MASTER M2 UE QUESTIONS D’ACTUALITÉ EN IMMUNOLOGIE...
19
MASTER M2 UE QUESTIONS D’ACTUALITÉ EN IMMUNOLOGIE SESSION DE JANVIER 2008 Durée de l’épreuve : 3 heures. Le sujet porte sur l'article ci-joint publié en 2006 par Bleul et al. (Nature 44, 992-996). Questions 1) Proposer un titre pour l'article et rédiger un résumé (maximum 120 mots) (8 points) 2) Expliquer à l'aide d'un diagramme le principe de fonctionnement de la protéine Cre-ERT2. Quel est l'effet du tamoxifène ? Pourquoi selon vous cette protéine présente-elle une activité constitutive résiduelle ? (2 points) 3) Proposer un schéma de l'allèle Rosa26R-eYFP. Décrire en quelques lignes la démarche qui permet d'obtenir un tel allèle. (2 points) 4) Proposer une représentation des figures S4 et S6, avec les légendes correspondantes. (2 points) 5) Expliquer le concept de tolérance centrale. Quel est le rôle des cellules épithéliales thymiques ? (2 points) 6) Les auteurs utilisent dans cet article une stratégie de réversion d'un phénotype nul pour Foxn1. Quel est l'intérêt de cette stratégie par rapport à une délétion conditionnelle de ce gène ? (2 points) 7) Identifier une question posée par ces résultats et proposer une stratégie expérimentale pour l'étudier. (2 points)
-
Upload
dinhnguyet -
Category
Documents
-
view
223 -
download
3
Transcript of MASTER M2 UE QUESTIONS D’ACTUALITÉ EN IMMUNOLOGIE...
MASTER M2UE QUESTIONS D’ACTUALITÉ EN IMMUNOLOGIE
SESSION DE JANVIER 2008
Durée de l’épreuve : 3 heures.
Le sujet porte sur l'article ci-joint publié en 2006 par Bleul et al. (Nature 44, 992-996).
Questions
1) Proposer un titre pour l'article et rédiger un résumé (maximum 120 mots) (8points)
2) Expliquer à l'aide d'un diagramme le principe de fonctionnement de la protéineCre-ERT2. Quel est l'effet du tamoxifène ? Pourquoi selon vous cette protéineprésente-elle une activité constitutive résiduelle ? (2 points)
3) Proposer un schéma de l'allèle Rosa26R-eYFP. Décrire en quelques lignes ladémarche qui permet d'obtenir un tel allèle. (2 points)
4) Proposer une représentation des figures S4 et S6, avec les légendescorrespondantes. (2 points)
5) Expliquer le concept de tolérance centrale. Quel est le rôle des cellulesépithéliales thymiques ? (2 points)
6) Les auteurs utilisent dans cet article une stratégie de réversion d'un phénotype nulpour Foxn1. Quel est l'intérêt de cette stratégie par rapport à une délétionconditionnelle de ce gène ? (2 points)
7) Identifier une question posée par ces résultats et proposer une stratégieexpérimentale pour l'étudier. (2 points)
© 2006 Nature Publishing Group
Formation of a functional thymus initiated by apostnatal epithelial progenitor cellConrad C. Bleul1, Tatiana Corbeaux1, Alexander Reuter1†, Paul Fisch2, Jurgen Schulte Monting3
& Thomas Boehm1
The thymus is essential for the generation of self-tolerant effectorand regulatory T cells. Intrathymic T-cell development requires anintact stromal microenvironment, of which thymic epithelial cells(TECs) constitute a major part1–3. For instance, cell-autonomousgenetic defects of forkhead box N1 (Foxn1)4 and autoimmuneregulator (Aire)5 in thymic epithelial cells cause primary immuno-deficiency and autoimmunity, respectively. During development,the thymic epithelial rudiment gives rise to two major compart-ments, the cortex and medulla. Cortical TECs positively selectT cells6, whereas medullary TECs are involved in negative selectionof potentially autoreactive T cells7. It has long been unclearwhether these two morphologically and functionally distincttypes of epithelial cells arise from a common bi-potent progenitorcell8 and whether such progenitors are still present in the postnatalperiod. Here, using in vivo cell lineage analysis in mice, wedemonstrate the presence of a common progenitor of corticaland medullary TECs after birth. To probe the function of postnatalprogenitors, a conditional mutant allele of Foxn1 was reverted towild-type function in single epithelial cells in vivo. This led to theformation of small thymic lobules containing both cortical andmedullary areas that supported normal thymopoiesis. Thus,single epithelial progenitor cells can give rise to a complete andfunctional thymic microenvironment, suggesting that cell-basedtherapies could be developed for thymus disorders.
The thymus is the primary lymphoid organ that generates a diverseand self-compatible T-cell repertoire. The epithelial component ofthe thymic stroma is essential for intrathymic T-cell development2,3.In mice homozygous for loss-of-function mutations in the geneencoding the transcription factor Foxn19, TECs fail to differentiate4,10
and thymopoiesis is completely blocked, causing severe immuno-deficiency11. In the normal thymus, TECs found in the cortex and themedulla are functionally distinct. For example, medullary epithelialcells are required for negative selection, failure of which leads toautoimmunity5,12,13. Therefore, TECs might be an attractive source ofcell-based strategies to correct or modulate autoimmune disorders8.
However, much remains to be learned about their developmentand function. For instance, an epithelial cell population isolated froman embryonic thymus gives rise to a functional microenvironmentconsisting of both medullary and cortical compartments whentransplanted into ectopic sites14,15, but it is unclear whether thisactivity resides in one cell type or is the result of the joint activity ofmany different cell types. Furthermore, it is unclear whether bi-potent progenitors exist in the postnatal thymus. Here, we examinetwo questions. First, we ask whether cortical and medullary epithelialcell types are derived from one common progenitor and whethersuch epithelial progenitor cells exist in postnatal thymus tissue.Second, we ask whether single such progenitor cells can give rise
to functionally competent thymic tissue supporting normalthymopoiesis.
To answer the first question, we developed a lineage-tracingprocedure based on the Cre/loxP system to follow the fate ofgenetically marked TECs. As a read-out for Cre activity we usedthe well-established Rosa26R-eYFP (where eYFP is enhanced yellowfluorescent protein) reporter16 system that supplies a fluorescentprotein only after Cre-mediated chromosomal rearrangement at aubiquitously expressed genomic locus. Cre activity was provided by amodified Cre-recombinase, driven by the human K14 promoter(hK14<Cre-ERT2) (where ER is human oestrogen receptor)17. Twofeatures made the latter component particularly attractive for ourpurpose. First, the K14 promoter is active in epithelial progenitorcells18 and so we expected that it might be active also in thymicepithelial precursor cells. Second, Cre-ERT2 exhibits a low level ofactivity even in the absence of tamoxifen induction (data not shown),effectively creating somatic mosaics in epithelial compartments.
Although no yellow cells were found in the thymic lobes of newborn(postpartum day zero, P0) hK14<Cre-ERT2;Rosa26R-eYFP mice(n ¼ 10), about half the mice (15/29) contained yellow cells in thethymic epithelial compartment at P14 (Supplementary Table S1). Asmice grew older, the proportion of mice with yellow TECs steadilyincreased, as did the number of yellow cells per thymus. However, atP14, the number of marked cells per thymus was low, ranging from 3to 146 cells per total thymus and thus comprised only a minorfraction ( ,, 0.1%) of TECs (Supplementary Table S1). In thymustissue, yellow cells were found to be clustered rather than evenlydistributed. Indeed, the observed distribution of yellow cells per unitvolume (that is, per section), each comprising about 1–2% of thymictissue, is incompatible with a Poisson distribution expected forrandom distribution (Supplementary Table S1, P , 0.001, Signtest). This indicated that yellow cells did not arise independentlyand that cell clusters were the result of single recombination eventsoccurring in cells with proliferative potential.
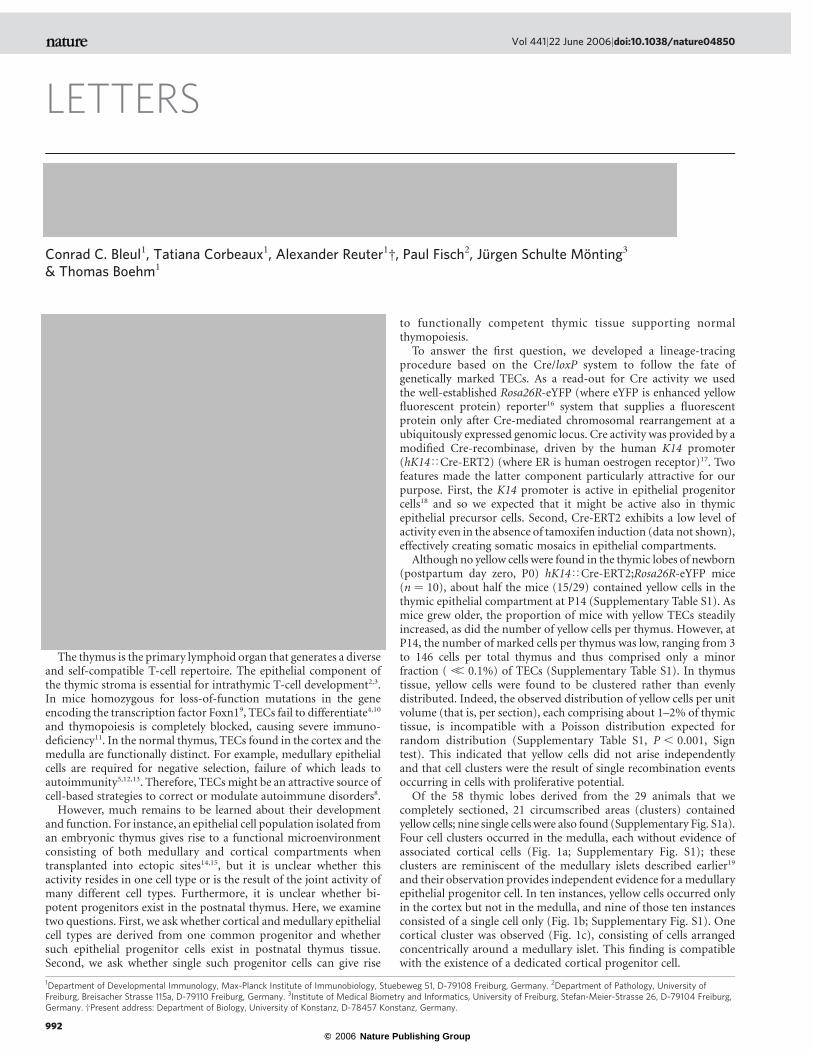
Of the 58 thymic lobes derived from the 29 animals that wecompletely sectioned, 21 circumscribed areas (clusters) containedyellow cells; nine single cells were also found (Supplementary Fig. S1a).Four cell clusters occurred in the medulla, each without evidence ofassociated cortical cells (Fig. 1a; Supplementary Fig. S1); theseclusters are reminiscent of the medullary islets described earlier19
and their observation provides independent evidence for a medullaryepithelial progenitor cell. In ten instances, yellow cells occurred onlyin the cortex but not in the medulla, and nine of those ten instancesconsisted of a single cell only (Fig. 1b; Supplementary Fig. S1). Onecortical cluster was observed (Fig. 1c), consisting of cells arrangedconcentrically around a medullary islet. This finding is compatiblewith the existence of a dedicated cortical progenitor cell.
LETTERS
1Department of Developmental Immunology, Max-Planck Institute of Immunobiology, Stuebeweg 51, D-79108 Freiburg, Germany. 2Department of Pathology, University ofFreiburg, Breisacher Strasse 115a, D-79110 Freiburg, Germany. 3Institute of Medical Biometry and Informatics, University of Freiburg, Stefan-Meier-Strasse 26, D-79104 Freiburg,Germany. †Present address: Department of Biology, University of Konstanz, D-78457 Konstanz, Germany.
Vol 441|22 June 2006|doi:10.1038/nature04850
992
© 2006 Nature Publishing Group
Sixteen of 21 cell clusters (76%) contained cells of both corticaland medullary phenotypes spanning the cortico-medullary junction(Fig. 1d). These patterns suggest that TEC progenitors exhibitingyellow fluorescence after Cre-mediated recombination at the Rosa26locus give rise to groups of genetically related progeny that arefound in close proximity to each other. Indeed, mathematicalmodelling reproduces the appearance of clustered progeny fromsingle progenitors and the results indicate that biologically mean-ingful parameters for proliferation probabilities of progenitor anddifferentiated cells and generation times can explain the observedpatterns (Supplementary Information and Table S2). Interestingly, thedistribution of labelled progeny derived from eYFP-positive/MHCclass-II-positive embryonic day (E)12.5 embryonic TECs added toreaggregates of thymic tissue and transplanted into ectopic sites isstrikingly similar to the pattern observed in the postnatal lineagetracing experiment (Supplementary Fig. S2). This is compatible withthe notion that the differentiation of embryonic and postnatal TECsfollows similar rules.
Collectively, the above analyses strongly suggested the presence ofbi- and uni-potent progenitor cells for the cortical and medullarycompartments, respectively. However, owing to the experimentaldesign of creating somatic mosaics, it was impossible to obtain prooffor the functional competence of such progenitors beyond theirmorphological and immunohistochemical characteristics. We there-fore devised a genetic test to examine the proposed differentiationmodel in functional terms. The design of this experiment was basedon the assumption that Foxn1-deficient TECs are maintained in anundifferentiated state in the alymphoid rudiment4,10.
We sought to create a null allele of Foxn1 that could be reverted tothe wild-type configuration upon the action of Cre recombinase.Owing to the unique properties of the hK14<Cre-ERT2 transgenedescribed above, we expected to be able to examine the functionalconsequences arising from the reversion of Foxn1 in single epithelialcells within a Foxn1-deficient epithelial rudiment. We first confirmedthat the hK14<Cre-ERT2 transgene was also active in Foxn12/2
epithelial cells using mice transgenic for hK14<Cre-ERT2 andRosa26R-lacZ20 on the Foxn1-deficient nu/nu background (Fig. 2a).In the thymic rudiment of hK14<Cre-ERT2;Rosa26R-lacZ;nu/numice, expression of b-galactosidase was confined to rare, often single,cells in an entire rudiment, indicating that Cre-mediated recombina-tion occurred as a singular event. Thus, for subsequent experimentsusing the hK14<Cre-ERT2 transgene, differentiated progeny ofreverted epithelial cells could be expected to originate from singleTEC.
The revertable allele of Foxn1 was created by insertion of a cassettecontaining splice acceptor and polyadenylation sites into the intronbetween exons 6 and 7 of the mouse Foxn1 gene (Fig. 2b). Thisinsertion was modelled according to a rat nude allele21 to corrupt thenormal splicing process. The formation of truncated non-functionalmessenger RNAs ultimately resulted in a nude phenotype in micehomozygous for this allele (Supplementary Fig. S3a). Excision of thecassette by Cre recombinase was expected to restore normal splicing;indeed, a wild-type phenotype was observed after deletion of thecassette in the germ-line (Supplementary Fig. S3b, c). When micehomozygous for the Foxn1SA2 allele were made transgenic for thehK14<Cre-ERT2 construct, peripheral T cells could be detected(Fig. 2c) in a progressively larger proportion of the mice withincreasing age. For instance, in one cohort, at 4 weeks of age, 8/18mice had peripheral T cells, and another five became positive withinthe following month. The presence of peripheral T cells above thebackground of T cells observed in nude mice was absolutely depen-dent on the presence of the hK14<Cre-ERT2 transgene, indicatingthat the Foxn1SA2 allele itself is not leaky.
Peripheral T cells in the reverter mice, although fewer in numberthan in wild-type mice, exhibited high surface levels of T-cell receptor(TCR) beta (Fig. 2c), showed a polyclonal T-cell repertoire (Sup-plementary Fig. S4), upregulated activation markers upon CD31cross-linking (Supplementary Fig. S5) and re-established theimmune response to a T-cell-dependent antigen (SupplementaryFig. S6), as well as reactivity in mixed lymphocyte reactions (data not
Figure 1 | Examples of cell clusters observed in lineage tracing analysis.a, Medullary islet observed via eYFP fluorescence (left); same section stainedwith UEA-1, which marks a subset of mature medullary cells (middle);merged images of EYFP and UEA-1 (right). Outline of section andgenetically marked medullary islet indicated in white. b, Single marked
cortical cell (merged images). c, Halo of cortical epithelial cells adjacent tomedullary islets (red) (merged images). Cortical clusters are more dispersedthan medullary islets. d, Group of cells spanning the cortico-medullaryjunction (merged images). Scale bars, 100mm (a), 100mm (b), 20 mm(b inset), 50 mm (c), 50mm (d).
NATURE|Vol 441|22 June 2006 LETTERS
993
© 2006 Nature Publishing Group
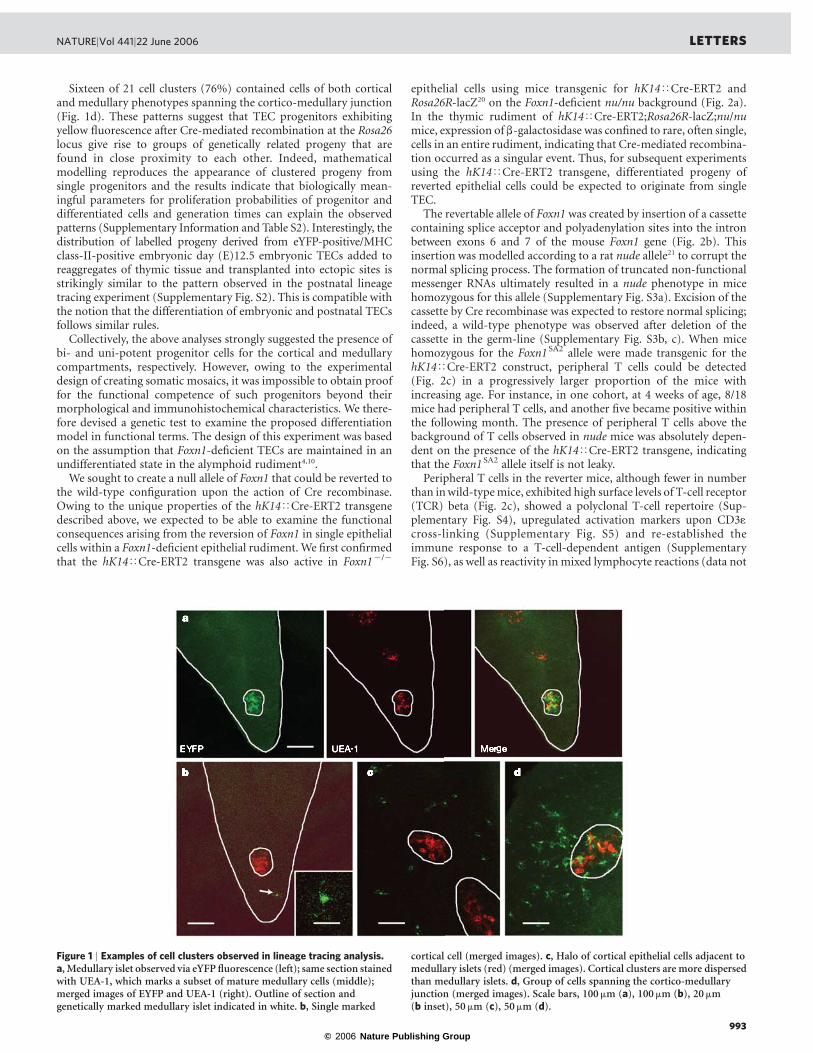
shown). When the thymic rudiment was analysed by histology insuch mice, small areas of thymic tissue were apparent adjacent toalymphoid cysts (Fig. 3a). These neo-thymi contained well-definedcentral medullary areas enclosed by cortical spheres (Fig. 3b) and
supported normal T-cell differentiation (Fig. 3c, d; SupplementaryFig. S7a) for at least 21 months (the latest time point examined;Supplementary Fig. S7b). The epithelium in neo-thymi expresses theautoimmune regulator Aire and peripheral self antigens (Supple-mentary Fig. 8), suggesting that central tolerance mechanisms are inplace.
Interestingly, no thymic mass consisting of either cortical ormedullary epithelium was observed, indicating that to supportproductive thymopoiesis, the reversion of Foxn1 function in singlecells occurs in a cell type that is positioned upstream of cortical andmedullary precursors in the differentiation hierarchy. This experi-ment shows how epithelial stroma emanating from single progenitorcells gives rise to a microenvironment that supports the immigration,differentiation and emigration of haematopoietic cells. As expectedfor a cumulative random reversion process, the number and size of
Figure 2 | A revertable Foxn1 allele (Foxn1SA2). a, Histological section ofthymic rudiment in hK14<Cre-ERT2;Rosa26R-lacZ;nu/nu mice stainedwith an anti-cytokeratin K8 antibody (brownish stain) and developed forb-galactosidase expression (blue stain). Right panel, close-up of theindicated region in the left panel; note the single positive cell in the wall ofthe cyst. Scale bars, 100mm, left panel; 25 mm, right panel. b, Structure of theFoxn1 locus before (upper line) and after knock-in (middle line) of the SA2cassette (yellow) and the hygromycin selectable marker (dark blue).Cre-mediated excision of this cassette (bottom line) deletes a small region(indicated by light blue rectangle) in the intron. Red arrowheads, loxP sites;splicing pattern indicated by red lines. c, Top panels, analysis ofsplenocytes for CD4-positive and CD8-positive T cells in 8–12-week-oldwild-type, nude (nu/nu), and Foxn1SA2/Foxn1SA2;hK14<Cre-ERT2 mice(SA2/SA2;K14Cre) (average ^ standard deviation). Bottom panels, surfacelevels of TCRß for CD4-positive cells.
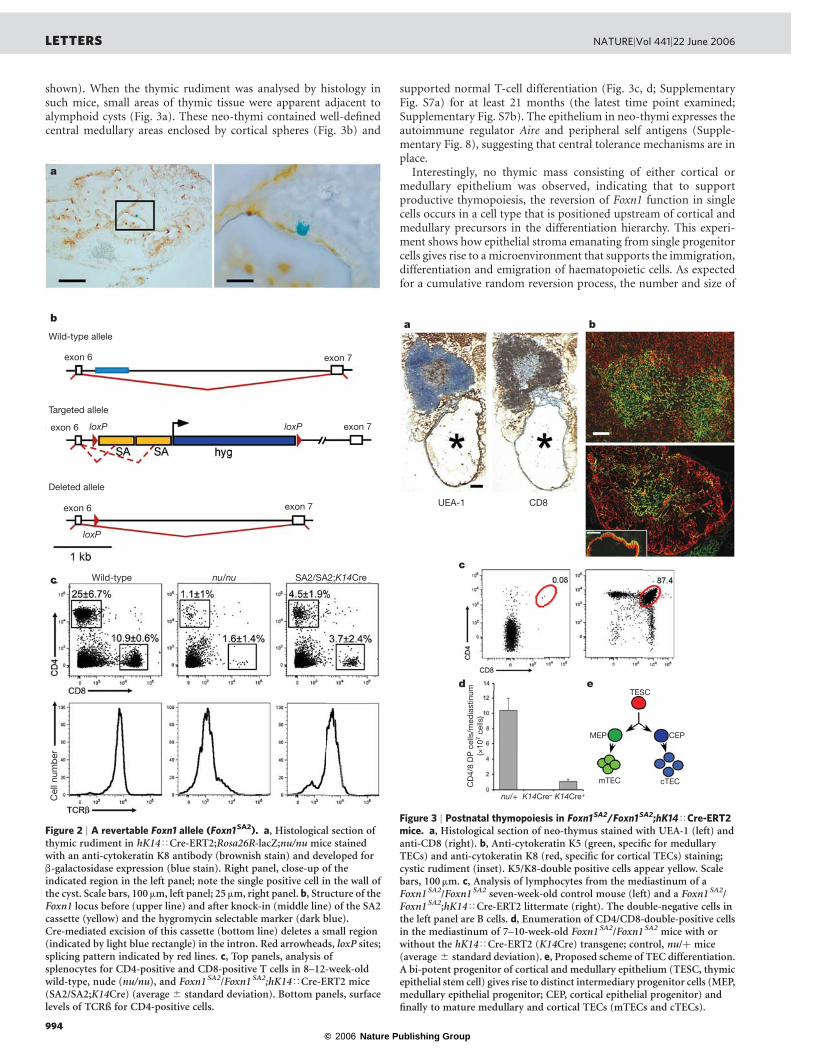
Figure 3 | Postnatal thymopoiesis in Foxn1SA2/Foxn1SA2;hK14<Cre-ERT2mice. a, Histological section of neo-thymus stained with UEA-1 (left) andanti-CD8 (right). b, Anti-cytokeratin K5 (green, specific for medullaryTECs) and anti-cytokeratin K8 (red, specific for cortical TECs) staining;cystic rudiment (inset). K5/K8-double positive cells appear yellow. Scalebars, 100mm. c, Analysis of lymphocytes from the mediastinum of aFoxn1SA2/Foxn1SA2 seven-week-old control mouse (left) and a Foxn1SA2/Foxn1SA2;hK14<Cre-ERT2 littermate (right). The double-negative cells inthe left panel are B cells. d, Enumeration of CD4/CD8-double-positive cellsin the mediastinum of 7–10-week-old Foxn1SA2/Foxn1SA2 mice with orwithout the hK14<Cre-ERT2 (K14Cre) transgene; control, nu/þ mice(average ^ standard deviation). e, Proposed scheme of TEC differentiation.A bi-potent progenitor of cortical and medullary epithelium (TESC, thymicepithelial stem cell) gives rise to distinct intermediary progenitor cells (MEP,medullary epithelial progenitor; CEP, cortical epithelial progenitor) andfinally to mature medullary and cortical TECs (mTECs and cTECs).
LETTERS NATURE|Vol 441|22 June 2006
994
© 2006 Nature Publishing Group
thymic lobules observed in thymic rudiments increased in older mice(Supplementary Fig. S9a); furthermore, the age of analysed micecorrelated with increasing numbers of TECs, CD4/CD8 double-positive thymocytes and peripheral T-cell numbers (SupplementaryFig. 9b, c). We also observed re-growth of hair in progressively largerpatches of skin in reverter mice, indicating restoration of hairkeratinization as a consequence of normalized Foxn1 function.
Our results provide answers to a number of key problems in TECbiology. We show that the embryonic and adult TEC compartmentscontain bi-potent progenitor cells that give rise to TECs with bothcortical and medullary phenotypes. Our results confirm the presenceof medullary precursors19 and suggest the presence of an equivalentprogenitor for the cortical compartment. We cannot determine therelative proportion of these types of progenitor cells in the postnatalthymus, because the method we use here for their detection dependson the (unknown) relative activity of the transgenic constructsupplying Cre activity in the different precursor types. Nevertheless,our findings allow us to propose a differentiation scheme of TECs(Fig. 3e): lineage tracing and genetic reversion analysis both suggestthat a Foxn1-dependent bi-potent precursor initially gives rise tocortical and medullary precursors which then form small clusters ofdifferentiated progeny. Interestingly, the reversion experiment alsoindicates that direct interaction of ectoderm with endoderm is notrequired for full differentiation of adult TECs, because mediastinalthymic rudiments are no longer in contact with the cells of this germlayer. Our results also indicate that the bi-potent TEC progenitor cellexpresses Foxn1.
A surprising finding was that despite the absence of Foxn1,epithelial precursors in thymic rudiments survive into the adultperiod, because they can be induced postnatally to differentiatenormally by re-supply of Foxn1 function. This finding providesfunctional proof for earlier suggestions of the presence of animmature epithelium in Foxn1-deficient thymic rudiments10. Italso shows how a functional epithelial compartment arising fromsingle progenitor cells is capable of organizing fully competentthymopoietic niches. The supply of Foxn1 is necessary and sufficientto direct the differentiation of immature epithelial cells into fullymature and functionally competent TECs, so the delivery of Foxn1 toeven single progenitor cells of the cystic epithelial rudiment of humanFOXN12/2 patients22,23 (for instance, through viral vectors) may resultin clinically relevant and long-lasting thymopoiesis that bone marrowtransplantation failed to achieve24. Our results thus suggest a treatmentmethod for this particular kind of primary immunodeficiency.
The presence of a bi-potent progenitor cell in the embryonicthymic epithelial compartment has been unequivocally demon-strated25; our results indicate that such a progenitor also exists inthe postnatal thymus. Further work should focus on the isolation ofthis rare cell type from adult tissues with the possibility of developingcell-based therapies to modify the outcome of autoimmune disordersin adults.
METHODSMore detailed methods are described in the Supplementary Information.Mice. TheCre-transgenic mouse strain for the ubiquitous deletion of loxP-flankedgene segments (PBi-2<Cre; ‘Cre-deleter’ (ref. 26)) was the kind gift of K. Rajewsky.The Cre reporter strains produced by targeted insertion of lacZ20 or eYFP16 intothe Rosa26 locus were kindly provided by P. Soriano and S. Srinivas, respect-ively. Mice expressing eYFP in all cells were generated by crossing Rosa26-eYFPmice with the Cre-deleter strain. The transgenic mouse line driving a modifiedCre-protein (Cre-ERT2) under the control of the hK14 promoter/enhancer17
was the kind gift of P. Chambon.
The Foxn1SA2 knock-in allele was created as follows. The targeting constructwas assembled in a step-wise fashion. Into the XbaI site of the plox2d plasmid27
that is positioned between two tandemly arranged loxP sites we inserted twotandemly arranged copies of a 605-base pair (bp) fragment (one copy of thisfragment corresponds to nucleotides (nt) 321 to 925 in GenBank accessionnumber Y08910; ref. 21.) each containing splice acceptor and polyadenylationsignal sequences to give plasmid pP4SA3. This fragment is derived from a
transposon insertion into the rat Foxn1 gene identified in the rat nu rnuN strain21.A triplicated version of this cassette was inserted into plasmid pKSB22A(a modified plasmid derivative of the lGET exon-trapping vector28) to giveplasmid p22SA3i and we confirmed its desired effect on splicing and poly-adenylation after transfection into COS7 cells (data not shown). This indicatesthat the cassette may be generally useful for the construction of revertable alleles.
Immediately upstream of the downstream loxP site of pP4SA3, a 2.1-kilobase(kb) BglII fragment derived from pHA58 (the kind gift of A. Berns; ref. 29.)encoding a hygromycin resistance cassette was cloned. Two fragments withhomologies to the mouse Foxn1 locus were positioned up- and downstream,respectively, of the two loxP sites in the final targeting vector. The upstream shorthomology arm corresponds to nt 36917 to 39877, and the downstream longhomology arm corresponds to nt 40433 to 47098 in GenBank accession numberY12488 (ref. 30). The final targeting construct (pP4SA2Whn) contains a deletionof 555 bp of intronic sequence between exon 6 (occurring at nt 39555 to 39651 inGenBank accession number Y12488) and exon 7 (occurring at nt 43958 to 33156in GenBank accession number Y12488) of the Foxn1 gene to facilitate thedetection of Cre-mediated removal of the SA2-hyg cassette (Fig. 2b). Thisvector was linearized with XhoI and electroporated into R1 embryonic stemcells. Hyg-resistant cells were screened for homologous recombination bySouthern blotting using BamHI-digested DNA and a probe derived from exon3 of Foxn1 (nt 34186 to 34467); the wild-type allele corresponds to 18.2 kb, thetargeted allele to about 11 kb. Several correctly targeted clones were injected intoblastocysts, and the chimaeras backcrossed to C57BL/6 mice for germlinetransmission.
Heterozygous mice were intercrossed to yield homozygous mutant mice andtheir phenotype analysed as described4; as expected, the knock-in allele wasallelic to the nu allele (data not shown) and indistinguishable in phenotype(Supplementary Fig. S3). It was concluded that the Foxn1-SA2hyg knock-inallele (henceforth designated Foxn1SA2) represents a null allele of Foxn1. Toconfirm the functionality of the loxP sites, these mice were crossed to the Cre-deleter strain; the phenotype of mice homozygous for the deleted allele wasnormal (Supplementary Fig. S3).Characterization of TECs in lineage tracing experiments. Fluorescence signalsemanating from eYFP-expressing cells and from immunohistochemical stains(UEA-1; K8; MTS-10) were recorded in tissue slices (50mm) using a Leica TCSSP2 UV confocal microscope system. Background fluorescence was distin-guished from eYFP fluorescence using Leica Spectral Dye Separation software.The average diameter of clusters composed of yellow cells was found to be160 ^ 115 mm (average ^ standard deviation); accordingly, we required aminimum distance of about 3 s.d. ( ¼ 350mm) between aggregates of yellowcells to designate them as independent; the minimum number of cells requiredper cluster is 1.Differentiation potential of embryonic TECs. To determine the long-termrepopulation potential of embryonic TECs, isolated thymic lobes from E12.5embryos of the fully recombined Rosa26-eYFP strain were dispersed into singlecell suspensions12 and stained with antibodies against CD45 and MHC class II.MHC-class-II-positive, CD45-negative, eYFP-positive cells were sorted intowells of microtitre plates that contained 2 £ 105 cells from dissociated E14.5thymic lobes of BALB/c wild-type mice. The cell suspensions were reaggregatedfor 2 days and then transplanted under the kidney capsule of BALB/c nude mice.After 5 months, recipient mice were killed and grafts examined for the presenceof eYFP-positive cells in the ectopic thymic tissue.
Received 17 January; accepted 26 April 2006.
1. Boehm, T., Bleul, C. C. & Schorpp, M. Genetic dissection of thymusdevelopment in mouse and zebrafish. Immunol. Rev. 195, 15–-27 (2003).
2. Anderson, G. & Jenkinson, E. J. Lymphostromal interactions in thymicdevelopment and function. Nature Rev. Immunol. 1, 31–-40 (2001).
3. Gray, D. H. et al. Controlling the thymic microenvironment. Curr. Opin. Immunol.17, 137–-143 (2005).
4. Nehls, M. et al. Two genetically separable steps in the differentiation of thymicepithelium. Science 272, 886–-889 (1996).
5. Anderson, M. S. et al. Projection of an immunological self shadow within thethymus by the aire protein. Science 298, 1395–-1401 (2002); published online10 October 2002 (doi: 10.1126/science.1075958).
6. Hogquist, K. A. & Bevan, M. J. The nature of the peptide/MHC ligand involvedin positive selection. Semin. Immunol. 8, 63–-68 (1996).
7. Kyewski, B., & Derbinski, J. Self-representation in the thymus: an extendedview. Nature Rev. Immunol. 4, 688–-698 (2004).
8. Blackburn, C. C. et al. One for all and all for one: thymic epithelial stem cellsand regeneration. Trends Immunol. 23, 391–-395 (2002).
9. Nehls, M., Pfeifer, D., Schorpp, M., Hedrich, H. & Boehm, T. New member ofthe winged-helix protein family disrupted in mouse and rat nude mutations.Nature 372, 103–-107 (1994).
NATURE|Vol 441|22 June 2006 LETTERS
995
© 2006 Nature Publishing Group
10. Blackburn, C. C. et al. The nu gene acts cell-autonomously and is required fordifferentiation of thymic epithelial progenitors. Proc. Natl Acad. Sci. USA 93,5742–-5746 (1996).
11. Cunningham-Rundles, C. & Ponda, P. P. Molecular defects in T- and B-cellprimary immunodeficiency diseases. Nature Rev. Immunol. 5, 880–-892 (2005).
12. Boehm, T., Scheu, S., Pfeffer, K. & Bleul, C. C. Thymic medullary epithelial celldifferentiation, thymocyte emigration, and the control of autoimmunity requirelympho-epithelial cross talk via LTbetaR. J. Exp. Med. 198, 757–-769 (2003).
13. Akiyama, T. et al. Dependence of self-tolerance on TRAF6-directeddevelopment of thymic stroma. Science 308, 248–-251 (2005); published online10 February 2005 (doi: 10.1126/science.1105677).
14. Bennett, A. R. et al. Identification and characterization of thymic epithelialprogenitor cells. Immunity 16, 803–-814 (2002).
15. Gill, J., Malin, M., Hollander, G. A. & Boyd, R. Generation of a complete thymicmicroenvironment by MTS24(þ) thymic epithelial cells. Nature Immunol. 3,635–-642 (2002); advance online publication 17 June 2002 (doi:10.1038/ni812).
16. Srinivas, S. et al. Cre reporter strains produced by targeted insertion of EYFPand ECFP into the ROSA26 locus. BMC Dev. Biol. 1, 4 (2001); published online27 March 2001 (doi: 10.1186/1471-213x-1-4).
17. Li, M. et al. Skin abnormalities generated by temporally controlled RXRalphamutations in mouse epidermis. Nature 407, 633–-636 (2000).
18. Vassar, R., Rosenberg, M., Ross, S., Tyner, A. & Fuchs, E. Tissue-specific anddifferentiation-specific expression of a human K14 keratin gene in transgenicmice. Proc. Natl Acad. Sci. USA 86, 1563–-1567 (1989).
19. Rodewald, H. R., Paul, S., Haller, C., Bluethmann, H. & Blum, C. Thymusmedulla consisting of epithelial islets each derived from a single progenitor.Nature 414, 763–-768 (2001).
20. Soriano, P. Generalized lacZ expression with the ROSA26 Cre reporter strain.Nature Genet. 21, 70–-71 (1999).
21. Huth, M., Schlake, T. & Boehm, T. Transposon-induced splicing defect in therat nude gene. Immunogenetics 45, 282–-283 (1997).
22. Adriani, M. et al. Ancestral founder mutation of the nude (FOXN1) gene incongenital severe combined immunodeficiency associated with alopecia insouthern Italy population. Ann. Hum. Genet. 68, 265–-268 (2004).
23. Frank, J. et al. Exposing the human nude phenotype.Nature 398, 473–-474 (1999).
24. Pignata, C. et al. Human equivalent of the mouse Nude/SCID phenotype:long-term evaluation of immunologic reconstitution after bone marrowtransplantation. Blood 97, 880–-885 (2001).
25. Rossi, S. W., Jenkinson, W. E., Anderson, G. & Jenkinson, E. J. Clonal analysisreveals a common progenitor for thymic cortical and medullary epithelium.Nature doi:10.1038/nature04813 (this issue).
26. Schwenk, F., Baron, U., & Rajewsky, K. A cre-transgenic mouse strain for theubiquitous deletion of loxP-flanked gene segments including deletion in germcells. Nucleic Acids Res. 23, 5080–-5081 (1995).
27. Nehls, M., Messerle, M., Sirulnik, A., Smith, A. J. & Boehm, T. Two large insertvectors, lambda PS and lambda KO, facilitate rapid mapping and targeteddisruption of mammalian genes. Biotechniques 17, 770–-775 (1994).
28. Nehls, M., Pfeifer, D., Micklem, G., Schmoor, C. & Boehm, T. The sequencecomplexity of exons trapped from the mouse genome. Curr. Biol. 4, 983–-989(1994).
29. te Riele, H., Maandag, E. R., Clarke, A., Hooper, M. & Berns, A. Consecutiveinactivation of both alleles of the pim-1 proto-oncogene by homologousrecombination in embryonic stem cells. Nature 348, 649–-651 (1990).
30. Schorpp, M., Hofmann, M., Dear, T. N. & Boehm, T. Characterization of mouseand human nude genes. Immunogenetics 46, 509–-515 (1997).
Supplementary Information is linked to the online version of the paper atwww.nature.com/nature.
Acknowledgements We thank A. Maul-Pavicic, S. Groß, C. Sainz-Rueda,A. Haas-Assenbaum, C. Happe, E. Nikolopoulos and M. Konrath for help duringvarious stages of this project, and K. Rajewsky, P. Soriano, P. Chambon,S. Srinivas, K. Eichmann, G. Turchinovich, for mouse lines or reagents. This workwas supported by grants from the Deutsche Forschungsgemeinschaft and theMax-Planck Society.
Author Information Reprints and permissions information is available atnpg/nature.com/reprintsandpermissions. The authors declare no competingfinancial interests. Correspondence and requests for materials should beaddressed to T.B. ([email protected]).
LETTERS NATURE|Vol 441|22 June 2006
996
1
Bleul et al., Legends to Supplementary Figures and Tables
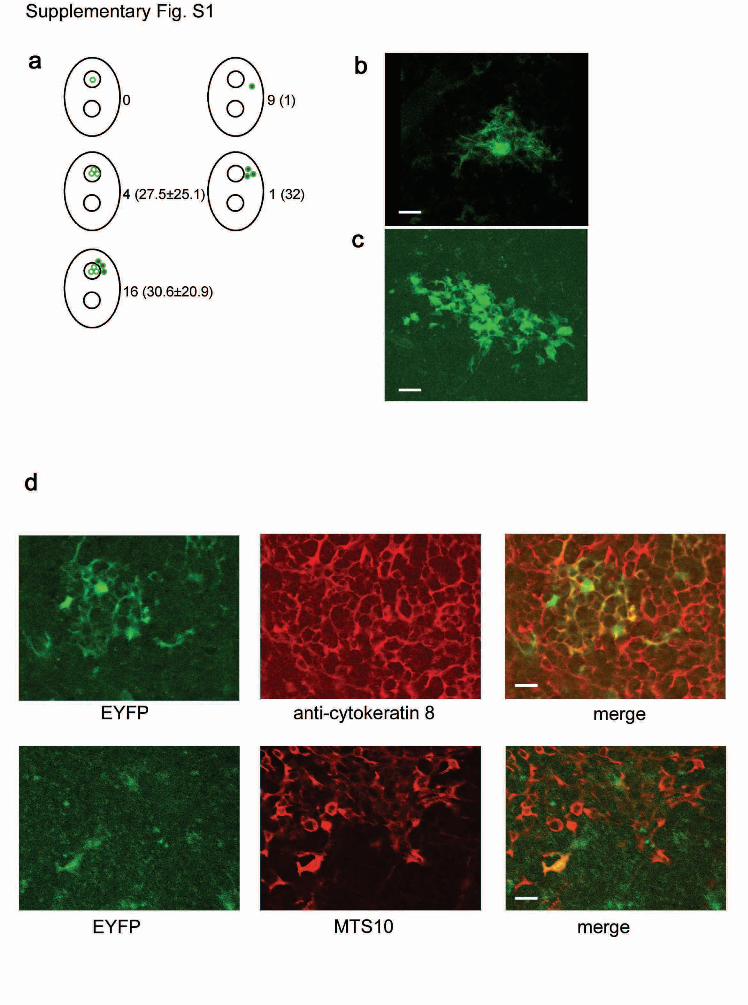
Figure S1 | Characterization of genetically marked epithelial cells
observed in lineage tracing analysis. a, Schematic of five potential
patterns indicated in a thymus with two medullary areas, symbolized by
two small circles. A single medullary cell (top left) was not observed; in
four instances, medullary clusters (middle left) were observed (cluster
size indicated in brackets; range 12 to 65 cells); in nine instances, single
cortical cells (top right) were observed and in one instance, a cluster
consisting of a total of 32 cells was observed to occur in three
consecutive 50µm sections (one section shown in Fig. 1c). The majority
of clusters (16/21), consisted of medullary and cortical cells (bottom left;
range 11 to 85). b, c, Morphological characteristics of TECs expressing
cytoplasmic EYFP protein. b, Single cortical epithelial cell. c, Medullary
islet. Note the extensive reticular network emanating from the central
body of the cortical cell, whereas the extensions of medullary cells appear
more blunted. Scale bars, 10µm. d, Immunohistological analysis of TECs
expressing cytoplasmic EYFP protein. Cortical cells are positive for K8
(upper panels), medullary epithelial cells are positive for MTS10 (lower
panels). Scale bars, 10 µm.
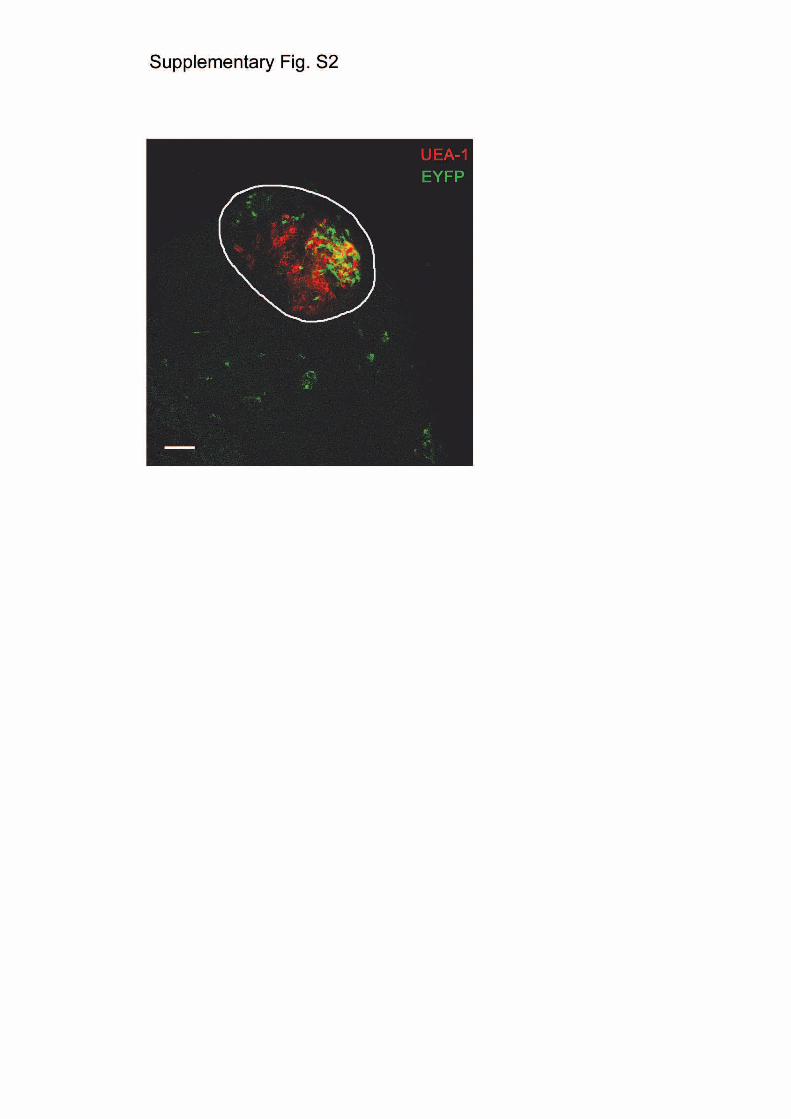
Figure S2 | Evidence for common cortico-medullary progenitors in
E12.5 thymus. MHC class II-positive epithelial cells (previously shown
to contain epithelial progenitor cells8-10 were dissociated from E12.5
thymi of fully recombined Rosa26-EYFP transgenic mice. About 15,000
cells were then reaggregated with epithelial cells from E14.5 non-
transgenic mice and transplanted under the kidney capsule of nude mice.
After 5 months, the resulting ectopic thymi were examined for the
2
presence of yellow-fluorescent cells. In each of these cases, yellow cells
were contained in a single circumscribed region of the large thymic tissue
that contained cells with immunohistological and morphological
hallmarks of both medullary (medullary islet encircled) and cortical
epithelial cells, suggesting that they arose from a single precursor cell.
The pattern became multi-focal with a higher input of yellow cells. The
unknown clonogenicity of yellow epithelial cells in these experiments
precluded a numerical assessment of precursor frequency in E12.5 thymic
epithelial cells. Nevertheless, the striking similarity in the spatial
arrangement of TECs in this and the lineage tracing experiments (c.f. Fig.
1d) suggested that differentiation of embryonic and postnatal TECs
follows similar rules. Scale bar, 50µm.
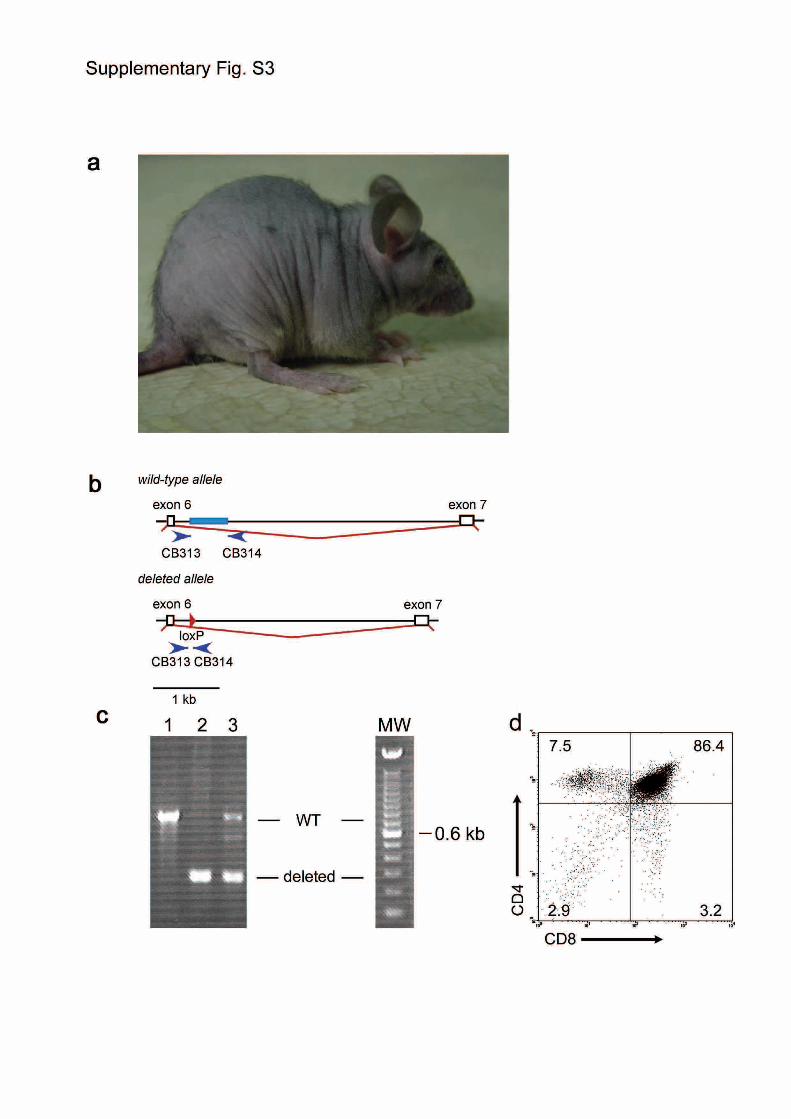
Figure S3 | Characterization of Foxn1SA2/Foxn1SA2 mice. a, External
appearance. Note the lack of a normal hair coat similar to nu/nu mice. b,
c, Reversion of the Foxn1SA2 allele via Cre-mediated excision in early
development. b, Schematic of wild-type and deleted alleles (c.f. Fig. 2)
with the position of screening primers CB313 and CB314 indicated. c,
PCR assay for genomic configuration of the Foxn1 locus. The wild-type
amplicon is 752, the amplicon arising from the deleted allele is 231 bp in
size. Results are shown for genomic DNA isolated from tail tissue of
mice with the following genotypes: lane 1, wild-type (+/+) control; lane
2, Foxn1SA2/Foxn1SA2//PBi-2::Cre (Ref. 11); lane 3, Foxn1SA2/+//PBi-2::Cre.
This analysis indicates that the SA2 cassette can be efficiently removed
from and reconstitutes the Foxn1 locus. Molecular weight (MW) marker
is a 100bp ladder, with the 600bp band indicated. d, FACS analysis of
thymocytes isolated from the thymus of the mouse shown in lane 2 in c,
indicating that normal thymopoiesis occurs after excision of the SA2-
3
cassette; the hair coat of this mouse is also normal (not shown). The
percentage of cells in the indicated gates is shown.
Figure S4 | Normal diversity of TCRs in
Foxn1SA2/Foxn1SA2//hK14::Cre-ERT2 mice. a, Usage of Vß chains in
splenic CD4 single-positive T cells of Foxn1SA2/Foxn1SA2//hK14::Cre-
ERT2 mice. The results for five individual mice of 7-12 week of age are
indicated by different colors. Usage of different Vß-chains in peripheral
CD4-positive T cells was determined by FACS analysis using specific
monoclonal antibodies. Values observed in age-matched nu/+ mice are
indicated by red bars. b, Spectratyping analysis for the indicated Vß gene
families (12 week old mice) indicating that nu/nu mice have a highly
skewed repertoire, whereas that in Foxn1SA2/Foxn1SA2//hK14::CreERT2
approaches that of normal mice. Qualitatively similar results were
obtained for Vß1, Vß3.1, Vß6, Vß7, Vß8.1, Vß11, Vß13, Vß20 families
(data not shown). c, Sequence diversity of CDR3 regions in TCRß
cDNAs (12 week old mice) with Vß8 variable regions. The results for
two individual mice for each of the three indicated genotypes are shown.
The percentage of unique sequences among analyzed cDNAs (number
indicated below columns) is shown. All wild-type sequences were unique
(100% singlets); nude mice have an oligoclonal repertoire, with a low
proportion of singlets among the sequenced cDNAs;
Foxn1SA2/Foxn1SA2//hK14::Cre-ERT2 mice have a near normal diversity
that is significantly different from that of nude mice (t-test, two-tailed)
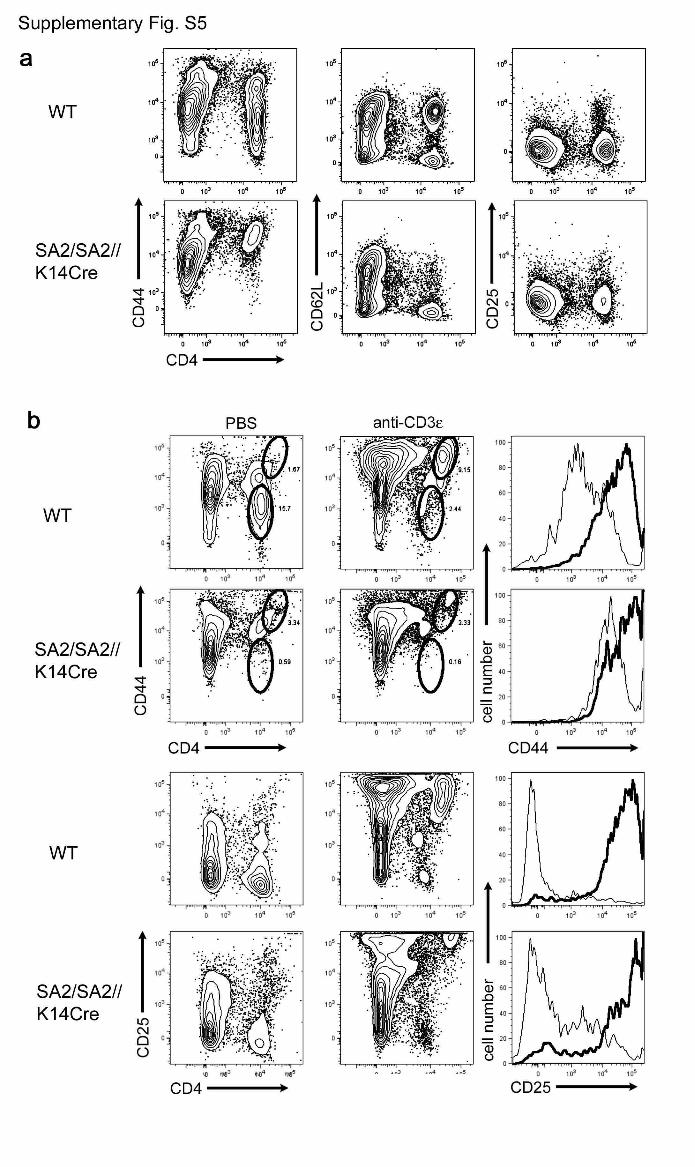
Figure S5 | Characterization of splenocytes in
Foxn1SA2/Foxn1SA2//hK14::Cre-ERT2 mice. a, Surface phenotype of
splenocytes from 8 week old mice. Wild-type mice have a lower
proportion of activated (CD44high, CD62Llow, CD25high) peripheral T cells
4
than Foxn1SA2/Foxn1SA2//hK14::Cre-ERT2 mice, consistent with
homeostatic proliferation of T cells emanating from neo-thymi in reverter
mice (results shown for CD4 subset). b, Activation of splenic T cells by
anti-CD3ε treatment in vitro. Despite initially increased levels of
activation markers, T cells from Foxn1SA2/Foxn1SA2//hK14::Cre-ERT2
mice can nevertheless be stimulated by CD3ε cross-linking, as indicated
by further up-regulation of CD44 and CD25. Histogram plots are gated
on CD4-positive splenocytes that have been incubated for four days in
either anti-CD3ε coated wells (bold line) or PBS-control wells (thin line).
Figure S6 | T-dependent immune response in
Foxn1SA2/Foxn1SA2//hK14::Cre-ERT2 mice. IgG1 response against the
hapten nitrophenol coupled to chicken γ-globulin (CG-NP). This response
is strictly dependent on functional T cells and thus shows the restoration
of T cell function in Foxn1SA2/Foxn1SA2//hK14::Cre-ERT2 (abbreviated
K14Cre+) but not Foxn1SA2/Foxn1SA2 (abbreviated K14Cre-) mice. Each
data point represents one mouse.
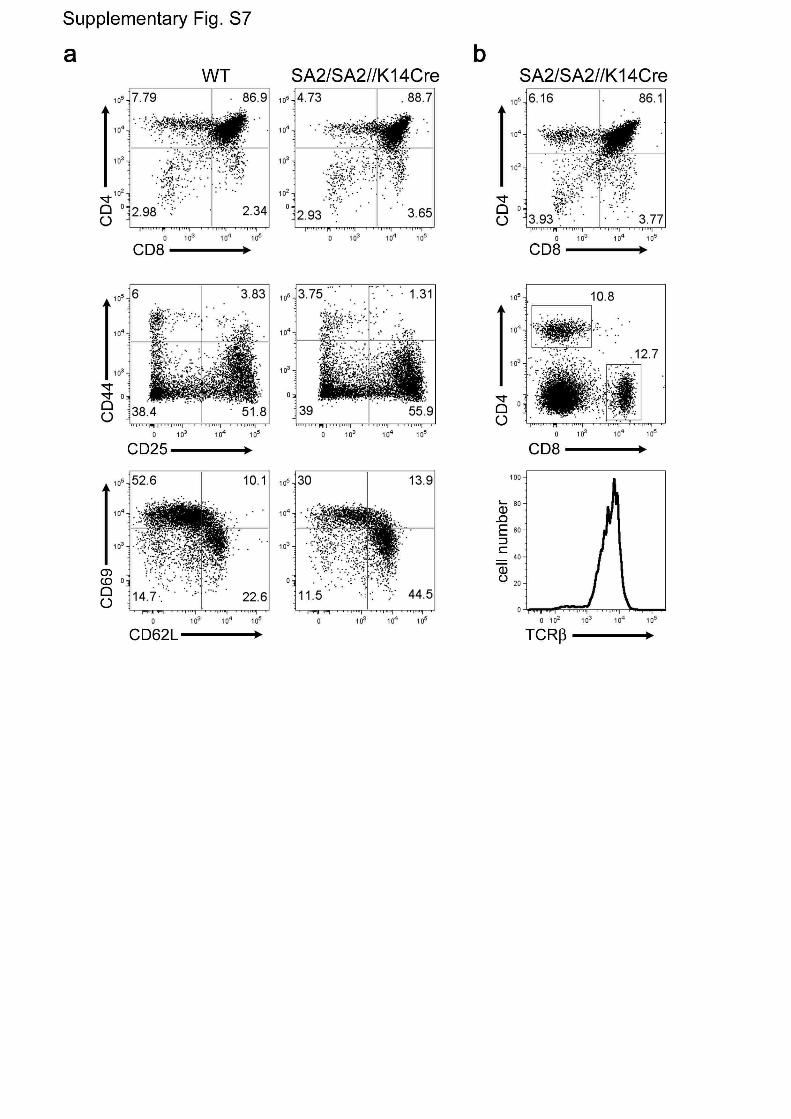
Figure S7 | Normal thymopoiesis in Foxn1SA2/Foxn1SA2//hK14::Cre-
ERT2 mice. a, FACS analysis of total thymocytes (top panels), double-
negative immature thymocytes (middle panels) and mature CD4-positive
thymocytes (lower panels). T cells expressing the γ/δ TCR and NKT cells
were also found (data not shown). b, Sustained thymopoiesis in 21 month
old Foxn1SA2/Foxn1SA2//hK14::Cre-ERT2 mice. Analysis of CD4 and
CD8 markers on thymocytes (top panel) indicates ongoing thymopoiesis.
Splenocytes of the same mouse contain a large proportion of T cells
(middle panel), with high levels of TCRß surface expression (shown for
CD4-positive cells, bottom panel). The pattern of activation markers
5
(CD44, CD69, CD25, CD62L) in such mice is similar to 8 week old mice
(not shown).
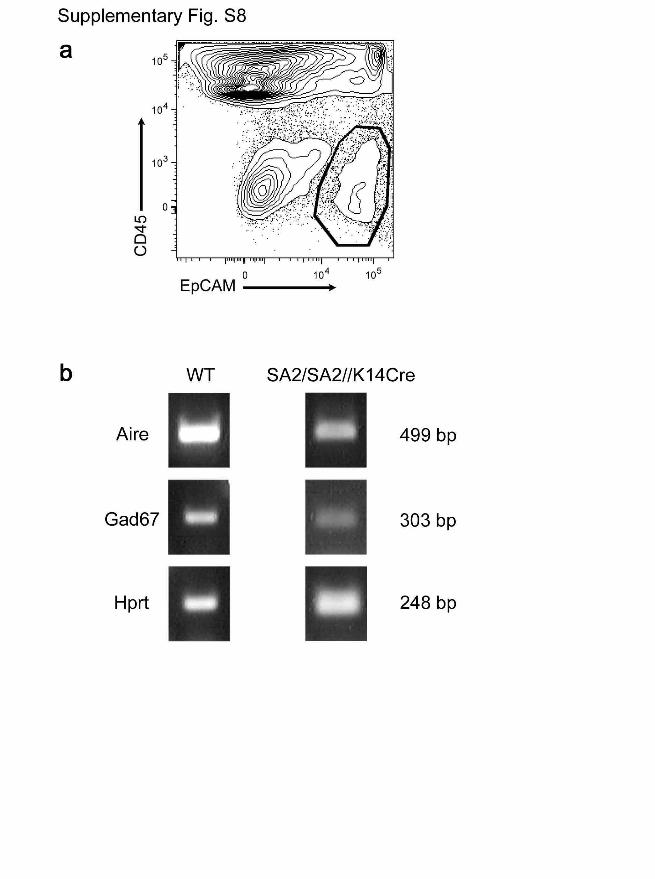
Figure S8 | Evidence for the expression of Aire and peripheral self-
antigens in thymic epithelial cells of Foxn1SA2/Foxn1SA2//hK14::Cre-
ERT2 mice. a, FACS profile of CD45-negative EpCAM-positive thymic
epithelial cells present in neo-thymi of reverter mice; the cells in the
indicated gate were sorted for subsequent RNA isolation. b, Expression
profile of TECs isolated as in a as determined by RT-PCR. The results
for the auto-immune regulator Aire and a representative example of
peripheral self antigens (Gad67) are shown. The quality of cDNA was
controlled by Hprt analysis. The fragment sizes of amplicons is indicated
on the right. The proportion of thymic CD4+CD25+ T regulatory cells in
neo-thymi (0.39±0.18% (n=6) is indistinguishable from that of wild-type
thymi (0.3±0.09; n=6).
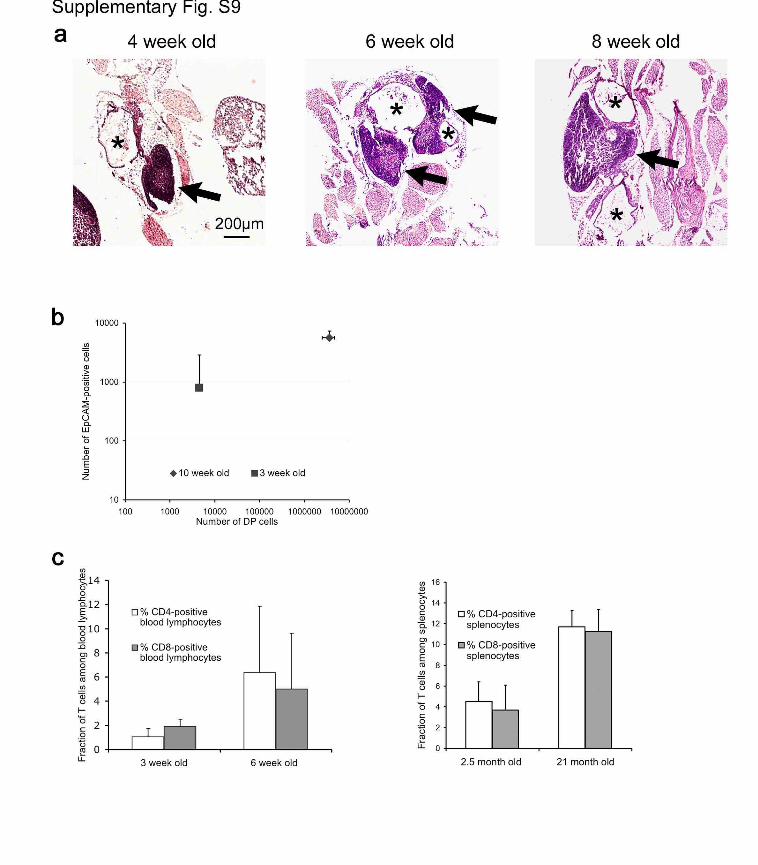
Figure S9 | Thymopoiesis correlates with peripheral T cell
reconstitution in Foxn1SA2/Foxn1SA2//hK14::Cre-ERT2 mice. a,
Histological verification of increased thymopoietic tissue in thymic
rudiments over time. The age of mice analysed is indicated at the top,
arrows point to neo-thymi, asterisks denote cystic parts of rudiments. In
older mice, medullary regions tend to coalesce into larger areas (data not
shown). b, The number of EpCAM-positive thymic epithelial cells
correlates with the number of CD4/CD8 double-positive thymocytes as
determined by FACS analysis after enzymatic digestion of thymic
rudiments (average values from 2 mice of the indicated age are shown). c,
Increasing levels of T cell sub-populations in peripheral blood (left panel)
6
and spleen (right panel) over time indicating an increasing T cell pool.
The results for at least 3 mice per group are shown.
Table S1 | Means and variances of the number of yellow cells in
thymic tissues of hK14::Cre-ERT2//Rosa26R-EYFP mice. The
characteristic feature of a Poisson (i.e. random) distribution is that the
means and variances of the observed parameter are the same. This is not
the case here (P<0.001; Sign test), even in the more stringent case of
variance equals five-fold of the mean (P<0.05). The number and
arrangement of yellow cells was determined by complete sectioning of
thymi.
Table S2 | Proliferation probabilities and cluster size. Under the
assumptions detailed in Supporting Text for the generation model,
biologically meaningful parameters reproduce the observed cluster size.
For a cluster of 32 cells, the probability of a progenitor cell to divide has
to be about 50%, whereas that of differentiated progeny about 5%.