Ce document correspond à la version acheminée aux Éditions ...
Upload
truongdieuCategory
view
215download
0
UNIVERSITÉ DU QUÉBEC
THÈSE PRÉSENTÉE À L'UNIVERSITÉ DU QUÉBEC À TROIS-RIVIÈRES
COMME EXIGENCE PARTIELLE DU DOCTORAT EN PSYCHOLOGIE
PAR IANMASSÉ
LES CONNEXIONS DES CORTEX SENSORIELS PRIMAIRES POUR LE TRAITEMENT CONTEXTUEL ET MULTISENSORIEL DE L'INFORMATION
AOUT 2017

Université du Québec à Trois-Rivières
Service de la bibliothèque
Avertissement
L’auteur de ce mémoire ou de cette thèse a autorisé l’Université du Québec à Trois-Rivières à diffuser, à des fins non lucratives, une copie de son mémoire ou de sa thèse.
Cette diffusion n’entraîne pas une renonciation de la part de l’auteur à ses droits de propriété intellectuelle, incluant le droit d’auteur, sur ce mémoire ou cette thèse. Notamment, la reproduction ou la publication de la totalité ou d’une partie importante de ce mémoire ou de cette thèse requiert son autorisation.

UNIVERSITÉ DU QUÉBEC À TROIS-RIVIÈRES
Cette thèse a été dirigée par:
Gilles Bronchti, directeur de recherche, Ph.D. Université du Québec à Trois-Rivières
Denis Boire, codirecteur de recherche, Ph.D. Université du Québec à Trois-Rivières
Jury d'évaluation de la thèse:
Gilles Bronchti, Ph.D. Université du Québec à Trois-Rivières
Johannes Frasnelli, Ph.D. Université du Québec à Trois-Rivières
Mathieu Piché, Ph.D. Université du Québec à Trois-Rivières
Patrice Voss, Ph.D. Université McGill
Thèse soutenue le 21/04/2017

Ce document est rédigé sous la forme d'articles scientifiques, tel qu' il est stipulé dans
les règlements des études de cycles supérieurs (Article 138) de l'Université du Québec à
Trois-Rivières. Les artiCles ont été rédigés selon les normes de publication de revues
reconnues et approuvées par le Comité d'études de cycles supérieurs en psychologie. Le
nom du directeur de recherche pourrait donc apparaitre comme co-auteur de l'article
soumis pour publication.

Sommaire
Notre perception de l'environnement dépend des interactions entre les différentes
modalités sensorielles. Ces interactions sont possibles entre les cinq sens
traditionnellement reconnus: la vision, l'audition, le toucher, l'odorat et le goût. Le
cortex cérébral, qui est un ensemble d'aires corticales interreliées par un réseau de
connexions, traite les informations provenant de chacun des sens. L'information
sensorielle est acheminée à partir des voies ascendantes, depuis les récepteurs
spécialisés, à des cortex sensoriels dédiés à des modalités spécifiques: le cortex visuel,
somatosensoriel et auditif. L'information sensorielle est par la suite acheminée aux aires
associatives qui assurent un traitement plus complexe de l'information. Bien que les
interactions multisensorielles aient été clairement démontrées dans les aires corticales
associatives multisensorielles du cortex temporal supérieur, pariétal et frontal, de
nombreuses études chez les humains, les primates et les rongeurs ont démontré que les
cortex sensoriels pnmarres sont également impliqués dans les interactions
multisensorielles. Les informations des autres modalités sensorielles peuvent atteindre
les cortex sensoriels primaires à partir de trois sources: les voies descendantes
provenant des aires corticales associatives multisensorielles, les conneXIOns
thalamocorticales provenant du thalamus et les conneXIOns corticocorticales directes
entre les cortex sensoriels primaires. Par conséquent, le concept des cortex sensoriels
primaires purement unisensoriels ne peut être maintenu.

v
Le traitement effectué dans les cortex sensoriels primaires inclurait donc l'information
sensorielle provenant des autres modalités, et l' information associative et motrice. Leur
position au premier niveau dans la hiérarchie corticale du traitement de l'information
sensorielle et à l' interface entre les voies sensorielles ascendantes provenant du thalamus
et les voies descendantes provenant des aires corticales associatives multisensorielles
suggérerait que les cortex sensoriels primaires ont un rôle clé dans le traitement de
l' information axé sur le stimulus et le traitement de l'information axé sur la tâche. Pour
comprendre comment ces aires contribuent au traitement de l' information sensorielle,
associative et motrice, il est important de connaitre l'ensemble des afférences des cortex
sensoriels primaires, tant corticales que sous-corticales. Des études démontrent l'étendue
des afférences corticales et sous-corticales vers le cortex visuel primaire et le cortex
auditif primaire afm d' avoir un inventaire complet des projections vers ces cortex. Un tel
inventaire a été réalisé pour le cortex somatosensoriel primaire. Un projet de grande
envergure a cartographié le connectôme des afférences et des efférences du cortex
somatosensoriel primaire de la souris. Cette analyse des projections du cortex
somatosensoriel primaire est cependant qualitative et ne fournit pas d' informations ~ur
leur distribution laminaire et leur poids relatif, qui sont des caractéristiques importantes
de la connectivité corticale. L'évaluation quantitative de la distribution laminaire des
neurones permet la classification des projections en tant que «feedforward »,
«feedback» ou latérale. Notre premier objectif était donc de faire l'évaluation
quantitative des afférences du cortex somatosensoriel primaire de la souris.

Vl
Les résultats de notre première étude démontrent que le cortex somatosensoriel primaire
de la souris possède des connexions avec les cortex moteurs, les aires corticales
associatives. et des noyaux thalamiques propices aux interactions multisensorielles. Ces
résultats confmnent que les cortex sensoriels primaires ne sont pas seulement limités au
traitement unisensoriel et incluent l' information sensorielle provenant des autres
modalités. Un résultat important est la démonstration que la partie caudale du champ de
tonneaux du cortex somatosensoriel primaire possède plus de connexions qui ciblent des
aires corticales et sous-corticales sensorielles propices à l'exploration. Ces aires incluent
des aires visuelles, auditives, olfactives et associatives, dont le cortex auditif et visuel, en
plus du cortex perirhinal et ectorhinal qui sont impliqué dans le traitement sensoriel.
Certaines régions sous-corticales sont également impliquées, telles que le noyau
thalamique ventral latéral qui module les processus nociceptifs. En comparaison, les
connexions de la partie rostrale du champ de tonneaux et de la partie du cortex
somatosensoriel primaire à l'extérieur du champ de tonneaux ciblent davantage des aires
somatosensorielles et motrices. SI reçoit aussi des afférences de plusieurs sources
différentes par le biais des voies descendantes. De plus, la distribution laminaire des
neurones rétrogradement marqués suggère que SI chez la souris, reçoit des projections
de type feedback de ces aires. Ces différentes aires pourraient avoir un rôle de
modulation, mais à différent degré étant donné que les indices laminaires, même si dans
l'ensemble négatifs, l'étaient à différents degrés. Ces projections de type feedback
pourraient moduler l'information dans le cortex somatosensoriel primaire, de sorte que
les signaux ascendants deviennent consciemment accessibles. En effet, SI aurait un rôle

vu
clé dans le codage prédictif qui est le processus d' appariement du système nerveux entre
l'information sensorielle des stimuli tactiles acheminée par les signaux ascendants et les
attentes envers l'environnement généré à l' interne par les signaux descendants. Le
champ de tonneaux comprend une représentation corticale des vibrisses chez les
rongeurs. Les vibrisses servent à l'exploration. Chez l'humain, la représentation des
mains occupe une grande surface du cortex somatosensoriel et est aussi surreprésentée
que les vibrisses dans le cortex. L' interaction des vibrisses avec la vision serait
importante dans la représentation de l'espace péripersonnel, soit l'espace à la portée de
n'importe quel membre d'un individu. Chez l'humain, cet espace est centré sur les mains
tandis que chez les rongeurs, cet espace serait centré sur les vibrisses. Des connexions
corticocorticales directes entre le champ de tonneaux et le cortex visuel primaire seraient
avantageuses pour favoriser des interactions multisensorielles rapides. Une étude plus
poussée de la structure de ces connexions permettrait de mieux comprendre comment
ces deux modalités sensorielles s' influencent mutuellement au niveau des cortex
sensoriels pnmaIres. L'étude de la morphologie des axones et de leurs terminaux
permettrait aussi d'en apprendre davantage sur leurs fonctions. Notre deuxième objectif
était donc d'étudier la microcircuiterie des connexions corticocorticales directes et
réciproques entre les cortex visuel et somatosensoriel primaires de la souris. Chez les
primates, très peu de neurones projettent directement d'un cortex sensoriel primaire vers
un autre. Cependant, les projections directes entre les cortex sensoriels primaires sont
abondantes chez les rongeurs. La souris est donc un meilleur modèle pour l'étude des
connexions corticocorticales directes entre les cortex sensoriels primaires.

V1l1
Les résultats de notre deuxième étude démontrent que la projection du champ de
tonneaux vers le cortex visuel primaire est de type feedback et aurait une influence
modulatrice prédominante alors que la projection réciproque est de type latéral et aurait
plutôt une influence inductrice. Ce résultat est important, car il démontre que ces
connexions corticocorticales entre deux cortex sensoriels primaires, bien que
réciproques, ne sont certainement pas symétriques. De plus, la présence de gros boutons
terminaux dans le champ de tonneaux du cortex somatosensoriel primaire et leur
absence dans le cortex visuel primaire suggère que chez la souris, la vision aurait une
influence inductrice sur l' exploration tactile et l'information tactile aurait une influence
modulatrice prédominante sur l' information visuelle. Ces deux modalités sensorielles ne
s'influencent donc pas mutuellement de la même manière au niveau des cortex
sensoriels primaires. À la lumière de ces résultats, nous nous sommes interrogés sur
l' influence de l'expérience visuelle pendant la période de vie postnatale sur le
développement des conneXIOns corticocorticales entre les cortex visuel et
somatosensoriel primaires. L'activité provenant des récepteurs sensoriels peut
considérablement influencer le développement de la connectivité corticale. La plasticité
intermodale implique des changements anatomiques importants dans le néocortex, mais
les effets de la cécité sur les connexions corticocorticales entre les cortex sensoriels
primaires ne sont pas encore bien documentés. Plusieurs études ont démontré chez des
modèles de cécité animale énucléée que le cortex visuel reçoit des afférences auditives et
somatosensorielles, mais peu d'études se sont consacrées aux efférences du cortex visuel
vers les aires des autres modalités sensorielles. Une étude plus poussée de la structure

IX
des connexions entre les cortex visuel et somatosensoriel primaires permettrait de mieux
comprendre comment les connexions entre deux cortex sensoriels primaires sont altérées
par la perte d'un sens. Notre troisième objectif était donc d'étudier l'impact de la perte
de la vision sur la microcircuiterie de ces connexions à l'aide d'un échantillon de souris
énucléées à la naissance. Enfm, la discussion générale est consacrée à la signification de
nos résultats dans le contexte des connaissances actuelles sur les interactions
multisensorielles, la hiérarchie des sens et nous spéculons sur leurs implications
cliniques en termes de la recherche sur les prothèses.
Mots clés : microcircuiterie, neuroanatomie, connectivité, cortex visuel primaire, cortex somatosensoriel primaire, champ de tonneaux, afférence, efférence, interaction multisensorielle, convergence mUltisensorielle, vision, acuité tactile, perception sensorielle, morphologie, cécité.

Table des matières
Sommaire ................................ ................................................... ... ....... .......... ...... ..... ..... .. .iv
Liste des tableaux .......................................................................................................... xvii
Liste des figures ................................................................... ...................................... ..... xix
Liste des symboles et abréviations ............................................................................... xxiii
Remerciements .................... ............................................... ...................... ................... xxvii
Introduction ............................................................................................................. ...... ..... 1
Les voies sensorielles ascendantes et descendantes .. .. ..... ........ ................ .... ........ ... .... 2
L'apprentissage perceptif ... .. .... ... ....... .. .. ...... .. ......... ..... ............................................... 5
Les connexions corticocorticales ................................................................................ 6
La distribution laminaire des connexions corticocorticales ................................ . 7
Le connectome et la connectomique .......................................... .. ...... .......... ............... 8
Les différentes échelles de connectome .... ........ ....... ..... ....... ................... ............. 8
Le modèle de recherche animal ... ............. .................................................................. 9
Comparaison entre humain et rongeur ................... ....... ................. ........ ............ 10
Le connectome du cerveau de souris ............. ................ ........................................... 11
Les modules somatosensoriels de la souris ...... ......... ......................................... 12
Objectif 1 : Projections afférentes corticales et sous-corticales du cortex somatosensoriel primaire de la souris ........ ... ............................................................ 13
L' espace péripersonnel ........... ............................................................... ........ ... ........ 14
Comparaison entre humain et rongeur ....... ........................................................ 15
Les interactions multisensorielles .............. ....... ................. ....................................... 16
Les interactions visuotactiles ...................... .................. .......................... .... ..... .. 17

Xl
Les modes de transmission glutamatergique ............................................................ 18
Les réponses postsynaptiques de Classe 1 ......................................................... 20
Les réponses postsynaptiques de Classe 2 ......................................................... 21
Les corrélations anatomiques des réponses postsynaptiques ............................. 22
Les implications fonctionnelles des réponses postsynaptiques ......................... 23
Objectif2 : Les connexions corticocorticales directes et réciproques entre le cortex visuel et somatosensoriel primaire de la souris .............................................. 26
La cécité et les connexions corticocorticales ............................................................ 28
Les effets de la cécité sur les connexions corticales .......................................... 29
Objectif3 : Effets de l'énucléation sur les connexions corticocorticales directes et réciproques entre le cortex visuel et somatosensoriel primaire de la souris ......... 30
Résumé des objectifs de recherche ........................................................................... 31
Méthode ............................................................................................................................ 32
Souris C57Bl/6 énucléée à la naissance .................................................................... 33
Énucléation néonatale ........................................................................................ 34
Traçage neuronal ....................................................................................................... 34
Transports antérograde et rétrograde ................................................................. 34
Sous-unité B de la toxine du choléra .......................................................... 37
Dextran-biotine aminé ................................................................................ 39
Chapitre I. Cortical and subcortical afferent connections of the primary somatosensory cortex of the mouse ................................................................................. 41
Abstract ..................................................................................................................... 43
Introduction ............................................................................................................... 45
Methods ..................................................................................................................... 48

xii
AnimaIs and experiment groups ........................................................................ 48
Tracing procedures ............................................................................................. 49
Perfusion ............................................................................................................ 49
Staining procedures ............................................................................................ 50
Data analysis ...................................................................................................... 51
Data comparison to the Mouse Connectome Project.. ....................................... 52
Antibody characterization .................................................................................. 53
Statistical analysis .............................................................................................. 53
Results ....................................................................................................................... 54
CTb labeling ....................................................................................................... 54
Cortical projections to SI ................................................................................... 57
Subcortical projections to Si ............................................................................. 82
Discussion ................................................................................................................. 92
Summary ............................................................................................................ 92
Connectomes and modules in the somatosensory barrel field vs. non-barrel field .................................................................................................................... 93
Multimodality of primary sensory cortices ........................................................ 98
Possible functions of non-somatosensory sensory and multisensory inputs to SI ..................................................................................................................... 100
Top-down cortical projections and conscious sensory perception in SI ......... 101
Top-down and multisensory thalamocortical connections to SI ..................... 105
Conclusions ............................................................................................................. 107
References ............................................................................................................... 109

X111
Chapitre II. Asymmetric direct reciprocal connections between primary visual and somatosensory cortices of the mouse ............................................................................. 119
Abstract ................................................................................................................... 121
Introduction ............................................................................................................. 122
Methods ................................................................................................................... 124
Tracing procedures ........................................................................................... 125
Charting of retrogradely labeled neurons ........................................................ 127
Single axon reconstructions ............................................................................. 129
Stereological sampling oflaminar distribution ofaxonal swellings ................ 130
Sampling ofaxonal diameters .......................................................................... 133
Statistical analysis ............................................................................................ 134
Results ........................................................... .......................................................... 135
Labeling of cortical visuotactile connections with CTb .................................. 135
Laminar distribution of Cholera toxin b labeled neurons ................................ 141
Anterograde BDA labeling of visuotactile connections .................................. 143
Single axon branching morphology ................................................................. 145
Axonal thickness .............................................................................................. 152
Number of anterogradely labeled axonal swellings ......................................... 153
Laminar distribution ofaxonal swellings ........................................................ 156
Size distribution ofaxonal swellings in corticallayers ................................... 158
Discussion ............................................................................................................... 160
Direct reciprocal projection between visual and somatosensory cortices ....... 161
Hierarchical order of primary sensory cortices ................................................ 162

XlV
Asymmetry of the strength of the reciprocal projections between VI and SIBF ................................................................................................................ 165
Size ofaxonal swellings ................................................................................... 166
Single axon morphology .................................................................................. 170
Conclusions ............................................................................................................. 172
References ............................................................................................................... 173
Chapitre III. Effects of enucleation on the direct reciprocal corticocortical connections between primary visual and somatosensory cortices of the mouse ........... 180
Abstract ................................................................................................................... 182
Introduction ............................................................................................................. 184
Methods ................................................................................................................... 186
Neonatal enucleation ........................................................................................ 186
Tracing procedures ........................................................................................... 187
Charting of retrogradely labeled neurons ........................................................ 189
Stereological sampling oflaminar distribution ofaxonal swellings ................ 191
Sampling ofaxonal diameters .......................................................................... 197
Statistical analysis ............................................................................................ 199
Results ..................................................................................................................... 199
Labeling of cortical visuotactile connections with CTh .................................. 199
Laminar distribution of Cholera toxin b labeled neurons ................................ 206
Laminar distribution ofaxonal swellings ........................................................ 210
Size distribution ofaxonal swellings in corticallayers ................................... 212
Axonal thickness .............................................................................................. 215
xv
Discussion ............................................................................................................... 217
The effects of enucleation on VI afferent projections ..................................... 217
The effects of enucleation on the structure of the projections between VI and SI ............................................................................................................... 221
The effects of enucleation on the thickness of axons and size axonal swellings .......................................................................................................... 221
Conclusions ............................................................................................................. 225
References ........................................................................................................ ....... 226
Discussion ...................................................................................................................... 236
Objectif 1 : Projections afférentes corticales et sous-corticales du cortex somatosensoriel primaire de la souris ..................................................................... 23 8
La multimodalité du cortex somatosensoriel primaire ..................................... 240
Les voies les plus rapides vers SI .................................................................... 242
Les voies descendantes des aires associatives vers SI .................................... 243
Spécificité des espèces aux niveaux des connexions entre aires primaires: rongeurs vs non-rongeurs ................................................................................. 244
Objectif2 : Les connexions corticocorticales directes et réciproques entre le cortex visuel et somatosensoriel primaire de la souris ............................................ 245
La position hiérarchique des cortex sensoriels primaires ................................ 246
L'asymétrie du poids des projections .............................................................. 248
L'asymétrie de la taille des boutons terminaux ............................................... 248
L'asymétrie du diamètre des axones ................................................................ 249
L'hypothèse de la précision des modalités sensorielles ................................... 250
Les prothèses .................................................................................................... 252
Les interfaces humain-robot ............................................................................ 255

XVl
Objectif3 : Effets de l'énucléation sur les connexions corticocorticales directes et réciproques entre le cortex visuel et somatosensoriel primaire de la souris ....... 257
Les effets de la cécité sur le poids des projections .......................................... 259
Les effets de la cécité sur la nature des projections ......................................... 261
Les effets de la cécité sur la taille des boutons et des axones .......................... 263
Conclusion ..................................................................................................................... 267
Références générales ...................................................................................................... 273

Liste des tableaux
Tableau
1 Résumé des caractéristiques anatomiques et synaptiques ............. ................ ....... 19
2 List of our cases that received CTb injections in the prirnary somatosensory cortex (SI) outside the barrel field, in the rostral (rSlBF) and caudal (cSlBt) barrel field and the cases used from the MCP corticocortical connectivity atlas that received CTb or Fluorogold (FG) injections in the prirnary somatosensory barrel field (SSp-bfd), lower limb (SSp-ll), and upper limb (SSp-ul) areas ....... . 60
3 Number and percentage (in parentheses) ofretrogradely labeled neurons in sensory and non-sensory cortical areas in the ipsilateral hemisphere after injections ofCTb into the primary somatosensory cortex (SI) of intact C57BI/6 mice ........................................... .... ......... ....... ..... ............ .... .... .... ......... .. 61
4 Number and percentage (in parentheses) of retrogradely labeled neurons in sens ory and non-sensory cortical areas in the contralateral hemisphere after injections ofCTb into the primary somatosensory cortex (SI) ofintact C57BI/6 mice ....... ............. ... .............. .................................................................. 65
5 Numbers of retrogradely labeled neurons in supragranular/infragranular layers and layer indices (below) in non-somatosensory sensory and non-sensory neocortical areas in the ipsilateral hemisphere after inj ections of CTh into SI, SIBF (rostral part) and SIBF (caudal part) ofC57Bl/6 rnÏce ............ .......... ....... . 73
6 Numbers of retrogradely labeled neurons in supragranular/infragranular layers and layer indices (below) in non-somatosensory sensory and non-sensory neocortical areas in the contralateral hemisphere after injections of CTb into SI, SIBF (rostral part) and SIBF (caudal part) of C57Bl/6 rnÏce ........................ 76
7 Number and percentage (in parentheses) of retrogradely labeled neurons in sensory and non-sensory subcortical areas after injections of CTh into the prirnary somatosensory cortex (S 1) of intact C57Bl/6 mice ...................... ...... ... 84
8 Stereological sampling parameters for the estimation of the number of anterogradely labeled axonal swellings in each layers in S IBF after injections of BDA into VI of C57Bl/6 mice ... ... .... ... ............................ .... ..... .................... 132
9 Sampling parameters for the estimation of the number of anterogradely labeled axons as they enter the gray matter in SIBF and VI after injections ofBDA into VI and SIBF respectively of C57Bl/6 mice ................................ 134

XVlll
Tableau
10 Numbers and percentage (in parentheses) ofretrogradely labeled neurons in supragranular / granular / infragranular layers and layer indices (below) in SI, SlBF and VI after injections ofCTh into VI and SlBF ofC57Bl/6 mice ....... 138
Il Stereological sampling parameters for the estimation of the number of anterogradely labeled axonal swellings in each layers in VI after injections of BDA into SlBF ofC57Bl/6 mice ...................................................................... 155
12 Stereological sampling parameters for the estimation of the number of anterogradely labeled axonal swellings in each layers in SlBF after injections ofBDA into VI of intact C57Bl/6 mice ............................................................ 193
13 Stereological sampling parameters for the estimation of the number of anterogradely labeled axonal swellings in each layers in SlBF after injections ofBDA into VI of enucleated C57Bl/6 mice .................................................... 194
14 Stereological sampling parameters for the estimation of the number of anterogradely labeled axonal swellings in each layers in VI after injections ofBDA into SlBF of intact C57Bl/6 mice ........................................................ 195
15 Stereological sampling parameters for the estimation of the number of anterogradely labeled axonal swellings in each layers in VI after injections of BDA into SlBF of enucleated C57Bl/6 mice .................................................... 196
16 Sampling parameters for the estimation of the diameter of anterogradely labeled axons as they enter the gray matter in SlBF and VI after injections of BDA into VI and SlBF respectively of intact and enucleated at birth C57Bl/6 mice .................................................................................................................... 198
17 Number and percentage (in parentheses) of retrogradely labeled neurons in neocortical areas after inj ections of CTh into the primary visual cortex (V 1) and the primary somatosensory cortex (SI) of intact and enucleated C57Bl/6 mice .................................................................................................................... 203
18 Numbers ofretrogradely labeled neurons in layers I-IIVIVNNI and layer indices (below) in neocortical areas after injections of CTh into the primary visual cortex (VI) and the primary somatosensory cortex (SI) of intact and enucleated C57BI/6 mice ................................................................................... 208
19 Résumé des caractéristiques des projections entre VI et S1.. ............................ 266

Liste des figures
Figure
1 Représentation schématique des voies sensorielles ................................................. .4
2 L'apprentissage perceptif. ......................................................................................... 5
3 Connexions feedforward, feedback et latérale d'après la distribution laminaire des neurones (Inspiré de Vezoli et al. 2004) ............................................................. 7
4 Vue latérale du cortex cérébral chez l'humain et le rat ............................................ 9
5 Parallèles entre humains et rongeurs. Homoncule et souricule (Bear et al., 2007; Zembrzycki et al., 2013) ......................................................................................... 1 0
6 Les quatre modules de connectivités somatosensoriels de la souris tel que démontré sur la base des données disponibles dans le Mouse Brain Connectome Project (Zingg et al., 2014) ..................................................................................... 12
7 Parallèles entre humains et rongeurs. Espace péripersonnel (Cardinali et al., 2009; Rizzolatti et al., 1981 b; Rizzolatti et al., 1981 a) .......................................... 16
8 Les boutons terminaux inducteurs et modulateurs ................................................. 19
9 Connexions corticothalamiques .............................................................................. 26
10 Transport axonal antérograde en rouge et transport axonal rétrograde en bleu ..... 35
Il Tracer injection sites and distribution of retrogradely labeled neurons in the somatosensory thalamus ......................................................................................... 55
12 CTb-Iabeled neurons in the cortex after an injection into the posterior part of the barrel field of SI ............................................................................................... 55
13 Diagram of the afferent connections of the primary somatosensory cortex (S 1) of the C57Bl/6 mouse ............................................................................................. 56
14 Percentage ofretrogradely labeled neurons in cortical areas in the ipsilateral (A) and contralateral hemispheres (B) .......................................................................... 70
15 Layer indices for neocortical areas in the ipsilateral (A) and contralateral hemispheres (B) ...................................................................................................... 78
xx
Figure
16 Layer indices matching between the ipsilateral hemisphere ex axis) and the contralateral hemisphere (Y axis) .......................... .... .... .... .. .............. ....... ..... ...... ... 80
17 Percentage of retrogradely labeled neurons (Y axis) depending on their distance ex axis) from one of the three different injection sites in SI ................ ...... ......... .. 81
18 CTb-labeled neurons in the subcortex after an injection into the posterior part of the barrel field of SI. Scale: 250 J.lm .............................. ... .... .... ............ ................ . 83
19 Percentage of retrogradely labeled neurons in different subcortical areas ............. 89
20 Diagram showing the input ratios of different modalities into the primary somatosensory cortex of the C57Bl/6 mouse .......... ...... .. ......... ... ............. ...... ........ 91
21 A: An injection of CTb in VI produced in B: Anterograde and retro grade labeling in SIBF. Note the more abundant retrogradely labeled neurons in layer 5 than in supragranular layers and the intense anterograde labeling in layers 2/3 and 5. C: An injection ofCTh in SIBF produced in D: Retrogradely labeled neurons in supragranular and infragranular layers, a typical distribution of lateral connections ...... ....... ..... .......... .......... ..... ............ ........ ... ....... .... ... ......................... .. 136
22 A: Number of retrogradely labeled neurons in cortical areas following an injection of CTh in VI and S IBF of C57Bl/6 mice. B: Percentage of retrogradely labeled neurons in cortical areas following an injection of CTb in VI and SIBF ofC57Bl/6 mice. C: Layer indices for neocortical areas following an injection of CTb in VI and SIBF of C57Bl/6 mice .......... .............. 140
23 A: An injection of BDA in S IBF produced in B: Anterograde labeling of axons in the supragranular and infragranular layers in VI. C: An injection ofBDA in VI produced in D: Anterograde labeling of axons in the supragranular and infragranular layers in SI BF ..... ... .. ....... .... ............. ...... ..... ..... ... ............ ... ............. 145
24 Single axons in SIBF following an injection ofBDA in VI ofC57Bl/6J mice ............... ..... ....... ..... ... .. .... .... .. ....... .... .... .... .. .... ... .... ... ....... .... ... .... .... ... .... .... .... 148
25 Single axons in VI following an injection ofBDA in SIBF ofC57Bl/6J mice .... ..... ....... ..... ..... ..... .... ...... ... ..... .... ... .... ........ .. .......... ...... ....... .. ...... .... .... ... ..... .. 150
26 Size distribution ofaxonal diameters in SIBF (solid line) following BDA injections in VI and in VI following injections in SIBF (dotted line) ..... .. ... .. .... 153

XXI
Figure
27 Laminar and size distribution ofaxonal swellings in SI BF and VI following an injection ofBDA in VI cortex and SlBF respectively ofC57Bl/6J mice from the sample of reconstructed single axons (A and C resp) and from the stereological sampling ofthese cortical areas following columnar BDA cortical injections (B and D resp) ............................................................................................................ 157
28 A: An injection of CTb in VI of intact C57Bl/6 mice produced in B: Anterograde and retro grade labeling in S 1BF. C: An injection of CTh in VI of enucleated C57Bl/6 mice produced in D: Anterograde and retro grade labeling in S 1BF ...... 200
29 A: An injection ofCTb in SlBF of intact C57Bl/6 mice produced in B: Anterograde and retro grade labeling in VI. C: An injection ofCTb in SlBF of enucleated C57Bl/6 mice produced in D: Anterograde and retro grade labeling in VI ..................................................................................................................... 200
30 A: Percentage of retrogradely labeled neurons in cortical areas following an injection ofCTb in VI and SlBF. Percentage ofretrogradely labeled neurons in each cortical layer following an injection ofCTb in VI (B) and in SlBF (C) ..... 205
31 Layer indices for neocortical areas following an injection of CTh in VI and SlBF ..................................................................................................................... 206
32 High power photomicrographs of swellings in SlBF of intact and enucleated mice (A and B resp) .............................................................................................. 211
33 Laminar distribution of the number ofaxonal swellings in SIBF (A) and VI (B) following and injection ofBDA in VI and SIBF respectively of intact and enucleated mice .................................................................................................... 212
34 Size distribution (A and C) and box plot representation (B and D) ofaxonal swelling size in SlBF (A and B) and VI (C and D) following injections of BDA in VI and SlBF respectively of intact and enucleated mice. The box plots depict the minimum and maximum values, the upper (Q3) and lower (QI) quartiles and the median ....................................................................................... 214
35 Size distribution (A and B) and box plot representation (C) of the diameters of randomly sampled axons as they enter the gray matter in SIBF (A and C) and VI (B and C) following an injection ofBDA in VI and SlBF respectively of intact and enucleated mice .................................................................................... 216
36 Asymétrie fonctionnelle entre les cortex sensoriels primaires de la souris (Iurilli et al., 2012) ................................................................................................ 241

XXII
Figure
37 L'illusion de la main en caoutchouc (Botvinick & Cohen, 1998) ........................ 253

Liste des symboles et abréviations
Al Cortex auditif primaire
AD Noyau thalamique antérodorsal
AM Noyau thalamique antéromédial
Amyg Noyaux amygdalaires
Au Cortex auditif
AuD Cortex auditif, aire dorsale
Au V Cortex auditif, aire ventrale
A V Noyau thalamique antéroventral
B Noyau basal de Meynert
Cg Cortex cingulaire
CGLd Corps géniculé latéral dorsal
CGM Corps géniculé médial
CGMd Corps géniculé médial dorsal
CGMm Corps géniculé médio médial
CGMv Corps géniculé médial ventral
CI Collicule inférieur
Cl Claustrum
CL Noyau thalamique centrolatéral
CM Noyau thalamique centromédian
CS Collicule supérieur
CTb Sous-unité B de la toxine du choléra

DAB
DBA
E
Ect
Ent
Fr2
HDB
Hyp
!AM
iGluR
Ins
IRMf
LD
LP
LPO
LSI
M
Ml
M2
Mam
MDL
mGluR
3,3 -diamino benzidine
Dextran-biotine aminé
Jour embryonnaire
Cortex ectorrunal
Cortex entorrunal
Cortex agranulaire médial
Segment horizontal de la bande diagonale de Broca
Hypothalamus
Noyau thalamique interantéromédial
Récepteur glutamatergique ionotropique
Cortex insulaire
Imagerie par résonance magnétique fonctionnelle
Noyau thalamique latérodorsal
Noyau latéral postérieur
Aire latérale préoptique
Noyau septallatéral, partie intermédiaire
Cortex moteur
Cortex moteur primaire
Cortex moteur secondaire
Noyaux mamillaires
Noyau thalamique médiodorsal, partie latérale
Récepteur glutamatergique métabotropique
XXIV

NDS
Orb
P
PC
PF
Pir
Pli
Po
PPC
PPSE
PPSI
PRh
PtA
PV
Re
Rh
RS
RSA
RSG
Rt
SI
SISh
Normaldonkeysennn
Cortex orbital
Jour postnatal
Noyau thalamique paracentral
Noyau thalamique parafasciculaire
Cortex piriforme
Noyau thalamique postérieur lirnitans
Noyau postérieur
Cortex pariétal postérieur
Potentiels postsynaptiques excitateurs initiaux élevés
Potentiels postsynaptiques inhibiteurs initiaux élevés
Cortex périrhinal
Cortex pariétal associatif
Noyau thalamique paraventriculaire
Noyau thalamique réuniens
Noyau thalamique rhomboïde
Cortex rétrosplénial
Cortex rétrosplénial agranulaire
Cortex rétrosplénial granulaire
Noyau thalamique réticulaire
Cortex somatosensorielprimaire
Cortex somatosensoriel primaire, épaules
xxv
S11
SlFL
SlHL
SlTr
S2
SG
SIP
Som
STS
Sub
TeA
Vl
V2
V2L
V2M
VA
VDB
VL
VM
VP
VPL
VPM
ZI
Cortex somatosensoriel primaire, mâchoire
Cortex somatosensoriel primaire, membres antérieurs
Cortex somatosensoriel primaire, membres postérieurs
Cortex somatosensoriel primaire, tronc
Cortex somatosensoriel secondaire
Noyau supragéniculé
Sillon intrapariétal
Cortex somatosensoriel
Sillon temporal supérieur
Noyau thalamique submedius
Cortex temporal associatif
Cortex visuel primaire
Cortex visuel secondaire
Cortex visuel secondaire, aire latérale
Cortex visuel secondaire, aire médiale
Noyau thalamique ventral antérieur
Segment vertical de la bande diagonale de Broca
Noyau thalamique ventral latéral
Noyau thalamique ventral médial
Noyau thalamique ventral postérieur
Noyau thalamique ventral postérolatéral
Noyau thalamique ventral postéromédial
Zona incerta
XXVI

Remerciements
J'aimerais premièrement remercier mon directeur de recherche principal, Monsieur
Gilles Bronchti, Ph.D., professeur au Département d'anatomie de l'Université du
Québec à Trois-Rivières, pour m'avoir donné la chance de travailler dans son laboratoire
alors que je fInissais ma première année d'étude au baccalauréat et que j 'hésitais entre la
clinique et la recherche. J'ai découvert un univers fascinant où la persévérance est de
mise, mais où les efforts sont toujours récompensés. Je voudrais aussi le remercier pour
son soutien, son souci du travail bien fait, ses conseils pratiques tout au long de ce projet
ainsi que pour son appui technique dans la réalisation de la présente recherche.
J'aimerais aussi remercier mon codirecteur de recherche, Monsieur Denis Boire,
Ph.D., professeur au Département d'anatomie de l'Université du Québec à Trois
Rivières, pour ses commentaires constructifs et ses conseils. Je voudrais aussi le
remercier pour les discussions, les critiques constructives, la disponibilité, la patience,
l' intégrité et le dévouement. Merci d' avoir eu conftance en moi et de m'avoir transmis
votre passion pour la recherche. Grâce à vous, mon passage au laboratoire aura été très
enrichissant, tant sur le plan scientifIque que personnel. Je voudrais aussi le remercier
pour m'avoir donné l'opportunité de voyager et de présenter mes travaux dans des
congrès où j ' ai pu rencontrer de grands chercheurs, élargir mes connaissances et aviver
ma passion pour la neuroscience. Merci aussi de m'avoir donné la chance de faire ce
doctorat en sachant que la courbe d'apprentissage pour un étudiant en psychologie serait
abrupte. Vous m'avez supporté et encouragé tout au long de ces études.

XXVlll
Merci aux nombreux collègues que j 'ai eu la chance de côtoyer au fil des ans. Ils ont
été une deuxième famille et ils ont su rendre agréables les longues journées passées au
laboratoire. Merci à Marie-Eve Laramée et Sonia Guillemette de m'avoir enseigné la
méthodologie qui m'a servi tout au long de mon doctorat et de toujours avoir pris le
temps de répondre à mes nombreuses questions. Merci à Joshua Cloutier-Beaupré et
Jonathan Pommainville d'avoir su faire du laboratoire un endroit dynamique et
convivial. Merci fmalement à Robert Tremblay-Laliberté et Samuel Stromei-Cléroux,
pour leur patience et leur bonne humeur, malgré les heures passées au microscope. Je
voudrais aussi remercier le Réseau de Recherche en Science de la Vision pour m'avoir
permis de présenter mes résultats dans un cadre valorisant et pour les prix qui ont été
beaucoup plus qu'un simple support fmancier, ils ont été un tremplin pour ma carrière
scientifique.
Je remercie fmalement ma famille et mes amis, qui m'ont toujours encouragé. Merci
d'avoir accepté que le travail à accomplir limitait parfois le temps passé avec vous.
Sachez par contre que chaque instant en votre compagnie a d'autant plus compté. Merci
finalement pour les tapes dans le dos. Ce sont ces gestes qui m'ont donné la force de
continuer. Mes derniers remerciements et non les moindres s'adressent à ma femme
Jessica, qui pour mon plus grand bonheur partage ma vie et mes expériences
professionnelles depuis leurs origines. Elle a su, tout au long de cette thèse
m'encourager dans ma voie. Son soutien a été sans faille et je lui serai éternellement
reconnaissant d' avoir été à mes côtés et d' être la clé de ma réussite.

- Je dédie cette thèse à mes parents.

Introduction
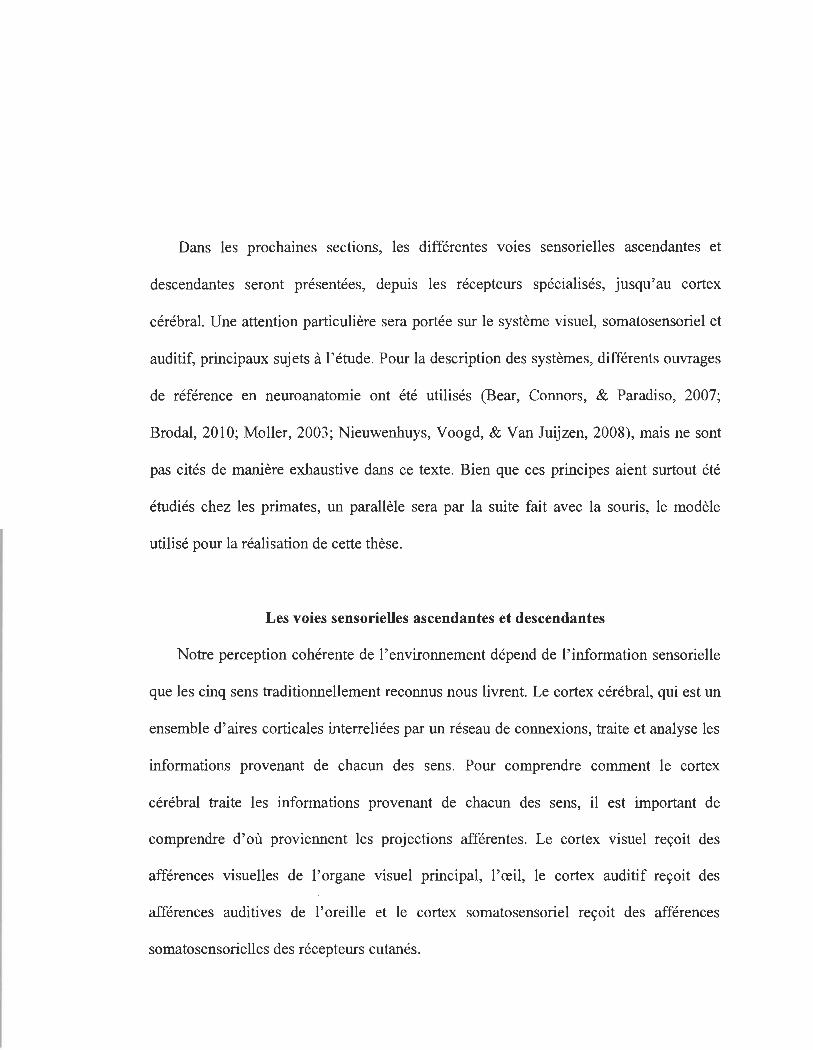
Dans les prochaines sections, les différentes VOles sensorielles ascendantes et
descendantes seront présentées, depuis les récepteurs spécialisés, jusqu'au cortex
cérébral. Une attention particulière sera portée sur le système visuel, somatosensoriel et
auditif, principaux sujets à l'étude. Pour la description des systèmes, différents ouvrages
de référence en neuroanatomie ont été utilisés (Bear, Connors, & Paradiso, 2007;
Brodal, 2010; Moller, 2003; Nieuwenhuys, Voogd, & Van Juijzen, 2008), mais ne sont
pas cités de manière exhaustive dans ce texte. Bien que ces principes aient surtout été
étudiés chez les primates, un parallèle sera par la suite fait avec la souris, le modèle
utilisé pour la réalisation de cette thèse.
Les voies sensorielles ascendantes et descendantes
Notre perception cohérente de l'environnement dépend de l'information sensorielle
que les cinq sens traditionnellement reconnus nous livrent. Le cortex cérébral, qui est un
ensemble d'aires corticales interreliées par un réseau de connexions, traite et analyse les
informations provenant de chacun des sens. Pour comprendre comment le cortex
cérébral traite les informations provenant de chacun des sens, il est important de
comprendre d'où proviennent les projections afférentes. Le cortex visuel reçoit des
afférences visuelles de l'organe visuel principal, l'œil, le cortex auditif reçoit des
afférences auditives de l'oreille et le cortex somatosensoriel reçoit des afférences
somatosensorielles des récepteurs cutanés.

3
L'information sensorielle est par la suite acheminée aux noyaux thalamiques
spécifiques par les voies sensorielles ascendantes. Le corps géniculé latéral dorsal pour
la vision, le noyau ventral postérieur pour le toucher et le corps géniculé médial ventral
pour l'audition. Dans les voies sensorielles ascendantes, la perception est axée sur le
stimulus et le signal se déplace du bas vers le haut. L' information arrive ensuite aux
cortex sensoriels primaires dédiés à chacune des modalités. Le cortex visuel primaire
pour la vision, le cortex somatosensoriel primaire pour le toucher et le cortex auditif
primaire pour l' audition. Le terme primaire provient du fait que ces aires corticales
représentent le premier niveau de traitement de l' information sensorielle. Elles traitent
les informations sensorielles de base comme les formes, les textures et les sons.
Les cortex sensoriels primaires relaient ensuite l' information à partir des VOles
ascendantes vers des cortex sensoriels secondaires qui traitent les informations plus
complexes comme la perception spatiale, la reconnaissance et la vitesse de mouvement.
Les connexions à partir d'aires corticales de différentes modalités sensorielles vont
ensuite converger vers les aires associatives multisensorielles au sommet qui sont
impliquées dans les fonctions supérieures. Ces dernières retournent l'information
sensorielle vers les cortex sensoriels primaires à partir des voies descendantes. Dans les
voies sensorielles descendantes, la perception est axée sur le contexte et le signal se
déplace du haut vers le bas. La communication ente les aires corticales peut également
se faire par les connexions indirectes des boucles cortico-thalamo-corticales qui passent
par des noyaux thalamiques d'ordre supérieur.

4
Les cortex sensoriels primaires ne seraient donc pas seulement impliqués dans le
traitement de l'information sensorielle de leur propre modalité acheminée par les voies
ascendantes provenant des noyaux thalamiques spécifiques. Les cortex sensoriels
primaires reçoivent également des informations contextuelles des voies descendantes
provenant des aires associatives, et des boucles cortico-thalamo-corticales indirectes
provenant des noyaux thalamiques d'ordre supérieur (Kaas & Collins, 2013; Scheich,
Brechmann, Brosch, Budinger, & Ohl, 2007). Les cortex sensoriels primaires sont ainsi
situés à l'interface des voies ascendantes et descendantes et auraient un rôle clé dans le
traitement de l' information axé sur le stimulus et axé sur le contexte. La Figure 1 est une
représentation schématique des voies sensorielles.
+- Voie ascendante • Perception axée sur le stimulus; • Du bas vers le haut.
Voie descendante • Perception axée sur le contexte; • Du haut vers le bas.
Indirecte
Boucle cortico-thalamo-corticale
Directe
Figure 1. Représentation schématique des voies sensorielles.

5
L'apprentissage perceptif
Un exemple qui valide le rôle clé des cortex sensoriels primaires dans le traitement
de l'information axé sur le stimulus et axé sur le contexte est l'apprentissage perceptif.
L'apprentissage perceptif reflète un processus d'appariement du système nerveux entre
l'information sensorielle des stimuli externes acheminée par les voies ascendantes et les
attentes envers l'environnement généré à l'interne par les voies descendantes
(Grossberg, 1980; Lee & Mumford, 2003; LIinas & Pare, 1991). Dans la Figure 2 par
exemple, le traitement de l'information sensorielle axé sur le stimulus des voies
ascendantes permet de percevoir des taches noires disposées sur un fond blanc. Pour un
observateur naïf, il est difficile de percevoir l'image cachée dans cet amas de taches. Si
cet observateur prend conscience de l'image et qu'il regarde à nouveau la première
figure, le traitement de l'information sensorielle axé sur le contexte des voies
descendantes fait que l'image de grenouille cachée devient perceptible.
Figure 2. L'apprentissage perceptif. Les voies ascendantes permettent de percevoir les taches, mais pas l'image qui devient perceptible si on la connait (Gregory, 1970).

6
Les connexions corticocorticales
Les axones sont les prolongements uniques des neurones qui transmettent les influx
nerveux vers une cible. En 1979, les chercheurs Kathleen Rockland et Deepak Pandya
ont démontré que les connexions corticocorticales, c'est-à-dire d'un cortex vers un autre
cortex, auraient des caractéristiques différentes selon leur direction. Les connexions
rostro-caudales, désignées comme les connexions «feedforward », sont dirigées de
l'avant vers l'arrière du cortex. Les connexions caudo-rostrales, désignées comme les
connexions «feedback », sont dirigées de l'arrière vers l'avant du cortex. Ces directions
pourraient correspondre aux voies ascendantes et descendantes. La réciprocité est aussi
un important principe des connexions corticocorticales. Ils ont démontré que les voies
ont tendance à être bidirectionnelles, de sorte que si l'aire A projette vers l'aire B, l'aire
B risque de projeter aussi vers l'aire A.
En 1991, ces notions ont été utilisées par les chercheurs Daniel F elleman et David
Van Essen pour former la base de leur modèle de la hiérarchie corticale du cortex visuel
chez le primate. Dans leur analyse des connexions corticocorticales, ils ont présenté un
modèle dans lequel 32 aires corticales sont réparties sur 10 niveaux hiérarchiques. Dans
ce modèle, les connexions feedforward projettent vers une aire de plus haut niveau et les
connexions feedback vers une aire de plus bas niveau. Un troisième type, les connexions
latérales, lie des aires corticales de niveau similaire (Bullier, 2001). Les motifs de
connectivité asymétrique entre des aires réciproquement connectés permettent de
déterminer la position des aires corticales dans la hiérarchie.

7
La distribution laminaire des connexions corticocorticales
Les neurones d'origine des connexions corticocorticales auraient une distribution
laminaire différente dans les six couches du cortex (voir Figure 3) (Felleman & Van
Essen, 1991). Les connexions feedforward proviennent des neurones situés dans les
couches supragranulaires deux et trois, au-dessus de la couche quatre, la couche
granulaire. Les connexions feedback proviennent des neurones situés dans les couches
infragranulaires cinq et six, en dessous de la couche quatre. Les connexions latérales
proviennent également des couches infragranulaires et supragranulaires. Ces connexions
latérales forment entre autres des connexions locales intracorticales (Bullier, 2001). Ceci
prend en considération l'aspect structurel des connexions corticocorticales, mais ces
connexions peuvent aussi être décrites selon leur aspect fonctionnel avec comme critères
le métabolisme cellulaire, la mesure des potentiels d'action, les changements de
potentiel électrique et des techniques de lésion ou de désactivation (Reid, 2009).
FEEDBACK LATÉRALE FEEDFORWARD
~ ~ ~
SUPRAGRANULAIRE 1-11-111 ~
• • ... ... ....... . .... .......
...... '/i:. ... Jt6..I.. .1;;. •
GRANULAIRE IV ... ~ N .... ... ...
INFRAGRANULAIRE V-VI ........ ...... • ... .... ...
• ... -1 < o <1
Figure 3. Connexionsfeedforward,feedback et latérale d'après la distribution laminaire des neurones (Inspiré de Vezoli et al. 2004).

8
Le connectome et la connectomique
L'analyse des connexions corticocorticales a été réalisée au-delà du cortex visuel du
primate sous forme de connectome. Un connectome est un plan complet des connexions
neuronales dans un cerveau. La production et l'étude des connectomes sont connue sous
le nom de connectomique. Le Human Connectome Project a construit le connectome
d'un cerveau humain à l'échelle macroscopique.
Les différentes échelles de connectome
Les réseaux de connexions du cerveau peuvent être déflnis à différentes échelles
comme l'échelle macroscopique, l'échelle mésoscopique ou l'échelle microscopique.
L'échelle macroscopique décrit l'organisation générale des réseaux de connexions. Le
Human Connectome Project est un exemple de connectome à l'échelle macroscopique et
l'imagep.e par résonance magnétique de diffusion est un exemple de technique employé.
L'échelle mésoscopique décrit la structure des connexions d'une aire à l'autre dans
l'ensemble du cerveau. Le Mouse Brain Connectome Project et le Allen Mouse Brain
Connectivity Atlas sont des exemples de connectome à l'échelle mésoscopique et
l'injection de traceurs antérogrades et rétrogrades est un exemple de technique employé.
L'échelle microscopique décrit le détail des synapses, c'est-à-dire comment les axones
et les dendrites se connectent. La microscopie électronique est un exemple de technique
employé. Cette thèse porte sur les connexions des cortex sensoriels primaires pour le
traitement contextuel et multisensoriel de l'information, ce que l'on a étudié à l'échelle
mésoscopique avec l'injection de traceurs.

9
Le modèle de recherche animal
La souris est le modèle animal employé dans cette thèse étant donné que les études
effectuées chez l'humain sont restreintes à des techniques peu invasives. Il est donc
nécessaire d'utiliser un modèle animal, chez qui des méthodes plus invasives comme les
injections de traceurs peuvent être employées. La souris C57Bl/6 est la souche de souris
la plus utilisée et la plus vendue en recherche, en raison de son élevage facile et de sa
robustesse. Le cerveau des rongeurs possède moins d'aires corticales que celui des
primates, mais les deux espèces ont les mêmes systèmes sensoriels avec les mêmes
relais pour traiter l'information provenant des récepteurs spécialisés (Huberman & Niell,
2011). Même si le néocortex des rongeurs est plus petit que celui des primates, on
associe les différentes aires corticales aux mêmes endroits. Contrairement à l'humain où
les aires associatives occupent une grande place, la majorité du cortex des rongeurs est
constituée d'aires sensorielles et motrices primaires (voir Figure 4).
Visuel
Visuel
7 Bulbe olfactif
Auditif
Homme Rat
Figure 4. Vue latérale du cortex cérébral chez l'humain et le rat. Les aires visuelles (rouge), somatosensorielles (vert) et auditives (bleu) sont conservées entre les espèces et ont une topographie semblable (Bear et al., 2007).

10
Comparaison entre humain et rongeur
La proportion que représentent les différentes parties du corps au niveau cortical est
illustrée par l'homoncule pour l'humain et par le souricule pour la souris (voir Figure 5)
(Blumenfeld, 2010; Zembrzycki, Chou, Ashery-Padan, Stoykova, & O'Leary, 2013).
Chez la souris, les vibrisses du museau, utilisées pour l' exploration de l' environnement
sont surreprésentées dans le cortex somatosensoriel. Chez l'humain, c' est la
représentation des mains qui est aussi surreprésentée que les vibrisses du museau.
Figure 5. Parallèles entre humains et rongeurs. Homoncule et souricule (Bear et al. , 2007; Zembrzycki et al. , 2013).
Chez la souris, on retrouve une région du cortex somatosensoriel primaire dédiée à
. la représentation corticale des différentes parties du corps, le champ de tonneaux, qui est
composé de plusieurs sous-régions associées à ces différentes parties. La partie
postéromédiale du champ de tonneaux contient les corrélats corticaux des vibrisses du

11
museau. Chez ces animaux, les vibrisses du museau sont utilisées pour l'exploration de
l'environnement et leur représentation corticale est très développée. On retrouve en effet
au niveau du cortex somatosensoriel primaire une représentation exacte de la disposition
des vibrisses sur le museau de l' animal (Woolsey & Van der Loos, 1970). La souris est
un rongeur nocturne et elle dépend grandement de ses vibrisses pour la localisation des
objets et pour la discrimination des textures (Kleinfeld, Ahissar, & Diamond, 2006).
Chez cet animal, la voie trigéminale est donc très importante. Chez l'humain, la
représentation des mains occupe une grande surface du cortex somatosensoriel et est
aussi surreprésentée que les vibrisses du museau dans le cortex (Blumenfeld, 2010;
Zembrzycki et al., 2013).
En plus de recevoir des informations des sources mentionnées précédemment, les
cortex sensoriels primaires chez les rongeurs reçoivent également des informations des
autres cortex sensoriels primaires par des connexions corticocorticales directes.
Le connectome du cerveau de souris
On s'est intéressé au cortex somatosensoriel primaire (SI) de la souris qui est l'aire
qui occupe la plus grande superficie. Les projets de grande envergure comme le Mouse
Brain Connectome Project et le Allen Mouse Brain Connectivity Atlas ont également
cartographié le connectome des connexions du cortex de la souris. Ces proj ets de
connectomes présentent des quantités impressionnantes de données à l'échelle

12
macroscopique, mais ne fournissent pas de données sur la structure des conneXions
corticales et ne prennent pas en considération les connexions sous-corticales.
Les modules somatosensoriels de la souris
Une étude précédente a démontré sur la base des données disponibles dans le Mouse
Brain Connectome Project, que SI chez la souris possède quatre modules de
connectivités différentes : le module orofaciopharyngé, les membres supérieurs, les
membres inférieurs, le tronc, et les vibrisses du museau (voir Figure 6) (Zingg et al. ,
2014). Les parties plus caudales de SI comme les vibrisses du museau sont les seules à
posséder des connexions avec des aires visuelles et auditives comparativement aux
parties plus rostrales. Cette évaluation démontre que les sous-régions de SI associées à
différentes parties du corps n'ont pas toutes les mêmes connexions.
U""., 1mb subMlworl<
Figure 6. Les quatre modules de connectivités somatosensoriels de la souris tel que démontré sur la base des données disponibles dans le Mouse Brain Connectome Project (Zingg et al. , 2014).
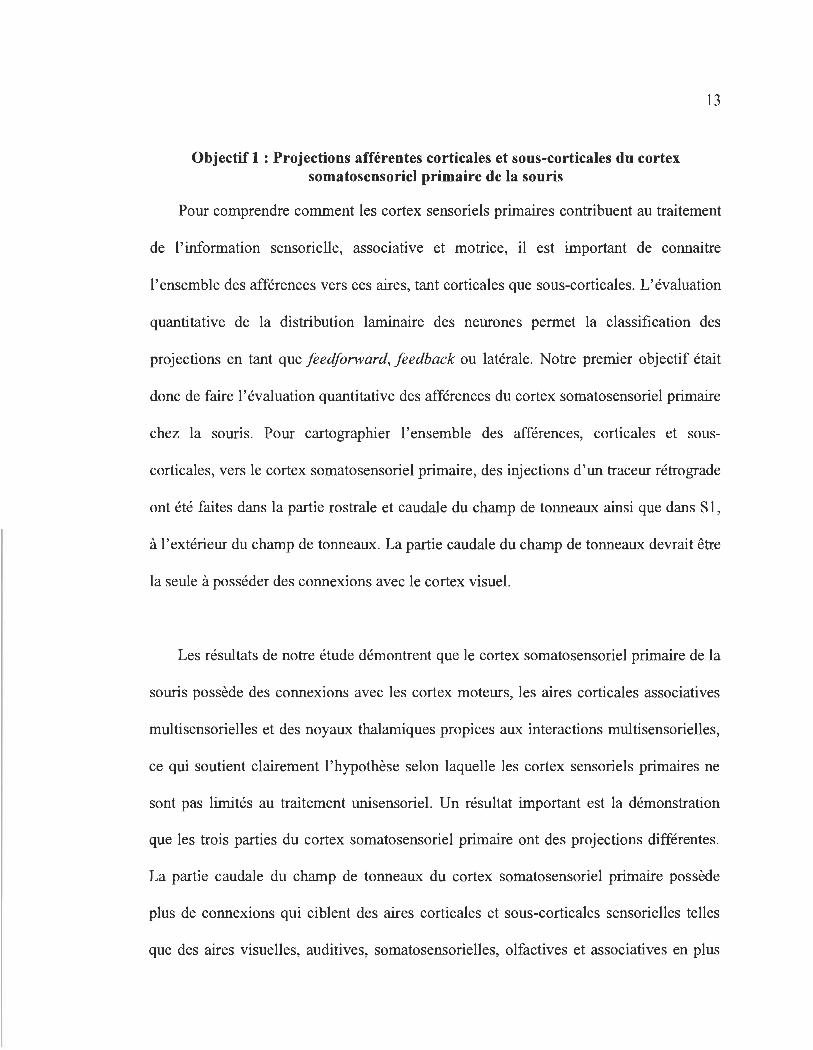
Objectif 1 : Projections afférentes corticales et sous-corticales du cortex somatosensoriel primaire de la souris
13
Pour comprendre comment les cortex sensoriels primaires contribuent au traitement
de l'information sensorielle, associative et motrice, il est important de connaitre
l' ensemble des afférences vers ces aires, tant corticales que sous-corticales. L' évaluation
quantitative de la distribution laminaire des neurones permet la classification des
projections en tant que feedforward, feedback ou latérale. Notre premier objectif était
donc de faire l' évaluation quantitative des afférences du cortex somatosensoriel primaire
chez la souris. Pour cartographier l' ensemble des afférences, corticales et sous-
corticales, vers le cortex somatosensoriel primaire, des injections d'un traceur rétrograde
ont été faites dans la partie rostrale et caudale du champ de tonneaux ainsi que dans SI ,
à l' extérieur du champ de tonneaux. La partie caudale du champ de tonneaux devrait être
la seule à posséder des connexions avec le cortex visuel.
Les résultats de notre étude démontrent que le cortex somatosensoriel primaire de la
souris possède des connexions avec les cortex moteurs, les aires corticales associatives
multisensorielles et des noyaux thalamiques propices aux interactions multisensorielles,
ce qui soutient clairement l'hypothèse selon laquelle les cortex sensoriels primaires ne
sont pas limités au traitement unisensoriel. Un résultat important est la démonstration
que les trois parties du cortex somatosensoriel primaire ont des projections différentes.
La partie caudale du champ de tonneaux du cortex somatosensoriel primaire possède
plus de connexions qui ciblent des aires corticales et sous-corticales sensorielles telles
que des aires visuelles, auditives, somatosensorielles, olfactives et associatives en plus

14
des connexions qui ciblent des aires motrices comparativement à la partie rostrale du
champ de tonneaux et à la partie de SI , à l'extérieur du champ de tonneaux dont les
connexions ciblent davantage des aires somatosensorielles et motrices. La partie caudale
du champ de tonneaux est la seule partie de SI à recevoir des projections de VI.
L'évaluation quantitative de la distribution laminaire des neurones nous a permis de
classifier les projections en tant que feedforward, feedback ou latérale. Les connexions
feedforward servent au transfert de l' information à traiter vers une aire de plus haut
niveau, les connexions feedback ont comme fonction le transfert de l' information vers
une aire de plus bas niveau, et les connexions latérales permettent de lier des neurones
d'aires corticales de niveau similaire (Bullier, 2001; Felleman & Van Essen, 1991). Les
projections vers le cortex somatosensoriel primaire seraient en majorité de nature
feedback. Dans le cas des cortex sensoriels primaires, les projections auditives seraient
de naturefeedback alors que les projections visuelles vers la partie caudale du champ de
tonneaux seraient de nature latérale, ce qui démontre que les différents cortex sensoriels
primaires n'occupent pas la même position dans la hiérarchie corticale.
L'espace péripersonnel
Comme on l'a vu dans la section précédente, le champ de tonneaux se démarque du
reste du cortex somatosensoriel primaire en ayant plus de connexions qui ciblent des
aires corticales et sous-corticales sensorielles telles que des aires visuelles, auditives,
olfactives et associatives. De manière plus spécifique, la partie caudale du champ de

15
tonneaux est la seule partie du cortex somatosensoriel pnmarre à recevoir des
projections du cortex visuel primaire. Cette connexion entre le cortex visuel et le champ
de tonneaux pourrait être le substrat anatomique de l' influence de la vision sur les
sensations tactiles et la navigation par les vibrisses chez la souris.
L'interaction des vibrisses avec la vision serait importante dans la représentation de
l' espace péripersonnel, soit l' espace à la portée des membres d'un individu, plus
particulièrement la tête et les bras dans le cas des humains (Rizzolatti, Scandolara,
Matelli, & Gentilucci, 1981 a, 1981 b), d'une part dans la spécification de la position
d'une cible et d'autre part dans la transformation de cette position en une commande
motrice appropriée pour l'atteindre. Pour que le cortex cérébral soit en mesure d'encoder
l'espace péripersonnel, les informations provenant de la modalité visuelle et tactile
doivent converger ensemble (Allman, Keniston, & Meredith, 2009; Hom & Hill, 1966).
Comparaison entre humain et rongeur
Comme on l'a vu précédemment avec l' illustration de l'homoncule et du souricule,
la représentation des mains chez l'humain (Blumenfeld, 2010) et des vibrisses chez la
souris (Zembrzycki et al. , 2013) possèdent un facteur de grossissement similaire dans le
cortex. De manière similaire, l'espace péripersonnel serait centré sur les mains chez
l'humain (Rizzolatti et al. , 1981a, 1981b) tandis que chez les rongeurs, cet espace serait
centré sur les vibrisses (Cardinali, Brozzoli, & Fame, 2009) (voir Figure 7). L' espace
péripersonne1 revêt une importance particulière pour la vie des humains autant que chez

16
les autres animaux. Lorsque les objets entrent dans l'espace péripersonnel, ils peuvent
être liés à la saisie et la manipulation (Rizzolatti, Fadiga, Fogassi, & Gallese, 1997) ou
être une menace, évoquant par exemple une réaction d' évitement (Graziano, Cooke, &
Taylor, 2000).
L:espace péripersonnel centré sur la tète et lil main
l:esp ce péri personnel centré sur les vibrisses
Schéma corporel
L'espace pérlpersonnel à portée de bras
Figure 7. Parallèles entre humains et rongeurs. Espace péripersonnel (Cardinali et al. , 2009; Rizzolatti et al., 1981a, 1981b).
Les interactions multisensorielles
La nature multisensorielle d'une aire est défInie sur la base de (1) la convergence de
projections à partir d'aires corticales de différentes modalités sensorielles (Jones &
Powell, 1970) et (2) la présence des neurones qui peuvent répondre à des stimuli qui
proviennent de plus d'une modalité sensorielle mentionnée dans la section précédente
(Bruce, Desimone, & Gross, 1981). Nos résultats démontrent que des projections d'aires

17
corticales visuelles et auditives convergent sur SI et bien que nous ne pouvons pas
démontrer avec certitude la présence de ces neurones multisensoriels dans ce cortex sur
la base de nos résultats anatomiques, l' existence de ces neurones a été démontrée à
l' intérieur des cortex sensoriels primaires chez le rat (Wallace, Ramachandran, & Stein,
2004) et le furet (Bizley & King, 2008; Bizley, Nodal, Bajo, Nelken, & King, 2007).
L' interaction entre les modalités sensorielles facilite la localisation et
l' identification (Stein, Huneycutt, & Meredith, 1988; Stein, Meredith, Huneycutt, &
McDade, 1989), la détection (Frassinetti, Bolognini, & Ladavas, 2002; Lovelace, Stein,
& Wallace, 2003) et le temps de réaction aux stimuli externes (Amlot, Walker, Driver,
& Spence, 2003 ; Calvert & Thesen, 2004; Corneil, Van, Munoz, & Van Opstal, 2002;
Diederich, Colonius, Bockhorst, & Tabeling, 2003; Forster, Cavina-Pratesi, Aglioti, &
Berlucchi, 2002; Frens, Van Opstal, & Van der Willigen, 1995; Harrington & Peck,
1998; Hughes, Reuter-Lorenz, Nozawa, & Fendrich, 1994; Molholm et al. , 2002).
Les interactions visuotactiles
Notre deuxième étude porte sur les connexions entre VI et SI, et il est donc
pertinent de connaitre les aspects comportementaux liés aux influences réciproques entre
la vision et le toucher. Une étude chez l'humain a démontré que la vision peut améliorer
l'acuité tactile (Kennett, Taylor-Clarke, & Haggard, 2001). Une autre a démontré que la
vision peut diminuer la perception de la douleur (Longo, Schuur, Kammers, Tsakiris, &
Haggard, 2008). Des connexions corticocorticales directes entre le champ de tonneaux et

18
VI comme celles que nous avons observées seraient avantageuses pour ces interactions
visuotactiles (Giard & Peronnet, 1999). Une étude plus poussée de la structure de ces
connexions permettrait de mieux comprendre comment ces deux modalités s'influencent
au niveau des cortex sensoriels primaires. L' étude de la morphologie des axones et de
leurs terminaux permettrait d' en apprendre davantage sur la fonction de ces connexions
et les propriétés fonctionnelles de leurs modes de transmission glutamatergiques.
Les modes de transmission glutamatergique
Les VOles glutamatergiques comportent deux modes de transmission
glutamatergique, les réponses postsynaptiques inductrices de Classe 1 et les réponses
postsynaptiques modulatrices de Classe 2 (Petrof & Sherman, 2013). Le Tableau 1 et la
Figure 8 résument les caractéristiques anatomiques et synaptiques qui différencient les
réponses de Classe 1 et de Classe 2.

Tableau 1
Résumé des caractéristiques anatomiques et synaptiques
Caractéristiques anatomiques
Caractéristiques synaptiques
iGluR
mGluR
Classe 1 - Inducteur
Gros boutons terminaux
Contacte des dendrites proximales
Axones avec un gros diamètre
Moins de convergence
PPSE de grande amplitude
Dépression lors d'un test paired-pulse
Active les récepteurs glutamatergiques ionotropiques seulement
Inducteur
Figure 8. Les boutons terminaux inducteurs et modulateurs.
Classe 2 - Modulateur
Petits boutons terminaux
Contacte des dendrites distales
Axones avec un petit diamètre
Plus de convergence
PPSE de petite amplitude
Facilitation lors d'un test paired-pulse
Active les' récepteurs glutamatergiques ionotropiques et métabotropiques
Modulateur
19

20
Les réponses postsynaptiques de Classe 1
Les différences dans les propriétés synaptiques des deux types de réponses
postsynaptiques ont été examinées principalement in vitro, où l'activation de diverses
voies glutamatergiques a produit des effets postsynaptiques radicalement différents. Par
exemple, une stimulation électrique de plus de 10Hz des voies glutamatergiques de
Classe 1 a produit des potentiels postsynaptiques excitateurs initiaux de plus forte
amplitude (PPSE), une dépression lors d'un test paired-pulse et une activation liée
exclusivement aux récepteurs glutamatergiques ionotropiques (iGluR). Des exemples
typiques de réponses postsynaptiques de Classe 1 sont trouvés dans les voies qui
véhiculent l'information sensorielle des organes sensoriels de la périphérie vers le
thalamus, voies désignées collectivement comme lemniscales, telles que la voie
lemniscale médiale vers le noyau ventral postérieur médial et latéral (VPM et VPL)
(Castro-Alamancos, 2002), la voie visuelle vers le corps géniculé latéral dorsal (CGLd)
(Reichova & Sherman, 2004) et la voie auditive vers le corps géniculé médian ventral
(CGMv) (Bartlett & Smith, 2002; Lee & Sherman, 2010). De manière similaire, les
réponses postsynaptiques des voies corticothalarniques feedforward originaires de la
couche 5 sont semblables à celle des réponses postsynaptiques de Classe 1 des voies
lemniscales vers le thalamus (Li, Guido, & Bickford, 2003; Reichova & Sherman,
2004). Des réponses de Classe 1 ont également été identifiées à l'extérieur du thalamus,
comme dans certaines voies thalamocorticales (Li, Guido et al., 2003; Reichova &
Sherman, 2004; Viaene, Petrof, & Sherman, 2011a, 2011b), certaines voies

21
corticorticales (Covic & Sherman, 2011; De Pasquale & Sherman, 2011), et quelques
voies corticales locales (De Pasquale & Sherman, 2012).
Les réponses postsynaptiques de Classe 2
Les propriétés synaptiques des Classe 2 diffèrent substantiellement de celles des
Classe 1. Par exemple, une stimulation électrique des projections locales de la couche 6
vers la couche 4 dans le cortex auditif et somatosensoriel primaire a produit des PP SE
faibles et une facilitation lors d'un test paired-pulse (Lee & Sherman, 2008; Lee &
Sherman, 2009a). Des effets similaires ont été mis en évidence dans des projections
corticothalarniques originaires des cellules de la couche 6 (Bartlett & Smith, 2002; Li,
Guido et al., 2003), des afférences thalamocorticales (Viaene, Petrof, & Sherman,
2011a, 2011c), et des voies corticocorticales (Covic & Sherman, 2011 ; De Pasquale &
Sherman, 20 Il), ainsi que dans certaines voies corticales locales (De Pasquale &
Sherman, 2012; Lee & Sherman, 2008; Lee & Sherman, 2009a). Ces réponses de Classe
2 sont capables d' activer les récepteurs métabotropiques (mGluR) (Covic & Sherman,
2011 ; De Pasquale & Sherman, 2011 ; Lee & Sherman, 2008, 2009b; Reichova &
Sherman, 2004; Viaene et al., 2011a, 2011c). Pour terminer, les voies contenant des
réponses de Classe 2 sont constituées d'axones avec une plus grande tendance à
converger sur des cellules individuelles par rapport à leurs homologues de la Classe 1
qui produisent des réponses postsynaptiques qui sont largement insensibles aux
augmentations d' intensité des stimulations indiquant peu ou pas de convergence des
axones.

22
Les corrélations anatomiques des réponses postsynaptiques
En plus des différences dans leurs propriétés synaptiques, les réponses de Classe 1
et de Classe 2 sont associées à des corrélations anatomiques différentes. Par exemple, les
réponses de Classe 1 dans les voies vers le thalamus sont caractérisées par des axones de
gros diamètre, qui se terminent en arborisation dense qui contient beaucoup de gros
boutons terminaux. Des exemples établis d'afférences contenant des réponses de
Classe 1, pour lesquels des données sur la taille de leurs boutons terminaux sont
disponibles, comprennent les afférences de la rétine vers le CGLd (Colonnier &
Guillery, 1964; Guillery, 1969; Hajdu, Hassler, & Somogyi, 1982; Li, Wang, &
Bickford, 2003; Peters & Palay, 1966; So, Campbell, & Lieberman, 1985; Szentagothai,
1963; Van Hom, Erisir, & Sherman, 2000), les voies lemniscales vers VPM et VPL
(Ralston, III, 1969), les afférences du collicule inférieur vers le CGMv (Bartlett et al.,
2000; Morest, 1975), et les voies corticothalamiques originaires de la couche 5
(Bourassa, Pinault, & Deschenes, 1995; Feig & Harting, 1998; Hoogland, Wouterlood,
Welker, & Van der Loos, 1991; Li, Guido et al., 2003; Rouiller & Welker, 1991;
Rouiller & Welker, 2000; Vidnyanszky, Borostyankoi, Gorcs, & Hamori, 1996). Les
voies thalamiques avec des réponses de Classe 1 ont tendance à contacter les dendrites
proximales (Sherman & Guillery, 2006). De plus, les réponses de Classe 1 sont corrélées
aux gros boutons terminaux. Ces gros boutons terminaux ont été démontrés dans un
certain nombre de voies thalamocorticales vers les aires corticales auditives, visuelles et
somatosensorielles, en particulier sur celles qui se terminent dans la couche 4 du cortex
(Ahmed, Anderson, Douglas, Martin, & Nelson, 1994; Lee & Sherman, 2008; Viaene et

23
al., 2011a, 2011c), et quelques voies corticocorticales entre le cortex auditif primaire et
secondaire de la souris (Covic & Sherman, 2011).
Contrairement aux réponses de Classe 1 dans les voies vers le thalamus, celles de
Classe 2 provenant des afférences corticothalamiques de la couche 6 sont constituées
d'axones avec un petit diamètre qui comprennent des petits boutons terminaux (Bartlett
et al. , 2000; Hoogland et al., 1991; Ichida & Casagrande, 2002; Li, Guido et al., 2003).
Les voies thalamiques avec des réponses de Classe 2 ont tendance à contacter les
dendrites distales (Sherman & Guillery, 2006). De plus, les réponses de Classe 2 sont
corrélées aux petits boutons terminaux. Des exemples de petits boutons terminaux ont
été démontrés dans certaines voies corticocorticales (Covic & Sherman, 2011), et la
plupart des voies thalamocorticales vers les couches 2 et 3 du cortex somatosensoriel et
auditif primaire (Viaene et al. , 2011a, 2011a). La majeure partie des projections du
noyau postérieur (po) vers toutes les couches de SI comprennent des réponses de Classe
2 et sont corrélées à des petits terminaux. (Viaene et al. , 2011c).
Les implications fonctionnelles des réponses postsynaptiques
Les réponses postsynaptiques de Classe 1 produisent des grands PPSE et elles ne
ciblent que les récepteurs glutamatergiques ionotropiques. Ces caractéristiques
permettent aux réponses de Classe 1 d'exercer des effets importants sur leurs cibles
postsynaptiques et d'avoir une vitesse de transmission synaptique plus rapide. De plus,
la dépression lors d'un test paired-pulse est une propriété qui agit comme un mécanisme

24
de contrôle sur le traitement synaptique (Chung, Li, & Nelson, 2002), ce qui les rend
idéales et fiables pour le relais de l' information sensorielle. Pour ces raisons, les
réponses postsynaptiques de Classe 1 sont souvent désignées comme les influx
inducteurs, étant donné qu' elles sont les principaux déterminants dans l' activité d'une
cellule postsynaptique en vertu de la définition de son champ récepteur (Sherman &
Guillery, 2006).
D'un autre côté, les réponses postsynaptiques de Classe 2 ne possèdent pas les
caractéristiques synaptiques nécessaires pour permettre un relais efficace et fiable de
l'information sensorielle. Au lieu de cela, leurs effets postsynaptiques relativement
faibles, leur convergence extensive, et leur composante métabotropique lente et
prolongée sont mieux adaptés au rôle de modulateur. La réponse prolongée serait plutôt
utile pour le contrôle du voltage et de la conductance, et le temps de réaction de cette
réponse dépasse l' influx d'environ 100 millisecondes à plusieurs secondes, des
caractéristiques qui sont incohérentes avec un flux d' information efficace. Pour ces
raisons, les réponses postsynaptiques de Classe 2 sont souvent désignées comme les
influx modulateurs (Sherman & Guillery, 2006).
Un autre point qui mérite d'être mentionné est que même si les réponses
postsynaptiques de Classe 1 sont les principaux transporteurs d'information sensorielle
dans les circuits thalamiques et corticaux, les réponses postsynaptiques de Classe 2 sont
beaucoup plus nombreuses, celles de Classe 1 ne représentant que de 2 à 10 % du
25
nombre total de synapses dans le thalamus et le cortex, selon les estimations (Van Hom
& Sherman, 2004; Wang, Eisenback, & Bickford, 2002). Même si ces chiffres sous
estiment en quelque sorte le nombre total de réponses postsynaptiques de Classe 1, étant
donné qu'ils prennent surtout en compte les plus gros boutons, il est évident que les
effets synaptiques inducteurs plus importants des réponses postsynaptiques de Classe 1
ne sont pas dus à leur supériorité numérique par rapport aux réponses postsynaptiques de
Classe 2 (Van Hom et al., 2000).
Une question intéressante qui n'a pas été abordée est de savoir si un axone unique
peut posséder un large éventail de taille de boutons et par le fait même, différentes
propriétés synaptiques ou non (Reyes et al. , 1998). Dans les projections
corticothalamiques, les terminaux associés aux deux types de réponses se trouvent sur
deux types d'axones distincts (voir Figure 9). Les terminaux corrélés avec les réponses
postsynaptiques de Classe 1 sont sur des axones avec un diamètre plus important qui
proviennent des neurones pyramidaux de la couche 5 (Bourassa et al., 1995), alors que
les terminaux corrélés avec les réponses postsynaptiques de Classe 2 sont sur des axones
avec un diamètre moins important qui proviennent des neurones de la couche 6
(Bourassa et al., 1995).
Répondre à cette question pour les projections corticocorticales nous apporterait une
meilleure compréhension des mécanismes exacts derrière la fonction des réponses

26
postsynaptiques de Classe 1 et de Classe 2 dans une connexion entre deux aires de
modalités sensorielles différentes et au niveau des cortex sensoriels primaires.
Figure 9. Connexions corticothalamiques. Terminaisons modulatrices, possèdent des boutons terminaux plus petits (A). Terminaisons inductrices, possèdent des boutons terminaux plus grands (B) (Bourassa et al., 1995).
Objectif 2 : Les connexions corticocorticales directes et réciproques entre le cortex visuel et somatosensoriel primaire de la souris
Une étude plus poussée de la structure des connexions corticocorticales directes et
réciproques entre le champ de tonneaux de SI et VI permettrait de mieux comprendre
comment la modalité sensorielle somatosensorielle et la modalité sensorielle visuelle
s'influencent mutuellement au niveau des cortex sensoriels primaires. L'étude de la
morphologie des axones et de leurs terminaux permettrait aussi d'en apprendre
davantage sur leurs fonctions. Notre deuxième objectif était donc d'étudier la
microcircuiterie des connexions corticocorticales directes et réciproques entre les cortex
visuel et somatosensoriel primaires de la souris. La quantité et la distribution laminaire
des corps cellulaires rétrogradement marqués ont été étudiées dans les cortex visuel et

27
somatosensoriel primaires afin de déterminer le poids et la nature de ces projections.
Pour rétrogradement marquer les corps cellulaires, des injections d'un traceur
rétrograde, la sous-unité B de la toxine du choléra, ont été faites dans les cortex visuel et
somatosensoriel primaires. Mm d'obtenir une distribution de taille du diamètre des
axones et de leurs boutons terminaux antérogradement marqués dans chaque couche
corticale des projections entre VI et SI , un échantillonnage stéréologique de ces axones
et de leurs boutons terminaux a été réalisé pour chaque cas ayant reçu une injection en
colonne d'un traceur antérograde, le dextran-biotine aminé. Des axones uniques ont été
reconstruits dans les projections entre les cortex visuel et somatosensoriel primaires afm
de déterminer si un axone unique peut contenir un large éventail de taille de boutons
terminaux. Si l'on s' appuie sur les résultats de notre première étude, nous devrions
observer une asymétrie dans les connexions entre ces deux aires primaires.
Les résultats de notre deuxième étude démontrent que la connexion du champ de
tonneaux (SIBF) vers le cortex visuel primaire (VI) est de type feedback et a une
influence modulatrice prédominante alors que la projection réciproque est de type latéral
et a plutôt une influence inductrice. En effet, l'évaluation quantitative de la distribution
laminaire des neurones a permis de classifier les projections en tant que feedforward,
feedback ou latérale. Les résultats démontrent que la projection de SlBF vers VI est de
typefeedback alors que la projection réciproque de VI vers SlBF est de type latéral. De
plus, la plus grande incidence de gros axones et de gros boutons terminaux dans la
projection de VI vers SIBF suggère fortement que VI exerce une influence inductrice
28
sur SIBF alors que la plus grande incidence de petits axones et de petits boutons
terminaux dans la projection de SIBF vers VI suggère fortement que SIBF exerce une
influence modulatrice prédominante sur VI. Les axones reconstruits dans la projection
de SIBF vers VI n'avaient que de petits boutons terminaux tandis que les axones
reconstruits dans la projection de VI vers SIBF avaient parfois un large éventail de
taille de boutons terminaux. Cela pourrait suggérer qu'il y a deux types d'axones
distincts sur la base de la présence ou de l'absence de gros boutons terminaux. Ce
résultat est important, car il démontre que ces connexions entre deux cortex sensoriels
primaires, bien que réciproques, ne sont certainement pas symétriques.
La cécité et les connexions corticocorticales
La projection de SIBF vers VI est de type feedback (Charbonneau, Laramee,
Boucher, Bronchti, & Boire, 2012) et pourrait avoir une influence modulatrice
prédominante alors que la projection réciproque est de type latéral (Masse, Ross,
Bronchti, & Boire, 2016) et pourrait plutôt avoir une influence inductrice. Ceci, ajouté
aux résultats de la deuxième étude que nous venons de voir confIrme que la modalité
visuelle et la modalité somatosensorielle ne s' influencent pas de la même manière au
niveau des cortex sensoriels primaires. À la lumière de ce résultat, nous nous sommes
interrogés sur l' influence de l'expérience visuelle pendant la période de vie postnatale
sur le développement des connexions corticocorticales entre VI et SI. On sait que
l'activité provenant des récepteurs sensoriels peut considérablement influencer le
développement de la connectivité corticale (Katz & Shatz, 1996; Price et al. , 2006). La
29
plasticité intermodale implique des changements anatomiques importants dans le
néo cortex, mais les effets de la cécité sur les connexions corticocorticales entre les
cortex sensoriels primaires ne sont pas encore entièrement compris. Plusieurs études
portent sur les afférences du cortex visuel lors de la perte de vision, mais peu se sont
consacrées aux efférences du cortex visuel. L'étude de la structure des connexions entre
le cortex visuel primaire et le cortex somatosensoriel primaire chez des souris énucléées
à la naissance permettrait de mieux comprendre comment les connexions entre deux
cortex sensoriels primaires sont altérées par la perte d'un sens.
Les effets de la cécité sur les connexions corticales
À l'heure actuelle, on ne sait pas si les connexions corticocorticales entre les cortex
sensoriels primaires sont amplifiées ou diminuées dans les interactions multisensorielles.
Bien que certaines études fonctionnelles rapportent une connectivité corticale
intermodale entre les cortex sensoriels primaires améliorée chez les aveugles (Fujii,
Tanabe, Kochiyama, & Sadato, 2009; Klinge, Eippert, Roder, & Buchel, 2010), d' autres
rapportent plutôt une de diminution de la connectivité du cortex visuel avec les autres
cortex sensoriels primaires chez les sujets aveugles (Liu et al. , 2007; Yu et al. , 2008).
Cela pourrait dépendre de la modalité sensorielle, car comme il a été précédemment
démontré, le pourcentage de neurones marqués projetant du cortex auditif vers le cortex
visuel primaire n' était pas significativement différent entre des souris intactes et
énuclées à la naissance (Charbonneau et al., 2012), contrairement au pourcentage de
neurones projetant de SI vers VI qui diminue. De plus, une étude chez le rat a démontré

30
que l'absence d'expérience unisensorielle tactile suivant l'ablation des vibrisses durant
les cinq premiers jours suivants la naissance diminue significativement la quantité de
neurones projetant de VI vers SI (Sieben, Bieler, Roder, & Hanganu-Opatz, 2015).
Ainsi, l'absence de stimuli visuels pourrait entraîner une perte généralisée en empêchant
l'établissement d'un certain pourcentage de projections du cortex somatosensoriel vers
le cortex visuel. Alors que la maturation des mécanismes d' interactions multisensoriels
dans les neurones multisensoriels des collicules supérieurs semble véritablement
dépendre des expériences unisensorielles (Stein, Stanford, & Rowland, 2014), on ne sait
pas encore à quel point les réseaux de connexions corticocorticales entre les cortex
sensoriels primaires en dépendent.
Objectif3 : Effets de l'énucléation sur les connexions corticocorticales directes et réciproques entre le cortex visuel et somatosensoriel primaire de la souris
Notre troisième objectif était donc d'étudier, avec les méthodes utilisées lors de la 2e
étude, l' impact de la perte de la vision sur la microcircuiterie de ces connexions chez la
souris énucléée à la naissance. On s'attend à ce que l'absence d'activité visuelle diminue
la taille des boutons terminaux dans la projection de VI vers SI. Les résultats de notre
troisième étude démontrent que l'énucléation réduit le nombre de neurones afférents de
SI vers VI. L'énucléation réduit l'étendue de la taille des boutons terminaux et la taille
des axones dans le cortex somatosensoriel primaire observés suite aux injections de
dextran-biotine aminé dans le cortex visuel primaire. L'énucléation n' a pas d'effet sur la
taille des axones et des boutons terminaux dans le cortex visuel primaire observés suite
aux injections de dextran-biotine aminé dans SI. L' absence de gros boutons terminaux

31
dans la projection de VI vers SI chez les souris énucléées suggère que SI ne reçoit plus
les réponses postsynaptiques inductrices de Classe 1 de VI et que VI exerce alors une
influence modulatrice prédominante sur SI. Notre troisième étude démontre que la
cécité entraine des modifications anatomiques dans les connexions corticocorticales
intermodales entre les cortex sensoriels primaires.
Résumé des objectifs de recherche
Le premier objectif de cette thèse était de faire l'évaluation quantitative et la
cartographie de l'ensemble des afférences, corticales et sous-corticales, vers SI, à
l'extérieur du champ de tonneaux, ainsi que la partie rostrale et caudale du champ de
tonneaux, chez la souris. Le deuxième objectif de cette thèse était d'étudier la
microcircuiterie des connexions corticocorticales directes et réciproques entre le cortex
visuel primaire et le cortex somatosensoriel primaire chez la souris. Le troisième et
dernier objectif de cette thèse était d'étudier l'impact de la perte de la vision sur la
microcircuiterie des connexions entre le cortex visuel primaire et le cortex
somatosensoriel primaire à l'aide d'un échantillon de souris énucléées à la naissance.
Pour étudier les différences quantitatives dans le poids et la distribution laminaire des
neurones et des terminaux dans les projections entre VI et SI chez les souris intactes et
énucléées à la naissance, des injections de la sous-unité B de la toxine du choléra et de
dextran-biotine aminé ont été réalisé dans VI et SI de ces deux groupes de souris.

Méthode

Dans cette thèse, l'organisation de la microcircuiterie des connexions
corticocorticale entre les cortex visuel et somatosensoriel primaires sera étudiée dans
l'optique d'améliorer la compréhension des réseaux corticaux impliqués dans la
convergence multisensorielle. Il est donc nécessaire d'utiliser des modèles animaux,
chez qui des méthodes plus invasives peuvent être employées.
Souris C57BI/6 énucléée à la naissance
Énucléée à la naissance, la C57BV6 est un modèle de cécité permettant l'étude
comparée des aspects anatomique de la réorganisation sensorielle chez les rongeurs
aveugles. En effet, cette souris aura un développement normal des voies visuelles
pendant la période embryonnaire, et c'est à la naissance, lors de l'énucléation, qu'elles
seront coupées (Clancy, Darlington, & Finlay, 2001). Le thalamus visuel aura donc été
innervé pendant une courte durée par les afférences rétiniennes. En effet, les connexions
entre la rétine et le CGLd ont pu s'établir vers le 14ième jour embryonnaire (E14), mais
ont été détruites brusquement 6 jours plus tard. De plus, cette déafférentation survient
avant la mise en place déftnitive de la couche 4 et avant l'arrivée des ftbres
thalamocorticales. Cependant, les neuroblastes ont été influencés dans la sous-plaque
pendant environ 2 jours par l' activité spontanée présente dans les ftbres rétiniennes
atteignant le CGLd. Suite à l'énucléation, les nerfs optiques, le chiasma et les tractus
optiques régressent. Il y a alors mort et dégénérescence des voies rétiniennes.

34
Énucléation néonatale
Les énucléations bilatérales des souriceaux C57BV6 ont été effectuées dans les 24h
suivant la naissance sous anesthésie profonde par hypothermie. La fente palpébrale a été
ouverte avec un scalpel, le globe oculaire a été doucement retiré et le nerf optique a été
sectionné. Les orbites oculaires ont été remplies avec du Gelfoam (Upjohn, Kalamazoo,
MI, USA) et les nouveau-nés ont été réchauffés jusqu'à leur éveil complet avant d'être
remis dans leur cage.
Traçage neuronal
Puisque le traçage de connexions neuronales est central aux trois études effectuées
dans cette thèse, il est nécessaire d'aborder plus en profondeur ce sujet et de définir les
notions de transport antérograde et rétrograde, et de donner les particularités des deux
traceurs qui ont été choisis pour les expériences: la sous-unité B de la toxine du choléra
(CTh) et le dextran-biotine aminé (DBA).
Transports antérograde et rétrograde
Le neurone a besoin d'une quantité importante de protéines (neurotransmetteurs,
neuropeptides, protéines du cytosquelette, etc.) pour subvenir à ses besoins et assurer ses
fonctions. Puisque les ribosomes, structures impliquées dans leur biosynthèse, sont
presque absents du cytoplasme des axones et de la partie terminale synaptique, la
synthèse des protéines s'effectue principalement dans le corps cellulaire (Bear et al. ,
2007). Pour acheminer les protéines nouvellement synthétisées jusqu'à l' extrémité de

35
l'axone, le neurone utilise le transport axonal. Lorsque le transport de molécules dans un
axone s' effectue du corps cellulaire vers les terminaisons synaptiques, on parle de
transport antérograde (voir Figure 10). Par exemple, les neurotransmetteurs synthétisés
dans le corps cellulaire sont transportés antérogradement dans des vésicules et libérés
dans la fente synaptique par le neurone pré synaptique (Bear et al. , 2007). En plus du
transport antérograde, le transport rétrograde permet de faire remonter des molécules de
la partie terminale vers le corps cellulaire (voir F)gure 10). Ce transport est utilisé
lorsque la partie terminale du neurone envoie des signaux au corps cellulaire pour
l' informer des modifications dans les besoins métaboliques des terminaisons (Bear et al.,
2007). Dans d'autres cas, il peut être utilisé pour rapatrier diverses molécules vers le
corps cellulaires dans le but de les dégrader, les recycler ou les réparer (Guénard, 1996).
Réticulum endoplasmique rugueux
Mitochondrie
Transport antérograde
Terminaison Exocytose
axonale
Transport rétrograde
Recyclage membranaire
Figure 10. Transport axonal antérograde en rouge et transport axonal rétrograde en bleu. http://schwann.free.fr/neurobiologie_cellulaire03.html Université Montpellier.
36
Les éléments transportés, telles les protéines, sont stockés la plupart du temps dans
des vésicules synaptiques. Ce sont ces vésicules qui sont transportées le long de l'axone.
Le transport des vésicules est en partie assuré par des éléments du cytosquelette : les
microtubules, les neurofilaments et les microfilaments (Guénard, 1996). De plus, pour
chaque type de transport, une protéine spécifique sert de transporteur en se déplaçant le
long du cytosquelette par un processus dépendant de l'ATP et du calcium. Il s' agit de la
kinésine pour le transport antérograde et il s'agit de la dynéine pour le transport
rétrograde (Oztas, 2003).
Une grande majorité de traceurs neuronaux utilise le transport neuronal de l'axone
pour voyager. Lorsque le traceur a les caractéristiques nécessaires pour utiliser le
transport rétrograde, il est incorporé au niveau des terminaisons axonales et remonte vers
le corps cellulaire. Sur une coupe histologique, on pourra y remarquer le corps cellulaire
et parfois même les dendrites remplies de traceur. Puisque le traceur remonte le long de
l'axone pour revenir à la source des influx nerveux, il indique donc les afférences du site
d'injection, c.-à-d. ce qui projette vers le site d' injection. Contrairement au traceur
rétrograde, un traceur antérograde est incorporé au niveau du corps cellulaire ou de
l' axone et migre vers la partie terminale. Il indique donc, en marquant les axones, les
terminaisons axonales et parfois même les boutons synaptiques, les efférences du site
d' injection, c.-à-d. les cibles des neurones qui ont incorporés le traceur au site
d' injection. Le transport axonal rétrograde et antérograde n' a pas la même vitesse de
déplacement. Le transport rétrograde s'effectue à une vitesse de 100 à 200 mm/jour et le

37
transport antérograde à une vitesse allant de 0.1 à 400 mm/jour (Oztas, 2003). Ce dernier
est souvent classé selon 2 sous-types de transport, un lent (0.1 à 6 mm/jour) et un rapide
(200 à 400 mm/jour). Le transport lent serait utilisé par la cellule pour véhiculer des
éléments servant à la réparation graduelle et constante de sa structure et remplacer des
sous-unités du cytosquelette neuronal. Le transport rapide servirait plutôt à transporter
des vésicules synaptiques et des neurotransmetteurs (Oztas, 2003). Il serait aussi
responsable du transport des traceurs neuronaux. Néanmoins, la vitesse de déplacement
des traceurs neuronaux à l'intérieur des cellules dépend surtout de la composition
moléculaire du traceur et du mécanisme de capture du traceur par le neurone. Les
traceurs utilisés dans ces études seront discutés dans les prochaines sections.
Sous-unité B de la toxine du choléra. La sous-unité B de la toxine du choléra
(CTb) a été introduite comme traceur rétrograde durant l' année 1977 (Sawchenko &
Gerfen, 1985; Stoeckel, Schwab, & Thoenen, 1977). La toxine du choléra provient de la
bactérie Vibrio choléra et sa sous-unité B est non-toxique et est la molécule responsable
du transport du marqueur dans les neurones (Sawchenko & Gerfen, 1985). La CTb fait
partie de la même classe de traceur que les lectines à cause de sa capacité à se fixer aux
surfaces glycoconjuguées. En effet, la CTh se lie spécifiquement aux
monosialoganglioside (Sawchenko & Gerfen, 1985). La CTb est un traceur rétrograde
très sensible ( Luppi, Fort, & Jouvet, 1990; Luppi, Sakai, Salvert, Fort, & Jouvet, 1987).
C'est pour cette raison que nous l' avons choisi. C'est aussi un excellent traceur
antérograde. La CTb est incorporée activement dans les vésicules des axones lésés et

38
celles-ci seraient transportées le long du cytosquelette des axones et des dendrites
(Angelucci, Clasca, & Sur, 1996; Luppi et al. , 1990). Le traceur reste dans les vésicules
tout au long de son cheminement dans le neurone. Par la suite, les vésicules
s'accumulent dans le corps cellulaire ce qui lui confère une apparence granulaire, et
conséquemment, ne montre pas toute la morphologie du neurone (Kobbert et al., 2000).
Pour visualiser les axones et les boutons lors des injections dans le cortex visuel
primaire et le champ de tonneaux du cortex somatosensoriel primaire dans le deuxième
et le troisième article, nous avons préféré utiliser le DBA (Luppi et al., 1990).
Le temps de survie chez l' animal peut varier entre 1 à 10 jours (Vercelli, Repici,
Garbossa, & Grimaldi, 2000), mais étant donné que la sous-unité B de la toxine du
choléra voyage rapidement dans les axones (Luppi et al. , 1990) et que le cerveau de la
souris est petit, le temps de survie dans ces travaux se situait entre 2 et 3 jours. Au-delà
de ce temps, il y avait plus de chance que le traceur soit incorporé dans les fibres de
passages lésées (Vercelli et al. , 2000) ou qu'il voyage au-delà des synapses par le
passage transsynaptique. La sous-unité B de la toxine du choléra peut être injectée par
pression ou par iontophorèse (Luppi et al. , 1990). Lorsqu' injectée par pression, les
cellules au site d' injection sont souvent nécrosées, surtout si l' injection est massive, et
cela peut venir interférer avec le captage du traceur dans les axones lésés. Injectée par
iontophorèse, le site d' injection est généralement plus petit et la nécrose cellulaire est
faible (Luppi et al. , 1990) la sous-unité B de la toxine du choléra peut être révélée par
immunohistochimie.

39
Dextran-biotine aminé. Le dextran-biotine aminé (DBA) est un traceur neuronal
très utilisé depuis le début des années 1990. Sa structure moléculaire est constituée de
sucres couplés à une biotine. L' afflnité de la biotine pour l' avidine permet de révéler ce
traceur par une histochirnie du complexe avidine-biotine (système ABC). Il peut être
injecté par pression ou par iontophorèse étant donné la charge anionique qu' il porte
(Reiner et al. , 2000). Son poids moléculaire peut varier entre 3 000 et 20 000 D. Les
DBA de faible poids moléculaire (3kD) sont préférentiellement transportés
rétrogradement, alors que ceux du plus haut poids moléculaire (10kD) sont surtout
transportés antérogradement (Reiner et al., 2000). Les DBA sont facilement incorporés
dans les axones endommagés et moins bien par les terminaisons nerveuses (Jiang,
Johnson, & Burkhalter, 1993; Kobbert et al. , 2000). L' incorporation des DBA dans les
axones endommagés s'effectue par diffusion, alors que le transport du traceur par les
neurones intacts, ce qui est plus rare, s'effectuerait par endocytose (Reiner et al. , 2000).
Le temps de survie chez l' animal suite à l' injection peut varier entre 2 et 21 jours
dépendamment de la distance que le traceur doit parcourir pour marquer la cible
d'intérêt (Vercelli et al. , 2000). Dans ces travaux, le temps de survie chez la souris était
de 7 jours. Lorsque le temps de survie de l' animal est long, le risque de transport
transynaptique est très faible (Brandt & Apkarian, 1992).
Les DBA comportent plusieurs avantages. Ils sont parmi les meilleurs traceurs
neuronaux puisqu' ils marquent les [ms détails neuronaux (Brandt & Apkarian, 1992;
Kobbert et al. , 2000; Reiner et al., 2000). La méthode de détection est rapide et facile

40
d'exécution comparativement à bien d'autres traceurs (Brandt & Apkarian, 1992;
Veenman, Reiner, & Honig, 1992). La stabilité de sa structure moléculaire est propice à
l'observation et l'entreposage à long terme (Brandt & Apkarian, 1992). li est aisé,
lorsqu'injecté par iontophorèse, de restreindre la taille du site d'injection, ce qui permet
de faire des études topographiques (Reiner et al., 2000). Ce traceur est intéressant
puisqu'il offre un marquage homogène le long des axones et de leurs terminaisons
(Lanciego & Wouterlood, 2011). Toutes ces raisons en ont fait un traceur de choix dans
le cadre de deux des articles publiés.
Par contre, il existe quelques désavantages à l'utilisation des DBA. D'abord, il est
possible que les fibres de passage qui ont été endommagées durant l'injection soient
marquées (Brandt & Apkarian, 1992; Vercelli et al., 2000), ce qui pourrait fausser la
validité des résultats en marquant une plus grande proportion de cellules qui ne seraient
pas originaires du site d'injection. Puis, lors de l'utilisation du DBA 3kD, le traçage
rétrograde est capricieux, c.-à-d. qu'une partie seulement des corps neuronaux sont
marqués, ce qui ne facilite pas les études quantitatives (Vercelli et al., 2000). C'est
principalement pour cette raison que nous avons décidé d'utiliser un autre traceur pour le
marquage rétrograde, la sous-unité B de la toxine du choléra.

Chapitre 1 Cortical and subcortical afferent connections of the
primary somatosensory cortex of the mouse1
Le contenu de ce chapitre est présenté sous forme de manuscrit qui sera dans la revue Journal of Comparative Neurology: Massé, 1.0., Blanchet-Godbout, S., Bronchti, G. et Boire, D.

Title: Cortical and subcortical afferent connections of the primary somatosensory cortex
of the mouse.
Authors: Ian O. Massé, Sohen Blanchet-Godbout, Gilles Bronchti, Denis Boire
Mfiliations:
Département d'anatomie Université du Québec à Trois-Rivières Canada, G9A 2W7

43
Running title: Primary somatosensory cortex connections.
Abstract: Sensory information in conveyed from peripheral receptors through specific
thalamic relays to primary areas of the cerebral cortex. Information is then routed to
specialized areas for the treatment of specific aspects of the sensory signals and to
multisensory associative areas. Information processing in primary sensory cortices is
influenced by contextual information from top-down projections of multiple cortical
motor and associative areas as well as areas of other sensory modalities and higher order
thalamic nuclei. The primary sensory cortices are thus located at the interface of the
ascending and descending pathways. The theory of predictive coding implies that the
primary areas are the site of comparison between the sensory information expected as a
function of the context and the sensory information that cornes from the environment. In
order to betler understand the anatomical basis of this model of sensory systems we have
charted the cortical and subcortical afferent inputs in the ipsilateral and contralateral
hemispheres of the primary somatosensory cortex of adult C57Bl/6 mice. Iontophoretic
injections of the b-fragment of cholera toxin were performed inside the mystacial caudal
barrel field, more rostral barrel field and somatosensory cortex outside the barrel field to
test the hypothesis that differences exist between these three parts and to compare their
projections to the subnetworks built from the Mouse Connectome Project data. The
laminar distribution of retrogradely labeled cell bodies was used to classify the
projections as feedback, feedforward or lateral. Layer indices range between -1 and 1,
indicating feedback and feedforward connections respectively. The primary

44
somatosensory cortex and the barrel field have afferent connections with somatosensory
areas, non-somatosensory primary sensory areas, multisensory, motor, associative, and
neuromodulatory areas. The caudal part of the barrel field displays different and more
abundant cortical and subcortical connections compared to the rest of the primary
somatosensory cortex. Layer indices of cortical projections to the primary
somatosensory cortex and the barrel field were mainly negative and very similar for
ipsilateral and contralateral projections. These data demonstrate that the primary
somatosensory cortex receives sensory and non-sensory information from cortical and
subcortical sources.
Keywords: Cross-modal, corticocortical connections, subcortical connections,
feedforward, feedback, top-down, bottom-up.

45
Introduction
Sensory processing is based on countercurrent feedforward and feedback flow of
information and the processing in the primary sensory cortices involves an interaction
between these bottom-up thalamocortical and top-down direct corticocortical (Gilbert
and Li, 2013; Makino and Komiyama, 2015; Mumford, 1992; Rao and Ballard, 1999;
Zhang et al. , 2014) and indirect cortico-thalamo-cortical pathways (Roth et al. , 2016;
Sherman, 2005; Sherman and Guillery, 2002; Theyel et al., 2010).
Recent evidence considers cortical areas as adaptive processors. Instead of making
stereotypical processing of incoming sensory information, different analysis is
performed as a function of both sensory and behavioral context. This contextual
information can be provided to primary sensory cortices by varied top-down cortical
projections and also by higher order thalamic nuclei (Budinger et al., 2006; Budinger &
Scheich, 2009; Charbonneau et al., 2012; Miller & Vogt, 1984; Papema & Malach,
1991 ; Zingg et al. , 2014). It has been proposed that perception results from a
reverberation between feedforward and feedback information and that neurons in early
stages of sens ory processing are adaptive processors multiplexing between functions as
instructed by feedback projections from higher cortical areas (Gilbert and Li, 2013;
Gilbert and Sigman, 2007).
Top-down processing in the visual system has been studied in many aspects
showing the influence of cortical feedback onto the primary visual cortex and even back

46
to the thalamic lateral geniculate nucleus (Bullier, 2001a, 2001b; Lamme and
Roelfsema, 2000; Sillito et al., 2006). Top-down modulation by feedback projections to
early sensory processing is thought to achieve an integration of local and globallevels of
analysis (see Gilbert and Li, 2013; Teufel and Nanay, 2016 for review). Top-down
modulation is also provided by non-sensory sources such as attention, expectation and
stimulus context (Ito and Gilbert, 1999; Jiang et al., 2013; McManus et al., 2011;
Roelfsema et al., 1998; Surnmerfield and de Lange, 2014; Surnmerfield and Egner,
2009) and memory (Moore and Cavanagh, 1998).
Moreover, several studies suggest conscious perception might depend on top-down
inputs from higher order cortices to primary sensory cortices (Meyer, 20 Il). Indeed,
early activity in primary sensory cortices is stimulus-bound whereas later activity
thought to represent top-down incoming information from higher order cortical areas is
correlated with conscious perception (Gutschalk et al., 2008; Hudetz et al., 2009;
Meador et al., 2002; Super et al., 2001; see Meyer, 2011 for review).
Extensive inventories of cortical afferent have been drawn for the primary visual
(Charbonneau et al., 2012), auditory (Budinger et al., 2006, 2008; Budinger and Scheich,
2009) and somatosensory cortices (Zingg et al. , 2014) in rodents. Such extensive
inventories are not available for other widely studied mammals such as primates and
carnivores. In agreement with the wide range of processes that can modulate early
sensory processing, these studies have shown a host of top-down cortical projections to
47
primary sensory cortices that cornes from very diverse motor, association and also from
cortices devoted to other sensory modalities supporting the particular position of primary
cortices at the interface of ascending and descending pathways. Moreover, the larninar
distribution of the cortical neurons projecting to primary visual and auditory cortices
shows a wide range of structure, sorne projections arising almost exc1usive1y from
infragranular layers whereas other projections arise from all corticallayers (Budinger et
al., 2006, 2008; Budinger and Scheich, 2009; Charbonneau et al., 2012).
Ascending and descending cortical projections have different morphological and
functional features. Specifically, feedforward connections originate from neurons mainly
located in supragranular layers 1 to 3 and terminate in the granular layer, whereas
feedback connections originate mainly from neurons located in infragranular layers 5
and 6 and avoid the granular layer (F elleman and Van Essen, 1991; Rockland and
Pandya, 1979). Lateral connections originate equally from infragranular and
supragranular layers. A similar hierarchical organization of visual cortices based on
feedback and feedforward corticocortical connections has been suggested for the rat
(Coogan and Burkhalter, 1990, 1993; Sieben et al., 2013) and mou se (Berezovskii et al.,
2011; Dong et al., 2004; Godement et al., 1979; Yamashita et al., 2003). In rodents
however, feedforward projections terminate in aU corticallayers, not only in granular
layer 4 as in primates (Coogan and Burkhalter, 1990).

48
The somatosensory cortex of the mouse also has widespread cortical afferents
(Zingg et al., 2014) as those of the visual and auditory cortices. There is evidence for
four somatic sensorimotor subnetworks: orofaciopharyngeal, upper limb, lower limb and
trunk, and whisker subnetworks (Zingg et al., 2014). This evaluation demonstrates that
SI subregions associated with different parts of the body do not ail have the same
connections. Our study extends this knowledge in providing a quantitative evaluation of
afferent cortical and thalamic projections to the primary somatosensory cortex and a
laminar distribution of cortical neurons in order to compare the structure of these
numerous corticothalamic top-down connections. Moreover, these features were
compared between afferent connections to the mystacial caudal barrel field, more rostral
barrel field and somatosensory cortex outside the barrel field to see if the different
somatosensory subnetworks follow similar patterns of cortical connectivity.
Methods
Animais and experiment groups
AnimaIs were treated in accordance with the regulations of the Canadian Council
for the Protection of Animals and the study was approved by the Comité de bons soins
aux animaux de l'Université du Québec à Trois-Rivières. C57BV6 mice (n = 15)
(Charles River, Montreal, QC, Canada) from our colonies were used. AlI animals were
kept under a light/dark cycle of 14/10 hours and were adults (60 days) when sacrificed.

49
Tracing procedures
Surgical anesthesia was achieved and maintained with inhalation of 1.5-2.5%
isoflurane and vital signs were monitored throughout the procedures. The animals were
mounted on a stereotaxic apparatus. A scalp incision was made along the midline to
expose the skull. For injections in the primary somatosensory cortex (S 1), a small
craniotomy was performed 1.5 mm caudal to Bregma and 1.5 mm from the midline or,
for injections in the rostral and caudal parts of the barrel field of the primary
somatosensory cortex (SlBF), 0.9 mm caudal to Bregma and 2.9 mm from the midline,
and 1.5 mm caudal to Bregma and 2.9 mm from the midline respectively. The dura was
incised and a glass micropipette (20 /lm tip diameter) filled with 1 % solution of the
b-fragment of cholera toxin (CTh) (Lists Biological Laboratories, CA) in phosphate
buffered saline (PBS) was inserted into the cortex into SI of 5 animals and SlBF of
10 animaIs. A 1.5 /lA positive CUITent with a 7 -s duty cycle was applied for 10 min at
depths ranging between 100 and 500 /lm from the pial surface. Starting at a depth of
500 /lm and ending at 100 /lm from the pial surface, 2 min at each 100 /lm. The mice
were kept warm until they recovered from anesthesia. Postoperative pain was managed
with buprenorphine (Temgesic, Schering-Plough, Hertfordshire, UK; i.p.; 0.009 mg/kg)
injected at the beginning of the procedure.
Perfusion
After a 2-day survival, mice received an intraperitoneal injection of 120 mg/kg
sodium pentobarbital (Euthanyl; Bimeda-MTC, Cambridge, ON, Canada) and were

50
perfused through the heart with 0.1 m 0.9% PBS (pH 7.4) followed by phosphate
buffered 4% paraformaldehyde. Brains were harvested, postfixed for 1-2 hours,
cryoprotected with 30% sucrose and frozen prior to sectioning for CTb
immunohistochemistry processing.
Staining procedures
SeriaI 50-llm-thick coronal sections were taken using a freezing microtome. One
series was processed for CTh immunohistochemistry and the other series was mounted
on sI ides and stained with cresyl violet to identify the cortical areas of interest and to
differentiate the corticallayers. To visualize CTb labeled neurons, free-floating sections
were treated for 45 min with 0.15% H202 and 70% methanol to quench endogenous
peroxidase, and thoroughly rinsed in 0.05 M Tris-HCI-buffered 0.9% saline solution
(TBS, pH 8.0) containing 0.5% Triton X-100 (TBS-Tx). Sections were then incubated in
2% normal donkey serum (NDS) for 2 hours and transferred to a solution of primary
antibody (goat polyc1onal anti-CTb 1:4 000; Molecular Probes) with 1% NDS in PBS
Tx for 2 days at 4°C. Subsequently, sections were rinsed in PBS-Tx and incubated in a
secondary antibody (biotinylated donkey anti-goat; 1 :500; Molecular Probes) solution
with 1 % NDS in PBS-Tx for 2 hours at room temperature. Following further rinsing, the
sections were then incubated for 90 min in an avidin-biotin complex solution (Elite
Vectastain, Vector Laboratories, PK4000 Standard kit) in TBS-Tx, pH 8.0, rinsed in
TBS, and then incubated in a 0.015% '3-diaminobenzidine (DBA) solution. Labeled
neurons were revealed by the addition of 0.005% H202. Sections were washed and

51
mounted on gelatin-subbed slides, air-dried, dehydrated and cover-slipped with
Permount mounting media (Fisher Scientific, Ottawa, ON, Canada).
Data analysis
AlI retrogradely labeled neurons found on one of every two sections immunostained
for CTb labeling, distributed throughout the who le rostro-caudal extent of the brain,
were plotted using an Olympus BX51WI microscope (20 x 0.75 NA objective) equipped
with a three-axis computer-controlled stepping motor system (0.05 /-lm resolution)
coupled to a personal computer and to a color Optronix CCD camera and driven by the
Neurolucida software (MBF Biosciences, Williston, VT, USA). In this way, the whole
cortex was systematically and randomly sampled on sections 200 /-lm apart. Cortical and
subcortical areas were delineated at lower magnification (4 x 0.16 NA objective) on
adjacent Nissl-stained sections. Borders between cortical and subcortical areas were
delineated according to the cytoarchitectonic descriptions provided by Caviness (1975)
and the mouse brain atlas of Franklin and Paxinos (2008). Contours of each cortical and
subcortical area in which retrogradely labeled cells were located were traced with
Neurolucida and the limits of each cortical layer were traced. These contours were
superimposed on the images of CTb-reacted sections and resized for shrinkage
differences between the Nissl and CTb sections. This allowed plotted neurons in each
cortical area to be assigned to supragranular, granular or infragranular layers for the
calculation of layer indices. These indices provide a quantitative assessment of the
laminar distribution of retrogradely labeled neurons and are instrumental in the

52
classification of corticocortical feedback, feedforward and lateral connections (Felleman
and Van Essen, 1991). Layer indices (L) were calculated using the formula where S and
1 are the numbers of labeled neurons in supragranular and infragranular layers
respectively (Budinger et al. , 2006, 2008; Budinger and Schei , 2009):
L = (S - 1) / (S + 1)
The indices range between -1 and 1. Negative values indicate feedback connections
mostly originating in infragranular layers and positive values indicate feedforward
connections mostly originating in supragranular layers. Values near zero indicate lateral
connections. The relationship between the abundance of labeled neurons in the
ipsilateral cortex and the distance for all three injection sites was evaluated by measuring
the shortest physical distance between the center of the injection sites and each labeled
neuron in each area with Neurolucida.
AlI photomicrographs were cropped and lurninosity and contrast were adjusted with
Adobe Photoshop software. Localization of injections sites was illustrated from sections
charts extracted from Neurolucida Explorer software (MBF Biosciences).
Data comparison to the Mouse Connectome Project
The afferent cortical and subcortical projections to SI from our animaIs were
compared to those reported for SI injection cases made public on the website of the
corticocortical connectivity atlas of Mouse Connectome Project (MCP,

53
www.MouseConnectome.org) through an interactive visualization tool, the
iConnectome. In these cases, double co-injections of tracers were made into the barrel
field and the lower and upper limb region of SI of 8 week old male C57BV6 mice
(n = 10). Retrograde labeling was achieved through injections of either CTb or
Fluorogold. AIl retrogradely labeled neurons were noted to obtain a qualitative
assessment of their presence.
Antibody characterization
The Anti-Cholera B Subunit antibody (product # 703, Lists Biological Laboratories)
was raised in goat using Cholera B Subunit (Product #104) as the immunogen. The
antibody was tested in an immuno-diffusion assay. A 1:4 dilution of the Anti-Cholera B
Subunit sera formed an immunoprecipitation during interaction with a 0.5mg/ml solution
of Cholera B Subunit (Product #104). The sera showed no reaction in a similar assay
against diphtheria toxin (product #150) or Pertussis Toxin (product #180).
Statistical analysis
Statistical analyses were performed using SPSS v 16.0 software (SPSS, Chicago, IL,
USA). To test for significance of the differences in the relative abundance of labeled
neurons, and the layer indices in each cortical area between injection sites, Kruskal
Wallis and Tukey HSD tests were performed with a significance level of p < 0.05.

54
Results
eTb labeling
Representative CTh injection sites in the somatosensory cortex are illustrated in
Figure lIA (SI), in the rostral part of the somatosensory barrel field in Figure lIB
(SIBF) and in the caudal part of the somatosensory barrel field in Figure lIC (SIBF).
None of the injections involved the underlying white matter. Cases were considered
valid only if injections in SI retrogradely labeled neurons in the ventral posterior lateral
thalarnic nucleus (VPL) (see Figure IID) and if injections in the rostral and caudal parts
of SIBF, retrogradely labeled neurons in the ventral posterior medial nucleus (VPM)
(see Figures lIE and lIF). In all cases, CTh injections in SI and SIBF retrogradely
labeled numerous neuronal cell bodies in cortical and subcortical structures in aIl
experiments for all the three animal groups. CTb-Iabeled neurons in the cortex after an
injection into the caudal part of the barrel field of SI are represented in Figure 12. AlI
the telencephalic and thalarnic afferent connections of SI were mapped and are
represented in Figure 13.

55
VPM
• • ... VPL
Figure 11. Tracer injection sites and distribution of retrogradely labeled neurons in the somatosensory thalamus. Photomicrographs of coronal sections from representative cases, showing CTh injection site in SI (A), the rostral (B) and caudal (C) parts of the barrel field of SI with retrogradely labeled neurons in VPL (D) and VPM (EIF) respectively. Scale: 1000 Ilm (AIB/C) and 200 Ilm (D1E1F).
V2M V2L PtA
1
1 li>
, 1$ . . -. ' S
:1 . . .
WM
. /~ . ' : .. ~ .. ~ ...
WM , WM WM
Figure 12. CTh-Iabeled neurons in the cortex after an injection into the posterior part of the barrel field of SI. Scale: 250 J.Un.

S1 I P'.I I...AT.~L .., .., .., ..,
~ .., .., .., .., ..,
Il! ~ il
r S1 BF
c S1BF
~----------~~ .., ~ ..,
ll:!:::J ..,
~==~~ 1+----------{'iES ~
56
Figure 13. Diagram of the afferent connections of the primary somatosensory cortex (81) of the C57Bl/6 mouse. Each box represents a brain structure which is connected with 81 or the rostral or caudal parts of 81BF. The target of a projection is represented by an arrow. Checkmarks next to the boxes represent a brain structure which is connected with the barrel field or the lower or upper limb regions of 81 that was presented in the Mouse Connectome Project.

57
Cortical projections to SI
Following injections in SI , many labeled neurons were observed within the
somatosensory cortex surrounding the injection sites. These local intra-areal projections
were not included in our connectivity charts and were not quantified. In addition, many
retrogradely labeled neurons were found in the ipsilateral primary (Ml) and secondary
(M2) motor cortices and in the secondary somatosensory cortex (S2). Neurons were also
found in cortices dedicated to other sensory modalities such as the primary auditory
(Au), and in the olfactory pirifonn (Pir) cortex. Neurons were also observed in
association cortices such as the parietal (PtA) and temporal association (TeA), ectorhinal
(Ect), perirhinal (PRh), orbital (OC) and insular (lC) cortices. Most of these connections
were also observed in the mouse connectome material except the projections to SI ,
outside the barrel field, from the parietal association and pirifonn cortex which were not
charted. We did not observe projections from the claustrum to this portion of SI whereas
these projections were reported in the mouse connectome. Labeled neurons were also
found in retrosplenial granular and dysgranular (RSG and RSD respectively), prelimbic
(prL) , infralimbic (IL), dorsal peduncular (DP) and cingulate (Cg) cortices and in the
dentate gyrus (DG) but because of the very low number of labeled neurons and
inconsistent occurrence of labeled neurons between our cases, these areas were not
included in the statistical analysis. The same ipsilateral cortical projections were
observed following injections in the rostral somatosensory barrel field. However
injections in the more caudal aspect of the barrel field produced retro grade labeling of
neurons in the primary visual (VI) cortex and in the medial and lateral extrastriate visual

58
areas (V2M and V2L). Injections in both rostral and caudal barrel field produced
retrogradely labeled neurones in the c1austrum.
Callosal projections to the somatosensory cortex were more restricted than
ipsilateral projections (see Figure 13). Injections in the three parts of the somatosensory
cortex labeled homospecific callosal neurons in the somatosensory cortex and neurons in
contralateral motor cortices, Ml and M2, secondary somatosensory cortex and auditory
cortices and from ectorhinal, perirhinal and orbital cortices. These were also charted in
the mouse connectome database along with other projections from infralimbic cortex
and c1austrum. The injections in the rostral and caudal barrel field labeled similar ipsi
and contralateral cortical areas with the exception of the three visual areas, VI , V2M
and V2L. The absence of heterospecific visual callosal projections to the caudal barrel
field was also found in the mouse connectome database.
Comparing our results with the Mouse Connectome Project (MCP), we fmd that
many of the ipsilateral and contralateral corticocortical projections observed in our
analysis are registered in the MCP and that the MCP contains reports of some additional
retro grade projections from the ipsilateral Cl and contralateral IC and Cl to the lower
limb and upper limb representations of SI , outside of the barrel field, as seen by the
checkmarks next to the corresponding boxes in Figure 13. Our injections outside of the
barrel field cover both the forelimb and hindlimb representations of SI which
correspond to both the upper limb and lower limb representations of SI in the MCP

59
respectively. The MCP also contains reports of retrograde projections to the barrel field
but precise infonnation on the injection coordinates for each individual case is not
available on the iConnectome tool. This means that each individual case available on the
MCP website could not be related to either the rostral or the caudal part of SlBF from
our own material. A list of our cases that received CTh injections in the primary
somatosensory cortex (SI) outside the barrel field, in the rostral (rS1BF) and caudal
(cS1Bf) barrel field and the cases used from the MCP corticocortical connectivity atlas
that received CTh or Fluorogold (FG) injections in the primary somatosensory barrel
field (SSp-bfd), lower limb (SSp-ll), and upper limb (SSp-ul) areas is given in Table 2.
The relative weight of ipsilateral (see Table 3) and contralateral (see Table 4)
cortical connections to SI and the rostral; and caudal parts of S 1BF were quantified in
each experimental case. AlI the injection sites in the somatosensory cortex labeled many
neurons in the ipsilateral motor cortices Ml and M2, in the secondary somatosensory
cortex and in other ipsilateral cortical fields. More robust projections arose from the
auditory and visual cortices as well as from parietal and temporal association cortices.
As observed in other studies, the percentage of labeled neurons in each cortex was quite
variable making strong statistical decisions on group differences less powerful. Several
cortices such as RSG, RSD, PrL, IL, DP, Cg and DG comprised 1ess than 1 % of the total
number of labeled cortical neurons.

60
Table 2
List of our cases that received CTh injections in the primary somatosensory cortex (SI) outside the barrel field, in the rostral (rSlBF) and caudal (cSlBj) barrel field and the
cases used from the MCP corticocortical connectivity atlas that received eTh or Fluorogold (FG) injections in the primary somatosensory barrel field (SSp-bfd),
lower limb (SSp-ll), and upper limb (SSp-ul) areas
Our cases CTB MCP cases
injections
Coordinates Injection
Coordinates Injection site Case (mm) Case Tracer (mm)
APIML/depth site
APIML/depth
SI 02-03a4 1.5/1.5/0.1-0.5 SSp-bfd SWll0420-01 CTB 4.0/-0.08/1.12
02-03a5 1.5/1.5/0.1-0.5 SWl10322-04 NA NA
02-03a3 1.5/1.5/0.1-0.5 SWll0419-03 CTB 3.11-0.88/0.9
02-03a6 1.5/1.5/0.1-0.5 SWI10419-01 NA NA
02-03a7 1.5/1.5/0.1-0.5 SWI10322-01 NA NA
SWII0418-01 NA NA
rSIBF 03-02b2 0.9/2.9/0.1-0.5 SWII0420-03 NA NA
03-04a6 0.9/2.9/0.1-0.5
03-04a7 0.9/2.9/0.1-0.5 SSp-l1 SWII0419-04 NA NA
03-04b4 0.9/2.9/0.1-0.5
03-04b5 0.9/2.9/0.1-0.5 SSp-ul SWll0419-02 CTB 2.3/0.75/0.8
SWll0516-01 NA NA
c SIBF 03-02b7 1.5/2.9/0.1-0.5
04-01b2 1.5/2.9/0.1-0.5
03-02b4 1.5/2.9/0.1-0.5
03-02b5 1.5/2.9/0.1-0.5
03-02b6 1.5/2.9/0.1-0.5

Table 3
Number and percentage (in parentheses) of retrogradely labeled neurons in sensory and non-sensory cortical areas in the ipsilateral hemisphere after injections ofeTb into the primary somatosensory cortex (S1) ofintact C57Bl/6 mice
Injection Case
Cortical area (ipsi)
site Ml M2 S2 Au VI V2M
SI 02-03a4 638 (24.13) 148 (5.60) 720 (27.23) 584 (22.09) 0(0) 0(0)
02-03a5 832 (22.75) 438 (11.97) 1736 (47.46) 140 (3 .83) 0(0) 0(0)
02-03a3 688 (22.21) 222 (7.17) 974 (31.44) 474 (15.30) 0(0) 0(0)
02-03a6 368 (19.73) 147 (7.88) 614 (32.92) 181 (9.71) 0(0) 0(0)
02-03a7 1176 (22.24) 549 (10.38) 2223 (42.05) 378 (7.15) 0(0) 0(0)
Mean±SEM 740.40 ± 147.91 300.80 ± 91.39 1253.4 ± 348.61 351.40 ± 94.73 O±O O±O
(22.21 ± 0.80) (8.60 ± 1.28) (36.22 ± 4.14) (11.61 ± 3.60) (0 ± 0) (O± 0)
r SlBF 03-02b2 170 (9.65) 832 (47.22) 296 (16.80) 0(0) 0(0) 0(0)
03-04a6 1376 (60.09) 122 (5.33) 492 (21.49) 6 (0.26) 0(0) 0(0)
03-04a7 1650 (36.85) 1324 (29.57) 404 (9.02) 200 (4.47) 0(0) 0(0)
03-04b4 1364 (30.41) 1416 (31.57) 736 (16.41) 50 (1.12) 0(0) 0(0)
03-04b5 1060 (29.66) 1190 (33.30) 478 (13.37) 84 (2.35) 0(0) 0(0)
Mean±SEM 1124.0 ± 286.36 976.80 ± 263.46 481.20 ± 81.13 68.00 ± 40.68 O±O O±O
(33.33 ± 9.05) (29.40 ± 7.57) (15.42 ± 2.30) (1.64 ± 0.91) (O± 0) (O± 0)
cSIBF 03-02b7 148 (7.18) 209 (10.14) 415 (20.14) 151 (7.33) 546 (26.49) 10 (0.46)
04-01b2 726 (23 .61) 573 (18.63) 582 (18.93) 365 (11.87) 76 (2.47) 8 (0.26)
03-02b4 800 (13.69) 1510 (25.85) 600 (10.27) 409 (7.00) 400 (6.85) 69 (1.18)
03-02b5 929 (14.88) 1197 (19.16) 1181 (18.91) 1063 (17.02) 154 (2.47) 93 (1.49)
03-02b6 450 (16.43) 323 (11.79) 1117(40.78) 121 (4.42) 33 (1.21) 3 (0.11)
Mean±SEM 610.60 ± 156.20 762.40 ± 283.17 779.00 ± 173.06 421.80 ± 190.12 241.80 ± 110.78 36.60 ± 20.74
(15.16 ± 2.95) (17.12± 3.16) (21.80 ± 5.67) (9.53 ± 2.49) (7.90±5.31) (0.71 ± 0.30)

Table 3
Number and percentage (in parentheses) of retrogradely labeled neurons in sensory and non-sensory cortical areas in the ipsilateral hemisphere after injections ofCTb into the primary somatosensory cortex (S1) ofintact C57Bl/6 mice (continued)
Injection Case
Cortical area (ipsi)
site V2L PtA TeA RSGc RSD Ect
SI 02-03a4 0(0) 218 (8.25) 108 (4.09) 0(0) 0(0) 194 (7.34)
02-03a5 0(0) 236 (6.45) 12 (0.33) 6 (0.16) 32 (0.88) 104 (2.84)
02-03a3 0(0) 224 (7.23) 84 (2.71) 8 (0.26) 36 (1.16) 172 (5.55)
02-03a6 0(0) 114 (6.11) 30 (1.61) 8 (0.43) 26 (1.39) 75 (4.02)
02-03a7 0(0) 348 (6.58) 57 (1.08) 9 (0.17) 37 (0.70) 192 (3 .63) Mean±SEM O±O 228.00 ± 41 .52 58.20 ± 19.49 6.20 ± 1.82 26.20± 7.64 147.40 ± 27.26
(O± 0) (6.92 ± 0.42) (1.96 ± 0.74) (0.20 ± 0.08) (0.83 ± 0.27) (4.68 ± 0.89)
r SlBF 03-02b2 0(0) 0(0) 0(0) 0(0) 0(0) 36 (2.04)
03-04a6 0(0) 0(0) 2 (0.09) 0(0) 2 (0.09) 80 (3.49)
03-04a7 0(0) 92 (2.05) 18 (0.40) 10 (0.22) 40 (0.89) 418 (9.34)
03-04b4 0(0) 0 (0) 10 (0.22) 12 (0.27) 36 (0.80) 230 (5.13)
03-04b5 0(0) 30 (0.84) 10 (0.28) 8 (0.22) 26 (0.73) 228 (6.38) Mean±SEM O±O 24.40 ± 19.98 8.00 ± 3.61 6.00 ± 2.83 20.80 ± 9.40 198.40 ± 75.20
(O± 0) (0.58 ± 0.45) (0.20 ± 0.08) (0.14 ± 0.07) (0.50 ± 0.21) (5 .28 ± 1.40)
c SlBF 03-02b7 100 (4.85) 13 (0.63) 42 (2.04) 8 (0.39) 14 (0.68) 215 (1Q.43)
04-01b2 37 (1.20) 185 (6.02) 88 (2.86) 4 (0.13) 24 (0.78) 245 (7.97)
03-02b4 230 (3 .94) 168 (2.88) 145 (2.48) 37 (0.63) 146 (2.50) 274 (4.69)
03-02b5 115 (1.84) 352 (5.64) 234 (3 .75) 70 (1.12) 163 (2.61) 231 (3 .70)
03-02b6 20 (0.73) 166 (6.06) 17 (0.62) 4 (0.15) 23 (0.84) 235 (8.58)
Mean±SEM 100.40 ± 41.45 176.80±60.10 105.20 ± 43 .48 24.60 ± 14.45 74.00 ± 36.92 240.00 ± 10.93 (2.51 ± 0.90) (4.24 ± 1.21) (2.35 ± 0.58) (0.48 ± 0.21) (1.48 ± 0.49) (7.07 ± 1.40)

Table 3
Number and percentage (in parentheses) of retrogradely labeled neurons in sensory and non-sensory cortical areas in the ipsilateral hemisphere after injections ofeTb into the primary somatosensory cortex (S1) ofintact C57Bl/6 mice (continued)
Injection Case
Cortical area (ipsi)
site PRh Pir Amyg PrL IL Orbital Cx
SI 02-03a4 0(0) 0(0) 2 (0.08) 0(0) 0(0) 0(0)
02-03a5 22 (0.60) 6 (0.16) 4 (0.11) 0(0) 16 (0.44) 6 (0.16)
02-03a3 114 (3.68) 19 (0.61) 6 (0.19) 0(0) 8 (0.26) 3 (0.10)
02-03a6 42 (2.25) 7 (0.38) 14 (0.75) 0(0) 4 (0.22) 192 (10.30)
02-03a7 67 (1.27) 16 (0.30) 12 (0.23) 0(0) 12 (0.23) 87 (1.65)
Mean±SEM 49.00 ± 21.98 9.60 ± 3.88 7.60 ± 2.59 O±O 8.00±3.16 57.60 ± 41.75
(1.56 ± 0.73) (0.29 ± 0.12) (0.27 ± 0.14) (O± 0) (0.23 ± 0.08) (2.44 ± 2.22)
rSlBF 03-02b2 44 (2.50) 26 (1.48) 22 (1 .25) 0(0) 0(0) 112 (6.36)
03-04a6 78 (4.41) 4 (0.18) 4 (0.18) 0(0) 0(0) 32 (1.40)
03-04a7 186(4.15) 32 (0.72) 8 (0.18) 0(0) 0(0) 0(0)
03-04b4 72 (1.61) 10 (0.22) 26 (0.58) 0(0) 0(0) 380 (8.47)
03-04b5 100 (2.80) 22 (0.62) 18 (0.50) 0(0) 0(0) 164 (4.59)
Mean±SEM 96.00 ± 27.07 18.80 ± 5.77 15.60 ± 4.66 O±O O±O 137.60 ± 75.08
(2.89 ± 0.48) (0.64 ± 0.26) (0.54 ± 0.22) (O± 0) (O± 0) (4.16± 1.74)
c SlBF 03-02b7 42 (2.04) 77 (3 .74) 2 (0.10) 0(0) 0(0) 39 (1.89)
04-01b2 36 (1.17) 65 (2.11) 1 (0.03) 0(0) 0(0) 26 (0.85)
03-02b4 48 (0.82) 111 (1.90) 42 (0.72) 1 (0.02) 6 (0.10) 623 (10.66)
03-02b5 67 (1.07) 189 (3.03) 5 (0.08) 5 (0.08) 11 (0.18) 72 (1.15)
03-02b6 92 (3.36) 56 (2.04) 1 (0.04) 0(0) 0(0) 20 (0.73)
Mean±SEM 57.00 ± 11.38 99.60 ± 27.08 1O.20 ± 8.93 1.20 ± 1.08 3.40 ± 2.49 156.00 ± 130.92
(1.69 ± 0.52) (2.56 ± 0.40) (0.19 ± 0.15) (0.02 ± 0.02) (0.06 ± 0.04) (3.06±2.14)
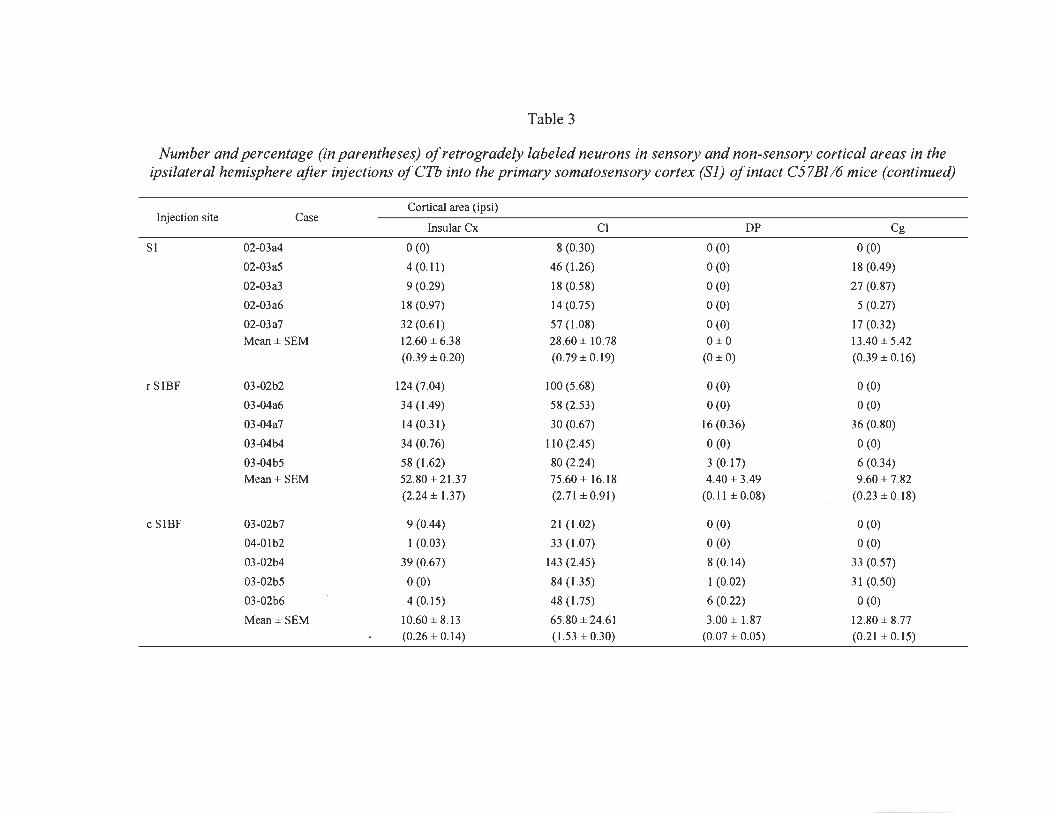
Table 3
Number and percentage (in parentheses) of retrogradely labeled neurons in sensory and non-sensory cortical areas in the ipsilateral hemisphere after injections ofCTb into the primary somatosensory cortex (S1) ofintact C57Bl/6 mice (continued)
Injection site Case Cortical area (ipsi)
Insular ex CI DP Cg
SI 02-03a4 0(0) 8 (0.30) 0(0) 0(0)
02-03a5 4 (0.11) 46 (1.26) 0(0) 18 (0.49)
02-03a3 9 (0.29) 18 (0.58) 0(0) 27 (0.87)
02-03a6 18 (0.97) 14 (0.75) 0(0) 5 (0.27)
02-03a7 32 (0.61) 57 (1.08) 0(0) 17 (0.32) Mean±SEM 12.60 ± 6.38 28.60 ± 10.78 O±O 13.40 ± 5.42
(0.39 ± 0.20) (0.79±0.19) (O± 0) (0.39 ± 0.16)
rSIBF 03-02b2 124 (7.04) 100 (5 .68) 0(0) 0(0)
03-04a6 34 (1.49) 58 (2.53) 0(0) 0(0)
03-04a7 14 (0.31) 30 (0.67) 16 (0.36) 36 (0.80)
03-04b4 34 (0.76) 110 (2.45) 0(0) 0(0)
03-04b5 58 (1.62) 80 (2.24) 3 (0.17) 6 (0.34) Mean±SEM 52.80 ± 21.37 75.60 ± 16.18 4.40 ± 3.49 9.60 ± 7.82
(2.24 ± 1.37) (2.71 ± 0.91) (0.11 ± 0.08) (0.23 ± 0.18)
cSIBF 03-02b7 9 (0.44) 21 (1.02) 0(0) 0(0)
04-01b2 1 (0.03) 33 (1.07) 0(0) 0(0)
03-02b4 39 (0.67) 143 (2.45) 8 (0.14) 33 (0.57)
03-02b5 0(0) 84 (1.35) 1 (0.02) 31 (0.50)
03-02b6 4 (0.15) 48 (1.75) 6 (0.22) 0(0)
Mean± SEM 10.60 ± 8.13 65.80 ± 24.61 3.00 ± 1.87 12.80 ± 8.77 (0.26±0.14) (1.53 ± 0.30) (0.07 ± 0.05) (0.21 ± 0.15)

Table 4
Number and percentage (in parentheses) of retrogradely labeled neurons in sensory and non-sensory cortical areas in the contralateral hemisphere after injections ofCTh into the primary somatosensory cortex (SI) ofintact C57Bl/6 mice
Injection Case
Cortical area (con)
site SI SIBF Ml M2 S2 Au
SI 02-03a4 244 (61.93) 6 (1.52) 70 (17.77) 60 (15.23) 8 (2.03) 4 (1.02)
02-03a5 364(46.13) 7 (0.89) 206 (26.11) 132 (16.73) 10 (1.27) 0(0)
02-03a3 287 (36.89) 7 (0.90) 104 (13.37) 78 (10.03) 10 (1.29) 4 (0.51)
02-03a6 165 (42.20) 4 (1.02) 69 (17.65) 48 (12.28) 5 (1.28) 2 (0.51)
02-03a7 521 (44.08) Il (0.93) 258 (21.83) 171 (14.47) 15 (1.27) 6 (0.51)
Mean±SEM 316.20 ± 67.62 7.00 ± 1.28 141.40 ± 42.94 97.80 ± 26.02 9.60 ± 1.82 3.20 ± 1.14
(46.25±4.71) (1.05 ± 0.13) (19.34 ± 2.41) (13 .75 ± 1.31) (1.43±0.17) (0.51±0.18)
r SIBF 03-02b2 42 (6.09) 272 (39.42) 8 (1.16) 0(0) 162 (23.48) 0(0)
03-04a6 173 (13.58) 637 (50.00) 132 (10.36) 8 (0.63) 110 (8.63) 0(0)
03-04a7 90 (7.65) 53 (4.50) 162 (13.76) 100 (8.50) 20 (1.70) 0(0)
03-04b4 385 (13.57) 1350 (47.59) 324 (11.42) 114 (4.02) 304 (10.72) 0(0)
03-04b5 177 (11.12) 579 (36.37) 164 (10.30) 72 (4.52) 162 (10.18) 0(0)
Mean±SEM 173.40 ± 65.67 578.20 ± 246.06 158.00 ± 56.34 58.80 ± 26.17 151.60 ± 51.53 O±O
(10.40 ± 1.71) (35.58 ± 9.13) (9.40 ± 2.41) (3.53 ± 1.71) (10.94 ± 3.94) (O± 0)
c SIBF 03-02b7 36 (9.65) 62 (16.62) 19 (5 .09) 183 (49.06) 17 (4.56) 0(0)
04-01b2 44 (0) 59 (0) 43 (20.38) 14 (6.64) 16 (7.58) 4 (1.90)
03-02b4 244 (0) 427 (0) 129 (16.69) 124 (16.04) 117 (15.14) 25 (3.23)
03-02b5 64 (0) 103 (0) 42 (11.35) 36 (9.73) 28 (7.57) 24 (6.49)
03-02b6 21 (0) 22 (0) 24 (14.46) 13 (7.83) 6 (3.62) 0(0)
Mean±SEM 81.80 ± 46.00 134.6 ± 82.98 51.40 ± 22.33 74.00 ± 38.04 36.80 ± 22.75 1O.60± 6.40
(12.51 ± 1.50) (18.94 ± 3.44) (9.41 ± 1.66) (15.01 ± 9.55) (5.17 ± 0.94) (1.50 ± 0.92)

Table 4
Number and percentage (in parentheses) of retrogradely labeled neurons in sensory and non-sensory cortical areas in the contralateral hemisphere after injections ofeTh into the primary somatosensory cortex (S1) ofintact C57Bl/6 mice
(continued)
Injection Case
Cortical area (con) site VI V2M V2L PtA TeA RSGc
SI 02-03a4 0(0) 0(0) 0(0) 0(0) 0(0) 0(0)
02-03a5 0(0) 0(0) 0(0) 0(0) 0(0) 0(0)
02-03a3 0(0) 0(0) 0(0) 0(0) 0(0) 0(0)
02-03a6 0(0) 0(0) 0(0) 0(0) 0(0) 0(0)
02-03a7 0(0) 0(0) 0(0) 0(0) 0(0) 0(0) Mean±SEM O±O O±O O±O O±O O±O O±O
(O± 0) (O± 0) (0 ± 0) (O± 0) (O± 0) (O± 0)
r SlBF 03-02b2 0(0) 0(0) 0(0) 0(0) 0(0) 0(0)
03-04a6 0(0) 0(0) 0(0) 0(0) 4 (0.31) 0(0)
03-04a7 0(0) 0(0) 0(0) 0(0) 0(0) 0(0)
03-04b4 0(0) 0(0) 0(0) 0(0) 6 (0.21) 0(0)
03-04b5 0(0) 0(0) 0(0) 0(0) 2 (0.13) 0(0) Mean±SEM O±O O±O O±O O±O 2.40 ± 1.30 O±O
(O± 0) (O± 0) (O± 0) (O± 0) (0.13 ± 0.07) (O±O)
c SlBF 03-02b7 0(0) 0(0) 0(0) 1 (0.27) 1 (0.27) 0(0)
04-01b2 0(0) 0(0) 0(0) 0(0) 3 (1.42) 2 (0.95)
03-02b4 0(0) 0(0) 0(0) 15 (1.94) 4 (0.52) 2 (0.26)
03-02b5 0(0) 0(0) 0(0) 9 (2.43) 13 (3.51) 0(0)
03-02b6 0(0) 0(0) 0(0) 0(0) 0(0) 0(0)
Mean±SEM O±O O±O O±O 5.00 ± 3.37 4.20±2.58 0.80 ± 0.55 (O± 0) (O± 0) (O±O) (0.60 ± 0.37) (0.78 ± 0.49) (0.16±0.14)

Table 4
Number and percentage (in parentheses) ofretrogradely labeled neurons in sensory and non-sensory cortical are as in the contralateral hemisphere after injections ofCTb into the primary somatosensory cortex (SI) ofintact C57Bl/6 mice
(continued)
Injection Case
Cortical area (con)
site RSD Ect PRh Pir Amyg PrL
SI 02-03a4 0(0) 2(0.51) 0(0) 0(0) 0(0) 0(0)
02-03a5 16 (2.03) 14 (1.77) 32 (4.06) 0(0) 0(0) 0(0)
02-03a3 8 (1.03) 6 (0.77) 270 (34.70) 0(0) 0(0) 0(0)
02-03a6 4 (1.02) 4 (1.02) 67 (17.14) 0(0) 0(0) 0(0)
02-03a7 12 (1.02) 18 (1.52) 157 (13.28) 0(0) 0(0) 0(0)
Mean±SEM 8.00±3.16 8.80± 3.44 105.20 ± 54.62 O±O O±O O±O
(1.02 ± 0.36) (1.12 ± 0.26) (13 .84 ± 6.77) (O± 0) (O± 0) (O± 0)
rSlBF 03-02b2 0(0) 26 (3 .77) 174 (25.22) 0(0) 4 (0.58) 0(0)
03-04a6 0(0) 80 (6.28) 90 (7.06) 2 (0.16) 2(0.16) 0(0)
03-04a7 0(0) 116 (9.86) 508 (43.16) 12 (1.02) 8 (0.68) 0(0)
03-04b4 0(0) 86 (3 .03) 118(4.16) 20 (0.71) 10 (0.35) 2 (0.07)
03-04b5 0(0) 76 (4.77) 266 (16.71) 10 (0.63) 8 (0.50) 0(0)
Mean±SEM O±O 76.80 ± 16.23 231.20 ± 84.36 8.80 ± 4.04 6.40 ± 1.64 0.40 ± 0.45 (O±O) (5.54 ± 1.35) (19.26 ± 7.87) (0.50 ± 0.21) (0.45 ± 0.10) (0.01 ± 0.02)
c SlBF 03-02b7 1 (0.27) 44 (11.80) 4 (1.07) 2 (0.54) 1 (0.27) 1 (0.27)
04-01b2 6 (2.84) 43 (20.38) 17 (8.06) 4 (1.90) 0(0) 0(0)
03-02b4 14 (1.81) 149 (19.28) 101 (13.07) 2 (0.26) 0(0) 0(0)
03-02b5 1 (0.27) 55 (14.87) 106 (28.65) 36 (9.73) 0(0) 0(0)
03-02b6 1 (0.60) 8 (4.82) 34 (20.48) 7 (4.22) 0(0) 0(0)
Mean±SEM 4.60 ± 2.84 59.80 ± 26.45 52.40 ± 23 .94 1O.20±7.28 0.20 ±0.22 0.20 ± 0.22
(0.76 ± 0.36) (9.98 ± 1.86) (9.90 ± 3.90) (2.40 ± 1.35) (0.05 ± 0.06) (0.05 ± 0.06)

Table 4
Number and percentage (in parentheses) of retrogradely labeled neurons in sensory and non-sensory cortical areas in the contralateral hemisphere after injections ofeTh into the primary somatosensory cortex (S1) ofintact C57Bl/6 mice
(continued)
Injection Case
Cortical area (con)
site Insular ex IL Orbital Cx CI DP Cg
SI 02-03a4 0(0) 0(0) 0(0) 0(0) 0(0) 0(0)
02-03a5 0(0) 0(0) 8 (1.01) 0(0) 0(0) 0(0)
02-03a3 0(0) 0(0) 4 (0.51) 0(0) 0(0) 0(0)
02-03a6 0(0) 0(0) 23 (5 .88) 0(0) 0(0) 0(0)
02-03a7 0(0) 0(0) 13 (1.10) 0(0) 0(0) 0(0) Mean±SEM O±O O±O 9.60 ± 4.45 O±O O±O O±O
(O± 0) (O±O) (1.70 ± 1.19) (O± 0) (O± 0) (O± 0)
r SlBF 03-02b2 0(0) 0(0) 0(0) 2 (0.29) 0(0) 0(0)
03-04a6 34 (2.67) 0(0) 0(0) 0(0) 0(0) 2 (0.16)
03-04a7 108 (9.18) 0(0) 0(0) 0(0) 0(0) 0(0)
03-04b4 70 (2.47) 0(0) 42 (1.48) 6 (0.21) 0(0) 0(0)
03-04b5 60 (3 .77) 0(0) 14 (0.88) 2 (0.13) 0(0) 0(0) Mean± SEM 54.40±20.19 O±O 11.20 ± 9.13 2.00 ± 1.23 O±O 0.40 ± 0.45
(3.62 ± 1.70) (O± 0) (0.47 ± 0.34) (0.13 ± 0.06) (O± 0) (0.03 ± 0.04)
cSlBF 03-02b7 0(0) 1 (0.27) 0(0) 0(0) 0(0) 0(0)
04-01b2 12 (5 .69) 0(0) 15 (7.11) 32 (15.17) 0(0) 0(0)
03-02b4 12 (1.55) 0(0) 55 (7.12) 24 (3.11) 0(0) 0(0)
03-02b5 0(0) 0(0) 18 (4.87) 2 (0.54) 0(0) 0(0)
03-02b6 62 (4.82) 0(0) 10 (6.02) 1 (20.48) 0(0) 0(0)
Mean±SEM 17.20± 12.88 0.20± 0.22 19.60 ± 10.47 11.80 ± 7.54 O±O O±O (6.86 ± 6.42) (0.05 ± 0.06) (3.35 ± 0.99) (2.54 ± 2.16) (O± 0) (O± 0)

69
The relative abundance of labeled neurons in each cortical area was compared
between injection sites (see Figure 14). This quantitative analysis demonstrates that the
three sites of the somatosensory cortex have many similar cortical connections that have
often different relative weights. The proportion of labeled cortical neurons in the
different cortical areas was quite variable between cases, and only quite large differences
reached levels of statistical significance. Indeed, the rostral portion of the barrel field
had more robust projections from the motor cortices, Ml and M2 than the non-barrel
field portion and the caudal barrel field. Only the difference in the proportion of neurons
labeled in M2 between SI and rostral SlBF reached statistical significance (Tukey
HSD, p = 0.013). Conversely the projections of SI with S2 and Au were more robust
than the other injection sites but only the difference between the rostral SlBF and SI
reaches statistical significance (S2 Tukey-HSD, p = 0.006; Au Tukey-HSD, p = 0.025).
Only the caudal barrel field received projections from striate and extrastriate visual
cortices (V2M Tukey-HSD,p = 0.019; V2L Tukey-HSD,p = 0.006). Several differences
between fields were detected in the lesser projections. Projection from the association
areas PtA and TeA were less important in the caudal barrel field than in the other areas.
Also the projection from the piriform cortex was more important in the caudal barrel
field.
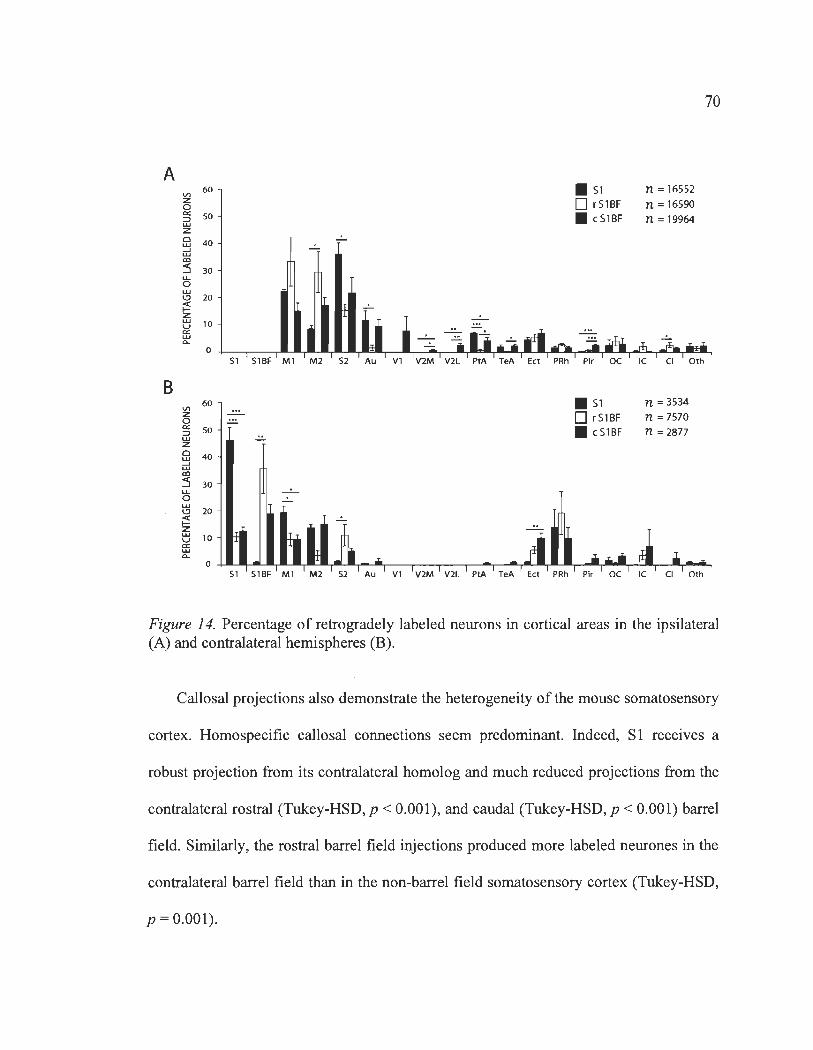
70
A VI
60 . 51 n = 16552 z o r51BF n = 16590 0 a: 50 • c51BF n = 19964 ::J w Z 0 40 -W ....J -W cc :5 30 U-0 w \!l 20
~ -w 10 u a: w Q..
0 51 51BF Ml M2 52 Au V1 V2M V2L PtA TeA Ect PRh Plr OC IC CI Oth
B VI
60 . 51 n =3534 z - o r51BF n =7570 0 -a: 50 • c51BF n = 2877 ::J w -Z 0 40 w ....J W cc :5 30 U- -0 . w \!l 20
~ -w 10 U a: w Q..
0 51 51BF Ml M2 52 Au V1 V2M V2L PtA TeA Ect PRh Plr OC IC CI Oth
Figure 14. Percentage of retrogradely labeled neurons in cortical areas in the ipsilateral (A) and contralateral hemispheres (B).
Callosal projections also demonstrate the heterogeneity of the mouse somatosensory
cortex. Homospecific callosal connections seem predominant. Indeed, SI receives a
robust projection from its contralateral homolog and much reduced projections from the
contralateral rostral (Tukey-HSD,p < 0.001), and caudal (Tukey-HSD,p < 0.001) barrel
field. Similarly, the rostral barrel field injections produced more labeled neurones in the
contralateral barrel field than in the non-barrel field somatosensory cortex (Tukey-HSD,
p = 0.001).

71
Callosal projections from the motor cortices and secondary somatosensory cortex
also show differences between injection sites. Moreover, these differences do not mirror
the heterogeneities in the ipsilateral projections. The somatosensory cortex outside the
barrel field had a more important projection from the contralateral Ml than the rostral
and caudal barrel field (Tukey-HSD, p = 0.010). Although the rostral barrel field had
more important projections from the ipsilateral M2, the somatosensory areas received a
relatively smaller callosal projection form this area than the other injection sites. This
difference however does not reach statistical significance. A similar inverted pattern of
callosal projection is seen with S2 that contributes a relatively stronger projection to the
contralateral rostral barrel field compared to the other injection sites.
Contrary to ipsilateral projections, the somatosensory cortex received very few
heteromodal callosal projections. The projections from the contralateral auditory cortex
were very small and in aIl cases, no labeled neurons were observed in the primary and
extrastriate visual cortices. The callosal projections from the ectorhinal and perirhinal
cortices were of similar weight as Ml, M2 and S2. The other callosal projections were
relatively small and did not show significant differences between injection sites. No
significant differences in the percentage of labeled neurons were observed in the
contralateral hemisphere between the group which received injections in the rostral part
ofSIBF and the group which received injections in the caudal part ofSIBF.

72
Layer indices were calculated in order to scale projections in the feedforward and
feedback continuum (see Tables 5 and 6 respectively and Figure 15). In all the cases and
for the three injections sites, all the layer indices of ipsilateral projections had negative
values. For the injections in SI the layer indices ranged between -0.27 in Ml and -0.94
in TeA. Injections in the rostral SlBF produced layer indices ranging between -0.43 in
Ml and -0.87 in TeA, and the injections in the caudal SlBF between -0.27 in Ml and -
0.91 in TeA. They also show heterogeneities between the three injection sites of the
mouse somatosensory cortex. Injections sites in the rostral SlBF produced more
negative layer indices for the projections from the motor cortices Ml and M2 and from
the secondary somatosensory cortex. Only the difference between rostral and caudal
SlBF of the projection from M2 (Tukey-HSD, p = 0.038), and the difference between
SI and rostral SlBF of the projection from S2 (Tukey-HSD, p = 0.023) reached
statistical significance. In all the ipsilateral projections, the layer indices of the
projections from the temporal cortices Au and TeA were the most negative and of the
same magnitude for all three injection sites. This contrasts with the heteromodal
connections with the primary visual cortex, VI , and the medial extrastriate visual cortex,
V2M, which were close to zero. The layer index of the projection from the ipsilateral
parietal association cortex, PtA to the rostral S lBF is also very close to zero whereas it
is more strongly negative for the projection to SI and caudal SlBF.

73
Table 5
Numbers of retrogradely labeled neurons in supragranular/infragranular layers and layer indices (below) in non-somatosensory sensory and non-sensory neocortical areas
in the ipsilateral hemisphere after injections ofeTb into S1, S1BF (rostral part) and S1BF (caudal part) ofC57Bl/6 mice
Injection Case
Cortical area (ipsi)
site Ml M2 S2
SI 02-03a4 242/396 36 / 112 98 / 456 -0.24 -0.51 -0.65
02-03a5 291 / 541 154 / 284 506 / 858 -0.30 -0.30 -0.26
02-03a3 255 / 433 66 / 156 200 / 558 -0.26 -0.41 -0.47
02-03a6 133 / 235 48 / 99 151 / 329 -0.28 -0.35 -0.37
02-03a7 419/757 187 / 362 606 / 1140 -0.29 -0.32 -0.31
Mean±SEM 268 ± 52/472 ± 97 98 ± 34/203 ± 58 312 ± 114/668 ± 167 -0.28 ± 0.01 -0.35 ± 0.04 -0.37 ± 0.08
r SIBF 03-02b2 44 / 126 280 / 552 30 / 138 -0.48 -0.33 -0.64
03-04a6 416 / 960 24 / 98 88 / 342 -0.40 -0.61 -0.59
03-04a7 563 / 1087 386 / 938 20 / 324
-0.32 -0.42 -0.88
03-04b4 263 / 1101 194 / 1222 86 / 474 -0.61 -0.73 -0.69
03-04b5 289 / 771 286 / 904 46 / 312
-0.46 -0.52 -0.74 Mean±SEM 315 ± 96/809 ± 205 234 ± 24/743 ± 224 54± 16/318±60
-0.44 ± 0.06 -0.52 ± 0.09 -0.71 ± 0.06
c SlBF 03-02b7 81 / 67 103 / 106 38 / 351 0.10 -0.01 -0.80
04-01b2 332 / 394 340 / 233 122 / 413
-0.09 0.19 -0.54
03-02b4 127 / 673 259 / 1251 124 / 436
-0.68 -0.66 -0.56
03-02b5 405 / 524 551 / 646 373 / 733 -0.13 -0.08 -0.33
03-02b6 167 / 283 133/178 169/888 -0.26 -0.18 -0.68
Mean±SEM 222 ± 70/388 ± 130 277 ± 90/485 ± 239 165 ± 63/564 ± 134
-0.27 ± 0.15 -0.27 ± 0.16 -0.55 ± 0.09

74
Table 5
Numbers of retrogradely labeled neurons in supragranular/infragranular layers and layer indices (below) in non-somatosensory sensory and non-sensory neocortical areas
in the ipsilateral hemisphere after injections ofCTh into S1, S1BF (rostral part) and S1BF (caudal part) ofC57BI/6 mice (continued)
Injection Case
Cortical area (ipsi)
site Au VI V2M
SI 02-03a4 74 / 470 -0.73
02-03a5 6 / 98 -0.89
02-03a3 58 / 378 -0.73
02-03a6 20 / 143
-0.76
02-03a7 36 / 291 -0.78
Mean ± SEM 39 ± 14/276 ± 82 -0.75 ± 0.03
r SlBF 03-02b2
03-04a6 0 / 6 -1.00
03-04a7 8 / 144 -0.90
03-04b4 8 / 30 -0.58
03-04b5 6 / 58 -0.81
Mean ± SEM 6 ± 2/60 ± 29 -0.83 ± 0.09
cSlBF 03-02b7 1 / 127 216 / 236 3 / 3
-0.98 -0.04 0.00
04-01b2 19 / 247 34 / 39 6/1 -0.86 -0.07 0.71
03-02b4 14 / 295 157 / 203 11 / 43
-0.91 -0.13 -0.59
03-02b5 119 / 675 79 / 60 34 / 28 -0.70 0.14 0.10
03-02b6 3 / 94 16 / 12 1 / 2
-0.94 0.14 -0.33
Mean ± SEM 31 ± 25/288 ± 119 100 ± 42/110±51 11 ± 7/15 ± 10
-0.80 ± 0.06 -0.05 ± 0.06 -0.17 ± 0.25

75
Table 5
Numbers of retrogradely labeled neurons in supragranular/infragranular layers and layer indices (below) in non-somatosensory sensory and non-sensory neocortical areas
in the ipsilateral hemisphere afier injections ofCTh into Si, SiBF (rostral part) and SiBF (caudal part) ofC57BI/6 mice (continued)
Injection site Case Cortical area (ipsi)
V2L PtA TeA
SI 02-03a4 58 / 116 2 / 98 -0.33 -0.96
02-03a5 42 / 124 0/12 -0.49 -1.00
02-03a3 54 / 118 2 / 78 -0.37 -0.95
02-03a6 25 / 60 1/28
-0.41 -0.93
02-03a7 69 / 183 3 / 54
-0.45 -0.90
Mean±SEM 50 ± 8/120 ± 23 2 ± 1/54 ± 18 -0.41 ± 0.03 -0.94 ± 0.02
rSIBF 03-02b2
03-04a6
03-04a7 34 / 40 2/16
-0.08 -0.78
03-04b4 0 / 6 -1.00
03-04b5 12 / 12 0 / 6 0.00 -1.00
Mean±SEM 23 ± 7/26 ± 9 1 ± 0/7 ± 4
-0.06 ± 0.02 -0.87 ± 0.24
cSIBF 03-02b7 14 / 42 4 / 7 0 / 33
-0.50 -0.27 -1.00
04-01b2 2 / 26 51 / 72 0 / 77
-0.86 -0.17 -1.00
03-02b4 30 / 150 29 / 114 12 / 103
-0.67 -0.59 -0.79
03-02b5 51/45 39 / 237 7 / 192
0.06 -0.72 -0.93
03-02b6 3/12 69 / 75 0/14
-0.6 -0.04 -1.00
Mean±SEM 20 ± 10/55 ± 27 38 ± 12/101 ± 44 4 ± 3/84± 36
-0.47 ± 0.l7 -0.45 ± 0.14 -0.91 ± 0.05

76
Table 6
Numbers of retrogradely labeled neurons in supragranular/infragranular layers and layer indices (below) in non-somatosensory sensory and non-sensory neocortical areas in the contralateral hemisphere after injections ofCTh into S1, S1BF (rostral part) and
S1BF (caudal part) ofC57BI/6 mice
Injection Case
Cortical area (con)
site SI SIBF Ml M2
SI 02-03a4 141/ 58 1 / 4 52 / 18 23 /37 0.42 -0.60 0.49 -0.23
02-03a5 199 / 99 2 / 3 113 / 93 36 / 96 0.34 -0.20 0.10 -0.46
02-03a3 167 / 72 2 / 3 67 / 37 26 / 52 0.40 -0.20 0.29 -0.33
02-03a6 93 / 43 1/1 41 / 28 15 / 33 0.37 0.00 0.19 -0.38
02-03a7 289 / 140 4 / 6 147 / ll1 50 / 121 0.35 -0.20 0.14 -0.42
Mean±SEM 178 ± 37/83 ± 19 2 ± 1I3 ± 1 84 ± 22/57 ± 21 30 ± 7/68 ± 21 0.37 ± 0.02 -0.26 ± 0.11 0.19 ± 0.08 -0.39 ± 0.04
rSIBF 03-02b2 14 / 24 56 / 200 0 / 8 -0.26 -0.56 -1.00
03-04a6 20 / 131 69 / 547 14 / ll8 2 / 6 -0.74 -0.78 -0.79 -0.50
03-04a7 12 / 60 12 / 36 28 / 134 13 / 87 -0.67 -0.50 -0.65 -0.74
03-04b4 57 / 299 187 / 1099 23 / 301 6 / 108 -0.68 -0.71 -0.86 -0.90
03-04b5 33 / 128 102 / 445 18 / 146 6 / 66 -0.59 -0.63 -0.78 -0.83
Mean ± SEM 27 ± 9/128 ± 54 85 ± 33/465 ± 201 17 ± 5/141 ± 54 7 ± 3/67 ± 26
-0.65 ± 0.09 -0.69 ± 0.06 -0.79 ± 0.06 -0.82 ± 0.09
c SIBF 03-02b7 20 / 13 15 / 42 5/14 101 / 82
0.21 -0.47 -0.48 0.10
04-01b2 18 / 26 14 / 38 3/ 40 12 / 2 -0.18 -0.46 -0.86 0.71
03-02b4 121 / llO 108 / 288 5 / 124 16 / 108 0.05 -0.46 -0.92 -0.74
03-02b5 33 / 23 29 / 63 12 / 30 17/19 0.18 -0.37 -0.43 -0.06
03-02b6 10 / 9 5/15 9/15 5 / 8 0.05 -0.50 -0.25 -0.23
Mean±SEM 40 ± 23/36 ± 21 171 ± 21/446 ± 56 7 ± 2/45 ± 23 30 ± 20/44 ± 25 0.06 ± 0.08 -0.45 ± 0.03 -0.74 ± 0.15 -0.18 ± 0.27

77
Table 6
Numbers of retrogradely labeled neurons in supragranular/infragranular layers and layer indices (below) in non-somatosensory sensory and non-sensory neocortical areas in the contralateral hemisphere after injections ofCTh into SI, SIBF (rostral part) and
SIBF (caudal part) ofC57BI/6 mice (continued)
Injection Case
Cortical area (con)
site S2 Au PtA TeA
SI 02-03a4 2 / 6 0 / 4 -0.50 -1.00
02-03a5 4 / 6 -0.20
02-03a3 4 / 6 0 / 4 -0.20 -1.00
02-03a6 2 / 3 0 / 2 -0.20 -1.00
02-03a7 6 / 9 0 / 6 -0.20 -1.00
Mean±SEM 4 ± 1/6 ± 1 o ± 0/4 ± 1
-0.25 ± 0.07 -1.00 ± 0.00
r SIBF 03-02b2 12 / 146 -0.85
03-04a6 0 / 108 -1.00
03-04a7 0 / 20 -1.00
03-04b4 0 / 284 0 / 2
-1.00 -1.00
03-04b5 4 / 150 -0.95
Mean ± SEM 3 ± 3/142 ± 56 O± 0/2± 0
-0.96 ± 0.03 -1.00 ± 0.00
cSlBF 03-02b7 1/16 1/0 1/0
-0.88 1.00 1.00
04-01b2 0/12 0 / 4 1/2
-1.00 -1.00 -0.33
03-02b4 11 / 95 1 / 24 5 / 8 0/3
-0.79 -0.92 -0.23 -1.00
03-02b5 8/12 1/23 0 / 6 0 / 10
-0.20 -0.92 -1.00 -1.00
03-02b6 0 / 5 -1.00
Mean±SEM 4±3/28±19 1 ± 0/17 ± 7 2 ± 1/5 ± 3 1 ± 0/4 ± 2
-0.75 ± 0.17 -0.93 ± 0.02 -0.40 ± 0.50 -0.77 ± 0.47

A
0,5 X w o z ~ Or----~I~~~~~i~-~~~~~
...J
-D,5
.!. .!.
-1
51 51BF Ml M2 52 Au Vl VlM V2l PIA TeA
B • Sl
0,5 o rS1BF X • cS1BF w 0 Z ~ ex: 0
1 w >-cC ...J
-D,5
... .. . -1 ... ... .!. ~ ... •
51 51BF Ml M2 52 Au Vl V2M V2l PIA TeA
78
Figure 15. Layer indices for neocortical areas in the ipsilateral (A) and contralateral hemispheres (B).
The layer indices of the callosal projections were also mostly negative. There is a
similar pattern in the layer indices of the callosal projections from somatosensory (S 1
and SIBF) motor (Ml and M2) and secondary somatosensory cortices in the projections
from these cortices to the rostral SIBF were more strongly negative than the projections
to the other sites. Not aIl these differences reach statistical significance however. This is

79
most evident for the projections from SI. The layer indices for this projection to SI and
caudal S lBF were either positive or close to zero whereas the projection to the rostral
SlBF was less than -0.7. The projections from M2 also followed a similar pattern but
differences do not reach statistical significance. Layer indices of the projection from Ml
to SI were positive whereas the layer indices of the projections to rostral and caudal
SlBF were very similar and significantly different. The layer indices of the quite weak
projection from the auditory cortex to all portions of the somatosensory cortex had very
strongly negative values similar to the other temporal cortical field TeA. There were no
visual heteromodal callosal projections to the mouse somatosensory cortices.
To further visualise the relationship between the structure of ipsilateral and callosal
projections, the values of layer indices for each projection in each case were plotted in a
scatter diagram (see Figure 16). This shows that in most cases both the ipsilateral and
contralateral projections have negative layer indices. In all cases the layers indices were
positive for the callosal and slightly negative for the ipsilateral projection from Ml to
SI. The projection from M2 to the caudal SlBF had highly variable and inconsistent
layer indices values for the ipsi- and contralateral projections. In one case both values
are strongly negative and in one case, both are strongly positive. Three cases have
intermediate values.

-' « cr
~ «
• •
• • • ,
~ -1 -0,8 -0,6
•• •
-0.4 -0,2
0 OO~ 8 • • •• • o
• 0 • ~ C • •
•• C~C. •
•
80
LAYER INDEX
. Ml
0,8 • M2
0,6 0 52
0,4 Au
• PtA 0,2
TeA
0,2 0.4 0,6 0,8
· -0,2
-o,~ • -0,6
-0,8 • -1
IPSllATERAl
Figure 16. Layer indices matching between the ipsilateral hemisphere ex axis) and the contralateral hemisphere (Y axis). Each circle (SI), square (r SIBF) and diamond (c S IBF) represents the layer index of a cortical area for a single case in which retrogradely labeled neurons were plotted in both hemispheres.
There was a clear inverse relationship between the abundance of labeled neurons in
the ipsilateral cortex and the distance for all three injection sites (see Figure 17). Since
the neurons labeled in the somatosensory cortex were not quantified, very few neurons
were charted in close proxirnity of the injections sites. This explains the increasing
number of neurons in a radius up to 2500 f..l.m from the injection sites. For greater
distances, the decrease in the abundance of labeled neurons with distance from the
injection sites is quite evident, showing that in corticocortical connections, shorter
connections are more abundant than longer ones.

81
A 51 B 51 1200 + 1.5 . Ml . M2 .S2 Au . Vl
'" • V2M . V2L • PtA • TeA
z 1000 ~ :::> w
800 0.5 z /li Q • w Q
al 600
;;:; 0 4O ......... _________ .. ____ .. _ ............... _ ..... ________ .. _ .......
co ~ ~ ri ~ 400 -0.5 • ffi 1. co ::;:
200 • -1 • :::> z
• -1.5 0 0 1000 2000 3000 4000 5000 6000 7000 0 1000 2000 3000 4000 5000 6000 7000
DISTANCE (pM) DISTANCE (~M)
C r51BF D r51BF 1200
+ 1.5
'" z 1000 + ~ al
0.5 z 800 e Q w al
600 ;;:; 0 :s ~
--- -- --- -.- -- -- --- -- --- -- --- ----- -- -- ------ -- ---~ • t f ffi
400 -0.5
+ co ::;:
200 -1 ~
0 -1.5 0 1000 2000 3000 4000 5000 6000 7000 0 1000 2000 3000 4000 5000 6000 7000
DISTANCE (PM) DISTANCE (pM)
E c51BF F c51BF 1200 1.5
'" z 1000 ~ :::> w
800 + z t 0.5 fil /li
--- --- -- --- ---------~-----t"! -- --- -- --------g 600 • ~ 0 ~ a: "- z ~ 0 400 -0.5 + 1 t f ffi ~ • ~ 200 -1 t
• • • 0 -1.5
0 1000 2000 3000 4000 5000 6000 7000 0 1000 2000 3000 4000 5000 6000 7000 DISTANCE (pM) DISTANCE (~M)
Figure 17. Percentage of retrogradely labeled neurons (Y axis) depending on their distance (X axis) from one of the three different injection sites in SI.

82
Subcortical projections to SI
Following injections of CTh into SI and the rostral and caudal parts of SlBF,
retrogradely labeled neurons were found in several subcortical structures of all three
animal groups (see Table 6). The main sources ofthalamic inputs to SI and SlBF were
VPL and VPM respectively, but due to the high density of labeled neurons therein (see
Figure Il), these areas were not included in the statistical analysis. Labeled neurons
were found mainly in the posterior thalamic nuclear group (Po), the ventrolateral
thalamic nucleus (VL), the ventromedial thalamic nucleus (VM), the reuniens thalamic
nucleus (Re), the globus pallidus (GP), the zona incerta (ZI), the central medial thalamic
nucleus (CM-PC), the hypothalamus (Hyp) and the laterodorsal thalamic nucleus (LD)
(see Figure 18). In addition, sorne labeled neurons were found in several other thalamic
nuclei and subcortical structures. Quantification of the labeled cells is detailed in
Table 7. Statistical analysis was performed for the nine subcortical structures that
consistently contained labeled neurons.

"'. ,,' ~"', . . . . . . . . . . . . / . ',
,/ \ ,'''J .
... ",: ;. :
.. "'/' , .: ..... ' •........... ~ ...... .
.... :-....... ... •• # ": • • .....
l '. · · · · · · ·
83
Figure 18. CTb-Iabeled neurons in the subcortex after an injection into the posterior part of the barrel field of SI. Scale: 250 !lm.

Table 7
Number and percentage (in parentheses) of retrogradely labeled neurons in sensory and non-sensory subcortical areas after injections ofCTh into the primary somatosensory cortex (S1) ofintact C57Bl/6 mice
Injection Subcortical area Case
site Po VPL VPM AM VL VM
SI 02-03a4 64 (10.06) 510 (80.19) 0(0). 0(0) 0(0) 0(0)
02-03a5 88 (12.61) 478 (68.48) 0(0) 0(0) 0(0) 56 (8.02)
02-03a3 70 (8.90) 502 (63.79) 0(0) 0(0) 0(0) 85 (10.80)
02-03a6 38 (8.56) 247 (55 .63) 0(0) 0(0) 0(0) 31 (6.98)
02-03a7 123 (11.38) 729 (67.44) 0(0) 0(0) 0(0) 68 (6.29)
Mean ± SEM 76.60 ± 15.76 493.20 ± 85.44 O±O O±O O±O 48.00 ± 16.63
(10.30 ± 0.85) (67.11 ± 4.44) (O± 0) (0 ± 0) (0 ± 0) (6.42 ± 1.99)
rSlBF 03-02b2 294 (39.95) 0(0) 258 (35 .05) 0(0) 0(0) 8 (1.09)
03-04a6 198 (30.18) 0(0) 258 (39.33) 0(0) 36 (5.49) 16 (2.44)
03-04a7 434 (48.22) 0(0) 162 (18) 0(0) 68 (7.56) 114 (12.67)
03-04b4 402 (31.31) 0(0) 258 (20.09) 26 (2.03) 258 (20.09) 34 (2.65)
03-04b5 376 (38.76) 0(0) 226 (23.30) 8 (0.83) 108 (11.13) 52 (5.36)
Mean± SEM 340.80 ± 47.60 O±O 232.40 ± 20.86 6.80 ± 5.64 94.00 ± 49.98 44.80 ± 21.13
(37.68 ± 3.66) (O±O) (27.16 ± 4.74) (0.57 ± 0.44) (8.85 ± 3.73) (4.84 ± 2.32)
c SlBF 03-02b7 263 (50.19) 0(0) 165 (31.49) 10 (1.91) 19 (3 .63) 3 (0.57)
04-01b2 264 (36.72) 0(0) 232 (32.27) 0(0) 26 (3 .62) 112 (15.58)
03-02b4 580 (37.69) 0(0) 111 (7.21) 12 (0.78) 59 (3 .83) 61 (3 .96)
03-02b5 362 (30.17) 0(0) 357 (29.75) 44 (3 .67) 162 (13.5) 1 (0.08)
03-02b6 215 (38.19) 0(0) 200 (35.52) 11 (1.95) 48 (8.53) 2 (0.36)
Mean± SEM 336.80 ± 73.04 O±O 15.40 ± 46.08 15.40 ± 8.35 62.80 ± 28.88 35.80 ± 24.84
(38.59 ± 3.62) (O ± 0) (27.25 ± 5.70) (1.66 ± 0.69) (6.62 ± 2.19) (4.11 ± 3.30)
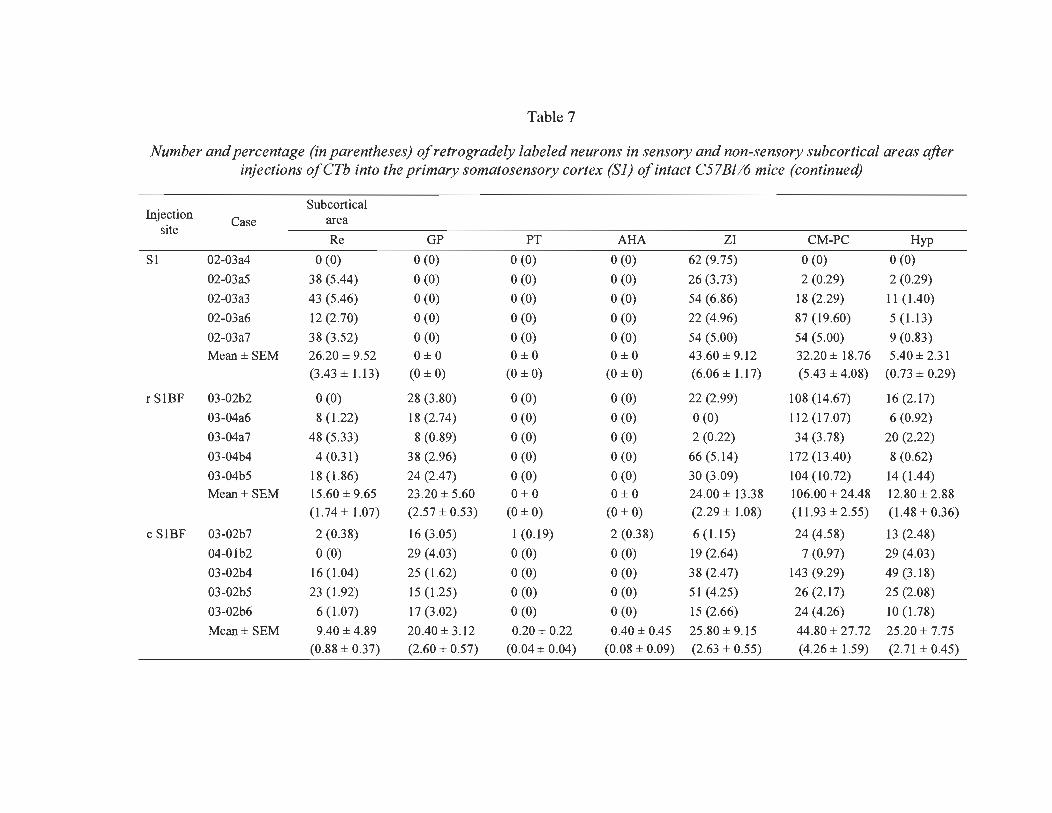
Table 7
Number and percentage (in parentheses) of retrogradely labeled neurons in sensory and non-sensory subcortical areas after injections ofeTb into the primary somatosensory cortex (S1) ofintact C57Bl/6 mice (continued)
Subcortical Injection
Case area site
Re GP PT ARA ZI CM-PC Hyp
SI 02-03a4 0(0) 0(0) 0(0) 0(0) 62 (9.75) 0(0) 0(0)
02-03a5 38 (5.44) 0(0) 0(0) 0(0) 26 (3 .73) 2 (0.29) 2 (0.29)
02-03a3 43 (5.46) 0(0) 0(0) 0(0) 54 (6.86) 18 (2.29) Il (1.40)
02-03a6 12 (2.70) 0(0) 0(0) 0(0) 22 (4.96) 87 (19.60) 5 (1.13)
02-03a7 38 (3.52) 0(0) 0(0) 0(0) 54 (5.00) 54 (5.00) 9 (0.83)
Mean± SEM 26.20 ± 9.52 o±o O±O O±O 43.60 ± 9.12 32.20 ± 18.76 5.40 ± 2.31
(3 .43 ± 1.13) (O± 0) (O± 0) (O± 0) (6.06 ± 1.17) (5.43 ± 4.08) (0.73 ± 0.29)
rSIBF 03-02b2 0(0) 28 (3 .80) 0(0) 0(0) 22 (2.99) 108 (14.67) 16 (2.17)
03-04a6 8 (1.22) 18 (2.74) 0(0) 0(0) 0(0) 112 (17.07) 6 (0.92)
03-04a7 48 (5.33) 8 (0.89) 0(0) 0(0) 2 (0.22) 34 (3.78) 20 (2.22)
03-04b4 4(0.31) 38 (2.96) 0(0) 0(0) 66 (5.14) 172 (13.40) 8 (0.62)
03-04b5 18 (1.86) 24 (2.47) 0(0) 0(0) 30 (3.09) 104 (10.72) 14 (1.44)
Mean± SEM 15.60 ± 9.65 23.20 ± 5.60 O±O O±O 24.00 ± 13.38 106.00 ± 24.48 12.80 ± 2.88
(1.74 ± 1.07) (2.57 ± 0.53) (O±O) (O± 0) (2.29 ± 1.08) (11.93 ± 2.55) (1.48 ± 0.36)
c SIBF 03-02b7 2 (0.38) 16 (3.05) 1 (0.19) 2 (0.38) 6 (1.15) 24 (4.58) 13 (2.48)
04-01b2 0(0) 29 (4.03) 0(0) 0(0) 19 (2.64) 7 (0.97) 29 (4.03)
03-02b4 16 (1.04) 25 (1.62) 0(0) 0(0) 38 (2.47) 143 (9.29) 49(3 .18)
03-02b5 23 (1.92) 15 (1.25) 0(0) 0(0) 51 (4.25) 26 (2.17) 25 (2.08)
03-02b6 6 (1.07) 17 (3.02) 0(0) 0(0) 15 (2.66) 24 (4.26) 10 (1.78)
Mean± SEM 9.40 ± 4.89 20.40 ± 3.12 0.20 ± 0.22 0.40 ± 0.45 25 .80 ± 9.15 44.80 ± 27 .72 25.20 ± 7.75
(0.88 ± 0.37) (2.60 ± 0.57) (0.04 ± 0.04) (0.08 ± 0.09) (2.63 ± 0.55) (4.26 ± 1.59) (2.71 ± 0.45)
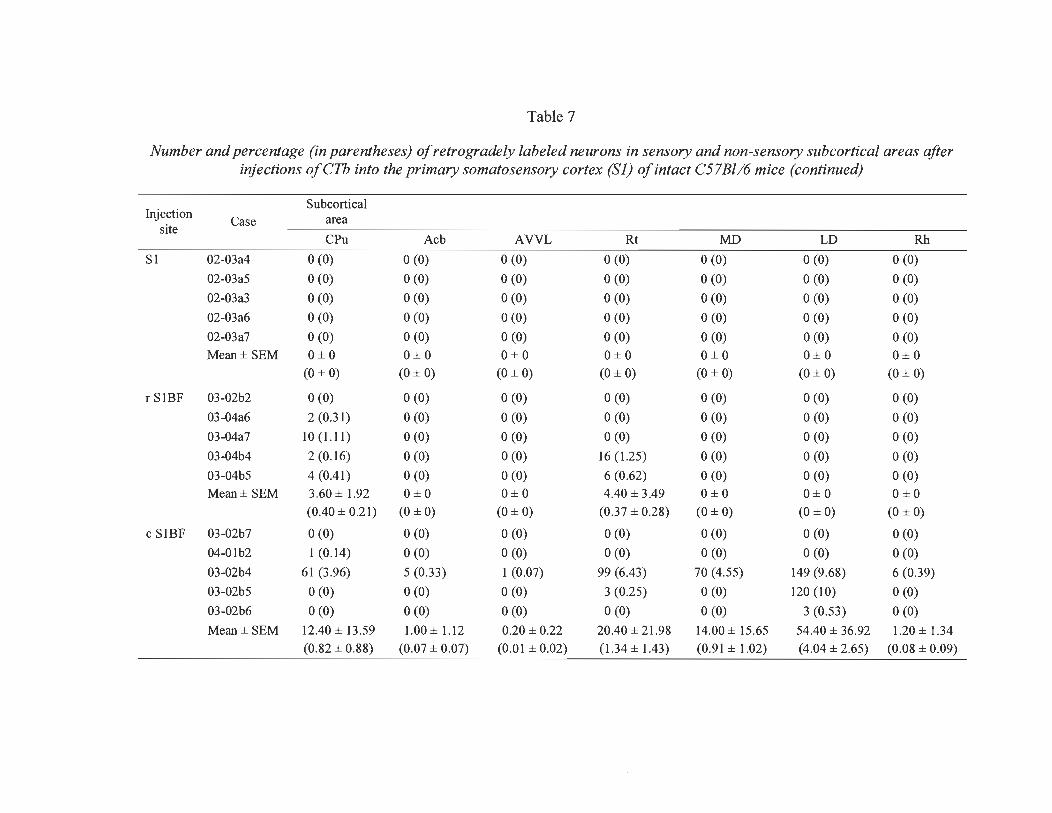
Table 7
Number and percentage (in parentheses) of retrogradely labeled neurons in sensory and non-sensory subcortical areas after injections ofCTb into the primary somatosensory cortex (S1) ofintact C57Bl/6 mice (continued)
Subcortical Injection
Case area site
CPu Acb AVVL Rt MD LD Rh
SI 02-03a4 0(0) 0(0) 0(0) 0(0) 0(0) 0(0) 0(0)
02-03a5 0(0) 0(0) 0(0) 0(0) 0(0) 0(0) 0(0)
02-03a3 0(0) 0(0) 0(0) 0(0) 0(0) 0(0) 0(0)
02-03a6 0(0) 0(0) 0(0) 0(0) 0(0) 0(0) 0(0)
02-03a7 0(0) 0(0) 0(0) 0(0) 0(0) 0(0) 0(0)
Mean±SEM O±O o±o o±o o±o o±o O±O O±O
(0 ± 0) (O± 0) (O±O) (O± 0) (0 ± 0) (0 ± 0) (O±O)
rSlBF 03-02b2 0(0) 0(0) 0(0) 0(0) 0(0) 0(0) 0(0)
03-04a6 2 (0.31) 0(0) 0(0) 0(0) 0(0) 0(0) 0(0)
03-04a7 10 (1.11) 0(0) 0(0) 0(0) 0(0) 0(0) 0(0)
03-04b4 2 (0.16) 0(0) 0(0) 16 (1.25) 0(0) 0(0) 0(0)
03-04b5 4 (0.41) 0(0) 0(0) 6 (0.62) 0(0) 0(0) 0(0)
Mean± SEM 3.60 ± 1.92 O±O O±O 4.40 ± 3.49 O±O O±O O±O
(0.40 ± 0.21) (O±O) (O±O) (0.37 ± 0.28) (0 ± 0) (O± 0) (O± 0)
c SlBF 03-02b7 0(0) 0(0) 0(0) 0(0) 0(0) 0(0) 0(0)
04-01b2 1 (0.14) 0(0) 0(0) 0(0) 0(0) 0(0) 0(0)
03-02b4 61 (3 .96) 5 (0.33) 1 (0.07) 99 (6.43) 70 (4.55) 149 (9.68) 6 (0.39)
03-02b5 0(0) 0(0) 0(0) 3 (0.25) 0(0) 120 (10) 0(0)
03-02b6 0(0) 0(0) 0(0) 0(0) 0(0) 3 (0.53) 0(0)
Mean± SEM 12.40 ± 13.59 1.00 ± 1.12 0.20± 0.22 20.40 ± 21.98 14.00 ± 15.65 54.40 ± 36.92 1.20 ± 1.34
(0.82 ± 0.88) (0.07 ± 0.07) (0.01 ± 0.02) (1.34 ± 1.43) (0.91 ± 1.02) (4.04 ± 2.65) (0.08 ± 0.09)

Table 7
Number and percentage (in parentheses) of retrogradely labeled neurons in sensory and non-sensory subcortical areas after injections ofCTh into the primary somatosensory cortex (SI) ofintact C57Bl/6 mice (continued)
Injection Subcortica1 area site
Case LP LH PVP APTD PM mfu
SI 02-03a4 0(0) 0(0) 0(0) 0(0) 0(0) 0(0)
02-03a5 0(0) 0(0) 0(0) 0(0) 0(0) 8 (1.15)
02-03a3 0(0) 0(0) 0(0) 0(0) 0(0) 4 (0.51)
02-03a6 0(0) 0(0) 0(0) 0(0) 0(0) 2 (0.45)
02-03a7 0(0) 0(0) 0(0) 0(0) 0(0) 6 (0.56)
Mean± SEM O±O O±O O±O O±O O±O 4.00 ± 1.58
(O± 0) (O± 0) (O±O) (0 ± 0) (O± 0) (0.53 ± 0.20)
r SlBF 03-02b2 0(0) 0(0) 0(0) 0(0) 0(0) 2 (0.27)
03-04a6 0(0) 0(0) 0(0) 0(0) 0(0) 2(0.31)
03-04a7 0(0) 0(0) 0(0) 0(0) 0(0) 0(0)
03-04b4 0(0) 0(0) 0(0) 0(0) 0(0) 0(0)
03-04b5 0(0) 0(0) 0(0) 0(0) 0(0) 0(0)
Mean±SEM O±O O±O O±O O±O O±O 0.80 ± 0.55
(O± 0) (O± 0) (O± 0) (0 ± 0) (O± 0) (0.12 ± 0.08)
c SIBF 03-02b7 0(0) 0(0) 0(0) 0(0) 0(0) 0(0)
04-01b2 0(0) 0(0) 0(0) 0(0) 0(0) 0(0)
03-02b4 2 (0.13) 3 (0.20) 10 (0.65) 32 (2.08) 7 (0.46) 0(0)
03-02b5 0(0) 0(0) 0(0) 0(0) 0(0) Il (0.92)
03-02b6 0(0) 0(0) 0(0) 0(0) 0(0) 5 (0.89)
Mean± SEM 0.40 ± 0.45 0.60± 0.67 2.00 ± 2.24 6.40 ± 7.16 1.40 ± 1.57 3.20 ± 2.43
(0.03 ± 0.03) (0.04 ± 0.04) (0.13 ± 0.15) (0.42 ± 0.47) (0.09 ± 0.10) (0.36 ± 0.25)

Table 7
Number and percentage (in parentheses) of retrogradely labeled neurons in sensory and non-sensory subcortical areas after injections ofCTh into the primary somatosensory cortex (S1) ofintact C57Bl/6 mice (continued)
Injection Subcortical area Case
site VA LSI STLP AV EP VP
SI 02-03a4 0(0) 0(0) 0(0) 0(0) 0(0) 0(0)
02-03a5 0(0) 0(0) 0(0) 0(0) 0(0) 0(0)
02-03a3 0(0) 0(0) 0(0) 0(0) 0(0) 0(0)
02-03a6 0(0) 0(0) 0(0) 0(0) 0(0) 0(0)
02-03a7 0(0) 0(0) 0(0) 0(0) 0(0) 0(0) Mean±SEM O±O O±O O±O O±O .O± 0 O±O
(0 ± 0) (O±O) (0 ± 0) (0 ± 0) (0 ± 0) (O± 0)
rSlBF 03-02b2 0(0) 2 (0.27) 0(0) 0(0) 0(0) 0(0)
03-04a6 0(0) 0(0) 0(0) 0(0) 2(0.31) 0(0)
03-04a7 0(0) 2 (0.22) 2 (0.22) 2 (0.22) 2 (0.22) 0(0)
03-04b4 0(0) 0(0) 0(0) 4 (0.31) 0(0) 4 (0.31)
03-04b5 0(0) 2 (0.21) 0(0) 0(0) 0(0) 2 (0.21) Mean±SEM O±O 1.20 ± 0.55 0.40 ± 0.45 1.60 ± 0.84 0.80 ± 0.55 1.20 ± 0.89
(O± 0) (0.04 ± 0.04) (0.04 ± 0.04) (0.07 ± 0.07) (0.03 ± 0.03) (0.04 ± 0.04)
cSlBF 03-02b7 0(0) 0(0) 0(0) 0(0) 0(0) 0(0)
04-01b2 0(0) 0(0) 0(0) 0(0) 0(0) 0(0)
03-02b4 0(0) 0(0) 0(0) 0(0) 0(0) 0(0)
03-02b5 0(0) 0(0) 0(0) 0(0) 0(0) 0(0)
03-02b6 7 (1 .24) 0(0) 0(0) 0(0) 0(0) 0(0)
Mean± SEM 1.40± 1.57 O±O O±O O±O O±O O±O (0.25 ± 0.28) (O± 0) (O± 0) (O± 0) (O ± 0) (O± 0)

89
Significant differences in the percentage of labeled neurons in Po, VL, GP and zr
were observed between the group which received injections in SI and the group which
received injections in the anterior part of SlBF (see Figure 19). Post-hoc tests revealed
that a greater proportion of labeled neurons was found in zr (Tukey-HSD, p = 0.025) of
the group which received injections in SI compared with the group which received
injections in the rostral part of SlBF. Also, a greater proportion of labeled neurons was
found in Po (Tukey-HSD, p < 0.001), VL (Tukey-HSD, p = 0.039) and GP (Tukey-
HSD, p = 0.002) of the group which received injections in the rostral part of SlBF
compared with the group which received injections in SI.
75 Vl Z 0 CI: ::::l 60 LU Z Q LU u:J 45 co « -l u-o 30 LU ~
~ a5 15 u CI: LU 0..
0
-*!."
. 51 o r51SF • c 51SF
n = 3646 n =4546 n =4545
Figure 19. Percentage of retrogradely labeled neurons in different subcortical areas.
Significant differences in the percentage of labeled neurons in Po, GP, zr and Hyp
were observed between the group which received injections in SI and the group which
received injections in the caudal part of SlBF. Post-hoc tests revealed that a greater
proportion of labeled neurons was found in Po (Tukey-HSD, p < 0.001), GP

90
(Tukey-HSD, p = 0.002), ZI (Tukey-HSD, p = 0.041) and Hyp (Tukey-HSD, p = 0.003)
of the group which received injections in the caudal part of SlBF compared with the
group which received injections in SI. No significant differences in the percentage of
labeled neurons were observed in the subcortical structures between the group which
received injections in the rostral part of SlBF and the group which received injections in
the caudal part of SI BF.
In order to assess and compare the multimodality of the different portions of the
mouse somatosensory cortex, the relative importance of cortical projections were
grouped according to sensory modality, motor and in functional do mains such as
multisensory areas and modulatory areas (see Figure 20). This classification was the
same as used by Budinger and Scheich (2009) for the sake of comparison between
studies. This analysis shows that SI and the rostral barrel field receive less multisensory
input and input from other sensory modalities, than the caudal portion of the
somatosensory barrel field. Indeed, both the ipsilateral and callosal cortical inputs of
these areas come mainly from somatosensory and motor cortices. The caudal portion of
the barrel field receives an important contingent of projections from somatosensory and
motor cortices but received a greater proportion of ipsilateral projections from cortices
dedicated to other sensory modalities and also from multisensory association cortices.
Callosal projections convey less heteromodal and multisensory projections than the
ipsilateral cortical projections. A similar pattern was shown for subcortical projections to
the somatosensory cortex. Indeed, the non-barrel field received mainly modality specific

91
afferents from the thalamus whereas the barrel field areas received more multisensory
thalamic inputs.
• Somel08.,KIfy Cortical
• Mat~ Subcortical
Mitl ..... ory
• Off.dot)'
O .... d."'" Ipsi Contra • VI .. ..
• Modu&atory
5..,.%
S1
r .... "
1.81"
r S1 BF
c SlBF
Figure 20. Diagram showing the input ratios of different modalities into the primary somatosensory cortex of the C57Bl/6 mouse. Ratios were calculated from the relative numbers of retrogradely labeled neurons found in the respective structures.
CORTEX: Somatosensory = S2 (SI & SlBF only for the contralateral hemisphere); Motor = Ml , M2; Multisensory =, TeA, Cl, RSGc, RSD, Ect, PRh, PrL, IL, Orbital Cx, Insular Cx, DP, Cg.; Olfactory = Pir.; Auditory = Au.; Visual = VI , V2M, V2L.; Modulatory = No area.
SUBCORTEX: Somatosensory = Po, VPL, VPM, APTD.; Motor = VL, VM, GP, ZI, CPU. ; Multisensory = PT, Rt, Re, CPU, Rh.; Olfactory = No area.; Auditory = No area.; Visual = LD, LP.; Modulatory = AM, ARA, CMPC, Hyp, Acb, A VVL, MD, LH, PVP, PM, mfb, V A.

92
Discussion
Summary
The aim of this study was to identify the top-down connections as weIl as the
networks of the mouse involved in multisensory integration, and to test the hypothesis
that differences exist in the quantity and/or structure of projections found in 81 , and the
rostral and caudal parts of 81BF. The present study has shown, by use of the sensitive
neuronal tracer CTh, that these three different parts of 81 have afferent connections with
somatosensory areas, non-somatosensory primary sensory areas, multisensory, motor,
associative, and neuromodulatory areas. The retro grade tracer used here made it possible
to quantitatively analyze the retrogradely labeled ceIls of origin and their laminar
distribution to classify the projections as feedback, feedforward or lateral.
Top-down influences on early cortical sensory processmg contribute to several
aspects such as perceptual grouping, constancies and shape recognitions but most
importantly they provide contextual information from sensory, motor and association
areas of the brain (see Gilbert and Li, 2013; Gilbert and 8igman, 2007 for review). The
diversity of afferent projections to the somatosensory cortex shown here are
commensurate with the afferent projections shown for the visual cortex in the mouse
(Charbonneau et al., 2012) and the auditory cortex of the gerbil (Budinger et al., 2008).
The present results and these previous studies illustrate the important functional
diversity of top-down influences on primary sensory cortices in rodents. Whether this

93
diversity is also present in primates is not known emphasizing the need for brain wide
connectivity of the cortex in mammals with more highly developed cerebral cortex.
Connectomes and modules in the somatosensory barrel field vs. non-barrel field
Compared to precedent anatomical studies (Henschke et al. , 2014; Zakiewicz et al. ,
2014), our brain-wide analysis contributes more complete and detailed information
about S 1 afferent projections, both regarding the differences between cortical and
subcortical projections to the different parts of S 1 and their structure. The presented
results are of relevance for ongoing large-scale efforts to systematically map connections
in the rodent brain, such as the Mouse Brain Connectome Project and the Allen Mouse
Brain Connectivity Atlas. A connectomics analysis of the mouse cortex has
demonstrated four subnetworks of the somatosensory cortex (Zingg et al. , 2014), the
orofaciopharyngeal, upper limb, lower limb and trunk, and whisker subnetworks.
Our study extends this knowledge on the widespread cortical afferents of SI of the
mouse by providing a quantitative rather than qualitative evaluation and also by taking
into account the thalamic afferents. Moreover, these quantifications were compared
between afferent connections to the mystacial caudal barrel field, more rostral barrel
field and somatosensory cortex outside the barrel field to see if the different
somatosensory subnetworks follow similar patterns of cortical connectivity. Our
injections outside of the barrel field cover both the forelimb and hindlimb
representations of SI which correspond to both the upper limb and lower limb

94
representations of SI respectively in the MCP data used to build the four subnetworks.
The MCP also contains reports of retro grade projections to the barrel field but this data
could not be specifically related to either the rostral or the caudal part of SlBF from our
own material.
Each of the four somatic sensorimotor subnetworks displayed connections with
other somatic sensorimotor areas like Ml, M2 and S2 (Zingg et al., 2014), which also
represented the overall majority of the connections displayed in our results for all three
injection sites of SI. Each of the four somatic sensorimotor subnetworks is also
composed of major nodes. The orofaciopharyngeal subnetwork is composed of five
major nodes: Ml , M2, SI , including the barrel field, and S2. The gustatory, visceral, and
dorsal agranular areas, grouped together as the insular cortex in our material, are also
connected with this subnetwork, which could contribute relevant information on
gustation and food safety (Carleton et al., 2010; Maffei et al., 2012). We did not perform
CTh injections directly into the mouth and nose regions of the primary somatosensory
cortex but we did observe afferent connections from the insular cortex to all three
injection sites of SI without any significant differences between the three in both
hernispheres.
The upper limb subnetwor~ is composed of four major nodes: Ml , M2, SI and S2.
The upper limb subnetwork also shares connections with the temporal association,
perirhinal, and ectorhinal cortices. We also observed afferent connections with the
95
temporal association, perirhinal and ectorhinal cortices to the primary somatosensory
cortex, outside of the barrel field and both parts of the barrel field.
The lower limb and trunk subnetwork is composed of three major nodes: Ml, M2
and SI. Relevant information for the lower limb and trunk subnetwork is also provided
by inputs from the temporal association, perirhinal and ectorhinal cortices as well as
from visual and auditory areas, and several other areas such as the parietal association
cortex and ventral orbital cortex. We also observed afferent connections with the
temporal association, perirhinal and ectorhinal cortices to the primary somatosensory
cortex, outside of the barrel field and both parts of the barrel field. We observed afferent
connections from auditory areas to SI, outside of the barrel field, but no projections
from visual areas were observed to this part of SI. The afferent connections from the
parietal association cortex and the ventral orbital cortex were observed as well in SI,
outside of the barrel field, with the former being more pro minent in this part of SI
compared to the two parts of the barrel field.
The whisker subnetwork is composed of three major nodes: Ml, S2 and the barrel
field. The whisker subnetwork also shares connections with the temporal and parietal
association cortices, the perirhinal and ectorhinal cortices as well as visual and insular
areas. These connections, inc1uding the ones from visual areas, were also observed in the
caudal barrel field, and to a lesser extent in the cases which received injections in the
rostral barrel field, exc1uding the ones from visual areas.

96
The most caudal part of SI was also reported to be highly connected with the
primary vi suaI and auditory cortices to form major components of the medial network,
another big network which mediate transduction of information between these sensory
areas and higher order association are as of the neocortex. Interestingly, this medial
network provides an interface for direct interactions between different sensory
modalities though reciprocal connections among the visual and auditory cortices and the
barrel field.
The urnque topological organization of the many subnetworks would reflect
different information processmg strategies for each. The heavy and reciprocal
connections between the somatosensory and motor areas of the somatic sensorimotor
network could enable rapid integration of tactile information for dynamically regulating
motor actions. For example, the orofaciopharyngeal subnetwork could enable the
integration of tactile information in the oral cavity and proprioception of the jaw for
initiation, maintenance, or termination of rhythmic jaw movements throughout the
masticatory period (Yamada et al. , 2005). Heavy connections with somatosensory and
motor areas were also observed in afferent inputs to the rostral part of the barrel field,
which could reflect such processes more centered on somatosensory and motor
information.
Unlike the interactions that occur within the somatic sensorimotor network, the
medial network primarily mediates interactions between the sensory and higher order

97
association areas. The medial network serves to transmit sens ory information from the
primary visual and auditory cortices as weIl as the caudal barrel field to the retrosplenial,
parietal, anterior cingulate, and orbital areas which have been implicated in orientating
and coordinating movements of the eyes, head, and body in object searching tasks and
spatial navigation (Bucci, 2009; Feierstein et al., 2006; Vann et al. , 2009; Weible, 2013).
The projections to the caudal part of the barrel field in our material support the
implication of this area in such a medial network and concretizes its position at the
interface between ascending bottom-up and descending top-down pathways. Our
comparison of the projections indeed shows that the barrel field of SI, particularly the
caudal part, displays different and more abundant cortical and subcortical connections
compared to the rest of SI, by targeting more sensory related cortical areas relevant to
exploration such as the auditory and visual cortex along the perirhinal and ectorhinal
cortex which are implicated in sensory integration and gating (Naber et al., 2000;
Rodgers et al., 2008), as weIl as sorne additional subcortical brain regions, such as the
ventrolateral nucleus of the thalamus which modulates nociceptive processes (Blomqvist
et al., 1992; Craig, Jr. and Burton, 1981; Miletic and Coffield, 1989). This suggests that
somatosensory processing in whisker representations of SI could be directly influenced
by other sensory information.

98
Multimodality of primary sensory cortices
In traditional models of sensory cortex organization, sens ory information processing
for each modality is initially segregated in modality-specific sensory areas before
subsequent integration in higher-order association areas. This organizational scheme has
been challenged by the demonstration of multimodal responses in primary sensory
cortices (Driver and Noesselt, 2008; Ghazanfar et al. , 2005). Indeed, our data suggests
that somatosensory processing in whisker representations of S 1 is directly influenced by
other sensory information. In particular, the caudal part of the barrel field of S 1 receives
afferents from more sensory related cortical areas dedicated to other modalities
compared to the rest of S 1.
Other studies on corticocortical connectivity in rodents show that the primary visual
cortex of the mouse receives direct inputs from somatosensory, auditory, olfactory as
well as multisensory and associative cortical areas such as the RSD, RSG, Cg, M, PtA,
TeA, Ect, Ent, PRh, Cl, IC and OC (Charbonneau et al. , 2012), and that the primary
auditory cortex of the gerbil also receives direct inputs from somatosensory, visual,
olfactory, multisensory and associative areas (Budinger et al. , 2009). Moreover, the
existence of direct and reciprocal connections has been demonstrated among the primary
sensory cortices (Budinger et al. , 2006; Campi et al., 2010; Charbonneau et al. , 2012;
Laramée et al., 2013; Larsen et al., 2009; Sieben et al. , 2013; Wang and Burkhalter,
2007;). As in the present study, retrogradely labeled neurons were quantified following
injections ofCTb in the primary visual cortex of the mouse (Charbonneau et al. , 2012).

99
It appears that 6.57% of the labeled cell bodies providing inputs to VI come from
somatosensory areas and 28.47% of them come from auditory areas. Retrogradely
labeled cell bodies were also quantified following tracer injections in the primary
auditory cortex of the gerbil (Budinger and Scheich, 2009). It appears that only 0.5% of
the labeled cell bodies providing inputs to Al come from somatosensory areas and 1.7%
ofthem come from visual areas. Our data indicates that 9.4% of the inputs to the caudal
part of the barrel field come from auditory areas and 10.97% of them come from visual
areas. This part of the primary somatosensory cortex would benefit the most from
heteromodal connections and be the most multimodal part of the primary somatosensory
cortex. Similarly, the caudal-most barrel field is part of the medial network built from
the Mep data (Zingg et al., 2014), which also shares connections with many sensory
related cortical areas dedicated to other modalities.
These results suggest that in rodents, the highest input ratio for "non-preferred"
modalities is for VI. This suggests that the visual modality in rodents would benefit the
most from heteromodal connections and be the most multimodal of the primary sensory
cortices. On the other hand, Al receives only fain~ inputs from the other primary sens ory
cortices (Budinger and Scheich, 2009; Henschke et al. , 2014). These observations
suggest that the mutual influences between the senses are not equivalent in strength. The
influence of the auditory areas on the visual cortex would be the stronger one.
100
Possible functions of non-somatosensory sensory and multisensory inputs to SI
The functional role of integration of non-somatosensory sensory and multisensory
infonnation at early somatosensory cortical stage has been demonstrated in previous
studies. Studies in humans demonstrated how vision influences somatosensory
perception. Visually modulated improvement of tactile perception is known as the visual
enhancement of touch (Cardini et al., 2011; Kennett et al., 2001; Serino et al., 2007,
2009; Taylor-Clarke et al., 2004; Tipper et al., 1998). Vision can also modulate pain
perception (Longo et al., 2009). Moreover binding of visual and tactile infonnation is
important in the sensory representation of the peripersonal space (Rizzolatti et al.,
1981a, 1981b). A study has shown that congruent haptic stimulation can improve
perfonnance on a simple visual grating detection task compared to incongruent haptic
stimulation (van der Groen et al., 2013). Visual infonnation adds to the perception of
surface texture and indicates a crossmodal interaction of sensory infonnation a1ready at
an early cortical processing stage (Eck et al., 2013). Visual infonnation exerts
substantial influences on torque perception even when participants know that visual
infonnation is unreliable (XU et al., 2012).
Object manipulation produces characteristic sounds and causes specific haptic
sensations that facilitate the recognition ofthe manipulated object (Kassuba et al., 2013).
Combining infonnation across the sensory modalities improves sensory perfonnance,
for example, by decreasing reaction times (Hoefer et al.; 2013; MolhoIm et al., 2002;
Noesselt et al., 2010; Teder-Salejarvi et al., 2002), which in turn can be crucial for the
101
survival of the individual. Our results suggest that there are indeed direct connections
between SI and both Au and VI and that the fastest, and thus most efficient, way to
convey information about SI and both modalities could be such connections (Bizley and
King, 2008; Bizley, Nodal, Bajo, Nelken, & King, 2007; Wallace et al., 2004). Likewise,
audiotactile (Hoefer et al., 2013) and visuotactile information (Macaluso, 2006) can be
rapidly processed in the respective crossmodal networks.
Top-down cortical projections and conscious sensory perception in SI
The three parts of SI receive afferent projections from several associative areas of
higher order, such as the parietal and temporal association cortices, agranular and
dysgranular retrosplenial cortices, and the ectorhinal, perirhinal, orbital and insular
cortices. Moreover, the laminar distribution of labeled neurons suggests that SI in mice
receives feedback-type projections from these areas. These projections have different
structures and could also have different functions since the layer indices, although on the
whole negative, were different in degree. These projections could modulate information
in SI (Bullier, 2001b), so that bottom-up signals become consciously perceptible
(Tononi and Koch, 2008). Indeed, SI would have a key role in predictive coding, which
is the matching process of the nervous system between the sensory information
conveyed by the bottom-up signals and the expectations towards the environment
generated by the top-down signals (Grossberg, 1980; Lee and Mumford, 2003; Llinas
and Pare, 1991).

102
The top-down projections not only serve to modulate the bottom-up signaIs, they are
capable of constructing a conscious sensory perception in the prirnary sens ory cortices
even in the absence of external stimuli from the sensory organs of their respective
modalities (Meyer, 2011). Top-down projections to VI (Charbonneau et al., 2012) and
Al (Budinger et al., 2006, 2008; Budinger and Scheich, 2009) are also present and very
diverse in rodents. These studies along with our results therefore support a model where
top-down connections are necessary for conscious sens ory perception and where the
prirnary sensory cortices are at the top of an inverted cortical hierarchy (Lamme and
Roelfsema, 2000).
Top-down influences in cortical circuits are not homogeneous in function. In the
visual system top-down influences can sharpen tuning, provide contextual information,
and modulate plasticity, etc (see Gilbert and Sigman, 2007 for review). The present
study more specifically emphasises the structural diversity of top-down influences on the
somatosensory cortex subfields. The layer indices calculated here demonstrate that top
down influences were provided by projections with mainly negative values. This
indicates that these projections are provided by more neurons in infragranular than
supragranular layers. The layer indices range however between values close to 0 and -1,
and are therefore not homogeneous. This diversity of size indices of top-down
projections to the somatosensory cortex was greater than those to the visual cortex of the
mouse (Charbonneau et al., 2012) and in the auditory cortex of the gerbil (Budinger et
al., 2008). Only a few layer indices are given for the mouse afferents to the visual cortex

103
but they were mostly quite strongly negative, as for those shown for the gerbil cortical
afferents of the auditory cortex.
The most striking differences in layer index values are between the auditory and
visual projections to the caudal barrel field. Indeed, the layer index of the auditory
cortex is strongly negative whereas that of the visual cortices VI and V2M were close to
O. Although negative layer indices seem to be most prevalent in cortical afferent
projections to somatosensory, visual and auditory cortices in these rodents, the
interconnections between them appear quite different. Lateral type projections with layer
indices close to 0 were found here from the projections from the visual cortex and this
was also the case in the gerbil (Henschke et al., 2014). This contrasts further with the
positive layer index reported in the projections from the visual cortex to the auditory
cortex of the gerbil (Henschke et al. , 2014).
There are significant functional differencesbetween supra- and infragranular
cortical connections. Electrophysiological studies have shown that gamma band
oscillations are more prevalent in supragranular neurons (Bollimunta et al. , 2011 ;
Buffalo et al., 2011; Xing et al. , 2012), whereas beta-band oscillations are more
important in infragranular neurons (Buffalo et al. , 2011 ; Xing et al. , 2012). It has been
suggested that feedback cortical projections might promote beta synchronization
between cortical areas and that feedforward projections could promote gamma band
interareal synchronizations (Markov et al. , 2014). Further studies demonstrated that
104
feedforward processing in the vi suai system increased activity in the gamma band and
that feedback processing increased activity in the theta and beta frequencies (Bastos et
al., 2015; Michalareas et al., 2016; van Kerkoerle et al., 2014). Moreover there is a
significant correlation between anatomically determined indices of neuron distributions
in corticallayers, and beta/gamma band activity in feedback and feedforward projections
in monkeys (Bastos et al., 2015).
The predominant negative values in the cortical afferent projections to the
somatosensory cortex of the mouse shown here suggest that top-down influences act
most importantly in the beta range oscillations. However we can hypothesize that the is a
range in the intensity of synchronization in the beta and gamma frequencies exerted by
namely visual and auditory cortices upon the caudal barrel field and also coming from
the contralateral cortices in which a wider range of layer indices values were found.
We show here that the strength of corticocortical connections of the somatosensory
decreases with distance from the injection sites in all three subfields of the
somatosensory cortex of the mouse. This demonstrates that the interareal connectivity
rules demonstrated for the monkey cortex (Ercsey-Ravasz et al., 2013) might also apply
to mouse. This also suggest that the mouse cortex interareal connections also develops
under the same constraint ofwire minimization (Cherniak, 1994, 2012; Cherniak et al.,
1999,2004; Chklovskii, 2000; Chklovskii and Koulakov, 2004; Chklovskii et al., 2002;

105
Klyachko and Stevens, 2003 ; Koulakov and Chklovskii, 2001 ; Mitchison, 1991)
notwithstanding it small brain size.
Top-down and multisensory thalamocortical connections to SI
Subcortical projections can also provide important top-down recurrent inputs.
Indeed, cortical connectivity also takes place through higher order thalamic nuclei such
as the pulvinar through which cortico-thalamo-cortical loops are established (Saalmann
et al. , 2012; Sherman, 2005; Sherman and Guillery, 2002, 2011 ; Theyel et al. , 2010).
The Po is such a higher order thalamic nucleus of the somatosensory system in the
mouse (Bourassa et al. , 1995; Diamond et al. , 1992; Hoogland et al. , 1987; Sherman and
Guillery, 2006). The Po projections to the rostral and caudal barrel field were much
stronger than to the non-barrel field somatosensory cortex. This could indicate that the
barrel field might require more abundant indirect cortical information than the cortical
representations of the rest of the body. The barrel field also receives more abundant
projections from cortices dedicated to other sensory modalities and association cortices.
We also show here that the somatosensory cortex receives projections from both the
Po and the visual higher-order thalamic lateral posterior nucleus which contrasts with
the visual cortex that receives projections from the LP only (Charbonneau et al. , 2012).
The visual LP in the mouse has been shown to provide contextual information on the
speed oflocomotion to the visual cortex (Roth et al. , 2016). This information would be

106
also conveyed to the somatosensory cortex and could be useful contextual information in
whisking behavior.
Among the nuclei of the ventral thalamic group, VL sends a good number of
projections to SIBF. It is weIl established that VL provides somatotopic motor
information to the motor cortex (Schmahmann, 2003; Strick, 1973; Tlamsa and
Brumberg, 2010), however, there is a small number ofneurons in VL that projects to SI
(Donoghue and Parham, 1983; Spreafico et al., 1981). As we show here, this projection
could target specifically SIBF. VL could be part of anatomical motor loops for eye blink
conditioning (Sears et al., 1996), eye positioning (Wemer-Reiss et al. , 2003), and
sensory motor task performance (Brosch et al., 2005).
LD is a nucleus with major projections to the visual cortex (Towns et al., 1982; van
der Groen T. and Wyss, 1992), which in addition to its visual connections, contains
neurons projecting to the caudal part ofthe barrel field in our study on the mouse as weIl
as the rat (Kamishina et al., 2009) and the gerbil (Henschke et al., 2014). These could
represent the fraction of LD neurons that already respond to somatosensory stimulation
(Bezdudnaya and Keller, 2008). Altematively, they may transmit visual information to
the somatosensory cortex (Shires et al., 2013; van der Groen T. and Wyss, 1992) or
could be involved in rapid spatial processing of multisensory information for tuming
behavior (Fabre-Thorpe et al., 1986).

107
Altogether, the mystacial caudal barrel field stands out from the rest of the primary
somatosensory cortex by having more connections with cortical and subcortical visual
structures such as VI and LD. These projections could be the anatomical substrate of the
influence of vision on the vibrissae tactile sensations and navigation in mice. The
interaction of the vibrissae with vision could be important in the representation of the
peripersonal space (Rizzolatti et al., 1981a, 1981b), and which is specifically centered
on the vibrissae in mice (Cardinali et al., 2009).
Conclusions
In conclusion, this study demonstrates the multitude and diversity of top-down and
heteromodal cortical and subcortical projections to SI. This study conftrms the
hypothesis that differences exist between the projections of the mystacial caudal barrel
field, more rostral barrel field and somatosensory cortex outside the barrel field. SI and
the barrel field have afferent connections with somatosensory areas, non-somatosensory
primary sensory areas, multisensory, motor, associative, and neuromodulatory areas but
the caudal part of the barrel field displays different and more abundant cortical and
subcortical connections compared to the rest of SI . Indeed, when compared to the
networks built from the Mouse Connectome Project data, a more caudal area such as the
mystacial barrel field is a major component of the medial network which mediates
transduction of information between the primary sensory areas and higher order ·
association areas of the neocortex compared to the more rostral areas whose processes
are more centered on somatosensory and motor information in the somatic sensorimotor

108
network. The projections to SI are mostly of a feedback nature, but would still have a
different structure since the laminar indices, albeit negative overall, were of varying
degrees. In the case of the primary sensory cortices, the auditory projections would be of
feedback nature whereas the visual projections towards the caudal part of the barrel field
would be of lateral nature, demonstrating that the different primary sensory cortices do
not occupy the same position in the cortical hierarchy. Along the previous studies on VI
and Al in the mouse, this study demonstrates that associative and multisensory
projections are present in all primary sensory cortices of the mouse and that these areas
are not only dedicated to the processing of information oftheir own sensory modality.
Acknowledgements We are grateful to Nadia Desnoyers for animal care and maintenance. This work was supported by discovery grants from the Natural Sciences and Engineering Research Council of Canada (NSERC) to DB and GB, and the Canadian Foundation for Innovation to DB. SBG was supported by a Réseau de Recherche en Santé de la Vision (RRSV) undergraduate student award.

109
References
Bastos AM, Vezoli J, Bosman CA, Schoffelen JM, Oostenveld R, Dowdall JR, De WP, Kennedy H, Fries P. 2015. Visual areas exert feedforward and feedback influences through distinct frequency channels. Neuron 85:390-401.
Berezovskii VK, Nassi JJ, Born RT. 2011. Segregation of feedforward and feedback projections in mouse visual cortex. J Comp NeuroI519:3672-3683.
Bezdudnaya T, Keller A. 2008. Laterodorsal nucleus of the thalamus: A processor of somatosensory inputs. J Comp NeuroI507:1979-1989.
Bizley JK, King AJ. 2008. Visual-auditory spatial processing ID auditory cortical neurons. Brain Res 1242:24-36.
Bizley JK, Nodal FR, Bajo VM, Nelken l, King AJ. 2007. Physiological and anatomical evidence for multisensory interactions in auditory cortex. Cereb Cortex 17:2172-2189.
Blomqvist A, Ericson AC, Broman J, Craig AD. 1992. Electron microscopic identification of lamina 1 axon terminations in the nucleus submedius of the cat thalamus. Brain Res 585:425-430.
Bollimunta A, Mo J, Schroeder CE, Ding M. 2011. Neuronal mechanisms and attentional modulation of corticothalamic alpha oscillations. J Neurosci 31 :4935-4943.
Bourassa J, Pinault D, Deschenes M. 1995. Corticothalamic projections from the cortical barrel field to the somatosensory thalamus in rats: A single-fibre study using biocytin as an anterograde tracer. Eur J Neurosci 7:19-30.
Brosch M, Selezneva E, Scheich H. 2005. Nonauditory events of a behavioral procedure activate auditory cortex ofhighly trained monkeys. J Neurosci 25:6797-6806.
Bucci DJ. 2009. Posterior parietal cortex: An interface between attention and learning? Neurobiol LeamMem 91:114-120.
Budinger E, Heil P, Hess A, Scheich H. 2006. Multisensory processing via early cortical stages: Connections of the primary auditory cortical field with other sens ory systems. Nsci 143:1065-1083.

110
Budinger E, Laszcz A, Lison H, Scheich H, Ohl FW. 2008. Non-sensory cortical and subcortical connections of the primary auditory cortex in Mongolian gerbils: Bottom-up and top-down processing of neuronal information via field AI. Brain Res 1220:2-32.
Budinger E, Scheich H. 2009. Anatomical connections suitable for the direct processing of neuronal information of different modalities via the rodent primary auditory cortex. Hear Res 258:16-27.
Buffalo EA, Fries P, Landman R, Buschman TJ, Desimone R. 2011. Laminar differences in gamma and alpha coherence in the ventral stream. Proc N atl Acad Sci USA 108:11262-11267.
Bullier J. 2001a. Feedback connections and conscious vision. Trends Cogn Sci 5:369-370.
Bullier J. 2001b. Integrated model ofvisual processing. Brain Res Brain Res Rev 36:96-107.
Campi KL, Bales KL, Grunewald R, Krubitzer L. 2010. Connections of auditory and visual cortex in the prairie vole (Microtus ochrogaster): Evidence for multisensory processing in primary sens ory areas. Cereb Cortex 20:89-108.
Cardinali L, Brozzoli C, Fame A. 2009. Peripersonal space and body schema: Two labels for the same concept? Brain Topogr 21:252-260.
Cardini F, Longo MR, Haggard P. 2011. Vision of the body modulates somatosensory intracortical inhibition. Cereb Cortex 21 :2014-2022.
Carleton A, AccoUa R, Simon SA. 2010. Coding in the mammalian gustatory system. Trends Neurosci 33:326-334.
Caviness VS. 1975. Architectonic map of neocortex of the normal mouse. J Comp NeuroI164:247-263.
Charbonneau V, Laramée ME, Boucher V, Bronchti G, Boire D. 2012. Cortical and subcortical projections to primary visual cortex in anophthalmic, enucleated and sighted mice. Eur J Neurosci 36:2949-2963.
Cherniak C. 1994. Component placement optimization in the brain. J Neurosci 14:2418-2427.
Cherniak C. 2012. Neural wiring optimization. Prog Brain Res 195:361-371.

111
Cherniak C, Changizi M, Kang D. 1999. Large-scale optimization of neuron arbors. Phys Rev E Stat Phys Plasmas Fluids Relat Interdiscip Topics 59:6001-6009.
Cherniak C, Mokhtarzada Z, Rodriguez-Esteban R, Changizi K. 2004. Global optimization of cerebral cortex layout. Proc N atl Acad Sci USA 101: 1 081-1 086.
Chklovskii DB. 2000. Optimal sizes of dendritic and axonal arbors in a topographic projection. J Neurophysiol 83:2113-2119.
Chklovskii DB, Koulakov AA. 2004. Maps in the brain: What can we learn from them? Annu Rev Neurosci 27:369-392.
Chklovskii DB, Schikorski T, Stevens CF. 2002. Wiring optimization in cortical circuits. Neuron 34:341-347.
Coogan TA, Burkhalter A. 1990. Conserved patterns of cortico-cortical connections defme areal hierarchy in rat visual cortex. Exp Brain Res 80:49-53.
Coogan TA, Burkhalter A. 1993. Hierarchical organization of areas in rat visual cortex. J Neurosci 13:3749-3772.
Craig AD, Jr., Burton H. 1981. Spinal and medullary lamina 1 projection to nucleus submedius in medial thalamus: A possible pain center. J NeurophysioI45:443-466.
Diamond ME, Armstrong-James M, Budway MJ, Ebner FF. 1992. Somatic sensory responses in the rostral sector of the posterior group (POm) and in the ventral posterior medial nucleus (VPM) of the rat thalamus: Dependence on the barrel field cortex. J Comp NeuroI319:66-84.
Dong H, Shao Z, Nerbonne JM, Burkhalter A. 2004. DifferentiaI depression of inhibitory synaptic responses in feedforward and feedback circuits between different areas ofmouse visual cortex. J Comp NeuroI475:361-373.
Donoghue JP, Parham C. 1983. Afferent connections of the lateral agranular field of the rat motor cortex. J Comp NeuroI217:390-404.
Driver J, Noesselt T. 2008. Multisensory interplay reveals crossmodal influences on 'sensory-specific' brain regions, neural responses, andjudgments. Neuron 57:11-23.
Eck J, Kaas AL, Goebel R. 2013. Crossmodal interactions of haptic and visual texture information in early sensory cortex. Neuroimage 75:123-135. .

112
Ercsey-Ravasz M, Markov NT, Lamy C, Van Essen DC, Knoblauch K, Toroczkai Z, Kennedy H. 2013. A predictive network model of cerebral cortical connectivity based on a distance rule. Neuron 80:184-197.
Fabre-Thorpe M, Vievard A, Buser P. 1986. Role of the extra-geniculate pathway in visual guidance. II. Effects of lesioning the pulvinar-Iateral posterior thalamic complex in the cat. Exp Brain Res 62:596-606.
Feierstein CE, Quirk MC, Uchida N, Sosulski DL, Mainen ZF. 2006. Representation of spatial goals in rat orbitofrontal cortex. Neuron 51 :495-507.
FeUeman Dl, Van Essen De. 1991. Distributed hierarchical processing in the primate cerebral cortex. Cereb Cortex 1: 1-47.
Franklin Bl, Paxinos G. 2008. The Mouse Brain in Stereotaxic Coordinates. San Diego: Academic Press.
Ghazanfar AA, Maier JX, Hoffman KL, Logothetis NK. 2005. Multisensory integration of dynamic faces and voices in rhesus monkey auditory cortex. 1 Neurosci 25:5004-5012.
Gilbert CD, Li W. 2013. Top-down influences on visual processing. Nat Rev Neurosci 14:350-363.
Gilbert CD, Sigman M. 2007. Brain states: Top-down influences in sensory processing. Neuron 54:677-696.
Godement P, SaiUour P, Imbert M. 1979. Thalamic afferents to the visual cortex in congenitally anophthalmic mice. Neurosci Lett 13:271-278.
Grossberg S. 1980. How does a brain build a cognitive code? Psychol Rev 87:1-51.
Gutschalk A, Micheyl C, Oxenham Al. 2008. Neural correlates of auditory perceptual awareness under informational masking. PLoS Biol 6: 1-10.
Henschke lU, Noesselt T, Scheich H, Budinger E. 2014. Possible anatomical pathways for short-Iatency multisensory integration processes in primary sensory cortices. Brain Struct Funct 10:1007-1030.
Hoefer M, TyU S, Kanowski M, Brosch M, Schoenfeld MA, Heinze Hl, Noesselt T. 2013. Tactile stimulation and hemispheric asymmetries modulate auditory perception and neural responses in primary auditory cortex. Neuroimage 79:371-382.

113
Hoogland PV, Welker E, Van der Loos H. 1987. Organization of the projections from barrel cortex to thalamus in mice studied with Phaseolus vulgaris-Ieucoagglutinin and HRP. Exp Brain Res 68:73-87.
Hudetz AG, Vizuete JA, Imas OA. 2009. Desflurane selectively suppresses long-Iatency cortical neuronal response to flash in the rat. Anesthesiology 111 :231-239.
Ho M, Gilbert CD. 1999. Attention modulates contextual influences in the primary visual cortex of alert monkeys. Neuron 22:593-604.
Jiang J, Summerfield C, Egner T. 2013. Attention sharpens the distinction between expected and unexpected percepts in the visual brain. J Neurosci 33:18438-18447.
Kamishina H, Conte WL, Patel SS, Tai RJ, Corwin N, Reep RL. 2009. Cortical . connections of the rat lateral posterior thalamic nucleus. Brain Res 1264:39-56.
Kassuba T, Menz MM, Roder B, Siebner HR. 2013. Multisensory interactions between auditory and haptic object recognition. Cereb Cortex 23: 1 097 -1107.
Kennett S, Taylor-Clarke M, Haggard P. 2001. Noninformative vision improves the spatial resolution of touch in hurnans. Curr Biol Il: 1188-1191.
Klyachko V A, Stevens CF. 2003. Connectivity optimization and the positioning of cortical areas. Proc Natl Acad Sci USA 100:7937-7941.
Koulakov AA, Chklovskii DB. 2001. Orientation preference patterns in mammalian visual cortex: A wire length minimization approach. Neuron 29:519-527.
Lamme VA, Roelfsema PR. 2000. The distinct modes of vision offered by feedforward and recurrent processing. Trends Neurosci 23:571-579.
Laramée ME, Rockland KS, Prince S, Bronchti G, Boire D. 2013. Principal component and cluster analysis of layer V pyramidal cells in visual and non-visual cortical areas projecting to the primary visual cortex of the mouse. Cereb Cortex 23:714-728.
Larsen DD, Luu ID, Burns ME, Krubitzer L. 2009. What are the Effects of Severe Visual Impairment on the Cortical Organization and Connectivity of Primary Visual Cortex? Front Neuroanat 3:1-16.
Lee TS, Murnford D. 2003. Hierarchical Bayesian inference in the visual cortex. J Opt Soc Am A Opt Image Sci Vis 20:1434-1448.
Llinas RR, Pare D. 1991. Ofdreaming and wakefulness. Neuroscience 44:521-535.

114
Longo MR, Betti V, Aglioti SM, Haggard P. 2009. Visually induced analgesia: Seeing the body reduces pain. J N eurosci 29: 12125 -1213 O.
Macaluso E. 2006. Multisensory processing in sensory-specific cortical areas. Neuroscientist 12:327-338.
Maffei A, Haley M, Fontanini A. 2012. Neural processing of gustatory infonnation in insular circuits. Curr Opin Neurobiol 22:709-716.
Makino H, Komiyama T. 2015. Learning enhances the relative impact of top-down processing in the visual cortex. Nat Neurosci 18:1116-1122.
Markov NT, Vezoli J, Chameau P, Falchier A, Quilodran R, Huissoud C, Lamy C, Misery P, Giroud P, UlIman S, Barone P, Dehay C, Knoblauch K, Kennedy H. 2014. Anatomy of hierarchy: Feedforward and feedback pathways in macaque visual cortex. J Comp Neuro1522:225-259.
McManus JN, Li W, Gilbert CD. 2011. Adaptive shape processing in primary visual cortex. Proc Natl Acad Sei USA 108:9739-9746.
Meador KJ, Ray PG, Echauz JR, Loring DW, Vachtsevanos GJ. 2002. Gamma coherence and conscious perception. Neurology 59:847-854.
Meyer K. 2011. Primary sensory cortices, top-down projections and conseious experience. Prog Neurobio194:408-417.
Michalareas G, Vezoli J, van PS, Schoffelen JM, Kennedy H, Fries P. 2016. Alpha-Beta and Gamma Rhythms Subserve Feedback and Feedforward Influences among Human Visual Cortical Areas. Neuron: 89:384-397.
Miletic V, Coffield JA. 1989. Responses of neurons in the rat nucleus submedius to noxious and innocuous mechanical cutaneous stimulation. Somatosens Mot Res 6:567-587.
Miller MW, Vogt BA. 1984. Direct connections ofrat visual cortex with sensory, motor, and association cortices. J Comp Neurol: 226: 184-202.
Mitchison G. 1991. Neuronal branching patterns and the economy of cortical wiring. Proc Biol Sci 245:151-158.
MolhoIm S, Ritter W, Murray MM, Javitt DC, Schroeder CE, Foxe JJ. 2002. Multisensory auditory-visual interactions during early sensory processing in humans: A high-density electrical mapping study. Brain Res Cogn Brain Res 14:115-128.

115
Moore C, Cavanagh P. 1998. Recovery of 3D volume from 2-tone images of novel objects. Cognition 67:45-71.
Mumford D. 1992. On the computational architecture of the neocortex. II. The role of cortico-corticalloops. Biol Cybem 66:241-251.
Naber PA, Witter MP, Lopes da Silva FH. 2000. Differential distribution of barrel or visual cortex. Evoked responses along the rostro-caudal axis of the peri- and postrhinal cortices. Brain Res 877:298-305.
Noesselt T, Tyll S, Boehler CN, Budinger E, Heinze HJ, Driver J. 2010. Sound-induced enhancement of low-intensity vision: Multisensory influences on human sensoryspecific cortices and thalamic bodies relate to perceptual enhancement of visual detection sensitivity. J Neurosci 30: 13609-13623.
Papema T, Malach R. 1991. Patterns of sensory intermodality relationships in the cerebral cortex of the rat. J Comp Neurol: 308:432-456.
Rao RP, Ballard DH. 1999. Predictive coding in the visual cortex: A functional interpretation of sorne extra-classical receptive-field effects. Nat Neurosci 2:79-87.
Rizzolatti G, Scandolara C, Matelli M, Gentilucci M. 1981a. Afferent properties of periarcuate neurons in macaque monkeys. 1. Somatosensory responses. Behav Brain Res 2:125-146.
Rizzolatti G, Scandolara C, Matelli M, Gentilucci M. 1981b. Afferent properties of periarcuate neurons in macaque monkeys. II. Visual responses. Behav Brain Res 2:147-163.
Rockland KS, Pandya DN. 1979. Laminar ongms and terminations of cortical connections of the occipital lobe in the rhesus monkey. Brain Res 179:3-20.
Rodgers KM, Benison AM, Klein A, Barth DS. 2008. Auditory, somatosensory, and multisensory insular cortex in the rat. Cereb Cortex 18:2941-2951.
Roelfsema PR, Lamme VA, Spekreijse H. 1998. Object-based attention in the primary visual cortex of the macaque monkey. Nature 395:376-381.
Roth MM, Dahmen JC, Muir DR, ImhofF, Martini FJ, Hofer SB. 2016. Thalamic nuclei convey diverse contextual information to layer 1 of visual cortex. Nat Neurosci 19:299-307.

116
Saa1mann YB, Pinsk MA, Wang L, Li X, Kastner S. 2012. The pulvinar regulates information transmission between cortical areas based on attention demands. Science 337:753-756.
Schmahmann ID. 2003. Vascular syndromes of the thalamus. Stroke 34:2264-2278.
Sears LL, Logue SF, Steinmetz JE. 1996. Involvement of the ventrolateral thalamic nucleus in rabbit classical eyeblink conditioning. Behav Brain Res 74:105-117.
Serino A, Fame A, Rinaldesi ML, Haggard P, Ladavas E. 2007. Can vision of the body ameliorate impaired somatosensory function? Neuropsychologia 45 :1101-1107.
Serino A, Padiglioni S, Haggard P, Ladavas E. 2009. Seeing the hand boosts feeling on the cheek. Cortex 45:602-609.
Sherman SM. 2005. Thalamic relays and cortical functioning. Prog Brain Res 149:107-126.
Sherman SM, Guillery RW. 2002. The role of the thalamus in the flow of information to the cortex. Philos Trans R Soc Lond B Biol Sci 357:1695-1708.
Sherman SM, Guillery RW. 2006. Exploring the thalamus and its role in cortical function. 2 ed. Cambridge, Mass.: MIT Press.
Sherman SM, Guillery R W. 20 Il. Distinct functions for direct and transthalamic corticocortical connections. J Neurophysiol 106: 1 068-1 077.
Shires KL, Hawthorne JP, Hope AM, Dudchenko PA, Wood ER, Martin SJ. 2013. Functional connectivity between the thalamus and postsubiculum: Analysis of evoked responses elicited by stimulation of the laterodorsal thalamic nucleus in anesthetized rats. Hippocampus 23:559-569.
Sieben K, Roder B, Hanganu-Opatz IL. 2013 . Oscillatory entrainment of prÎmary somatosensory cortex encodes visual control of tactile processing. J Neurosci 33:5736-5749.
Sillito AM, Cudeiro J, Jones HE. 2006. Always returning: Feedback and sensory processing in visual cortex and thalamus. Trends Neurosci 29:307-316.
Spreafico R, Hayes NL, Rustioni A. 1981. Thalamic projections to the prÎmary and secondary somatosensory cortices in cat: Single and double retrograde tracer studies. J Comp NeuroI203:67-90.

117
Strick PL. 1973. Light microscopic analysis of the cortical projection of the thalamic ventrolateral nucleus in the cat. Brain Res 55:1-24.
Summerfield C, de Lange FP. 2014. Expectation in perceptual decision making: Neural and computational mechanisms. Nat Rev Neurosci 15:745-756.
Summerfield C, Egner T. 2009. Expectation (and attention) in visual cognition. Trends Cogn Sei 13:403-409.
Super H, Spekreijse H, Lamme VA. 2001. Two distinct modes of sensory processing observed in monkey primary visual cortex (VI). Nat Neurosci 4:304-310.
Taylor-Clarke M, Kennett S, Haggard P. 2004. Persistence ofvisual-tactile enhancement in humans. Neurosci Lett 354:22-25.
Teder-Salejarvi WA, McDonald JJ, Di RF, Hillyard SA. 2002. An analysis of audiovisual crossmodal integration by means of event-related potential (ERP) recordings. Brain Res Cogn Brain Res 14: 106-114.
Teufel C, Nanay B. 2016. How to (and how not to) think about top-down influences on visual perception. Conseious Cogn.
Theyel BB, Llano DA, Sherman SM. 2010. The corticothalamocortical circuit drives higher-order cortex in the mouse. Nat Neurosci 13:84-88.
Tipper SP, Lloyd D, Shorland B, Dancer C, Howard LA, McGlone F. 1998. Vision influences tactile perception without proprioceptive orienting. Neuroreport 9: 1741-1744.
Tlamsa AP, Brumberg JC. 2010. Organization and morphology of thalamocortical neurons ofmouse ventrallateral thalamus. Somatosens Mot Res 27:34-43.
Tononi G, Koch C. 2008. The neural correlates of consciousness: An update. Ann N Y Acad Sci 1124:239-261.
Towns LC, Burton SL, Kimberly CJ, Fetterman MR. 1982. Projections of the dorsal lateral geniculate and lateral posterior nuclei to visual cortex in the rabbit. J Comp NeuroI210:87-98.
van der Groen 0, van der Burg E, Lunghi C, Alais D. 2013. Touch influences visual perception with a tight orientation-tuning. PLoS One 8:1-9.
van der Groen T., Wyss JM. 1992. Projections from the laterodorsal nucleus of the thalamus to the limbic and visual cortices in the rat. J Comp NeuroI324:427-448.

118
van Kerkoerle T, Self MW, Dagnino B, Gariel-Mathis MA, Poort J, van der Togt C, Roelfsema PR. 2014. Alpha and gamma oscillations characterize feedback and feedforward processing in monkey visual cortex. Proc Nat! Acad Sci USA 111:14332-14341.
Vann SD, Aggleton JP, Maguire EA. 2009. What does the retrosplenial cortex do? Nat Rev Neurosci 10:792-802.
Wallace M.T., Ramachandran R. Stein, B.E. 2004. A revised view of sensory cortical parcellation. Proc.Natl.Acad.Sci.U.S.A 101:2167-2172.
Wang Q, Burkhalter A. 2007. Area map of mouse visual cortex. J Comp Neurol 502:339-357.
Weible AP. 2013 . Remembering to attend: The anterior cingulate cortex and remote memory. Behav Brain Res 245:63-75.
Wemer-Reiss U, Kelly KA, Trause AS, Underhill AM, Groh JM. 2003 . Eye position affects activity in primary auditory cortex ofprimates. CUIT Biol 13:554-562.
Xing D, Yeh CI, Burns S, Shapley RM. 2012. Laminar analysis of visually evoked activity in the primary visual cortex. Proc Nat! Acad Sci USA 109:13871-13876.
Xu Y, Q'Keefe S, Suzuki S, Franconeri SL. 2012. Visual influence on haptic torque perception. Perception 41 :862-870.
Yamada Y, Yamamura K, Inoue M. 2005. Coordination of cranial motoneurons during mastication. Respir Physiol NeurobioI147:177-189.
Yamashita A, Valkova K, Gonchar Y, Burkhalter A. 2003 . Rearrangement of synaptic connections with inhibitory neurons in developing mouse visual cortex. J Comp NeuroI464:426-437.
Zakiewicz lM, Bjaalie JG, Leergaard TB. 2014. Brain-wide map of efferent projections from rat barrel cortex. Front Neuroinform 8:1-15.
Zhang S, Xu M, Kamigaki T, Hoang Do JP, Chang WC, Jenvay S, Miyamichi K, Luo L, Dan Y. 2014. Selective attention. Long-range and local circuits for top-down modulation ofvisual cortex processing. Science 345:660-665.
Zingg B, Hintiryan H, Gou L, Song MY, Bay M, Bienkowski MS, Foster NN, Yamashita S, Bowman l, Toga AW, Dong HW. 2014. Neural networks of the mouse neocortex. Cell156: 1 096-1111.

Chapitre II Asymmetric direct reciprocal connections between prirnary visual and somatosensory
cortices of the mouse1
Le contenu de ce chapitre est présenté sous forme de manuscrit qui a été publié durant l'été 2016 dans la revue Cerebral Cortex: Massé, 1.0., Ross, S., Bronchti, G. et Boire, D.

Title: Asymmetric direct reciprocal connections between pnmary visual and
somatosensory cortices of the mouse.
Authors: Ian O. Massé, Stéphanie Ross, Gilles Bronchti, Denis Boire
AffIliations:
Département d' anatomie Université du Québec à Trois-Rivières Canada, G9A 2W7

121
Running title: Visuo-tactile cortical connections.
Abstract: Several studies show direct connections between primary sensory cortices
involved in multisensory integration. The purpose of this study is to understand the
microcircuitry of the reciprocal connections between visual and somatosensory cortices.
The laminar distribution of retrogradely labeled cell bodies in VI and in the
somatosensory cortex both in (SIBF) and outside (SI) the barrel field was studied to
provide layer indices in order to determine whether the connections are of feedforward,
feedback or lateral type. Single axons were reconstructed and the size of their swellings
was stereologically sampled. The negative layer indices in SI and SIBF and the layer
index near zero in VI indicate that the connection from SIBF to VI is offeedback type
while the opposite is of lateral type. The greater incidence of larger axonal swellings in
the projection from VI to SIBF strongly suggests that SIBF receives a stronger driver
input from VI and that SIBF inputs to VI have a predominant modulatory influence.
Keywords: cross-modal, corticocortical connections, visuo-haptic interaction,
feedforward, feedback.

122
Introduction
Multisensory integration is important for the fonnation of a coherent percept, to
enhance the salience of biologically meaningful events and for the facilitation of
adaptive behaviors (Ernst and Bulthoff 2004; Stein and Meredith 1993; Stein and
Stanford 2008). Although it is clearly established that multisensory convergence occurs
in higher order temporal, parietal and frontal cortices (Kaas and Collins 2013),
numerous studies in primates, carnivores and rodents demonstrate that early sensory
cortices are also involved in multisensory processing (Bizley and King 2009; Bizley et
al. 2007; Brosch et al. 2005; Cappe and Barone 2005; Clavagnier et al. 2004; Driver and
Noesselt 2008; Falchier et al. 2013; Foxe et al. 2000; Ghazanfar and Schroeder 2006;
Giard and Peronnet 1999; Hishida et al. 2014; Iurilli et al. 2012; Laurienti et al. 2002;
Macaluso 2006; Schroeder et al. 2003; Sieben et al. 2013; Yoshitake et al. 2013).
In contrast to primates (Cappe and Barone 2005; Clavagnier et al. 2004; Falchier et
al. 2002; Rockland and Ojima 2003), there are significant direct connections between
primary sensory cortices in rodents (Budinger et al. 2006; Budinger and Scheich 2009;
Campi et al. 2010; Charbonneau et al. 2012; Henschk:e et al. 2014; Iurilli et al. 2012;
Miller and Vogt 1984; Paperna and Malach 1991 ; Sieben et al. 2013; Stehberg et al.
2014; Wang and Burkhalter 2007; Zingg et al. 2014). The mouse is therefore an
interesting model for the study of multisensory integration at the level of primary
sensory cortices.

123
The hierarchical organization of cortical connectivity has been defmed by
feedforward and feedback pathways (Fellernan and Van Essen 1991; Rockland and
Pandya 1979). Although there are sorne differences in the rnorphological features of
these connections, this classification also seerns to apply to rodents (Berezovskii et aL
2011 ; Coogan and Burkhalter 1990, 1993; Godernent et aL 1979; Gonchar and
Burkhalter 1999; Gonchar and Burkhalter 2003; Yamashita et aL 2003). Although
primary sensory cortices might be expected to be at the same basal level of the cortical
hierarchy and linked by symmetrical reciprocal connections, this is not always the case.
Retrograde tracing studies have shown that the prirnary auditory and sornatosensory
cortices project in a feedback rnanner to the primary visual cortex (Charbonneau et al.
2012; Henschke et aL 2014), the primary visual cortex projects in a feedforward rnanner
to the primary auditory cortex and in a lateral rnanner to the primary sornatosensory
cortex, and the primary auditory and sornatosensory cortices are linked by reciprocal
feedback projections (Henschke et al. 2014). This suggests that primary sensory cortices
might be at different levels of the cortical hierarchy. Moreover these projection patterns
have not been corroborated by the laminar distribution of anterogradely labeled
terminals.
There is evidence for two types of glutamatergic synaptic contacts in corticocortical
connections (Covic and Sherman 2011 ; De Pasquale and Sherman 2011 ; Petrof and
Sherman 2013). Class lB synapses have larger initial excitatory postsynaptic potentials,
exhibit paired-pulse depression, are limited to ionotropic glutamate receptor activation

124
and are anatomically correlated with larger synaptic terminaIs. Class 2 synapses have
smaller initial excitatory postsynaptic potentials, exhibit paired-pulse facilitation, are
limited to metabotropic glutamate receptor activation and are anatomically correlated
with smaller synaptic terminals (see Sherman and Guillery 2013a). Class 1 and 2 are
respectively considered drivers and modulators (Lee and Sherman 2008; Lee and
Sherman 2009a, 2009b; Petrof and Sherman 2013; Reichova and Sherman 2004;
Sherman and Guillery 1996, 1998; Sherman and Guillery 2013a; Viaene et al. 2011).
We might expect that direct connections between primary sensory cortices comprise
mainly Class 2 synapses.
The reciprocal projections between the primary visual cortex and the somatosensory
cortex in mouse will be studied in order to quantify the relative strengths of the
connections with both retro grade and anterograde neuronal tracers. The size and laminar
density ofaxonal swellings will be studied in order to see whether these direct
projections between primary sensory cortices fit in the classification criteria provided by
the distribution of retrogradely labeled neurons and if they present features of driving or
modulatory corticocortical inputs.
Methods
AnimaIs were treated in accordance with the regulations of the Canadian Council
for the Protection of Animals and the study was approved by the Animal Care
committee of the Université du Québec à Trois-Rivières. C57Bl/6J mice (n = 20)

125
(Charles River, Montréal, QC, Canada) from our colonies were used. AlI animaIs were
kept under a lightldark cycle of 14110 hours and were adults when sacrificed.
Tracing procedures
Surgical anesthesia was achieved and maintained with inhalation of 1.5-2.5%
isoflurane and vital signs were monitored throughout the procedures. The animals were
mounted on a stereotaxic apparatus. Mice were protected from ocular dryness by
applying ophthalmic ointment (polysporin; Pfizer, Toronto, ON, Canada). A scalp
incision was made along the midline to expose the sku1l. For injections in the primary
visual cortex (VI), a small craniotomy was performed 3.7 mm caudal and 2.5 mm lateral
to Bregma or, for injections in the barrel field of the primary somatosensory cortex
(S 1BF), 1.5 mm caudal to Bregma and 2.9 mm from the midline. The dura was incised
and a glass micropipette filled with a solution of the b-fragment of cholera toxin (CTh)
or biotinylated dextran amine (BDA) was inserted into the cortex. Retrograde and
anterograde neuronal tracing was achieved with iontophoretic injections of 1 % solution
of CTb and of a 10% solution of high molecular weight BDA (10 kDa) respectively in
phosphate-buffered saline (PBS) (Molecular Probes, Cedarlane Laboratories, Ontario,
Canada) through glass micropipettes (20 J!m tip diameter) into VI for 5 animals and
SlBF for 5 animals for each tracer. A 1.5 J!A. positive CUITent with a 7-s duty cycle was
applied for 10 min, starting at a depth of 500 J!m and ending at 100 J!m from the pial
surface, 2 min at each 100 J!m. The mice were kept warm until they recovered from
anesthesia and postoperative pain was managed with buprenorphine Temgesic,

126
Schering-Plough, Hertfordshire, UK; (i.p.; 0.009 mg/kg) injected before anesthesia was
induced.
After a 2-day survival period following CTb injections and a 7-day survival period
following BDA injections, mice received an intraperitoneal injection of 120 mg/kg
sodium pentobarbital (Euthanyl; Bimeda-MTC, Cambridge, ON, Canada) and were
perfused through the heart with PBS (pH 7.4) followed by phosphate-buffered 4%
paraformaldehyde. Brains were harvested, postfixed for 1-2 hours, cryoprotected with
30% sucrose and frozen prior to sectioning and CTb or BDA processing.
Serial 50-J..1m-thick coronal sections were taken using a freezing microtome. One
series was processed for CTh immunohistochemistry and the other was mounted on
slides and stained with cresyl violet to identify the cortical areas and layers. Sections
processed for BDA histochemisty were counterstained with bisbenzimide to identify the
cortical areas and layers.
To visualize CTh labeled neurons, free-floating sections were treated for 45 min
with 0.15% H202 and 70% methanol to quench endogenous peroxidase and thoroughly
rinsed in 0.05 M Tris-HCI-buffered 0.9% saline solution (TBS, pH 8.0) containing 0.5%
Triton X-lOO (TBSTx). Sections were then incubated in 2% normal donkey serum
(NDS) for 2 hours and transferred to a solution of primary antibody (goat polyclonal
anti-CTh 1:40 000; Molecular Probes) with 1% NDS in PBS-Tx for 2 days at 4°C.

127
Subsequently, sections were rinsed in PBS-Tx and incubated in a secondary antibody
(biotinylated donkey anti-goat; 1 :500; Molecular Probes) solution with 1% NDS in
PBS-Tx for 2 hours at room temperature. Following further rinsing, the sections were
then incubated for 90 min in an avidin-biotin complex solution (Elite Vectastain, Vector
Laboratories, PK4000 Standard kit) in TBS-Tx, pH 8.0, rinsed in TBS, and then
incubated in a 0.015% '3- diaminobenzidine (DBA) solution. Labeled neurons were
revealed by the addition of 0.005% H202. Sections were washed and mounted on
gelatin-subbed slides, air-dried, dehydrated and cover-slipped with Permount mounting
media (Fisher Scientific, Ottawa, ON, Canada).
For BDA staining, after quenching endogenous peroxidase, sections were incubated
for 90 min in an avidin-biotin complex solution (ABC Vectastain elite), washed and
BDA was revealed using nickel-intensified DAB (Sigma-Aldrich, St-Louis, MO, USA)
as a chromogen. Sections were pre-incubated for 30 min in Tris-buffered (TB)
(0.05 m) - nickel ammonium sulfate 0.4%, pH 8.0, followed by 10 min in TB-nickel
ammonium containing 0.015% DAB and 0.005% H202. Sections were dehydrated in
ethanol, cleared in xylenes and cover-slipped with Eukitt mounting media.
Charting of retrogradely labeled neurons
AlI CTb retrogradely labeled neurons on one of every two sections of SI , SI BF and
of VI were plotted using an Olympus BX51 WI microscope (20X, 0.75 NA objective)
equipped with a three-axis computer-controlled stepping motor system coupled to a

128
personal computer and to a color Optronix CCD camera and driven by the Neurolucida
software (MBF Biosciences, Williston, VT, USA).
The whole primary somatosensory and visual cortices were systematically and
randomly sampled on sections spaced 200 !-lm apart. Cortical areas were delineated at
lower magnification (4X, 0.16 NA objectives) on adjacent Nissl-stained sections.
Borders between cortical areas were delineated according to the cytoarchitectonic
descriptions provided by Caviness (1975) and the mouse brain atlas of Franklin and
Paxinos (2008). Contours of each cortical area in which retrogradely labeled cells were
located were traced with Neurolucida and the limits of each cortical layer were traced.
These contours were superimposed on the images of CTb-reacted sections and resized
for shrinkage differences between the Nissl and CTb sections. This allowed plotted
neurons in each cortical area to be assigned to either supragranular, granular or
infragranular layers for the calculation of layer indices. These indices provide a
quantitative assessment of the laminar distribution of retrogradely labeled neurons and
are instrumental in the classification of corticocortical feedback, feedforward and lateral
connections (Felleman and Van Essen 1991). Layer indices (L) were calculated using
the formula where S and 1 are the numbers of labeled neurons in supragranular and
infragranular layers respectively (Budinger et al. 2006, 2008; Budinger and Scheich
2009):
L = (S-1) / (S+1)
129
The indices range between -1 and 1. Negative values indicate feedback connections
mostly originating in infragranular layers and positive values indicate feedforward
connections mostly originating in supragranular layers. Values near zero indicate lateral
connections. AlI photomicrographs were cropped, and luminosity and contrast were
adjusted with Adobe Photoshop software.
Single axon reconstructions
Six anterogradely labeled axons projecting from VI to the barrel field of SI and six
axons projecting from the barrel field of SI to VI were reconstructed at higher
magnification (lOOX, 1.4 NA objectives). Cortical areas were delineated at lower
magnification (4X, 0.16 NA objectives) using bisbenzimide as a fluorescent
counterstain. Contours of each cortical area in which anterogradely labeled axons were
located were traced with Neurolucida and the limits of each cortical layer were defmed.
Axons were reconstructed from their entrance in the grey matter. The axonal branches
were completely reconstructed and followed throughout the serial sections until they
ended and could not be followed further to adjacent sections. Throughout the full extent
of the axonal arborisation, all the axonal swellings were charted, assigned to specifie
cortical layers and their largest diameter was measured. The size frequency distribution
ofaxonal swellings was determined for each cortical layer of each individual axon.

130
Stereological sampling of laminar distribution ofaxonal swellings
In order to provide an unbiased size frequency distribution of swellings in each
cortical layer for the projection from VI to the SI barrel field and the reciprocal
projection from the SI barrel field to VI, a stereological systematic random sampling of
these projection fields was performed using the Stereo Investigator software (MBF
Bioscience) in cases that received a columnar injection in the visual or somatosensory
cortices. These size distributions for a whole population of neurons projecting from the
injection sites were compared with the same distributions obtained for individual axons
and with the sum of all the single axon reconstructions. This comparison is done to
assess if the data obtained from the swellings of single axons is representative of the
whole population of swellings sampled.
Projections fields in which anterograde labeling was observed were sampled using
the optical fractionator worlcflow (in Stereo investigator) on approximately 10
equidistant sections covering the full anteroposterior range of the projection, except for
the fourth case injected with BDA in VI in which the projection extended to only 5
sections. On each section, polygonal contours were traced around the projection field in
each cortical layer. Axonal swellings were then counted in no less than 100 disectors
that were 20x20 !lm square and 15 !lm height, and evenly distributed at the intersections
of an 80x80 !!fi grid. The maximum diameter was measured for each sampled swelling.

131
This optical fractionator sampling strategy allowed for the estimation of the total
number of swellings in each cortical layer. The total numbers of swellings (N) were
calculated by the following equation (West et al. 1991) where LQ is the total number of
swellings counted within the disectors, ssf is the section sampling fraction (number of
sampled sections over the total number of sections on which the terminal projection field
appears), asf is the area sampling fraction (ratio of the frame area/the total area of the
reference space on the section) and tsf is the thickness sampling fraction (disector
heightl section thickness):
Product of ssf, asf and tsf is the overall sampling faction (see Table 8). Coefficients
of error (CEs) were calculated according to the procedure described by West and
Gundersen (1990), in order to determine whether the sampling effort was sufficient. It is
widely accepted as a rule of thumb that CEs below 0.1 are indicative of a sufficient
sampling. The objective of this stereological sampling was not to determine the total
number of swellings that are labeled for each injection. This number is a function of the
injection size. The objective was to obtain unbiased estimates of laminar and size
distributions.

132
Table 8
Stereological sampling parameters for the estimation of the number of anterogradely labeled axonal swellings in each layers in SI BF after injections of BDA
into VI ofC57Bl/6 mice
Case Layer Number Total Numberof Number Sampling Total CE of area dissectors of fraction estimation
sections (mm2) objects
I-ID 9 8661 106 313 0.004 84662 0.060
IV 9 5663 117 164 0.006 26279 0.053
Va 9 3150 117 178 0.011 15865 0.065
Vbc 9 5407 115 164 0.006 25527 0.050
VI 9 3950 116 78 0.009 8793 0.097
Total 45 26831 571 897 (0.007) 161126 (0.065) (Mean)
2 I-ID 9 6593 112 329 0.005 64112 0.074
IV 9 4580 III 118 0.007 16117 0.075
Va 9 2257 128 139 0.017 8115 0.074
Vbc 9 3969 119 129 0.009 14243 0.089
VI 9 2050 111 80 0.016 4890 0.083
Total 45 19449 581 795 (0.011) 107477 (0.079) (Mean)
3 I-ID 9 17372 110 317 0.002 165717 0.075
IV 9 11941 112 158 0.003 55764 0.052
Va 9 6617 127 181 0.006 31218 0.060
Vbc 9 10180 123 156 0.004 42739 0.051
VI 9 10885 64 III 0.003 20776 0.063
Total 45 56995 536 923 (0.004) 316214 (0.060) (Mean)
4 I-ID 5 2507 106 174 0.013 13519 0.194
IV 5 1521 105 72 0.021 3427 0.201
Va 5 940 114 60 0.037 1626 0.192
Vbc 5 1408 110 90 0.024 3786 0.147
VI 5 1515 105 141 0.021 6685 0.167
Total 25 7891 540 537 (0.023) 29043 (0.180) (Mean)
5 I-ID 10 5745 118 97 0.006 17793 0.071
IV 10 3005 105 38 0.009 4097 0.097
Va 10 1821 120 63 0.018 3602 0.044
Vbc 10 2506 115 42 0.012 3449 0.052
VI 10 1398 112 40 0.021 1881 0.070
Total 50 14475 570 280 (0.013) 30822 (0.067) (Mean)
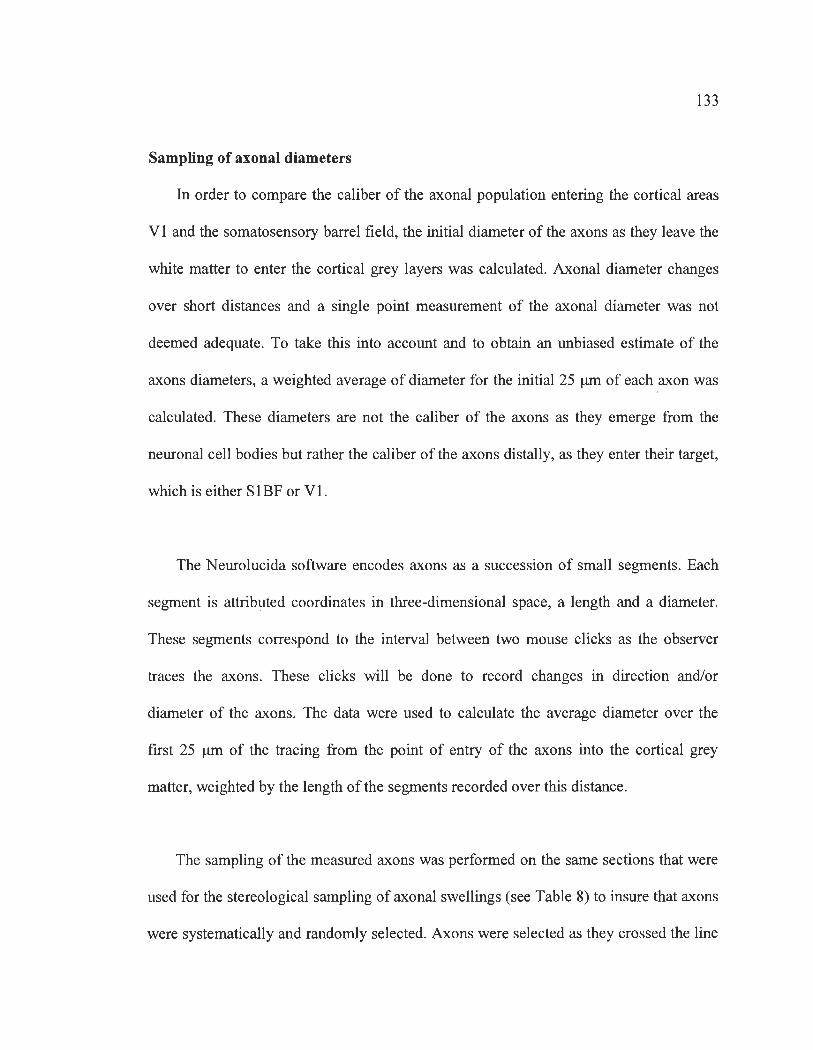
133
Sampling ofaxonal diameters
In order to compare the caliber of the axonal population entering the cortical areas
VI and the somatosensory barrel field, the initial diameter of the axons as they leave the
white matter to enter the cortical grey layers was calculated. Axonal diameter changes
over short distances and a single point measurement of the axonal diameter was not
deemed adequate. To take this into account and to obtain an unbiased estimate of the
axons diameters, a weighted average of diameter for the initial 25 Ilm of each axon was
calculated. These diameters are not the caliber of the axons as they emerge from the
neuronal cell bodies but rather the caliber of the axons distally, as they enter their target,
which is either SIBF or VI.
The Neurolucida software encodes axons as a succession of small segments. Each
segment is attribl;lted coordinates in three-dimensional space, a length and a diameter.
These segments correspond to the interval between two mouse clicks as the observer
traces the axons. These clicks will be done to record changes in direction and/or
diameter of the axons. The data were used to calculate the average diameter over the
frrst 25 Ilm of the tracing from the point of entry of the axons into the cortical grey
matter, weighted by the length ofthe segments recorded over this distance.
The sampling of the measured axons was performed on the same sections that were
used for the stereological sampling ofaxonal swellings (see Table 8) to insure that axons
were systematically and randomly selected. Axons were selected as they crossed the line

134
between the white and grey matter. The totallength of this line for each case and the
number of sampled sections are given in Table 9.
Table 9
Sampling parameters for the estimation of the number of anterogradely labeled axons as they enter the gray matter in S1 BF and V1 after injections of BDA
into V1 and S1BF respectively ofC57Bl/6 mice
Injection Case Numberof Sampled Number of Sampling Total CE site sections length axons fraction estimation
(mm)
VI 9 13.281 259 0.333 777 0.071
2 9 12.215 116 0.333 348 0.094
3 9 14.372 104 0.500 208 0.067
4 5 6.567 195 1.000 195 0.183
5 10 13.967 132 0.500 264 0.091
Mean 358
SIBF 11 II.532 134 0.250 536 0.130
2 10 6.016 38 1.000 38 0.072
3 10 5.373 154 1.000 154 0.051
4 7 6.215 84 0.500 168 0.102
5 8 6.143 310 1.000 310 0.045
Mean 241
Statistical analysis
Statistical analyses were performed using SPSS v 16.0 software (SPSS, Chicago, IL,
USA).

Results
Labeling of cortical visuotactile connections with eTb
135
Representative CTb injection sites in the visual cortex are illustrated in Figure 2IA
(VI) and in the somatosensory barrel field in Figure 2IC (SIBF). None of the injections
damaged the underlying white matter. In aU cases, CTb injections in SIBF and VI
anterogradely labeled axonal terminaIs and retrogradely labeled numerous neuronal ceU
bodies in VI and SI respectively. Conversely, CTh injections outside of the barrel field
of SI resulted in very few labeled neurons in VI.
In SI, CTh-labeled neurons were found in supragranular layers and layer 4 but they
were more numerous in infragranular layers (see Figure 2IB). By contrast, in VI, CTb
labeled neurons were more evenly distributed in layers 2/3 to layer 5 (see Figure 2ID).
In layer 6, neurons with fusiform ceU bodies were found along the border of the white
matter.

136
6 6
WM WM
Figure 21. A: An injection of CTb in VI produced in B: Anterograde and retro grade labeling in SIBF. Note the more abundant retrogradely labeled neurons in layer 5 than in supragranular layers and the intense anterograde labeling in layers 2/3 and 5. C: An injection of CTb in S IBF produced in D: Retrogradely labeled neurons in supragranular and infragranular layers, a typical distribution of lateral connections. Scale: 1000 J.lm (AlC) and 200 J.lffi (BID).
In addition, CTb injections in VI produced intense anterograde axonallabeling in
supragranular layers as weU as in layer 5. Less intense axonallabeling was observed in
layer 4 and only sparse labeling was observed in layer 6 (see Figure 2IB). Injections in
SIBF produced sparse anterograde labeling in aU layers of VI , (see Figure 2ID).
Anterograde labeling was much lighter in the projection from SIBF to VI than that of
VI to SIBF. This clearly shows an asymmetry of the reciprocal connections between VI
and SIBF; the projection from VI to the SlBF being much stronger.

137
Even though the number of labeled neurons varied between cases, and is dependent
upon the injection size, all injections were perfonned with the same parameters and a
comparison of the total number of labeled neurons is instructive here of the strength of
the projection. Following eTb injections in VI, the number of retrogradely labeled
neurons in SIBF ranged between 10 and 164 (mean = 80.8) and between 15 and 85
(mean = 36.6) in SI (see Table 10), but this difference was not significant (one-way
ANOVA,p = 0.857) (see Figure 22A).

138
Table 10
Numbers and percentage (in parentheses) of retrogradely labeled neurons in supragranular / granulai: / infragranular layers and layer indices (below) in S1, S1BF
and V1 after injections ofCTh into V1 and S1BF ofC57BI/6 mice
Injection Case Layer SI SlBF VI
site
VI CT9 I-III 14 (16.47) 23 (14.02)
IV Il (12.94) 25 (15.24)
V 33 (38.82) 55 (33 .54)
VI 27 (31.77) 61 (37.20)
Layer -0.62 -0.67 Index
CT20 I-III 4 (25) 0(0)
IV 0(0) 0(0)
V 9 (56.25) 3 (30)
VI 3 (18.75) 7 (70)
Layer -0.5 -1 Index
CT25 I-III 4 (26.67) 13 (23 .21)
IV 0(0) 0(0)
V 5 (33.33) 27 (48.21)
VI 6 (40) 16 (28.57)
Layer -0.47 -0.54 Index
CT26 I-III 6 (15.39) 19 (16.96)
IV 8(20.51) 6 (5.36)
V 13 (33.33) 41 (36.61)
VI 12 (30.77) 46 (41.07)
Layer -0.61 -0.64 Index
CT31 I-III 11 (39.29) 8 (12.9)
IV 1 (3.57) 0(0)
V 8 (28.57) 27 (43.55)
VI 8 (28.57) 27 (43.55)
Layer -0.19 -0.74 Index
SlBF 03-02b4 I-III 89 (31.79)
IV 60 (21.43)
V 84 (30)
VI 47 (16.79)
Layer -0.19 Index

139
Table 10
Numbers and percentage (in parentheses) of retrogradely labeled neurons in supragranular / granular / infragranular layers and layer indices (below) in S1, S1BF
and V1 after injections ofCTb into V1 and S1BF ofC57BI/6 mice (continued)
Injection Case Layer SI SIBF VI site
04-01b2 I-ID 175 (34.38)
IV 104 (20.43)
V 86 (16.90)
VI 144 (28.29)
Layer -0.14 Index
03-02b5 I-ID 282 (47.08)
IV 110 (18.36)
V 108 (18.03)
VI 99 (16.53)
Layer 0.15 Index
03-02b6 I-ID 68 (41.72)
IV 38 (23.31)
V 37 (22.70)
VI 20 (12.27)
Layer 0.08 Index
03-02b7 I-ID 227 (33.43)
IV 170 (25.04)
V 173 (25.48)
VI 109 (16.05)
Layer -0.11 Index
Mean I-ID 7.8 ± 2.25 (23 .93) 12.6 ± 4.54 (15 .59) 168.2 ± 45.25 ±SEM IV 4 ± 2.57 (10.93) 6.2 ± 5.41 (7.67) (37.71)
V 13.6 ± 5.61 (37.16) 30.6 ± 9.65 (37.87) 96.4 ± 25.49
VI 11.2 ± 4.71 (30.60) 31.4± 11.02 (21.61)
Layer -0.52 ± 0.09 (38.86) 97.6 ± 24.73
Index -0.66 ± 0.09 (21.88)
83 .8 ± 24.89 (18.79) -0.04 ± 0.08

140
Il LayersHII
A o LayerlV
600 *** Layer V
** o layerV1
500 ~ a? 0':400 z § ~ 300
l5 ffi 200 al :::E ::::> z
100
0 51 51BF VI
B 60
'" 50 z a? 0': z 40 0 ~
~ 30
l5 w
'" ~ 20
f!i 10 "-
0 51 51BF VI
C 0.2
0
-0.2
g z cr -0.4
~ -0.6
*** -o.B **
-1 51 51BF VI
Figure 22. A: Number of retrogradely labeled neurons in cortical areas following an injection of CTh in VI and SIBF of C57BV6 mice. B: Percentage of retrogradely labeled neurons in cortical areas following an injection of CTh in VI and SIBF of C57BV6 mice. C: Layer indices for neocortical areas following an injection of CTb in VI and SIBF ofC57BV6 mice.

141
Similarly, injections of CTh in and outside the somatosensory barrel field
retrogradely labeled neurons in VI. Very few neurons were labeled after injections in
SI. Of the 5 cases injected with CTh in SI , 3 of them had no retrogradely labeled
neurons in VI and 2 of them had only 2 neurons labeled in layer 5 of VI. Conversely,
numerous neurons were labeled in VI following injections in SlBF. The total number of
labeled neurons in VI following SlBF injections ranged between 163 and 679 (mean
446) (see Table 10). There was a statistically significant difference between the
projections (Kruskal-Wallis, p = 0.009) Post-hoc tests revealed that the projection from
VI to SlBF was stronger than that from SI to VI (Tukey-HSD, p = 0.001) and from
SlBF to VI (Tukey-HSD, p = 0.002) (see Figure 22A). This is in agreement with the
stronger projection of VI to the SlBF shown by CTb anterograde labeling.
Laminar distribution of Cholera toxin b labeled neurons
In order to classify each projection as a feedforward, feedback or lateral connection,
retrogradely labeled neurons in VI and in the somatosensory cortex within and outside
of the barrel field were counted in supragranular layers 1 to 3, layer 4 and infragranular
layers 5 and 6 in each case (see Table 10). Injections in VI retrogradely labeled a greater
percentage ofneurons in infragranular layers 5 and 6 in SI and SlBF (67.76% in SI and
76.73% in SlBF), whereas injections in SlBF retrogradely labeled a greater percentage
of neurons in the supragranular layers 1 to 3 (37.71%), (see Figure 22B). More
specifically, following injections in VI , the percentage of labeled neurons in SI was
significantly lower in layer 4 (10.93%) than in layers 1 to 3 (23.93%) (p = 0.016),

142
5 (37.16%) (p < 0.001) and 6 (30.60%) (p = 0.001). There was no significant difference
between the percentage of labeled neurons in layer 5 (37.16%) and 6 (30.60%)
(p = 0.848). The percentage oflabeled neurons in SlBF was significantly lower in layers
1 to 3 (15.59%) and layer 4 (7.67%) than in layer 5 (37.87%) (p < 0.001) and 6 (38.86%)
(p < 0.001). There was no significant difference between the percentage of labeled
neurons in layer 5 (37.87%) and in layer 6 (38.86%) (p> 0.999). Injections in SlBF
resulted in a significantly greater percentage of labeled neurons in layers 1 to 3 (37.71 %)
in VI than in layer 4 (21.61%) (p = 0.029), 5 (21.88%) (p = 0.046) and 6 (18.79%)
(p = 0.004). There was no significant difference between the percentage of labeled
neurons in layer 5 (21.88%) and in layer 6 (18.79%) (p> 0.999). Note that the
proportion of neurons labeled in layers 5 and 6 were always sirnilar showing that these
layers do not vary independently.
Significant differences in the percentage of labeled neurons in cortical layers were
observed between the projection from VI to SlBF and SlBF to VI (see Figure 22B). A
greater proportion of labeled neurons was found in layers 1 to 3 of VI following
injections in SlBF compared with SlBF (p < 0.001) following injections in VI. A
greater proportion oflabeled neurons was found in layers 4 of VI following injections in
SlBF compared with SI (p = 0.033) and SlBF (p = 0.006) following injections in VI. A
lesser proportion of labeled neurons was found in layers 5 of VI following injections in
SlBF compared with SI (p = 0.019) and SlBF (p = 0.016) following injections in VI.
AIso, a greater proportion of labeled neurons were found in layer 6 of SlBF following

143
injections in VI compared with SI (p = 0.036) following injections in VI and VI
(p < 0.001) following injections in SIBF.
Following CTb injections in VI , there were more labeled neurons in infragranular
than in supragranular layers of SI and SIBF. Hence, layer indices were negative in all
cases ranging between -0.62 and -0.19 in SI and between -1.0 and -0.54 in SIBF (see
Table 10), clearly suggestive of a feedback projection. CTh injections in S IBF produced
retro grade labeling of neurons in similar proportion in supra- and infragranular layers in
VI and, in all cases, layer indices were near zero, ranging from -0.19 to 0.15 (see
Table 10) indicating a lateral type of connection between two areas of similar
hierarchical levels within the cortical network. There was a statistically significant
difference between the layer indices (Kruskal-Wallis, p = 0.003). Post-hoc tests reveal
that the layer indices of VI and both SI and SIBF (Tukey-HSD, p = 0.003 and
p < 0.001 resp) (see Figure 22C) were significantly different.
Anterograde BDA labeling of visuotactile connections
The injections of high-molecular weight BDA in both VI and S IBF resulted in
significant anterograde axonallabeling in SIBF and VI respectively, without significant
signs of retro grade transport. None of the injections damaged the underlying white
matter. The BDA injections in the barrel field of SI (see Figure 23A) resulted in
anterogradely labeled axons in VI in each of the 5 cases, confmning the projection
observed following the injection of CTb in VI . These injections labeled axons in infra-

144
and supragranular layers of VI (see Figure 23B). Upon entering the grey matter, axons
travelled up to layer 4 without extensive branching. Sorne small en-passant axonal
swellings were seen as the axons crossed layer 4. In supragranular layers a dense lattice
of intercrossing neurites was always present. Labeled terminaIs were most evident in
layers 1 to 3, with a greater density in the superior part oflayer 2.
Injections in VI (see Figure 23C) anterogradely labeled axonal arbors largely
restricted to the barrel field in SI , in each of the 5 cases, confmning the projection
observed following the injection of CTb in SIBF. Labeled axons were found in infra
and supragranular layers of (see Figure 23D). Axons left the white matter, crossed layer
6 and arborized in layer 5. Axons travelled radially through the granular layer without
significant branching. Axonal terminal labeling was most intense in the supragranular
layers.

145
c
Figure 23. A: An injection of BDA in S IBF produced in B: Anterograde labeling of axons in the supragranular and infragranular layers in VI. C: An injection ofBDA in VI produced in D: Anterograde labeling of axons in the supragranular and infragranular layers in SIBF. Scale: 1000 J.1m (AlC) and 250 J.1ID (BID).
Single axon branching morphology
In order to characterize the branching structure and the laminar and size distribution
ofaxonal swellings, a sample of single axons were completely reconstructed from their
entrance in the grey matter for the projections from VI to SIBF and from SIBF to VI.
More specifically, branching structure was described in terms of the general appearance
of the axons and axonal swellings were described with respect to their laminar position
and size distribution.
Axons of the projection from VI to SIBF (see Figure 24) displayed a wide range of
branching structures. Relatively simple branching patterns were observed in three axons

146
(see Figure 24A, C and F). Upon entering the grey matter, these axons ascended through
the infragranular layers without any significant branching, and underwent a few
bifurcations within the supragranular layers, forming relatively restricted columnar trees.
One axon branched mostly in the supragranular layers but sparsely in infragranular
layers and exhibited a somewhat more complex richly arborized tree (see Figure 24D).
The medio-Iateral extent of the portion of the arbor located in the supragranular layers
was wider in this axon than in the more simple ones which had a more restricted
projection column. In these three axons, axonal swellings were mostly located in
supragranular layers, reflecting their branching structure.
Two axons had more extensive trajectories in the infragranular layers than the other
axons of the sample (see Figure 24B and E). One axon (see Figure 24B) bifurcated early
after entering the grey matter, sending a long poorly branched extension that coursed
tangentially over more than 500 f.Ull in layers 5 and 6, and another branch that ascended
through layers 5 and 4 that subsequently arborized sparsely in supragranular layers
forming very restricted radial projections in layers 1 to 3. Finally, one axon exhibited
extensive tangential travel in the infragranular layers (see Figure 24E). As in the
previously described axon, it bifurcated only once to pro duce two main branches. One
ascended to the supragranular layers and formed a tangentially restricted projection
column, whereas the other bifurcated in layer 5 in one location (see terminal branches 1
and 3) and another branch travelled extensively over more than 500 f.Ull to ascend in the
supragranular layer without any significant branching in another location in the barrel

147
field. In these two axons, (see Figure 24B and E) swelling were quite evenly distributed
across ail corticallayers also reflecting to distribution ofaxonal segments in these cases.
A
~H-~ =-Va n=255
\IboY< VI-'--__
o JO 60 90 .. '~I .
~50~ "0 0,5 1 U 2 U ', ,,(
d~nJ "-.• ~ R
B ,.MI ;
:. n=382 \/boY<
VI
c
0106090 .. I~~
~50
" °0 0.5 i 1.5 2 2.5
d",",'
.... m __
::(::=272 \IboY<
VI
"
o JO 60 90 ..
", " -"
IOO~ # ~ ,.
o 0.5 1 1.5 l d",",'
2~ ", r'" / ",) ---v R"
- 1
Antf!fior
• Layer 1-11-111 • Layer IV • LayerVa • LayerVb • Layer VI • White Matter - Pial Surface .... White Matter

E
F HI':r: v" n = 194 Vb-Vc
VI
100
15
"''''
o ]() 60 90
"
15 L'>-. J '\i 0.5 1 1.5 2 2.S ;
.""1 1 . )
R·.
148
2 3 \ , 1
--,~
0.",1 Mterlor
L~~ LLal .... Figure 24. Single axons in SlBF following an injection of BDA in VI of C57Bl/6J mice. The reconstructed axons are viewed as coronal plane projections on the left panel and as top projections on the right. Each colored segment on the axons corresponds to the layer in which this segment is situated. The full line represents the pial surface and the dotted line the border between layer 6 and the white matter. The Ris the root of the axons as they enter they grey matter. The numbers (1/2/3) on the axons are landmarks to facilitate the visualisation of their structure in the two different projections. On the left ofaxonal structures are histograms of the laminar distribution of terminals (% of axonal swellings for each layer) n is the total number ofaxonal swellings for each axon; and just below is the size distribution ofaxonal swellings as a function of their largest diameter (d). Scale: 100 !lm.
The size distribution of swellings on individual axons in the projections from VI to
SlBF shows a great predominance of very small swellings (see Figure 24) with a small
contingent of much larger swellings. In four of the six reconstructed axons, the large st
swellings were no larger than 1.9 !lm in diameter (see Figure 24 A-D). On two axons,
there were sorne swellings with diameters greater than 2.5!lm (see Figure 24E and F, 2.8
and 2.7 Jlffi resp.).
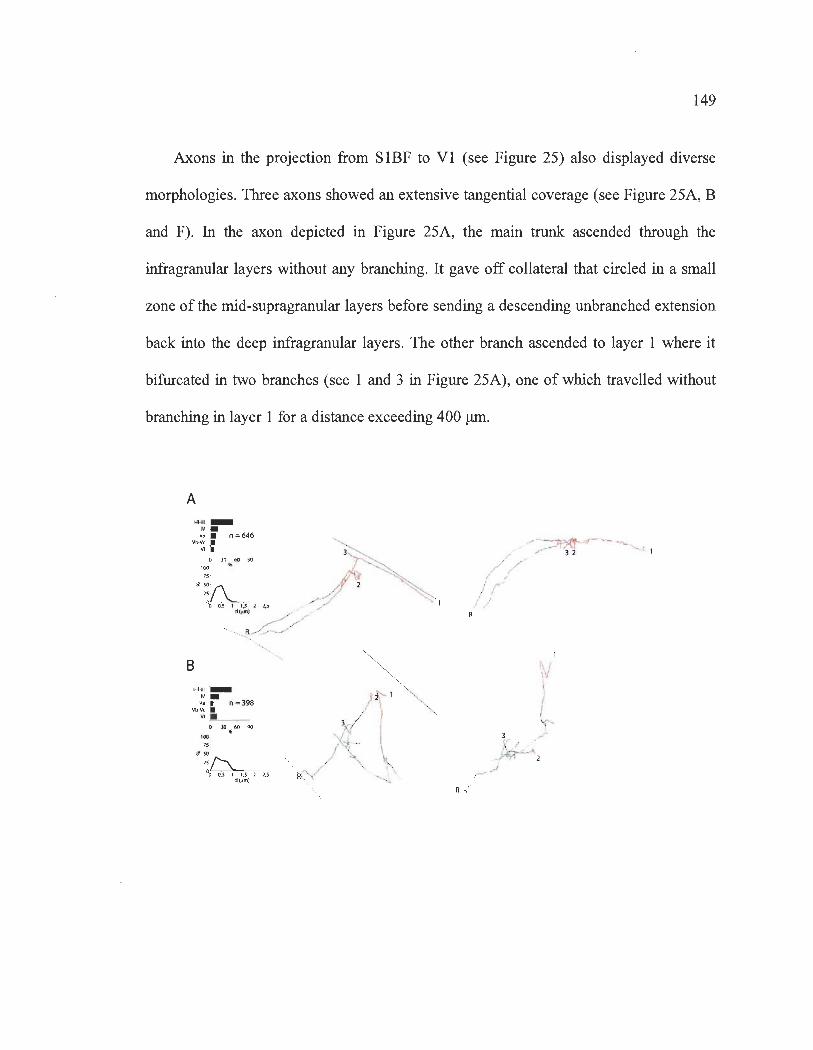
149
Axons in the projection from SIBF to VI (see Figure 25) also displayed diverse
morphologies. Three axons showed an extensive tangential coverage (see Figure 25A, B
and F). In the axon depicted in Figure 25A, the main trunk ascended through the
infragranular layers without any branching. It gave off collateral that circled in a small
zone of the mid-supragranular layers before sending a descending unbranched extension
back into the deep infragranular layers. The other branch ascended to layer 1 where it
bifurcated in two branches (see 1 and 3 in Figure 25A), one of which travelled without
branching in layer 1 for a distance exceeding 400 ~.
A
B 14I.jU _
~ .
Yb-: -1 n=398 Vl . o JO 60 QO
" 100
" 'so
".
"h. 00 0..5 1 1,5 2 2,5 d (~m)
".
R ~('.

(.
HI~II _ rJ . V. ". n = 469 Yb\'< •
VI -. o JO 60 90 ..
100
7S .
~:J\ '\i a..s 1 1,522.5
diIJml
o 1-11-111 -ri .
V. _ n = 531 Yb-V< •
E
VIL ~ o JO 60 90 ..
150
Do",' ,ll,ntf!fÏOl'
L Lo,"', L, ..... ,
ç--~---0--'(
!-- 2
Figure 25. Single axons in VI following an injection of BDA in SIBF of C57Bl/6J mice. Legends as in Figure 24.

151
Another axon showed an extensive tangential trajectory (see Figure 25B). Upon
entering the grey matter, this axon made two successive right angle turns before
ascending through the infragranular layers without branching. While in layer 5, it gave
out one branch that ascended through infragranular layers without any significant
branching, except for a small terminal tuft. The other branch emerged from layer 5 and
travelled vertically in the deeper part of layer 5 and emitted therein several short
collaterals and then engaged in a linear tangential course without branching for more
than 300 ~m. It subsequently made a sharp turn and ascended obliquely towards the pial
surface in an anteriorly directed trajectory for approximately 400 ~m but did not reach
layer 1. The laminar distribution of swellings was similar in axons shown in Figure 25A
and B in that the majority were found in supragranular layers.
The axon depicted in Figure 25F is peculiar in that it had a collateral branch that
arborized quite significantly in layer 6 and another that ascended to the upper-half of the
supragranular layers before arborizing. Also, the top-view of this axon showed that the
infragranular focus of arborisation was out of radial register with the supragranular
terminal arbors which were located about 300 ~m more anteriorly. This is not apparent
in the coronal projection that would rather suggest a more restricted columnar
organisation for this axon (see Figure 25F). The laminar distribution of swellings for this
axon was clearly bimodal with an important population of swellings in supragranular
layers and an also very important contingent of swellings in layer 6.

152
Two axons displayed a restricted tangential extent of their arborisation (see Figure
25C and D). They arborized more importantly in the supragranular layers even though
they did emit a few unbranched collaterals in infragranular layers. Top projections of
these axons demonstrated the restricted tangential distribution of their arbors that
remained within a radius of approximately 300 Ilm. The tangential extent of the axons
projecting from VI to SIBF was in general greater than that of these two axons. The
laminar distribution of swellings of the axon shown in Figure 25C was sirnilar to that of
the axon of Figure 25B, in that there was a large contingent of swellings in
supragranular layers, but also a significant number of swellings distributed throughout
cortical layers. The axon depicted in Figure 25E was peculiar in that it did not reach
supragranular layers. Oblique segments ascended through the infragranular layers
without any significant branching. Consequently, swellings were found in sirnilar
proportions only in layers 5 and 6.
The size distribution of swellings on individual axons in the projection from SIBF
to VI shows a strong dominance of very small swellings with diameters no greater than
1.2 JlID (see Figure 25 A, B, D-F). In a11 the six reconstructed axons, only one axon has a
few swellings no larger than 1.8 Ilm in diameter (see Figure 25C).
Axonal thickness
In order to compare the reciprocal projections between VI to SIBF at the single
axon level, the frequency distributions of the diameters of randomly sampled axons (see

153
Table 9) as they enter the grey matter were compared (see Figure 26). Within the
sampled axons, the size of the mean diameters ranged between 0.1 and 1.9J.lm for the
projection from VI to SlBF and between 0.1 and 0.5J.lffi for the projection from SlBF to
VI. There was a very highly significant difference between the projection from VI to
SlBF and from SlBF to VI (Kolmogorov-Smirnov tests, p < 0.001). In both
projections, thin axons are predominant and account for the majority of the axons. In the
projection from VI to the somatosensory barrel field, quite thick axons were found that
were never seen in the reciprocal proj ection from the barrel field to the visual cortex.
100
80
UJ \!l 60 ~ z UJ u 15 40 0..
20
o
. n
" '1 , 1 , 1
, 1 , 1
, 1 , , , , , , , , 1
1 , 1
1 1 , ,
1
0,5 1 1,5
DIAMmR (~M)
SlBF Vl
-II·· n = 806 n = 720
2,5
Figure 26, Size distribution ofaxonal diameters in SlBF (solid line) following BDA injections in VI and in VI following injections in SlBF (dotted line). n = the number of counted axons for each projection.
Number of anterogradely labeled axonal sweUings
The total number of anterogradely labeled axonal swellings for each injection was
estimated through stereological sampling in order to compare the strength of the
reciprocal projections between the visual cortex and the somatosensory barrel field. The

154
estimated numbers of anterogradely labeled axonal swellings in each layers of S 1BF are
shown in Table 8 and the numbers of anterogradely labeled axonal swellings in each
layers of VI are shown in Table Il.
Even though the total number of labeled swellings and axons is dependent upon the
injection size, all our injections were performed with the same parameters and could,
within certain limits, be compared. The estimated total number of swellings in SlBF
following a BDA injection in VI ranged between 29043 and 316 214 (see Table 8) with
a mean of 128936 and the estimated number of swellings in VI after a BDA injection in
SlBF ranged from 9 763 to 134 413 (see Table 11) with a mean of 47 961. This
difference did not reach statistical significance (Mann-Whitney,p = 0.251).

155
Table Il
Stereological sampling parameters for the estimation of the number of anterogradely labeled axonal swellings in each layers in Vi after injections of BDA
into SiBF ofC57BI/6 mice
Case Layer Number Total Numberof Number Sampling Total CE of area dissectors of fraction estimation
sections (mm2) objects
I-ill 11 9174 124 201 0.004 53794 0.089
IV 11 6717 122 80 0.005 15935 0.078
Va 11 3229 141 85 0.012 7043 0.098
Vbc 11 5130 137 137 0.007 18558 0.085
VI 11 6571 118 194 0.005 39083 0.090
Total 55 30821 642 697 (0.007) 134413 (0.088) (Mean)
2 I-ill 10 1604 105 488 0.ü18 27043 0.043
IV 10 779 122 291 0.043 6747 0.056
Va 10 461 129 241 0.077 3129 0.059
Vbc 10 600 120 169 0.055 3070 0.072
VI 10 566 118 89 0.058 1549 0.082
Total 50 4010 594 1278 (0.050) 41538 (0.062) (Mean)
3 I-ill 10 1380 108 209 0.022 9692 0.061
IV 10 578 119 153 0.057 2696 0.050
Va 10 461 124 146 0.074 1971 0.061
Vbc 10 649 128 128 0.054 2355 0.057
VI 10 607 153 91 0.070 1310 0.059
Total 50 3675 632 727 (0.055) 18024 (0.058) (Mean)
4 I-ill 7 3414 111 254 0.010 25597 0.080
IV 7 1343 133 106 0.030 3508 0.092
Va 7 819 115 90 0.043 2102 0.099
Vbc 7 1317 105 65 0.024 2671 0.094
VI 7 1295 124 64 0.029 2190 0.093
Total 35 8188 588 579 (0.027) 36068 (0.092) (Mean)

156
Table Il
Stereological sampling parameters for the estimation of the number of anterogradely labeled axonal swellings in each layers in Vi after injections of BDA
into SiBF ofC57Bl/6 mice (continued)
Case Layer Number Total Number of Number Sampling Total CE of area dissectors of fraction estimation
sections (mm2) objects
5 I-III 8 1493 121 152 0.025 6192 0.052
IV 8 709 139 82 0.059 1381 0.040
Va 8 403 158 56 0.119 472 0.068
Vbc 8 710 138 52 0.059 883 0.069
VI 8 678 134 50 0.060 835 0.026
Total 40 3993 690 392 (0.064) 9763 (0.051) (Mean)
Laminar distribution ofaxonal swellings
The laminar and size distributions ofaxonal swellings in the sample of
reconstructed single axons in VI and SlBF (see Figure 27A and C) were compared to
the stereological estimates of the laminar and size distributions of swellings labeled
following large columnar injections of BDA in these cortices (see Figure 27B and D).
The stereologically estimated numbers of anterogradely labeled axonal swellings in each
layers of SlBF are shown in Table 8 and the numbers of anterogradely labeled axonal
swellings in each layers of VI are shown in Table Il.

A
1-111 . Vl 0 518
IV -+--SIBF Vl
V. ---+--- n =31 78 n = 2383
IIb-Vc ---=:::t--
VI ~ o IS 30 45
NUMBER OFAXONAl SWElllNGS (!Io)
B
I~II +
IV +-51BF VI
V. -+- fi = 3432 fi = 3673
IIb-Vc 0f-
VI --+--
o 15 30 45
NUMBER OFAXONAL SWEWNGS "II)
C 60
45
w \!)
~ tj30 a; ~
IS
os
D 60
45
lOI \!)
i30
~ 15
0 0 OS
1.5 OIAMETER I\IM)
1 1.5 OIAMETER I!>M)
1-111
IV
V.
IIb-Vc
VI
157
SI BF VI
2.5
2.S
Figure 27. Laminar and size distribution ofaxonal swellings in SlBF and VI following an injection of BDA in VI cortex and SlBF respectively of C57Bl/6J mice from the sample of reconstructed single axons (A and C resp) and from the stereological .sampling ofthese cortical areas following columnar BDA cortical injections (B and D resp). Solid lines correspond to layers in SlBF and dotted lines correspond to layers in VI (CID). =
the number of swellings estimated by the stereological sampling. n = the total number of swellings measured in the stereological sampling scheme.
Although the laminar distribution of swellings in individual axons exhibits a wide
range of patterns (see Figures 24 and 25), the sum of the reconstructed axons in SlBF
and VI produced similar laminar distributions ofaxonal swellings (see Figure 27A).
Furthermore, these distributions were very similar to those obtained with the
stereological sampling of cortical layers (see Figure 27B). The stereological sampling

158
produced smaller variances of the estimates of the number ofaxonal swellings (see
Figure 27B). There were no significant differences in the estimated percentage ofaxonal
swellings in each layer between VI and SIBF (Kruskal-Wallis,p = 0.946).
In both the stereological sampling and the reconstructed axons, both injections in
VI and SIBF resulted in labeling of axons with swellings in layers 1 to 3 and 5. The
proportion of swellings found in layer 4 was commensurate with those in infragranular
sublayers 5a and 5c and also layer 6.
Size distribution ofaxonal swellings in corticallayers
Within the stereological sample ofaxonal swellings, the size of the axonal swellings
ranged between 0.3 ~m and 2 ~m for the projection from VI to SIBF and between 0.3
~ and 0.9 ~m for the projection from S IBF to VI. Within the sample of reconstructed
axons, the size of the axonal swellings ranged between 0.3 ~m and 2.8 ~m for the
projection from VI to SIBF and between 0.2 ~m and 1.8 ~m for the projection from
SIBF to VI.
The systematic random stereological sampling yielded size distributions of the
swellings that should be representative of the population of swellings in these
projections. The sample of reconstructed axons is quite small and is not statistically
representative of the whole population. However, the stereological sampling scheme did
not pick up the larger swellings that were observed in the reconstructed axons. These are
159
quite rare in the overall population and could have been missed. Nevertheless the
predominance of smaller swelling in alllayers of the projection from SlBF to VI was
observed in both samples (see Figure 27C and 27D).
The laminar size distribution ofaxonal swellings was compared between the
projection from VI to SlBF and from SlBF to VI in the samples ofreconstructed axons
(see Figure 27C) and the stereological samples described above (see Figure 27D). The
small sample of reconstructed axons is likely not sufficient to detect with any statistical
power the swelling size differences between layers; only the statistical conclusions
drawn from the stereological sampling will be considered here.
Within the projection from VI to SlBF, there was a significant difference of the
mean size ofaxonal swellings between layers (one-way ANOVA, p = 0.001), layer 6
swellings being smaller than those of layers 1 to 3 (p = 0.001) and layer 5a (p = 0.001)
(see Figure 27D). Within the projection from SlBF to VI , the mean size of the axonal
swellings was significantly different between layers (one-way ANOVA, p = 0.004),
layer 4 swellings being smaller ,than those of layers 1 to 3 (p = 0.021) and layer 5a
(p = 0.044). The layer by layer comparisons ofthese size distributions show that there is
a very highly significant difference for alilayers pairwise comparisons between SIBF
and VI (Kolmogorov- Smirnov tests, p < 0.001). The size distributions for each layers
for the stereological sampling (see Figure 27D), clearly show that axonal swellings in
VI are smaller than those in SIBF. The size distributions ofswellings for each layers in

160
the reconstructed axons (see Figure 27C) and in the stereological sampling (see
Figure 27D), clearly show a greater asymmetry towards the right in S IBF that in VI .
Discussion
The aim of this study was to de scribe the structure of the reciprocal connections
between visual and somatosensory cortices in the mouse. We show that the primary
visual cortex and the barrel field of the primary somatosensory cortex of C57Bl/6J mice
are linked by direct reciprocal connections. This supports visuo-tactile interactions at the
initial stage of sensory processing in primary sensory cortices. We extend these frndings
by showing a significant asymmetry of the strength and of the axonal morphology of
these reciprocal connections. The projection from VI to SI is predominantly to the
barrel field and stronger than the reciprocal projection to VI. We also demonstrate that
these connections between primary sensory cortices do not fit in the classification
scheme of feedforward and feedback cortical projections. Finally, axons in the
projection from VI to SIBF were thicker and had sorne large anterogradely labeled
axonal swellings not found in the projection from SIBF to VI , suggesting a greater
importance ofClass lB glutamatergic inputs from the visual cortex to the somatosensory
cortex. This asymmetry suggests that, in the mouse, the visual projection to the primary
somatosensory cortex has a greater driving influence on the somatosensory cortex than
the reciprocal projection from the somatosensory cortex to the visual cortex.

161
Direct reciprocal projection between visual and somatosensory cortices
Numerous retrogradely labeled neuronal ceIl bodies were found in VI and SI
foIlowing injections in SIBF and VI respectively. The projection from VI to SIBF was
more robust than previously shown (Campi et al. 2010; Wang et al. 2012). The
projection from the somatosensory to the visual cortex was significant as previously
shown in the mouse (Charbonneau et al. 2012; Stehberg et al. 2014; Wang et al. 2012;
Zingg et al. 2014), rat (Sieben et al. 2013; Stehberg et al. 2014; Zakiewicz et al. 2014),
and gerbil (Henschke et al. 2014).
Direct projections between primary sensory areas are sparse in primates (Cappe et
al. 2009; Cappe and Barone 2005; Clavagnier et al. 2004; Falchier et al. 2002; Rockland
and Ojima 2003). The greater importance of direct interactions between primary sensory
cortices in rodents than in primates could indicate a greater reliance of multisensory
processing on low level cortices than on top down feedback projections from higher
level multisensory cortices as in primates. The involvement of the direct connections
between primary sensory cortices in cross-modal interactions has been demonstrated in
rodents (lurilli et al. 2012; Sieben et al. 2013, 2015). Top down projections to primary
sensory cortices from other sensory modalities and non-sensory cortices are nonetheless
present and diverse in rodents (Budinger et al. 2006; Budinger and Scheich 2009;
Charbonneau et al. 2012; Miller and Vogt 1984; Papema and Malach 1991; Zingg et al.
2014) and there is direct evidence for a contribution of top down feedback to the primary
vi suai cortex form association cortices in the mouse (Hirokawa et al. 2008; Y oshitake et

162
al. 2013) and transthalamic pathways (Sieben et al. 2013) in multisensory processing.
The relative contribution of direct connections between primary sensory areas and of
feedback projections from association cortical areas in multisensory processing is still an
open question.
Hierarchical order of primary sensory cortices
The layer indices obtained from the number of retrogradely labeled neurons in
supra- and infragranular layers show that the connection of the somatosensory cortex to
the visual cortex has features of a feedback projection that is reciprocated by a lateral
projection from the visual cortex. This asymmetry suggests that these two primary
sensory cortices might not be at the same hierarchical level in the cortical network.
Indeed, the asymmetry of reciprocal connections between cortical areas is the basis for
establishing hierarchical levels in the cortex (Coogan and Burkhalter 1993; Felleman
and Van Essen 1991; Hilgetag et al. 2000; Markov et al. 2014; Rockland and Pandya
1979). Negative layer indices, typical of feedback cortical projections, have also been
demonstrated in the mouse projection of somatosensory cortex to VI (Charbonneau et
al. 2012). In the gerbil, the connection from somatosensory to primary visual cortex also
has features of a feedback projection, whereas the reciprocal connection has those of a
lateral projection (Henschke et al. 2014). One study in the rat however, shows more
numerous retrogradely labeled neurons in the supragranular layers of VI following
tracer injections in somatosensory cortex suggesting a feedforward projection (Sieben et
al. 2013). In the gerbil, as we have also shown in the mouse (Charbonneau et al. 2012),

163
VI receives feedback projections from both the primary auditory and somatosensory
cortices. In the gerbil, these projections are reciprocated by a feedforward projection to
the auditory cortex and a lateral projection to the somatosensory cortex, and the auditory
and somatosensory cortices are reciprocally linked by lateral projections (Henschke et
aL 2014). This suggests that primary somatosensory and auditory cortices would be
higher in the cortical hierarchy than VI, and possibly at similar levels.
Primary sensory cortices, are the initial portals to cortical networks for specific
sensory modalities, and could have been expected to stand at the same hierarchicallevel
and linked by symmetric lateral connections. This is clearly not the case. It is generally
believed that in hierarchical cortical networks, a descending pathway is, reciprocated by
an ascending projection, and if one is lateral, its counterpart should also be lateral
(Felleman and Van Essen 1991). It has been suggested that the hierarchical organization
of cortical areas in the rat could be based on half steps in that a feedback projection
could be reciprocated by a lateral type projection (Coogan and Burkhalter 1993). Such
half steps were not reported in primates, in which feedback projections are strictly paired
with feedforward projections (Coogan and Burkhalter 1993). The use of continuous
indices such as the layer indices used here, have shown that the cortical areas are not
ranked in the cortical hierarchical structure in discrete steps but in a continuum of levels
(Markov et aL 2014; Vezoli et aL 2004).

164
The laminar distribution of anterogradely labeled tenninals demonstrates that both
projections between VI and SIBF have features offeedback projections as shown by the
dense terminal labeling in both supra- and infragranular layers and by the much lighter
labeling in layer 4 (Coogan and Burkhalter 1990, 1993). Indeed, in rodents, feedback
projections target both supra- and infragranular layer generally avoiding layers 4
whereas feedforward projections target all corticallayers (Coogan and Burkhalter 1990,
. 1993). Whether this terminal labeling in layer 4 is a specific attribute of projections
between primary sensory cortices is not known. There are no quantitative assessments of
the laminar distribution ofaxonal swellings in cortical projections in rodents showing
the absence of layer 4 labeling in feedback projections. We provide here a fust
quantitative evaluation of the laminar distribution ofaxonal swellings in corticocortical
projections between primary sensory cortices, and show significant tenninallabeling in
layer 4. Moreover, single axon reconstructions also show axonal branching in layer 4 in
both projections. This terminal labeling is quite different to what is seen in feedback
projections in primates that target mainly superficial cortical layers. There are no
accounts of terminal structure of projections between primary sensory cortices in
primates.
In the projection from the somatosensory barrel field to VI, the laminar distribution
of retrogradely labeled neurons in the barrel field and the terminallabeling in VI both
indicate that this projection has features of a feedback projection type. However, in the
projection from the visual cortex to the barrel field, the retro grade labeling and the

165
terminal labeling are not strictly consistent with a feedback or feedforward types of
projections. The laminar distribution of terminaIs in the barrel field is the same as the
one in VI and suggests a feedback projection whereas the laminar distribution of
retrogradely labeled neurons yields layer indices close to 0 suggesting a lateral type
projection. This could be particular to projections between primary sensory cortices and
could also indicate that a dichotomous classification of cortical projections m
feedforward and feedback types is not appropriate to describe all possibilities.
Asymmetry of the strength of the reciprocal projections between VI and SIBF
Retrograde transport of cholera toxin showed a stronger projection from VI to
SIBF than from SI and SIBF to VI. Similarly, a strong projection of the visual cortex
to the somatosensory cortex and a moderate reciprocal projection have been shown in
the gerbil (Henschke et al. 2014). In the gerbil, the primary visual cortex has the
strongest multisensory inputs receiving similar moderate inputs from the primary
auditory and somatosensory cortices. On the other hand, the somatosensory cortex
receives a strong input from the visual cortex but only a faint input from the auditory
cortex. The primary auditory cortex receives only faint inputs from the other primary
sensory cortices (Henschke et al. 2014). These observations suggest that the mutual
influences between the senses are not equivalent in strength. In the mouse, as in the
gerbil, the influence of the visual cortex on the somatosensory cortex would be the
stronger one.

166
A functional asymmetric reciprocity has also been shown between prÎmary visual
and somatosensory cortices in the mouse. Visual stimulation produces a small
subthreshold depolarisation of layer 2/3 neurons of the somatosensory cortex whereas
whisker deflection hyperpolarizes neurons in these layers by direct corticocortical
recruiting of local translaminar inhibitory circuits (lurilli et al. 2012).
Size ofaxonal swellings
The asymmetry of the reciprocal projections between VI and SlBF is also seen in
the size distribution ofaxonal swellings. AlI cortical layers in SI BF had sorne larger
swellings not seen in VI. The size distributions we obtained here are commensurate with
those reported in the reciprocal connections between prÎmary and secondary auditory
cortices in mice (Covic and Sherman 2011). Class lB synapses are anatomically
correlated with larger synaptic terminals and Class 2 synapses with smaller synaptic
terminals (Covic and Sherman 2011; see Sherman and Guillery 20Ba). We surmise that
the larger swellings in the projection from VI to SlBF in our results, reflects a greater
proportion of Class 1 terminaIs therein and that the large population of smaller
swellings, which appears to be predominant in both projections, could be Class 2
terminals.
In thalamocortical and corticothalamic pathways, Class lB and 2 are respectively
considered drivers and modulators (Lee and Sherman 2008, 2009a, 2009b; Petrof and
Sherman 2013; Reichova and Sherman 2004; Sherman and Guillery 1996, 1998, 20Ba;

167
Viaene et al. 20 Il). This model of glutamatergic transmission predicts that information
flow depends on Class 1 pathways (Covic and Sherman 2011 ; Sherman and Guillery
20Ba). If this is the case, our results would indicate that visual information is
transmitted to the somatosensory cortex while tactile information can mostly modulate
activity in the visual cortex.
The presence of larger terminals in SlBF not found in VI would indicate that VI
might exert a driving influence on the somatosensory cortex that is not reciprocated in
its projection back to the visual cortex. This asymmetry could reflect the greater
influence of vision on whisker mediated tactile sensing and navigation in mice, and the
relative importance of the different senses in rodents, which rely less on visual stimuli
compared to the more visual carnivores and primates (Whishaw and Kolb 2004).
Moreover, the benefit of multisensory interactions is larger for sorne modalities
(Hollensteiner et al. 2015). The modality precision hypothesis states that the resolution
of intersensory discrepancies will be in favor of the more precise of the two modalities
(see Welch and Warren 1986 for review and references). This theory is based on an
order of dominance between sensory modalities derived from their respective spatial
precision. Whisker mediated tactile sensing is spatially more precise than vision in rats
and mice, tactile acuity greatly surpassing their visual discrimination capabilities
(Carvell and Simons 1990; Prusky et al. 2000; Wu et al. 2013). The presence of the
larger presumed Class 1 terminals in the projection from the visual cortex to the barrel
field would suggest that the visual cortex provides the somatosensory cortex with more

168
specifie visual infonnation than the reciprocal projection of S 1 BF to VI. Indeed, Class 1
responses are mediated by ionotropic receptors which exhibit fast postsynaptic response
dynarnics compared to the much slower Class 2 metabotropic mediated responses. Class
lB inputs will therefore maintain the highly specifie temporal attributes of the conveyed
infonnation (see Shennan and Guillery 2013a). In visuo-tactile integration, the less
precise visual infonnation will contribute in providing additional infonnation to the
somatosensory cortex through a stronger driving projection. The absence of larger
terminaIs in the projection from the barrel field to the visual cortex suggests that it has
more modulatory influence on visual cortex activity. This could indicate that in the
mouse, vision is more important to enhance the context of whisking and that tactile
infonnation is not as important for the enhancement of visual infonnation.
It is noteworthy that there are very few larger swellings in the visual cortex
projection to the barrel field. This is also observed in many other cortical and subcortical
pathways. Even though Class 1 inputs are considered as the main infonnation carriers in
thalarnic circuits, it is common that they are vastly outnumbered by Class 2 inputs,
accounting for less than 10% of the total number of synapses in thalamus, with sorne
estimates putting them as low as 2% (Huppé-Gourgues et al. 2006; Van Hom et al.
2000; Wang et al. 2002). Retinogeniculate projections are considered as Class 1 inputs
and are functionally the dominant input to geniculate neurons however they account for
only 5% of geniculate synapses whereas cortical inputs account for 30 to 40% of
synapses therein (Erisir et al. 1998; Van Hom et al. 2000). We cannot evaluate the

169
proportions of tenninals that could be assigned to these functional classes having no
basis for detennining a eut-off size as a reliable criterion for such a classification.
However, we do provide the frrst quantitative unbiased stereological sampling ofaxonal
swellings laminar and size distributions in a cortical connection. This sampling clearly
shows that small terminals, that would most likely have Class 2 properties, largely
outnumber the larger terminals.
In the projection from VI to SlBF, there were no significant differences of the size
distributions ofaxonal swellings between layers. This pattern is different than what was
reported in the corticocortical connection between auditory (Covic and Sherman 2011)
and visual cortices (De Pasquale and Sherman 20 Il). In the reciprocal connection
between primary and secondary auditory cortices, layers 5a and 6 received almost only
Class 2 inputs whereas layer 5b received almost only Class lB inputs. This was
correlated with anatomical observations showing significantly smaller tenninals in
layers 4 and 5b than in layers 5a and 6 (Covic and Sherman 2011). We show here that
there is a wide range of terminal sizes in the supragranular layers in the somatosensory
cortex that would support the presence of the two types of postsynaptic responses.
Conversely, in the projection from SlBF to VI, the swellings in layer 4 were smaller
than those in the bottom tiers of layer 5. Whether this indicates a greater contribution of
Class 1 inputs therein is possible, but very large terminals were not observed in this
projection to the somatosensory cortex.

170
Single axon morphology
This is the only account of single axon morphology of interareal connections
between primary sensory cortices. Although we have here only small samples of axons,
significant observations can be drawn from these. There is a diversity of morphologies
in both projections; supporting previous studies in showing that a single cortical
projection likely comprises several morphofunctional conduction channels (see
Rockland 2015 for further references and discussion). This is further supported by the
diversity in the laminar distribution of terminaIs for each of these axons. The overall
laminar distribution of terminals results from the sum of individual axons that have very
different terminal arbor structures. Axonal morphologies exhibit a mosaic of features.
Sorne axons had terminal arbors that form a more or less defmed columnar projection
with a limited tangential spread, whereas others were widely divergent over large
distances. Sorne axons show both features. These are not typical of axons in cortical
feedforward and feedback projections in monkeys. In general, feedforward axons have a
more focused structure whereas feedback axons appear to trave! greater distances and
cross functional domains such as ocular dominance columns (see Rockland 2002 for
review). Such a mixture of columnar and divergent features could be particular to
connections between primary sensory cortices or can also be related to the less-modular,
salt-and-pepper organisation of the mouse cortex. The more divergent axons seen here
were in the projection from VI to the barrel field and would likely target more than one
barrel.

171
In corticotha1amic projections there are two very distinct types of axons (see
Shennan and Guillery 20Bb for extended discussion). Thick axons originate from layer
5 pyramidal neurons and bear type II axon tenninals that convey Class 1 inputs. Thin
axons are issued by neurons of layer 6 and bear type 1 axon terminaIs that convey Class
2 inputs (Bourassa and Deschenes 1995; Bourassa et al. 1995; Shennan and Guillery
20Ba). There is no evidence here for corticocortical axons with exclusively large
terminals similar to the thick corticothalamic axons issued by layer 5 neurons. There are
several reconstructed axons in our sample that bear only very small tenninals and axon
on which a wider range of terminal sizes occur. On these particular axons, again very
small terminaIs largely outnumber the larger ones. This might indicate two distinct types
of axons on the basis of the presence of sorne larger terminaIs.
Axons entering the somatosensory barrel field were significantly thicker than the
axons entering the primary visual cortex. Moreover in S1BF there were a few quite thick
axons that were never observed in the projection to the visual cortex, further supporting
the asymmetric projections between the two primary sensory cortices. Previous studies
in primates have shown that corticofugal axons originating from different cortical areas
have different diameters whereas the thickness of axons of inter-area connections was
not different (Tomasi et al. 2012). Another study showed that corticocortical projections
to different targets may have axons of different diameters (Innocenti et al. 2014). Our
results show here that both projections comprise mainly a population of quite thin axons
with the projection to the visual cortex having the thinner axons and that the projection

172
of SIBF to the visual cortex contains a few larger caliber axons. Axonal diameter is
related to conduction speeds. Therefore, we might expect that the projection from the
somatosensory barrel field is more homogeneous in this "respect than the projection from
the visual cortex to the barrel field. The greater range in axon diameters in the projection
to the barrel field supports the idea that a single connection can be a complex channel
comprising a range of parallel axonal pathways that might generate different conduction
delays (Innocenti et al. 2014).
Conclusions
This study shows a direct and reciprocal connection oflateral type from VI to SIBF
and of feedback type from SIBF to VI. This direct link between the vi suaI cortex and
the barrel field further supports the notion that primary sensory cortices integrate
multisensory inputs. This study indicates that these heteromodal connections between
low-Ievel primary sensory cortices although reciprocal, are certainly not symmetrical.
This reciprocal connection between the vi suaI cortex and the barrel field could be the
anatomical substrate of the influence of vision on tactile sensing and navigation by the
whiskers in mice. We show here that the reciprocal connection between the vi suaI and
somatosensory cortex of the mouse would be a good experimental model for the study of
functional and behavioral asymmetries between sensory modalities.
Acknowledgements We are grateful to Nadia Desnoyers for animal care and maintenance. This work was supported by discovery grants of the Natural Sciences and Engineering Research Council of Canada (NSERC) to DB and GB, and the Canadian Foundation for Innovation to DB. SR was supported by an NSERC undergraduate student award. Contributions from UQTR are also acknowledged.

173
References
Berezovskii VK, Nassi 11 and Born RT. 20 Il. Segregation of feedforward and feedback projections in mouse visual cortex. 1 Comp Neurol. 2011/05/28:3672-3683.
Bizley JK and King AJ. 2009. Visual influences on ferret auditory cortex. Hear Res. 258:55-63.
Bizley JK, Nodal FR, Bajo VM, Nelken 1 and King Al. 2007. Physiological and anatomical evidence for multisensory interactions in auditory cortex. Cereb Cortex. 17:2172-2189.
Bourassa 1 and Deschenes M. 1995. Corticothalamic projections from the primary visual cortex in rats: A single fiber study using biocytin as an anterograde tracer. Neuroscience. 66:253-263.
Bourassa 1, Pinault D and Deschenes M. 1995. Corticothalamic projections from the cortical barrel field to the somatosensory thalamus in rats: A single-fibre study using biocytin as an anterograde tracer. Eur 1 Neurosci. 7:19-30.
Brosch M, Selezneva E and Scheich H. 2005. Nonauditory events of a behavioral procedure activate auditory cortex of highly trained monkeys. 1 N eurosci. 2005/07/22:6797 -6806.
Budinger E, Heil P, Hess A and Scheich H. 2006. Multisensory processing via early cortical stages: Connections of the primary auditory cortical field with other sensory systems. Neuroscience. 143:1065-1083.
Budinger E, Laszcz A, Lison H, Scheich H and Ohl FW. 2008. Non-sensory cortical and subcortical connections of the primary auditory cortex. in Mongolian gerbils: Bottom-up and top-down processing of neuronal information via field AI. Brain Res. 1220:2-32.
Budinger E and Scheich H. 2009. Anatomical connections suitable for the direct processing of neuronal information of different modalities via the rodent primary auditory cortex. Hear Res. 258:16-27.
Campi KL, BaIes KL, Grunewald Rand Krubitzer L. 2010. Connections of auditory and visual cortex in the prairie vole (Microtus ochrogaster): Evidence for multisensory processing in primary sensory areas. Cereb Cortex. 2009/04/28:89-108.
Cappe C and Barone P. 2005. Heteromodal connections supporting multisensory integration at low levels of cortical processing in the monkey. Eur 1 Neurosci. 22:2886- 2902.

174
Cappe C, Rouiller EM and Barone P. 2009. Multisensory anatomical pathways. Hear Res. 2009/05/05:28-36.
Carvell GE and Simons DJ. 1990. Biometric analyses of vibrissal tactile discrimination in the rat. JNeurosci. 10:2638-2648.
Caviness VS. 1975. ArchitectoIÙc map of neocortex of the normal mouse. J Comp Neurol. 164:247-263.
Charbonneau V, Laramée ME, Boucher V, Bronchti G and Boire D. 2012. Cortical and subcortical projections to primary visual cortex in anophthalmic enucleated and sighted mice. Eur J Neurosci. 2012/07/12:2949-2963.
ClavagIÙer S, Falchier A and Kennedy H. 2004. Long-distance feedback projections to area VI: Implications for multisensory integration, spatial awareness, and visual consciousness. Cogn Affect Behav Neurosci. 2004/10/06:117-126.
Coogan TA and Burkhalter A. 1990. Conserved patterns of cortico-cortical connections define areal hierarchy in rat visual cortex. Exp Brain Res. 80:49-53.
Coogan TA and Burkhalter A. 1993. Hierarchical orgaIÙzation of areas in rat visual cortex. JNeuroscÎ. 13:3749-3772.
Covic EN and Sherman SM. 20 Il. Synaptic properties of connections between the primary and secondary auditory cortices in mice. Cereb Cortex. 21 :2425-2441.
De Pasquale R and Sherman SM. 2011. Synaptic properties of corticocortical connections between the primary and secondary visual cortical areas in the mouse. J NeuroscÎ.31:16494-16506.
Driver J and Noesselt T. 2008. Multisensory interplay reveals crossmodal influences on 'sensory-specific' brain regions, neural responses, and judgments. Neuron. 2008/01/11: 11-23.
Erisir A, Van Hom SC and Sherman SM. 1998. Distribution of synapses in the lateral geIÙculate nucleus of the cat: Differences between laminae A and Al and between relay cells and interneurons. J Comp Neurol. 390:247-255.
Ernst MO and Bulthoff HH. 2004. Merging the senses into a robust percept. Trends Cogn Sci. 8:162-169.
Falchier A, Cappe C, Barone P and Schroeder CE. 2013. Sensory convergence in lowlevel cortices. In Stein BE. The new handbook of multisensory processing. The MIT Press, Cambridge MA, London England, pp. 67-79.

175
Falchier A, Clavagnier S, Barone P and Kennedy H. 2002. Anatomical evidence of multimodal integration in primate striate cortex. J Neurosci. 2002/07/05:5749-5759.
Felleman DJ and Van Essen DC. 1991. Distributed hierarchical processing in the primate cerebral cortex. Cereb Cortex. 1: 1-47.
Foxe JJ, Morocz lA, Murray MM, Higgins BA, Javitt DC and Schroeder CE. 2000. Multisensory auditory-somatosensory interactions in early cortical processing revealed by high-density electrical mapping. Brain Res Cogn Brain Res. 2000/09/09:77 -83 .
Franklin, BJ and Paxinos, G. 2008. The Mouse Brain in Stereotaxic Coordinates.
Ghazanfar AA and Schroeder CE. 2006. Is neocortex essentially multisensory? Trends Cogn Sci. 10:278-285.
Giard MH and Peronnet F. 1999. Auditory-visual integration during multimodal object recognition in humans: A behavioral and electrophysiological study. J Cogn Neurosci. 1999/10/08:473-490.
Godement P, Saillour P and Imbert M. 1979. Thalamic afferents to the visual cortex in congenitally anophthalmic mice. Neurosci Lett. 13 :271-278.
Gonchar Y and Burkhalter A. 1999. DifferentiaI subcellular localization of forward and feedback interareal inputs to parvalbumin expressing GABAergic neurons in rat visual cortex. J Comp Neurol. 406:346-360.
Gonchar Y and Burkhalter A. 2003. Distinct GABAergic targets of feedforward and feedback connections between lower and higher areas of rat visual cortex. J Neurosci.23:10904-10912.
Henschke ru, Noesselt T, Scheich H and Budinger E. 2014. Possible anatomical pathways for short-Iatency multisensory integration processes in primary sensory cortices. Brain Struct Funct. 220:955-977.
Hilgetag CC, O'Neill MA and Young MP. 2000. Hierarchical organization of macaque and cat cortical sensory systems explored with a novel network processor. Philos Trans R Soc Lond B Biol Sci. 355:71-89.
Hirokawa J, Bosch M, Sakata S, Sakurai y and Yamamori T. 2008. Functional role of the secondary visual cortex in multisensory facilitation in rats. Neuroscience. 153:1402-1417.

176
Hishida R, Kudoh M and Shibuki K. 2014. Multimodal cortical sensory pathways revealed by sequential transcranial electrical stimulation in mice. N eurosci Res. 87:49-55.
Hollensteiner KJ, Pieper F, Engler G, Konig P and Engel AK. 2015. Crossmodal integration improves sensory detection thresholds in the ferret. PLoS One. 1 O:eO 124952.
Huppé-Gourgues F, Bickford ME, Boire D, Ptito M and Casanova C. 2006. Distribution, morphology, and synaptic targets of corticothalamic terminaIs in the cat lateral posterior pulvinar complex that originate from the posteromedial lateral suprasylvian cortex. J Comp Neurol. 497:847-863.
Innocenti GM, Vercelli A and Caminiti R. 2014. The diameter of cortical axons depends both on the area of origin and target. Cereb Cortex. 24:2178-2188.
Iurilli G, Ghezzi D, Olcese U, Lassi G, Nazzaro C, Tonini R, Tucci V, Benfenati F and Medini P. 2012. Sound-driven synaptic inhibition in primary visual cortex. Neuron. 73:814-828.
Kaas JH and Collins CE. 2013. The resurrection of multisensory cortex in primates: Connection patterns that integrate modalities. In Calvert GA., Spence C. & Stein B. The handbook ofmultisensory processes. The MIT Press, Cambridge, pp. 285-293.
Laurienti PJ, Burdette JH, Wallace MT, Yen YF, Field AS and Stein BE. 2002. Deactivation of sensory-specific cortex by cross-modal stimuli. J Cogn Neurosci. 14:420-429.
Lee CC and Sherman SM. 2008. Synaptic properties of thalamic and intracortical inputs to layer 4 of the frrst- and higher-order cortical areas in the auditory and somatosensory systems. J Neurophysiology. 100:317-326.
Lee CC and Sherman SM. 2009a. Glutamatergic inhibition in sensory neocortex. Cereb Cortex. 19:2281-2289.
Lee CC and Sherman SM. 2009b. Modulator property of the intrinsic cortical projection from layer 6 to layer 4. Front Syst Neurosci. 3:3.
Macaluso E. 2006. Multisensory processing m sensory-specific cortical areas. Neuroscientist. 2006/07/15:327-338.

177
Markov NT, Vezoli J, Chameau P, Fa1chier A, Quilodran R, Huissoud C, Lamy C, Misery P, Giroud P, Ullman S, Barone P, Dehay C, Knoblauch K and Kennedy H. 2014. Anatomy of hierarchy: Feedforward and feedback pathways ID macaque visual cortex. J Comp Neurol. 522:225-259.
Miller MW and Vogt BA. 1984. Direct connections of rat visual cortex with sensory, motor, and association cortices. J Comp Neurol. 226:184-202.
Paperna T and Malach R. 1991. Patterns of sensory intermodality relationships in the cerebral cortex of the rat. J Comp Neurol. 308:432-456.
Petrof l and Sherman SM. 2013 . Functional significance of synaptic terminal size in glutamatergic sensory pathways in thalamus and cortex. J Physiol. 591 :3125-3131.
Prusky GT, West PW and Douglas RM. 2000. Behavioral assessment ofvisual acuity in mice and rats. Vision Res. 40:2201-2209.
Reichova l and Sherman SM. 2004. Somatosensory corticothalamic projections: Distinguishing drivers from modulators. J Neurophysiology. 92:2185-2197.
Rockland KS. 2002. Visual cortical organization at the single axon level: A beginning. Neurosci Res. 42:155-166.
Rockland KS. 2015. Article about connections. Front Neuroanat. 9:61.
Rockland KS and Ojima H. 2003. Multisensory convergence in calcarine visual areas in macaque monkey. Int J Psychophysiol. 2003/09/27:19-26.
Rockland KS and Pandya DN. 1979. Laminar origins and terminations of cortical connections of the occipital lobe in the rhesus monkey. Brain Res. 179:3-20.
Schroeder CE, Smiley J, Fu KG, McGinnis T, O'Connell MN and Hackett TA. 2003. Anatomical mechanisms and functional implications of multisensory convergence in early cortical processing. Int J Psychophysiol. 2003/09/27:5-17.
Sherman SM and Guillery RW. 1996. Functional organization ofthalamocortical relays. J Neurophysiol. 76:1367-1395.
Sherman SM and Guillery RW. 1998. On the actions that one nerve cell can have on another: Distinguishing "drivers" from "modulators". Proc Natl Acad Sci USA. 95:7121-7126.
Sherman, SM and Guillery, RW. 2013a. Functional connections of cortical areas. Cambridge MA, London England: MIT Press.

178
Sherman, SM and Guillery, RW. 2013b. Functional connections of cortical areas. A new view from the thalamus. Cambridge, Massachusetts; London, England: MIT Press.
Sieben K, Bieler M, Roder B and Hanganu-Opatz IL. 2015. Neonatal Restriction of Tactile Inputs Leads to Long-Lasting Impairments of Cross-Modal Processing. PLoS Biol. 13:elO02304.
Sieben K, Roder B and Hanganu-Opatz IL. 2013. Oscillatory entrainment of primary somatosensory cortex encodes vi suai control of tactile processing. J Neurosci. 33:5736-5749.
Stehberg J, Dang PT and Frostig RD. 2014. Unimodal primary sensory cortices are directly connected by long-range horizontal projections in the rat sensory cortex. Front Neuroanat. 8:93.
Stein BE and Meredith MA. 1993. The Merging of the Senses.
Stein BE and Stanford TR. 2008. Multisensory integration: CUITent issues from the perspective of the single neuron. Nat RevNeurosci. 2008/03/21:255-266.
Tomasi S, Caminiti R and Innocenti GM. 2012. Areal differences in diameter and length of corticofugal projections. Cereb Cortex. 22:1463-1472.
Van Hom SC, Erisir A and Sherman SM. 2000. Relative distribution of synapses in the A-Iaminae of the lateral geniculate nucleus of the cat. J Comp Neurol. 416:509-520.
Vezoli J, Falchier A, Jouve B, Knoblauch K, Young M and Kennedy H. 2004. Quantitative analysis of connectivity in the visual cortex: Extracting function from structure. Neuroscientist. 10:476-482.
Viaene AN, Petrof 1 and Sherman SM. 2011. Synaptic properties of thalamic input to layers 2/3 and 4 of primary somatosensory and auditory cortices. J Neurophysiol. 105:279-292.
Wang Q and Burkhalter A. 2007. Area map of mouse visual cortex. J Comp Neurol. 502:339-357.
Wang Q, Spoms 0 and Burkhalter A. 2012. Network analysis of corticocortical connections reveals ventral and dorsal processing streams in mouse visual cortex. J Neurosci.2012/03/30:4386-4399.
Wang S, Eisenback MA and Bickford ME. 2002. Relative distribution of synapses in the pulvinar nucleus of the cat: Implications regarding the "driver/modulator" theory of thalamic function. J Comp Neurol. 454:482-494.

179
Welch RB and Warren DH. 1986. Intersensory interactions. In BoffKR., Kaufman L. & Thomas JP. Handbook of perception and human performance. J. Wiley, New York, pp. 25-1-25-36.
West Ml. and Gundersen H.J. 1990. Unbiased stereological estimation of the number of neurons in the human hippocampus. J.Comp Neurol. 296: 1-22.
West MJ, Slomianka L and Gundersen HJ. 1991. Unbiased stereological estimation of the total number of neurons in the subdivisions of the rat hippocampus using the optical fractionator. Anat Rec. 231 :482-497.
Whishaw IQ and Kolb B. 2004. The Behavior of the Laboratory Rat: A Handbook with Tests: Oxford University Press, USA.
Wu HP, loffe JC, Iverson MM, Boon JM and Dyck RH. 2013 . Novel, whiskerdependent texture discrimination task for mice. Behav Brain Res. 237:238-242.
Yamashita A, Valkova K, Gonchar Y and Burkhalter A. 2003 . Rearrangement of synaptic connections with inhibitory neurons in developing mouse visual cortex. J Comp Neurol. 2003/08/06:426-437.
Yoshitake K, Tsukano H, Tohmi M, Komagata S, Hishida R, Yagi T and Shibuki K. 2013. Visual map shifts based on whisker-guided cues in the young mouse visual cortex. Cell Rep. 5:1365-1374.
Zakiewicz lM, Bjaalie JG and Leergaard TB. 2014. Brain-wide map of efferent projections from rat barrel cortex. Front Neuroinform. 8:5.
Zingg B, Hintiryan H, Gou L, Song MY, Bay M, Bienkowski MS, Foster NN, Yamashita S, Bowman l , Toga AW and Dong HW. 2014. Neural networks of the mouse neocortex. Cell. 156: 1 096-1111.

Chapitre III Effects of enucleation on the direct reciprocal corticocortical connections between
prÎmary visual and somatosensory cortices of the mouse1
1 Le contenu de ce chapitre est présenté sous forme de manuscrit qui a été soumis durant l' automne 2016 dans la revue European Journal ofNeuroscience: Massé, 1.0., Bronchti, G. et Boire, D.

Title: Effects of enucleation on the direct reciprocal corticocortical connections between
primary visual and somatosensory cortices of the mouse.
Authors: Ian O. Massé, Gilles Bronchti, Denis Boire
Affiliations:
Département d'anatomie Université du Québec à Trois-Rivières Canada, G9A 2W7

182
Running title: Enucleation effects on visuo-tactile connections.
Abstract: In the sensory deprived brain, the intermodal cortical connections appear to
play a more significant role in sensory processing. Although some studies report
enhanced functional intermodal cortical connectivity in the blind, others report a
contradictory finding of decreased functional connectivity of the visual cortex in blind
subjects. The purpose of this study is to compare the direct reciprocal intermodal
corticocortical connections between the primary visual (VI) and somatosensory (81)
cortices in intact and C57Bl/6 mice enucleated at birth, and to determine quantitative
differences in the strength and laminar distribution of neurons and terminals in these
projections through iontophoretic injections of high molecular weight biotinylated
dextrans (BDA) and of the B fragment of cholera toxin (CTB). The size ofaxonal
swellings was measured and frequency distribution determined for each cortical layer.
Axon diameters were also sampled in these connections. CTB labeled neurons were used
to estimate the relative weight of projections between VI and 81 , and their laminar
distribution used to classify them as feedback, feedforward or lateral projections. CTB
injections in VI resulted in a greater proportion of labeled cells in 81 of intact mice than
of enucleated mice. Following injections of BDA in VI , a greater range of swelling size
was observed in 81 of intact mice compared to enucleated mice, suggesting that normal
sensory activity is required for the normal development of Class 1 driver projections
from VI or that a homeostatic adjustment of these terminals size is produced by high
levels of activity in these projection neurons. This study provides evidence for

183
alterations in intennodal connections through anatornical changes following visual
deprivation.
Keywords: Blind, intennodal, cross-modal, corticocortical connections, visuo-haptic
interaction.

184
Introduction
Visually deprived humans have greater abilities in processing somatosensory stimuli
than sighted individuals (Van Boven et al. , 2000; Wan et al., 2010). These capabilities
appear to be correlated with the activation of their visual cortex by somatosensory
stimuli (Gougoux et al., 2005; Roder et al. , 2001). This somatosensory activation of the
visual cortex has also been observed in visually deprived rodents (Nys et al. , 2014; Toldi
et al., 1988, 1994; Van Brussel et al. , 2011). These results suggest underlying intermodal 1
plasticity following the loss of visual inputs.
Several mechanisms have been put forth to explain how intermodal interactions are
established in visually deprived individuals (Bavelier & Neville, 2002). The fust
mechanism involves subcortical pathways directly conveying non-visual activity to the
primary visual cortex (VI). The second mechanism involves a reorganization of
intermodal cortical circuits which includes two hypotheses. The fust hypothesis
suggested that the existing connections between the visual areas and the areas of other
modalities are amplified in the blind, as to increase the amount of non-visual sensory
information that can be sent to the occipital cortex (Kahn & Krubitzer, 2002; Karlen et
al., 2006; Klinge et al. , 2010; Wittenberg et al. , 2004). The second hypothesis proposed
that these existing connections are reduced in the blind, because of the lack of
coordination between the sensory systems (Pascual-Leone et al., 2005). The third and ~
last mechanism proposed instead that intermodal corticocortical connections in the blind
are unmasked by synaptic changes (Pascual-Leone et al., 2005; Pascual-Leone &

185
Hamilton, 2001). In the present study, we set out to investigate the influence of the
visual experience during the postnatal life on the development of the corticocortical
connections between VI and the primary somatosensory cortex (SI) in mice.
It is lmown that activity from sensory receptors can significantly influence the
development of cortical connectivity. Although sorne studies report amplified functional
intermodal cortical connectivity (Fujii et al., 2009; Klinge et al., 2010), others report a
reduced connectivity of the visual cortex with other primary sensory cortices in blind
subjects (Liu et al., 2007; Yu et al., 2008). Few studies have been devoted to the effects
of blindness on the efferents of VI. The topography and size of striate extrastriate
projections were altered in rodents enucleated at birth (Bravo & Inzunza, 1994; Laing et
al., 2012; Laramée et al., 2013).
In contrast to primates (Cappe & Barone, 2005; Clavagnier et al., 2004), there are
significant direct connections between primary sensory cortices in rodents (Budinger et
al., 2006; Budinger & Scheich, 2009; Campi et al., 2010; Charbonneau et al., 2012;
Henschke et al., 2014; Iurilli et al., 2012; Massé et al., 2016; Papema & Malach, 1991;
Sieben et al., 2013; Stehberg et al., 2014; Wang & Burkhalter, 2007; Zingg et al., 2014).
The mouse is therefore an interesting model for the study of alterations in intermodal
connections between primary sensory cortices following visual deprivation.
•

186
The projections between VI and SlBF in intact and C57Bl/6 mice enucleated at
birth will be studied in order to quantify the relative strengths of the connections with
both retro grade and anterograde tracers. The size ofaxonal swelIings and axons will be
compared between intact and enucleated cases to study the effects of blindness on the
driving influence of VI on SlBF and the conduction velocity ofits axons.
Methods
AnimaIs were treated in accordance with the regulations of the Canadian Council
for the Protection of Animals and the study was approved by the Animal Care
committee of the Université du Québec à Trois-Rivières. C57Bl/6J mice (n = 40)
(Charles River, Montreal, QC, Canada) from our colonies were used. Intact C57Bl/6J
mice (n = 20) served as controls and neonatally enucleated C57Bl/6J mice (n = 20) were
studied as a mode! of visual deprivation. AlI animals were kept under a lightldark cycle
of 14/1 0 hours and were adults (60 days) when sacrificed.
Neonatal enucleation
Bilateral enucleations of C57Bl/6J mouse pups were performed within 24h
folIowing birth under deep anesthesia by hypothermia. The palpebral fissure was opened
with a scalpel, the eyeball was gently pulled out and the optic nerve was sectioned.
Ocular orbits were filIed with Gelfoam (Upjohn, Kalamazoo, MI, USA) and newboms
were warmed until complete awakening before being retumed to their home cage.

187
Tracing procedures
AIl animaIs were adults (60 days) when the cortical tracer injections were
performed. Surgie al anesthesia was achieved and maintained with inhalation of 1.5-2.5%
isoflurane and vital signs were monitored throughout the procedures. The animals were
mounted on a stereotaxie apparatus. Mice were protected from ocular dryness by
applying ophthalmic ointment (polysporin; Pfizer, Toronto, ON, Canada). A scalp
incision was made along the rnidline to expose the skull. For injections in the primary
visual cortex (VI), a small craniotomy was performed 3.7 mm caudal and 2.5 mm lateral
to Bregma or, for injections in the barrel field of the primary somatosensory cortex
(SIBF), 1.5 mm caudal to Bregma and 2.9 mm from the rnidline. The dura was incised
and a glass rnicropipette filled with a solution of the b-fragment of cholera toxin (CTb)
or biotinylated dextran amine (BDA) was inserted into the cortex. Retrograde and
anterograde neuronal tracing was achieved with iontophoretic injections of 1 % solution
of CTb and of a 10% solution of high molecular weight BDA (10 kDa) (Molecular
Probes, Cedarlane Laboratories, Ontario, Canada) respectively in phosphate-buffered
saline (PBS) through glass rnicropipettes (20 Jlm tip diameter) into VI for 20 animals
and SIBF for 20 animals for each tracer. A 1.5 JlA positive current with a 7-s duty cycle
was applied for 10 min, starting at a depth of 500 Jlm and ending at 100 Jlm from the
pial surface, 2 min at each 100 Jlm. The rnice were kept warm until they recovered from
anesthesia and postoperative pain was managed with buprenorphine (Temgesic,
Schering-Plough, Hertfordshire, UK; i.p. ; 0.009 mg/kg) injected before anesthesia was
induced.
188
After a 2-day survival period for CTb injections and 7-day survival period for BDA
injections, mice received an intraperitoneal injection of 120 mg/kg sodium pentobarbital
(Euthanyl; Bimeda-MTC, Cambridge, ON, Canada) and were perfused through the heart
with PBS (pH 7.4) followed by phosphate-buffered 4% paraformaldehyde. Brains were
harvested, postfixed for 1-2 hours, cryoprotected with 30% sucrose and frozen prior to
sectioning and CTb or BDA processing.
Serial 50-~m-thick coronal sections were taken using a freezing microtome. One
series was processed for CTb immunohistochemistry and the other was mounted on
slides and stained with cresyl violet to identify the cortical areas and layers. Sections
processed for BDA histochemisty were counterstained with bisbenzimide to identify the
cortical areas and layers.
To visualize CTh labeled neurons, free-floating sections were treated for 45 min
with 0.15% H202 and 70% methanol to quench endogenous peroxidase and thoroughly
rinsed in 0.05 M Tris-HCI-buffered 0.9% saline solution (TBS, pH 8.0) containing 0.5%
Triton X-lOO (TBSTx). Sections were then incubated in 2% normal donkey serum
(NDS) for 2 hours and transferred to a solution of primary antibody (goat polyclonal
anti-CTh 1:4 000; Molecular Probes) with 1% NDS in PBS-Tx for 2 days at 4°C.
Subsequently, sections were rinsed in PBS-Tx and incubated in a secondary antibody
(biotinylated donkey anti-goat; 1 :500; Molecular Probes) solution with 1% NDS in
PBS-Tx for 2 hours at room temperature. Following further rinsing, the sections were

189
then incubated for 90 min in an avidin-biotin complex solution (Elite Vectastain, Vector
Laboratories, PK4000 Standard kit) in TBS-Tx, pH 8.0, rinsed in TBS, and then
incubated in a 0.015% ' 3-diaminobenzidine (DBA) solution. Labeled neurons were
revealed by the addition of 0.005% H202. Sections were washed and mounted on
gelatin-subbed slides, air-dried, dehydrated and cover-slipped with Permount mounting
media (Fisher Scientific, Ottawa, ON, Canada).
For BDA staining, after quenching endogenous peroxidase, sections were incubated
for 90 min in an avidin-biotin complex solution (ABC Vectastain elite), washed and
BDA was revealed using nickel-intensified DAB (Sigma-Aldrich, St-Louis, MO, USA)
as a chromogen. Sections were pre-incubated for 30 min in Tris-buffered (TB) (0.05 m)
nickel ammonium sulfate 0.4%, pH 8.0, followed by 10 min in TB-nickel ammonium
containing 0.015% DAB and 0.005% H202. Sections were dehydrated in ethanol,
cleared in xylenes and cover-slipped with Eukitt mounting media.
Charting of retrogradely labeled neurons
AlI CTb retrogradely labeled neurons on one of every two sections of SI , SIBF,
V2M, V2L, Ml , M2, S2 and of VI were plotted using an Olympus BX51 WI microscope
(20 x 0.75 NA objective) equipped with a three-axis computer-controlled stepping motor
system coupled to a personal computer and to a color Optronix CCD camera and driven
by the Neurolucida software (MBF Biosciences, Williston, VT, USA).

190
The whole primary and secondary somatosensory, motor and visual cortices were
systematically and randomly sampled on sections spaced 200 /lm apart. Cortical areas
were delineated at lower magnification (4 X, 0.16 NA objective) on adjacent Nissl
stained sections. Borders between cortical areas were delineated according to the
cytoarchitectonic descriptions provided by Caviness (1975) and the mouse brain atlas of
Franklin and Paxinos (2008). Contours of each cortical area in which retrogradely
labeled cells were located were traced with Neurolucida and the limits of each cortical
layer were traced. These contours were superimposed on the images of CTb-reacted
sections and resized for shrinkage differences between the Nissl and CTb sections. This
allowed plotted neurons in each cortical area to be assigned to supragranular, granular or
infragranular layers for the calculation of layer indices. These indices provide a
quantitative assessment of the laminar distribution of retrogradely labeled neurons and
are instrumental in the classification of corticocortical feedback, feedforward and lateral
connections (Felleman & Van Essen, 1991). Layer indices (L) were calculated using the
contrast formula where S and 1 are the numbers of labeled neurons in supragranular and
infragranular layers respectively (Budinger et al. , 2006, 2008; Budinger I!' Scheich,
2009; Cappe & Barone, 2005):
L = ((S-1)) / ((S+1))
The indices range between -1 and 1. Negative values indicate feedback connections
mostly originating in infragranular layers and positive values indicate feedforward
connections mostly originating in supragranular layers. Values near zero indicate lateral
191
connections. AlI photomicrographs were cropped and luminosity and contrast were
adjusted with Adobe Photoshop software.
Stereological sampling of laminar distribution ofaxonal swellings
In order to provide an unbiased size frequency distribution ofaxonal swelIings in
each cortical layer for the projection from VI to the SI barrel field and the reciprocal
projection from the SI barrel field to VI , a stereological systematic random sampling of
these projection fields was performed using the Stereo Investigator software (MBF
Bioscience ).
Projection fields in which anterograde labeling was observed were sampled using
the optical fractionator workflow (in Stereo Investigator) on approximately 10
equidistant sections covering the full anteroposterior range of the projection, except for
the fourth intact case injected with BDA in VI in which the projection extended to oruy
5 sections. On each section, polygonal contours were traced around the projection field
in each cortical layer. Axonal swelIings were then counted in no less than 100 square
disectors of 20 ~m si de length and 15 ~ height, everuy distributed at the intersections
of an 80x80 ~m sampling spacing grid. The maximum diameter was measured for each
sampled swelIing at higher magnification (100X, 1.4 NA objective).
This optical fractionator sampling strategy allowed for the estimation of the total
number of swellings in each cortical layer. The total numbers of swellings (N) were

192
calculated by the following equation (West et al., 1991) where ~Q is the total number of
swellings counted within the disectors, ssf is the section sampling fraction (number of
sampled sections over the total number of sections on which the terminal projection field
appears), asf is the area sampling fraction (ratio of the frame are a/the total area of the
reference space on the section) and tsf is the thickness-sampling fraction (disector
heightl section thickness):
N = EQxss.f' (-1) xas.f'(-l) xts.f'(-l)
Product of ssf, asf and tsf is the overall sampling faction (see Tables 12, 13, 14 and
15). Coefficients of error (CEs) were calculated according to the procedure described by
West and Gundersen (1990), in order to determine whether the sampling effort was
sufficient. It is widely accepted as a rule of thumb that CEs below 0.1 are indicative of a
sufficient sampling. The main objective of this stereological sampling was not to
determine the total number of swellings that are labeled for each injection, as this
number is a function of the injection size, but to obtain unbiased estimates of laminar
and size distributions.

193
Table 12
Stereological sampling parameters for the estimation of the number of anterogradely labeled axonal swellings in each layers in SiBF after injections ofBDA
into Vi ofintact C57Bl/6 mice
Case Layer Number Total Number Number Sampling Total CE of area of of fraction estimation
sections (mm2) dissectors objects
I-ID 9 8661 106 313 0.004 84662 0.060 IV 9 5663 117 164 0.006 26279 0.053 Va 9 3150 117 178 0.011 15865 0.065
Vbc 9 5407 115 164 0.006 25527 0.050 VI 9 3950 116 78 0.009 8793 0.097
Total 45 26831 571 897 (0.007) 161126 (0.065) (Mean)
2 I-ID 9 6593 112 329 0.005 64112 0.074 IV 9 4580 III 118 0.007 16117 0.075 Va 9 2257 128 139 0.017 8115 0.074
Vbc 9 3969 119 129 0.009 14243 0.089 VI 9 2050 111 80 0.016 4890 0.083
Total 45 19449 581 795 (0.011) 107477 (0.079) (Mean)
3 I-ID 9 17372 110 317 0.002 165717 0.075 IV 9 11941 112 158 0.003 55764 0.052 Va 9 6617 127 181 0.006 31218 0.060
Vbc 9 10180 123 156 0.004 42739 0.051 VI 9 10885 64 111 0.003 20776 0.063
Total 45 56995 536 923 (0.004) 316214 (0.060) (Mean)
4 I-ID 5 2507 106 174 0.013 13519 0.194 IV 5 1521 105 72 0.021 3427 0.201 Va 5 940 114 60 0.037 1626 0.192
Vbc 5 1408 110 90 0.024 3786 0.147 VI 5 1515 105 141 0.021 6685 0.167
Total 25 7891 540 537 (0.023) 29043 (0.180) (Mean)
5 I-ID 10 5745 118 97 0.006 17793 0.071 IV 10 3005 105 38 0.009 4097 0.097 Va 10 1821 120 63 0.018 3602 0.044
Vbc 10 2506 115 42 0.012 3449 0.052 VI 10 1398 112 40 0.021 1881 0.070
Total 50 14475 570 280 (0.013) 30822 (0.067) (Mean)

194
Table 13
Stereological sampling parameters for the estimation of the number of anterogradely labeled axonal swellings in each layers in SiBF after injections ofBDA
into Vi of enuc/eated C57Bl/6 mice
Case Layer Number Total Number Number Sampling Total CE of area of of fraction estimation
sections (mm2) dissectors objects
IC-01 1-1lI 10 7596 111 106 0.009 23344 0.076
IV 10 5712 117 100 0.ûl0 15712 0.079
Va 10 3582 119 99 0.010 9590 0.070
Vbc 10 6726 114 119 0.008 22596 0.071
VI 10 5632 113 74 0.014 11869 0.085
Total 50 29248 574 498 (0.010) 83111 (0.076) (Mean)
IC-02 1-1lI 11 9185 125 103 0.010 27566 0.087 IV 11 6728 123 40 0.025 7968 0.078
Va Il 3230 142 45 0.022 3729 0.093 Vbc 11 5141 138 70 0.014 9483 0.078
VI 11 6582 119 99 0.010 19945 0.089 Total 55 30866 647 357 (0.016) 68691 (0.085)
(Mean)
IC-03 1-1lI 10 1382 144 167 0.006 5161 0.063 IV 10 1534 139 85 0.012 3020 0.081
Va 10 1020 133 119 0.008 2937 0.068 Vbc 10 1922 125 73 0.014 3613 0.102
VI 10 2375 122 134 0.008 8395 0.106 Total 50 8233 663 578 (0.010) 23126 (0.084)
(Mean)
IC-04 1-1lI 10 10264 109 232 0.004 70308 0.046
IV 10 4180 135 233 0.004 23213 0.045 Va 10 2840 143 233 0.004 14896 0.036
Vbc 10 5188 127 220 0.005 28920 0.053
VI 10 6240 114 229 0.004 40346 0.048
Total 50 28712 628 1147 (0.004) 177683 (0.046) (Mean)
IC-05 1-1lI 10 1615 106 247 0.004 13688 0.042
IV 10 780 123 148 0.007 3432 0.055 Va 10 472 130 123 0.008 1597 0.059
Vbc 10 611 121 87 0.012 1580 0.071 VI 10 577 119 46 0.022 801 0.077
Total 50 4055 599 651 (0.011) 21098 (0.061) (Mean)
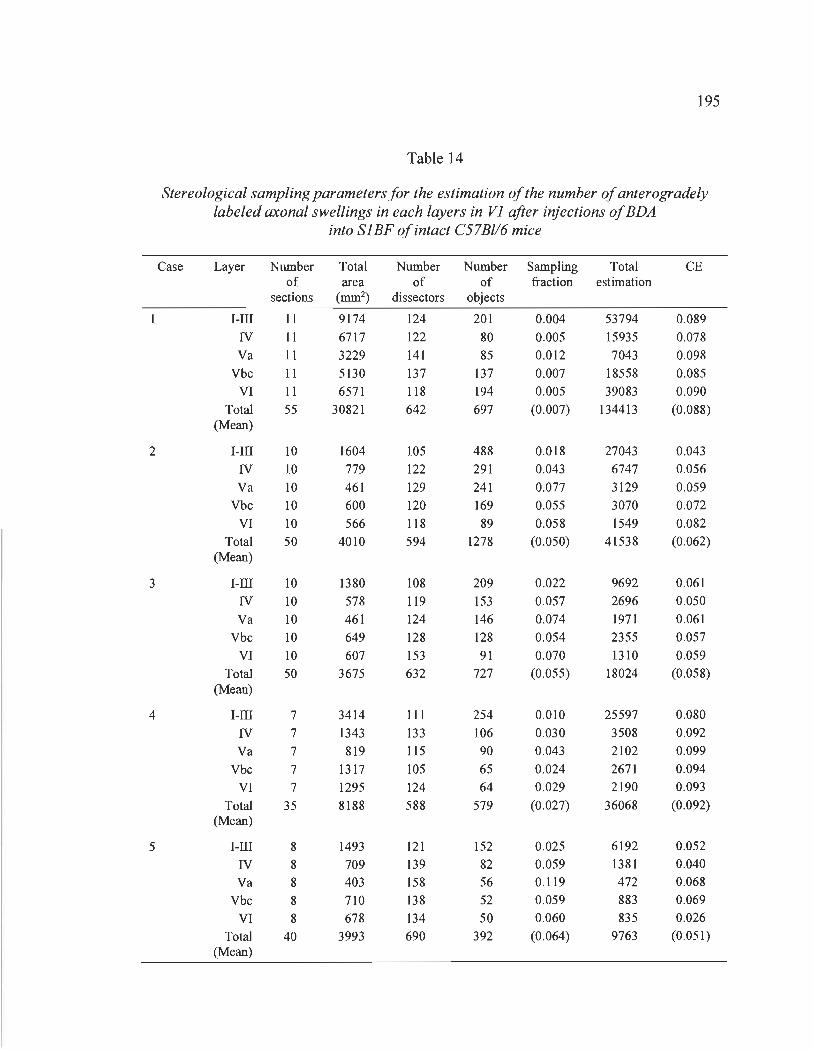
195
Table 14
Stereological sampling parameters for the estimation of the number of anterogradely labeled axonal swellings in each layers in Vi after injections of BDA
into SiBF ofintact C57BI/6 mice
Case Layer Number Total Number Number Sampling Total CE of area of of fraction estimation
sections (mm2) dissectors objects
1 I-ID 11 9174 124 201 0.004 53794 0.089 IV Il 6717 122 80 0.005 15935 0.078 Va 11 3229 141 85 0.012 7043 0.098
Vbc 11 5130 137 137 0.007 18558 0.085 VI 11 6571 118 194 0.005 39083 0.090
Total 55 30821 642 697 (0.007) 134413 (0.088) (Mean)
2 I-ID 10 1604 105 488 0.018 27043 0.043 IV 10 779 122 291 0.043 6747 0.056 Va 10 461 129 241 0.077 3129 0.059
Vbc 10 600 120 169 0.055 3070 0.072 VI 10 566 118 89 0.058 1549 0.082
Total 50 4010 594 1278 (0.050) 41538 (0.062) (Mean)
3 I-ID 10 1380 108 209 0.022 9692 0.061 IV 10 578 119 153 0.057 2696 0.050 Va 10 461 124 146 0.074 1971 0.061
Vbc 10 649 128 128 0.054 2355 0.057 VI 10 607 153 91 0.070 1310 0.059
Total 50 3675 632 727 (0.055) 18024 (0.058) (Mean)
4 I-ID 7 3414 111 254 0.010 25597 0.080 IV 7 1343 133 106 0.030 3508 0.092 Va 7 819 115 90 0.043 2102 0.099
Vbc 7 1317 105 65 0.024 2671 0.094 VI 7 1295 124 64 0.029 2190 0.093
Total 35 8188 588 579 (0.027) 36068 (0.092) (Mean)
5 I-ID 8 1493 121 152 0.025 6192 0.052 IV 8 709 139 82 0.059 1381 0.040 Va 8 403 158 56 0.119 472 0.068
Vbc 8 710 138 52 0.059 883 0.069 VI 8 678 134 50 0.060 835 0.026
Total 40 3993 690 392 (0.064) 9763 (0.051 ) (Mean)

196
Table 15
Stereological sampling parameters for the estimation of the number of anterogradely labeled axonal swellings in each layers in V1 after injections of BDA
into S1 BF of enuc/eated C57Bl/6 mice
Case Layer Number Total Number Number Sampling Total CE of area of of fraction estimation
sections (mm2) dissectors objects
IC-06 I-III 10 3284 116 36 0.028 3697 0.060
IV 10 1448 130 32 0.031 1293 0.054
Va 10 982 142 26 0.039 652 0.057
Vbc 10 1471 125 26 0.039 1110 0.080
VI 10 1875 116 18 0.056 1056 0.052
Total 50 9060 629 138 (0.039) 7808 (0.061) (Mean)
IC-07 I-III 10 8722 123 59 0.017 15177 0.069
IV 10 3326 135 52 0.019 4647 0.073
Va 10 1919 139 39 0.026 1954 0.083
Vbc 10 3572 123 46 0.022 4846 0.085
VI 10 3974 127 49 0.020 5562 0.058
Total 50 21513 647 245 (0.021) 32186 (0.074) (Mean)
IC-08 I-III 10 1391 109 21 0.048 974 0.067
IV 10 589 120 14 0.071 247 0.083
Va 10 472 125 15 0.067 203 0.072
Vbc 10 650 129 14 0.071 258 0.098
VI 10 618 154 9 0.111 130 0.094
Total 50 3720 637 73 (0.074) 1812 (0.083) (Mean)
IC-09 I-III 10 4451 112 66 0.015 9516 0.056
IV 10 1901 124 54 0.019 3003 0.056
Va 10 1017 145 65 0.015 1654 0.047
Vbc 10 2090 111 65 0.015 4440 0.042
VI 10 1017 118 57 0.018 1782 0.063
Total 50 10476 610 307 (0.016) 20395 (0.053) (Mean)
IC-lO I-III 8 3102 110 47 0.021 4879 0.087
IV 8 1242 128 42 0.024 1501 0.067
Va 8 733 127 33 0.030 701 0.102
Vbc 8 1249 129 35 0.029 1247 0.082
VI 8 1429 122 26 0.038 1121 0.123
Total 40 7755 616 183 0.028 9449 0.092 (Mean)
197
Sampling ofaxonal diameters
In order to compare the caliber of the axonal population entering the cortical areas
VI and the somatosensory barrel field between the intact and enucleated at birth cases,
the initial diameter of the axons as they leave the white matter to enter the cortical grey
layers of the target was calculated. Axonal diameter changes over short distances and a
single point measurement of the axonal diameter was not deemed adequate. To take this
into account and to obtain an unbiased estimate of the axons diameters, a weighted
average of diameter for the initial 25 ~m of each axon was calculated.
The Neurolucida software encodes reconstructions of traced axons as a succession
of small segments. Each segment is attributed coordinates in three-dimensional space, a
length and a diameter. These segments correspond to the interval between two mouse
clicks as the observer traces the axons. These clicks were done to record changes in
direction and/or diameter of the axons. The data were used to calculate the average
diameter over the frrst 25 ~m of the tracing from the point of entry of the axons into the
cortical grey matter, weighted by the length of the segments recorded over this distance.
The sampling of the measured axons was performed on the same sections that were
used for the stereological sampling ofaxonal swellings (see Table 12) to ensure that
axons were systematically and randomly selected. Axons were selected as they crossed
the line between the white and grey matter. The totallength ofthis line for each case and
the number of sampled sections are given in Table 16.
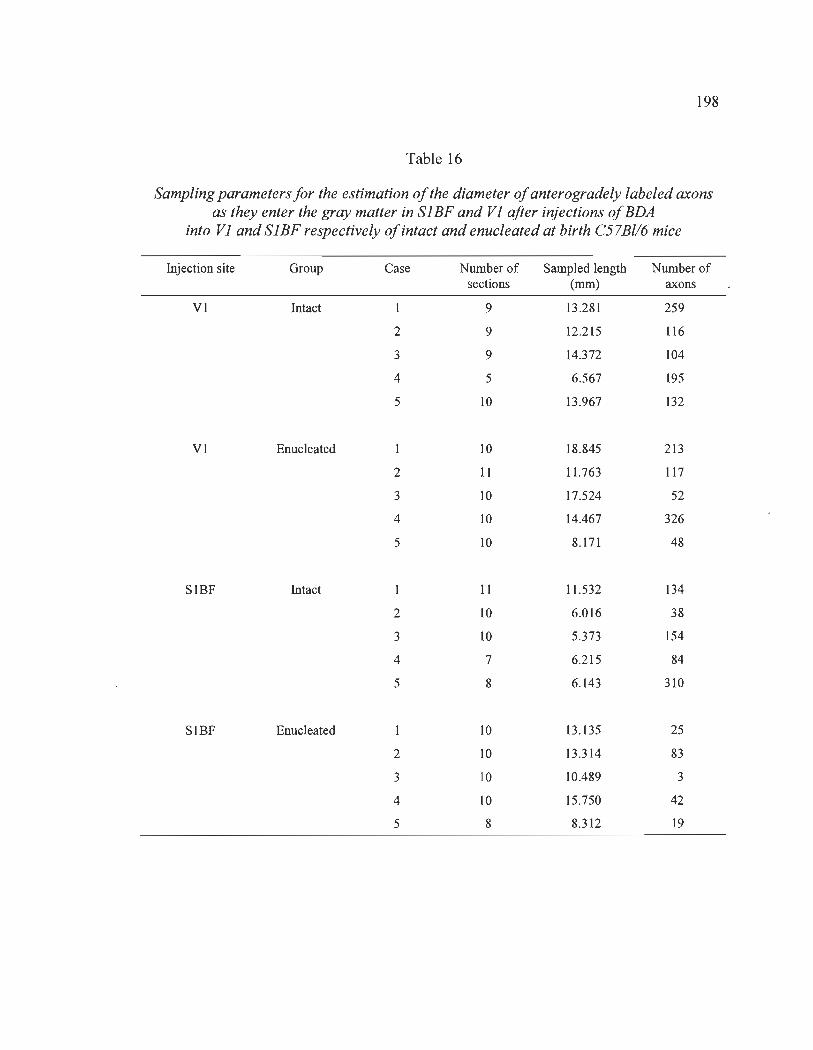
198
Table 16
Sampling parameters for the estimation of the diameter of anterogradely labeled axons as they enter the gray matter in SiBF and Vi after injections ofBDA
into Vi and Si BF respectively of intact and enuc/eated at birth C57Bl/6 mice
Injection site Group Case Numberof Sampled length Number of sections (mm) axons
VI Intact 9 13.281 259
2 9 12.215 116
3 9 14.372 104
4 5 6.567 195
5 10 13.967 132
VI Enucleated 10 18.845 213
2 11 11. 763 117
3 10 17.524 52
4 10 14.467 326
5 10 8.171 48
SIBF Intact 11 11.532 134
2 10 6.016 38
3 10 5.373 154
4 7 6.215 84
5 8 6.143 310
SIBF Enucleated 10 13.135 25
2 10 13.314 83
3 10 10.489 3
4 10 15.750 42
5 8 8.312 19

199
Statistical analysis
Statistical analyses were performed using SPSS v 16.0 software (SPSS, Chicago, IL,
USA). To test for significance of the differences in the relative abundance of labeled
neurons in each cortical area between intact and enucleated cases, Wilcoxon and Tukey
HSD tests were performed with a significance level of p < 0.05. To test for significance
of the differences in the layer indices in each cortical area between intact and enucleated
cases, Kruskal-Wallis and Tukey HSD tests were performed with a significance level of
p < 0.05. To test for significance of the differences in the size distribution of the
diarneters, Kolmogorov-Smirnov analyses were performed.
Results
Labeling of cortical visuotactile connections with eTb
Representative CTh injections sites in the visual cortex of intact (see Figure 28A)
and enucleated mice (see Figure 28C), and in the somatosensory barrel field in intact
(see Figure 29A) and enucleated mice (see Figure 29C) show that in all the intact cases,
CTh injections in VI anterogradely labeled axonal terminals and retrogradely labeled
numerous neuronal cell bodies in SI (see Figure 28B). Conversely, CTb injections in VI
ofthe enucleated cases resulted in very few labeled neurons in SI (see Figure 28D). CTh
injections in SIBF produced similar anterograde and retro grade labeling in VI of intact
and enucleated cases (see Figures 29B and 29D respectively).

200
INTACT ENUCLEATED
Figure 28. A: An injection of CTb in VI of intact C57BV6 mice produced in B: Anterograde and retro grade labeling in SIBF. C: An injection of CTb in VI of enucleated C57BV6 mice produced in D: Anterograde and retro grade labeling in SIBF. Scales: 1000 J.IlIl (AfC) and 200 J.IlIl (BID).
INTACT ENUCLEATED
-A c
Figure 29. A: An injection of CTh in SIBF of intact C57BV6 mice produced in B: Anterograde and retro grade labeling in VI. C: An injection of CTh in SIBF of enucleated C57BV6 mice produced in D: Anterograde and retro grade labeling in VI. Scales: 1000 ~m (AfC) and 200 ~m (BID).

201
CTh injections in VI and SIBF labeled numerous neurons in the primary and
secondary somatosensory, motor and visual cortices. None of the injections damaged the
underlying white matter. AlI the observed retrogradely labeled neurons were plotted in
SI , SIBF, V2M and V2L following CTb injections in VI and were plotted in Ml, M2,
S2 and VI following CTb injections in SIBF. Quantifications of labeled neurons were
performed in V2M, V2L, Ml , M2 and S2 in order to compare the projections between
VI and SI as a ratio of the number of labeled neurons in these areas over the total
number of labeled neurons rather than absolute numbers of neurons which are directly
related to the differences in injection size.
Even though the number of labeled neurons varied between cases, and is dependent
upon the injection size, all injections were performed with the same parameters and a
comparison of the percentage of labeled neurons is instructive of the strength of the
projections. Quantifications for all cases are detailed for the intact and enucleated cases
in Table 17 and a comparison of the percentage of retrogradely labeled neurons in
cortical areas is illustrated in Figure 30A. There were statistically significant differences
in the percentage of labeled neurons observed in SI (Wilcoxon, p = 0.032) and V2M
(Wilcoxon, p = 0.016) bètween the intact and enucleated cases following injections in
VI. Conversely, CTh injections in SIBF resulted in no statistically significant
differences in the percentage oflabeled neurons in VI.

202
Significant differences in the percentage of labeled neurons in cortical layers were
observed between the intact and enucleated cases following injections in VI (see
Figure 30B). A greater proportion of labeled neurons was found in layers 1 to 3 of SI in
the intact cases compared to the enucleated cases (Wilcoxon, p = 0.032). Significant
differences in the percentage of labeled neurons in cortical layers were also observed
between the intact and enucleated cases following injections in SIBF (see Figure 30C).
A lesser proportion of labeled neurons was found in layer V of S2 in the intact cases
compared to the enucleated cases (Wilcoxon,p = 0.008).

Table 17
Number and percentage (in parentheses) of retrogradely labeled neurons in neocortical areas after injections of CTb into the primary visual cortex (Vi) and the primary somatosensory cortex (Si) ofintact and enucleated C57Bl/6 mice
Injection site Case
V 1 Intact CT9
CT20
CT25
CT26
CT31
Mean± SEM
VI Enu CT52
CT53
CT54
CT55
CT57
Mean± SEM
Cortical area
SI
85 (4.43)
16 (1.59)
15 (1.87)
39 (10.74)
28 (3.14)
36.60 ± 14.39
(4.35 ± 1.87)
5 (0.52)
5 (0.79)
21 (1.14)
6 (0.76)
28 (2.60)
13.00± 5.40
(1.16 ± 0.42)
SIBF V2M V2L
164 (8.55) 448 (23.35) 1222 (63 .68)
10 (1.00) 183 (18.23) 795 (79.18)
56 (6.97) 93 (11.58) 639 (79.58)
112 (30.85) 45 (12.40) 167 (46.01)
62 (6.94) 181 (20.67) 622 (69.65)
80.80 ± 29.45 190.00 ± 77.91 689.00 ± 189.54
(10.86 ± 5.77) (17.16±2.54) (67.62 ± 6.91)
9 (0.94) 272 (28.42) 671 (70.12)
2 (0.32) 143 (22.59) 483 (76.30)
18 (0.98) 507 (27.63) 1289 (70.25)
14 (1.77) 227 (28.63) ' 546 (68.85)
12 (1.11) 333 (30.92) 704 (65.37)
11.00 ± 3.00 296.40 ± 68.30 738.60 ± 160.30
(1.02 ± 0.26) (27.64 ± 1.54) (70.18 ± 1.98)

Table 17
Number and percentage (in parentheses) of retrogradely labeled neurons in neocortical are as after injections of CTb into the primary visual cortex (V1) and the primary somatosensory cortex (S1) ofintact and enucleated C57Bl/6 mice (continued)
Injection site Case
SI Intact 03-02b7
SI Enu
04-01b2
03-02b4
03-02b5
03-02b6
Mean± SEM
2
3
4
5
Mean± SEM
Cortical area
Ml
148 (11.23)
726 (37.10)
800 (24.17)
929 (26.84)
450 (23.40)
610.60 ± 156.20
(24.55 ± 4.62)
313 (25 .93)
124 (11.05)
328 (26.95)
158 (11.41)
115 (9.02)
207.60 ± 52.22
(16.87 ± 4.40)
M2
209 (15.86)
573 (29.28)
1510 (45 .62)
1197 (34.59)
323 (16.80)
762.40 ± 283.17
(28.43 ± 6.26)
574 (47.56)
339 (30.21)
617 (50.70)
600 (43.32)
535 (41.96)
533.00 ± 56.38
(42.75 ± 3.91)
S2 VI
415 (31.49) 546 (41.43)
582 (29.74) 76 (3 .88)
600 (18.13) 400 (12.09)
1181 (34.12) 154 (4.45)
1117 (58.09) 33 (1.72)
779.00 ± 173.06 241.80 ± 110.78
(34.31 ±7.32) (12.71 ± 8.26)
243 (20.13) 77 (6.38)
381 (33 .96) 278 (24.78)
220 (18.08) 52 (4.27)
387 (27.94) 240 (17.33)
409 (32.08) 216 (16.94)
328.00 ± 44.54 172.60 ± 50.76
(26.44 ± 3.54) (13.94 ± 4.25)

205
A INJECllONS IN VI INJECTIONS IN SI BF
IOC
~ 80
• Intact n_ 4982 • • Intact n= 11969 • ii:
... Enuc"at~ n_S29S ..!. .. Â. Enucl. attd n z 6206 z • • § 60 • III :5 • Ô • • • i
40 * .- • - • • . .. • 4 • • !;1 .' ~
i · • ~ 20 * • t - <IL
• • · t .&-• • • • SI SIBF V2M V2L MI Ml S2 VI
B INJECTIONS IN VI
80 • • ~ 70 • ~ • ~60 • ,.
• z t .4-filso * • •• Al • ~ iiÎ • •• •• • • l t. :5 40 • ... - * Ô • .. - --r • .. • ~ • .d- • ~ 30 • • •• • 1 • • ~ 20 • • ~ • • -. •• • • - • • ~ ~. • • • • • .!. iF .~ • ~ .. 10 ~ t · .1.&
A if .• r .. • • 1-111 IV VI 1-111 IV VI HI! IV VI HII IV VI
SI SIBF V2M V2L
C INJECTIONS IN SI BF
80
t ~ 70 • 1-z -0 ... • ~60 • .. ., z • §SO ~. •• :t • •• • !il ~
, • :540 • • • • • ... i5
.... • ,I • • • • • • ~3O * ... • • • -< T ~ 1 .- P ~2O • • a.... • u •• -.! • • .1 4t
,. ffi •• • ~ 10 .. ï. et .;. :t
1-111 IV VI 1-111 IV VI H II IV VI 1411 IV VI
MI Ml S2 VI
Figure 30_ A: Percentage of retrogradely labeled neurons in cortical areas following an injection of CTh in VI and SIBF. Percentage of retrogradely labeled neurons in each cortical layer following an injection ofCTh in VI (B) and in SIBF (C).

206
Laminar distribution of Cholera toxin b labeled neurons
Layer indices are summarized for the intact and enucleated cases in Table 18, and
illustrated in Figure 31. Following eTh injections in VI of the intact and the enucleated
cases, there were more labeled neurons in infragranular than in supragranular layers of
SI, SIBF, V2M and V2L. Rence, layer indices were negative in the majority of the
cases, indicating the structure of a feedback projection to VI from SI , SIBF, V2M and
V2L. There was a statistically significant difference in the layer indices of SI between
intact and enucleated cases (Kruskal-Wallis,p = 0.032).
A INJECTIONS IN Vl B INJECTIONS IN SlBF
0..2 02 • • -• "" • * • T • • • • .t- •
·02 • ... • · 0..2 • .. t · .... 1:5 - 1:5 • 0 .!. t 0
~ ·0.4 • ~ -0.4 • .-.. ~ 1 1 S .. t :s • • .,
·0..6 • • • · 0..6 • • • • • • .. · 0..8
. .. · 0..8 •• ..
• · 1 .. . Ml · 1
Sl SlBF V2M V2l Ml M2 52 Vl
Figure 31. Layer indices for neocortical areas following an injection of eTh in VI and SIBF.
eTh injections in SIBF of the intact and the enucleated cases labeled more neurons
in infragranular than in supragranular layers of Ml, M2 and S2. Rence, layer indices
were negative in the majority of the cases, suggestive of feedback projections to SIBF
from Ml, M2 and S2. There were labeled neurons in similar proportion in supra- and

207
infragranular layers in VI and, in all cases except one, layer indices were near zero,
indicating a lateral type of connection between two areas of sunilar hierarchical levels
within the cortical network.

Table 18
Numbers of retrogradely labeled neurons in layers I-IIIIIV/ V/ VI and layer indices (below) in neocortical areas after injections of CTh into the primary visual cortex (VI) and the primary somatosensory cortex (SI) ofintact and enuc/eated C57Bl/6 mice
Injection Case
Cortical area site SI SIBF V2M V2L
VI CT9 14 / 11 /33 / 27 23 / 25/55 / 61 106/50 / 219/73 338 / 113 / 555 / 216 -0.62 -0.67 -0.47 -0.39
Intact CT20 4 / 0 / 9 / 3 0 / 0 / 3/7 42 / 14 / 111 / 16 239 / 90 / 339 / 127 -0.5 -1.00 -0.50 -0.32
CT25 4 / 0 / 5 / 6 13 / 0 / 27/16 35 / 8 / 41/9 333 / 67 / 195 / 44 -0.47 -0.54 -0.18 0.16
CT26 6 / 8 / 13 / 12 19 / 6 / 41 / 46 13 / 3 / 26 / 3 57 / 5 / 70 / 35 -0.61 -0.64 -0.38 -0.30
CT31 11 / 1/8 / 8 8 / 0 / 27 / 27 67 / 14 / 86/14 218 / 32 / 278 / 94 -0.19 -0.74 -0.20 -0.26
Mean Sup/Inf ± 8 ± 2/25 ± 10 13±5/62 ± 21 53 ± 18/120 ± 52 237 ± 57/391 ± 127 SEM -0.52 ± 0.09 -0.66 ± 0.09 -0.39 ± 0.08 -0.25 ± 0.11
VI CT52 1 / 0/1 / 3 1 / 0 / 4 / 4 83 / 66 / 11 0 / 13 223 / 156 / 193/99 -0.60 -0.78 -0.19 -0.13
Enu CT53 0 / 1 / 4 / 0 0 / 0 / 1 / 1 41 / 31 / 57 / 14 200 / 67 / 158 / 58 -1.00 -1.00 -0.27 -0.04
CT54 3 / 0 / 11 / 7 2 / 4 / 3 / 9 165 / 57 / 271 / 14 461 / 191 / 495 / 142 -0.71 -0.71 -0.27 -0.16
CT55 0/1 / 3 / 2 0 / 5 / 4 / 5 67 / 2 / 145 / 13 195 / 58 / 219 / 74 -1.00 -1.00 -0.40 -0.20
CT57 1 / 1 / 12 / 14 0 / 1 / 9/2 93 / 32/196 / 12 238 / 80 / 296 /90 -0.93 -1.00 -0.38 -0.24
Mean Sup/Inf ± 1 ± 1/11 ± 5 1 ± 0/8 ± 3 90 ± 23/169 ± 41 263 ± 56/365 ± 83 SEM -0.84 ± 0.09 -0.87 ± 0.07 -0.31 ± 0.04 -0.16 ± 0.04

Table 18
Numbers of retrogradely labeled neurons in layers I-IIIIIV/ V/ VI and layer indices (below) in neocortical areas after injections of eTh into the primary visual cortex (VI) and the primary somatosensory cortex (SI) ofintact and enuc/eated C57Bl/6 mice
(continued)
Injection site Case Cortical area
Ml M2 S2 VI
SI 03-02b7 81 / 0 / 58 / 9 103 / 0/104 / 2 38 / 26 / 87 / 264 216 / 94 / 137 / 99 0.10 -0.01 -0.81 -0.04
Intact 04-01b2 332 / 0 / 348 / 46 340 / 0 / 221 / 12 122 / 47 / 142 / 271 34 / 3 / 16 / 23 -0.09 0.19 -0.54 -0.07
03-02b4 127 / 0 / 404 / 269 259 / 0 / 990 / 261 124 / 40 / 179 / 257 157 / 40 / 127 / 76 -0.68 -0.66 -0.56 -0.13
03-02b5 405 / 0 / 451 /73 551 / 0 / 573 / 73 373 / 75 / 368 / 365 79 / 15 / 32 / 28 -0.13 -0.08 -0.33 0.14
03-02b6 167 / 0 / 221 / 62 133 / 0 / 178 / 12 169 / 60 / 257 / 631 16 / 5 / 7 / 5 -0.26 -0.18 -0.68 0.14
Mean Sup/Inf ± 222 ± 70/388 ± 120 277 ± 90/485 ± 239 165 ± 63/564 ± 134 100 ± 42/110 ± 51 SEM -0.27 ± 0.15 -0.27 ± 0.16 -0.55 ± 0.09 -0.05 ± 0.06
SI 58 / 0 / 217 / 38 128 / 0 / 440 / 6 17 / 5 / 84 / 137 32 / 5 / 23 / 17 -0.63 -0.55 -0.86 -0.11
Enu 2 31 / 0 / 73 / 20 88 / 0 / 240 / 11 40 / 8/180/153 144 / 13 / 48 / 73 -0.50 -0.48 -0.79 0.09
3 94 / 0 /194 / 40 151 / 0 / 452 / 14 15 / 8/75 / 122 12 / 3/19/18 -0.43 -0.51 -0.86 -0.51
4 47 / 0 / 101 / 10 178 / 0 / 415/7 53 / 38 / 123 / 173 119 / 6 / 42 / 73 -0.41 -0.41 -0.70 0.02
5 44 / 0 / 62 / 9 275 / 0 / 256 / 4 39 / 25 / 161 / 184 108 / 16 / 34 / 58 -0.24 0.28 -0.80 0.08
Mean Sup/Inf ± SEM 55 ± 12/153 ± 43 164 ± 35/369 ± 54 33 ± 8/278 ± 36 83 ± 29/81 ± 20 -0.47 ± 0.07 -0.39 ± 0.12 -0.79 ± 0.03 0.01 ± 0.13

210
Laminar distribution ofaxonal swellings
An injection of BDA in VI of intact and enuc1eated mice produced anterograde
labeling of axons in SI , largely restricted to the barrelfield in each of the IO cases.
Labeled axons were found in infra- and supragranular layers of SIBF. Axonal terminal
labeling was most intense in the supragranular layers. Labeling was similar in both the
intact and enuc1eated cases, except that labeling in layer I was much more pronounced
in the enuc1eated group. Quite large swellings were observed in SIBF of intact (see
Figure 32A) but not in the enuc1eated mice (see Figure 32B).
An injection of BDA in SIBF of intact and enuc1eated mice produced anterograde
labeling of axons in infra- and supragranular layers of VI in the intact group and to a
lesser extent in the enuc1eated group. Labeled terminals were most evident in layers I to
3, with a greater density in the lower part of layer 2 in the intact group and in the
superior part of layer 2 in the enuc1eated group. In both intact (see Figure 32C) and in
enuc1eated mice (see Figure 32D) oruy quite small swellings were observed. None ofthe
injections damaged the underlying white matter.
The injections ofBDA in both VI and SIBF of intact and enuc1eated mice resulted
in anterograde axonallabeling in SIBF and VI respectively, without signs of retro grade
transport. In order to compare the labeling ofaxonal terminaIs in intact and enuc1eated
cases, stereological estimates were performed of the laminar distribution ofaxonal

211
swellings in SIBF and VI (see Figures 33A and 33B respectively) following an
injection ofBDA in VI and SIBF respectively.
There were no significant differences in the laminar distribution ofaxonaI swellings
in SIBF and VI between the intact and enuc1eated cases. The stereologicaIly estimated
numbers of anterograde1y labeled axonaI swellings in each layers of SI are given in
Table 12 and 13 for the intact and enuc1eated C57B1I6 mice respectively and the
numbers of anterogradely labeled axonaI swellings in each layers of VI are shown in
Table 14 and 15 for the intact and enuc1eated C57B1I6 mice respectively.
Figure 32. High power photomicrographs of swellings in SIBF of intact and enuc1eated mice (A and B resp). High power photomicrographs of swellings in VI of intact and enuc1eated mice (C and D resp). Black arrows point larger axonal swellings and white arrows point smaller swellings. ScaIes: 25 ~m.

212
A PROJECTION FROM V1 TO 5 1 BF , 1-11 1
IV --+---
Va -+-
Vb-Vc -t--D Intact n = 3 4 3 2
VI • Enucleat e d n 3231
o 15 30 45 60 NUMBER OFAXONAL SWELLINGS (%l
B PROJECTION FROM 51 BF TO V1 , 1-111
IV --+---
Va -+-
Vb-Vc -t--D Intact n = 3673
VI • Enucleated n 946
o 15 30 45 60 NUMBER OFAXONAL SWELLINGS (%l
Figure 33. Laminar distribution of the number ofaxonal swellings in SIBF (A) and VI (B) following and injection of BDA in VI and SIBF respectively of intact and enucleated mice. n = number of counted swellings.
Size distribution ofaxonal swellings in corticallayers
The size distribution ofaxonal swellings counted with the systematic stereological
sampling was compared between the intact and enucleated groups for each cortical
layers for the projection from VI to SIBF (see Figure 34 A-B) and from SIBF to VI
(see Figure 34C-D). The size of the axonal swellings ranged between 0.3 !lm and 2 !lm
for the intact cases in the projection from VI to SIBF and between 0.2 !lm and 1.3 !lm
for the enucleated cases. The axonal swellings in S IBF of the intact group were larger

213
than in the enucleated group in layers 1 to 3 (Kolmogorov-Smirnov tests, p < 0.001),
layer 4 (Kolmogorov-Smirnov tests, p < 0.001), layer Sa (Kolmogorov-Smirnov tests,
p < 0.001), layers Sb and Sc (Kolmogorov-Smirnov tests, p < 0.001) and layer 6
(Kolmogorov-Smirnov tests, p = 0.001) (see Figure 34B). The size of the axonal
swellings ranged between 0.3 IJm and 0.9 IJm for the intact cases in the projection from
SlBF to VI and between 0.1 IJm and 1.4 IJm for the enucleated cases. The axonal
swellings in V 1 of the intact group were smaller than in the enucleated group in layers 1
to 3 (Kolmogorov-Smirnov tests, p = 0.014) and layer 4 (Kolmogorov-Smirnov tests,
p = 0.036) (see Figure 34D).

A 60
45
~
~ 30
~ 15
0 0
B
1-111
IV
~ Va
Vb-Vc
VI
0
C 60
45
~ ~ 30
~ 15
0 0
D
1- 111
IV
~ Va
Vb-Vc
VI
0
0.5
-----c::I:J
c::I:J
PROJECTION FROM Vl TO S1 BF
1.5
1- 111
IV
Va
Vb-Vc
VI
2
Intact Enucleated
n=3432 n=3231
2.5 AXONAL 5WELUNG DIAMETER (~M)
PROJECTION FROM Vl TO 51 BF
1 i! . \$ 0 Intact
3
-----c::I:J---1 =
Enucleated
------r::::I:J
-c:r:::J
0.5
1 i! .
1 = 1.5 2
AXONAL 5WELUNG DIAMETER (~M)
PROJECTION FROM 51BFTO Vl
HII
IV
Va
Vb-Vc
VI
2.5
Intact Enucleated
n = 3673 n = 946
1.5 2 2.5
AXONAL 5WELUNG DIAMETER (~M)
PROJECTION FROM 51 BF TO Vl
~ 1 -. ~ .1 -~
~
~
0.5 1.5 2 2.5 AXONAL SWELUNG DIAMETER (~M)
3
3
3
214
Figure 34. Size distribution (A and C) and box plot representation (B and D) ofaxonal swelling size in SIBF (A and B) and VI (C and D) following injections of BDA in VI and SI BF respectively of intact and enucleated mice. The box plots depict the minimum and maximum values, the upper (Q3) and lower (QI) quartiles and the median.

215
Axonal thickness
The size distribution of the diameters ofrandomly sampled axons (see Table 16) as
they enter the grey matter was compared between the intact and enucleated cases for the
projection from VI to SlBF (see Figure 35 A-C) and from SlBF to VI (see
Figure 34 B-C). Axon thickness ranged between 0.1 and 1.9 for the intact cases in the
projection from VI to SlBF and between 0.1 and 1.2 for the enucleated cases. The
axons in SlBF of the intact group were larger than in the enucleated group
(Kolmogorov-Smirnov tests, p < 0.001) (see Figure 35C). Axon thickness ranged
between 0.1 and 0.5 for the intact cases in the projection from SlBF to VI and between
0.1 and 0.7 for the enucleated cases. The axons in VI of the intact group were not
significantly different than in the enucleated group (see Figure 35C).

216
A PROJECTION FROM VI TO 51 BF 100
80 ;. Intact Enucleated
" , , , , , , n=806 n=756
60 , ,
~ , , , ,
~ , , al , , , l5 40
, , a.. , , , ,
20 , , , , , , ,
0 ,
0 0,5 1,5 2 2,5 3 AXON DIAMETER (l'Ml
B 100
PROJECTION FROM51BFTOVI
80 Intact Enucieated
w n=720 n=172
I.!) 60
~ ffi 40 a..
20
0 0 0,5 1,5 2 2,5 3
AXON DIAMETER (l'Ml
C
VlTOS1BF ~I---------II 1 i
SIBFTOVI
o 0,5 1,5 2 2,5 3 AXON DIAMETER (l'Ml
Figure 35. Size distribution (A and B) and box plot representation (C) of the diameters ofrandomly sampled axons as they enter the gray matter in SIBF (A and C) and VI (B and C) following an injection of BDA in VI and SIBF respectively of intact and enucleated mice.

217
Discussion
The effects of enucleation on VI afferent projections
Visual pathways are generally affected by loss of sight. Bilateral enucleation results
in a significant reduction of the size of DLG and/or VI in the opossmn (Karlen &
Krubitzer, 2009), mouse (Hemnann & Rabinowicz, 1980; Massé et al. , 2014), rat
(Hemnann & Rabinowicz, 1980), cat (Berman, 1991), and monkey (Dehay et al. , 1989,
1996; Rakic, 1988; Rakic et al. , 1991). Moreover, visual input and spontaneous retinal
activity play important roles in the determination of cortical areas and their connectivity \
(see Pallas, 2001 for review). Our results show that enucleation reduces the strength of
somatosensory projections to the visual cortex, but has no effect on the strength ofvisual
projections to the somatosensory cortex. This reduction in the nmnber of projecting
neurons was previously demonstrated in the enucleated rnice (Charbonneau et al., 2012),
but our study provides a comparison between the nmnber of projecting neurons found
inside the barrel field, inside the rest of SI and inside the secondary somatosensory
cortex instead of considering the whole somatosensory cortex as a single group. Long
term visual deprivation would decrease the somatosensory afferents to the deprived
visual cortex. Sirnilarly, short transient reduction of somatosensory activity by the
trimming of whiskers in the frrst five days after birth also significantly reduced the direct
projection of the visual cortex to the somatosensory cortex cross-modal synchrony in SI
in adult rats (Sieben et al. , 2015). Previous studies have also demonstrated a decreased
functional connectivity between the visual cortex and the somatosensory cortex as weIl
as between the motor cortex and the temporal multisensory areas in blind hmnans (Liu et

218
al., 2007; Yu et al., 2008). This reduction in connectivity following visual deprivation
could be specific to the somatosensory modality, since the number of neurons projecting
from the primary auditory cortex to VI was not altered by early enucleation in mice
(Charbonneau et al., 2012). Moreover there are no major changes in cross-modal
connectivity patterns in deaf cats and ferrets (see Meredith & Lomber, 2016 for review).
Conversely, a transient visual deprivation in early life in humans, results in auditory
activation of the visual cortex, and this activation was interpreted as resulting from
maintained exuberant cross-modal corticocortical projections that would otherwise be
pruned out by normal visual activity during development (Collignon et al., 2015).
However, even though there is a reduction in the projection from SI to VI in the
visually deprived mice, there is evidence for cross-modal activation of the visual cortex
by tactile inputs in mice following binocular enucleation at birth (Nys et al. in prep) and
following monocular enucleation in adult mice (Nys et al., 2014, 2015; Van Brussel et
al., 20 Il) and many examples of cross-modal activation of the visual cortex in blind
humans (see Bavelier & Neville, 2002; Merabet & Pascual-Leone, 2010 for review).
These activations in mice would therefore be produced by a diminished projection from
the somatosensory cortex in the chronically blind mice. The absence of tactile activity in
the visual cortex in intact mice would be explained by the overwhelming predominance
of visual input from the intact visual pathways. There are many examples of cross-modal
activity in intact visual cortex. This activity can be conveyed to the vi suaI cortex by the
already present projections between primary sensory cortices that are quite strong in

219
rodents, or by descending projections for multisensory association cortices (see Meredith
& Lomber, 2016 for review). Similarly, blind individuals are more efficient than sighted
individuals in tactile discrimination tasks by having a better spatial resolution for
detecting tactile stimuli (Van Boven et al. , 2000) and by detecting more easily
vibrotactile stimuli (Wan et al. , 2010) and these abilities could be related to amplified
feedback projections from the multisensory associative areas to VI (Fujii et al. , 2009).
Our result could suggest that amplification of these pathways might not be the substrate
for these enhanced functional capabilities.
Our results show that visual deprivation could affect the development of the
feedback projections from different extrastriate cortical areas in mice. Indeed, there was
a reduced number of labeled neurons in V2M, whereas the number of labeled neurons
was not changed in V2L in the enucleated mice. Similar observations were obtained in
humans showing that the development of visual areas depend differently on visual
experience. More specifically, early visual areas are more dependent on normal visual
experience than higher level cortical areas and that ventral stream visual areas depend
more on normal visual input than the dorsal stream areas, these differences arising from
differences in connectivity patterns (Qin et al. , 2013). The mouse visual cortex also
comprises several functionally distinct extrastriate visual areas (Olavarria et al. , 1982;
Olavarria & Montero, 1989; Wang & Burkhalter, 2007). Moreover these areas have
distinct connectivity patterns (Wang et al. , 2011 , 2012) and functional properties
suggesting similar dorsal and ventral streams of processing (Andermann et al. , 2011;

220
Glickfeld et al., 20l3, 2014; Marshel et al., 2011; Matsui & Ohki, 20l3). In the mouse,
the medial/anterior extrastriate areas have similar connectivity patterns to dorsal stream
areas in primates and lateral areas to ventral stream areas (Wang et al., 2012). Our
present results suggest that in mice, the medial/dorsal stream areas might be more
dependent on normal visual input for their development than in humans, and might
reveal network structure differences between rodents and primates.
Our results also show that the strength of the projection of the visual cortex to the
somatosensory cortex is not altered by early enucleation. There are only a few studies
showing the effects of altered activity on the efferent projections of a brain structure and
these have mainly concentrated on terminal structure rather than on the neurons of origin
of these efferent projections (Garraghty et al. , 1986, 1987; Hsiao & Sherman, 1986;
Lachica et al., 1990; Pallas, 2001; Raczkowski et al., 1988; Ruthazer & Stryker, 1996;
Sur et al. , 1982). We had expected to fmd that blindness could induce a reduction in the
size of visual cortex efferent projections. Perhaps remaining spontaneous activity and
cross-modal activations are sufficient to maintain a normal complement of efferent
visual cortical projections at least to another non-deprived specific sensory cortex. The
lesser postnatal size increase of the visual cortex seen in enucleated mice compared to
the intact cases (Massé et al., 2014) could be explained by the reduction we observed in
the number of neurons projecting from primary sens ory cortices of other modalities such
as SI. This size reduction ofV1 however, would not affect the efferent projections to the
barrel field.

221
The effects of enucleation on the structure of the projections between VI and SI
In addition to the reduction of the number of neurons of SI projecting to VI in the
enucleated mice (Charbonneau et al. , 2012), we further show that this is mainly
explained by a loss of projection of supragranular layer neurons of SI. In primates and
rodents, feedforward projections originate mainly from supragranular layer neurons and
feedback projections, from infragranular layer neurons (Coogan & Burkhalter, 1990,
1993; Felleman & Van Essen, 1991 ; Rockland & Pandya, 1979). This pathway specific
laminar distribution of projection neurons emerges from an initial uniform laminar
distribution of neurons mainly through selective elimination of supragranular layer
projections in corticocortical feedback (Batardiere et al., 1998; Batardiere et al. , 2002;
Kennedy et al. , 1989) as well as in interhemispheric callosal projections (Innocenti &
Caffiiniti, 1980). Several studies have shown that normal visual experience is necessary
for the development of a normal complement of callosal projections and that altered
visual experience results in the supranormal elimination of callosal projections of
supragranular layer neurons (Boire et al., 1995; Frost & Moy, 1989; Frost et al., 1990;
Innocenti & Frost, 1980; Innocenti et al. , 1985). Therefore, as in cats, normal visual
experience is required for the normal establishment of supragranular layer projections in
the cortex.
The effects of enucleation on the thickness of axons and size axonal swellings
Visual deprivation also affected the size ofaxonal swellings in the projection from
the visual cortex to the barrel field of the primary somatosensory cortex. Indeed, the

222
larger axonal swelling observed in tbis projection in the intact mice were no longer
present in the enuc1eated mice. There is evidence for two types of glutamatergic synaptic
contacts in corticocortical connections (Covic & Shennan, 2011; De Pasquale &
Shennan, 2011; Petrof & Shennan, 2013). Class 1 synapses have larger initial excitatory
postsynaptic potentials, exhibit paired-pulse depression, are limited to ionotropic
glutamate receptor activation and are anatomically correlated with larger synaptic
terminaIs and Class 2 synapses have smaller initial excitatory postsynaptic potentials,
exhibit paired-pulse facilitation, are limited to metabotropic glutamate receptor
activation and are anatomically correlated with smaller synaptic terminaIs (Shennan &
Guillery, 2013). Class 1 and 2 are respectively considered drivers and modulators (Lee
& Shennan, 2008, 2009a, 2009b; Petrof & Shennan, 2013 ; Reichova & Shennan, 2004;
Shennan & Guillery, 1996, 1998, 2013 ; Viaene et al. , 2011). We surmise that the larger
swellings in the projection from VI to SIBF in our results reflect a greater proportion of
Class 1 terminals therein and that the large population of smaller swellings, wbich
appears to be predominant in both projections, to be Class 2 terminals. Axonal bouton
size is positively correlated with the number of synaptic vesic1es, active zone area and
the number of active zones (pierce & Lewin, 1994; Pierce & Mendell, 1993; Schikorski
& Stevens, 1997; Streichert & Sargent, 1989; Yeow & Peterson, 1991). Both pre- and
postsynaptic activity blockade result in an increase in post-synaptic density and size of
the synaptic active zone, bouton volume and increases neurotransmitter release (Murthy
et al. , 2001). This could be related to "disuse hypersensitivity" (Cannon, 1939; Duc1ert
& Changeux, 1995; Murthy et al., 2001 ; Sharpless, 1964, 1975a, 1975b) and regulated

223
by homeostatic regulation of synaptic strength (Turrigiano & Nelson, 2000). Our results
suggest that either Class 1 terminals might not form in the absence of normal sensory
activity or that these visual cortex projection neurons are highly active in the enucleated
mice reducing the size of these terminaIs. Our result also show that even the size
distribution of the smaller terminals is shifted towards lower diameter values, suggesting
that the size of all terminals is equally affected by the altered activity in the visual cortex
of the enucleated mice. There is yet no direct experimental demonstration that increased
activity results in decreased synaptic size (see Murthy et al. , 2001 for review). The
activity levels in the visual cortex of binocularly enucleated mice are not known.
Increase metabolic activity was reported in blind humans (De Volder et al., 1997;
Wanet-Defalque et al. , 1988). The visual cortex in these mice is not likely silent, it is
activated by auditory stimulation in enucleated rats (Piché et al., 2007) and mice (Nys et
al., in prep) and by tactile stimulation in monocularly enucleated mice (Nys et al. , 2014,
2015; Van Brussel et al. , 2011).
Different corticocortical projections include axons of different diameters depending
on their source and the cortical areas they target (Anderson & Martin, 2002; Caminiti et
al. , 2009, 2013; Innocenti et al. , 2014; Tomasi et al. , 2012). The range ofaxonal
diameters was greater in VI projections to SIBF than in the reciprocal projection back
to VI. We would therefore expect faster conduction velocities in sorne axons in the
projection of VI to SIBF. Axonal diameter is not the only variable that determines
conduction delays however, pathway length, axonal geometry and branching structure

224
will also influence conduction speed in axons (see Debanne, 2004 for review). This
asymmetry in this reciprocal projection between these primary sensory cortices is not
known.
Axonal thickness in the projection from VI to SIBF was also reduced in the
enucleated mice. This reduction is commensurate with the axonal swelling size
reduction in these mice. Indeed, the bouton size and axonal thickness are positively
correlated in corticocortical projections (Innocenti & Caminiti, 2016). Few studies have ·
examined the effects of sensory activity on the diameter of axons in corticocortical
connections. Sorne studies show that afferent sensory activity is important for the
development of very local cortical intra-areal projections (Bruno et al., 2009; Cheetham
et al. , 2007). We know of no reports on the role of sensory afferent activity on the
structure of single axons in corticocortical interareal projections activity. There are sorne
indications that axonal structure would be altered by sensory deprivation. For example,
the topography of striate extrastriate projections is abnormal in anophthalmic and in
enucleated mice (Laramée et al. , 2014) and in enucleated rats, (Laing et al. , 2012, 2013).
Moreover, cross-modal rewiring of visual inputs to the auditory thalamus in ferret
demonstrated that the nature of sensory activity is important in shaping the local
horizontal connectivity within the auditory cortex (Gao & Pallas, 1999). The changes
observed here in the size distribution ofaxonal swellings and diameter might reflect
further changes in branching structure and terminal field size of the axons.

225
Conclusions
In the current study, we asked how visual experience shapes cortical circuitry by
comparing the direct reciprocal intermodal corticocortical connections between VI and
SI in intact and C57BL/6 mice enucleated at birth, and determining quantitative
differences in the strength and laminar distribution of neurons and terminals in these
projections. We show that enucleation significantly reduced the strength of the
somatosensory projections to the visual cortex without affecting the strength of the
visual, motor and somatosensory afferents to the somatosensory cortex. Moreover
enucleation reduced the larger axonal swellings which were no longer observed and
axonal thickness was reduced in the visual cortex projection to the primary
somatosensory cortex. The absence of larger axonal swellings in the projection from VI
to SI of enucleated mice could indicate that normal sensory activity is required for the
normal development of Class 1 driver projections from Vlora homeostatic adjustment
of these terminals size is produced by high levels of activity in these projection neurons.
Acknowledgements We are grateful to Nadia Desnoyers for animal care and maintenance. This work
was supported by discovery grants of the Natural Sciences and Engineering Research Council of Canada (NSERC) to DB and GB, and the Canadian Foundation for Innovation to DB.

226
References
Andermann, M. L., Kerlin, A. M., Roumis, D. K., Glickfeld, L. L. & Reid, R. C. (2011) Functional specialization of mouse higher visual cortical areas. Neuron, 72, 1025-1039.
Anderson, J. C. & Martin, K. A. (2002) Connection from cortical area V2 to MT in macaque monkey. J. Comp. Neurol., 443, 56-70.
Batardiere, A., Barone, P., Dehay, C. & Kennedy, H. (1998) Area-specific laminar distribution of cortical feedback neurons projecting to cat area 17: Quantitative analysis in the adult and during ontogeny. J. Comp. Neurol., 396,493-510.
Batardiere, A., Barone, P., Knoblauch, K., Giroud, P., Berland, M., Dumas, A. M. & Kennedy, H. (2002) Early specification of the hierarchical organization of visual cortical areas in the macaque monkey. Cereb. Cortex, 12,453-465.
Bavelier, D. & Neville, H. J. (2002) Cross-modal plasticity: Where and how? Nat. Rev. Neurosci., 3, 443-452.
Berman, N. E. (1991) Alterations of visual cortical connections in cats following early removal ofretinal input. Brain Res. Dev. Brain Res., 63, 163-180.
Boire, D., Morris, R., Ptito, M., Lepore, F. & Frost, D. O. (1995) Effects of neonatal splitting of the optic chiasm on the development of feline visual callosal connections. Exp. Brain Res., 104, 275-286.
Bravo, H. & Inzunza, O. (1994) Effect of pre- and postnatal retinal deprivation on the striate-peristriate cortical connections in the rat. Biol. Res., 27, 73-77.
Bruno, R. M., Hahn, T. T., Wallace, D. J., de Kock, C. P. & Sakmann, B. (2009) Sensory experience alters specific branches of individual corticocortical axons during development. J. Neurosci., 29, 3172-3181.
Budinger, E., Heil, P., Hess, A. & Scheich, H. (2006) Multisensory processing via early cortical stages: Connections of the primary auditory cortical field with other sensory systems. Neuroscience, 143, 1065-1083.
Budinger, E., Laszcz, A., Lison, H., Scheich, H. & Oh!, F. W. (2008) Non-sensory cortical and subcortical connections of the primary auditory cortex in Mongolian gerbils: Bottom-up and top-down processing of neuronal information via field AI. Brain Res., 1220, 2-32.
227
Budinger, E. & Scheich, H. (2009) Anatomical connections suitable for the direct processing of neuronal information of different modalities via the rodent primary auditory cortex. Hear. Res., 258, 16-27.
Caminiti, R, Carducci, F., Piervincenzi, C., Battaglia-Mayer, A., Confalone, G., ViscoComandini, F., Pantano, P. & Innocenti, G. M. (2013) Diameter, length, speed, and conduction delay of callosal axons in macaque monkeys and humans: Comparing data from histology and magnetic resonance imaging diffusion tractography. J. Neurosci., 33,14501-14511.
Caminiti, R, Ghaziri, H., Galuske, R, Hof, P. R. & Innocenti, G. M. (2009) Evolution amplified processing with temporally dispersed slow neuronal connectivity in primates. Proc. Natl. Acad. Sci. U. S. A., 106, 19551-19556.
Campi, K. L., Bales, K. L., Grunewald, R & Krubitzer, L. (2010) Connections of auditory and visual cortex in the prairie vole (Microtus ochrogaster): Evidence for multisensory processing in primary sensory areas. Cereb. Cortex, 20, 89-108.
Cannon, W. B. (1939) A law of denervation. Am. J. Med. Sci., 198, 737-750.
Cappe, C. & Barone, P. (2005) Heteromodal connections supporting multisensory integration at low levels of cortical processing in the monkey. Eur. J. Neurosci., 22, 2886-2902.
Caviness, V. S. (1975) Architectonic map of neocortex of the normal mouse. J. Comp. Neurol., 164,247-263.
Charbonneau, V., Laramée, M. E., Boucher, V., Bronchti, G. & Boire, D. (2012) Cortical and subcortical projections to primary visual cortex in anophthalmic, enucleated and sighted mice. Eur. 1. Neurosci., 36, 2949-2963.
Cheetham, C. E., Hammond, M. S., Edwards, C. E. & Finnerty, G. T. (2007) Sensory experience alters cortical connectivity and synaptic function site specifically. J. Neurosci., 27, 3456-3465.
Clavagnier, S., Falchier, A. & Kennedy, H. (2004) Long-distance feedback projections to area VI: Implications for multisensory integration, spatial awareness, and visual consciousness. Cogn. Affect. Behav. Neurosci., 4, 117-126.
Collignon, O., Dormal, G., de, H. A., Lepore, F., Lewis, T. L. & Maurer, D. (2015) Long-Lasting Crossmodal Cortical Reorganization Triggered by Brief Postnatal Visual Deprivation. CUIT. Biol., 25, 2379-2383.

228
Coogan, T. A. & Burkhalter, A. (1990) Conserved patterns of cortico-cortical connections defme areal hierarchy in rat visual cortex. Exp. Brain Res., 80,49-53.
Coogan, T. A & Burkhalter, A (1993) Hierarchical organization of areas in rat visual cortex. J. Neurosci., 13,3749-3772.
Covic, E. N. & Sherman, S. M. (2011) Synaptic properties of connections between the primary and secondary auditory cortices in mice. Cereb. Cortex, 21, 2425-2441.
De Pasquale R. & Sherman, S. M. (2011) Synaptic properties of corticocortical connections between the primary and secondary visual cortical areas in the mouse. J. Neurosci., 31, 16494-16506.
De Volder, A. G., Bol, A, Blin, J., Robert, A., Arno, P., Grandin, c., Michel, C. & Veraart, C. (1997) Brain energy metabolism in early blind subjects: Neural activity in the visual cortex. Brain Res., 750, 235-244.
Debanne, D. (2004) Information processing in the axon. Nat. Rev. Neurosci., 5, 304-316.
Dehay, C., Giroud, P., Berland, M., Killackey, H. & Kennedy, H. (1996) Contribution of thalarnic input to the specification of cytoarchitectonic cortical fields in the primate: Effects of bilateral enucleation in the fetal monkey on the boundaries, dimensions, and gyrification of striate and extrastriate cortex. J. Comp. Neurol., 367, 70-89.
Dehay, C., Horsburgh, G., Berland, M., Killackey, H. & Kennedy, H. (1989) Maturation and connectivity of the visual cortex in monkey is altered by prenatal removal of retinal input. Nature, 337, 265-267.
Duclert, A. & Changeux, J. P. (1995) Acetylcholine receptor gene. expression at the developing neuromuscular junction. Physiol. Rev., 75, 339-368.
Felleman, D. J. & Van Essen, D. C. (1991) Distributed hierarchical processing in the primate cerebral cortex. Cereb. Cortex, 1, 1-47.
Franklin, B. J. & Paxinos, G. (2008) The Mouse Brain in Stereotaxic Coordinates. Academic Press, San Diego.
Frost, D. O. & Moy, Y. P. (1989) Effects of dark rearing on the development of visual callosal connections. Exp. Brain Res., 78, 203-213.
Frost, D. O., Moy, Y. P. & Smith, D. C. (1990) Effects of alternating monocular occlusion on the development of visual callosal connections. Exp. Brain Res., 83, 200-209.
229
Fujii, T., Tanabe, H. C., Kochiyama, T. & Sadato, N. (2009) An investigation of crossmodal plasticity of effective connectivity in the blind by dynamic causal modeling offunctional MRI data. Neurosci. Res., 65, 175-186.
Gao, W. J. & Pallas, S. L. (1999) Cross-modal reorganization of horizontal connectivity in auditory cortex without altering thalamocortical projections. J. Neurosci., 19, 7940-7950.
Garraghty, P. E., Frost, D. O. & Sur, M. (1987) The morphology ofretinogeniculate Xand Y-cell axonal arbors in dark-reared cats. Exp. Brain Res., 66, 115-127.
Garraghty, P. E., Sur, M., WeIler, R. E. & Sherman, S. M. (1986) Morphology of retinogeniculate X and Y axon arbors in monocularly enucleated cats. J. Comp. Neurol., 251, 198-215.
Glickfeld, L. L., Andermann, M. L., Bonin, V. & Reid, R. C. (2013) Cortico-cortical projections in mouse visual cortex are functionally target specific. Nat. Neurosci., 16,219-226.
Glickfeld, L. L., Reid, R. C. & Andermann, M. L. (2014) A mouse model of higher visual cortical function. CUIT. Opin. Neurobiol., 24, 28-33.
Gougoux, F., Zatorre, R. J., Lassonde, M., Voss, P., & Lepore, F. (2005) A functional neuroimaging study of sound localization: visual cortex activity predicts performance in early-blind individuals. PLoS Biol, 3, e27.
Henschke, J. U., Noesselt, T., Scheich, H. & Budinger, E. (2014) Possible anatomical pathways for short-Iatency multisensory integration processes in primary sensory cortices. Brain Struct. Funct., 10, 1007-1030.
Heumann, D. & Rabinowicz, T. (1980) Postnatal development of the dorsal lateral geniculate nucleus in the normal and enucleated albino mouse. Exp. Brain Res., 38, 75-85.
Hsiao, C. F. & Sherman, S. M. (1986) Alpha and beta cells projecting from retina to lamina A of the lateral geniculate nucleus in normal cats, monocularly deprived cats, and young kittens. Exp. Brain Res., 61, 413-431.
Innocenti, G. M., & Caminiti, R. (1980) Postnatal shaping of callosal connections from sensory areas. Exp. Brain Res., 38, 381-394.
Innocenti, G. M., & Carniniti, R. (2016) Axon diameter relates to synaptic bouton size: Structural properties define computationally different types of cortical connections in primates. Brain Struct. Funct.

230
Innocenti, G. M., & Frost, D. O. (1980) The postnatal development of visual callosal connections in the absence of visual experience or of the eyes. Exp. Brain Res., 39, 365-375.
Innocenti, G. M., Frost, D. O. & Illes, J. (1985) Maturation of visual callosal connections in visually deprived kittens: A challenging critical period. 1. Neurosci., 5,255-267.
Innocenti, G. M., Vercelli, A. & Caminiti, R. (2014) The diameter of cortical axons depends both on the area of origin and target. Cereb. Cortex, 24, 2178-2188.
Iurilli, G., Ghezzi, D., Olcese, U., Lassi, G., Nazzaro, C., Tonini, R., Tucci, V., Benfenati, F. & Medini, P. (2012) Sound-driven synaptic inhibition in primary visual cortex. Neuron, 73, 814-828.
Kahn, D. M. & Krubitzer, L. (2002) Massive cross-modal cortical plasticity and the emergence of a new cortical area in developmentally blind mammals. Proc. Natl. Acad. Sci. U. S. A. , 99, 11429-11434.
Karlen, S. J. , Kahn, D. M. & Krubitzer, L. (2006) Early blindness results in abnormal corticocortical and thalamocortical connections. Neuroscience, 142, 843-858.
Karlen, S. J. & Krubitzer, L. (2009) Effects ofbilateral enucleation on the size ofvisual and nonvisual areas of the brain. Cereb. Cortex, 19, 1360-1371.
Kennedy, H. , Bullier, J. & Dehay, C. (1989) Transient projection from the superior temporal sulcus to area 17 in the newborn macaque monkey. Proc. Natl. Acad. Sci. U. S. A., 86, 8093-8097.
Klinge, C. , Eippert, F., Roder, B. & Buchel, C. (2010) Corticocortical connections mediate primary visual cortex responses to auditory stimulation in the blind. 1. Neurosci., 30, 12798-12805.
Lachica, E. A., Crooks, M. W. & Casagrande, V. A. (1990) Effects of monocular deprivation on the morphology of retinogeniculate axon arbors in a primate. J. Comp. Neurol., 296, 303-323.
Laing, R. J. , Bock, A. S., Lasiene, J. & Olavarria, J. F. (2012) Role of retinal input on the development of striate-extrastriate patterns of connections in the rat. J. Comp. Neurol. , 520, 3256-3276.
Laing, R. J., Lasiene, J. & Olavarria, J. F. (2013) Topography of striate-extrastriate connections in neonatally enucleated rats. Biomed. Res. Int., 2013, 1-9.

231
Laramée, M. E., Bronchti, G. & Boire, D. (2014) Primary visual cortex projections to extrastriate cortices in enucleated and anophthalmic mice. Brain Struct. Funct., 219, 2051-2070.
Laramée, M. E. , Rockland, K. S., Prince, S., Bronchti, G. & Boire, D. (2013) Principal component and cluster analysis of layer V pyramidal cells in visual and non-visual cortical areas projecting to the primary visual cortex of the mouse. Cereb. Cortex, 23, 714-728.
Lee, C. C. & Sherman, S. M. (2008) Synaptic properties of thalamic and intracortical inputs to layer 4 of the frrst- and higher-order cortical areas in the auditory and somatosensory systems. J. Neurophysiol., 100, 317-326.
Lee, C. C. & Sherman, S. M. (2009a) Glutamatergic inhibition in sensory neocortex. Cereb. Cortex, 19, 2281-2289.
Lee, C. C. & Sherman, S. M. (2009b) Modulator property of the intrinsic cortical projection from layer 6 to layer 4. Front Syst. Neurosci., 3, 3-8.
Liu, Y., Yu, C., Liang, M., Li, J. , Tian, L., Zhou, Y., Qin, W., Li, K. & Jiang, T. (2007) Whole brain functional connectivity in the early blind. Brain, 130, 2085-2096.
Marshel, J. H. , Garrett, M. E., Nauhaus, 1. & Callaway, E. M. (2011) Functional specialization of seven mouse visual cortical areas. Neuron, 72, 1040-1054.
Massé, 1. O. , Guillemette, S., Laramée, M. E., Bronchti, G. & Boire, D. (2014) Strain differences of the effect of enucleation and anophthalmia on the size and growth of sensory cortices in mice. Brain Res. , 1588, 113-126.
Massé, 1. O., Ross, S., Bronchti, G. & Boire, D. (2016) Asymmetric Direct Reciprocal Connections Between Primary Visual and Somatosensory Cortices of the Mouse. Cereb. Cortex.
Matsui, T. & Ohki, K. (2013) Target dependence of orientation and direction selectivity of corticocortical projection neurons in the mouse VI. Front Neural Circuits, 7, 143-152.
Merabet, L. B. & Pascual-Leone, A. (2010) Neural reorganization following sensory loss: The opportunity of change. Nat. Rev. NeuroscÏ. , Il , 44-52.
Meredith, M. A. & Lomber, S. G. (2016) Species-dependent role of crossmodal connectivity among the primary sensory cortices. Hear. Res. , 10, 1016-1023.
232
Murthy, V. N., Schikorski, T., Stevens, C. F. & Zhu, Y. (2001) Inactivity produces increases in neurotransrnitter release and synapse size. Neuron, 32, 673-682.
Nys, l, Aerts, J., Ytebrouck, E., Vreysen, S., Laeremans, A. & Arckens, L. (2014) The cross-modal aspect of mouse visual cortex plasticity induced by monocular enucleation is age dependent. J. Comp. Neurol., 522, 950-970.
Nys, J., Scheyltjens, 1. & Arckens, L. (2015) Visual system plasticity in mammals: The story ofmonocular enucleation-induced vision loss. Front Syst. Neurosci., 9, 60-80.
Olavarria, J., Mignano, L. R. & Van Sluyters, R. C. (1982) Pattern of extrastriate visual areas connecting reciprocally with striate cortex in the mouse. Exp. Neurol., 78, 775-779.
Olavarria, l & Montero, V. M. (1989) Organization of visual cortex in the mouse revealed by correlating callosal and striate-extrastriate connections. Vis. Neurosci., 3,59-69.
Pallas, S. L. (2001) Intrinsic and extrinsic factors that shape neocortical specification. Trends Neurosci., 24, 417-423.
Paperna, T. & Malach, R. (1991) Patterns of sensory intermodality relationships in the cerebral cortex of the rat. J. Comp. Neurol., 308, 432-456.
Pascual-Leone, A., Amedi, A., Fregni, F. & Merabet, L. B. (2005) The plastic human brain cortex. Annu. Rev. Neurosci., 28,377-401.
Pascual-Leone, A. & Hamilton, R. (2001) The metamodal organization of the brain. Prog. Brain Res., 134,427-445.
Petrof, 1. & Sherman, S. M. (2013) Functional significance of synaptic terminal size in glutamatergic sensory pathways in thalamus and cortex. J. Physiol., 591, 3125-3131.
Piché, M., Chabot, N., Bronchti, G., Miceli, D., Lepore, F. & Guillemot, J. P. (2007) Auditory responses in the visual cortex of neonatally enucleated rats. Neuroscience, 145, 1144-1156.
Pierce, J. P. & Lewin, G. R. (1994) An ultrastructural size principle. Neuroscience, 58, 441-446.
Pierce, J. P. & Mendell, L. M. (1993) Quantitative ultrastructure of la boutons in the ventral horn: Scaling and positional relationships. J. Neurosci., 13,4748-4763.

233
Qin, W., Liu, Y., Jiang, T. & Yu, C. (2013) The development of visual areas depends differently on visual experience. PLoS One., 8, 1-10.
Raczkowski, D., Uhlrich, D. J. & Sherman, S. M. (1988) Morphology of retinogeniculate X and Y axon arbors in cats raised with binocular lid suture. J. Neurophysiol., 60, 2152-2167.
Rakic, P. (1988) Specification of cerebral cortical areas. Science, 241, 170-176.
Rakic, P., Suner, 1. & Williams, R. W. (1991) A novel cytoarchitectonic area induced experimentally within the primate visual cortex. Proc. Natl. Acad. Sci. U. S. A., 88, 2083-2087.
Reichova, 1. & Sherman, S. M. (2004) Somatosensory corticothalamic projections: Distinguishing drivers from modulators. J. Neurophysiol., 92,2185-2197.
Rockland, K. S. & Pandya, D. N. (1979) Laminar origins and terminations of cortical connections of the occipital lobe in the rhesus monkey. Brain Res., 179,3-20.
Rôder, B., RosIer, F. & Neville, H. J. (2001) Auditory memory in congenitally blind adults: a behavioral-electrophysiological investigation. Brain Res Cogn Brain Res, 11,289-303.
Ruthazer, E. S. & Stryker, M. P. (1996) The role of activity in the development oflongrange horizontal connections in area 17 of the ferret. J. Neurosci., 16, 7253-7269.
Schikorski, T. & Stevens, C. F. (1997) Quantitative ultrastructural analysis of hippocampal excitatory synapses. J. Neurosci., 17,5858-5867.
Sharpless, S. K. (1964) Reorganization offunction in the nervous system-use and disuse. Annu. Rev. Physiol., 26, 357-388.
Sharpless, S.K. (1975a) Disuse sensitivity. In A.H Riessen (ed), The developmental neuropsychology of sens ory deprivation. Academic Press, New York, pp. 125-152.
Sharpless, S. K. (1975b) Supersensitivity-like phenomena in the central nervous system. Fed. Proc., 34, 1990-1997.
Sherman, S. M. & Guillery, R. W. (1996) Functional organization of thalamocortical relays. J. Neurophysiol., 76, 1367-1395.
Sherman, S. M. & Guillery, R. W. (1998) On the actions that one nerve cell can have on another: Distinguishing "drivers" from "modulators". Proc. Natl. Acad. Sci. U. S. A., 95, 7121-7126.

234
Sherman, S.M. & Guillery, R.W. (2013) Functional connections of cortical areas. MIT Press, Cambridge MA , London England.
Sieben, K., Bieler, M., Roder, B. & Hanganu-Opatz, I. L. (2015) Neonatal Restriction of Tactile Inputs Leads to Long-Lasting Impairments of Cross-Modal Processing. PLoS Biol., 13, 1-26.
Sieben, K., Roder, B. & Hanganu-Opatz, I. L. (2013) Oscillatory entrainment ofprimary somatosensory cortex encodes visual control of tactile processing. J. NeurosCÎ., 33, 5736-5749.
Stehberg, J., Dang, P. T. & Frostig, R. D. (2014) Unimodal primary sensory cortices are directly connected by long-range horizontal projections in the rat sens ory cortex. Front. Neuroanat., 8, 93-112.
Streichert, L. C. & Sargent, P. B. (1989) Bouton ultrastructure and synaptic growth in a frog autonomic ganglion. J. Comp. Neurol., 281, 159-168.
Sur, M., Humphrey, A. L. & Sherman, S. M. (1982) Monocular deprivation affects Xand Y-ceil retinogeniculate terminations in cats. Nature, 300, 183-185.
Toldi, J. , Farkas, T. & Volgyi, B. (1994) Neonatal enuc1eation induces cross-modal changes in the barrel cortex of rat. A behavioural and electrophysiological study. Neurosci. Lett., 167, 1-4.
Toldi, J., Joo, F., Feher, O. & Wolff, J. R. (1988) Modified distribution patterns of responses in rat visual cortex induced by monocular enuc1eation. Neuroscience, 24, 59-66.
Tomasi, S., Caminiti, R. & Innocenti, G. M. (2012) Areal differences in diameter and length of corticofugal projections. Cereb. Cortex, 22, 1463-1472.
Turrigiano, G. G. & Nelson, S. B. (2000) Hebb and homeostasis in neuronal plasticity. CUIT. Opin. Neurobiol., 10,358-364.
Van Boven, R. W., Hamilton, R. H., Kauffman, T., Keenan, J. P. & Pascual-Leone, A. (2000) Tactile spatial resolution in blind braille readers. Neurology, 54, 2230-2236.
Van Brussel, L., Gerits, A. & Arckens, L. (2011) Evidence for cross-modal plasticity in adult mouse visual cortex following monocular enuc1eation. Cereb. Cortex, 21 , 2133-2146.

235
Viaene, AN., Petrof, 1. & Sherman, S. M. (2011) Synaptic properties ofthalamic input to layers 2/3 and 4 of primary somatosensory and auditory cortices. J. Neurophysiol., 105,279-292.
Wan, C. Y., Wood, AG., Reutens, D. C. & Wilson, S. J. (2010) Congenital blindness leads to enhanced vibrotactile perception. Neuropsychologia, 48, 631-635.
Wanet-Defalque, M. C., Veraart, C., De, V. A , Metz, R., Michel, C., Dooms, G. & Goffmet, A. (1988) High metabolic activity in the visual cortex of early blind human subjects. Brain Res., 446, 369-373.
Wang, Q. & Burkhalter, A (2007) Area map ofmouse visual cortex. 1. Comp. Neurol. , 502, 339-357.
Wang, Q., Gao, E. & Burkhalter, A (2011) Gateways of ventral and dorsal streams in mouse visual cortex. J. Neurosci., 31 , 1905-1918.
Wang, Q., Spoms, O. & Burkhalter, A. (2012) Network analysis of corticocortical connections reveals ventral and dorsal processing streams in mouse visual cortex. 1. Neurosci., 32, 4386-4399.
West, M. J. & Gundersen, H. J. (1990) Unbiased stereological estimation of the number ofneurons in the human hippocampus. J.Comp Neurol., 296, 1-22.
West, M. J., Slomianka, L. & Gundersen, H. J. (1991) Unbiased stereological estimation of the total number of neurons in the subdivisions of the rat hippocampus using the optical fractionator. Anat. Rec., 231 , 482-497.
Wittenberg, G. F., Werhahn, K. J., Wassermann, E. M., Herscovitch, P. & Cohen, L. G. (2004) Functional connectivity between somatosensory and visual cortex in early blind humans. Eur. 1. Neurosci., 20, 1923-1927.
Yeow, M. B. & Peterson, E. H. (1991) Active zone organization and vesicle content scale with bouton size at a vertebrate central synapse. 1. Comp. Neurol., 307, 475-486.
Yu, c., Liu, Y., Li, J. , Zhou, Y. , Wang, K., Tian, L., Qin, W., Jiang, T. & Li, K. (2008) Altered functional connectivity of primary visual cortex in early blindness. Hum. Brain Mapp. , 29, 533-543 .
Zingg, B., Hintiryan, H., Gou, L., Song, M. Y., Bay, M. , Bienkowski, M. S. , Foster, N. N. , Yamashita, S., Bowman, 1., Toga, A. W. & Dong, H. W. (2014) Neural networks of the mouse neocortex. Cell, 156, 1096-1111 .

Discussion

L'objectif général de cette thèse était de mieux comprendre comment les cortex
sensoriels primaires contribuent au traitement de l'information sensorielle et non
sensorielle. Les travaux de cette thèse ont été présentés en trois objectifs spécifiques.
Pour mieux comprendre comment les cortex sensoriels primaires contribuent à ce
traitement, nous avons déterminé la provenance et la nature des projections afférentes
aux cortex sensoriels primaires, dont SI , pour lesquelles un inventaire complet et
quantitatif n'avait pas été réalisé chez la souris. Suite à la démonstration que le champ
de tonneaux de SI possède plus de connexions qui ciblent des aires corticales
sensorielles telles que VI , nous avons poussé l'étude de la structure de cette connexion
entre deux cortex sensoriels primaires pour mieux comprendre comment ces modalités
s'influencent mutuellement. Le deuxième objectif était donc d'étudier la microcircuiterie
des connexions corticocorticales directes et réciproques entre le cortex visuel et
somatosensoriel primaire de la souris. Suite à la démonstration que la projection de VI
vers SI à une influence inductrice, nous nous sommes interrogés sur l' influence de
l'expérience visuelle pendant la période de vie postnatale sur le développement des
connexions corticocorticales entre VI et SI. Le troisième et dernier objectif était donc
d'étudier l' impact de la perte de la vision sur la microcircuiterie des connexions entre
VI et SI à l'aide d'un échantillon de souris énucléées à la naissance. Les sections de la
discussion sont dédiées à la signification de nos résultats dans le contexte des
connaissances actuelles sur les interactions multisensorielles et la hiérarchie des sens.

Objectif 1 : Projections afférentes corticales et sous-corticales du cortex somatosensoriel primaire de la souris
238
Notre première étude a confIrmé que SI chez la souris reçoit des projections des
cortex moteurs, des aires corticales associatives multisensorielles, des noyaux
thalamiques et des cortex sensoriels primaires des autres modalités. sensorielles, ce qui
soutient ce qui avait été démontré précédemment dans la littérature (Zakiewicz, Bjaa1ie,
& Leergaard, 2014; Zingg et al., 2014), et l'hypothèse selon laquelle les aires primaires
ne sont pas limités au traitement unisensoriel (Ghazanfar & Schroeder, 2006; Kayser,
Petkov, Augath, & Logothetis, 2007; Wallace et al. , 2004). Par rapport aux études
neuroanatomiques antérieures (Budinger, Heil, Hess, & Scheich, 2006; Budinger,
Laszcz, Lison, Scheich, & OhI, 2008; Budinger & Scheich, 2009; Charbonneau et al. ,
2012; Henschk:e, Noesselt, Scheich, & Budinger, 2014; Zakiewicz et al. , 2014; Zingg et
al., 2014), notre analyse contribue des informations plus complètes et détaillées sur les
afférences de SI telles que leur distribution laminaire et leur poids relatif, et prend en
compte les différentes parties de ce cortex sensoriel primaire ainsi que l' ensemble des
afférences sous-corticales. Nos résultats apportent une contribution aux efforts à grande
échelle qui consistent à cartographier l' ensemble des connexions du cerveau des
rongeurs, tels que le Mouse Brain Connectome Project et l'Allen Mouse Brain
Connectivity Atlas. Les images fournit par ces bases de données permettent de
facilement répertorier certaines projections bien connues de SI telles que les projections
vers le cortex moteur et le striatum, mais l'existence de projections plus petites vers
d'autres cibles tel que VI et les régions sous-corticales ne peut être confrrmé que par une
analyse plus détaillée comme celle présentée dans notre étude.

239
Notre première étude contribue de manière originale à la recherche sur les
projections de SI en démontrant que ces trois parties ont des projections différentes. En
effet, la partie caudale de SIBF possède plus de connexions qui ciblent des arres
corticales et sous-corticales sensorielles des autres modalités telles que des arres
visuelles, auditives, olfactives et associatives, dont le cortex auditif et visuel, en plus du
cortex perirhinal et ectorhinal qui sont impliqué dans le traitement sensoriel (Naber,
Witter, & Lopes da Silva, 2000; Rodgers, Benison, Klein, & Barth, 2008), ainsi que
certaines régions sous-corticales, telles que le noyau thalamique ventral latéral qui
module les processus nociceptifs (Blomqvist, Ericson, Broman, & Craig, 1992; Craig, Jr.
& Burton, 1981 ; Miletic & Coffield, 1989), comparativement à la partie rostrale du
champ de tonneaux et à la partie de SI à l'extérieur du champ de tonneaux dont les
connexions ciblent davantage des aires somatosensorielles et motrices. De plus, la partie
caudale du champ de tonneaux est la seule partie de SI à recevoir des projections de VI .
Les projections vers SI seraient surtout de nature feedback, mais les projections
auditives seraient de nature feedback alors que les projections visuelles seraient de
nature latérale, ce qui démontre que les différentes modalités sensorielles n'ont pas la
même influence envers SI . SI reçoit des projections de nature feedback des cortex
pariétal et temporal associatifs, ce qui soutient l' importance de SI dans le codage
prédictif et le modèle de la hiérarchie inversé. Les indices laminaires démontrent que
malgré la nature feedback des projections dans l' ensemble, les informations
contextuelles des aires associatives vers SIn' ont pas toute la même structure et auraient
possiblement des contributions fonctionnelles différentes.

240
La multimodalité du cortex somatosensoriel primaire
Dans les modèles traditionnels de l'organisation des cortex sensoriels, l'information
de chaque modalité est d'abord traitée séparément dans les cortex spécifiques avant son
intégration ultérieure dans les aires associatives d' ordre supérieur. Ce modèle
d'organisation a été contesté par la démonstration d' interactions multisensorielles dans
les cortex sensoriels primaires (Driver & Noesselt, 2008; Ghazanfar & Schroeder, 2006).
La modalité qui est associée à un cortex sensoriel spécifique pourrait être définie comme
dominante (pascual-Leone & Hamilton, 2001). Par exemple, l' information
somatosensorielle serait dominante dans le cortex somatosensoriel primaire. Par
conséquent, les autres modalités peuvent être définies comme non dominante par rapport
au même cortex. Par exemple, l' information visuelle et auditive serait non dominante
dans le cortex somatosensoriel primaire. En effet, les résultats de notre première étude
démontrent que malgré la dominance des afférences somatosensorielles, la partie
caudale du champ de tonneaux reçoit des afférences des aires corticales dédiées à
d'autres modalités.
Bien qu'on puisse s' attendre à ce que l'influence entre les différentes modalités
sensorielles soit similaire, des études récentes ont démontré que ce ne serait pas le cas.
Par exemple, pour mieux comprendre le caractère synaptique des connexions entre les
cortex sensoriels primaires, ainsi que leur impact sur la réactivité aux stimuli des autres
modalités, lurilli et ses collaborateurs (2012) ont mesuré les réponses synaptiques des
neurones pyramidaux dans VI , SI et Al lors de la stimulation des modalités sensorielles

241
non dominante, en utilisant des enregistrements in vivo de cellules entières guidées par
imagerie de signal intrinsèque. Les auteurs ont démontré qu'une stimulation des
vibrisses et une stimulation acoustique ont évoqué une hyperpolarisation des cortex
sensoriels primaires non somatosensoriels et non auditifs respectivement tandis qu'une
stimulation visuelle a évoqué une légère dépolarisation sous le seuil dans SI et aucune
réponse détectable dans Al (voir Figure 36). Cela pourrait suggérer des différences
fonctionnelles dans les influences relatives des projections entre VI, SI et Al.
Cortex visuel Cortex auditif
Cortex somatosensoriel
2mV L 200ms
Figure 36. Asymétrie fonctionnelle entre les cortex sensoriels primaires de la souris (Iurilli et al., 2012).

242
En ce qui concerne les autres études sur la connectivité corticocorticale, des
connexions directes et réciproques entre les aires primaires ont été démontrées chez les
rongeurs (Budinger et al., 2006; Campi, BaIes, Grunewald, & Krubitzer, 2010;
Charbonneau et al. , 2012; Laramée, Kurotani, Rockland, Bronchti, & Boire, 2011 ;
Larsen, Luu, Burns, & Krubitzer, 2009; Sieben, Roder, & Hanganu-Opatz, 2013; Wang
& Burkhalter, 2007). De manière similaire à notre première étude, des neurones
rétrogradement marqués ont été quantifiées après des injections de traceur rétrograde
dans VI chez la souris (Charbonneau et al. , 2012) et dans le cortex auditif primaire de la
gerbille (Budinger & Scheich, 2009). Les résultats de ces deux études et de notre
première étude démontrent que chez les rongeurs, VI reçoit plus de projections des
cortex dédiées aux autres modalités sensorielles. Ainsi, VI serait le cortex sensoriel
primaire le plus multisensoriel comparativement au cortex auditif primaire qui ne reçoit
que peu de projections des autres cortex sensoriels primaires (Budinger & Scheich,
2009; Henschk:e et al., 2014). Ces observations suggèrent que les influences mutuelles
entre les sens ne sont pas équivalentes en force. L'influence du cortex auditif primaire
sur VI serait plus forte que les autres influences observées entre les cortex sensoriels
prunarres.
Les voies les plus rapides vers SI
La combinaison de l' information des différentes modalités sensorielles réduit les
temps de réaction (Hoefer et al., 2013; Molholm et al. , 2002; Noesselt et al. , 2010;
Teder-Salejarvi, McDonald, Di, & Hillyard, 2002), ce qui peut être crucial pour la survie

243
de l'individu. En effet, les interactions audiosomatosensorielle (Hoefer et al., 2013) et
visuosomatosensorielles (Macaluso, 2006) doivent être traitées rapidement dans leur
réseau intermodal respectif. Afin d'éliciter des réponses avec un très court temps de
latence, les voies neuroanatomiques qui transportent l' information sensorielle
intermodale vers les cortex sensoriels primaires doivent être très courtes et doivent
couvrir le moins de synapses possible. Parmi les trois sources, les deux voies les plus
rapides vers les cortex sensoriels primaires seraient les afférences acheminés par les
connexions thalamocorticales provenant du thalamus et les connexions corticocorticales
directes entre les cortex sensoriels primaires (Budinger et al., 2006; Cappe, Rouiller, &
Barone, 2009; Kayser, Petkov, Augath, & Logothetis, 2005; Schroeder et al. , 2003;
Sieben et al. , 2013). Les résultats de notre première étude suggèrent qu' il existe
effectivement des connexions entre le champ de tonneaux, des noyaux thalamiques et
des cortex sensoriels primaires des autres modalités, et que ce serait le moyen le plus
rapide, et donc le plus efficace de transmettre des informations sensorielles des autres
modalités vers SlBF.
Les voies descendantes des aires associatives vers St
Les trois parties de SI reçoivent des afférences de plusieurs aires associatives et
multisensorielles d'ordre supérieur, telles que les cortex pariétal et temporal associatifs,
les cortex rétrospléniaux agranulaire et granulaire, et les cortex ectorhinal, périrhinal,
orbital et insulaire. SI reçoit donc des afférences de plusieurs sources différentes par le
biais des voies descendantes. De plus, la distribution laminaire des neurones

244
rétrogradement marqués suggère que SI chez la souris, reçoit des projections de type
feedback de ces aires. Ces différentes aires pourraient avoir un rôle de modulation, mais
à différent degré étant donné que les indices laminaires, même si dans l' ensemble
négatif, l'étaient à différents degrés. Ces projections de type feedback pourraient
moduler l' information dans le cortex somatosensoriel primaire (Bullier, 2001), de sorte
que les signaux ascendants deviennent consciemment accessibles (Tononi & Koch,
2008). En effet, SI aurait un rôle clé dans le codage prédictif qui est le processus
d'appariement du système nerveux entre l'information sensorielle des stimuli tactiles
acheminée par les signaux ascendants et les attentes envers l' environnement généré à
l'interne par les signaux descendants (Grossberg, 1980; Lee & Mumford, 2003; Llinas &
Pare, 1991).
Spécificité des espèces aux niveaux des connexions entre aires primaires : rongeurs vs non-rongeurs
Bien que la connectivité d'un cortex sensoriel primaire à un autre cortex sensoriel
primaire ait récemment reçu beaucoup d'attention (pour revue, voir Meredith & Lomber,
2016), la littérature démontre clairement l' existence de la connectivité corticocorticale
entre aires primaires de différentes modalités chez les rongeurs (pour revue, voir
Henschke et al. , 2014), mais il existe peu de preuves cohérentes chez les non-rongeurs
tels que les carnivores et les primates non-humains. L'une des principales sources
d'erreur dans l'interprétation de la littérature originale est l'ambiguïté dans la défInition
de ce qu'est un cortex sensoriel primaire. Le terme Al par exemple, n'est pas
interchangeable avec le terme cortex auditif ou cortex auditif de bas niveau. Il semble

245
intuitif que, pour les animaux avec un cortex de plus grande taille, il y ait simplement
plus de tissus et plus de régions à partir desquelles les projections vers les aires primaires
pourraient survenir. Effectivement, il est possible que l'évolution de nouvelles aires
corticales chez les non-rongeurs offre des représentations élargies des capacités de
traitement contenues dans les cortex sensoriels primaires chez les rongeurs. Il est
également possible que la dépendance comportementale des carnivores et des primates
sur certains sens la vision et l'ouïe, comparativement aux rongeurs qui dépendent plus du
toucher peut également contribuer à la distinction entre leurs cortex primaires.
Néanmoins, toutes les espèces doivent faire face à un environnement sensoriel complexe
et il existe une littérature considérable qui documente des projections corticales d'aire de
niveau supérieur (non primaire) vers les cortex sensoriels primaires d'une autre modalité
qui pourraient remplir la même fonction que les connexions entre cortex sensoriels
primaires de différentes modalités vues chez les rongeurs.
Objectif 2 : Les connexions corticocorticales directes et réciproques entre le cortex visuel et somatosensoriel primaire de la souris
Le deuxième objectif de cette thèse était d' étudier la microcircuiterie des
connexions corticocorticales directes et réciproques entre les cortex visuel et
somatosensoriel primaires de la souris afin de mieux comprendre comment deux
modalités s'influencent mutuellement. L'étude de la morphologie des axones et de leurs
boutons terminaux a aussi permis d'en apprendre davantage sur la fonction de ces
conneXIons.

246
La position hiérarchique des cortex sensoriels primaires
L' asymétrie des connexions réciproques entre les aires corticales est à la base de
l'établissement des niveaux hiérarchiques dans le cortex (Coogan & Burkhalter, 1993;
Felleman & Van Essen, 1991 ; Hilgetag, O'Neill, & Young, 2000; Markov et al. , 2014;
Rockland & Pandya, 1979). Il est aussi généralement cru que si une voie est
descendante, la voie réciproque sera ascendante, et si une projection est latérale, son
homologue devrait également être latéral (Felleman & Van Essen, 1991).
Étant donné que les cortex sensoriels primaires sont les portails d'entrée du cortex
pour les voies sensorielles ascendantes de chaque modalité provenant du thalamus, on
aurait pu s' attendre à ce que VI et SI soient positionnés au même niveau dans la
hiérarchie et réciproquement connectés par des projections latérales symétriques. Nos
résultats démontrent que ce n' est pas le cas. La projection de SIBF vers VI serait de
typefeedback alors que la projection réciproque de VI vers SIBF serait de type latéral.
Cette asymétrie suggère que ces deux cortex sensoriels primaires ne sont pas au même
niveau dans la hiérarchie corticale.
Chez la gerbille et la souris, le cortex visuel primaire reçoit des projectionsfeedback
à la fois du cortex auditif primaire et du cortex somatosensoriel primaire (Charbonneau
et al., 2012; Henschke et al. , 2014). Chez la gerbille, ces projections sont en réciprocité
avec une projectionfeedforward vers le cortex auditif et une projection latérale vers le
cortex somatosensoriel tandis que le cortex auditif primaire et le cortex somatosensoriel

247
primaire sont réciproquement connectés par des projections latérales (Henschke et al.,
2014). Ces résultats et les nôtres suggèrent que le cortex auditif primaire et le cortex
somatosensoriel primaire sont positionnés plus haut dans la hiérarchie corticale que le
cortex visuel primaire, et possiblement au même niveau.
Notre étude est la première à comparer la réciprocité entre le marquage rétrograde et
antérograde. La distribution laminaire des boutons terminaux antérogradement marqués
démontre que les projections réciproques entre le cortex visuel primaire et le cortex
somatosensoriel primaire ont toute les deux des caractéristiques d'une projection
feedback (Coogan & Burkhalter, 1990, 1993). Dans la projection du champ de tonneaux
vers le cortex visuel primaire, la distribution laminaire des neurones rétrogradement
marqués et des boutons terminaux antérogradement marqués suggère que cette
projection a des caractéristiques d'une projection feedback. Cependant, dans la
projection du cortex visuel primaire vers le champ de tonneaux, la distribution laminaire
des neurones rétrogradement marqués suggère que cette projection a des caractéristiques
d'une projection latérale alors que la distribution laminaire des boutons terminaux
antérogradement marqués suggère que cette projection a des caractéristiques d'une
projection feedback. Cette contradiction pourrait être propre aux connexions
corticocorticales entre les cortex sensoriels primaires et pourrait également suggérer que
la classification dichotomique des projections corticales en type feedforward ou
feedback n'est pas appropriée.

248
L'asymétrie du poids des projections
Le transport rétrograde de la sous-unité B de la toxine du choléra a démontré une
projection plus forte de VI vers SI que de SI vers VI. De manière similaire, une forte
projection du cortex visuel primaire vers le cortex somatosensoriel primaire et une
projection réciproque modérée a été démontrée chez la gerbille (Henschke et al. , 2014).
Chez la gerbille, le cortex visuel primaire a les plus fortes projections multisensorielles
et reçoit des projections modérées et similaires du cortex auditif primaire et du cortex
somatosensoriel primaire. D'un autre côté, le cortex somatosensoriel reçoit une forte
projection du cortex visuel, mais seulement une faible projection du cortex auditif. Le
cortex auditif primaire ne reçoit que des faibles projections des autres cortex sensoriels
primaires (Henschke et al. , 2014). Ces observations suggèrent que les influences
mutuelles entre les sens ne sont pas équivalentes en force. Chez la souris, comme chez la
gerbille, l'influence du cortex visuel sur le cortex somatosensoriel serait la plus forte.
L'asymétrie de la taille des boutons terminaux
L'asymétrie des projections réciproques entre VI et SI a également été observée
dans la distribution de taille des boutons terminaux. Il y avait de gros boutons terminaux
dans toutes les couches corticales du champ de tonneaux qui n' étaient pas présents dans
le cortex visuel primaire.
La distribution de taille que nous avons obtenue dans notre deuxième étude emploie
la même mesure que celle des connexions entre le cortex auditif primaire et secondaire

249
chez la souris (Covic & Sherman, 2011). Nous supposons que les gros boutons
terminaux que nous avons observés dans la projection de VI vers le champ de tonneaux
reflètent la présence de réponses postsynaptiques de Classe 1 et que la grande population
de petits terminaux, qui semble être prédominante dans les deux projections reflètent la
présence de réponses postsynaptiques de Classe 2.
Dans les VOles thalamocorticales et corticothalamiques, les réponses
postsynaptiques de Classe 1 et de Classe 2 sont respectivement considérées comme
inductrices et modulatrices (Lee & Sherman, 2008; Lee & Sherman, 2009a, 2009b;
Petrof & Sherman, 2013; Reichova & Sherman, 2004; Sherman & Guillery, 1996, 1998,
2013a; Viaene et al. , 2011a). Ce modèle de transmission glutamatergique stipule que la
transmission de l' information sensorielle dépend des voies inductrices (Covic &
Sherman, 2011 ; Sherman & Guillery, 20 Ba). Si tel est le cas, les résultats de notre
deuxième étude démontrent que l' information visuelle est induite au cortex
somatosensoriel tandis que l' information tactile a une influence modulatrice
prédominante sur le cortex visuel.
L'asymétrie du diamètre des axones
Dans les projections corticothalamiques, il existe deux types très distincts d'axones
(Sherman & Guillery, 2013a). Des axones de gros diamètre qui proviennent des
neurones de la couche 5 et qui transmettent des réponses postsynaptiques de Classe 1 et
des axones de petit diamètre qui proviennent des neurones de la couche 6 et qui

250
transmettent des réponses postsynaptiques de Classe 2 (Bourassa et al. , 1995; Bourassa
& Deschenes, 1995; Sherman & Guillery, 2013b). Il n'y a aucun cas d'axone dans nos
résultats avec seulement de gros boutons comme les axones corticothalamiques de gros
diamètre. Plusieurs axones dans notre échantillon n'avaient que de très petits boutons
alors que d' autres avaient un large éventail de taille de boutons. Sur ces axones, les très
petits boutons étaient plus nombreux que les gros. Ces résultats suggèrent qu' il y aurait
deux types distincts d'axones, sur la base de la présence ou de l'absence des gros
boutons. De plus, les axones qui entraient dans SIBF étaient significativement plus gros
que les axones qui entraient dans VI. Il y avait quelques axones très gros qui n' ont
jamais été observés dans la projection vers VI , ce qui démontre encore une fois que ces
connexions sont asymétriques. Une étude a démontré que les projections
corticocorticales vers différentes cibles peuvent avoir des axones de diamètre différent
(Innocenti, Vercelli, & Caminiti, 2014). Nos résultats démontrent que les deux
projections sont principalement constituées d'une population d'axones assez mince avec
la projection vers VI ayant les axones plus minces et la projection vers SIBF ayant les
axones de plus gros calibre. Le diamètre des axones est directement lié à leur vitesse de
conduction, ce qui suggère que certains axones dans la projection vers SlBF ont une
vitesse de conduction plus rapide que ceux dans la projection réciproque.
L'hypothèse de la précision des modalités sensorielles
La présence de gros boutons terminaux dans le champ de tonneaux et leur absence
dans le cortex visuel primaire suggère que l' influence inductrice de VI sur SI n'est pas

251
réciproque. Cette asymétrie pourrait refléter l'influence inductrice de la vision sur la
détection et la navigation tactile médiée par les vibrisses chez la souris, et l' importance
relative des différentes modalités sensorielles chez les rongeurs qui dépendent moins des
stimuli visuels par rapport aux primates (Whishaw & Kolb, 2004). En effet, le bénéfice
des interactions multisensorielles serait plus grand pour certaines modalités sensorielles
(Hollensteiner, Pieper, Engler, Konig, & Engel, 2015). L'hypothèse de la précision des
modalités sensorielles stipule que la résolution des divergences entre les modalités se
fera en faveur de la plus précise des deux (Welch & Warren, 1986). Cette hypothèse est
basée sur un ordre de dominance entre les modalités qui s'appuie sur leur précision
spatiale respective. Ainsi, les vibrisses sont spatialement plus précises dans la détection
et la navigation que la vision pour les rongeurs chez qui leur acuité tactile dépasse
largement leurs capacités de discrimination visuelle (Carvell & Simons, 1990; Prusky,
West, & Douglas, 2000; Wu, Ioffe, Iverson, Boon, & Dyck, 2013). On s'est donc
questionné sur comment cet aspect de la dominance des modalités sensorielles pourrait
se refléter chez l'humain qui dépend plus des stimuli visuels comparativement aux
rongeurs. Une étude a démontré que lorsque l'on varie le degré de congruence spatiale
entre ce que l'on voie et ce que l'on entend, la vision domine l' audition dans ce qui est
connu comme l' effet de la ventriloquie (Shams & Beierholm, 2010). De plus, dans une
tâche d'identification d' objet, des études ont démontré que la vision domine le toucher
(Gori, Del, Sandini, & Burr, 2008; Gori, Sandini, & Burr, 2012). On pourrait donc
s'attendre à retrouver des connexions avec une influence inductrice de SI et Al vers VI
dont les connexions réciproques auraient une influence modulatrice chez l'humain.

252
Les prothèses
La connaissance des mécanismes d'interactions visuotactiles et d'influence mutuelle
entre la modalité visuelle et somatosensorielle est applicable au sentiment de propriété
du corps, à l' illusion de la main en caoutchouc, et à la recherche sur les prothèses. Le
sentiment de propriété du corps se réfère à l'état perceptif particulier qui identifie les
différentes parties de notre corps comme étant les nôtres. Cette auto attribution est
médiée par des interactions multisensorielles (Botvinick & Cohen, 1998; Rochat, 1998;
van den Bos & Jeannerod, 2002). L' autoattribution de notre main par exemple, dépend
de l' interaction entre la vision de la main et le feedback tactile.
L'illusion de la main en caoutchouc est une illusion perceptive qui suscite un
sentiment de propriété d'une main étrangère en caoutchouc (Botvinick & Cohen, 1998).
Elle peut être induite quand une fausse main d'apparence réaliste est placée à la vue de
l'individu, et est touchée tout en touchant synchroniquement la main de cet individu, qui
est caché de sa vue (voir Figure 37). Plus précisément, il a été démontré que, après les
stimulations visuotactiles synchrones, l'emplacement perçu de la main de l'individu est
décalé vers la main en caoutchouc.
Cette illusion ne se produit pas lorsque la main en caoutchouc et la main de
l'individu sont touchées de manière asynchrone, à savoir lorsque le décalage temporel
est de plus de 300 ms (Shimada, Fukuda, & Hiraki, 2009), selon le principe de contiguïté
temporelle des interactions multisensorielles rapportées dans la littérature.

253
Une étude antérieure a démontré que l' illusion de la main en caoutchouc entraine un
recalibrage des représentations proprioceptives dans l'espace péripersonnel (Ehrsson,
Spence, & Passingham, 2004), et une autre a démontré l' implication du cortex
somatosensoriel primaire dans cette illusion (Schaefer, FIor, Heinze, & Rotte, 2007).
Figure 37. L'illusion de la main en caoutchouc (Botvinick & Cohen, 1998).
, , , ,
Pour que l' illusion se produise, les signaux ascendants, tels que les afférences
visuelles et tactiles, doivent prendre le dessus sur les signaux descendants, telles que les
attentes que la main étrangère en caoutchouc ne fasse pas partie de notre corps (Slater,
Spanlang, Sanchez-Vives, & Blanke, 2010). L'illusion de la main en caoutchouc est une
découverte particulièrement intéressante pour la recherche sur les prothèses, soit la
restauration des fonctions motrices et sensorielles d'un membre perdu avec un substitut
artificiel qui est ressenti et agit comme un membre organique. Une étude antérieure a
démontré qu' il est possible d' induire l' illusion chez des amputés en touchant des points
254
spécifiques sur le membre restant (Ehrsson et al., 2008). L'étude suggère que des effets
similaires pourraient être obtenus avec une prothèse et des capteurs artificiels qui
fournissent unfeedback tactile synchrone grâce à une gamme de stimulateurs tactiles sur
le moignon. La prothèse envisagée avec un tel feedback tactile jumelé au contrôle visuel,
pourrait être plus facilement incorporé dans l'espace péripersonnel ce qui pourrait en
retour améliorer son contrôle volontaire (Childress, 1973).
Comme nous l'avons vu dans les résultats de notre deuxième étude, l'asymétrie
reflétée dans la plus grande influence de la vision sur la détection et la navigation tactile
médiée par les vibrisses chez la souris démontre l'importance relative des différentes
modalités sensorielles chez les rongeurs qui dépendent moins des stimuli visuels par
rapport aux primates (Whishaw & Kolb, 2004). L'humain dépend plus des stimuli
visuels par rapport aux rongeurs, ce qui est reflété dans la dominance de la vision sur les
autres modalités sensorielles (Gori et al., 2008, 2012; Shams & Beierholm, 2010). Le
bénéfice des interactions visuotactiles serait donc plus grand pour la modalité visuelle
(Hollensteiner et al., 2015), car chez l'humain, l'acuité visuelle est spatialement plus
précise dans la détection et la navigation, et dépasse largement leurs capacités de
discrimination tactile (Witten & Knudsen, 2005). Le feedback tactile synchrone fourni
par une prothèse et des capteurs artificiels serait donc important dans la résolution des
divergences entre la modalité visuelle et somatosensorielle basée sur la dominance de la
vision (Welch & Warren, 1986). Les divergences lors de l'illusion de la main en
caoutchouc seraient entre les signaux ascendants et descendants. Les signaux ascendants

255
dans l'illusion de la main en caoutchouc seraient en fonction de la synchronisation entre
les stimuli visuels et tactiles (Armel & Ramachandran, 2003). Les signaux descendants
dans cette illusion seraient plutôt en fonction de la position anatomiquement correcte de
la prothèse par rapport à un vrai membre, et de l'apparence réaliste de celle-ci (Ehrsson
et al., 2004; Pavani, Spence, & Driver, 2000; Tsakiris & Haggard, 2005). Des stimuli
asynchrones dans le premier cas ou une apparence artificielle dans le second pourraient
inhiber l'illusion et donc l'utilisation de la prothèse chez l'amputé.
Les interfaces humain-robot
La connaissance des mécanismes d'interactions visuotactiles et de l'influence
mutuelle entre la modalité visuelle et somatosensorielle est aussi applicable à
l'utilisation d'outils. L'utilisation d'outils permet d'étendre le champ d'interaction avec
l'environnement et l'espace péripersonnel (Goldenberg & Spatt, 2009; Peeters et al.,
2009). Les progrès récents dans le domaine de la robotique ont attiré l'attention sur une
catégorie spécifique d'outils, les interfaces humain-robot. Les outils robotiques, tels que
les robots chirurgicaux sont conçus pour fonctionner à des endroits éloignés ou dans des
environnements virtuels sous un contrôle humain direct (Rosen, Hannaford, & Satava,
2011; Suematsu & deI Nido, 2004). Ces outils sans précédent augmentent
considérablement la précision, la force et l'accessibilité de la manipulation humaine sur
le corps humain ou dans certains systèmes industriels. Avec de tels dispositifs,
l'utilisateur détecte les positions et les mouvements de la cible et envoie ces
informations à un robot qUI est en contact avec l'environnement à distance

256
(Stone, 2000). Les chirurgiens interagissent maintenant fréquemment avec ces robots
pour effectuer des tâches complexes, telles que les chirurgies laparoscopiques (Kenngott
et al., 2012; Rassweiler, Safi, Subotic, Teber, & Frede, 2005; Tavakoli, Aziminejad,
Patel, & Moallem, 2007). Le but de ces robots est d' augmenter l' immersion entre le
chirurgien et l' environnement à distance, ainsi que la précision et l ' intuitivité de
l'utilisation du système (Octavia, Raymaekers, & Coninx, 2011). En dépit des avancées
dans le domaine de la robotique, l'étude des interfaces humain-robot en est encore à ses
débuts et peu d' attention a été accordée à l' influence des différentes modalités qui
contribuent à l ' extension d'un corps et de son espace péripersonnellors de l' utilisation
d'outils (Moizumi, Yamamoto, & Kitazawa, 2007; Sengul et al. , 2012, 2013).
La représentation neuronale de l' espace péripersonnel est encodée par l ' interaction
multisensorielle de la vision et du toucher dans plusieurs aires dont les cortex sensoriels
primaires (Ladavas & Serino, 2008; Schaefer, Heinze, & Rotte, 2012). La vision spécifie
la position d' une cible et le toucher transforme cette position en une commande motrice
appropriée pour l' atteindre (Rizzolatti et al. , 1981a, 1981b). La représentation neuronale
de l' espace péripersonnel est très plastique et plusieurs études chez les humains et les
primates ont démontré qu' elle peut s' étendre pour inclure des outils (Iriki, Tanaka, &
Iwamura, 1996; Maravita, 2006; Maravita & Iriki, 2004). Nos résultats ont démontré que
la vision transmet l'information sensorielle au cortex somatosensoriel primaire et que ce
dernier module cette information en retour. Dans le cas d 'une interface humain-robot, le
transfert d'information visuelle se fait dans un sens, mais il n'y a pas de feedback tactile

257
pour moduler cette information. Nos résultats suggéreraient que l' ajout de feedback
tactile, comme une vibration par exemple, contribuerait à l'immersion de l'utilisateur
dans l'environnement à distance et rendrait ces outils plus faciles à intégrer dans
l'espace péripersonnel. Une telle perspective de recherche dans la conception des
interfaces humain-robot serait à considérer. Par conséquent, la réconciliation des
domaines de la neuroscience tels que les neurosciences comportementales et la
neuroanatomie est importante pour comprendre tous les aspects de l' espace
péripersonneL Les résultats de notre deuxième étude fournissent des données
importantes sur les influences réciproques entre la vision et le toucher au niveau de la
partie caudale du champ de tonneaux du cortex somatosensoriel primaire et du cortex
visuel primaire, ce qui représente une étape importante de la recherche sur l'utilisation
d'outils tels que les robots chirurgicaux et la plasticité de la représentation neuronale de
l'espace péripersonneL
Objectif3 : Effets de l'énucléation sur les connexions corticocorticales directes et réciproques entre le cortex visuel et somatosensoriel primaire de la souris
Le troisième et dernier objectif de cette thèse était d'étudier l' impact de la perte de
la vision sur la microcircuiterie des connexions entre VI et SI à l' aide d'un échantillon
de souris énucléées à la naissance et de souris intactes. L'étude plus poussée de la
structure des connexions entre VI et SI a permis de mieux comprendre comment les
connexions entre deux cortex sensoriels primaires sont altérées par la perte d'un sens,
car peu d' études se sont consacrées aux efférences du cortex visuel vers les aires des
autres modalités sensorielles suite à la perte de la vision. En effet, les conséquences de la

258
cécité sur les modalités intactes est devenu l' objet d'études que récemment (Bavelier &
Neville, 2002; Merabet & Pascual-Leone, 2010).
Il était auparavant suggéré que la plasticité intermodale dans les aires déprivées était
le résultat du développement de nouvelles projections provenant d' aires des autres
modalités ou du démasquage de projections existantes (Rauschecker, 1995). À cette
époque, le paradigme dominant en matière d'organisation sensorielle corticale
considérait les cortex sensoriels primaires comme étant seulement habileté à traiter les
informations de leur propre modalité (Felleman & Van Essen, 1991; Jones & Powell,
1970; Papema & Malach, 1991). Dans ce contexte, si un cortex sensoriel primaire venait
à perdre sa source d' activation, la plasticité intermodale qui s' en suit serait le résultat du
développement de nouvelles projections. Cependant, une multitude d'études récentes ont
démontré qu' il y a des connexions corticocorticales directes et réciproques entre les
cortex sensoriels primaires même lorsque l'ensemble des modalités sensorielles est
intact.
C'est pourquoi notre troisième étude s'est intéressée davantage au mécanisme de la
réorganisation des circuits corticaux intermodaux de la plasticité intermodale qui
implique l'amplification ou la diminution des connexions. Les résultats de notre
troisième étude conftrment que l'énucléation réduit le poids de la projection de SI vers
VI tel que démontré précédemment (Charbonneau et al. , 2012). De plus, nos résultats
démontrent que l'énucléation réduit l' étendue de taille des boutons terminaux et des

259
axones de la projection du cortex visuel vers le cortex somatosensoriel. La diminution de
l'étendue de taille des boutons terminaux dans la projection de VI vers SI chez les
souris énucléées suggère que l'influence de VI sur SI est modifiée par l'énucléation.
Notre troisième étude démontre que la cécité entraine des modifications
neuroanatomiques dans les connexions corticocorticales intermodales entre le cortex
visuel et somatosensoriel primaire chez la souris.
Les effets de la cécité sur le poids des projections
Nos résultats confinnent que l'énucléation réduit le poids des projections
somatosensorielles vers VI (Charbonneau et al., 2012), et montrent pour la première fois
qu'elle n'a aucun effet sur le poids des projectiolls visuelles vers SI. Cette conséquence
de la cécité pourrait être spécifique au toucher étant donné que le nombre de neurones
projetant de Al vers VI n'était pas significativement différent entre les souris intactes et
énucléées (Charbonneau et al., 2012), de même que le nombre de neurones projetant de
VI vers SI comme le démontrent nos résultats. De même, l'absence d'activité
somatosensorielle suivant la coupe des vibrisses durant les cinq premiers jours après la
naissance diminue significativement les afférences visuelles vers le cortex
somatosensoriel primaire chez le rat (Sieben et al., 2015). Cette étude démontre
également une diminution fonctionnelle de cette projection. Des études antérieures ont
également démontré une connectivité fonctionnelle diminuée entre le cortex visuel et le
cortex somatosensoriel ainsi que le cortex moteur et les aires multisensorielles
temporales chez les humains aveugles (Liu et al., 2007; Yu et al., 2008). Les

260
changements observés chez l'humain au ruveau de la connectivité fonctionnelle ne
s'expliquent toutefois par nécessairement par des changements anatomiques qui vont
dans le même sens.
Nos résultats penchent en faveur de l'hypothèse de la diminution des connexions
existantes entre les aires visuelles et les aires des autres modalités sensorielles. Les
capacités non visuelles exacerbées chez les aveugles ne peuvent donc pas s'expliquer
par une amplification des connexions corticocorticales entre les cortex sensoriels
primaires. Les individus aveugles sont pourtant plus performants que les individus
voyants pour localiser des sons périphériques (Despres, Candas, & Dufour, 2005; Fieger,
Roder, Teder-Salejarvi, Hillyard, & Neville, 2006; Roder et al. , 1999; Voss et al. , 2004),
ou des stimuli monauraux (Gougoux, Zatorre, Lassonde, Voss, & Lepore, 2005; Lessard,
Pare, Lepore, & Lassonde, 1998; Voss, Gougoux, Zatorre, Lassonde, & Lepore, 2008).
Ils ont aussi une meilleure résolution temporelle de détection des stimuli auditifs
(Stevens & Weaver, 2005) et peuvent discriminer plus facilement des variations de
fréquence sonore (Gougoux et al. , 2004). Quant aux informations somatosensorielles, en
plus de posséder une meilleure résolution spatiale pour la détection des stimuli tactiles
(Van Boven, Hamilton, Kauffman, Keenan, & Pascual-Leone, 2000) les aveugles
détectent plus facilement des stimuli vibrotactiles (W an, Wood, Reutens, & Wilson,
2010) que les individus voyants. Finalement, ils démontrent aussi des performances
améliorées pour la détection (Beaulieu-Lefebvre, Schneider, Kupers, & Ptito, 2011;
Cuevas, Plaza, Rombaux, De Volder, & Renier, 2009) et l' identification (Cuevas et

261
al., 2009; Rosenbluth, Grossman, & Kaitz, 2000) de stimuli olfactifs. Les résultats d'une
étude antérieure de Collignon et collègues publiés dans la revue Brain (2013) ont
suggéré que les aveugles précoces utilisent des connexions corticocorticales entre les
aires sensorielles primaires pour traiter l'information auditive au sein du cortex visuel,
alors que les aveugles tardifs utiliseraient plutôt des connexions corticocorticales
provenant des aires associatives.
Les effets de la cécité sur la nature des projections
La nature de la projection de SI vers VI en termes de la distribution laminaire des
neurones rétrogradement marqués (Felleman & Van Essen, 1991; Rouiller & Welker,
1991), a changé pour une distribution beaucoup plus infragranulaire chez les souris
énucléées à la naissance. Un mécanisme qui pourrait expliquer la diminution du nombre
de neurones dans les couches supragranulaires et leur augmentation dans les couches
infragranulaires dans la projection de VI vers S 1 observées chez les cas énucléés
pourrait être celui du raffmement des projections reliant les aires corticales grâce à
l'élimination sélective des connexions initialement surabondantes (Batardiere et al.,
2002; Kennedy, Bullier, & Dehay, 1989). Des études ont testé si l'élimination sélective
des connexions joue un rôle fondamental dans la formation de l'organisation
hiérarchique du cortex. Chez les primates, la distribution laminaire des neurones des
connexions corticocorticales émerge à un stade précoce où il y a un excès de neurones
dans les couches supragranulaires. Dans le développement de ces connexions, il y a une
augmentation concomitante du nombre de neurones infragranulaires et une diminution
262
des neurones supragranulaires. Les résultats de notre troisième étude, bien que chez la
souris, suggéreraient qu'il y a une diminution excessive du nombre de neurones dans les
couches supragranulaires. On aurait donc ici un développement aberrant de la projection
de SI vers VI.
Tel que mentionné précédemment, peu d' études se sont consacrées aux effets de la
cécité sur les efférences de VI. Certaines études ont toutefois démontré que l'expérience
sensorielle affecte l'organisation des circuits corticaux dans le système visuel et les
efférences de VI vers les aires extrastriées. Il a été démontré chez les rats énucléés à la
naissance que l'activité visuelle était nécessaire pour le développement normal des
connexions striées-extrastriées. Chez les cas énucléés à la naissance, le schéma de
distribution des projections de VI vers les aires extrastriées était aberrant et la cécité a
entrainé un élargissement anormal des champs de projection (Bravo & Inzunza, 1994;
Laing, Bock, Lasiene, & Olavarria, 2012; Laramée et al., 2011). Ces résultats mettent en
évidence une diminution de la spécificité de la topographie des connexions striées
extrastriées des aveugles. D'autres études de traçage démontrent également une vaste
réorganisation des connexions corticocorticales préexistantes entre les cortex sensoriels
primaires chez les opossums énucléés (Karlen, Kahn, & Krubitzer, 2006), les souris
ayant une déficience visuelle (Larsen et al., 2009) et les humains aveugles (Klinge et al. ,
2010).

263
Les effets de la cécité sur la taille des boutons et des axones
Les effets de la déprivation visuelle sur les connexions corticocorticales entre le
cortex visuel primaire et le cortex somatosensoriel primaire ont également été observés
dans l'étendue de taille des boutons terminaux et des axones. Les gros boutons
terminaux observés dans le champ de tonneaux chez les cas intacts ne sont plus présents
chez les cas énucléés. Le modèle de la transmission glutamatergique stipule que le
transfert de l'information sensorielle dépend des réponses synaptiques de Classe 1
(Covic & Sherman, 2011; Sherman & Guillery, 2013b). Cependant, l'identification des
réponses postsynaptiques en tant que Classe 1 ou Classe 2 sur la base de la taille des
boutons terminaux doit être faite parcimonieusement. En effet, bien que l'on sache que
l'activité sensorielle joue un rôle important dans la détermination de la taille d'une
synapse (Harris & Sultan, 1995; Pierce & Lewin, 1994; Schikorski & Stevens, 1997,
1999), l'absence de gros boutons terminaux dans le champ de tonneaux suite à
l'énucléation ne signifierait pas systématiquement l'absence de réponses
postsynaptiques de Classe 1. En conséquence à l'absence d'activité visuelle dans le
cortex visuel primaire, celui-ci ne serait plus en mesure de transmettre de l'information
visuelle au cortex somatosensoriel primaire, ce qui pourrait entrainer une diminution de
la taille des boutons terminaux associés aux réponses postsynaptiques de Classe 1 sans
pour autant signifier leur disparition totale. Si tel est le cas, les résultats de notre
troisième étude suggèrent que l'influence inductrice du cortex visuel primaire vers le
champ de tonneaux du cortex somatosensoriel primaire est diminuée par l'énucléation et
l'absence d'activité visuelle qui en découle dans le cortex visuel primaire.
264
La déprivation sensorielle n'affecte pas seulement la taille des boutons terminaux, il
a également été démontré qu'elle affecte la densité des boutons sur les neurones
excitateurs et inhibiteurs du cortex visuel et somatosensoriel (Marik, Yamahachi,
McManus, Szabo, & Gilbert, 2010; Marik, Yamahachi, Meyer zum Alten, & Gilbert,
2014). Une augmentation de la densité totale des boutons terminaux a été démontrée sur
les neurones excitateurs dans les aires déprivées tandis qu'une diminution de la densité
totale des boutons terminaux a été démontrée sur les neurones inhibiteurs dans les aires
déprivées. Même si un grand nombre de questions demeurent sur les mécanismes de la
transmission synaptique glutamatergique, nos résultats suggèrent que l'activité
sensorielle et certaines caractéristiques neuroanatomiques des axones tels que la taille de
leurs boutons terminaux sont corrélées.
L'énucléation avait également diminué significativement le diamètre des axones
dans SI suite aux injections dans VI. Le diamètre des axones est une variable
importante dans la détermination de la vitesse de conduction. Tout comme la longueur,
cette variable détermine les délais de transmission et la synchronisation des impulsions
aux différentes cibles d'un axone individuel (Tomasi, Carniniti, & Innocenti, 2012).
Autrement dit, plus le diamètre d'un axone est gros, plus les potentiels d'action seront
rapidement transmis entre les aires corticales. Les projections corticocorticales
comprennent des axones de diamètres différents dépendant de leur source et des aires
corticales qu'elles ciblent (Anderson & Martin, 2002; Carniniti, Ghaziri, Galuske, Hof,
& Innocenti, 2009; Carniniti et al., 2013; Innocenti et al., 2014; Tomasi et al., 2012). Peu

265
d'études ont examiné l'effet de l' activité sensorielle sur le diamètre des axones dans les
connexions corticocorticales. Nos résultats ont démontré que la cécité peut diminuer le
diamètre des axones projetant à partir d'une aire déprivée vers une aire non déprivée et
peut augmenter le diamètre des axones projetant à partir d'une aire non déprivée vers
une aire déprivée. En d' autres termes, suivant la déprivation visuelle, la projection de VI
vers SI perdrait beaucoup de sa vitesse de conduction, ce qui est cohérent avec ce qui a
été vu dans l'étendue de taille des boutons terminaux chez les cas énucléés. Le
Tableau 19 résume les caractéristiques qui différencient les proj ections entre V 1 et SI .
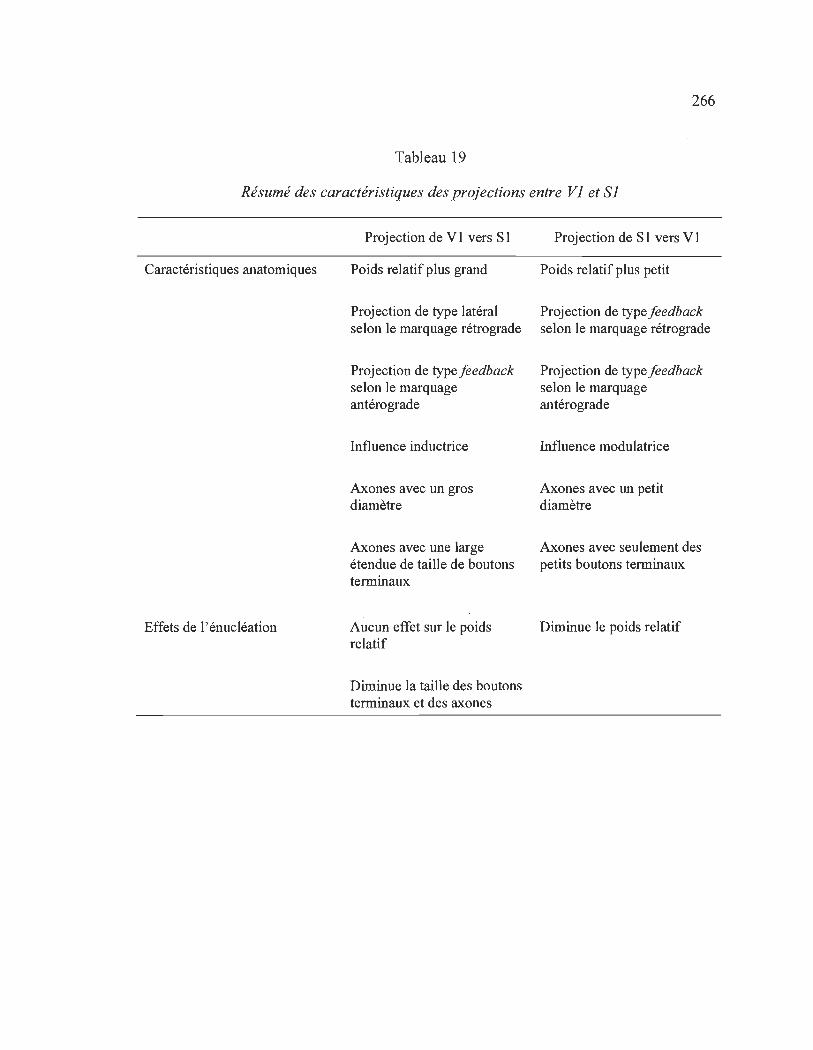
266
Tableau 19
Résumé des caractéristiques des projections entre Vi et Si
Caractéristiques anatomiques
Effets de l'énucléation
Projection de VI vers SI
Poids relatif plus grand
Projection de type latéral selon le marquage rétrograde
Projection de type feedback selon le marquage antérograde
Influence inductrice
Axones avec un gros diamètre
Axones avec une large étendue de taille de boutons terminaux
Aucun effet sur le poids relatif
Diminue la taille des boutons terminaux et des axones
Projection de SI vers VI
Poids relatif plus petit
Projection de typefeedback selon le marquage rétrograde
Projection de type feedback selon le marquage antérograde
Influence modulatrice
Axones avec un petit diamètre
Axones avec seulement des petits boutons terminaux
Diminue le poids relatif

Conclusion
Les résultats des trois études présentés dans cette thèse ont une signification
importante dans le contexte des connaissances actuelles sur les interactions
multisensorielles et la hiérarchie des sens. Notre première étude démontre que le
traitement effectué dans un cortex sensoriel primaire tel que le cortex somatosensoriel
primaire est effectivement plus complexe que ce qui était initialement cru (Felleman &
Van Essen, 1991; Jones & Powell, 1970; Mesulam, 1998), et qu'il implique
l'information sensorielle provenant des autres modalités et l'information non sensorielle.
Sa position à mi-chemin entre les voies sensorielles ascendantes provenant du thalamus
et les voies sensorielles descendantes provenant des aires corticales associatives
multisensorielles suggérait que ce cortex sensoriel primaire a un rôle clé dans le
traitement de l'information axé sur le stimulus et le traitement de l'information sur la
tâche.
Nos résultats ont entre autres démontré que les informations des modalités auditives
et visuelles atteignent le champ de tonneaux à partir de trois sources. D'une part il Y a
les connexions thalamocorticales provenant de certains noyaux thalamiques propices aux
interactions multisensorielles et il y a les connexions corticocorticales directes provenant
du cortex auditif et visuel primaire. D'autre part, il y les connexions corticocorticales de
type feedback provenant de plusieurs aires associatives et multisensorielles d'ordre
supérieur. Dans le premier cas, ces connexions seraient le moyen le plus rapide et le plus

269
efficace de transmettre les informations sensorielles des autres modalités vers le cortex
somatosensoriel primaire (Budinger et al., 2006; Cappe et al., 2009; Kayser et al., 2005;
Schroeder et al. , 2003; Sieben et al., 2013). Dans le dernier cas, ces connexions
permettraient de moduler l'information acheminée par le thalamus dans le cortex
somatosensoriel primaire (Bullier, 2001 ; Tononi & Koch, 2008), et lui conférerait un
rôle clé dans le codage prédictif qui est le processus d'appariement du système nerveux
entre l'information sensorielle des stimuli acheminée par les signaux ascendants et les
attentes envers l'environnement généré à l' interne par les signaux descendants
(Grossberg, 1980; Lee & Mumford, 2003; Llinas & Pare, 1991). Ces signaux
descendants suffiraient à construire un percept sensoriel consciemment accessible dans
le cortex somatosensoriel primaire même en l'absence de stimuli externes provenant des
organes sensoriels (Kosslyn, Thompson, Kim, & Alpert, 1995; Kraemer, Macrae, Green,
& Kelley, 2005; Le et al., 1993; Yoo, Freeman, McCarthy, III, & Jolesz, 2003 ; Yoo,
Lee, & Choi, 2001).
Notre deuxième étude démontre que les connexions entre les cortex visuel et le
cortex somatosensoriel primaires, bien que réciproques, ne sont pas symétriques. En
effet, la projection du champ de tonneaux du cortex somatosensoriel primaire vers le
cortex visuel primaire est .de type feedback et a une influence modulatrice prédominante
alors que la projection réciproque est de type latéral et a plutôt une influence inductrice.
Bien que l'on ait pu supposer que ces deux sensoriels primaires soient au même niveau
initial dans la hiérarchie corticale et liée par des connexions réciproques symétriques

270
(Felleman & Van Essen, 1991), nos résultats démontrent que ce n'est pas le cas. Ces
observations suggèrent que les influencent mutuelles entre les sens au niveau des cortex
sensoriels primaires ne sont pas équivalente. Chez la souris, la vision serait plus
importante pour l'amélioration de l'exploration tactile et que l'information tactile est
moins importante pour l'amélioration de l'information visuelle. Comme on l'a vu
précédemment, cette asymétrie pourrait refléter la plus grande influence de la vision sur
la détection et la navigation tactile médiée par les vibrisses chez la souris, et
l'importance relative des différentes modalités sensorielles chez les rongeurs qui
dépendent moins des stimuli visuels par rapport aux primates (Whishaw & Kolb, 2004).
En effet, le bénéfice des interactions multisensorielles serait plus grand pour certaines
modalités sensorielles (Hollensteiner et al., 2015). Cet aspect de la dominance des
modalités sensorielles se reflète chez l'humain qui dépend plus des stimuli visuels par
rapport aux rongeurs avec la dominance de la vision sur l'audition et le toucher en cas de
divergence (Gori et al., 2008, 2012; Shams & Beierholm, 2010). Si nous spéculons, ce
serait donc le toucher qui viendrait améliorer la vision chez l'humain.
Notre troisième et dernière démontre l'impact de la cécité sur la microcircuiterie des
connexions entre VI et SI. Nos résultats démontrent que la perte de la vision entraine
non seulement la réduction du poids de la projection du cortex visuel primaire vers le
cortex somatosensoriel primaire, mais suggèrent aussi que la projection réciproque n'a
plus d' influence inductrice. Si l'on se base sur le modèle de la transmission
glutamatergique qui stipule que le transfert de l'information sensorielle dépend des

271
réponses synaptiques inductrices (Covic & Sherman, 2011 ; Sherman & Guillery,
2013b), l' information visuelle ne serait plus transmise à SI suivant l'énucléation.
Cette thèse démontre l'originalité de la recherche effectuée dans les trois articles
présentés. Notre première étude fait la démonstration qu'un cortex sensoriel primaire
comme le cortex somatosensoriel primaire n'est pas limité au traitement unisensoriel.
Cette étude se démarque des études antérieures et des projets de grandes envergures avec
une analyse plus complète et détaillée sur les afférences du cortex somatosensoriel
primaire. Cela est important, car on démontre ainsi que même avec moins de moyens
que certains grands laboratoires travaillant dans le même domaine, on arrive à contribuer
de manière significative aux connaissances sur la connectivité du cerveau de la souris.
Notre deuxième étude fait la démonstration que les modalités sensorielles n'ont pas la
même influence au niveau des cortex sensoriels primaires. Cette étude se démarque par
l'étude de la morphologie des axones et de leurs boutons terminaux, deux aspects qui
n'ont jamais été étudiés dans les connexions corticocorticales intermodales et qui ont
permis d'en apprendre davantage sur la fonction de ces connexions. La méthodologie
employée pour échantillonner les axones et les boutons terminaux a été conçue en
partant de rien et a dû être mise à l'épreuve par essais et erreurs. Notre troisième et
dernière étude fait la démonstration que la perte d'un sens entraine des modifications de
la structure des connexions corticocorticales intermodales. Cette étude se démarque en
étant sans précédent et en démontrant comment les connexions entre deux cortex
sensoriels primaires sont altérées par la perte d'un sens. C'est pour toutes ces raisons que

272
cette thèse contribue de façon originale aux connaissances sur la microcircuiterie, la
neuroanatomie, la connectivité entre les cortex sensoriels primaires, les interactions
multisensorielles, la perception sensorielle et la cécité.

Références générales

Ahmed, B., Anderson, 1. C., Douglas, R. 1., Martin, K. A., & Nelson, J. C. (1994). Polyneuronal innervation of spiny stellate neurons in cat visual cortex. Journal of Comparative Neurology, 341, 39-49.
Allman, B. L., Keniston, L. P., & Meredith, M. A. (2009). Notjust for bimodal neurons anymore: The contribution of unimodal neurons to cortical multisensory processing. Brain Topography, 21, 157-167.
Amlot, R , Walker, R , Driver, J., & Spence, C. (2003). Multimodal visualsomatosensory integration in saccade generation. Neuropsychologia, 41, 1-15.
Anderson, J. C. , & Martin, K. A. (2002). Connection from cortical area V2 to MT in macaque monkey. Journal of Comparative Neurology, 443, 56-70.
Angelucci, A., Clasca, F., & Sur, M. (1996). Anterograde axonal tracing with the subunit B of cholera toxin: A highly sensitive immunohistochemical protocol for revealing fme axonal morphology in adult and neonatal brains. Journal of Neuroscience Methods, 65, 101-112.
Armel, K. C., & Ramachandran, V. S. (2003). Projecting sensations to external objects: evidence from skin conductance response. Proceedings of the Royal Society of London: Biological, 270, 1499-1506.
Bartlett, E. L. , & Smith, P. H. (2002). Effects of paired-pulse and repetitive stimulation on neurons in the rat medial geniculate body. Neuroscience, 113, 957-974.
Bartlett, E. L., Stark, 1. M., Guillery, R W., & Smith, P. H. (2000). Comparison of the fme structure of cortical and collicular terminals in the rat medial geniculate body. Neuroscience, 100, 811-828.
Batardiere, A., Barone, P., Knoblauch, K., Giroud, P., Berland, M. , Dumas, A. M. et al. (2002). Early specification ofthe hierarchical organization ofvisual cortical areas in the macaque monkey. Cerebral Cortex, 12, 453-465.
Bavelier, D., & Neville, H. J. (2002). Cross-modal plasticity: Where and how? Nature Reviews Neuroscience, 3, 443-452.
Bear, M. F. , Connors, B. W., & Paradiso, M. A. (2007). Neurosciences: Exploring the brain (3e éd.). Baltimore, MD: Lippincott Williams & Wilkins.

275
Beaulieu-Lefebvre, M., Schneider, F. c., Kupers, R., & Ptito, M. (2011). Odor perception and odor awareness in congenital blindness. Brain Research Bulletin, 84, 206-209.
Bizley, J. K. , & King, A. 1. (2008). Visual-auditory spatial processing in auditory cortical neurons. Brain Research, 1242, 24-36.
Bizley, J. K., Nodal, F. R., Bajo, V. M., Nelken, L, & King, A. 1. (2007). Physiologie al and anatomie al evidence for multisensory interactions in auditory cortex. Cerebral Cortex, 17, 2172-2189.
Blomqvist, A., Ericson, A. c., Broman, 1., & Craig, A. D. (1992). Electron microscopie identification of lamina 1 axon terminations in the nucleus submedius of the cat thalamus. Brain Research, 585, 425-430.
Blumenfeld, H. (2010). Neuroanatomy through clinical cases (2e éd.). Sunderland, MA: Sinauer Associates, Inc.
Botvinick, M., & Cohen, J. (1998). Rubber hands 'feel' touch that eyes see. Nature, 391, 756.
Bourassa, J. , & Deschenes, M. (1995). Corticothalamic projections from the primary visual cortex in rats: A single fiber study using biocytin as an anterograde tracer. Neuroscience, 66, 253-263.
Bourassa, J., Pinault, D. , & Deschenes, M. (1995). Corticothalamic projections from the cortical barrel field to the somatosensory thalamus in rats: A single-fibre study using biocytin as an anterograde tracer. Eur J Neurosci, 7, 19-30.
Brandt, H. M., & Apkarian, A. V. (1992). Biotin-dextran: A sensitive anterograde tracer for neuroanatomic studies in rat and monkey. Journal of Neuroscience Methods, 45, 35-40.
Bravo, H., & Inzunza, O. (1994). Effect of pre- and postnatal retinal deprivation on the striate-peristriate cortical connections in the rat. Biological Research, 27, 73-77.
Brodal, P. (2010). The central nervous system: Structure and function (4e éd.). Oslo, Norvège: Oxford University Press.
Bruce, C., Desimone, R., & Gross, C. G. (1981). Visual properties of neurons in a polysensory area in superior temporal sulcus of the macaque. Journal of Neurophysiology, 46, 369-384.

276
Budinger, E., Heil, P., Hess, A., & Scheich, H. (2006). Multisensory processing via early cortical stages: Connections of the primary auditory cortical field with other sensory systems. Neuroscience, 143, 1065-1083.
Budinger, E., Laszcz, A., Lison, H., Scheich, H., & Ohl, F. W. (2008). Non-sensory cortical and subcortical connections of the primary auditory cortex in Mongolian gerbils: Bottom-up and top-down processing of neuronal information via field AI. Brain Research, 1220, 2-32.
Budinger, E., & Scheich, H. (2009). Anatomical connections suitable for the direct processing of neuronal information of different modalities via the rodent primary auditory cortex. Hearing Research, 258, 16-27.
Bullier, J. (2001). Integrated model of visual processing. Brain Research Reviews, 36, 96-107.
Calvert, G. A. , & Thesen, T. (2004). Multisensory integration: Methodological approaches and emerging principles in the human brain. Journal of Physiology -Paris, 98, 191-205.
Caminiti, R., Carducci, F., Piervincenzi, C. , Battaglia-Mayer, A., Confalone, G., ViscoComandini, F. et al. (2013). Diameter, length, speed, and conduction delay of callosal axons in macaque monkeys and humans: Comparing data from histology and magnetic resonance imaging diffusion tractography. Journal of Neuroscience, 33, 14501-14511.
Caminiti, R., Ghaziri, H., Galuske, R., Hof, P. R., & Innocenti, G. M. (2009). Evolution amplified processing · with temporally dispersed slow neuronal connectivity in primates. Proceedings of the National Academy of Sciences of the United States of America, 106, 19551-19556.
Campi, K. L., Bales, K. L., Grunewald, R., & Krubitzer, L. (2010). Connections of auditory and visual cortex in the prairie vole (Microtus ochrogaster): Evidence for multisensory processing in primary sensory areas. Cerebral Cortex, 20, 89-108.
Cappe, C., Rouiller, E. M., & Barone, P. (2009). Multisensory anatomical pathways. Hearing Research, 258, 28-36.
Cardinali, L., Brozzoli, C., & Fame, A. (2009). Peripersonal space and body schema: Two labels for the same concept? Brain Topography, 21, 252-260.
Carvell, G. E. , & Simons, D. J. (1990). Biometric analyses of vibrissal tactile discrimination in the rat. Journal ofNeuroscience, 10, 2638-2648.

277
Castro-Alamancos, M. A. (2002). Properties of primary sensory (lemniscal) synapses in the ventrobasal thalamus and the relay of high-frequency sensory inputs. Journal of Neurophysiology, 87, 946-953.
Charbonneau, V., Laramee, M. E., Boucher, V., Bronchti, G., & Boire, D. (2012). Cortical and subcortical projections to primary visual cortex in anophthalmic, enucleated and sighted mice. European Journal ofNeuroscience, 36, 2949-2963.
Childress, D. S. (1973). Powered limb prostheses: Their clinical significance. IEEE Transactions on Biomedical Engineering, BME-20, 200-207.
Chung, S., Li, X., & Nelson, S. B. (2002). Short-term depression at thalamocortical synapses contributes to rapid adaptation of cortical sensory responses in vivo. Neuron, 34, 437-446.
Clancy, B., Darlington, R. B., & Finlay, B. L. (2001). Translating developmental time across mammalian species. Neuroscience, 105, 7-17.
Colonnier, M., & Guillery, R. W. (1964). Synaptic organization in the lateral geniculate nucleus of the monkey. Zeitschrift für Zellforschung und mikroskopische Anatomie, 62, 333-355.
Coogan, T. A., & Burkhalter, A. (1990). Conserved patterns of cortico-cortical connections defme areal hierarchy in rat visual cortex. Experimental Brain Research, 80, 49-53.
Coogan, T. A., & Burkhalter, A. (1993). Hierarchical organization of areas in rat visual cortex. Journal ofNeuroscience, 13, 3749-3772.
Corneil, B. D., Van, W. M., Munoz, D. P., & Van Opstal, A. J. (2002). Auditory-visual interactions subserving goal-directed saccades in a complex scene. Journal of Neurophysiology, 88, 438-454.
Covic, E. N., & Sherman, S. M. (2011). Synaptic properties of connections between the primary and secondary auditory cortices in mice. Cerebral Cortex, 21, 2425-2441.
Craig, A. D., Jr., & Burton, H. (1981). Spinal and medullary lamina I projection to nucleus submedius in medial thalamus: A possible pain center. Journal of Neurophysiology, 45, 443-466.
Cuevas, I., Plaza, P., Rombaux, P., De Volder, A. G., & Renier, L. (2009). Odour discrimination and identification are improved m early blindness. Neuropsychologia, 47, 3079-3083.

278
De Pasquale, R., & Sherman, S. M. (2011). Synaptic properties of corticocortical connections between the primary and secondary visual cortical areas in the mouse. JournalofNeuroscience, 31, 16494-16506.
De Pasquale, R., & Sherman, S. M. (2012). Modulatory effects of metabotropic glutamate receptors on local cortical circuits. Journal of Neuroscience, 32, 7364-7372.
Despres, O., Candas, V., & Dufour, A. (2005). Spatial auditory compensation in earlyblind humans: Involvement of eye movements and/or attention orienting? Neuropsychologia, 43, 1955-1962.
Diederich, A., Colonius, H., Bockhorst, D., & Tabeling, S. (2003). Visual-tactile spatial interaction in saccade generation. Experimental Brain Research, 148, 328-337.
Driver, J., & Noesselt, T. (2008). Multisensory interplay reveals crossmodal influences on 'sensory-specific' brain regions, neural responses, and judgments. Neuron, 57, 11-23.
Ehrsson, H. H., Rosen, B., Stockselius, A., Ragno, C., Kohler, P., & Lundborg, G. (2008). Upper limb amputees can be induced to experience a rubber hand as their own. Brain, 131, 3443-3452.
Ehrsson, H. H., Spence, C., & Passingham, R. E. (2004). That's my hand! Activity in premotor cortex reflects feeling of ownership of a limb. Science, 305, 875-877.
Feig, S., & Harting, J. K. (1998). Corticocortical communication via the thalamus: Ultrastructural studies of corticothalamic projections from area 17 to the lateral posterior nucleus of the cat and inferior pulvinar nucleus of the owl monkey. Journal of Comparative Neurology, 395, 281-295.
Felleman, D. J., & Van Essen, D. C. (1991). Distributed hierarchical processing in the primate cerebral cortex. Cerebral Cortex, 1, 1-47.
Fieger, A., Roder, B., Teder-Salejarvi, W., Hillyard, S. A., & Neville, H. J. (2006). Auditory spatial tuning in late-onset blindness in humans. Journal of Cognitive Neuroscience, 18, 149-157.
Forster, B., Cavina-Pratesi, c., Aglioti, S. M., & Berlucchi, G. (2002). Redundant target effect and intersensory facilitation from visual-tactile interactions in simple reaction time. Experimental Brain Research, 143, 480-487.

279
Frassinerti, F., Bolognini, N., & Ladavas, E. (2002). Enhancement of visual perception by crossmodal visuo-auditory interaction. Experimental Brain Research, 147, 332-343.
Frens, M. A., Van Opstal, A. J. , & Van der Willigen, R. F. (1995). Spatial and temporal factors determine auditory-visual interactions in human saccadic eye movements. Attention Perception, & Psychophysics, 57, 802-816.
Fujii, T., Tanabe, H. C., Kochlyama, T. , & Sadato, N. (2009). An investigation of crossmodal plasticity of effective connectivity in the blind by dynamic causal modeling of functional MRI data. Neurosciences Research, 65, 175-186.
Ghazanfar, A. A., & Schroeder, C. E. (2006). Is neocortex essentially multisensory? Trends in Cognitive Sciences, 10, 278-285.
Giard, M. H., & Peronnet, F. (1999). Auditory-visual integration during multimodal object recognition in humans: A behavioral and electrophysiological study. Journal of Cognitive Neuroscience, 11, 473-490.
Goldenberg, G., & Spart, 1. (2009). The neural basis oftool use. Brain, 132, 1645-1655.
Gori, M., Del, V. M., Sandini, G. , & Burr, D. C. (2008). Young chlldren do not integrate visual and haptic fonn information. Current Biology, 18, 694-698.
Gori, M., Sandini, G., & Burr, D. (2012). Development of visuo-auditory integration in space and time. Frontiers in Integrative Neurosciences, 6, 77.
Gougoux, F., Lepore, F. , Lassonde, M. , Voss, P., Zatorre, R. 1., & Belin, P. (2004). Neuropsychology: Pitch discrimination in the early blind. Nature, 430, 309.
Gougoux, F., Zatorre, R. J. , Lassonde, M., Voss, P. , & Lepore, F. (2005). A functional neuroimaging study of sound localization: Visual cortex activity predicts performance in early-blind individuals. PLoS Biol, 3, e27.
Graziano, M. S., Cooke, D. F., & Taylor, C. S. (2000). Coding the location of the arm by sight. Science, 290, 1782-1786.
Gregory, R. L. (1970). The Intelligent Eye. London: Weidenfeld & Nicolson.
Grossberg, S. (1980). How does a brain build a cognitive code? Psychological Review, 87, 1-51.
Guénard, H. (1996). Physiologie humaine (2e éd.). Paris: Pradel.

280
Guillery, R W. (1969). The organization of synaptic interconnections in the laminae of the dorsal lateral geniculate nucleus of the cat. Zeitschrift für Zellforschung und mikroskopische Anatomie, 96, 1-38.
Hajdu, F., Hassler, R, & Somogyi, G. (1982). Neuronal and synaptic organization of the lateral geniculate nucleus of the tree shrew, Tupaia glis. Cell and Tissue Research, 224, 207-223.
Harrington, L. K., & Peck, C. K. (1998). Spatial disparity affects visual-auditory interactions in human sensorimotor processing. Experimental Brain Research, 122, 247-252.
Harris, K. M., & Sultan, P. (1995). Variation in the number, location and size of synaptic vesicles provides an anatomical basis for the nonunifonn probability of release at hippocampal CAl synapses. Neuropharmacology, 34, 1387-1395.
Henschke, J. U., Noesselt, T., Scheich, H., & Budinger, E. (2014). Possible anatomical pathways for short-Iatency multisensory integration processes in primary sensory cortices. Brain Structure and Function.
Hilgetag, C. c., O'Neill, M. A., & Young, M. P. (2000). Hierarchical organization of macaque and cat cortical sensory systems explored with a novel network processor. Philosophical Transactions of the Royal Society of London B: Biological Sciences, 355, 71-89.
Hoefer, M., Tyll, S., Kanowski, M., Brosch, M., Schoenfeld, M. A., Heinze, H. 1. et al. (2013). Tactile stimulation and hemispheric asymmetries modulate auditory perception and neural responses in primary auditory cortex. Neuroimage, 79, 371-382.
Hollensteiner, K. J., Pieper, F., Engler, G., Konig, P., & Engel, A. K. (2015). Crossmodal integration improves sensory detection thresholds in the ferret. PLoS.One., 10, e0124952.
Hoogland, P. V., Wouterlood, F. G., Welker, E., & Van der Loos, H. (1991). Ultrastructure of giant and small thalamic terminaIs of cortical origin: A study of the projections from the barrel cortex in mice using Phaseolus vulgaris leuco-agglutinin (pHA-L). Experimental Brain Research, 87, 159-172.
Hom, G., & Hill, R M. (1966). Responsiveness to sensory stimulation of units in the superior colliculus and subjacent tectotegmental regions of the rabbit. Experimental Neurology, 14, 199-223.

281
Huberman, A. D., & Niell, C. M. (2011). What can mice tell us about how vision works? Trends in Neurosciences, 34, 464-473:
Hughes, H. C., Reuter-Lorenz, P. A., Nozawa, G., & Fendrich, R (1994). Visualauditory interactions in sensorimotor processing: Saccades versus manual responses. Journal of Experimental Psychology: Human perception and performance, 20, 131-153.
Ichida, J. M. , & Casagrande, V. A. (2002). Organization of the feedback pathway from striate cortex (VI) to the lateral geniculate nucleus (LGN) in the owl monkey (Aotus trivirgatus). Journal of Comparative Neurology, 454, 272-283.
Innocenti, G. M., Vercelli, A., & Caminiti, R (2014). The diameter of cortical axons depends both on the area of origin and target. Cerebral Cortex, 24, 2178-2188.
Iriki, A., Tanaka, M. , & Iwamura, Y. (1996). Coding of modified body schema during tool use by macaque postcentral neurones. Neuroreport, 7, 2325-2330.
Iurilli, G., Ghezzi, D., Olcese, U., Lassi, G., Nazzaro, C., Tonini, R, ... Medini, P. (2012). Sound-driven synaptic inhibition in primary visual cortex. Neuron, 73, 814-828.
Jiang, X., Johnson, R R, & Burkhalter, A. (1993). Visualization of dendritic morphology of cortical projection neurons by retro grade axonal tracing. Journal of Neuroscience Methods, 50, 45-60.
Jones, E. G., & Powell, T. P. (1970). An anatomical study of converging sensory pathways within the cerebral cortex ofthe monkey. Brain, 93, 793-820.
Kaas, J. H., & Collins, C. E. (2013). The resurection ofmultisensory cortex in primates: Connection patterns that integrate modalities. Dans G. A. Calvert, C. Spence, & B. E. Stein (Éds), The handbook of multisensory processes (pp. 285-293). Cambridge: The MIT Press.
Karlen, s. J., Kahn, D. M., & Krubitzer, L. (2006). Early blindness results in abnormal corticocortical and thalamocortical connections. Neuroscience, 142, 843-858.
Katz, L. C., & Shatz, C. J. (1996). Synaptic activity and the construction of cortical circuits. Science, 2 74, 1133-1138.
Kayser, C., Petkov, C. 1. , Augath, M. , & Logothetis, N . K. (2005). Integration of touch and sound in auditory cortex. Neuron, 48, 373-384.

282
Kayser, C., Petkov, C. 1., Augath, M., & Logothetis, N. K. (2007). Functional imaging reveals visual modulation of specific fields in auditory cortex. Journal of Neuroscience, 27, 1824-1835.
Kennedy, H., Bullier, J., & Dehay, C. (1989). Transient projection from the superior temporal sulcus to area 17 in the newborn macaque monkey. Proceedings of the National Academy of Sciences of the United States of America, 86, 8093-8097.
Kennett, S., Taylor-Clarke, M., & Haggard, P. (2001). Noninformative vision improves the spatial resolution of touch in humans. Current Biology, 11, 1188-1191.
Kenngott, H. G., Fischer, L., Nickel, F., Rom, J., Rassweiler, J., & Muller-Stich, B. P. (2012). Status of robotic assistance--a less traumatic and more accurate minimally invasive surgery? Langenbecks Archives ofSurgery, 397, 333-341.
Kleinfeld, D., Ahissar, E., & Diamond, M. E. (2006). Active sensation: Insights from the rodent vibrissa sensorimotor system. Current Opinion in Neurobiology, 16, 435-444.
Klinge, C., Eippert, F., Roder, B., & Buchel, C. (2010). Corticocortical connections mediate primary visual cortex responses to auditory stimulation in the blind. JournalofNeuroscience, 30, 12798-12805.
Kobbert, C., Apps, R., Bechmann, 1., Lanciego, J. L., Mey, 1., & Thanos, S. (2000). CUITent concepts in neuroanatomical tracing. Progress in Ne urobiology, 62, 327-351.
Kosslyn, S. M., Thompson, W. L., Kim, 1. J., & Alpert, N. M. (1995). Topographical representations of mental images in primary visual cortex. Nature, 378, 496-498.
Kraemer, D. J., Macrae, C. N., Green, A. E., & Kelley, W. M. (2005). Musical imagery: Sound of silence activates auditory cortex. Nature, 434, 158.
Ladavas, E., & Serino, A. (2008). Action-dependent plasticity in peripersonal space representations. Cognitive Neuropsychology, 25, 1099-1113.
Laing, R. J., Bock, A. S., Lasiene, J., & Olavarria, J. F. (2012). Role of retinal input on the development of striate-extrastriate patterns of connections in the rat. Journal of Comparative Neurology, 520, 3256-3276.
Lanciego, 1. L., & Wouterlood, F. G. (2011). A half century of experimental neuroanatomical tracing. Journal ofChemical.Neuroanatomy, 42, 157-183.
283
Laramée, M. E., Kurotani, T., Rockland, K. S., Bronchti, G., & Boire, D. (2011). Indirect pathway between the primary auditory and visual cortices through layer V pyramidal neurons in V2L in mouse and the effects of bilateral enucleation. European Journal ofNeuroscience, 34, 65-78.
Larsen, D. D., Luu, J. D., Burns, M. E., & Krubitzer, L. (2009). What are the effects of severe visual impairment on the cortical organization and connectivity of primary visual cortex? Frontiers Neuroanatomy, 3, 30.
Le, B. D., Turner, R., Zeffrro, T. A., Cuenod, C. A., Jezzard, P., & Bonnerot, V. (1993). Activation of human primary visual cortex during visual recall: A magnetic resonance imaging study. Proceedings of the National Academy of Sciences of the United States of America, 90, 11802-11805.
Lee, C. C. , & Sherman, S. M. (2008). Synaptic properties of thalamic and intracortical inputs to layer 4 of the frrst- and higher-order cortical areas in the auditory and somatosensory systems. Journal of Neurophysiology, 100, 317-326.
Lee, C. C., & Sherman, S. M. (2009a). Modulator property of the intrinsic cortical projection from layer 6 to layer 4. Frontiers in Systems Neuroscience. , 3, 3.
Lee, C. C., & Sherman, S. M. (2009b). Glutamatergic inhibition in sensory neocortex. Cerebral Cortex, 19, 2281-2289.
Lee, C. C., & Sherman, S. M. (2010). Topography and physiology of ascending streams in the auditory tectothalamic pathway. Proceedings of the National Academy of Sciences of the United States of America, 107, 372~377.
Lee, T. S., & Mumford, D. (2003). Hierarchical Bayesian inference in the visual cortex. Journal of the Optical Society of America. Part A, Optics, Image Science and Vision, 20, 1434-1448.
Lessard, N., Pare, M., Lepore, F., & Lassonde, M. (1998). Early-blind human subjects localize sound sources betler than sighted subjects. Nature, 395, 278-280.
Li, J., Guido, W., & Bickford, M. E. (2003). Two distinct types of corticothalamic EPSPs and their contribution to short-term synaptic plasticity. Journal of Neurophysiology, 90, 3429-3440.
Li, J., Wang, S., & Bickford, M. E. (2003). Comparison of the ultrastructure of cortical and retinal terminals in the rat dorsal lateral geniculate and lateral posterior nuclei. Journal of Comparative Neurology, 460, 394-409.

284
Liu, Y., Yu, C., Liang, M., Li, 1., Tian, L. , Zhou, Y. , ... Jiang, T. (2007). Whole brain functional connectivity in the early blind. Brain, 130, 2085-2096.
Llinas, R. R. , & Pare, D. (1991). Of dreaming and wakefulness. Neuroscience, 44, 521-535.
Longo, M. R., Schuur, F. , Kammers, M. P., Tsakiris, M., & Haggard, P. (2008). What is embodiment? A psychometric approach. Cognition, 107, 978-998.
Lovelace, C. T., Stein, B. E., & Wallace, M. T. (2003). An irrelevant light enhances auditory detection in humans: A psychophysical analysis of multisensory integration in stimulus detection. Cognitive Brain Research, 17, 447-453.
Luppi, P. H. , Fort, P., & Jouvet, M. (1990). Iontophoretic application of unconjugated cholera toxin B subunit (CTb) combined with immunohistochemistry of neurochemical substances: A method for transmitter identification of retrogradely labeled neurons. Brain Research, 534, 209-224.
Luppi, P. H., Sakai, K., Salvert, D., Fort, P., & Jouvet, M. (1987). Peptidergic hypothalamic afferents to the cat nucleus raphe pallidus as revealed by a double immunostaining technique using unconjugated cholera toxin as a retro grade tracer. Brain Research, 402, 339-345.
Macaluso, E. (2006). Multisensory processing fi sensory-specific cortical areas. Neuroscientist, 12, 327-338.
Maravita, A. (2006). From body in the brain, to body in space: Sensory and intentional aspects ofbody representation. New York, NY: Oxford University Press ..
Maravita, A., & Iriki, A. (2004). Toois for the body (schema). Trends in Cognitive Sciences, 8, 79-86.
Marik, S. A., Yamahachi, H., McManus, J. N. , Szabo, G., & Gilbert, C. D. (2010). Axonal dynamics of excitatory and inhibitory neurons in somatosensory cortex. PLoS Biol, 8, e1000395.
Marik, S. A., Yamahachi, H., Meyer zum Alten, B. S. , & Gilbert, C. D. (2014). Largescale axonal reorganization of inhibitory neurons following retinal lesions. Journal ofNeuroscience, 34, 1625-1632.
Markov, N. T., Vezoli, J. , Chameau, P., Falchier, A., Quilodran, R., Huissoud, C. et al. (2014). Anatomy of hierarchy: Feedforward and feedback pathways in macaque visual cortex. Journal of Comparative Neurology, 522, 225-259.
285
Masse, I. O., Ross, S., Bronchti, G., & Boire, D. (2016). Asymmetric direct reciprocal connections between primary visual and somatosensory cortices of the mouse. Cerebral Cortex.
Merabet, L. B., & Pascual-Leone, A. (2010). Neural reorganization following sensory loss: The opportunity of change. Nature Reviews Neuroscience, Il, 44-52.
Meredith, M. A., & Lomber, S. G. (2016). Species-dependent role of crossmodal connectivity among the primary sensory cortices. Hearing Research, 343, 83-91.
Mesulam, M. M. (1998). From sensation to cognition. Brain, 121, 1013-1052.
Miletic, V., & Coffield, J. A. (1989). Responses ofneurons in the rat nucleus submedius to noxious and innocuous mechanical cutaneous stimulation. Somatosensory and Motor Research, 6, 567-587.
Moizumi, S., Yamamoto, S., & Kitazawa, S. (2007). Referral of tactile stimuli to action points in virtual reality with reaction force. Neuroscience Research, 59, 60-67.
MolhoIm, S., Ritter, W., Murray, M. M., Javitt, D. c., Schroeder, C. E., & Foxe, J. J. (2002). Multisensory auditory-visual interactions during early sensory processing in humans: A high-density electrical mapping study. Cognitive Brain Research, 14, 115-128.
Moller, A. R. (2003). Sensory systems: Anatomy and physiology (1 re éd.). San Diego, USA: Academic Press.
Morest, D. K. (1975). Synaptic re1ationships of Golgi type II cells in the medial geniculate body of the cat. Journal of Comparative Neurology, 162, 157-193.
Naber, P. A., Witter, M. P., & Lopes da Silva, F. H. (2000). Differential distribution of barrel or visual cortex. Evoked responses along the rostro-caudal axis of the periand postrhinal cortices. Brain Research, 877, 298-305.
Nieuwenhuys, R., Voogd, J., & Van Juijzen, C. (2008). The human central nervous system: A symposis and atlas. (4e éd.) Berlin ' Heidelberg, Allemagne: SpringerVerlag.
Noesselt, T., Tyll, S., Boehler, C. N., Budinger, E., Heinze, H. J., & Driver, J. (2010). Sound-induced enhancement of low-intensity vision: Multisensory influences on human sensory-specific cortices and thalamic bodies relate to perceptual enhancement of visual detection sensitivity. Journal of Neuroscience, 30, 13609-13623.

286
Octavia, 1. R, Raymaekers, c., & Coninx, K. (2011). Adaptation m virtual environments: Conceptual framework and user models. Multimedia Tools and Applications, 54, 121-142.
Oztas, E. (2003). Neuronal tracing. Neuroanatomy, 2, 2-5.
Paperna, T., & Malach, R (1991). Patterns of sens ory intermodality relationships in the cerebral cortex of the rat. Journal of Comparative Neurology, 308, 432-456.
Pascual-Leone, A., & Hamilton, R (2001). The metamodal organization of the brain. Progress in Brain Research, 134, 427-445.
Pavani, F., Spence, C., & Driver, J. (2000). Visual capture of touch: out-of-the-body experiences with rubber gloves. Psychological Science, 11, 353-359.
Peeters, R, Simone, L., Nelissen, K., Fabbri-Destro, M., Vanduffel, W., Rizzolatti, G., ... Orban, G. A. (2009). The representation of tool use in humans and monkeys: Common and uniquely human features. Journal ofNeuroscience, 29, 11523-11539.
Peters, A., & Palay, S. L. (1966). The morphology of laminae A and Al of the dorsal nucleus of the lateral geniculate body of the cat. Journal of Anatomy, 100, 451-486.
Petrof, I., & Sherman, S. M. (2013). Functional significance of synaptic terminal size in glutamatergic sensory pathways in thalamus and cortex. Journal ofPhysiology, 591, 3125-3131.
Pierce, J. P. , & Lewin, G. R (1994). An ultrastructural size principle. Neuroscience, 58, 441-446.
Price, D. J., Kennedy, H., Dehay, C., Zhou, L., Mercier, M., Jossin, Y., ... Molnârz, Z. (2006). The development of cortical connections. European Journal of Neuroscience, 23, 910-920.
Prusky, G. T., West, P. W., & Douglas, R M. (2000). Behavioral assessment of visual acuity in mice and rats. Vision Research, 40, 2201-2209.
Ralston, H. J. , III (1969). The synaptic organization of lemniscal projections to the ventrobasal thalamus of the cat. Brain Research, 14, 99-115.
Rassweiler, J., Safi, K. C., Subotic, S., Teber, D., & Frede, T. (2005). Robotics and telesurgery--an update on their position in laparoscopic radical prostatectomy. Minimally Invasive Therapy & Allied Technologies, 14, 109-122.

287
Rauschecker, J. P. (1995). Compensatory plasticity and sensory substitution in the cerebral cortex. Trends in Neurosciences, 18, 36-43.
Reichova, 1. , & Sherman, S. M. (2004). Somatosensory corticothalamic projections: Distinguishing drivers from modulators. Journal of Neurophysiology, 92, 2185-2197.
Reid, A. T., Krumnack, A., Wanke, E., & Kotter, R (2009). Optimization of cortical hierarchies with continuous scales and ranges. Neuroimage. , 47, 611-617.
Reiner, A., Veenman, C. L., Medina, L., Jiao, Y., Del, M. N., & Honig, M. G. (2000). Pathway tracing using biotinylated dextran amines. Journal of Neuroscience Methods, 103, 23-37.
Reyes, A., Lujan, R, Rozov, A., Burnashev, N., Somogyi, P., & Sakmann, B. (1998). Target-cell-specific facilitation and depression in neocortical circuits. Nature Neuroscience., 1, 279-285.
Rizzolatti, G., Fadiga, L., Fogassi, L., & Gallese, V. (1997). The space around us. Science, 277, 190-191.
Rizzolatti, G., Scandolara, C., Matelli, M., & Gentilucci, M. (1981a). Afferent properties of periarcuate neurons in macaque monkeys. 1. Somatosensory responses. Behavioural Brain Research, 2, 125-146.
Rizzolatti, G., Scandolara, C., Matelli, M., & Gentilucci, M. (1981 b). Afferent properties of periarcuate neurons in macaque monkeys. II. Visual responses. Behavioural Brain Research, 2, 147-163.
Rochat, P. (1998). Self-perception and action in infancy. Experimental Brain Research, 123, 102-109.
Rockland, K. S., & Pandya, D. N. (1979). Laminar origins and terminations of cortical connections of the occipital lobe in the rhesus monkey. Brain Research, 179, 3-20.
Roder, B., Teder-Salejarvi, W., Sterr, A., RosIer, F., Hillyard, S. A., & Neville, H. J. (1999). Improved auditory spatial tuning in blind humans. Nature, 400, 162-166.
Rodgers, K. M., Benison, A. M., Klein, A., & Barth, D. S. (2008). Auditory, somatosensory, and multisensory insular cortex in the rat. Cerebral Cortex, 18, 2941-2951.
Rosen, J., Hannaford, B. , & Satava, R (2011). Surgical robotics: Systems applications and visions. London: Springer.

288
Rosenbluth, R., Grossman, E. S., & Kaitz, M. (2000). Perfonnance of early-blind and sighted children on olfactory tasks. Perception, 29, 101-110.
Rouiller, E. M., & Welker, E. (1991). Morphology of corticothalamic terminaIs arising from the auditory cortex of the rat: A Phaseolus vulgaris-Ieucoagglutinin (pHA-L) tracing study. Hearing Research. , 56, 179-190.
Rouiller, E. M., & Welker, E. (2000). A comparative analysis of the morphology of corticothalamic projections in mammals. Brain Research Bulletin, 53, 727-741.
Sawchenko, P. E., & Gerfen, G. R. (1985). Plant lectins and bacterial toxins as tools for tracing neuronal connections. Trends in Neurosciences, 8, 378-384.
Schaefer, M., FIor, H., Heinze, H. 1., & Rotte, M. (2007). Morphing the body: Illusory feeling of an elongated arm affects somatosensory homunculus. Neuroimage., 36, 700-705.
Schaefer, M., Heinze, H. J., & Rotte, M. (2012). Close to you: Embodied simulation for peripersonal space in primary somatosensory cortex. PLoS One, 7, e42308.
Scheich, H., Brechmann, A., Brosch, M., Budinger, E., & Oh!, F. W. (2007). The cognitive auditory cortex: Task-specificity of stimulus representations. Hearing Research. , 229, 213-224.
Schikorski, T., & Stevens, C. F. (1997). Quantitative ultrastructural analysis of hippocampal excitatory synapses. Journal ofNeuroscience, 17, 5858-5867.
Schikorski, T., & Stevens, C. F. (1999). Quantitative fme-structural analysis of olfactory cortical synapses. Proceedings of the National Academy of Sciences of the United States of America, 96, 4107-4112.
Schroeder, C. E., Smiley, J., Fu, K. G., McGinnis, T., O'Connell, M. N., & Hackett, T. A. (2003). Anatomical mechanisms and functional implications of multisensory convergence in early cortical processing. Int J Psychophysiol, 50, 5-17.
Sengul, A., Rognini, G., van, E. M., Aspell, J. E., Bleuler, H., & Blanke, O. (2013). Force feedback facilitates multisensory integration during robotic tool use. Experimental Brain Research, 227, 497-507.
Sengul, A., van, E. M., Rognini, G., Aspell, J. E., Bleuler, H., & Blanke, O. (2012). Extending the body to virtual tools using a robotic surgical interface: Evidence from the crossmodal congruency task. PLoS.One., 7, e49473.

289
Shams, L., & Beierholm, U. R. (2010). Causal inference in perception. Trends in Cognitive Sciences, 14, 425-432.
Sherman, S. M., & Guillery, R. W. (1996). Functional organization of thalamocortical relays. Journal ofNeurophysiology, 76, 1367-1395.
Sherman, S. M., & Guillery, R. W. (1998). On the actions that one nerve cell can have on another: Distinguishing "drivers" from "modulators". Proceedings of the National Academy of Sciences of the United States of America, 95, 7121-7126.
Sherman, S. M., & Guillery, R. W. (2006). Exploring the thalamus and its role in cortical function. Cambridge MA: MIT Press.
Sherman, S. M., & Guillery, R. W. (2013a). Functional connections of cortical areas. A new view from the thalamus. Cambridge, Massachussetts; London, England: MIT Press.
Sherman, S. M., & Guillery, R. W. (20 13b). Functional connections of cortical areas. Cambridge, Massachussetts; London, England: MIT Press.
Shimada, S., Fukuda, K., & Hiraki, K. (2009). Rubber hand illusion under delayed visual feedback. PLoS.One. , 4, e6185.
Sieben, K., Bieler, M., Roder, B., & Hanganu-Opatz, 1. L. (2015). Neonatal restriction of tactile inputs leads to long-lasting irnpairments of cross-modal processing. PLoS Biol, 13, el 002304.
Sieben, K., Roder, B., & Hanganu-Opatz, 1. L. (2013). Oscillatory entrainment of primary somatosensory cortex encodes visual control of tactile processing. Journal ofNeuroscience, 33, 5736-5749.
Slater, M., Spanlang, B., Sanchez-Vives, M. V., & Blanke, O. (2010). First person experience of body transfer in virtual reality. PL oS One, 5, e10564.
So, K. F., Campbell, G., & Lieberman, A. R. (1985). Synaptic organization of the dorsal lateral geniculate nucleus in the adult hamster. An electron microscope study using degeneration and horseradish peroxidase tracing techniques. Anatomy and Embryology (Berl), 171, 223-234.
Stein, B. E., Huneycutt, W. S., & Meredith, M. A. (1988). Neurons and behavior: The same rules ofmultisensory integration apply. Brain Research, 448, 355-358.

290
Stein, B. E., Meredith, M. A., Huneycutt, W. S., & McDade, L. (1989). Behavioral indices of multisensory integration: Orientation to visual cues is affected by auditory stimuli. Journal of Cognitive Neuroscience, 1, 12-24.
Stein, B. E., Stanford, T. R, & Rowland, B. A. (2014). Development of multisensory integration from the perspective of the individual neuron. Nature Review Neurosciences, 15, 520-535.
Stevens, A. A., & Weaver, K. (2005). Auditory perceptual consolidation in early-onset blindness. Neuropsychologia, 43, 1901-1910.
Stoeckel, K., Schwab, M., & Thoenen, H. (1977). Role of gangliosides in the uptake and retro grade axonal transport of cholera and tetanus toxin as compared to nerve growth factor and wheat germ agglutinin. Brain Research, 132, 273-285.
Stone, R (2000). Haptic feedback: A potted history, from telepresence to virtual reality. Springer, 1-7.
Suematsu, Y., & deI Nido, P. J. (2004). Robotic pediatric cardiac surgery: Present and future perspectives. The American Journal ofSurgery, 188, 98S-103S.
Szentagothai,1. (1963). The structure of the synapse in the lateral geniculate body. Acta Anatomica (Basel), 55, 166-185.
Tavakoli, M., Aziminejad, A., Patel, R V., & Moallem, M. (2007). High-fidelity bilateral teleoperation systems and the effect of multimodal haptics. IEEE Transactions on Systems, Man, and Cybernetics - Part B: Cybernetics, 37, 1512-1528.
Teder-Salejarvi, W. A., McDonald, J. J., Di, RF., & Hillyard, S. A. (2002). An analysis of audio-visual crossmodal integration by me ans of event-related potential (ERP) recordings. Cognitive Brain Research, 14, 106-114.
Tomasi, S., Carniniti, R, & Innocenti, G. M. (2012). Areal differences in diameter and length of corticofugal projections. Cerebral Cortex, 22, 1463-1472.
Tononi, G., & Koch, C. (2008). The neural correlates of consciousness: An update. Annals of the New York Academy of Sciences, 1124, 239-261.
Tsakiris, M., & Haggard, P. (2005). The rubber hand illusion revisited: Visuotactile integration and self-attribution. Journal of Experimental Psychology: Human Perception and Performance, 31, 80-91.
291
Van Boven, R. W., Hamilton, R. H., Kauffman, T., Keenan, J. P., & Pascual-Leone, A. (2000). Tactile spatial resolution in blind braille readers. Neurology, 54, 2230-2236.
van den Bos, E., & Jeannerod, M. (2002). Sense of body and sense of action both contribute to self-recognition. Cognition, 85, 177-187.
Van Hom, S. C., Erisir, A., & Sherman, S. M. (2000). Relative distribution of synapses in the A-Iaminae of the lateral geniculate nucleus of the cat. Journal of Comparative Neurology, 416, 509-520.
Van Hom, S. c., & Sherman, S. M. (2004). Differences in projection patterns between large and small corticothalamic terminaIs. Journal of Comparative Neurology, 475, 406-415.
Veenman, C. L., Reiner, A., & Honig, M. G. (1992). Biotinylated dextran amine as an anterograde tracer for single- and double-Iabeling studies. Journal of Neuroscience Methods, 41, 239-254.
Vercelli, A., Repici, M., Garbossa, D., & Grimaldi, A. (2000). Recent techniques for tracing pathways in the central nervous system of developing and adult mammals. Brain Research Bulletin, 51, 11-28.
Vezoli, J., Falchier, A., Jouve, B., Knoblauch, K., Young, M., & Kennedy, H. (2004). Quantitative analysis of connectivity in the visual cortex: extracting function from structure. Neuroscientist, 10, 476-482.
Viaene, A. N., Petrof, 1., & Sherman, S. M. (2011a). Synaptic properties of thalamic input to layers 2/3 and 4 of primary somatosensory and auditory cortices. Journal of Neurophysiology, 105, 279-292.
Viaene, A. N., Petrof, 1., & Sherman, S. M. (2011b). Synaptic properties of thalamic input to the subgranular layers of primary somatosensory and auditory cortices in the mouse. Journal ofNeuroscience, 31, 12738-12747.
Viaene, A. N., Petrof, 1., & Sherman, S. M. (2011c). Properties of the thalamic projection from the posterior medial nucleus to primary and secondary somatosensory cortices in the mouse. Proceedings of the National Academy of Sciences of the United States of America, 108, 18156-18161.
Vidnyanszky, Z., Borostyankoi, Z., Gorcs, T. J. , & Hamori, J. (1996). Light and electron microscopic analysis of synaptic input from cortical area 17 to the lateral posterior nucleus in cats. Experimental Brain Research, 109, 63-70.

292
Voss, P., Gougoux, F., Zatorre, R. J. , Lassonde, M., & Lepore, F. (2008). DifferentiaI occipital responses in early- and late-blind individuals during a sound-source discrimination task. Neuroimage, 40, 746-758.
Voss, P., Lassonde, M., Gougoux, F., Fortin, M., Guillemot, J. P. , & Lepore, F. (2004). Early- and late-onset blind individuals show supra-normal auditory abilities in farspace. Current Biology, 14, 1734-1738.
Wallace, M. T., Ramachandran, R., & Stein, B. E. (2004). A revised view of sensory cortical parcellation. Proceedings of the National Academy of Sciences of the United States of America, 101, 2167-2172.
Wan, C. Y., Wood, A. G., Reutens, D. c., & Wilson, S. 1. (2010). Congenital blindness leads to enhanced vibrotactile perception. Neuropsychologia, 48, 631-635.
Wang, Q. , & Burkhalter, A. (2007). Area map of mouse vi suai cortex. Journal of Comparative Neurology, 502, 339-357.
Wang, S., Eisenback, M. A., & Bickford, M. E. (2002). Relative distribution of synapses in the pulvinar nucleus of the cat: Implications regarding the "driver/modulator" theory ofthalamic function. Journal of Comparative Neurology, 454, 482-494.
Welch, R. B. , & Warren, D. H. (1986). Intersensory interactions. Dans K. R. Boff, L. Kaufman, & J. P. Thomas (Éds), Handbook ofperception and human performance (pp. 25-1-25-36). New York, NY: J. Wiley.
Whishaw, 1. Q., & Kolb, B. (2004). The Behavior of the Laboratory Rat: A Handbook with Tests (1 re éd.). New York, NY: Oxford University Press.
Witten, 1. B. , & Knudsen, E. 1. (2005). Why seeing is believing: Merging auditory and visual worlds. Neuron, 48, 489-496.
Wooisey, T. A. , & Van der Loos, H. (1970). The structural organization of layer IV in the somatosensory region (SI) of mouse cerebral cortex. The description of a cortical field composed of discrete cytoarchitectonic units. Brain Research, 1 7, 205-242.
Wu, H. P., loffe, J. C., Iverson, M. M., Boon, J. M., & Dyck, R. H. (2013). Novel, whisker-dependent texture discrimination task for mice. Behavioural Brain Research, 237, 238-242.
Yoo, S. S. , Freeman, D. K., McCarthy, 1. 1., III, & Jolesz, F. A. (2003). Neural substrates of tactile imagery: A functional MRI study. Neuroreport, 14, 581-585.

293
Yoo, S. S., Lee, C. U., & Choi, B. G. (2001). Human brain mapping of auditory imagery: Event-related functional MRI study. Neuroreport, 12, 3045-3049.
Yu, C., Liu, Y., Li, J. , Zhou, Y., Wang, K., Tian, L., .. . Li, K. (2008). Altered functional connectivity of primary visual cortex in early blindness. Human Brain Mapping, 29, 533-543.
Zakiewicz, 1. M. , Bjaalie, J. G., & Leergaard, T. B. (2014). Brain-wide map of efferent projections from rat barrel cortex. Frontiers in Neuroinformatics, 8, 5.
Zembrzycki, A., Chou, S. J., Ashery-Padan, R., Stoykova, A. , & Q'Leary, D. D. (2013). Sensory cortex limits cortical maps and drives top-down plasticity in thalamocortical circuits. Nature N euroscience, 16, 1060-1067.
Zingg, B., Hintiryan, H., Gou, L., Song, M. Y., Bay, M., Bienkowski, M. S. , . .. Dong, H. W. (2014). Neural networks of the mouse neocortex. Cell, 156, 1096-1111.