Primer Sequence 5 to 3 Description PCRa primer-1 ... · TCC a PCR = PCR product length in basepair....
16
TABLE S1 List of primers used in this study Primer Sequence 5′ to 3′ Description PCR a primer-1 GCGTCGATGCAGATTCTTA CTTA flanking region upstream of sol4 FP b 838 primer-2 TTGACCTCCACTAGCTCCA GCCAAGCCCATCGTGTTGT ACTCATGTGGTT flanking region upstream of sol4 RP c with overhang sequence of 5’end of hph primer-3 GCAAAGGAATAGAGTAGA TGCCGACCGTTAGGCGAT GGAGTAGAGAGAAG flanking region downstream of sol4 RP with overhang sequence of 3’end of hph 1,094 primer-4 CATCCAAGCGAGCGAGAA TGGAG flanking region downstream of sol4 FP HYG-F GGCTTGGCTGGAGCTAGT GGAG FP to amplify hph from pDWJ5 1,372 HYG-R CGGTCGGCATCTACTCTAT TCCTT RP to amplify hph from pDWJ5 primer-7 AGAGTAAGCGGAGCGGAT CAAAG flanking region upstream of sol4 FP nested primer primer-8 CCAGAAGTGGACCTCTGA TGCGA flanking region downstream of sol4 RP nested primer YG-F CGATGTAGGAGGGCGTGG ATATGTCC FP coding region of hph for overlapping extension, pair with primer-8 HY-R GTATTGACCGATTCCTTGC GGTCCGAA RP coding region of hph for overlapping extension, pair with primer-7 primer-11 GTGTGTCCACCTGCCTATG TATC FP upstream of sol4, verification primer 1,950 (in wild type) 1,581 (in sol4) primer-12 CACGCTTCTTCCCGTGCAT CTG RP downstream of sol4, verification primer Sol4BamH5 GGATCCATGATGCCGTCCA CCCTCATC FP at ATG with BamHI cut site for 4OE construction 2,029 Sol4Hind3 AAGCTTTCGCAAGGTCTG GGAAATTC RP at +276 bp from stop codon with HindIII cut site for 4OE construction a PCR = PCR product length in basepair; b FP = forward primer; c RP = reverse primer
Transcript of Primer Sequence 5 to 3 Description PCRa primer-1 ... · TCC a PCR = PCR product length in basepair....

TABLE S1 List of primers used in this study
Primer Sequence 5′ to 3′ Description PCRa
primer-1 GCGTCGATGCAGATTCTTA
CTTA
flanking region upstream of
sol4 FPb
838
primer-2 TTGACCTCCACTAGCTCCA
GCCAAGCCCATCGTGTTGT
ACTCATGTGGTT
flanking region upstream of
sol4 RPc with overhang
sequence of 5’end of hph
primer-3 GCAAAGGAATAGAGTAGA
TGCCGACCGTTAGGCGAT
GGAGTAGAGAGAAG
flanking region downstream
of sol4 RP with overhang
sequence of 3’end of hph
1,094
primer-4 CATCCAAGCGAGCGAGAA
TGGAG
flanking region downstream
of sol4 FP
HYG-F GGCTTGGCTGGAGCTAGT
GGAG
FP to amplify hph from
pDWJ5
1,372
HYG-R CGGTCGGCATCTACTCTAT
TCCTT
RP to amplify hph from
pDWJ5
primer-7 AGAGTAAGCGGAGCGGAT
CAAAG
flanking region upstream of
sol4 FP nested primer
primer-8 CCAGAAGTGGACCTCTGA
TGCGA
flanking region downstream
of sol4 RP nested primer
YG-F CGATGTAGGAGGGCGTGG
ATATGTCC
FP coding region of hph for
overlapping extension, pair
with primer-8
HY-R GTATTGACCGATTCCTTGC
GGTCCGAA
RP coding region of hph for
overlapping extension, pair
with primer-7
primer-11 GTGTGTCCACCTGCCTATG
TATC
FP upstream of sol4,
verification primer
1,950
(in wild type)
1,581
(in sol4)
primer-12 CACGCTTCTTCCCGTGCAT
CTG
RP downstream of sol4,
verification primer
Sol4BamH5 GGATCCATGATGCCGTCCA
CCCTCATC
FP at ATG with BamHI cut
site for 4OE construction
2,029
Sol4Hind3 AAGCTTTCGCAAGGTCTG
GGAAATTC
RP at +276 bp from stop
codon with HindIII cut site
for 4OE construction
a PCR = PCR product length in basepair;
b FP = forward primer;
c RP = reverse primer
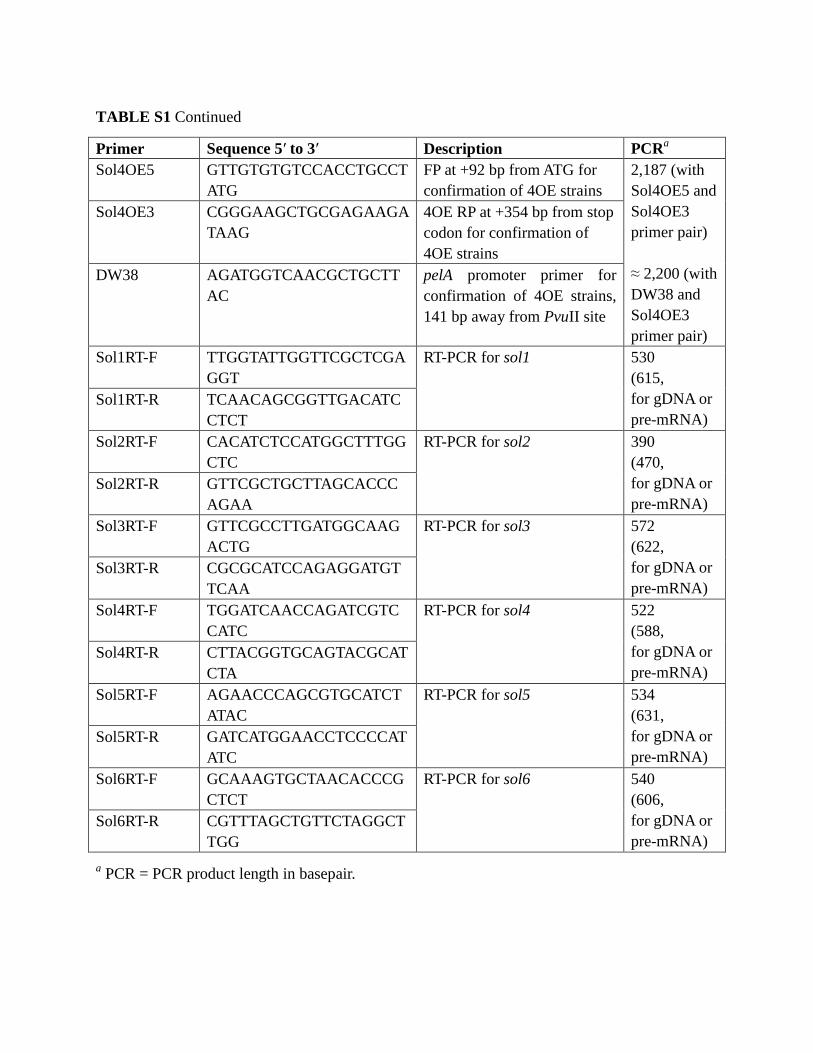
TABLE S1 Continued
Primer Sequence 5′ to 3′ Description PCRa
Sol4OE5 GTTGTGTGTCCACCTGCCT
ATG
FP at +92 bp from ATG for
confirmation of 4OE strains
2,187 (with
Sol4OE5 and
Sol4OE3
primer pair)
≈ 2,200 (with
DW38 and
Sol4OE3
primer pair)
Sol4OE3 CGGGAAGCTGCGAGAAGA
TAAG
4OE RP at +354 bp from stop
codon for confirmation of
4OE strains
DW38 AGATGGTCAACGCTGCTT
AC
pelA promoter primer for
confirmation of 4OE strains,
141 bp away from PvuII site
Sol1RT-F TTGGTATTGGTTCGCTCGA
GGT
RT-PCR for sol1 530
(615,
for gDNA or
pre-mRNA)
Sol1RT-R TCAACAGCGGTTGACATC
CTCT
Sol2RT-F CACATCTCCATGGCTTTGG
CTC
RT-PCR for sol2
390
(470,
for gDNA or
pre-mRNA)
Sol2RT-R GTTCGCTGCTTAGCACCC
AGAA
Sol3RT-F GTTCGCCTTGATGGCAAG
ACTG
RT-PCR for sol3
572
(622,
for gDNA or
pre-mRNA)
Sol3RT-R CGCGCATCCAGAGGATGT
TCAA
Sol4RT-F TGGATCAACCAGATCGTC
CATC
RT-PCR for sol4
522
(588,
for gDNA or
pre-mRNA)
Sol4RT-R CTTACGGTGCAGTACGCAT
CTA
Sol5RT-F AGAACCCAGCGTGCATCT
ATAC
RT-PCR for sol5
534
(631,
for gDNA or
pre-mRNA)
Sol5RT-R GATCATGGAACCTCCCCAT
ATC
Sol6RT-F GCAAAGTGCTAACACCCG
CTCT
RT-PCR for sol6
540
(606,
for gDNA or
pre-mRNA)
Sol6RT-R CGTTTAGCTGTTCTAGGCT
TGG
a PCR = PCR product length in basepair.
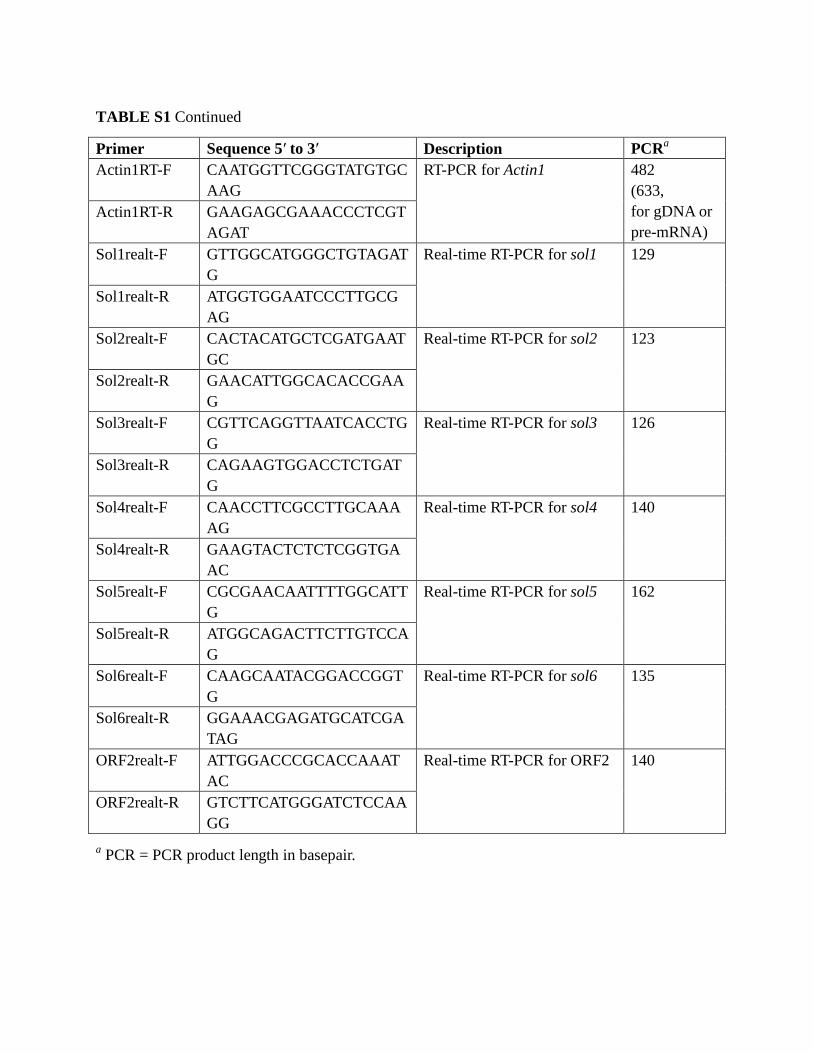
TABLE S1 Continued
Primer Sequence 5′ to 3′ Description PCRa
Actin1RT-F CAATGGTTCGGGTATGTGC
AAG
RT-PCR for Actin1
482
(633,
for gDNA or
pre-mRNA)
Actin1RT-R GAAGAGCGAAACCCTCGT
AGAT
Sol1realt-F GTTGGCATGGGCTGTAGAT
G
Real-time RT-PCR for sol1
129
Sol1realt-R ATGGTGGAATCCCTTGCG
AG
Sol2realt-F CACTACATGCTCGATGAAT
GC
Real-time RT-PCR for sol2
123
Sol2realt-R GAACATTGGCACACCGAA
G
Sol3realt-F CGTTCAGGTTAATCACCTG
G
Real-time RT-PCR for sol3
126
Sol3realt-R CAGAAGTGGACCTCTGAT
G
Sol4realt-F CAACCTTCGCCTTGCAAA
AG
Real-time RT-PCR for sol4 140
Sol4realt-R GAAGTACTCTCTCGGTGA
AC
Sol5realt-F CGCGAACAATTTTGGCATT
G
Real-time RT-PCR for sol5 162
Sol5realt-R ATGGCAGACTTCTTGTCCA
G
Sol6realt-F CAAGCAATACGGACCGGT
G
Real-time RT-PCR for sol6
135
Sol6realt-R GGAAACGAGATGCATCGA
TAG
ORF2realt-F ATTGGACCCGCACCAAAT
AC
Real-time RT-PCR for ORF2 140
ORF2realt-R GTCTTCATGGGATCTCCAA
GG
a PCR = PCR product length in basepair.
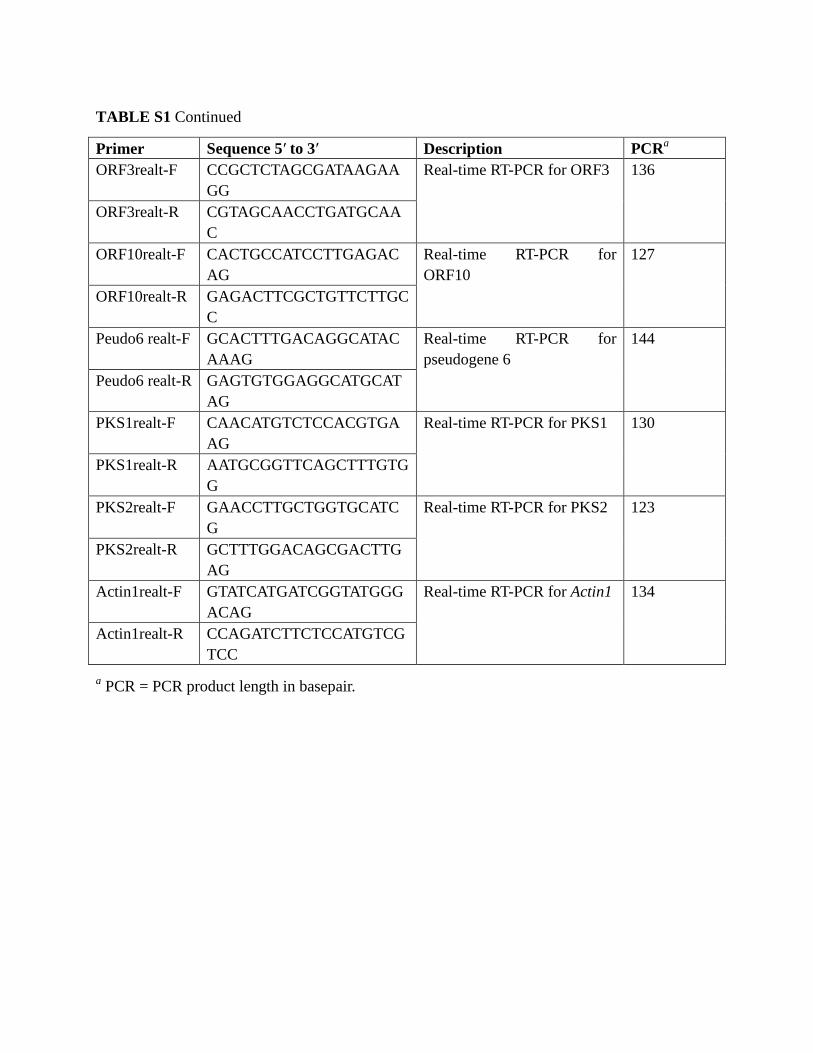
TABLE S1 Continued
Primer Sequence 5′ to 3′ Description PCRa
ORF3realt-F CCGCTCTAGCGATAAGAA
GG
Real-time RT-PCR for ORF3 136
ORF3realt-R CGTAGCAACCTGATGCAA
C
ORF10realt-F CACTGCCATCCTTGAGAC
AG
Real-time RT-PCR for
ORF10
127
ORF10realt-R GAGACTTCGCTGTTCTTGC
C
Peudo6 realt-F GCACTTTGACAGGCATAC
AAAG
Real-time RT-PCR for
pseudogene 6
144
Peudo6 realt-R GAGTGTGGAGGCATGCAT
AG
PKS1realt-F CAACATGTCTCCACGTGA
AG
Real-time RT-PCR for PKS1 130
PKS1realt-R AATGCGGTTCAGCTTTGTG
G
PKS2realt-F GAACCTTGCTGGTGCATC
G
Real-time RT-PCR for PKS2 123
PKS2realt-R GCTTTGGACAGCGACTTG
AG
Actin1realt-F GTATCATGATCGGTATGGG
ACAG
Real-time RT-PCR for Actin1 134
Actin1realt-R CCAGATCTTCTCCATGTCG
TCC
a PCR = PCR product length in basepair.
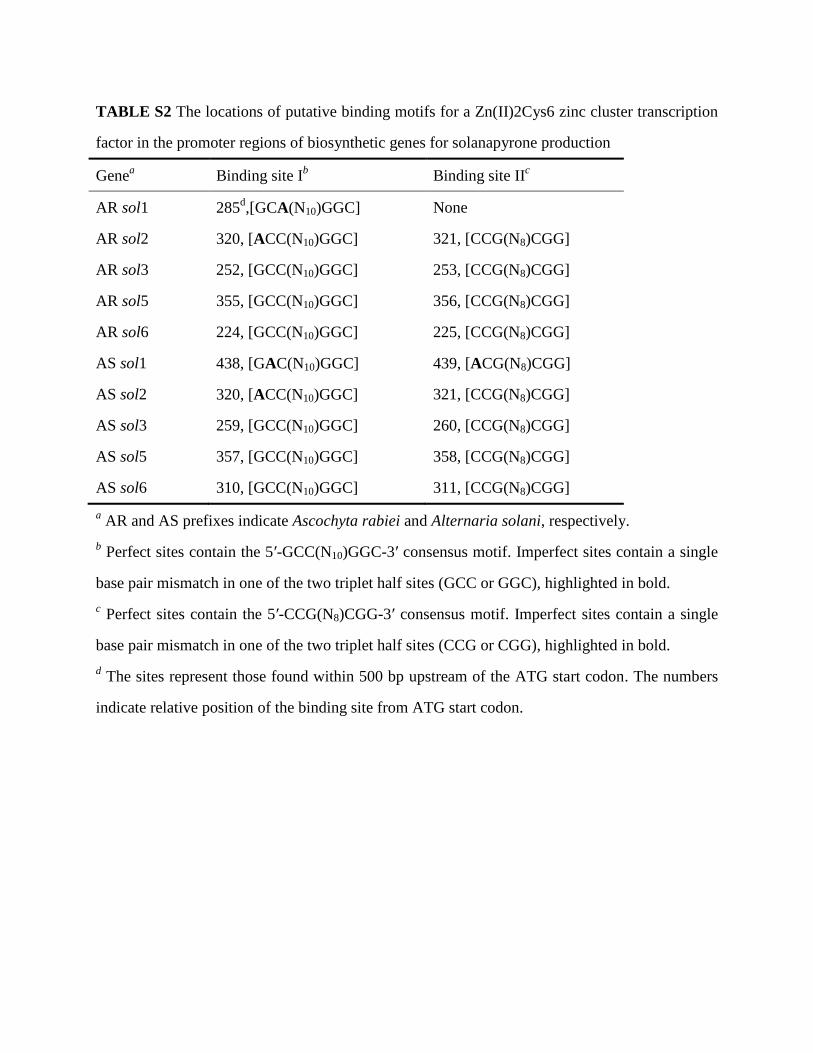
TABLE S2 The locations of putative binding motifs for a Zn(II)2Cys6 zinc cluster transcription
factor in the promoter regions of biosynthetic genes for solanapyrone production
Genea Binding site I
b Binding site II
c
AR sol1 285d,[GCA(N10)GGC] None
AR sol2 320, [ACC(N10)GGC] 321, [CCG(N8)CGG]
AR sol3 252, [GCC(N10)GGC] 253, [CCG(N8)CGG]
AR sol5 355, [GCC(N10)GGC] 356, [CCG(N8)CGG]
AR sol6 224, [GCC(N10)GGC] 225, [CCG(N8)CGG]
AS sol1 438, [GAC(N10)GGC] 439, [ACG(N8)CGG]
AS sol2 320, [ACC(N10)GGC] 321, [CCG(N8)CGG]
AS sol3 259, [GCC(N10)GGC] 260, [CCG(N8)CGG]
AS sol5 357, [GCC(N10)GGC] 358, [CCG(N8)CGG]
AS sol6 310, [GCC(N10)GGC] 311, [CCG(N8)CGG]
a AR and AS prefixes indicate Ascochyta rabiei and Alternaria solani, respectively.
b Perfect sites contain the 5′-GCC(N10)GGC-3′ consensus motif. Imperfect sites contain a single
base pair mismatch in one of the two triplet half sites (GCC or GGC), highlighted in bold.
c Perfect sites contain the 5′-CCG(N8)CGG-3′ consensus motif. Imperfect sites contain a single
base pair mismatch in one of the two triplet half sites (CCG or CGG), highlighted in bold.
d The sites represent those found within 500 bp upstream of the ATG start codon. The numbers
indicate relative position of the binding site from ATG start codon.

FIG S1 Gene replacement via split-marker strategy and PCR analysis of sol4-deletion. (A)
Schematic diagram of targeted gene replacement strategy. (B) PCR analysis of A. rabiei
wild-type isolates and their Δsol4 mutants. Replacement of the sol4 gene by the hph
cassette was verified in two independent mutants from each isolate using a primer pair,
primer-11 and primer-12 (wild-types, 1,950 bp; Δsol4 mutants, 1,581 bp). (C) PCR
verification for homologous integration of the replacement fragment to the correct
genomic site with a primer pair, primer-1 and HY-R (1,604 bp).
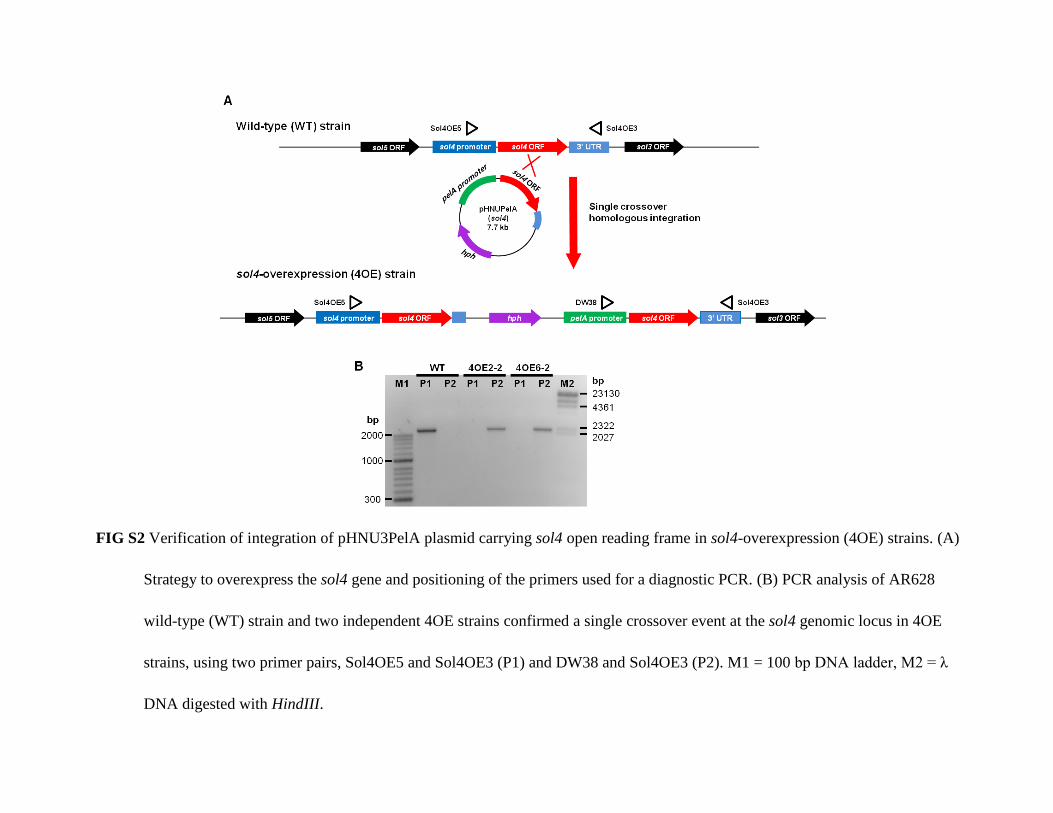
FIG S2 Verification of integration of pHNU3PelA plasmid carrying sol4 open reading frame in sol4-overexpression (4OE) strains. (A)
Strategy to overexpress the sol4 gene and positioning of the primers used for a diagnostic PCR. (B) PCR analysis of AR628
wild-type (WT) strain and two independent 4OE strains confirmed a single crossover event at the sol4 genomic locus in 4OE
strains, using two primer pairs, Sol4OE5 and Sol4OE3 (P1) and DW38 and Sol4OE3 (P2). M1 = 100 bp DNA ladder, M2 = λ
DNA digested with HindIII.
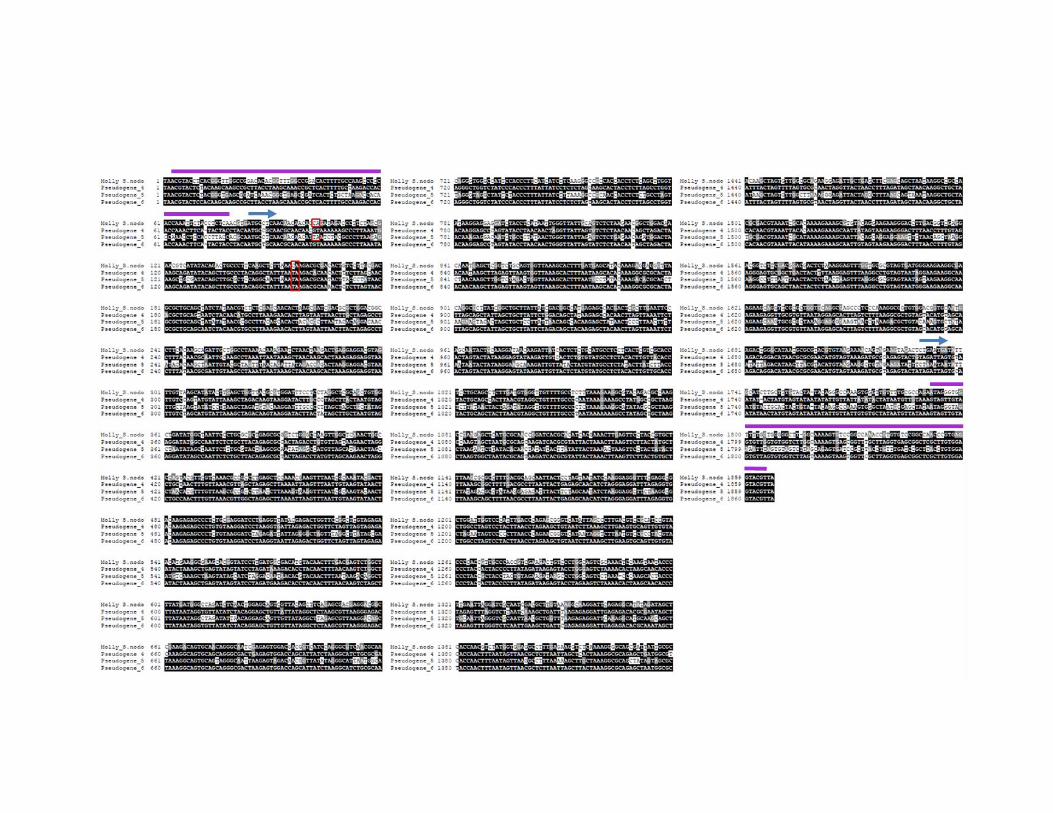
FIG S3 Multiple DNA sequence alignment of Molly transposon from Stagonospora nodorum
and degenerated transposons (pseudogene 4–6) located proximal to the solanapyrone
gene cluster in A. rabiei. Identical nucleotides are shaded in black. The regions marked
with purple line indicate terminal inverted repeat. The coding regions of putative
transposase are indicated by arrows. The first RIP mutation (CpA to TpA) which
introduced premature stop codon in the transposase domain of pseudogene 4, 5, or 6 are
indicated by red boxes in comparison to the functional Molly transposon. Note that the
four elements are of nearly identical length and include 5′ and 3′ TA insertion sites.

FIG S4 Pairwise sequence alignment of ORF10 and a P450 homologous gene found in
Coniosporium apollinis. (A) Pairwise comparison of deduced amino acid sequence of
ORF10 and the homologous P450 gene from Coniosporium apollinis (GenBank
accession: XP_007784573). Only a region conserved with ORF10 (240 out of 535
residues) was shown for the P450. Alignment shaded to indicate similarity with black
corresponding to blocks of identical residues, and with grey corresponding to
conservative substitutions. Pairwise DNA sequence comparison between upstream of
ORF10 and the corresponding region of the hypothetical protein (B), between the coding
region of ORF10 and the corresponding region of the hypothetical protein (C) and
between downstream of ORF10 and the corresponding region of the hypothetical protein
(D). Note that the coding region of ORF10 has no indels and is more conserved with the
hypothetical protein compared with the upstream or downstream regions.
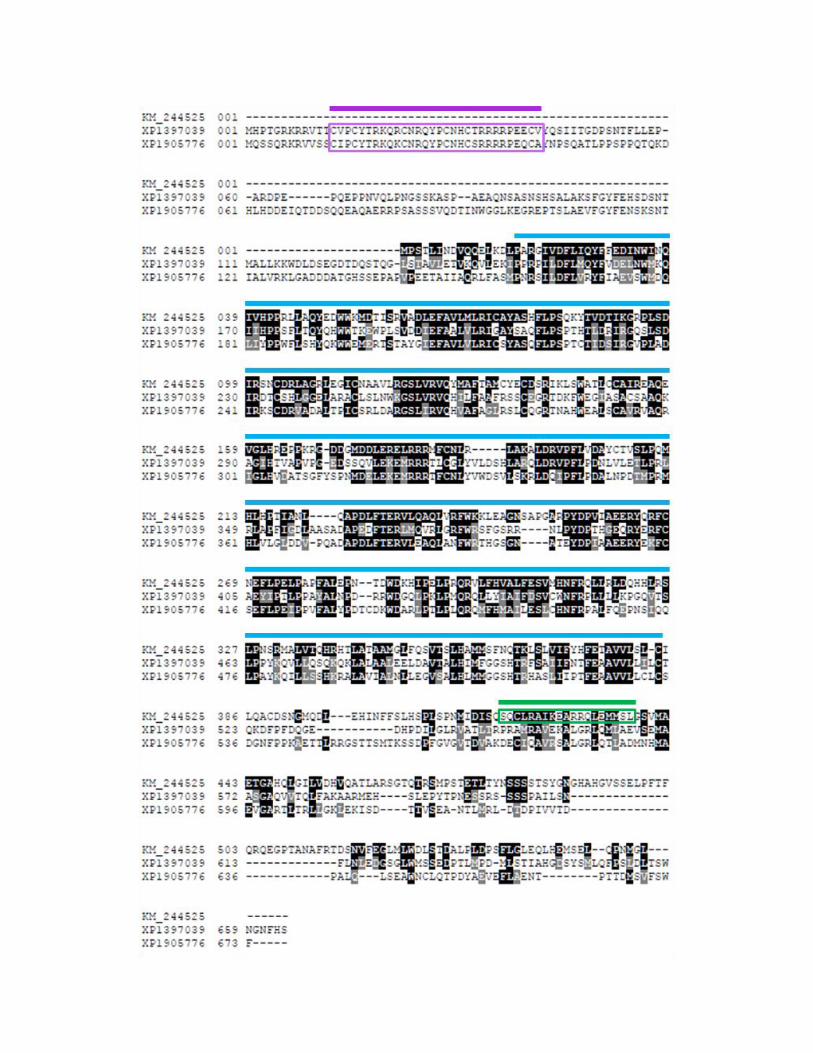

FIG S5 Multiple amino acid sequence alignment of A. rabiei Sol4 (KM244525) and two
hypothetical proteins from Aspergillus niger (XP_001397039) and Podospora anserina
(XP_001905776). Alignment was shaded to indicate similarity with black corresponding
to blocks of identical residues, and with grey corresponding to conservative substitutions.
Zn(II)2Cys6 (C6) zinc cluster DNA-binding domain is boxed in purple and middle
homology region (MHR) is marked with blue line. The coiled coil region in Sol4 amino
acid sequence detected by COILS program (1) is boxed in green (a region with prediction
values greater than 0.8 in scanning windows of 14). No coiled coil region was predicted
for the two hypothetical proteins. Note that Sol4 lacks the C6 zinc cluster DNA-binding
domain.

FIG S6 Gene content of the flanking region of sol1 gene in Alternaria solani. (A) GC content (%,
black line), RIP index I (TpA/ApT, blue line) and RIP index II (CpA+TpG/ApC+ GpT,
red line) were calculated in a 200-bp window, which was slid in 50-bp increments across
≈ 10 kb of the flanking sequence. Horizontal solid line are provided to show the 50% GC
mark, while dashed line shows a RIP index value of 1. (B) Schematic diagram of
arrangement and orientation of three open reading frames (red boxes) and one
pseudogene (blue box). Genes found were pectin lyase (similar to XM_001796354, 67%
identity, E-value = 4e-155), hexokinase (similar to XP_008029266, 94% identity, E-value
= 0), hypothetical protein (similar to XP_007692661, 88% identity, E-value = 1e-119),
and aminoglycoside 3′-phosphotransferase (similar to XP_007692660, 85% identity,
E-value = 0). Note that the partial coding region of pectin lyase gene showed strong RIP
response.
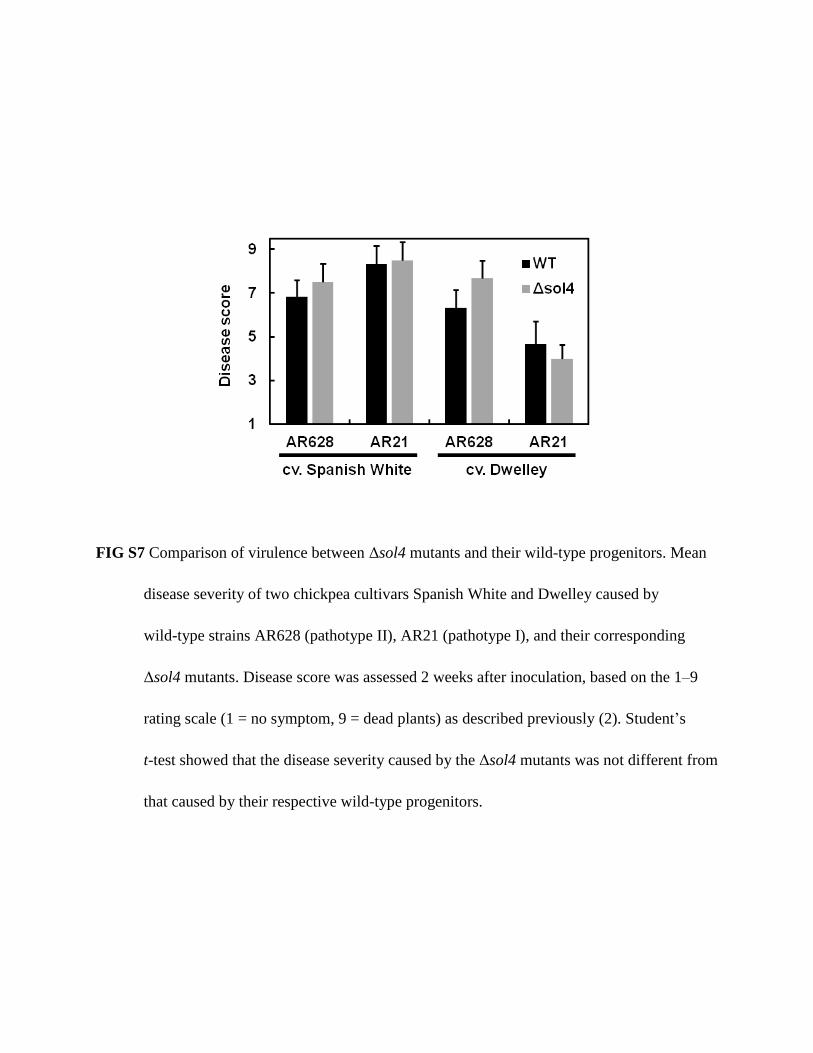
FIG S7 Comparison of virulence between Δsol4 mutants and their wild-type progenitors. Mean
disease severity of two chickpea cultivars Spanish White and Dwelley caused by
wild-type strains AR628 (pathotype II), AR21 (pathotype I), and their corresponding
Δsol4 mutants. Disease score was assessed 2 weeks after inoculation, based on the 1–9
rating scale (1 = no symptom, 9 = dead plants) as described previously (2). Student’s
t-test showed that the disease severity caused by the Δsol4 mutants was not different from
that caused by their respective wild-type progenitors.
REFERENCES
1. Lupas A, Van Dyke M, Stock J. 1991. Predicting coiled coils from protein sequences. Science
252:1162-1164.
2. Chen W, Coyne CJ, Peever TL, Muehlbauer FJ. 2004. Characterization of chickpea differentials for
pathogenicity assay of ascochyta blight and identification of chickpea accessions resistant to Didymella
rabiei. Plant Pathol. 53:759-769.