Design of a WSN for Smart Irrigation in Citrus Plots with ...
21
Network Protocols and Algorithms ISSN 1943-3581 2018, Vol. 10, No. 2 www.macrothink.org/npa 95 Design of a WSN for Smart Irrigation in Citrus Plots with Fault-Tolerance and Energy-Saving Algorithms Lorena Parra, Javier Rocher, Laura García, Jaime Lloret, Jesus Tomás, Oscar Romero, Miguel Rodilla, Silvia Falco, María Teresa Sebastiá, Jesus Mengual, Juan Andrés González, Bernat Roig Instituto de Investigación para la Gestión Integrada de Zonas Costeras, Universitat Politècnica de València. C/ Paranimf nº 1, Grao de Gandía – Gandía, Valencia (Spain) E-mail: [email protected], [email protected], [email protected], [email protected], [email protected], [email protected], [email protected], [email protected], [email protected], [email protected], [email protected], [email protected] Received: March 28, 2018 Accepted: June 13, 2018 Published: June 29, 2018 DOI: 10.5296/npa.v10i2.13205 URL: https://doi.org/10.5296/npa.v10i2.13205 Abstract Wireless sensor networks are widely used for monitoring different processes, including agriculture, in order to reach sustainability. One of the keys to sustainable crops is water saving. In particular, saving water is extremely important in arid and semiarid regions. In those regions, citrus trees are cultivated, and drip irrigation is used to save water. In this paper, we propose a smart irrigation system for citrus trees using a WSN. We describe the employed sensors and nodes for this proposal. Next, we present the proposed architecture and the operational algorithms for the nodes. Moreover, we designed different algorithms for fault tolerance and energy saving functionalities. The energy saving algorithm is based on the relevance of the gathered data, which is analyzed in order to consider whether the information should be forwarded or not. A TPC-based protocol is proposed to perform the communication among the nodes of our system. In addition, we present different simulations of the proposed system. Particularly, we show the consumed bandwidth and the remaining energy in the different nodes. Finally, we test different energy configurations to evaluate the network lifetime and the remaining energy when the first node depletes its energy. Keywords: Energy saving; fault tolerance; Wireless Sensor Networks (WSNs); environmental monitoring; irrigation; sensors; WiFi
Transcript of Design of a WSN for Smart Irrigation in Citrus Plots with ...
Network Protocols and Algorithms ISSN 1943-3581
2018, Vol. 10, No. 2
www.macrothink.org/npa 95
Design of a WSN for Smart Irrigation in Citrus Plots with Fault-Tolerance and Energy-Saving Algorithms
Lorena Parra, Javier Rocher, Laura García, Jaime Lloret, Jesus Tomás, Oscar Romero, Miguel Rodilla, Silvia Falco, María Teresa Sebastiá, Jesus Mengual, Juan Andrés González,
Bernat Roig
Instituto de Investigación para la Gestión Integrada de Zonas Costeras, Universitat Politècnica de València.
C/ Paranimf nº 1, Grao de Gandía – Gandía, Valencia (Spain)
E-mail: [email protected], [email protected], [email protected], [email protected], [email protected], [email protected], [email protected],
[email protected], [email protected], [email protected], [email protected], [email protected]
Received: March 28, 2018 Accepted: June 13, 2018 Published: June 29, 2018
DOI: 10.5296/npa.v10i2.13205 URL: https://doi.org/10.5296/npa.v10i2.13205
Abstract
Wireless sensor networks are widely used for monitoring different processes, including agriculture, in order to reach sustainability. One of the keys to sustainable crops is water saving. In particular, saving water is extremely important in arid and semiarid regions. In those regions, citrus trees are cultivated, and drip irrigation is used to save water. In this paper, we propose a smart irrigation system for citrus trees using a WSN. We describe the employed sensors and nodes for this proposal. Next, we present the proposed architecture and the operational algorithms for the nodes. Moreover, we designed different algorithms for fault tolerance and energy saving functionalities. The energy saving algorithm is based on the relevance of the gathered data, which is analyzed in order to consider whether the information should be forwarded or not. A TPC-based protocol is proposed to perform the communication among the nodes of our system. In addition, we present different simulations of the proposed system. Particularly, we show the consumed bandwidth and the remaining energy in the different nodes. Finally, we test different energy configurations to evaluate the network lifetime and the remaining energy when the first node depletes its energy.
Keywords: Energy saving; fault tolerance; Wireless Sensor Networks (WSNs); environmental monitoring; irrigation; sensors; WiFi

Network Protocols and Algorithms ISSN 1943-3581
2018, Vol. 10, No. 2
www.macrothink.org/npa 96
1. Introduction
Water is a very important resource because without water, life cannot exist. Water scarcity is a very important problem in the world. 4 billion people live under the condition of water scarcity at least one month per year [1]. Moreover, farming is the activity with the highest water consumption in the world with a 70% of water usage [2] [3]. In the future, the increase of the population and global warming could be the cause of wars over water. To reduce the problems with water, there are three options I) decrease the use of water II) Increase the available water by reusing wastewater. III) Desalination of seawater. The high costs of water desalination make it impossible to use it for agriculture if it is not with public incentives. Therefore, only the first two options are economically valid for agriculture.
Water scarcity is not the only problem for the irrigation of crops. Water quality is another aspect of great importance concerning crops. Generally, in Europe, the quality of the irrigation water is acceptable but in other regions, the quality of the water is not good for irrigation. The countries of North Africa and the Middle East are an example of this situation [4]. Therefore, we have encountered two problems: water scarcity and its quality. To solve water scarcity in arid and semi-arid regions, the reuse of wastewater is important. China has a long history of wastewater reuse [5]. In Spain and Greece, it is foreseeable that, in the future, the regeneration of water will become a routine practice [3]. However, as we have previously seen, the quality of these waters can cause problems. The irrigation with raw o diluted wastewater can cause problems in the environment and human health. Consequently, the governments have to take measures to manage the risks [6]. A study of reuse of wastewater concluded that with a good control of the pollutants and the use of this water for irrigating the appropriate species, the regenerated wastewater can be used without any problems [3]. Therefore, wastewater can be used for irrigation employing the correct methodologies.
To treat contaminants that are not usually eliminated in a wastewater treatment plant or found in water, it is necessary to use a tertiary treatment. A tertiary treatment is a biosorption. The biosorption is a physicochemical process based on an adsorption, surface complexation, adsorption, and precipitation. This is highly important in biotreatment processes and can remove or recover organic and inorganic substances from a solution. The biological material can be living beings or parts of living beings that have suffered some treatment [7]. The bioabsorption is a very popular technique for eliminating the presence of heavy metals in the water. It is eco-friendly in nature and is considered as a low-cost technique [8] [9]. The biosorption of cyanobacteria has been observed in Lake Dianchi (China) [10]. Other studies showed that the use of Acacia leucocephala (Lam) bark can be used for removing Cu(II), Cd(II) and Pb(II) ions of the water [11].
To ensure that water does not cause problems to human health or the environment, sensors can be employed to guarantee the quality of the water used for irrigation. In addition, to reduce the amount of irrigation water, we need to use smart systems based on sensors. Wireless Sensor Networks (WSN) can be used for determining the quality of the water in irrigation and irrigation needs. An example is the conductivity sensor proposed in [12]. This sensor can be used for determining the salinity of the water, which is a very important

Network Protocols and Algorithms ISSN 1943-3581
2018, Vol. 10, No. 2
www.macrothink.org/npa 97
parameter for agriculture because irrigation with salt water can cause the loss of fertility of the soil. Another important parameter for detecting the quality of water is the presence of solids. This parameter is calculated indirectly with the turbidity of the water. However, not only is it important to know the value of solids but also their nature. In [13], a sensor with infrared and color Light Emitting Diodes (LEDs) to detect the value of the solids expressed in mg / l, differentiating between two species of algae and inorganic solids was proposed. Moisture sensors can prevent moisture stress conditions in the plants and reduce the excess of irrigation [14]. Moreover, WSN have two important problems, energy consumption and the failures that may arise in data forwarding. To solve these problems, there are operating algorithms that allow to save energy and act in case of failure of one of the sensor nodes.
Energy consumption is an important problem for WSN. Energy is needed for the sensors and microcontrollers to work. In general, in order to power the WSN there are two options: batteries or solar panels. Solar panels cannot always be used because, in some cases, light does not impact the panel directly. There is not an only way for saving energy in WSN. The strategies will depend on the needs that have to be monitored [15]. Each communication protocol has its own transmission speed and range which implies greater or lesser energetic consumptions. There are other energy-saving techniques such as radio optimization, data transmission reduction, sleep and wake-up techniques and energy conscious routing protocols [15] [16]. In this case, a communication protocol that does not consume a large amount of energy is needed in order to avoid replacing batteries.
Failures among the nodes affect the communication process and are another one of the problems that WSNs face. Sensor nodes can be broken or stolen, there can be communication link errors, malicious attacks or they may simply run out of power. In order to avoid fault problems, there are routing algorithms that act in case of failure (fault-tolerant algorithms). In a WSN, the fault-tolerance functionalities can be implemented in the software, hardware, network communication and apliccation layers [17]. According to the routing protocol, different techniques are used to reduce the consequences of the failures. In addition to the efficiency of the system, fault-tolerance solutions may have an impact on energy consumption. Therefore, a balance between energy consumption and efficiency must be sought after so as to implement fault tolerance functionalities.
In this paper, we propose an intelligent system for the irrigation of crops. Our system does not only take into account the water needs of the crops but also the quality of the irrigation waters. In order to do so, temperature and moisture sensors have been deployed in the soil. Moreover, a rain sensor has been deployed as well on a location of the surface. In the channel of water for irrigation, we installed filters for the bioabsorption of contaminants; to check the quality of the water and the operation of the filters we installed sensor nodes before and after the filter. The nodes are composed of a conductivity sensor and a turbidity sensor. We used microcontrollers to acquire data form the sensors and send the information. In the sensor nodes for irrigation, there is a sink node that collects the information and sends it to the database. The water quality sensors also have a Wi-Fi antenna and send the data to the database. The topology of the network is a mesh topology and we also propose a fault-tolerance algorithm.

Network Protocols and Algorithms ISSN 1943-3581
2018, Vol. 10, No. 2
www.macrothink.org/npa 98
The rest of paper is structured as follows. In section 2, the related work is discussed. In section 3, we present the sensors employed in the system, the selected node, the architecture of the system, and the fault tolerance algorithm. The simulation parameters are described in Section 4. In section 5, we present the results of our system and finally, in section 5, we present the conclusions and future works.
2. Related work
In this section, we discuss the related work on smart irrigation for saving water and fault-tolerance algorithms.
The use of WSN to monitor the irrigation needs of crop fields is very common. Dursun and Ozden, [14] developed a low-cost WSN (96 dollars) to control the irrigation in dwarf cherry trees. The system has been based on 3 units. A sensor unit, a base station unit and a valve unit. The sensor unit has a moisture sensor and sends the data to the base station. The base station analyzes the data and decides the parts that need irrigation and open or close the valve units. This system allows eliminating the moisture stress and reducing excessive irrigation.
Yao et. al. [18] proposed a WSN for monitoring the irrigation in agriculture and saving water. The sensor nodes are composed of soil moisture, air temperature, pressure and light intensity sensors. The sensor node transmits the data to the gateway node and the latter, forwards it to a LAN or WAN. For decision making, they used a fuzzy neural network. The self-learning ability of the neural network and the employed fuzzy logic techniques are good for irrigation monitoring. Simulation results confirm that the system can be used for irrigation monitoring.
Abd El-Kader, and Mohammad [19] studied the use of WSN in the potato crop in Egypt. They demonstrated that the cost of the WSN is compensated by the increase in profits and the reduction of costs. The sensor nodes contain sensors for temperature, humidity, light intensity, soil pH, and soil moisture. The sensor nodes are placed in the tubs of potato crops with a distance of 6 meters between them. The different sensor nodes communicate through radio frequency. The Periodic Thresh- old-sensitive Energy-Efficient sensor Network (APTEEN) is used for routing strategy. In this protocol, node sensors are regrouped in a cluster and a sensor node has the responsibility of receiving, aggregating and transmitting the data of cluster members to the gateway. They used APTEEN because it is the most suitable routing idea for their needs.
WSNs can also be used for monitoring water quality. He and Zhan [20] designed a water quality monitoring system for an environmental protection department. They used a CC2430 microprocessor and many different sensors, like water temperature, pH, turbidity sensors, etc. The employed wireless network transmission protocol is Zigbee. The sensor sends the data to the internet.
Fustine et. al. [21] explained the need to monitor the Lake Victoria Basin which has

Network Protocols and Algorithms ISSN 1943-3581
2018, Vol. 10, No. 2
www.macrothink.org/npa 99
increased due to anthropomorphic pressures. Thus, authors presented a WSN for monitoring the Lake Victoria Basin. An Arduino microcontroller, water quality sensors (water temperature, dissolved oxygen, pH, and conductivity) and a wireless network connection compose the system. They used an open source hardware, a web portal and a mobile phone platform to display the value of the sensors. The experiments showed that their proposal can be used for monitoring in real environments.
In the first place, we have seen the techniques for the detection of irrigation needs and in order to know the quality of irrigation water. Unlike our system that does an evaluation not only of the needs of irrigation but of the quality of the water that is used in the irrigation. The system presented in this paper is able to separately analyze irrigation and water quality.
In WSN, failures that prevent the correct operation of the network may occur in the sensor nodes. Hereafter, some algorithms that reduce these problems are analyzed.
Bagci et al. [20] developed a new distributed fault-tolerant topology control algorithm called Disjoint Path Vector (DPV) that is used for heterogeneous WSNs. These have two layers. The first one is a layer of nodes with low-cost ordinary sensors, limited power, and short transmission range. The other layer is comprised of supernodes with more energy reserves and better processing, data capacity and actuators. These collect the information of the nodes. In the topology, each sensor is connected with at least one supernode by k-vertex disjoint paths (Paths with common endpoint but that have no other vertices in common). The typology is tolerant to a failure of k-1 in the worst case. The simulation showed that the algorithm is more efficient than other algorithms. DPV has a 4-fold saving in total transmission power of distributed anycast topology control under the assumption of no packet losses and a 2.5-fold saving with a packet loss rate of 0.1.
Azharuddin et al. [22] showed an algorithm called Distributed Fault-tolerant Clustering and Routing (DFCR). This algorithm is proposed for WSNs. The sensor nodes are grouped in clusters and a sensor node of the cluster is selected as cluster head (CH). The CH changes in each round of information forwarding. This is selected based on the residual energy of the CH, the distance between the sensor node and the CH and the distance from the CH to the base station. In case of failure, the sensor nodes send a help message to other clusters and, if they receive replies, they join this new cluster. They compared their algorithm with Minimum Hop Routing Model (MHRM) and Distributed Energy Balanced Routing (DEBR) with simulations. The results of the simulation showed that DFCR is better with regard to the number of live sensor nodes, energy consumption, etc.
Kaur and Garg [23] developed an improvement of the DFCA, the Improved Distributed Fault-Tolerant Clustering Algorithm (IDFCA). In DFCA, when the CH fails, the operation is moved to the neighboring CH, causing a greater workload in it. In this study, when a CH fault happens, the sensor node selects the CH that was going to be chosen in the next round.
Our system evaluates irrigation water quality and irrigation needs. To solve the possible problems that may arise when nodes break or deplete their energy. We have opted for a meshed network to solve the errors because its installation is simpler, due to its reliability

Network Protocols and Algorithms ISSN 1943-3581
2018, Vol. 10, No. 2
www.macrothink.org/npa 100
when all the nodes are connected to each other.
3. System description
In this section, we are going to describe the proposed smart irrigation system. First, we will describe the sensors employed to gather data from the field and the selected node to transmit the data. Then, the architecture of the proposed system is shown. Finally, the fault tolerance and energy saving algorithms will be presented.
3.1 Sensors
In this subsection, the sensors used for monitoring water quality and irrigation needs in the farmland are described.
First, we will show the sensor utilized for water quality monitoring. The monitored parameters in the water are turbidity and conductivity. For the turbidity sensing, optical sensors are selected. On the other hand, for conductivity monitoring, inductive sensors are used.
The turbidity sensor is composed by two LEDs emitting at different wavelength and two light detectors. The sensor is based on the one presented in [13]. One of the LEDs has the peak wavelength of 612-625nm and the other of 850 nm. The light detectors are a Light Dependent Resistance (LDR) responsive to visible light by the first LED and a photodiode responsive to Infrared (IR) light by the second LED. The turbidity sensor is placed before and after the application of the filters for purifying the water. The LEDs are powered at 3.3V using the 3.3V output voltage. The light detectors are connected to the node at the analog input (AI) 1 and 2.
The conductivity sensor is composed of two copper coils. The first coil is powered with a sine wave and the second coil is induced. The induced voltage depends on the conductivity of the water. The selected sensor is based on the prototype described in [12]. The powered coil is powered with the Arduino using an analog output (PWM) pin, in particular PWM 2. The generated voltage in the induced coil is measured in the AI 3. As the turbidity sensor, the conductivity sensor is placed before and after the filters.
Both sensors will monitor the correct operation of the purification filters by registering the changes in water quality before and after the filters. The conductivity and turbidity sensors are connected to the same node.
Next, we are going to describe the employed sensors for the field monitoring. Three different parameters will be monitored including rain, soil moisture and soil temperature.
The employed rain sensor is a raindrops module compatible with Arduino. The sensor is composed by a printed circuit that acts as a variable resistor. The resistance of the sensor depends on the presence of drops in the module. The minimum resistance, when it is wet, is 100KΩ and the maximum resistance, when it is dry, is 2MΩ. The sensor is powered at 3.3V. The sensor output voltage is connected to the AI 10. The sensor is located on the field where

Network Protocols and Algorithms ISSN 1943-3581
2018, Vol. 10, No. 2
www.macrothink.org/npa 101
the orange trees are placed. The sensor is deployed at 1m of the soil in an area which is not covered by trees. The rain sensor is not included in all the nodes deployed on the field.
The soil moisture sensor is based on an available module for Arduino. The sensor is composed by two electrodes with a gap between them. Once the sensor is introduced in the soil, the current will be transmitted from one electrode to the other according to the water content of the soil. The output voltage of the sensor changes from 0V, when the soil is completely dry, to 4.2V. The soil moisture sensors will be placed next to each orange tree. The soil moisture sensor will be connected to AI 1.
The temperature sensor is based on a thermistor Negative Temperature Coefficient (NTC). The sensor is powered at 3.3V and the output voltage is connected to the AI 4 of the node. The temperature sensor is used to measure the temperature of the soil. The sensor is placed next to each tree over the soil.
The sensors in the field will be used for monitoring the state of the soil in order to define the irrigation needs of the different plots.
3.2 Nodes
In this subsection, the description of the characteristics of the node is performed.
In our proposed system, the nodes are deployed throughout the expanse of the plots. The quantity of nodes depends on the size of the plot and its specific needs. The employed nodes are Arduino Mega 2560 [24] nodes provided with WiFi connection employing the ESP8266 module [25] which supports IEEE 802.11 b/g/n. This node has 16 analog input pins and 54 digital input/output pins, allowing to connect many sensors to one single node. Moreover, it provides a USB connection, 4 UART serial ports, a power jack, a 16 MHz crystal oscillator, an ICSP (In-Circuit Serial Programming) header and a reset button. This node however, does not provide an integrated wireless interface. Thus, it is necessary to incorporate a Wi-Fi module. The ESP8266 is a low-cost Wi-Fi module that supports IPv4. Moreover, the UDP, TCP, HTTP and FTP protocols are supported as well. It also provides 1MB of flash memory and an integrated 32-bit CPU. The connections between the node and the Wi-Fi module are the ones presented in Figure 1.
Network Protocols and Algorithms ISSN 1943-3581
2018, Vol. 10, No. 2
www.macrothink.org/npa 102
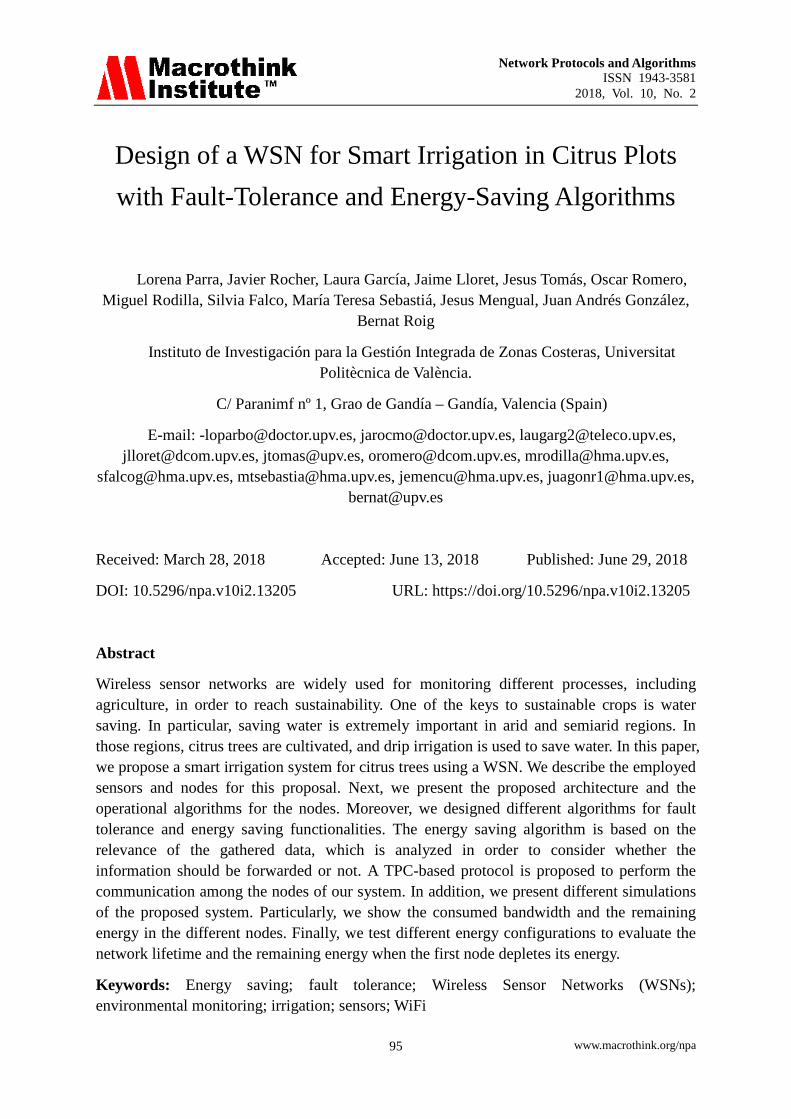
Figure 1. Connections between the Arduino Mega 2560 and the ESP8266.
3.3. Architecture
In this subsection, we show the architecture and the operation algorithm of the proposed smart irrigation system.
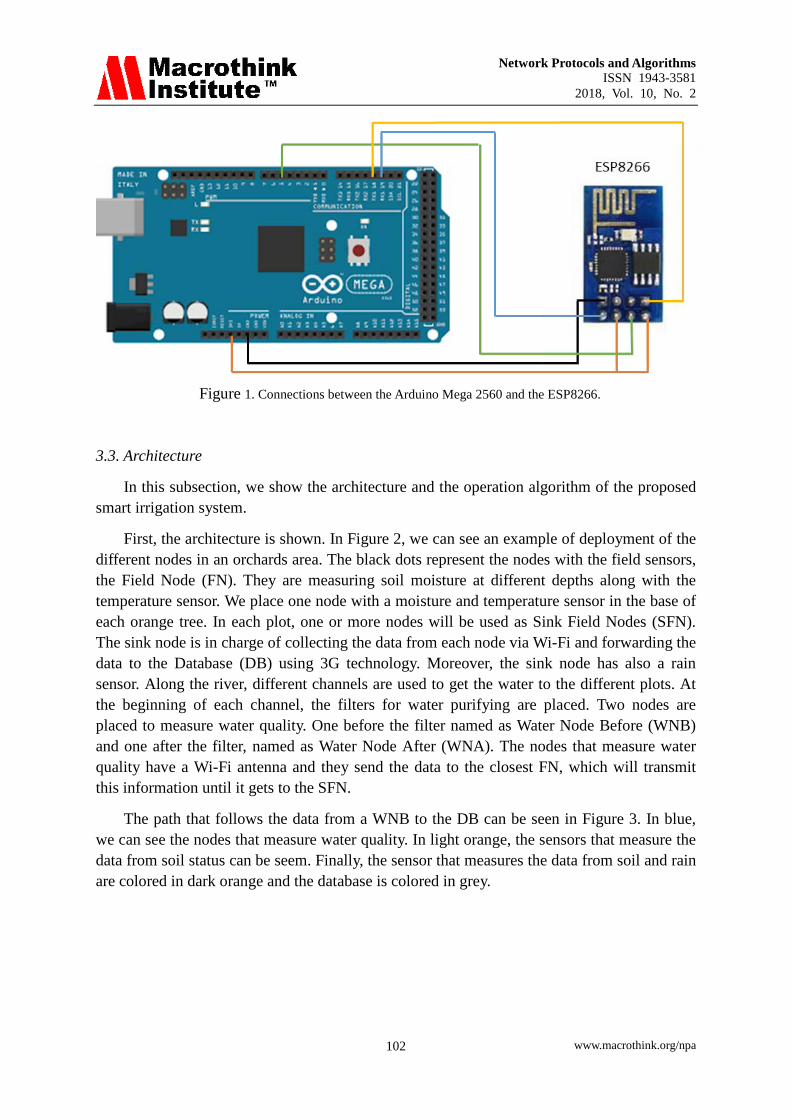
First, the architecture is shown. In Figure 2, we can see an example of deployment of the different nodes in an orchards area. The black dots represent the nodes with the field sensors, the Field Node (FN). They are measuring soil moisture at different depths along with the temperature sensor. We place one node with a moisture and temperature sensor in the base of each orange tree. In each plot, one or more nodes will be used as Sink Field Nodes (SFN). The sink node is in charge of collecting the data from each node via Wi-Fi and forwarding the data to the Database (DB) using 3G technology. Moreover, the sink node has also a rain sensor. Along the river, different channels are used to get the water to the different plots. At the beginning of each channel, the filters for water purifying are placed. Two nodes are placed to measure water quality. One before the filter named as Water Node Before (WNB) and one after the filter, named as Water Node After (WNA). The nodes that measure water quality have a Wi-Fi antenna and they send the data to the closest FN, which will transmit this information until it gets to the SFN.
The path that follows the data from a WNB to the DB can be seen in Figure 3. In blue, we can see the nodes that measure water quality. In light orange, the sensors that measure the data from soil status can be seem. Finally, the sensor that measures the data from soil and rain are colored in dark orange and the database is colored in grey.
Network Protocols and Algorithms ISSN 1943-3581
2018, Vol. 10, No. 2
www.macrothink.org/npa 103
Figure 2. Example of location of nodes in the field.
Figure 3. Data forwarding from the WNB to the DB
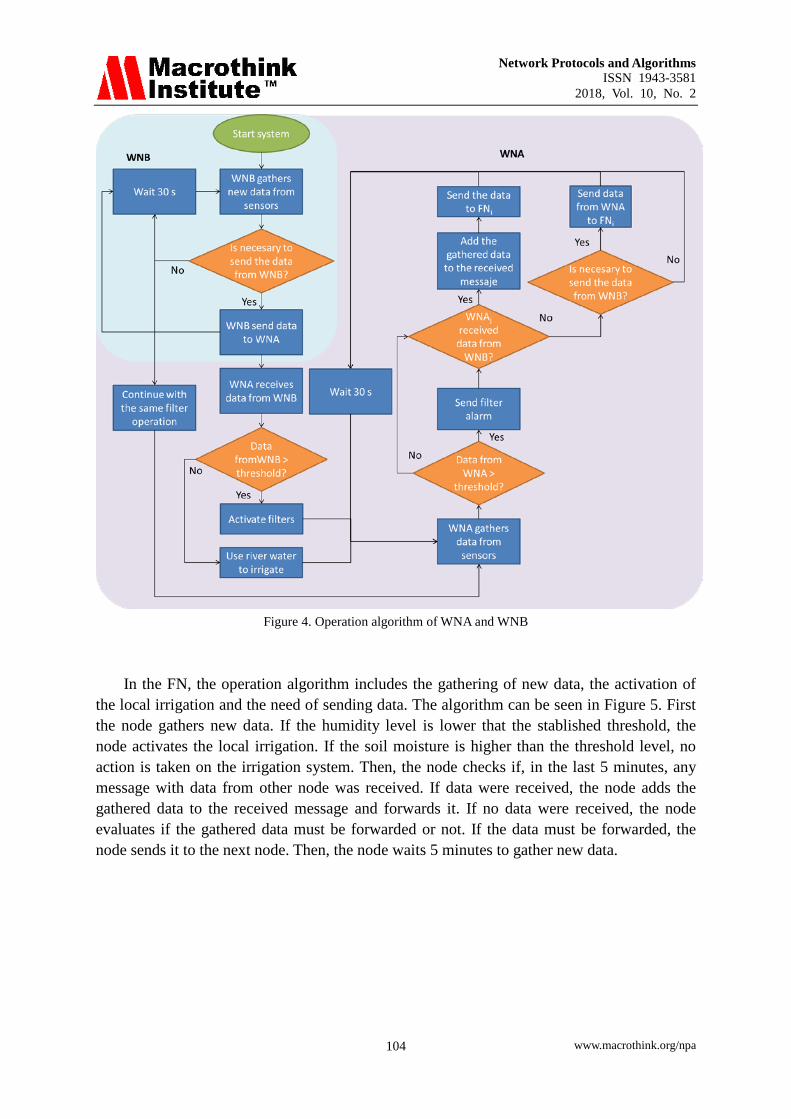
Next, we are going to describe the operation algorithm applied in the nodes that monitor water quality, the WNB and WNA, and activate the filters when it is needed. The algorithm presented in Figure 4, shows the operation process of the nodes. Firstly, the WNB gathers data from salinity and turbidity. Then, the node evaluates if it is necessary to send the data or not. This will be performed applying the algorithm described in the following subsection. If the data have changes from the previous sent value, the WNB must send the new gathered data to the WNA. Thus, the WNA will evaluate the needed action. The actions are meant to activate the filters to purify the water, if pollution is detected, or irrigate with river water if the water is clean. To determine the pollution of the water, the data from the WNB is compared with stablished thresholds. However, if it is not necessary to send the data from the WNB to the WNA, the data is not sent and no actions are taken on the filters. If no data is received, the WNA gathers new data as usual. If data from WNA is higher than a threshold, it indicates that the filters are not operating properly, then an alarm is sent. The last step is to evaluate if it is necessary to send the data gathered by the WNA. Then, according to the need of sending the data of WNA and WNB, the WNA will forward the data that requires to be sent.
Network Protocols and Algorithms ISSN 1943-3581
2018, Vol. 10, No. 2
www.macrothink.org/npa 104
Figure 4. Operation algorithm of WNA and WNB
In the FN, the operation algorithm includes the gathering of new data, the activation of the local irrigation and the need of sending data. The algorithm can be seen in Figure 5. First the node gathers new data. If the humidity level is lower that the stablished threshold, the node activates the local irrigation. If the soil moisture is higher than the threshold level, no action is taken on the irrigation system. Then, the node checks if, in the last 5 minutes, any message with data from other node was received. If data were received, the node adds the gathered data to the received message and forwards it. If no data were received, the node evaluates if the gathered data must be forwarded or not. If the data must be forwarded, the node sends it to the next node. Then, the node waits 5 minutes to gather new data.

Network Protocols and Algorithms ISSN 1943-3581
2018, Vol. 10, No. 2
www.macrothink.org/npa 105
Figure 5. Operation algorithm of FNs
3.4. Fault tolerance algorithm
Figure 6 presents the fault tolerance algorithm for the nodes deployed throughout the crops. The nodes employed are Arduino Mega provided with WiFi connection employing the ESP8266 module. Firstly, the connection is stablished between the nodes. Nodes detect their neighbors and ask for the metrics to determine the shortest path to the base station. When the node determines the next hop, it starts performing its sensing activities. Then, the forwarding decision algorithm presented in the next section of this paper is applied. When necessary, data is forwarded to the next hop. If the ACK is received, the node continues with its normal functioning. If an ACK is not received, the data is forwarded again. If after three tries an ACK is not forwarded, the process of detecting the neighbors and selecting the one closest to the base station is performed again. Then, the data and a warning are forwarded so as to inform that there is a broken node.

Network Protocols and Algorithms ISSN 1943-3581
2018, Vol. 10, No. 2
www.macrothink.org/npa 106
Figure 6. Fault tolerance algorithm.
Figure 7 presents the message exchange between the components of the architecture of our proposed system. Firstly, the connection establishment process is performed where nodes send a broadcast message to reach the other nodes. Then, the nodes send the metrics indicating the distance to the base station. When the nodes perform correctly, the data is forwarded to the next hop and an ACK is received. Then, the information is forwarded from node to node to the router in the base station, where the information from the nodes is received employing Wi-Fi. 3G is employed to forward the information to the database. When there is a failure in a node, the data is forwarded three times in order to ensure the error was not caused by interferences. The neighbor discovery process is performed again and when the next hop is selected, the data is forwarded as usual including a warning to alert of the broken node.

Network Protocols and Algorithms ISSN 1943-3581
2018, Vol. 10, No. 2
www.macrothink.org/npa 107
Figure 7. Message exchange among the elements of the system.
3.5. Energy saving algorithm
In this section, we are going to describe the use of the energy saving algorithm. Many algorithms have appeared in the last years for WSNs to diminish the energy usage. The majority of those algorithms are based on the selection of different transmission settings, using different routing protocols, or using specific protocols with less communication requirements or less packet size. However, the best way to save energy is to avoid
Network Protocols and Algorithms ISSN 1943-3581
2018, Vol. 10, No. 2
www.macrothink.org/npa 108
unnecessary packet exchanges. In WSNs, when the sensors are measuring a parameter, the node usually sends the gathered data without considering the relevance of this data.
It is extremely important to consider the relevance of the gathered data in order to know if it is important to forward the it. The reason is because if the node sends this data a high energy consumption in this and other nodes will be generated. The data transmission is considered as the procedure that requires more energy. Thus, the rest of the processes as processing, coding, and decoding the data can be despised. In other paper, [26], authors have proposed a smart algorithm that decides if the gathered data must be transmitted or not. Based on their algorithm we propose a simplified version adapted to our proposal.
The adapted algorithm is shown in Figure 8. In our case, the decision algorithm is applied to all the nodes during its operation algorithm (Figures 4 and 5). These algorithms start with the new gathered data and must decide to send it or not. The gathered data corresponds to two variables, m and n. The new gathered data is set as Xm and Xn. Those variables are, in case of WNB and WNA, the conductivity and the turbidity and, in case of FN, soil moisture and temperature. Then, the algorithm searches in the node memory for the established thresholds for each variable (Δm and Δn). These thresholds represent the minimum variation in the parameter that must be overcome to consider the new information as relevant. Next, the algorithm searches in the node for the previous transmitted values. If there were no previous transmitted values, the new values are set as the last transmitted values (Ym and Yn), and the values are transmitted. If there were Ym and Yn in the node memory, the algorithm compares the Xm and Xn with the Ym and Yn. If the difference exceeds Δm or Δn, the gathered data is transmitted. Otherwise, the data is not transmitted because it is considered that the gathered data does not contain relevant information.
3.6. Protocol description
Nodes communicate employing IPv4. For this proposal we present a modification of the TCP protocol that incorporate on the TCP datagram the fields presented in Figure 8. In the data forwarding message, the TCP header is followed by the W Node ID field. This field is employed if there is a warning. The W Node ID indicates the ID of the node that is malfunctioning. Node 1 ID indicates the ID of the first node that wants to forward information, which has a size of 1 Byte. The next field is sensor ID and has a size of 1 bit. The Sensor data field is where the data gathered from the sensor is positioned on the datagram. There are two types of sensor. For WNA/WNB sensors, the size of the data field is 6 bits whereas for FN sensors, it is 8 bits. Sensor 2 ID has a 1-bit size and indicates the ID of the second sensor. Lastly, Sensor 2 Data is employed to transmit the information gathered from the second sensors. Its size is 4 bits for both types of sensors.
When a node receives information from other nodes in order for it to be forwarded, the information is placed on the datagram following the data from the other nodes. As it can be seen in Figure 9, where Node 1 Data is followed by Node 2 Data and so on depending on the number of nodes that are forwarding data at the moment. The W Node ID field is only employed when there is a warning. Finally, the ACK message is composed of only the TCP header, without adding any more data.

Network Protocols and Algorithms ISSN 1943-3581
2018, Vol. 10, No. 2
www.macrothink.org/npa 109
Figure 8. Energy saving algorithm.
Figure 9. Message strucutre.

Network Protocols and Algorithms ISSN 1943-3581
2018, Vol. 10, No. 2
www.macrothink.org/npa 110
4. Simulation description
In this section, we are going to describe the simulation performed with the proposed protocol and algorithms.
First, we describe the number of employed nodes and its topology. In our simulation, we include a total of 23 nodes. From those 23 nodes, there are different types of nodes such as WNA (1 node), WNB (1 node), FN (20 nodes) and FNS (1 node). In Figure 10, we show the location and type of the nodes. In blue, we can see the WNA and WNB placed in the Jucar River and in the channel used to transport the water to the orchards. The FN are represented in red dots and are numbered in letters, from “a” to “u”. The node “k” is the FNS, which will collect the data from the rest of the nodes.
Figure 10. Topology for the simulation
According to [26] we assume that the energy used for transmission and reception is 50nJ/bit, and 100pJ/bit/m2 considering a distance of 3m between FNs. In our simulations we are not going to use any type of encryption to avoid the energy use. The initial battery of the FNs is 0.1J and the FNS has a different battery with 0.5J. We consider that the nodes gather data each 5 min. The data is sent only if the gathered data is relevant, see Figure 4. For the simulation we consider a 10% chance that the gathered data is relevant and must be sent.
When one node sends information, according to Figure 4 and 5, the following nodes in the topology have to add their gathered data to the received information and send it. The length of the TCP header is 160 bits. The length of the data gathered by WNA or WNB is 20 bits. The length of the data gathered by FNs is 22 bits. The ACK packet length is 160 bits.
The same scenario will be tested with different energy configurations. The first configuration is the previous one, with 0.1J in all the FN nodes and 0.5J in the FNS. The second configuration gives 0.5J to FNS and 0.25J to nodes d and r. In the last configuration, nodes d and r have 0.425J, the nodes c, e, j, l, o, p, q and s have 0.15J, the FNS 0.5J, and the rest of the nodes 0.05J. The number of iterations will be 20000. A total of 9 simulations will

Network Protocols and Algorithms ISSN 1943-3581
2018, Vol. 10, No. 2
www.macrothink.org/npa 111
be performed for each configuration.
5. Results
In this section, we present the data obtained from the aforementioned simulation, including the total bandwidth consumed from the FNs and the remaining energy after 10000 iterations.
Firstly, we are going to present the results from the bandwidth consumed by the network. Figure 11 presents the consumed bandwidth during 5000 iterations. The mean consumed bandwidth is 1938 bits. The maximum consumed bandwidth is 7252 bits at iteration 4165. The minimum consumed bandwidth is 0 bits, this occurs many times in the 5000 iterations.
Next, the remaining energy in the nodes are shown (see Figure 12). The node represented by a k in Figure 12 is the FNS and has 5 times more energy than the rest of the nodes. In Figure 12, we are representing the energy use related to the data transmission and reception. The nodes j and f consume the energy much faster than the other normal FNs. The node with less remaining energy is the r node, with 0.028J. The average remaining energy in the FN is 0.081J. The FN with higher remaining energy is the h node with 0.95J. The FNS has a remaining energy of 0.36J.
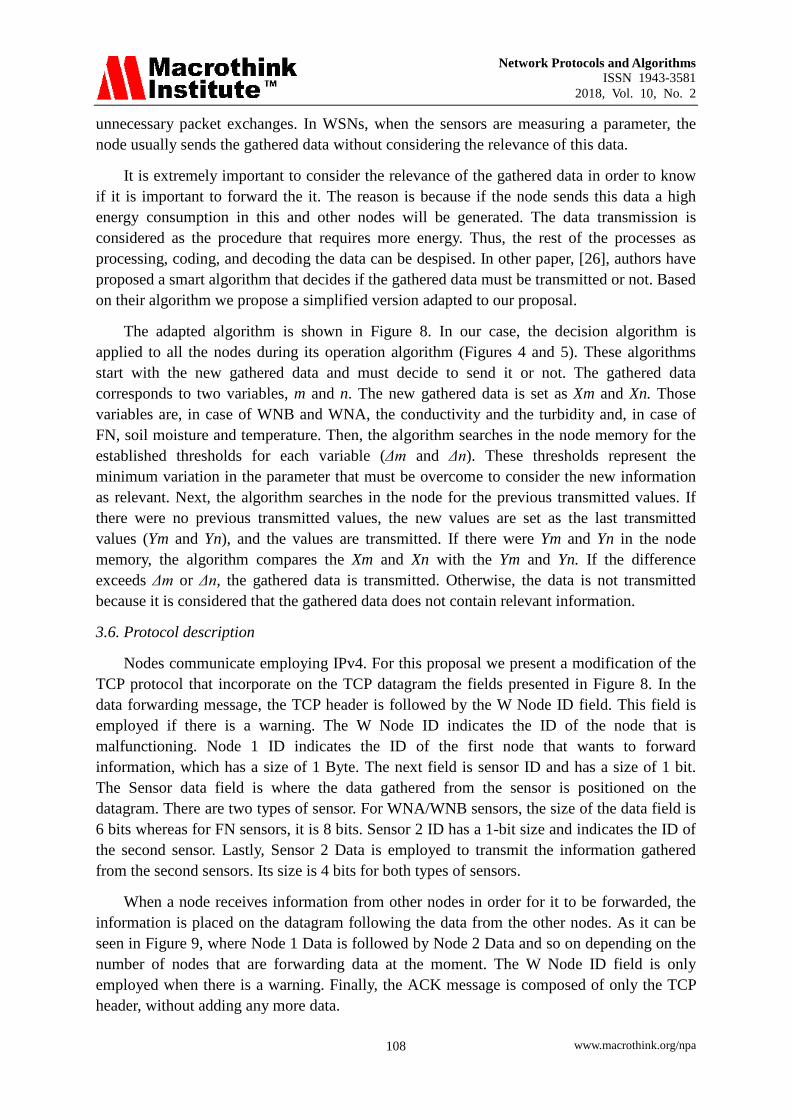
Now, we are going to evaluate the different energetic configurations. Table 1 shows the iterations before the first node dies. In the first configuration, the first node that dies is node r. The first node dies between iterations 6762 and 6919. The mean lifetime of the network is 6841 iterations. For the second configuration, the first node that dies is node q. This happens between iteration 1306 and 13609. The mean lifetime of the network is 13300 iterations. For the last configuration, the fist node that dies is k node. The mean lifetime of the network is 18126 iterations, the minimum and maximum are 18079 and 18189. In Figure 13, we can see the maximum remaining energy in one node and the mean remaining energy in all the nodes for the different configurations. The configuration that uses the energy less efficiently is the configuration 1, where there is one node with up to 3J when the first node dies. The second and third configurations have almost the same maximum remaining energy in one node. However, the configuration 2 has a higher mean remaining energy in the nodes, 0.06J, while configuration 3 only has 0.04J. In addition, configuration 3 is the one that presents the longer lifetime.

Network Protocols and Algorithms ISSN 1943-3581
2018, Vol. 10, No. 2
www.macrothink.org/npa 112
Figure 11. Consumed bandwidth
0
0.05
0.1
0.15
0.2
0.25
0.3
0.35
0.4
WNB
WNA
a b c d e f g h i j K l m n o p q r s t u
Rem
iani
ng e
nerg
y af
ter 5
000
itera
tion
(J)
Node Figure 12. Remaining energy in nodes after 5000 iterations
0
0,05
0,1
0,15
0,2
0,25
0,3
0,35
1 2 3Rem
aini
ng e
nerg
y w
hen
first
nod
e di
ed (J
)
ConfigurationMaximum remaining energy Mean remaining energy
Figure 13. Remaining energy in nodes after 5000 iterations
Network Protocols and Algorithms ISSN 1943-3581
2018, Vol. 10, No. 2
www.macrothink.org/npa 113
Table 1. Number of iterations before first node dies with different energetic configurations.
Iteration first node died
Simulation Conf 1 Conf 2 Conf 3
1 6919 13236 18094
2 6862 13153 18189
3 6844 13326 18158
4 6765 13409 18129
5 6875 13343 18098
6 6762 13414 18114
7 6833 13609 18079
8 6850 13144 18146
9 6861 13065 18124
Mean 6841 13300 18126
6. Conclusion
In this paper we present the application of a smart irrigation system with a new protocol for WSN that allows a decrease in the energy consumption and provides a fault-tolerance mechanism. The proposal is based on our previous work in [27].
Firstly, we describe our proposal including the employed sensors, nodes and architecture. Then, the protocols and algorithms are detailed. Finally, a simulation was performed with a topology that includes 23 nodes. We show the consumed bandwidth and the remaining energy after 5000 iterations. Moreover, we simulate the moment when the first node reaches the 0% of energy using different combinations of energy distribution in the nodes.
Our results show that the mean consumed bandwidth is 1938bits, while the maximum consumed bandwidth is 7252 bits. After 5000 iterations no node has used all its energy. Different energy configurations show different network lifetime and different remaining energy in the rest of the nodes.
Acknowledgement
This work has been partially supported by the “Conselleria d' Educació, Investigació, Cultura i Esport” through the “Subvenciones para la contratación de personal investigator de carácter predoctoral (Convocatoria 2017)” Grant number ACIF/2017/069, by the “Ministerio de Educación, Cultura y Deporte”, through the “Ayudas para contratacion predoctoral de Formación del Profesorado Universitario FPU (Convocatoria 2014)”. Grant number FPU14/02953 and finally, the research leading to these results has received funding from “la Caixa” Foundation and Triptolemos Foundation. This work has also been partially supported by European Union through the ERANETMED (Euromediterranean Cooperation through ERANET joint activities and beyond) project ERANETMED3-227 SMARTWATIR.

Network Protocols and Algorithms ISSN 1943-3581
2018, Vol. 10, No. 2
www.macrothink.org/npa 114
References
[1] Mekonnen M. and Hoekstra A., “Four Billion People Experience Water Scarcity”, Sci. Adv., Vol. 2, Issue. 2, February 2016. Science Advances
[2] OECD, “Water use in agriculture”, 2017. Avaible at http://www.oecd.org/agriculture/water-use-in-agriculture.htm (Last access may 25 to 2018).
[3] Pedrero F., Kalavrouziotis I., Alarcón J. J., Koukoulakis P., and Asano T., “Use of treated municipal wastewater in irrigated agriculture-Review of some practices in Spain and Greece”, Agricultural Water Management, Vol. 97, Issue. 9, pp. 1233–1241, September 2010. https://doi.org/10.1016/j.agwat.2010.03.003
[4] Tropp H. and Jägerskog A., “Water Scarcity Challenges in the Middle East and North Africa”, Ed. UNDP Human Development Report, 2006. Avaible at. http://hdr.undp.org/sites/default/files/siwi2.pdf (last accessed March 30, 2011)
[5] Yi L., Jiao W., Chen X., and Chen W., “An overview of reclaimed water reuse in China”, Journal of Environmental Sciences., Vol. 23, Issue. 10, pp. 1585–1593, October 2011. https://doi.org/10.1016/S1001-0742(10)60627-4
[6] Qadir M. et al., “The challenges of wastewater irrigation in developing countries”, Agricultural Water Management, Vol. 97, Issue. 4, pp. 561–568, April 2010. https://doi.org/10.1016/j.agwat.2008.11.004
[7] Fomina M. and Gadd G. M., “Biosorption: Current perspectives on concept, definition and application”, Bioresource Technology, Vol. 160, pp. 3–14, May 2014. https://doi.org/10.1016/j.biortech.2013.12.102
[8] Gupta V. K. and Rastogi A., “Biosorption of lead from aqueous solutions by green algae Spirogyra species: Kinetics and equilibrium studies”, Journal of Hazardous Materials, Vol. 152, Issue. 1, pp. 407–414, March 2008. https://doi.org/10.1016/j.jhazmat.2007.07.028
[9] Vieira R. H. S. F. and Volesky B., “Biosorption: a solution to pollution?”, International Microbiology , Vol. 3, pp. 17–24, January 2000.
[10] Wang K., Colica G., Philippis R. De, Liu Y., and Li D., “Biosorption of copper by cyanobacterial bloom-derived biomass harvested from the eutrophic Lake Dianchi in China.”, Current Microbiology, Vol. 61, Issue 4, pp. 340–345, October 2010. https://doi.org/10.1007/s00284-010-9617-2
[11] Munagapati V. S., Yarramuthi V., Nadavala S. K., Alla S. R., and Abburi K., “Biosorption of Cu(II), Cd(II) and Pb(II) by Acacia leucocephala bark powder: Kinetics, equilibrium and thermodynamics”, Chemical Engineering Journal., Vol. 157, Issue 2–3, pp. 357–365, March 2010. https://doi.org/10.1016/j.cej.2009.11.015
[12 ] Parra L., Ortuño V., Sendra S., Lloret J., “Low-cost conductivity sensor based on two coils”, In Proceedings of the First International Conference on Computational Science and Engineering (CSE 2013), Valencia, Spain, August 25-31, 2013.
[13] Parra L., Rocher J., Escrivá J., and Lloret J., “Design and development of low cost smart turbidity sensor for water quality monitoring in fish farms”, Aquacultural Engineering , Vol. 81, Issue February, pp. 10–18, May 2018. https://doi.org/10.1016/j.aquaeng.2018.01.004
[14] Dursun M. and Ozden S., “A wireless application of drip irrigation automation supported by soil moisture sensors”, Scientific Research and Essays, Vol. 6, Issue 7, pp. 1573–1582, April 2011. https://doi.org/10.5897/SRE10.949
[15] Rault T., Bouabdallah A., and Challal Y., “Energy efficiency in wireless sensor networks: A top-down survey”, Computer Networks, Vol. 67, pp. 104–122, July 2014.
Network Protocols and Algorithms ISSN 1943-3581
2018, Vol. 10, No. 2
www.macrothink.org/npa 115
https://doi.org/10.1016/j.comnet.2014.03.027 [16] Al Ameen M., Islam S. M. R., and Kwak K., “Energy Saving Mechanisms for MAC Protocols in
Wireless Sensor Networks”, International Journal of Distributed Sensor Networks, Vol. 6, Issue 1, p. 163413, October 2010.
[17] Liu H., Nayak A., and Stojmenovic I., “Chapter 10: Fault-Tolerant Algorithms/Protocols in Wireless Sensor Networks Guide to Wireless Mesh Networks”, in Guide to Wireless Mesh Networks, S. Misra, I. Woungang and S. Chandra Misra, 2009, p. 261-291.
[18] Yao Z., Lou G., XiuLi Z., and Zhao Q., “Research and development precision irrigation control system in agricultural”, 2010 International Conference on Computer and Communication Technologies in Agriculture Engineering (CCTAE 2010), Chengdu, China, June 12-13, 2010. https://doi.org/10.1109/CCTAE.2010.5544390
[19] Abd El-Kader S. M. and Mohammad El-Basioni B. M., “Precision farming solution in Egypt using the wireless sensor network technology”, Egyptian Informatics Journal, Vol. 14, Issue 3, pp. 221–233, November 2013. https://doi.org/10.1016/j.eij.2013.06.004
[20] Bagci H., Korpeoglu I., and Yazıcı A., “A Distributed Fault-Tolerant Topology Control Algorithm for Heterogeneous Wireless Sensor Networks”, IEEE Transactions on Parallel and Distributed Systems, Vol. 26, Issue 4, pp. 914–923, April 2015. https://doi.org/10.1109/TPDS.2014.2316142
[21] Faustine A. et al., “Wireless Sensor Networks for Water Quality Monitoring and Control within Lake Victoria Basin: Prototype Development Wireless Sensor Networks, Lake Victoria Basin, Gateway, Sensor Nodes”, Wireless Sensor Network, Vol. 6, pp. 281–281, December 2014. http://dx.doi.org/10.4236/wsn.612027
[22] Azharuddin M., Kuila P., Jana P. K., and Thampi S., “Energy efficient fault tolerant clustering and routing algorithms for wireless sensor networks”, Computers & Electrical Engineering, Vol. 41, pp. 177–190, January 2015. https://doi.org/10.1016/j.compeleceng.2014.07.019
[23] Kaur M. and Garg P., “Improved distributed fault tolerant clustering algorithm for fault tolerance in WSN”, Proceedings - 2016 International Conference on Micro-Electronics and Telecommunication Engineering, (ICMETE 2016). Ghaziabad, India, September 22-23, 2016 pp. 197–201, 2017. https://doi.org/10.1109/ICMETE.2016.99
[24] Arduino Mega, Arduino webpage. Available at: https://www.arduino.cc/en/Main/arduinoBoardMega/. Last access: 27/02/2018
[25] ESP8266 module. Available at: https://www.sparkfun.com/products/13678. Last access: 27/02/2018 [26] García L., Parra L., Romero O., Lloret J., “System for monitoring the wellness state of people in
domestic environments employing emoticon-based HCI”, The Journal of Supercomputing, pp. 1-25, December 2017. https://doi.org/10.1007/s11227-017-2214-4
[27] Garcia M., Sendra S., Lloret G., Lloret J., “Monitoring and control sensor system for fish feeding in marine fish farms”, IET communications Vol. 5, Issue 12, pp. 1682-1690, August 2011. https://doi.org/10.1049/iet-com.2010.0654
Copyright Disclaimer
Copyright reserved by the author(s).
This article is an open-access article distributed under the terms and conditions of the Creative Commons Attribution license (http://creativecommons.org/licenses/by/3.0/).