Résistance à la corrosion et comportement …...III Résumé Le comportement à la corrosion de...
78
Résistance à la corrosion et comportement électrochimique des composites matriciels intermétalliques Fe 3 Al renforcés par TiC Mémoire Najmeh Ahledel GÉNIE DES MATÉRIAUX ET DE LA MÉTALLURGIE MAÎTRISE- AVEC MÉMOIRE Québec, Canada © Ahledel, Najmeh, 2018
Transcript of Résistance à la corrosion et comportement …...III Résumé Le comportement à la corrosion de...

Résistance à la corrosion et comportement
électrochimique des composites matriciels
intermétalliques Fe3Al renforcés par TiC
Mémoire
Najmeh Ahledel
GÉNIE DES MATÉRIAUX ET DE LA MÉTALLURGIE
MAÎTRISE- AVEC MÉMOIRE
Québec, Canada
© Ahledel, Najmeh, 2018

Corrosion Resistance and Electrochemical
Behavior of Fe3Al Intermetallic Matrix Composites
Reinforced by TiC
MÉMOIRE
Najmeh Ahledel
Sous la direction de :
Houshang Alamdari, directeur ou directrice de recherche
Hendra Hermawan, codirecteur ou codirectrice de recherche

III
Résumé
Le comportement à la corrosion de deux revêtements composites à matrice intermétallique Fe3Al
préparés par la technique HVOF (High Velocity Oxy Fuel) a été étudié dans une solution à 3.5%
en poids de NaCl et comparé au Fe3Al non renforcé. En outre, le chrome en tant qu'élément
d'alliage utilisé dans la charge d'alimentation de HVOF pour évaluer l'effet du chrome sur le
comportement à la corrosion du revêtement. Les techniques électrochimiques, y compris la
polarisation potentiodynamique, le potentiel de circuit ouvert (OCP) et la spectroscopie
d'impédance électrochimique (EIS) ont été considérées. La surface de l'échantillon a été analysée
après la corrosion en utilisant un microscope électronique à balayage (MEB) et une spectroscopie
photoélectronique par rayons X (XPS).
L'essai de potentiel en circuit ouvert a révélé qu'il existe sur le revêtement une couche d'oxyde qui
pourrait être due à la technique HVOF utilisant de l'oxygène gazeux pour appliquer les
revêtements. Les diagrammes de polarisation potentiométrique ont révélé que l'ajout de particules
de TiC à la matrice Fe3Al améliore les performances de corrosion de Fe3Al, de sorte que les
revêtements Fe3Al / TiC présentent un taux de corrosion légèrement 6 fois supérieur. Une
spectroscopie d'impédance électrochimique a été réalisée pour étudier les mécanismes de
prévention de la corrosion des revêtements et un mécanisme différent était supposé pour Fe3Al-Cr
/ TiC.
Une analyse post-corrosion, telle que les spectres XPS et les images MEB de la couche passive, a
été réalisée pour étudier la forme de corrosion. L'analyse élémentaire de la couche passive a révélé
que l'addition de chrome au revêtement composite, fournit une couche passive plus protectrice en
bloquant les sites d'entrée des ions chlorure.
Essais de polarisation cyclique effectués dans une solution d'acide sulfurique 0.25 M pour étudier
le comportement de passivation et de piqûration de revêtements dans une solution différente pour
comparer les résultats de plusieurs autres travaux sur des aluminiures de fer avec Fe3Al et deux
revêtements composites de Fe3Al /TiC et Fe3Al-Cr/TiC. Les résultats de la polarisation cyclique
potentiodynamique ont révélé que les performances de corrosion des revêtements composites dans
cette solution sont légèrement meilleures que Fe3Al. Cependant Fe3Al-Cr/TiC présente une
résistance à la piqûration inférieure à celle de deux autres revêtements.

IV
ABSTRACT
The corrosion behavior of two Fe3Al intermetallic matrix composite coatings (Fe3Al/TiC and
Fe3AlCr/TiC) that prepared by high velocity oxy fuel (HVOF) technique was studied in 3.5 wt.%
NaCl solution and compared with non-reinforced Fe3Al. Furthermore, chromium as an alloying
element used in the feedstock of HVOF to evaluate the effect of chromium on corrosion behaviour
of the coating. Four electrochemical techniques, open circuit potential potentiodynamic
polarization, and electrochemical impedance spectroscopy (EIS) were employed to examine
corrosion behavior in detail. Post-corrosion analysis was done using Scanning Electron
Microscopy (SEM) and X-ray Photoelectron Spectroscopy (XPS) to reveal the surface morphology
and chemistry of the corroded samples.
Results from the open circuit potential test revealed that an oxide layer formed on the coating
which could be due to oxidation during the HVOF coating process. The Potentiodynamic
polarization graphs revealed that adding TiC particles to Fe3Al matrix improved the corrosion
performance of Fe3Al so that the Fe3Al/TiC coatings exhibit slightly six times more corrosion rate.
The EIS results indicated a more compact corrosion layer formed on the Cr-added coating resulting
into the highest coating resistance. This is supported by the SEM/EDS and XPS analyses which
revealed that a mixed oxide and hydroxide formed a passive layer. The Cr in the composite coating
took the role in providing a more protective passive layer by blocking the entry sites of Clions.
The pitting resistance of the Fe3Al-Cr/TiC coating in 0.25 M H2SO4 solution was, however, lower
compared to that of the two other coatings. It is concluded that the addition of TiC particles to
Fe3Al matrix, which primarily done for improving wear resistance, improves the corrosion
resistance of the coating in saline solution. The addition of Cr into the Fe3Al/TiC composite
coating further improves its corrosion resistance, but the pitting resistance is not improved when
tested in acid solution.

V
Table of Contents
Résumé .......................................................................................................................................... III
ABSTRACT .................................................................................................................................. IV
List of Figures .............................................................................................................................. VII
Acknowledgement ......................................................................................................................... X
INTRODUCTION ...................................................................................................................... 1
1.1. Background .......................................................................................................................... 2
1.2. Objective .............................................................................................................................. 4
CHAPTER 1 ............................................................................................................................... 5
LITERATURE REVIEW ........................................................................................................... 5
2.1. Introduction to Mechanical Properties of Fe3Al .................................................................. 6
2.1.1 Phase Diagram ............................................................................................................... 6
2.1.2 Point defects and Dislocations ....................................................................................... 7
2.1.3 Mechanical Properties .................................................................................................... 8
2.1.4 Alloying Elements ......................................................................................................... 9
2.1.5. Oxidation....................................................................................................................... 9
2.2. Electrochemical Nature of Corrosion ................................................................................ 10
2.2.1. Electrochemical Reactions .......................................................................................... 10
2.2.2. Electrochemical Thermodynamics and Electrode Potential ....................................... 11
2.2.3. Electrochemical Kinetics of Corrosion ....................................................................... 12
2.2.4. Polarization ................................................................................................................. 13
2.2.5. Active –Passive Behavior of Fe3Al............................................................................. 17
2.3. Corrosion Measurement Techniques ................................................................................. 23
2.3.1. Electrochemical Methods............................................................................................ 23
2.3.2. Microstructural Analyses ............................................................................................ 31
2.3.3. Chemical Analyses...................................................................................................... 32
2.4. HVOF Thermal Spray Coatings......................................................................................... 34
2.5. Summary ............................................................................................................................ 35
CHAPTER 2 ................................................................................................................................. 37
EXPERIMENTAL .................................................................................................................... 37
3.1. Composite Coatings Fabrication ........................................................................................ 38
3.2. Preparing Samples for electrochemical tests ..................................................................... 39
3.3. Operating Parameters and Solutions .................................................................................. 40
3.3. Experimental Procedures ................................................................................................... 41
3.3.1. Open Circuit Potential Test ......................................................................................... 41
3.3.2. Potentiodynamic Polarization Studies ........................................................................ 41
3.3.3. Electrochemical Impedance Spectroscopy (EIS) ........................................................ 42
3.3.4. Energy Dispersive Spectrometry (EDS) ..................................................................... 42
3.3.5. X-ray Photoelectron Spectroscopy (XPS) .................................................................. 42
3.3.5. Cyclic Polarization in sulphuric acid solution ............................................................ 43

VI
CHAPTER 3 ................................................................................................................................. 44
RESULTS AND DISCUSSION ................................................................................................... 44
4.1. Open circuit potential ......................................................................................................... 45
4.2. Potentiodynamic polarization ............................................................................................ 46
4.3. Electrochemical impedance spectroscopy (EIS) ................................................................ 47
4.4. Possible corrosion reactions ............................................................................................... 51
4.5. SEM and EDS Analyses .................................................................................................... 52
4.6. XPS Analysis ..................................................................................................................... 53
4.7. Cyclic Polarization ............................................................................................................. 59
CONCLUSION AND OUTLOOK ............................................................................................... 61
5.1. General Conclusion ............................................................................................................ 62
5.2. Outlook .............................................................................................................................. 63
6. References ................................................................................................................................. 65
VII
List of Figures
Fig. 1. Fe-Al phase diagram. In the phase diagram, some of the solubility lines are plotted with
dashed lines because they are still not well determined. Data from reference[37] ..................... 6
Fig. 2. Atomic arrangement in a B2 or D03 super-lattice; (b) Occupation probabilities of the
lattice sites by Al in a Fe-Al system[2] ....................................................................................... 7
Fig. 3. (a)The influence of temperature and Al content on the yield stress of binary
intermetallics (a)[45] ; (b)Stress anomaly and strain rate sensitivity of Fe–39.5 at. % Al
intermetallics for a single slip system–oriented[44] ................................................................... 9
Fig. 4. The polarization of iron in acid[53] .............................................................................. 13
Fig. 5. Schematic Evans diagram for the corrosion of metal M by an acid showing the
application of mixed potential theory[55] ................................................................................. 15
Fig. 6. Schematic measured polarization curve for metal M in an acid[56] ............................. 16
Fig. 7. The active-passive behaviour of a material ................................................................... 18
Fig. 8. Potentiodynamic polarisation curves of iron aluminide, pure Al and Fe obtained in 0.25
M H2SO4 .................................................................................................................................. 19
Fig. 9. Schematic model for passivation behaviour of iron aluminide in acidic electrolyte[1].21
Fig. 10. Change of the open circuit potential versus time curves obtained for the Al–TiC
composite sintered at (1) 900, (2) 1100, and (3) 1300 °C in 3.5% NaCl solutions[65]............ 25
Fig. 11. Typical Potentiostatic Anodic Polarization Plot for Type 430 Stainless Steel in 1.0 N
H2SO4[57] ................................................................................................................................ 25
Fig. 12. Typical Cyclic polarization curve[70] ......................................................................... 27
Fig. 13. A simple metal–aqueous solution interface in which the vertical dotted lines in (a) can
match the electronic components determined by EIS studies[63] ............................................ 29
Fig. 14. Example Bode plot for the equivalent circuit of Randle’s circuit[72] ........................ 30
VIII
Fig. 15. Equivalent electrical circuit model for a simple corroding electrode (left) and related
Nyquist plot for the equivalent circuit (right)[72] .................................................................... 31
Fig. 16. XPS spectra for (a) Al and (b) Fe spectra for thermally oxidized elements at 800 °C
(dotted lines) and passivated elements in 0.25 M H2SO4 at 1 VSCE.[1] ................................ 33
Fig. 17. Schematic diagram of the high-velocity oxy-fuel spray process (HVOF)[76] ........... 34
Fig. 18. High energy ball milling apparatus ............................................................................. 38
Fig. 19. HVOF gun that applied the coating ............................................................................. 39
Fig. 20. K0235 Flat Cell used for OCP and polarization tests ................................................. 40
Fig. 21. VersaSTAT3 Potentiostat -Galvanostat workstation .................................................. 41
Fig. 22. Open circuit potential of Fe3Al, Fe3Al/TiC and Fe3Al-Cr /TiC measured for 24 hours
in freely aerated 3.5 wt.% NaCl ................................................................................................ 45
Fig. 23.The potentiodynamic polarization curves of Fe3Al, Fe3Al/TiC and Fe3Al-Cr/TiC in
freely aerated 3.5 wt% NaCl ..................................................................................................... 46
Fig. 24. Nyquist plot of Fe3Al, Fe3Al/Tic and Fe3Al-Cr/TiC composite coatings after one hour
immersion in 3.5% NaCl solution ............................................................................................. 48
Fig. 25. The proposed equivalent circuit model used to obtain impedance ............................. 49
Fig. 27. SEM micrograph and related EDS analysis of the passive layer formed on (a) Fe3Al,
Fe3Al/TiC(b) and Fe3Al-Cr/TiC (c) after potentiodynamic test exposure to 3.5% NaCl solution
................................................................................................................................................... 53
Fig. 28. XPS Spectra for Fe 2p for (a)Fe3Al (b) Fe3Al/TiC and (c)Fe3Al-Cr/TiC .................. 55
Fig. 29. XPS spectra of Al 2p (a) before polarization test and (b) passivated sample ............ 56

IX
Fig. 30. XPS spectra of Ti2p (a) Fe3Al/TiC (b) Fe3Al-Cr/TiC ................................................. 56
Fig. 31. XPS spectra of Cr 2p Fe3Al-Cr/TiC ............................................................................ 57
Fig. 32. Elemental analysis results of the surface after passivation in 3.5% NaCl solution
during potentiodynamic test ...................................................................................................... 58
Fig. 33. Cyclic polarization diagram of Fe3Al, Fe3Al/TiC and Fe3Al-Cr/TiC coating in 0.25M
sulphuric acid solution .............................................................................................................. 59

X
Acknowledgement
My deepest gratitude goes to Professor Houshang Alamdari, my supervisor, for his constant
encouragement and guidance. He accepted me as a master student while I had the responsibility of
my six-month-old, breast-feed baby with two other young kids. I would like to express my
appreciation to Professor Hendra Hermawan, my co-supervisor who guided me throughout this
project and offered me valuable suggestions.
I also wish to acknowledge Professor Edward Ghali, Dr. Fariba Safizadeh and Nabil Sorour who
have offered me valuable suggestions in the academic studies. I would also like to thank Mr. André
Ferland, Mrs. Vicky Dodier, and Mr. Alain Adnot for their professional technical participation.
The last but not the least, I am a greatly indebted to my beloved husband Saeed and two sons Parsa
and Daniel and my little girl Romina for their support.

1
INTRODUCTION
2
1.1. Background
Iron aluminides have received extensive attention among the most studied intermetallics since the
1930s. This is basically due to low density, high strength-to-weight ratios, ease of fabrication and
resistance to high-temperature oxidation and sulfurization [1, 2]. Their application is, however,
limited by their low ductility, poor creep resistance [3] and low wear resistance [4].
It has been shown that the incorporation of ceramic particles in the iron aluminide matrix improves
its tribological properties. The Fe–Al/WC composite coating is an example of improvement of
wear-resistance of Fe–Al coating [5, 6].
Titanium carbide (TiC), owing to its excellent mechanical, chemical and thermal properties, has
been known as a good reinforcing phase to improve the mechanical properties of the aluminide
matrix [7, 8]. Chen et al. [9] stated that Fe-Al intermetallics with TiC reinforcement have excellent
wear resistance. These composite coatings, fabricated by laser cladding, exhibited higher
resistance to dry sliding wear resistance. In addition to laser cladding, several other techniques,
such as plasma spraying [10-13], wire arc spraying [14] and high-velocity oxy-fuel (HVOF)
projection [15] have also been used to deposit Fe-Al alloys on carbon steels or stainless steel
substrates. HVOF is a convenient process to deposit thick coatings on a variety of substrates with
superior properties at low cost [16].
Although iron aluminides are mainly developed for applications at high temperatures, they also
exhibit good potential for low-temperature applications. These intermetallics are a good candidate
to replace stainless steel in several applications, i.e., pipes and tubes for heating elements, and
main components for distillation and desalination plants [17]. A number of studies were thus
concentrated on the aqueous corrosion behaviour of these materials to test the durability of these
alloys in corrosive environment firstly, to examine the durability of these alloys when they are
either stored ideally or during working conditions in a corrosive atmosphere. Secondly, as an
alternative to conventional stainless steels.
The corrosion behaviour of iron aluminides has been studied in several acidic and basic solution
[18-24]. Chiang et al. [18] studies show that Fe–Al alloys contain 3.4, 10.4, 18.7, 19.4, 29.5 and
41.7 at.% of Al. He showed that Fe-Al alloys with Al content exceeding 19 at. %, in 0.1 N H2SO4,
have wide passivation regions with low passivation current. In addition, when the Al content of
Fe–Al alloys exceeds this limit, the increment of Al content has a slight influence on passivation.

3
Sharma [19] compared the stability of the passive film and pitting behaviour of Fe-28Al (at. %)
and Fe-28Al-3Cr (at. %) with AISI SS 304 under different pH conditions to study their
performance in acidic, basic, and neutral solutions and revealed that the presence of 3 at. % Cr in
iron aluminides improves the aqueous corrosion resistance and makes it comparable to AISI SS
304. Calderon et al. [20] studied the corrosion behaviour of FeAl and Fe3Al intermetallic coatings
in 1.0 M NaOH solution at room temperature and compared the performance of coatings with base
alloys. Three different particle sizes were used for the coatings. The coatings were applied by two
thermal spray techniques: flame spraying and HVOF. The coatings produced by the HVOF process
were shown to be denser, more uniform and with lower porosity. Alloys and coatings with higher
aluminum content had lower Icorr values and therefore greater corrosion resistance. They also
reported the effect of feedstock particles size on the corrosion behaviour of the coatings. Coatings
applied using medium particle size, and flame spray and those prepared using fine particle size
and HVOF process were shown to be more stable [20]. Grosdidier et al. [21] investigated
microstructure and corrosion properties of nanocrystalline Fe–40Al coatings by HVOF. They also
showed that the feedstock powder size has a strong effect on the coating hardness by modifying
the amount of hard unmelted powder particles. The electrochemical response of coatings revealed
that these particles are the reason for poor corrosion resistance, compared to the bulk material.
Analysis of corrosion damage showed a prevalent localized attack at intersplat boundaries or
around un-melted powder particles, probably enhanced by galvanic phenomena. A mechanistic
model was proposed by Rao [23] according to his investigation on repassivation of iron aluminide
comparing to pure Al and Fe using a rapid scratched electrode technique in 0.25 M H2SO4. Few
works investigated the corrosion behaviour of intermetallic matrix composites.
Amiriyan et al. [25] reported that the Vickers hardness and the dry sliding wear rates of Fe3Al/TiC
composite coatings at sliding speeds, ranging from 0.04 to 0.8 m s-1, and under a constant load of
5 N. Wear resistance was reported to increase by increasing the TiC particles in the Fe3Al matrix.
He also compared the phase composition, microstructure, microhardness and elastic modulus of
unreinforced Fe3Al and Fe3Al/TiC composite coatings[26]however the authors did not report the
corrosion behaviour of these coatings.

4
Alloying elements in the form of a solid solution can also improve the mechanical or
electrochemical properties of Fe-Al intermetallics [27-31]. Addition of 6 at.% chromium improves
the ductility of Fe3Al up to 10 % [32]. A few mechanisms were proposed to explain the effect of
chromium on mechanical and corrosion properties of Fe3Al. First, it has been postulated that Cr in
solid solution facilitates the dislocation cross-slipping and solid solution softening[33, 34].
Epelboin et al. [35]also showed that Cr affects the surface properties through the contribution of
chromium oxides to the formation of passive layers and the decrement of reaction kinetics. The
decrease of water reduction reaction rate, may also lead to the reduction of hydrogen evolution
and thus mitigating the hydrogen embrittlement [36].
1.2. Objective
The aim of this project can be divided into the following objectives:
1. Study the corrosion behavior of two Fe3Al intermetallic matrix composite coatings that
prepared by high velocity oxy fuel (HVOF) technique, in 3.5 wt.% NaCl solution and
compared with non-reinforced Fe3Al.
2. Evaluate the effect of adding chromium as an alloying element on passivity of Fe3Al/TiC
composite in 3.5% NaCl solution
3. Investigation of pitting tendency and passivity of Fe3Al/TiC and Fe3Al-Cr/TiC after
passivation and compare the
Electrochemical techniques, including potentiodynamic polarization, open circuit potential and
electrochemical impedance spectroscopy (EIS) are considered to examine corrosion behavior of
Fe3Al, Fe3Al/TiC and Fe3Al-Cr/TiC coatings. Post-corrosion analysis such as scanning electron
microscopy (SEM) and x-ray photoelectron spectroscopy (XPS) are employed to characterize the
passive layer which formed during polarization.

5
CHAPTER 1
LITERATURE REVIEW

6
2.1. Introduction to Mechanical Properties of Fe3Al
2.1.1 Phase Diagram
The phase diagrams of binary iron aluminides were studied using several techniques, such as
dilatometric measurement, electrical resistivity and specific heat measurement, measurement of
elastic modulus and magnetic properties, X-ray diffraction methods and, more recently, the phase
diagram was intensively studied with TEM [2].
Fig. 1 shows the phase diagrams for binary iron aluminides. At high temperatures, there is a solid
solution of Al in Fe from 0 up to 45 at. % Al. This region at low temperatures is divided into three
parts. The first part consists of disordered alloys up to 18.75 at. % Al at room temperature. At
about 25 at. % Al and temperatures below 545 °C, the intermetallic phase Fe3Al is formed. At
higher Al contents the next phase is FeAl. Both Fe3Al (D03) and FeAl (B2) phases are ordered
forms on the body-centred cubic (bcc) lattice and are separated from the disordered A2 phase by
first- or second-order transitions.
Fig. 1. Fe-Al phase diagram. In the phase diagram, some of the solubility lines are plotted with dashed lines because
they are still not well determined. Data from reference [37]
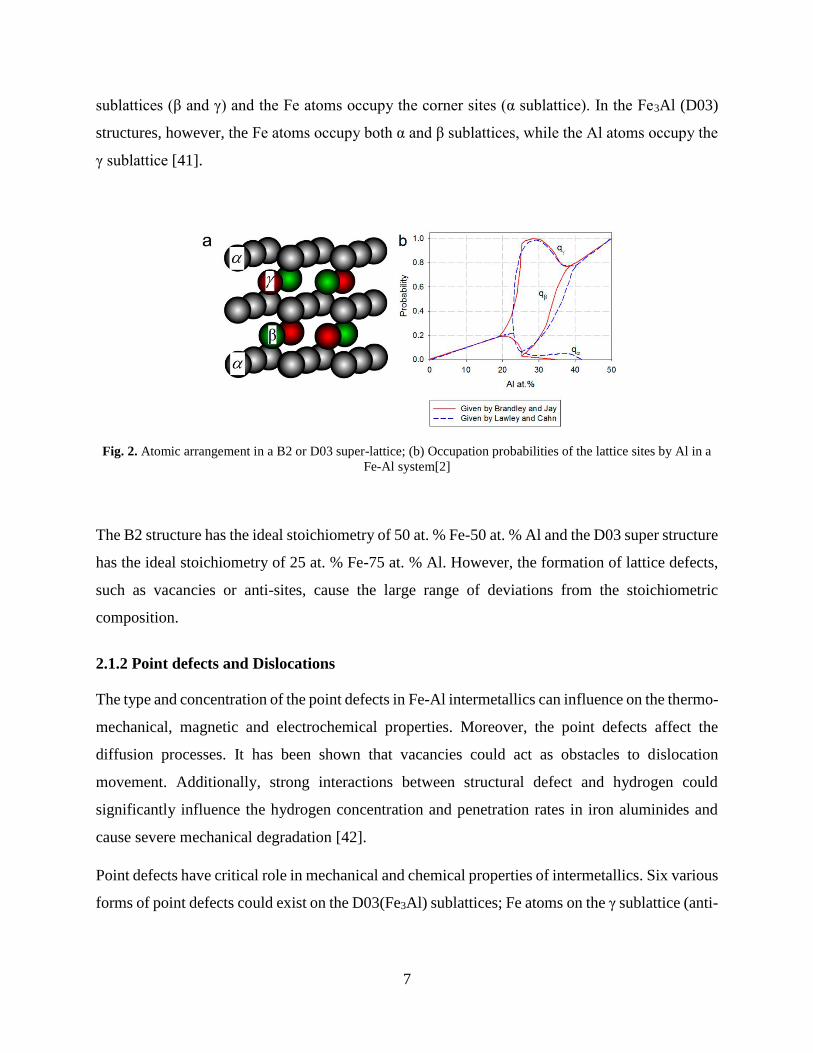
The distribution of iron and aluminum atoms in the crystal lattice of FeAl (B2) and Fe3Al (D03)
phases have been studied by the X-ray diffraction method [38-40]. As presented in Fig. 2, in the
FeAl (B2) crystal lattice, in the stoichiometric composition, Al atoms occupy the body center
7
sublattices (β and γ) and the Fe atoms occupy the corner sites (α sublattice). In the Fe3Al (D03)
structures, however, the Fe atoms occupy both α and β sublattices, while the Al atoms occupy the
γ sublattice [41].
Fig. 2. Atomic arrangement in a B2 or D03 super-lattice; (b) Occupation probabilities of the lattice sites by Al in a
Fe-Al system[2]
The B2 structure has the ideal stoichiometry of 50 at. % Fe-50 at. % Al and the D03 super structure
has the ideal stoichiometry of 25 at. % Fe-75 at. % Al. However, the formation of lattice defects,
such as vacancies or anti-sites, cause the large range of deviations from the stoichiometric
composition.
2.1.2 Point defects and Dislocations
The type and concentration of the point defects in Fe-Al intermetallics can influence on the thermo-
mechanical, magnetic and electrochemical properties. Moreover, the point defects affect the
diffusion processes. It has been shown that vacancies could act as obstacles to dislocation
movement. Additionally, strong interactions between structural defect and hydrogen could
significantly influence the hydrogen concentration and penetration rates in iron aluminides and
cause severe mechanical degradation [42].
Point defects have critical role in mechanical and chemical properties of intermetallics. Six various
forms of point defects could exist on the D03(Fe3Al) sublattices; Fe atoms on the γ sublattice (anti-

8
site Fe atoms), Al atoms on the α or β sublattices (anti-site Al atoms) and vacancies on the α , β
and γ sublattices.
These defects let diffusion occur exclusively by nearest neighbor vacancy jumps, though diffusion
occurs mostly via nearest neighbor jumps into vacant sites.
Slip direction in Fe3Al in low temperature is <111>. The difference between the active slip
directions have significant influence on the ductility of intermetallics. Since the number of slip
systems in the Fe-Al intermetallics is more than the required five independent slip systems, iron
aluminides are intrinsically ductile. In Fe3Al with D03 structure, a super lattice dislocation with a
burgers vector of <111> is known to be dissociated into four super-partial dislocations, bound by
two types of anti-phase boundaries (APBs) [43].
2.1.3 Mechanical Properties
One of the significant mechanical property of iron aluminides is their unusual increase in yield
strength with increasing temperature up to 900 K[44] which is the basic reason to use them in high
temperature conditions. It has been shown that Young’s modulus of Fe-Al intermetallics with D03
super structure is minimum at room temperature. As it has been shown in Fig. 3, the Young’s
modulus increases with the enhancement of the Al content in each super lattice [45]. It shows the
effect of aluminum on the strengthening of the interatomic bonds. Interestingly, the Young’s
modulus of aluminides with high Al content decreases significantly with the increase of
temperature (about 40%).

9
Fig. 3. (a)The influence of temperature and Al content on the yield stress of binary intermetallics (a)[45] ; (b)Stress
anomaly and strain rate sensitivity of Fe–39.5 at. % Al intermetallics for a single slip system–oriented [44]
2.1.4 Alloying Elements
Several alloying elements add to the binary Fe-Al intermetallics to improve the mechanical,
thermal or electrochemical properties. Some metallic elements such as Si, V, Cr, Mn, Co, Ni, Cu
and Zn have great solid solubility and others such as Zr, Nb and Ta have restricted solid solubility
in Fe-Al intermetallics. The β sublattice sites are preferred by Ti, W, V, Cr, Mo and Zr in a Fe3Al
super-structure[46].Cr is one of the most important alloying elements, and its input on various
thermo-mechanical and electrochemical properties has already been studied extensively [1, 36, 47-
49].
Palm studied an isothermal section for the Fe-Al-Cr system at 1000 °C [50]. He did not find any
ternary intermetallic phases. It means the binary phases (Fe-Al) can dissolve considerable amounts
of the third component (Cr) and the substitution does not make any changes in the crystallographic
structure. The influence of Cr on ordering kinetics and dislocation configurations is not very
significant [51].
2.1.5. Oxidation
In Iron aluminides oxidation, the formation of aluminum oxide is thermodynamically more
possible than iron oxide since oxygen has a higher affinity to Al compared to Fe (the standard
Gibbs energy of formation of α-Al2O3 is -1,582,260 J/mol which is almost 6.5 times higher
10
compared to FeO). However, the experimental results performed on binary poly-crystals (with15
and 40 at.% Al), oxidized at temperatures around 727 °C in synthetic air, show the existence of a
thin Fe2O3, containing outer layer followed by an inner, nearly pure Al2O3 layer [2].
2.2. Electrochemical Nature of Corrosion
Corrosion of materials is the deterioration of a metal as a result of chemical reactions with its
environment or flow of electricity during an electrochemical reaction in an aggressive medium
[52].
In order to achieve a better understanding of the electrochemical nature of corrosion and the
behaviour of metal in a corrosive environment, it is necessary to discuss the electrochemical
aspects of the electrochemical reactions.
2.2.1. Electrochemical Reactions
Electrochemical reactions in the corrosion process consist of two half-cell reactions; the oxidation
reaction, (equation 1), which takes place at the anodic sites and the reduction reaction, which
occurs at the cathodic sites (equation 2). The oxidation and reduction could occur at separate
locations on the metal. Alternatively, the location of anodes and cathodes can fluctuate randomly
across the sample surface. The former case results in a localized form of corrosion, such as pitting,
crevice corrosion, intergranular corrosion, or galvanic corrosion, and the latter case results in
nominally uniform corrosion.
If a metal, M, for example with a valence number of +2, undergoes a corrosion process, the half-
cell reactions can be written as:
M → M2+ + 2𝑒− (1)
The cathodic corrosion reactions in aqueous media could be one of two primary cathodic reactions.
The hydrogen evolution reaction in acidic media :
2H++ 2𝑒− → H2 (2)
And in neutral or basic solutions:

11
2H2O + 2e → H2(g) + 2OH− (3)
Each of the half reactions (1) and (2) or (3) will be in equilibrium at a specific potential called the
reversible potential, Erev. When all reactants and products are in their standard states with the
activity of unity, the potential reaches a special value of reversible potential called the standard
potential, E0. The electromotive force series is a list of half reactions that have been ordered by
their standard potentials and indicates the tendency of one metal or ion to reduce the ions of any
other metal below it in the series.
During corrosion process, the electrons liberated by anodic reaction are consumed in the cathodic
process. A corroding metal does not accumulate any charge. It, therefore, means that these two
partial reactions of oxidation and reduction must proceed simultaneously and at the same rate to
maintain this electroneutrality[53]. The rates of the anodic and cathodic reactions must be
equivalent according to Faraday’s Laws. The total flow of electrons from anodes to cathodes which
is called the “corrosion current,” Icorr. Since the corrosion current must also flow through the
electrolyte by ionic conduction, the conductivity of the electrolyte will influence the current. The
anodic reaction usually is a metal dissolution, and the cathodic reaction is reduction of hydrogen
ions.
2.2.2. Electrochemical Thermodynamics and Electrode Potential
The driving force for a fellow of electron between cathode and anode is a negative free energy
change (ΔG). For electrochemical reactions, the free energy change is calculated from:
∆G = -n FE (4)
Where n is the number of electrons, F is Faraday’s constant, and Ε is the cell potential. Therefore,
for a given reaction to take place, the cell potential is taken as the difference between the two half-
cell reactions. The reason for the existence of such potential differences is the difference in the
tendency of the anode and cathode towards continuing the reaction.
Another thermodynamic factor, which has a significant effect on corrosion reactions, is the factor
of concentration. The equilibrium conditions require the same level of chemical activity for the

12
products and reactants. The change in energy activity due to a change in concentration of reactants
and products can be then calculated using equation 4, which is also known as the Nernst equation:
Δ𝐺−Δ𝐺°= 𝑅𝑇ln 𝑎𝑐𝑡𝑖𝑣𝑖𝑡𝑖𝑒𝑠 𝑜𝑓 𝑝𝑟𝑜𝑑𝑢𝑐𝑡𝑠
𝑎𝑐𝑡𝑖𝑣𝑖𝑡𝑖𝑒𝑠 𝑜𝑓 𝑟𝑒𝑎𝑐𝑡𝑎𝑛𝑡𝑠 (5)
Where Δ𝐺 is the Gibbs energy, Δ𝐺° is the Gibbs energy at stthe andard condition, R is the gas
constant, T is absolute temperature. Now by simplifying Equation 4 and Equation 5 the cell
potential can be calculated (Equation 6):
𝐸=𝐸°- 𝑅𝑇𝑛𝐹 (6)
Where E is the cell potential, E° is the electromotive force in standard conditions, while activities
are the effective concentrations of the reactants and products that is calculated via the following
formula:
a = γ. c (7)
Where c is the real concentration and γ is the activity coefficient. The activity coefficient of solids,
electrons, and of species whose concentration does not change, e.g., solvents such as water, is
equal to 1. For gases, partial pressure values are used in the place of activity coefficients, and the
RT/nF is then converted to 0.0592 L.atm/mol.K at standard conditions. The direction of the
reaction can be determined by the conventional assumption that the more negative cell potential
always precedes through oxidation and the more positive half-cell will go through reduction [36].
2.2.3. Electrochemical Kinetics of Corrosion
The driving force of an electrochemical process is the potential difference between the cathode
and anode. Although, the potential of cathode and anode potentials are equalized when both
electrodes are connected and a current passe through the cell, resulting in the same potential of Ec
and Ea at Ecorr, which is a steady-state potential, where anodic current density is equal to cathodic
current density, leading to the same anodic and cathodic reaction rates. That steady-state potential
(Ecorr) is called corrosion potential, and the corresponding current is called the corrosion current
(icorr).

13
2.2.4. Polarization
Despite equilibrium potential providing useful information about how the corrosion reaction is
progressing, it cannot provide any data about reaction rate and kinetics. To measure the corrosion
rate, usually an external current is applied, and the change in the electrode potential is measured.
Polarization is the change in electrode potential due to this externally applied current, and the
polarization value is the difference between the equilibrium potential and the potential measured
under the externally applied current.
ε𝑎= 𝐸 −𝐸𝑐𝑜𝑟𝑟 (8)
Fig. 4. The polarization of iron in acid[53]
Information about polarization effects gives an idea about which reactions take place at the
electrodes. There are several types of polarization.
Activation Polarization: Activation polarization occurs because of a slow step in the electrode
reaction. In such reactions, the activation energy in the form of an increase in potential is required
for the reaction to proceed. This is best illustrated by the hydrogen evolution reaction. The
hydrogen evolution reaction consists of several steps; the formation of hydrogen molecules is
assumed the slowest step in the reaction sequence, and the rate of overall reaction will depend on
14
how fast or slow it proceeds. Therefore, to have a higher rate of reaction, expressed in terms of
increased current density, an increase in potential should be applied [54].
Concentration Polarization: Concentration polarization occurs due to the concentration changes
around the electrode with time. When current passes through the corrosion cell, some ions are
consumed, and their concentrations are reduced, leading to an increase in the electrode potential.
Consumed ions must be replaced with new ions from the electrolyte, but this process is limited
with diffusion rate. Some factors such as increasing velocity, increasing temperature, and
increasing concentrations will decrease the concentration polarization.
Ohmic Polarization: Ohmic polarization is due to the resistance in the circuit, which is also called
IR ohmic overpotential reduction. Ohmic polarization is directly proportional to the current
intensity between the anodic and cathodic sites of a corrosion process. If the current is stopped,
then a reduction in the potential amount of IR also disappears simultaneously, while other
polarization effects decrease slowly [37]. For many corrosion situations, these sites are adjacent to
each other, and the ohmic drop is negligible.
2.2.4.1. Polarization Curves
Any electrode immersed in an environment will naturally have a potential, called the corrosion
potential. At the corrosion potential the sum of all of the oxidation currents must equal the sum of
all of the reduction currents:
∑ Ic + ∑ Ia = 0 (9)
Note that reduction currents (Ic) are negative. The corrosion potential is also called the open-circuit
potential, free potential, or rest potential. The corrosion potential is a mixed potential indicating
that its value depends on the rate of the anodic as well as the cathodic reactions. Furthermore, if
the corrosion cell includes one anodic reaction and one cathodic reaction, the corrosion potential
will be between the reversible potentials of the two half reactions [55].
15
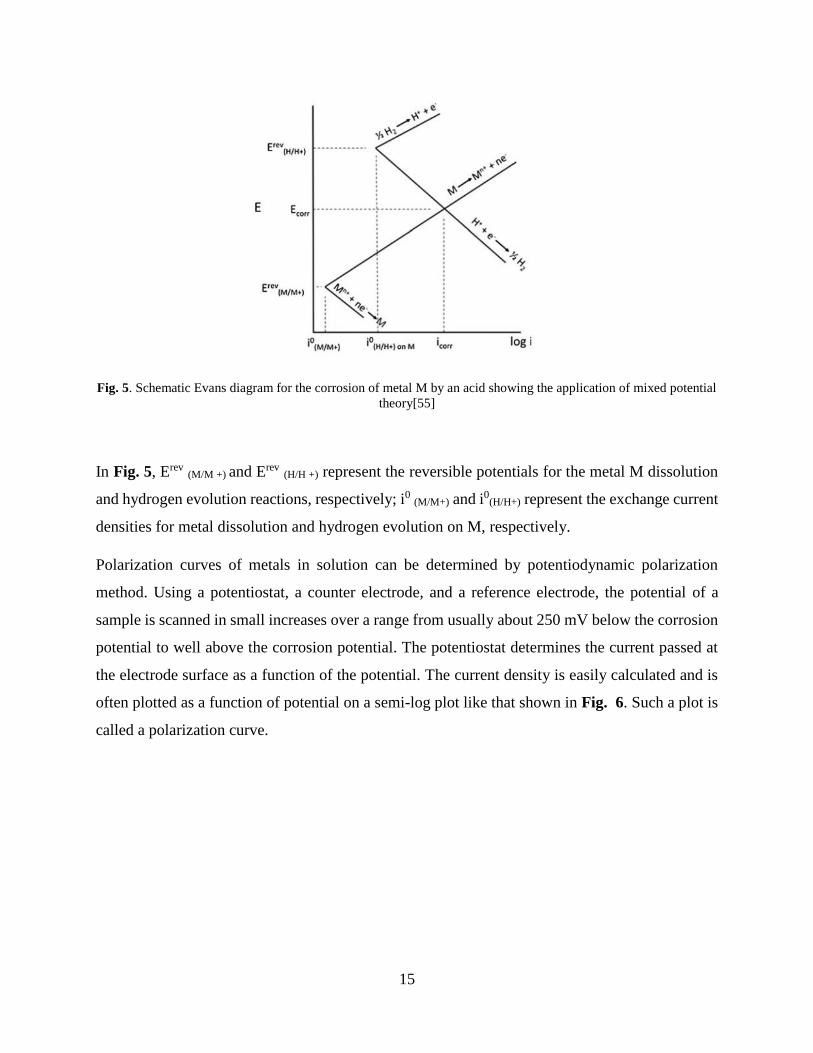
Fig. 5. Schematic Evans diagram for the corrosion of metal M by an acid showing the application of mixed potential
theory[55]
In Fig. 5, Erev (M/M +) and Erev (H/H +) represent the reversible potentials for the metal M dissolution
and hydrogen evolution reactions, respectively; i0 (M/M+) and i0(H/H+) represent the exchange current
densities for metal dissolution and hydrogen evolution on M, respectively.
Polarization curves of metals in solution can be determined by potentiodynamic polarization
method. Using a potentiostat, a counter electrode, and a reference electrode, the potential of a
sample is scanned in small increases over a range from usually about 250 mV below the corrosion
potential to well above the corrosion potential. The potentiostat determines the current passed at
the electrode surface as a function of the potential. The current density is easily calculated and is
often plotted as a function of potential on a semi-log plot like that shown in Fig. 6. Such a plot is
called a polarization curve.
16
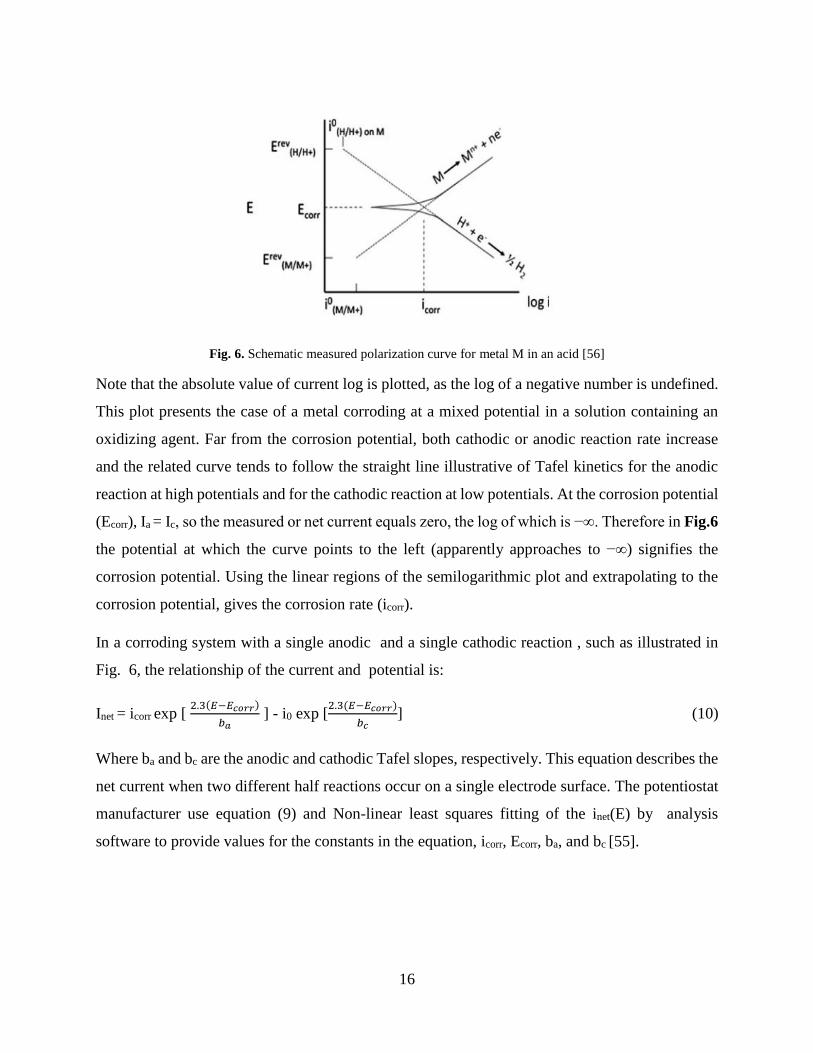
Fig. 6. Schematic measured polarization curve for metal M in an acid [56]
Note that the absolute value of current log is plotted, as the log of a negative number is undefined.
This plot presents the case of a metal corroding at a mixed potential in a solution containing an
oxidizing agent. Far from the corrosion potential, both cathodic or anodic reaction rate increase
and the related curve tends to follow the straight line illustrative of Tafel kinetics for the anodic
reaction at high potentials and for the cathodic reaction at low potentials. At the corrosion potential
(Ecorr), Ia = Ic, so the measured or net current equals zero, the log of which is −∞. Therefore in Fig.6
the potential at which the curve points to the left (apparently approaches to −∞) signifies the
corrosion potential. Using the linear regions of the semilogarithmic plot and extrapolating to the
corrosion potential, gives the corrosion rate (icorr).
In a corroding system with a single anodic and a single cathodic reaction , such as illustrated in
Fig. 6, the relationship of the current and potential is:
Inet = icorr exp [ 2.3(𝐸−𝐸𝑐𝑜𝑟𝑟)
𝑏𝑎 ] - i0 exp [
2.3(𝐸−𝐸𝑐𝑜𝑟𝑟)
𝑏𝑐] (10)
Where ba and bc are the anodic and cathodic Tafel slopes, respectively. This equation describes the
net current when two different half reactions occur on a single electrode surface. The potentiostat
manufacturer use equation (9) and Non-linear least squares fitting of the inet(E) by analysis
software to provide values for the constants in the equation, icorr, Ecorr, ba, and bc [55].

17
2.2.4.2. Polarization Resistance
Polarization resistance (sometimes referred to as linear polarization resistance, LPR), is an
electrochemical test method that measures the resistance of the specimen to oxidation in a
corrosive environment while an external potential is applied to the system. Polarization resistance
(R), can then be monitored, and directly related to the rate of corrosion [57].
In order to perform an experiment for monitoring the polarization resistance, an electrode needs to
be polarized within the range 10 to 30 mV, relative to the corrosion potential at steady state, to
ensure that active corrosion is occurring during the measurements. Then the polarization resistance
can be specified by determining the slope of the linear region of the resulting curve at the corrosion
potential. The relationship between change in potential and resulting polarization current RP is
given by equation 10:
ΔE
Δi = Rp =
𝛽𝑎𝛽𝑐
2.3(𝑖𝑐𝑜𝑟𝑟)(β𝑎+β𝑐) (11)
where i is the current density, icorr is the corrosion current density, E is the applied voltage, and βa
and βc are the anodic and cathodic Tafel slopes, respectively. It should be noted that equation 10
can be derived to calculate the icorr. Once the corrosion current is known, the rate of corrosion can
be determined from Equation 11:
𝑐𝑜𝑟𝑟𝑜𝑠𝑖𝑜𝑛 𝑟𝑎𝑡𝑒 (𝑀𝑃𝑌) = 0.13( 𝑖𝑐𝑜𝑟𝑟)𝐸𝑊
𝐴.𝑑 (12)
Where EW is the equivalent weight in g, A is the exposed area in cm2, d is the density of the
specific test subject, and 0.13 is the metric time conversion factor. The rate of corrosion is
measured in units of millimetre per year.
2.2.5. Active –Passive Behavior of Fe3Al
Metals such as chromium, nickel, titanium, aluminum, magnesium, and iron that are above
hydrogen in the electrochemical series, do not corrode in specific solution due to the oxide layers
formed on their surfaces, resulting in passivity as observed in potential-pH diagrams. These metals
automatically get passivated without the application of any external current under appropriate
conditions. Auto-passivation occurs when the corrosion current (icorr) is higher than the current
needed to passivate the metal. Definition of passivity has been provided by the NACE/ASTM

18
Committee J01, Joint Committee on Corrosion “passive—the state of a metal surface characterized
by low corrosion rates in a potential region that is strongly oxidizing for the metal”.
Fig. 7. The active-passive behaviour of a material
Active-passive behaviour is schematically represented by the anodic polarization curve in Fig.7.
That describes the kinetics of passivity in a general way. Starting from lower potential, the curve
starts out with a gradually increasing current as expected. However, at a critical point A (Ecrit) there
is a dramatic polarizing effect that drops the current to a point where corrosion is almost stopped
(Ep). As this potential is increased further, there is little change in current flow until the next critical
stage B; the current density starts to increase, resulting in either the initiation of pitting or entry
into the transpassive region and the current again begins to rise [56].
Corrosion happens more rapidly in the active region and current increases with more positive
applied potential. At point A, the corrosion rate increasing stops and the passivation begins. The
potential at this point called passivation potential, Epp and the corresponding value of current
density referred as the critical current density. In the passive region, as the passivating film forms
on the specimen, the current decrease rapidly. A small secondary pick in that small change in
current is observed by increasing potential that determine the breaking of the passive film in
transpassive region in which corrosion rate increases (point B).

19
Shankar Rao[1] in his review of the electrochemical corrosion behaviour of iron aluminides
stated the aqueous corrosion behaviour of iron aluminides in both acidic and basic solution.
Considering both Al and Fe polarization curve with Fe3Al in 0.25M sulphuric acid (Fig. 8), the
combined effect of Fe and Al has an advantage for iron aluminide over a wide potential range. At
low potential, close to the corrosion potential of the aluminide, the spontaneous passivation
tendency of Al helps to reduce active dissolution of iron aluminide by the formation of an Al2O3
film, while at the higher potential the presence of iron oxide makes an additional resistance to the
passage of current with Al2O3. Therefore, the current density of iron aluminide in the passive
region is lower than that of pure iron. In addition, the anodic critical current density (icrit ~ 20 mA
cm-2) of aluminide is more than its limiting current density for oxygen reduction (0.1 mA cm-2 ),
which makes the aluminide difficult to self-passivate in aerated conditions. The polarization curve
of iron aluminide in the transpassive region seems to be similar to that of pure iron, and its
transpassive potential is well above the equilibrium potential for oxygen evolution (0.96 VSCE for
a measured pH of 0.6 and assuming the partial pressure of O2 as 1 atm.).
2.2.5.1. Structure and chemistry of the passive film
Several studies were directed on passive film structure of iron aluminides with different Al
contents in the alloy, different electrolytes, concentration and pH, and different formation
Fig. 8. Potentiodynamic polarisation curves of iron aluminide, pure Al and Fe
obtained in 0.25 M H2SO4

20
potentials [58-61]. Despite these variations among these studies they have some aspects in
common that are as follow:
• An enrichment of Al in the form of Al (III) oxide/hydroxide on the surface during
passivation. This enrichment is even more than the Al bulk concentration of the
alloy.
• Al content in the passive film increases with increasing Al content in the alloy.
• Co-existence of iron and aluminum oxides on the surface during passivation
• Addition of alloying elements such as Cr and Mo facilitate the formation of their
respective oxides (Cr2O3 and MoO3) in the passive film along with Al2O3.
Investigation of the passive layer by XPS spectra [58] illustrates that the outer part of the passive
film mainly consists of mixed Al–Fe oxy-hydroxide whereas the inner part is of mostly an Al-rich
oxide phase. In another study, elastic-ion scattering and XPS depth profiling [59] shows maximum
enrichment of Al(III) within the centre of the passive film . The primarily formed Al(III)-rich film
contains a large amount of hydroxide. However, during longer passivation time and at more
positive potential the layer composition changes into a mixed oxide/hydroxide film with a larger
amount of additionally formed iron oxide.
To get an idea about the mechanism behind the passivation behaviour of iron aluminides we take
a look at the chemical reactions which take place after its immersion in the electrolyte. Fig. 9
presents a schematic model for the passivation behaviour of iron aluminide. During the active
dissolution of the alloy, whether it is FeAl or Fe3Al, Iron atoms dissolve, and Fe ions enter to the
solution. thermodynamically, Al2O3 has more negative free energy compared to iron oxide[59]
and kinetically, the mobility of Al3+ is also low compared with iron ions within the barrier film[58].
Therefore, after active dissolution from iron aluminide, aluminum quickly converts into Al2O3 on
the surface, whereas iron ions remain in the solution.
21
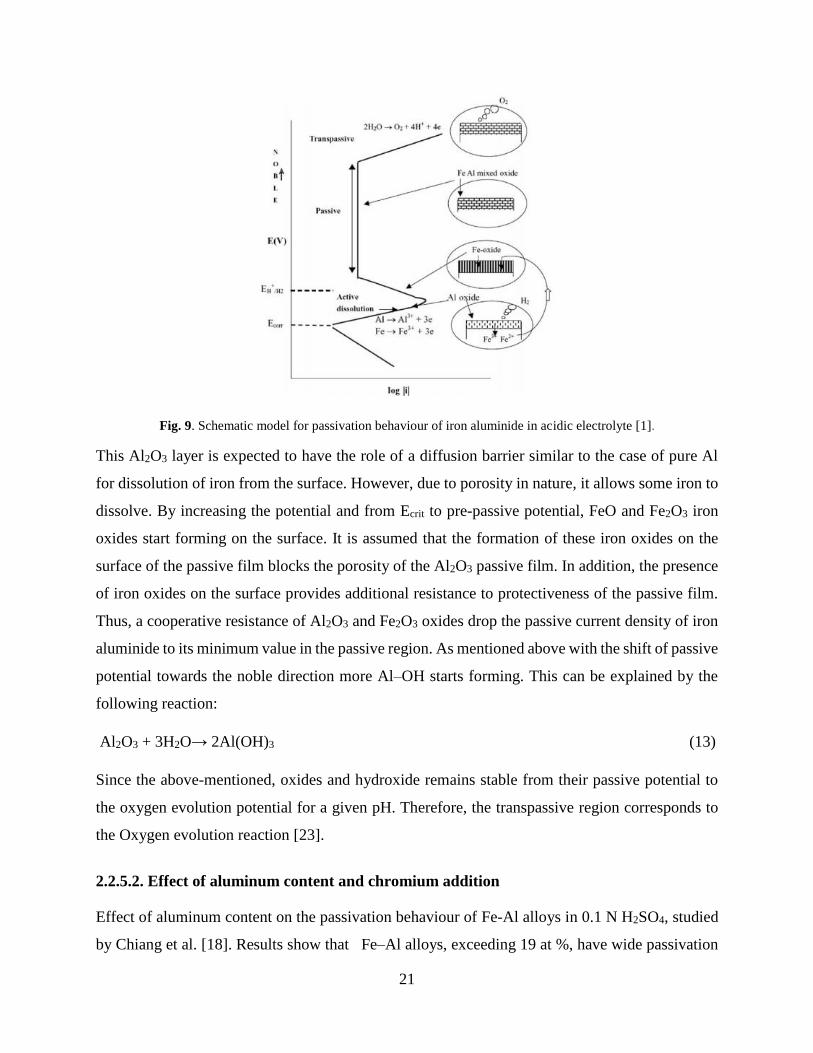
Fig. 9. Schematic model for passivation behaviour of iron aluminide in acidic electrolyte [1].
This Al2O3 layer is expected to have the role of a diffusion barrier similar to the case of pure Al
for dissolution of iron from the surface. However, due to porosity in nature, it allows some iron to
dissolve. By increasing the potential and from Ecrit to pre-passive potential, FeO and Fe2O3 iron
oxides start forming on the surface. It is assumed that the formation of these iron oxides on the
surface of the passive film blocks the porosity of the Al2O3 passive film. In addition, the presence
of iron oxides on the surface provides additional resistance to protectiveness of the passive film.
Thus, a cooperative resistance of Al2O3 and Fe2O3 oxides drop the passive current density of iron
aluminide to its minimum value in the passive region. As mentioned above with the shift of passive
potential towards the noble direction more Al–OH starts forming. This can be explained by the
following reaction:
Al2O3 + 3H2O→ 2Al(OH)3 (13)
Since the above-mentioned, oxides and hydroxide remains stable from their passive potential to
the oxygen evolution potential for a given pH. Therefore, the transpassive region corresponds to
the Oxygen evolution reaction [23].
2.2.5.2. Effect of aluminum content and chromium addition
Effect of aluminum content on the passivation behaviour of Fe-Al alloys in 0.1 N H2SO4, studied
by Chiang et al. [18]. Results show that Fe–Al alloys, exceeding 19 at %, have wide passivation

22
regions with low passivation current. In addition, when the Al content exceeds this range, the
increment of Al content has a slight influence on passivation. In that work, the influence of Cr on
passivation behaviour of alloys demonstrate that Fe-20Al-5Cr and Fe-30Al-5Cr have more stable
passive film than those without Cr. These alloys, are likely to form a relatively more stable passive
film with slight lower passivation current density at higher anodic potential. Consequently, the
passivation behaviour of these alloys can be improved with Cr addition. Al tends to form a porous
oxide film (separate oxide phase) in H2SO4 and Cr has the role of a strong oxide film-forming
element by giving Fe–Al alloys, additional resistance to the passage of metal ions through Al oxide
film. Therefore, it improves the passivation behavior by the formation of a film, composed of
Cr(OH)3 and Cr2O3 in alloys with higher Cr content [18].
In other work, Frangini et al. [62] conducted some experiments to determine the role of Cr in the
passive film by incorporation from the solution rather than from the alloy. For this, Cr ions were
incorporated into the passive film of FeAl from alkaline chromate solution through repetitive
oxidation–reduction cycles and its corrosion behaviour was compared with Fe–(12–24)% Cr
stainless steels in 0.5 M NaCl containing borate solutions. Their results revealed that the pitting
potential of this alloy after treatment is comparable to those of stainless steels despite the fact that
the Cr enrichment in the passive film of FeAl was not as high as in the passive film of the compared
stainless steel.
Recently, Zamanzadeh and Barnoosh[48] made a detailed investigation on the electrochemical
properties of Fe3Al in a range of Cr concentration (0, 0.5, 4.0 and 5.0) while Al concentrations
remained constant at the 26 at.% to gain a detailed understanding of effect of Cr on the electronic
behaviour, thickness and effective capacitance of the passive layer. They revealed that Cr as an
alloying element provides more resistance to pitting corrosion for passive film and decreases the
average density of pits. However, addition of 5 at.% Cr to the binary Fe3Al intermetallics does not
prevent the pitting and crevice corrosion of alloys completely. They also stated that Cr3+ would
substitute at the Al3+ site in the passive film because the Cr3+ size is 63 pm, slightly bigger than
the size of the Al3+ ion (51 pm). During the formation of the passive film, Cr3+ diffuses into the
solution/oxide interface. It can segregate at crystal imperfections sites cause of high energy defects
and prevent chloride ions entering. Therefore, the entry sites may be blocked by the alloying

23
oxides. The saturation of the oxide/electrolyte could be seen by the changes of the flat-band
potentials where no space charge arises in the passive layer [48].
2.3. Corrosion Measurement Techniques
The main purposes of corrosion testing, are generally evaluation and selection of materials for a
specific application, evaluation and design of new alloys, determination of the aggressiveness of a
medium, provide reference or database information; and study of the corrosion kinetics and
mechanisms [63].
Corrosion laboratory tests can be defined into three categories [64]:
- Wetting of the surface by condensing media in a humid atmosphere (simulated atmosphere
test)
- Spraying of aggressive medium (salt spray test)
- Immersion into corrosive liquid (immersion test)
- Electrochemical test
2.3.1. Electrochemical Methods
Electrochemical techniques are employed to identify the corrosion behaviour of many materials
for many years. Since corrosion consists of electrochemical oxidation and reduction reactions,
electrochemical measurements can provide valuable information relating to the factors that are
needed to characterize the corrosion mechanism and rate.
The reactions that occur during a corrosion process create the corrosion potential. This potential
should be measured regarding a reference such as a saturated calomel electrode (SCE). The
potential difference between test specimen and the reference electrode is reported. The value of
the potential (E) and current (I) or current density(i) can be specified by performing an
electrochemical test.
Corrosion-related mechanisms, such as passivation and pitting, are slow processes and could be
studied by applying ‘accelerating’ external potentials to the system. The curves of the applied

24
potential versus the specific current densities can be plotted for further quantitative interpretation
and calculations.
The most frequently measurements are
1. Steady state corrosion potential (Ecorr)
2. Variation of Ecorr with time
3. E- i correlation during polarization at constant current density(galvanostatic) and variable
potential
4. E-i correlation during polarization at constant current potential(potentiostatic) and variable
current
5. Electrochemical impedance under alternating potential conditions as a function of
frequency
6. Electrochemical noise: fluctuations of the free potential or fluctuations of the current when
a constant potential is maintained [64].
Frequently used electrochemical techniques in corrosion testing that can aid in identifying the
corrosion processes of composite materials are open circuit potential, potentiodynamic
polarization, cyclic polarization, and electrochemical impedance spectroscopy.
2.3.1.1. Open circuit Potential
Open circuit potential (OCP) can be considered as the simplest technique among the others. When
it is employed in short-term (one hour or less), it usually is followed by the other methods.
Furthermore, when it performed in long-term (one day or more), it can be considered as an
individual test method to determine the electrochemical equilibrium of an electrochemical system
by the time. The potential difference between the working and reference electrode is measured
until a steady state is achieved. This final value is known as the corrosion potential (Ecorr).
The variation of OCP of metallic materials as a function of time gives valuable information about
film formation and passivation. A rise of potential in the positive direction indicates the formation
of a passive film, a steady potential indicates the presence of an intact and protective film, and a
drop of potential in the negative direction indicates breakage or dissolution of the film, or no film

25
formation[65]. Fig. 10 is an example of OCP curves that is obtained from Al–TiC composites
sintered at different temperatures in 3.5%NaCl solution for 1 h [66].
Fig. 10. Change of the open circuit potential versus time curves obtained for the Al–TiC composite sintered at (1)
900, (2) 1100, and (3) 1300 °C in 3.5% NaCl solution [65]
2.3.1.2. Potentiodynamic Polarization
Potentiodynamic polarization test illustrates the polarization characteristics of active material in
the corrosive environment by plotting the current response as a function of the electrode potential.
In this technique, potential scans from negative to positive and the resultant net current is
measured. A complete current–potential profile can be plotted in a matter of a few minutes to a
few hours, depending on the voltage scan rate. After a specific duration that the specimen
Fig. 11. Typical Potentiostatic Anodic Polarization Plot for Type 430 Stainless
Steel in 1.0 N H2SO4[57]

26
immersed in corrosive liquid, it reaches a steady state condition and potential approaches to Ecorr.
The external voltage source used to force it to a potential slightly more positive than Ecorr, the
cathodic current becomes negligible with respect to the anodic component, and cathodic reaction
occurs on the counter electrode surface. By increasing the potential, the polarization characteristics
of a sample in special solution can be identified.
Important information, such as the ability of the material towards immediate passivation in a
particular medium, and the specific potential at which this occurs, can be obtained from the
potentiodynamic polarization curve. Such plots are also extensively used to predict the rate of
corrosion in the passive region. Fig. 11 is an example of potentiodynamic anodic polarization
curve for 430 stainless steel [67].
2.3.1.3. Cyclic Polarization
Cyclic polarization is a type of the potentiodynamic polarization technique which is performed in
a cyclic manner. Cyclic polarization is widely used to determine the tendency of specific materials
towards pitting corrosion. It provides information on both corrosion characteristics and corrosion
mechanisms.
The potential is scanned in a single cycle, and the size and direction of the hysteresis are examined
to investigating pitting occurrence. The existence of the hysteresis is usually revealing of pitting,
while the size of the loop is often related to the amount of pitting.
In the cyclic polarization test, first, the OCP is scanned, and the test starts at the corrosion potential.
The potential then is increased in a positive direction up to the point a specific current density is
reached (set by the user). Once the maximum current density is reached, the experiment is
programmed to change the potential in the opposite direction [68].
The reversed potential traces a hysteresis loop, which may close at the protection or passivation
potential. If the passivation and the corrosion potential have the same value, or the protection
potential is more negative, the likelihood of pit formation becomes higher [69].This method can
also be used for predicting the occurrence crevice corrosion.
Fig. 12 shows a typical cyclic polarization plot. The Ecorr, Eb and Ep parameters are represented
the corrosion potential, passivation breakdown potential and protection potential respectively.

27
When Ep>Ecorr As displayed in Fig. 12, the repassivation is more likely, and In case of Ep< Ecorr
sample remains in an active state and pitting increases continuously [70].
Fig. 12. Typical Cyclic polarization curve [70]
Additionally, the size and shape of the cyclic polarization loop can be a parameter to interpret the
results. For example, if the reverse current has a higher value than the current in the forward
direction, the formation of a larger hysteresis loop will demonstrate a higher tendency of the
material to form pits [71].
2.3.1.4. Electrochemical Impedance Spectroscopy
Impedance measurements are employed to achieve corrosion rate and reaction mechanisms of the
process at corroding surface [64]. Impedance just like resistance represents a barrier to the flow of
electrons or current. In direct current, only resistors produce this effect while for AC circuits, two
other circuit elements, capacitors and inductors, impede the flow of electrons. The effect of
capacitors and inductors is given the name reactance, symbolized by X and measured in ohms (XC
for capacitive reactance and XL for inductive reactance). The circuit elements in impedance and
their equation is described in Table 1 [63].

28
For DC signal according to Ohm's law, V = IR, where V is the voltage across a resistor in volts, R
is the resistance in ohms, and I is the current in amperes. For AC signals, E= IZ, where E and I are
waveform amplitudes for potential and current, respectively, and Z is the impedance.
The impedance of a system at a given frequency is defined by two terms which relate the output
current, the input voltage.
In a specific system with AC signal, the voltage is a function of time
𝐸 = 𝐸0 sin (𝜔𝑡) (14)
Where E0 is the amplitude of the signal and 𝜔 is the angular frequency (2𝜋𝑓)and, t is time in
second the current is also funa ction of time
𝐼 = 𝐼0 sin (𝜔𝑡 + 𝜑) (15)
Where I0 is the amplitude of the current and 𝜑 is the phase angle. The ratio of voltage amplitude
to that of the current defines the impedance term
|Z| = E0 / I0 (16)
To calculate the impedance of the system:
𝑍 = 𝐸
𝐼
Z = 𝐸
𝐼 =
𝐸0 𝑠𝑖𝑛 (𝜔𝑡)
𝐼0 sin (𝜔𝑡+𝜑) = z0
𝑠𝑖𝑛 (𝜔𝑡)
𝑠𝑖𝑛 (𝜔𝑡+𝜑) (17)

29
Table 1. Circuit elements in impedance and their equation[63]
EIS method is a beneficial method to study the electrochemical reaction states. The impedance
measurement employed to determine the electronic components. Fig. 13(a) shows the model of
the interface proposed by Helmholtz. In a simple case, the interface can be modeled by an
equivalent circuit as shown in Fig. 13(b). This is also called a Randles circuit, which is made of a
double-layer capacitor in parallel with a polarization resistor. This is also called a Randles circuit,
which is made of a double-layer capacitor in parallel with a polarization resistor (or charge-transfer
resistor, Rct,) and Warburg impedance, ZW, connected in series with a resistor that measures the
resistance of the electrolyte, Rs.
Fig. 13. A simple metal–aqueous solution interface in which the vertical dotted lines in (a) can match the electronic
components determined after EIS studies [63]

30
In order to obtain an Impedance plot, the EIS data are recorded as a function of the frequency of
an applied AC signal at a fixed working point of the polarization curve. In corrosion studies, this
working point is often Ecorr. The EIS measurements results are a set of amplitude and phase values
for a range of frequencies; these can be presented in two ways: Bode plot and Nyquist plot.
The bode plot presents a log of frequency in x axis and both the absolute value of the impedance
and phase shift on the y axis. Fig. 14 presents a Bode plot for the equivalent circuit of Randles
equivalent circuit [64].
Fig. 14. Example Bode plot for the equivalent circuit of Randle’s circuit[72]
The Nyquist diagram normally plots the imaginary part (Z″) of the impedance versus real part (Z′).
It is also known as cole-cole plot or a complex impedance plane plot. Since the majority of the
responses of corroding metals have negative Z″, it is conventional, for corrosion studies, to the
plot -Z″ against Z′. In this plot the y axis is negative, and each point on the Nyquist plot is the
impedance at one frequency. Fig. 15 shows an Equivalent electrical circuit model for a simple
corroding electrode (left) and related Nyquist plot.

31
Fig. 15. Equivalent electrical circuit model for a simple corroding electrode (left) and related Nyquist plot for the
equivalent circuit (right) [72]
In practical, the measured impedance spectra may differ from ideal or theoretical behaviour. The
loops (or time constants) do not show a perfect semi-circle shape in Nyquist representation. This
non-ideal behaviour may arise from coating heterogeneities as roughness, inhomogeneous
composition etc. In such a case the coating cannot be described by a simple capacitor. This one is
generally replaced by a constant phase element (CPE) whose impedance is given by
CPE = Y0 (jω)n
n accounts for non-ideal behaviours: when it equals to 1, the CPE is a pure capacitance and when
it equals zero, the CPE is a pure resistance[73].
Depending on the system studied, there can be two or more such parallel RCs (resistance and
capacitances) in the fitted circuit. Then the number of time constants is number of parallel RC or
R and CPE components that can be visually estimated from the number of semicircles in the
Nyquist plots.
2.3.2. Microstructural Analyses
The microstructural analysis is extensively performed to evaluate the surface of samples. Methods
such as scanning electron microscopy (SEM), energy dispersive X-ray spectroscopy (EDS) and
X-ray diffraction (XRD) confirms important information such as the grain size, distribution of

32
chemical elements within the structure, and the formation of possible phases due to the chemical
corrosion reactions.
While SEM is known as one of the more useful techniques to study the effects of corrosion on
microstructures of many materials, XRD is widely used for crystalline phase analyses of the
starting powders, densified cermet and coatings, and potentially any corrosion induced oxides
formed on the surface.
2.3.3. Chemical Analyses
X-ray photoelectron spectroscopy (XPS) techniques used to analysis of passive films formation
for metals and alloys from 1970’s. However, this technique usually faces such problems as (a)
very high surface coverage of oxygen resulting from the layers of bound water and hydroxyl
groups and the chemical effects of in vacuum dehydration and(b) oxidation of surface ions to
higher states during transport to the analysis chamber [73].
Schaepers and Strehblow made a wide investigation on passive layers of Fe-Al alloys with XPS
and elastic-ion scattering spectroscopy (ISS) under inert conditions on sputter-cleaned. In that
work, the aluminum content was 8, 15 and 22 at%, which meets the homogeneity region of α-Fe
in the Fe-Al phase diagram. X-ray photoelectron spectroscopy (XPS) studies revealed an
accumulation of aluminum oxide within the centre of the passive layer, which is confirmed by ISS
and XPS depth profiles. Angular-resolved XPS measurements suggest a continuous structural
change of the chemical film during its growth [74].

33
Fig. 16. XPS spectra for (a) Al and (b) Fe spectra for thermally oxidized elements at 800 °C (dotted lines) and
passivated elements in 0.25 M H2SO4 at 1 VSCE. [1]
Some Authors compared the chemistry of passive films with that of the air-oxidized films in order
to differentiate film properties in wet and dry conditions by XPS [58, 75]. In such study, XPS
spectra of the iron aluminide exposed to the 0.25 M H2SO4 solution at 1 VSCE and iron aluminide
oxidized in the O2 atmosphere at 800 °C for 10 min are compared (Fig. 16). Notably, in the case
of the passivated sample, there is a shift in the Al3+ peak towards high BE, it revealed coexistence
of Al3+ as Al2O3 and Al-OH at 74.49 and 75.29 eV, respectively. In Fig. 16(b), the peaks of iron
at 711 eV corresponding to Fe3+. Passive spectra reveal multiple peaks assigned to oxides and
sulphates. Contrasting in the case of Al, there is no difference in the peak position of Fe3+ between
the oxidized and passivated samples. This demonstrates that Al exists in the form of an oxide and
hydroxide while Fe exists in the passive film only as an oxide.
In another work [59], investigation of the passive layer by XPS depth profiling illustrated that
maximum enrichment of Al(III) within the centre of the passive film. The initially formed Al (III)-
rich film contains a large amount of hydroxide. However, like any other passivating alloy during
longer passivation time and at more positive potential the layer composition changes into a mixed
oxide/hydroxide film with a larger amount of additionally formed iron oxide.

34
2.4. HVOF Thermal Spray Coatings
Thermal spraying is a well-known technology for applying wear and corrosion resistant coatings
in many industrial sectors, such as aerospace, automotive, power generation, petrochemical and
offshore and recently in biomedical, dielectric and electronic-coatings.
In thermal Spraying, fine molten particles impinge on the substrate surface and form a coating. A
coating of the order of 20 microns to several millimetres can be formed using thermal spraying
depending upon the methods and feed rate. The quality of the coatings is evaluated by the phase
stability, coating density, adhesive strength, hardness, toughness, oxide contents and surface
roughness. Thermal Spray is used for a group of processes in which metallic, ceramic, cermet and
some polymeric materials in the form of powder, wire, or rod are fed to a torch or gun with which
they are heated to near or somewhat above their melting point. Plasma spray, electric arc wire
spray flame spray, high velocity oxy-fuel spray (HVOF) are the most popular of thermal spraying
techniques.
In the early 1980s, Browning and Witfield introduced a unique method of spraying metal powders,
called High-Velocity Oxy-Fuel (HVOF). The process utilizes a combination of oxygen with
various fuel gases including hydrogen, propane, propylene, hydrogen and even kerosene.
Fig. 17. Schematic diagram of the high-velocity oxy-fuel spray process (HVOF) [76]
In the HVOF process, fuel and oxygen are entered into the combustion chamber together, and the
spray powder comes through from other side (Fig. 17). The combustion of the gases provides the

35
temperature and pressure needed to flow of the gases through the nozzle. The flame temperature
is in the range of 2500 °C to 3200 °C. Therefore, the powder particles partially or completely melt
during the flight through the nozzle [77].
The ability to produce dense coatings with a low amount of degradation, oxidation of metallic
materials, and phase transformations is the main benefits of the HVOF process. This is due to the
short dwell time of the particles in a relatively cold flame. It is widely used to produce cermet and
metal coatings [77].
2.5. Summary
Intermetallic matrix composites were an interest owing to the combination of high specific
modulus, strength, and wear resistance. Fe3Al as a matrix has the superior properties and its
relatively low wear resistance can also be improved by the addition of cermet as reinforcement
phase. TiC has been found to be a suitable choice to reinforce the Fe3Al matrix due to high hardness
and high-temperature stability with the iron aluminide matrix [4].
In metallurgy and materials department of Laval University, a detailed project concerning the
Fe3Al matrix composites coatings that produced by HVOF techniques is defined for an industrial
application. This project includes different methods of powder production and investigation of
their mechanical and electrochemical properties. Mahdi Amiriyan as a Ph.D. candidate, in his
work, studied the dry sliding wear behaviour of Fe3Al/TiB2 [78] and Fe3Al/TiC composites
provided by HVOF in which, the coating powder feedstock, was produced by high-energy ball
milling of Fe3Al, Ti and graphite powders. He also investigated the effect of TiC addition on dry
sliding wear rates of the coatings at sliding speeds ranging from 0.04 to 0.8 m s-1 and under a
constant load of 5 N. The composite coatings with 0,10,30,50 and 70 mol.% TiC was evaluated
and the results revealed that the Vickers hardness and wear resistance of the coatings increased
with increasing TiC content in the Fe3Al matrix. He has studied the wear mechanism and showed
that the mechanism strongly depends on the sliding speed and the content of TiC particles. It was
observed that at low sliding speed, the predominant wear mechanism of the coatings with 0, 10
and 30 mol.% TiC was fatigue wear, whereas, at high sliding speeds, the wear mechanism is
oxidation. For Fe3Al–50 mol.% TiC and Fe3Al–70 mol.% TiC composites, abrasive and oxidation
wear are most likely the dominant wear mechanisms[4]. He also compared the phase composition,

36
microstructure, microhardness and elastic modulus of unreinforced Fe3Al and Fe3Al/TiC
composite coatings reinforced with 30 and 50 vol.% TiC particles [26].
In other work, Hadi Ghazanfari, as a Ph.D. candidate at Laval University, used combustion
synthesis of pure elemental powder of Fe, Ti, Al and C to provide HVOF feedstock powder. In
this method, the powders were mixed and pressed under 200 MPa pressure and placed in a
preheated furnace at 1100 °C to ensure the highest possible heating rate.He likewise investigated
the effect of TiC particles on the wear resistance of Fe3Al/TiC composite coatings at sliding speeds
ranging from 0.04 to 0.8 m.s−1 and under a constant load of 5 N and revealed that the coatings in
which feedstocks powders prepared by combustion synthesis exhibit 2 to 20 times higher wear
resistance than the coatings with powder that prepared by ball milling. The best performance was
related to a coating containing 70 mol.% TiC at highest speed.

37
CHAPTER 2
EXPERIMENTAL
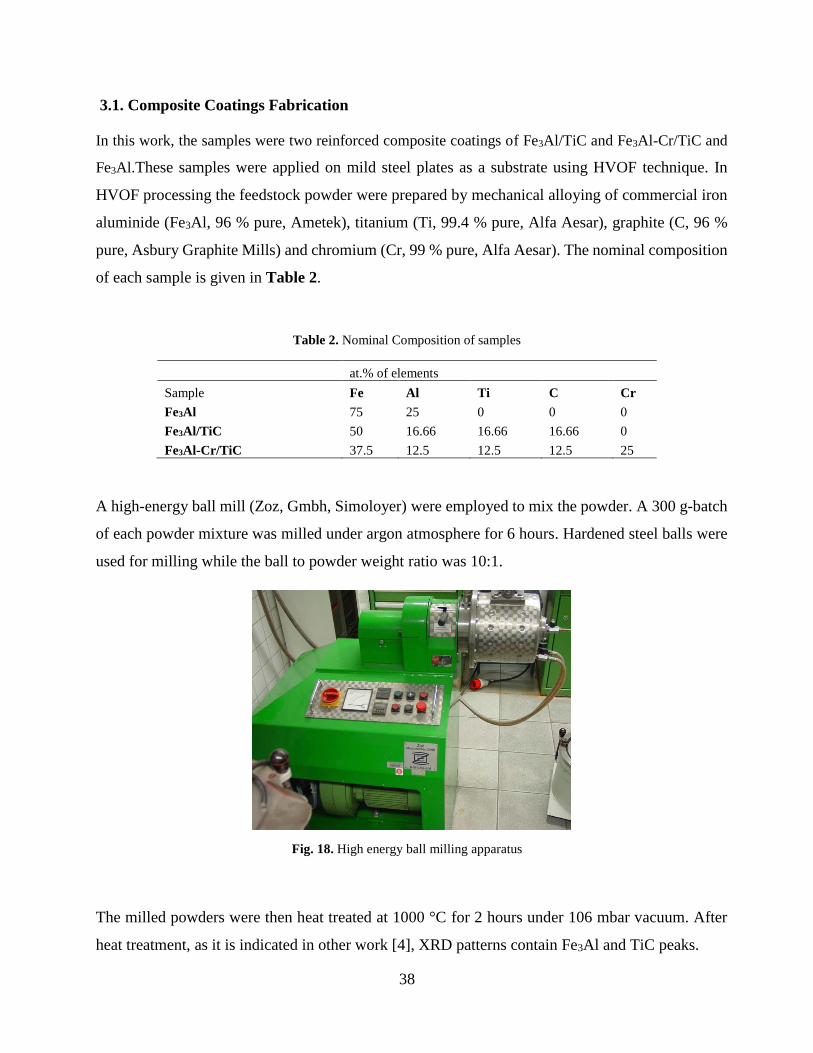
38
3.1. Composite Coatings Fabrication
In this work, the samples were two reinforced composite coatings of Fe3Al/TiC and Fe3Al-Cr/TiC and
Fe3Al.These samples were applied on mild steel plates as a substrate using HVOF technique. In
HVOF processing the feedstock powder were prepared by mechanical alloying of commercial iron
aluminide (Fe3Al, 96 % pure, Ametek), titanium (Ti, 99.4 % pure, Alfa Aesar), graphite (C, 96 %
pure, Asbury Graphite Mills) and chromium (Cr, 99 % pure, Alfa Aesar). The nominal composition
of each sample is given in Table 2.
Table 2. Nominal Composition of samples
at.% of elements
Sample Fe Al Ti C Cr
Fe3Al 75 25 0 0 0
Fe3Al/TiC 50 16.66 16.66 16.66 0
Fe3Al-Cr/TiC 37.5 12.5 12.5 12.5 25
A high-energy ball mill (Zoz, Gmbh, Simoloyer) were employed to mix the powder. A 300 g-batch
of each powder mixture was milled under argon atmosphere for 6 hours. Hardened steel balls were
used for milling while the ball to powder weight ratio was 10:1.
Fig. 18. High energy ball milling apparatus
The milled powders were then heat treated at 1000 °C for 2 hours under 106 mbar vacuum. After
heat treatment, as it is indicated in other work [4], XRD patterns contain Fe3Al and TiC peaks.

39
Heat treated powders utilized as feedstock of HVOF gun to make a composite coating on mild steel
plates (AISI1020) with dimensions of 190 mm×120 mm×5 mm. the substrates were sand-blasted
and then washed with acetone and ethanol in order to roughen and clean the surface prior to
deposition. HVOF system was a PraxairJP-8000HVOF spray with spray parameters listed in Table
3. The substrates were sand-blasted and then washed with acetone and ethanol prior to applying the
coating. The carrying gas was Argon and Kerosene used as the fuel during the HVOF deposition.
5-10 micron of coating applied in each pass.
Table 3. HVOF spraying Parameters
Oxygen flow rate (m3/s)
1.5 10-2
Kerosene flow rate (m3/s) 5.57 10-6
Carrying gas Argon
Spraying distance (m) 0.38
Number of deposition passes 5
Fig. 19. HVOF gun that applied the coating
3.2. Preparing Samples for electrochemical tests
The coatings which have applied by HVOF used as samples for electrochemical evaluation. The
surface was not polished in order to not reduce the thickness and evaluate the corrosion behaviour
in the same condition as they are employed in the industry. Samples were rinsed with ethanol and
dried before performing the experiments.
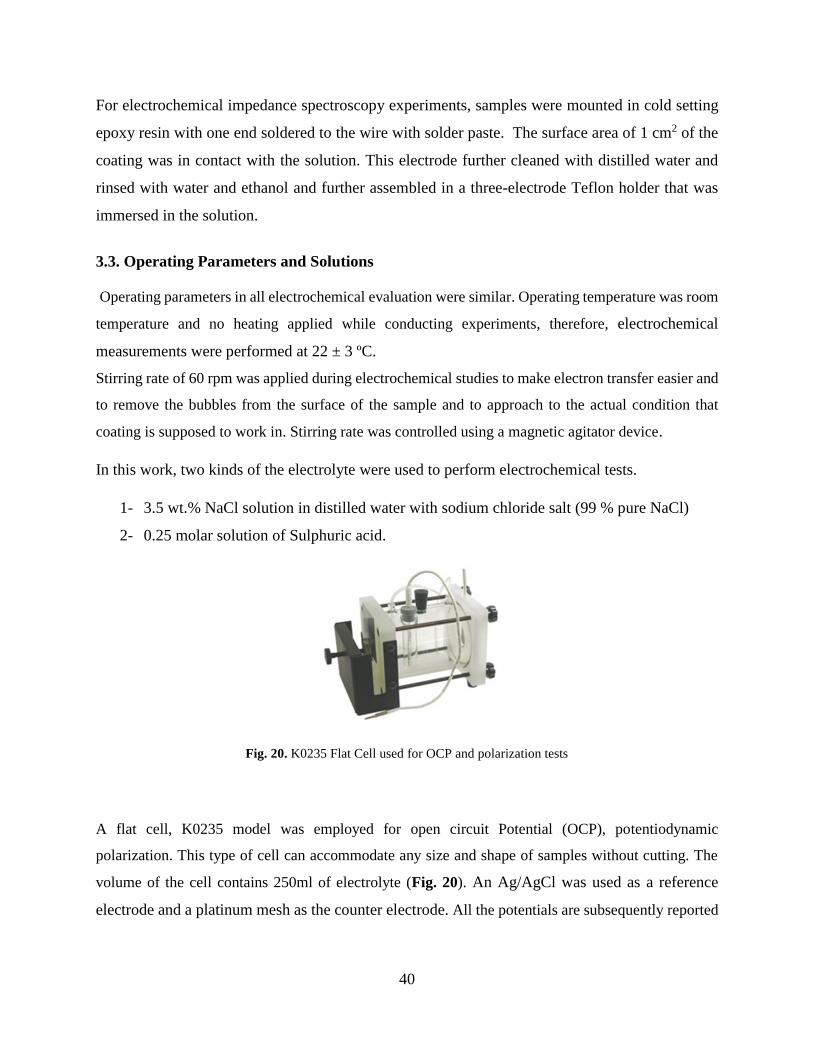
40
For electrochemical impedance spectroscopy experiments, samples were mounted in cold setting
epoxy resin with one end soldered to the wire with solder paste. The surface area of 1 cm2 of the
coating was in contact with the solution. This electrode further cleaned with distilled water and
rinsed with water and ethanol and further assembled in a three-electrode Teflon holder that was
immersed in the solution.
3.3. Operating Parameters and Solutions
Operating parameters in all electrochemical evaluation were similar. Operating temperature was room
temperature and no heating applied while conducting experiments, therefore, electrochemical
measurements were performed at 22 ± 3 ºC.
Stirring rate of 60 rpm was applied during electrochemical studies to make electron transfer easier and
to remove the bubbles from the surface of the sample and to approach to the actual condition that
coating is supposed to work in. Stirring rate was controlled using a magnetic agitator device.
In this work, two kinds of the electrolyte were used to perform electrochemical tests.
1- 3.5 wt.% NaCl solution in distilled water with sodium chloride salt (99 % pure NaCl)
2- 0.25 molar solution of Sulphuric acid.
Fig. 20. K0235 Flat Cell used for OCP and polarization tests
A flat cell, K0235 model was employed for open circuit Potential (OCP), potentiodynamic
polarization. This type of cell can accommodate any size and shape of samples without cutting. The
volume of the cell contains 250ml of electrolyte (Fig. 20). An Ag/AgCl was used as a reference
electrode and a platinum mesh as the counter electrode. All the potentials are subsequently reported

41
respect to Ag/AgCl electrode. These tests were carried out using a VersaSTAT3 Potentiostat-
Galvanostat workstation equipped with VersaStudio software.
Fig. 21. VersaSTAT3 Potentiostat -Galvanostat workstation
Since Versa STAT 3 potentiostat-Galvanostat system was not equipped with electrochemical
impedance spectroscopy test, electrochemical impedance spectroscopy (EIS) was conducted
using potentiostat Gamry Reference 3000.
3.3. Experimental Procedures
3.3.1. Open Circuit Potential Test
The change of potential with time (OCP) curves was collected over 20 hours of immersion for Fe3Al,
Fe3Al/TiC and Fe3Al-Cr/TiC in solution. In this technique, it does not apply any voltage or current
(Cell OFF), and simply measures the voltage difference between the working-sense and the reference
electrodes. The collection of data started 5 minutes after immersion and rate of the scan was one point
per second. The natural corrosion of coatings in 3.5 % NaCl solution investigated.
3.3.2. Potentiodynamic Polarization Studies
The solution of 3.5 wt.% NaCl was used during electrochemical tests. Prior to each polarization
measurement, a minimum of 1 hours of sample immersion in the electrolyte was allowed to ensure
nominally steady-state conditions. The potential scan rate was 1 mV/s. The applied potential was
controlled during testing using the VersaStudio software. Potentiodynamic polarization measurements
were conducted by scanning from -0.6 to +2 V (vs. OCP) for all coatings. Experiments have been
repeated until three same results achieved. The ASTM standard method for potentiodynamic
polarization resistance measurements and the subsequent calculation of corrosion rates (Equation 18)
was followed[79, 80]
𝐶𝑅 =𝑖𝑐𝑜𝑟𝑟
𝜌 𝐸𝑊 (18)

42
where CR is the rate of corrosion (given in mm/year), icorr is the current density at the corrosion
potential (in A/cm2), K is a constant (equal to 3.27 × 10⁻³ mm g/μA cm yr), 𝜌 is the density (in g/cm3)
and EW is the equivalent weight for the specific composition. Calculation of equivalent weight (EW)
values for the alloys according to sthe tandard practice of ASTM G102[67] and following equation.
𝐸𝑊 = 1
∑ 𝑛𝑖𝑓𝑖𝑊𝑖
(19)
where:
fi = the mass fraction of the ith element in the alloy,
Wi = the atomic weight of the ith element in the alloy, and
ni = the valence of the ith element of the alloy
3.3.3. Electrochemical Impedance Spectroscopy (EIS)
Electrochemical impedance spectroscopy (EIS) was conducted using potentiostat Gamry
Reference 3000. The working electrode was the coated plate mounted in epoxy resin with a 1 cm2
of surface area, and cathode was a platinum foil with a surface of 1 cm2. Electrodes were rinsed
with ethanol and dried before tests. The Ag/AgCl (KCl sat.) was used as reference electrode. Prior
to electrochemical impedance spectroscopy, 1-hour stabilization time was considered then the
frequency scanning was performed from 10-2 to 105 Hz with a root-mean-square potential
amplitude of 5 mV. Experiments were repeated until three same results achieved.
3.3.4. Energy Dispersive Spectrometry (EDS)
In order to the analysis of the surface of coatings after performing the potentiodynamic polarization
tests, a scanning electron microscope (SEM) JEOL JSM-840A, equipped with an energy dispersive
X-ray spectroscopy (EDXS) was employed. Morphology and elemental analysis of the coating
were done to evaluate the composition of corrosion products.
3.3.5. X-ray Photoelectron Spectroscopy (XPS)
Surface chemistry analysis was performed using an X-ray photoelectron spectroscopy (XPS). The
ESCA spectrometer was an AXIS-ULTRA instrument by KRATOS (UK). X-ray source was a
monochromatic Al K-alpha source operated at 300 watts. The analyzer is run in the constant pass
energy mode, with the lens system in the “hybrid” configuration, i.e. with both the magnetic and
the electrostatic lenses, and the electrostatic lens aperture in the “slot” position. This assures the
43
highest sensitivity with an analyzed spot approximately 700 microns x 300 microns, which is the
size of the monochromated X-ray beam. Multichannel electron counting is performed with an 8
channel electron multiplier detector. The pressure during analysis is in the 10-8 Torr range while
the base pressure is 5 x 10⁻¹⁰ Torr.
The electrostatic charge which appears on electrically insulating samples under X-ray irradiation
was neutralized with the integrated very low energy electron flood gun, the parameters of which
were set to optimize energy resolution and counting rate. The electron beam was normal to sample
holder's bottom, and x-ray beam was at 30 degrees to it. Photoelectrons are collected along sample
surface normal.
Elemental analysis was performed by recording survey spectra at a pass energy of 160eV and
energy step of 1eV per channel. Apparent relative concentrations were calculated using the
CasaXPS software with the appropriate sensitivity factors and are displayed on the survey spectra
in atomic percent. Concentrations are named apparent because they are calculated under the
hypothesis that the sample is homogeneous laterally and in depth over the analyzed area
(approximately 800 μm × 400 μm × 5-10 nm). Concentrations thus obtained from XPS can be very
different from bulk concentrations such as measured with EDS or WDS.
High-resolution spectra are recorded at pass energies of 40 and 20eV and step sizes of 0.1 and
0.05. Peak decompositions were performed using the same CasaXPS software. C1s spectra are
usually recorded mainly for binding energy correction, because of the use of the neutralization gun
which overcompensates the electrostatic charge; as usual aliphatic/contamination carbon
component is set at 285 eV and the correction is propagated to all spectra of the same sample
recorded in the same conditions.
3.3.5. Cyclic Polarization in sulphuric acid solution
The cyclic electrochemical analysis was performed in 0.25 M sulphuric acid solution, after one hour
of stabilization. Polarising the surfaces carried out with an initial voltage of -0.5 V to +2.0 V, and then
cycling back to 0.5 V as the final potential, with respect to the Ag/AgCl reference with a scanning rate
of 0.166 mV/s.

44
CHAPTER 3
RESULTS AND DISCUSSION
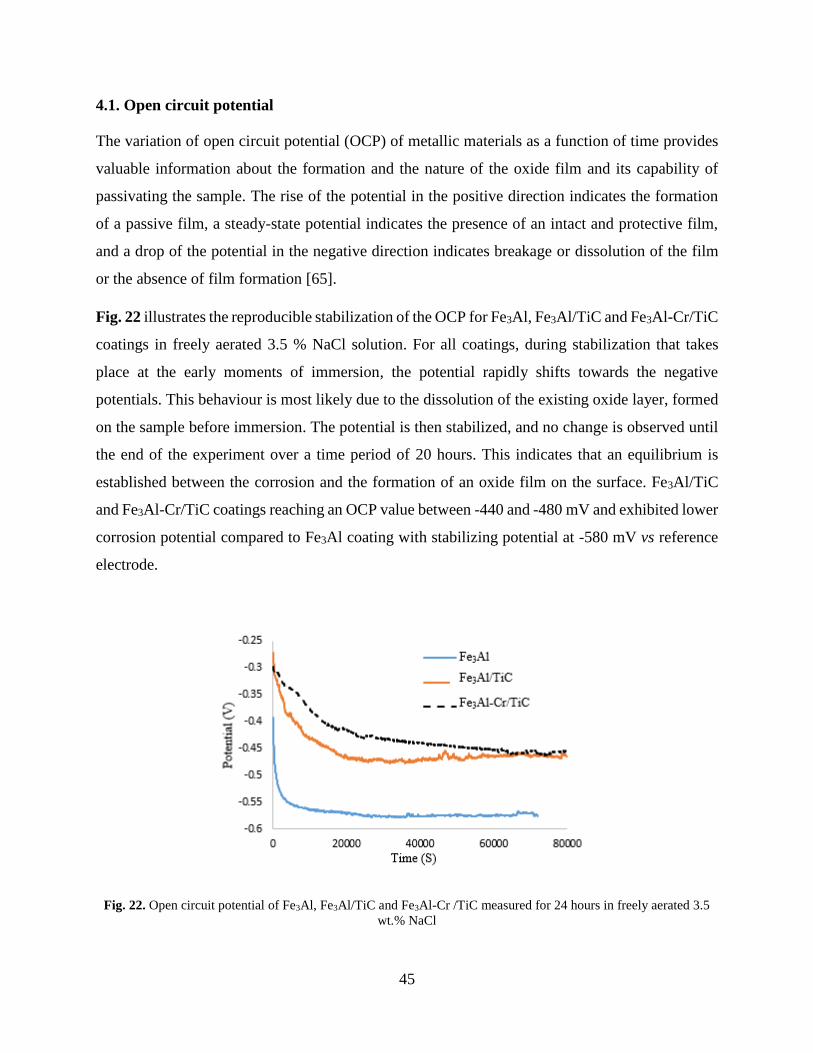
45
4.1. Open circuit potential
The variation of open circuit potential (OCP) of metallic materials as a function of time provides
valuable information about the formation and the nature of the oxide film and its capability of
passivating the sample. The rise of the potential in the positive direction indicates the formation
of a passive film, a steady-state potential indicates the presence of an intact and protective film,
and a drop of the potential in the negative direction indicates breakage or dissolution of the film
or the absence of film formation [65].
Fig. 22 illustrates the reproducible stabilization of the OCP for Fe3Al, Fe3Al/TiC and Fe3Al-Cr/TiC
coatings in freely aerated 3.5 % NaCl solution. For all coatings, during stabilization that takes
place at the early moments of immersion, the potential rapidly shifts towards the negative
potentials. This behaviour is most likely due to the dissolution of the existing oxide layer, formed
on the sample before immersion. The potential is then stabilized, and no change is observed until
the end of the experiment over a time period of 20 hours. This indicates that an equilibrium is
established between the corrosion and the formation of an oxide film on the surface. Fe3Al/TiC
and Fe3Al-Cr/TiC coatings reaching an OCP value between -440 and -480 mV and exhibited lower
corrosion potential compared to Fe3Al coating with stabilizing potential at -580 mV vs reference
electrode.
Fig. 22. Open circuit potential of Fe3Al, Fe3Al/TiC and Fe3Al-Cr /TiC measured for 24 hours in freely aerated 3.5
wt.% NaCl

46
4.2. Potentiodynamic polarization
Fig. 23 presents the polarization curves of three coatings in a freely aerated solution of 3.5 wt.%
NaCl. All samples demonstrate the similar shape of polarization curve. For the composite coatings
(Fe3Al/TiC and Fe3Al-Cr/TiC) the corrosion potential Ecorr is nobler and the corrosion current Icorr
is less than that of the Fe3Al. This observation is in accordance with the OCP results. Although the
current density remains constant beyond a certain potential, the curves demonstrate an active-
passive behaviour where the anodic current rapidly increased to reach a region with very little
change in its value with the increase of potential (passive region). However, no breakdown
potential can be observed even in relatively high potentials.
Fig. 23.The potentiodynamic polarization curves of Fe3Al, Fe3Al/TiC and Fe3Al-Cr/TiC in freely aerated 3.5 wt%
NaCl.
The values of corrosion parameters obtained from the polarization curves, such as cathodic Tafel
(βc) and anodic Tafel (βa) slopes, the corrosion potential (Ecorr), corrosion current density (jcorr) and
polarization resistance is calculated using Stern-Geary method and are presented in Table 5. This
It can be seen that by adding TiC particles to Fe3Al matrix the anodic and cathodic current densities
are decreased, and the value of the corrosion potential (Ecorr) shifted to the less negative direction.
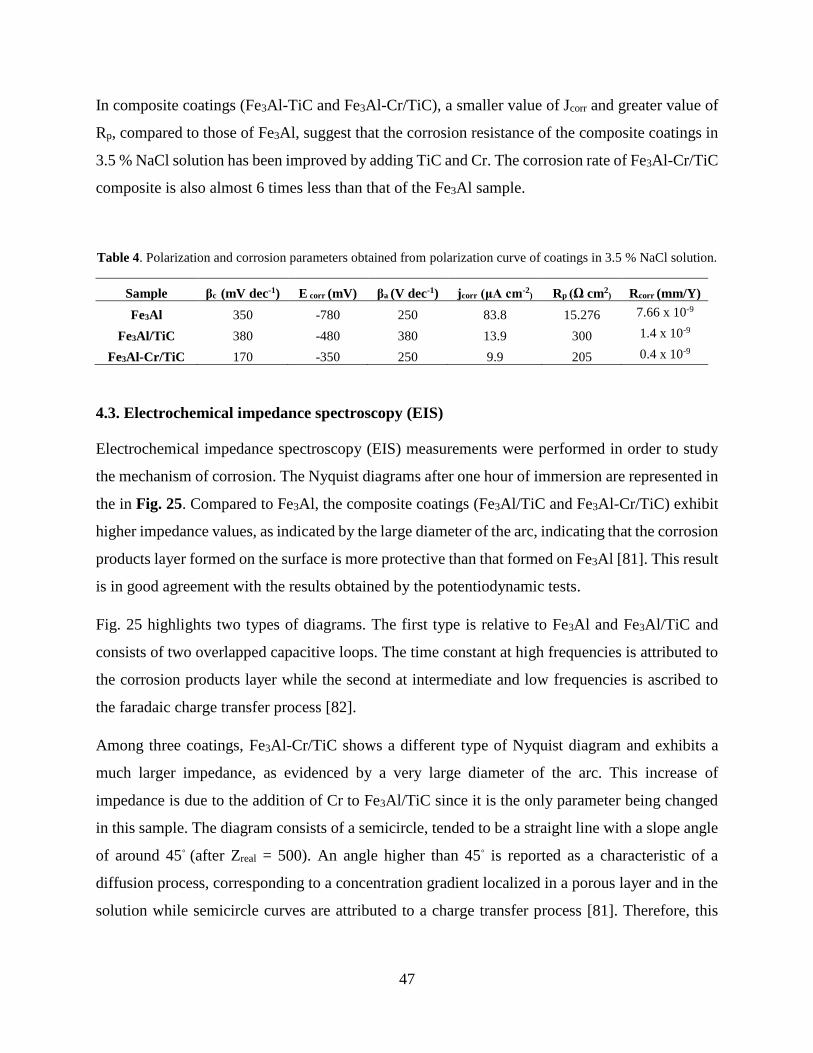
47
In composite coatings (Fe3Al-TiC and Fe3Al-Cr/TiC), a smaller value of Jcorr and greater value of
Rp, compared to those of Fe3Al, suggest that the corrosion resistance of the composite coatings in
3.5 % NaCl solution has been improved by adding TiC and Cr. The corrosion rate of Fe3Al-Cr/TiC
composite is also almost 6 times less than that of the Fe3Al sample.
Table 4. Polarization and corrosion parameters obtained from polarization curve of coatings in 3.5 % NaCl solution.
Sample βc (mV dec-1) E corr (mV) βa (V dec-1) jcorr (μA cm-2) Rp (Ω cm2
) Rcorr (mm/Y)
Fe3Al 350 -780 250 83.8 15.276 7.66 x 10⁻⁹
Fe3Al/TiC 380 -480 380 13.9 300 1.4 x 10⁻⁹
Fe3Al-Cr/TiC 170 -350 250 9.9 205 0.4 x 10⁻⁹
4.3. Electrochemical impedance spectroscopy (EIS)
Electrochemical impedance spectroscopy (EIS) measurements were performed in order to study
the mechanism of corrosion. The Nyquist diagrams after one hour of immersion are represented in
the in Fig. 25. Compared to Fe3Al, the composite coatings (Fe3Al/TiC and Fe3Al-Cr/TiC) exhibit
higher impedance values, as indicated by the large diameter of the arc, indicating that the corrosion
products layer formed on the surface is more protective than that formed on Fe3Al [81]. This result
is in good agreement with the results obtained by the potentiodynamic tests.
Fig. 25 highlights two types of diagrams. The first type is relative to Fe3Al and Fe3Al/TiC and
consists of two overlapped capacitive loops. The time constant at high frequencies is attributed to
the corrosion products layer while the second at intermediate and low frequencies is ascribed to
the faradaic charge transfer process [82].
Among three coatings, Fe3Al-Cr/TiC shows a different type of Nyquist diagram and exhibits a
much larger impedance, as evidenced by a very large diameter of the arc. This increase of
impedance is due to the addition of Cr to Fe3Al/TiC since it is the only parameter being changed
in this sample. The diagram consists of a semicircle, tended to be a straight line with a slope angle
of around 45 (after Zreal = 500). An angle higher than 45 is reported as a characteristic of a
diffusion process, corresponding to a concentration gradient localized in a porous layer and in the
solution while semicircle curves are attributed to a charge transfer process [81]. Therefore, this

48
response for Fe3Al-Cr/TiC could be the characteristic of a diffusion process while the semicircle
curves of Fe3Al and Fe3Al/TiC are attributed to a charge transfer process.
Fig. 24. Nyquist plot of Fe3Al, Fe3Al/Tic and Fe3Al-Cr/TiC composite coatings after one-hour immersion in 3.5 %
NaCl solution
In order to provide quantitative support to the experimental EIS results, an equivalent circuit was
adopted, as shown in Fig. 25. The related impedance parameters were obtained by ZView software.
The simulated curves (solid curves) are superposed to the experimental data in Fig. 24. As it can
be seen, a very good agreement can be observed between the experimental and the simulated plots.
-500
0
500
1000
1500
2000
2500
3000
3500
4000
4500
0 500 1000 1500 2000 2500 3000 3500 4000
-Z i
ma
g.(
oh
m)
Z real (ohm)
Fe3Al
Fe3Al-TiC
Fe3Al-TiC-Cr
-20
0
20
40
60
80
100
120
140
160
0 100 200 300 400-Z
im
ag
.(o
hm
)Z real (ohm)
Fe3AlFe3Al-TiC

49
The significance of the elements of the proposed equivalent circuit has been reported in the
literature [29, 82]. In this circuit, Rel corresponds to the resistance of the electrolyte while R2 and
CPE2 represent the resistance and the capacitance of the corrosion product layer, respectively. R1
represents the charge transfer resistance, and CPE1 represents double-layer capacitance. A constant
phase element (CPE) was used to consider a deviation from an ideal capacitor. The origins of the
CPE were summarised by Jorcin et al. [83], which includes distributed surface roughness and
heterogeneity, slow adsorption reaction, non-uniform potential and current distribution. The
relevant impedance of CPE is defined as:
CPE = Y0 (jω)n (17)
Where Y0 is the capacitance, j𝜔 is a complex variable for sinusoidal perturbations with 𝜔 = 2𝜋f,
and n is the frequency power of CPE. The value of n suites between -1 and 1. CPE can represent
pure resistance for n=0, pure capacitance for n=1, Warburg impedance for n=0.5 and inductance
for n=-1[29].
Fig. 25. The proposed equivalent circuit model used to obtain impedance.
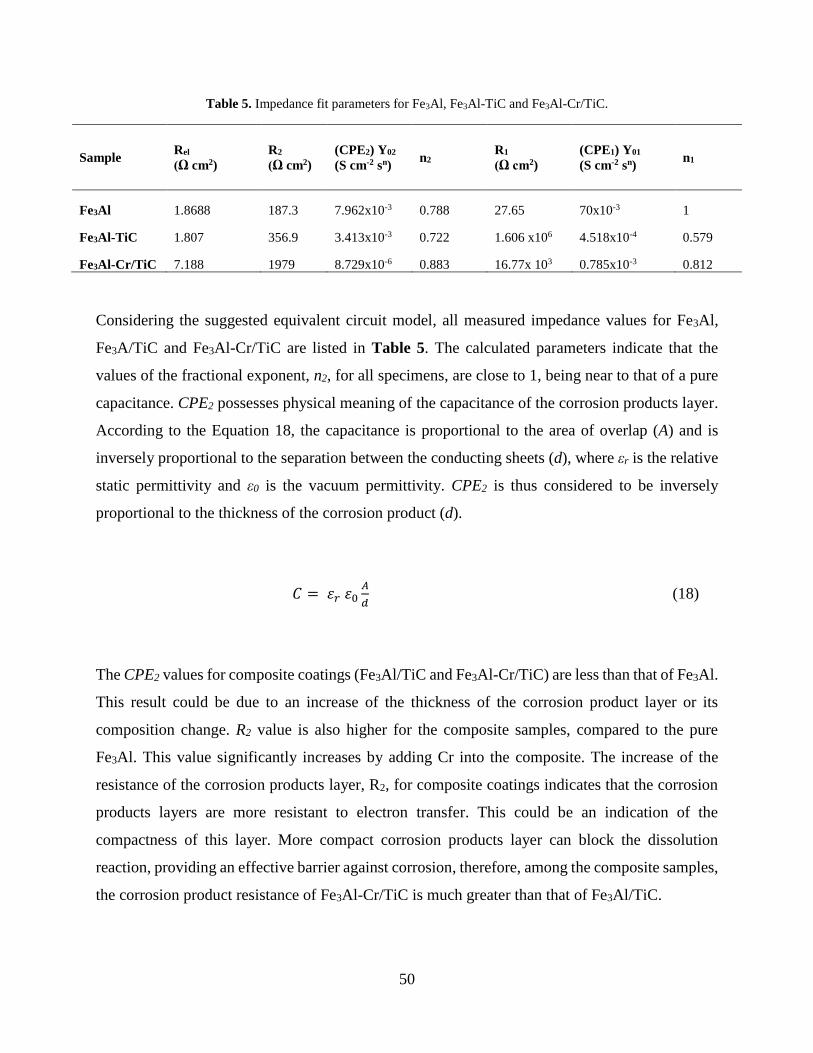
50
Table 5. Impedance fit parameters for Fe3Al, Fe3Al-TiC and Fe3Al-Cr/TiC.
Sample Rel
(Ω cm2)
R2
(Ω cm2)
(CPE2) Y02
(S cm-2 sn) n2
R1
(Ω cm2)
(CPE1) Y01
(S cm-2 sn) n1
Fe3Al 1.8688 187.3 7.962x10⁻³ 0.788 27.65 70x10-3 1
Fe3Al-TiC 1.807 356.9 3.413x10⁻³ 0.722 1.606 x10⁶ 4.518x10⁻⁴ 0.579
Fe3Al-Cr/TiC 7.188 1979 8.729x10⁻⁶ 0.883 16.77x 10³ 0.785x10⁻³ 0.812
Considering the suggested equivalent circuit model, all measured impedance values for Fe3Al,
Fe3A/TiC and Fe3Al-Cr/TiC are listed in Table 5. The calculated parameters indicate that the
values of the fractional exponent, n2, for all specimens, are close to 1, being near to that of a pure
capacitance. CPE2 possesses physical meaning of the capacitance of the corrosion products layer.
According to the Equation 18, the capacitance is proportional to the area of overlap (A) and is
inversely proportional to the separation between the conducting sheets (d), where εr is the relative
static permittivity and ε0 is the vacuum permittivity. CPE2 is thus considered to be inversely
proportional to the thickness of the corrosion product (d).
𝐶 = 𝜀𝑟 𝜀0𝐴
𝑑 (18)
The CPE2 values for composite coatings (Fe3Al/TiC and Fe3Al-Cr/TiC) are less than that of Fe3Al.
This result could be due to an increase of the thickness of the corrosion product layer or its
composition change. R2 value is also higher for the composite samples, compared to the pure
Fe3Al. This value significantly increases by adding Cr into the composite. The increase of the
resistance of the corrosion products layer, R2, for composite coatings indicates that the corrosion
products layers are more resistant to electron transfer. This could be an indication of the
compactness of this layer. More compact corrosion products layer can block the dissolution
reaction, providing an effective barrier against corrosion, therefore, among the composite samples,
the corrosion product resistance of Fe3Al-Cr/TiC is much greater than that of Fe3Al/TiC.

51
The charge transfer resistance, R1 of Fe3Al/TiC is also higher than that of the two other samples
which is likely due to the blocking effect of the more compact corrosion products layer formed at
the surface. R1 for composite coatings (Fe3Al/TiC and Fe3Al-Cr/TiC) are considerably higher than
that of Fe3Al.
As a summary, EIS measurements confirmed that a fairly protective surface layer is formed on all
samples after one-hour exposure to naturally aerated 3.5 % NaCl solution. However, the more
compact surface layer was formed on Fe3Al-Cr/TiC, and the corrosion mechanism is diffusion
process. Fe3Al/TiC and Fe3Al exhibited charge transfer mechanism.
4.4. Possible corrosion reactions
Before analysing the surface, the possible reactions of iron aluminide as the matrix of composite and
TiC as reinforcement are reviewed. According to previous works on iron aluminide [1],
during active dissolution the following reactions may take place:
Fe3Al +6H+ = 3Fe3+ + Al3+ + 3H2 + 6e- (20)
Fe3Al +6H+ = 3Fe2+ + Al3+ +3H2 + 3e- (21)
After active dissolution from iron aluminide, aluminium quickly converts into Al2O3 on the surface by
following reaction, whereas iron ions remain in the solution.
2Al3+ + 3H2O = Al2O3 + 6H+ (22)
Contrary to the oxide film on a pure aluminum, this Al2O3 layer is not continuous and exhibits a
porous structure. The porosity allows the corrosion process to continue and iron dissolves from
the surface. Therefore, FeO and Fe2O3 iron oxides start to form on the surface.
2Fe3+ + 3H2O = Fe2O3+ 6H+ (23)
Fe2+ + H2O = FeO + 2H+ (24)
More Al–OH formed by the following reaction:
Al2O3 + 3H2O→ 2Al(OH)3 (25)

52
The role of TiC in passivation in 3 % NaCl solution was explained by Lavrenko et al. [84]. TiC,
owed to the high value of the oxygen adsorption energy on its surface has good corrosion
resistance. They revealed that electrolytic corrosion of TiC, in 3 % NaCl solution, is a multistep
process. After an initial anodic dissolution, with the transfer of Ti3+and TiO2+ ions into the solution,
the formation of TiO2 (rutile) partially protecting layers, slows down the dissolution of the
composites.
2TiC + 6H2O = 2TiO2+ + 12H+ + 2CO2 + 16e (26)
TiC + 4H2O = TiO2 + 8H+ + CO2 + 8e (27)
Corrosion products consist of the intermediate scale layer composed of the TiO lower oxide while
the external layer is composed of rutile TiO2.
4.5. SEM and EDS Analyses
Post corrosion analyses were performed to study the surface of the samples after corrosion. The
analyses consist of microstructural analysis with scanning electron microscopy (SEM), equipped by
EDS elemental. The Passive layer of the samples, after being polarized from -1 to +1.5 V (vs. OCP),
were examined. SEM images have shown that the effective corrosion mechanism is a uniform attack.
Fig. 26 shows the surface morphology of the samples after potentiodynamic polarization test
exposure to 3.5 % NaCl solution. A thick layer of corrosion products (including passive layer)
covers the entire surface of the coatings. The corrosion products were different for the studied
samples, both in colour and in composition. For the elemental analysis of passive layer, Energy
Dispersive Spectroscopy (EDS) related to each SEM images was performed.
EDS results show an approximate amount of each element in the passive layer. In Fe3Al sample,
Fe, Al and O are detected in the passive layer, but hydrogen amount cannot be detected by this
method. The weight percent calculation indicates a large amount of O and C in the passive layer.
However, this elemental analysis does not give any information about the type of compounds and
the mechanisms of passivation. In order to achieve these goals, XPS analysis was performed.
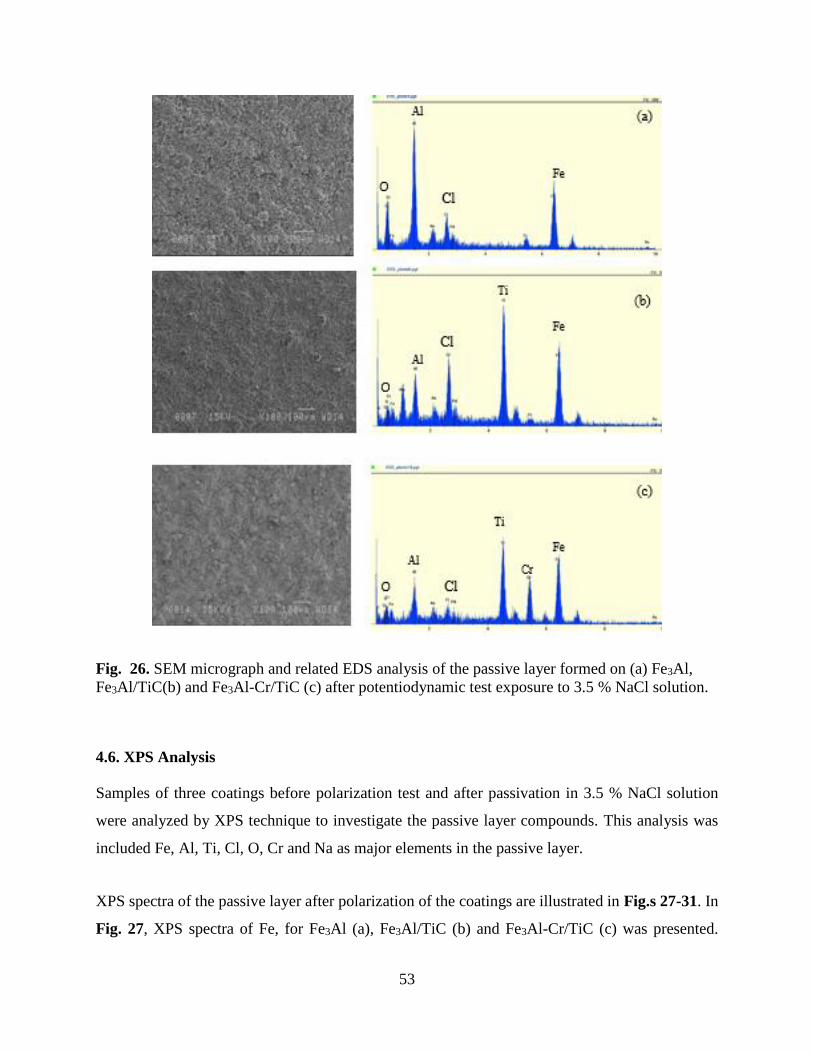
53
Fig. 26. SEM micrograph and related EDS analysis of the passive layer formed on (a) Fe3Al,
Fe3Al/TiC(b) and Fe3Al-Cr/TiC (c) after potentiodynamic test exposure to 3.5 % NaCl solution.
4.6. XPS Analysis
Samples of three coatings before polarization test and after passivation in 3.5 % NaCl solution
were analyzed by XPS technique to investigate the passive layer compounds. This analysis was
included Fe, Al, Ti, Cl, O, Cr and Na as major elements in the passive layer.
XPS spectra of the passive layer after polarization of the coatings are illustrated in Fig.s 27-31. In
Fig. 27, XPS spectra of Fe, for Fe3Al (a), Fe3Al/TiC (b) and Fe3Al-Cr/TiC (c) was presented.

54
Appearing of the peak in the passive layer of coatings at 710.7 eV is associated with Fe+3. Satellite
at 743.2 eV is characteristic of the Fe+3 state, and positions of satellites 2 and 3 in agreement with
the Fe+3 state. In Fig. 27-b, visually detectable Fe+2 satellites can be seen, and it is an evidence of
the mixture of Fe+3 and Fe+2.
In Fig. 28, XPS spectra of Al, before the test (a) and after passivation (b) are illustrated. The
appearance of the peak at 74.7 eV in the sample before corrosion (a) is assigned to the binding
energy of Al3+ in Al2O3. This oxide could be formed during HVOF technique by the exposure of
pure aluminum to air. In the case of the passivated sample (b), there is a shift in the Al3+ peak
towards high binding energy. By deconvolution of the spectra, it was revealed the coexistence of
Al3+ as Al2O3, Al(OH)3 and AlCl3 at 74.7, 75 and 77.29 eV, respectively [75].
This results for Al and Fe is similar to what Frangini et al. [58] reported while comparing oxidized
and passivated iron aluminide samples. They reported that the outer part of the passive film
predominantly consists of mixed Al–Fe oxy-hydroxide whereas the inner part is of mostly an Al-
rich oxide phase.
Fig. 29 presents the XPS spectra of Ti2p in a passive layer of two composites, Fe3Al/TiC(a) and
Fe3Al-Cr/TiC(b). Two spectra are almost the same and are attributed to Ti2p1/2 and Ti2p3/2 and are
compatible to TiO and TiO2. However binding energy that is attributed to TiC is 454.9-455.1 eV,
and that could be confused with TiO. XPS spectra of Cr2p, in Fig. 31, is attributed to Cr(OH)3 that
is formed in the passive layer.
These results indicate that the passive layer of composite coatings (Fe3Al/TiC and Fe3Al-Cr/TiC)
consists of a mixture of aluminum, iron and titanium oxide and aluminum hydroxide. In case of
Fe3Al-Cr / TiC, chromium hydroxide also exists in the passive layer. The presence of hydroxide
could be the result of hydration of passive film that can happen by raising potential [23].

55
Fig. 27. XPS Spectra for Fe 2p for (a)Fe3Al (b) Fe3Al/TiC and (c)Fe3Al-Cr/TiC.

56
Fig. 28. XPS spectra of Al 2p (a) before polarization test and (b) passivated sample.
Fig. 29. XPS spectra of Ti2p (a) Fe3Al/TiC (b) Fe3Al-Cr/TiC.
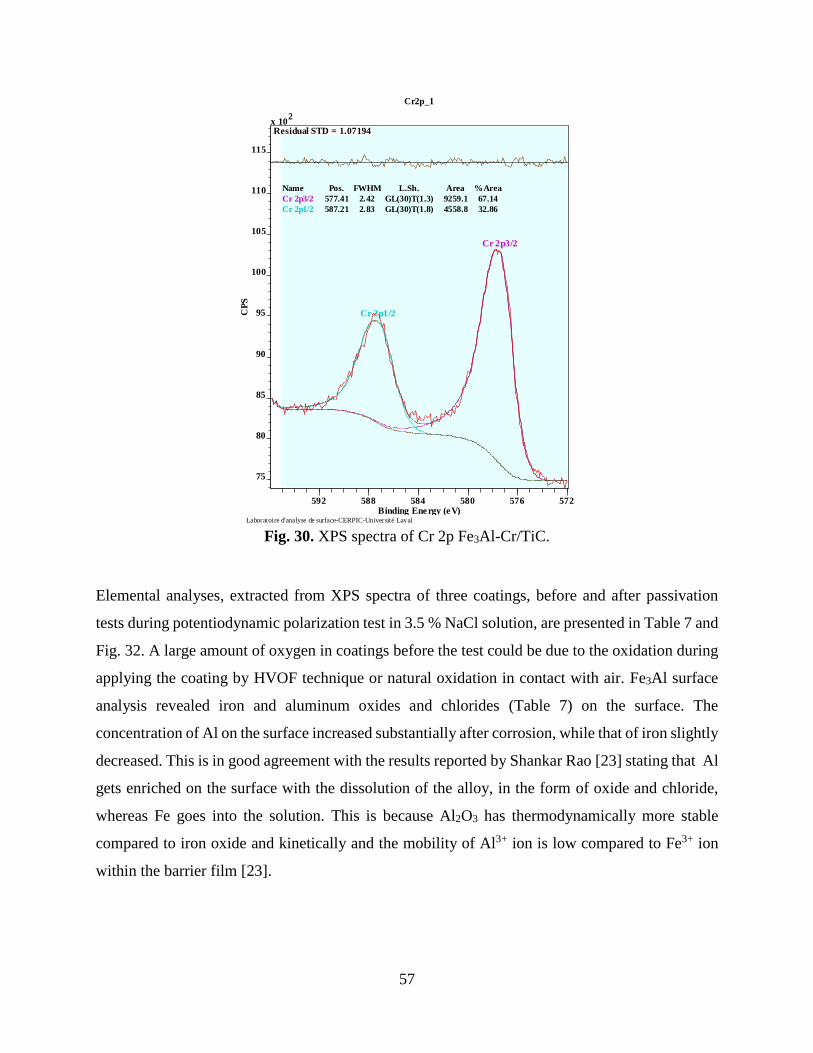
57
Fig. 30. XPS spectra of Cr 2p Fe3Al-Cr/TiC.
Elemental analyses, extracted from XPS spectra of three coatings, before and after passivation
tests during potentiodynamic polarization test in 3.5 % NaCl solution, are presented in Table 7 and
Fig. 32. A large amount of oxygen in coatings before the test could be due to the oxidation during
applying the coating by HVOF technique or natural oxidation in contact with air. Fe3Al surface
analysis revealed iron and aluminum oxides and chlorides (Table 7) on the surface. The
concentration of Al on the surface increased substantially after corrosion, while that of iron slightly
decreased. This is in good agreement with the results reported by Shankar Rao [23] stating that Al
gets enriched on the surface with the dissolution of the alloy, in the form of oxide and chloride,
whereas Fe goes into the solution. This is because Al2O3 has thermodynamically more stable
compared to iron oxide and kinetically and the mobility of Al3+ ion is low compared to Fe3+ ion
within the barrier film [23].
Laboratoire d'analyse de surface-CERPIC-Université Laval
Cr2p_1
Cr 2p3/2
Cr 2p1/2
Residual STD = 1.07194
Name
Cr 2p3/2
Cr 2p1/2
Pos.
577.41
587.21
FWHM
2.42
2.83
L.Sh.
GL(30)T(1.3)
GL(30)T(1.8)
Area
9259.1
4558.8
%Area
67.14
32.86
x 102
75
80
85
90
95
100
105
110
115
CP
S
592 588 584 580 576 572Binding Energy (eV)

58
Table 6. Elemental analysis results of the surface before the test after passivation in 3.5% NaCl
solution during the potentiodynamic test.
Fe3Al Fe3Al/TiC Fe3Al-Cr/TiC
at.% Before the test passivated Before the test passivated Before the test passivated
Fe 6.13 4.44 5.71 6.37 2.94 6.27
Al 3.91 13.07 3.6 2.88 2.52 1.46
Ti 0 0 1.1 7.43 0 6.96
Cr 0.3 0.86 0.21 1.82 1.9 4.33
O 40 53.72 46.14 47.37 31.12 44.41
Cl 1.64 22.34 1.01 30.11 3.59 2.4
Fig. 31. Elemental analysis results of the surface after passivation in 3.5 % NaCl solution during
the potentiodynamic test.
In case of Fe3Al/TiC, high amount of Ti after corrosion could indicate that TiC dissolved in
solution according to equations (26) and (27). Thus, Ti remained in the passive layer in the form
of TiC, TiO, and TiO2 (oxidation usually takes place during HVOF process) and its concentration
increases, as the corrosion progresses. Comparing two composites, in case of Fe3Al-Cr/TiC, the
passive layer consists of less chloride that is good evidence of better protection. As discussed by

59
Zamanzadeh [48], Cr3+ may substitute the Al3+ site. During the formation of the passive film, Cr3+
diffuses into the solution/oxide interface. They may segregate at the crystal imperfection sites
which act as the entry sites for the chloride ions because of the high surface energy of the defects.
Thus, the entry site may be blocked by the Cr oxide and therefore reduce the penetration of chloride
ions.
4.7. Cyclic Polarization
Cyclic polarization is a variant of the potentiodynamic polarization technique, and it is widely used to
determine the tendency of specific materials towards pitting corrosion. In this work, cyclic polarization
tests were performed in sulphuric acid solution to study the passivation and pitting behaviour of the
coatings .
Fig. 33 presents cyclic potentiodynamic polarization curves of coatings in 0.25 M sulphuric acid
solution. The shape of diagrams for Fe3Al and Fe3Al/TiC is in good agreement with other works about
iron aluminides [28, 29, 31, 86] which consists of several partial passivation and breakdown.
Fig. 32. Cyclic polarization diagram of Fe3Al, Fe3Al/TiC and Fe3Al-Cr/TiC coating in 0.25 M
sulphuric acid solution
As shown in Fig. 33, the individual coatings exhibited cyclic polarization curves, with clockwise
hysteresis loops which are extremely small in case of Fe3Al and Fe3Al/TiC. The potential at which the

60
current sharply increases is defined as the passivation breakdown potential (Eb) or pitting potential
(Epit) and the potential at which the loop closes on the reverse scan is the protection or re-protection
potential (Ep). In case of Fe3Al and Fe3Al/TiC samples, these two potentials are the same, and there is
no tendency to pitting. Fe3Al-Cr/TiC shows more positive Ep than Eb, therefore, there is a little tendency
to pitting. Furthermore, the size of the pitting loop can be used as an indication of pitting tendency.
The larger loop in Fe3Al-Cr/TiC shows more tendency to pitting.
Corrosion and cyclic polarization parameters of Fe3Al, Fe3Al/TiC and Fe3Al-Cr/TiC in 0.25 M
sulphuric acid solution are presented in Table 8. Composite coatings, with less negative corrosion
potential (Ecorr) and less corrosion current, revealed better corrosion parameters than did Fe3Al. In fact,
the corrosion current of Fe3Al/TiC is slightly lower than that of Fe3Al while the addition of Cr (Fe3Al-
Cr/TiC sample) exhibits a much lower corrosion current which is 27 times smaller than that of Fe3Al.
However, in the case of Fe3Al-Cr/TiC, compared to the other coatings, the difference between
corrosion potential and breakdown potential (Eb-Ecorr) has smaller value, and the passive breakdown
occurs in more negative potential. This displays less pitting resistance of this coating in sulphuric acid
solution. Furthermore, once a pit formed, it propagates at a faster rate in Fe3Al-Cr/TiC, as indicated by
the higher active current.
Table 7.Cyclic polarization parameters of Fe3Al, Fe3Al/TiC and Fe3Al-Cr/TiC in 0.25 M
sulphuric acid solution
Ecorr (mV) i corr (mA/cm2) Eb (mV) Ep (mV) Eb - Ecorr (mV)
Fe3Al -518 11.64 1490 1590 2008
Fe3Al/TiC -500 9.27 1487 1.58 1987
Fe3Al-Cr/TiC -380 0.42 1010 1.103 1390
Results of potentiodynamic cyclic polarization revealed that adding TiC to Fe3Al does not have a
negative effect on the corrosion resistance of Fe3Al. On the other hand, it was reported that [28, 86]
adding chromium in small amounts (2-5 at.%) may improve the pitting resistance of Fe3Al in a mixed
solution of Na2SO4 and NaCl. Our results did not show such a clear tendency. Fe3Al-Cr/TiC composite
coating did not exhibit good resistance to pitting in sulphuric acid solution, although its general
corrosion resistance is significantly improved by Cr addition.

61
CONCLUSION AND OUTLOOK

62
5.1. General Conclusion
The corrosion behaviour of two composite coatings with the Fe3Al matrix, prepared by high-
velocity oxy-fuel (HVOF) spraying, in 3.5 wt.% NaCl was studied. The effect of chromium
addition on corrosion behaviour of the coatings was evaluated. Electrochemical measurements
such as electrochemical impedance spectroscopy and potentiodynamic polarization were
considered to examine corrosion behaviour of Fe3Al, Fe3Al/TiC and Fe3Al-Cr/TiC coatings.
Furthermore, cyclic polarization test in 0.25 M sulphuric acid was performed to study the pitting
resistance of the coatings. Post-corrosion analysis such as scanning electron microscopy (SEM)
and X-ray photoelectron spectroscopy (XPS) was employed to characterize the passive layer that
formed during polarization in order to provide useful and complementary data and explanations.
According to the research work during this project, the following conclusions can be drawn:
1- An oxide layer is formed on the surface of all coatings before corrosion tests. This layer
could be formed due to oxidation of the sample during HVOF process or by natural
oxidation in the air. In OCP tests, a decrease of potential toward negative potential with
time is evidence of dissolution of this pre-corrosion film. After a while, the potential shows
a good stabilization, due to the formation of the stable passive layer.
2- Potentiodynamic polarization revealed that two composite coatings (Fe3Al/TiC and Fe3Al-
Cr/TiC), with smaller corrosion current density (icorr) and more positive corrosion potential
(Ecorr), exhibit better corrosion performance than does Fe3Al. The corrosion rate of
Fe3Al/TiC is almost 6 times higher than that of Fe3Al in 3.5 % NaCl solution.
3- The Nyquist plot of EIS revealed that Fe3Al-Cr/TiC shows a different type of diagram with
much larger impedance, comparing to the other coatings. This increase of impedance could
be due to the addition of Cr to Fe3Al/TiC. The diagram consists of a semicircle tended to
be a straight line with a slope angle of around 45º. An angle higher than 45º was reported
as a characteristic of a diffusion process, corresponding to a concentration gradient
localized in a porous layer. This response for Fe3Al-Cr/TiC could, therefore, be the
characteristic of a diffusion process while the semicircle curves of Fe3Al and Fe3Al/TiC
are attributed to a charge transfer process.

63
4- SEM images of the surface of coatings after polarization test show general uniform
corrosion and no localized corrosion was detected.
5- XPS spectra of passive layer after polarization revealed the existence of iron, aluminum
oxides and hydroxide plus titanium oxide that could be mixed with titanium carbide.
Elemental analysis shows that the passive layer of Fe3Al-Cr/TiC consists of less chloride
comparing to that of Fe3Al/TiC and it is good evidence of better protection. During the
formation of the passive film, Cr3+ diffuses into the solution/oxide interface. They may
segregate at the crystal imperfection sites which act as the entry sites for the chloride ions
because of the high surface energy of the defects. Thus, the entry sites are blocked by the
Cr oxide and therefore reduce the penetration of chloride ions.
6- Cyclic polarization tests performed in 0.25 M sulphuric acid solution due to study the
passivation and pitting behaviour of coatings in a different solution to compare the results
of several other works on iron aluminides in this solution. Results of potentiodynamic
cyclic polarization revealed that adding TiC to Fe3Al does not have a significant effect on
corrosion behaviour of Fe3Al. However, in case of Fe3Al-Cr/TiC, the difference between
corrosion potential and breakdown potential, (Eb-Ecorr) has a smaller value, and the passive
breakdown occurs in more negative potential which displays less pitting resistance of this
coating in sulphuric acid solution. Furthermore, once a pit formed, it propagated at a fast
rate in Fe3Al-Cr/TiC as indicated by the higher active current.
These results revealed that adding TiC particles to Fe3Al matrix to improve the wear resistance
does not deteriorate the corrosion behaviour of Fe3Al coating. The addition of Cr in Fe3Al/TiC
composite coatings could further improve their corrosion resistance. However, in sulphuric acid
solution, this coating exhibits low pitting resistance.
5.2. Outlook
Based on the obtained results in this research study, the following perspectives and future work
could be considered

64
1. Electrochemical studies including OCP, potentiodynamic polarization and electrochemical
impedance in a mixed solution of H2SO4 and NaCl or other solutions to study the role of
chloride ion in corrosion behaviour of the composite.
2. Post corrosion investigation such as chemical analysis of passive layer by XPS technique
to evaluate passive layer that formed on the coatings in a different solution.
3. Performing Electrochemical studies in dynamic solution to approach to the real condition
that an industrial part such as turbine blade works.
65
6. References
1. Rao, V.S., A review of the electrochemical corrosion behaviour of iron aluminides. Electrochimica Acta, 2004. 49(26): p. 4533-4542.
2. Zamanzade, M., A. Barnoush, and C. Motz, A Review on the Properties of Iron Aluminide Intermetallics. Crystals, 2016. 6(1): p. 10.
3. Cinca, N., C.R.C. Lima, and J.M. Guilemany, An overview of intermetallics research and application: Status of thermal spray coatings. Journal of Materials Research and Technology, 2013. 2(1): p. 75-86.
4. Amiriyan, M., et al., Dry sliding wear behavior of Fe3Al and Fe3Al/TiC coatings prepared by HVOF. Wear, 2015. 342-343: p. 154-162.
5. Xu, B., et al., Sliding wear behavior of Fe–Al and Fe–Al/WC coatings prepared by high velocity arc spraying. Wear, 2004. 257(11): p. 1089-1095.
6. ZHU, Z.-x., et al., Influence of Heat Treatment on Microstructure and Wear Behavior of Fe-Al/WC Composite Coatings [J]. Journal of Materials Engineering, 2004. 7: p. 000.
7. Durlu, N., Titanium carbide based composites for high temperature applications. Journal of the European Ceramic Society, 1999. 19(13): p. 2415-2419.
8. Hussainova, I., Some aspects of solid particle erosion of cermets. Tribology international, 2001. 34(2): p. 89-93.
9. Chen, Y. and H. Wang, Microstructure and wear resistance of laser clad TiC reinforced FeAl intermetallic matrix composite coatings. Surface and Coatings Technology, 2003. 168(1): p. 30-36.
10. Kumar, S., et al., Characterization and comparison between ball milled and plasma processed iron-aluminium thermal spray coatings. Surface and Coatings Technology, 2006. 201(3–4): p. 1267-1275.
11. Song, B., et al., Oxidation Control of Atmospheric Plasma Sprayed FeAl Intermetallic Coatings Using Dry-Ice Blasting. Journal of Thermal Spray Technology, 2013. 22(2): p. 345-351.
12. High-Temperature Sulfidation of Fe3Al Thermal Spray Coatings at 600°C. CORROSION, 2000. 56(2): p. 189-198.
13. Frangini, S. and A. Masci, Intermetallic FeAl based coatings deposited by the electrospark technique: corrosion behavior in molten (Li+K) carbonate. Surface and Coatings Technology, 2004. 184(1): p. 31-39.
14. Pokhmurska, H., et al., Tribological properties of arc sprayed coatings obtained from FeCrB and FeCr-based powder wires. Surface and Coatings Technology, 2002. 151–152: p. 490-494.
15. Szczucka-Lasota, B., et al., Oxidation models of the growth of corrosion products on the intermetallic coatings strengthened by a fine dispersive Al2O3. Journal of Materials Processing Technology, 2005. 164–165: p. 935-939.
16. Sidhu, T., S. Prakash, and R. Agrawal, Studies on the properties of high-velocity oxy-fuel thermal spray coatings for higher temperature applications. Materials Science, 2005. 41(6): p. 805-823.
17. Rosalbino, F., et al., Effect of silicon and germanium alloying additions on the passivation characteristics of Fe 3 Al intermetallic in sulphuric acid solution. Electrochimica Acta, 2012. 62: p. 305-312.
18. Chiang, W.-C., W.-C. Luu, and J.-K. Wu, Effect of aluminum content on the passivation behavior of Fe–Al alloys in sulfuric acid solution. Journal of materials science, 2006. 41(10): p. 3041-3044.
19. Sharma, G., et al., Aqueous corrosion behavior of iron aluminide intermetallics. Journal of Materials Engineering and Performance, 2007. 16(6): p. 779-783.

66
20. Porcayo-Calderon, J., et al., Corrosion performance of Fe-Al intermetallic coatings in 1.0 M NaOH solution. Int. J. Electrochem. Sci, 2013. 8(11): p. 12205-12218.
21. Ji, G., O. Elkedim, and T. Grosdidier, Deposition and corrosion resistance of HVOF sprayed nanocrystalline iron aluminide coatings. Surface and Coatings Technology, 2005. 190(2): p. 406-416.
22. Liu, T., et al., The electrochemistry corrosion behavior of Fe3Al-type intermetallic with super-hydrophobic surfaces. Materials and Manufacturing Processes, 2010. 25(5): p. 298-301.
23. Rao, V.S., Repassivation behaviour and surface analysis of Fe 3 Al based iron aluminide in 0.25 MH 2 SO 4. Corrosion science, 2005. 47(1): p. 183-194.
24. Huape-Padilla, E., et al., Corrosion study of Fe-Al Intermetallic Alloys in Simulated Acid Rain. Int. J. Electrochem. Sci, 2015. 10: p. 2141-2154.
25. Amiriyan, M., et al., Dry sliding wear behavior of Fe 3 Al and Fe 3 Al/TiC coatings prepared by HVOF. Wear, 2015. 342: p. 154-162.
26. Amiriyan, M., et al., Mechanical Behavior and Sliding Wear Studies on Iron Aluminide Coatings Reinforced with Titanium Carbide. Metals, 2017. 7(5): p. 177.
27. Rosalbino, F., et al., Investigation of passivity and its breakdown on Fe 3 Al–Si and Fe 3 Al–Ge intermetallics in chloride-containing solution. Corrosion Science, 2014. 85: p. 394-400.
28. Negache, M., et al., Effect of Cr, Nb and Zr additions on the aqueous corrosion behavior of iron-aluminide. Intermetallics, 2013. 36: p. 73-80.
29. Rosalbino, F., et al., Effect of copper alloying addition on the electrochemical corrosion behaviour of Fe3Al intermetallic in sulphuric acid solution. Materials and Corrosion, 2016. 67(10): p. 1042-1048.
30. Zamanzade, M., H. Vehoff, and A. Barnoush, Cr effect on hydrogen embrittlement of Fe 3 Al-based iron aluminide intermetallics: Surface or bulk effect. Acta materialia, 2014. 69: p. 210-223.
31. Rao, V.S., R. Baligidad, and V. Raja, Effect of carbon on corrosion behaviour of Fe 3 Al intermetallics in 0.5 N sulphuric acid. Corrosion Science, 2002. 44(3): p. 521-533.
32. McKamey, C., J. Horton, and C. Liu, Effect of chromium on properties of Fe 3 Al. Journal of Materials Research, 1989. 4(05): p. 1156-1163.
33. Keddam, M., O.R. Mattos, and H. Takenouti, Mechanism of anodic dissolution of iron-chromium alloys investigated by electrode impedances—I. Experimental results and reaction model. Electrochimica Acta, 1986. 31(9): p. 1147-1158.
34. Keddam, M., O. Mattos, and H. Takenouti, Mechanism of anodic dissolution of iron-chromium alloys investigated by electrode impedances—II. Elaboration of the reaction model. Electrochimica Acta, 1986. 31(9): p. 1159-1165.
35. Epelboin, I., et al., The dissolution and passivation of Fe and FeCr alloys in acidified sulphate medium: Influences of pH and Cr content. Corrosion Science, 1979. 19(7): p. 1105-1112.
36. Zamanzade, M. and A. Barnoush, An overview of the hydrogen embrittlement of iron aluminides. Procedia Materials Science, 2014. 3: p. 2016-2023.
37. Novák, P., et al., On the formation of intermetallics in Fe–Al system – An in situ XRD study. Intermetallics, 2013. 32(Supplement C): p. 127-136.
38. Taylor, A. and R. Jones, Constitution and magnetic properties of iron-rich iron-aluminum alloys. Journal of Physics and Chemistry of Solids, 1958. 6(1): p. 16-37.
39. Bradley, A. and A. Jay, The formation of superlattices in alloys of iron and aluminium. Proceedings of the Royal Society of London. Series A, Containing Papers of a Mathematical and Physical Character, 1932. 136(829): p. 210-232.
40. Lawley, A. and R. Cahn, A high temperature X-ray study of ordering in iron-aluminium alloys. Journal of Physics and Chemistry of Solids, 1961. 20(3-4): p. 204-221.

67
41. Fu, C., Origin of ordering in B2-type transition-metal aluminides: Comparative study of the defect properties of PdAl, NiAl, and FeAl. Physical Review B, 1995. 52(5): p. 3151.
42. Hasemann, G., et al., Vacancy strengthening in Fe 3 Al iron aluminides. Intermetallics, 2014. 54: p. 95-103.
43. Yasuda, H., et al., Effect of Al concentration on pseudoelasticity in Fe 3 Al single crystals. Acta materialia, 2005. 53(20): p. 5343-5351.
44. Yoshimi, K., S. Hanada, and M. Yoo, Yielding and plastic flow behavior of B2-type Fe-39.5 mol.% A1 single crystals in compression. Acta metallurgica et materialia, 1995. 43(11): p. 4141-4151.
45. Palm, M., Concepts derived from phase diagram studies for the strengthening of Fe–Al-based alloys. Intermetallics, 2005. 13(12): p. 1286-1295.
46. Fu, C. and J. Zou, Site preference of ternary alloying additions in FeAl and NiAl by first-principles calculations. Acta materialia, 1996. 44(4): p. 1471-1478.
47. McKamey, C., J. Horton, and C. Liu, Effect of chromium on properties of Fe 3 Al. Journal of Materials Research, 1989. 4(5): p. 1156-1163.
48. Zamanzade, M. and A. Barnoush, Effect of chromium on the electrochemical properties of iron aluminide intermetallics. Corrosion Science, 2014. 78: p. 223-232.
49. Balasubramaniam, R., On the role of chromium in minimizing room temperature hydrogen embrittlement in iron aluminides. Scripta materialia, 1996. 34(1): p. 127-133.
50. Palm, M., The Al–Cr–Fe system–Phases and phase equilibria in the Al-rich corner. Journal of Alloys and Compounds, 1997. 252(1): p. 192-200.
51. Morris, D., M. Dadras, and M. Morris, The influence of chromium additions on order and ductility in Fe3Al intermetallic. Le Journal de Physique IV, 1993. 3(C7): p. C7-429-C7-434.
52. Ghali, E., V.S. Sastri, and M. Elboujdaini, Corrosion prevention and protection: practical solutions. 2007: John Wiley & Sons.
53. Schweitzer, P.A., Fundamentals of corrosion mechanisms, causes, and preventative methods. 2010, CRC Press: Boca Raton, Fla.
54. Schweitzer, P.A., Fundamentals of corrosion : mechanisms, causes, and preventative methods. 2010, Boca Raton, FL: CRC Press. xxiii, 403 p.
55. Frankel, G.S., Fundamentals of Corrosion Kinetics, in Active Protective Coatings: New-Generation Coatings for Metals, A.E. Hughes, et al., Editors. 2016, Springer Netherlands: Dordrecht. p. 17-32.
56. Revie, R.W. and H.H. Uhlig, Uhlig's corrosion handbook. 2011, Wiley: Hoboken, New Jersey. 57. Standard, A., G59-97. PA: ASTM, 2003. 58. Frangini, S., et al., A combined electrochemical and XPS study on the passivity of B2 iron
aluminides in sulphuric acid solution. Corrosion science, 1997. 39(8): p. 1431-1442. 59. Schaepers, D. and H.-H. Strehblow, An XPS and ISS investigation of passive layers on binary Fe-Al
alloys. Corrosion science, 1997. 39(12): p. 2193-2213. 60. Schaepers, D. and H.H. Strehblow, Surface analytical investigations of electrochemically formed
passive layers on binary Fe/Al alloys. Journal of the Electrochemical Society, 1995. 142(7): p. 2210-2218.
61. Schaepers, D., et al., Electrochemical, ellipsometrical and surface analytical investigations of passive layers on binary Fe/Al alloys. Surface and interface analysis, 1994. 21(6‐7): p. 342-348.
62. Frangini, S., J. Lascovich, and N. De Cristofaro. Pitting susceptibility of chromium modified passive films of a B2-FeAl intermetallic alloy. in Materials Science Forum. 1995. Trans Tech Publ.
63. Ghali, E., Corrosion resistance of aluminum and magnesium alloys : understanding, performance, and testing. 2010, Hoboken, N.J: Wiley. xxi, 719 p.
64. Cottis, R.A. and L.L. Shreir, Shreir's corrosion. 4th ed ed. 2010, Amsterdam: Elsevier. 4 v.

68
65. Arrieta-Gonzalez, C., et al., Electrochemical behavior of Fe3Al modified with Ni in Hank’s solution. International Journal of Electrochemical Science, 2011. 6(9): p. 4016-4031.
66. Sherif, E.-S.M., et al., Corrosion properties in sodium chloride solutions of Al–TiC composites in situ synthesized by HFIHF. Metals, 2015. 5(4): p. 1799-1811.
67. Standard Practice for Conventions Applicable to Electrochemical Measurements in Corrosion Testing.
68. G61-86, A., Standard Test Method for Conducting Cyclic Potentiodynamic Polarization Measurements for Localized Corrosion Susceptibility of Iron-, Nickel-, or Cobalt-Based Alloys. 2009.
69. Frankel, G., Pitting corrosion of metals. A review of the critical factors (vol 145, pg 2186, 1998). JOURNAL OF THE ELECTROCHEMICAL SOCIETY, 1998. 145(8): p. 2970-2970.
70. Touzin, M., Évaluation de la stabilité d'une couche mince de simili-téflon déposée par plasma sur un substrat d'acier inoxydable. 2009, Université Laval.
71. Watson, S., et al., Methods of measuring wear-corrosion synergism. Wear, 1995. 181: p. 476-484.
72. Kendig, M. and J. Scully, Basic aspects of electrochemical impedance application for the life prediction of organic coatings on metals. Corrosion, 1990. 46(1): p. 22-29.
73. Castle, J.E. and D.C. Epler, The correlation of XPS analysis with electrochemical history in aqueous corrosion. Surface Science, 1975. 53(1): p. 286-296.
74. Schaepers, D. and H.H. Strehblow, An XPS and ISS investigation of passive layers on binary Fe-Al alloys. Corrosion Science, 1997. 39(12): p. 2193-2213.
75. Rao, V.S. and V. Raja, Anodic polarization and surface composition of Fe-16Al-0.14 C alloy in 0.25 M sulfuric acid. Corrosion, 2003. 59(7): p. 575-583.
76. Metco, S., An introduction to thermal spray. Caderno informativo do fabricante, 2014. 6. 77. Amin, S. and H. Panchal, A review on thermal spray coating processes. transfer, 2016. 2(4). 78. Amiriyan, M., et al., Tribo-Mechanical Properties of HVOF Deposited Fe3Al Coatings Reinforced
with TiB2 Particles for Wear-Resistant Applications. Materials, 2016. 9(2): p. 117. 79. Standard, A., G102-89. Calculation of corrosion rates and related information from
electrochemical measurements, Annual Book of ASTM Standards, ASTM International, Philadelphia, 2004.
80. Standard, A., G59–97: Standard Test Method for Conducting Potentiodynamic Polarization Resistance Measurements. Annual Book of ASTM Standards, 2009. 3.
81. Devos, O., C. Gabrielli, and B. Tribollet, Simultaneous EIS and in situ microscope observation on a partially blocked electrode application to scale electrodeposition. Electrochimica Acta, 2006. 51(8–9): p. 1413-1422.
82. Osório, W.R., E.S. Freitas, and A. Garcia, EIS and potentiodynamic polarization studies on immiscible monotectic Al–In alloys. Electrochimica Acta, 2013. 102: p. 436-445.
83. Jorcin, J.-B., et al., CPE analysis by local electrochemical impedance spectroscopy. Electrochimica Acta, 2006. 51(8): p. 1473-1479.
84. Lavrenko, V.A., et al., Kinetics and mechanism of electrolytic corrosion of titanium-based ceramics in 3% NaCl solution. Journal of the European Ceramic Society, 2005. 25(10): p. 1813-1818.
85. Agarwal, A., M. Akhtar, and R. Balasubramaniam, Effect of alloying on aqueous corrosion and mechanical behaviour of iron aluminide Fe3Al. Journal of materials science, 1996. 31(19): p. 5207-5213.
86. Sharma, G., et al., Aqueous Corrosion Behavior of Iron aluminide Intermetallics. Journal of Materials Engineering and Performance, 2007. 16(6): p. 779-783.