![POST U ( 2015 ) Chimiothérapie dans l’adénocarcinome du ... · PDF filedu pancréas : actualités; ... (TNCD)–[2]. – Pour– les– 80 ... néo-adjuvante dans le cancer du](https://static.fdocuments.fr/doc/165x107/5a7368237f8b9ac0538e964d/post-u-2015-chimiotherapie-dans-ladenocarcinome-du-du-pancreas.jpg)
Que$peuton$aendre$de$la chimiothérapie$dans$le$cancer$de ... · Que$peuton$aendre$de$la...
42
Que peut on a*endre de la chimiothérapie dans le cancer de l’estomac? P. Michel Service d’HépatoGastroentérologie et Nutri@on, CHU de Rouen
Transcript of Que$peuton$aendre$de$la chimiothérapie$dans$le$cancer$de ... · Que$peuton$aendre$de$la...
Que peut on a*endre de la chimiothérapie dans le cancer de
l’estomac? P. Michel
Service d’Hépato-‐Gastroentérologie et Nutri@on, CHU de Rouen
XXe siècle
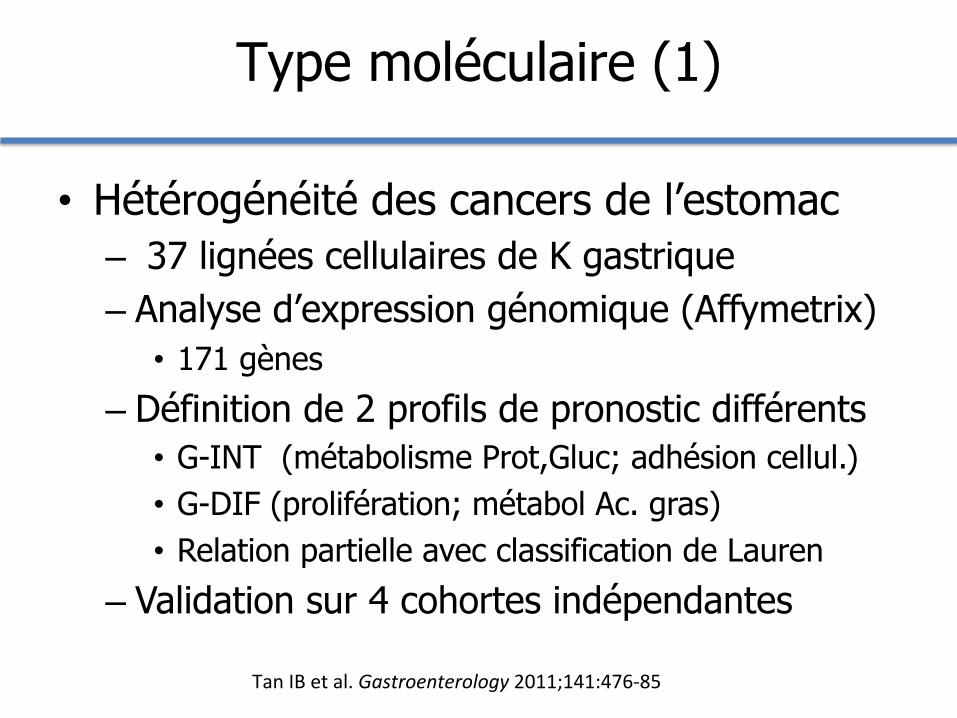
• Hétérogénéité des cancers de l’estomac – 37 lignées cellulaires de K gastrique – Analyse d’expression génomique (Affymetrix)
• 171 gènes
– Définition de 2 profils de pronostic différents • G-INT (métabolisme Prot,Gluc; adhésion cellul.) • G-DIF (prolifération; métabol Ac. gras) • Relation partielle avec classification de Lauren
– Validation sur 4 cohortes indépendantes
Type moléculaire (1)
Tan IB et al. Gastroenterology 2011;141:476-‐85

• Analyse TMA – LGALS4>1+ et CDH17>2+ = G-INT – LGALS4 – et CDH17 - = G-DIF
• Réponse à la chimio. (lignées cellulaires)
Type moléculaire (2)
Survie G-DIF<G-INT HR ajusté
1,95 IC 95% 1,13-3,38
Tan IB et al. Gastroenterology 2011;141:476-‐85

Oncologue

Qu’apporte la chimiothérapie?
1. maladie localisée 2. maladie métasta@que
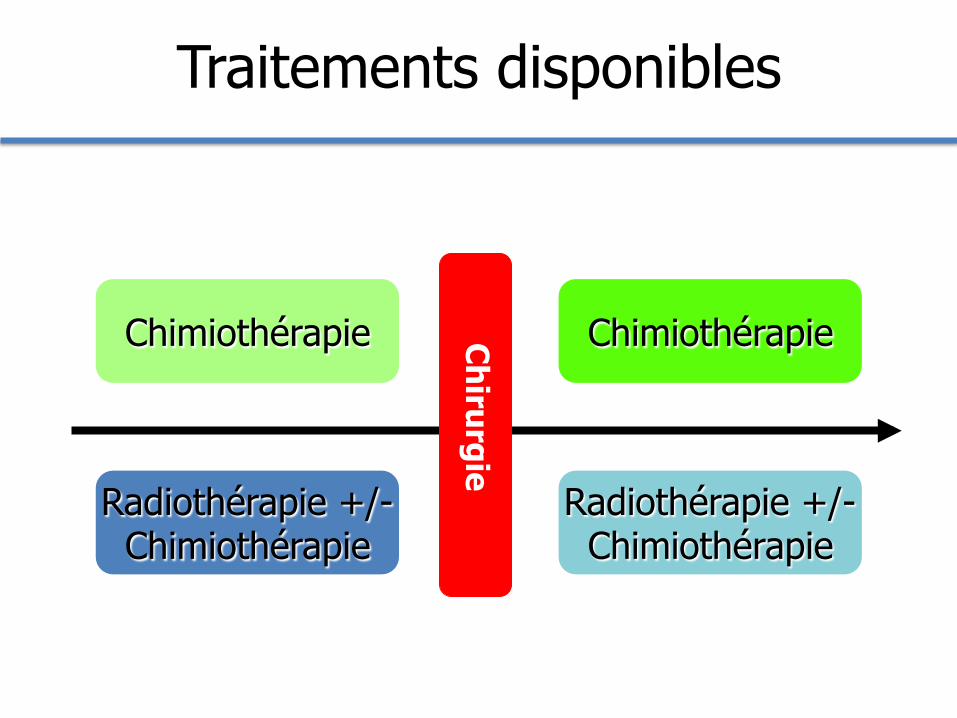
Traitements disponibles
Chirurgie
Radiothérapie +/- Chimiothérapie
Radiothérapie +/- Chimiothérapie
Chimiothérapie Chimiothérapie
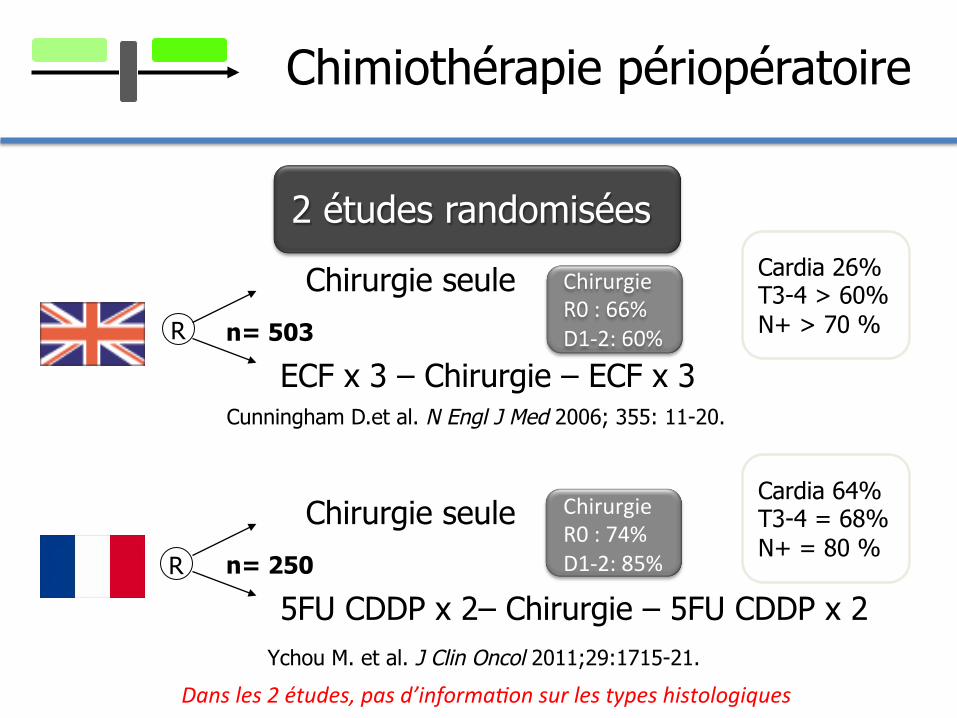
Chimiothérapie périopératoire
2 études randomisées
Chirurgie seule
ECF x 3 – Chirurgie – ECF x 3 n= 503
Chirurgie seule
5FU CDDP x 2– Chirurgie – 5FU CDDP x 2 n= 250
Cunningham D.et al. N Engl J Med 2006; 355: 11-20.
Ychou M. et al. J Clin Oncol 2011;29:1715-21.
R
R
Cardia 26% T3-4 > 60% N+ > 70 %
Cardia 64% T3-4 = 68% N+ = 80 %
Chirurgie R0 : 66% D1-‐2: 60%
Chirurgie R0 : 74% D1-‐2: 85%
Dans les 2 études, pas d’informa8on sur les types histologiques
713162738537911114172741536593113
0,00
0,20
0,40
0,60
0,80
1,00
0 1 2 3 4 5 6 7A risque
logrank : p = 0,021
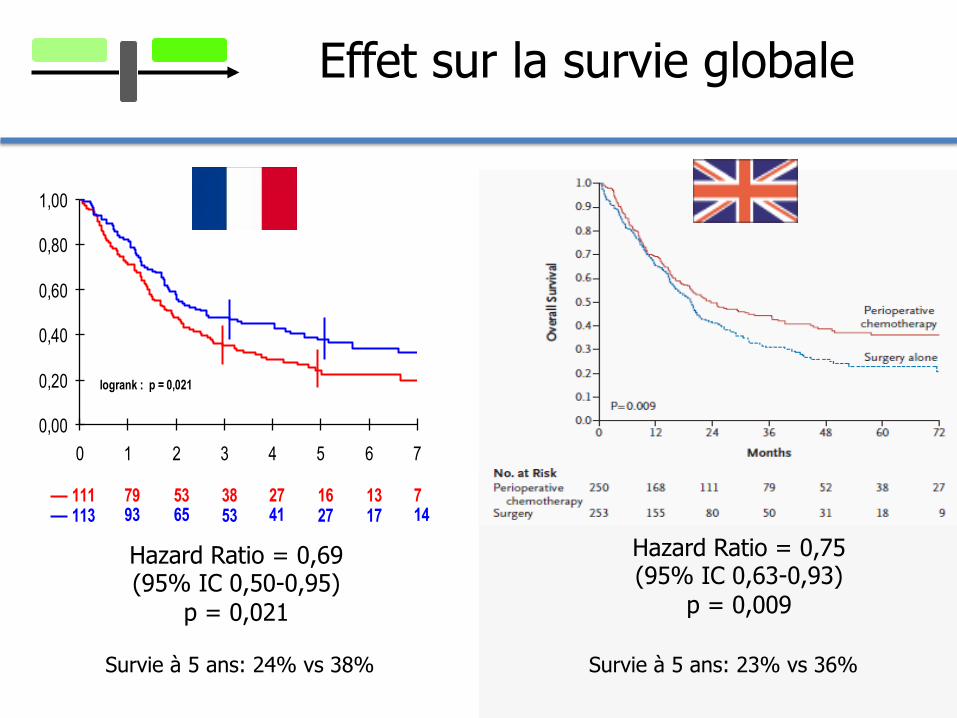
Survie à 5 ans: 24% vs 38%
Hazard Ratio = 0,69 (95% IC 0,50-0,95)
p = 0,021
Hazard Ratio = 0,75 (95% IC 0,63-0,93)
p = 0,009
Survie à 5 ans: 23% vs 36%
Effet sur la survie globale

713162738537911114172741536593113
0,00
0,20
0,40
0,60
0,80
1,00
0 1 2 3 4 5 6 7A risque
logrank : p = 0,021
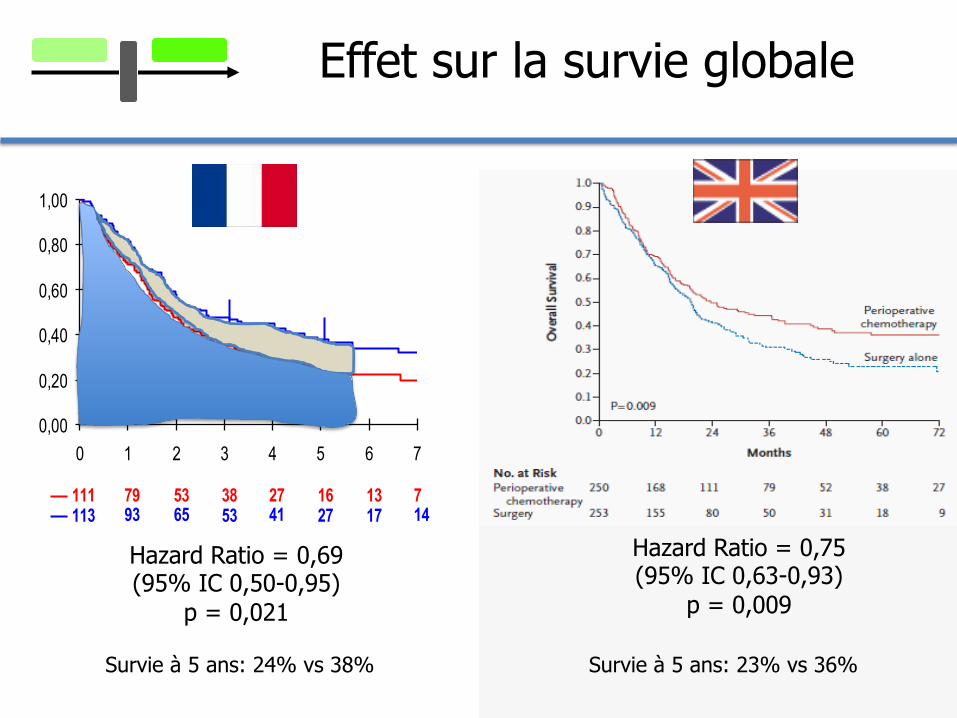
Survie à 5 ans: 24% vs 38%
Hazard Ratio = 0,69 (95% IC 0,50-0,95)
p = 0,021
Hazard Ratio = 0,75 (95% IC 0,63-0,93)
p = 0,009
Survie à 5 ans: 23% vs 36%
Effet sur la survie globale
713162738537911114172741536593113
0,00
0,20
0,40
0,60
0,80
1,00
0 1 2 3 4 5 6 7A risque
logrank : p = 0,021
Survie à 5 ans: 24% vs 38%
Hazard Ratio = 0,69 (95% IC 0,50-0,95)
p = 0,021
Hazard Ratio = 0,75 (95% IC 0,63-0,93)
p = 0,009
Survie à 5 ans: 23% vs 36%
Effet sur la survie globale

Chimiothérapie postopératoire
JAMA 2010;303:1729-37.
meta-analyse de 17 essais randomisés, 3838 patients
HR survie globale 0,83 (95% IC 0,74 – 0,94)
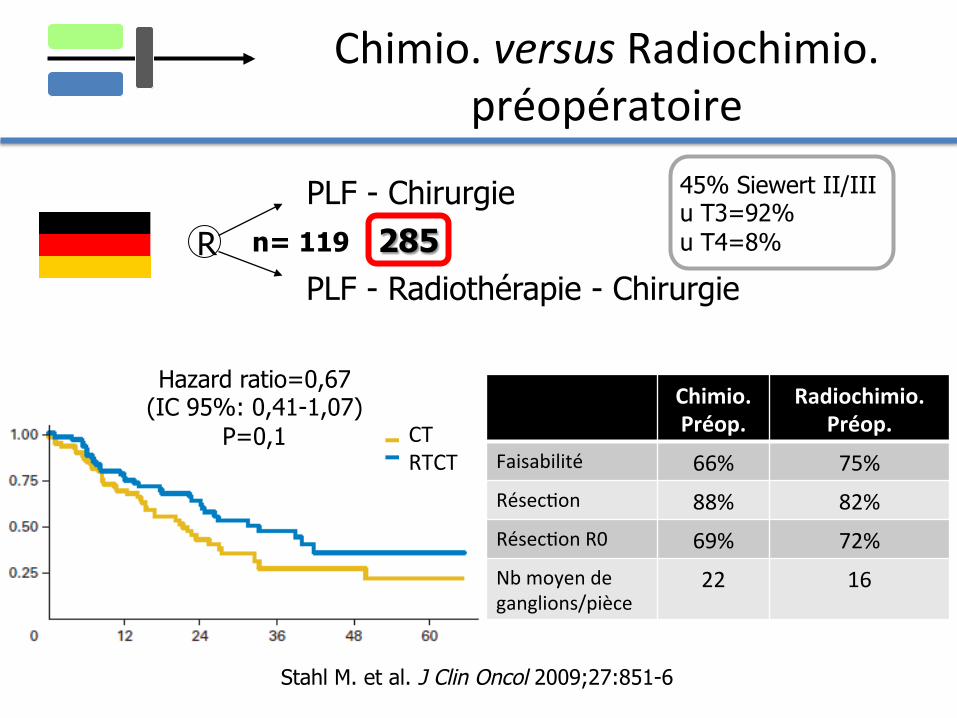
Chimio. versus Radiochimio. préopératoire
PLF - Chirurgie
PLF - Radiothérapie - Chirurgie n= 119 R
Stahl M. et al. J Clin Oncol 2009;27:851-6
45% Siewert II/III u T3=92% u T4=8%
Hazard ratio=0,67 (IC 95%: 0,41-1,07)
P=0,1 CT RTCT
Chimio. Préop.
Radiochimio. Préop.
Faisabilité 66% 75% Résec@on 88% 82% Résec@on R0 69% 72% Nb moyen de ganglions/pièce
22 16
285

Qu’apporte la chimiothérapie?
1. maladie localisée 2. maladie métasta@que

Comparaison de chimiothérapies classiques
J Clin Oncol 2006;24:4991-‐97
9 mois

Tyrosines kinases membranaires
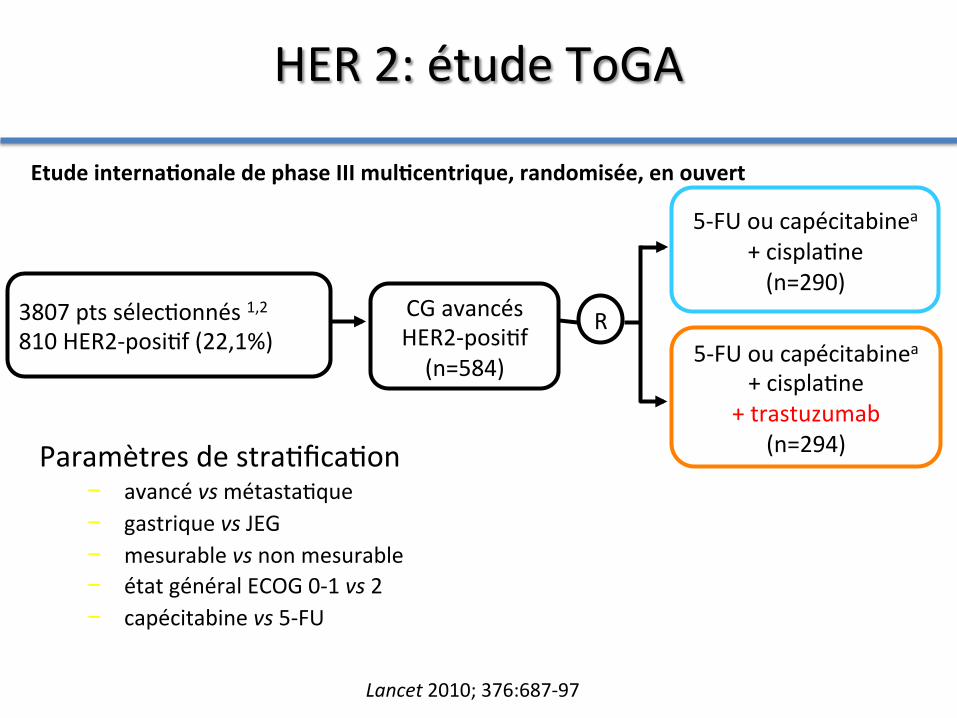
CG avancés HER2-‐posi@f (n=584)
5-‐FU ou capécitabinea + cispla@ne (n=290)
R 5-‐FU ou capécitabinea
+ cispla@ne + trastuzumab
(n=294) Paramètres de stra@fica@on − avancé vs métasta@que − gastrique vs JEG − mesurable vs non mesurable − état général ECOG 0-‐1 vs 2 − capécitabine vs 5-‐FU
Etude interna5onale de phase III mul5centrique, randomisée, en ouvert
3807 pts sélec@onnés 1,2 810 HER2-‐posi@f (22,1%)
HER 2: étude ToGA
Lancet 2010; 376:687-‐97
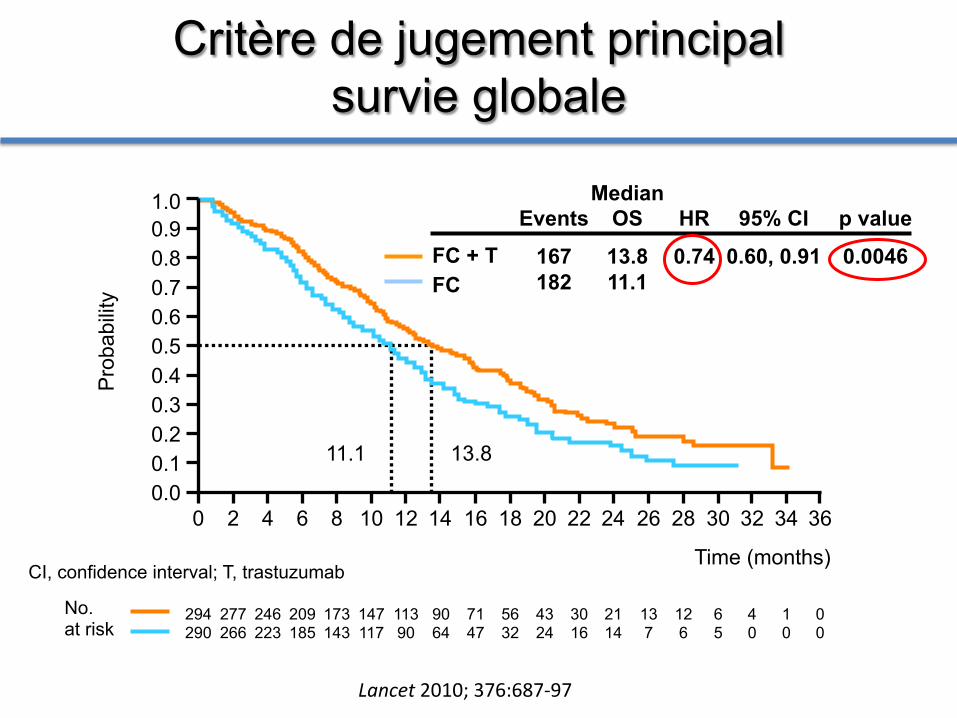
Critère de jugement principal survie globale
Time (months)
294 290
277 266
246 223
209 185
173 143
147 117
113 90
90 64
71 47
56 32
43 24
30 16
21 14
13 7
12 6
6 5
4 0
1 0
0 0
No. at risk
11.1 13.8
0.0 0.1 0.2 0.3 0.4 0.5 0.6 0.7 0.8 0.9 1.0
0 2 4 6 8 10 12 14 16 18 20 22 24 26 28 30 32 34 36
FC + T FC
CI, confidence interval; T, trastuzumab
Events
167 182
HR
0.74
95% CI
0.60, 0.91
p value
0.0046
Median OS
13.8 11.1
Pro
babi
lity
Lancet 2010; 376:687-‐97
11 3
1,0
0,8
0,6
0,4
0,2
0,0
36 34 32 30 28 26 24 22 20 18 16 14 12 10 8 6 4 2 0 Temps (mois)
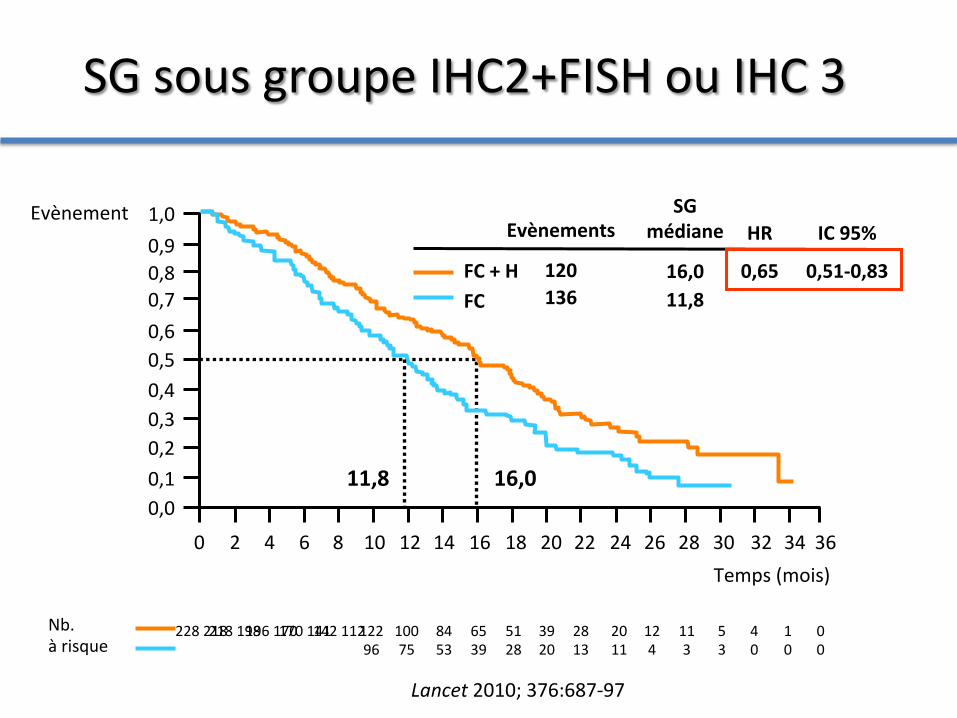
11,8 16,0
FC + H FC
Evènements
120 136
HR
0,65
IC 95%
0,51-‐0,83
SG médiane
16,0 11,8
Evènement
0,1
0,3
0,5
0,7
0,9
218 198
4 0
5 3
12 4
20 11
228 218
196 170 170 141
142 112
122 96
100 75
84 53
65 39
51 28
1 0
0 0
Nb. à risque
39 20
28 13
SG sous groupe IHC2+FISH ou IHC 3
Lancet 2010; 376:687-‐97
0
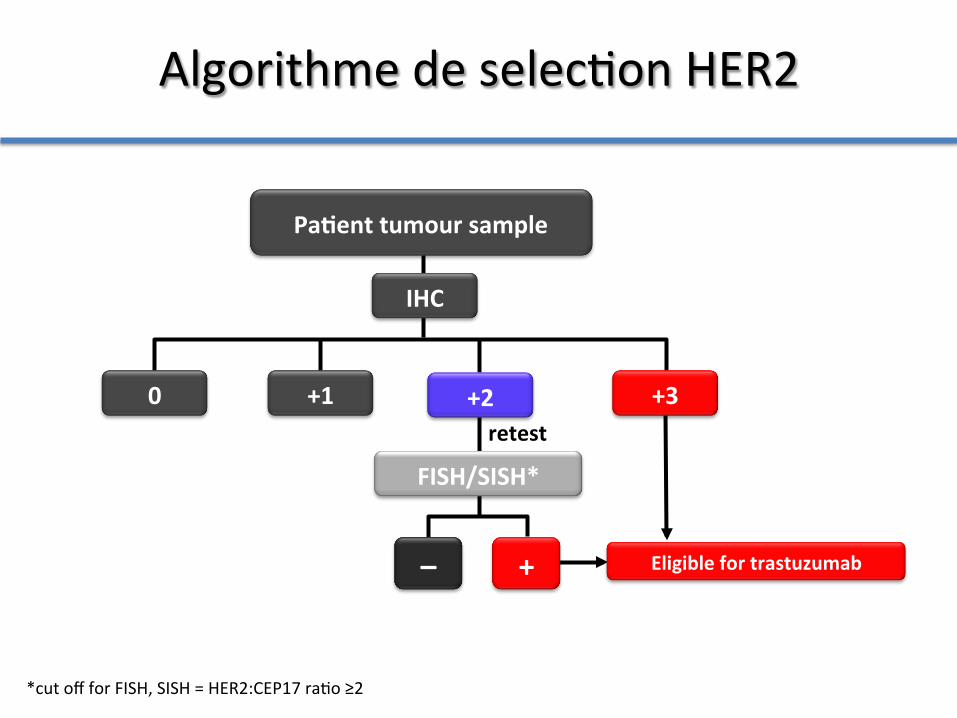
FISH/SISH*
+ – Eligible for trastuzumab
+1 +3
IHC
Pa5ent tumour sample
+2
*cut off for FISH, SISH = HER2:CEP17 ra@o ≥2
retest
Algorithme de selec@on HER2
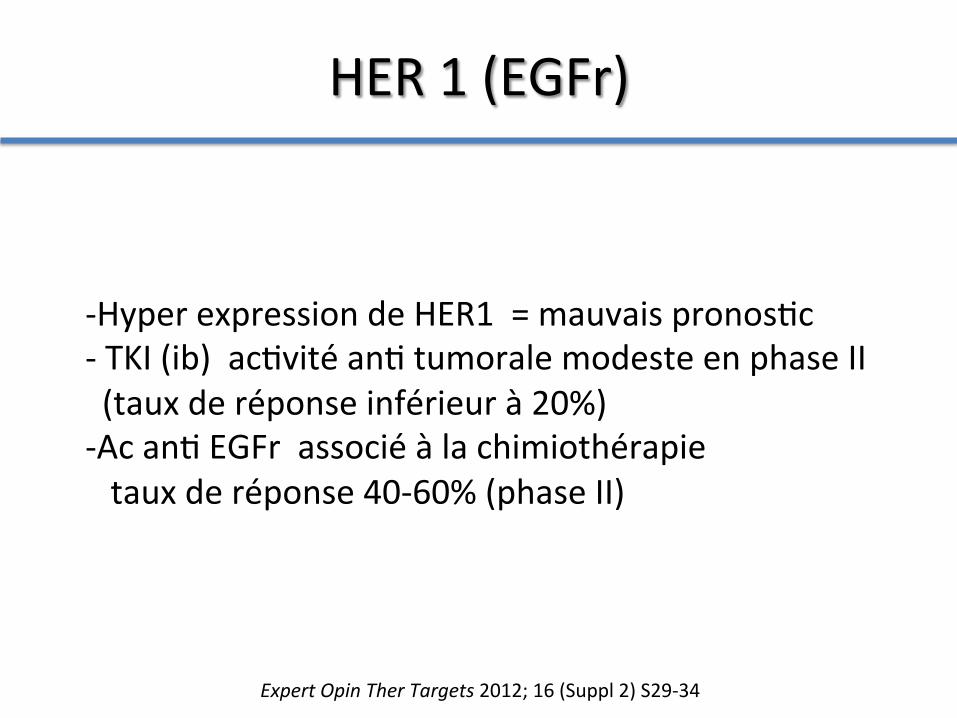
HER 1 (EGFr)
-‐ Hyper expression de HER1 = mauvais pronos@c -‐ TKI (ib) ac@vité an@ tumorale modeste en phase II (taux de réponse inférieur à 20%) -‐ Ac an@ EGFr associé à la chimiothérapie taux de réponse 40-‐60% (phase II)
Expert Opin Ther Targets 2012; 16 (Suppl 2) S29-‐34
Phase III EXPAND
Articles
494 www.thelancet.com/oncology Vol 14 May 2013
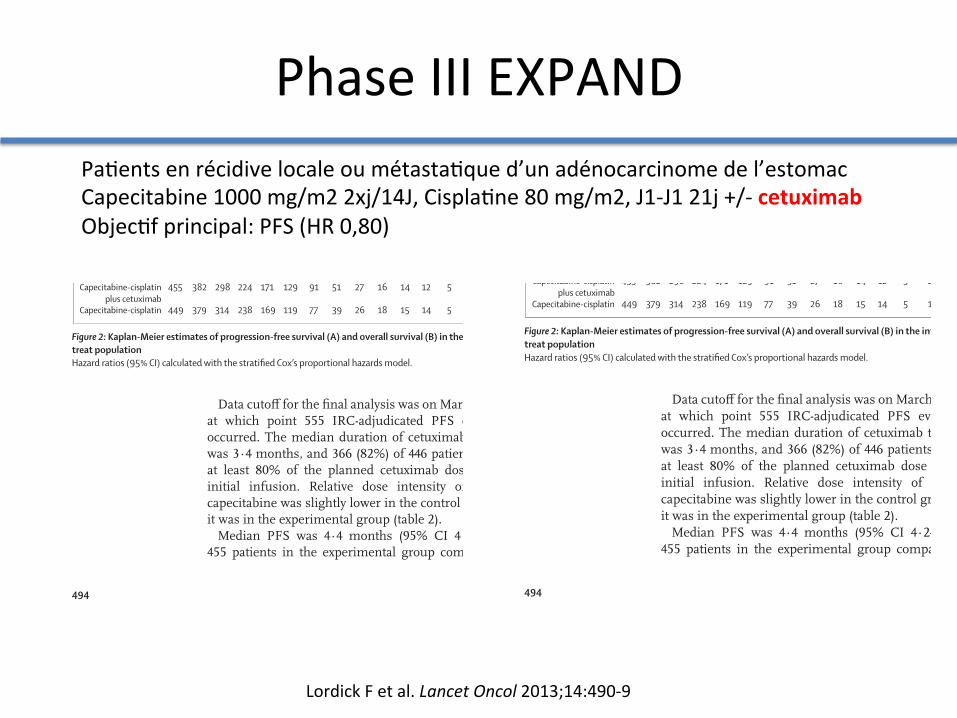
Data cutoff for the fi nal analysis was on March 31, 2012, at which point 555 IRC-adjudicated PFS events had occurred. The median duration of cetuximab treatment was 3·4 months, and 366 (82%) of 446 patients received at least 80% of the planned cetuximab dose after the initial infusion. Relative dose intensity of cisplatin-capecitabine was slightly lower in the control group than it was in the experimental group (table 2).
Median PFS was 4·4 months (95% CI 4·2–5·5) for 455 patients in the experimental group compared with
5·6 months (5·1–5·7) for 449 controls (HR 1·09 [95% CI 0·92–1·29], p=0·32; fi gure 2). Median overall survival time was not substantially diff erent between groups (fi gure 2). Median follow-up was 22·4 months (95% CI 21·3–24·0) in the experimental group and 21·0 months (20·0–24·9) in the control group. By data analysis (cutoff March 31, 2012), 362 (80%) patients in the experimental group had died, as had 351 (78%) in the control group. The number of patients who had an overall response or achieved disease control seemed similar between treatment groups (table 3).
241 (53%) of 455 patients in the experimental group and 238 (53%) of 449 controls received second-line treat-ment (appendix).
In general, we noted few diff erences between treatment groups for either PFS or overall survival in an analysis of predefi ned subgroups (fi gure 3). Notably, patients aged 65 years or older might have benefi ted in terms of PFS after receipt of capecitabine-cisplatin compared with capecitabine-cisplatin plus cetuximab.
Between treatment groups, PFS and overall survival were similar in patients with fi rst-cycle acne-like rash (256 patients in the experimental group and eight controls) compared with those without fi rst-cycle acne-like rash (147 patients and 419 patients; fi gure 3).
In both treatment groups, patients with HER2-positive tumours had longer median overall survival (fi gure 3) and better overall response than did patients with HER2-negative tumours. In the experimental group, 37 (51%, 95% CI 39–63) of 72 patients with HER2-positive tumours responded to treatment (ie, had an IRC adjudicated complete or partial response) compared with 76 (27%, 22–33) of 281 patients with HER2-negative tumours. In the control group, 27 (38%, 26–50) of 72 patients with HER2-positive tumours responded to treatment compared with 67 (26%, 21–32) of 254 patients with HER2-negative tumours. Tumour EGFR expression was assessable in 398 patients in the experimental group and 376 controls. The EGFR immunohisto chemistry score was low; median score was 0. We noted no substantial diff erences between the
Figure 2: Kaplan-Meier estimates of progression-free survival (A) and overall survival (B) in the intention-to-treat populationHazard ratios (95% CI) calculated with the stratifi ed Cox’s proportional hazards model.
Number at riskCapecitabine-cisplatin
plus cetuximabCapecitabine-cisplatin
455 233 94 44 30 20 14
449 244 116 50 29 14 10
Prog
ress
ion-
free s
urvi
val (
%)
0
10
20
30
40
50
60
70
80
90
100
12 15 18 21 24 27 30 33 36 39 42
Number at riskCapecitabine-cisplatin
plus cetuximabCapecitabine-cisplatin
455 382 298 224 171 129 91 51 27 16 14 12
449 379 314 238 169 119 77 39 26 18 15 14
8 4 4 3 3 1 1
4 4 4 4 2 0 0
0
0
5 2 1 0
5 1 0 0
Over
all s
urvi
val (
%)
0
10
20
30
40
50
60
70
80
90
100
0 3 6 9
Time from randomisation (months)12 15 18 21 24 27 30 33 36 39 420 3 6 9 45
A
B
Capecitabine-cisplatin plus cetuximab (286 events; median progression-free survival 4·4 months [95% CI 4·2–5·5])Capecitabine-cisplatin (269 events; median progression-free survival 5·6 months [95% CI 5·1–5·7])
Stratified HR 1·09 (95% CI 0·92–1·29; p=0·32)
Capecitabine-cisplatin plus cetuximab (362 events; median overall survival 9·4 months [95% CI 8·3–10·6])Capecitabine-cisplatin (351 events; median overall survival 10·7 months [95% CI 9·4–11·3])
Stratified HR 1·00 (95% CI 0·87–1·17; p=0·95)
Capecitabine-cisplatin plus cetuximab group (n=455)
Capecitabine-cisplatin group (n=449)
Complete response 2 (<1%) 2 (<1%)
Partial response 134 (29%) 129 (29%)
Stable disease 196 (43%) 186 (41%)
Progressive disease 65 (14%) 61 (14%)
Unknown* 58 (13%) 71 (16%)
Overall response† 136 (30%, 26–34) 131 (29%, 25–34)
Disease control 332 (73%, 69–77) 317 (71%, 66–75)
Data are n (%) or n (%, 95% CI). *The main reasons for unknown responses were no assessable target lesions at baseline, no assessable post-baseline scan (not done, partly missing, or quality issues), or pleural eff usion or ascites. †Odds ratio 1·04 (95% CI 0·78–1·39, p=0·77).
Table 3: Best overall response
Articles
494 www.thelancet.com/oncology Vol 14 May 2013
Data cutoff for the fi nal analysis was on March 31, 2012, at which point 555 IRC-adjudicated PFS events had occurred. The median duration of cetuximab treatment was 3·4 months, and 366 (82%) of 446 patients received at least 80% of the planned cetuximab dose after the initial infusion. Relative dose intensity of cisplatin-capecitabine was slightly lower in the control group than it was in the experimental group (table 2).
Median PFS was 4·4 months (95% CI 4·2–5·5) for 455 patients in the experimental group compared with
5·6 months (5·1–5·7) for 449 controls (HR 1·09 [95% CI 0·92–1·29], p=0·32; fi gure 2). Median overall survival time was not substantially diff erent between groups (fi gure 2). Median follow-up was 22·4 months (95% CI 21·3–24·0) in the experimental group and 21·0 months (20·0–24·9) in the control group. By data analysis (cutoff March 31, 2012), 362 (80%) patients in the experimental group had died, as had 351 (78%) in the control group. The number of patients who had an overall response or achieved disease control seemed similar between treatment groups (table 3).
241 (53%) of 455 patients in the experimental group and 238 (53%) of 449 controls received second-line treat-ment (appendix).
In general, we noted few diff erences between treatment groups for either PFS or overall survival in an analysis of predefi ned subgroups (fi gure 3). Notably, patients aged 65 years or older might have benefi ted in terms of PFS after receipt of capecitabine-cisplatin compared with capecitabine-cisplatin plus cetuximab.
Between treatment groups, PFS and overall survival were similar in patients with fi rst-cycle acne-like rash (256 patients in the experimental group and eight controls) compared with those without fi rst-cycle acne-like rash (147 patients and 419 patients; fi gure 3).
In both treatment groups, patients with HER2-positive tumours had longer median overall survival (fi gure 3) and better overall response than did patients with HER2-negative tumours. In the experimental group, 37 (51%, 95% CI 39–63) of 72 patients with HER2-positive tumours responded to treatment (ie, had an IRC adjudicated complete or partial response) compared with 76 (27%, 22–33) of 281 patients with HER2-negative tumours. In the control group, 27 (38%, 26–50) of 72 patients with HER2-positive tumours responded to treatment compared with 67 (26%, 21–32) of 254 patients with HER2-negative tumours. Tumour EGFR expression was assessable in 398 patients in the experimental group and 376 controls. The EGFR immunohisto chemistry score was low; median score was 0. We noted no substantial diff erences between the
Figure 2: Kaplan-Meier estimates of progression-free survival (A) and overall survival (B) in the intention-to-treat populationHazard ratios (95% CI) calculated with the stratifi ed Cox’s proportional hazards model.
Number at riskCapecitabine-cisplatin
plus cetuximabCapecitabine-cisplatin
455 233 94 44 30 20 14
449 244 116 50 29 14 10
Prog
ress
ion-
free s
urvi
val (
%)
0
10
20
30
40
50
60
70
80
90
100
12 15 18 21 24 27 30 33 36 39 42
Number at riskCapecitabine-cisplatin
plus cetuximabCapecitabine-cisplatin
455 382 298 224 171 129 91 51 27 16 14 12
449 379 314 238 169 119 77 39 26 18 15 14
8 4 4 3 3 1 1
4 4 4 4 2 0 0
0
0
5 2 1 0
5 1 0 0
Over
all s
urvi
val (
%)
0
10
20
30
40
50
60
70
80
90
100
0 3 6 9
Time from randomisation (months)12 15 18 21 24 27 30 33 36 39 420 3 6 9 45
A
B
Capecitabine-cisplatin plus cetuximab (286 events; median progression-free survival 4·4 months [95% CI 4·2–5·5])Capecitabine-cisplatin (269 events; median progression-free survival 5·6 months [95% CI 5·1–5·7])
Stratified HR 1·09 (95% CI 0·92–1·29; p=0·32)
Capecitabine-cisplatin plus cetuximab (362 events; median overall survival 9·4 months [95% CI 8·3–10·6])Capecitabine-cisplatin (351 events; median overall survival 10·7 months [95% CI 9·4–11·3])
Stratified HR 1·00 (95% CI 0·87–1·17; p=0·95)
Capecitabine-cisplatin plus cetuximab group (n=455)
Capecitabine-cisplatin group (n=449)
Complete response 2 (<1%) 2 (<1%)
Partial response 134 (29%) 129 (29%)
Stable disease 196 (43%) 186 (41%)
Progressive disease 65 (14%) 61 (14%)
Unknown* 58 (13%) 71 (16%)
Overall response† 136 (30%, 26–34) 131 (29%, 25–34)
Disease control 332 (73%, 69–77) 317 (71%, 66–75)
Data are n (%) or n (%, 95% CI). *The main reasons for unknown responses were no assessable target lesions at baseline, no assessable post-baseline scan (not done, partly missing, or quality issues), or pleural eff usion or ascites. †Odds ratio 1·04 (95% CI 0·78–1·39, p=0·77).
Table 3: Best overall response
Lordick F et al. Lancet Oncol 2013;14:490-‐9
Pa@ents en récidive locale ou métasta@que d’un adénocarcinome de l’estomac Capecitabine 1000 mg/m2 2xj/14J, Cispla@ne 80 mg/m2, J1-‐J1 21j +/-‐ cetuximab Objec@f principal: PFS (HR 0,80)
Articles
www.thelancet.com/oncology Vol 14 May 2013 495
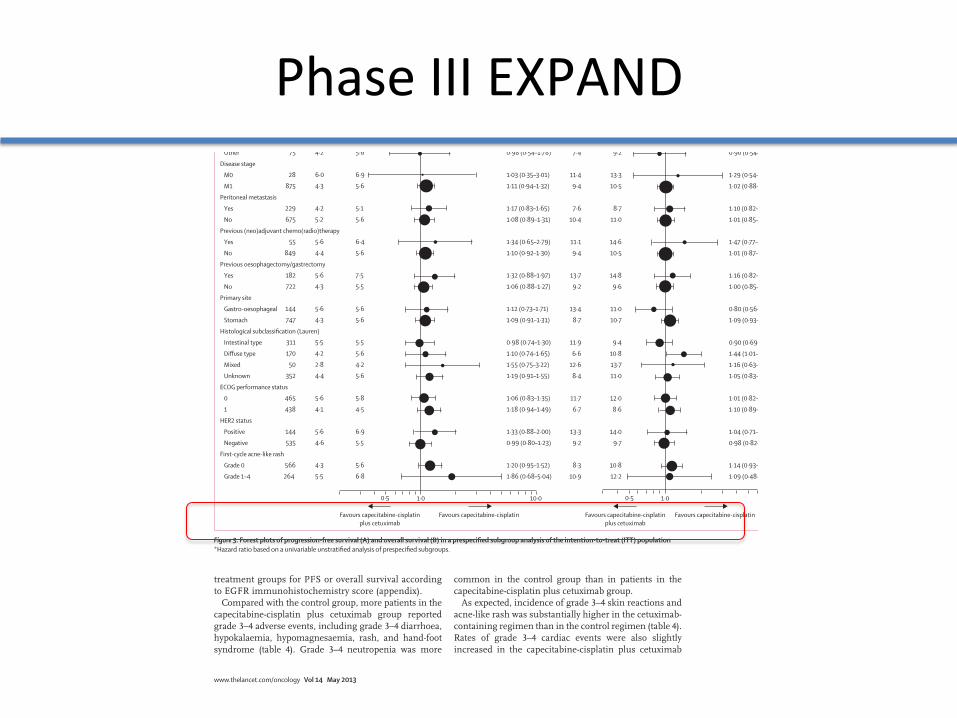
treatment groups for PFS or overall survival according to EGFR immuno histochemistry score (appendix).
Compared with the control group, more patients in the capecitabine-cisplatin plus cetuximab group reported grade 3–4 adverse events, including grade 3–4 diarrhoea, hypokalaemia, hypomagnesaemia, rash, and hand-foot syndrome (table 4). Grade 3–4 neutropenia was more
common in the control group than in patients in the capecitabine-cisplatin plus cetuximab group.
As expected, incidence of grade 3–4 skin reactions and acne-like rash was substantially higher in the cetuximab-containing regimen than in the control regimen (table 4). Rates of grade 3–4 cardiac events were also slightly increased in the capecitabine-cisplatin plus cetuximab
Median progression-free survival (months)
Hazard ratio*(95% CI)
ITT
Age
<65 years
≥65 years
Sex
Male
Female
Ethnic origin
White
Asian
Other
Disease stage
M0
M1
Peritoneal metastasis
Yes
No
Previous (neo)adjuvant chemo(radio)therapy
Yes
No
Previous oesophagectomy/gastrectomy
Yes
No
Primary site
Gastro-oesophageal
Stomach
Histological subclassification (Lauren)
Intestinal type
Diffuse type
Mixed
Unknown
ECOG performance status
0
1
HER2 status
Positive
Negative
First-cycle acne-like rash
Grade 0
Grade 1–4
1·10 (0·93–1·30)
1·03 (0·84–1·26)
1·37 (1·01–1·86)
1·08 (0·89–1·31)
1·22 (0·87–1·71)
1·15 (0·92–1·45)
1·13 (0·86–1·48)
0·98 (0·54–1·78)
1·03 (0·35–3·01)
1·11 (0·94–1·32)
1·17 (0·83–1·65)
1·08 (0·89–1·31)
1·34 (0·65–2·79)
1·10 (0·92–1·30)
1·32 (0·88–1·97)
1·06 (0·88–1·27)
1·12 (0·73–1·71)
1·09 (0·91–1·31)
0·98 (0·74–1·30)
1·10 (0·74–1·65)
1·55 (0·75–3·22)
1·19 (0·91–1·55)
1·06 (0·83–1·35)
1·18 (0·94–1·49)
1·33 (0·88–2·00)
0·99 (0·80–1·23)
1·20 (0·95–1·52)
1·86 (0·68–5·04)
Patients
904
624
280
673
231
490
339
75
28
875
229
675
55
849
182
722
144
747
311
170
50
352
465
438
144
535
566
264
5·6
5·6
5·6
5·6
4·7
5·7
5·5
5·6
6·9
5·6
5·1
5·6
6·4
5·6
7·5
5·5
5·6
5·6
5·5
5·6
4·2
5·6
5·8
4·5
6·9
5·5
5·6
6·8
4·4
4·5
4·4
5·5
4·1
4·8
4·2
4·2
6·0
4·3
4·2
5·2
5·6
4·4
5·6
4·3
5·6
4·3
5·5
4·2
2·8
4·4
5·6
4·1
5·6
4·6
4·3
5·5
Capecitabine-cisplatin plus cetuximab
Capecitabine-cisplatin
Median overall survival (months)
Hazard ratio*(95% CI)
1·03 (0·89–1·19)
1·07 (0·90–1·28)
0·95 (0·73–1·24)
1·04 (0·88–1·23)
1·00 (0·75–1·34)
0·96 (0·79–1·17)
1·19 (0·93–1·52)
0·90 (0·54–1·50)
1·29 (0·54–3·07)
1·02 (0·88–1·18)
1·10 (0·82–1·47)
1·01 (0·85–1·20)
1·47 (0·77–2·79)
1·01 (0·87–1·17)
1·16 (0·82–1·64)
1·00 (0·85–1·17)
0·80 (0·56–1·16)
1·09 (0·93–1·29)
0·90 (0·69–1·16)
1·44 (1·01–2·03)
1·16 (0·63–2·16)
1·05 (0·83–1·32)
1·01 (0·82–1·24)
1·10 (0·89–1·35)
1·04 (0·71–1·53)
0·98 (0·82–1·19)
1·14 (0·93–1·41)
1·09 (0·48–2·46)
10·7
11·0
9·9
11·0
8·7
9·7
11·4
9·2
13·3
10·5
8·7
11·0
14·6
10·5
14·8
9·6
11·0
10·7
9·4
10·8
13·7
11·0
12·0
8·6
14·0
9·7
10·8
12·2
9·4
9·4
9·6
10·0
7·2
9·6
10·5
7·4
11·4
9·4
7·6
10·4
11·1
9·4
13·7
9·2
13·4
8·7
11·9
6·6
12·6
8·4
11·7
6·7
13·3
9·2
8·3
10·9
Capecitabine-cisplatin plus cetuximab
Capecitabine-cisplatin
Favours capecitabine-cisplatinplus cetuximab
Favours capecitabine-cisplatin
1·00·5 10·0
Favours capecitabine-cisplatinplus cetuximab
Favours capecitabine-cisplatin
1·00·5
BA
Figure 3: Forest plots of progression-free survival (A) and overall survival (B) in a prespecifi ed subgroup analysis of the intention-to-treat (ITT) population*Hazard ratio based on a univariable unstratifi ed analysis of prespecifi ed subgroups.
Phase III EXPAND
Phase III REAL3
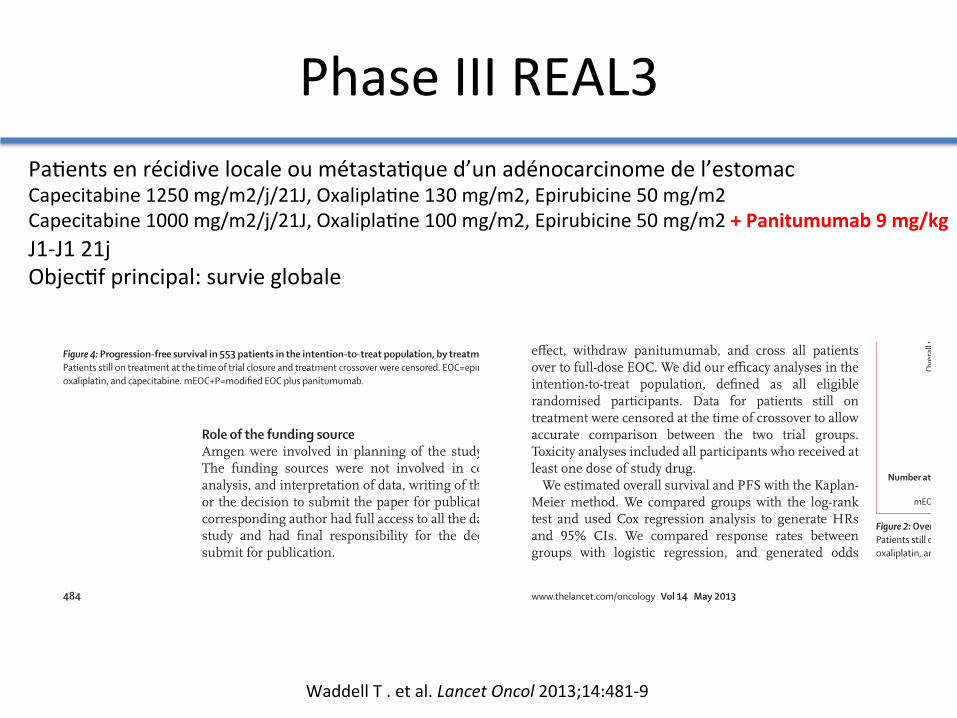
Waddell T . et al. Lancet Oncol 2013;14:481-‐9
Pa@ents en récidive locale ou métasta@que d’un adénocarcinome de l’estomac Capecitabine 1250 mg/m2/j/21J, Oxalipla@ne 130 mg/m2, Epirubicine 50 mg/m2 Capecitabine 1000 mg/m2/j/21J, Oxalipla@ne 100 mg/m2, Epirubicine 50 mg/m2 + Panitumumab 9 mg/kg J1-‐J1 21j Objec@f principal: survie globale
Articles
www.thelancet.com/oncology Vol 14 May 2013 483
methods are available in the appendix. Results from patient-reported outcomes will be reported separately.
Data for patients recruited at Royal Marsden Hospital were subject to source data verifi cation by trust-appointed monitoring staff . For other UK centres, the sponsor deemed it appropriate, in keeping with good clinical practice requirements, to undertake central monitoring and provide sites with training meetings and written guidance to ensure appropriate conduct of the trial. Participating centres were required to provide evidence confi rming patient eligibility, including blood test results, histopathology reports, and imaging reports to ensure appropriate randomisation and stratifi cation at trial entry. During trial treatment, any discrepancies in data received compared with expected were queried with sites in real time. Recorded toxicities were cross-referenced against reported serious adverse events to ensure that all toxicities were captured and that all events meeting the criteria for a serious adverse event were reported as such.
Statistical analysisThe trial was powered to detect a 10% improvement in 1 year survival, from 45% for EOC to 55% with mEOC+P, equating to a hazard ratio (HR) of 0·749. To achieve 90% power and a two-sided α of 0·05, we needed to include 509 events (deaths from any cause) and planned a total accrual of 730 patients. We planned to do an interim survival analysis after 255 events (50%). We also did a preplanned non-comparative interim analysis of response rate with mEOC+P after the fi rst 200 patients were assessable for response (phase 2 population). These data were reviewed by the independent data monitoring committee (IDMC), and confi rmed an acceptable response rate of 52% in the mEOC+P group, which exceeded the predefi ned futility threshold of 45%.
Throughout the trial, unmasked data were reviewed by the IDMC to examine the safety, scientifi c validity, and conduct of the trial. At annual review of the data in October, 2011, the IDMC noted a statistically inferior overall survival outcome in the mEOC+P group based on the occurrence of 169 events (HR 1·53, p=0·0062). In discussion with the trial management group, we decided to close the trial to further recruitment with immediate eff ect, withdraw panitumumab, and cross all patients over to full-dose EOC. We did our effi cacy analyses in the intention-to-treat population, defi ned as all eligible randomised participants. Data for patients still on treatment were censored at the time of crossover to allow accurate comparison between the two trial groups. Toxicity analyses included all participants who received at least one dose of study drug.
We estimated overall survival and PFS with the Kaplan-Meier method. We compared groups with the log-rank test and used Cox regression analysis to generate HRs and 95% CIs. We compared response rates between groups with logistic regression, and generated odds
ratios and 95% CIs. We used the χ² test to compare incidence of toxic eff ects between groups. In multivariate analysis, we used forward stepwise Cox regression to calculate corrected HRs and 95% CIs. Statistical analyses were done with SPSS version 19.
This study is registered with ClinicalTrials.gov, number NCT00824785.
EOC group (n=275) mEOC+P group (n=278)
Age, years
Median (range; IQR) 62 (26–83; 54–68) 63 (26–83; 56–68)
<60 110 (40%) 105 (38%)
≥60 165 (60%) 173 (62%)
Sex, male 226 (82%) 232 (83%)
Performance status
0 117 (43%) 118 (42%)
1 143 (52%) 144 (52%)
2 15 (5%) 16 (6%)
Site
Oesophagus 111 (40%) 106 (38%)
Oesophagogastric junction
75 (27%) 94 (34%)
Stomach 89 (32%) 78 (28%)
Extent
Locally advanced 25 (9%) 34 (12%)
Metastatic 250 (91%) 244 (88%)
Histology
Adenocarcinoma 272 (99%) 273 (98%)
Undiff erentiated 3 (1%) 5 (2%)
Data are n (%), unless otherwise stated. EOC=epirubicin, oxaliplatin, and capecitabine. mEOC+P=modifi ed EOC plus panitumumab.
Table 1: Demographics and baseline characteristics of the intention-to-treat population
0
20
40
60
80
100
0 6 12 18 24 30 36
Over
all s
urvi
val (
%)
Time from randomisation (months)
2 10 38 130 278 mEOC+P 3 12 49 135 EOC
Number at risk275
EOCmEOC+PHazard ratio 1·37 (95% CI 1·07–1·76; p=0·013)
Figure 2: Overall survival in 553 patients in the intention-to-treat population, by treatment groupPatients still on treatment at the time of trial closure and treatment crossover were censored. EOC=epirubicin, oxaliplatin, and capecitabine. mEOC+P=modifi ed EOC plus panitumumab.
Articles
484 www.thelancet.com/oncology Vol 14 May 2013
Role of the funding sourceAmgen were involved in planning of the study design. The funding sources were not involved in collection, analysis, and interpretation of data, writing of the report, or the decision to submit the paper for publication. The corresponding author had full access to all the data in the study and had fi nal responsibility for the decision to submit for publication.
ResultsBetween June 2, 2008, and Oct 17, 2011, we enrolled 575 patients, three of whom were withdrawn because they did not fulfi l eligibility criteria. Additionally, 19 patients randomly allocated during the phase 1 dose-fi nding study were excluded from the intention-to-treat analysis.12 We included 553 eligible patients in the phase 3 intention-to-treat population, representing 76% of the planned accrual at the time of trial closure (fi gure 1; table 1). 494 (89%) patients had metastatic disease. Median follow-up in patients who were alive at the time of analysis was 4·6 months (IQR 1·8–10·1) in the EOC group and 5·3 months (2·6–9·5) in the mEOC+P group.
Based on 251 events (EOC 110, mEOC+P 141) at the time of reporting, median overall survival was lower in the mEOC+P group than in the EOC group (HR 1·37, 95% CI 1·07–1·76, p=0·013; fi gure 2). Median overall survival was 8·8 months (95% CI 7·7–9·8) in the
EOC group (n=238) mEOC+P group (n=254)
Complete response 5 (2%) 8 (3%)
Partial response 95 (40%) 108 (43%)
Stable disease 51 (21%) 46 (18%)
Progressive disease 19 (8%) 30 (12%)
Not assessable 68 (29%) 62 (24%)
EOC=epirubicin, oxaliplatin, and capecitabine. mEOC+P=modifi ed EOC plus panitumumab. *61 patients were excluded because they were still on treatment and had not reached fi rst response assessment at time of data censoring.
Table 2: Responses by treatment group in 492 patients*
0·01 0·1 1 10
95% CI HR Patients
KRAS mutation 0·23 0·05–1·15 10
KRAS wild-type 1·50 1·03–2·18 164
Performance status 2 1·95 0·74–5·13 31
Performance status 1 1·48 1·07–2·03 287
Performance status 0 1·22 0·79–1·90 235
Female 1·52 0·85–2·72 95
Male 1·34 1·01–1·76 458
Age ≥60 years 1·36 0·99–1·87 338
Age <60 years 1·37 0·91–2·07 215
Oesophagogastric junction 1·27 0·78–2·07 169
Oesophagus 1·32 0·90–1·94 217
Stomach 1·64 1·04–2·58 167
>1 metastatic site 1·79 1·20–2·68 192
1 metastatic site 1·20 0·85–1·69 302
Metastatic 1·39 1·07–1·80 494
Locally advanced 1·25 0·54–2·88 59
Overall 1·37 1·07–1·76 553
Favours mEOC+P Favours EOC
0
20
40
60
80
100
0 6 12 18 24 30 36
Prog
ress
ion-
free s
urvi
val (
%)
Time from randomisation (months)
0 4 24 100 278 mEOC+P 2 6 25 113 275 EOC
Number at risk
EOCmEOC+PHazard ratio 1·22 (95% CI 0·98–1·52; p=0·068)
Figure 3: Forest plot of hazard ratios (HR) for overall survival according to baseline characteristicsEOC=epirubicin, oxaliplatin, and capecitabine. mEOC+P=modifi ed EOC plus panitumumab.
Figure 4: Progression-free survival in 553 patients in the intention-to-treat population, by treatment groupPatients still on treatment at the time of trial closure and treatment crossover were censored. EOC=epirubicin, oxaliplatin, and capecitabine. mEOC+P=modifi ed EOC plus panitumumab.

HER 1 (EGFr)
-‐ Hyper expression de HER1 = mauvais pronos@c -‐ TKI (ib) ac@vité an@ tumorale modeste en phase II (taux de réponse inférieur à 20%) -‐ Ac an@ EGFr associé à la chimiothérapie taux de réponse 40-‐60% (phase II)
Expert Opin Ther Targets 2012; 16 (Suppl 2) S29-‐34
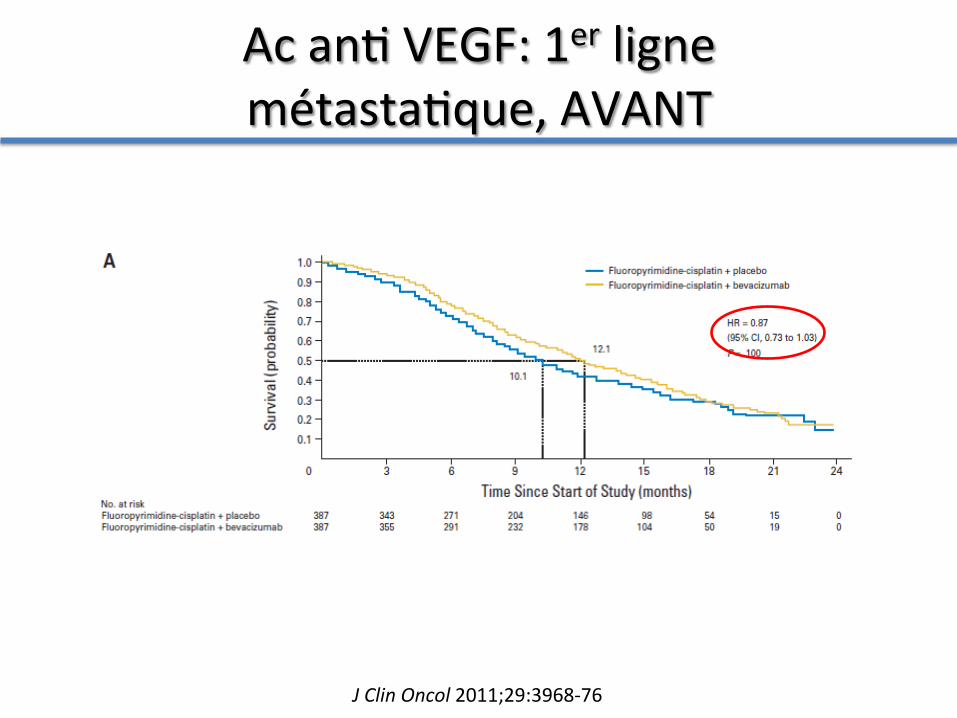
Ac an@ VEGF: 1er ligne métasta@que, AVANT
J Clin Oncol 2011;29:3968-‐76
Articles
4 www.thelancet.com Published online October 3, 2013 http://dx.doi.org/10.1016/S0140-6736(13)61719-5
the time from randomisation to the fi rst documentation of an ECOG performance status score of 2 or worse.
This trial is registered with ClinicalTrials.gov, number NCT00917384.
Role of the funding sourceThe sponsor of the study provided the study drug and collaborated with the investigators on protocol, study design, data collection, data analysis, data interpretation, and preparation of this report. CSF prepared the fi rst draft of the report in collaboration with the sponsor and other coauthors. The corresponding author had full access to all the data in the study and all authors had fi nal responsibility for the decision to submit for publication.
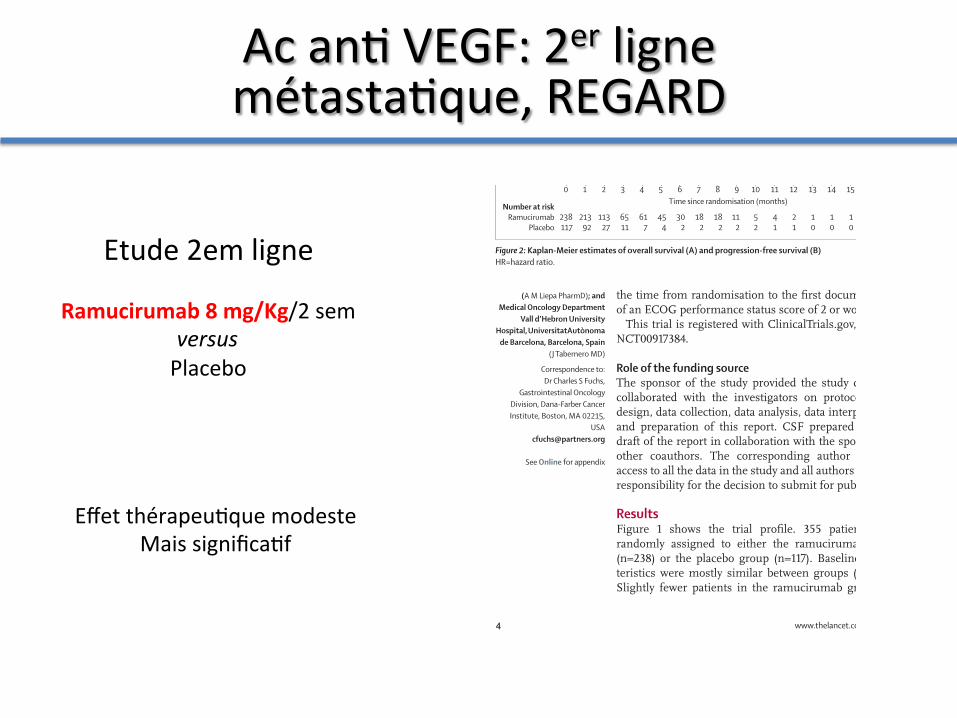
ResultsFigure 1 shows the trial profi le. 355 patients were randomly assigned to either the ramucirumab group (n=238) or the placebo group (n=117). Baseline charac-teristics were mostly similar between groups (table 1). Slightly fewer patients in the ramucirumab group had
peritoneal metastases than did those in the placebo group (table 1).
At the time of data cutoff , 278 patients had died: 179 (75%) patients given ramucirumab and 99 (85%) of those given placebo. Treatment with ramucirumab signifi cantly improved overall survival compared with placebo (fi gure 2). Median overall survival was 5·2 months (IQR 2·3–9·9) in patients receiving ramucirumab and 3·8 months (1·7–7·1) in those receiving placebo. Esti-mated rates of 6 month overall survival were 41·8% (35·4–48·1) in the ramucirumab group and 31·6% (23·2–40·2) in the placebo group; rates at 12 months were 17·6% (11·8–24·3) versus 11·8% (6·0–19·7; fi gure 2).
We examined the eff ect of treatment with adjustment for other statistically signifi cant prognostic factors with a stepwise Cox proportional hazards model that identifi ed three signifi cant independent predictors for reduced overall survival: ECOG performance status (≥1 vs 0), location of the primary tumour (gastro-oesophageal junc-tion vs gastric), and presence of peritoneal metastases. After adjustment for these factors, ramucirumab still conferred a signifi cant improvement in overall survival (appendix). When we repeated this multivariable analysis to include the predefi ned stratifi cation factors, the eff ect of ramucirumab on overall survival was unchanged and remained signifi cant (HR for death 0·767, 95% CI 0·598–0·984; p=0·037). The eff ect of ramucirumab on overall survival was consistent across almost all sub-groups, including the prespecifi ed stratifi cation factors (fi gure 3). The eff ect of treatment did not diff er signifi -cantly between men and women (p=0·063).
Treatment with ramucirumab resulted in a 52% reduc-tion in the risk of disease progression or death from any cause (fi gure 2). Median progression-free survival was 2·1 months (IQR 1·3–4·2) in patients receiving ramu-cirumab and 1·3 months (1·1–2·1) in those receiving placebo (fi gure 2). Estimated rates of 12 week progression-free survival were 40·1% (33·6–46·4) in patients in the ramucirumab group and 15·8% (9·7–23·3) in the placebo group (fi gure 2). The eff ect of ramucirumab on pro-gression-free survival was maintained after adjustment for other signifi cant baseline prognostic factors (appendix). Additionally, the progression-free survival benefi t asso-ciated with ramucirumab was consistent across almost all subgroups (fi gure 4). Table 2 shows the numbers of patients with an objective tumour response. The rate of disease control was signifi cantly higher in patients given ramucirumab than in those given placebo (table 2). Add-itionally, the duration of disease control was signifi cantly longer in the ramucirumab group than in the placebo group (median 4·2 months [IQR 2·8–8·1] vs 2·9 months [2·7–4·3]; p=0·036).
At data cutoff , 222 (93%) patients had discontinued ramucirumab and 114 (97%) had discontinued placebo (fi gure 1). Radiological and symptomatic progression was the most common reason for discontinuation followed by adverse events (fi gure 1, appendix). Median duration
Figure 2: Kaplan-Meier estimates of overall survival (A) and progression-free survival (B)HR=hazard ratio.
Number at riskRamucirumab
Placebo
0 1 2 3 4 5 6 7 8 9 10 11 12 13 14 15 16 17 18 19 20 26 27 28
238117
15466
9234
4920
177
74
32
01
00
HR (95% CI)=0·776 (0·603–0·998)Log-rank p value (stratified)=0·047
0
20
40
60
80
100
Over
all s
urvi
val (
%)
A
Ramucirumab (n=238)Placebo (n=117)Censored
Number at riskRamucirumab
Placebo
0 1 2 3 4 5 6 7 8 9 10 11 12 13 14 15 16 17
238117
11327
21392
6511
617
302
182
112
52
454
182
41
21
10
10
10
10
00
Time since randomisation (months)
HR (95% CI)=0·483 (0·376–0·620)Log-rank p value (stratified) <0·0001
0
20
40
60
80
100
Prog
ress
ion-
free s
urvi
val (
%)
B
(A M Liepa PharmD); and Medical Oncology Department
Vall d’Hebron University Hospital, UniversitatAutònoma
de Barcelona, Barcelona, Spain (J Tabernero MD)
Correspondence to:Dr Charles S Fuchs,
Gastrointestinal Oncology Division, Dana-Farber Cancer Institute, Boston, MA 02215,
See Online for appendix
Etude 2em ligne
Ramucirumab 8 mg/Kg/2 sem versus Placebo
Ac an@ VEGF: 2er ligne métasta@que, REGARD
Effet thérapeu@que modeste Mais significa@f

An@ VEGF
• Concept intéressant • Effet thérapeu@que modeste • Ciblage en cours (VEGFa …)
Expert Opin Ther Targets 2012; 16 (Suppl 2) S29-‐34
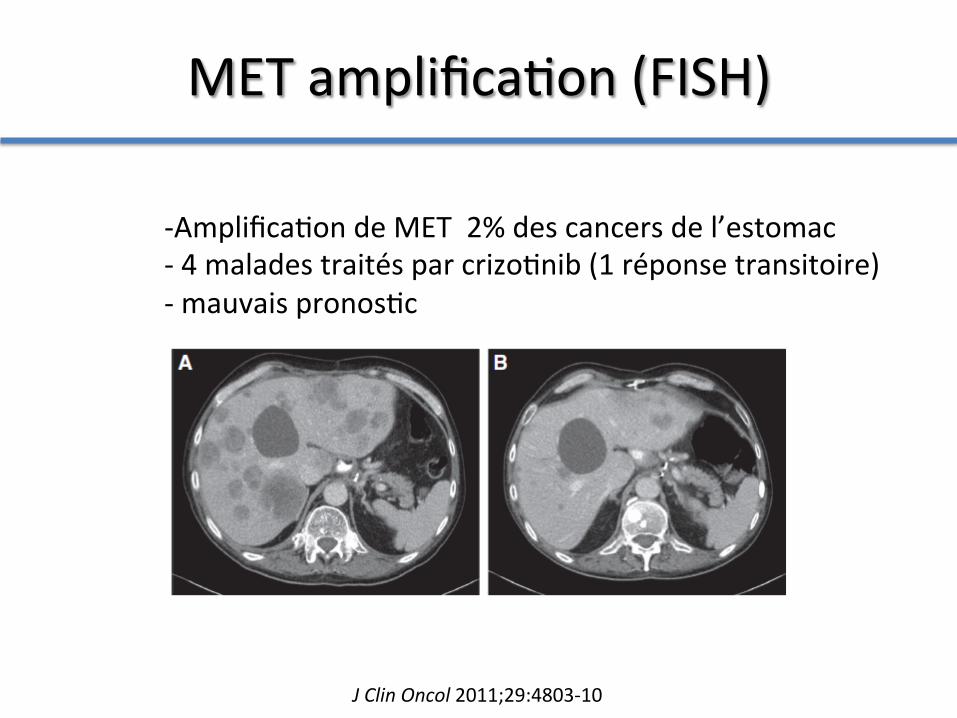
MET amplifica@on (FISH)
-‐ Amplifica@on de MET 2% des cancers de l’estomac -‐ 4 malades traités par crizo@nib (1 réponse transitoire) -‐ mauvais pronos@c
J Clin Oncol 2011;29:4803-‐10
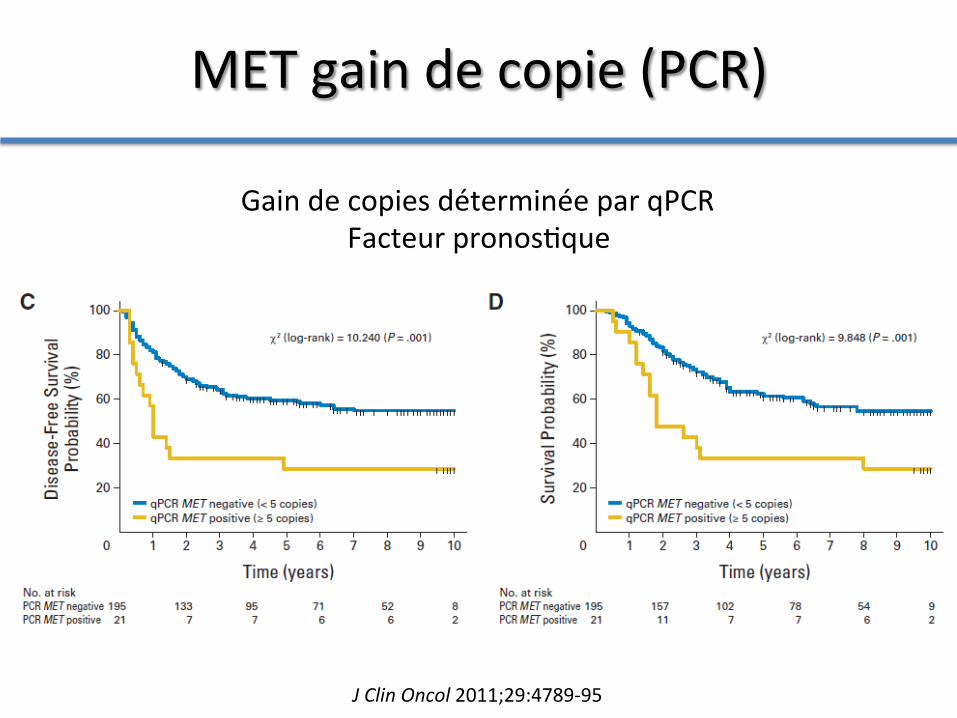
MET gain de copie (PCR)
J Clin Oncol 2011;29:4789-‐95
Gain de copies déterminée par qPCR Facteur pronos@que

MET hyper expression (IHC)
• Hyper expression en IHC de l’ordre de 50% – Type intes@nal (68%) >> type diffus (28%)
• Hyper expression ARNm (10%) – Type intes@nal > type diffus
L’hyper expression de MET ne serait pas liée a une ac@va@on du récepteur chez les pa@ents occidentaux Cancer Epidemiol Biomarkers Prev 2011;20:1021-‐27
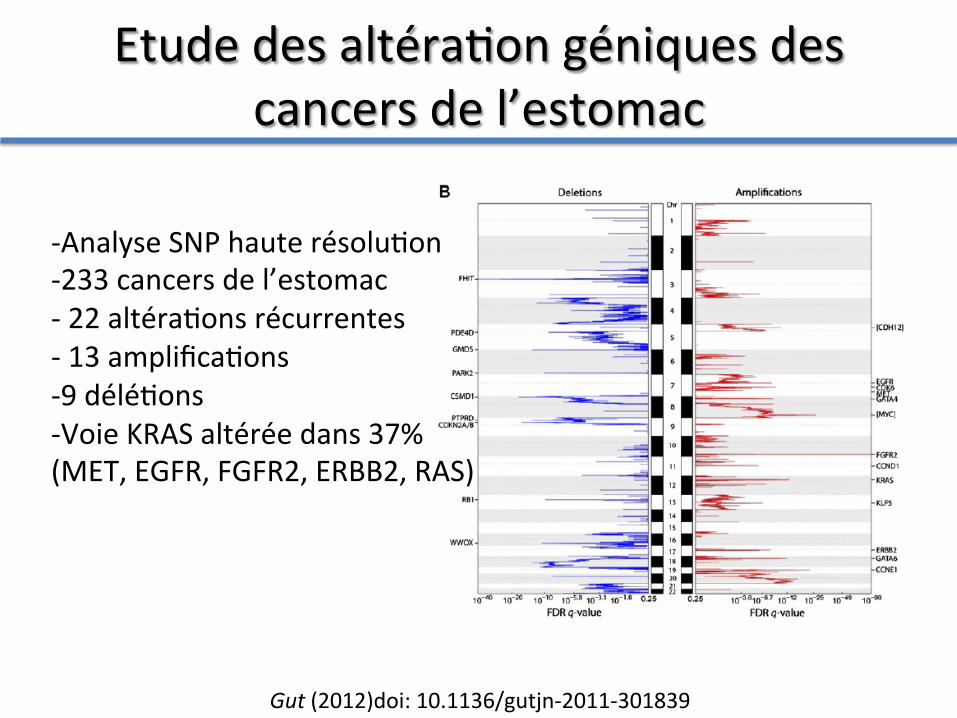
Etude des altéra@on géniques des cancers de l’estomac
Gut (2012)doi: 10.1136/gutjn-‐2011-‐301839
-‐ Analyse SNP haute résolu@on -‐ 233 cancers de l’estomac -‐ 22 altéra@ons récurrentes -‐ 13 amplifica@ons -‐ 9 délé@ons -‐ Voie KRAS altérée dans 37% (MET, EGFR, FGFR2, ERBB2, RAS)

altéra@on géniques associées ou exclusives des cancers de l’estomac
Gut (2012)doi: 10.1136/gutjn-‐2011-‐301839
Conclusion
1. reste un « adjuvant » à la chirurgie pour la maladie localisée
2. Est le meilleur pallia@f en maladie métasta@que
3. Sta@s@quement augmente la survie de manière modeste (<20 mois)
La chimiothérapie dans le cancer de l’estomac