PowerPoint template, standard version 1 · réception du signal I.R.M. PERMANENT!! 24/24h ......
56
SOMMAIRE ¾ Imagerie Neuro ¾ Ostéo ¾ Sénologie ¾ Fœtal ¾ Cardio-vasculaire ¾ Oncologie Dr. Luisa DIVANO , 3 juin 2008
-
Upload
nguyencong -
Category
Documents
-
view
213 -
download
0
Transcript of PowerPoint template, standard version 1 · réception du signal I.R.M. PERMANENT!! 24/24h ......

SOMMAIRE
Imagerie Neuro
Ostéo
Sénologie
Fœtal
Cardio-vasculaire
Oncologie
Dr. Luisa DIVANO , 3 juin 2008
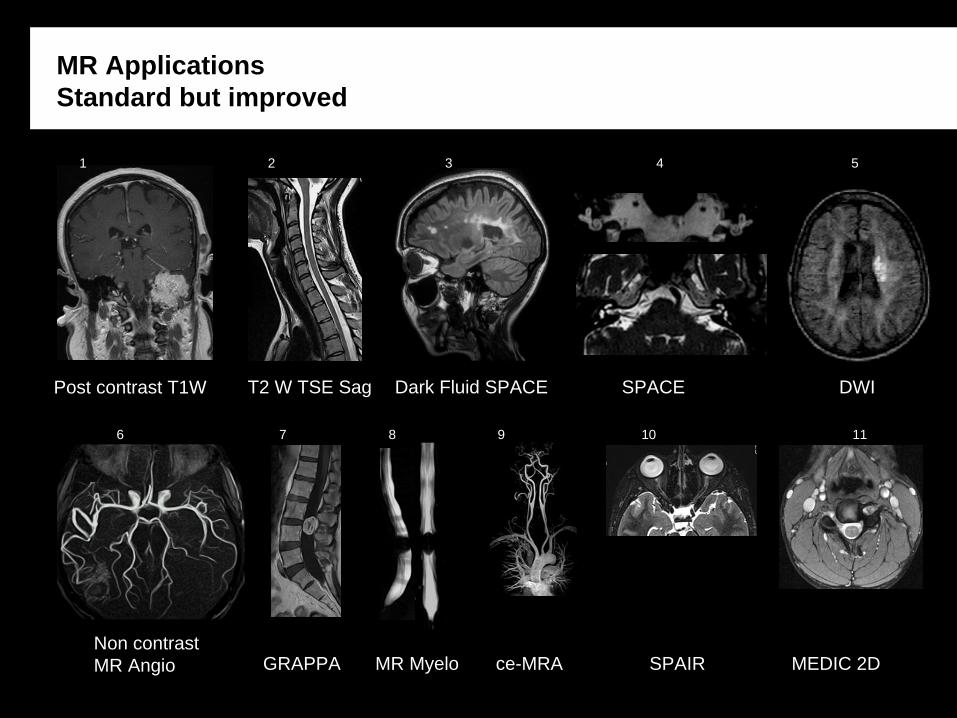
NOUVEL APPAREIL IRM 1.5T

De quoi se compose un système I.R.M. ?
• L’aimant
•Les bobines de gradients: - Petits champs magnétiques superposés
•Les antennes RF: Permettent l’émission et/ou la réception du signal I.R.M.
PERMANENT!! 24/24h
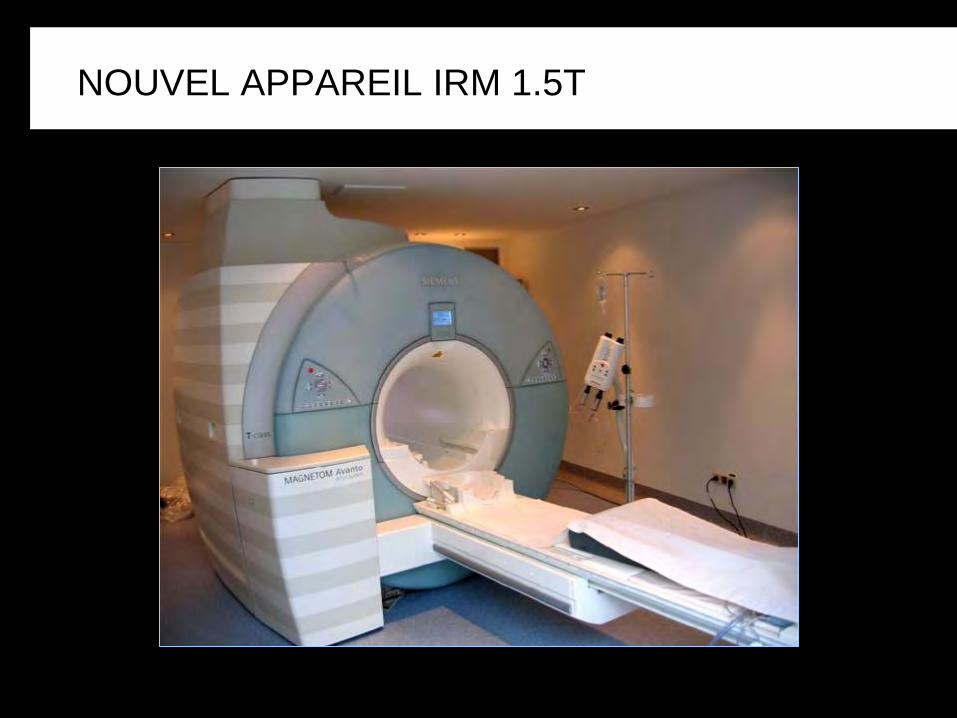
Sous l’effet du Champ Magnétique et des ondes de radio-fréquence, les protons changent de position en émettant un signal
C’est en amplifiant ce signal qu’il y a construction de l’image

CONTRE-INDICATIONS ABSOLUES ET RELATIVES

remboursement INAMI pour chaque examen équivalent à un examen CTscanner
même ticket modérateur pour le patient

De nombreuses pathologies qui étaient investiguées par d’autres techniques en
raison des délais importants pourront bénéficier d’examens IRM, souvent plus
précis et non irradiants.
Le produit de contraste, parfois nécessaire, ne contient pas d’iode (pas
d’allergie).
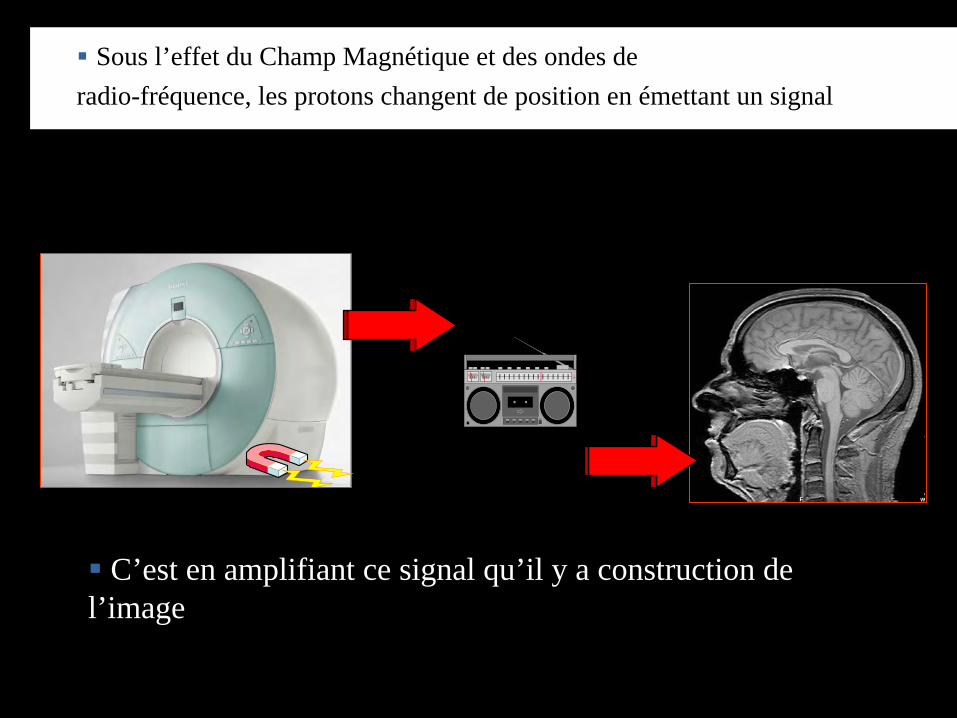
GRAPPANon contrast MR Angio
MR Applications Standard but improved
T2 W TSE Sag
SPAIR MEDIC 2D
SPACEDark Fluid SPACE DWI Post contrast T1W
ce-MRAMR Myelo
1 2 3 4
6
5
7 8 9 10 11
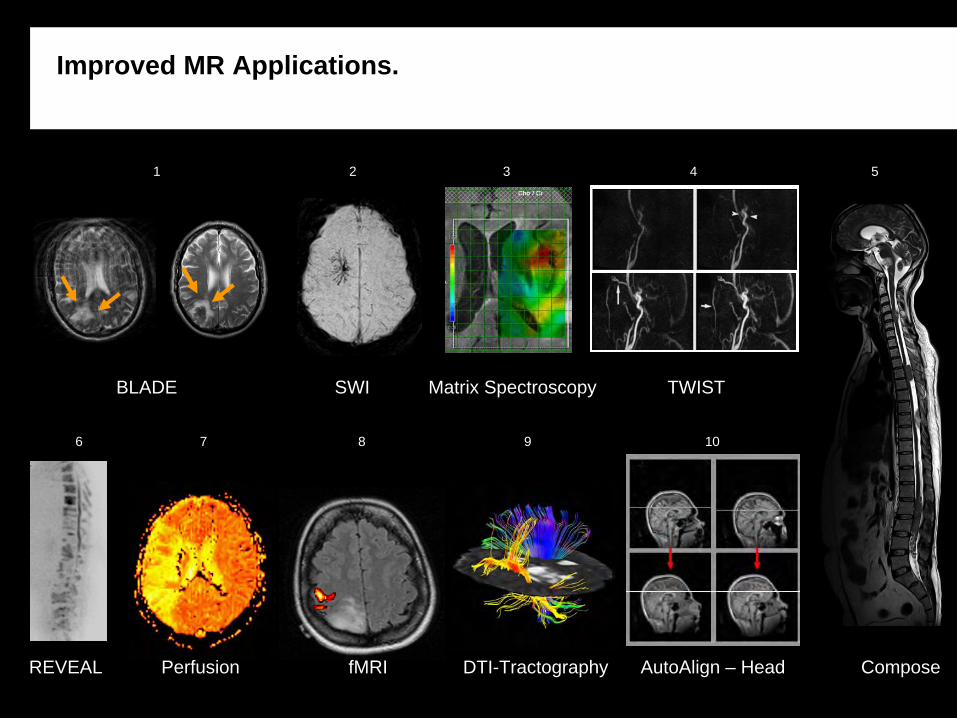
SWI
DTI-TractographyPerfusion
BLADE Matrix Spectroscopy
REVEAL
Improved MR Applications.
ComposefMRI AutoAlign – Head
TWIST
1 2 3 4 5
6 7 8 9 10

Role of MRI in intracranial disease
Stroke MR imaging
Congenital Astrocytoma Neonate*
Pilocytic Astrocytoma residual tumor
3D Curved reformatting for Epilepsy imaging
Tumor Congenital disease Seizure
Non-descended post pituitary
Sella
DWI ADC
Cerebrovascular disease

Role of MRI in intracranial disease
Inflammatory pseudo-tumor near complete clearing of lesion with steroids
SWI (3D T2*)in shearing injury
White Matter lesions Infection Trauma
Aging brain
FLAIR 3D TSE
MCI Alzheimer
FA maps of DTI comparing Mild Cognitive impairment and Alzheimer’s disease

Color indicates: direction as follows:
red, left-right
green, anteroposterior
blue, superior-inferior
Directional maps in axial planeanisotropy maps demonstrate the discrete directions for each voxel
as resolved relative to the x, y and z gradient directions

corpus callosum
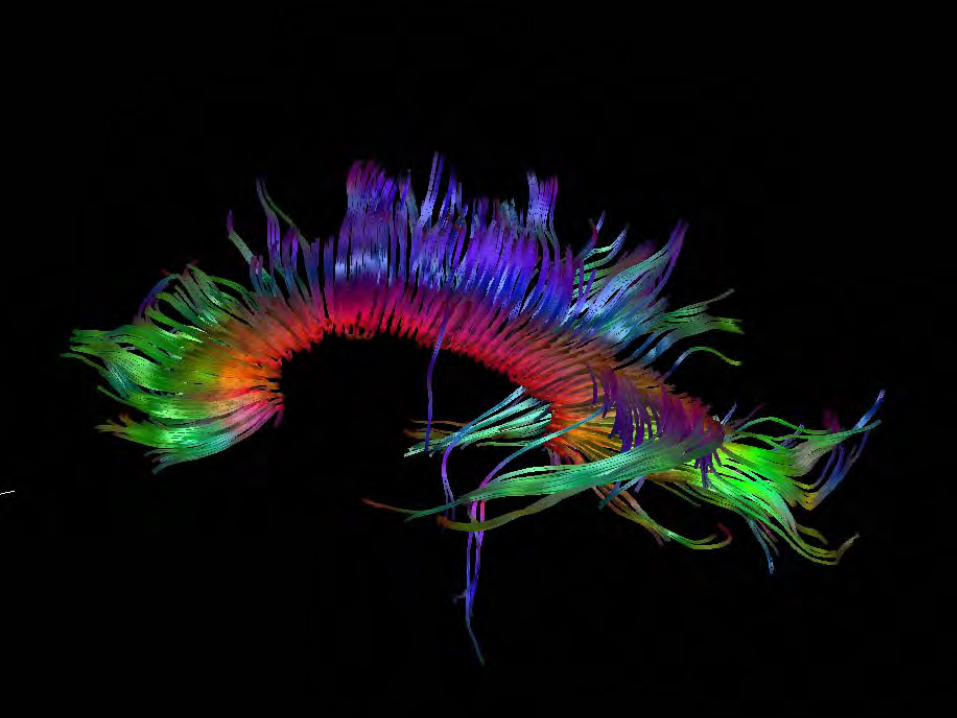


Corticospinal
tracts


The different peaks of the spectrum indicate different metabolic components (Cho, Cr, NAA, mI, Lac...). Their amplitude indicate the relative concentration.
Spectroscopy

Spectroscopy
Single Voxel or Monovoxel (MV)
High spectral resolutionShort acquisition timeLow spatial resolution
Multivoxel
or Chemical
Shift Imaging (CSI) or Spectroscopic
Imaging
Metabolic maps of the different compounds, with their spatial distribution
Low spectral resolutionLong acquisition time
High spatial resolution

Role of MRI in Brain tumors
MR lesion characterization with spectroscopy
Radiation NecrosisMetastasis Glioblastoma

BRAIN TUMOURS
MRSI is useful for
monitoring response to therapy (it can distinguish between radiation necrosis and recurrent tumour)
NAA
Cho RADIATION
NECROSIS
NAA mapCho map

ff--MRIMRI
MOTOR FUNCTIONSENSIBILITY
VISUAL FUNCTIONLANGUAGE
........
•technique capable of visualizing brain function•visualize differential activity between 2 (or more) “brain states”•signal modification are determined by the paramagnetic properties of deoxiHb T2* hypersignal in the activated areas

Motor
paradigm
Movement of tongue, hand,
lips or foot according to location of lesion
“Homunculus of Penfield”

f-MRI identification of areas that is important to spare during
surgery
Tactile stimulation left leg-foot Tactile stimulation right leg-foot

Right hand movementsAdjacent to lesion (red arrow)
Tongue movementsDistant from lesion (red arrow)
BOLD (Blood Oxygen Level Dependent) fMRI for pre-surgical evaluation of risk
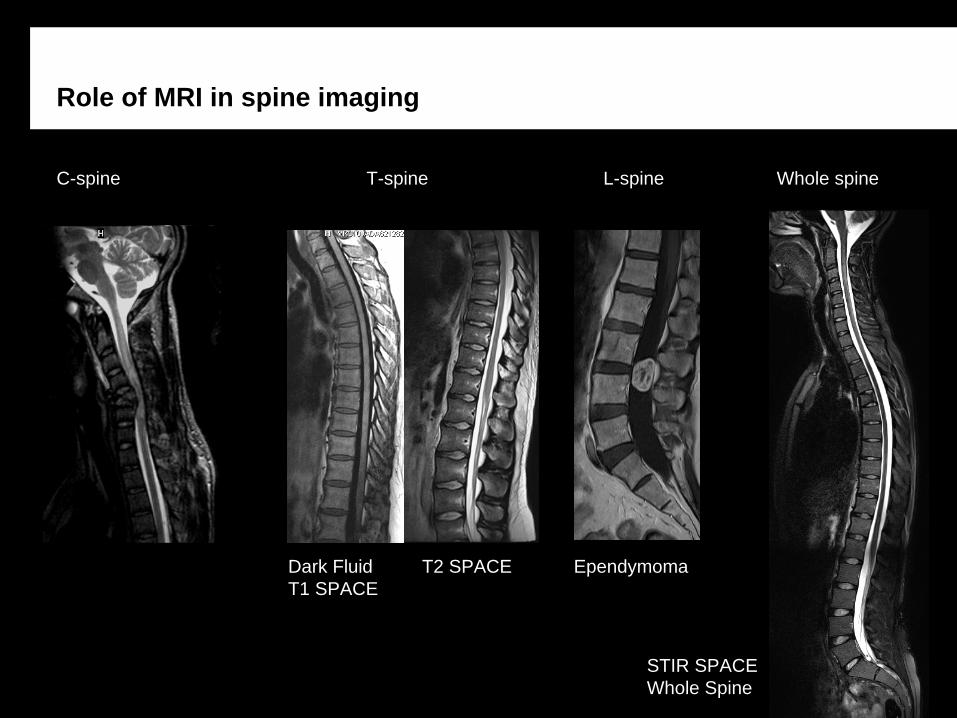
Role of MRI in spine imaging
T2 SPACE Ependymoma
C-spine T-spine L-spine Whole spine
STIR SPACE Whole Spine
Dark Fluid T1 SPACE

3 month-old unsedated pediatric* patient fronto-temporal subdural hematoma T1 sagittal and FLAIR axial, with BLADE
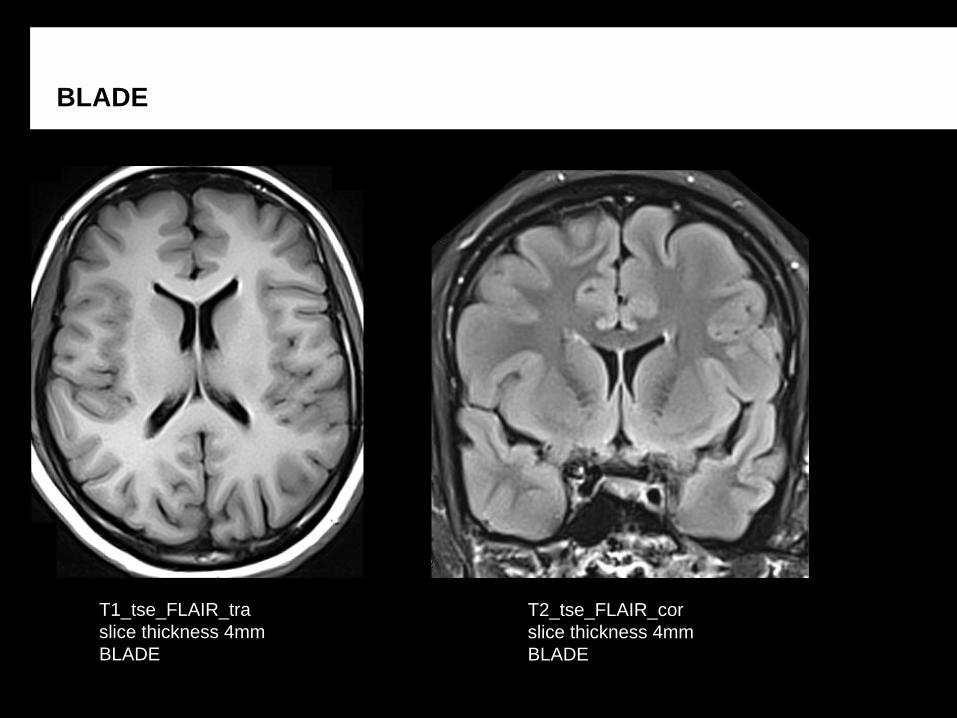
Multiple contrastsCompatible with all orientationsCompatible with iPAT
Stroke coronal, TA 1:53
Conventional BLADE
BLADE
BLADE
T1_tse_FLAIR_traslice thickness 4mmBLADE
T2_tse_FLAIR_corslice thickness 4mmBLADE

BLADE c-spine
T2_tse_sagBLADE
T2_tse_tra_p2BLADE

T2 SPACE for T & C-spine imaging
1 mm Isotropic imaging in 4 min

T2 SPACE STIR whole spine imaging insensitive to flow.
application with 3 steps total=14:15 min
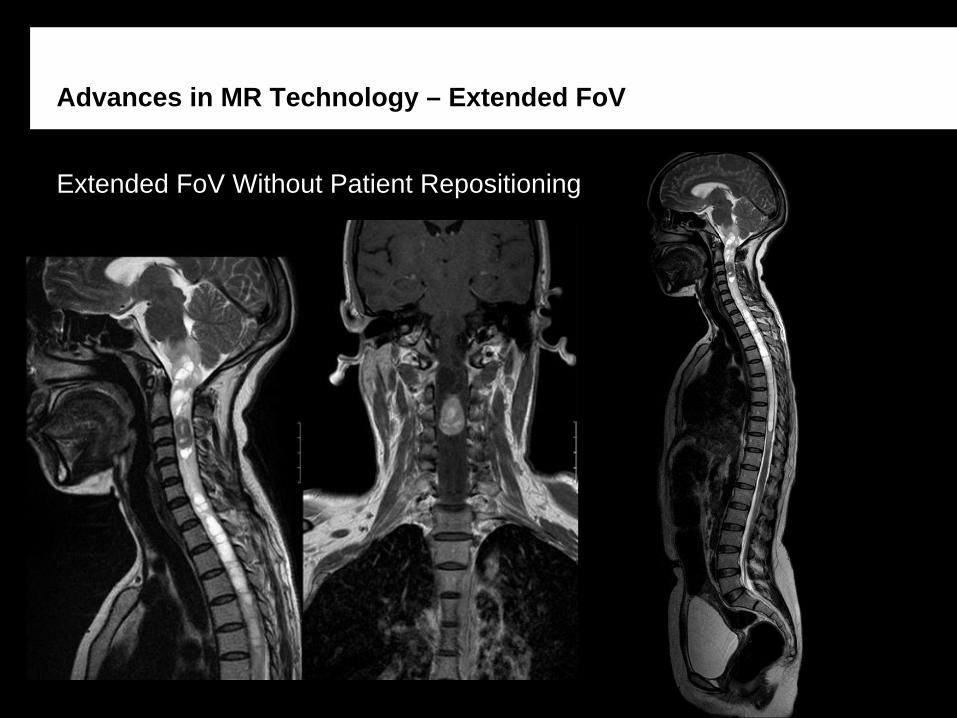
Advances in MR Technology – Extended FoV
Extended FoV Without Patient Repositioning

T2 SPACE with PAT 2 GRAPPA 0.9 x 0.9 x 0.9 mm3, TA 4:44 min for 256 slices
T2 SPACE: Isotropic imaging Ultra-fast 3D imaging in T2
Unmatched performance with sub-millimeter resolution with shortest acquisition times

Processing instead of post-processing Inline Composing / Inline Image Filter
Inline ComposingSets automatically images together for spines, MRA, whole-body, etc.
Inline Image Filter Filters the images the way you want.
With Image FilterWithout

Osteologie
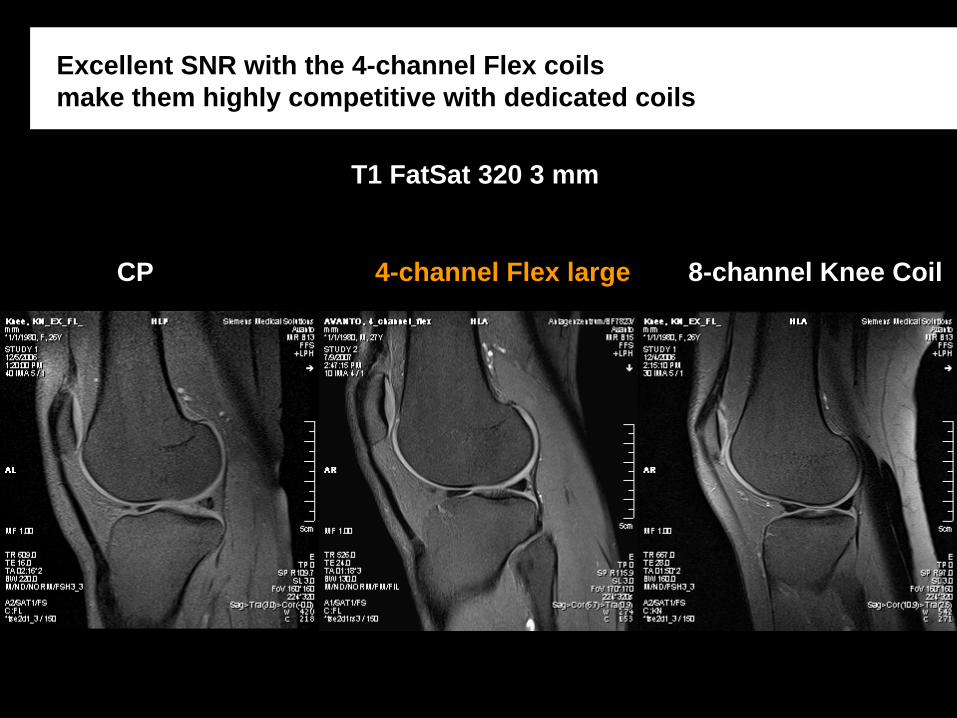
Excellent SNR with the 4-channel Flex coils make them highly competitive with dedicated coils
T1 FatSat 320 3 mm
CP 4-channel Flex large 8-channel Knee Coil

Early Detection: High resolution Imaging
Growth plate assessment for detection of early morpholgical changes leading to OA of the hip
PD TSE, 140 FoV, 0.3 x 0.3 x 3 mm, 5:10 min

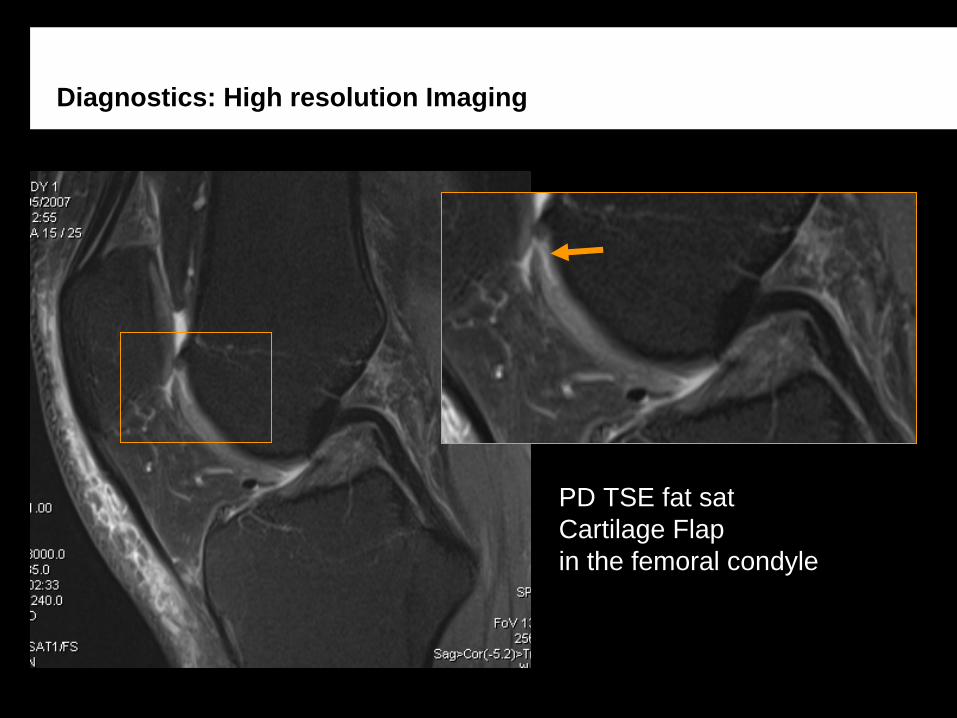
Diagnostics: High resolution Imaging
PD TSE (0.2 x 0.2 x 2 mm)Severe Cartilage degenerationwith secondary OA signs
Diagnostics: High resolution Imaging
PD TSE fat satCartilage Flap in the femoral condyle

Follow Up: High Resolution Imaging
Cooper et al
Cartilage Repair Patient
Assessment Integrity, Surface, Signal Intensity and Integration Surrounding Cartilage
PD TSE0.2 x 0.2 x 2 mm
Repair

Senologie

Protocols and Applications that support all your clinical needs
Breast Suite with
General breast imagingSilicon detection
syngo MR Applications:
syngo VIEWSsyngo GRACEsyngo REVEALsyngo BRACEsyngo SPACESPAIR

syngo Breast Suite with Click-n-Go Protocols including syngo VIEWS
With syngo VIEWS the best of two worlds meet.High resolution in short measurement time bring you right to diagnosis.
Short measurement timeHigh spatial resolutionIsotropic and rotatable in any plane for perfect visibility of complete lesion extend3 min*
2 min*
1 min*
Place holder for clinical image
Delayed VIEWS,RADIANT,iPAT 2,rt DCIS , matrix
512, 3 mm @ 3 degrees 360°
pre

REVEAL See more with Diffusion Weighted Imaging
ADC map
b-value=500
b-value=1000
syngo REVEAL shows more….
ADC map is processed automatically at the end of the scan with Inline Technology.
ADC map is giving additional information on cellular density of a lesion.
Low ADC maps tend to indicate lesion angiogenesis.
EPI Diffusion with GRAPPA2, TA 1:49 min, DCIS
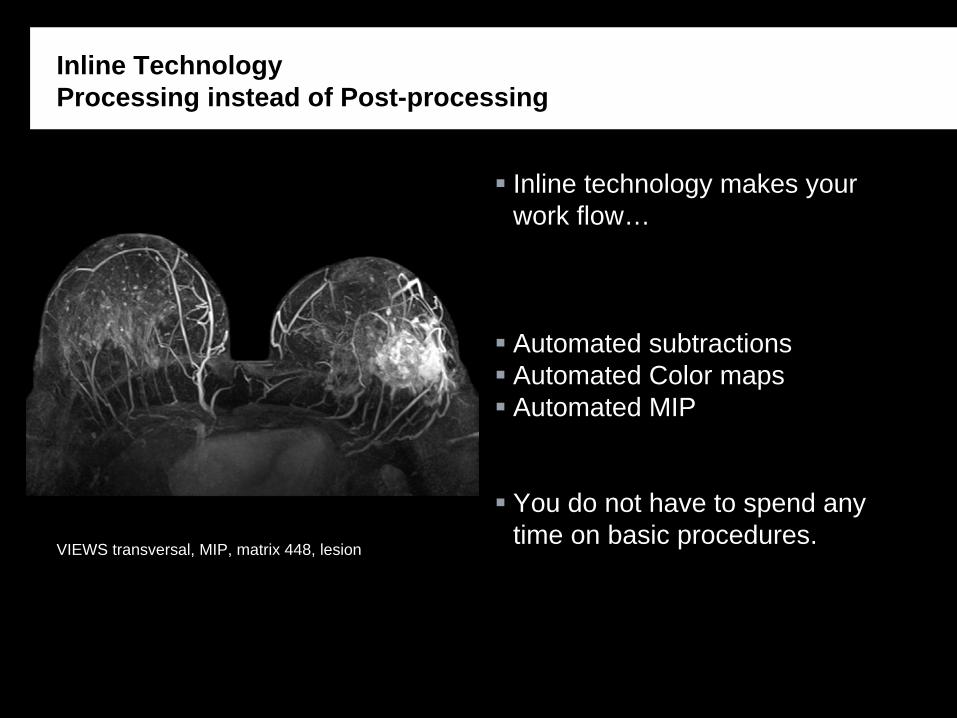
Inline Technology Processing instead of Post-processing
Inline technology makes your work flow…
Automated subtractionsAutomated Color mapsAutomated MIP
You do not have to spend any time on basic procedures.
VIEWS transversal, MIP, matrix 448, lesion

IRM cardio-vasculaire


Oncologie

Functional Imaging – syngo REVEAL – Body Diffusion
Inline ADC MapsMultiple b-valuesiPAT (GRAPPA)PACE – Breath-hold or Free Breathingsyngo Image Fusion
Trace weighted image b-values (600 – 1000 for overlay)

Functional Imaging – syngo REVEAL – Prostate Cancer
T2 imaging whole-body T1 Post Contrast Pet-like syngo REVEAL

Functional Imaging – syngo REVEAL – Body Diffusion
T2 TSE with FatSat syngo REVEAL Image Fusion with T2 TSE

Role of MR Imaging to follow-up treatment response – Breast – Neo-adjuvant Chemotherapy
VIEWS – Volume Imaging with Enhanced Water SignalPre-chemo 5 months Post-chemo

DTI in glioma @ 3 T
L
Advanced Applications – DTI Tractography – Diffusion Tensor Imaging Metastasis
Diffusion 12 directionsSlice Thickness 2.5 mmMatrix 192 x 256TA: 4:38 min
T2 TSE Coronal
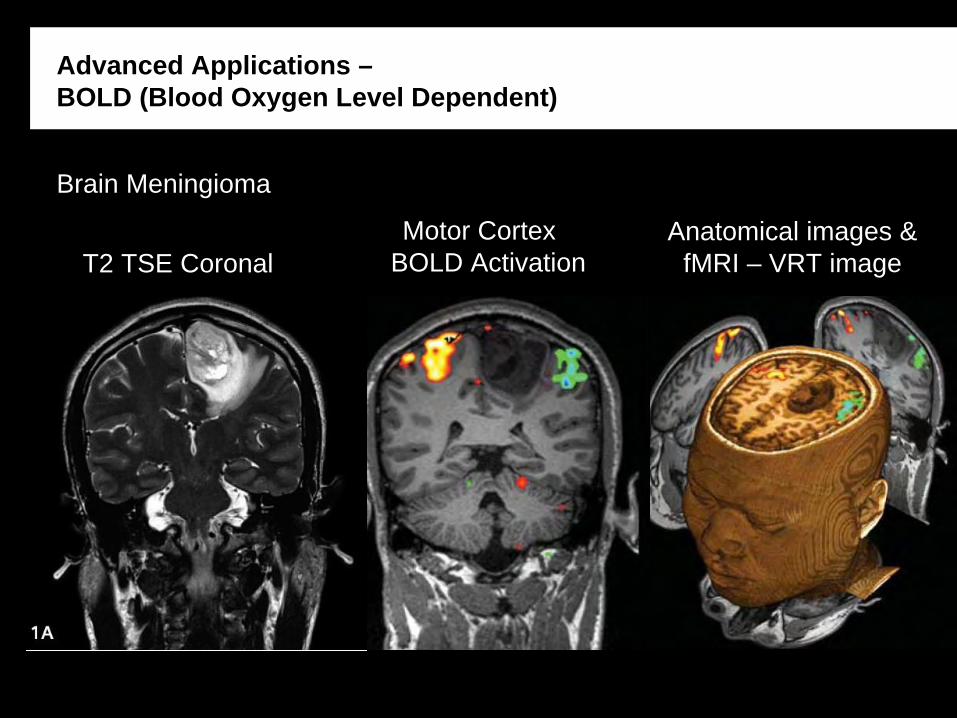
Advanced Applications – BOLD (Blood Oxygen Level Dependent)
Brain Meningioma
Motor Cortex BOLD Activation
Anatomical images & fMRI – VRT image

MERCI POUR VOTRE ATTENTION