PowerPoint Template - Landscape - Accueil - Bollor逢 India, Haiti, Timor-Leste…...
35
1 2015 RESULTS MARCH 24, 2016
Transcript of PowerPoint Template - Landscape - Accueil - Bollor逢 India, Haiti, Timor-Leste…...
1
2015 RESULTS MARCH 24, 2016
2
2015 RESULTS
Modifiez les styles du texte du masque
Modifiez les styles du texte du masque
Modifiez les styles du texte du masque
Modifiez les styles du texte du masque
Modifiez les styles du texte du masque
3
GROUPE BOLLORÉ 2015 RESULTS
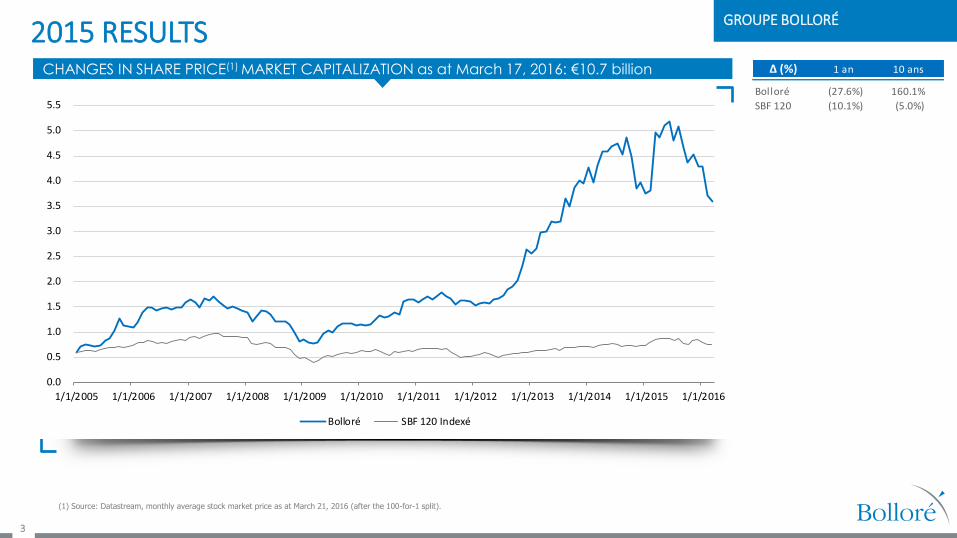
(1) Source: Datastream, monthly average stock market price as at March 21, 2016 (after the 100-for-1 split).
CHANGES IN SHARE PRICE(1) MARKET CAPITALIZATION as at March 17, 2016: €10.7 billion
0.0
0.5
1.0
1.5
2.0
2.5
3.0
3.5
4.0
4.5
5.0
5.5
1/1/2005 1/1/2006 1/1/2007 1/1/2008 1/1/2009 1/1/2010 1/1/2011 1/1/2012 1/1/2013 1/1/2014 1/1/2015 1/1/2016
Bolloré SBF 120 Indexé
Δ (%) 1 an 10 ans
Bolloré (27.6%) 160.1%
SBF 120 (10.1%) (5.0%)
2015 RESULTS KEY FIGURES
4
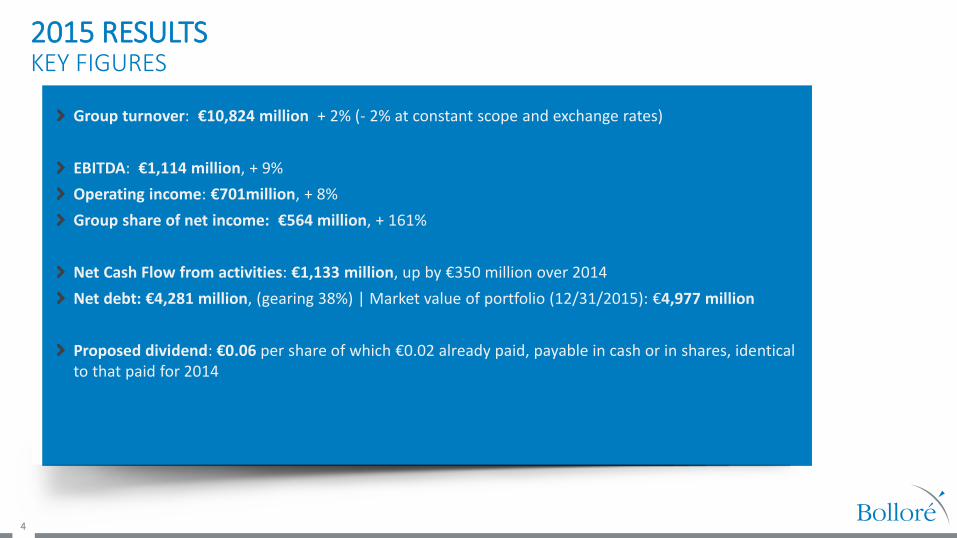
Group turnover: €10,824 million + 2% (- 2% at constant scope and exchange rates)
EBITDA: €1,114 million, + 9%
Operating income: €701million, + 8%
Group share of net income: €564 million, + 161%
Net Cash Flow from activities: €1,133 million, up by €350 million over 2014
Net debt: €4,281 million, (gearing 38%) | Market value of portfolio (12/31/2015): €4,977 million
Proposed dividend: €0.06 per share of which €0.02 already paid, payable in cash or in shares, identical to that paid for 2014
5
GROUPE BOLLORÉ GROUP STRUCTURE
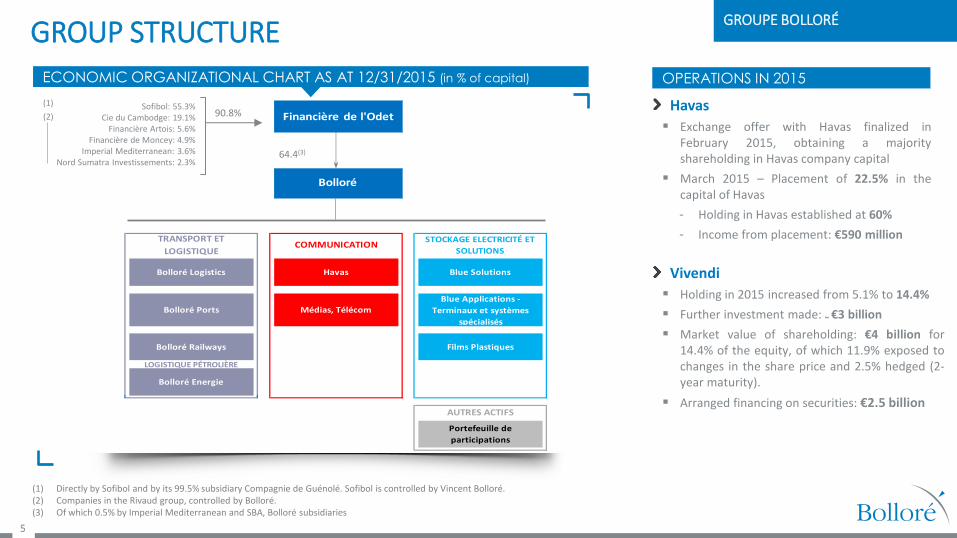
(1) Directly by Sofibol and by its 99.5% subsidiary Compagnie de Guénolé. Sofibol is controlled by Vincent Bolloré. (2) Companies in the Rivaud group, controlled by Bolloré. (3) Of which 0.5% by Imperial Mediterranean and SBA, Bolloré subsidiaries
ECONOMIC ORGANIZATIONAL CHART AS AT 12/31/2015 (in % of capital)
90.8% (1)
(2) Sofibol: 55.3%
Cie du Cambodge: 19.1% Financière Artois: 5.6%
Financière de Moncey: 4.9% Imperial Mediterranean: 3.6%
Nord Sumatra Investissements: 2.3%
Havas
Exchange offer with Havas finalized in February 2015, obtaining a majority shareholding in Havas company capital
March 2015 – Placement of 22.5% in the capital of Havas
‐ Holding in Havas established at 60%
‐ Income from placement: €590 million
OPERATIONS IN 2015
Vivendi
Holding in 2015 increased from 5.1% to 14.4%
Further investment made: ~ €3 billion
Market value of shareholding: €4 billion for 14.4% of the equity, of which 11.9% exposed to changes in the share price and 2.5% hedged (2-year maturity).
Arranged financing on securities: €2.5 billion
64.4(3)
TRANSPORT ET
LOGISTIQUECOMMUNICATION
STOCKAGE ELECTRICITÉ ET
SOLUTIONS
Bolloré Logistics Havas Blue Solutions
Bolloré Ports Médias, TélécomBlue Applications -
Terminaux et systèmes
spécialisés
Bolloré Railways Films Plastiques
LOGISTIQUE PÉTROLIÈRE
Bolloré Energie
AUTRES ACTIFS
Portefeuille de
participations
Bolloré
Financière de l'Odet

6
GROUPE BOLLORÉ 2015 RESULTS
(1)
(2)
(1) including income from operating companies accounted for via the equity method: €22 million vs €19 million (2) excluding treasury shares. (3) taking into account the impact from financing on Vivendi securities (4) restated amendment of the IAS 41 standard.
SUMMARY OF MAIN FINANCIAL ITEMS IN 2015
EBITDA up by 9% and OPERATING INCOME up by 8% thanks to good
performance by the Transportation & Logistics and Communications divisions.
FINANCIAL INCOME benefiting from
dividends received from Vivendi
Net debt up further to the increased
holding in Vivendi
(3)
en millions d'euros 2015 2014 (4) Variation
Chiffre d'affaires 10 824 10 604 2%
EBITDA 1 114 1 022 9%
Amortissements et provisions (413) (372) 11%
Résultat opérationnel 701 650 8%
Résultat financier 187 (85)
Part dans le résultat net des sociétés mises en
équivalence non-opérationnelles 104 65
Impôts (265) (236)
Résultat net des activités destinées à la vente - 7
Résultat Net 727 401 81%
Résultat Net Part du Groupe 564 217 161%
Minoritaires 163 185
Benéfice par action 0,20 0,09 128%
Cash Flow Opérationnel 1 133 783 350
Investissements industriels nets (771) (617) (154)
Investissements financiers nets (2 539) 18 (2 557)
Endettement net 4 281 1 771 2 509
Gearing 38% 18%
Valeur de marché du portefeuille de titres cotés 4 977 2 177 2 800

7
GROUPE BOLLORÉ TURNOVER BY BUSINESS SECTOR
CHANGES IN TURNOVER BY BUSINESS SECTOR
Main items of the 2015 fiscal year:
At constant scope and exchange rates, turnover fell by 2% for the 2015 fiscal year. These developments were the result of the 20% decline in Oil Logistics business subsequent to the drop in prices for petroleum products. They also factor in the good performance of the Transportation & Logistics (+ 4%), Communications (+ 5%), and Electricity Storage and Solutions (+ 9%) activities;
In unadjusted figures, currency fluctuations primarily affecting Transportation & Logistics and Communications, had a positive impact on Group turnover of €364 million.
en millions d'euros
2015 2014Croissance
publiée (%)
Croissance à
périmètre et
change
constants (%)
Transport & Logistique 6 051 5 629 7% 4%
Logistique Pétrolière 2 238 2 781 (20%) (20%)
Communication (Havas, Médias, Télécoms) 2 247 1 931 16% 5%
Stockage d'Electricité et Solutions 265 237 12% 9%
Autres (Actifs Agricoles, Holdings) 22 26 (13%) (14%)
Total Chiffre d'Affaires Groupe Bolloré 10 824 10 604 2% (2%)
8
GROUPE BOLLORÉ OPERATING INCOME BY BUSINESS SECTOR
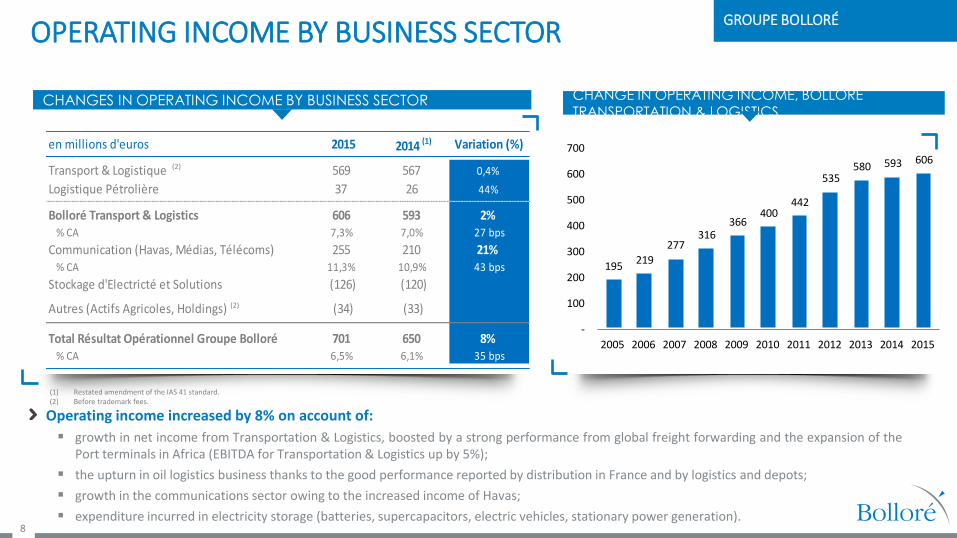
CHANGES IN OPERATING INCOME BY BUSINESS SECTOR
Operating income increased by 8% on account of:
growth in net income from Transportation & Logistics, boosted by a strong performance from global freight forwarding and the expansion of the Port terminals in Africa (EBITDA for Transportation & Logistics up by 5%);
the upturn in oil logistics business thanks to the good performance reported by distribution in France and by logistics and depots;
growth in the communications sector owing to the increased income of Havas;
expenditure incurred in electricity storage (batteries, supercapacitors, electric vehicles, stationary power generation).
CHANGE IN OPERATING INCOME, BOLLORÉ TRANSPORTATION & LOGISTICS
195 219
277 316
366 400
442
535 580 593 606
-
100
200
300
400
500
600
700
2005 2006 2007 2008 2009 2010 2011 2012 2013 2014 2015
(1) Restated amendment of the IAS 41 standard. (2) Before trademark fees.
en millions d'euros 2015 2014 (1) Variation (%)
Transport & Logistique 569 567 0,4%
Logistique Pétrolière 37 26 44%
Bolloré Transport & Logistics 606 593 2%% CA 7,3% 7,0% 27 bps
Communication (Havas, Médias, Télécoms) 255 210 21%% CA 11,3% 10,9% 43 bps
Stockage d'Electricté et Solutions (126) (120)
Autres (Actifs Agricoles, Holdings) (34) (33)
Total Résultat Opérationnel Groupe Bolloré 701 650 8%% CA 6,5% 6,1% 35 bps
(2)
(2)
9
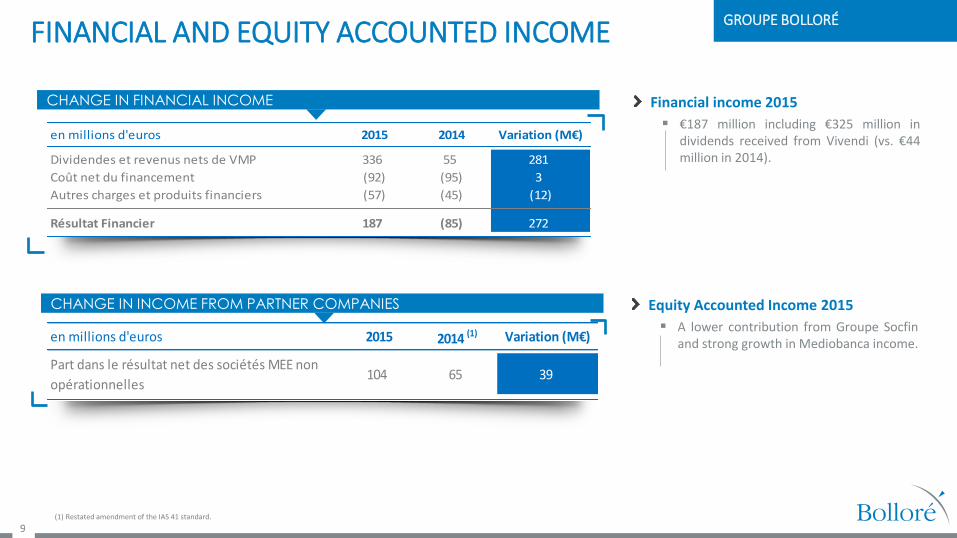
GROUPE BOLLORÉ FINANCIAL AND EQUITY ACCOUNTED INCOME
CHANGE IN FINANCIAL INCOME
CHANGE IN INCOME FROM PARTNER COMPANIES
Financial income 2015
€187 million including €325 million in dividends received from Vivendi (vs. €44 million in 2014).
Equity Accounted Income 2015
A lower contribution from Groupe Socfin and strong growth in Mediobanca income.
(1) Restated amendment of the IAS 41 standard.
en millions d'euros 2015 2014 Variation (M€)
Dividendes et revenus nets de VMP 336 55 281
Coût net du financement (92) (95) 3
Autres charges et produits financiers (57) (45) (12)
Résultat Financier 187 (85) 272
en millions d'euros 2015 2014 (1) Variation (M€)
Part dans le résultat net des sociétés MEE non
opérationnelles 104 65 39

10
GROUPE BOLLORÉ CHANGES IN NET DEBT
CHANGES IN NET DEBT (€ MILLIONS)(1)
(1) Cash-flow after elimination of gains and before financial charges
(1)
en millions d'euros 2015 2014 Variation (M€)
Marge brute d'autofinancement 1 207 806 401
Variation du BFR (+ = réduction) (73) (23) (50)
Flux net de trésorerie de l'activité 1 133 783 350
Investissements industriels nets (771) (617) (154)
Investissements financiers nets (2 539) 18 (2 557)
Dividendes versés (254) (151) (103)
Frais financiers nets payés (86) (94) 8
Augmentation de capital, variation de juste valeur et autres éléments 8 83 (75)00
Variation de l'endettement (- = augmentation de l'endettement) (2 509) 23 (2 532)
11
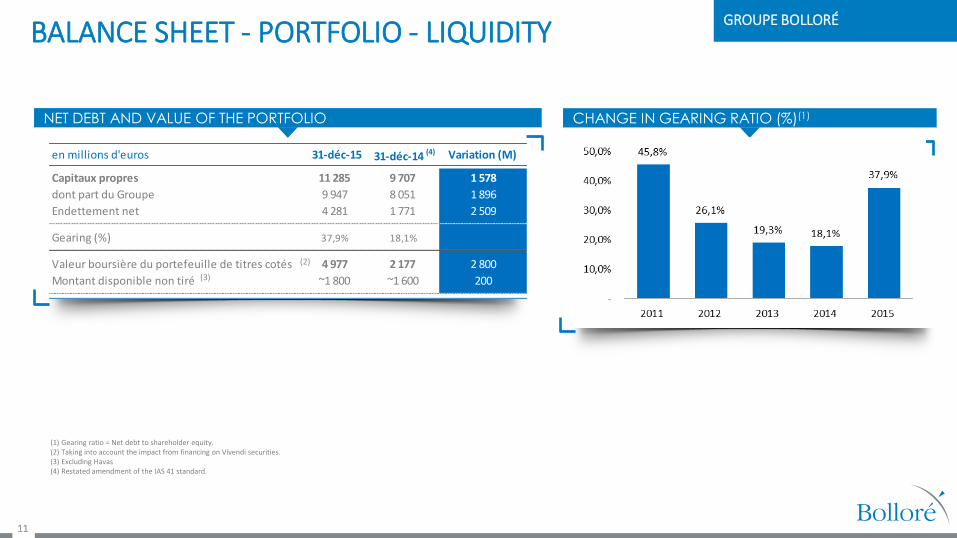
GROUPE BOLLORÉ BALANCE SHEET - PORTFOLIO - LIQUIDITY
NET DEBT AND VALUE OF THE PORTFOLIO
(2)
(1) Gearing ratio = Net debt to shareholder equity. (2) Taking into account the impact from financing on Vivendi securities. (3) Excluding Havas (4) Restated amendment of the IAS 41 standard.
CHANGE IN GEARING RATIO (%)(1)
(3)
en millions d'euros 31-déc-15 31-déc-14 (4) Variation (M)
Capitaux propres 11 285 9 707 1 578
dont part du Groupe 9 947 8 051 1 896
Endettement net 4 281 1 771 2 509
Gearing (%) 37,9% 18,1%
Valeur boursière du portefeuille de titres cotés 4 977 2 177 2 800
Montant disponible non tiré ~1 800 ~1 600 200

12
GROUPE BOLLORÉ
DIVIDEND
CHANGE IN DIVIDENDS PAID(1)
(1) After the 100-for-1 split of January 1, 2016 (2) Proposed distribution submitted to the AGM of June 3, 2016.
Company income 2015
€100 million
Distributable amount
€2,078 million
General Meeting
June 3, 2016
Ex-dividend date
June 8, 2016
Payment
June 29, 2016
KEY DATES
(2)
Proposed dividend: €0.06
of which an installment of €0.02 already paid in 2015;
payable in cash or in shares;
maximum amount of €173 million.
13
Modifiez les styles du texte du masque
Modifiez les styles du texte du masque
Modifiez les styles du texte du masque
Modifiez les styles du texte du masque
Modifiez les styles du texte du masque
BUSINESS REVIEW 2015
14
A LEADING OPERATOR IN PORT OPERATIONS
A MAJOR OPERATOR IN RAIL CONCESSIONS IN AFRICA
A MAJOR PLAYER IN OIL DISTRIBUTION AND LOGISTICS
IN FRANCE
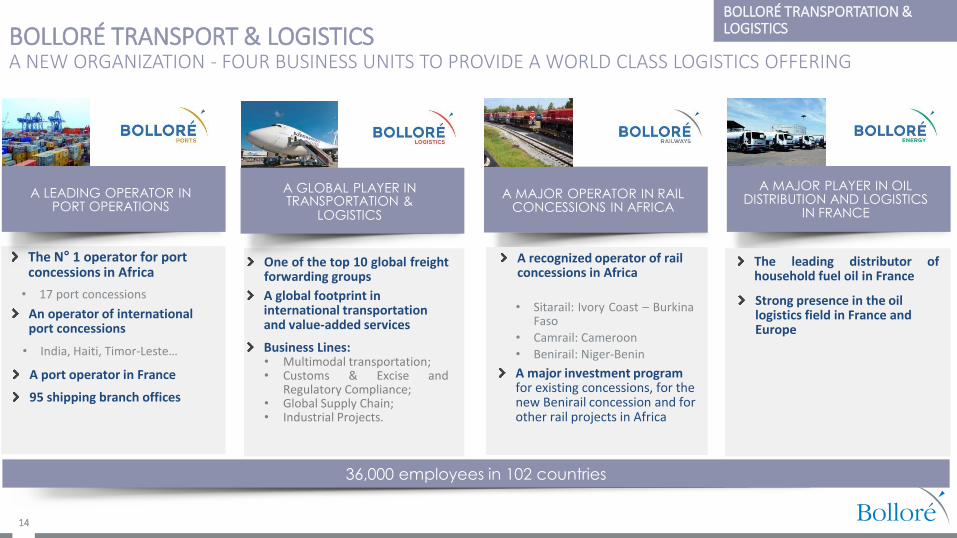
BOLLORÉ TRANSPORTATION & LOGISTICS
BOLLORÉ TRANSPORT & LOGISTICS A NEW ORGANIZATION - FOUR BUSINESS UNITS TO PROVIDE A WORLD CLASS LOGISTICS OFFERING
The N° 1 operator for port concessions in Africa
• 17 port concessions
A port operator in France
95 shipping branch offices
36,000 employees in 102 countries
A recognized operator of rail concessions in Africa
A major investment program for existing concessions, for the new Benirail concession and for other rail projects in Africa
• Sitarail: Ivory Coast – Burkina Faso
• Camrail: Cameroon
• Benirail: Niger-Benin
A GLOBAL PLAYER IN TRANSPORTATION &
LOGISTICS
One of the top 10 global freight forwarding groups
A global footprint in international transportation and value-added services
Business Lines: • Multimodal transportation; • Customs & Excise and
Regulatory Compliance; • Global Supply Chain; • Industrial Projects.
The leading distributor of household fuel oil in France
Strong presence in the oil logistics field in France and Europe
An operator of international port concessions
• India, Haiti, Timor-Leste…

TRANSPORTATION & LOGISTICS KEY FIGURES
15 (1) before trademark income.
BOLLORÉ TRANSPORTATION & LOGISTICS
FINANCIAL ITEMS IN 2015
(1)
EBITBA:up 5%
Good overall performance from the port business in Africa (particularly in Ivory Coast, Cameroon, Ghana, Nigeria and Guinea) and from the logistics business, especially in Europe and Asia;
Falling commodity prices affecting industrial projects for oil and mining customers in Africa and activity in countries that are particularly exposed to oil (Gabon, Congo, Angola, Mozambique, Nigeria).
Operating income, up 0,4%:
In view of the increased depreciation and amortization linked to a ramp-up of investment in Africa;
(1)
en millions d'euros 2015 2014 Variation (%)
CA Bolloré Logistics 3 363 3 073 9,4%
CA Bolloré Africa Logistics 2 688 2 556 5,2%
Total Chiffres d'Affaires Transport et Logistique 6 051 5 629 7,5%
EBITDA Transport et Logistique 767 730 5,1%
Résultat opérationnel Transport et Logistique 569 567 0,4%
Total Investissements Transport et Logistique 426 350 21,7%
16
BOLLORÉ TRANSPORTATION & LOGISTICS
BOLLORÉ LOGISTICS
2015 RESULTS
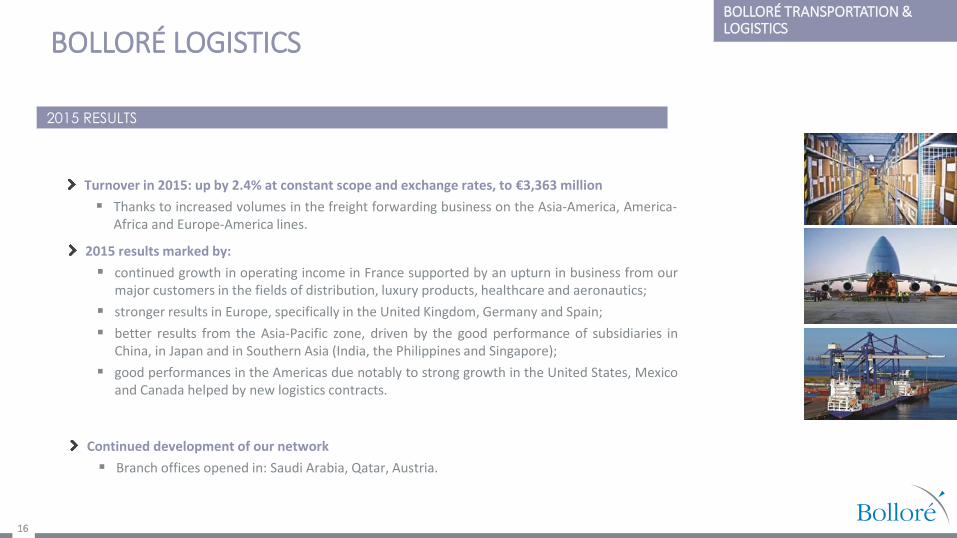
Turnover in 2015: up by 2.4% at constant scope and exchange rates, to €3,363 million
Thanks to increased volumes in the freight forwarding business on the Asia-America, America-Africa and Europe-America lines.
2015 results marked by:
continued growth in operating income in France supported by an upturn in business from our major customers in the fields of distribution, luxury products, healthcare and aeronautics;
stronger results in Europe, specifically in the United Kingdom, Germany and Spain;
better results from the Asia-Pacific zone, driven by the good performance of subsidiaries in China, in Japan and in Southern Asia (India, the Philippines and Singapore);
good performances in the Americas due notably to strong growth in the United States, Mexico and Canada helped by new logistics contracts.
Continued development of our network
Branch offices opened in: Saudi Arabia, Qatar, Austria.
BOLLORÉ AFRICA LOGISTICS
17
BOLLORÉ TRANSPORTATION & LOGISTICS
Corridors Outlets Port concessions
2015 RESULTS
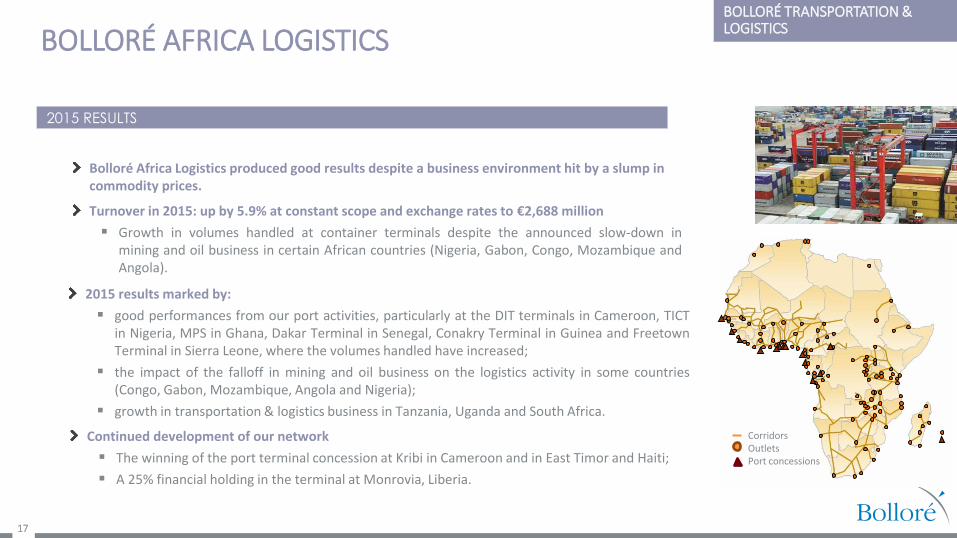
Bolloré Africa Logistics produced good results despite a business environment hit by a slump in commodity prices.
Turnover in 2015: up by 5.9% at constant scope and exchange rates to €2,688 million
Growth in volumes handled at container terminals despite the announced slow-down in mining and oil business in certain African countries (Nigeria, Gabon, Congo, Mozambique and Angola).
2015 results marked by:
good performances from our port activities, particularly at the DIT terminals in Cameroon, TICT in Nigeria, MPS in Ghana, Dakar Terminal in Senegal, Conakry Terminal in Guinea and Freetown Terminal in Sierra Leone, where the volumes handled have increased;
the impact of the falloff in mining and oil business on the logistics activity in some countries (Congo, Gabon, Mozambique, Angola and Nigeria);
growth in transportation & logistics business in Tanzania, Uganda and South Africa.
Continued development of our network
The winning of the port terminal concession at Kribi in Cameroon and in East Timor and Haiti;
A 25% financial holding in the terminal at Monrovia, Liberia.
BOLLORÉ AFRICA LOGISTICS
18
BOLLORÉ TRANSPORTATION & LOGISTICS
THREE RAIL CONCESSIONS 2015 RESULTS
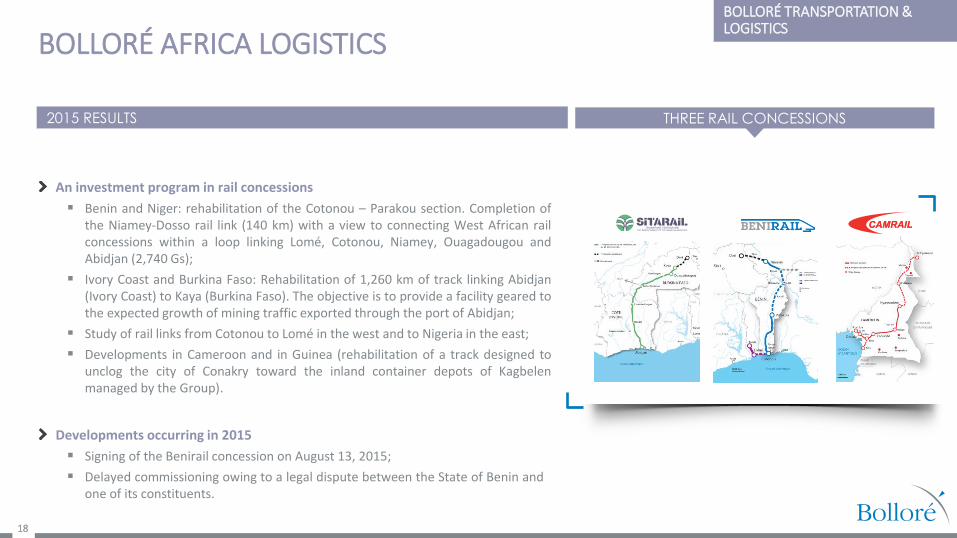
An investment program in rail concessions
Benin and Niger: rehabilitation of the Cotonou – Parakou section. Completion of the Niamey-Dosso rail link (140 km) with a view to connecting West African rail concessions within a loop linking Lomé, Cotonou, Niamey, Ouagadougou and Abidjan (2,740 Gs);
Ivory Coast and Burkina Faso: Rehabilitation of 1,260 km of track linking Abidjan (Ivory Coast) to Kaya (Burkina Faso). The objective is to provide a facility geared to the expected growth of mining traffic exported through the port of Abidjan;
Study of rail links from Cotonou to Lomé in the west and to Nigeria in the east;
Developments in Cameroon and in Guinea (rehabilitation of a track designed to unclog the city of Conakry toward the inland container depots of Kagbelen managed by the Group).
Developments occurring in 2015
Signing of the Benirail concession on August 13, 2015;
Delayed commissioning owing to a legal dispute between the State of Benin and one of its constituents.
BOLLORÉ ÉNERGIE
19
BOLLORÉ TRANSPORTATION & LOGISTICS
FINANCIAL ITEMS IN 2015
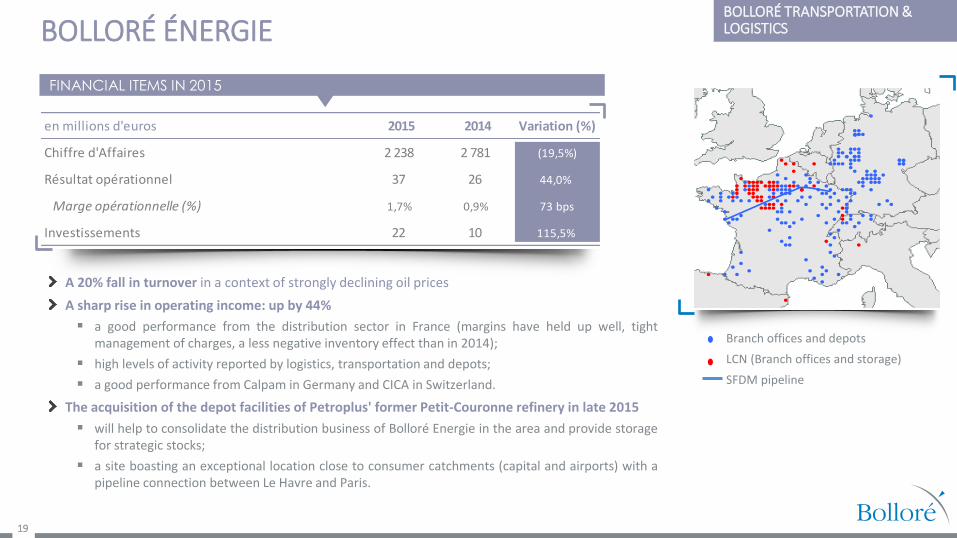
A 20% fall in turnover in a context of strongly declining oil prices
A sharp rise in operating income: up by 44%
a good performance from the distribution sector in France (margins have held up well, tight management of charges, a less negative inventory effect than in 2014);
high levels of activity reported by logistics, transportation and depots;
a good performance from Calpam in Germany and CICA in Switzerland.
The acquisition of the depot facilities of Petroplus' former Petit-Couronne refinery in late 2015
will help to consolidate the distribution business of Bolloré Energie in the area and provide storage for strategic stocks;
a site boasting an exceptional location close to consumer catchments (capital and airports) with a pipeline connection between Le Havre and Paris.
Branch offices and depots
LCN (Branch offices and storage)
SFDM pipeline
en millions d'euros 2015 2014 Variation (%)
Chiffre d'Affaires 2 238 2 781 (19,5%)
Résultat opérationnel 37 26 44,0%
Marge opérationnelle (%) 1,7% 0,9% 73 bps
Investissements 22 10 115,5%
20
COMMUNICATION
COMMUNICATION
FINANCIAL ITEMS IN 2015
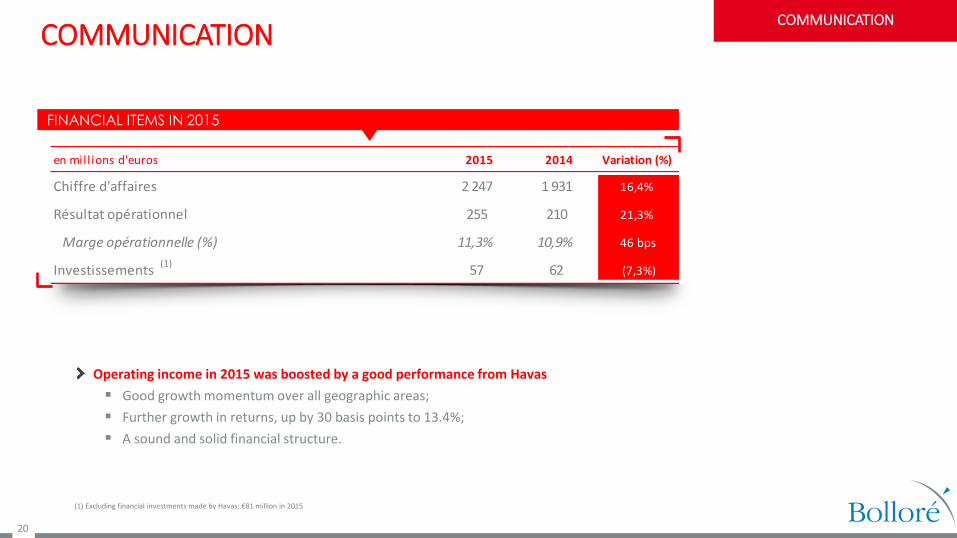
Operating income in 2015 was boosted by a good performance from Havas
Good growth momentum over all geographic areas;
Further growth in returns, up by 30 basis points to 13.4%;
A sound and solid financial structure.
en millions d'euros 2015 2014 Variation (%)
Chiffre d'affaires 2 247 1 931 16,4%
Résultat opérationnel 255 210 21,3%
Marge opérationnelle (%) 11,3% 10,9% 46 bps
Investissements 57 62 (7,3%)(1)
(1) Excluding financial investments made by Havas: €81 million in 2015
21
HAVAS
COMMUNICATION
FINANCIAL ITEMS IN 2015 PUBLISHED BY HAVAS
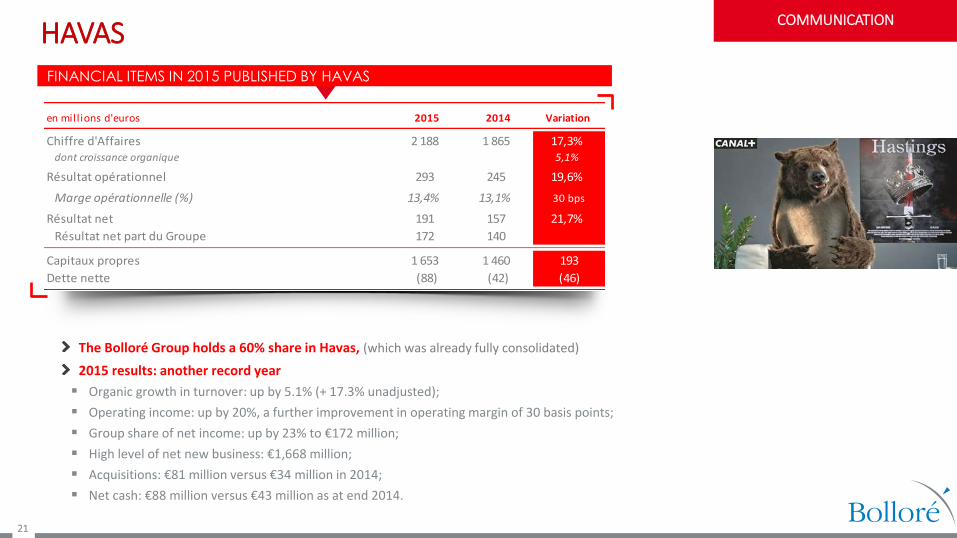
The Bolloré Group holds a 60% share in Havas, (which was already fully consolidated)
2015 results: another record year
Organic growth in turnover: up by 5.1% (+ 17.3% unadjusted);
Operating income: up by 20%, a further improvement in operating margin of 30 basis points;
Group share of net income: up by 23% to €172 million;
High level of net new business: €1,668 million;
Acquisitions: €81 million versus €34 million in 2014;
Net cash: €88 million versus €43 million as at end 2014.
en millions d'euros 2015 2014 Variation
Chiffre d'Affaires 2 188 1 865 17,3%dont croissance organique 5,1%
Résultat opérationnel 293 245 19,6%
Marge opérationnelle (%) 13,4% 13,1% 30 bps
Résultat net 191 157 21,7%
Résultat net part du Groupe 172 140
Capitaux propres 1 653 1 460 193
Dette nette (88) (42) (46)
22
MEDIA & TELECOMS
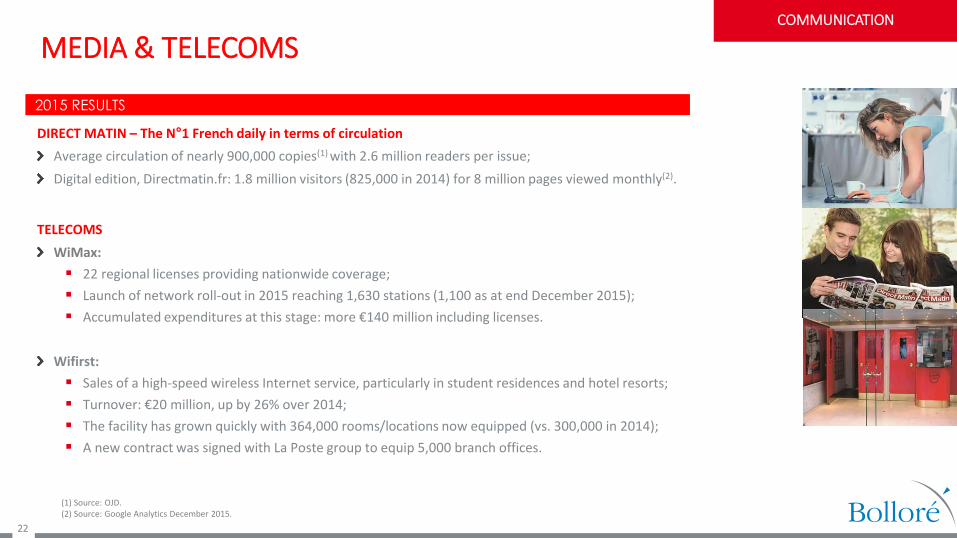
DIRECT MATIN – The N°1 French daily in terms of circulation
Average circulation of nearly 900,000 copies(1) with 2.6 million readers per issue;
Digital edition, Directmatin.fr: 1.8 million visitors (825,000 in 2014) for 8 million pages viewed monthly(2).
(1) Source: OJD. (2) Source: Google Analytics December 2015.
COMMUNICATION
TELECOMS
WiMax:
22 regional licenses providing nationwide coverage;
Launch of network roll-out in 2015 reaching 1,630 stations (1,100 as at end December 2015);
Accumulated expenditures at this stage: more €140 million including licenses.
Wifirst:
Sales of a high-speed wireless Internet service, particularly in student residences and hotel resorts;
Turnover: €20 million, up by 26% over 2014;
The facility has grown quickly with 364,000 rooms/locations now equipped (vs. 300,000 in 2014);
A new contract was signed with La Poste group to equip 5,000 branch offices.
2015 RESULTS
ELECTRICITY STORAGE & SOLUTIONS
23
BLUE SOLUTIONS, BLUE APPLICATIONS, PLASTIC FILMS
ELECTRICITY STORAGE & SOLUTIONS
(1)
(1) Excluding turnover from Blue Solutions with Group entities, eliminated in the Bolloré financial statements.
FINANCIAL ITEMS IN 2015
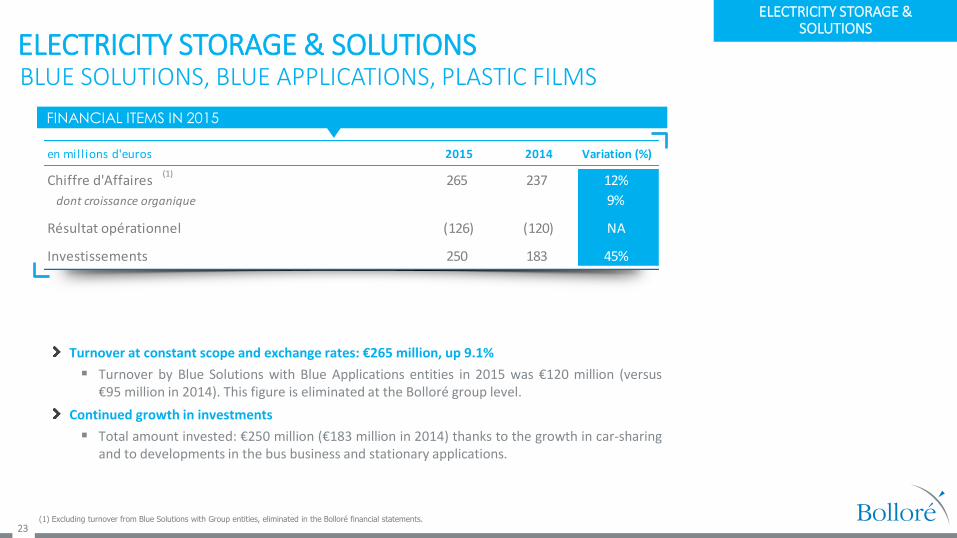
Turnover at constant scope and exchange rates: €265 million, up 9.1%
Turnover by Blue Solutions with Blue Applications entities in 2015 was €120 million (versus €95 million in 2014). This figure is eliminated at the Bolloré group level.
Continued growth in investments
Total amount invested: €250 million (€183 million in 2014) thanks to the growth in car-sharing and to developments in the bus business and stationary applications.
en millions d'euros 2015 2014 Variation (%)
Chiffre d'Affaires 265 237 12%
dont croissance organique 9%
Résultat opérationnel (126) (120) NA
Investissements 250 183 45%
ELECTRICITY STORAGE & SOLUTIONS
24
BLUE SOLUTIONS
(1) Bluecar-Bluecarsharing-Autolib’, Bluebus, Bluetram, Blueboat, Bluestorage, IER, Polyconseil.
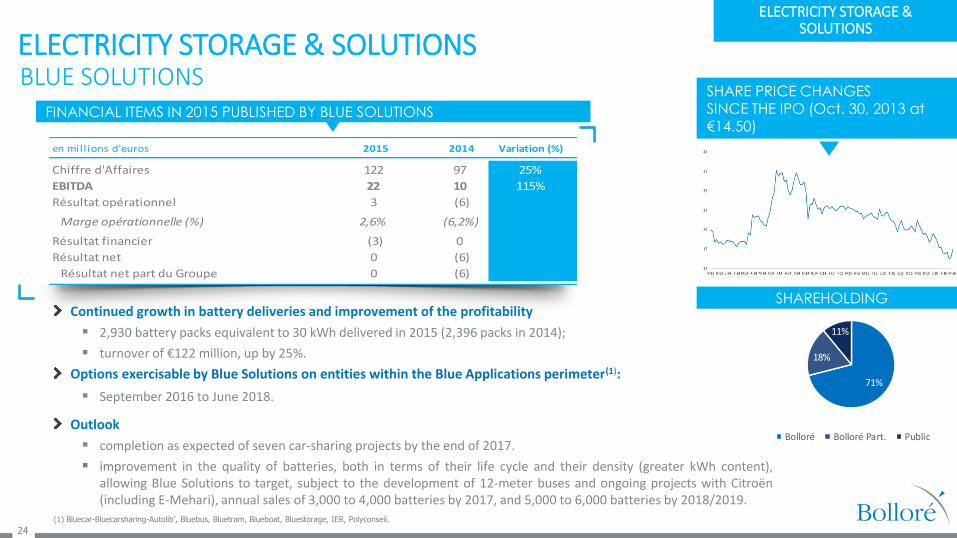
FINANCIAL ITEMS IN 2015 PUBLISHED BY BLUE SOLUTIONS
Continued growth in battery deliveries and improvement of the profitability
2,930 battery packs equivalent to 30 kWh delivered in 2015 (2,396 packs in 2014);
turnover of €122 million, up by 25%.
Options exercisable by Blue Solutions on entities within the Blue Applications perimeter(1):
September 2016 to June 2018.
ELECTRICITY STORAGE & SOLUTIONS
en millions d'euros 2015 2014 Variation (%)
Chiffre d'Affaires 122 97 25%
EBITDA 22 10 115%
Résultat opérationnel 3 (6)
Marge opérationnelle (%) 2,6% (6,2%)
Résultat financier (3) 0
Résultat net 0 (6)
Résultat net part du Groupe 0 (6)
Outlook
completion as expected of seven car-sharing projects by the end of 2017.
improvement in the quality of batteries, both in terms of their life cycle and their density (greater kWh content), allowing Blue Solutions to target, subject to the development of 12-meter buses and ongoing projects with Citroën (including E-Mehari), annual sales of 3,000 to 4,000 batteries by 2017, and 5,000 to 6,000 batteries by 2018/2019.
SHARE PRICE CHANGES SINCE THE IPO (Oct. 30, 2013 at €14.50)
71%
18%
11%
Bolloré Bolloré Part. Public
SHAREHOLDING
BLUE APPLICATIONS - Mobility
25
ACHIEVEMENTS IN 2015
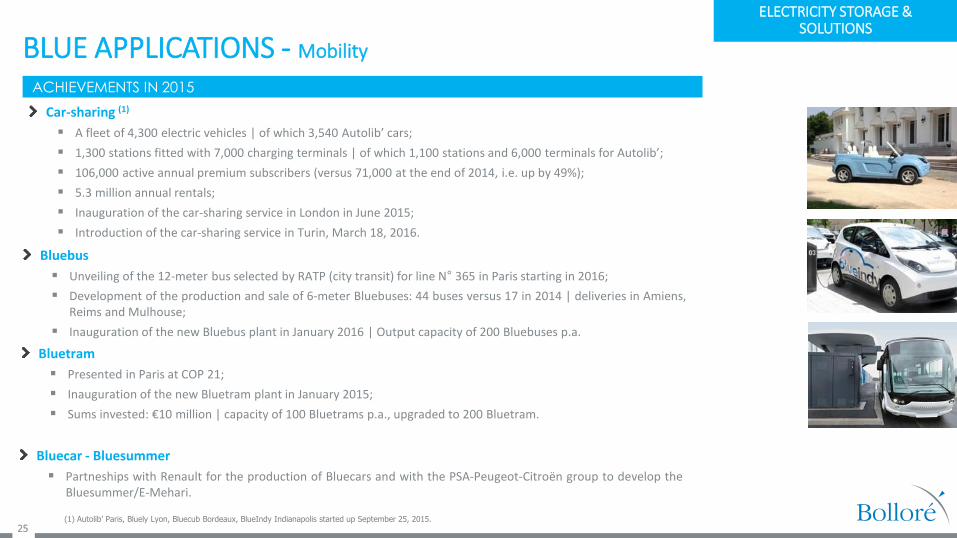
Car-sharing (1)
A fleet of 4,300 electric vehicles | of which 3,540 Autolib’ cars;
1,300 stations fitted with 7,000 charging terminals | of which 1,100 stations and 6,000 terminals for Autolib’;
106,000 active annual premium subscribers (versus 71,000 at the end of 2014, i.e. up by 49%);
5.3 million annual rentals;
Inauguration of the car-sharing service in London in June 2015;
Introduction of the car-sharing service in Turin, March 18, 2016.
(1) Autolib’ Paris, Bluely Lyon, Bluecub Bordeaux, BlueIndy Indianapolis started up September 25, 2015.
Bluebus
Unveiling of the 12-meter bus selected by RATP (city transit) for line N° 365 in Paris starting in 2016;
Development of the production and sale of 6-meter Bluebuses: 44 buses versus 17 in 2014 | deliveries in Amiens, Reims and Mulhouse;
Inauguration of the new Bluebus plant in January 2016 | Output capacity of 200 Bluebuses p.a.
Bluetram
Presented in Paris at COP 21;
Inauguration of the new Bluetram plant in January 2015;
Sums invested: €10 million | capacity of 100 Bluetrams p.a., upgraded to 200 Bluetram.
Bluecar - Bluesummer
Partneships with Renault for the production of Bluecars and with the PSA-Peugeot-Citroën group to develop the Bluesummer/E-Mehari.
ELECTRICITY STORAGE & SOLUTIONS
BLUE APPLICATIONS - Stationary applications, IER, Polyconseil and Plastic Films
26
ACHIEVEMENTS IN 2015
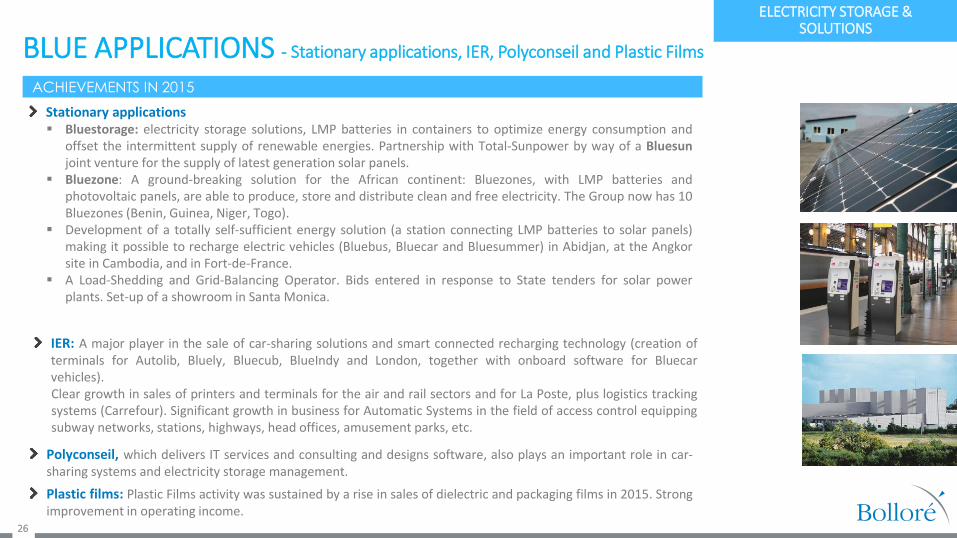
Stationary applications Bluestorage: electricity storage solutions, LMP batteries in containers to optimize energy consumption and
offset the intermittent supply of renewable energies. Partnership with Total-Sunpower by way of a Bluesun joint venture for the supply of latest generation solar panels.
Bluezone: A ground-breaking solution for the African continent: Bluezones, with LMP batteries and photovoltaic panels, are able to produce, store and distribute clean and free electricity. The Group now has 10 Bluezones (Benin, Guinea, Niger, Togo).
Development of a totally self-sufficient energy solution (a station connecting LMP batteries to solar panels) making it possible to recharge electric vehicles (Bluebus, Bluecar and Bluesummer) in Abidjan, at the Angkor site in Cambodia, and in Fort-de-France.
A Load-Shedding and Grid-Balancing Operator. Bids entered in response to State tenders for solar power plants. Set-up of a showroom in Santa Monica.
IER: A major player in the sale of car-sharing solutions and smart connected recharging technology (creation of terminals for Autolib, Bluely, Bluecub, BlueIndy and London, together with onboard software for Bluecar vehicles). Clear growth in sales of printers and terminals for the air and rail sectors and for La Poste, plus logistics tracking systems (Carrefour). Significant growth in business for Automatic Systems in the field of access control equipping subway networks, stations, highways, head offices, amusement parks, etc.
Polyconseil, which delivers IT services and consulting and designs software, also plays an important role in car-sharing systems and electricity storage management.
Plastic films: Plastic Films activity was sustained by a rise in sales of dielectric and packaging films in 2015. Strong improvement in operating income.
ELECTRICITY STORAGE & SOLUTIONS
OTHER ASSETS (1/3)
27
(1) Taking into account financing on Vivendi securities.
(2) Equity accounted.
(3) of which 0.02% held by Financière de l'Odet.
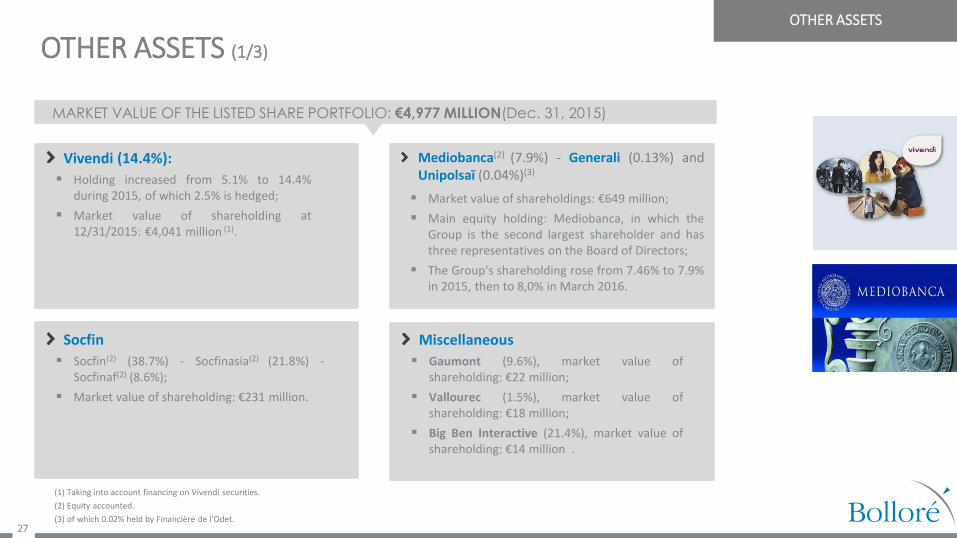
MARKET VALUE OF THE LISTED SHARE PORTFOLIO: €4,977 MILLION(Dec. 31, 2015)
Vivendi (14.4%):
Holding increased from 5.1% to 14.4% during 2015, of which 2.5% is hedged;
Market value of shareholding at 12/31/2015: €4,041 million (1).
Socfin
Socfin(2) (38.7%) - Socfinasia(2) (21.8%) - Socfinaf(2) (8.6%);
Market value of shareholding: €231 million.
Miscellaneous
Gaumont (9.6%), market value of shareholding: €22 million;
Vallourec (1.5%), market value of shareholding: €18 million;
Big Ben Interactive (21.4%), market value of shareholding: €14 million .
Mediobanca(2) (7.9%) - Generali (0.13%) and Unipolsaï (0.04%)(3)
Market value of shareholdings: €649 million;
Main equity holding: Mediobanca, in which the Group is the second largest shareholder and has three representatives on the Board of Directors;
The Group's shareholding rose from 7.46% to 7.9% in 2015, then to 8,0% in March 2016.
OTHER ASSETS

OTHER ASSETS (2/3)
28
(1) Company data before restatement under IFRS. Socfin group plantations are accounted for under the equity method in the Bolloré financial statements.
(2) Not consolidated.
GROUPE SOCFIN AND OTHER AGRICULTURAL ASSETS
Groupe Socfin(1)
the Group holds nearly 38,.% of Socfin, which manages 187,000 hectares (461,890 acres) of plantations in Asia and Africa. Net income was generally held back by a drop in the average price of rubber (down by 20%) and palm oil (down by 24 %) compared to the 2014 fiscal year.
OTHER ASSETS
Surfaces plantées Résultat net (en mill ions d'euros)
(hectares) 2015 2014 Variation (%)
Socfindo Indonésie 48 000 42,6 55,4 (23%) Baisse des cours de l'huile de palme et du caoutchouc
Okomu Nigéria 18 500 13,5 7,4 82% Hausse de la production d'huile de palme de 12%, soutien du prix de
vente de l'huile de palme
Socaplam Cameroun 35 100 Hausse de la production d'huile de palme et soutien des cours
Ferme Suisse Suisse Unité de raffinage
Safa Cameroun Cameroun 9 800 2,8 2,8 2% Baisse des cours, compensée par la hausse de la production
Lac Nigéria 13 800 (5,1) (0,3) na Net recul de la production et baisse des cours du caoutchouc
Brabanta Congo 6 200 (7,1) - - 1ère année de production, quantités produites encourageantes
mais retard des ventes
SOGB Côte d'Ivoire 23 400 9,1 7,0 30% Bonnes performances du caoutchouc et niveau élévé de production
ont compensé la baisse des cours des matières premières
Société Pays Commentaires sur les résultats
9,9 9,0 10%
OTHER ASSETS (3/3)
29
OTHER ASSETS
GROUPE SOCFIN AND OTHER AGRICULTURAL ASSETS
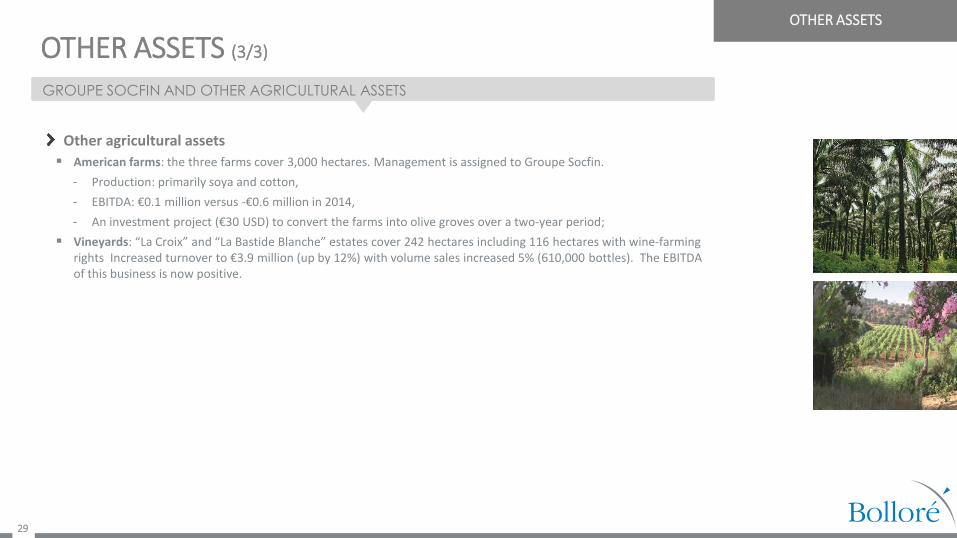
Other agricultural assets
American farms: the three farms cover 3,000 hectares. Management is assigned to Groupe Socfin.
‐ Production: primarily soya and cotton,
‐ EBITDA: €0.1 million versus -€0.6 million in 2014,
‐ An investment project (€30 USD) to convert the farms into olive groves over a two-year period;
Vineyards: “La Croix” and “La Bastide Blanche” estates cover 242 hectares including 116 hectares with wine-farming rights Increased turnover to €3.9 million (up by 12%) with volume sales increased 5% (610,000 bottles). The EBITDA of this business is now positive.

30
Modifiez les styles du texte du masque
Modifiez les styles du texte du masque
Modifiez les styles du texte du masque
Modifiez les styles du texte du masque
Modifiez les styles du texte du masque
APPENDIX
31
BALANCE SHEET 2015 FINANCIAL RESULTS
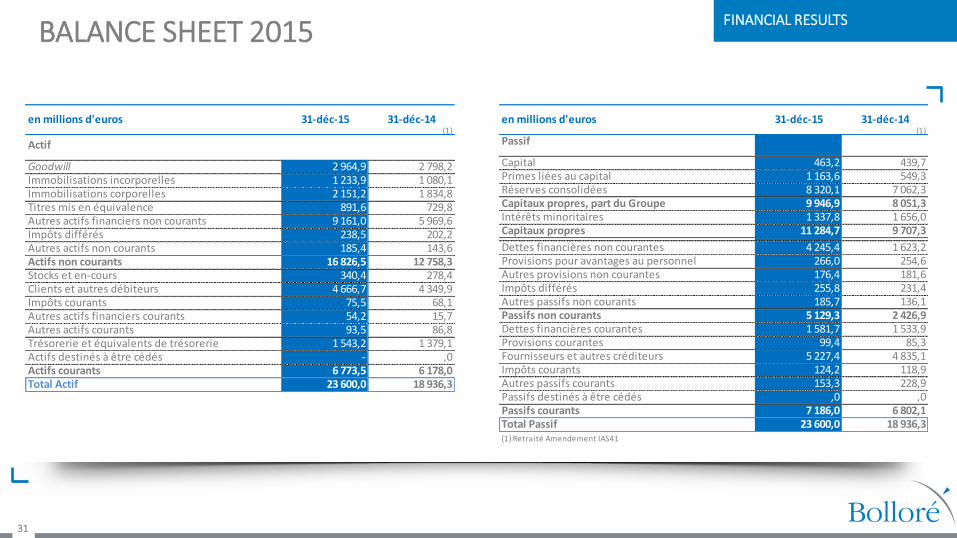
en millions d'euros 31-déc-15 31-déc-14(1)
Actif
Goodwill 2 964,9 2 798,2Immobilisations incorporelles 1 233,9 1 080,1Immobilisations corporelles 2 151,2 1 834,8Titres mis en équivalence 891,6 729,8Autres actifs financiers non courants 9 161,0 5 969,6Impôts différés 238,5 202,2Autres actifs non courants 185,4 143,6Actifs non courants 16 826,5 12 758,3Stocks et en-cours 340,4 278,4Clients et autres débiteurs 4 666,7 4 349,9Impôts courants 75,5 68,1Autres actifs financiers courants 54,2 15,7Autres actifs courants 93,5 86,8Trésorerie et équivalents de trésorerie 1 543,2 1 379,1Actifs destinés à être cédés - ,0Actifs courants 6 773,5 6 178,0Total Actif 23 600,0 18 936,3
en millions d'euros 31-déc-15 31-déc-14(1)
Passif
Capital 463,2 439,7Primes liées au capital 1 163,6 549,3Réserves consolidées 8 320,1 7 062,3Capitaux propres, part du Groupe 9 946,9 8 051,3Intérêts minoritaires 1 337,8 1 656,0Capitaux propres 11 284,7 9 707,3
Dettes financières non courantes 4 245,4 1 623,2Provisions pour avantages au personnel 266,0 254,6Autres provisions non courantes 176,4 181,6Impôts différés 255,8 231,4Autres passifs non courants 185,7 136,1Passifs non courants 5 129,3 2 426,9Dettes financières courantes 1 581,7 1 533,9Provisions courantes 99,4 85,3Fournisseurs et autres créditeurs 5 227,4 4 835,1Impôts courants 124,2 118,9Autres passifs courants 153,3 228,9Passifs destinés à être cédés ,0 ,0Passifs courants 7 186,0 6 802,1Total Passif 23 600,0 18 936,3(1) Retraité Amendement IAS41
32
CONSOLIDATED INCOME STATEMENT 2015 FINANCIAL RESULTS
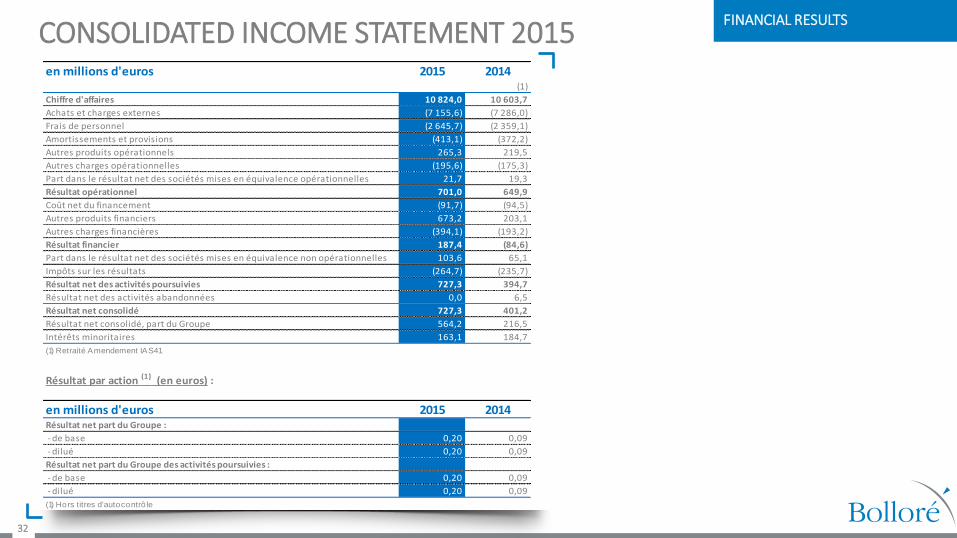
en millions d'euros 2015 2014(1)
Chiffre d'affaires 10 824,0 10 603,7
Achats et charges externes (7 155,6) (7 286,0)
Frais de personnel (2 645,7) (2 359,1)
Amortissements et provisions (413,1) (372,2)
Autres produits opérationnels 265,3 219,5
Autres charges opérationnelles (195,6) (175,3)
Part dans le résultat net des sociétés mises en équivalence opérationnelles 21,7 19,3
Résultat opérationnel 701,0 649,9
Coût net du financement (91,7) (94,5)
Autres produits financiers 673,2 203,1
Autres charges financières (394,1) (193,2)
Résultat financier 187,4 (84,6)
Part dans le résultat net des sociétés mises en équivalence non opérationnelles 103,6 65,1
Impôts sur les résultats (264,7) (235,7)
Résultat net des activités poursuivies 727,3 394,7
Résultat net des activités abandonnées 0,0 6,5
Résultat net consolidé 727,3 401,2
Résultat net consolidé, part du Groupe 564,2 216,5
Intérêts minoritaires 163,1 184,7
(1) Retraité Amendement IAS41
Résultat par action (1) (en euros) :
en millions d'euros 2015 2014Résultat net part du Groupe :
- de base 0,20 0,09
- dilué 0,20 0,09
Résultat net part du Groupe des activités poursuivies :
- de base 0,20 0,09
- dilué 0,20 0,09
(1) Hors titres d'autocontrô le
33
CHANGE IN CONSOLIDATED CASH FLOW FINANCIAL RESULTS
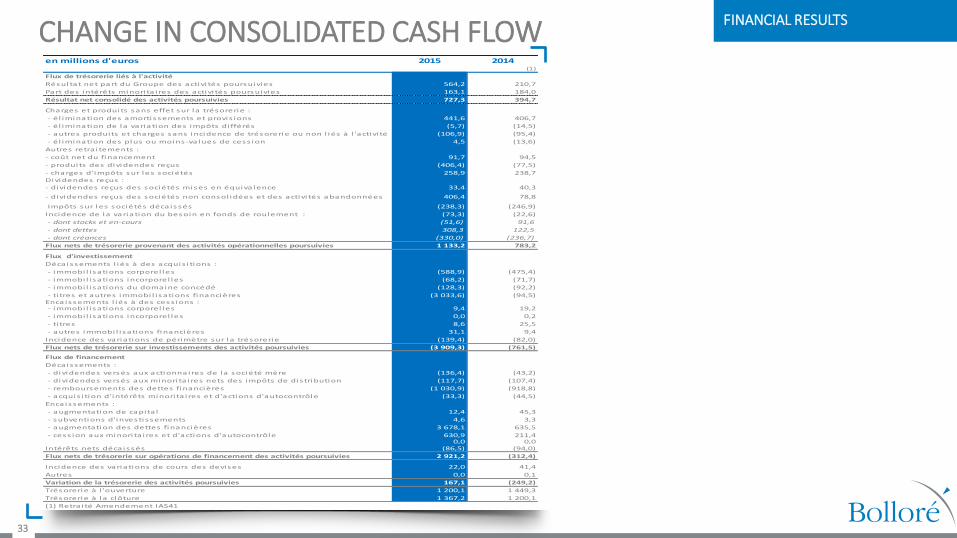
en millions d'euros 2015 2014(1)
Flux de trésorerie liés à l'activité
Résultat net part du Groupe des activi tés poursuivies 564,2 210,7
Part des intérêts minori ta i res des activi tés poursuivies 163,1 184,0
Résultat net consolidé des activités poursuivies 727,3 394,7
Charges et produits sans effet sur la trésorerie :
- él imination des amortissements et provis ions 441,6 406,7
- él imination de la variation des impôts di fférés (5,7) (14,5)
- autres produits et charges sans incidence de trésorerie ou non l iés à l 'activi té (106,9) (95,4)
- él imination des plus ou moins-va lues de cess ion 4,5 (13,6)
Autres retra i tements :
- coût net du financement 91,7 94,5
- produits des dividendes reçus (406,4) (77,5)
- charges d'impôts sur les sociétés 258,9 238,7
Dividendes reçus :
- dividendes reçus des sociétés mises en équiva lence 33,4 40,3
- dividendes reçus des sociétés non consol idées et des activi tés abandonnées 406,4 78,8
Impôts sur les sociétés décaissés (238,3) (246,9)
Incidence de la variation du besoin en fonds de roulement : (73,3) (22,6)
- dont stocks et en-cours (51,6) 91,6
- dont dettes 308,3 122,5
- dont créances (330,0) (236,7)
Flux nets de trésorerie provenant des activités opérationnelles poursuivies 1 133,2 783,2
Flux d'investissement
Décaissements l iés à des acquis i tions :
- immobi l i sations corporel les (588,9) (475,4)
- immobi l i sations incorporel les (68,2) (71,7)
- immobi l i sations du domaine concédé (128,3) (92,2)
- ti tres et autres immobi l i sations financières (3 033,6) (94,5)Encaissements l iés à des cess ions : - immobi l i sations corporel les 9,4 19,2
- immobi l i sations incorporel les 0,0 0,2
- ti tres 8,6 25,5
- autres immobi l i sations financières 31,1 9,4
Incidence des variations de périmètre sur la trésorerie (139,4) (82,0)
Flux nets de trésorerie sur investissements des activités poursuivies (3 909,3) (761,5)
Flux de financement
Décaissements :
- dividendes versés aux actionnaires de la société mère (136,4) (43,2)
- dividendes versés aux minori ta i res nets des impôts de dis tribution (117,7) (107,4)
- remboursements des dettes financières (1 030,9) (918,8)
- acquis i tion d'intérêts minori ta i res et d'actions d'autocontrôle (33,3) (44,5)
Encaissements :
- augmentation de capita l 12,4 45,3
- subventions d'investissements 4,6 3,3
- augmentation des dettes financières 3 678,1 635,5
- cess ion aux minori ta i res et d'actions d'autocontrôle 630,9 211,40,0 0,0
Intérêts nets décaissés (86,5) (94,0)
Flux nets de trésorerie sur opérations de financement des activités poursuivies 2 921,2 (312,4)
Incidence des variations de cours des devises 22,0 41,4
Autres 0,0 0,1
Variation de la trésorerie des activités poursuivies 167,1 (249,2)
Trésorerie à l 'ouverture 1 200,1 1 449,3
Trésorerie à la clôture 1 367,2 1 200,1
(1) Retra i té Amendement IAS41
34
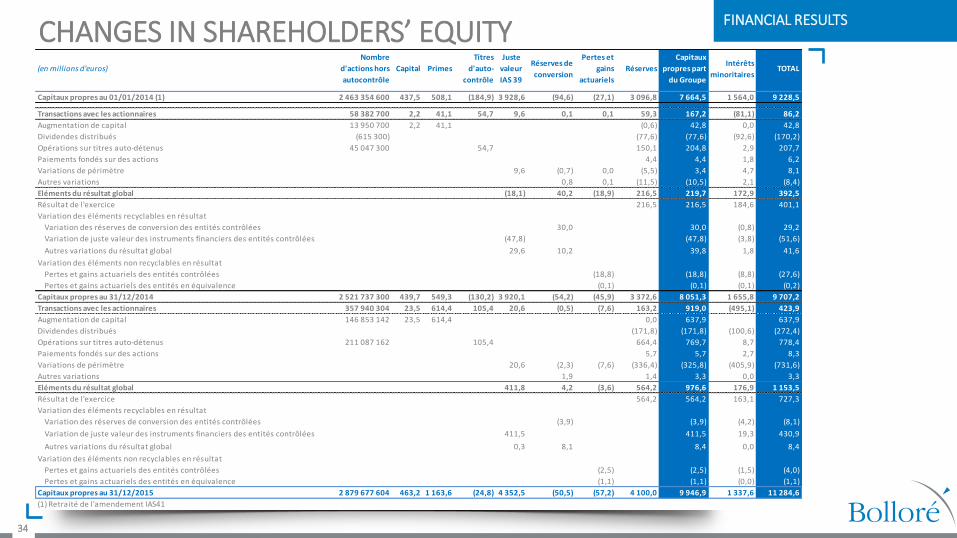
CHANGES IN SHAREHOLDERS’ EQUITY FINANCIAL RESULTS
(en millions d'euros)
Nombre
d'actions hors
autocontrôle
Capital Primes
Titres
d'auto-
contrôle
Juste
valeur
IAS 39
Réserves de
conversion
Pertes et
gains
actuariels
Réserves
Capitaux
propres part
du Groupe
Intérêts
minoritairesTOTAL
Capitaux propres au 01/01/2014 (1) 2 463 354 600 437,5 508,1 (184,9) 3 928,6 (94,6) (27,1) 3 096,8 7 664,5 1 564,0 9 228,5
Transactions avec les actionnaires 58 382 700 2,2 41,1 54,7 9,6 0,1 0,1 59,3 167,2 (81,1) 86,2
Augmentation de capital 13 950 700 2,2 41,1 (0,6) 42,8 0,0 42,8
Dividendes distribués (615 300) (77,6) (77,6) (92,6) (170,2)
Opérations sur titres auto-détenus 45 047 300 54,7 150,1 204,8 2,9 207,7
Paiements fondés sur des actions 4,4 4,4 1,8 6,2
Variations de périmètre 9,6 (0,7) 0,0 (5,5) 3,4 4,7 8,1
Autres variations 0,8 0,1 (11,5) (10,5) 2,1 (8,4)
Eléments du résultat global (18,1) 40,2 (18,9) 216,5 219,7 172,9 392,5
Résultat de l'exercice 216,5 216,5 184,6 401,1
Variation des éléments recyclables en résultat
Variation des réserves de conversion des entités contrôlées 30,0 30,0 (0,8) 29,2
Variation de juste valeur des instruments financiers des entités contrôlées (47,8) (47,8) (3,8) (51,6)
Autres variations du résultat global 29,6 10,2 39,8 1,8 41,6
Variation des éléments non recyclables en résultat
Pertes et gains actuariels des entités contrôlées (18,8) (18,8) (8,8) (27,6)
Pertes et gains actuariels des entités en équivalence (0,1) (0,1) (0,1) (0,2)
Capitaux propres au 31/12/2014 2 521 737 300 439,7 549,3 (130,2) 3 920,1 (54,2) (45,9) 3 372,6 8 051,3 1 655,8 9 707,2
Transactions avec les actionnaires 357 940 304 23,5 614,4 105,4 20,6 (0,5) (7,6) 163,2 919,0 (495,1) 423,9
Augmentation de capital 146 853 142 23,5 614,4 0,0 637,9 637,9
Dividendes distribués (171,8) (171,8) (100,6) (272,4)
Opérations sur titres auto-détenus 211 087 162 105,4 664,4 769,7 8,7 778,4
Paiements fondés sur des actions 5,7 5,7 2,7 8,3
Variations de périmètre 20,6 (2,3) (7,6) (336,4) (325,8) (405,9) (731,6)
Autres variations 1,9 1,4 3,3 0,0 3,3
Eléments du résultat global 411,8 4,2 (3,6) 564,2 976,6 176,9 1 153,5
Résultat de l'exercice 564,2 564,2 163,1 727,3
Variation des éléments recyclables en résultat
Variation des réserves de conversion des entités contrôlées (3,9) (3,9) (4,2) (8,1)
Variation de juste valeur des instruments financiers des entités contrôlées 411,5 411,5 19,3 430,9
Autres variations du résultat global 0,3 8,1 8,4 0,0 8,4
Variation des éléments non recyclables en résultat
Pertes et gains actuariels des entités contrôlées (2,5) (2,5) (1,5) (4,0)
Pertes et gains actuariels des entités en équivalence (1,1) (1,1) (0,0) (1,1)
Capitaux propres au 31/12/2015 2 879 677 604 463,2 1 163,6 (24,8) 4 352,5 (50,5) (57,2) 4 100,0 9 946,9 1 337,6 11 284,6
(1) Retraité de l'amendement IAS41
19,1 (0,0) Compagnie du Cambodge**
5,6 (0,0) Société Industrielle et Financière de l'Artois**
4,9 (0,0) Financière Moncey**
3,6 (0,0) Imperial Mediterranean **
2,3 (0,0) Nord-Sumatra Investissements **
0,4 (0,0) Imperial Mediterranean **
0,1 (0,0) Société Bordelaise Africaine**
10,0 (2)
22,8
61,8 64,2
4,1(3)
36,7
15,2
14,0 8,9
48,2
42,1
71,2
17,8(9)
11,5
56,5
55,5
5,0
58,8
6,0
6,8
13,0
Sofibol
63,8 (8)
(64,2)
55,3(7)
(92,0)
Financière de l'Odet
8,9
64,6 (4)
LOGISTIQUE PETROLIERE
100,0 (1)
Bolloré Railways
Nord-Sumatra Investissements
67,2(1)
La Forestière Équatoriale
(Côte d'Ivoire)
Plantations des Terres Rouges
(Luxembourg)
Compagnie du Cambodge
Financière Moncey
32,5
Havas
Bolloré
Socfinaf 1,8 (12)
1,9 (6)
16,7
29,2(1)
90,5(1)
9,3
17,5
Médias, télécoms
Bolloré Energie
31,5
3,3(11)
37,1(1)
7,3
Société Industrielle et
Financière de l'Artois
26,6
25,3 (1)
28,6
15,1
25,9
100,00
100,0(1)
100,0 (10)
37,0 (5)
12,0
Bolloré Logistics
StOCKAGE D'ÉLECTRICITÉ
ET SOLUTIONS
Bolloré Ports
TRANSPORT ET LOGISTIQUE
COMMUNICATION
100,0
Compagnie des Tramways de Rouen
4,3*
3,7*
1,1*
2,5*
9,2*
Films plastiques
Financière deSainte-Marine
35,7*
Compagnie de Pleuven
Socfin ex-Socfinal
(Luxembourg)
Socfinasia(Luxembourg)
Société Bordelaise Africaine
Imperial Mediterranean
Blue Solutions
Financière du Perguet
Compagnie deCornouaille
6,0*
11,0*
40,0*
Société des Chemins de Fer et Tramways duVar et du Gard
3,9*
Blue Applications
IER
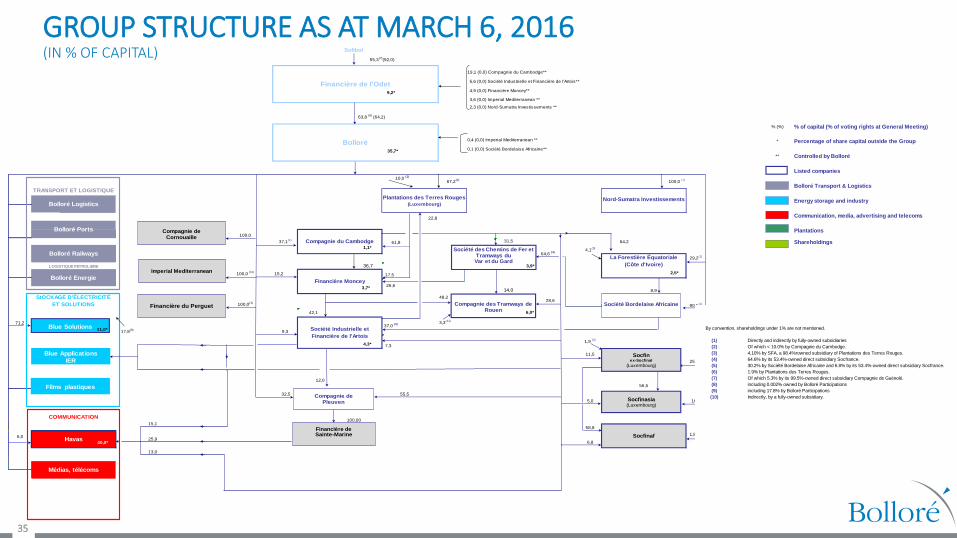
GROUP STRUCTURE AS AT MARCH 6, 2016 (IN % OF CAPITAL)
35
19.1 (0.0) Compagnie du Cambodge**
5.6 (0.0) Société Industrielle et Financière de l'Artois**
4.9 (0.0) Financière Moncey**
3.6 (0.0) Imperial Mediterranean **
2.3 (0.0) Nord-Sumatra Investissements **
0.5 (0.0) Imperial Mediterranean **
0.1 (0.0) Société Bordelaise Africaine**
10.0(2)
22.8
61.8 64.2
4.1(3)
36.7
15.2
8.9
48.2
42.1 64.6(4)
71.2 14.0
17.8(9)
11.5
56.5
55.5
5.0
58.8
27.0
6.8
13
By convention, shareholdings under 1% are not mentioned.
(1) Directly and indirectly by fully-owned subsidiaries
(2) Of which < 10.0% by Compagnie du Cambodge.
(3) 4,10% by SFA, a 98.4%rowned subsidiary of Plantations des Terres Rouges.
(4) 64.6% by its 53.4%-owned direct subsidiary Socfrance.
(5) 30.2% by Société Bordelaise Africaine and 6.8% by its 53.4%-owned direct subsidiary Socfrance.
(6) 1.9% by Plantations des Terres Rouges.
(7) Of which 5.3% by its 99.5%-owned direct subsidiary Compagnie de Guénolé.
(8) including 0.002% owned by Bolloré Participations
(9) including 17.8% by Bolloré Participations
(10) Indirectly, by a fully-owned subsidiary.
8.9
31.5
100.0
100.0(10)
Bolloré Railways
12.0
26.6
7.3
27.4
Bolloré Énergie
Oil logistics
100.00
Société Industrielle et
Financière de l'Artois
37.0(5)
Bolloré Logistics
ELECTRICITY STORAGE AND
SOLUTIONS
Bolloré Ports
BOLLORÉ
TRANSPORTATION &
LOGISTICS
Blue Applications
IER
Media, telecoms
52.4
100.0(1)
Listed companies
47.6
15.1
COMMUNICATION
Shareholdings
Plantations
1,9(6)
28.6
Percentage of share capital outside the Group
Bolloré Transport & Logistics
Energy storage and industry
Controlled by Bolloré
Communication, media, advertising and telecoms
16.7
1.8(1)Socfinaf
**
9.3
% (%) % of capital (% of voting rights at General Meeting)
*
32.5
Havas
Bolloré
Plantations des Terres
Rouges
(Luxembourg)
64.0(8)
(64.4)
100.0 (1)
Nord-Sumatra
Investissements
67.2(1)
55.3(7)
(92.0)
Financière de l'Odet
Forestière Équatoriale
(Republic of Côte
d'Ivoire)
Financière Moncey
17.5
3.3
37.1(1)
Sofibol
25.3(1)
Compagnie du
Cambodge
29.2(1)
90.5(1)
Compagnie des Tramways de Rouen
Société des Chemins de Fer et Tramways du
Var et du Gard
4.3*
3.7*
1.1*
4.6*6.0*
2.5*
9.2*
Plastic films
Financière deSainte-Marine
35.4*
Compagnie de Pleuven
Socfin ex-Socfinal
(Luxembourg)
Socfinasia(Luxembourg)
Société Bordelaise Africaine
Imperial Mediterranean
Blue Solutions
Financière du Perguet
Compagnie deCornouaille
6.0* 3.9*
11.0*
17.5*