Liability Structure in Small-scale Finance
34
Policy Research Working Paper 5427 Liability Structure in Small-scale Finance Evidence from a Natural Experiment Fenella Carpena Shawn Cole Jeremy Shapiro Bilal Zia e World Bank Development Research Group Finance and Private Sector Development Team September 2010 WPS5427 Public Disclosure Authorized Public Disclosure Authorized Public Disclosure Authorized Public Disclosure Authorized Public Disclosure Authorized Public Disclosure Authorized Public Disclosure Authorized Public Disclosure Authorized
Transcript of Liability Structure in Small-scale Finance
Policy Research Working Paper 5427
Liability Structure in Small-scale Finance
Evidence from a Natural Experiment
Fenella CarpenaShawn Cole
Jeremy ShapiroBilal Zia
The World BankDevelopment Research GroupFinance and Private Sector Development TeamSeptember 2010
WPS5427P
ublic
Dis
clos
ure
Aut
horiz
edP
ublic
Dis
clos
ure
Aut
horiz
edP
ublic
Dis
clos
ure
Aut
horiz
edP
ublic
Dis
clos
ure
Aut
horiz
edP
ublic
Dis
clos
ure
Aut
horiz
edP
ublic
Dis
clos
ure
Aut
horiz
edP
ublic
Dis
clos
ure
Aut
horiz
edP
ublic
Dis
clos
ure
Aut
horiz
ed

Produced by the Research Support Team
Abstract
The Policy Research Working Paper Series disseminates the findings of work in progress to encourage the exchange of ideas about development issues. An objective of the series is to get the findings out quickly, even if the presentations are less than fully polished. The papers carry the names of the authors and should be cited accordingly. The findings, interpretations, and conclusions expressed in this paper are entirely those of the authors. They do not necessarily represent the views of the International Bank for Reconstruction and Development/World Bank and its affiliated organizations, or those of the Executive Directors of the World Bank or the governments they represent.
Policy Research Working Paper 5427
Microfinance, the provision of small individual and business loans, has witnessed dramatic growth, reaching over 150 million borrowers worldwide. Much of its success has been attributed to overcoming the challenges of information asymmetries in uncollateralized lending. Yet, very little is known about the optimal contract structure of such loans—there is substantial variation across lenders, even within a particular setting. This paper exploits a plausibly exogenous change in the liability
This paper—a product of the Finance and Private Sector Development Team, Development Research Group—is part of a larger effort in the department to conduct policy-oriented research. Policy Research Working Papers are also posted on the Web at http://econ.worldbank.org. The author may be contacted at [email protected].
structure offered by a microfinance program in India, which shifted from individual to group liability lending. The analysis finds compelling evidence that contract structure matters: for the same borrower, required monthly loan installments are 6 percent less likely to be missed under the group liability setting, relative to individual liability. In addition, compulsory savings deposits are 19 percent less likely to be missed under group liability contracts.

Liability Structure in Small-scale Finance: Evidence from a Natural
Experiment∗
Fenella Carpena, Shawn Cole, Jeremy Shapiro, and Bilal Zia†
1 Introduction
Theory and evidence highlight financial market imperfections as a central cause of poverty and a key
impedement to growth (Banerjee and Newman, 1993; Galor and Zeira, 1993; Rajan and Zingales,
1998). In theories of capital accumulation for example, financial market imperfections influence the
poor’s ability to borrow for investments in education and physical capital. Additionally, in models
explaining entrepreneurship, information asymmetries and transaction costs prevent profitable en-
treprenurial activities of the poor, who often have no collateral. Lack of access to financial services
may thus play a crucial role in leaving many productive opportunities for the poor untapped, as
well as in generating persistent income inequality and lower growth (Beck et al., 2008).1
Microfinance, the provision of credit, savings and other financial services to low-income house-
holds and entrepreneurs, has exploded in popularity and coverage in recent years, particularly in
meeting the large unmet demand for finance (Morduch, 1999; Armendariz de Aghion and Morduch,
2010). Emerging markets and developed economies alike, including the United States, now provide
microfinance services through a variety of public and private channels. The growth of microfinance
has been unprecedented: between 2004 and 2008, the sector’s average annual asset growth rate
was 39%, reaching US$60 billion in total assets by the end of 2008 (Chen et al., 2010). A careful
evaluation of microfinance in Banerjee et al. (2009) has also revealed that microcredit does have
important effects on business outcomes and the composition of household expenditure. The rapid
∗This project is a collaborative research effort with Saath Microfinance. We thank Saath, Xavier Gine, DavidMcKenzie, Petia Topalova, and workshop participants at the World Bank for helpful comments and suggestions.Stuti Tripathi provided excellent research assistance. Financial support from the World Bank, and the HBS Divisionof Faculty Research and Development, is gratefully acknowledged.†World Bank ([email protected]), Harvard Business School ([email protected]), Yale University
([email protected]), and World Bank ([email protected]), respectively.1See World Bank (2008) for a literature summary.
1

growth of microfinance, along with its potential for promoting development, has attracted the inter-
est not only of governments, donors, and socially oriented investors, but of mainstream commercial
banks as well.
Perhaps the most celebrated feature of microfinance is the group liability contract, a lending
methodology pioneered by the Grameen Bank in Bangladesh. Under this contract, loans without
collateral are extended to a group of borrowers whose members are jointly liable for each other’s
repayment. Since groups form voluntarily and group members are responsible for paying off each
other’s debts, borrowers have the incentive to screen risky clients, monitor their peers, and enforce
repayment. The success of this model with the Grameen Bank led to its replication in many
other countries around the world, with over 150 million individuals reached at the end of 2007
(Daley-Harris, 2009). This model is particularly important given that small firms suffer most from
institutional weakness (Beck et al., 2005), and because the structure of the banking sector can have
important distributional impacts on growth (Cetorelli and Gambera, 2001).
While most microfinance organizations use group liability, not all do so. On the one hand, group
liability may solve information asymmetry problems by leveraging social ties and the borrower’s
knowledge about the community, and reduce monitoring costs to the lender by motivating borrowers
to monitor each other. On the other hand, social sanctions may be limited, bad clients may free-
ride on good clients, and borrower groups may collude against the lender. In addition to group
liability lending, many microfinance programs also employ a variety of approaches to maintain high
repayment rates. For example, some programs implement frequent repayment schedules, progressive
lending, or require collateral substitutes. And yet, very little is known about the efficiency of such
designs in ensuring repayment.
Indeed, the question of an optimal loan contract structure remains largely unanswered in both
the theoretical and empirical microfinance literature. Theoretical studies have mainly focused on
explaining how and why group liability mechanisms work, offering competing predictions on its
benefits, while the empirical literature lags behind the theory. An important exception is Gine and
Karlan (2009), which reports on a field experiments in the Philippines to test the effect of individual
versus group liability lending. Their analysis focuses on the importance of peer monitoring, and
finds no significant difference in default among individual and group borrowers. However, they
study existing group borrowers who convert to individual liability, and it is quite possible that the
2

social ties and repayment discipline instilled by group monitoring remain intact even with a shift to
individual liability. Further, since they focus on pre-formed groups, they are not able to measure
or identify the presence or importance of screening in group liability contracts.
Identifying the impact of group liability on outcomes such as default rate is complicated by
the standard problems of selection and omitted variables bias. Individuals with different financial
habits might choose to take one form of contract but not the other. Alternatively, lenders with
different levels of sophistication may attract different client mixes, and offer different contracts.
One cannot simply compare clients across lending contracts, since self-selection or other aspects of
the program may be the root cause of any observed differences.
In this paper, we use a natural experiment to compare loan repayment and savings discipline
between group liability and individual liability contracts.2 Our empirical strategy takes advantage
of a change in lending policies of Saath, a non-government organization providing microfinance
services in India. Saath switched from individual liability to group liability lending. This transition
was governed by a strict policy rule: after a particular date, all borrowers completing an individual
liability cycle were subsequently switched to group liability in their next loan. Individual liability
loan completion dates were distributed relatively uniformly throughout the year, which offers a
natural variation in switching of loan contracts. Thus, in July for example, individual liability
borrowers finishing a loan cycle would switch to group liability in the following loan, while those
whose loan cycle ended after July would remain under an individual contract setting until the end
of the cycle. This plausibly exogenous change was phased in over time, generating natural control
groups, and allows us to credibly identify the causal impact of group liability structure. Further,
since we have time series data both before and after group liability is introduced, we can study the
dynamics of group borrower formation.
Consistent with Ghatak (1999 and 2000), we find evidence of assortative matching. Specifically,
we find that the formation of groups is endogenous to borrower risk types: safe borrowers are
significantly more likely to form joint liability groups with other safe borrowers, even controlling
for other factors such as physical proximity.
Our main analysis focuses on loan performance and estimates the joint effect of assortative peer
matching and ex-post peer monitoring under group liability. We find that group liability structure
2Throughout this paper, we use the terms “group liability” and “joint liability” interchangeably.
3
significantly improves repayment rates. In particular, clients are about 6% less likely to miss a
monthly repayment in the group liability setting relative to individual liability; this effect holds
even with individual fixed effects. We also find that there is greater discipline in monthly compulsory
savings deposits when clients have a group liability loan. Specifically, compulsory deposits are about
19% less likely to be missed in the group liability setting. Our results provide the first credible
evidence that group liability contracts improve upon individual liability, particularly in ensuring
repayment and increasing savings discipline among clients.
From a practical and policy perspective, our results are quite timely. Microlenders worldwide
are increasingly weakening joint liability in their lending approaches (Armendariz de Aghion and
Morduch, 2010). For example BancoSol in Bolivia has shifted significant proportions of its lending
portfolio from group to individual lending, and even the Grameen Bank has moderated its joint
liability clause, allowing defaulters to get back on track without invoking group pressure. Our
results suggest a careful rethinking of such policy direction.
The rest of this paper is organized as follows. Section 2 reviews the existing literature on
liability structure in microfinance. Section 3 provides a background on the microfinance program
we study, as well as the change in liability structure of its loan products. In Section 4, we provide
a description of the data and summary statistics, and discuss our empirical strategy and results in
Section 5. Finally, Section 6 concludes.
2 Predictions of Group Liability
A wealth of theoretical literature in microfinance explores the mechanisms behind group liability
contracts, particularly on mitigating information asymmetries and enforcement problems. Stiglitz
(1990) shows that the group liability structure overcomes ex ante moral hazard, since it creates
incentives for group members to monitor each other’s loans. Although group liability induces
borrowers to bear more risk, Stiglitz argues that the gains from monitoring exceeds this cost,
leading to improved borrower welfare. Similarly, Banerjee et al. (1994) study credit cooperatives
and underscore the role of peer monitoring. They describe a model where higher monitoring results
in higher borrower effort, and hence, a higher probability of project success.
Even if a project succeeds, however, borrowers may refuse to repay or may claim that the
4

project failed to avoid repayment. This strategic default, or ex post moral hazard, is also captured
in several theoretical studies on group liability. For example, Besley and Coate (1995) provide
a model demonstrating that joint liability may harness social capital to increase a borrower’s
willingness to repay. Moreover, they show that if social penalties are sufficiently severe, group
liability results in higher repayment rates than individual lending. Armendariz de Aghion (1999)
likewise demonstrates that joint liability agreements may increase the lender’s ability to elicit debt
repayments. It may also reduce the incidence of strategic default since borrowers may impose social
sanctions on the defaulter.
In addition to examining moral hazard, the theoretical literature investigates how joint liability
mitigates adverse selection. Ghatak (2000) describes a model under a scenario where borrowers have
ex-ante information about the riskiness of other borrower’s investment projects, while lenders do
not. Joint liability then acts as a screening device inducing ‘assortative matching.’ Borrowers with
safe investments will partner with other safe borrowers, leaving risky borrowers to form groups
with themselves. In the case where borrowers do not have full information about each other’s
risk types, Armendariz de Aghion and Gollier (2000) demonstrate that peer group formation may
still mitigate adverse selection. They describe a ‘collateral effect’ where cross-subsidization among
borrowers acts as a collateral behind the loan, thus enhancing efficiency.
These theoretical models, among others, have shown that group liability may improve repayment
rates through alleviating imperfections in the credit market. However, whether group liability
outperforms other contract structures remains an open question in the microfinance literature.
For example, Besley and Coate (1995) point out in their model that group liability also creates
a negative incentive effect. If borrowers cannot repay as a group, then some group members will
not find it worthwhile to contribute their share of repayment, even though they would have repaid
under individual lending. Rai and Sjostrom (2004), on the other hand, argue that a system of
cross-reports which elicits information about borrower’s projects does better than both group and
individual liability. With limited side contracting, such a system improves performance since it
reduces the deadweight loss of harsh punishments.
Inconclusive empirical evidence accompanies these ambiguous theoretical predictions. Some
empirical studies support the theoretical advantages of group liability. For instance, Wenner (1995)
considers a group credit program in Costa Rica, and finds that groups which screened members and
5
used local information had lower rates of delinquency; in Bangladesh, Sharma and Zeller (1997)
show that groups that were formed through self-selection had better repayment rates. However,
both of these studies may suffer from omitted variable biases or selection problems. Other studies
provide little empirical evidence for the theory: Wydick (1999) finds that in group lending in
Guatemala, social ties have limited impact on repayment and that borrowers are in fact more
tolerant with their friends; Ahlin and Townsend (2007) use Thai data to show that repayment
rates are negatively associated with social ties.
Only a handful of studies examine the merits of group liability relative to other contract struc-
tures. Fischer (2009) conducts a series of lab experiments with actual microfinance clients and
provides evidence that contract structure affects project selection. Specifically, he finds that group
liability increases risk-taking, relative to individual liability contracts, as borrowers free-ride on
the insurance provided by their partners. When project approval is required, however, risk taking
under group liability is lower than both individual liability and an equity-like contract in which
income is shared equally.
The most relevant study on repayment rates under different loan liability structures is Gine and
Karlan (2009), who report evidence from a series of field experiments in the Philippines. In the
first, borrowers who had signed up under a group liability structure were converted to individual
liability, thus the authors can independently identify the peer monitoring effect under group liability
since both joint and individual liability groups previously underwent the same screening. However,
they cannot identify or rule out any impacts of screening with this methodology. In addition, the
group repayment and monitoring mechanisms may already be entrenched and difficult to undo
even with an indivdual liability structure. Their second experiment randomly introduced either
group or individual liability lending to new borrowers. However, the experiment was at the loan
center level and take-up was quite uneven between group and individual loan centers, resulting
in potential statistical power concerns. In both instances, they find default rates are invariant to
contract structure.
Our paper complements Gine and Karlan (2009) by examing optimal contract structure in an
alternative setting. While the original experiment in Gine and Karlan (2009) focuses on moving
from group to individual liability contracts, we explore the reverse; that is, the shift from individual
to group liability. As such, we are able to study the dynamics of group formation and find evidence
6

on assortative matching.
The following section describes the setting and our empirical strategy in more detail.
3 Empirical Setting
Our partner institution, Saath, is a non-government organization based in Ahmedabad, India.
Founded in 1989, Saath implements development initiatives in slum communities, including health,
education, infrastructure improvement, job placement, and livelihood training programs. Addition-
ally, Saath provides credit and savings services to the urban poor through its Microfinance Unit.
In 2009, Saath Microfinance had over 6,400 active clients in 4 branches, with a savings portfolio of
INR 18 million (USD 390,000) and a loan portfolio of INR 19 million (USD 410,000).3
While Saath has provided mentoring support to community-based credit and savings groups
since the mid-1990s, its Microfinance Unit was not formally established until 2002. In that year,
Saath integrated the credit and savings groups it previously mentored into its organization, as
well as registered them as cooperative societies with the Indian government. Saath also began
managing these credit and savings cooperatives at this time, giving way to the Saath Microfinance
Unit. Today, Saath Microfinance provides various financial services to slum communities, including
voluntary savings accounts, compulsory savings accounts, and group liability loans.
3.1 Savings Products
Since its inception in 2002, Saath Microfinance has been offering voluntary savings accounts to
its clients. These voluntary savings earn an interest of 6% per year and do not have a minimum
balance. As the name suggests, members are not obliged to make regular deposits in voluntary
savings accounts. Any amount may be deposited, but only six withdrawals per year may be made.
In November 2007, Saath Microfinance initiated compulsory savings accounts among its mem-
bers. Specifically, members are required to deposit INR 100 (USD 2) every month into compulsory
savings accounts, for the duration of their membership with Saath Microfinance. Clients may with-
draw any amount from their compulsory savings at any time, as long as a minimum balance of INR
3,500 (USD 70) is maintained. Similar to voluntary savings, compulsory savings earn an interest
3Based on Saath’s 2008-2009 Annual Report.
7

of 6% per year. Any amount which the client deposits over the compulsory savings of INR 100 is
deposited in the client’s voluntary savings account. The goal of the compulsory savings account is
to allow clients to build a financial buffer stock against adverse shocks. It also provides low-cost
capital to Saath Microfinance. It is important to note that the compulsory deposits were mandated
of all borrowers, independent of the switch to group liability loans. Hence, all outstanding loans
under both individual and group liability were required to make compulsory deposits after Novem-
ber 2007. In the analysis section, we will compare the adherence to these compulsory deposits for
the same person as s/he moves from individual to group liability.
3.2 Loan Products
In addition to savings products, Saath Microfinance provides loans for asset creation (e.g. house
repairs), production (e.g. business working capital), and consumption (e.g. health, social func-
tions). From its beginnings in 2002 until November 2007, Saath provided credit through individual
liability loans. Beginning in November 2007, Saath discontinued individual liability loans, offering
instead group liability loans to members applying for loans.
Under the individual liability loan model, a client was required to have been a member of Saath
for at least six months with a savings account in order to be eligible for a loan. Members could
borrow up to three times their savings account balance, at an interest rate of 18% per year.4 These
individual-liability loans generally require no collateral, however, each loan applicant must meet two
requirements. First, the loan applicant must have two “guarantors” who also have a savings account
with Saath. Second, the combined savings balances of the loan applicant and the two guarantors
must be greater than or equal to the loan amount applied for. Although guarantors are in principle
required to maintain these savings balances through the duration of the loan, in practice this rule
was not strictly enforced. Guarantors are not eligible for a loan until the loan they guaranteed
has been fully repaid, but loan repayment is the sole responsibility of the borrower. Borrowers are
required to make monthly installments which cover principal and interest. The monthly principal
installment is a fixed amount, and since the interest rate is declining balance, the total installment
4Microfinance organizations typically quote interest rates in one of two forms: “declining,” the standard used indeveloped markets, where the amount of interest due each period is calculated based on the interest rate and theremaining principle, and “flat,” where the interest payments are calculated using the original principal amount. Thusa 10% “flat” rate is significantly higher than a 10% “declining” rate. Saath quotes rates using the standard decliningbalance approach.
8

amount (principal plus interest) varies every month. If the borrower defaults, Saath reserves the
right to take the guarantors’ savings.
With the group liability model, on the other hand, Saath extends credit to groups of individuals
at an interest rate of 24% per year. These groups form primarily through self-selection with joint
applications submitted to Saath. Groups are composed of three to six individuals, all of whom
must be Saath Microfinance members. Within each group, several criteria must be fulfilled. First,
at least 50% of the group must have been Saath Microfinance members for at least 6 months with
at least a savings account. Second, at least 50% of the group must be female. Third, relatives
or individuals from the same household are not allowed in the same group. And finally, loan
terms must be homogenous across group members; that is, the number of installments as well as
the monthly installment due dates must be the same, and the loan amount must not vary widely
within each group. As in the individual liability model, group liability borrowers are required to
make monthly installments for both principal and interest, although in this setting, total installment
amounts (principal plus interest) are equated every month. That is, unlike the individual liability
model where the monthly principal installment is the same every month, it is the total installment
amount that is made to be equal in the group liability setting. Before any loans are disbursed,
group members are also required to sign a “mutual agreement form,” stating that they are liable to
pay each other’s debt in the event of default or delinquency. Borrower groups who have defaulted
or are delinquent are no longer eligible to receive a next loan from Saath.
3.3 Shift from Individual to Group Liability
Saath’s decision to shift from offering individual-liability to group liability loans in November
2007 was due to a change in the management’s priorities. Saath wanted to lend to more people,
provide larger loan amounts, and expand its microfinance operations geographically, but its lending
activities had become stagnant under the individual liability model. In particular, the “guarantors”
requirement for individual liability loans restricted credit eligibility, as Saath had already reached
a point where almost all of its members were either a borrower or a guarantor. Additionally,
savings clients were reluctant to stand as guarantors for another client’s loans, and loan amounts
were limited to 3 times the total savings account balance of the borrower. Saath management
thus shifted to group liability loans to overcome the restrictions in its individual liability model.
9

In terms of the models discussed above, the limited ability of Saath members to pledge savings
as a collateral prevented Saath from expanding, and it saw group liability as a way to solve this
problem. In the year following this change, Saath gained almost 800 new clients and increased its
reach from 11 to 20 wards.
The transition from individual liability to group liability loans was implemented with the fol-
lowing rule. Beginning in November 2007, all new loans disbursed were group liability loans; Saath
would no longer disburse individual liability loans. However, existing loans whose term lasted be-
yond November 2007 were unaffacted. For example, individual liability loan clients who completed
their loan in February 2008 continued under the individual liability contract until then, and fol-
lowing February 2008 would receive a group liability loan should they borrow again. The date of
switching from individual to group liability was therefore determined by individual liability loan
completion dates. These completion dates and subsequent conversion to group liability loans were
distributed relatively uniformly throughout the year.
Although Saath’s loan product moved from individual to group liability beginning in late 2007,
repayment collection protocol (e.g. place of repayment, frequency of collection) and salaries for
field officers remained similar across time in our dataset. An empirical concern for the analysis to
follow is whether Saath’s policy shift from individual to joint liability was also accompanied by a
shift in their loan collection techniques. A survey of field officers conducted in June 2010 confirms
that in both individual and group liability settings, field officers collected loan installments at the
client’s household or workplace every month. For group liability borrowers, Saath does not require
groups to designate one of its members as a “group leader,” but in practice, almost all groups have
a leader who is in charge of collecting repayments from other members. Hence, among individual
borrowers, field officers visited each borrower, while among group borrowers, field officers typically
visit only the group leader’s household. If any member of a particular borrower group fails to
make a scheduled payment, the field officer assembles all group members together, and collects the
installment amount from the other members as stipulated in the group liability contract. Both
individual liability borrowers and joint liability borrower groups in default are not granted any
loans in the future. In addition, over the period we study, there was no change in wages among
field officers, who continued to receive a fixed monthly sum.5
5After March 2009 field officers received 1% of the loan interest they collect. Surveys of field officers indicate that
10

Overall, there are only two differences between Saath’s individual and group liability loans: first,
the interest rate, which increased from 18% to 24% (declining balance) per year; and second, the
required total monthly installment amounts (principal plus interest), which varied slightly month
to month in the individual liability model but was constant in the group liability setting. In our
main analysis on loan repayment and savings discipline, we will focus only on individuals who
converted to group liability loans, exploiting the timing of their switch. By doing so, our empirical
design accounts for any self-screening based on the increase in interest rates between the two loan
contracts.
4 Data Collection and Summary Statistics
In this study, we use data from Saath Microfinance’s administrative software systems. The loan
data cover outstanding loans every month from April 2005 through March 2009. Since the change
in the type of loan contract occurred in November 2007, the data contain over two years of monthly
data on individual liability loans and over one year on group liability loans. Data are available
electronically from only 2 out of 4 Saath Microfinance branches, Behrampura and Vasna, and we
focus on these. They are the two largest branches, and the oldest, accounting for the vast majority
of Saath’s clients.
The data were maintained for accounting purposes, recording cash flowing in and out of each
branch. They are therefore of very high quality. They do not, however, contain information on the
terms of each loan, such as maturity dates, installment amounts, and amounts outstanding. These
data were recorded by loan officers in client passbooks and administrative ledgers. As a result, we
are unable to look at overdue amounts, prepayments, and other similar measures.6
While the data on loans cover April 2005 to March 2009, the savings data were only avail-
they were not aware of this change in compensation structure before it occured. Nevertheless, to isolate the focus ofour study on contract structure, we exclude months after March 2009 in the analysis.
6The loan data come from three software systems which Saath Microfinance has used at different points in time.Each of the two branches in our dataset used a separate system until early 2008, when the current system wasintroduced in both branches. Because client identifiers were not carried over from one software system to another,we had to rely on using client names to track individuals over time. These names were unique since they includedfirst, middle, and last names. In identifying clients across systems, 80% of the clients had exact name matches, while14% had to be matched by hand due to name spelling errors. The remaining 6%, on the other hand, could not bematched to the current software system. It is likely that these clients have withdrawn their membership with SaathMicrofinance and therefore have not borrowed under the group liability setting, since Saath migrated informationfrom the previous to the current software system only for existing members.
11
able from January 2008 to March 2009. The savings data include monthly aggregate deposit and
withdrawal amounts, for compulsory savings accounts.
As previously described, in our main analysis we study borrowers who have received both
individual and group liability loans to overcome the selection problem. Hence, in our dataset, these
clients begin with an individual liability loan, and after November 2007, receive a group liability
loan. Within Saath’s Behrampura and Vasna locations, we find a sample of 276 such clients,
representing 22% of the loan client base in these two branches as of March 2009.
Table 1 provides summary statistics for our sample. Collectively, these clients received a total
of 748 loans from Saath, 450 of which are individual liability loans and 298 are group liability
loans. The average individual liability loan amount is about INR 10,000 (USD 220), and about
INR 18,000 (USD 390) for group liability loans. Figure 1 plots the number of group liability
loans that are disbursed over time. As the figure shows, the borrowers in our sample, all of whom
received individual liability loans, switched to group liability loans at varying months. Our empirical
strategy takes advantage of this staggered timing, comparing individual liability loan clients who
have already received group liability loans to future recipients, to identify the impact of group
liability on loan repayment behavior and savings discipline.
5 Empirical Strategy and Analysis
5.1 Empirical Strategy
Our first empirical tests measure the extent of assortive matching, using two complementary sets of
analysis. First, we use a simple regression framework. For each individual i who belongs to a joint
liability borrower group, we define a measure of ‘reliability,’ ri, (discussed in greater detail below),
as well as the average reliability of that individual’s group members (i.e., yi = 1NGi
∑j∈Gi,j 6=i rj ,
where NGi is the number of borrowers in the group Gi of which i is a member). We thus regress:
yi = α+ βri + εi (1)
clustering standard errors at the borrower-group level.
Our second measure is based on a permutation test. We first randomly assign members into
12

groups, keeping the original distribution of group sizes.7. We estimate the coefficient β from
Equation (1) on this set of randomly assigned individuals. We repeat this exercise 10,000 times
and plot the distribution of coefficients. We then compare the actual coefficient to the distribution
generated at random.
To study the effect of contract structure on lending outcomes, we exploit the natural experiment
provided by Saath’s change in policy. The presence of an exogenous policy change is important.
Without exogenous variation, it would be very difficult to know whether differences in outcomes
were attributable to contract structure, or any number of other unobservable characteristics of
borrowers or lending institutions. Indeed, theory predicts that different contracts will be optimal
for different types of borrowers.
To overcome this selection problem, we focus our attention to borrowers of Saath who received
both individual and group liability loans. We exploit the natural phasing-in of group liability, in
what amounts to a repeated difference-in-difference framework. At any particular point in time, our
“treatment” group then consists of clients who have fully repaid their individual liability loan and
currently have a group liability loan, while our “control” group consists of individual liability loan
clients who will eventually convert to a group liability loan. Specifically, we estimate the following
equation:
yilt = α+ βTil + γi + δt + εilt (2)
where the subscript i refers to individuals, l refers to loans, and t refers to months. T is a dummy
variable equal to 1 if loan l of client i is a group liability loan, and 0 if it is an individual liability
loan. yilt is a measure of loan repayment or savings discipline. The estimate of β then provides the
effect of switching to group liability loans for individuals who are already borrowing. We include
time effects δt since conversion to group liability loans was staggered across individuals, and the
individual fixed effects γi absorb time-invariant characteristics of each borrower.
5.2 Self-screening and Assortative Matching
Section 2 discusses the theoretical underpinnings of how self-selected groups may be formed under a
joint liability setting. The theory predicts self-sorting and matching of the same types of individuals;
7In the data, we observe 12 groups of size 3, 123 groups of size 4, 37 groups of size 5, and 6 groups of size 6.
13

specifically, Ghatak (2000) predicts assortative matching where safe borrowers form groups with
other safe borrowers.
Following the change in contract structure, individuals were obliged to form groups, but were
free to choose their own group members. Table 2 presents evidence on assortative matching among
Saath microfinance clients, using a variety of measures of borrower quality. Since many group loan
members in this analysis are first-time borrowers who never previously held an individual liability
loan, we cannot use past loan repayment or default data as a measure of borrower quality. However,
we do observe compulsory savings data for everyone since, as per Saath regulation, every applicant
must have a compulsory savings account with Saath for at least six month prior to applying for a
loan. For this reason, our borrower quality measures are based on savings rather than loan data.
In columns (1) to (3) of Table 2, the ‘reliability’ of a borrower is defined as the proportion
of compulsory savings deposits that were missed before the group liability loan; columns (4) to
(6) define ‘reliability’ as a dummy variable equal to 1 if any past compulsory savings deposit was
missed. Under both these definitions of reliability, we find strong evidence of assortative matching,
that is, we find that the average reliability of group members is strongly and positively associated
with the borrower’s own level of reliability. This result is robust across specifications, and holds
even when we include neighborhood fixed effects.8
As a further test of assortative matching, Figure 2 plots the distribution of the regression
coefficient on own reliability level from 10,000 randomly formed group combinations. The idea
behind this exercise is to simulate the reliability profile of groups if they were truly randomly
formed with no endogenous matching. The red dot represents the regression coefficient that we
observe in our data. As is clearly evident, our observed coefficient is on the extreme right tail of
all the distributions we plot, confirming that borrower self-screening is at play in group formation,
even controlling for physical proximity.
While the analysis above suggests a strong self-screening mechanism within joint liability groups,
we cannot distinguish how much more informative this screening is than what Saath could have
achieved through its own devices. We do, however, note that everyone in our sample had already
been approved by Saath for a loan; the strong evidence of sorting even within this group suggests
8As a third definition of ‘reliability’, we consider a dummy for whether the client missed the compulsory savingsdeposit in the month prior to receiving a group liability loan, and obtain similar results.
14

borrowers may have substantial inside information about each other’s quality.
5.3 Loan Repayment
We now turn to the critical question of loan repayment. We note that the joint liability structure
will in theory induce both better screening (demonstrated above), but also greater monitoring
efforts. Our empirical design does not distinguish between the two potential causes of improved
repayment, but rather estimates the combined causal effect.
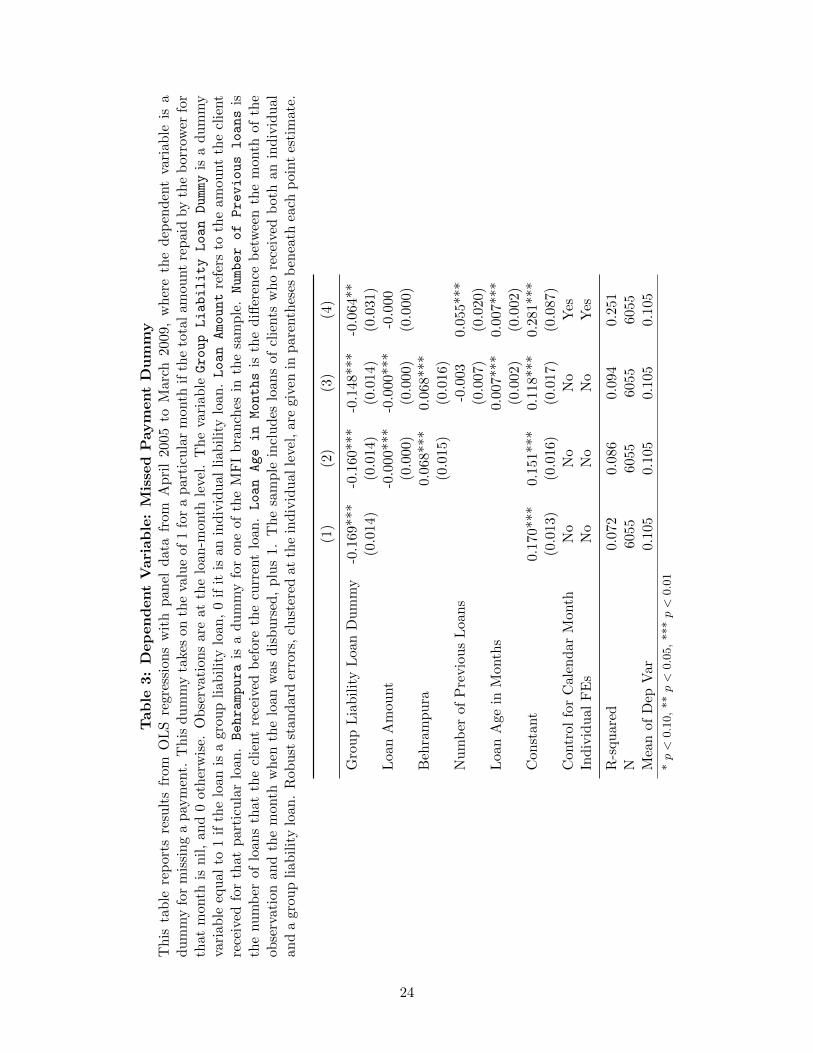
Table 3 presents OLS estimates of Equation 2, where the outcome of interest is a dummy
variable for a missed payment. This dummy variable indicates whether the client failed to make
a repayment for a particular month. Saath Microfinance clients are required to make monthly
repayments until the principal balance is paid in full, beginning 30 days following disbursement.
Hence, the dependent variable takes on the value 1 for a particular month if the total amount
repaid by the borrower for that month is nil, and 0 otherwise. We use this dummy variable as our
first measure of monthly loan repayment discipline.
In our sample, almost 20% of individual liablity and only 0.1% of group-liabilty monthly loan
repayments were not made. Our results in Table 3 indicate that under the group liability contract,
monthly loan repayments are about 6% less likely to be missed relative to individual liability, signif-
icant at the 5% level. Controlling for other factors such as time trends and individual characteristics
does not affect these results.
As a further robustness check, we conduct a direct “falsification” test of our analysis by using
data from our clients’ previous individual-to-individual loan renewals. The sample is reduced since
many clients did not have multiple individual loans in the past. Table 4 presents these results and
shows no significant effect on missed payments.
Another concern over our empirical strategy is in the sample selection; since our sample consists
of individual liability clients who chose to renew their borrowing under the group liability setting,
these clients may be better at repayment than borrowers who did not want to enter into a group
liability loan contract. However, our analysis focuses exclusively on those who renew, and includes
individual fixed effects. Hence, an interpretation of our results is that even “good” clients exhib-
ited higher repayment discipline under the group liability setting, in comparison to the individual
liability setting.
15

Yet another concern is that a client’s propensity to repay may be correlated with the time in
the loan cycle. Specifically, clients may be more likely to make repayments towards the end of the
cycle on their individual liability loan, so that they may become eligible for a group liability loan
in the future. We note that this would bias estimates against finding that group liability improves
borrower performance. Nevertheless, we investigate this possibility using an event-time regression
with the dependent variable for missed payment as previously described, where the event is the
conversion from an individual liability to a group liability-loan.
Figure 3 plots the coefficients for each event-time dummy. The first month of repayment in the
group liability setting is at time = 0, the final repayment month in the individual liability loan is at
time = −1, the second to the last individual liability loan repayment month is at time = −2, and
so on. Thus, the figure describes loan repayment behavior under the individual liability contract,
before switching to group liability. Saath requires its borrowers to pay their current loan in full
before they are given a next loan, so by definition, all clients in our sample made a repayment at
time = −1. Examining the periods where time ≤ −2 shows no pattern supporting the idea that
clients strategically repaid their individual liability loan so that they may borrow under the group
liability setting.
On the other hand, it might also be the case that clients are more likely to make repayments
early on than towards the end of the loan cycle. For example, clients may have more liquidity to
repay immediately following loan disbursal, but become less able (or willing) to pay as the loan
matures. We examine this possibility, again using an event-time regression, as shown in Figure
4. We estimate how repayment rates change around loan renewal times when an client pays off
an individual liability loan and renews for another individual liability loan (blue line), and for the
cases when a client pays off a group liability loan and renews for a second group liability loan (red
line). Note that the first month of repayment in the second loan cycle is at time = 0, and the final
repayment in the first loan cycle is at time = −1. Similar to Figure 3, at time = −1, all clients
made a repayment by definition, so the missed payment dummy must mechanically equal zero. To
control for any possible effects of maturity on repayment, we include ‘loan age in months’ (i.e., the
number of months which have passed since the loan was disbursed), as an explanatory variable in
Columns (3) and (4) of Table 3. The point estimate on the group liability loan dummy remains
statistically significant. Figure 5 further shows that prior missed payments are uncorrelated with
16
the calendar month of loan origination.
Finally, the outcome we have considered thus far, whether the client missed a loan installment
for a particular month, is a rough measure since repayments may be partial. That is, a client
may have repaid an amount greater than zero, but this amount may be less than the required
installment amount. Another measure of repayment discipline then is the standard deviation of
principal amount repaid for individual liability loans, and total amount repaid for group liability
loans. As described in Section 3, the principal installment amount was fixed in the individual
liability setting, whereas in group liability, the required total installment amount (principal plus
interest) was equated every month. If the required amount is repaid each month, then the standard
deviation would be zero. However, if there are many months where people pay less or more than
the required amount, then the standard deviation would be higher. Table 5 provides OLS estimates
where the dependent variable is the standard deviation of repayment. Again, our estimates show
that there is greater loan repayment discipline in the group liability setting, relative to individual
liability.
Given these results, a natural question that arises is why group liability outperforms individual
liability for clients who are already borrowing. Although the guarantors requirement in individual
liability contracts provided incentives for guarantors to monitor loans and enforce repayment, these
incentives in practice were quite weak: the microlender rarely seized the savings of guarantors
of defaulting clients, and did not strictly enforce that guarantors maintain their savings account
balance. The microlender collected repayment from the guarantors only if all other options (e.g.
seizing the defaulting borrower’s savings, revisiting the defaulting borrower, threatening to charge
penalties, rescheduling the loan, having the branch manager intervene) have been exhausted. In
contrast, the group liability structure strengthens cooperation and trust among group members,
as indicated by the fact that almost all joint liability borrower groups designate a group leader
even though it is not required. It is possible that having a group leader increases incentives for
monitoring and enforcing repayment. For example, having a group leader perhaps creates a person
of authority who can enforce repayment or impose sanctions in the event of default.
17

5.4 Savings Discipline
We now turn our attention to the compulsory savings deposits required by Saath. We might expect
that savings discipline is higher in the group liability setting, since compulsory savings may act as
a form of insurance when a group member defaults.
Although Saath initiated both a shift to group liability lending and compulsory deposits at the
same time in November 2007, we can uniquely identify the effect of group liability on compulsory
savings by exploiting the time-series variation in loan renewals. Specifically, while the compulsory
savings were mandated across the board for all borrowers post-November 2007, the shift from
individual to group liability was more staggered, depending on when each individual loan term
expired. As explained earlier, these renewals were distrubted relatively uniformly throughout the
year. Hence, we can study the adherence to compulsory savings for the same person who was
borrowing under an individual liability contract post November 2007, and who eventually converted
to a group liability contract.9
Table 6 presents OLS estimates where our dependent variable is a dummy for missing a com-
pulsory savings deposit. The dependent variable takes on the value 1 if the client deposited less
then INR 100, and 0 otherwise. Our results indicate that the same borrower exhibits greater sav-
ings discipline when in a group liability loan than when in an individual liability loan: compulsory
savings depoists are about 19% less likely to be missed in the group liability setting, significant at
the 5% level.
6 Conclusion
Microfinance has reached over 150 million borrowers worldwide, and is growing at a 40 percent
cumulative average growth rate. Recent initial public offerings (IPOs) which valued the Mexican
microfinance institution Compartamos at $2 billion, and SKS in India at $1.5 billion, have attracted
the attention of global financial markets. Yet, there have also been spectacular failures, such as the
collapse of Banco del Exito (BANEX), which with a $125 million dollar loan portfolio was recently
the largest micro and small and medium enterprise lender in Nicaragua. Suffering from a 45 percent
9Since we only have savings data from January 2008 onwards, we cannot study the effect of compulsory savingsunder the individual liability setting as we have no pre-period data (i.e. savings data pre-November 2007).
18

delinquency rate, it was ordered into liquidation.10
As many microlenders around the world weaken their group liability approach and shift towards
individual lending, understanding the role of group liability in enhancing performance has become
a critical question in microfinance programs, moving forward. Yet, the empirical literature provides
little guidance for policy makers and microfinance practitioners, since few empirical studies have
examined group liability contracts with other lending strategies.
In this paper, we exploit an exogenous change in liability structure in an Indian microfinance
program, where the program shifted from individual liability to a group liability structure. We
find evidence that for the same borrower, the shift to group liability reduces default rates and
improves savings discipline. Under the group liability setting, required monthly loan installments
are 6% less likely to be missed and compulsory savings deposits are about 19% less likely to be
missed, relative to individual liability. Thus, our findings indicate that group lending outperforms
individual lending in loan repayment and savings discipline.
The microlender we study, Saath, has operations that are fairly typical of MFIs that lend in
urban areas. Overall, our results suggest that group liability in microfinance may be a particularly
effective contract in improving repayment behavior, especially for clients who are already borrowing.
A promising avenue for further research is to study the precise mechanisms for this improved
behavior, that is, the relative merits of peer screening versus peer monitoring under group liability
contracts. Further, if peers are indeed effective screeners or monitors, an open research question
is whether group liability contracts can be made even better, perhaps by introducing some formal
group or sub-group level repayment incentives or insurance mechanisms.
References
Ahlin, C. and R. M. Townsend (2007, February). Using repayment data to test across models of
joint liability lending. The Economic Journal 117, F11–F51.
Armendariz de Aghion, B. (1999). On the design of a credit agreement with peer monitoring.
Journal of Development Economics 60, 79–104.
10See: http://financialaccess.org/node/3547
19

Armendariz de Aghion, B. and C. Gollier (2000, July). Peer group formation in an adverse selection
model. The Economic Journal 110, 632–643.
Armendariz de Aghion, B. and J. Morduch (2010). The Economics of Microfinance. MIT Press.
Banerjee, A., T. Besley, and T. Guinnane (1994). Thy neighbor’s keeper: The design of a credit
cooperative with theory and a test. Quarterly Journal of Economics 109 (2), 491–515.
Banerjee, A., E. Duflo, R. Glennerster, and C. Kinnan (2009). The miracle of microfinance?
Evidence from a randomized evaluation. Department of Economics, Massachusetts Institute of
Technology (MIT) Working Paper .
Banerjee, A. V. and A. F. Newman (1993, April). Occupational choice and the process of develop-
ment. Journal of Political Economy 101 (2), 274–98.
Beck, T., A. Demirguc-Kunt, and V. Maksimovic (2005). Financial and legal constraints to growth:
Does firm size matter? The Journal of Finance 60 (1), 137–177.
Beck, T., A. Demirguc-Kunt, and M. Martinez Peria (2008). Banking services for everyone? Barriers
to bank access and use around the world. The World Bank Economic Review .
Besley, T. and S. Coate (1995). Group lending, repayment incentives and social collateral. Journal
of Development Economics 46 (1), 1–18.
Cetorelli, N. and M. Gambera (2001). Banking market structure, financial dependence and growth:
International evidence from industry data. The Journal of Finance 56 (2), 617–648.
Chen, G., S. Rasmussen, and X. Reille (2010, February). Growth and vulnerabilities in microfinance.
CGAP Focus Note No. 61 .
Daley-Harris, S. (2009). State of the Microcredit Summit Campaign Report 2009. Washington,
DC: Microcredit Summit Campaign.
Fischer, G. (2009). Contract structure, risk sharing and investment choice.
Galor, O. and J. Zeira (1993, January). Income distribution and macroeconomics. Review of
Economic Studies 60 (1), 35–52.
20
Ghatak, M. (1999). Group lending, local information and peer selection. Journal of Development
Economics 60 (1), 27–50.
Ghatak, M. (2000). Screening by the company you keep: Joint liability lending and the peer
selection effect. Economic Journal 110 (465), 601–31.
Gine, X. and D. Karlan (2009, November). Group versus individual liability: Long term evidence
from philippine microcredit lending groups.
Morduch, J. (1999, December). The microfinance promise. Journal of Economic Litera-
ture XXXVII, 1569–1614.
Rai, A. and T. Sjostrom (2004). Is grameen lending efficient? repayment incentives and insurance
in village economies. Review of Economic Studies 71 (1), 217–234.
Rajan, R. and L. Zingales (1998). Financial dependence and growth. American Economic Re-
view 88 (3), 559–586.
Sharma, M. and M. Zeller (1997). Repayment performance in group-based credit programs in
bangladesh: An empirical analysis. World Development 25 (10), 1731–42.
Stiglitz, J. E. (1990). Peer monitoring and credit markets. World Bank Economic Review 4 (3),
351–366.
Wenner, M. (1995). Group credit: A means to improve information transfer and loan repayment
performance. Journal of Development Studies 32 (2), 263–281.
World Bank (2008). Finance for all? policies and pitfalls in expanding access.
Wydick, B. (1999, July). Can social cohesion be harnessed to repair market failures? evidence from
group lending in guatemala. The Economic Journal 109 (457), 463–475.
21

Table 1: Summary StatisticsThis table reports summary statistics for borrowers in our sample. These borrowers received bothindividual liability and group liability loans.
Individual Liability Group LiabilityBranch Total No.
of ClientsTotal No.of Loans
No. ofLoans
Ave. LoanAmt (Rs.)
No. ofLoans
Ave. LoanAmt (Rs.)
Behrampura 198 512 303 9959.646 209 19081.34Vasna 78 236 147 9927.211 89 16764.04
Full Sample 276 748 450 9948.761 298 18389.26
22

Tab
le2:
Test
sfo
rA
ssort
ati
ve
Matc
hin
g:
Do
Ind
ivid
uals
Join
Gro
up
sof
Sim
ilar
Reliab
ilit
y?
Th
ista
ble
rep
orts
OL
Sre
gres
sion
sw
ith
cros
s-se
ctio
nal
dat
aat
the
ind
ivid
ual
leve
l,w
her
eth
ed
epen
den
tva
riab
leis
the
aver
age
reli
ab
ilit
yof
oth
ergr
oup
mem
ber
s.T
hat
is,
for
each
ind
ivid
ual
wh
ob
elon
gsto
ap
arti
cula
rb
orro
wer
grou
p,
the
dep
end
ent
vari
ab
leis
the
aver
age
reli
abil
ity
ofth
ere
stof
the
grou
pm
emb
ers,
not
incl
ud
ing
the
ind
ivid
ual
.In
colu
mn
s(1
)to
(3),
reli
abil
ity
isd
efin
edas
the
pro
port
ion
ofco
mp
uls
ory
savin
gsd
epos
its
that
wer
en
otm
ade
bet
wee
nJan
uar
y20
08an
dth
em
onth
bef
ore
the
gro
up
liab
ilit
ylo
an
was
dis
bu
rsed
.In
colu
mn
s(4
)to
(6),
reli
abil
ity
isd
efin
edas
ad
um
my
for
mis
sin
gan
yco
mp
luso
rysa
vin
gsd
epos
itb
etw
een
January
2008
an
dth
em
onth
bef
ore
the
grou
pli
abil
ity
loan
was
dis
bu
rsed
.T
he
vari
able
sOwnReliabilityLevel
andReliabilityDummy
thu
sre
fer
toea
chin
div
idu
al’s
own
mea
sure
ofre
liab
ilit
y,gi
ven
thes
ed
efin
itio
ns.
Gro
up
liab
ilit
ylo
anb
orro
wer
sw
ho
rece
ived
thei
rlo
an
on
or
bef
ore
Jan
uar
y20
08ar
eex
clu
ded
inth
ese
regr
essi
ons.
Behrampura
isa
du
mm
yfo
ron
eof
the
two
MF
Ib
ran
ches
inth
esa
mp
le.Entiregroup
isfemale
isa
du
mm
yva
riab
leeq
ual
to1
ifal
lm
emb
ers
ofth
eb
orro
wer
grou
par
efe
mal
e,0
oth
erw
ise.
Entiregrouplivesinsame
neighborhood
isa
du
mm
yva
riab
leeq
ual
to1
ifal
lm
emb
ers
ofth
eb
orro
wer
grou
pli
vein
the
sam
enei
ghb
orh
ood
,0
oth
erw
ise.
Inco
lum
ns
(1)
and
(4),
the
sam
ple
incl
ud
esal
lgr
oup
liab
ilit
ylo
ancl
ients
.In
colu
mn
s(2
)-(3
)an
d(5
)-(6
),th
esa
mp
leco
nsi
sts
of
gro
up
liab
ilit
ylo
ancl
ients
wh
ob
elon
gto
ab
orro
wer
grou
pw
her
eal
lgr
oup
mem
ber
sli
ve
inth
esa
me
nei
ghb
orh
ood
,fo
cusi
ng
on
nei
ghb
orh
ood
wh
ere
ther
eis
mor
eth
anon
esu
chgr
oup
.R
obu
stS
Es,
clu
ster
edat
the
bor
row
ergr
oup
leve
l.
(1)
(2)
(3)
(4)
(5)
(6)
Ow
nR
elia
bil
ity
Lev
el0.
414*
**0.
409*
**0.
287*
**(0
.046
)(0
.064
)(0
.058
)R
elia
bil
ity
Du
mm
y0.
340*
**0.3
55***
0.2
74***
(0.0
43)
(0.0
60)
(0.0
58)
Beh
ram
pu
ra-0
.148
***
-0.1
95**
*-0
.204
***
-0.2
40***
(0.0
27)
(0.0
43)
(0.0
42)
(0.0
65)
Enti
regr
oup
isfe
mal
e-0
.012
-0.0
36-0
.026
-0.0
13-0
.047
-0.0
01
(0.0
21)
(0.0
26)
(0.0
36)
(0.0
40)
(0.0
53)
(0.0
78)
Enti
regr
oup
live
sin
sam
en
eigh
bor
hood
-0.0
41*
-0.0
29(0
.021
)(0
.032
)C
onst
ant
0.32
6***
0.34
0***
0.15
3***
0.60
1***
0.6
15***
0.3
78***
(0.0
39)
(0.0
58)
(0.0
41)
(0.0
63)
(0.1
05)
(0.0
95)
Nei
ghb
orh
ood
FE
sN
oN
oY
esN
oN
oY
es
R-s
qu
ared
0.43
50.
480
0.57
00.
325
0.3
46
0.4
27
N83
347
147
183
3471
471
Mea
nof
Dep
Var
0.31
50.
281
0.28
10.
646
0.6
20
0.6
20
*p<
0.1
0,
**p<
0.0
5,
***p<
0.0
1
23
Tab
le3:
Dep
en
dent
Vari
ab
le:
Mis
sed
Paym
ent
Du
mm
yT
his
tab
lere
por
tsre
sult
sfr
omO
LS
regr
essi
ons
wit
hp
anel
dat
afr
omA
pri
l20
05to
Mar
ch20
09,
wh
ere
the
dep
end
ent
vari
ab
leis
ad
um
my
for
mis
sin
ga
pay
men
t.T
his
du
mm
yta
kes
onth
eva
lue
of1
for
ap
arti
cula
rm
onth
ifth
eto
tal
am
ount
rep
aid
by
the
borr
ower
for
that
mon
this
nil
,an
d0
oth
erw
ise.
Ob
serv
atio
ns
are
atth
elo
an-m
onth
level
.T
he
vari
able
GroupLiabilityLoanDummy
isa
du
mm
yva
riab
leeq
ual
to1
ifth
elo
anis
agr
oup
liab
ilit
ylo
an,
0if
itis
anin
div
idu
alli
abil
ity
loan
.LoanAmount
refe
rsto
the
am
ou
nt
the
clie
nt
rece
ived
for
that
par
ticu
lar
loan
.Behrampura
isa
du
mm
yfo
ron
eof
the
MF
Ib
ran
ches
inth
esa
mp
le.NumberofPreviousloans
isth
enu
mb
erof
loan
sth
atth
ecl
ient
rece
ived
bef
ore
the
curr
ent
loan
.LoanAgeinMonths
isth
ed
iffer
ence
bet
wee
nth
em
onth
of
the
obse
rvat
ion
and
the
mon
thw
hen
the
loan
was
dis
bu
rsed
,p
lus
1.T
he
sam
ple
incl
ud
eslo
ans
ofcl
ients
wh
ore
ceiv
edb
oth
an
ind
ivid
ual
and
agr
oup
liab
ilit
ylo
an.
Rob
ust
stan
dar
der
rors
,cl
ust
ered
atth
ein
div
idu
alle
vel,
are
given
inp
aren
thes
esb
enea
thea
chp
oin
tes
tim
ate
.
(1)
(2)
(3)
(4)
Gro
up
Lia
bil
ity
Loa
nD
um
my
-0.1
69**
*-0
.160
***
-0.1
48**
*-0
.064**
(0.0
14)
(0.0
14)
(0.0
14)
(0.0
31)
Loa
nA
mou
nt
-0.0
00**
*-0
.000
***
-0.0
00
(0.0
00)
(0.0
00)
(0.0
00)
Beh
ram
pu
ra0.
068*
**0.
068*
**(0
.015
)(0
.016
)N
um
ber
ofP
revio
us
Loa
ns
-0.0
030.
055***
(0.0
07)
(0.0
20)
Loa
nA
gein
Mon
ths
0.00
7***
0.00
7***
(0.0
02)
(0.0
02)
Con
stan
t0.
170*
**0.
151*
**0.
118*
**0.
281***
(0.0
13)
(0.0
16)
(0.0
17)
(0.0
87)
Con
trol
for
Cal
end
arM
onth
No
No
No
Yes
Ind
ivid
ual
FE
sN
oN
oN
oY
es
R-s
qu
ared
0.07
20.
086
0.09
40.
251
N60
5560
5560
5560
55
Mea
nof
Dep
Var
0.10
50.
105
0.10
50.
105
*p<
0.1
0,
**p<
0.0
5,
***p<
0.0
1
24

Tab
le4:
Fals
ificati
on
Test
Th
ista
ble
rep
orts
resu
lts
from
afa
lsifi
cati
onte
st,
wh
ere
the
dep
end
ent
vari
able
isa
du
mm
yfo
rm
isse
dp
aym
ent.
Th
isd
um
my
vari
ab
leta
kes
onth
eva
lue
of1
for
ap
arti
cula
rm
onth
ifth
eto
tal
amou
nt
rep
aid
by
the
bor
row
erfo
rth
atm
onth
isn
il,
an
d0
oth
erw
ise.
Th
ere
gres
sion
sco
rres
pon
dw
ith
thos
ein
Tab
le3.
FalseTreatment
isa
du
mm
yva
riab
leeq
ual
to1
ifth
elo
an
was
dis
bu
rsed
aft
erN
ovem
ber
2006
,0
oth
erw
ise.
Ob
serv
atio
ns
are
atth
elo
an-m
onth
leve
l.LoanAmount
refe
rsto
the
amou
nt
the
clie
nt
rece
ived
for
that
part
icu
lar
loan
.Behrampura
isa
du
mm
yfo
ron
eof
the
MF
Ib
ran
ches
inth
esa
mp
le.NumberofPreviousloans
isth
enu
mb
erof
loan
sth
at
the
clie
nt
rece
ived
bef
ore
the
curr
ent
loan
.LoanAgeinMonths
isth
ed
iffer
ence
bet
wee
nth
em
onth
ofth
eob
serv
ati
on
an
dth
em
onth
wh
enth
elo
anw
asd
isb
urs
ed,
plu
s1.
Th
esa
mp
leco
nta
ins
obse
rvat
ion
sof
ind
ivid
ual
liab
ilit
ylo
ans
amon
gcl
ients
wh
ore
ceiv
edb
oth
ind
ivid
ual
and
agr
oup
liab
ilit
ylo
an,
and
wh
oob
tain
edat
leas
t2
ind
ivid
ual
liab
ilit
ylo
ans,
the
mos
tre
cent
ofw
hic
hw
as
dis
bu
rsed
aft
erN
ovem
ber
2006
.R
obu
stst
and
ard
erro
rs,
clu
ster
edat
the
ind
ivid
ual
level
,ar
egi
ven
inp
aren
thes
esb
enea
thea
chp
oin
tes
tim
ate
.
(1)
(2)
(3)
(4)
Fal
seT
reat
men
t0.
002
-0.0
030.
018
0.04
9(0
.025
)(0
.023
)(0
.025
)(0
.049)
Loa
nA
mou
nt
-0.0
00-0
.000
0.00
0(0
.000
)(0
.000
)(0
.000)
Beh
ram
pu
ra0.
074*
**0.
065*
*(0
.027
)(0
.029
)N
um
ber
ofP
revio
us
Loa
ns
-0.0
250.
030
(0.0
15)
(0.0
41)
Loa
nA
gein
Mon
ths
-0.0
010.
004
(0.0
03)
(0.0
04)
Con
stan
t0.
139*
**0.
112*
**0.
129*
**0.
269*
*(0
.020
)(0
.025
)(0
.032
)(0
.112)
Con
trol
for
Cal
end
arM
onth
No
No
No
Yes
Ind
ivid
ual
FE
sN
oN
oN
oY
es
R-s
qu
ared
0.00
00.
013
0.01
60.
174
N15
8415
8415
8415
84M
ean
ofD
epV
ar0.
140
0.14
00.
140
0.14
0
*p<
0.1
0,
**p<
0.0
5,
***p<
0.0
1
25

Tab
le5:
Dep
en
dent
Vari
ab
le:
Sta
nd
ard
Devia
tion
of
Rep
aym
ent
Th
ista
ble
rep
orts
resu
lts
from
OL
Sre
gres
sion
sw
ith
cros
s-se
ctio
nal
dat
a,w
her
eth
ed
epen
den
tva
riab
leis
the
stan
dard
dev
iati
on
of
mon
thly
rep
aym
ent:
ifth
ere
qu
ired
amou
nt
isre
pai
dev
ery
mon
th,
then
the
stan
dar
ddev
iati
onw
ould
be
zero
;if
ther
eare
many
month
sw
her
ep
eop
lep
ayle
ssor
mor
eth
anth
ere
qu
ired
amou
nt,
then
the
stan
dar
dd
evia
tion
wou
ldb
eh
igh
er.
Ob
serv
ati
on
sare
at
the
loan
leve
l.T
he
vari
able
GroupLiabilityLoanDummy
isa
du
mm
yva
riab
leeq
ual
to1
ifth
elo
anis
agr
oup
liab
ilit
ylo
an
,0
ifit
isan
ind
ivid
ual
liab
ilit
ylo
an.LoanAmount
refe
rsto
the
amou
nt
the
clie
nt
rece
ived
for
that
par
ticu
lar
loan
.Behrampura
isa
du
mm
yfo
ron
eof
the
MF
Ib
ran
ches
inth
esa
mp
le.
Th
esa
mp
lein
clu
des
loan
sof
clie
nts
wh
ore
ceiv
edb
oth
anin
div
idu
alan
da
grou
pliab
ilit
ylo
an
.R
ob
ust
stan
dard
erro
rs,
clu
ster
edat
the
ind
ivid
ual
level
,ar
egi
ven
inp
aren
thes
esb
enea
thea
chp
oint
esti
mat
e.
(1)
(2)
(3)
Gro
up
Lia
bil
ity
Loa
nD
um
my
-288
.666
-100
2.05
2***
-813
.105
***
(185
.204
)(1
86.5
20)
(280
.590)
Loa
nA
mou
nt
0.08
5***
0.06
9***
(0.0
11)
(0.0
20)
Beh
ram
pu
ra73
2.50
2***
(121
.145
)C
onst
ant
1352
.427
***
14.2
84-4
77.7
04**
(100
.308
)(1
48.5
92)
(241
.601)
Ind
ivid
ual
FE
sN
oN
oY
es
R-s
qu
ared
0.00
50.
176
0.50
3N
689
689
689
Mea
nof
Dep
Var
1243
.496
1243
.496
1243
.496
*p<
0.1
0,
**p<
0.0
5,
***p<
0.0
1
26
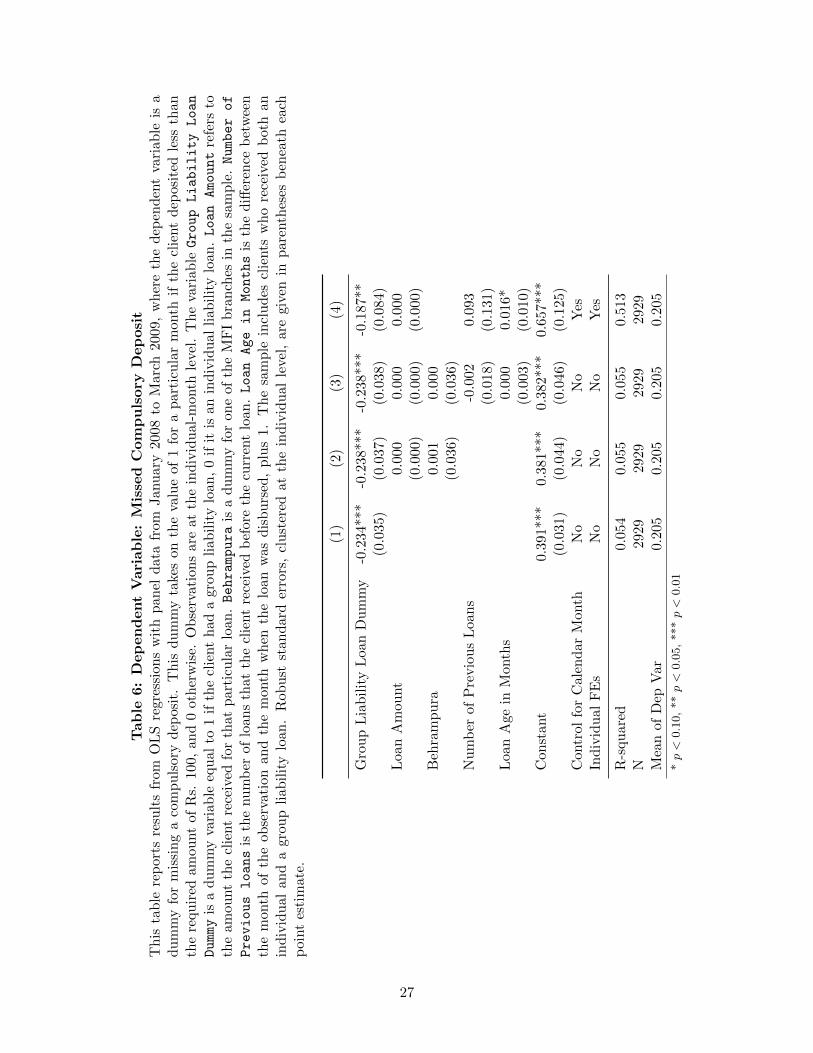
Tab
le6:
Dep
en
dent
Vari
ab
le:
Mis
sed
Com
pu
lsory
Dep
osi
tT
his
tab
lere
por
tsre
sult
sfr
omO
LS
regr
essi
ons
wit
hp
anel
dat
afr
omJan
uar
y20
08to
Mar
ch20
09,
wh
ere
the
dep
enden
tva
riab
leis
ad
um
my
for
mis
sin
ga
com
pu
lsor
yd
epos
it.
Th
isd
um
my
take
son
the
valu
eof
1fo
ra
par
ticu
lar
mon
thif
the
clie
nt
dep
osi
ted
less
than
the
requ
ired
amou
nt
ofR
s.10
0,an
d0
oth
erw
ise.
Ob
serv
atio
ns
are
atth
ein
div
idu
al-m
onth
leve
l.T
he
vari
ab
leGroupLiabilityLoan
Dummy
isa
dum
my
vari
able
equ
alto
1if
the
clie
nt
had
agr
oup
liab
ilit
ylo
an,
0if
itis
anin
div
idu
alli
abil
ity
loan
.LoanAmount
refe
rsto
the
amou
nt
the
clie
nt
rece
ived
for
that
par
ticu
lar
loan
.Behrampura
isa
du
mm
yfo
ron
eof
the
MF
Ib
ran
ches
inth
esa
mp
le.Numberof
Previousloans
isth
enu
mb
erof
loan
sth
atth
ecl
ient
rece
ived
bef
ore
the
curr
ent
loan
.LoanAgeinMonths
isth
ed
iffer
ence
bet
wee
nth
em
onth
ofth
eob
serv
atio
nan
dth
em
onth
wh
enth
elo
anw
asd
isb
urs
ed,
plu
s1.
Th
esa
mp
lein
clu
des
clie
nts
wh
ore
ceiv
edb
oth
an
ind
ivid
ual
and
agr
oup
liab
ilit
ylo
an.
Rob
ust
stan
dar
der
rors
,cl
ust
ered
atth
ein
div
idu
alle
vel,
are
giv
enin
pare
nth
eses
ben
eath
each
poi
nt
esti
mat
e.
(1)
(2)
(3)
(4)
Gro
up
Lia
bil
ity
Loa
nD
um
my
-0.2
34**
*-0
.238
***
-0.2
38**
*-0
.187**
(0.0
35)
(0.0
37)
(0.0
38)
(0.0
84)
Loa
nA
mou
nt
0.00
00.
000
0.000
(0.0
00)
(0.0
00)
(0.0
00)
Beh
ram
pu
ra0.
001
0.00
0(0
.036
)(0
.036
)N
um
ber
ofP
revio
us
Loa
ns
-0.0
020.
093
(0.0
18)
(0.1
31)
Loa
nA
gein
Mon
ths
0.00
00.
016*
(0.0
03)
(0.0
10)
Con
stan
t0.
391*
**0.
381*
**0.
382*
**0.
657***
(0.0
31)
(0.0
44)
(0.0
46)
(0.1
25)
Con
trol
for
Cal
end
arM
onth
No
No
No
Yes
Ind
ivid
ual
FE
sN
oN
oN
oY
es
R-s
qu
ared
0.05
40.
055
0.05
50.
513
N29
2929
2929
2929
29
Mea
nof
Dep
Var
0.20
50.
205
0.20
50.
205
*p<
0.1
0,
**p<
0.0
5,
***p<
0.0
1
27

Figure 1: Group Liability Loans Disbursement in SampleThis figure plots the number of group liability loans that are disbursed over time in our sample. Allborrowers are previously individual liability borrowers, who subsequently received a group liabilityloan after the policy change.
28

Figure 2: Group Formation under Joint LiabilityThese figures plot the distribution of the coefficient on the client’s own reliability level, from theregressions in Columns (1), (3), (4) and (6) of Table 2, if borrower groups are randomly formed.The distribution comes from 10,000 iterations. The red dot represents the point estimate observed.Figures in the left column are from regressions which include all group liability loan clients. Figuresin the right column are from regressions which include group liability loan clients who belong to aborrower group where all group members live in the same neighborhood, focusing on neighborhoodswhere there is more than one such group. These figures represent different definitions of reliability,as indicated below.
(a) Reliability Defined as Proportion ofCompulsory Savings Missed Before JLGLoan Starts (All Groups)
(b) Reliability Defined as Proportion ofCompulsory Savings Missed Before JLGLoan Starts (Within Neighborhood)
(c) Reliability Defined as Whether YouMissed Any Compulsory Deposit Before JLGLoan Starts (All Groups)
(d) Reliability Defined as Whether YouMissed Any Compulsory Deposit Before JLGLoan Starts (Within Neighborhood)
(e) Reliability Defined As Whether YouMissed The Compulsory Deposit In TheMonth Before JLG Loan Starts (All Groups)
(f) Reliability Defined As Whether YouMissed The Compulsory Deposit In TheMonth Before JLG Loan Starts (WithinNeighborhood)
29
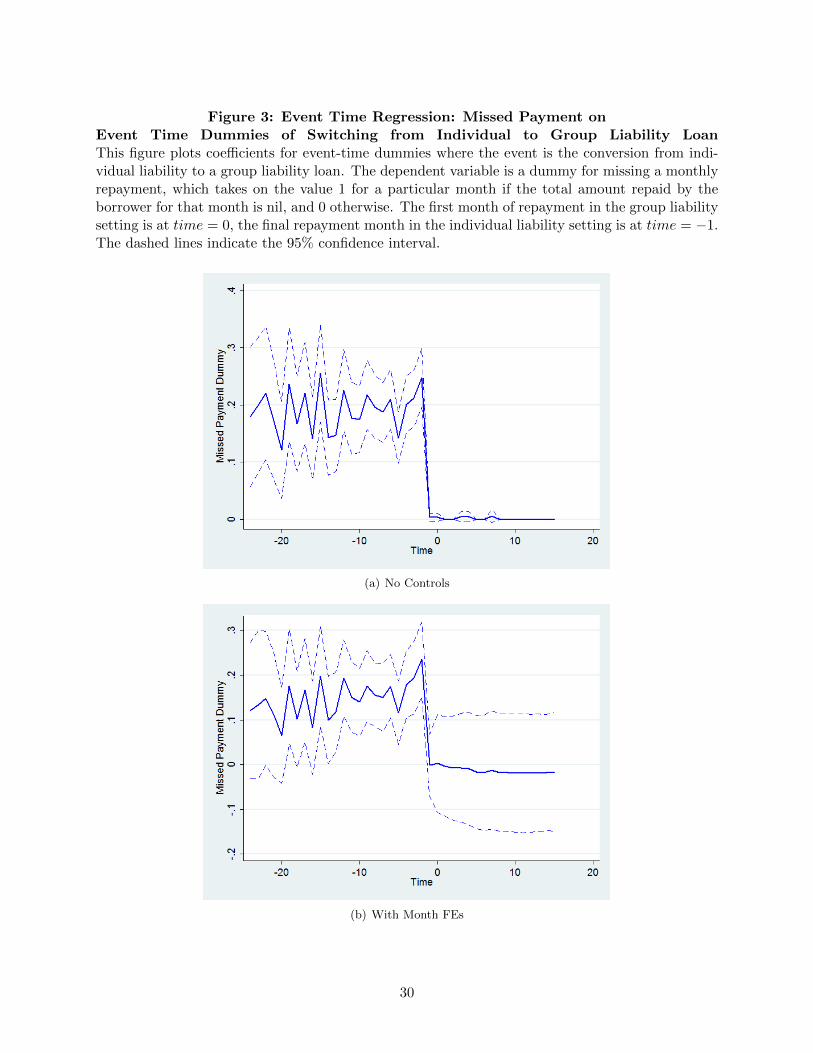
Figure 3: Event Time Regression: Missed Payment onEvent Time Dummies of Switching from Individual to Group Liability LoanThis figure plots coefficients for event-time dummies where the event is the conversion from indi-vidual liability to a group liability loan. The dependent variable is a dummy for missing a monthlyrepayment, which takes on the value 1 for a particular month if the total amount repaid by theborrower for that month is nil, and 0 otherwise. The first month of repayment in the group liabilitysetting is at time = 0, the final repayment month in the individual liability setting is at time = −1.The dashed lines indicate the 95% confidence interval.
(a) No Controls
(b) With Month FEs
30
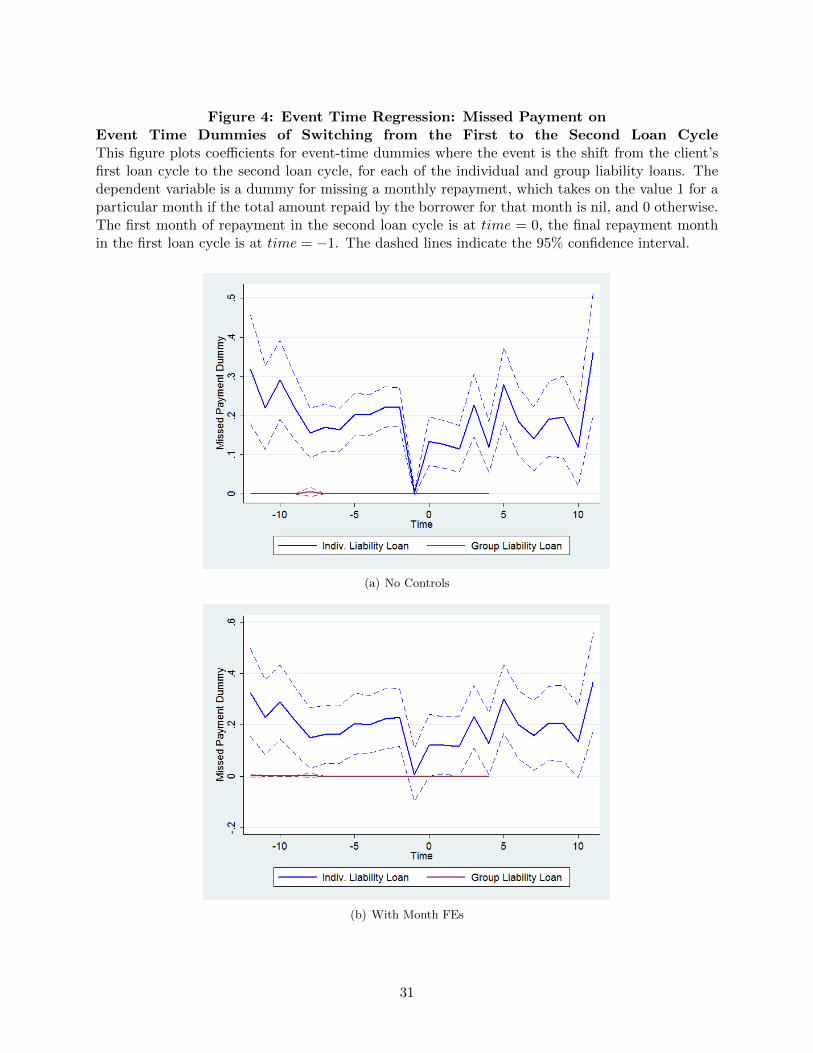
Figure 4: Event Time Regression: Missed Payment onEvent Time Dummies of Switching from the First to the Second Loan CycleThis figure plots coefficients for event-time dummies where the event is the shift from the client’sfirst loan cycle to the second loan cycle, for each of the individual and group liability loans. Thedependent variable is a dummy for missing a monthly repayment, which takes on the value 1 for aparticular month if the total amount repaid by the borrower for that month is nil, and 0 otherwise.The first month of repayment in the second loan cycle is at time = 0, the final repayment monthin the first loan cycle is at time = −1. The dashed lines indicate the 95% confidence interval.
(a) No Controls
(b) With Month FEs
31
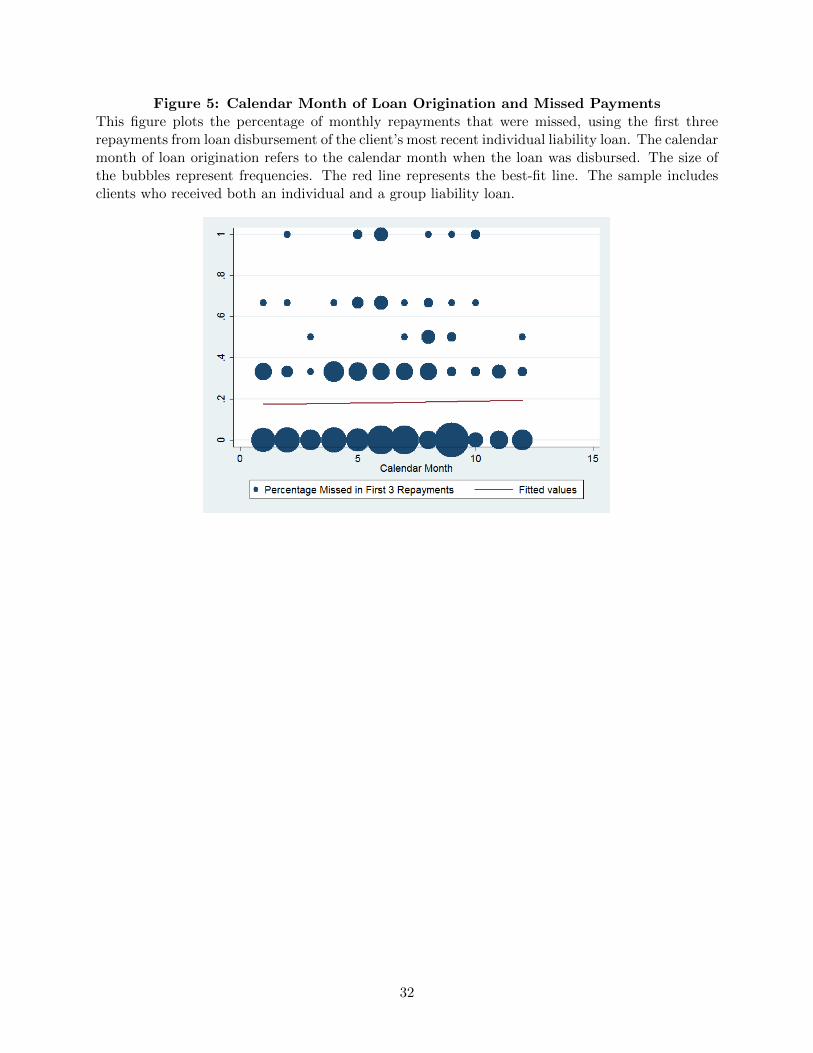
Figure 5: Calendar Month of Loan Origination and Missed PaymentsThis figure plots the percentage of monthly repayments that were missed, using the first threerepayments from loan disbursement of the client’s most recent individual liability loan. The calendarmonth of loan origination refers to the calendar month when the loan was disbursed. The size ofthe bubbles represent frequencies. The red line represents the best-fit line. The sample includesclients who received both an individual and a group liability loan.
32