DESIGN, CONSTRUCTION, AND NDT OF A MOCK-UP FOR …
12
Transactions, SMiRT-25 Charlotte, NC, USA, August 4-9, 2019 Division VIII DESIGN, CONSTRUCTION, AND NDT OF A MOCK-UP FOR REINFORCED CONCRETE WALLS IN NPP Fahim Al-Neshawy 1 , Miguel Ferreira 2 , Edgar Bohner 3 , Teemu Ojala 4 , Ville Sjöblom 5 , Ernst Niederleithinger 6 , Ute Effner 7 and Jari Puttonen 8 1 Staff Scientist, Civil Engineering Dept., Aalto University, Finland ([email protected]) 2 Senior Researcher, VTT Technical Research Centre of Finland 3 Research Team Leader, VTT Technical Research Centre of Finland 4 Doctoral Student, Civil Engineering Department, Aalto University, Finland 5 Research Scientist, VTT Technical Research Centre of Finland 6 Head of Division 8.2 Non-Destructive Testing Methods for Civil Engineering, BAM, Germany 7 Senior scientist, Division 8.2 Non-Destructive Testing Methods for Civil Engineering, BAM, Germany 8 Professor, Civil Engineering Department, Aalto University, Finland ABSTRACT Construction methods, environmental stressors, and aging factors are the main causes for defects of reinforced concrete in nuclear power plants (NPP). These defects are typically occurred as corrosion of reinforcement steel, delamination, cracks, malfunction of post-tensioning or steel composite systems etc. Some of the challenges for assessing the performance of these structures by non- destructive testing methods (NDT) are that the assessment could be performed only during the annual overhauls when testing is time-limited and uncertainty of the accuracy and reliability of the available NDT testing devices combined with the lack of the international uniformity of the methods used for NDT tests. To overcome these challenges, a mock-up wall representing a section of the concrete containment of the NPP. The mock-up wall included simulated defects, which mimic the most common types of defects in NPP concrete structures such as dimensional errors, honeycombing, delamination, defects adjacent to the steel liner and voids in grouted tendon ducts for the post- tensioned structures. This paper introduce the design and construction of the wall including the concrete properties, reinforcement, tendon ducts and the types of the simulated defects. The paper also introduces the NDT methods and techniques that are suitable for assessing the condition of the mock-up wall under the real environmental conditions. These techniques include mechanical methods as rebound hammer, ultrasonic and electromagnetic methods. This mock-up wall will enable to investigate reliably available NDT methods and experts’ skills providing also an important and very much need educational platform for future NDE experts. Keywords: NDE, Concrete, Thick-walled, Defects, Deterioration, Steel liner.
Transcript of DESIGN, CONSTRUCTION, AND NDT OF A MOCK-UP FOR …

Transactions, SMiRT-25Charlotte, NC, USA, August 4-9, 2019
Division VIII
DESIGN, CONSTRUCTION, AND NDT OF A MOCK-UP FORREINFORCED CONCRETE WALLS IN NPP
Fahim Al-Neshawy1, Miguel Ferreira2, Edgar Bohner3, Teemu Ojala4, Ville Sjöblom5, ErnstNiederleithinger6, Ute Effner7 and Jari Puttonen8
1 Staff Scientist, Civil Engineering Dept., Aalto University, Finland ([email protected])2 Senior Researcher, VTT Technical Research Centre of Finland3 Research Team Leader, VTT Technical Research Centre of Finland4 Doctoral Student, Civil Engineering Department, Aalto University, Finland5 Research Scientist, VTT Technical Research Centre of Finland6 Head of Division 8.2 Non-Destructive Testing Methods for Civil Engineering, BAM, Germany7 Senior scientist, Division 8.2 Non-Destructive Testing Methods for Civil Engineering, BAM, Germany8 Professor, Civil Engineering Department, Aalto University, Finland
ABSTRACT
Construction methods, environmental stressors, and aging factors are the main causes fordefects of reinforced concrete in nuclear power plants (NPP). These defects are typically occurredas corrosion of reinforcement steel, delamination, cracks, malfunction of post-tensioning or steelcomposite systems etc. Some of the challenges for assessing the performance of these structures by non-destructive testing methods (NDT) are that the assessment could be performed only during the annualoverhauls when testing is time-limited and uncertainty of the accuracy and reliability of the available NDTtesting devices combined with the lack of the international uniformity of the methods used for NDT tests.
To overcome these challenges, a mock-up wall representing a section of the concretecontainment of the NPP. The mock-up wall included simulated defects, which mimic the mostcommon types of defects in NPP concrete structures such as dimensional errors, honeycombing,delamination, defects adjacent to the steel liner and voids in grouted tendon ducts for the post-tensioned structures. This paper introduce the design and construction of the wall including theconcrete properties, reinforcement, tendon ducts and the types of the simulated defects. The paperalso introduces the NDT methods and techniques that are suitable for assessing the condition ofthe mock-up wall under the real environmental conditions. These techniques include mechanicalmethods as rebound hammer, ultrasonic and electromagnetic methods. This mock-up wall will enableto investigate reliably available NDT methods and experts’ skills providing also an important and verymuch need educational platform for future NDE experts.
Keywords: NDE, Concrete, Thick-walled, Defects, Deterioration, Steel liner.
25th Conference on Structural Mechanics in Reactor Technology Charlotte, NC, USA, August 4-9, 2019
Division VIII
INTRODUCTION
Reinforced concrete structures in nuclear power plants (NPP) are deteriorated due to ageing orenvironmental stress or effects during the lifetime of the power plant. To assess the construction qualityand long-term performance of the reinforced concrete structures, different non-destructive testing andevaluation (NDT&E) methods are used (Wiggenhauser and Naus, 2014). Some of the challenges forassessing the performance of these structures are:
1) The assessment could be performed only during the annual overhauls when testing is time-limited,2) The accuracy and reliability of the available NDT testing devices,3) The uncertainty of the international uniformity of the methods used for NDT tests, and4) The creditability of results and analyses.
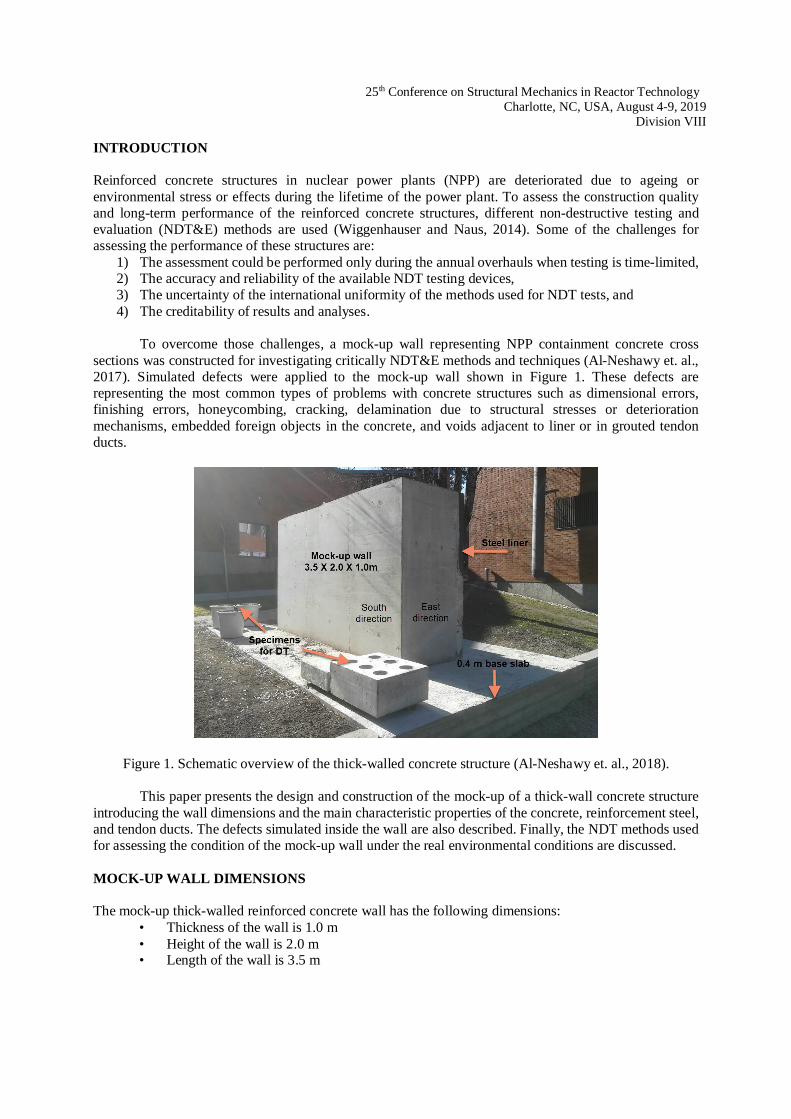
To overcome those challenges, a mock-up wall representing NPP containment concrete crosssections was constructed for investigating critically NDT&E methods and techniques (Al-Neshawy et. al.,2017). Simulated defects were applied to the mock-up wall shown in Figure 1. These defects arerepresenting the most common types of problems with concrete structures such as dimensional errors,finishing errors, honeycombing, cracking, delamination due to structural stresses or deteriorationmechanisms, embedded foreign objects in the concrete, and voids adjacent to liner or in grouted tendonducts.
Figure 1. Schematic overview of the thick-walled concrete structure (Al-Neshawy et. al., 2018).
This paper presents the design and construction of the mock-up of a thick-wall concrete structureintroducing the wall dimensions and the main characteristic properties of the concrete, reinforcement steel,and tendon ducts. The defects simulated inside the wall are also described. Finally, the NDT methods usedfor assessing the condition of the mock-up wall under the real environmental conditions are discussed.
MOCK-UP WALL DIMENSIONS
The mock-up thick-walled reinforced concrete wall has the following dimensions:• Thickness of the wall is 1.0 m• Height of the wall is 2.0 m• Length of the wall is 3.5 m
25th Conference on Structural Mechanics in Reactor Technology Charlotte, NC, USA, August 4-9, 2019
Division VIII
• Volume of the wall is 7.0 m³The curvature typical for some containments was not considered to be the main issue for testing the NDTmethods and was excluded from the mock-up as Figure 1 illustrates.
A 40 cm reinforced concrete slab-on-grade (floating slab) foundation placed at the ground wasdesigned for transferring the weight of the mock-up structure to the soil. Another purpose of the foundationslab is to perform some semi-destructive testing or drill sample for further testing of the concrete quality.The semi destructive tests include among others, the carbonation depth and corrosion measurement. Thedrilled sample are used for determine the compressive strength and some microscopic analysis for assessingthe quality of concrete. The mock-up concrete slab base has the following dimensions:
• Thickness of the wall base is 0.4 m• Width of the wall base is 3.0 m• Length of the wall base is 5.5 m• Volume of the wall base is 6.6 m³
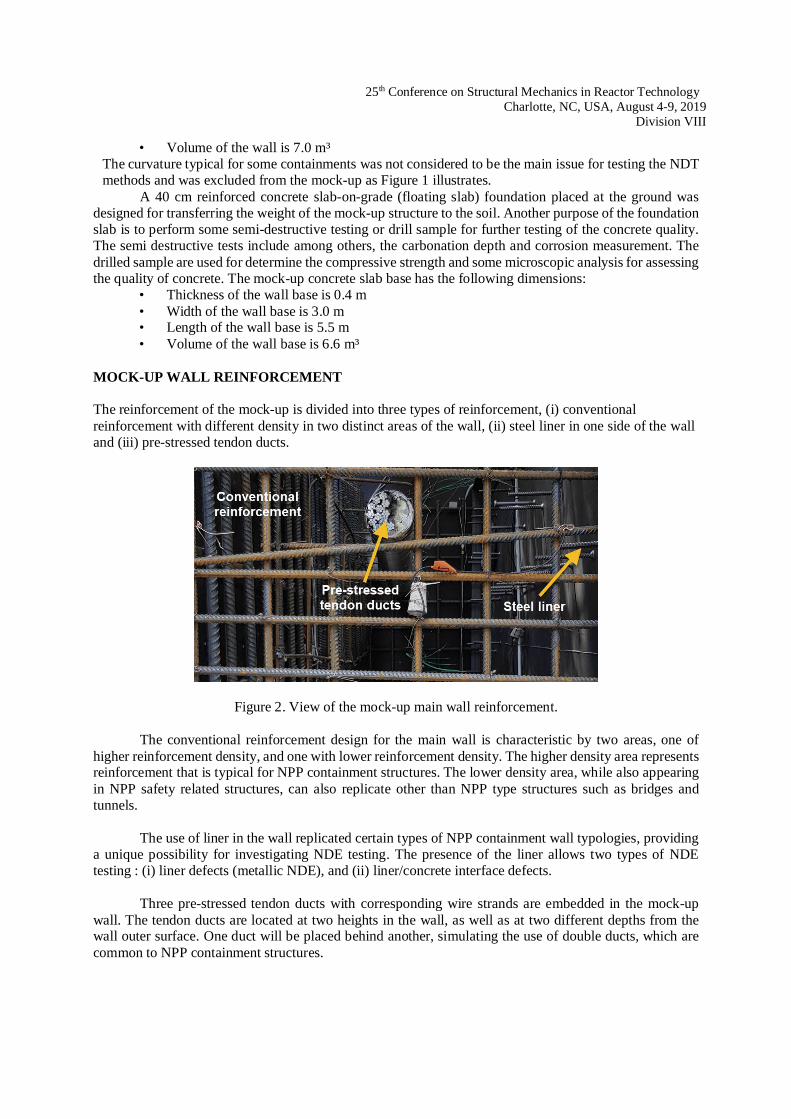
MOCK-UP WALL REINFORCEMENT
The reinforcement of the mock-up is divided into three types of reinforcement, (i) conventionalreinforcement with different density in two distinct areas of the wall, (ii) steel liner in one side of the walland (iii) pre-stressed tendon ducts.
Figure 2. View of the mock-up main wall reinforcement.
The conventional reinforcement design for the main wall is characteristic by two areas, one ofhigher reinforcement density, and one with lower reinforcement density. The higher density area representsreinforcement that is typical for NPP containment structures. The lower density area, while also appearingin NPP safety related structures, can also replicate other than NPP type structures such as bridges andtunnels.
The use of liner in the wall replicated certain types of NPP containment wall typologies, providinga unique possibility for investigating NDE testing. The presence of the liner allows two types of NDEtesting : (i) liner defects (metallic NDE), and (ii) liner/concrete interface defects.
Three pre-stressed tendon ducts with corresponding wire strands are embedded in the mock-upwall. The tendon ducts are located at two heights in the wall, as well as at two different depths from thewall outer surface. One duct will be placed behind another, simulating the use of double ducts, which arecommon to NPP containment structures.
25th Conference on Structural Mechanics in Reactor Technology Charlotte, NC, USA, August 4-9, 2019
DivisionVIII
SIMULATED DEFECTS OF MOCK-UP WALL AND BASE SLAB
Controlled defects were embedded in the mock-up wall to ensure that limitations of the advanced NDTmethods can be quantified. At the same time, some of the proposed defects were designed to be identifiableby most of the methods. The simulated defects are designed to represent: (i) activities that could haveoccurred during the construction process and (ii) cumulative deterioration and degradation of the concretewith time. (Clayton et. al., 2014 and Clayton et. al., 2015)
Some of the ageing related degradation mechanisms cannot be reproduced due to time constraintslike for example the corrosion of reinforcement steel. The defects were designed to give a mix of realisticand controlled defects for assessment of both the necessary measures needed to overcome the challengeswith more heavily reinforced concrete thick-walled structures, while also ensuring the correct types offeatures for effective NPP evaluation have been included.
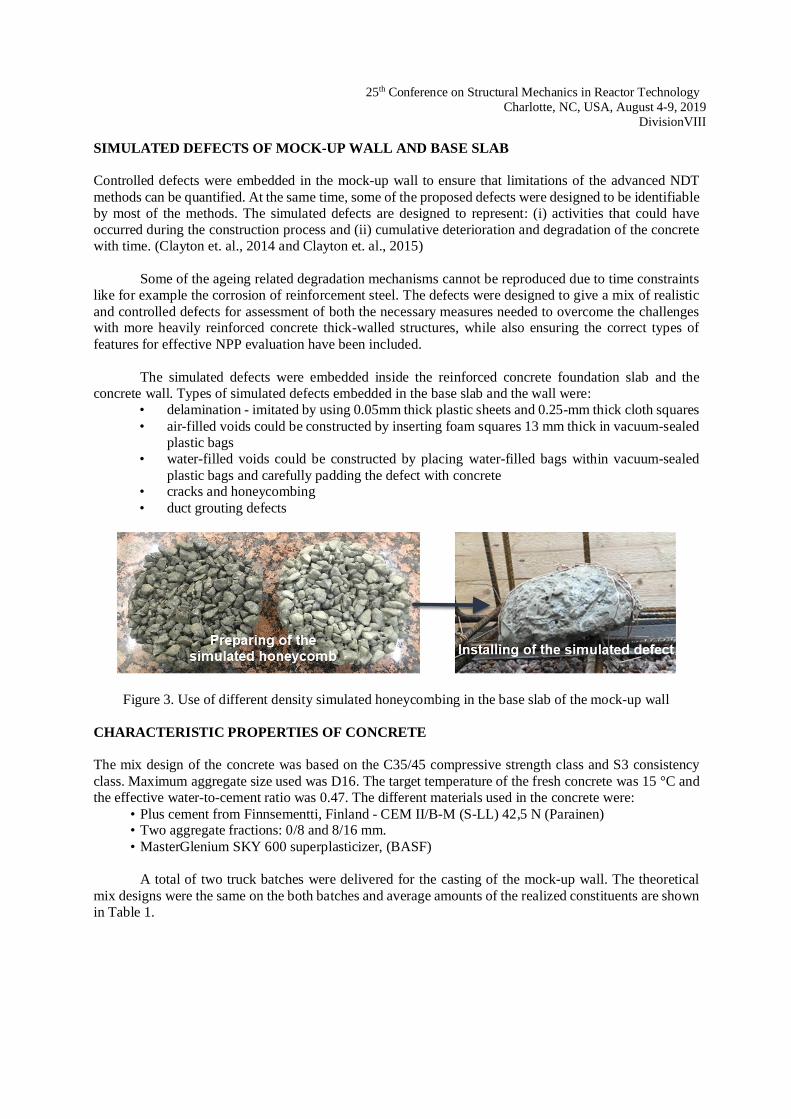
The simulated defects were embedded inside the reinforced concrete foundation slab and theconcrete wall. Types of simulated defects embedded in the base slab and the wall were:
• delamination - imitated by using 0.05mm thick plastic sheets and 0.25-mm thick cloth squares• air-filled voids could be constructed by inserting foam squares 13 mm thick in vacuum-sealed
plastic bags• water-filled voids could be constructed by placing water-filled bags within vacuum-sealed
plastic bags and carefully padding the defect with concrete• cracks and honeycombing• duct grouting defects
Figure 3. Use of different density simulated honeycombing in the base slab of the mock-up wall
CHARACTERISTIC PROPERTIES OF CONCRETE
The mix design of the concrete was based on the C35/45 compressive strength class and S3 consistencyclass. Maximum aggregate size used was D16. The target temperature of the fresh concrete was 15 °C andthe effective water-to-cement ratio was 0.47. The different materials used in the concrete were:
• Plus cement from Finnsementti, Finland - CEM II/B-M (S-LL) 42,5 N (Parainen)• Two aggregate fractions: 0/8 and 8/16 mm.• MasterGlenium SKY 600 superplasticizer, (BASF)
A total of two truck batches were delivered for the casting of the mock-up wall. The theoreticalmix designs were the same on the both batches and average amounts of the realized constituents are shownin Table 1.
25th Conference on Structural Mechanics in Reactor Technology Charlotte, NC, USA, August 4-9, 2019
Division VIII
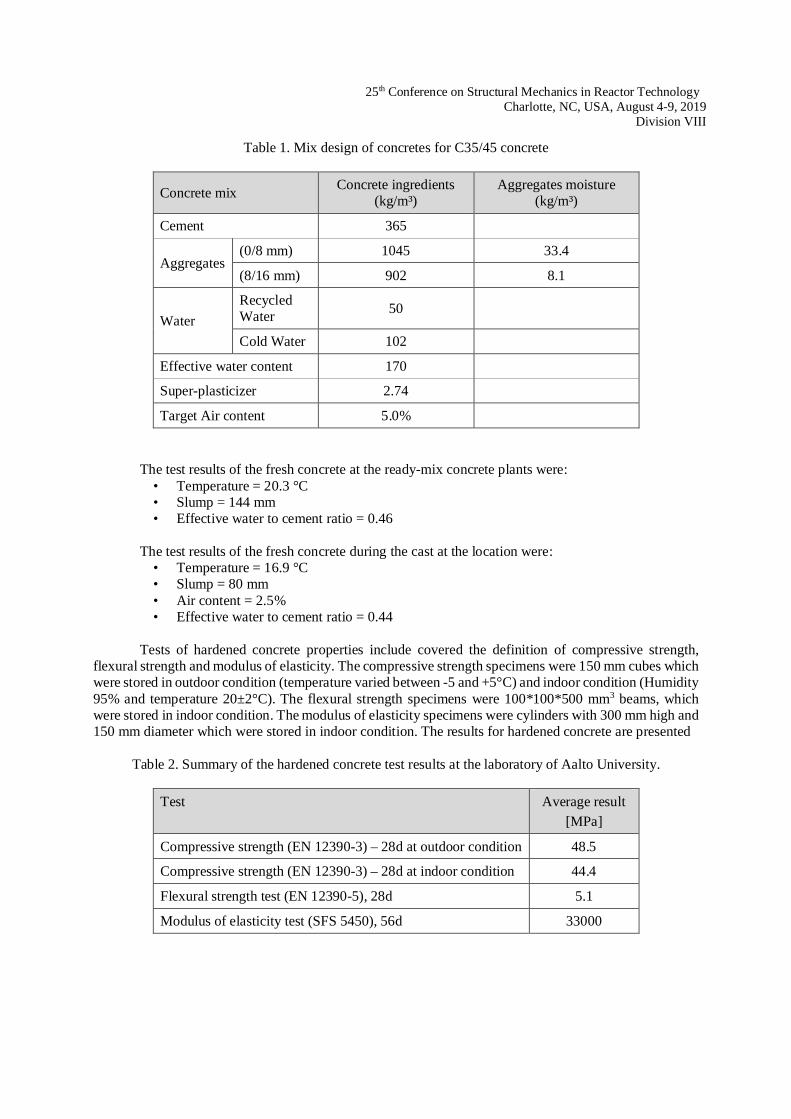
Table 1. Mix design of concretes for C35/45 concrete
Concrete mix Concrete ingredients(kg/m³)
Aggregates moisture(kg/m³)
Cement 365
Aggregates(0/8 mm) 1045 33.4
(8/16 mm) 902 8.1
WaterRecycledWater 50
Cold Water 102
Effective water content 170
Super-plasticizer 2.74
Target Air content 5.0%
The test results of the fresh concrete at the ready-mix concrete plants were:• Temperature = 20.3 °C• Slump = 144 mm• Effective water to cement ratio = 0.46
The test results of the fresh concrete during the cast at the location were:• Temperature = 16.9 °C• Slump = 80 mm• Air content = 2.5%• Effective water to cement ratio = 0.44
Tests of hardened concrete properties include covered the definition of compressive strength,flexural strength and modulus of elasticity. The compressive strength specimens were 150 mm cubes whichwere stored in outdoor condition (temperature varied between -5 and +5°C) and indoor condition (Humidity95% and temperature 20±2°C). The flexural strength specimens were 100*100*500 mm3 beams, whichwere stored in indoor condition. The modulus of elasticity specimens were cylinders with 300 mm high and150 mm diameter which were stored in indoor condition. The results for hardened concrete are presented
Table 2. Summary of the hardened concrete test results at the laboratory of Aalto University.
Test Average result[MPa]
Compressive strength (EN 12390-3) – 28d at outdoor condition 48.5
Compressive strength (EN 12390-3) – 28d at indoor condition 44.4
Flexural strength test (EN 12390-5), 28d 5.1
Modulus of elasticity test (SFS 5450), 56d 33000
25th Conference on Structural Mechanics in Reactor Technology Charlotte, NC, USA, August 4-9, 2019
Division VIII
NON-DESTRUCTIVE ASSESSMENT OF THE CONCRETE MOCK-UP WALL
In this paper, we present some results received by the NDT methods: (i) rebound hammer, ultrasonic pulsevelocity (UPV) to evaluate the characteristic properties of concrete and (ii) ultrasonic tomography device(MIRA).to detect the location of reinforcement and the embedded simulated defects.
Rebound Schmidt Hammer
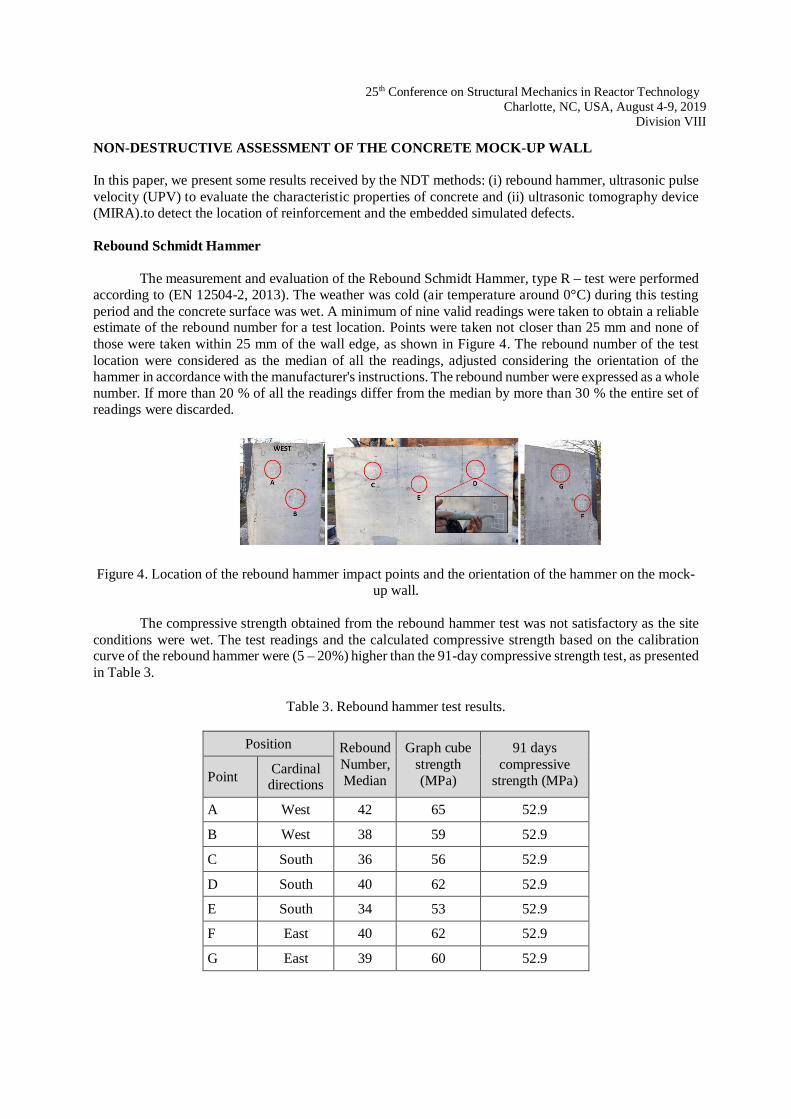
The measurement and evaluation of the Rebound Schmidt Hammer, type R – test were performedaccording to (EN 12504-2, 2013). The weather was cold (air temperature around 0°C) during this testingperiod and the concrete surface was wet. A minimum of nine valid readings were taken to obtain a reliableestimate of the rebound number for a test location. Points were taken not closer than 25 mm and none ofthose were taken within 25 mm of the wall edge, as shown in Figure 4. The rebound number of the testlocation were considered as the median of all the readings, adjusted considering the orientation of thehammer in accordance with the manufacturer's instructions. The rebound number were expressed as a wholenumber. If more than 20 % of all the readings differ from the median by more than 30 % the entire set ofreadings were discarded.
Figure 4. Location of the rebound hammer impact points and the orientation of the hammer on the mock-up wall.
The compressive strength obtained from the rebound hammer test was not satisfactory as the siteconditions were wet. The test readings and the calculated compressive strength based on the calibrationcurve of the rebound hammer were (5 – 20%) higher than the 91-day compressive strength test, as presentedin Table 3.
Table 3. Rebound hammer test results.
Position ReboundNumber,Median
Graph cubestrength(MPa)
91 dayscompressive
strength (MPa)Point Cardinaldirections
A West 42 65 52.9
B West 38 59 52.9
C South 36 56 52.9
D South 40 62 52.9
E South 34 53 52.9
F East 40 62 52.9
G East 39 60 52.9
25th Conference on Structural Mechanics in Reactor Technology Charlotte, NC, USA, August 4-9, 2019
Division VIII
Ultrasonic Pulse Velocity
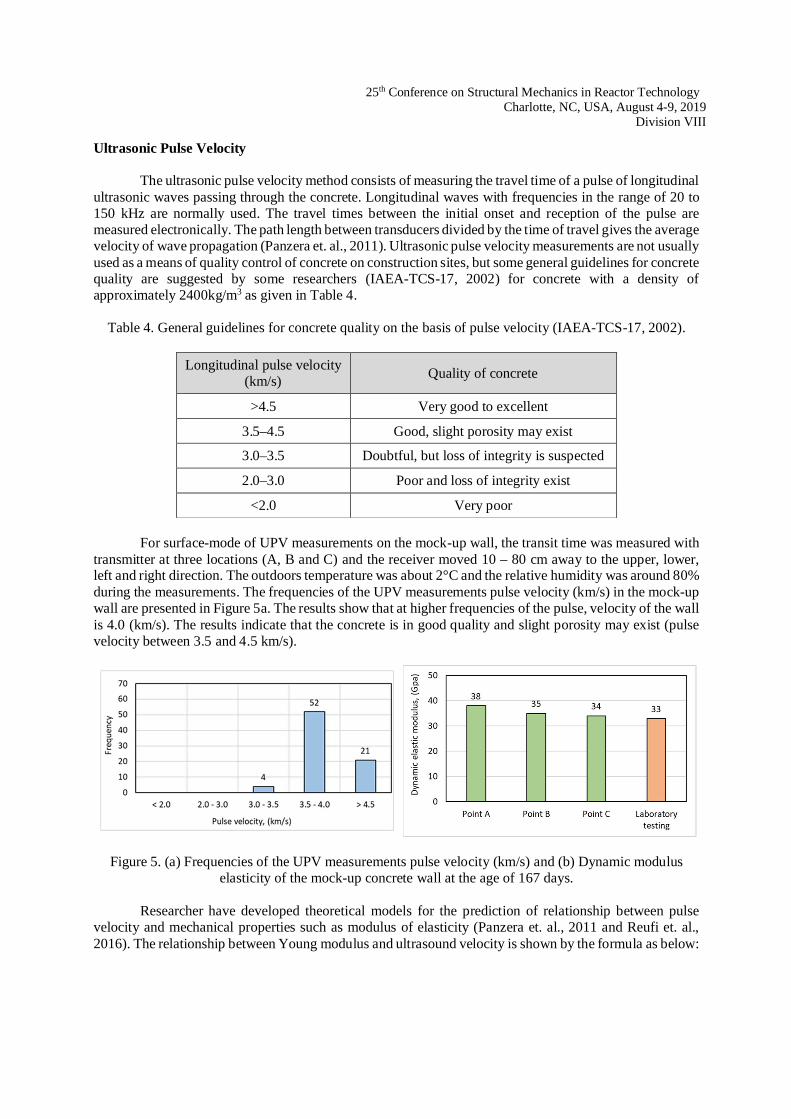
The ultrasonic pulse velocity method consists of measuring the travel time of a pulse of longitudinalultrasonic waves passing through the concrete. Longitudinal waves with frequencies in the range of 20 to150 kHz are normally used. The travel times between the initial onset and reception of the pulse aremeasured electronically. The path length between transducers divided by the time of travel gives the averagevelocity of wave propagation (Panzera et. al., 2011). Ultrasonic pulse velocity measurements are not usuallyused as a means of quality control of concrete on construction sites, but some general guidelines for concretequality are suggested by some researchers (IAEA-TCS-17, 2002) for concrete with a density ofapproximately 2400kg/m3 as given in Table 4.
Table 4. General guidelines for concrete quality on the basis of pulse velocity (IAEA-TCS-17, 2002).
Longitudinal pulse velocity(km/s) Quality of concrete
>4.5 Very good to excellent
3.5–4.5 Good, slight porosity may exist
3.0–3.5 Doubtful, but loss of integrity is suspected
2.0–3.0 Poor and loss of integrity exist
<2.0 Very poor
For surface-mode of UPV measurements on the mock-up wall, the transit time was measured withtransmitter at three locations (A, B and C) and the receiver moved 10 – 80 cm away to the upper, lower,left and right direction. The outdoors temperature was about 2°C and the relative humidity was around 80%during the measurements. The frequencies of the UPV measurements pulse velocity (km/s) in the mock-upwall are presented in Figure 5a. The results show that at higher frequencies of the pulse, velocity of the wallis 4.0 (km/s). The results indicate that the concrete is in good quality and slight porosity may exist (pulsevelocity between 3.5 and 4.5 km/s).
Figure 5. (a) Frequencies of the UPV measurements pulse velocity (km/s) and (b) Dynamic moduluselasticity of the mock-up concrete wall at the age of 167 days.
Researcher have developed theoretical models for the prediction of relationship between pulsevelocity and mechanical properties such as modulus of elasticity (Panzera et. al., 2011 and Reufi et. al.,2016). The relationship between Young modulus and ultrasound velocity is shown by the formula as below:
25th Conference on Structural Mechanics in Reactor Technology Charlotte, NC, USA, August 4-9, 2019
Division VIII
= ² ×(1 + )(1 − 2 )
(1 − ) (1)where is the dynamic elastic modulus, (MN/m2), is the density, (kg/m3), is the wave velocity
of the material, (km/s), is the dynamic Poisson’s ratio. The Poisson’s ratio for concrete varies between0.15 and 0.22. According to Eurocode 2: Design of concrete structures (EN1992-1-1), The Poisson’s ratiofor un-cracked concrete is considered 0.2.
The dynamic modulus of elasticity was calculated based on Equation (1) and the results arepresented in Figure 5b. The results show that the average value of the dynamic modulus of elasticity of themock up is 35 (GPa) at age of 167 days, while the average value of the dynamic modulus of elasticity ofthe laboratory specimens at 56 days was 33 (GPa).
Ultrasonic Shear-Wave Tomography (MIRA)
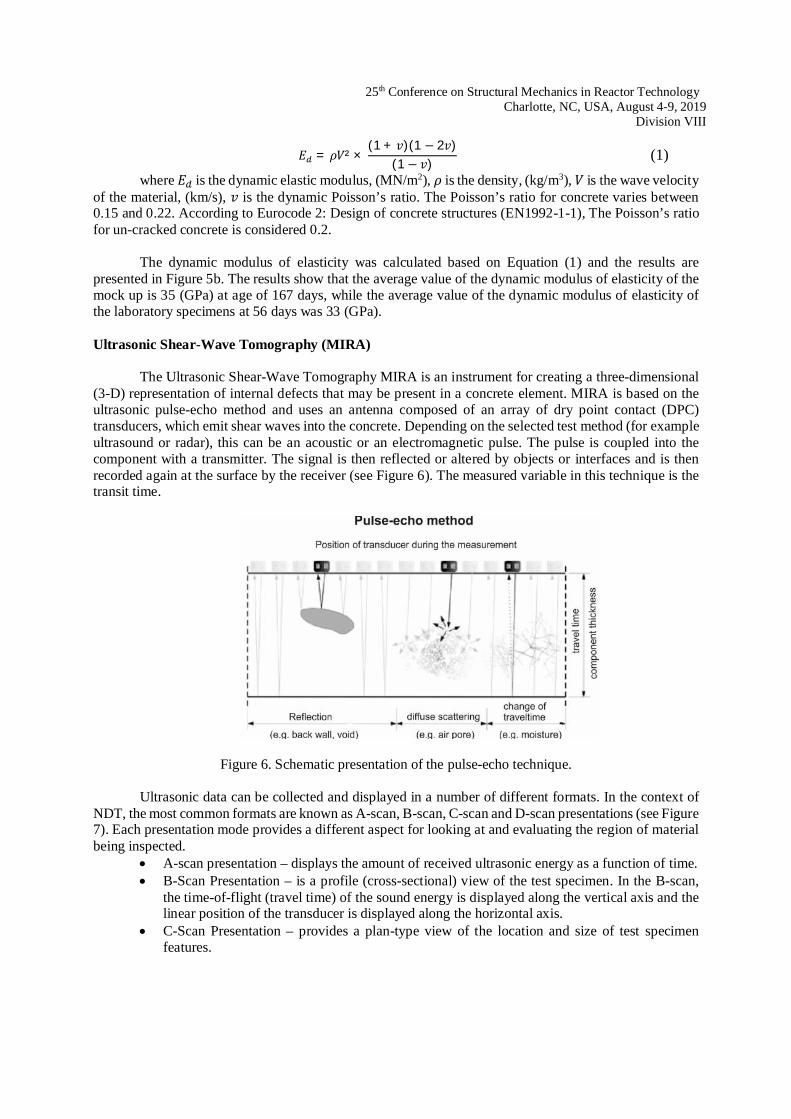
The Ultrasonic Shear-Wave Tomography MIRA is an instrument for creating a three-dimensional(3-D) representation of internal defects that may be present in a concrete element. MIRA is based on theultrasonic pulse-echo method and uses an antenna composed of an array of dry point contact (DPC)transducers, which emit shear waves into the concrete. Depending on the selected test method (for exampleultrasound or radar), this can be an acoustic or an electromagnetic pulse. The pulse is coupled into thecomponent with a transmitter. The signal is then reflected or altered by objects or interfaces and is thenrecorded again at the surface by the receiver (see Figure 6). The measured variable in this technique is thetransit time.
Figure 6. Schematic presentation of the pulse-echo technique.
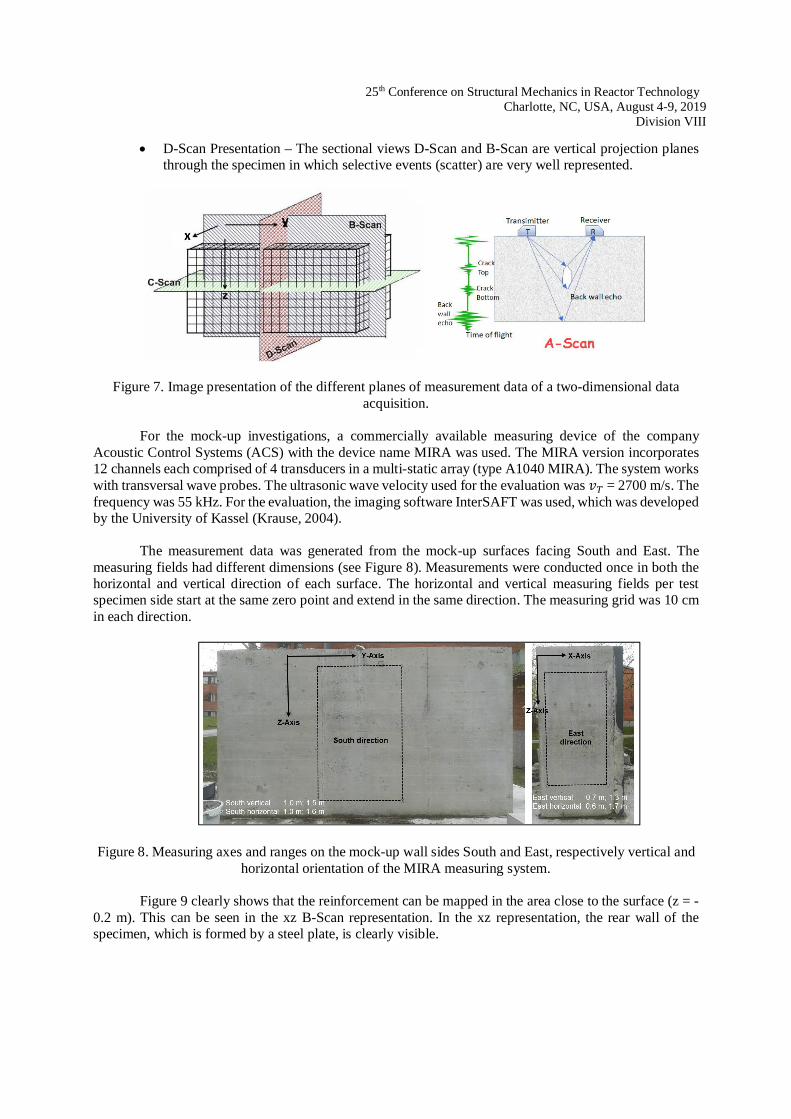
Ultrasonic data can be collected and displayed in a number of different formats. In the context ofNDT, the most common formats are known as A-scan, B-scan, C-scan and D-scan presentations (see Figure7). Each presentation mode provides a different aspect for looking at and evaluating the region of materialbeing inspected.
· A-scan presentation – displays the amount of received ultrasonic energy as a function of time.· B-Scan Presentation – is a profile (cross-sectional) view of the test specimen. In the B-scan,
the time-of-flight (travel time) of the sound energy is displayed along the vertical axis and thelinear position of the transducer is displayed along the horizontal axis.
· C-Scan Presentation – provides a plan-type view of the location and size of test specimenfeatures.
25th Conference on Structural Mechanics in Reactor Technology Charlotte, NC, USA, August 4-9, 2019
Division VIII
· D-Scan Presentation – The sectional views D-Scan and B-Scan are vertical projection planesthrough the specimen in which selective events (scatter) are very well represented.
Figure 7. Image presentation of the different planes of measurement data of a two-dimensional dataacquisition.
For the mock-up investigations, a commercially available measuring device of the companyAcoustic Control Systems (ACS) with the device name MIRA was used. The MIRA version incorporates12 channels each comprised of 4 transducers in a multi-static array (type A1040 MIRA). The system workswith transversal wave probes. The ultrasonic wave velocity used for the evaluation was = 2700 m/s. Thefrequency was 55 kHz. For the evaluation, the imaging software InterSAFT was used, which was developedby the University of Kassel (Krause, 2004).
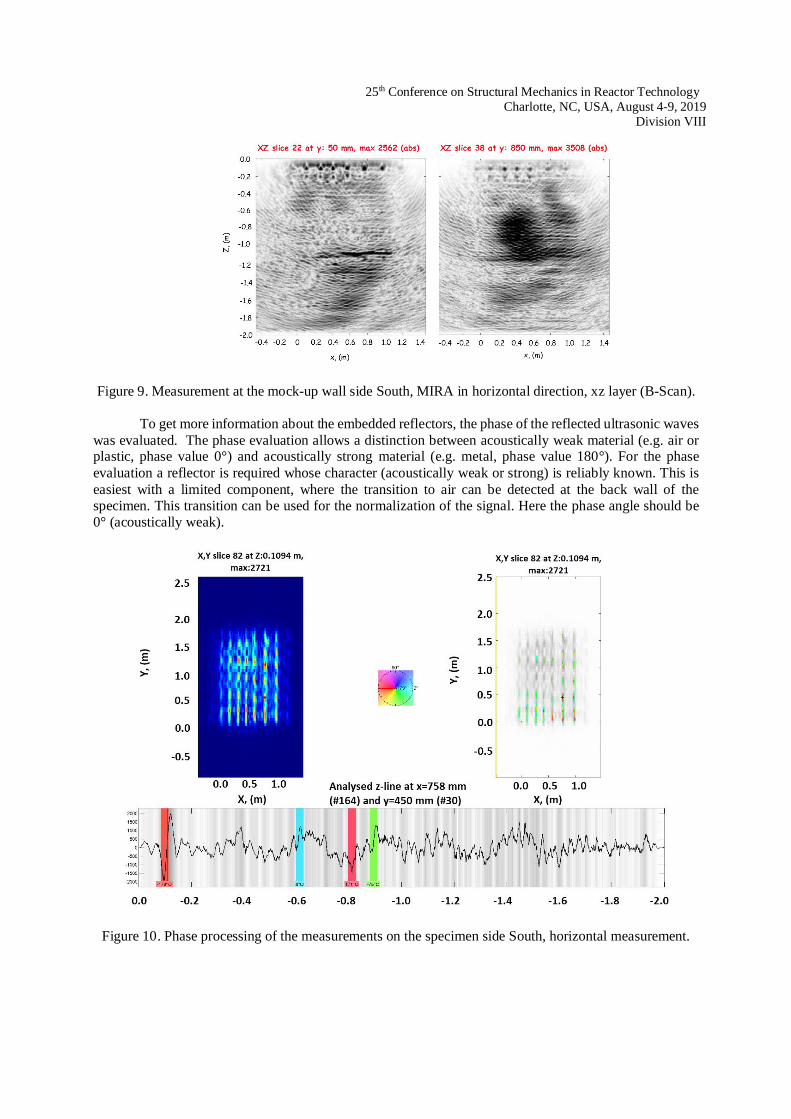
The measurement data was generated from the mock-up surfaces facing South and East. Themeasuring fields had different dimensions (see Figure 8). Measurements were conducted once in both thehorizontal and vertical direction of each surface. The horizontal and vertical measuring fields per testspecimen side start at the same zero point and extend in the same direction. The measuring grid was 10 cmin each direction.
Figure 8. Measuring axes and ranges on the mock-up wall sides South and East, respectively vertical andhorizontal orientation of the MIRA measuring system.
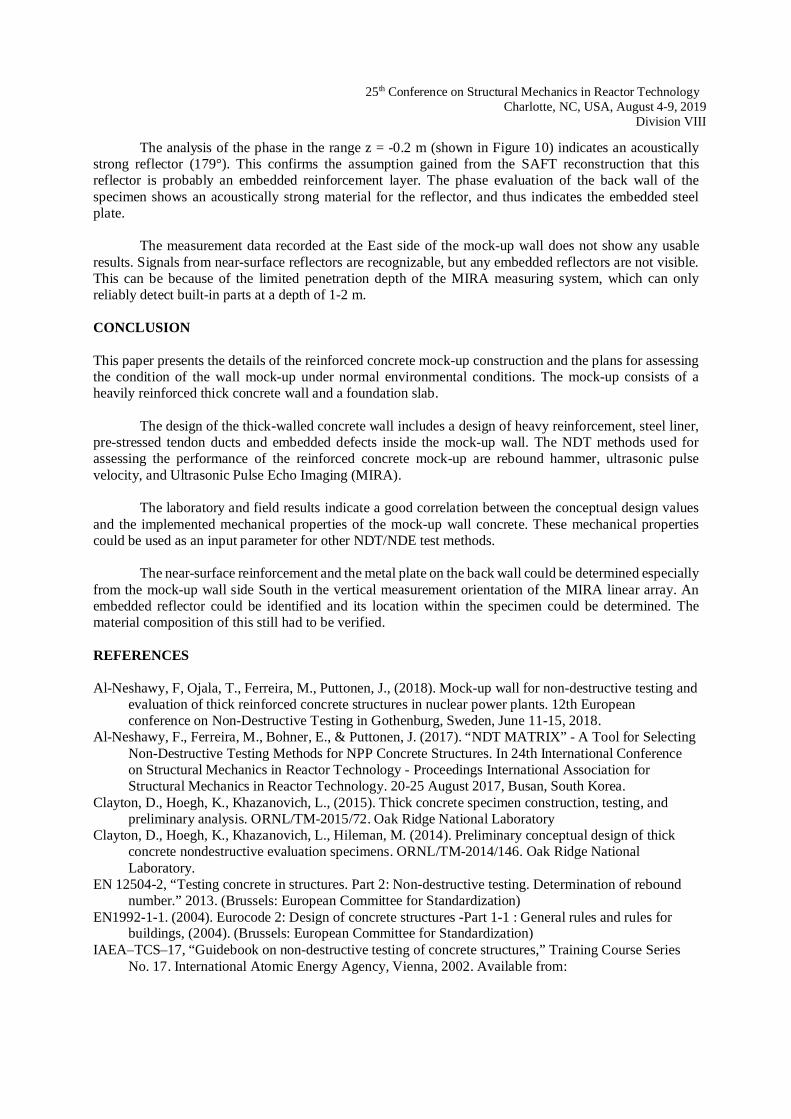
Figure 9 clearly shows that the reinforcement can be mapped in the area close to the surface (z = -0.2 m). This can be seen in the xz B-Scan representation. In the xz representation, the rear wall of thespecimen, which is formed by a steel plate, is clearly visible.
25th Conference on Structural Mechanics in Reactor Technology Charlotte, NC, USA, August 4-9, 2019
Division VIII
Figure 9. Measurement at the mock-up wall side South, MIRA in horizontal direction, xz layer (B-Scan).
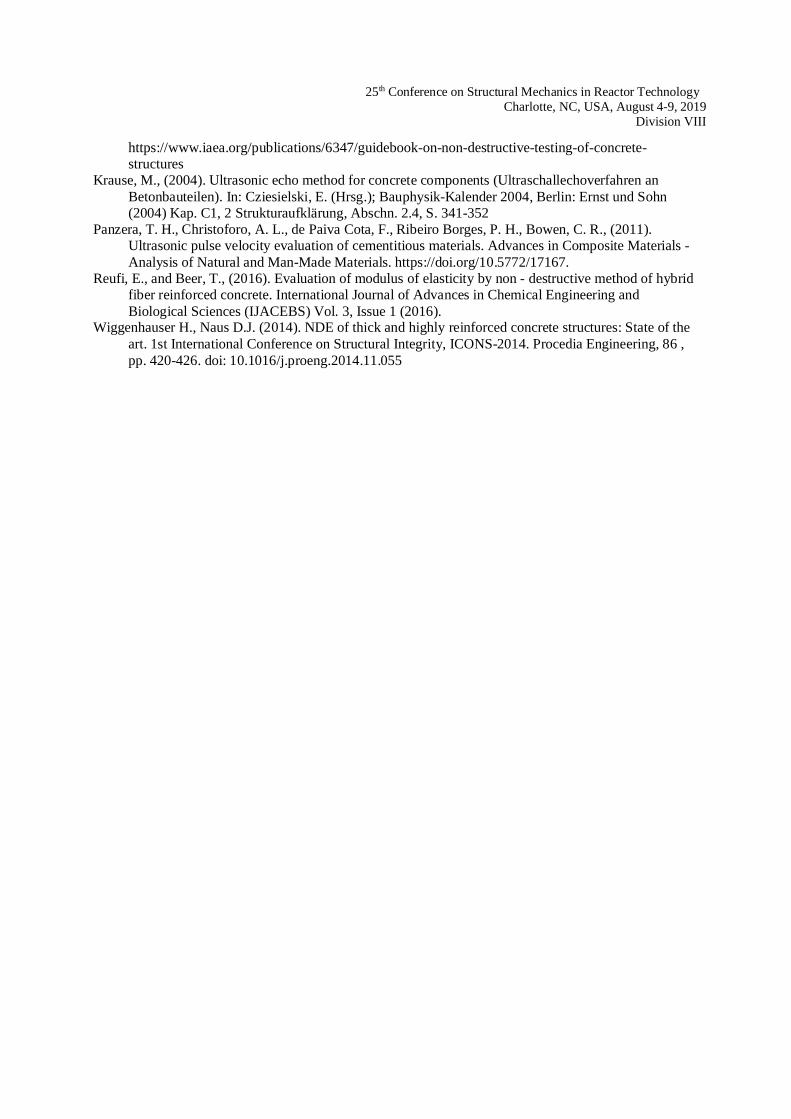
To get more information about the embedded reflectors, the phase of the reflected ultrasonic waveswas evaluated. The phase evaluation allows a distinction between acoustically weak material (e.g. air orplastic, phase value 0°) and acoustically strong material (e.g. metal, phase value 180°). For the phaseevaluation a reflector is required whose character (acoustically weak or strong) is reliably known. This iseasiest with a limited component, where the transition to air can be detected at the back wall of thespecimen. This transition can be used for the normalization of the signal. Here the phase angle should be0° (acoustically weak).
Figure 10. Phase processing of the measurements on the specimen side South, horizontal measurement.
25th Conference on Structural Mechanics in Reactor Technology Charlotte, NC, USA, August 4-9, 2019
Division VIII
The analysis of the phase in the range z = -0.2 m (shown in Figure 10) indicates an acousticallystrong reflector (179°). This confirms the assumption gained from the SAFT reconstruction that thisreflector is probably an embedded reinforcement layer. The phase evaluation of the back wall of thespecimen shows an acoustically strong material for the reflector, and thus indicates the embedded steelplate.
The measurement data recorded at the East side of the mock-up wall does not show any usableresults. Signals from near-surface reflectors are recognizable, but any embedded reflectors are not visible.This can be because of the limited penetration depth of the MIRA measuring system, which can onlyreliably detect built-in parts at a depth of 1-2 m.
CONCLUSION
This paper presents the details of the reinforced concrete mock-up construction and the plans for assessingthe condition of the wall mock-up under normal environmental conditions. The mock-up consists of aheavily reinforced thick concrete wall and a foundation slab.
The design of the thick-walled concrete wall includes a design of heavy reinforcement, steel liner,pre-stressed tendon ducts and embedded defects inside the mock-up wall. The NDT methods used forassessing the performance of the reinforced concrete mock-up are rebound hammer, ultrasonic pulsevelocity, and Ultrasonic Pulse Echo Imaging (MIRA).
The laboratory and field results indicate a good correlation between the conceptual design valuesand the implemented mechanical properties of the mock-up wall concrete. These mechanical propertiescould be used as an input parameter for other NDT/NDE test methods.
The near-surface reinforcement and the metal plate on the back wall could be determined especiallyfrom the mock-up wall side South in the vertical measurement orientation of the MIRA linear array. Anembedded reflector could be identified and its location within the specimen could be determined. Thematerial composition of this still had to be verified.
REFERENCES
Al-Neshawy, F, Ojala, T., Ferreira, M., Puttonen, J., (2018). Mock-up wall for non-destructive testing andevaluation of thick reinforced concrete structures in nuclear power plants. 12th Europeanconference on Non-Destructive Testing in Gothenburg, Sweden, June 11-15, 2018.
Al-Neshawy, F., Ferreira, M., Bohner, E., & Puttonen, J. (2017). “NDT MATRIX” - A Tool for SelectingNon-Destructive Testing Methods for NPP Concrete Structures. In 24th International Conferenceon Structural Mechanics in Reactor Technology - Proceedings International Association forStructural Mechanics in Reactor Technology. 20-25 August 2017, Busan, South Korea.
Clayton, D., Hoegh, K., Khazanovich, L., (2015). Thick concrete specimen construction, testing, andpreliminary analysis. ORNL/TM-2015/72. Oak Ridge National Laboratory
Clayton, D., Hoegh, K., Khazanovich, L., Hileman, M. (2014). Preliminary conceptual design of thickconcrete nondestructive evaluation specimens. ORNL/TM-2014/146. Oak Ridge NationalLaboratory.
EN 12504-2, “Testing concrete in structures. Part 2: Non-destructive testing. Determination of reboundnumber.” 2013. (Brussels: European Committee for Standardization)
EN1992-1-1. (2004). Eurocode 2: Design of concrete structures -Part 1-1 : General rules and rules forbuildings, (2004). (Brussels: European Committee for Standardization)
IAEA–TCS–17, “Guidebook on non-destructive testing of concrete structures,” Training Course SeriesNo. 17. International Atomic Energy Agency, Vienna, 2002. Available from:
25th Conference on Structural Mechanics in Reactor Technology Charlotte, NC, USA, August 4-9, 2019
Division VIII
https://www.iaea.org/publications/6347/guidebook-on-non-destructive-testing-of-concrete-structures
Krause, M., (2004). Ultrasonic echo method for concrete components (Ultraschallechoverfahren anBetonbauteilen). In: Cziesielski, E. (Hrsg.); Bauphysik-Kalender 2004, Berlin: Ernst und Sohn(2004) Kap. C1, 2 Strukturaufklärung, Abschn. 2.4, S. 341-352
Panzera, T. H., Christoforo, A. L., de Paiva Cota, F., Ribeiro Borges, P. H., Bowen, C. R., (2011).Ultrasonic pulse velocity evaluation of cementitious materials. Advances in Composite Materials -Analysis of Natural and Man-Made Materials. https://doi.org/10.5772/17167.
Reufi, E., and Beer, T., (2016). Evaluation of modulus of elasticity by non - destructive method of hybridfiber reinforced concrete. International Journal of Advances in Chemical Engineering andBiological Sciences (IJACEBS) Vol. 3, Issue 1 (2016).
Wiggenhauser H., Naus D.J. (2014). NDE of thick and highly reinforced concrete structures: State of theart. 1st International Conference on Structural Integrity, ICONS-2014. Procedia Engineering, 86 ,pp. 420-426. doi: 10.1016/j.proeng.2014.11.055