BILAL RT1001B49
43
SYNOPSIS OF TERM PAPER OF ACCOUNTING FOR MANAGERS SUBMITTED TO:- PRESENTED BY:- LECT.MISS SUKHWINDAR KAUR NAME:-BILAL AHMAD CLASS:-MBA I ST SEM. SEC.:-RT1001 ROLL NO.:- B49 REG.NO.:-1101149
-
Upload
bilal-ahmad -
Category
Documents
-
view
231 -
download
0
Transcript of BILAL RT1001B49
8/2/2019 BILAL RT1001B49
http://slidepdf.com/reader/full/bilal-rt1001b49 1/43
SYNOPSIS
OF
TERM PAPER
OF
ACCOUNTING
FOR
MANAGERS
SUBMITTED TO:- PRESENTED BY:-
LECT.MISS SUKHWINDAR KAUR NAME:-BILAL AHMAD
CLASS:-MBA IST
SEM.
SEC.:-RT1001
ROLL NO.:- B49
REG.NO.:-1101149
8/2/2019 BILAL RT1001B49
http://slidepdf.com/reader/full/bilal-rt1001b49 2/43
INDIAN PETROCHEMICALS CORPORATION LTD.
Indian Petrochemicals Corporation Limited (IPCL) is a petrochemicals company in India. It was established on March 22, 1969, with a view to
promote and encourage the use of plastics in India. Its business consists of polymers, synthetic fibre, fibre intermediaries, solvents, surfactants,
industrial chemicals, catalysts, adsorbents and polyesters. The Company operates three petrochemical complexes, a naphtha based complexat Vadodara and gas based complex each at Nagothane near Mumbai and at Dahej on Narmada estuary in bay of Khambhat. The Company also
operates a catalyst manufacturing facility at Vadodara. Its turnover for the financial year 2005-06 has crossed the US $ 2 billion mark.
In June 2002, the Government of India as a part of its disinvestment programme divested 26% of its equity shares in favour of Reliance
Petroinvestments Limited (RPIL), aReliance Group Company. RPIL acquired an additional 20% equity shares through a cash offer in terms of
SEBI (Takeover Regulations) and currently holds 46% of Company's equity shares.
The Board of IPCL consists of ten directors led by Shri Mukesh Ambani as Chairman, five independent and five non-independent directors.
Effective April 1, 2005, the six polyester companies namely Appollo Fibres Limited (AFL), Central India Polyesters Limited (CIPL), India
Polyfibres Limited (IPL), Orissa Polyfibres Limited (OPL), Recron Synthetics Limited (RSL) and Silvassa Industries Private Limited (SIPL)
have been amalgamated with IPCL. This marks the entry of the Company in the polyester sector. The polyester units are based
in Hoshiarpur (Punjab), Nagpur (Maharashtra), Barabanki (Uttar Pradesh), Baulpur (Orissa), Allahabad (Uttar Pradesh) and Silvassa (Gujarat).
Company Profile:
Indian Petrochemicals Corporation Limited with management control by Reliance Petroinvest Co. and one of the Navratnas established in 1969
by Govt. of India is leading entity in corporate circles of India. IPCL’s mutiproduct portfolio includes Polymers, Synthetic Rubber, Synthetic
Fibre & Fibre Intermediates, Solvents, Industrial Chemicals, Synthetic Resins, Engineering Plastics, Catalysts, Absorbents, and Wire & Cable
Compounds. IPCL have manufacturing facility at three location, (a) Baroda in Gujarat, (b) Nagothane in Maharashtre, (C) Gandhar near
Bharuch in Gujarat.
8/2/2019 BILAL RT1001B49
http://slidepdf.com/reader/full/bilal-rt1001b49 3/43
GANDAHR COMPLEX
The discovery of large reserves of oil and gas in the Gandhar region has given the region a fillip through a large-scale industrial development.
Availability of raw materials like salt and access to a sea, besides hydrocarbon feed stock and good water sources in river Narmada offered
favorable environment for growth of industries in the region. A survey had estimated Oil and Gas reserve in the Gandhar basin at around 190
million tones out of which 73 million tones was said to be recoverable. This important discovery and abundance of salt in nearby places formed
the basis for IPCL's venture to set up an integrated gas cracker and a chlor alkali complex near Jageshwar village in Vagra taluka of Bharuch
district of Gujarat. Gandhar task force was constituted in 1989. Mr. Rajiv Gandhi, Prime Minister of India, laid the foundation stone for the
complex on October 6, 1989. The final investment clearance was granted on March 26, 1992. The special feature of this complex is that it has a
fully integrated
production of PVC starting from captive Chlorine and Ethylene with power drawn from a captive power plant. IPCL’s entry as a producer of
Caustic Soda, in synergy with fully integrated PVC plant, has provided an edge in the Caustic Soda and PVC business. Infrastructure
development was taken up in tandem with the development of the manufacturing facilities. Exploitation of waterfront for strategic advantage is a
unique proposition for any commodity business that has large volumes to handle liquid hydrocarbons inclusive of those at cryogenic
temperatures has been set up and commissioned in the estuary of Narmda at Jageshwar near Gandhar Complex. The jetty is about a quarter km
long and the water channel is seven to eight meters deep. This facilitates berthing of ship upto 8,000 DWT. The jetty was commissioned on
December, 2 1996, when the first ship carrying vinyl chloride arrived. IPCL has also networked its manufacturing facilities at Dahej and
Vadodara through three product pipelines. This has provided the opportunity to optimize capacity utilization at Vadodara and Gandhar and
source feed stocks and other raw materials at competitive price from international sources. The major handicap of land locked locations has been
overcome to a great extent in this way.
8/2/2019 BILAL RT1001B49
http://slidepdf.com/reader/full/bilal-rt1001b49 4/43
In the phase II, a gas cracker of 300,000 MTA of ethylene, 160,000 MTA of HDPE and 120,000 MTA of Ethylene Oxide/Glycol plants were
built. The second phase plants have been commissioned during accounting year 1999-2000. The last set of plants of the II
phase; gas cracker and C2/C3 separation unit were commissioned on February 10, 2000 (Vasant Panchmi). Flexibility to expand the cracker to
400,000 MTA of ethylene has also been built in during design stage. After addition of balancing equipment, this can also
be raised further, to 500,000 MTA of ethylene. Ethylene Oxide/Glycol plant capacity has been expanded to 150,000 MTA in Nov. 03. Further
capacity expansion work for CA, VCM, PVC, EO/EG and GCU plants are under progress.
(II) Energy Consumption:
Gandhar Complex energy consumption rate is approx. 43 Mt of Naphtha equivalent i.e.443 MMKCAL per hour.72 % of the total energy is
purchased energy and balance 28 % energy is met through fuel gas and Mixed Oil generated in process internally. Please find the in the page
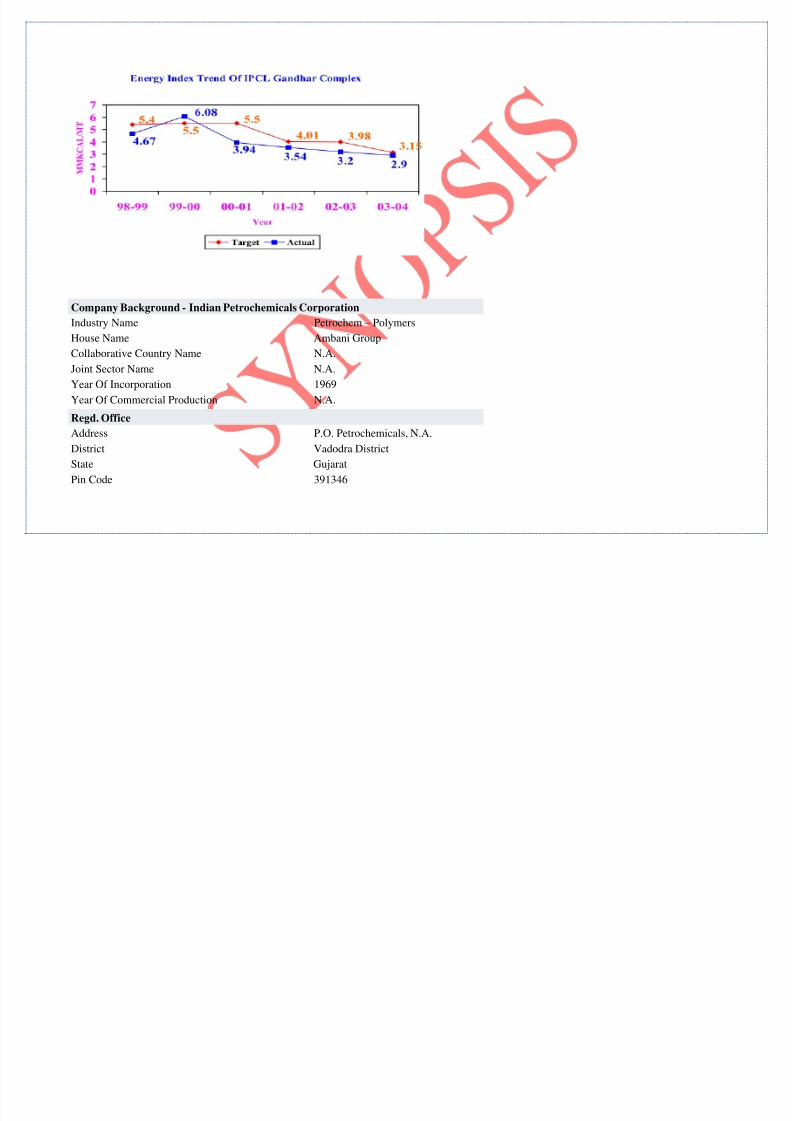
trend of energy consumption of Gandhar complex for the period of 98 – 99 to 2003-04.
Energy Cost as a Percentage of Manufacturing cost comes to Approx. 28.63
8/2/2019 BILAL RT1001B49
http://slidepdf.com/reader/full/bilal-rt1001b49 5/43
Company Background - Indian Petrochemicals Corporation
Industry Name Petrochem – Polymers
House Name Ambani Group
Collaborative Country Name N.A.
Joint Sector Name N.A.
Year Of Incorporation 1969
Year Of Commercial Production N.A.
Regd. Office
Address P.O. Petrochemicals, N.A.
District Vadodra District
State Gujarat
Pin Code 391346
8/2/2019 BILAL RT1001B49
http://slidepdf.com/reader/full/bilal-rt1001b49 6/43
Tel. No. 0265-6696000/7000
Fax No. 0265-6693834
Email : [email protected] Internet : http://www.ipcl.co.in
Company Facts - IPCL
Registered Address
P.O. Petrochemicals ,Vadodra District Gujarat 391346Tel: 0265-6696000/7000Fax: 0265-6693834Email: [email protected]
Website: http://www.ipcl.co.in
Group: Ambani Group
Explore IPCL connections
Registrars
8/2/2019 BILAL RT1001B49
http://slidepdf.com/reader/full/bilal-rt1001b49 7/43
Karvy Computershare Private Ltd "Karvy House"46, Avenue 4,Street No. 1,Banjara Hills
Tel: 23312454, 23320251/751/752Fax: 23311968Email: [email protected]
Website: http://www.karvy.com
Management - IPCL
PRODUCTS:-
Oxygen Scavenger Catalyst
Deltamike Specialty Products Pvt. Ltdsupplies Oxygen Scavenger Catalyst.Deltamike Spe...
Supplier : Deltamike Speciality ProductsPvt. Ltd.Active Raney Nickel Catalyst For
Hydrogenation
Vineeth Precious Catalysts Pvt. Ltdmanufactures Active Raney NickelCatalyst for Hydro...
Supplier : Vineeth Chemicals
Raney Copper Catalyst For Oxidation
Vineeth Precious Catalysts Pvt. Ltd offers
8/2/2019 BILAL RT1001B49
http://slidepdf.com/reader/full/bilal-rt1001b49 8/43
Raney Copper Catalyst for Oxidation.Vineeth...
Supplier : Vineeth ChemicalsRaney Copper Catalyst For Oxidation
Vineeth Precious Catalysts Pvt. Ltd offersRaney Copper Catalyst for Oxidation.Vineeth...
Supplier : Vineeth Chemicals
Raney Cobalt Catalyst For Selective
Hydrogenation
Vineeth Precious Catalysts Pvt. Ltdmanufactures Raney Cobalt Catalyst for
Selective Hy...
Supplier : Vineeth ChemicalsPalladium Based Activated Charcoal
Catalyst
Vineeth Precious Catalysts Pvt. Ltd offersPalladium Based Activated CharcoalCatalyst....
Supplier : Vineeth Chemicals
8/2/2019 BILAL RT1001B49
http://slidepdf.com/reader/full/bilal-rt1001b49 9/43
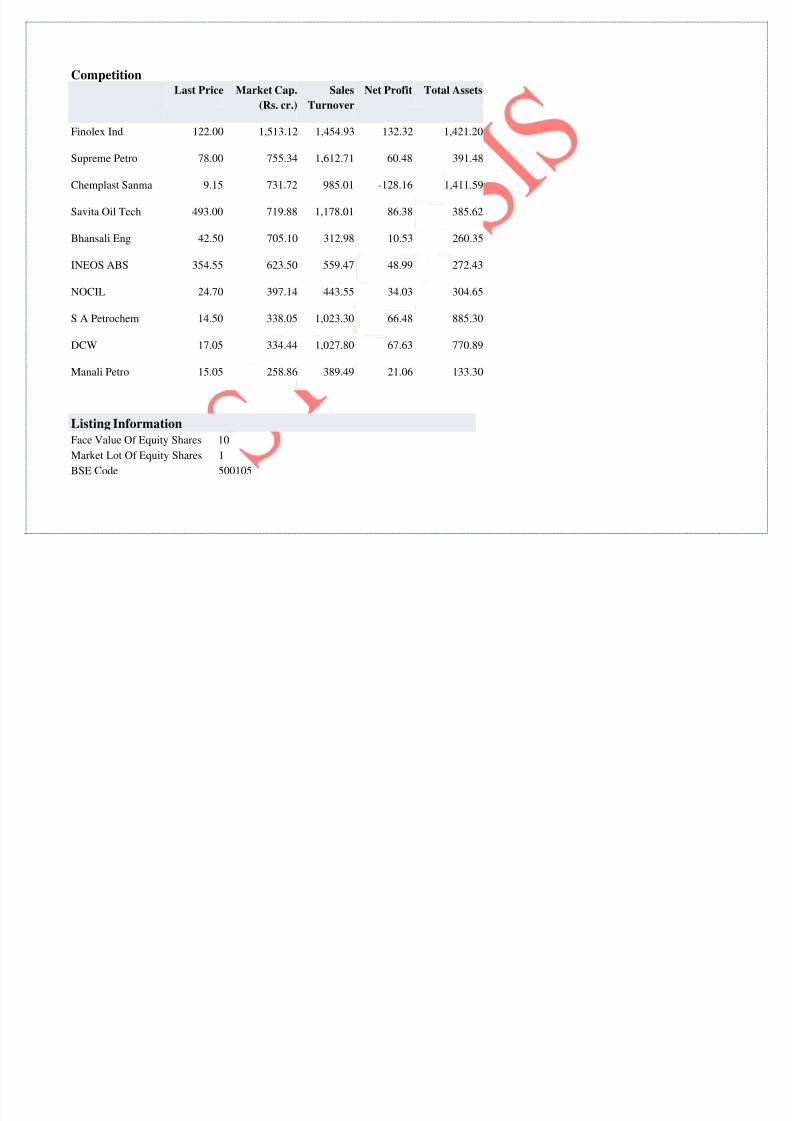
CompetitionLast Price Market Cap.
(Rs. cr.)
Sales
Turnover
Net Profit Total Assets
Finolex Ind 122.00 1,513.12 1,454.93 132.32 1,421.20
Supreme Petro 78.00 755.34 1,612.71 60.48 391.48
Chemplast Sanma 9.15 731.72 985.01 -128.16 1,411.59
Savita Oil Tech 493.00 719.88 1,178.01 86.38 385.62
Bhansali Eng 42.50 705.10 312.98 10.53 260.35
INEOS ABS 354.55 623.50 559.47 48.99 272.43
NOCIL 24.70 397.14 443.55 34.03 304.65
S A Petrochem 14.50 338.05 1,023.30 66.48 885.30
DCW 17.05 334.44 1,027.80 67.63 770.89
Manali Petro 15.05 258.86 389.49 21.06 133.30
Listing Information
Face Value Of Equity Shares 10
Market Lot Of Equity Shares 1
BSE Code 500105
8/2/2019 BILAL RT1001B49
http://slidepdf.com/reader/full/bilal-rt1001b49 10/43
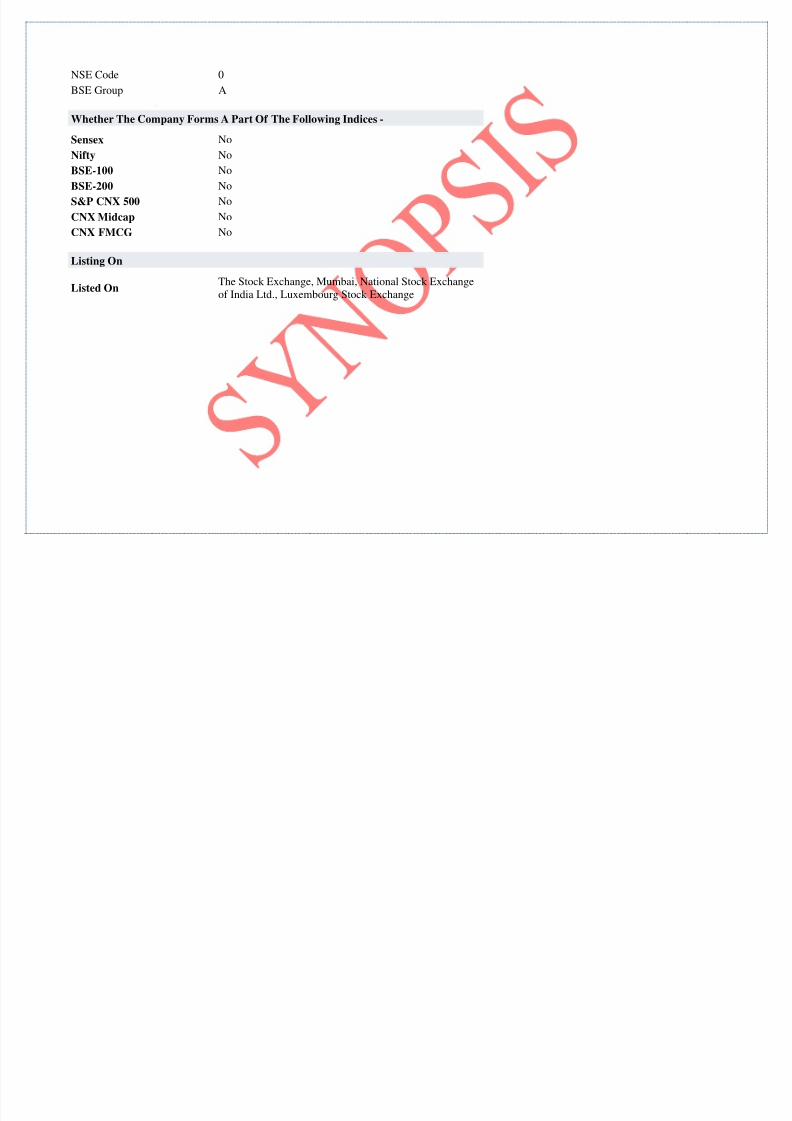
NSE Code 0
BSE Group A
Whether The Company Forms A Part Of The Following Indices -
Sensex NoNifty No
BSE-100 No
BSE-200 No
S&P CNX 500 No
CNX Midcap No
CNX FMCG No
Listing On
Listed OnThe Stock Exchange, Mumbai, National Stock Exchangeof India Ltd., Luxembourg Stock Exchange
8/2/2019 BILAL RT1001B49
http://slidepdf.com/reader/full/bilal-rt1001b49 11/43
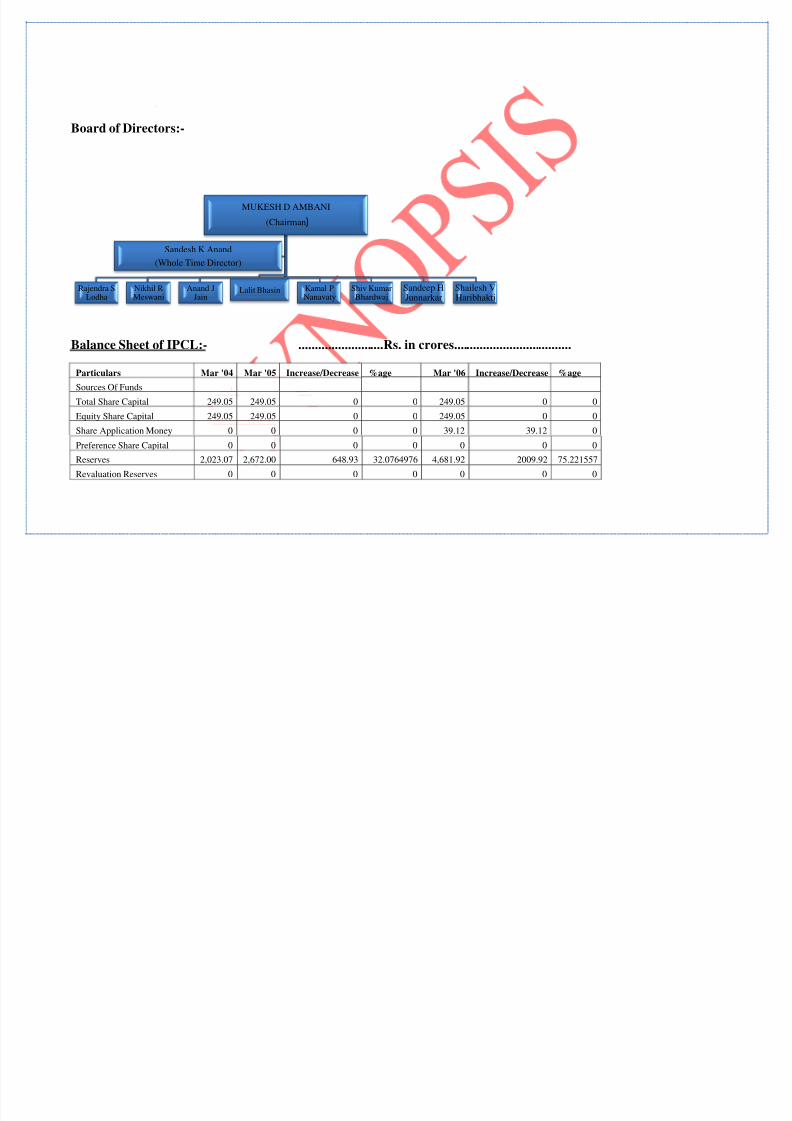
Board of Directors:-
Balance Sheet of IPCL:- ..........................Rs. in crores....................................
Particulars Mar '04 Mar '05 Increase/Decrease %age Mar '06 Increase/Decrease %age
Sources Of Funds
Total Share Capital 249.05 249.05 0 0 249.05 0 0
Equity Share Capital 249.05 249.05 0 0 249.05 0 0Share Application Money 0 0 0 0 39.12 39.12 0
Preference Share Capital 0 0 0 0 0 0 0
Reserves 2,023.07 2,672.00 648.93 32.0764976 4,681.92 2009.92 75.221557
Revaluation Reserves 0 0 0 0 0 0 0
MUKESH D AMBANI
(Chairman)
Rajendra SLodha
Nikhil RMeswani
Anand JJain
Lalit Bhasin Kamal PNanavaty
Shiv KumarBhardwaj
Sandeep HJunnarkar
Shailesh VHaribhakti
Sandesh K Anand
(Whole Time Director)
8/2/2019 BILAL RT1001B49
http://slidepdf.com/reader/full/bilal-rt1001b49 12/43
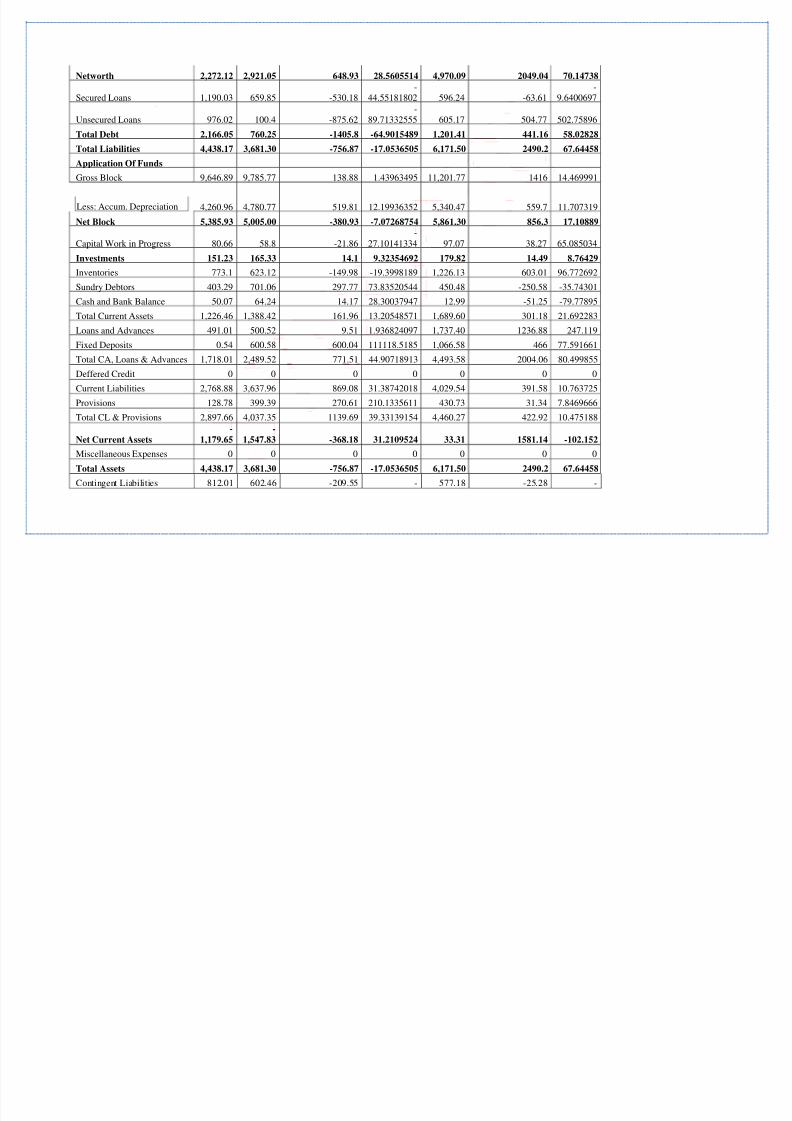
Networth 2,272.12 2,921.05 648.93 28.5605514 4,970.09 2049.04 70.14738
Secured Loans 1,190.03 659.85 -530.18-
44.55181802 596.24 -63.61-
9.6400697
Unsecured Loans 976.02 100.4 -875.62-
89.71332555 605.17 504.77 502.75896
Total Debt 2,166.05 760.25 -1405.8 -64.9015489 1,201.41 441.16 58.02828
Total Liabilities 4,438.17 3,681.30 -756.87 -17.0536505 6,171.50 2490.2 67.64458
Application Of Funds
Gross Block 9,646.89 9,785.77 138.88 1.43963495 11,201.77 1416 14.469991
Less: Accum. Depreciation 4,260.96 4,780.77 519.81 12.19936352 5,340.47 559.7 11.707319
Net Block 5,385.93 5,005.00 -380.93 -7.07268754 5,861.30 856.3 17.10889
Capital Work in Progress 80.66 58.8 -21.86-
27.10141334 97.07 38.27 65.085034
Investments 151.23 165.33 14.1 9.32354692 179.82 14.49 8.76429
Inventories 773.1 623.12 -149.98 -19.3998189 1,226.13 603.01 96.772692
Sundry Debtors 403.29 701.06 297.77 73.83520544 450.48 -250.58 -35.74301
Cash and Bank Balance 50.07 64.24 14.17 28.30037947 12.99 -51.25 -79.77895
Total Current Assets 1,226.46 1,388.42 161.96 13.20548571 1,689.60 301.18 21.692283
Loans and Advances 491.01 500.52 9.51 1.936824097 1,737.40 1236.88 247.119
Fixed Deposits 0.54 600.58 600.04 111118.5185 1,066.58 466 77.591661
Total CA, Loans & Advances 1,718.01 2,489.52 771.51 44.90718913 4,493.58 2004.06 80.499855
Deffered Credit 0 0 0 0 0 0 0
Current Liabilities 2,768.88 3,637.96 869.08 31.38742018 4,029.54 391.58 10.763725
Provisions 128.78 399.39 270.61 210.1335611 430.73 31.34 7.8469666
Total CL & Provisions 2,897.66 4,037.35 1139.69 39.33139154 4,460.27 422.92 10.475188
Net Current Assets
-
1,179.65
-
1,547.83 -368.18 31.2109524 33.31 1581.14 -102.152
Miscellaneous Expenses 0 0 0 0 0 0 0
Total Assets 4,438.17 3,681.30 -756.87 -17.0536505 6,171.50 2490.2 67.64458
Contingent Liabilities 812.01 602.46 -209.55 - 577.18 -25.28 -

8/2/2019 BILAL RT1001B49
http://slidepdf.com/reader/full/bilal-rt1001b49 13/43
25.80633243 4.1961292
Book Value (Rs) 91.53 117.68 26.15 28.5698678 198.65 80.97 68.805235
Comparative analysis of Balance Sheet of IPCL:-
Total Share Capital and Equity Share Capital is stable in all the three years.
Reserves increases from 32.08% in 2005 to 75.22% in 2006.
There is very much increase in Total Debts from 2005 to 2006 which is due to the increase in unsecured loans and decrease in secured
loans.
Investment has decreased from 9.32% in 2005 to 8.76% in 2006.
Inventories has increased from -19.39% in 2005 to 96.77% in 2006, this is due to the increase in work in progress.
Sundry Debtors has increased from 73.83% in 2005 to -35.74 % in 2006.
Cash and bank balance has also decreased from 28.30% to -79.77%.
Loans and advanced has very much increased, which means that company had borrowed very much from outsiders.
Profit and Loss Account of IPCL:- ..........................Rs. in crores....................................
Particulars Mar '04 Mar '05 Increase/Decrease %age Mar '06 Increase/Decrease %age
Income
Sales Turnover 9,080.46 9,470.40 389.94 4.29 12,372.52 2,902.12 30.64411218
Excise Duty 895.73 1,185.17 289.44 32.31 1,477.42 292.25 24.65890969
Net Sales 8,184.73 8,285.23 100.50 1.23 10,895.10 2,609.87 31.50027217
Other Income -59.28 -32.23 27.05 -45.63 127.51 159.74-
495.6251939
Stock Adjustments -129.59 2.92 132.51-
102.25 232.41 229.49 7859.246575
8/2/2019 BILAL RT1001B49
http://slidepdf.com/reader/full/bilal-rt1001b49 14/43
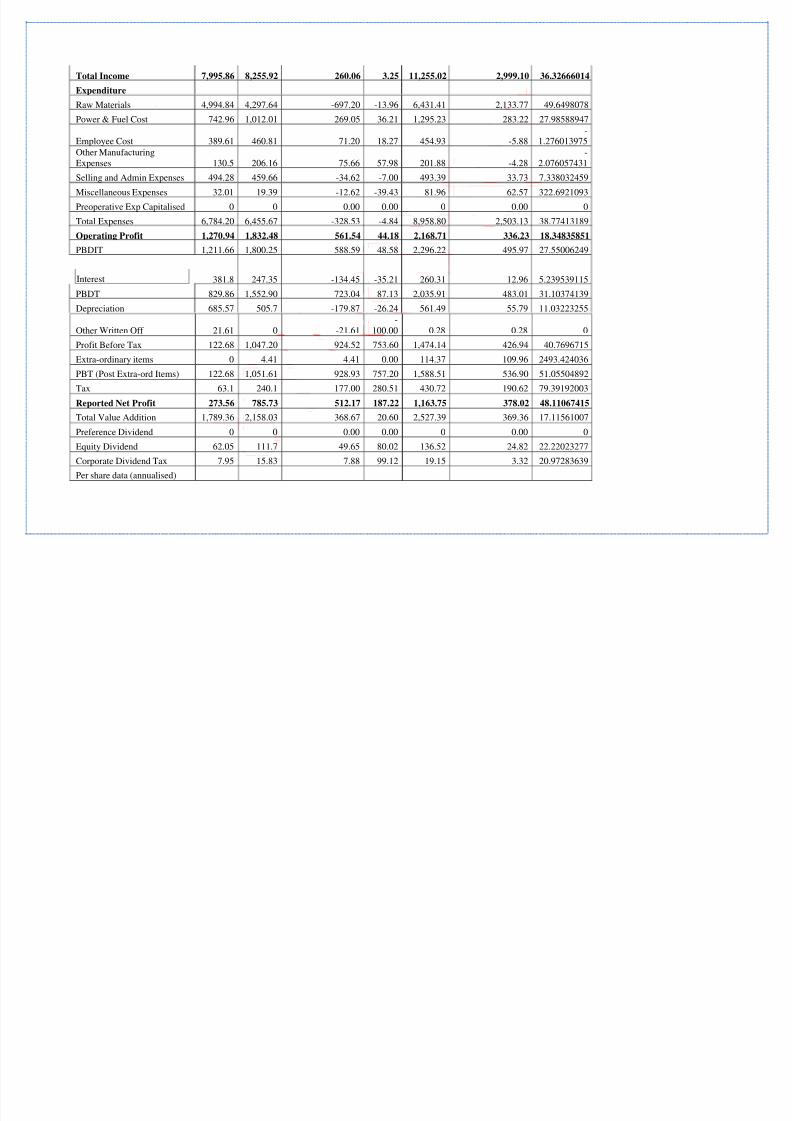
Total Income 7,995.86 8,255.92 260.06 3.25 11,255.02 2,999.10 36.32666014
Expenditure
Raw Materials 4,994.84 4,297.64 -697.20 -13.96 6,431.41 2,133.77 49.6498078
Power & Fuel Cost 742.96 1,012.01 269.05 36.21 1,295.23 283.22 27.98588947
Employee Cost 389.61 460.81 71.20 18.27 454.93 -5.88
-
1.276013975Other ManufacturingExpenses 130.5 206.16 75.66 57.98 201.88 -4.28
-2.076057431
Selling and Admin Expenses 494.28 459.66 -34.62 -7.00 493.39 33.73 7.338032459
Miscellaneous Expenses 32.01 19.39 -12.62 -39.43 81.96 62.57 322.6921093
Preoperative Exp Capitalised 0 0 0.00 0.00 0 0.00 0
Total Expenses 6,784.20 6,455.67 -328.53 -4.84 8,958.80 2,503.13 38.77413189
Operating Profit 1,270.94 1,832.48 561.54 44.18 2,168.71 336.23 18.34835851
PBDIT 1,211.66 1,800.25 588.59 48.58 2,296.22 495.97 27.55006249
Interest 381.8 247.35 -134.45 -35.21 260.31 12.96 5.239539115
PBDT 829.86 1,552.90 723.04 87.13 2,035.91 483.01 31.10374139
Depreciation 685.57 505.7 -179.87 -26.24 561.49 55.79 11.03223255
Other Written Off 21.61 0 -21.61-
100.00 0.28 0.28 0
Profit Before Tax 122.68 1,047.20 924.52 753.60 1,474.14 426.94 40.7696715
Extra-ordinary items 0 4.41 4.41 0.00 114.37 109.96 2493.424036
PBT (Post Extra-ord Items) 122.68 1,051.61 928.93 757.20 1,588.51 536.90 51.05504892
Tax 63.1 240.1 177.00 280.51 430.72 190.62 79.39192003
Reported Net Profit 273.56 785.73 512.17 187.22 1,163.75 378.02 48.11067415
Total Value Addition 1,789.36 2,158.03 368.67 20.60 2,527.39 369.36 17.11561007
Preference Dividend 0 0 0.00 0.00 0 0.00 0
Equity Dividend 62.05 111.7 49.65 80.02 136.52 24.82 22.22023277
Corporate Dividend Tax 7.95 15.83 7.88 99.12 19.15 3.32 20.97283639
Per share data (annualised)
8/2/2019 BILAL RT1001B49
http://slidepdf.com/reader/full/bilal-rt1001b49 15/43
Shares in issue (lakhs) 2,482.26 2,482.26 0.00 0.00 2,482.26 0.00 0
Earning Per Share (Rs) 11.02 31.65 20.63 187.21 46.88 15.23 48.12006319
Equity Dividend (%) 25 45 20.00 80.00 55 10.00 22.22222222
Book Value (Rs) 91.53 117.68 26.15 28.57 198.65 80.97 68.80523453
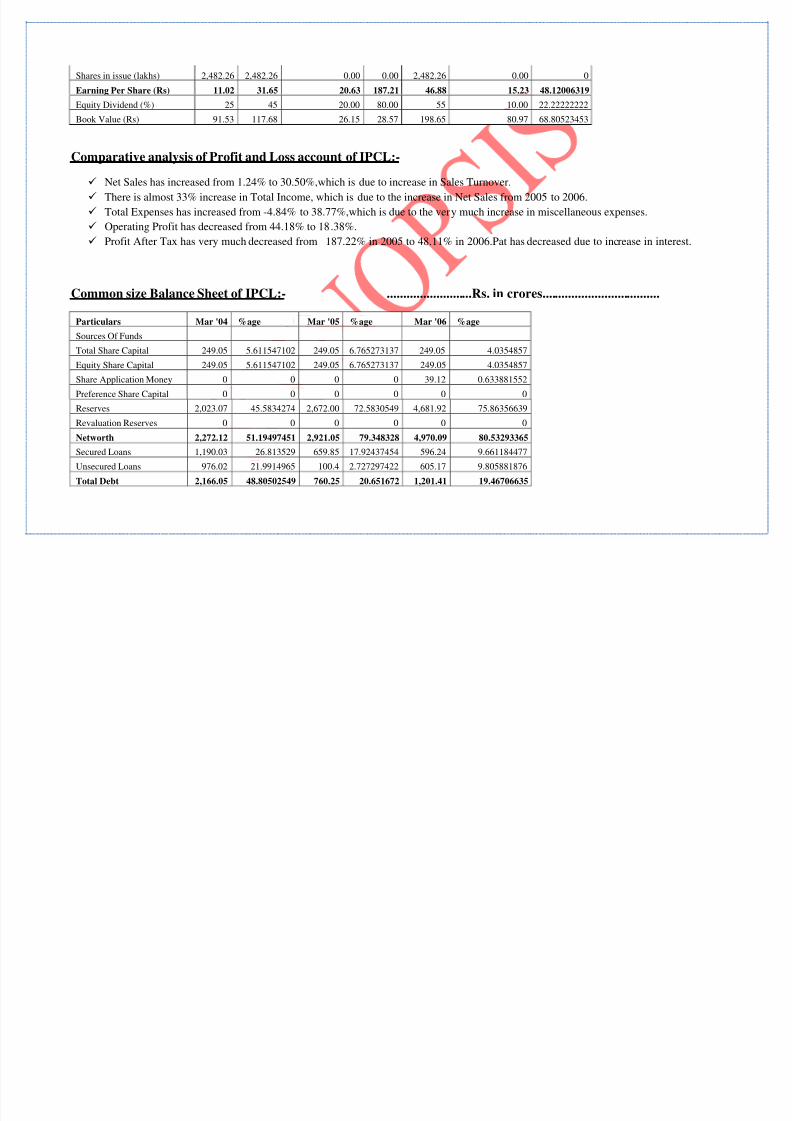
Comparative analysis of Profit and Loss account of IPCL:-
Net Sales has increased from 1.24% to 30.50%,which is due to increase in Sales Turnover.
There is almost 33% increase in Total Income, which is due to the increase in Net Sales from 2005 to 2006.
Total Expenses has increased from -4.84% to 38.77%,which is due to the very much increase in miscellaneous expenses.
Operating Profit has decreased from 44.18% to 18.38%.
Profit After Tax has very much decreased from 187.22% in 2005 to 48.11% in 2006.Pat has decreased due to increase in interest.
Common size Balance Sheet of IPCL:- ..........................Rs. in crores....................................
Particulars Mar '04 %age Mar '05 %age Mar '06 %age
Sources Of Funds
Total Share Capital 249.05 5.611547102 249.05 6.765273137 249.05 4.0354857
Equity Share Capital 249.05 5.611547102 249.05 6.765273137 249.05 4.0354857
Share Application Money 0 0 0 0 39.12 0.633881552
Preference Share Capital 0 0 0 0 0 0
Reserves 2,023.07 45.5834274 2,672.00 72.5830549 4,681.92 75.86356639
Revaluation Reserves 0 0 0 0 0 0
Networth 2,272.12 51.19497451 2,921.05 79.348328 4,970.09 80.53293365
Secured Loans 1,190.03 26.813529 659.85 17.92437454 596.24 9.661184477
Unsecured Loans 976.02 21.9914965 100.4 2.727297422 605.17 9.805881876
Total Debt 2,166.05 48.80502549 760.25 20.651672 1,201.41 19.46706635

8/2/2019 BILAL RT1001B49
http://slidepdf.com/reader/full/bilal-rt1001b49 16/43
Total Liabilities 4,438.17 100 3,681.30 100 6,171.50 100
Application Of Funds
Gross Block 9,646.89 217.3618856 9,785.77 265.8237579 11,201.77 181.5080612
Less: Accum. Depreciation 4,260.9696.0071380
4,780.77 129.8663516 5,340.47 86.53439196
Net Block 5,385.93 121.3547476 5,005.00 #DIV/0! 5,861.30 94.97366929
Capital Work in Progress 80.66 1.817415737 58.8 1.597261837 97.07 1.572875314
Investments 151.23 3.407485518 165.33 4.49107652 179.82 2.913716276
Inventories 773.1 17.41934176 623.12 16.92662918 1,226.13 19.86761727
Sundry Debtors 403.29 9.086853365 701.06 19.04381604 450.48 7.299359961
Cash and Bank Balance 50.07 1.128167691 64.24 1.745035721 12.99 0.210483675
Total Current Assets 1,226.46 27.63436281 1,388.42 37.71548094 1,689.60 27.37746091
Loans and Advances 491.01 11.06334368 500.52 13.59628392 1,737.40 28.15198898
Fixed Deposits 0.54 0.012167177 600.58 16.31434548 1,066.58 17.28234627
Total CA, Loans &Advances 1,718.01 38.70987366 2,489.52 67.62611034 4,493.58 72.81179616
Deffered Credit 0 0 0 0 0 0
Current Liabilities 2,768.88 62.38787608 3,637.96 #DIV/0! 4,029.54 65.29271652
Provisions 128.78 2.901646399 399.39 10.84915655 430.73 6.979340517
Total CL & Provisions 2,897.66 65.28952248 4,037.35 109.6718551 4,460.27 72.27205704
Net Current Assets
-
1,179.65 -26.57964882
-
1,547.83 -42.0457447 33.31 0.539739123
Miscellaneous Expenses 0 0 0 0 0 0
Total Assets 4,438.17 100 3,681.30 100 6,171.50 100
Contingent Liabilities 812.01 18.29605445 602.46 16.36541439 577.18 9.352345459
Book Value (Rs) 91.53 2.062336504 117.68 3.196696819 198.65 3.218828486
ANALYSIS:-
8/2/2019 BILAL RT1001B49
http://slidepdf.com/reader/full/bilal-rt1001b49 17/43
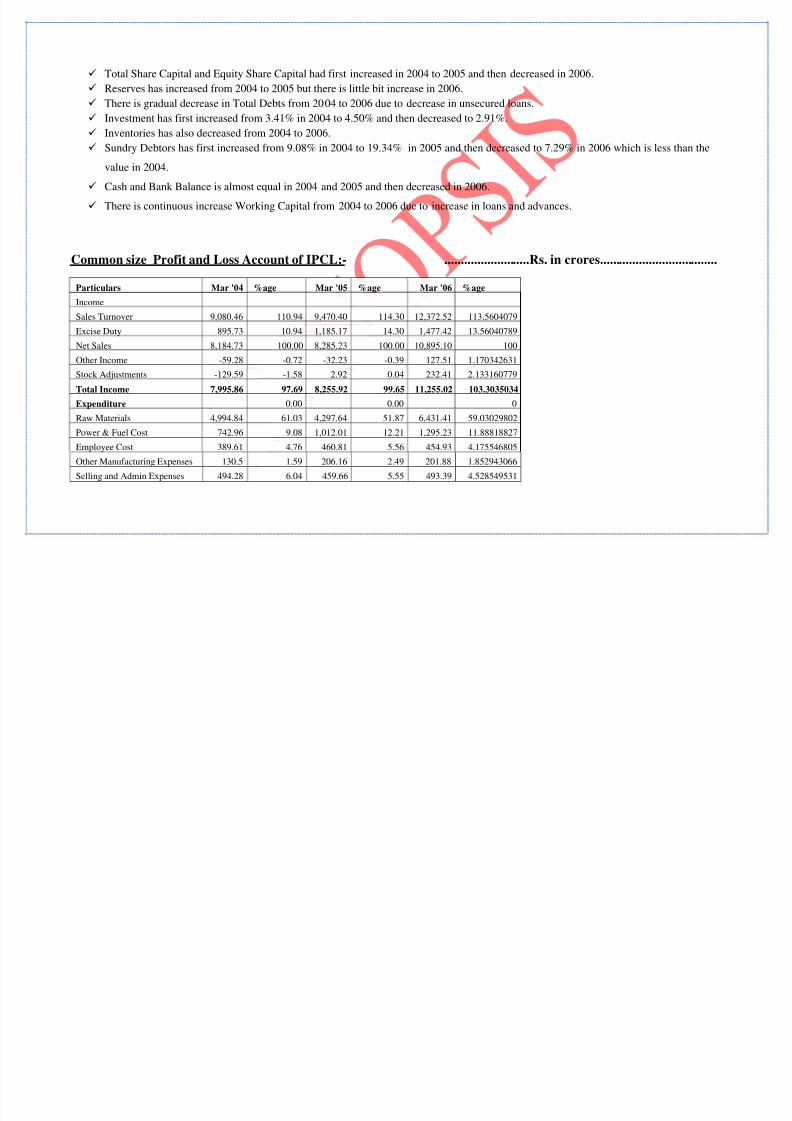
Total Share Capital and Equity Share Capital had first increased in 2004 to 2005 and then decreased in 2006.
Reserves has increased from 2004 to 2005 but there is little bit increase in 2006.
There is gradual decrease in Total Debts from 2004 to 2006 due to decrease in unsecured loans.
Investment has first increased from 3.41% in 2004 to 4.50% and then decreased to 2.91%.
Inventories has also decreased from 2004 to 2006.
Sundry Debtors has first increased from 9.08% in 2004 to 19.34% in 2005 and then decreased to 7.29% in 2006 which is less than the
value in 2004.
Cash and Bank Balance is almost equal in 2004 and 2005 and then decreased in 2006.
There is continuous increase Working Capital from 2004 to 2006 due to increase in loans and advances.
Common size Profit and Loss Account of IPCL:- ..........................Rs. in crores....................................
Particulars Mar '04 %age Mar '05 %age Mar '06 %age
Income
Sales Turnover 9,080.46 110.94 9,470.40 114.30 12,372.52 113.5604079
Excise Duty 895.73 10.94 1,185.17 14.30 1,477.42 13.56040789
Net Sales 8,184.73 100.00 8,285.23 100.00 10,895.10 100
Other Income -59.28 -0.72 -32.23 -0.39 127.51 1.170342631
Stock Adjustments -129.59 -1.58 2.92 0.04 232.41 2.133160779
Total Income 7,995.86 97.69 8,255.92 99.65 11,255.02 103.3035034
Expenditure 0.00 0.00 0
Raw Materials 4,994.84 61.03 4,297.64 51.87 6,431.41 59.03029802
Power & Fuel Cost 742.96 9.08 1,012.01 12.21 1,295.23 11.88818827
Employee Cost 389.61 4.76 460.81 5.56 454.93 4.175546805
Other Manufacturing Expenses 130.5 1.59 206.16 2.49 201.88 1.852943066
Selling and Admin Expenses 494.28 6.04 459.66 5.55 493.39 4.528549531
8/2/2019 BILAL RT1001B49
http://slidepdf.com/reader/full/bilal-rt1001b49 18/43
Miscellaneous Expenses 32.01 0.39 19.39 0.23 81.96 0.75226478
Preoperative Exp Capitalised 0 0.00 0 0.00 0 0
Total Expenses 6,784.20 82.89 6,455.67 77.92 8,958.80 82.22779047
Operating Profit 1,270.94 15.53 1,832.48 22.12 2,168.71 19.9053703
PBDIT 1,211.66 14.80 1,800.25 21.73 2,296.22 21.07571294
Interest 381.8 4.66 247.35 2.99 260.31 2.389239199
PBDT 829.86 10.14 1,552.90 18.74 2,035.91 18.68647374
Depreciation 685.57 8.38 505.7 6.10 561.49 5.15360116
Other Written Off 21.61 0.26 0 0.00 0.28 0.002569963
Profit Before Tax 122.68 1.50 1,047.20 12.64 1,474.14 13.53030261
Extra-ordinary items 0 0.00 4.41 0.05 114.37 1.049737956
PBT (Post Extra-ord Items) 122.68 1.50 1,051.61 12.69 1,588.51 14.58004057
Tax 63.1 0.77 240.1 2.90 430.72 3.953336821
Reported Net Profit 273.56 3.34 785.73 9.48 1,163.75 10.68140724
Total Value Addition 1,789.36 21.86 2,158.03 26.05 2,527.39 23.19749245
Preference Dividend 0 0.00 0 0.00 0 0
Equity Dividend 62.05 0.76 111.7 1.35 136.52 1.253040358
Corporate Dividend Tax 7.95 0.10 15.83 0.19 19.15 0.175767088
Per share data (annualised)
Shares in issue (lakhs) 2,482.26 30.33 2,482.26 29.96 2,482.26 22.78326954
Earning Per Share (Rs) 11.02 0.13 31.65 0.38 46.88 0.430285174
Equity Dividend (%) 25 0.31 45 0.54 55 0.504814091
Book Value (Rs) 91.53 1.12 117.68 1.42 198.65 1.823296711
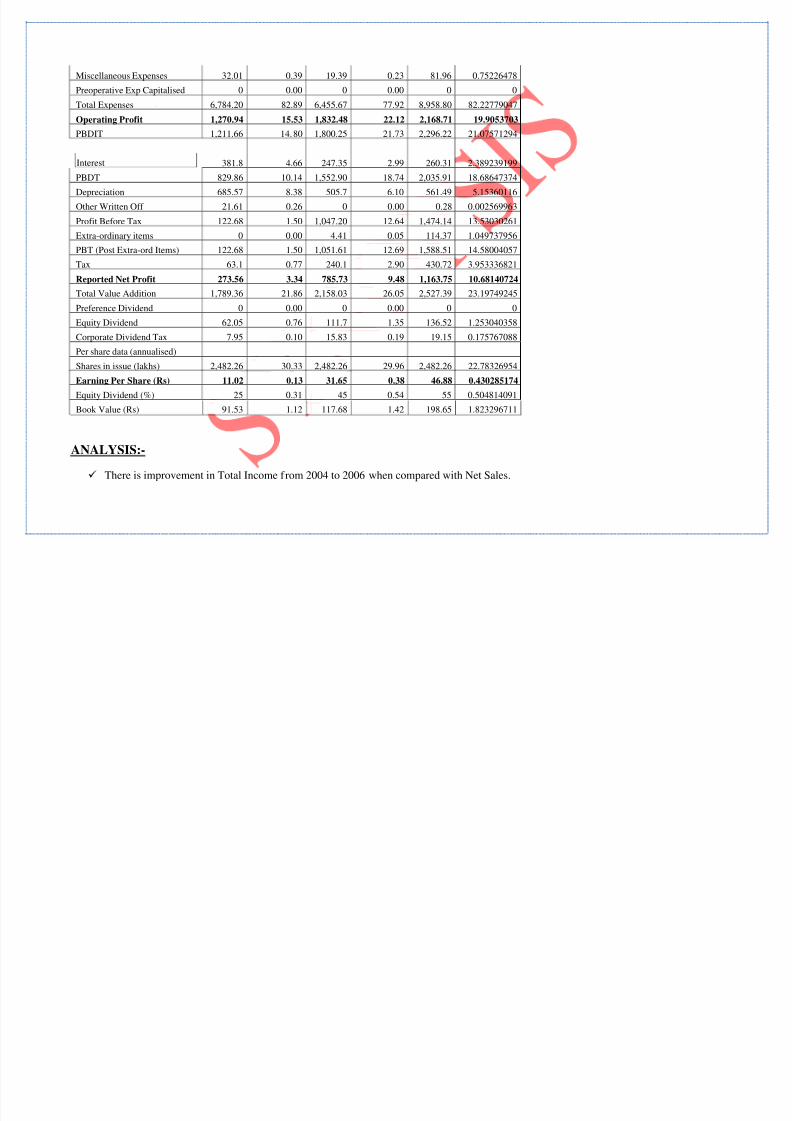
ANALYSIS:-
There is improvement in Total Income from 2004 to 2006 when compared with Net Sales.

8/2/2019 BILAL RT1001B49
http://slidepdf.com/reader/full/bilal-rt1001b49 19/43
Total Expenses are lesser than Net Sales,this is due to the continuous decrease in raw-materials expenses, employee cost, selling and
distribution cost etc.
Operating Profit first increases from 2004 to 2005 and then decreases in 2006 but it ai very much less than Net Sales.
No doubt Profit After Tax is showing increasing trend but it is very much less than Net Sales.
Balance Sheet of IPCL:- ..........................Rs. in crores....................................
Particulars Mar '04 Mar '05 Mar '06
Sources Of Funds
Total Share Capital 249.05 100 249.05 100 249.05 100
Equity Share Capital 249.05 100 249.05 100 249.05 100
Share Application Money 0 0 0 0 39.12 0
Preference Share Capital 0 0 0 0 0 0
Reserves 2,023.07 100 2,672.00 132.0765 4,681.92 231.4265
Revaluation Reserves 0 0 0 0 0 0
Networth 2,272.12 100 2,921.05 128.56055 4,970.09 218.74241
Secured Loans 1,190.03 100 659.85 55.448182 596.24 50.102939
Unsecured Loans 976.02 100 100.4 10.286674 605.17 62.003852
Total Debt 2,166.05 100 760.25 35.09845 1,201.41 55.46548
Total Liabilities 4,438.17 100 3,681.30 82.94635 6,171.50 139.0551
Application Of Funds
Gross Block 9,646.89 100 9,785.77 101.43963 11,201.77 116.11794
Less: Accum. Depreciation 4,260.96 100 4,780.77 112.19936 5,340.47 125.3349
Net Block 5,385.93 100 5,005.00 92.92731 5,861.30 108.8261
Capital Work in Progress 80.66 100 58.8 72.898587 97.07 120.34466
Investments 151.23 100 165.33 109.3235 179.82 118.905
8/2/2019 BILAL RT1001B49
http://slidepdf.com/reader/full/bilal-rt1001b49 20/43
Inventories 773.1 100 623.12 80.600181 1,226.13 158.59915
Sundry Debtors 403.29 100 701.06 173.83521 450.48 111.70126
Cash and Bank Balance 50.07 100 64.24 128.30038 12.99 25.943679
Total Current Assets 1,226.46 100 1,388.42 113.20549 1,689.60 137.76234
Loans and Advances 491.01 100 500.52 101.93682 1,737.40 353.84208
Fixed Deposits 0.54 100 600.58 111218.52 1,066.58 197514.81
Total CA, Loans & Advances 1,718.01 100 2,489.52 144.90719 4,493.58 261.55727
Deffered Credit 0 0 0 0 0 0
Current Liabilities 2,768.88 100 3,637.96 131.38742 4,029.54 145.5296
Provisions 128.78 100 399.39 310.13356 430.73 334.46964
Total CL & Provisions 2,897.66 100 4,037.35 139.33139 4,460.27 153.92662
Net Current Assets
-
1,179.65 100
-
1,547.83 131.211 33.31 -2.82372
Miscellaneous Expenses 0 0 0 0 0 0
Total Assets 4,438.17 100 3,681.30 82.94635 6,171.50 139.0551
Contingent Liabilities 812.01 100 602.46 74.193668 577.18 71.080405
Book Value (Rs) 91.53 100 117.68 128.56987 198.65 217.03267
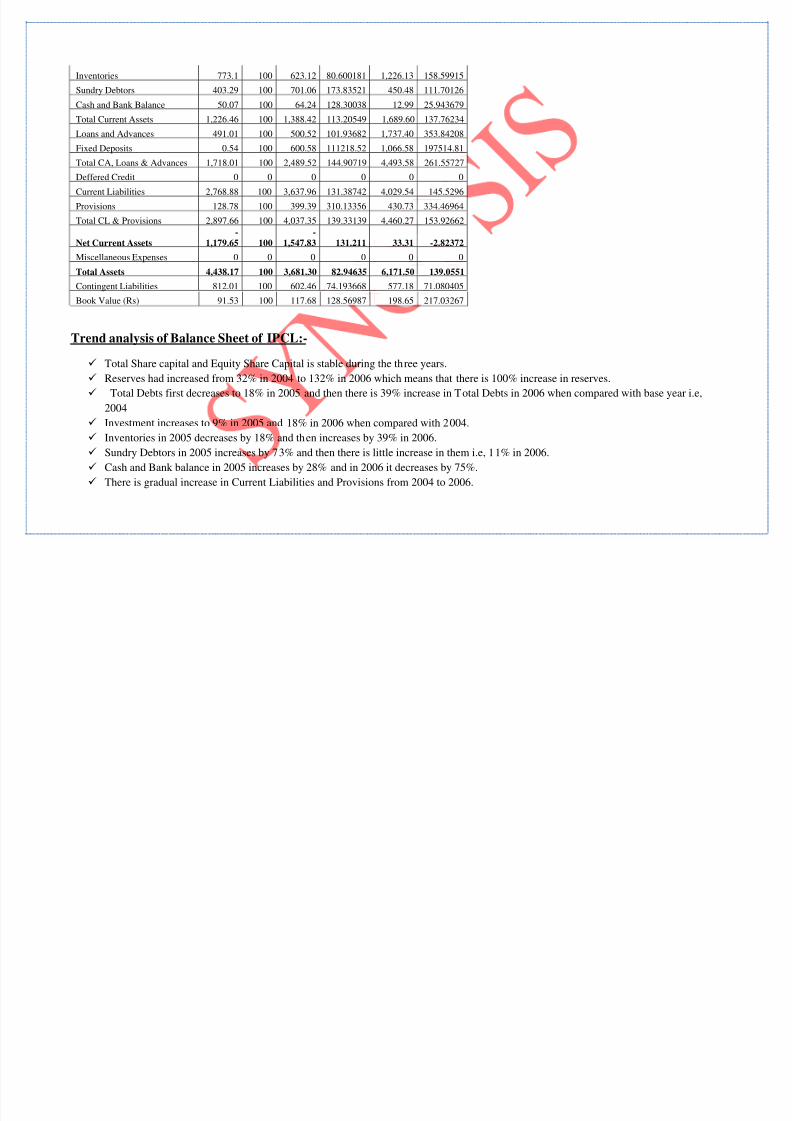
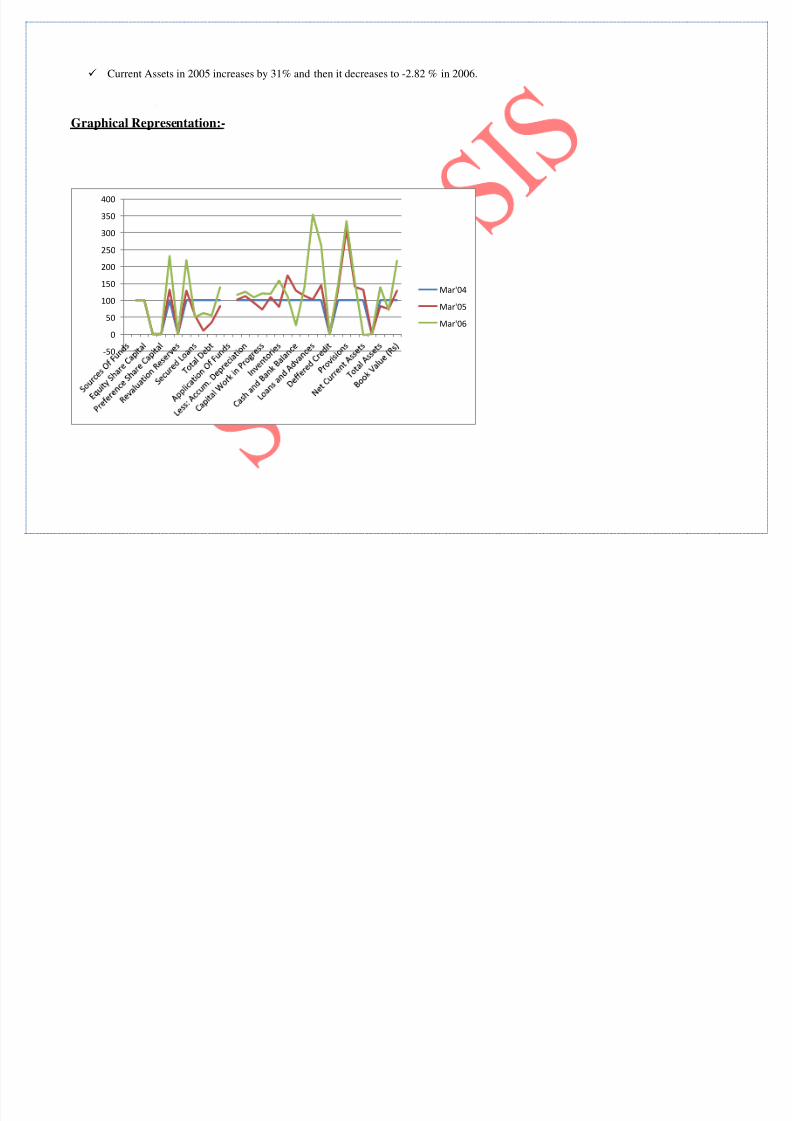
Trend analysis of Balance Sheet of IPCL:-
Total Share capital and Equity Share Capital is stable during the three years.
Reserves had increased from 32% in 2004 to 132% in 2006 which means that there is 100% increase in reserves.
Total Debts first decreases to 18% in 2005 and then there is 39% increase in Total Debts in 2006 when compared with base year i.e,
2004
Investment increases to 9% in 2005 and 18% in 2006 when compared with 2004.
Inventories in 2005 decreases by 18% and then increases by 39% in 2006.
Sundry Debtors in 2005 increases by 73% and then there is little increase in them i.e, 11% in 2006.
Cash and Bank balance in 2005 increases by 28% and in 2006 it decreases by 75%.
There is gradual increase in Current Liabilities and Provisions from 2004 to 2006.
8/2/2019 BILAL RT1001B49
http://slidepdf.com/reader/full/bilal-rt1001b49 21/43
Current Assets in 2005 increases by 31% and then it decreases to -2.82 % in 2006.
Graphical Representation:-
-50
0
50
100
150
200
250
300
350
400
Mar'04
Mar'05
Mar'06

8/2/2019 BILAL RT1001B49
http://slidepdf.com/reader/full/bilal-rt1001b49 22/43
Profit and Loss account of IPCL:-
Particulars Mar '04 Mar '05 Mar '06
Income
Sales Turnover 9,080.46 100.00 9,470.40 104.29 12,372.52 136.25433
Excise Duty 895.73 100.00 1,185.17 132.31 1,477.42 164.94033
Net Sales 8,184.73 100.00 8,285.23 101.23 10,895.10 133.11496
Other Income -59.28 100.00 -32.23 54.37 127.51-
215.09784
Stock Adjustments -129.59 100.00 2.92 -2.25 232.41-
179.34254
Total Income 7,995.86 100.00 8,255.92 103.25 11,255.02 140.7606
Expenditure
Raw Materials 4,994.84 100.00 4,297.64 86.04 6,431.41 128.76108
Power & Fuel Cost 742.96 100.00 1,012.01 136.21 1,295.23 174.33375
Employee Cost 389.61 100.00 460.81 118.27 454.93 116.76548
Other Manufacturing Expenses 130.5 100.00 206.16 157.98 201.88 154.69732
Selling and Admin Expenses 494.28 100.00 459.66 93.00 493.39 99.81994
Miscellaneous Expenses 32.01 100.00 19.39 60.57 81.96 256.04499
Preoperative Exp Capitalised 0 0.00 0 0.00 0 0
Total Expenses 6,784.20 100.00 6,455.67 95.16 8,958.80 132.05389
Operating Profit 1,270.94 100.00 1,832.48 144.18 2,168.71 170.6383PBDIT 1,211.66 100.00 1,800.25 148.58 2,296.22 189.51026
Interest 381.8 100.00 247.35 64.79 260.31 68.179675
PBDT 829.86 100.00 1,552.90 187.13 2,035.91 245.33174
8/2/2019 BILAL RT1001B49
http://slidepdf.com/reader/full/bilal-rt1001b49 23/43
Depreciation 685.57 100.00 505.7 73.76 561.49 81.901192
Other Written Off 21.61 100.00 0 0.00 0.28 1.2956964
Profit Before Tax 122.68 100.00 1,047.20 853.60 1,474.14 1201.614
Extra-ordinary items 0 0.00 4.41 0.00 114.37 0
PBT (Post Extra-ord Items) 122.68 100.00 1,051.61 857.20 1,588.51 1294.8402
Tax 63.1 100.00 240.1 380.51 430.72 682.59905
Reported Net Profit 273.56 100.00 785.73 287.22 1,163.75 425.4094
Total Value Addition 1,789.36 100.00 2,158.03 120.60 2,527.39 141.24547
Preference Dividend 0 0 0.00 0 0
Equity Dividend 62.05 100.00 111.7 180.02 136.52 220.01612
Corporate Dividend Tax 7.95 100.00 15.83 199.12 19.15 240.8805
Per share data (annualised)
Shares in issue (lakhs) 2,482.26 100.00 2,482.26 100.00 2,482.26 100
Earning Per Share (Rs) 11.02 100.00 31.65 287.21 46.88 425.4083
Equity Dividend (%) 25 100.00 45 180.00 55 220Book Value (Rs) 91.53 100.00 117.68 128.57 198.65 217.03267
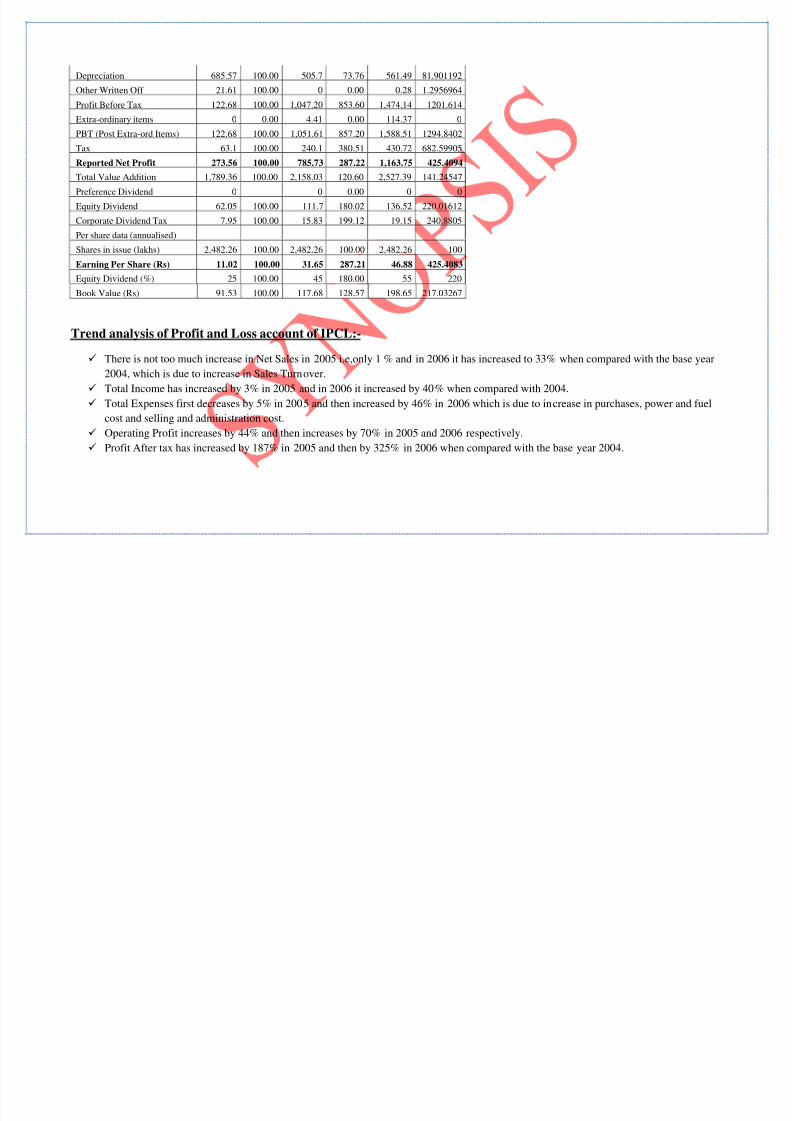
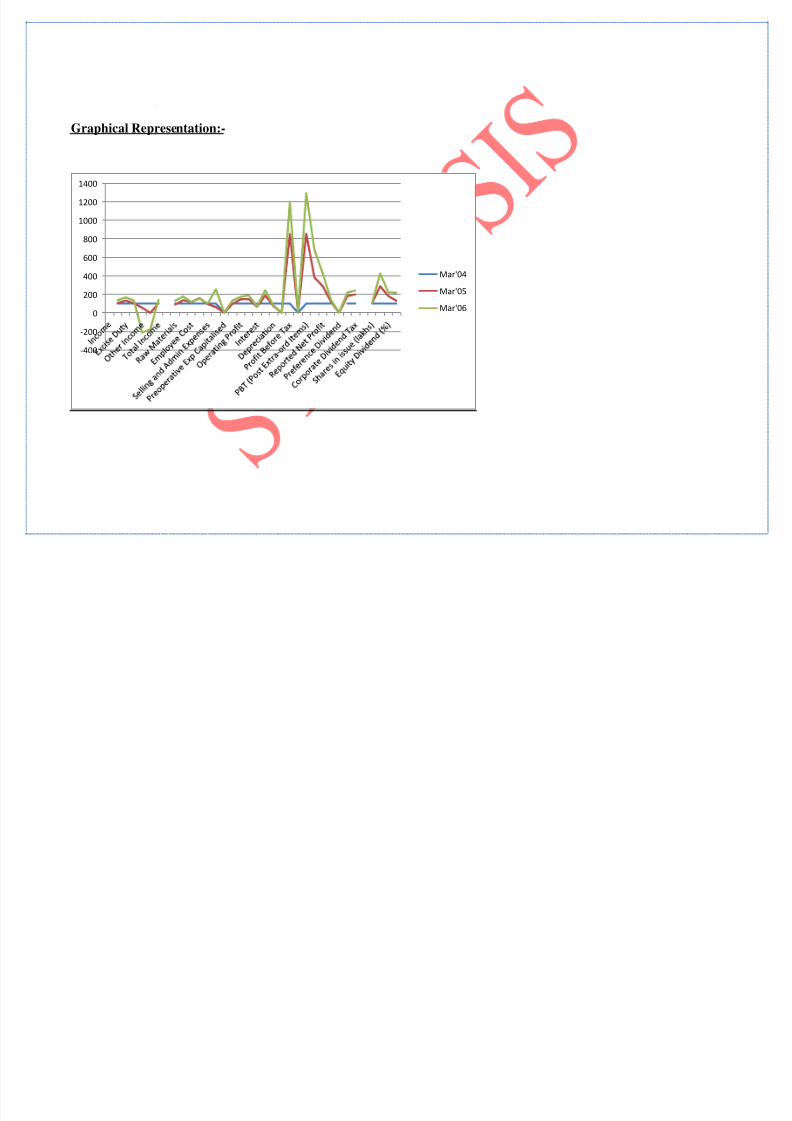
Trend analysis of Profit and Loss account of IPCL:-
There is not too much increase in Net Sales in 2005 i.e,only 1 % and in 2006 it has increased to 33% when compared with the base year
2004, which is due to increase in Sales Turnover.
Total Income has increased by 3% in 2005 and in 2006 it increased by 40% when compared with 2004.
Total Expenses first decreases by 5% in 2005 and then increased by 46% in 2006 which is due to increase in purchases, power and fuel
cost and selling and administration cost. Operating Profit increases by 44% and then increases by 70% in 2005 and 2006 respectively.
Profit After tax has increased by 187% in 2005 and then by 325% in 2006 when compared with the base year 2004.
8/2/2019 BILAL RT1001B49
http://slidepdf.com/reader/full/bilal-rt1001b49 24/43
Graphical Representation:-
-400
-200
0
200
400
600
800
1000
1200
1400
Mar'04
Mar'05
Mar'06
8/2/2019 BILAL RT1001B49
http://slidepdf.com/reader/full/bilal-rt1001b49 25/43
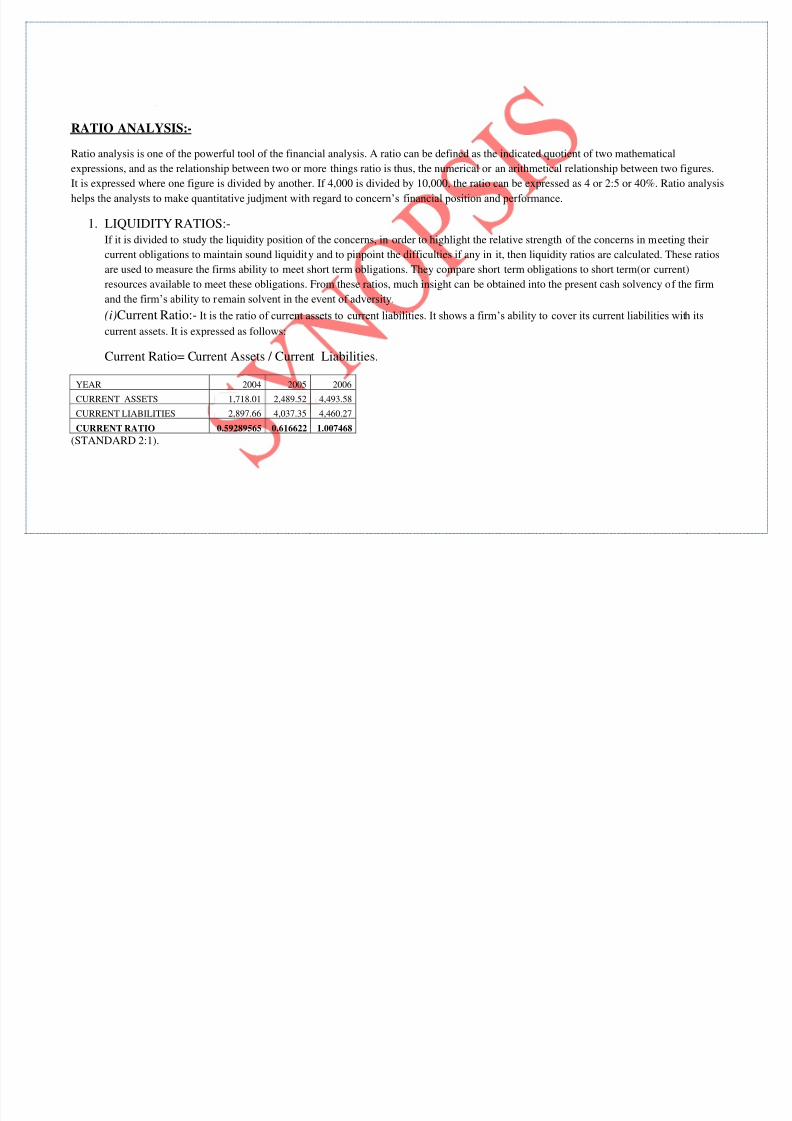
RATIO ANALYSIS:-
Ratio analysis is one of the powerful tool of the financial analysis. A ratio can be defined as the indicated quotient of two mathematical
expressions, and as the relationship between two or more things ratio is thus, the numerical or an arithmetical relationship between two figures.
It is expressed where one figure is divided by another. If 4,000 is divided by 10,000, the ratio can be expressed as 4 or 2:5 or 40%. Ratio analysis
helps the analysts to make quantitative judjment with regard to concern’s financial position and performance.
1. LIQUIDITY RATIOS:-If it is divided to study the liquidity position of the concerns, in order to highlight the relative strength of the concerns in meeting their
current obligations to maintain sound liquidity and to pinpoint the difficulties if any in it, then liquidity ratios are calculated. These ratios
are used to measure the firms ability to meet short term obligations. They compare short term obligations to short term(or current)
resources available to meet these obligations. From these ratios, much insight can be obtained into the present cash solvency of the firm
and the firm’s ability to remain solvent in the event of adversity.
(i)Current Ratio:- It is the ratio of current assets to current liabilities. It shows a firm’s ability to cover its current liabilities with its
current assets. It is expressed as follows:
Current Ratio= Current Assets / Current Liabilities.
YEAR 2004 2005 2006
CURRENT ASSETS 1,718.01 2,489.52 4,493.58
CURRENT LIABILITIES 2,897.66 4,037.35 4,460.27CURRENT RATIO 0.59289565 0.616622 1.007468
(STANDARD 2:1).

8/2/2019 BILAL RT1001B49
http://slidepdf.com/reader/full/bilal-rt1001b49 26/43
(ii)Quick Ratio:-This is the ratio of liquid assets to current liabilities. It shows firm’s ability to meet current liabilities with its most quick
(liquid) assets, 1:1 ratio is considered ideal ratio for a concern because it is wise to keep the quick or liquid assets equal at least equal to the
current or liquid liabilities at all times. It is calculated as under:
Quick Ratio Or Acid Test Ratio= Quick Assets/Current Liabilities.
Quick Assets = Current Assets – Prepaid Expenses – Inventory.
YEAR 2004 2005 2006
CURRENT ASSETS 1,718.01 2,489.52 4,493.58
(-)INVEVTORY 773.1 623.12 1,226.13
QUICK ASSETS 944.91 1,866.40 3,267.45
CURRENT LIABILITIES 2,897.66 4,037.35 4,460.27
QUICK RATIO 0.32609416 0.462283 0.732568
(STANDARD 1:1).
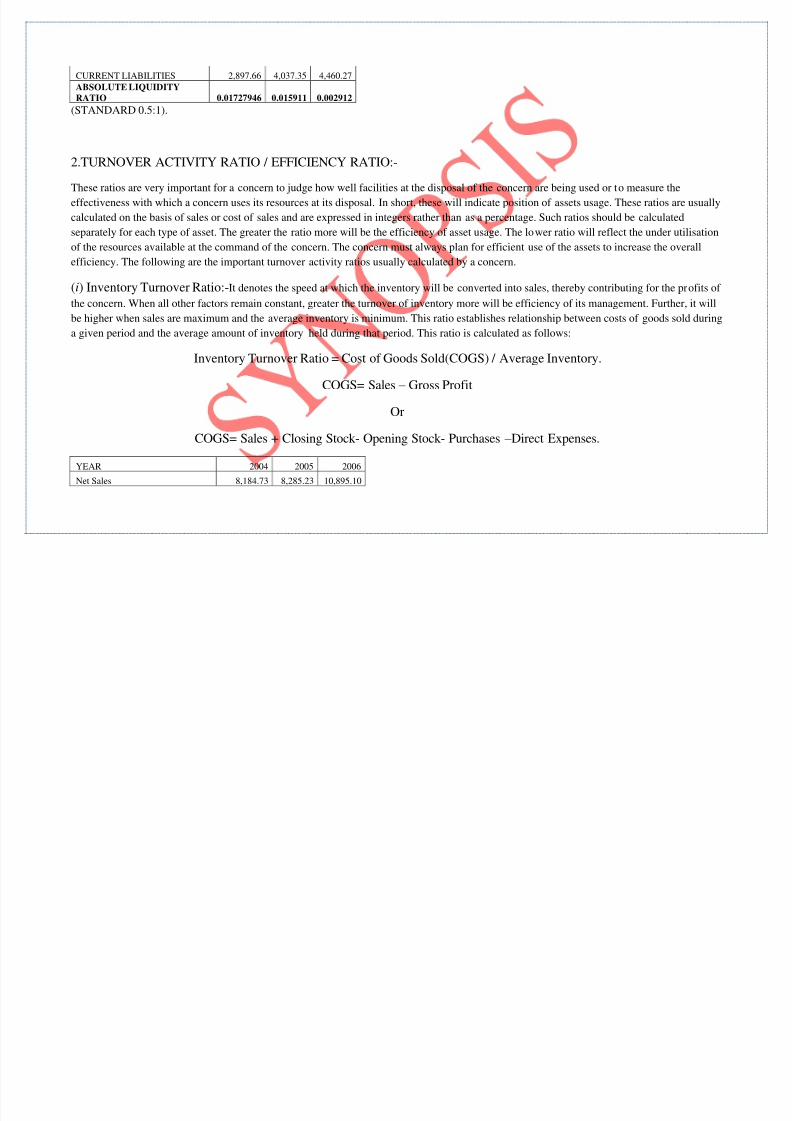
(iii)ABSOLUTE LIQUIDITY (OR SUPER QUICK) RATIO :- Though receivables are generally more liquid than inventories, there
may be debts having doubt regarding their real stability in time. So to get idea about the absolute liquid of concern, both receivables and
inventories are excluded from current assets and only absolute liquid assets, such as cash in hand, cash at bank and readily realisable securities
are taken into consideration. Absolute liquidity ratio is calculated as follows:
ABSOLUTE LIQUIDITY RATIO = CASH + BANK BALANCE + MARKETABLE SECURITIES / CURRENTLIABILITIES
YEAR 2004 2005 2006
CASH AND BANK BALANCE 50.07 64.24 12.99
8/2/2019 BILAL RT1001B49
http://slidepdf.com/reader/full/bilal-rt1001b49 27/43
CURRENT LIABILITIES 2,897.66 4,037.35 4,460.27
ABSOLUTE LIQUIDITY
RATIO 0.01727946 0.015911 0.002912
(STANDARD 0.5:1).
2.TURNOVER ACTIVITY RATIO / EFFICIENCY RATIO:-
These ratios are very important for a concern to judge how well facilities at the disposal of the concern are being used or to measure the
effectiveness with which a concern uses its resources at its disposal. In short, these will indicate position of assets usage. These ratios are usually
calculated on the basis of sales or cost of sales and are expressed in integers rather than as a percentage. Such ratios should be calculated
separately for each type of asset. The greater the ratio more will be the efficiency of asset usage. The lower ratio will reflect the under utilisation
of the resources available at the command of the concern. The concern must always plan for efficient use of the assets to increase the overall
efficiency. The following are the important turnover activity ratios usually calculated by a concern.
(i) Inventory Turnover Ratio:-It denotes the speed at which the inventory will be converted into sales, thereby contributing for the profits of
the concern. When all other factors remain constant, greater the turnover of inventory more will be efficiency of its management. Further, it will
be higher when sales are maximum and the average inventory is minimum. This ratio establishes relationship between costs of goods sold during
a given period and the average amount of inventory held during that period. This ratio is calculated as follows:
Inventory Turnover Ratio = Cost of Goods Sold(COGS) / Average Inventory.
COGS= Sales – Gross Profit
OrCOGS= Sales + Closing Stock- Opening Stock- Purchases – Direct Expenses.
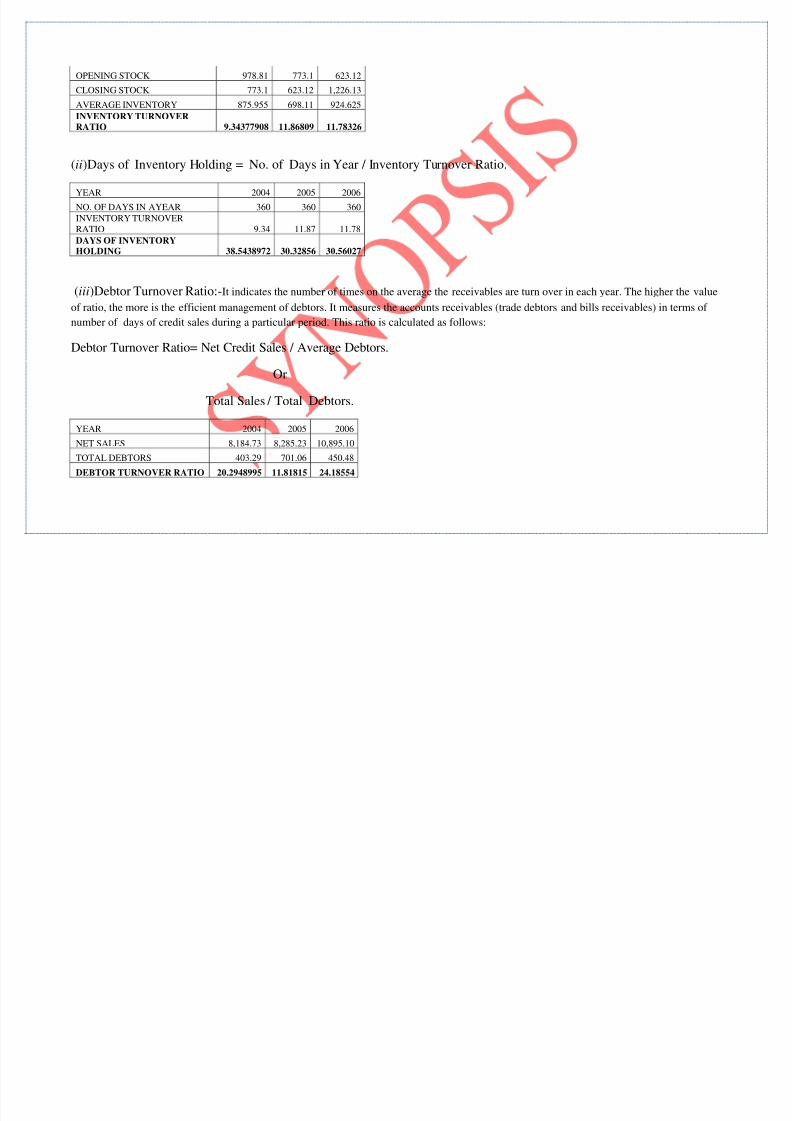
YEAR 2004 2005 2006
Net Sales 8,184.73 8,285.23 10,895.10
8/2/2019 BILAL RT1001B49
http://slidepdf.com/reader/full/bilal-rt1001b49 28/43
OPENING STOCK 978.81 773.1 623.12
CLOSING STOCK 773.1 623.12 1,226.13
AVERAGE INVENTORY 875.955 698.11 924.625
INVENTORY TURNOVERRATIO 9.34377908 11.86809 11.78326
(ii)Days of Inventory Holding = No. of Days in Year / Inventory Turnover Ratio.
YEAR 2004 2005 2006
NO. OF DAYS IN AYEAR 360 360 360
INVENTORY TURNOVERRATIO 9.34 11.87 11.78
DAYS OF INVENTORYHOLDING 38.5438972 30.32856 30.56027
(iii)Debtor Turnover Ratio:-It indicates the number of times on the average the receivables are turn over in each year. The higher the value
of ratio, the more is the efficient management of debtors. It measures the accounts receivables (trade debtors and bills receivables) in terms of
number of days of credit sales during a particular period. This ratio is calculated as follows:
Debtor Turnover Ratio= Net Credit Sales / Average Debtors.
Or
Total Sales / Total Debtors.
YEAR 2004 2005 2006
NET SALES 8,184.73 8,285.23 10,895.10
TOTAL DEBTORS 403.29 701.06 450.48
DEBTOR TURNOVER RATIO 20.2948995 11.81815 24.18554
8/2/2019 BILAL RT1001B49
http://slidepdf.com/reader/full/bilal-rt1001b49 29/43
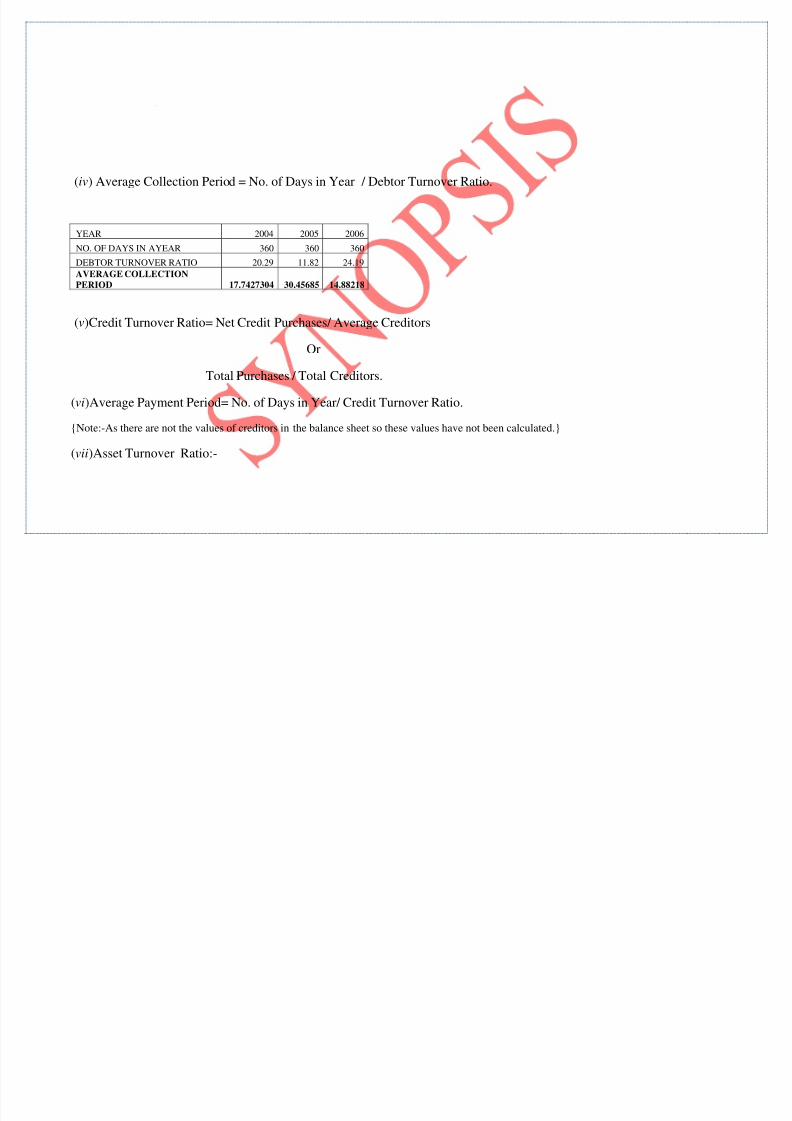
(iv) Average Collection Period = No. of Days in Year / Debtor Turnover Ratio.
YEAR 2004 2005 2006
NO. OF DAYS IN AYEAR 360 360 360
DEBTOR TURNOVER RATIO 20.29 11.82 24.19
AVERAGE COLLECTION
PERIOD 17.7427304 30.45685 14.88218
(v)Credit Turnover Ratio= Net Credit Purchases/ Average Creditors
Or
Total Purchases / Total Creditors.
(vi)Average Payment Period= No. of Days in Year/ Credit Turnover Ratio.
{Note:-As there are not the values of creditors in the balance sheet so these values have not been calculated.}
(vii)Asset Turnover Ratio:-
8/2/2019 BILAL RT1001B49
http://slidepdf.com/reader/full/bilal-rt1001b49 30/43
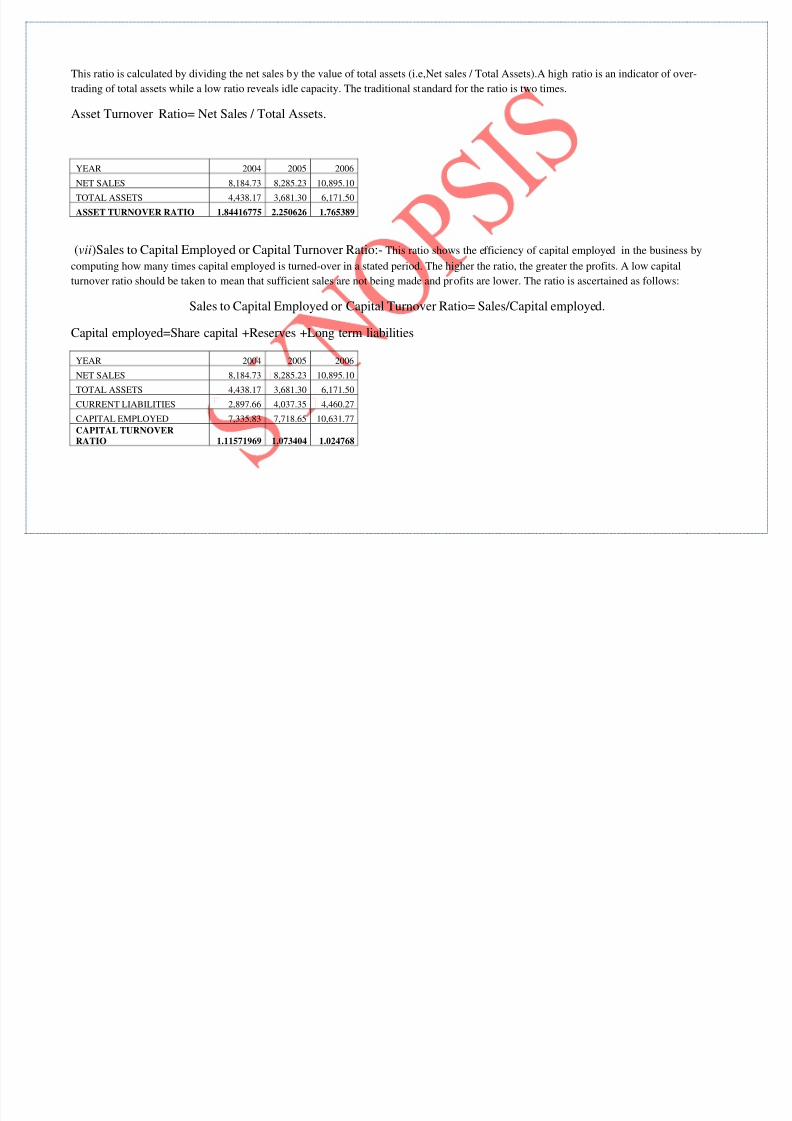
This ratio is calculated by dividing the net sales by the value of total assets (i.e,Net sales / Total Assets).A high ratio is an indicator of over-
trading of total assets while a low ratio reveals idle capacity. The traditional standard for the ratio is two times.
Asset Turnover Ratio= Net Sales / Total Assets.
YEAR 2004 2005 2006
NET SALES 8,184.73 8,285.23 10,895.10
TOTAL ASSETS 4,438.17 3,681.30 6,171.50
ASSET TURNOVER RATIO 1.84416775 2.250626 1.765389
(vii)Sales to Capital Employed or Capital Turnover Ratio:- This ratio shows the efficiency of capital employed in the business by
computing how many times capital employed is turned-over in a stated period. The higher the ratio, the greater the profits. A low capital
turnover ratio should be taken to mean that sufficient sales are not being made and profits are lower. The ratio is ascertained as follows:
Sales to Capital Employed or Capital Turnover Ratio= Sales/Capital employed.
Capital employed=Share capital +Reserves +Long term liabilities
YEAR 2004 2005 2006
NET SALES 8,184.73 8,285.23 10,895.10
TOTAL ASSETS 4,438.17 3,681.30 6,171.50
CURRENT LIABILITIES 2,897.66 4,037.35 4,460.27
CAPITAL EMPLOYED 7,335.83 7,718.65 10,631.77CAPITAL TURNOVERRATIO 1.11571969 1.073404 1.024768
8/2/2019 BILAL RT1001B49
http://slidepdf.com/reader/full/bilal-rt1001b49 31/43
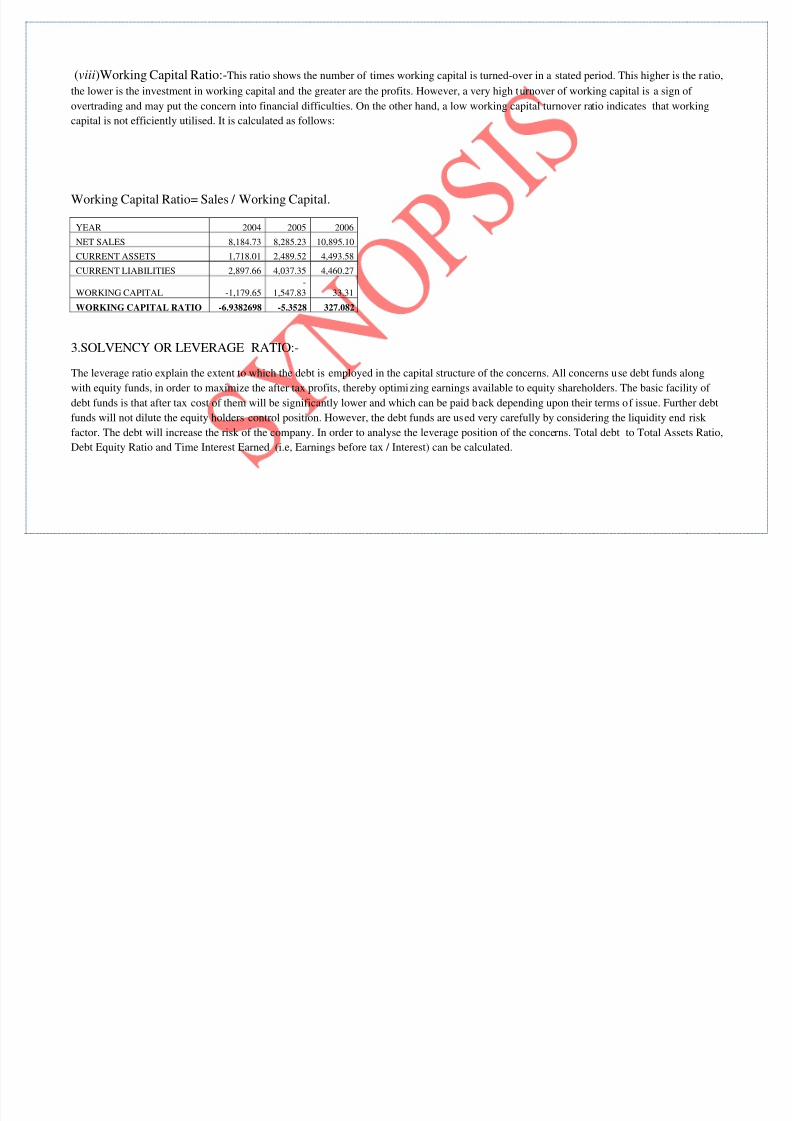
(viii)Working Capital Ratio:-This ratio shows the number of times working capital is turned-over in a stated period. This higher is the ratio,
the lower is the investment in working capital and the greater are the profits. However, a very high turnover of working capital is a sign of
overtrading and may put the concern into financial difficulties. On the other hand, a low working capital turnover ratio indicates that working
capital is not efficiently utilised. It is calculated as follows:
Working Capital Ratio= Sales / Working Capital.
YEAR 2004 2005 2006
NET SALES 8,184.73 8,285.23 10,895.10
CURRENT ASSETS 1,718.01 2,489.52 4,493.58
CURRENT LIABILITIES 2,897.66 4,037.35 4,460.27
WORKING CAPITAL -1,179.65-
1,547.83 33.31
WORKING CAPITAL RATIO -6.9382698 -5.3528 327.082
3.SOLVENCY OR LEVERAGE RATIO:-
The leverage ratio explain the extent to which the debt is employed in the capital structure of the concerns. All concerns use debt funds along
with equity funds, in order to maximize the after tax profits, thereby optimizing earnings available to equity shareholders. The basic facility of
debt funds is that after tax cost of them will be significantly lower and which can be paid back depending upon their terms of issue. Further debt
funds will not dilute the equity holders control position. However, the debt funds are used very carefully by considering the liquidity end risk factor. The debt will increase the risk of the company. In order to analyse the leverage position of the concerns. Total debt to Total Assets Ratio,
Debt Equity Ratio and Time Interest Earned (i.e, Earnings before tax / Interest) can be calculated.

8/2/2019 BILAL RT1001B49
http://slidepdf.com/reader/full/bilal-rt1001b49 32/43
It may be favourable or unfavourable. When earnings are more than the fixed cost of the funds, it is called favourable. An unfavourable leverage
exists if the rate of return remains to be lower. It can be used as a tool of financial planning by finance manager.
(i)Debt Equity Ratio:- This ratio is calculated to measure the relative proportions of outsider’s funds and shareholder’s funds invested in the
company. This ratio is determined to ascertain the soundness of long term financial policies of that company and is also known as external-
internal equity ratio. It is calculated as follows:
Debt Equity Ratio= Outstanding Funds(Total Debts)/Shareholders Fund.
Shareholders Funds = Equity share capital+Preference shares +Reserves & Surpluses(Retained earnings).
YEAR 2004 2005 2006
TOTAL DEBTS 2,166.05 760.25 1,201.41
EQUITY SHARE CAPITAL 249.05 249.05 249.05
RESERVES 2,023.07 2,672.00 4,681.92
SHARE HOLDERS FUNDS 2,272.12 2,921.05 4,930.97
DEBT EQUITY RATIO 0.953317 0.260266 0.243646
(ii)Proprietory Ratio:- A variant of debt to equity ratio is the propriety ratio which shows the relationship between shareholders’ funds and
total assets. This ratio is worked out as follows:
Proprietory Ratio = shareholders Funds / Total Assets.
YEAR 2004 2005 2006
EQUITY SHARE CAPITAL 249.05 249.05 249.05RESERVES 2,023.07 2,672.00 4,681.92
SHARE HOLDERS FUNDS 2,272.12 2,921.05 4,930.97
TOTAL ASSETS 4,438.17 3,681.30 6,171.50
PROPRIETORY RATIO 0.51195 0.79348 0.79899

8/2/2019 BILAL RT1001B49
http://slidepdf.com/reader/full/bilal-rt1001b49 33/43
4. PROFITABILITY RATIO:-
Profitability ratio is the overall measure of the companies with regard to efficient and effective utilisation of resources at their command. It
indicates in a nutshell the effectiveness of the decisions taken by the management from time to time. Profitability ratios are of utmost importance
for a concern. These ratios are calculated to enlighten the end results of business activities which is the sole criterion of the overall efficiency of
the business concern. The following are the important profitability ratios:
(i)Gross Profit Ratio:- This ratio tells gross margin on trading and is calculated as under:
(i)Gross Profit Ratio= Gross Profit / Net Sales*100.
[Note:- The values of COGS is not given so we cannot calculate the values of gross profit.]
(ii)Net Profit Ratio:- This ratio measures the relationship between net profit and sales of a firm. It is calculated as follows:
Net Profit Ratio = Net Profit / Net Sales *100.
YEAR 2004 2005 2006
NET PROFIT 273.56 785.73 1,163.75
NET SALES 8,184.73 8,285.23 10,895.10
NET PROFIT RATIO 0.033423 0.094835 0.106814
(iii)Operating Ratio:-
This ratio indicates the proportion that the cost of sales bears to sales. Cost of sales includes cost of goods sold as well as other operating
expenses, administration, selling and distribution expenses which have matching relationship with sales. It excludes income and expenses which

8/2/2019 BILAL RT1001B49
http://slidepdf.com/reader/full/bilal-rt1001b49 34/43
have no bearing on production and sales, i.e, non-operating income and expenses as interest and dividend received on investment, interest paid
on long-term loans and debentures, profit or loss on sales of fixed assets or long-term investments. It is calculated as:
Operating Ratio= Operating Expenses/Net Sales *100.
Operating Expenses= COGS+Office Expenses+Selling & Distribution Expenses.
YEAR 2004 2005 2006
OPERATING EXPENSES 6,784.20 6,455.67 8,958.80
NET SALES 8,184.73 8,285.23 10,895.10OPERATING RATIO 0.828885 0.779178 0.822278
(iv)Operating Profit Ratio:-
This ratio establishes the relationship between operating profit and sales and is calculated as follows:
Operating Profit Ratio= Operating Profit/ Net Sales*100
Where Operating Profit = Net Profit + Non-operating Expenses – Non-operating Income
Or
= Gross Profit – Operating Expenses.

8/2/2019 BILAL RT1001B49
http://slidepdf.com/reader/full/bilal-rt1001b49 35/43
This ratio indicates the portion remaining out of every rupee worth of sales after all operating costs and expenses have been met. Higher the ratio
the better it is.
YEAR 2004 2005 2006
OPERATING PROFIT 1,270.94 1,832.48 2,168.71
NET SALES 8,184.73 8,285.23 10,895.10
OPERATING PROFIT RATIO 0.15528 0.22117 0.19905
5.PROFITABILITY RATIO RELATED TO INVESTMENT:-
(i)Interest Coverage Ratio:-
It really measures the ability of the concern to service the debt. This ratio is very important from lender’s point of view and indicates whether the
business would earn sufficient profits to pay periodically the interest charges. The higher the ratio, the more secured the lenders will be in
respect of their periodical interest income. It is calculated as under:
Interest Coverage Ratio = Earnings Before interest and Taxes / Interest. Charges.
YEAR 2004 2005 2006PAT 273.56 785.73 1,163.75
(+)TAX 63.1 240.1 430.72
(+)INTEREST 381.8 247.35 260.31
EARNINGS BEFORE TAX ANDINTEREST 718.46 1273.18 1854.78
8/2/2019 BILAL RT1001B49
http://slidepdf.com/reader/full/bilal-rt1001b49 36/43
INTEREST 381.8 247.35 260.31
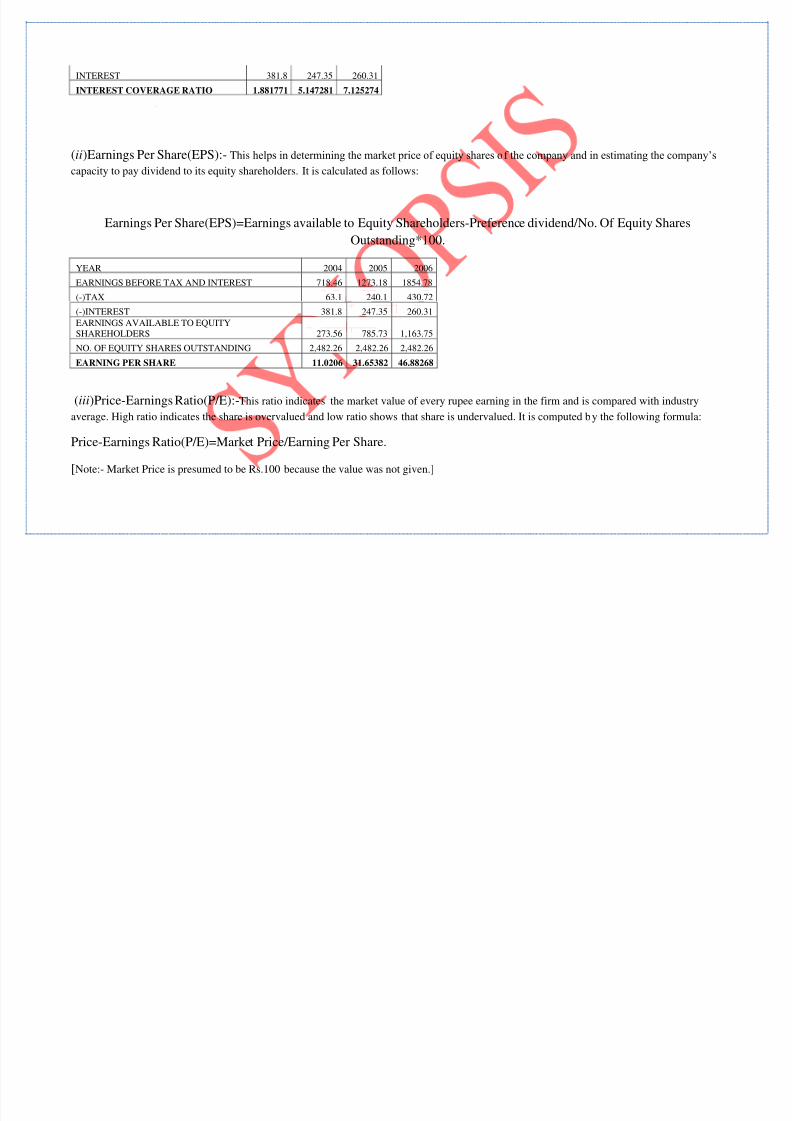
INTEREST COVERAGE RATIO 1.881771 5.147281 7.125274
(ii)Earnings Per Share(EPS):- This helps in determining the market price of equity shares of the company and in estimating the company’s
capacity to pay dividend to its equity shareholders. It is calculated as follows:
Earnings Per Share(EPS)=Earnings available to Equity Shareholders-Preference dividend/No. Of Equity Shares
Outstanding*100.
YEAR 2004 2005 2006
EARNINGS BEFORE TAX AND INTEREST 718.46 1273.18 1854.78
(-)TAX 63.1 240.1 430.72
(-)INTEREST 381.8 247.35 260.31
EARNINGS AVAILABLE TO EQUITYSHAREHOLDERS 273.56 785.73 1,163.75
NO. OF EQUITY SHARES OUTSTANDING 2,482.26 2,482.26 2,482.26
EARNING PER SHARE 11.0206 31.65382 46.88268
(iii)Price-Earnings Ratio(P/E):-This ratio indicates the market value of every rupee earning in the firm and is compared with industry
average. High ratio indicates the share is overvalued and low ratio shows that share is undervalued. It is computed by the following formula:
Price-Earnings Ratio(P/E)=Market Price/Earning Per Share.
[Note:- Market Price is presumed to be Rs.100 because the value was not given.]
8/2/2019 BILAL RT1001B49
http://slidepdf.com/reader/full/bilal-rt1001b49 37/43
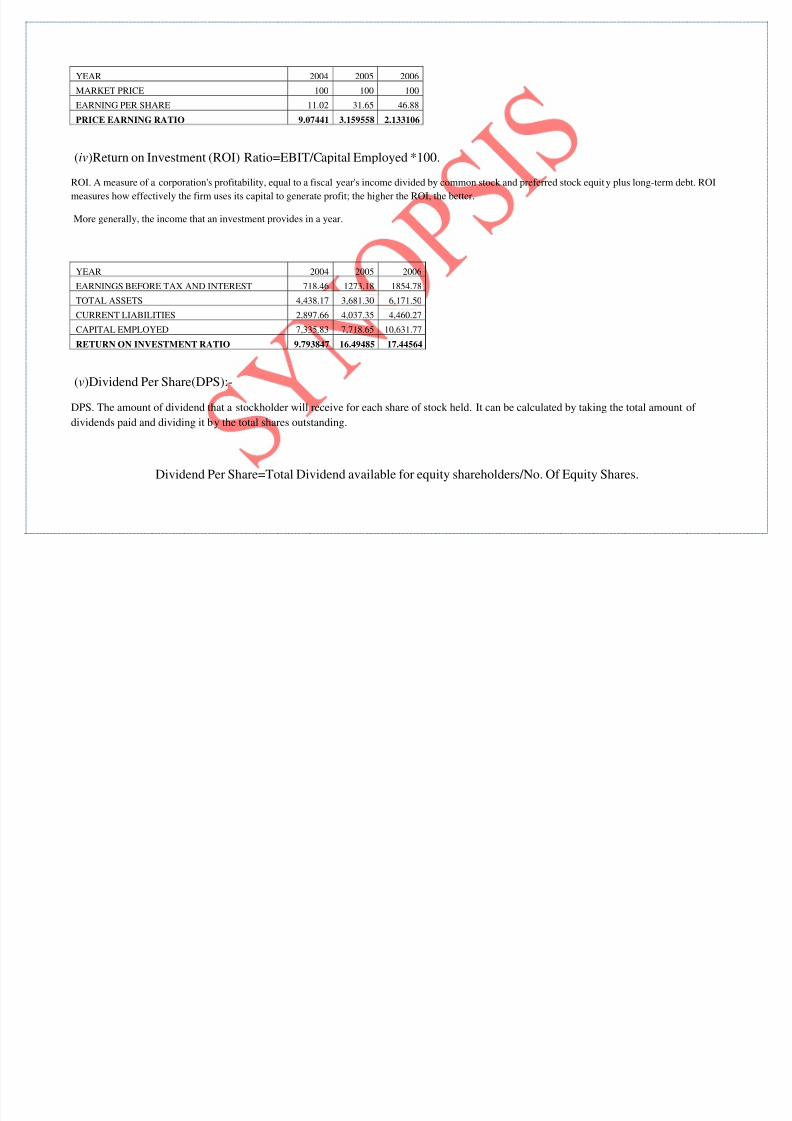
YEAR 2004 2005 2006
MARKET PRICE 100 100 100
EARNING PER SHARE 11.02 31.65 46.88
PRICE EARNING RATIO 9.07441 3.159558 2.133106
(iv)Return on Investment (ROI) Ratio=EBIT/Capital Employed *100.
ROI. A measure of a corporation's profitability, equal to a fiscal year's income divided by common stock and preferred stock equity plus long-term debt. ROI
measures how effectively the firm uses its capital to generate profit; the higher the ROI, the better.
More generally, the income that an investment provides in a year.
YEAR 2004 2005 2006
EARNINGS BEFORE TAX AND INTEREST 718.46 1273.18 1854.78
TOTAL ASSETS 4,438.17 3,681.30 6,171.50
CURRENT LIABILITIES 2,897.66 4,037.35 4,460.27
CAPITAL EMPLOYED 7,335.83 7,718.65 10,631.77
RETURN ON INVESTMENT RATIO 9.793847 16.49485 17.44564
(v)Dividend Per Share(DPS):-
DPS. The amount of dividend that a stockholder will receive for each share of stock held. It can be calculated by taking the total amount of
dividends paid and dividing it by the total shares outstanding.
Dividend Per Share=Total Dividend available for equity shareholders/No. Of Equity Shares.

8/2/2019 BILAL RT1001B49
http://slidepdf.com/reader/full/bilal-rt1001b49 38/43
YEAR 2004 2005 2006
EARNINGS BEFORE TAX AND INTEREST 718.46 1273.18 1854.78
(-)TAX 63.1 240.1 430.72
(-)INTEREST 381.8 247.35 260.31
(-)RESERVES 2,023.07 2,672.00 4,681.92
TOTAL DIVIDEND AVAILABLE FOR EQUITYSHAREHOLDERS
-1,749.51 -695.58 -844.62
NO.OF EQUITY SHARES 2,482.26 2,482.26 2,482.26
DIVIDEND PER SHARE -0.70481 -0.28022 -0.34026
(vi)Dividend Pay out Ratio:- This ratio indicates as to what proportion of earning per share has been used for paying dividend and what has
been retained for ploughing back. This ratio is very important from shareholders point if view as it tells that if a company has used whole or
substantially the whole of its earnings for paying dividend and retained nothing for future growth and expansion purposes, then there will be
very dim chances of capital appreciation in the price of shares of such company. In other words, an investor who is more interested in capital
appreciation must look for a company having low payout ratio. This is determined as follows:
Dividend Pay out Ratio=DPS/EPS.
YEAR 2004 2005 2006
DIVIDEND PER SHARE -0.7 -0.28 -0.34
EARNING PER SHARE 11.02 31.65 46.88
DIVIDEND PAY OUT RATIO -0.0066 -0.00264 -0.00321
(vii)Return on Gross Capital Employed:-
The term gross capital employed refers to the total investment made in the business and is represented by the total assets, fixed as well as current
assets used in the business. The ratio eashtablishes the business b/w earning before interest and taxes and gross capital employed. The
conventional approach is to divide earnings before interest and tax by gross capital employed , that is ,

8/2/2019 BILAL RT1001B49
http://slidepdf.com/reader/full/bilal-rt1001b49 39/43
Return on Gross Capital Employed=EBIT/Gross Capital*100.
YEAR 2004 2005 2006
EARNINGS BEFORE TAX AND INTEREST 718.46 1273.18 1854.78
TOTAL LIABILITIES 4,438.17 3,681.30 6,171.50
(-)PRE-OPERATING EXPENSES 0 0 0
GROSS CAPITAL 4,438.17 3,681.30 6,171.50
RETURN ON GROSS CAPITAL EMPLOYED 0.161882 0.345851 0.30054
(viii)Return on Net Capital Employed:- This ratio is an indicator of the earning capacity of the capital employed in the business. This
ratio is considered to be the most important ratio because it reflects the overall efficiency with which capital is used. This ratio is a helpful tool
for making capital budgeting decisions, a project yielding higher return is favoured. This ratio is calculated as follows:
Return on Net Capital Employed=EBIT/Net capital Employed*100.
YEAR 2004 2005 2006
EARNINGS BEFORE TAX AND INTEREST 718.46 1273.18 1854.78
GROSS CAPITAL 4,438.17 3,681.30 6,171.50
(-)NET CURRENT LIABILITIES 2,897.66 4,037.35 4,460.27
NET CAPITAL 1,540.51 -356.05 1,711.23
RETURN ON NET CAPITAL EMPLOYED 0.46638 -3.5758 1.08389
8/2/2019 BILAL RT1001B49
http://slidepdf.com/reader/full/bilal-rt1001b49 40/43
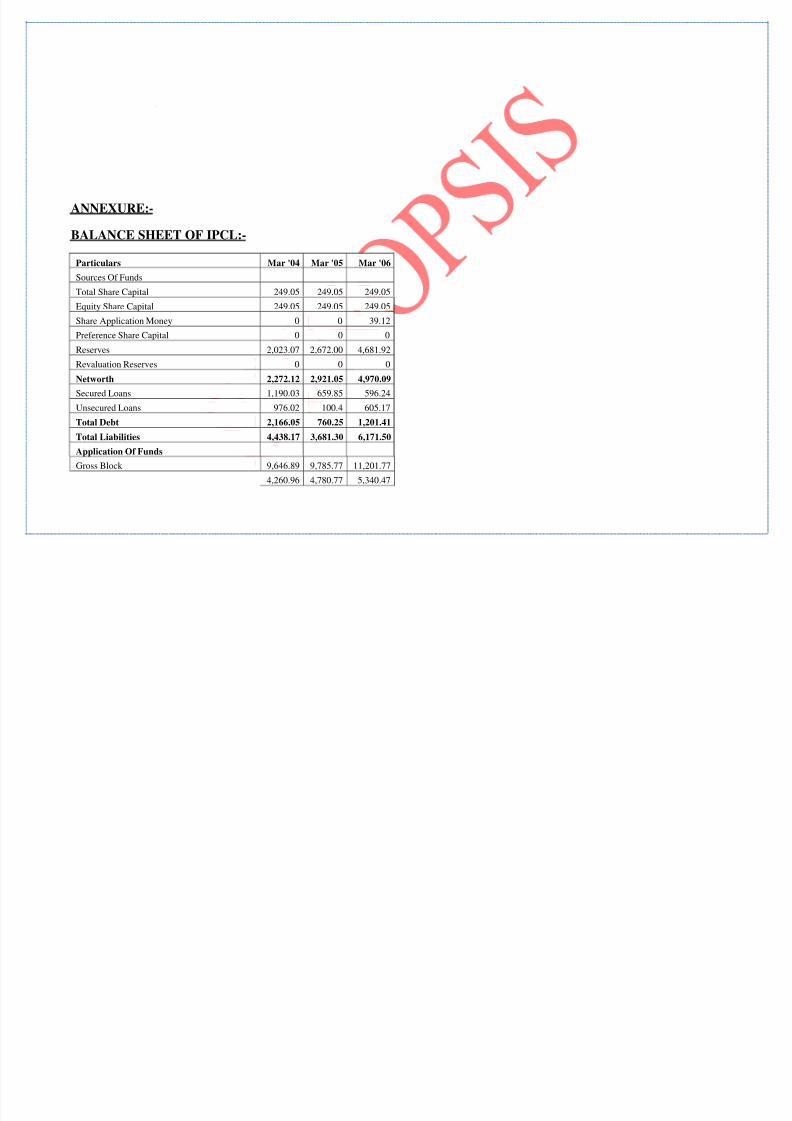
ANNEXURE:-
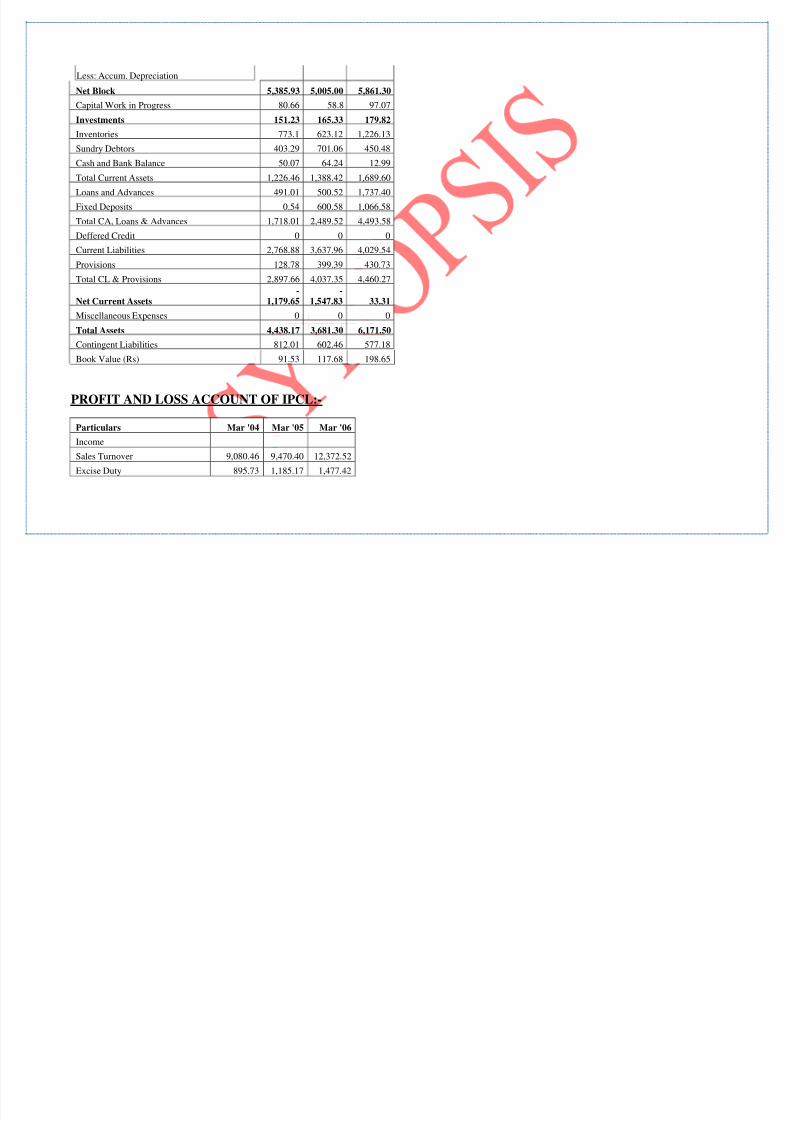
BALANCE SHEET OF IPCL:-
Particulars Mar '04 Mar '05 Mar '06
Sources Of Funds
Total Share Capital 249.05 249.05 249.05
Equity Share Capital 249.05 249.05 249.05
Share Application Money 0 0 39.12
Preference Share Capital 0 0 0
Reserves 2,023.07 2,672.00 4,681.92
Revaluation Reserves 0 0 0
Networth 2,272.12 2,921.05 4,970.09
Secured Loans 1,190.03 659.85 596.24
Unsecured Loans 976.02 100.4 605.17
Total Debt 2,166.05 760.25 1,201.41
Total Liabilities 4,438.17 3,681.30 6,171.50
Application Of Funds
Gross Block 9,646.89 9,785.77 11,201.77
4,260.96 4,780.77 5,340.47
8/2/2019 BILAL RT1001B49
http://slidepdf.com/reader/full/bilal-rt1001b49 41/43
Less: Accum. Depreciation
Net Block 5,385.93 5,005.00 5,861.30
Capital Work in Progress 80.66 58.8 97.07
Investments 151.23 165.33 179.82
Inventories 773.1 623.12 1,226.13
Sundry Debtors 403.29 701.06 450.48
Cash and Bank Balance 50.07 64.24 12.99
Total Current Assets 1,226.46 1,388.42 1,689.60
Loans and Advances 491.01 500.52 1,737.40
Fixed Deposits 0.54 600.58 1,066.58
Total CA, Loans & Advances 1,718.01 2,489.52 4,493.58
Deffered Credit 0 0 0
Current Liabilities 2,768.88 3,637.96 4,029.54
Provisions 128.78 399.39 430.73
Total CL & Provisions 2,897.66 4,037.35 4,460.27
Net Current Assets-
1,179.65-
1,547.83 33.31
Miscellaneous Expenses 0 0 0
Total Assets 4,438.17 3,681.30 6,171.50
Contingent Liabilities 812.01 602.46 577.18
Book Value (Rs) 91.53 117.68 198.65
PROFIT AND LOSS ACCOUNT OF IPCL:-
Particulars Mar '04 Mar '05 Mar '06
Income
Sales Turnover 9,080.46 9,470.40 12,372.52
Excise Duty 895.73 1,185.17 1,477.42
8/2/2019 BILAL RT1001B49
http://slidepdf.com/reader/full/bilal-rt1001b49 42/43
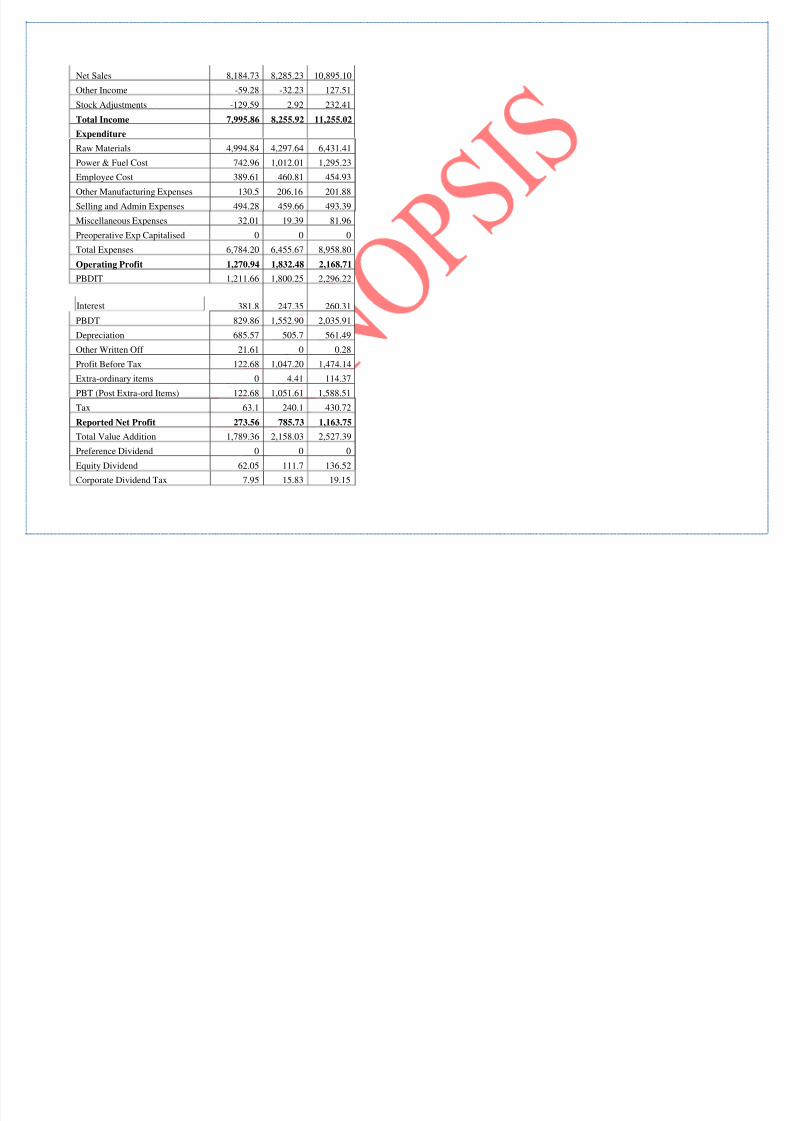
Net Sales 8,184.73 8,285.23 10,895.10
Other Income -59.28 -32.23 127.51
Stock Adjustments -129.59 2.92 232.41
Total Income 7,995.86 8,255.92 11,255.02
Expenditure
Raw Materials 4,994.84 4,297.64 6,431.41
Power & Fuel Cost 742.96 1,012.01 1,295.23
Employee Cost 389.61 460.81 454.93
Other Manufacturing Expenses 130.5 206.16 201.88
Selling and Admin Expenses 494.28 459.66 493.39
Miscellaneous Expenses 32.01 19.39 81.96
Preoperative Exp Capitalised 0 0 0
Total Expenses 6,784.20 6,455.67 8,958.80
Operating Profit 1,270.94 1,832.48 2,168.71
PBDIT 1,211.66 1,800.25 2,296.22
Interest 381.8 247.35 260.31
PBDT 829.86 1,552.90 2,035.91
Depreciation 685.57 505.7 561.49
Other Written Off 21.61 0 0.28
Profit Before Tax 122.68 1,047.20 1,474.14
Extra-ordinary items 0 4.41 114.37
PBT (Post Extra-ord Items) 122.68 1,051.61 1,588.51
Tax 63.1 240.1 430.72
Reported Net Profit 273.56 785.73 1,163.75
Total Value Addition 1,789.36 2,158.03 2,527.39
Preference Dividend 0 0 0
Equity Dividend 62.05 111.7 136.52
Corporate Dividend Tax 7.95 15.83 19.15
8/2/2019 BILAL RT1001B49
http://slidepdf.com/reader/full/bilal-rt1001b49 43/43
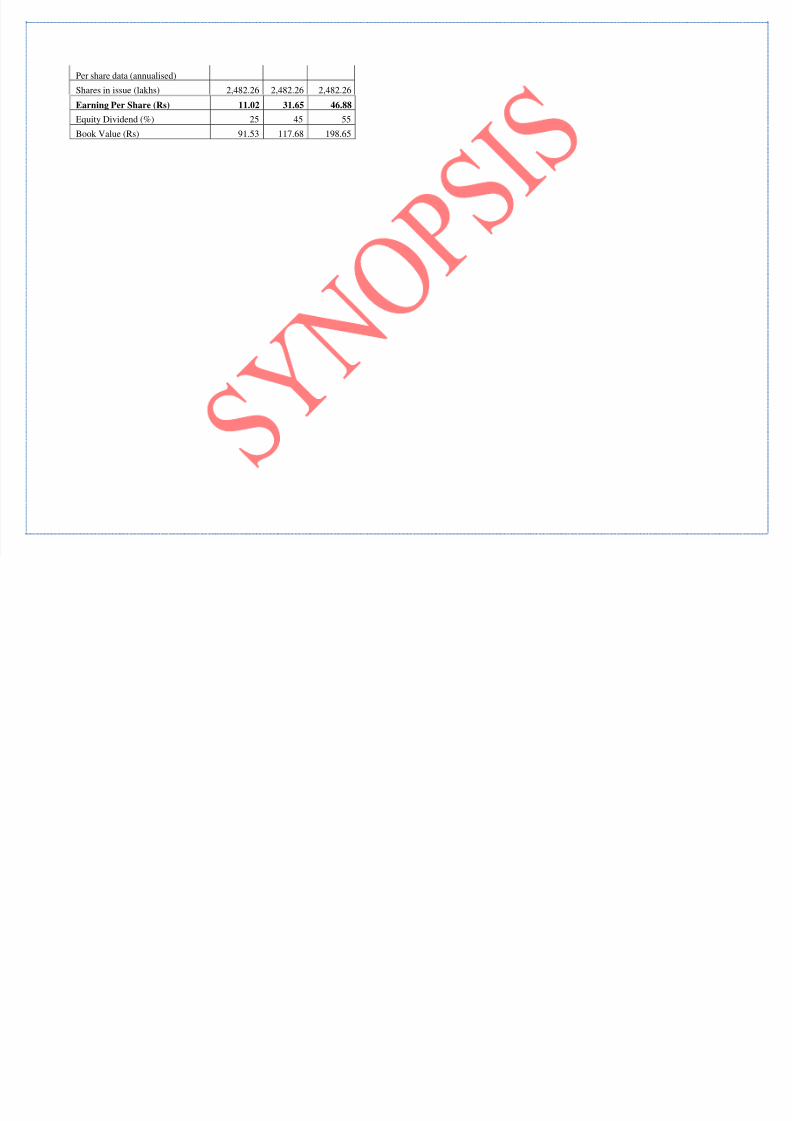
Per share data (annualised)
Shares in issue (lakhs) 2,482.26 2,482.26 2,482.26
Earning Per Share (Rs) 11.02 31.65 46.88
Equity Dividend (%) 25 45 55
Book Value (Rs) 91.53 117.68 198.65