
The Canadian Neonatal Network
145
SEHC CHUS RCH OTTA JGH ACH FMC MSH KGH IWK WRH SUNY CHUQ ECH HMR LHSC HSJ GVS RUH SBGH SJRH EDM CBRH SMH MUHC HHSC RQHQ The Canadian Neonatal Network ™ Le Réseau Néonatal Canadien ™ Annual Report 2018 Rapport Annuel BCWH SEHC UUH JCHC HSCC
Transcript of The Canadian Neonatal Network

SEHC
CHUS
RCH
OTTA
JGH
ACH
FMC
MSH
KGH
IWK
WRH
SUNY
CHUQ
ECH
HMR
LHSC
HSJ
GVS
RUH
SBGH
SJRH
EDM
CBRH
SMH
MUHC
HHSC
RQHQ
The Canadian Neonatal Network ™ Le Réseau Néonatal Canadien ™ Annual Report 2018 Rapport Annuel
BCWH
SEHC
UUH
JCHC
HSCC

i
Acknowledgements This report is based upon data collected from 32 Health Care Organizations that were members of the Canadian Neonatal Network™ during the year 2018. In addition to all the investigators and the funding agency, we would like to recognize the invaluable support of the Neonatal Intensive Care Units (NICUs) that collected this information, the support of all of the participating sites and most importantly, the dedication and hard work of the Site Investigators, NICU Medical Directors and Data Abstractors. Structure of the CNN The Canadian Neonatal Network™ (CNN) is a group of researchers who collaborate on research issues relating to neonatal care. The CNN was founded in 1995 by Dr. Shoo Lee. The CNN maintains a standardized neonatal database and provides unique opportunities for researchers to participate in collaborative projects on a national and international scale. Health care professionals, health services researchers, and health care administrators participate actively in clinical, epidemiologic, outcomes, health services, health policy and informatics research aimed at improving quality, effectiveness and efficiency of neonatal care. Research results are published in Network reports and in peer-reviewed journals. Funding The CNN infrastructure is funded by the Canadian Institutes of Health Research. Individual participating sites provided additional funding for data collection and other related resources. The coordinating center, Maternal-Infant Care Research Centre, is supported by Mount Sinai Hospital, Toronto, Ontario. Coordinating Centre of the CNN Maternal-Infant Care Research Centre, Mount Sinai Hospital, Toronto, Ontario Chairman: Dr. Shoo K. Lee, University of Toronto Governing Board: Dr. Khalid Aziz, University of Alberta Dr. Kimberly Dow, Queen’s University Dr. Shoo K. Lee, University of Toronto (Chair) Dr. Douglas McMillan, Dalhousie University Dr. Bruno Piedboeuf, Université Laval Dr. Molly Seshia, University of Manitoba Dr. Nalini Singhal, University of Calgary Director: Dr. Prakesh Shah, University of Toronto Associate Director Dr. Marc Beltempo, McGill University Executive Committee: Dr. Marc Beltempo, McGill University Ms. Martine Claveau, McGill University

ii
Dr. Walid El-Naggar, Dalhousie University Dr. Abhay Lodha, University of Calgary Dr. Amit Mukerji, McMaster University Dr. Prakesh Shah, University of Toronto (Chair) Dr. Joseph Ting, University of British Columbia Dr. Eugene Ng, University of Toronto
CNN Coordinator: Ms. Priscilla Chan, Mount Sinai Hospital Report Analyst: Mr. Eugene W. Yoon, Mount Sinai Hospital Report Review Committee: Dr. Marc Beltempo, McGill University (Co-Chair) Dr. George Carson, University of Saskatchewan Dr. Orlando DaSilva, Western University Dr. Akhil Deshpandey, Memorial University Dr. Michael Dunn, University of Toronto Dr. Amit Mukerji, McMaster University Ms. Wendy Seidlitz, Hamilton Health Sciences Dr. Prakesh Shah, University of Toronto (Co-Chair) Dr. Joseph Ting, University of British Columbia Participating CNN Sites and Site Investigators in 2018: Victoria General Hospital, Victoria, British Columbia Dr. Jaideep Kanungo BC Women’s Hospital, Vancouver, British Columbia Dr. Joseph Ting Royal Columbian Hospital, New Westminster, Dr. Zenon Cieslak
British Columbia Surrey Memorial Hospital, Surrey, British Columbia Dr. Rebecca Sherlock Foothills Medical Centre, Calgary, Alberta Dr. Ayman Abou Mehrem Alberta Children’s Hospital, Calgary, Alberta Dr. Carlos Fajardo Royal Alexandra Hospital, Edmonton, Alberta Dr. Khalid Aziz &
& University of Alberta Hospital – Dr. Jennifer Toye Stollery Children's, Edmonton, Alberta
Royal University Hospital, Saskatoon, Saskatchewan Dr. Koravangattu Sankaran & Dr. Sibasis Daspal Regina General Hospital, Regina, Saskatchewan Dr. Zarin Kalapesi & Dr. Jaya Bodani Winnipeg Health Sciences Centre, Winnipeg, Manitoba Dr. Mary Seshia & Dr. Deepak LouisSt. Boniface General Hospital, Winnipeg, Manitoba Dr. Ruben Alvaro Windsor Regional Hospital, Windsor, Ontario Dr. Mohammed Adie London Health Sciences Centre, London, Ontario Dr. Orlando Da Silva Hamilton Health Sciences, Hamilton, Ontario Dr. Amit Mukerji Mount Sinai Hospital, Toronto, Ontario Dr. Prakesh Shah Hospital for Sick Children, Toronto, Ontario Dr. Kyong-Soon Lee Sunnybrook Health Sciences Centre, Toronto, Ontario Dr. Michael Dunn Kingston General Hospital, Kingston, Ontario Dr. Faiza Khurshid Children’s Hospital of Eastern Ontario, Ottawa, Ontario Dr. Brigitte Lemyre

iii
& The Ottawa Hospital, Ottawa, Ontario Jewish General Hospital, Montréal, Québec Dr. Ermelinda Pelausa Hôpital Sainte-Justine, Montréal, Québec Dr. Keith Barrington,
Dr. Anie Lapointe & Mr. Guillaume Ethier
Montreal Children’s Hospital – McGill University Health Dr. Marc Beltempo & Centre, Montréal, Québec Ms. Martine Claveau Centre Hospitalier Universitaire de Québec, Sainte Foy, Dr. Bruno Piedboeuf &
Québec Dr. Christine Drolet Centre Hospitalier Universitaire de Sherbrooke, Sherbrooke, Dr. Valérie Bertelle &
Québec Dr. Edith Massé Hôpital Maisonneuve-Rosemont, Montréal, Québec Dr. Marie St-Hilaire Dr. Everett Chalmers Hospital, Fredericton, New Brunswick Dr. Hala Makary Saint John Regional Hospital, Saint John, New Brunswick Dr. Cecil Ojah & Dr. Luis Monterrosa Moncton Hospital, Moncton, New Brunswick Dr. Rody Canning IWK Health Centre, Halifax, Nova Scotia Dr. Jehier Afifi Cape Breton Regional Hospital, Sydney, Nova Scotia Dr. Andrzej Kajetanowicz Janeway Children’s Health and Rehabilitation Centre,
St. John’s, Newfoundland Dr. Julie Emberley University of Utah Hospital Dr. Bradley A. Yoder Written & Prepared By: Marc Beltempo, Prakesh Shah, Eugene W. Yoon, Priscilla Chan, Nevetha Balachandran and Members of the Annual Report Review Committee Cover page adapted by Nevetha Balachandran

iv
Table of contents Page
A. Executive Summary 1 B. CNN Site Characteristics 3 C. Information Systems 4 D. Descriptive Analyses 5 Flow diagram 6 D.1. Analyses based on number of eligible admissions to participating sites Presentation #1 All admissions: Type of admissions: All sites 8
Presentation #2 All admissions: Admission illness severity scores (SNAP-II and SNAP-IIPE): Sites with complete data 10
D.2. Analyses based on number of eligible neonates admitted to participating sites Presentation #3 Gestational age distribution: All sites and all admitted neonates 13 Presentation #4 Survival to discharge by GA: All admissions including delivery room deaths 15 Presentation #5 Birth weight distribution: All sites and all admitted neonates 16 Presentation #6 Survival to discharge by BW: All admissions including delivery room deaths 17 Presentation #6b Survival to discharge by BW: BW < 1000g including delivery room deaths 18 Presentation #7a Maternal and peripartum characteristics: All neonates 19 Presentation #7b Timing of single course of Antenatal Corticosteroids: GA <33 weeks 21 Presentation #7c Timing of deferred cord clamping: GA <33 weeks 22 Presentation #8a Resuscitation details: GA < 31 weeks 23 Presentation #8b Resuscitation details: GA ≥ 31 weeks 24 Presentation #9 Early onset sepsis: All GA 25 Presentation #10 Late onset sepsis: All GA 26 Presentation #11 Late onset sepsis: All BW 27 Presentation #12 Other diagnoses / interventions / procedures: All GA 28 D.3. Analyses based on number of very preterm (GA < 33 weeks) or VLBW (< 1500g) neonates Presentation #13 Patent ductus arteriosus treatments: GA < 33 weeks 31 Presentation #14 Patent ductus arteriosus treatments: BW < 1500g 32 Presentation #15 Neuroimaging findings: GA < 33 weeks 33 Presentation #16 Neuroimaging findings: BW < 1500g 35 Presentation #17 Necrotizing enterocolitis treatments: GA < 33 weeks 37 Presentation #18 Necrotizing enterocolitis treatments: BW < 1500g 38 Presentation #19 Chronic lung disease at 36 weeks PMA or discharge: GA<33 weeks 39 Presentation #20 Chronic lung disease at 36 weeks PMA or discharge: BW <1500g 40 Presentation #21 Retinopathy of prematurity staging: GA < 33 weeks 41 Presentation #22 Retinopathy of prematurity staging: BW < 1500g 42 Presentation #23 Retinopathy of prematurity treatments: GA < 33 weeks 43 Presentation #24 Retinopathy of prematurity treatments: BW < 1500g 44 Presentation #25 Mortality or select morbidity: GA < 33 weeks 45 E. Site Comparisons E.1. Site Comparisons – Care Practices Presentation #26 Prenatal and delivery room care practices: GA<29 weeks: Site specific crude rates 48

v
(inborn only) Presentation #27 Postnatal care practices: GA <29 weeks: Site specific crude rates (inborn only) 49 E.2. Site Comparisons – Survival / Mortality Presentation #28 Survival rates by site: All GA 51 Presentation #29 Survival rates by site: All BW 52 Presentation #30a Mortality: GA < 33 weeks: Adjusted standardized ratios by site 53 Presentation #30b Mortality: GA < 33 weeks: Adjusted standardized ratios by site: Funnel plot 54 Presentation #30c Mortality: GA < 29 weeks: Adjusted standardized ratios by site 55 Presentation #30d Mortality: GA < 29 weeks: Adjusted standardized ratios by site: Funnel plot 56 Presentation #30e Mortality: All neonates: Adjusted standardized ratios by site 57 Presentation #30f Mortality: All neonates: Adjusted standardized ratios by site: Funnel plot 58 E.3. Site Comparisons – Mortality / Morbidities
Presentation #31 Mortality / morbidities: GA < 33 weeks: Site specific crude rates 60 Presentation #32 Mortality / morbidities: GA<29 weeks: Site specific crude rates 61 E.3.1. Site Comparisons – Late Onset Sepsis and Antimicrobial Use Presentation #33 Late onset sepsis: GA < 33 weeks: Site specific crude rates 63 Presentation #34a Late onset sepsis: GA < 33 weeks: Adjusted standardized ratios by site 64 Presentation #34b Late onset sepsis: GA < 33 weeks: Adjusted standardized ratios by site: Funnel plot 65 Presentation #34c Late onset sepsis: GA < 29 weeks: Adjusted standardized ratios by site 66 Presentation #34d Late onset sepsis: GA < 29 weeks: Adjusted standardized ratios by site: Funnel plot 67 Presentation #35 Late onset sepsis per 1000 patient days: GA < 33 weeks: Site specific crude rates 68 Presentation #36a CLABSI per 1000 central line days: GA < 33 weeks: Site specific crude rates 69 Presentation #36b CLABSI per 1000 central line days: All neonates: Site specific crude rates 70 Presentation #37 Days of antimicrobial use per 1000 patient days: GA <33 weeks 71 Presentation #38 Days of antimicrobial use per 1000 patient days: GA <29 weeks 72 E.3.2. Site Comparisons – Patent Ductus Arteriosus Presentation #39 Rate of treatment for PDA: GA < 33 weeks who had PDA: Site specific crude rates 73 Presentation #40 Surgical PDA ligation rates: GA < 33 weeks who had PDA: Site specific crude rates 74 E.3.3. Site Comparisons – Severe Brain Injury Presentation #41 Severe brain injury rates: GA < 33 weeks: Site specific crude rates 75 Presentation #42 Periventricular leukomalacia (PVL) rates: GA<33 weeks: Site specific crude rates 77 Presentation #43a IVH grade 3 or 4 or PVL: GA < 33 weeks: Adjusted standardized ratios by site 79 Presentation #43b IVH grade 3 or 4 or PVL: GA < 33 weeks: Adjusted standardized ratios by site: Funnel plot 80 Presentation #43c IVH grade 3 or 4 or PVL: GA < 29 weeks: Adjusted standardized ratios by site 81 Presentation #43d IVH grade 3 or 4 or PVL: GA < 29 weeks: Adjusted standardized ratios by site: Funnel plot 82 E.3.4. Site Comparisons – Necrotizing Enterocolitis Presentation #44 NEC treatment rates: GA < 33 weeks: Site specific crude rates 83 Presentation #45a NEC: GA < 33 weeks: Adjusted standardized ratios by site 85 Presentation #45b NEC: GA < 33 weeks: Adjusted standardized ratios by site: Funnel plot 86 Presentation #45c NEC: GA < 29 weeks: Adjusted standardized ratios by site 87 Presentation #45d NEC: GA < 29 weeks: Adjusted standardized ratios by site: Funnel plot 88 E.3.5. Site Comparisons – Chronic Lung Disease Presentation #46 CLD: GA < 33 weeks: Site specific crude rates 89

vi
Presentation #47a CLD: GA < 33 weeks: Adjusted standardized ratios by site 90 Presentation #47b CLD: GA < 33 weeks: Adjusted standardized ratios by site: Funnel plot 91 Presentation #47c CLD: GA < 29 weeks: Adjusted standardized ratios by site 92 Presentation #47d CLD: GA < 29 weeks: Adjusted standardized ratios by site: Funnel plot 93 E.3.6. Site Comparisons – Postnatal Use of Steroids Presentation #48a Postnatal use of steroids for treatment of CLD: GA < 29 weeks: Site specific crude rates 94 Presentation #48b Systemic steroids for hypotension: GA < 33 weeks: Site specific crude rates 95 E.3.7. Site Comparisons – Retinopathy of Prematurity Presentation #49a ROP > Stage 3: GA<33 weeks: Adjusted standardized ratios by site 96 Presentation #49b ROP > Stage 3: GA<33 weeks: Adjusted standardized ratios by site: Funnel plot 97 Presentation #49c ROP > Stage 3: GA<29 weeks: Adjusted standardized ratios by site 98 Presentation #49d ROP > Stage 3: GA<29 weeks: Adjusted standardized ratios by site: Funnel plot 99 E.3.8. Site Comparisons – Mortality or Major Morbidity Presentation #50a Mortality or major morbidity: GA < 33 weeks: Adjusted standardized ratios by site 100
Presentation #50b Mortality or major morbidity: GA < 33 weeks: Adjusted standardized ratios by site: Funnel plot 101
Presentation #50c Mortality or major morbidity: GA < 29 weeks: Adjusted standardized ratios by site 102
Presentation #50d Mortality or major morbidity: GA < 29 weeks: Adjusted standardized ratios by site: Funnel plot 103
F. Discharge Disposition & Status Presentation #51 Final Discharge destination: All GA: Crude rates 105 Presentation #52 Support at discharge: Neonates who were discharged directly home: Crude rates 106 G. Hypoxic Ischemic Encephalopathy Presentation #53 Hypoxic Ischemic Encephalopathy 108 H. Trend Analyses over the last 8 years 111 I. 2018 CNN publications 130 J. Appendices Outcomes Definitions 134 CNN Definitions and Major Anomalies 135 Abbreviations 136

A. Executive Summary
1
A. Executive Summary
Inclusion summary: This report from the Canadian Neonatal NetworkTM (CNN) is based on data from 32 tertiary NICU sites that contributed data in the year 2018. Admissions between January 1, 2018 and December 31, 2018 who were discharged by March 31, 2019 were included. Eight (8) infants who were admitted in 2017 but discharged after March 31, 2018 were also included in the 2018 report. Delivery room deaths, moribund neonates, and readmissions from 2017 were excluded.
Total number of eligible admissions to participating Canadian sites 16 827 (See section D.1 for analyses)
Total number of eligible individual neonates 15 484 (See section D.2. for analyses)
Total number of eligible very preterm (GA <33 weeks) neonates 4 482 Total number of eligible extremely preterm (GA <29 weeks) neonates 2 299
(See section D.3. for analyses)
Total number of eligible very low birth weight (BW <1500 g) neonates 3 086 (See section D.3. for analyses) Important information for data interpretations:
a. Neonates who were transferred to a “normal newborn care area” (level I nursery) or discharged home within 24 hours of their admission to the site were excluded.
b. In 2018, seven (7) sites had resource limitations and were only able to contribute data from a subset of eligible neonates admitted to their NICUs. Each of these seven (7) sites included, at a minimum, all neonates born at less than 33 weeks’ gestational age (GA). See page 3 for data collection criteria of all participating sites.
c. Characteristics of participating sites were highlighted at the outset of the presentations.
d. ‘Missing’ data on outcome variables varied for each presentation. Caution should be used when interpreting the information. When possible, both the total number of neonates and the number of neonates with available data were provided.
e. The denominators for all percentages in this report included neonates whose data for that particular item were available.
f. This report included data from neonates who were admitted to the NICUs, except for Presentations #4, #6 and #6b.
g. Presentations #4, #6 and #6b included delivery room deaths. h. Neonates who were not admitted to participating NICUs were not included in
this report.
A. Executive Summary
2
Noteworthy findings:
a. Out of 32 CNN sites, 30 had maternity units in their facilities; and of those, 29 collected data on delivery room deaths in 2018.
b. 22% of all admitted neonates were outborn neonates and 14% of neonates of
<33 weeks’ GA were admitted as outborn neonates.
c. The survival rate has remained similar at lower GAs: i. At 22 weeks’ GA, 13% of all neonates and 34% of neonates who received
intensive care survived. ii. At 23 weeks’ GA, 34% of all neonates and 47% of neonates who received
intensive care survived.
d. The survival rate also remained similar at lower BWs: i. At 400-499g, 30% of all neonates and 52% of neonates who received
intensive care survived. ii. At 500-599g, 49% of all neonates and 61% of neonates who received
intensive care survived.
e. Among inborn neonates <29 weeks’ GA at birth: i. 44% received a complete course of antenatal steroids within the last week
prior to birth ii. 76% received MgSO4 for neuroprotection. iii. 47% received deferred cord clamping. iv. 28% were hypothermic (temperature <36.50C) on admission. v. 92% received antibiotics at some time during their stay. vi. 20% were never intubated during their stay. vii. 36% were exclusively breast milk feeding at discharge and 23% were
exclusively formula feeding at discharge.
f. A majority of neonates received <40% oxygen at the start of resuscitation.
g. Surgical ligation for PDA decreased and was done in 48 neonates.
h. NEC rates were 4% in neonates <33 weeks’ GA and 5% for VLBW neonates.
i. Stage 3 ROP occurred in 8% of neonates <33 weeks’ GA (6% required treatment) and in 9% of neonates <1500g BW (7% required treatment).
j. A total of 566 neonates were diagnosed with HIE and of whom 306 received hypothermia.

B. Site Characteristics
3
B. CNN Site Characteristics
SITE CNN data collection criteria
Level II / Step-down
nursery
Level II / Step-down
data included in CNN
Delivery room
deaths included in CNN
ROP treatment service?
PDA surgical service?
Victoria General Hospital All eligible admissions y y y y y
BC Women’s Hospital All eligible admissions y n y y y
Royal Columbian Hospital All eligible admissions y y y y n
Surrey Memorial Hospital All eligible admissions y y y n n
Foothills Medical Centre All eligible admissions n n/a y y y
Alberta Children’s Hospital All eligible admissions n n/a n/a y y
Royal Alexandra Hospital (Edmonton)* < 33 weeks GA & HIE y y y y n University of Alberta Hospital - Stollery (Edmonton)* All eligible admissions n n/a n/a n y
Regina General Hospital All eligible admissions y y y n n
Royal University Hospital All eligible admissions n n/a n n y
Health Sciences Centre Winnipeg <33 weeks GA, cardiacs, CDH & gastroschisis y y y y y
St. Boniface General Hospital All eligible admissions n n/a y y y
Hamilton Health Sciences All eligible admissions y n y y y
London Health Sciences Centre All eligible admissions y y y y y
Windsor Regional Hospital All eligible admissions n n/a y y n
Hospital for Sick Children All eligible admissions n n/a n/a y y
Mount Sinai Hospital All eligible admissions y y y n n
Sunnybrook Health Sciences Centre All eligible admissions n n/a y n n Children's Hospital of Eastern Ontario and the Ottawa Hospital** < 33 weeks GA y y y y y
Kingston General Hospital All eligible admissions y y y y y
Jewish General Hospital All eligible admissions y y y y n
Hôpital Sainte-Justine All eligible admissions y n y y y
Centre Hospitalier Universitaire de Quebec < 33 weeks GA y n y y y
Montreal Children’s Hospital - MUHC All eligible admissions n n/a y y y Centre Hospitalier Universitaire de Sherbrooke < 33 weeks GA & HIE y n y n n
Hôpital Maisonneuve-Rosemont < 33 weeks GA n n/a y y n
The Moncton Hospital All eligible admissions n n/a y n n
Dr. Everett Chalmers Hospital All eligible admissions n n/a y n n
Saint John Regional Hospital All eligible admissions n n y n n
Janeway Children's Health & Rehab Centre All eligible admissions y y y y y
IWK Health Centre < 37 weeks GA, HIE, CDH & gastroschisis y y y y y
Cape Breton Regional Hospital All eligible admissions n n/a y n n University of Utah Hospital All eligible admissions y n y n n
* Royal Alexandra Hospital & University of Alberta Hospital transmit data as one site ** Children's Hospital of Eastern Ontario and the Ottawa Hospital transmit data as one site
C. Information Systems
4
C. Information Systems
Neonates included in this report are those who were admitted to a CNN participating site between January 1, 2018 and December 31, 2018, and were discharged by March 31, 2019. The neonates must have had a length of stay at one of the CNN participating sites for greater than or equal to 24 hours, or died or were transferred to another level 2 or 3 facility within 24 hours. Eight (8) infants who were admitted in 2017 but discharged after March 31, 2018 were also included in the 2018 report. Delivery room deaths, moribund neonates, and readmissions from 2017 were excluded. A total of 15 484 patients accounted for 16 827 admissions as some neonates were admitted on more than one occasions. Patient information was retrospectively abstracted from patient charts by trained personnel using standard definitions and protocols contained in a standard manual of operations. Data were usually entered into a laptop computer using a customized data entry program with built-in error checking and subsequently sent electronically to the Canadian Neonatal Network™ Coordinating Centre located at the Maternal-Infant Care Research Centre (MiCare) in Toronto, Ontario. Patient data at each participating site are available to the respective site investigator and data abstractor only. Patient identifiers were stripped prior to data transfer to the Coordinating Centre. Patient confidentiality was strictly observed. A unique identifier was generated for each entry of neonate into the system and that identifier was followed throughout one or more hospital stays. Individual-level data are used for analyses, but only aggregate data are reported. The results presented in this report will not identify participating sites by name; each site is anonymous using a randomly assigned number. Whenever a small cell size (1 to 4 individuals) was observed in the data output, the data were grouped to maintain anonymity. At each participating site, data are stored in a secured database in the site or in an alternate secured site used by the site to store patient information (e.g. health records department, computer services department). At the Coordinating Centre, the central database is stored in a secured computer database located on a server and an off-site back up that is maintained and secured by the Mount Sinai Hospital Information Technology Department. At the Coordinating Centre, information was verified for completeness and was reviewed for accuracy by looking for “unusual” and missing values on individual data items and by comparison with other information that might be related (e.g. gestational age [GA] and birth weight [BW]). However, the principal accuracy rests upon the diligence and capabilities of the individual sites. Each site had one or occasionally two dedicated person(s) responsible for data acquisition and transmission. At the Coordinating Centre, analyses were conducted using univariate, bivariate, and multivariate analyses for the total cohort, and for individual sites. Multivariable regression analysis was used to identify risk factors associated with mortality and major morbidities. Grouped data enabled development of outcome graphs by GA and BW for mortality and selected major morbidities. Similar systems have been used to assist in quality assurance and predict resource utilization.

D. Descriptive Analyses
5
D. Descriptive Analyses
This section is divided into three sub-sections.
Section D.1. Analyses based on number of eligible admissions to participating sites
These include data from 16 827 eligible admissions (including readmissions) to 32 sites. 25 of these sites submitted complete data (n=14 832) on all admissions and 7 sites submitted data on a selected admission cohort (n=1 995).
Section D.2. Analyses based on number of eligible neonates admitted to participating sites
These include data from 15 484 eligible neonates admitted to 32 sites. 25 of these sites submitted complete data (n=13 239) on all eligible admitted neonates and 7 sites submitted data on selected eligible admitted neonates (n=2 245).
Section D.3. Analyses based on number of eligible very preterm (GA <33 weeks) or very low birth weight (BW <1500g) neonates
These include data from 4 482 eligible very preterm neonates and 3 086 eligible very low birth weight (VLBW) neonates.

D. Descriptive Analyses
6
Canadian Neonatal Network™ Database: Admissions between January 1, 2018 and December 31, 2018 who were discharged by March 31, 2019. Eight (8) infants who were admitted in 2017 but discharged after March 31, 2018 were also included in the 2018 report. Delivery room deaths, moribund neonates, and readmissions from 2017 were excluded.
GA > 33 weeks and
BW > 1500g
10 828
GA > 33 weeks and
BW < 1500g
166
Discharge destination Home 7 801 Non-CNN site 3 812 Intra-site 2 864 Tertiary site 525 Death 438 Palliative Care 32 Out of country 9 Missing 3
GA < 33 weeks and
BW > 1500g
1 563
GA < 33 weeks and
BW < 1500g
2 919
Section D.3 Very preterm
Section D.3 VLBW
Missing GA or BW 8
Total number of eligible very preterm neonates
(GA <33 weeks) 4 482
Total number of eligible very low birth weight
neonates (BW <1500g) 3 086*
* one baby is missing GA
Readmissions 541 Intra-CNN Transfers 802
Section D.2
Total number of eligible admissions to participating Canadian NICUs (32 sites)
16 827
14 832 from 25 sites with complete data 1 995 from 7 sites with restricted data
Section D.1
Total number of eligible individual neonates admitted to participating NICUs (32 sites)
15 484
13 239 from 25 sites with complete data 2 245 from 7 sites with restricted data

D. Descriptive Analyses
7
Section D.1
Analyses based on number of eligible admissions to participating sites
These include data from 16 827 eligible admissions (including readmissions) to 32 sites. 25 of these sites submitted complete data (n=14 832) on all admissions and 7 sites submitted data on a selected admission cohort (n=1 995).

D. Descriptive Analyses
8
Presentation #1 All admissions: Type of admissions: All Sites
ᶲ Data collected on selected cohort of eligible admissions only.
0
100
200
300
400
500
600
700
800
900
1000
1100
1200
aᶲ b c dᶲ e f g h iᶲ j k lᶲ
m n o p q r s tᶲ
uᶲ v w x y z
aaᶲ ab ac ad ae af
Num
ber o
f adm
issi
ons
CNN Hospitals
Inborn Outborn Readmission

D. Descriptive Analyses
9
Presentation #1 (continued) All admissions: Type of admissions: All Sites
Sites Admission Status
Total
Sites Admission status
Total Inborn Outborn Readmission Inborn Outborn Readmission
aᶲ Count 144 19 11 174 q Count 1059 90 9 1158
% 82.8 10.9 6.3 (100.0) % 91.5 7.8 0.8 (100.0)
b Count 1113 46 22 1181 r Count 467 25 13 505
% 94.2 3.9 1.9 (100.0) % 92.5 5.0 2.6 (100.0)
c Count 271 57 5 333 s Count 0 785 47 832
% 81.4 17.1 1.5 (100.0) % 0.0 94.4 5.7 (100.0)
dᶲ Count 322 426 129 877 tᶲ Count 106 14 4 124
% 36.7 48.6 14.7 (100.0) % 85.5 11.3 3.2 (100.0)
e Count 114 7 13 134 uᶲ Count 265 71 12 348
% 85.1 5.2 9.7 (100.0) % 76.2 20.4 3.5 (100.0)
f Count 759 216 67 1042 v Count 325 61 3 389
% 72.8 20.7 6.4 (100.0) % 83.6 15.7 0.8 (100.0)
g Count 555 301 5 861 w Count 361 64 3 428
% 64.5 35.0 0.6 (100.0) % 84.4 15.0 0.7 (100.0)
h Count 753 192 18 963 x Count 320 99 1 420
% 78.2 19.9 1.9 (100.0) % 76.2 23.6 0.2 (100.0)
iᶲ Count 77 17 9 103 y Count 323 5 7 335
% 74.8 16.5 8.7 (100.0) % 96.4 1.5 2.1 (100.0)
j Count 437 83 17 537 z Count 589 67 17 673
% 81.4 15.5 3.2 (100.0) % 87.5 10.0 2.5 (100.0)
k Count 0 317 8 325 aaᶲ Count 137 37 10 184
% 0.0 97.5 2.5 (100.0) % 74.5 20.1 5.4 (100.0)
lᶲ Count 151 30 4 185 ab Count 263 45 8 316
% 81.6 16.2 2.2 (100.0) % 83.2 14.2 2.5 (100.0)
m Count 411 131 4 546 ac Count 368 264 15 647
% 75.3 24.0 0.7 (100.0) % 56.9 40.8 2.3 (100.0)
n Count 352 69 7 428 ad Count 455 361 31 847
% 82.2 16.1 1.6 (100.0) % 53.7 42.6 3.7 (100.0)
o Count 643 107 15 765 ae Count 597 80 4 681
% 84.1 14.0 2.0 (100.0) % 87.7 11.8 0.6 (100.0)
p Count 264 33 14 311 af Count 138 23 9 170
% 84.9 10.6 4.5 (100.0) % 81.2 13.5 5.3 (100.0)
Total number of admissions: 16 827 Inborn: 12 139 (72.1%) Outborn: 4 142 (24.6%) Readmission: 541 (3.2%) Missing data on inborn/outborn status: 5 (0.0%)
COMMENTS: These analyses include 16 827 admissions to participating sites across Canada during the period of January 1, 2018 to December 31, 2018. After adjusting for readmission, 15 484 neonates are represented. Twenty-five sites collected data on all eligible admissions whereas seven sites (marked by ᶲ) collected data on selected cohort of eligible admissions only. See page 3 for data collection criteria of all participating sites.
D. Descriptive Analyses
10
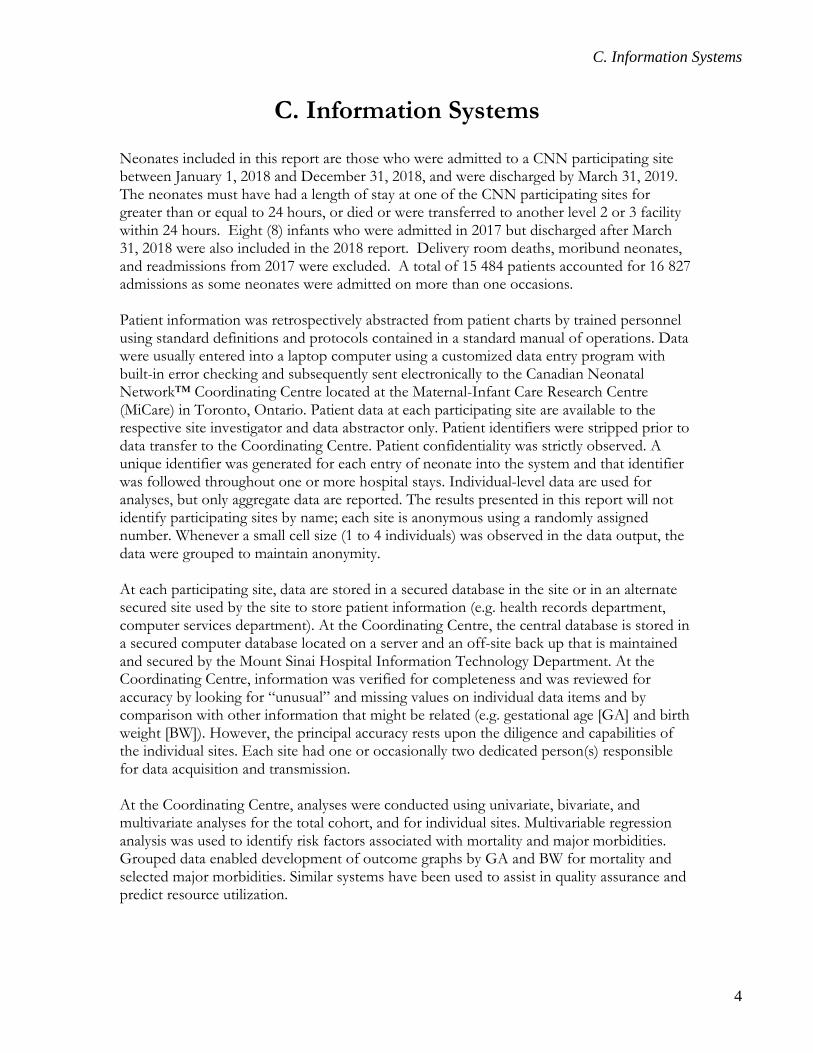
Presentation #2 All admissions: Admission illness severity scores (SNAP-II and SNAP-IIPE):
Sites with complete data (n=25 sites, 14 832 admissions, 667 missing data on SNAP-II scores)
Data
collection status
Number of sites
Score Mean Std Dev Q1 Median Q3
Complete 25 SNAPIIPE 10.0 0.1 0 0 18 SNAPII 4.9 0.1 0 0 7
Restricted 7 SNAPIIPE 14.7 0.4 0 7 23 SNAPII 6.7 0.3 0 0 9
0
1
2
3
4
5
6
7
8
9
10
11
12
13
14
15
16
17
B C D E F G H I J K M N O P R S T U Y Z AB AC AD AE AF
Mea
n Sc
ores
Site
SNAPPEII Score SNAPII Score SNAPPEII Mean SNAPII Mean

D. Descriptive Analyses
11
Presentation #2 (continued) All admissions: Admission illness severity scores
(SNAP-II and SNAP-IIPE): All sites Site SNAP-IIPE SNAP-II Site SNAP-IIPE SNAP-II
Aᶲ Mean 14.8 7.2
Qᶲ Mean 14.2 7.1
SEM 1.8 1.0 SEM 1.4 0.8
B Mean 11.5 6.1
R Mean 10.5 5.4
SEM 0.7 0.4 SEM 0.9 0.6
C Mean 16.3 7.9
S Mean 11.8 5.2
SEM 0.7 0.4 SEM 0.6 0.4
D Mean 4.1 2.1
T Mean 11.1 6.7
SEM 0.4 0.2 SEM 0.5 0.3
E Mean 6.4 2.5
U Mean 14.7 8.5
SEM 0.5 0.3 SEM 0.5 0.3
F Mean 7.3 2.7
Vᶲ Mean 8.4 3.3
SEM 0.4 0.2 SEM 1.0 0.5
G Mean 9.7 4.4
Wᶲ Mean 17.3 7.9
SEM 0.7 0.4 SEM 1.4 0.8
H Mean 11.7 5.5
Xᶲ Mean 9.9 3.6
SEM 0.6 0.4 SEM 0.8 0.5
I Mean 7.6 3.3
Y Mean 6.8 3.6
SEM 0.6 0.3 SEM 0.7 0.4
J Mean 11.5 4.0
Z Mean 10.0 5.7
SEM 0.5 0.3 SEM 0.5 0.3
K Mean 16.8 8.7
AAᶲ Mean 16.4 8.0
SEM 1.4 0.9 SEM 0.7 0.4
Lᶲ Mean 17.6 7.4
AB Mean 16.2 9.0
SEM 1.4 0.7 SEM 0.7 0.4
M Mean 7.1 3.1
AC Mean 8.5 3.5
SEM 0.6 0.4 SEM 0.7 0.4
N Mean 5.2 1.6
AD Mean 3.0 0.8
SEM 0.6 0.3 SEM 0.7 0.3
O Mean 10.0 5.1
AE Mean 4.7 2.6
SEM 0.7 0.4 SEM 0.5 0.3
P Mean 6.3 2.1
AF Mean 6.8 3.9
SEM 0.4 0.2 SEM 0.6 0.4 COMMENTS: These analyses include 16 827 admissions (689 missing data on SNAP scores) to participating all sites during the year 2018. Adjusting for readmission, these analyses represent 15 484 Neonates. Twenty-five sites collected data on all eligible admissions whereas seven sites (marked by ᶲ) collected data on a selected cohort of eligible admissions only. These seven sites were not included in the Presentation #2 bar graph but were included in the Presentation #2 Table (above). ᶲ Please note that the criteria for entering neonates in the CNN dataset are not the same for these seven sites and thus, the scores are not comparable with each other or with centers contributing complete data. These seven sites may have included neonates at lower GAs and/or lower BWs; thus, their severity of illness scores may be different.

D. Descriptive Analyses
12
Section D.2
Analyses based on number of eligible neonates admitted to participating sites
These include data from 15 484 eligible neonates admitted to 32 sites. 25 of these sites submitted complete data (n=13 239) on all eligible admitted neonates and 7 sites submitted data on a selected cohort of eligible admitted neonates (n=2 245).
D. Descriptive Analyses
13
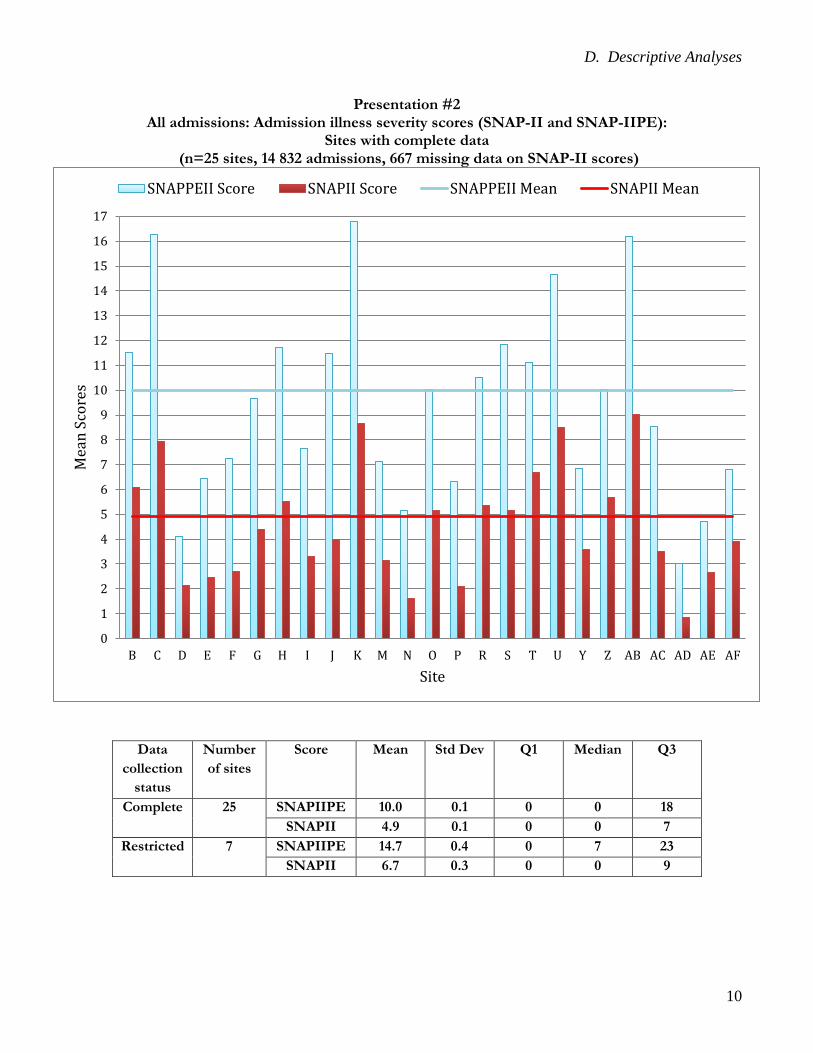
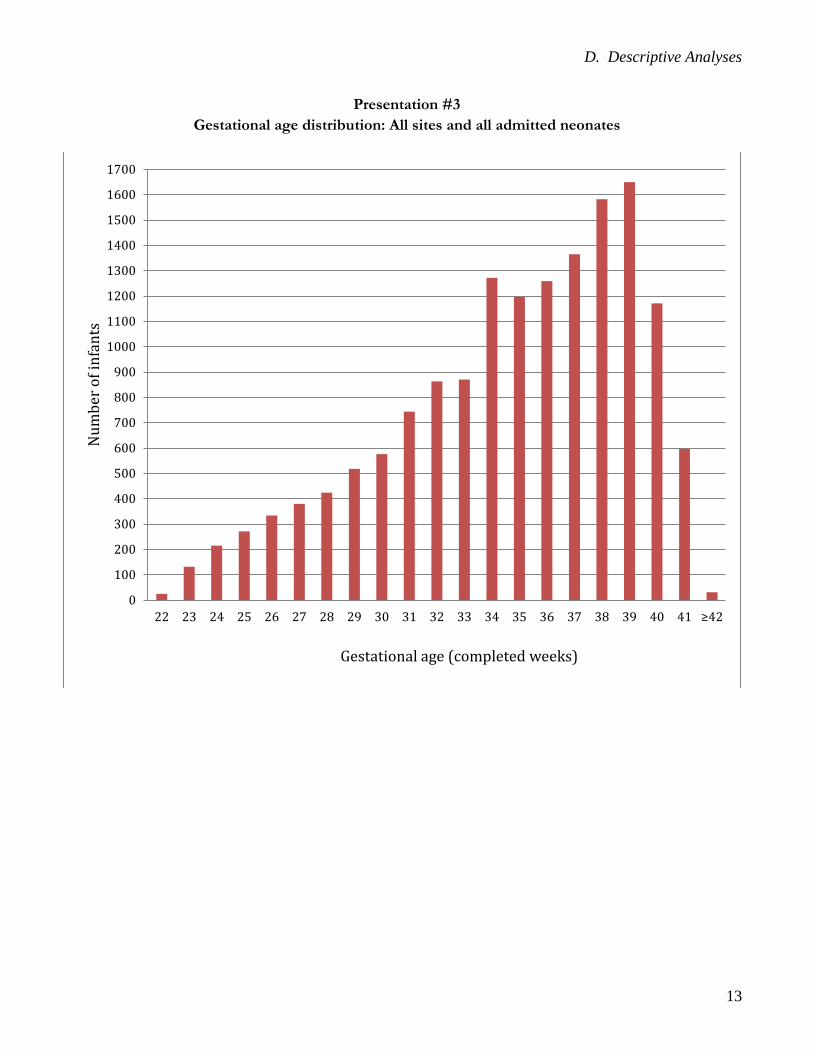
Presentation #3 Gestational age distribution: All sites and all admitted neonates
0
100
200
300
400
500
600
700
800
900
1000
1100
1200
1300
1400
1500
1600
1700
22 23 24 25 26 27 28 29 30 31 32 33 34 35 36 37 38 39 40 41 ≥42
Num
ber o
f inf
ants
Gestational age (completed weeks)
D. Descriptive Analyses
14
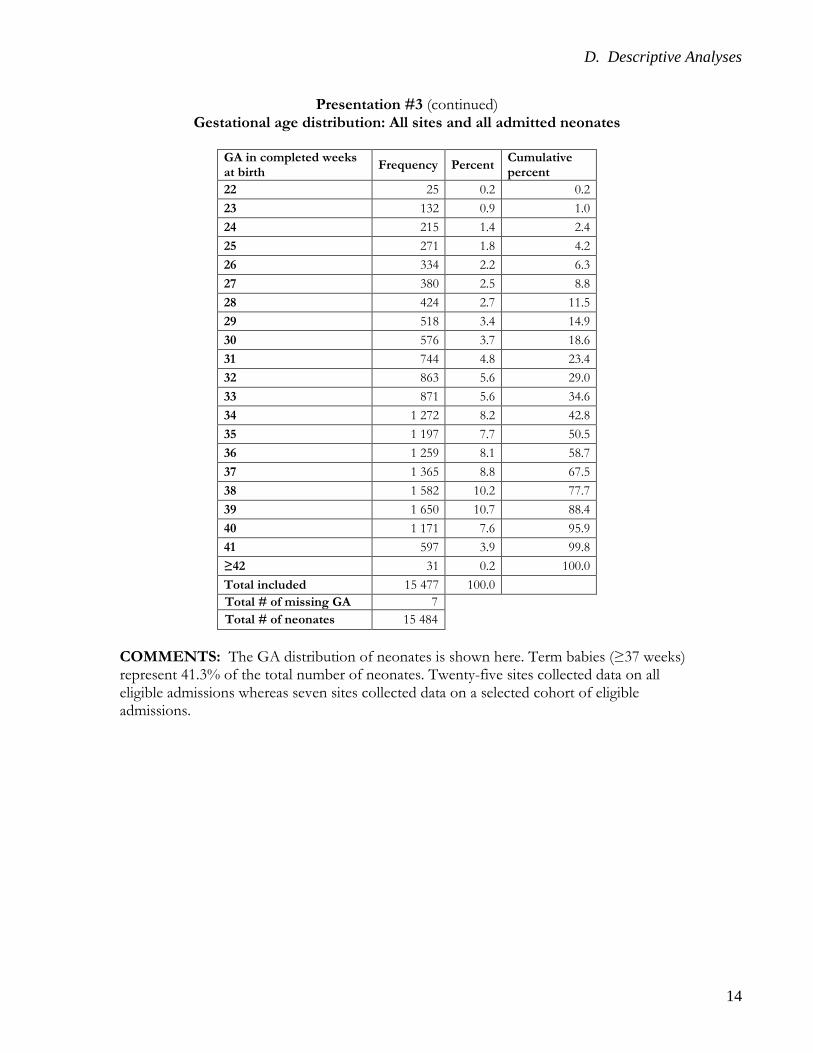
Presentation #3 (continued) Gestational age distribution: All sites and all admitted neonates
GA in completed weeks at birth Frequency Percent Cumulative
percent 22 25 0.2 0.2 23 132 0.9 1.0 24 215 1.4 2.4 25 271 1.8 4.2 26 334 2.2 6.3 27 380 2.5 8.8 28 424 2.7 11.5 29 518 3.4 14.9 30 576 3.7 18.6 31 744 4.8 23.4 32 863 5.6 29.0 33 871 5.6 34.6 34 1 272 8.2 42.8 35 1 197 7.7 50.5 36 1 259 8.1 58.7 37 1 365 8.8 67.5 38 1 582 10.2 77.7 39 1 650 10.7 88.4 40 1 171 7.6 95.9 41 597 3.9 99.8 ≥42 31 0.2 100.0 Total included 15 477 100.0 Total # of missing GA 7 Total # of neonates 15 484
COMMENTS: The GA distribution of neonates is shown here. Term babies (≥37 weeks) represent 41.3% of the total number of neonates. Twenty-five sites collected data on all eligible admissions whereas seven sites collected data on a selected cohort of eligible admissions.

D. Descriptive Analyses
15
Presentation #4 Survival to discharge by GA: All admissions, including delivery room (DR) deaths
*Please note that delivery room deaths are only included in Presentations #4, #6, and #6b in this report. **Active care refers to infants who received cardiopulmonary resuscitation at birth.
Note: The results should be used cautiously for antenatal counseling. The survival rates are based upon the final discharge from the participating neonatal site. Note that these rates include only neonates admitted to the sites or dying in the delivery rooms of participating sites and thus are not reflective of the entire Canadian population. Capturing data for delivery room deaths is an ongoing process and not all sites contributed delivery room death data.
0
10
20
30
40
50
60
70
80
90
100
22 23 24 25 26 27 28 29 ≥30
Perc
enta
ge o
f Sur
viva
l
Gestational age (completed weeks)
CNN admissions,excluding DRdeaths
All neonateswho receiedactive care
All neonates(CNNadmissions + DRdeaths)
CNN admissions, excluding delivery room deaths Delivery room deaths* Total CNN admissions including delivery room deaths*
GA (completed weeks)
#of neonates
#of survivors
Percent survival among CNN admissions, excluding DR deaths
#of neonates who received palliative care
Palliative care
Active care **
Total
#of neonates who received palliative care
# of neonates who received active care**
Percent survival among those who received active care
Percent survival among all neonates (CNN admissions + DR deaths)
a b b/a c d e a+d+e c+d (a-c) +e b/ (a-c)+e b/(a+d+e) 22 25 12 48 0 60 10 95 60 35 34 13 23 132 63 48 2 50 3 185 52 133 47 34 24 215 167 78 0 11 9 235 11 224 75 71 25 271 223 82 1 6 5 282 7 275 81 79 26 334 302 90 0 3 0 337 3 334 90 90 27 380 347 91 0 2 2 384 2 382 91 90 28 424 402 95 0 5 1 430 5 425 95 93 29 518 506 98 0 1 3 522 1 521 97 97 ≥30 13 178 13 017 99 1 23 12 13 213 24 13 189 99 99 Total included 15 477 15 039 97 4 161 45 15 683 165 15 518 97 96
Missing GA 7 0 0 7 0 7
Total 15 484 161 45 15 690 165 15 525
D. Descriptive Analyses
16
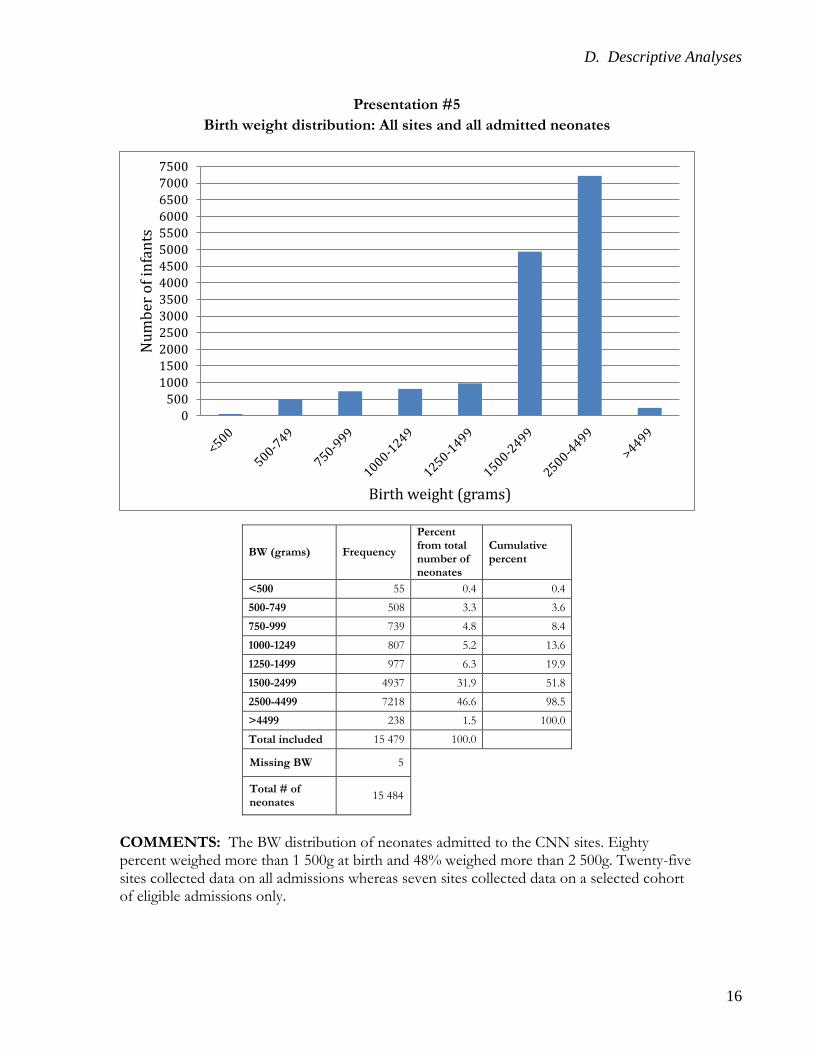
Presentation #5 Birth weight distribution: All sites and all admitted neonates
BW (grams) Frequency
Percent from total number of neonates
Cumulative percent
<500 55 0.4 0.4
500-749 508 3.3 3.6
750-999 739 4.8 8.4
1000-1249 807 5.2 13.6
1250-1499 977 6.3 19.9
1500-2499 4937 31.9 51.8
2500-4499 7218 46.6 98.5
>4499 238 1.5 100.0
Total included 15 479 100.0
Missing BW 5
Total # of neonates 15 484
COMMENTS: The BW distribution of neonates admitted to the CNN sites. Eighty percent weighed more than 1 500g at birth and 48% weighed more than 2 500g. Twenty-five sites collected data on all admissions whereas seven sites collected data on a selected cohort of eligible admissions only.
0500
10001500200025003000350040004500500055006000650070007500
Num
ber o
f inf
ants
Birth weight (grams)
D. Descriptive Analyses
17
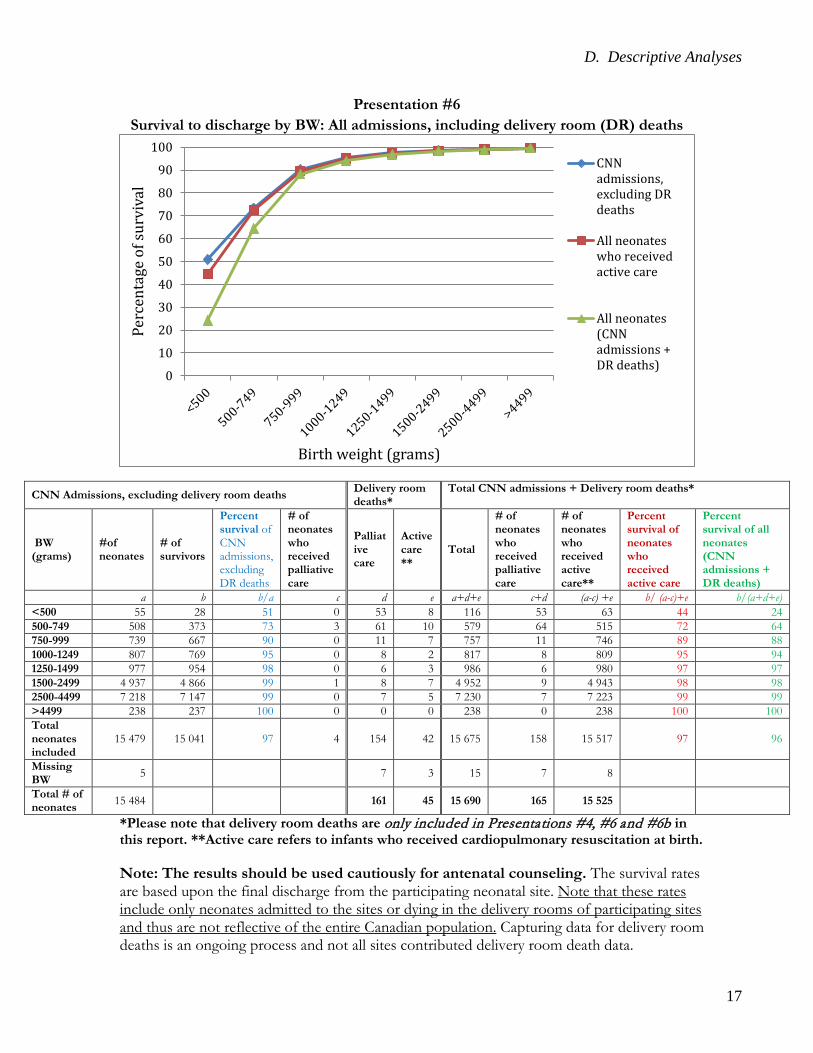
Presentation #6 Survival to discharge by BW: All admissions, including delivery room (DR) deaths
*Please note that delivery room deaths are only included in Presentations #4, #6 and #6b in this report. **Active care refers to infants who received cardiopulmonary resuscitation at birth. Note: The results should be used cautiously for antenatal counseling. The survival rates are based upon the final discharge from the participating neonatal site. Note that these rates include only neonates admitted to the sites or dying in the delivery rooms of participating sites and thus are not reflective of the entire Canadian population. Capturing data for delivery room deaths is an ongoing process and not all sites contributed delivery room death data.
0
10
20
30
40
50
60
70
80
90
100Pe
rcen
tage
of s
urvi
val
Birth weight (grams)
CNNadmissions,excluding DRdeaths
All neonateswho receivedactive care
All neonates(CNNadmissions +DR deaths)
CNN Admissions, excluding delivery room deaths Delivery room deaths*
Total CNN admissions + Delivery room deaths*
BW (grams)
#of neonates
# of survivors
Percent survival of CNN admissions, excluding DR deaths
# of neonates who received palliative care
Palliative care
Active care **
Total
# of neonates who received palliative care
# of neonates who received active care**
Percent survival of neonates who received active care
Percent survival of all neonates (CNN admissions + DR deaths)
a b b/a c d e a+d+e c+d (a-c) +e b/ (a-c)+e b/(a+d+e) <500 55 28 51 0 53 8 116 53 63 44 24 500-749 508 373 73 3 61 10 579 64 515 72 64 750-999 739 667 90 0 11 7 757 11 746 89 88 1000-1249 807 769 95 0 8 2 817 8 809 95 94 1250-1499 977 954 98 0 6 3 986 6 980 97 97 1500-2499 4 937 4 866 99 1 8 7 4 952 9 4 943 98 98 2500-4499 7 218 7 147 99 0 7 5 7 230 7 7 223 99 99 >4499 238 237 100 0 0 0 238 0 238 100 100 Total neonates included
15 479 15 041 97 4 154 42 15 675 158 15 517 97 96
Missing BW 5 7 3 15 7 8 Total # of neonates 15 484 161 45 15 690 165 15 525
D. Descriptive Analyses
18
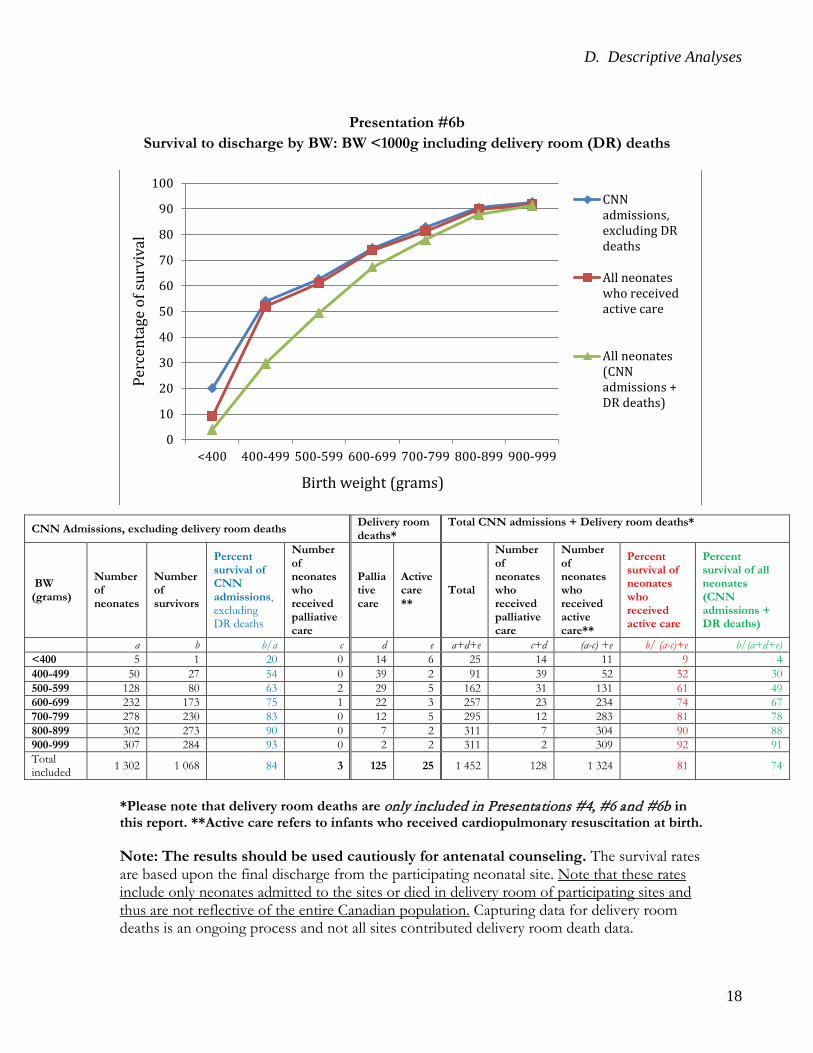
Presentation #6b
Survival to discharge by BW: BW <1000g including delivery room (DR) deaths
*Please note that delivery room deaths are only included in Presentations #4, #6 and #6b in this report. **Active care refers to infants who received cardiopulmonary resuscitation at birth. Note: The results should be used cautiously for antenatal counseling. The survival rates are based upon the final discharge from the participating neonatal site. Note that these rates include only neonates admitted to the sites or died in delivery room of participating sites and thus are not reflective of the entire Canadian population. Capturing data for delivery room deaths is an ongoing process and not all sites contributed delivery room death data.
0
10
20
30
40
50
60
70
80
90
100
<400 400-499 500-599 600-699 700-799 800-899 900-999
Perc
enta
ge o
f sur
viva
l
Birth weight (grams)
CNNadmissions,excluding DRdeaths
All neonateswho receivedactive care
All neonates(CNNadmissions +DR deaths)
CNN Admissions, excluding delivery room deaths Delivery room deaths*
Total CNN admissions + Delivery room deaths*
BW (grams)
Number of neonates
Number of survivors
Percent survival of CNN admissions, excluding DR deaths
Number of neonates who received palliative care
Palliative care
Active care **
Total
Number of neonates who received palliative care
Number of neonates who received active care**
Percent survival of neonates who received active care
Percent survival of all neonates (CNN admissions + DR deaths)
a b b/a c d e a+d+e c+d (a-c) +e b/ (a-c)+e b/(a+d+e) <400 5 1 20 0 14 6 25 14 11 9 4 400-499 50 27 54 0 39 2 91 39 52 52 30 500-599 128 80 63 2 29 5 162 31 131 61 49 600-699 232 173 75 1 22 3 257 23 234 74 67 700-799 278 230 83 0 12 5 295 12 283 81 78 800-899 302 273 90 0 7 2 311 7 304 90 88 900-999 307 284 93 0 2 2 311 2 309 92 91 Total included 1 302 1 068 84 3 125 25 1 452 128 1 324 81 74

D. Descriptive Analyses
19
Presentation #7a Maternal and peripartum characteristics: All neonates
Characteristics GA at birth (completed weeks) Missing/
Unknown <26 26-28 29-32 33 - 36 >37 Total
Total 7 643 1138 2701 4599 6396 15477 No prenatal care 462 N 26 52 133 80 72 363
% 4.2 4.7 5.1 1.8 1.2 2.4 Marijuana/cannabis 181 N 34 89 146 302 320 891
% 5.3 7.9 5.5 6.6 5.1 5.8 Smoking 108 N 87 180 356 680 805 2108
% 13.6 15.9 13.3 14.9 12.7 13.7 Maternal hypertension 936 N 74 208 605 903 664 2454
% 11.9 18.9 23.3 20.5 11.4 16.9 Maternal diabetes 981 N 52 152 500 899 1029 2632
% 8.5 14.1 19.4 20.6 17.6 18.1 Assisted pregnancy (ART) 10 N 94 103 264 410 227 1098
% 14.6 9.1 9.8 8.9 3.6 7.1 Multiples 10 N 179 325 833 1302 165 2804
% 27.9 28.6 30.8 28.3 2.6 18.1 MgSO4 for neuroprotection
1086 N 447 786 1410 350 33 3026 % 73.6 74.2 55.8 8.0 0.6 21.0
Antenatal steroids None 453 N 75 120 278 2735 6148 9356
% 11.9 10.9 10.7 61.4 98.4 62.2
Partial N 186 266 653 320 8 1433 % 29.4 24.1 25.2 7.2 0.1 9.5
Complete N 372 716 1659 1403 92 4242 % 58.8 65.0 64.1 31.5 1.5 28.2
Mode of birth Vaginal 59 N 294 386 1000 2043 3744 7467
% 45.8 34.0 37.1 44.6 58.8 48.4
C/S N 348 750 1693 2540 2627 7958 % 54.2 66.0 62.9 55.4 41.2 51.6
Presentation Vertex 1292 N 312 620 1788 3436 5268 11424 % 51.0 57.8 70.9 80.3 92.3 80.5
Breech N 276 392 632 758 357 2415 % 45.1 36.5 25.1 17.7 6.3 17.0
Other N 24 61 103 83 82 353 % 3.9 5.7 4.1 1.9 1.4 2.5
Rupture of membranes <24 h 1276 N 437 809 1914 3688 5205 12053
% 71.4 76.1 76.1 85.4 91.3 84.8 24h to 1wk
N 102 127 307 392 402 1330 % 16.7 12.0 12.2 9.1 7.1 9.4
>1 wk N 73 127 294 237 94 825 % 11.9 12.0 11.7 5.5 1.7 5.8

D. Descriptive Analyses
20
Presentation #7a (continued) Maternal and peripartum characteristics: All neonates
Characteristics GA at birth (completed weeks) Missing/
Unknown <26 26-28 29-32 33 - 36 >37 Total
Total 621 1053 2684 4332 6083 14773 Chorioamnionitis* 2260 N 252 296 387 291 545 1771
% 41.9 28.3 15.9 7.3 10.6 13.4 Deferred cord clamping
< 29 sec 3186 N 33 48 95 89 76 341 % 5.8 4.8 4.1 2.3 1.6 2.8
30-59 sec N 98 182 438 616 495 1829 % 17.3 18.3 18.9 16.2 10.7 14.9
>60 sec N 145 287 941 1329 1213 3915 % 25.6 28.8 40.7 35.0 26.3 31.8
Yes, but timing unknown
N 6 22 57 236 295 616 % 1.1 2.2 2.5 6.2 6.4 5.0
No N 285 456 782 1532 2542 5597 % 50.3 45.8 33.8 40.3 55.0 45.5
*Chorioamnionitis is defined as documented histological chorioamnionitis on placenta pathology or “suspected or confirmed clinical chorioamnionitis” in chart or presence of maternal fever and either leukocytosis or purulent discharge or fetal tachycardia.
D. Descriptive Analyses
21
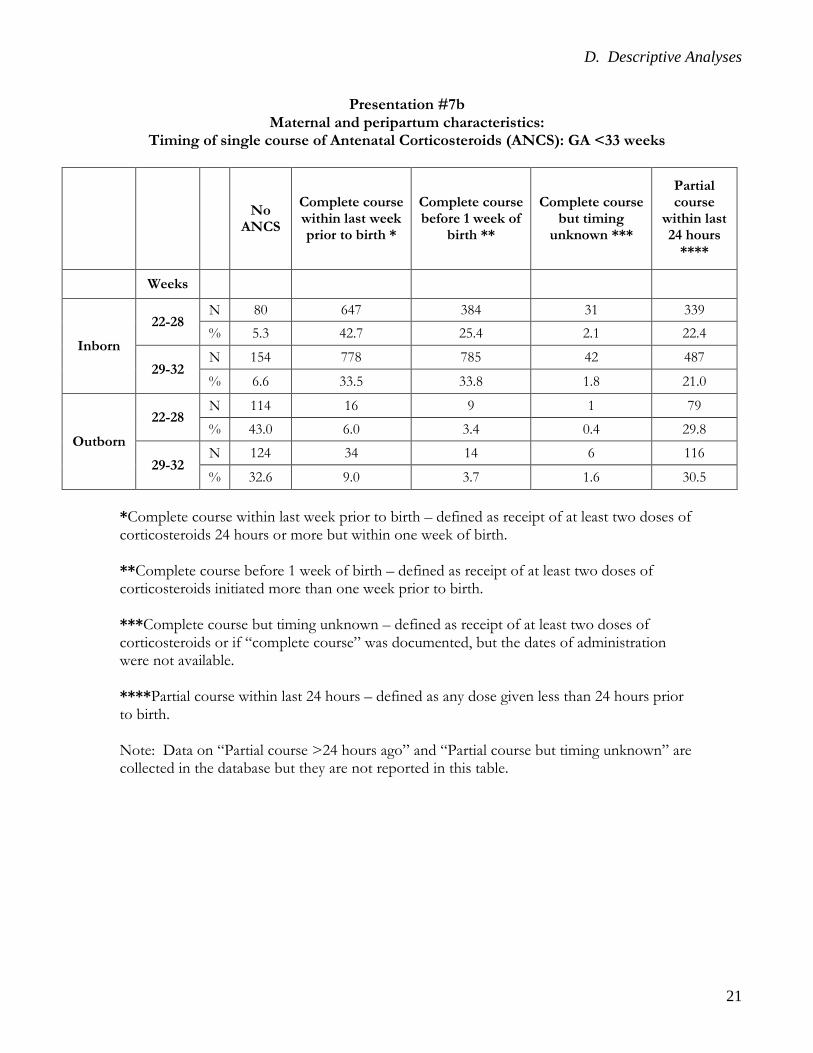
Presentation #7b Maternal and peripartum characteristics:
Timing of single course of Antenatal Corticosteroids (ANCS): GA <33 weeks
No ANCS
Complete course within last week prior to birth *
Complete course before 1 week of
birth **
Complete course but timing
unknown ***
Partial course
within last 24 hours
****
Weeks
Inborn
22-28 N 80 647 384 31 339
% 5.3 42.7 25.4 2.1 22.4
29-32 N 154 778 785 42 487
% 6.6 33.5 33.8 1.8 21.0
Outborn
22-28 N 114 16 9 1 79
% 43.0 6.0 3.4 0.4 29.8
29-32 N 124 34 14 6 116
% 32.6 9.0 3.7 1.6 30.5
*Complete course within last week prior to birth – defined as receipt of at least two doses of corticosteroids 24 hours or more but within one week of birth. **Complete course before 1 week of birth – defined as receipt of at least two doses of corticosteroids initiated more than one week prior to birth. ***Complete course but timing unknown – defined as receipt of at least two doses of corticosteroids or if “complete course” was documented, but the dates of administration were not available. ****Partial course within last 24 hours – defined as any dose given less than 24 hours prior to birth. Note: Data on “Partial course >24 hours ago” and “Partial course but timing unknown” are collected in the database but they are not reported in this table.

D. Descriptive Analyses
22
Presentation #7c Maternal and peripartum characteristics:
Timing of deferred cord clamping: GA <33 weeks
Singleton Deferred Cord clamping timing
Immediate Cord
clamping
Unknown timing 0-15
seconds 16-30
seconds 31-60
seconds 61-75
seconds >75
seconds Duration unknown
Weeks
Inborn 22-28 N 21 117 395 6 15 17 434 60
% 2.0 11.0 37.1 0.6 1.4 1.6 40.8 5.6
29-32 N 16 170 763 10 32 41 429 95 % 1.0 10.9 49.0 0.6 2.1 2.6 27.6 6.1
Outborn 22-28 N 1 10 21 0 0 2 81 95
% 0.5 4.8 10.0 0.0 0.0 1.0 38.6 45.2
29-32 N 0 11 37 2 4 0 70 188 % 0.0 3.5 11.9 0.6 1.3 0.0 22.4 60.3
First twin
Deferred Cord clamping timing Immediate
Cord clamping
Unknown timing 0-15
seconds 16-30
seconds 31-60
seconds 61-75
seconds >75
seconds Duration unknown
Weeks
Inborn 22-28 N 1 23 70 1 1 5 95 14
% 0.5 11.0 33.3 0.5 0.5 2.4 45.2 6.7
29-32 N 6 30 152 1 4 5 116 21 % 1.8 9.0 45.4 0.3 1.2 1.5 34.6 6.3
Outborn 22-28
N 0 2 1 0 0 0 8 12 % 0.0 8.7 4.4 0.0 0.0 0.0 34.8 52.2
29-32 N 0 3 3 0 1 1 7 15 % 0.0 10.0 10.0 0.0 3.3 3.3 23.3 50.0
Second twin
Deferred Cord clamping timing Immediate
Cord clamping
Unknown timing 0-15
seconds 16-30
seconds 31-60
seconds 61-75
seconds >75
seconds Duration unknown
Weeks
Inborn 22-28
N 4 23 65 0 2 4 89 19 % 1.9 11.2 31.6 0.0 1.0 1.9 43.2 9.2
29-32 N 3 33 144 0 3 5 116 33 % 0.9 9.8 42.7 0.0 0.9 1.5 34.4 9.8
Outborn 22-28
N 0 1 1 0 0 0 13 11 % 0.0 3.9 3.9 0.0 0.0 0.0 50.0 42.3
29-32 N 0 2 1 0 1 1 5 20 % 0.0 6.7 3.3 0.0 3.3 3.3 16.7 66.7
D. Descriptive Analyses
23
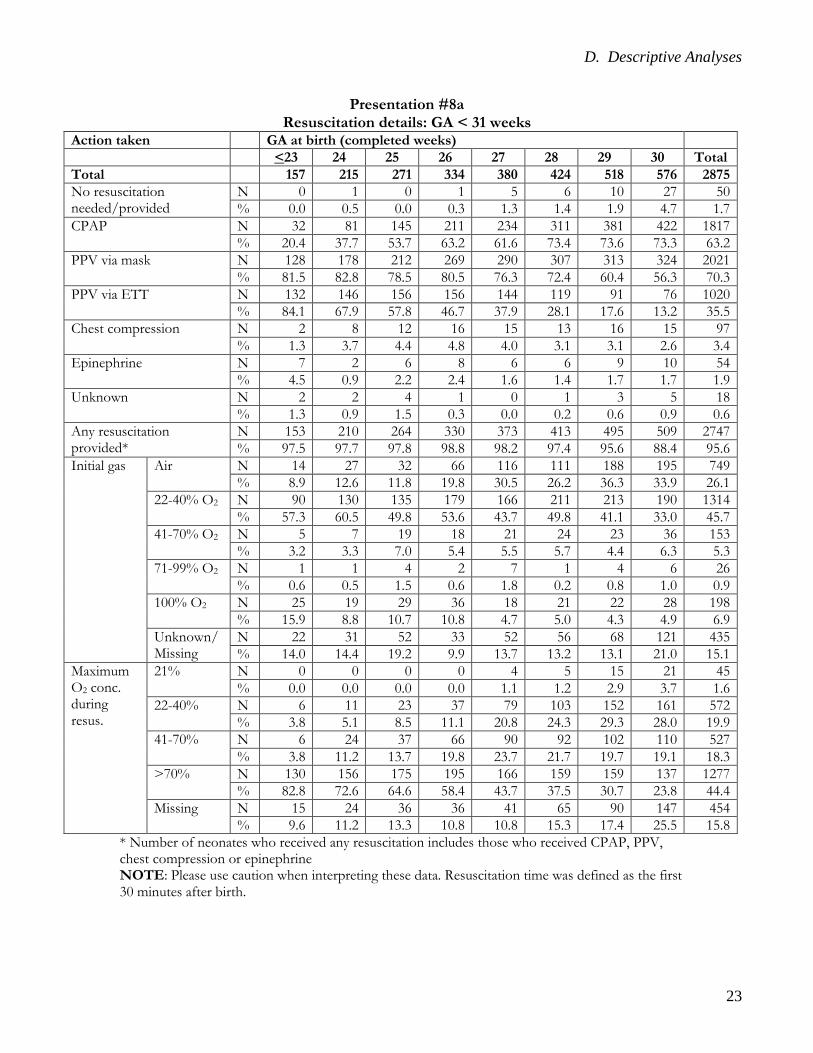
Presentation #8a Resuscitation details: GA < 31 weeks
Action taken GA at birth (completed weeks) <23 24 25 26 27 28 29 30 Total Total 157 215 271 334 380 424 518 576 2875 No resuscitation needed/provided
N 0 1 0 1 5 6 10 27 50 % 0.0 0.5 0.0 0.3 1.3 1.4 1.9 4.7 1.7
CPAP N 32 81 145 211 234 311 381 422 1817 % 20.4 37.7 53.7 63.2 61.6 73.4 73.6 73.3 63.2
PPV via mask N 128 178 212 269 290 307 313 324 2021 % 81.5 82.8 78.5 80.5 76.3 72.4 60.4 56.3 70.3
PPV via ETT N 132 146 156 156 144 119 91 76 1020 % 84.1 67.9 57.8 46.7 37.9 28.1 17.6 13.2 35.5
Chest compression N 2 8 12 16 15 13 16 15 97 % 1.3 3.7 4.4 4.8 4.0 3.1 3.1 2.6 3.4
Epinephrine N 7 2 6 8 6 6 9 10 54 % 4.5 0.9 2.2 2.4 1.6 1.4 1.7 1.7 1.9
Unknown N 2 2 4 1 0 1 3 5 18 % 1.3 0.9 1.5 0.3 0.0 0.2 0.6 0.9 0.6
Any resuscitation provided*
N 153 210 264 330 373 413 495 509 2747 % 97.5 97.7 97.8 98.8 98.2 97.4 95.6 88.4 95.6
Initial gas Air N 14 27 32 66 116 111 188 195 749 % 8.9 12.6 11.8 19.8 30.5 26.2 36.3 33.9 26.1
22-40% O2 N 90 130 135 179 166 211 213 190 1314 % 57.3 60.5 49.8 53.6 43.7 49.8 41.1 33.0 45.7
41-70% O2 N 5 7 19 18 21 24 23 36 153 % 3.2 3.3 7.0 5.4 5.5 5.7 4.4 6.3 5.3
71-99% O2 N 1 1 4 2 7 1 4 6 26 % 0.6 0.5 1.5 0.6 1.8 0.2 0.8 1.0 0.9
100% O2 N 25 19 29 36 18 21 22 28 198 % 15.9 8.8 10.7 10.8 4.7 5.0 4.3 4.9 6.9
Unknown/Missing
N 22 31 52 33 52 56 68 121 435 % 14.0 14.4 19.2 9.9 13.7 13.2 13.1 21.0 15.1
Maximum O2 conc. during resus.
21% N 0 0 0 0 4 5 15 21 45 % 0.0 0.0 0.0 0.0 1.1 1.2 2.9 3.7 1.6
22-40% N 6 11 23 37 79 103 152 161 572 % 3.8 5.1 8.5 11.1 20.8 24.3 29.3 28.0 19.9
41-70% N 6 24 37 66 90 92 102 110 527 % 3.8 11.2 13.7 19.8 23.7 21.7 19.7 19.1 18.3
>70% N 130 156 175 195 166 159 159 137 1277 % 82.8 72.6 64.6 58.4 43.7 37.5 30.7 23.8 44.4
Missing N 15 24 36 36 41 65 90 147 454 % 9.6 11.2 13.3 10.8 10.8 15.3 17.4 25.5 15.8
* Number of neonates who received any resuscitation includes those who received CPAP, PPV, chest compression or epinephrine NOTE: Please use caution when interpreting these data. Resuscitation time was defined as the first 30 minutes after birth.

D. Descriptive Analyses
24
Presentation #8b Resuscitation details: GA > 31 weeks
Action taken GA at birth (completed weeks) 31 32 33 34 35 36 >37 Total Total 744 863 971 1272 1197 1259 6396 12602 No resuscitation needed / provided
N 72 119 209 398 451 510 2426 4185 % 9.7 13.8 24.0 31.3 37.7 40.5 37.9 33.2
CPAP N 500 535 397 498 402 336 1815 4483 % 67.2 62.0 45.6 39.2 33.6 26.7 28.4 35.6
PPV via mask N 359 373 267 357 279 297 1809 3741 % 48.3 43.2 30.7 28.1 23.3 23.6 28.3 29.7
PPV via ETT N 57 61 53 46 49 50 440 756 % 7.7 7.1 6.1 3.6 4.1 4.0 6.9 6.0
Chest compression N 12 11 12 14 14 8 126 197 % 1.6 1.3 1.4 1.1 1.2 0.6 2.0 1.6
Epinephrine N 8 5 5 8 5 3 41 75 % 1.1 0.6 0.6 0.6 0.4 0.2 0.6 0.6
Unknown N 11 14 14 18 18 22 153 250 % 1.5 1.6 1.6 1.4 1.5 1.8 2.4 2.0
Any resuscitation provided*
N 610 649 490 621 489 472 2708 6039 % 82.0 75.2 56.3 48.8 40.9 37.5 42.4 47.9
Initial gas Air N 291 349 239 268 273 267 1356 3043 % 39.1 40.4 27.4 21.1 22.8 21.2 21.2 24.1
22-40% O2 N 216 193 179 243 151 134 593 1709 % 29.0 22.4 20.6 19.1 12.6 10.6 9.3 162.7
41-70% O2 N 31 18 20 37 25 28 136 295 % 4.2 2.1 2.3 2.9 2.1 2.2 2.1 2.3
71-99% O2 N 4 6 4 1 5 2 22 44 % 0.5 0.7 0.5 0.1 0.4 0.2 0.3 0.3
100% O2 N 16 22 33 47 27 47 273 465 % 2.2 2.6 3.8 3.7 2.3 3.7 4.3 3.7
Unknown/Missing
N 186 275 396 676 716 781 4016 7046 % 25.0 31.9 45.5 53.1 59.8 62.0 62.8 55.9
Maximum O2 conc. during resus
21% N 40 56 64 82 82 97 344 765 % 5.4 6.5 7.4 6.5 6.9 7.7 5.4 6.1
22-40% N 214 234 153 229 176 140 659 1805 % 28.8 27.1 17.6 18.0 14.7 11.1 10.3 14.3
41-70% N 144 118 74 97 67 83 336 919 % 19.4 13.7 8.5 7.6 5.6 6.6 5.3 7.3
>70% N 133 135 113 122 128 127 851 1609 % 17.9 15.6 13.0 9.6 10.7 10.1 13.3 12.8
Missing N 213 320 467 742 744 812 4206 7504 % 28.6 37.1 53.6 58.3 62.2 64.5 65.8 59.5
* Number of neonates who received any resuscitation includes those who received CPAP, PPV, Chest compression or epinephrine NOTE: Please use caution while interpreting these data. Resuscitation time was defined as the first 30 minutes after birth.

D. Descriptive Analyses
25
Presentation #9 Early onset sepsis rates: All GA
GA at birth (completed weeks)
Total number
of neonates
No. of neonates
with infection
% of neonates
with infection
Total number of organisms
Organism
E. Coli GBS Others
<25 372 16 4.3 17 11 3 3 25-26 605 15 2.5 15 8 3 4 27-28 804 14 1.7 14 9 0 5 29-30 1 094 13 1.2 14 5 2 7 31-32 1 607 11 0.7 11 5 1 5 33-34 2 143 13 0.6 14 4 3 7 35-36 2 456 8 0.3 8 3 2 3 ≥37 6 396 33 0.5 34 4 13 17 Total neonates included 15 477 123 0.8 127 49 27 51
Missing 7 Total # of neonates 15 484
COMMENTS: Early onset sepsis is indicated by positive bacterial, viral or fungal culture in blood and/or cerebrospinal fluid, in the first two days after birth. Two neonates had two organisms isolated. In other category, top five organisms were: Streptococci other than GBS (n=14), Staph aureus (n=8), Cytomegalovirus (n=5), Enterococci (n=4), Hemophilus influenza (n=4). In contrast to previous CNN reports, CONS was not included as an organism causing early onset sepsis in this report based on consultation with microbiologists.
0.0
1.0
2.0
3.0
4.0
5.0
<25 25-26 27-28 29-30 31-32 33-34 35-36 ≥37
Perc
enta
ge o
f inf
ants
Gestational age (completed weeks)

D. Descriptive Analyses
26
Presentation #10 Late onset sepsis rates: All GA
COMMENTS: Late onset sepsis is defined as any positive blood and/or cerebrospinal fluid culture for bacteria, viral or fungi after 2 days of age (analysis is neonate-based). The numbers are adjusted for readmission. Among other category, top 5 organisms were: GBS (n=45), Enterococci (n=28), Klebsiella (n=24), Enterobacter (n=12), Candida albicans (n=11).
0
5
10
15
20
25
30
35
40
<25 25-26 27-28 29-30 31-32 33-34 35-36 ≥37
Perc
enta
ge o
f inf
ants
Gestational age (completed weeks)
GA at birth (completed
weeks)
Total number
Number of deaths in the first 2 days after birth
Number of neonates survived
beyond day 2 after birth
Number of neonates
with at least one
infection
Number of neonates
with more than one infection
Among neonates who survived day 2,
percentage with at least one
infection
Total number of organisms
Organisms
CONS E. Coli Staph aureus Fungal Virus Other
<25 372 29 343 137 35 40 192 61 27 46 10 2 46 25-26 605 14 591 132 22 22 179 64 24 37 9 6 39 27-28 804 14 790 87 13 11 103 45 13 17 0 1 27 29-30 1 094 6 1 088 45 3 4 52 19 5 11 0 0 17 31-32 1 607 7 1 600 37 1 2 37 16 1 8 2 3 7 33-34 2 143 6 2 137 21 2 1 24 5 2 9 0 3 5 35-36 2 456 4 2 452 27 3 1 31 12 4 6 1 1 7 ≥37 6 396 15 6 381 67 3 1 70 21 14 7 1 10 17
Total included 15 477 95 15 382 553 82 4 688 243 90 141 23 26 165
Missing 7 Total # of neonates 15 484

D. Descriptive Analyses
27
Presentation #11 Late onset sepsis rates: All BW
BW (grams)
Total number
Number of
deaths in the first 2 days after birth
Number of
neonates survived beyond day 2
after birth
Number of
neonates with at
least one infection
Number of
neonates with more than one infection
Among neonates
who survived
day 2, percentage with at least
one infection
Total number
of organis
ms
Organisms
CONS
E. Coli
Staph aureu
s
Fungal Virus Other
<500 55 6 49 17 6 35 30 10 1 7 1 4 7 500-749 508 26 482 146 39 30 203 74 27 43 8 4 47 750-999 739 15 724 145 20 20 183 69 28 40 7 1 38 1000-1499 1 784 16 1 768 96 6 5 108 36 12 24 4 2 30 1500-1999 2 309 6 2 303 43 5 2 50 17 2 10 1 1 19 2000-2499 2 628 6 2 622 30 2 1 32 12 2 5 2 5 6 >2500 7 456 20 7 436 76 4 1 82 25 18 12 0 9 18 Total included 15 479 95 15 384 553 82 4 688 243 90 141 23 26 165
Missing (BW) 5
Total # of neonates 15 484
COMMENTS: Late onset sepsis is defined as any positive blood and/or cerebrospinal fluid culture for bacteria, viral or fungi after 2 days of age (analysis is neonate-based). The numbers are adjusted for readmission and transfer. Among other category, top 5 organisms were: GBS (n=45), Enterococci (n=28), Klebsiella (n=24), Enterobacter (n=12), Candida albicans (n=11).
0
5
10
15
20
25
30
35
<500 500-749 750-999 1000-1499 1500-1999 2000-2499 ≥2500
Perc
enta
ge o
f inf
ants
Birth weight (grams)
D. Descriptive Analyses
28
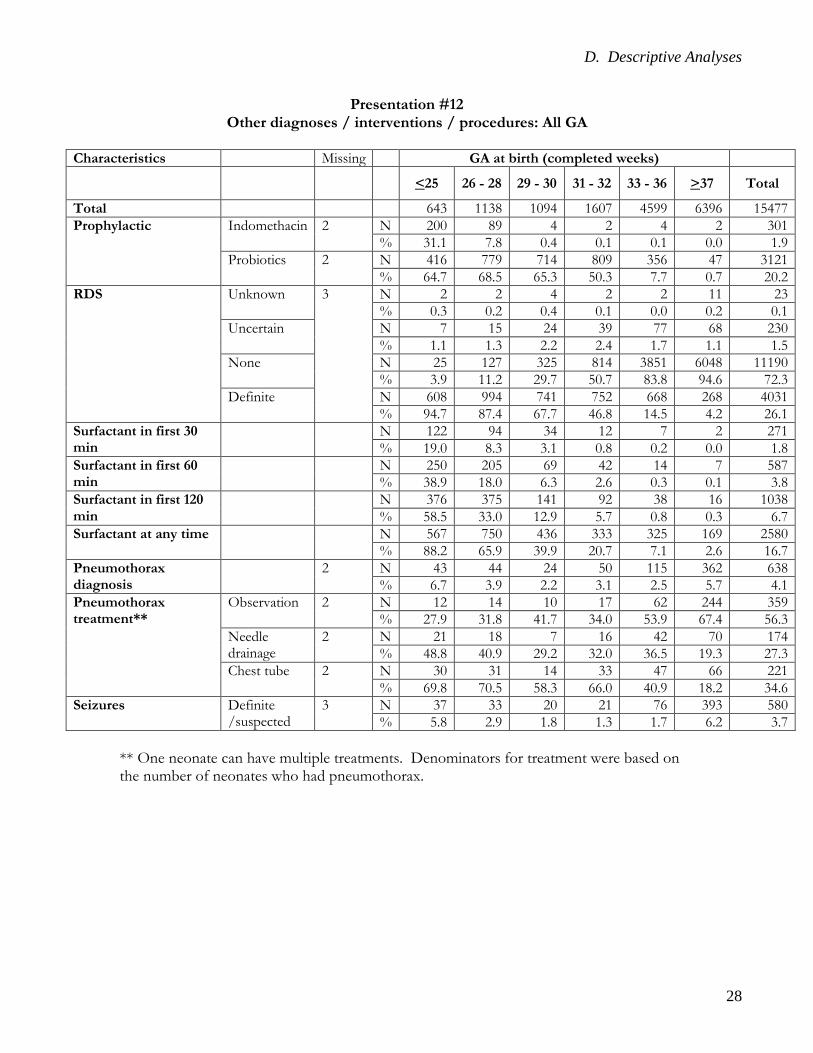
Presentation #12 Other diagnoses / interventions / procedures: All GA
Characteristics Missing GA at birth (completed weeks) <25 26 - 28 29 - 30 31 - 32 33 - 36 >37 Total
Total 643 1138 1094 1607 4599 6396 15477 Prophylactic Indomethacin 2 N 200 89 4 2 4 2 301
% 31.1 7.8 0.4 0.1 0.1 0.0 1.9 Probiotics 2 N 416 779 714 809 356 47 3121
% 64.7 68.5 65.3 50.3 7.7 0.7 20.2 RDS Unknown 3 N 2 2 4 2 2 11 23
% 0.3 0.2 0.4 0.1 0.0 0.2 0.1 Uncertain N 7 15 24 39 77 68 230
% 1.1 1.3 2.2 2.4 1.7 1.1 1.5 None N 25 127 325 814 3851 6048 11190
% 3.9 11.2 29.7 50.7 83.8 94.6 72.3 Definite N 608 994 741 752 668 268 4031
% 94.7 87.4 67.7 46.8 14.5 4.2 26.1 Surfactant in first 30 min
N 122 94 34 12 7 2 271 % 19.0 8.3 3.1 0.8 0.2 0.0 1.8
Surfactant in first 60 min
N 250 205 69 42 14 7 587 % 38.9 18.0 6.3 2.6 0.3 0.1 3.8
Surfactant in first 120 min
N 376 375 141 92 38 16 1038 % 58.5 33.0 12.9 5.7 0.8 0.3 6.7
Surfactant at any time N 567 750 436 333 325 169 2580 % 88.2 65.9 39.9 20.7 7.1 2.6 16.7
Pneumothorax diagnosis
2 N 43 44 24 50 115 362 638 % 6.7 3.9 2.2 3.1 2.5 5.7 4.1
Pneumothorax treatment**
Observation 2 N 12 14 10 17 62 244 359 % 27.9 31.8 41.7 34.0 53.9 67.4 56.3
Needle drainage
2 N 21 18 7 16 42 70 174 % 48.8 40.9 29.2 32.0 36.5 19.3 27.3
Chest tube 2 N 30 31 14 33 47 66 221 % 69.8 70.5 58.3 66.0 40.9 18.2 34.6
Seizures Definite /suspected
3 N 37 33 20 21 76 393 580 % 5.8 2.9 1.8 1.3 1.7 6.2 3.7
** One neonate can have multiple treatments. Denominators for treatment were based on the number of neonates who had pneumothorax.
D. Descriptive Analyses
29
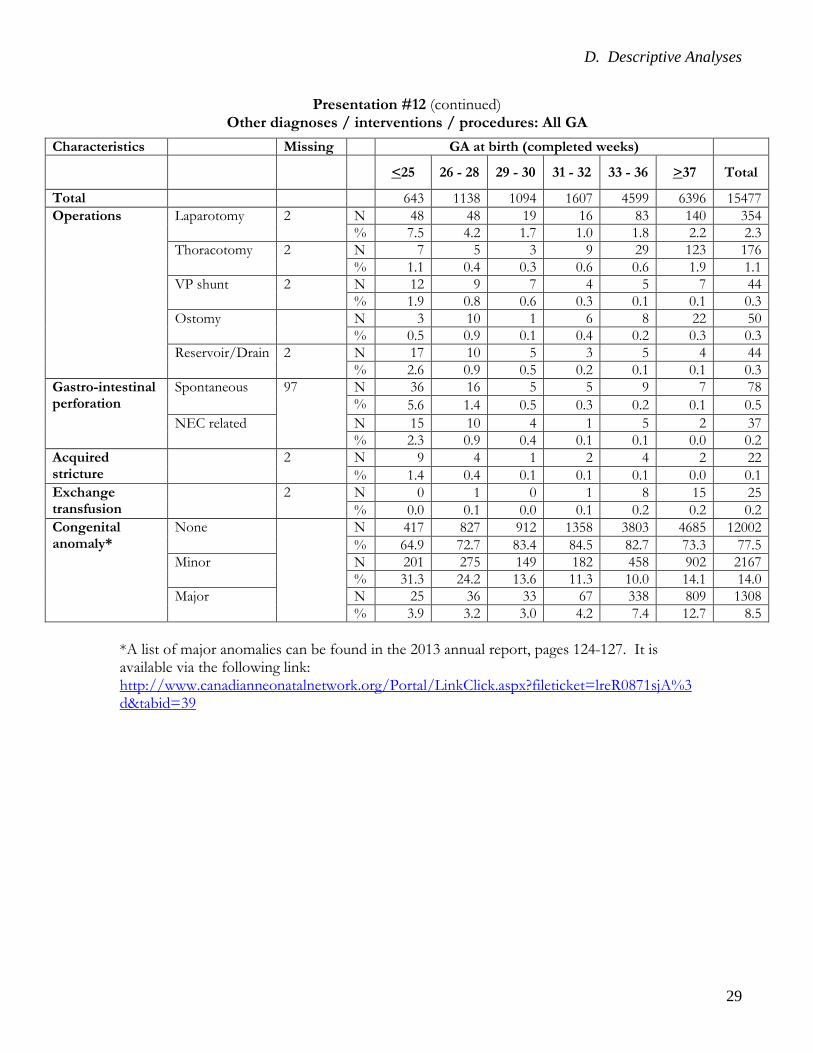
Presentation #12 (continued) Other diagnoses / interventions / procedures: All GA
*A list of major anomalies can be found in the 2013 annual report, pages 124-127. It is available via the following link: http://www.canadianneonatalnetwork.org/Portal/LinkClick.aspx?fileticket=lreR0871sjA%3d&tabid=39
Characteristics Missing GA at birth (completed weeks) <25 26 - 28 29 - 30 31 - 32 33 - 36 >37 Total
Total 643 1138 1094 1607 4599 6396 15477 Operations Laparotomy 2 N 48 48 19 16 83 140 354
% 7.5 4.2 1.7 1.0 1.8 2.2 2.3 Thoracotomy 2 N 7 5 3 9 29 123 176
% 1.1 0.4 0.3 0.6 0.6 1.9 1.1 VP shunt 2 N 12 9 7 4 5 7 44
% 1.9 0.8 0.6 0.3 0.1 0.1 0.3 Ostomy N 3 10 1 6 8 22 50
% 0.5 0.9 0.1 0.4 0.2 0.3 0.3 Reservoir/Drain 2 N 17 10 5 3 5 4 44
% 2.6 0.9 0.5 0.2 0.1 0.1 0.3 Gastro-intestinal perforation
Spontaneous 97 N 36 16 5 5 9 7 78 % 5.6 1.4 0.5 0.3 0.2 0.1 0.5
NEC related N 15 10 4 1 5 2 37 % 2.3 0.9 0.4 0.1 0.1 0.0 0.2
Acquired stricture
2 N 9 4 1 2 4 2 22 % 1.4 0.4 0.1 0.1 0.1 0.0 0.1
Exchange transfusion
2 N 0 1 0 1 8 15 25 % 0.0 0.1 0.0 0.1 0.2 0.2 0.2
Congenital anomaly*
None N 417 827 912 1358 3803 4685 12002 % 64.9 72.7 83.4 84.5 82.7 73.3 77.5
Minor N 201 275 149 182 458 902 2167 % 31.3 24.2 13.6 11.3 10.0 14.1 14.0
Major N 25 36 33 67 338 809 1308 % 3.9 3.2 3.0 4.2 7.4 12.7 8.5

D. Descriptive Analyses
30
Section D.3
Analyses based on number of eligible very preterm (GA <33 weeks) or very low birth weight (BW <1 500g) neonates These included data from 4 482 eligible very preterm neonates and 3 086 eligible VLBW neonates.
D. Descriptive Analyses
31
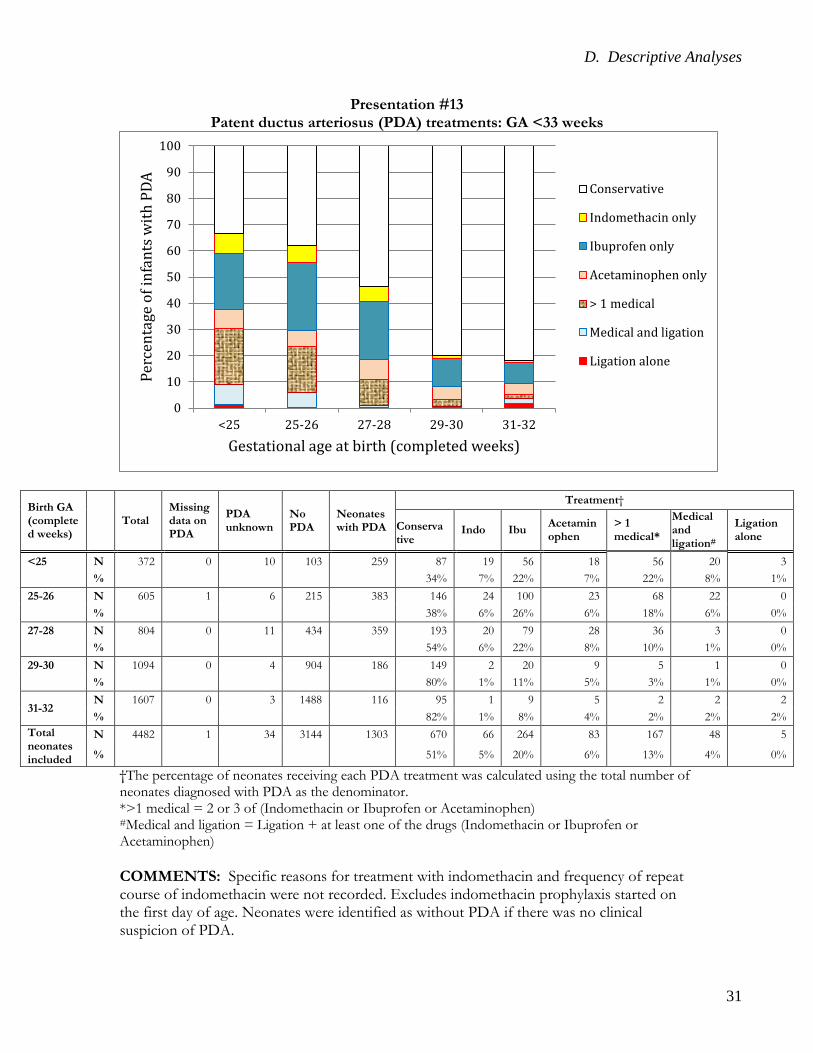
Presentation #13 Patent ductus arteriosus (PDA) treatments: GA <33 weeks
†The percentage of neonates receiving each PDA treatment was calculated using the total number of neonates diagnosed with PDA as the denominator. *>1 medical = 2 or 3 of (Indomethacin or Ibuprofen or Acetaminophen) #Medical and ligation = Ligation + at least one of the drugs (Indomethacin or Ibuprofen or Acetaminophen) COMMENTS: Specific reasons for treatment with indomethacin and frequency of repeat course of indomethacin were not recorded. Excludes indomethacin prophylaxis started on the first day of age. Neonates were identified as without PDA if there was no clinical suspicion of PDA.
0
10
20
30
40
50
60
70
80
90
100
<25 25-26 27-28 29-30 31-32
Perc
enta
ge o
f inf
ants
with
PDA
Gestational age at birth (completed weeks)
Conservative
Indomethacin only
Ibuprofen only
Acetaminophen only
> 1 medical
Medical and ligation
Ligation alone
Birth GA (completed weeks)
Total
Missing data on PDA
PDA unknown
No PDA
Neonates with PDA
Treatment†
Conservative
Indo Ibu Acetaminophen
> 1 medical*
Medical and ligation#
Ligation alone
<25 N 372 0 10 103 259 87 19 56 18 56 20 3 % 34% 7% 22% 7% 22% 8% 1% 25-26 N 605 1 6 215 383 146 24 100 23 68 22 0 % 38% 6% 26% 6% 18% 6% 0% 27-28 N 804 0 11 434 359 193 20 79 28 36 3 0 % 54% 6% 22% 8% 10% 1% 0% 29-30 N 1094 0 4 904 186 149 2 20 9 5 1 0 % 80% 1% 11% 5% 3% 1% 0%
31-32 N 1607 0 3 1488 116 95 1 9 5 2 2 2 % 82% 1% 8% 4% 2% 2% 2%
Total neonates included
N 4482 1 34 3144 1303 670 66 264 83 167 48 5
% 51% 5% 20% 6% 13% 4% 0%
D. Descriptive Analyses
32
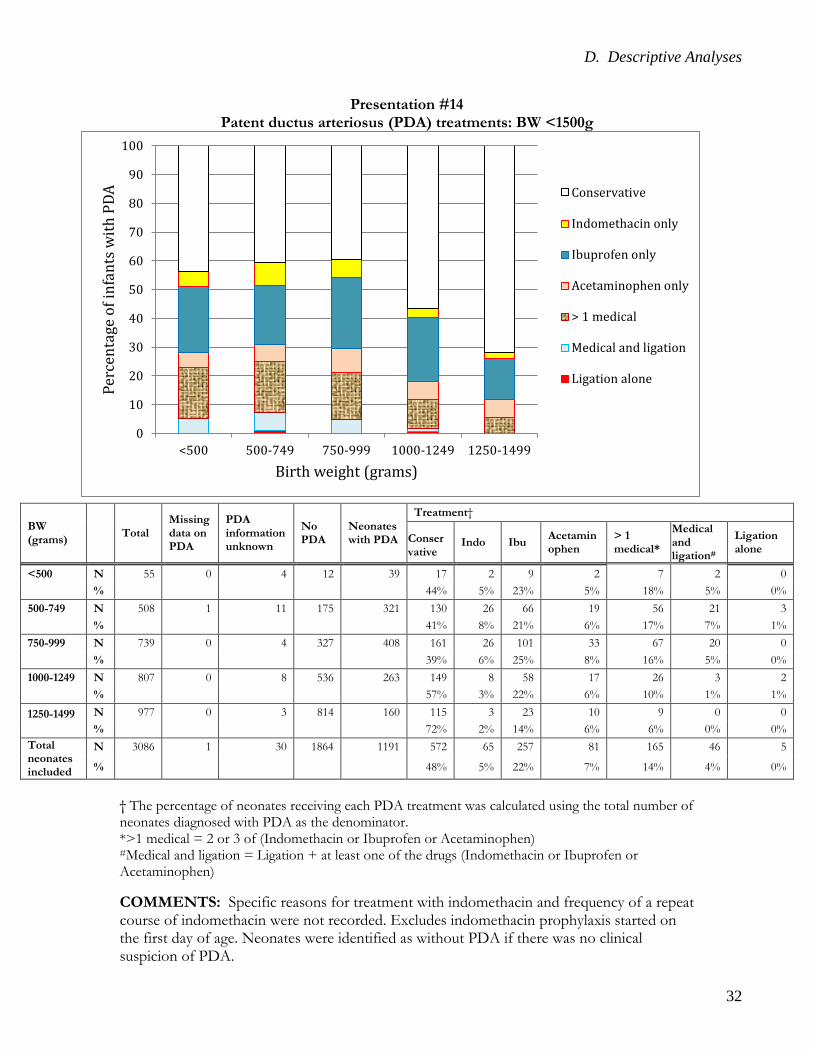
Presentation #14 Patent ductus arteriosus (PDA) treatments: BW <1500g
† The percentage of neonates receiving each PDA treatment was calculated using the total number of neonates diagnosed with PDA as the denominator. *>1 medical = 2 or 3 of (Indomethacin or Ibuprofen or Acetaminophen) #Medical and ligation = Ligation + at least one of the drugs (Indomethacin or Ibuprofen or Acetaminophen)
COMMENTS: Specific reasons for treatment with indomethacin and frequency of a repeat course of indomethacin were not recorded. Excludes indomethacin prophylaxis started on the first day of age. Neonates were identified as without PDA if there was no clinical suspicion of PDA.
0
10
20
30
40
50
60
70
80
90
100
<500 500-749 750-999 1000-1249 1250-1499
Perc
enta
ge o
f inf
ants
with
PDA
Birth weight (grams)
Conservative
Indomethacin only
Ibuprofen only
Acetaminophen only
> 1 medical
Medical and ligation
Ligation alone
BW (grams)
Total
Missing data on PDA
PDA information unknown
No PDA
Neonates with PDA
Treatment†
Conservative
Indo Ibu Acetaminophen
> 1 medical*
Medical and ligation#
Ligation alone
<500 N 55 0 4 12 39 17 2 9 2 7 2 0 % 44% 5% 23% 5% 18% 5% 0% 500-749 N 508 1 11 175 321 130 26 66 19 56 21 3 % 41% 8% 21% 6% 17% 7% 1% 750-999 N 739 0 4 327 408 161 26 101 33 67 20 0 % 39% 6% 25% 8% 16% 5% 0% 1000-1249 N 807 0 8 536 263 149 8 58 17 26 3 2 % 57% 3% 22% 6% 10% 1% 1%
1250-1499
N 977 0 3 814 160 115 3 23 10 9 0 0 % 72% 2% 14% 6% 6% 0% 0%
Total neonates included
N 3086 1 30 1864 1191 572 65 257 81 165 46 5
% 48% 5% 22% 7% 14% 4% 0%
D. Descriptive Analyses
33
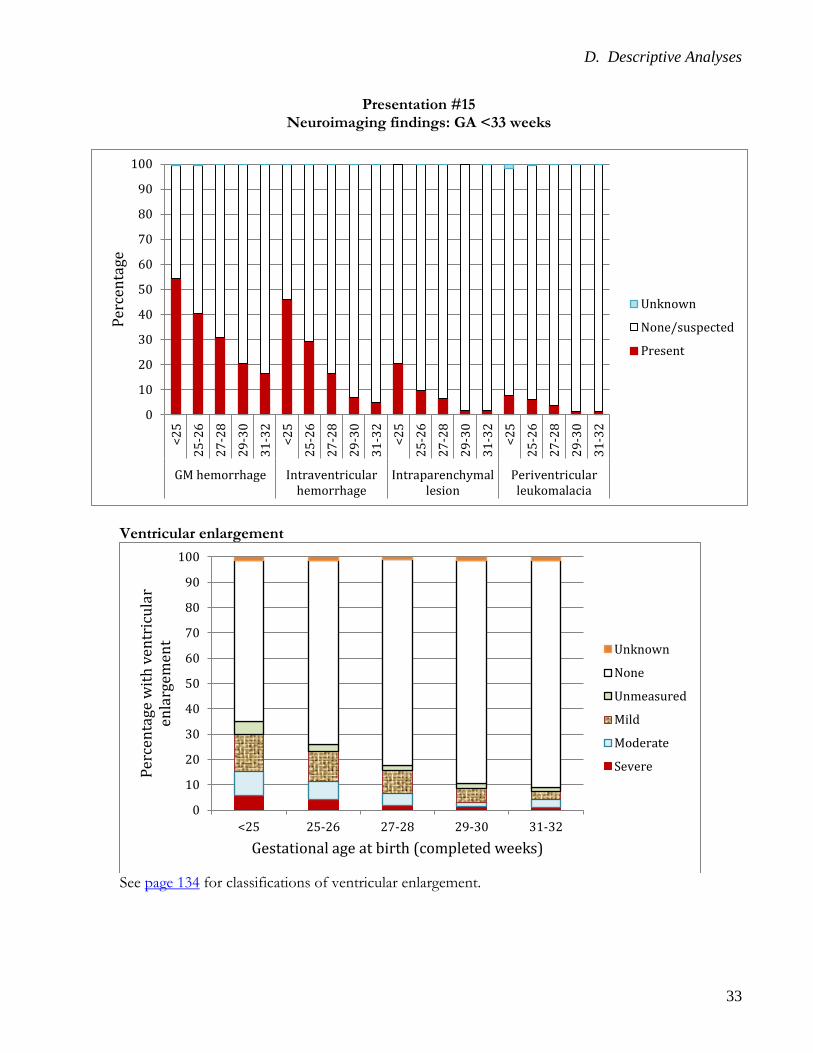
Presentation #15 Neuroimaging findings: GA <33 weeks
Ventricular enlargement
See page 134 for classifications of ventricular enlargement.
0
10
20
30
40
50
60
70
80
90
100<2
5
25-2
6
27-2
8
29-3
0
31-3
2
<25
25-2
6
27-2
8
29-3
0
31-3
2
<25
25-2
6
27-2
8
29-3
0
31-3
2
<25
25-2
6
27-2
8
29-3
0
31-3
2
GM hemorrhage Intraventricularhemorrhage
Intraparenchymallesion
Periventricularleukomalacia
Perc
enta
ge
Unknown
None/suspected
Present
0
10
20
30
40
50
60
70
80
90
100
<25 25-26 27-28 29-30 31-32
Perc
enta
ge w
ith v
entr
icul
ar
enla
rgem
ent
Gestational age at birth (completed weeks)
Unknown
None
Unmeasured
Mild
Moderate
Severe

D. Descriptive Analyses
34
Presentation #15 (continued) Neuroimaging findings: GA <33 weeks
GA at birth (completed
weeks) Total
Neuro-imaging available
Neuroimaging findings
GM hemorrhage Intraventricular hemorrhage Ventricular enlargement Intraparenchymal
lesion Periventricular leukomalacia
Present
None/suspected
Unknow
n
Present
None/suspected
Unknow
n
Mild
Moderate
Severe
Unm
easured
None
Unknow
n
Present
None/suspected
Unknow
n
Present
None/suspected
Unknow
n
<25
N 372 343 187 154 2 158 184 1 48 31 19 17 209 4 71 272 0 26 311 6 % 55% 45% 1% 46 54 0% 15% 9% 6% 5% 64% 1% 21% 79% 0% 8% 91% 2%
25-26
N 605 587 237 346 4 171 415 1 67 40 24 15 407 9 56 530 1 35 549 3 % 40% 59% 1% 29% 71% 0% 12% 7% 4% 3% 72% 2% 10% 90% 0% 6% 94% 1%
27-28
N 804 778 239 537 2 127 649 2 66 36 12 14 596 6 52 724 2 29 747 2 % 31% 69% 0% 16% 83% 0% 9% 5% 2% 2% 82% 1% 7% 93% 0% 4% 96% 0%
29-30
N 1094 1006 205 800 1 69 935 2 53 18 12 16 849 12 18 988 0 15 989 2 % 20% 80% 0% 7% 93% 0% 6% 2% 1% 2% 88% 1% 2% 98% 0% 1% 98% 0%
31-32
N 1607 1005 166 838 1 51 953 1 29 31 10 15 857 15 17 986 2 12 991 2 % 17% 83% 0% 5% 95% 0% 3% 3% 1% 2% 90% 2% 2% 98% 0% 1% 99% 0%
Total number of neonates
N 4482 3719 1034 2675 10 576 3136 7 263 156 77 77 2918 46 214 3500 5 117 3587 15
% 28% 72% 0% 15% 84% 0% 7% 4% 2% 2% 78% 1% 6% 94% 0% 3% 96% 0%
Note: Neuroimaging findings were not mutually exclusive, i.e. one neonate may have had more than one finding. See page 134 for classifications of ventricular enlargement.

D. Descriptive Analyses
35
Presentation #16 Neuroimaging findings: BW <1500g
Ventricular enlargement
See page 134 for classifications of ventricular enlargement.
0
10
20
30
40
50
60
70
80
90
100<5
0050
0-74
975
0-99
910
00-1
249
1250
-149
9<5
0050
0-74
975
0-99
910
00-1
249
1250
-149
9<5
0050
0-74
975
0-99
910
00-1
249
1250
-149
9<5
0050
0-74
975
0-99
910
00-1
249
1250
-149
9
GM hemorrhage Intraventricularhemorrhage
Intraparenchymallesion
Periventricularleukomalacia
Perc
enta
ge
Unknown
None/suspected
Present
0
10
20
30
40
50
60
70
80
90
100
<500 500-749 750-999 1000-1249 1250-1499
Perc
enta
ge w
ith v
entr
icul
ar
enla
rgem
ent
Gestational age at birth (completed weeks)
Unknown
None
Unmeasrued
Mild
Moderate
Severe

D. Descriptive Analyses
36
Presentation #16 (continued) Neuroimaging findings: BW <1500g
BW (grams)
Total
Neuro-im
aging available
Neuroimaging findings
GM hemorrhage Intraventricular hemorrhage Ventricular enlargement Intraparenchymal
lesion Periventricular leukomalacia
Present
None/suspected
Unknow
n
Present
None/suspected
Unknow
n
Mild
Moderate
Severe
Unm
easured
None
Unknow
n
Present
None/suspected
Unknow
n
Present
None/suspected
Unknow
n
<500 N 55 49 22 27 0 18 31 0 6 3 1 1 34 1 6 43 0 2 47 0 % 45% 55% 0% 37% 63% 0% 13% 7% 2% 2% 74% 2% 12% 88% 0% 4% 96% 0%
500-749 N 508 478 185 290 3 157 320 1 47 32 20 19 332 6 68 410 0 26 446 6 % 39% 61% 1% 33% 67% 0% 10% 7% 4% 4% 73% 1% 14% 86% 0% 5% 93% 1%
750-999 N 739 714 255 456 3 160 553 1 74 37 22 16 538 6 60 654 0 36 674 4 % 36% 64% 0% 22% 77% 0% 11% 5% 3% 2% 78% 1% 8% 92% 0% 5% 94% 1%
1000-1249 N 807 770 198 570 2 103 666 1 52 36 12 12 609 7 39 729 2 22 747 1 % 26% 74% 0% 13% 86% 0% 7% 5% 2% 2% 84% 1% 5% 95% 0% 3% 97% 0%
1250-1499 N 977 813 186 626 1 74 737 2 45 18 10 19 665 11 23 789 1 18 793 2 % 23% 77% 0% 9% 91% 0% 6% 2% 1% 2% 87% 1% 3% 97% 0% 2% 98% 0%
Total neonates N 3086 2824 846 1969 9 512 2307 5 224 126 65 67 2178 31 196 2625 3 10
4% 2707 13
% 30% 70% 0% 18% 82% 0% 8% 4% 2% 2% 77% 1% 7% 93% 0% 4% 96% 0%
Note: Neuroimaging findings were not mutually exclusive, i.e. one neonate may had more than one findings. See page 134 for classifications of ventricular enlargement.
D. Descriptive Analyses
37
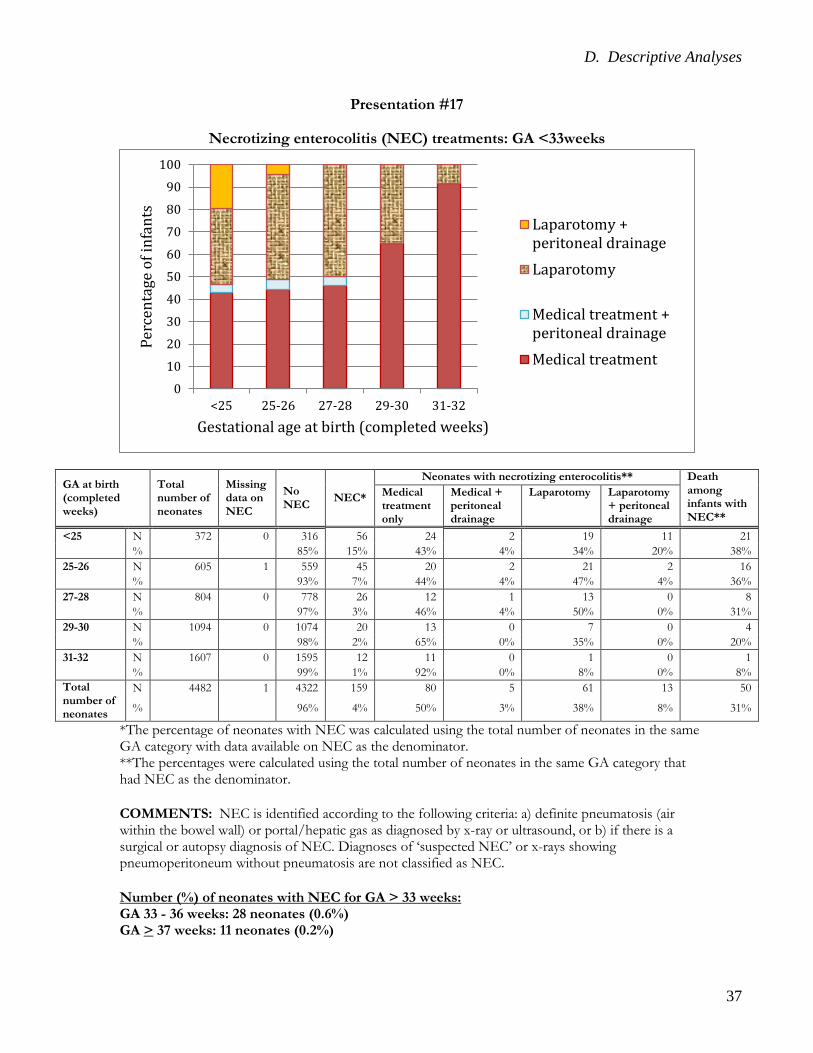
Presentation #17
Necrotizing enterocolitis (NEC) treatments: GA <33weeks
GA at birth (completed weeks)
Total number of neonates
Missing data on NEC
No NEC NEC*
Neonates with necrotizing enterocolitis** Death among infants with NEC**
Medical treatment only
Medical + peritoneal drainage
Laparotomy Laparotomy + peritoneal drainage
<25 N 372 0 316 56 24 2 19 11 21 % 85% 15% 43% 4% 34% 20% 38% 25-26 N 605 1 559 45 20 2 21 2 16 % 93% 7% 44% 4% 47% 4% 36% 27-28 N 804 0 778 26 12 1 13 0 8 % 97% 3% 46% 4% 50% 0% 31% 29-30 N 1094 0 1074 20 13 0 7 0 4 % 98% 2% 65% 0% 35% 0% 20% 31-32 N 1607 0 1595 12 11 0 1 0 1 % 99% 1% 92% 0% 8% 0% 8% Total number of neonates
N 4482 1 4322 159 80 5 61 13 50
% 96% 4% 50% 3% 38% 8% 31%
*The percentage of neonates with NEC was calculated using the total number of neonates in the same GA category with data available on NEC as the denominator. **The percentages were calculated using the total number of neonates in the same GA category that had NEC as the denominator. COMMENTS: NEC is identified according to the following criteria: a) definite pneumatosis (air within the bowel wall) or portal/hepatic gas as diagnosed by x-ray or ultrasound, or b) if there is a surgical or autopsy diagnosis of NEC. Diagnoses of ‘suspected NEC’ or x-rays showing pneumoperitoneum without pneumatosis are not classified as NEC.
Number (%) of neonates with NEC for GA > 33 weeks: GA 33 - 36 weeks: 28 neonates (0.6%) GA > 37 weeks: 11 neonates (0.2%)
0
10
20
30
40
50
60
70
80
90
100
<25 25-26 27-28 29-30 31-32
Perc
enta
ge o
f inf
ants
Gestational age at birth (completed weeks)
Laparotomy +peritoneal drainageLaparotomy
Medical treatment +peritoneal drainageMedical treatment

D. Descriptive Analyses
38
Presentation #18 Necrotizing enterocolitis (NEC) treatments: BW <1500 g
Birth weight (grams)
Total number of neonates
Missing data on NEC
NEC*
Neonates with necrotizing enterocolitis** Death among infants with NEC**
No NEC
Medical treatment only
Medical + peritoneal drainage
Laparotomy laparotomy + peritoneal drainage
<500 N 55 0 50 5 2 0 3 0 3 % 91% 9% 40% 0% 60% 0% 60% 500-749 N 508 1 448 59 24 2 23 10 24 % 88% 12% 41% 3% 39% 17% 41% 750-999 N 739 0 693 46 22 3 18 3 16 % 94% 6% 48% 7% 39% 7% 35% 1000-1249 N 807 0 782 25 12 0 13 0 5 % 97% 3% 48% 0% 52% 0% 20% 1250-1499 N 977 0 961 16 15 0 1 0 2 % 98% 2% 94% 0% 6% 0% 13% Total number of neonates
N 3086 1 2934 151 75 5 58 13 50
% 95% 5% 50% 3% 38% 9% 33%
*The percentage of neonates with NEC was calculated using the total number of neonates in the same GA category with data available on NEC as the denominator. ** The percentages were calculated using the total number of neonates in the same GA category that had NEC as the denominator. COMMENTS: NEC is identified according to the following criteria: a) definite pneumatosis (air within the bowel wall) or portal/hepatic gas as diagnosed by x-ray or ultrasound, or b) if there is a surgical or autopsy diagnosis of NEC. Diagnoses of ‘suspected NEC’ or x-rays showing pneumoperitoneum without pneumatosis are not classified as NEC. Number (%) of neonates with NEC and BW > 1500g: BW 1500 - 2499g: 31 neonates (0.6%) BW > 2500g: 16 neonates (0.2%)
0
10
20
30
40
50
60
70
80
90
100
<500 500-749 750-999 1000-1249 1250-1499
Perc
enta
ge o
f inf
ants
Birth weight (grams)
Laparotomy +peritoneal drainage
Laparotomy
Medical treatment +peritoneal drainage
Medical treatment

D. Descriptive Analyses
39
Presentation #19 Chronic lung disease (CLD) at 36 weeks post menstrual age (PMA) or discharge:
GA <33 weeks
GA
Total number of neonates
Number of neonates who died before 36 weeks PMA
Number of surviving neonates whose respiratory support is unknown*
CLD from**
Number of neonates with known results
Number of neonates with severe CLD
Number of neonates with moderate CLD
Number of neonates with mild CLD
Number of neonates with CLD but severity unknown
Number of neonates without CLD
<25 372 128 2 36w 214 62 81 13 23 35
Disch 28 7 3 3 4 11
25-26 605 73 2 36w 394 87 154 21 23 109
Disch 136 7 34 9 5 81
27-28 804 52 4 36w 424 39 114 51 15 205
Disch 324 9 64 22 20 209
29-30 1 094 28 1 36w 420 13 92 30 16 269
Disch 645 5 74 18 5 543
31-32 1 607 18 12 36w 573 20 52 26 12 463
Disch 1 004 6 50 7 5 936
Total 4 482 299 21 36w 2 025 221 493 141 89 1 081
Disch 2 137 34 225 59 39 1 780 COMMENTS: See pages 134-135 for the definition of severity of CLD. *unknown = first admission was after 36 weeks’ PMA ** w = weeks’ PMA, Disch = Discharge prior to 36 weeks’ PMA Note: Percentages of neonates with CLD were calculated based on the total number of neonates in the same GA category with known CLD results.
0
10
20
30
40
50
60
70
80
90
100
<25 25-26 27-28 29-30 31-32
Perc
enta
ge o
f inf
ants
with
CLD
Gestational age (completed weeks)
CLD but severityunknown
Mild CLD
Moderate CLD
Severe CLD
D. Descriptive Analyses
40
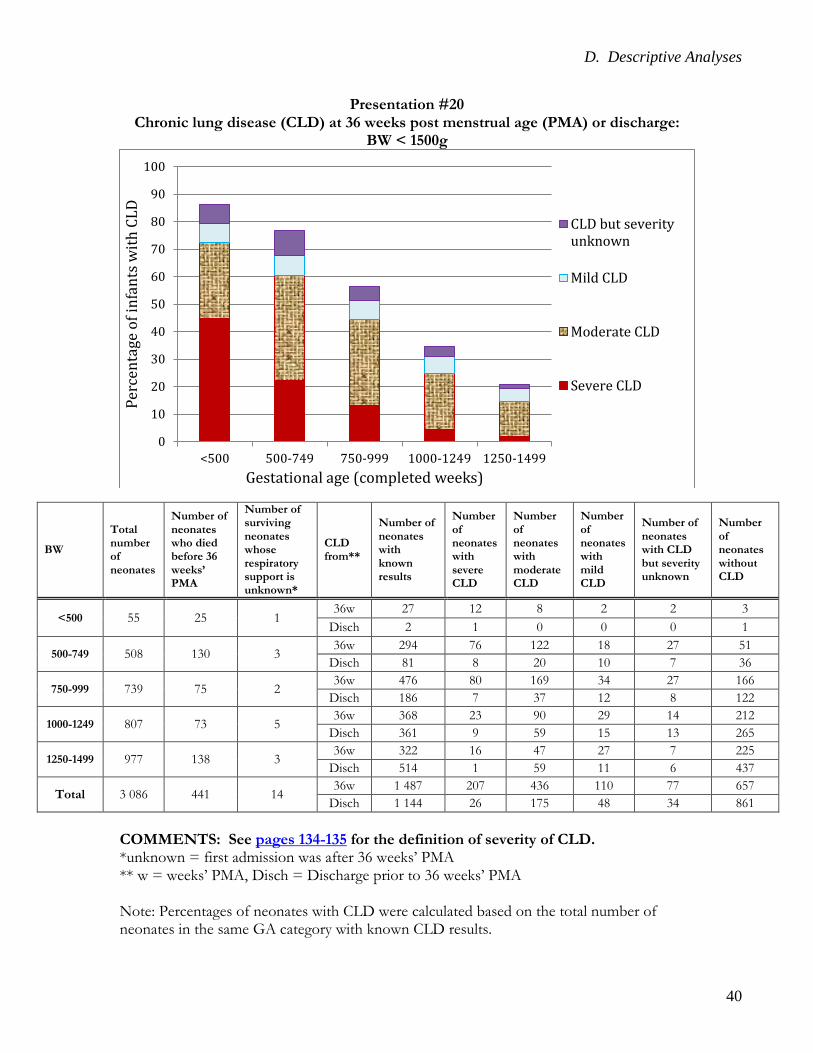
Presentation #20 Chronic lung disease (CLD) at 36 weeks post menstrual age (PMA) or discharge:
BW < 1500g
BW
Total number of neonates
Number of neonates who died before 36 weeks’ PMA
Number of surviving neonates whose respiratory support is unknown*
CLD from**
Number of neonates with known results
Number of neonates with severe CLD
Number of neonates with moderate CLD
Number of neonates with mild CLD
Number of neonates with CLD but severity unknown
Number of neonates without CLD
<500 55 25 1 36w 27 12 8 2 2 3
Disch 2 1 0 0 0 1
500-749 508 130 3 36w 294 76 122 18 27 51
Disch 81 8 20 10 7 36
750-999 739 75 2 36w 476 80 169 34 27 166
Disch 186 7 37 12 8 122
1000-1249 807 73 5 36w 368 23 90 29 14 212
Disch 361 9 59 15 13 265
1250-1499 977 138 3 36w 322 16 47 27 7 225
Disch 514 1 59 11 6 437
Total 3 086 441 14 36w 1 487 207 436 110 77 657
Disch 1 144 26 175 48 34 861 COMMENTS: See pages 134-135 for the definition of severity of CLD. *unknown = first admission was after 36 weeks’ PMA ** w = weeks’ PMA, Disch = Discharge prior to 36 weeks’ PMA Note: Percentages of neonates with CLD were calculated based on the total number of neonates in the same GA category with known CLD results.
0
10
20
30
40
50
60
70
80
90
100
<500 500-749 750-999 1000-1249 1250-1499
Perc
enta
ge o
f inf
ants
with
CLD
Gestational age (completed weeks)
CLD but severityunknown
Mild CLD
Moderate CLD
Severe CLD
D. Descriptive Analyses
41
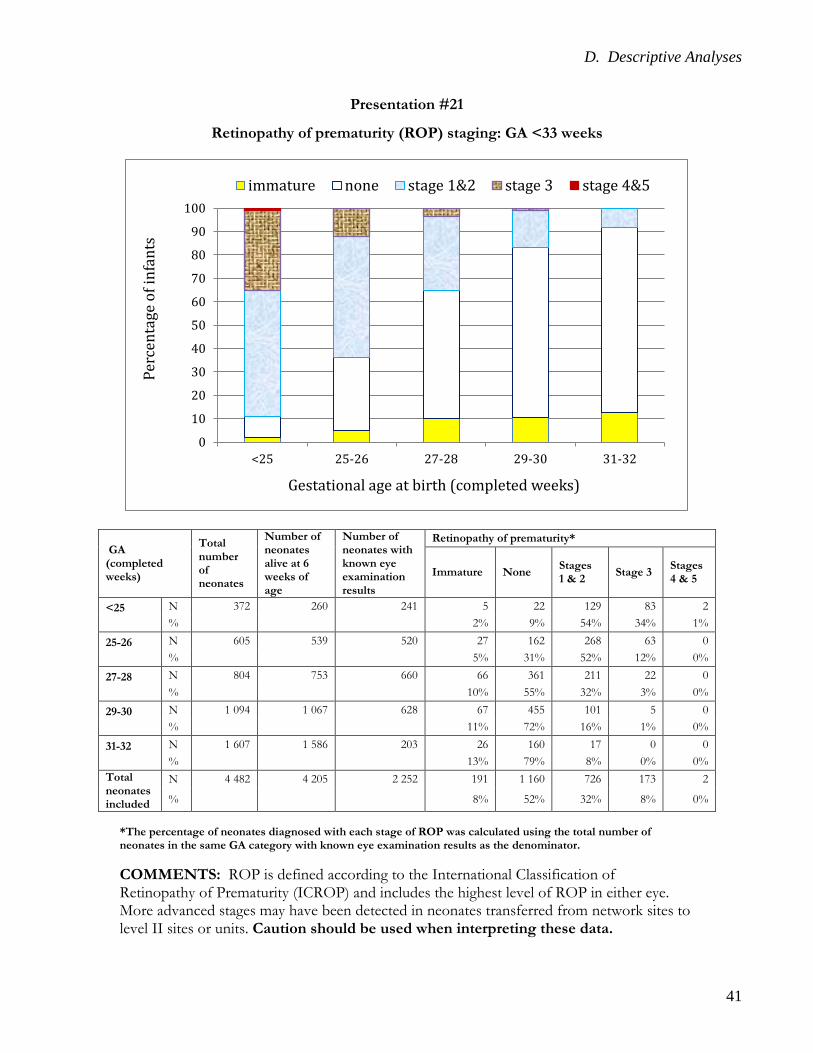
Presentation #21
Retinopathy of prematurity (ROP) staging: GA <33 weeks
GA (completed weeks)
Total number of neonates
Number of neonates alive at 6 weeks of age
Number of neonates with known eye examination results
Retinopathy of prematurity*
Immature None Stages 1 & 2 Stage 3 Stages
4 & 5
<25
N 372 260 241 5 22 129 83 2 % 2% 9% 54% 34% 1%
25-26
N 605 539 520 27 162 268 63 0 % 5% 31% 52% 12% 0%
27-28
N 804 753 660 66 361 211 22 0 % 10% 55% 32% 3% 0%
29-30
N 1 094 1 067 628 67 455 101 5 0 % 11% 72% 16% 1% 0%
31-32
N 1 607 1 586 203 26 160 17 0 0 % 13% 79% 8% 0% 0%
Total neonates included
N 4 482 4 205 2 252 191 1 160 726 173 2
% 8% 52% 32% 8% 0%
*The percentage of neonates diagnosed with each stage of ROP was calculated using the total number of neonates in the same GA category with known eye examination results as the denominator. COMMENTS: ROP is defined according to the International Classification of Retinopathy of Prematurity (ICROP) and includes the highest level of ROP in either eye. More advanced stages may have been detected in neonates transferred from network sites to level II sites or units. Caution should be used when interpreting these data.
0
10
20
30
40
50
60
70
80
90
100
<25 25-26 27-28 29-30 31-32
Perc
enta
ge o
f inf
ants
Gestational age at birth (completed weeks)
immature none stage 1&2 stage 3 stage 4&5

D. Descriptive Analyses
42
Presentation #22 Retinopathy of prematurity (ROP) staging: BW< 1500 g
BW (grams)
Total number of neonates
Number of neonates alive at 6 weeks of age
Number of neonates with known eye examination results
Retinopathy of prematurity*
Immature None Stages 1 & 2 Stage 3 Stages
4 & 5
<500
N 55 31 29 0 3 13 13 0 % 0% 10% 45% 45% 0%
500-749
N 508 393 372 10 95 181 85 1 % 3% 26% 49% 23% 0%
750-999
N 739 678 628 43 229 292 63 1 % 7% 36% 47% 10% 0%
1000-1249
N 807 773 562 64 335 153 10 0 % 11% 60% 27% 2% 0%
1250-1499 N 977 956 414 39 313 61 1 0 % 9% 76% 15% 0% 0%
Total neonates included
N 3 086 2 831 2 005 156 975 700 172 2
% 8% 49% 35% 9% 0%
*The percentage of neonates diagnosed with each stage of ROP was calculated using the total number of neonates in the same GA category with known eye examination results as the denominator. COMMENTS: ROP is defined according to the International Classification of Retinopathy of Prematurity (ICROP) and includes the highest level of ROP in either eye. More advanced stages may have been detected in neonates transferred from network sites to level II sites or units. Caution should be used when interpreting these data.
0102030405060708090
100
<500 500-749 750-999 1000-1249 1250-1499
Perc
ent o
f inf
ants
Birth weight (grams)
immature none Stage 1&2 Stage 3 Stage 4&5

D. Descriptive Analyses
43
Presentation #23
Retinopathy of prematurity (ROP) treatments: GA <33 weeks
Birth GA (completed weeks)
Total number of neonates
Number of neonates with known eye examination results
Therapy for retinopathy of prematurity (ROP)*
Therapy for ROP
Laser Anti-VEGF
Both Laser and Anti-
VEGF
Other surgery
<25
N 372 241 69 13 51 5 1 % 29%
25-26
N 605 520 46 18 27 1 0 % 9%
27-28
N 804 660 15 4 10 1 0 % 2%
29-30
N 1 094 628 4 2 2 0 0 % 1%
31-32 N 1 607 203 0 0 0 0 0 % 0%
Total neonates included
N 4 482 2 252 134 37 90 7 1
% 6% *The percentage of neonates who received ROP therapy was calculated using the total number of neonates in the same GA category with known eye examination results as the denominator. COMMENTS: ROP is defined according to the International Classification of Retinopathy of Prematurity (ICROP) and includes the highest level of ROP in either eye. More advanced stages may have been detected in neonates transferred from network sites to level II sites or units. Caution should be used when interpreting these data as some neonates did not have eye examination data.
02468
1012141618202224262830
<25 25-26 27-28 29-30 31-32
Perc
enta
ge o
f inf
ants
hav
ing
eye
exam
ined
and
trea
ted
Gestational age at birth (completed weeks)
Other surgery
Both Laserand Anti-VEGFAnti-VEGF
Laser
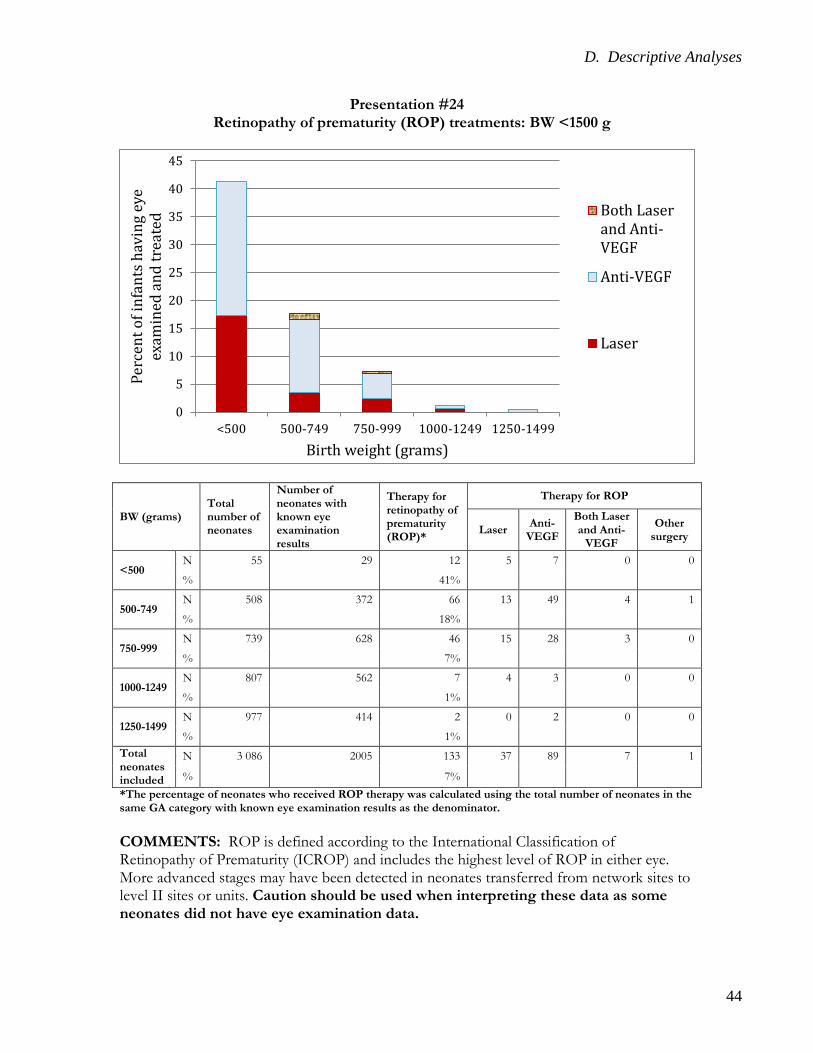
D. Descriptive Analyses
44
Presentation #24 Retinopathy of prematurity (ROP) treatments: BW <1500 g
BW (grams) Total number of neonates
Number of neonates with known eye examination results
Therapy for retinopathy of prematurity (ROP)*
Therapy for ROP
Laser Anti-VEGF
Both Laser and Anti-
VEGF
Other surgery
<500 N 55 29 12 5 7 0 0
% 41%
500-749 N 508 372 66 13 49 4 1
% 18%
750-999 N 739 628 46 15 28 3 0
% 7%
1000-1249 N 807 562 7 4 3 0 0
% 1%
1250-1499 N 977 414 2 0 2 0 0
% 1% Total neonates included
N 3 086 2005 133 37 89 7 1
% 7% *The percentage of neonates who received ROP therapy was calculated using the total number of neonates in the same GA category with known eye examination results as the denominator. COMMENTS: ROP is defined according to the International Classification of Retinopathy of Prematurity (ICROP) and includes the highest level of ROP in either eye. More advanced stages may have been detected in neonates transferred from network sites to level II sites or units. Caution should be used when interpreting these data as some neonates did not have eye examination data.
0
5
10
15
20
25
30
35
40
45
<500 500-749 750-999 1000-1249 1250-1499
Perc
ent o
f inf
ants
hav
ing
eye
exam
ined
and
trea
ted
Birth weight (grams)
Both Laserand Anti-VEGF
Anti-VEGF
Laser

D. Descriptive Analyses
45
Presentation #25 Mortality or select major morbidity: GA <33 weeks
GA Number of neonates
Number survived until discharge / transfer (%)
Major morbiditya (%)
CLDb (%) Severe ROPc (%)
Severe neurological injuryd (%)
NECe (%) Late onset sepsis f
<24 153 72 (47) 106 (69) 56 (78) 33 (45) 36 (26) 27 (18) 58 (38) 24 209 161 (77) 176 (84) 132 (82) 54 (35) 45 (23) 28 (13) 74 (35) 25 256 212 (83) 187 (73) 145 (67) 39 (19) 38 (15) 19 (7) 69 (27) 26 329 298 (91) 228 (69) 184 (61) 24 (9) 36 (11) 25 (8) 56 (17) 27 367 337 (92) 206 (56) 160 (48) 20 (7) 35 (10) 17 (5) 52 (14) 28 406 387 (95) 191 (47) 154 (40) 3 (1) 31 (8) 9 (2) 30 (7) 29 505 495 (98) 159 (31) 127 (26) 5 (2) 13 (3) 9 (2) 24 (5) 30 556 544 (98) 137 (25) 113 (21) 0 13 (3) 7 (1) 18 (3) 31 723 714 (99) 108 (15) 74 (10) 0 16 (3) 6 (1) 18 (2) 32 817 805 (99) 101 (12) 78 (10) 0 12 (3) 5 (1) 13 (2) Total neonates 4321 4025 (93) 1599 (37) 1223 (30) 178 (9) 275 (8) 152 (4) 412 (10)
Inclusion criteria for these analyses:
1. Neonate born at <33 weeks GA without major congenital anomaly 2. Denominators were based on the number of neonates with available data and those
without major congenital anomaly Definitions: a Major morbidity was counted as any one of the following
1. CLD (any grade) 2. Severe ROP 3. Severe neurological injury (IVH ≥ grade 3 and/or PVL) 4. Stage 2 or 3 NEC 5. Late onset sepsis
b Chronic lung disease was defined as per presentation #19 of any grade c Severe ROP was defined as ROP stage 3,4,5 and/or those with ROP treatment (laser or intraocular injection). d Severe neurological injury was defined as IVH ≥ grade 3 and/or PVL e NEC defined as stage 2 or 3 f Late onset sepsis was defined as any positive blood and/or cerebrospinal fluid culture after 2 days of age. Analysis was neonate-based.

E. Site Comparisons
46
E. Site Comparisons
E. Site Comparisons
47
E.1. Site Comparisons –
Care Practices

E. Site Comparisons
48
Presentation #26 Prenatal and delivery room care practices: GA<29 weeks:
Site specific crude rates* (inborn only)
Site
Number of neonates
Antenatal MgSO4 Antenatal steroidsa
Timing of cord clampingb Admission temperature
Apgar <5 at 5 minutes
N Yes No Missing Completed course within last week prior
to birtha
> 30 sec
< 30 sec or none
Missing <36.5 36.5-37.2
>37.2
vi
< 20
55.6 44.4 0.0 22.2 61.1 22.2 16.7 22.2 55.6 22.2 22.2 xxxi 100.0 0.0 0.0 33.3 33.3 66.7 0.0 33.3 66.7 0.0 33.3 xxix 50.0 50.0 0.0 25.0 75.0 25.0 0.0 75.0 25.0 0.0 25.0 i 84.6 15.4 0.0 53.9 61.5 38.5 0.0 15.4 38.5 46.2 23.1 xxxii 86.7 13.3 0.0 66.7 20.0 73.3 6.7 13.3 53.3 33.3 20.0 xxviii 0.0 100.0 0.0 0.0 50.0 50.0 0.0 0.0 0.0 100.0 50.0 xix 27.8 55.6 16.7 22.2 55.6 38.9 5.6 66.7 16.7 16.7 16.7 v 100.0 0.0 0.0 52.6 84.2 15.8 0.0 23.5 52.9 23.5 10.5 xvi
20 – 39
80.0 20.0 0.0 30.0 50.0 50.0 0.0 5.0 90.0 5.0 10.0 xxi 88.6 11.4 0.0 48.6 54.3 45.7 0.0 14.3 62.9 22.9 20.0 xv 80.0 20.0 0.0 24.0 48.0 44.0 8.0 16.7 70.8 12.5 8.0 xi 75.9 24.1 0.0 37.9 62.1 37.9 0.0 35.7 46.4 17.9 27.6 xiv 100.0 0.0 0.0 37.5 37.5 45.8 16.7 16.7 25.0 58.3 33.3 xvii 78.1 15.6 6.3 22.6 28.1 46.9 25.0 34.5 37.9 27.6 3.1 xxx 70.6 29.4 0.0 52.9 91.2 8.8 0.0 29.4 47.1 23.5 20.6 iv 42.9 51.4 5.7 34.3 57.1 40.0 2.9 37.1 45.7 17.1 34.3 vii
40 – 70
88.1 11.9 0.0 31.0 4.8 4.8 90.5 15.8 55.3 29.0 7.1 xxiv 23.4 63.8 12.8 44.7 51.1 44.7 4.3 39.5 55.8 4.7 27.7 xxvi 93.9 6.1 0.0 36.7 49.0 44.9 6.1 48.9 36.2 14.9 16.3 iii 92.5 5.7 1.9 43.4 1.9 98.1 0.0 62.5 27.1 10.4 19.2 x 93.1 6.9 0.0 60.3 62.1 31.0 6.9 27.6 56.9 15.5 22.4 xxvii 83.3 16.7 0.0 54.2 2.1 95.8 2.1 53.9 38.5 7.7 14.9 xviii 84.8 13.6 1.7 49.2 62.7 33.9 3.4 29.3 53.5 17.2 20.3 viii 89.2 10.8 0.0 49.2 6.2 90.8 3.1 18.5 38.5 43.1 12.3 xxv 71.0 29.0 0.0 53.6 8.7 89.9 1.5 55.2 37.3 7.5 20.3 xii
> 70
75.3 23.4 1.3 48.7 55.1 44.3 0.6 25.8 61.9 12.3 8.9 xxii 90.9 9.1 0.0 46.4 55.5 41.8 2.7 9.4 54.2 36.5 4.6 xxiii 67.9 9.8 22.3 35.5 56.3 34.8 8.9 19.1 61.0 20.0 28.6 ix 37.6 61.4 1.0 51.5 61.4 37.6 1.0 29.3 48.5 22.2 7.9 xiii 88.1 11.9 0.0 36.3 58.9 40.5 0.6 16.7 76.8 6.6 22.6 Total CNN 76.1 21.0 2.9 43.6 47.0 47.0 6.1 27.6 53.4 19.0 17.1
*Denominators were based on inborn neonates <29 weeks’ GA admitted without major congenital anomaly. a Completed course of antenatal steroids within the last week prior to birth = received at least two doses of corticosteroids for a period of 24 hours or more, but within one week of birth These are unadjusted rates.
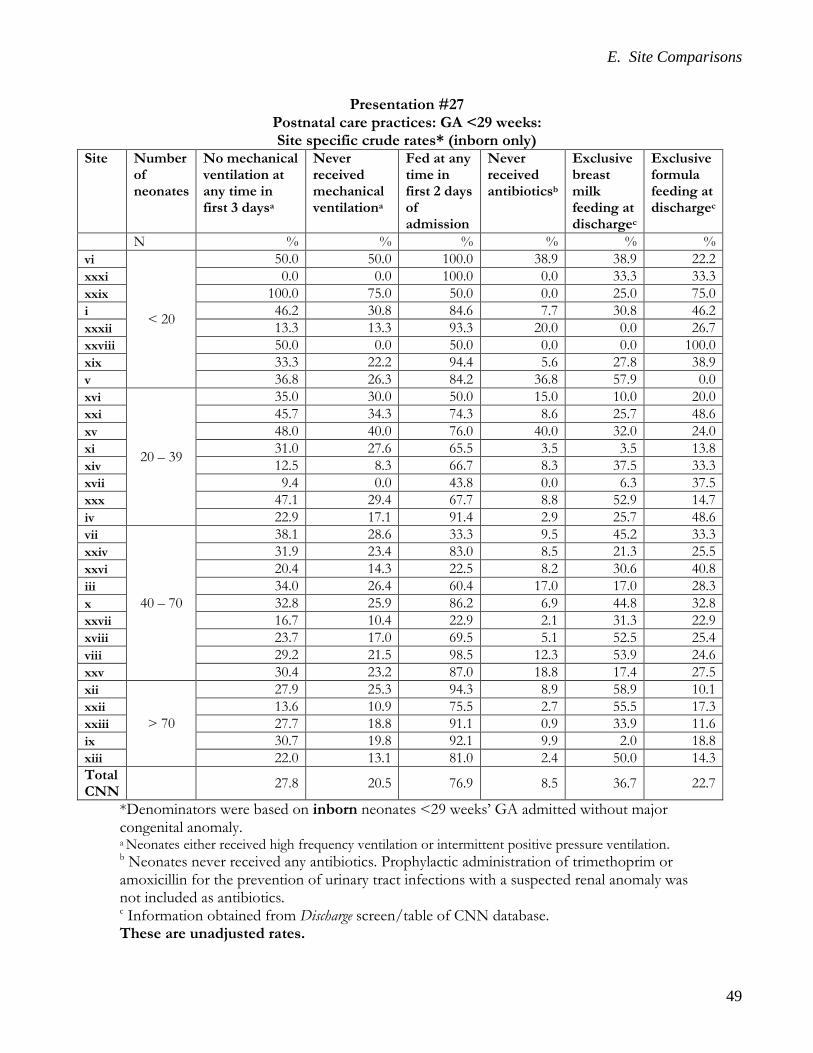
E. Site Comparisons
49
Presentation #27 Postnatal care practices: GA <29 weeks: Site specific crude rates* (inborn only)
Site Number of neonates
No mechanical ventilation at any time in first 3 daysa
Never received mechanical ventilationa
Fed at any time in first 2 days of admission
Never received antibioticsb
Exclusive breast milk feeding at dischargec
Exclusive formula feeding at dischargec
N % % % % % % vi
< 20
50.0 50.0 100.0 38.9 38.9 22.2 xxxi 0.0 0.0 100.0 0.0 33.3 33.3 xxix 100.0 75.0 50.0 0.0 25.0 75.0 i 46.2 30.8 84.6 7.7 30.8 46.2 xxxii 13.3 13.3 93.3 20.0 0.0 26.7 xxviii 50.0 0.0 50.0 0.0 0.0 100.0 xix 33.3 22.2 94.4 5.6 27.8 38.9 v 36.8 26.3 84.2 36.8 57.9 0.0 xvi
20 – 39
35.0 30.0 50.0 15.0 10.0 20.0 xxi 45.7 34.3 74.3 8.6 25.7 48.6 xv 48.0 40.0 76.0 40.0 32.0 24.0 xi 31.0 27.6 65.5 3.5 3.5 13.8 xiv 12.5 8.3 66.7 8.3 37.5 33.3 xvii 9.4 0.0 43.8 0.0 6.3 37.5 xxx 47.1 29.4 67.7 8.8 52.9 14.7 iv 22.9 17.1 91.4 2.9 25.7 48.6 vii
40 – 70
38.1 28.6 33.3 9.5 45.2 33.3 xxiv 31.9 23.4 83.0 8.5 21.3 25.5 xxvi 20.4 14.3 22.5 8.2 30.6 40.8 iii 34.0 26.4 60.4 17.0 17.0 28.3 x 32.8 25.9 86.2 6.9 44.8 32.8 xxvii 16.7 10.4 22.9 2.1 31.3 22.9 xviii 23.7 17.0 69.5 5.1 52.5 25.4 viii 29.2 21.5 98.5 12.3 53.9 24.6 xxv 30.4 23.2 87.0 18.8 17.4 27.5 xii
> 70
27.9 25.3 94.3 8.9 58.9 10.1 xxii 13.6 10.9 75.5 2.7 55.5 17.3 xxiii 27.7 18.8 91.1 0.9 33.9 11.6 ix 30.7 19.8 92.1 9.9 2.0 18.8 xiii 22.0 13.1 81.0 2.4 50.0 14.3 Total CNN 27.8 20.5 76.9 8.5 36.7 22.7
*Denominators were based on inborn neonates <29 weeks’ GA admitted without major congenital anomaly. a Neonates either received high frequency ventilation or intermittent positive pressure ventilation. b Neonates never received any antibiotics. Prophylactic administration of trimethoprim or amoxicillin for the prevention of urinary tract infections with a suspected renal anomaly was not included as antibiotics. c Information obtained from Discharge screen/table of CNN database. These are unadjusted rates.
E. Site Comparisons
50
E.2. Site Comparisons –
Survival / Mortality

E. Site Comparisons
51
Presentation #28 Survival rates by site: All GA
Site Percentage survival for each GA (completed weeks)
<25 25-26 27-28 29-30 31-32 33-34 35-36 ≥37 Overall survival rate for sites*
Aᶲ 66.7 100.0 80.0 100.0 100.0 NA 100.0 92.3 96.7
B 53.3 100.0 94.3 97.6 94.9 97.6 99.0 99.0 97.0
C 76.9 91.3 97.4 91.3 100.0 96.4 98.7 98.9 97.2
D NA 66.7 86.7 100.0 100.0 100.0 100.0 99.6 99.2
E 66.7 90.9 83.3 100.0 98.0 99.0 100.0 98.7 98.3 F 58.8 88.2 82.9 100.0 95.8 97.8 99.5 99.0 97.2 G 33.3 62.5 90.5 100.0 100.0 98.7 100.0 99.4 97.8 H 86.7 89.7 88.5 100.0 98.0 98.7 96.0 98.8 97.4 I 90.0 100.0 100.0 100.0 100.0 98.9 100.0 99.5 99.4 J 75.0 85.7 89.5 90.5 96.0 90.7 98.3 98.0 96.4 K 50.0 100.0 81.3 100.0 100.0 100.0 100.0 100.0 96.8
Lᶲ 55.6 83.3 100.0 100.0 100.0 NA NA NA 93.9 M 0.0 85.7 94.1 100.0 100.0 100.0 98.9 100.0 99.0 N 50.0 57.1 88.9 100.0 96.0 100.0 100.0 99.2 97.9 O 66.7 88.0 89.5 100.0 100.0 100.0 100.0 99.2 97.6 P 66.7 92.9 100.0 100.0 100.0 97.9 99.1 99.7 98.8
Qᶲ 42.9 83.3 92.9 97.1 96.8 100.0 100.0 100.0 93.0 R NA NA 100.0 NA 100.0 100.0 100.0 96.9 97.6 S 58.3 71.4 87.9 97.3 98.4 99.3 96.5 98.5 95.8 T 57.7 87.0 96.2 98.3 98.8 95.8 98.7 98.8 96.5 U 65.5 90.0 92.6 94.2 98.3 98.3 100.0 98.7 95.8
Vᶲ 100.0 80.0 88.9 97.8 98.0 NA NA NA 95.8
Wᶲ 75.0 90.9 96.0 94.4 98.6 NA NA NA 95.1
Xᶲ 75.0 75.0 95.8 94.7 97.0 98.6 100.0 88.9 97.0 Y 0.0 100.0 76.9 100.0 100.0 98.4 100.0 100.0 97.4 Z 77.3 95.5 98.0 98.0 100.0 99.2 99.5 99.2 98.6
AAᶲ 55.9 82.7 92.7 95.8 97.8 90.9 97.8 98.7 93.9 AB 76.7 84.2 96.4 97.9 93.9 98.3 100.0 99.0 94.8 AC 60.0 83.3 100.0 100.0 100.0 100.0 100.0 100.0 98.5 AD NA NA 100.0 100.0 100.0 100.0 100.0 100.0 100.0 AE NA 66.7 100.0 100.0 100.0 100.0 100.0 100.0 99.7 AF 100.0 100.0 100.0 100.0 100.0 100.0 100.0 98.9 99.3 Overall survival rate for GA**
65.1 86.8 93.2 97.4 98.3 98.4 99.2 99.0 97.2
These analyses included 15 477 neonates from 32 sites (7 neonates had missing GA data). Twenty-five sites collected data on all eligible admissions whereas seven sites (marked byᶲ) collected data on selected eligible admissions only. ᶲ Please note the data collection criteria were not the same for these seven sites, and thus their rates may not be comparable with other sites. Overall* = (number of neonates who survived per site / total number of neonates for that site)*100 Overall** = (number of neonates who survived for each GA category / total number of neonates in each GA category)*100 NA = no data available, 0 = no neonates survived, Delivery room deaths were not included

E. Site Comparisons
52
Presentation #29 Survival rates by site: All BW
Site Percentage survival for each BW (g) category
<500 500-749 750-999 1000-1249 1250-1499 1500-2499 ≥2500 Overall survival rate for sites*
Aᶲ NA 75.0 100.0 100.0 93.8 100.0 94.1 96.7 B 0.0 76.0 95.5 100.0 88.9 97.9 99.1 97.0 C 50.0 80.0 100.0 97.1 96.6 95.8 99.1 97.2 D NA 50.0 100.0 81.8 100.0 100.0 99.6 99.2 E NA 100.0 75.0 94.1 100.0 99.4 98.9 98.3 F 50.0 53.3 88.5 88.6 97.0 98.2 99.2 97.2 G NA 40.0 71.4 100.0 100.0 100.0 99.0 97.8 H 0.0 85.7 96.7 89.7 100.0 98.1 98.5 97.4 I 100.0 91.7 100.0 100.0 100.0 99.4 99.6 99.4 J 100.0 62.5 100.0 91.3 100.0 93.3 98.1 96.4 K 100.0 57.1 88.9 88.9 100.0 100.0 100.0 96.8
Lᶲ 0.0 69.6 91.7 100.0 100.0 100.0 100.0 93.9 M 0.0 66.7 90.9 100.0 100.0 99.2 100.0 99.0 N NA 42.9 87.5 100.0 100.0 100.0 98.9 97.9 O 66.7 73.7 88.5 100.0 100.0 100.0 99.3 97.6 P 0.0 83.3 94.7 100.0 100.0 98.4 99.8 98.8
Qᶲ NA 71.4 81.8 88.2 100.0 95.5 100.0 93.1 R NA NA 100.0 100.0 100.0 96.6 97.8 97.6 S 33.3 64.7 85.7 86.1 97.2 97.9 98.9 95.8 T 33.3 70.6 91.1 95.8 96.9 98.5 98.2 96.5 U 54.5 75.7 91.3 94.0 98.3 98.4 98.6 95.8
Vᶲ NA 100.0 60.0 100.0 100.0 98.2 100.0 95.8
Wᶲ NA 75.0 95.8 96.6 96.6 97.0 100.0 95.1
Xᶲ 50.0 80.0 93.8 100.0 95.7 97.5 98.6 97.0 Y 0.0 40.0 75.0 93.3 93.3 100.0 100.0 97.4 Z 100.0 86.7 96.1 98.4 100.0 99.5 99.1 98.6
AAᶲ 50.0 58.8 83.6 95.0 92.6 98.8 98.1 93.9 AB 62.5 84.2 89.0 94.8 96.5 98.0 99.3 94.8 AC 75.0 58.3 100.0 100.0 100.0 100.0 100.0 98.5 AD NA NA NA 100.0 100.0 100.0 100.0 100.0 AE NA 0.0 100.0 100.0 100.0 100.0 100.0 99.7 AF NA NA 100.0 100.0 100.0 98.6 99.5 99.3 Overall survival rate for BW**
50.9 73.4 90.3 95.3 97.6 98.6 99.0 97.2
These analyses included 15 479 neonates from 32 sites (5 neonates had missing BW data). Twenty-five sites collected data on all eligible admissions whereas seven sites (marked by ᶲ) collected data on selected eligible admissions only. ᶲ Please note the data collection criteria were not the same for these seven sites, and thus their rates may not be comparable with other sites. Overall* = (number of neonates who survived per site / total number of neonates for site)*100 Overall** = (number of neonates who survived for each BW category / total number of neonates in each BW category)*100 NA = no data available, 0 = no neonates survived, Delivery room deaths were not included
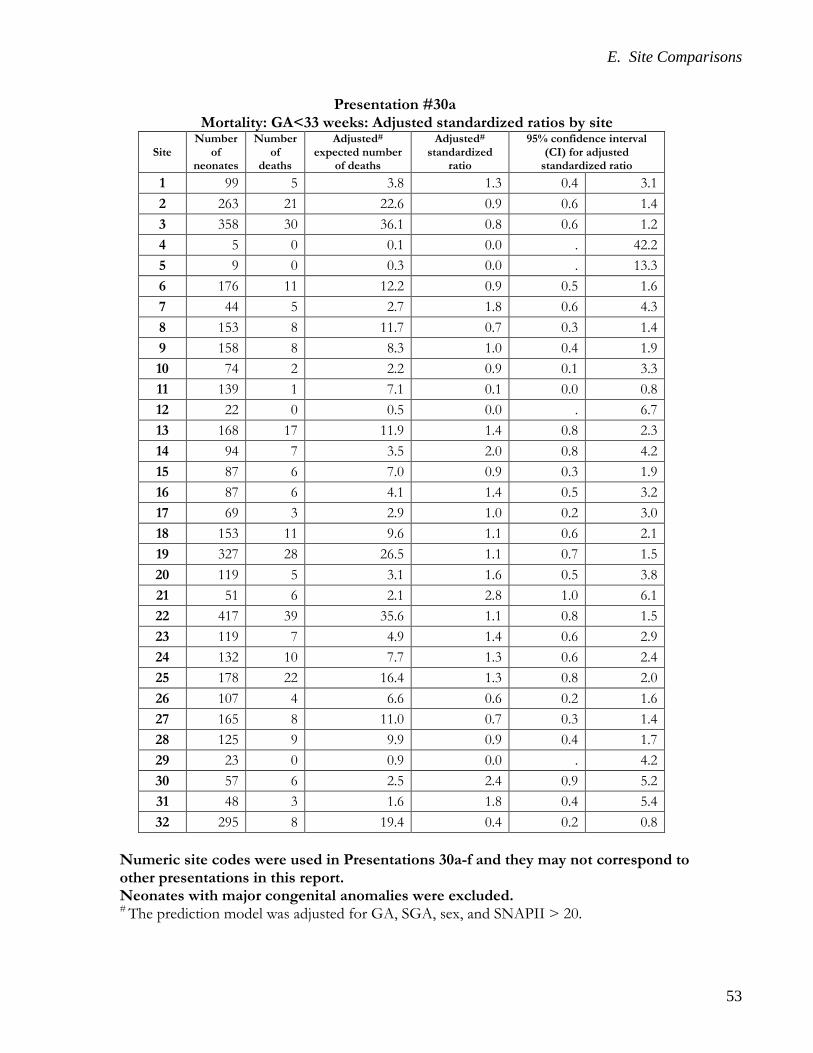
E. Site Comparisons
53
Presentation #30a Mortality: GA<33 weeks: Adjusted standardized ratios by site
Site Number
of neonates
Number of
deaths
Adjusted# expected number
of deaths
Adjusted# standardized
ratio
95% confidence interval (CI) for adjusted
standardized ratio 1 99 5 3.8 1.3 0.4 3.1 2 263 21 22.6 0.9 0.6 1.4 3 358 30 36.1 0.8 0.6 1.2 4 5 0 0.1 0.0 . 42.2 5 9 0 0.3 0.0 . 13.3 6 176 11 12.2 0.9 0.5 1.6 7 44 5 2.7 1.8 0.6 4.3 8 153 8 11.7 0.7 0.3 1.4 9 158 8 8.3 1.0 0.4 1.9 10 74 2 2.2 0.9 0.1 3.3 11 139 1 7.1 0.1 0.0 0.8 12 22 0 0.5 0.0 . 6.7 13 168 17 11.9 1.4 0.8 2.3 14 94 7 3.5 2.0 0.8 4.2 15 87 6 7.0 0.9 0.3 1.9 16 87 6 4.1 1.4 0.5 3.2 17 69 3 2.9 1.0 0.2 3.0 18 153 11 9.6 1.1 0.6 2.1 19 327 28 26.5 1.1 0.7 1.5 20 119 5 3.1 1.6 0.5 3.8 21 51 6 2.1 2.8 1.0 6.1 22 417 39 35.6 1.1 0.8 1.5 23 119 7 4.9 1.4 0.6 2.9 24 132 10 7.7 1.3 0.6 2.4 25 178 22 16.4 1.3 0.8 2.0 26 107 4 6.6 0.6 0.2 1.6 27 165 8 11.0 0.7 0.3 1.4 28 125 9 9.9 0.9 0.4 1.7 29 23 0 0.9 0.0 . 4.2 30 57 6 2.5 2.4 0.9 5.2 31 48 3 1.6 1.8 0.4 5.4 32 295 8 19.4 0.4 0.2 0.8
Numeric site codes were used in Presentations 30a-f and they may not correspond to other presentations in this report. Neonates with major congenital anomalies were excluded. # The prediction model was adjusted for GA, SGA, sex, and SNAPII > 20.

E. Site Comparisons
54
Presentations #30b Mortality: GA<33 weeks: Adjusted standardized ratios by site
Explanation for Presentation 30a Column 1: Numeric site codes Column 2: Number of eligible neonates at each site (<33 weeks GA and no major anomaly) Column 3: Number of neonates with the outcome of interest among those eligible neonates Column 4: Expected number of neonates with outcome of interest after adjustment for GA, SGA, sex, and SNAPII > 20 Column 5: Adjusted standardized ratio calculated based on observed deaths/expected deaths Columns 6 and 7: 95% CI around the adjusted standardized ratio for the outcome Explanation for Presentation 30b X-axis: Expected number of neonates with outcome (value from Column 4 of previous presentation) Y-axis: Adjusted standardized ratio (value from Column 5 of previous presentation) Dark points with numerical notation: Site and its location matching x and y axis values Red funnel shaped lines: 95% confidence limits based on entire network information. Sites outside of red lines represent higher or lower (depending upon position in graph) adjusted standardized ratio. However, for determining whether site is statistically different from others, one should also assess 95% CI and check whether both upper and lower boundaries are also outside of the funnel area or not.
Y

E. Site Comparisons
55
Presentation #30c Mortality: GA<29 weeks: Adjusted standardized ratios by site
Site Number
of neonates
Number of
deaths
Adjusted# expected number
of deaths
Adjusted# standardized
ratio
95% confidence interval (CI) for adjusted
standardized ratio 1 26 4 2.8 1.4 0.4 3.6 2 129 19 20.0 0.9 0.6 1.5 3 197 24 32.0 0.8 0.5 1.1 6 72 11 10.6 1.0 0.5 1.9 7 24 5 2.4 2.0 0.7 4.8 8 67 7 10.0 0.7 0.3 1.4 9 54 5 6.4 0.8 0.3 1.8 10 13 2 1.5 1.4 0.2 4.9 11 45 1 5.9 0.2 0.0 0.9 12 4 0 0.3 0.0 . 13.2 13 67 15 10.2 1.5 0.8 2.4 14 29 3 2.8 1.1 0.2 3.1 15 38 6 6.4 0.9 0.3 2.0 16 31 6 3.0 2.0 0.7 4.4 17 25 3 2.6 1.2 0.2 3.4 18 59 8 8.2 1.0 0.4 1.9 19 135 26 22.6 1.1 0.8 1.7 20 25 3 1.7 1.7 0.4 5.1 21 18 5 1.8 2.8 0.9 6.6 22 189 31 32.0 1.0 0.7 1.4 23 36 4 3.8 1.1 0.3 2.7 24 39 8 6.1 1.3 0.6 2.6 25 83 22 14.8 1.5 0.9 2.2 26 34 4 5.6 0.7 0.2 1.8 27 71 6 9.2 0.7 0.2 1.4 28 55 9 8.9 1.0 0.5 1.9 29 4 0 0.6 0.0 . 6.1 30 21 6 1.9 3.1 1.1 6.7 31 18 3 1.1 2.7 0.6 8.0 32 109 7 16.4 0.4 0.2 0.9
Numeric site codes were used in Presentations 30a-f and they may not correspond to other presentations in this report. Neonates with major congenital anomalies were excluded. # The prediction model was adjusted for GA, SGA, sex, and SNAPII > 20. Note: Site 4 and 5 were excluded from the analysis due to the small number of eligible neonates.
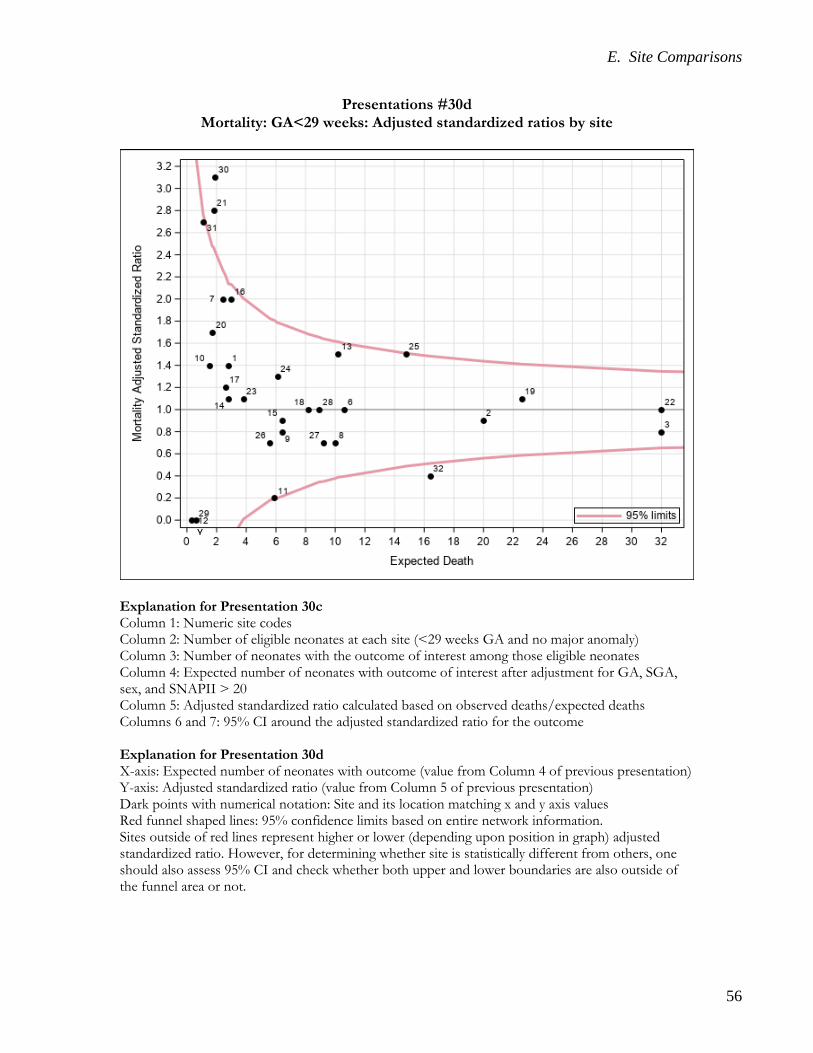
E. Site Comparisons
56
Presentations #30d Mortality: GA<29 weeks: Adjusted standardized ratios by site
Explanation for Presentation 30c Column 1: Numeric site codes Column 2: Number of eligible neonates at each site (<29 weeks GA and no major anomaly) Column 3: Number of neonates with the outcome of interest among those eligible neonates Column 4: Expected number of neonates with outcome of interest after adjustment for GA, SGA, sex, and SNAPII > 20 Column 5: Adjusted standardized ratio calculated based on observed deaths/expected deaths Columns 6 and 7: 95% CI around the adjusted standardized ratio for the outcome Explanation for Presentation 30d X-axis: Expected number of neonates with outcome (value from Column 4 of previous presentation) Y-axis: Adjusted standardized ratio (value from Column 5 of previous presentation) Dark points with numerical notation: Site and its location matching x and y axis values Red funnel shaped lines: 95% confidence limits based on entire network information. Sites outside of red lines represent higher or lower (depending upon position in graph) adjusted standardized ratio. However, for determining whether site is statistically different from others, one should also assess 95% CI and check whether both upper and lower boundaries are also outside of the funnel area or not.
Y
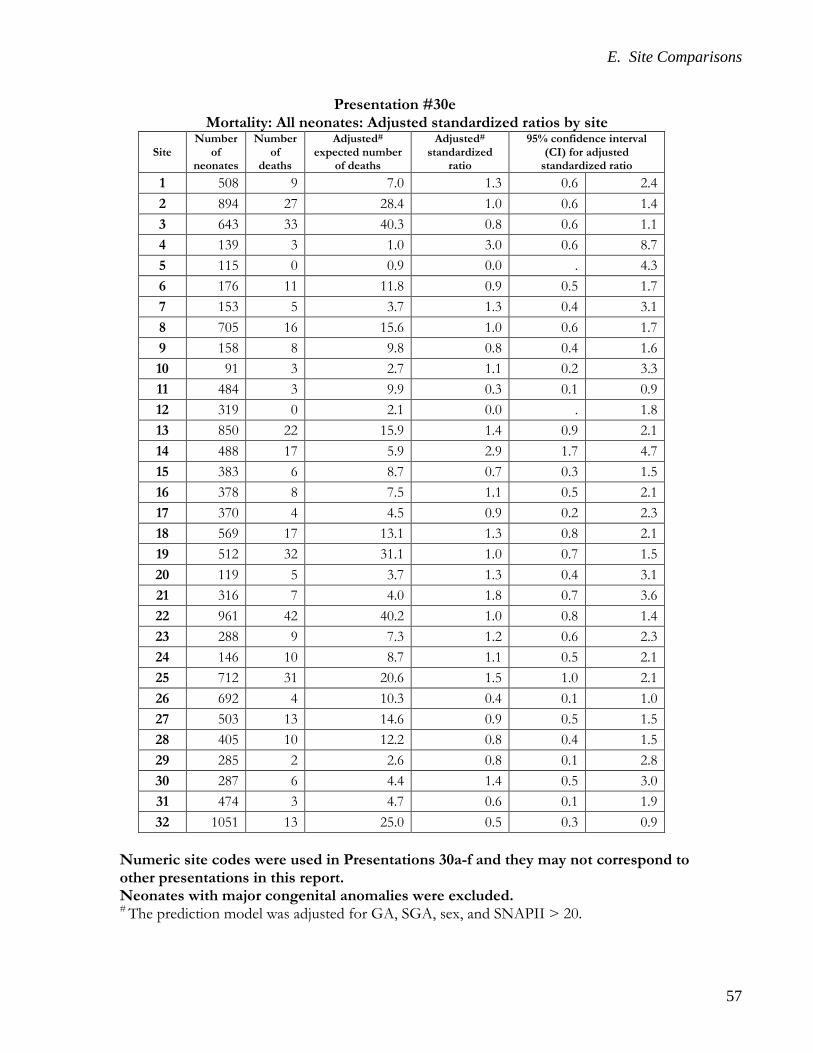
E. Site Comparisons
57
Presentation #30e Mortality: All neonates: Adjusted standardized ratios by site
Site Number
of neonates
Number of
deaths
Adjusted# expected number
of deaths
Adjusted# standardized
ratio
95% confidence interval (CI) for adjusted
standardized ratio 1 508 9 7.0 1.3 0.6 2.4 2 894 27 28.4 1.0 0.6 1.4 3 643 33 40.3 0.8 0.6 1.1 4 139 3 1.0 3.0 0.6 8.7 5 115 0 0.9 0.0 . 4.3 6 176 11 11.8 0.9 0.5 1.7 7 153 5 3.7 1.3 0.4 3.1 8 705 16 15.6 1.0 0.6 1.7 9 158 8 9.8 0.8 0.4 1.6 10 91 3 2.7 1.1 0.2 3.3 11 484 3 9.9 0.3 0.1 0.9 12 319 0 2.1 0.0 . 1.8 13 850 22 15.9 1.4 0.9 2.1 14 488 17 5.9 2.9 1.7 4.7 15 383 6 8.7 0.7 0.3 1.5 16 378 8 7.5 1.1 0.5 2.1 17 370 4 4.5 0.9 0.2 2.3 18 569 17 13.1 1.3 0.8 2.1 19 512 32 31.1 1.0 0.7 1.5 20 119 5 3.7 1.3 0.4 3.1 21 316 7 4.0 1.8 0.7 3.6 22 961 42 40.2 1.0 0.8 1.4 23 288 9 7.3 1.2 0.6 2.3 24 146 10 8.7 1.1 0.5 2.1 25 712 31 20.6 1.5 1.0 2.1 26 692 4 10.3 0.4 0.1 1.0 27 503 13 14.6 0.9 0.5 1.5 28 405 10 12.2 0.8 0.4 1.5 29 285 2 2.6 0.8 0.1 2.8 30 287 6 4.4 1.4 0.5 3.0 31 474 3 4.7 0.6 0.1 1.9 32 1051 13 25.0 0.5 0.3 0.9
Numeric site codes were used in Presentations 30a-f and they may not correspond to other presentations in this report. Neonates with major congenital anomalies were excluded. # The prediction model was adjusted for GA, SGA, sex, and SNAPII > 20.

E. Site Comparisons
58
Presentations #30f Mortality: All neonates: Adjusted standardized ratios by site
Explanation for Presentation 30e Column 1: Numeric site codes Column 2: Number of eligible neonates at each site (no major anomaly) Column 3: Number of neonates with outcome of interest among those eligible neonates Column 4: Expected number of neonates with the outcome of interest after adjustment for GA, SGA, sex, and SNAPII > 20 Column 5: Adjusted standardized ratio calculated based on observed deaths/expected deaths Columns 6 and 7: 95% CI around the adjusted standardized ratio for the outcome Explanation for Presentation 30f X-axis: Expected number of neonates with outcome (value from Column 4 of previous presentation) Y-axis: Adjusted standardized ratio (value from Column 5 of previous presentation) Dark points with numerical notation: Site and its location matching x and y axis values Red funnel shaped lines: 95% confidence limits based on entire network information. Sites outside of red lines represent higher or lower (depending upon position in graph) adjusted standardized ratio. However, for determining whether site is statistically different from others, one should also assess 95% CI and check whether both upper and lower boundaries are also outside of the funnel area or not.
Y
E. Site Comparisons
59
E.3. Site Comparisons –
Mortality / Morbidities

E. Site Comparisons
60
Presentation #31 Mortality/morbidities: GA<33 weeks: Site specific crude rates
Site Number
of neonates
Mortality Severe neurological injury
Severe ROP
CLD at 36 weeks PMA or discharge*
NEC stage 2 or 3
Late onset sepsis
Mortality or severe morbidity
N % % % % % % % K
< 60
11.4 10.5 17.4 15.4 6.8 4.6 31.8 AD 0.0 0.0 33.3 11.1 0.0 11.1 22.2 AE 4.4 5.3 6.7 4.6 0.0 0.0 13.0 AF 0.0 21.1 0.0 21.7 0.0 0.0 33.3 D 6.3 2.1 0.0 17.8 0.0 8.3 25.0 R 0.0 33.3 0.0 25.0 0.0 0.0 16.7 N 11.8 2.7 0.0 17.8 3.9 9.8 29.4 Y 11.9 10.0 2.9 11.5 3.4 5.1 28.8 M
61 – 120
4.4 3.6 2.3 9.1 0.0 8.7 20.3 A 2.7 3.3 7.4 13.9 5.4 6.8 23.0 AC 6.7 5.6 9.8 18.6 4.4 13.3 28.9 G 7.8 5.7 0.0 19.3 1.1 5.6 28.9 E 5.0 3.0 6.8 16.7 5.0 13.0 27.0 J 7.9 15.5 7.1 34.6 5.0 10.9 52.5 P 3.6 7.9 10.9 33.0 1.8 13.6 40.0 V 4.2 4.8 1.9 17.1 4.2 5.8 26.7 X
121 – 170
5.7 11.9 10.5 18.3 0.8 7.4 31.2 O 7.0 1.8 7.1 14.3 3.1 6.3 26.6 Q 8.1 6.3 7.9 21.4 3.7 16.2 35.3 I 0.7 1.9 22.2 23.8 0.0 8.3 31.3 H 5.7 8.3 3.9 34.9 3.2 10.8 47.1 W 4.9 5.7 5.8 38.5 3.7 6.8 44.8 B 7.9 4.8 10.0 73.7 1.8 2.4 75.6 C
> 170
5.8 9.1 15.7 30.7 2.3 8.7 41.6 F 10.1 8.8 16.1 29.1 2.3 6.7 37.1 L 6.2 16.0 3.2 32.0 2.8 7.3 41.3 S 12.9 8.4 7.2 36.4 8.6 13.4 47.9 T 8.0 7.3 14.7 74.7 4.4 16.0 78.6 Z 3.2 3.6 6.9 35.9 1.3 5.8 41.9 AA 9.8 19.0 24.7 27.2 5.5 9.3 38.4 AB 8.5 6.7 14.4 17.6 4.4 9.6 32.1 U 9.4 9.9 7.2 36.1 5.1 16.5 47.3 Total CNN 7.2 8.0 9.1 31.3 3.6 9.8 41.3
Mortality or severe morbidity = Mortality prior to discharge or any of the five morbidities *PMA: Post-menstrual age These are unadjusted rates.

E. Site Comparisons
61
Presentation #32 Mortality/morbidities: GA<29 weeks: Site specific crude rates
Site Number
of neonates
Mortality Severe neurological injury
Severe ROP
CLD at 36 weeks PMA or discharge*
NEC stage 2 or 3
Late onset sepsis
Mortality or severe morbidity
N % % % % % % % N
< 25
27.8 5.9 0.0 46.2 11.1 27.8 66.7 AD 0.0 0.0 50.0 50.0 0.0 50.0 100.0 AF 0.0 40.0 0.0 60.0 0.0 0.0 80.0 A 15.4 7.7 28.6 54.6 15.4 30.8 76.9 D 16.7 5.9 0.0 26.7 0.0 11.1 38.9 R 0.0 50.0 0.0 100.0 0.0 0.0 50.0 Y 31.8 25.0 0.0 26.7 9.1 13.6 63.6 AE 20.0 25.0 25.0 25.0 0.0 0.0 60.0 K 20.8 18.2 22.2 31.6 12.5 8.3 58.3 M
25 – 40
12.0 4.6 4.6 22.7 0.0 20.0 44.0 V 12.0 12.5 4.6 34.8 16.0 20.0 60.0 E 15.4 8.7 13.6 50.0 7.7 30.8 61.5 J 13.3 19.2 10.0 69.6 0.0 10.0 73.3 G 21.9 12.9 0.0 28.0 3.1 15.6 53.1 P 11.1 16.7 20.0 78.1 5.6 33.3 86.1 X 11.1 11.4 16.7 50.0 2.8 11.1 61.1 Q 20.5 13.9 18.8 58.1 5.1 38.5 74.4 AC 15.0 10.0 13.9 41.7 10.0 25.0 55.0 I
41 – 80
2.1 4.3 24.4 61.7 0.0 20.8 75.0 W 9.1 7.4 11.8 74.0 7.3 10.9 78.2 O 16.1 3.7 12.8 23.4 7.1 10.7 46.4 B 14.1 8.8 13.3 96.4 4.7 4.7 96.9 F 21.7 14.5 28.0 63.5 4.4 14.5 69.6 H 11.4 11.6 6.3 52.4 4.3 17.1 68.6 L 15.1 28.6 5.3 65.1 6.9 13.7 78.1 C 8.1 13.7 18.6 54.4 2.7 17.6 68.9 S
> 80
25.9 14.5 10.3 66.2 16.5 25.9 78.8 Z 6.8 6.1 12.7 70.9 2.6 12.8 78.6 T 15.0 10.9 16.8 93.0 6.8 29.3 95.5 AA 19.9 29.4 27.5 57.5 12.8 17.7 72.3 U 16.3 16.8 9.2 63.4 10.2 34.2 79.1 AB 12.4 10.3 15.7 26.4 6.9 16.8 48.5 Total CNN 14.9 13.8 13.8 57.2 7.1 20.0 71.0
Mortality or severe morbidity = Mortality prior to discharge or any of the five morbidities *PMA: Post-menstrual age These are unadjusted rates.
E. Site Comparisons
62
E.3.1. Site Comparisons –
Late Onset Sepsis and Antimicrobial Use
In presentations #33 and #34, late onset sepsis was attributed to the hospital where the first episode of sepsis was acquired. Each neonate was counted only once even if there were
multiple episodes of infections.
In presentations #35 and #36, assignment of infection was based on location where the infection happened and not assigned to the hospital where the first episode of sepsis was
acquired. Each episode of infection was counted (the total number of episodes exceeds the total number of neonates).
In all other presentations of this report, all morbidities including late onset sepsis were attributed to the hospital where the neonate was first admitted.
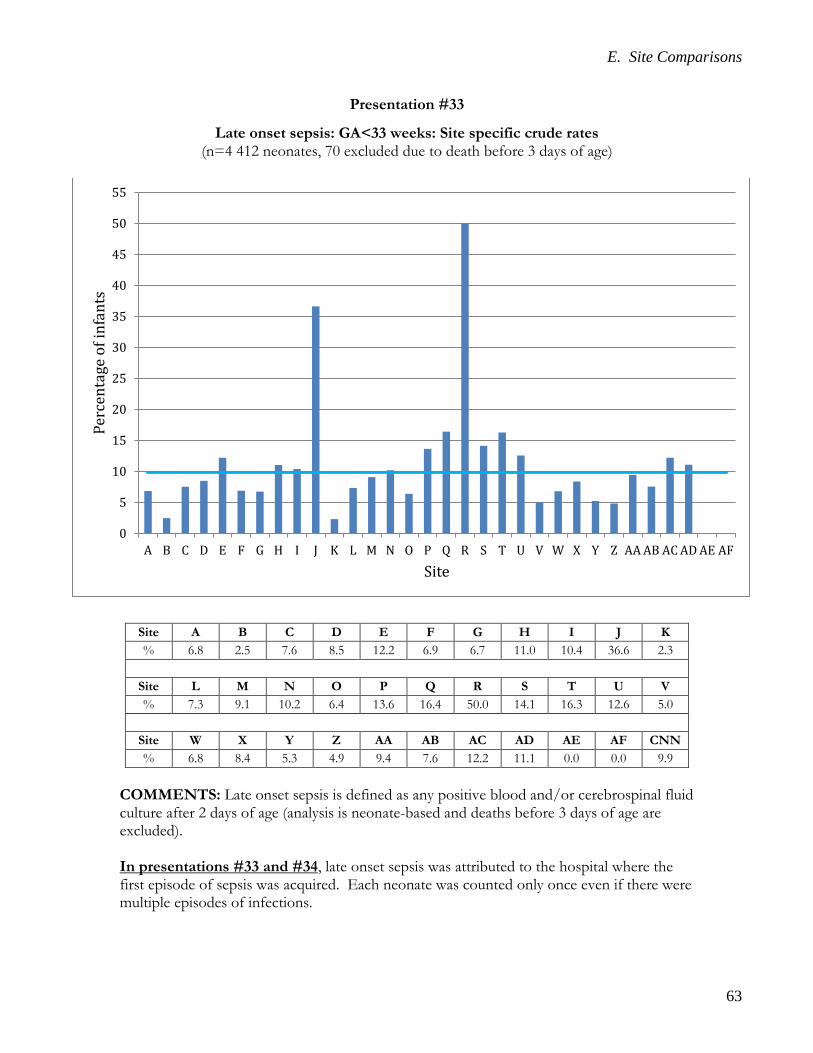
E. Site Comparisons
63
Presentation #33
Late onset sepsis: GA<33 weeks: Site specific crude rates (n=4 412 neonates, 70 excluded due to death before 3 days of age)
COMMENTS: Late onset sepsis is defined as any positive blood and/or cerebrospinal fluid culture after 2 days of age (analysis is neonate-based and deaths before 3 days of age are excluded). In presentations #33 and #34, late onset sepsis was attributed to the hospital where the first episode of sepsis was acquired. Each neonate was counted only once even if there were multiple episodes of infections.
0
5
10
15
20
25
30
35
40
45
50
55
A B C D E F G H I J K L M N O P Q R S T U V W X Y Z AA AB AC AD AE AF
Perc
enta
ge o
f inf
ants
Site
Site A B C D E F G H I J K % 6.8 2.5 7.6 8.5 12.2 6.9 6.7 11.0 10.4 36.6 2.3
Site L M N O P Q R S T U V % 7.3 9.1 10.2 6.4 13.6 16.4 50.0 14.1 16.3 12.6 5.0
Site W X Y Z AA AB AC AD AE AF CNN % 6.8 8.4 5.3 4.9 9.4 7.6 12.2 11.1 0.0 0.0 9.9
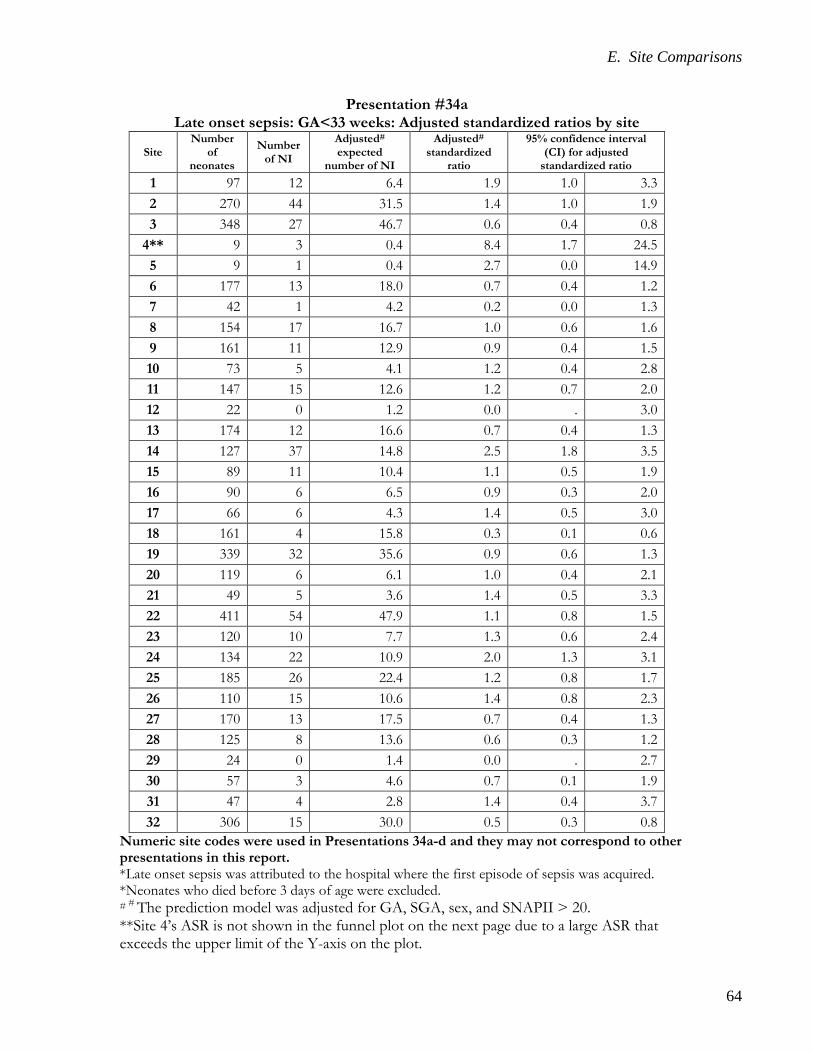
E. Site Comparisons
64
Presentation #34a Late onset sepsis: GA<33 weeks: Adjusted standardized ratios by site
Site Number
of neonates
Number of NI
Adjusted# expected
number of NI
Adjusted# standardized
ratio
95% confidence interval (CI) for adjusted
standardized ratio 1 97 12 6.4 1.9 1.0 3.3 2 270 44 31.5 1.4 1.0 1.9 3 348 27 46.7 0.6 0.4 0.8
4** 9 3 0.4 8.4 1.7 24.5 5 9 1 0.4 2.7 0.0 14.9 6 177 13 18.0 0.7 0.4 1.2 7 42 1 4.2 0.2 0.0 1.3 8 154 17 16.7 1.0 0.6 1.6 9 161 11 12.9 0.9 0.4 1.5 10 73 5 4.1 1.2 0.4 2.8 11 147 15 12.6 1.2 0.7 2.0 12 22 0 1.2 0.0 . 3.0 13 174 12 16.6 0.7 0.4 1.3 14 127 37 14.8 2.5 1.8 3.5 15 89 11 10.4 1.1 0.5 1.9 16 90 6 6.5 0.9 0.3 2.0 17 66 6 4.3 1.4 0.5 3.0 18 161 4 15.8 0.3 0.1 0.6 19 339 32 35.6 0.9 0.6 1.3 20 119 6 6.1 1.0 0.4 2.1 21 49 5 3.6 1.4 0.5 3.3 22 411 54 47.9 1.1 0.8 1.5 23 120 10 7.7 1.3 0.6 2.4 24 134 22 10.9 2.0 1.3 3.1 25 185 26 22.4 1.2 0.8 1.7 26 110 15 10.6 1.4 0.8 2.3 27 170 13 17.5 0.7 0.4 1.3 28 125 8 13.6 0.6 0.3 1.2 29 24 0 1.4 0.0 . 2.7 30 57 3 4.6 0.7 0.1 1.9 31 47 4 2.8 1.4 0.4 3.7 32 306 15 30.0 0.5 0.3 0.8
Numeric site codes were used in Presentations 34a-d and they may not correspond to other presentations in this report. *Late onset sepsis was attributed to the hospital where the first episode of sepsis was acquired. *Neonates who died before 3 days of age were excluded. # # The prediction model was adjusted for GA, SGA, sex, and SNAPII > 20. **Site 4’s ASR is not shown in the funnel plot on the next page due to a large ASR that exceeds the upper limit of the Y-axis on the plot.

E. Site Comparisons
65
Presentation # 34b Late onset sepsis: GA<33 weeks: Adjusted standardized ratios by site
Explanation for Presentation 34a Column 1: Numeric site codes Column 2: Number of eligible neonates at each site (<33 weeks GA) Column 3: Number of neonates with outcome of interest among those eligible neonates Column 4: Expected number of neonates with outcome of interest after adjustment for GA, SGA, sex, and SNAPII > 20 Column 5: Adjusted standardized ratio calculated based on observed late onset sepsis/expected late onset sepsis Columns 6 and 7: 95% CI around the adjusted standardized ratio for the outcome Explanation for Presentation 34b X-axis: Expected number of neonates with outcome (value from Column 4 of previous presentation) Y-axis: Adjusted standardized ratio (value from Column 5 of previous presentation) Dark points with numerical notation: Site and its location matching x and y axis values Red funnel shaped lines: 95% confidence limits based on entire network information. Sites outside of red lines represent higher or lower (depending upon position in graph) adjusted standardized ratio. However, for determining whether site is statistically different from others, one should also assess 95% CI and check whether both upper and lower boundaries are also outside of the funnel area or not.

E. Site Comparisons
66
Presentation #34c Late onset sepsis: GA<29 weeks: Adjusted standardized ratios by site
Site Number
of neonates
Number of NI
Adjusted# expected
number of NI
Adjusted# standardized
ratio
95% confidence interval (CI) for adjusted
standardized ratio 1 24 8 4.4 1.8 0.8 3.6 2 129 39 27.4 1.4 1.0 1.9 3 190 27 40.9 0.7 0.4 1.0 6 71 10 14.5 0.7 0.3 1.3 7 22 1 3.7 0.3 0.0 1.5 8 68 12 14.0 0.9 0.4 1.5 9 53 6 9.9 0.6 0.2 1.3 10 12 4 2.4 1.6 0.4 4.2 11 51 13 10.0 1.3 0.7 2.2 12 4 0 0.6 0.0 . 6.0 13 65 10 13.4 0.7 0.4 1.4 14 54 27 12.7 2.1 1.4 3.1 15 39 9 9.0 1.0 0.5 1.9 16 31 5 4.7 1.1 0.3 2.5 17 22 5 3.0 1.7 0.5 3.9 18 62 3 12.6 0.2 0.0 0.7 19 136 25 30.2 0.8 0.5 1.2 20 24 4 3.2 1.2 0.3 3.2 21 16 5 2.6 1.9 0.6 4.4 22 175 50 39.6 1.3 0.9 1.7 23 35 5 5.5 0.9 0.3 2.1 24 37 15 7.9 1.9 1.1 3.1 25 85 23 19.5 1.2 0.7 1.8 26 36 12 8.3 1.5 0.7 2.5 27 71 11 14.1 0.8 0.4 1.4 28 53 6 11.7 0.5 0.2 1.1 29 5 0 0.9 0.0 . 3.9 30 20 3 3.5 0.9 0.2 2.5 31 17 2 1.8 1.1 0.1 3.9 32 113 15 23.6 0.6 0.4 1.1
Numeric site codes were used in Presentations 34a-d and they may not correspond to other presentations in this report. *Late onset sepsis was attributed to the hospital where the first episode of sepsis was acquired. *Neonates who died before 3 days of age are excluded. # The prediction model was adjusted for GA, SGA, sex, and SNAPII > 20. Note: Sites 4 and 5 were excluded from the analysis due to the small number of eligible neonates.
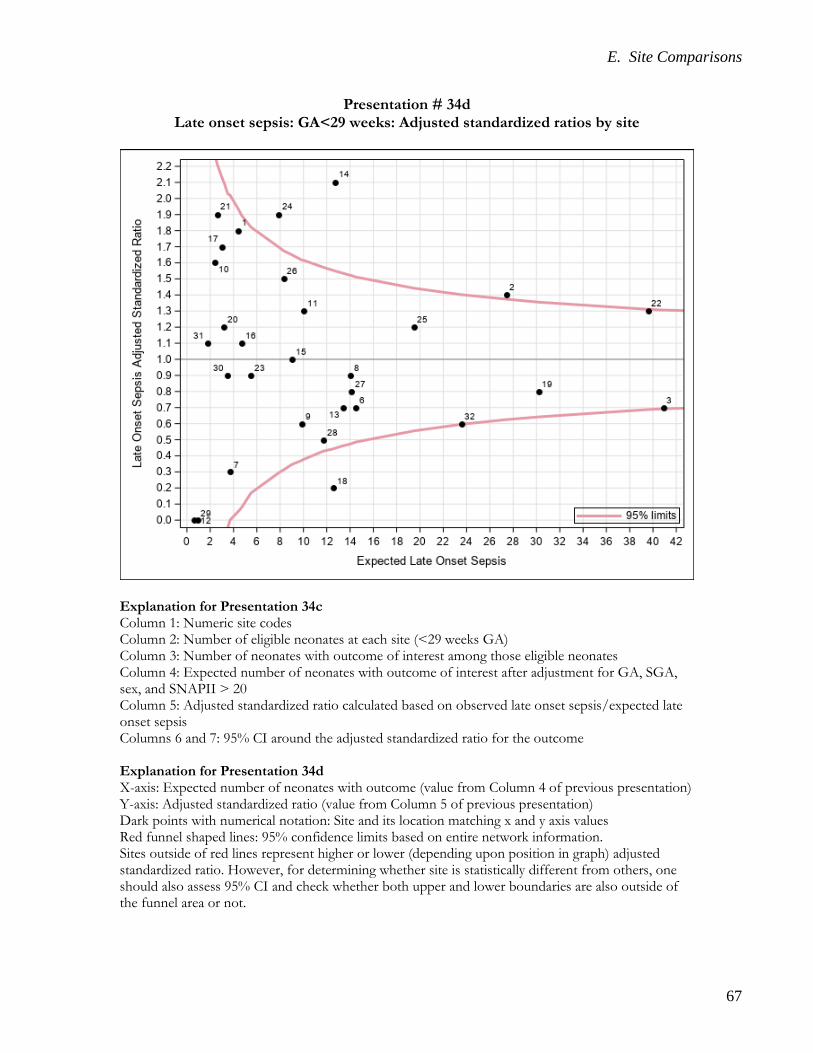
E. Site Comparisons
67
Presentation # 34d Late onset sepsis: GA<29 weeks: Adjusted standardized ratios by site
Explanation for Presentation 34c Column 1: Numeric site codes Column 2: Number of eligible neonates at each site (<29 weeks GA) Column 3: Number of neonates with outcome of interest among those eligible neonates Column 4: Expected number of neonates with outcome of interest after adjustment for GA, SGA, sex, and SNAPII > 20 Column 5: Adjusted standardized ratio calculated based on observed late onset sepsis/expected late onset sepsis Columns 6 and 7: 95% CI around the adjusted standardized ratio for the outcome Explanation for Presentation 34d X-axis: Expected number of neonates with outcome (value from Column 4 of previous presentation) Y-axis: Adjusted standardized ratio (value from Column 5 of previous presentation) Dark points with numerical notation: Site and its location matching x and y axis values Red funnel shaped lines: 95% confidence limits based on entire network information. Sites outside of red lines represent higher or lower (depending upon position in graph) adjusted standardized ratio. However, for determining whether site is statistically different from others, one should also assess 95% CI and check whether both upper and lower boundaries are also outside of the funnel area or not.

E. Site Comparisons
68
Presentation #35 Late onset sepsis per 1000 patient days: GA<33 weeks: Site specific crude rates
Site Infections per 1000 patient days
Site Infections per 1000 patient days
Site Infections per 1000 patient days
A 2.2 L 3.2 W 1.4 B 0.6 M 1.8 X 2.0 C 1.6 N 2.1 Y 1.6 D 1.9 O 1.7 Z 1.8 E 3.0 P 3.3 AA 3.3 F 2.1 Q 4.2 AB 3.0 G 2.0 R 3.4 AC 2.5 H 2.3 S 3.9 AD 1.7 I 2.1 T 5.8 AE 0.0 J 6.9 U 5.5 AF 0.0
K 0.5 V 2.1 CNN 3.0 Total number of neonates = 4 482
COMMENTS: Late onset sepsis is defined as positive blood and/or cerebrospinal fluid culture after 2 days of age (includes all admissions). Considerable variation exists when late onset sepsis is analyzed as infections per 1000 patient days. Note that it is possible that certain sites with high retro transfer rates may report a high incidence per 1000 patient days since neonates who are transferred out are those with lower acuity. If a neonate had >1 distinct episodes of infection, each episode will be counted as separate infections in the numerator. In presentations #35 and #36, the infection was assigned to the hospital where the infection happened and not assigned to the hospital where the first episode of sepsis happened.
0
1
2
3
4
5
6
7
A B C D E F G H I J K L M N O P Q R S T U V W X Y Z AA AB AC AD AE AF
Nos
ocom
ial i
nfec
tion
per 1
000
patie
nt d
ays
Site
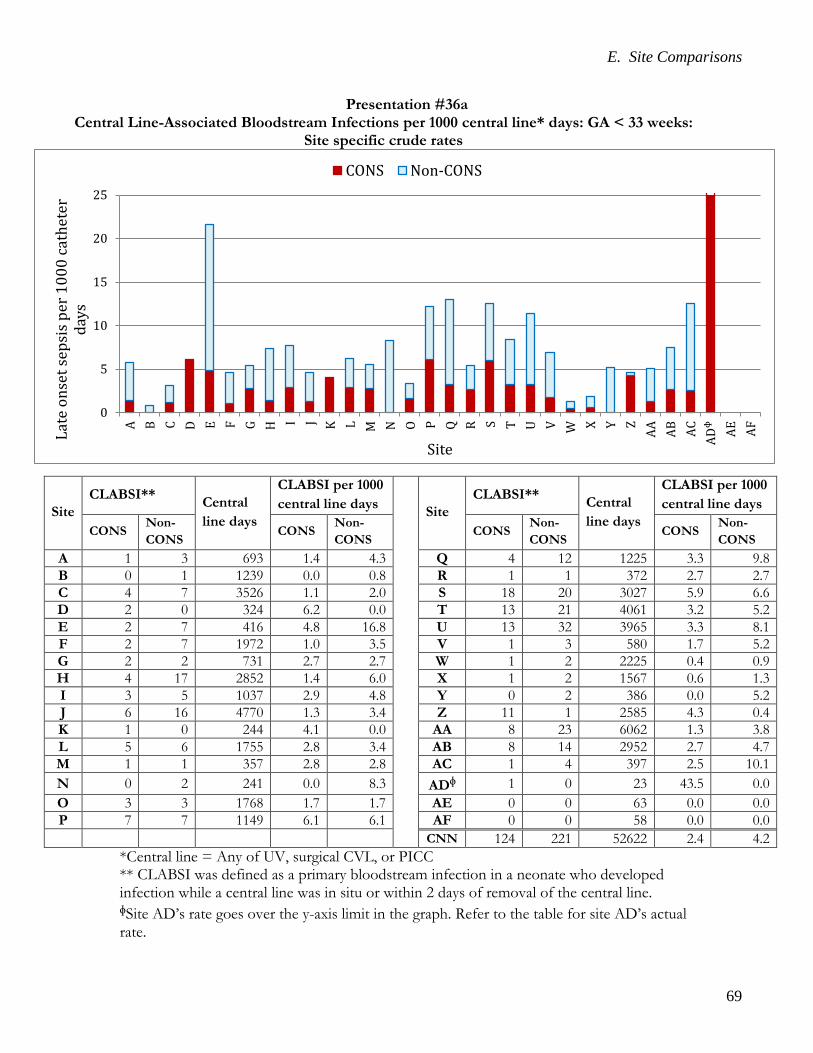
E. Site Comparisons
69
Presentation #36a Central Line-Associated Bloodstream Infections per 1000 central line* days: GA < 33 weeks:
Site specific crude rates
Site CLABSI** Central
line days
CLABSI per 1000 central line days
Site CLABSI** Central
line days
CLABSI per 1000 central line days
CONS Non-CONS
CONS Non-CONS
CONS Non-CONS
CONS Non-CONS
A 1 3 693 1.4 4.3 Q 4 12 1225 3.3 9.8 B 0 1 1239 0.0 0.8 R 1 1 372 2.7 2.7 C 4 7 3526 1.1 2.0 S 18 20 3027 5.9 6.6 D 2 0 324 6.2 0.0 T 13 21 4061 3.2 5.2 E 2 7 416 4.8 16.8 U 13 32 3965 3.3 8.1 F 2 7 1972 1.0 3.5 V 1 3 580 1.7 5.2 G 2 2 731 2.7 2.7 W 1 2 2225 0.4 0.9 H 4 17 2852 1.4 6.0 X 1 2 1567 0.6 1.3 I 3 5 1037 2.9 4.8 Y 0 2 386 0.0 5.2 J 6 16 4770 1.3 3.4 Z 11 1 2585 4.3 0.4 K 1 0 244 4.1 0.0 AA 8 23 6062 1.3 3.8 L 5 6 1755 2.8 3.4 AB 8 14 2952 2.7 4.7 M 1 1 357 2.8 2.8 AC 1 4 397 2.5 10.1 N 0 2 241 0.0 8.3 ADᶲ 1 0 23 43.5 0.0 O 3 3 1768 1.7 1.7 AE 0 0 63 0.0 0.0 P 7 7 1149 6.1 6.1 AF 0 0 58 0.0 0.0 CNN 124 221 52622 2.4 4.2
*Central line = Any of UV, surgical CVL, or PICC ** CLABSI was defined as a primary bloodstream infection in a neonate who developed infection while a central line was in situ or within 2 days of removal of the central line. ᶲSite AD’s rate goes over the y-axis limit in the graph. Refer to the table for site AD’s actual rate.
0
5
10
15
20
25
A B C D E F G H I J K L M N O P Q R S T U V W X Y ZAA AB AC ADᶲ
AE AFLate
ons
et se
psis
per
100
0 ca
thet
er
days
Site
CONS Non-CONS
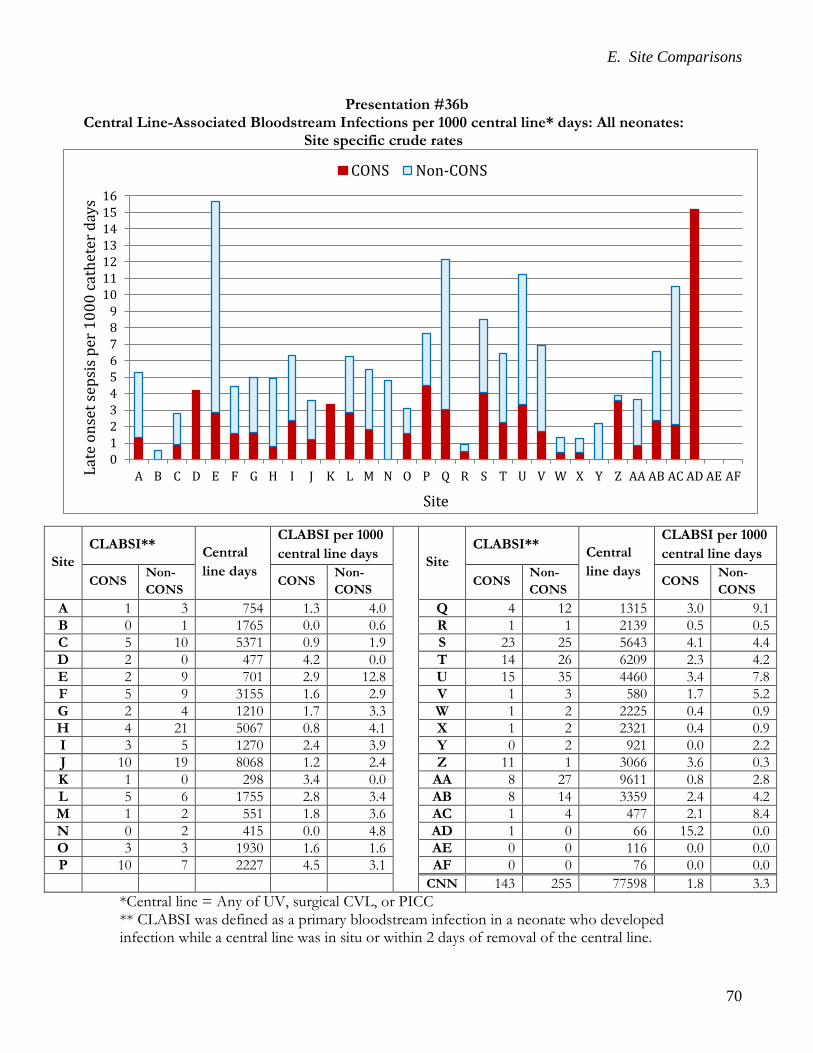
E. Site Comparisons
70
Presentation #36b Central Line-Associated Bloodstream Infections per 1000 central line* days: All neonates:
Site specific crude rates
Site CLABSI** Central
line days
CLABSI per 1000 central line days
Site CLABSI** Central
line days
CLABSI per 1000 central line days
CONS Non-CONS
CONS Non-CONS
CONS Non-CONS
CONS Non-CONS
A 1 3 754 1.3 4.0 Q 4 12 1315 3.0 9.1 B 0 1 1765 0.0 0.6 R 1 1 2139 0.5 0.5 C 5 10 5371 0.9 1.9 S 23 25 5643 4.1 4.4 D 2 0 477 4.2 0.0 T 14 26 6209 2.3 4.2 E 2 9 701 2.9 12.8 U 15 35 4460 3.4 7.8 F 5 9 3155 1.6 2.9 V 1 3 580 1.7 5.2 G 2 4 1210 1.7 3.3 W 1 2 2225 0.4 0.9 H 4 21 5067 0.8 4.1 X 1 2 2321 0.4 0.9 I 3 5 1270 2.4 3.9 Y 0 2 921 0.0 2.2 J 10 19 8068 1.2 2.4 Z 11 1 3066 3.6 0.3 K 1 0 298 3.4 0.0 AA 8 27 9611 0.8 2.8 L 5 6 1755 2.8 3.4 AB 8 14 3359 2.4 4.2 M 1 2 551 1.8 3.6 AC 1 4 477 2.1 8.4 N 0 2 415 0.0 4.8 AD 1 0 66 15.2 0.0 O 3 3 1930 1.6 1.6 AE 0 0 116 0.0 0.0 P 10 7 2227 4.5 3.1 AF 0 0 76 0.0 0.0 CNN 143 255 77598 1.8 3.3
*Central line = Any of UV, surgical CVL, or PICC ** CLABSI was defined as a primary bloodstream infection in a neonate who developed infection while a central line was in situ or within 2 days of removal of the central line.
0123456789
10111213141516
A B C D E F G H I J K L M N O P Q R S T U V W X Y Z AA AB AC AD AE AFLate
ons
et se
psis
per
100
0 ca
thet
er d
ays
Site
CONS Non-CONS

E. Site Comparisons
71
Presentation #37 Days of antimicrobial use per 1000 patient days among neonates who did not
develop NEC, early-onset sepsis or late onset sepsis: GA <33 weeks*
Site
Days of antimicrobial use per 1000 patient days
Site
Days of antimicrobial use per 1000 patient days
Site
Days of antimicrobial use per 1000 patient days
A 87.0 L 118.1 W 94.2 B 70.5 M 33.7 X 112.7 C 127.7 N 48.7 Y 85.6 D 106.7 O 101.0 Z 146.6 E 69.3 P 171.9 AA 136.6 F 236.7 Q 100.1 AB 110.3 G 86.3 R 233.3 AC 140.3 H 74.4 S 50.4 AD 69.3 I 112.5 T 235.1 AE 69.3 J 121.9 U 161.6 AF 148.8 K 160.5 V 47.0 CNN 117.6
*Denominators were based on neonates born < 33 weeks’ GA without major congenital anomaly who did not develop early-onset sepsis, late-onset sepsis or necrotising enterocolitis. Note: Prophylactic administration of trimethoprim or amoxicillin for the prevention of urinary tract infections with a suspected renal anomaly was not included.
0
50
100
150
200
250
A B C D E F G H I J K L M N O P Q R S T U V W X Y Z AA AB AC AD AE AF
AUR
per 1
000
patie
nt d
ays
Site
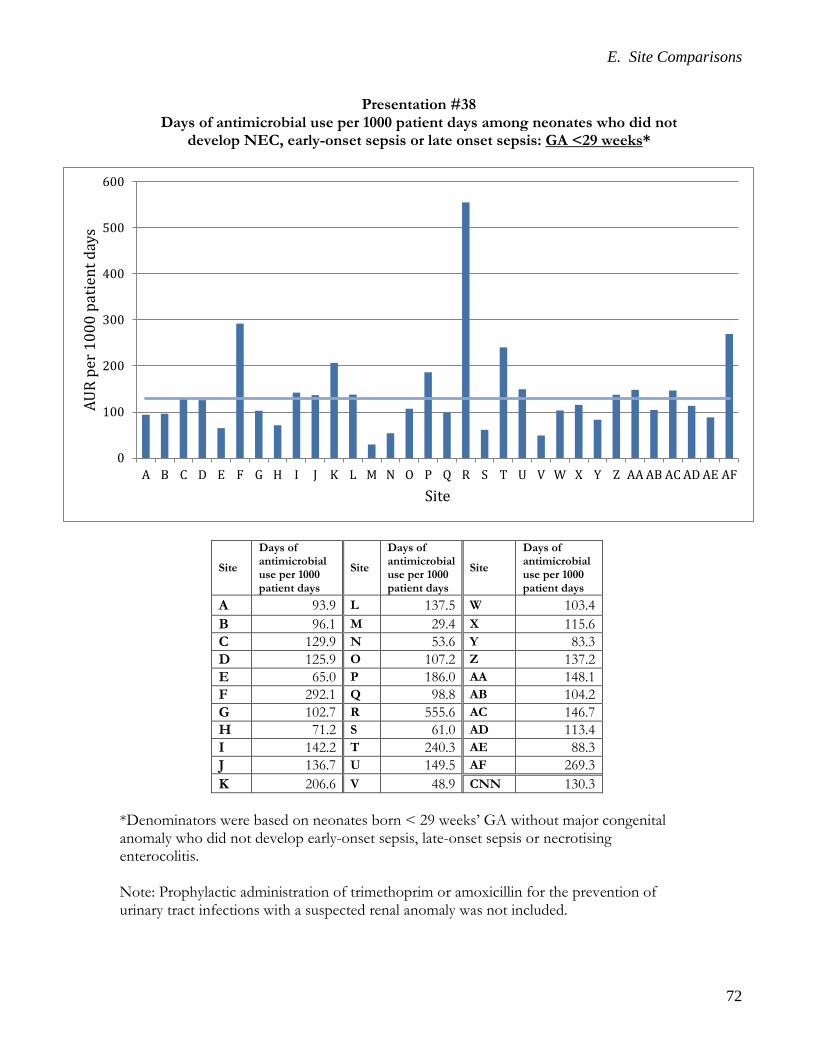
E. Site Comparisons
72
Presentation #38 Days of antimicrobial use per 1000 patient days among neonates who did not
develop NEC, early-onset sepsis or late onset sepsis: GA <29 weeks*
Site
Days of antimicrobial use per 1000 patient days
Site
Days of antimicrobial use per 1000 patient days
Site
Days of antimicrobial use per 1000 patient days
A 93.9 L 137.5 W 103.4 B 96.1 M 29.4 X 115.6 C 129.9 N 53.6 Y 83.3 D 125.9 O 107.2 Z 137.2 E 65.0 P 186.0 AA 148.1 F 292.1 Q 98.8 AB 104.2 G 102.7 R 555.6 AC 146.7 H 71.2 S 61.0 AD 113.4 I 142.2 T 240.3 AE 88.3 J 136.7 U 149.5 AF 269.3 K 206.6 V 48.9 CNN 130.3
*Denominators were based on neonates born < 29 weeks’ GA without major congenital anomaly who did not develop early-onset sepsis, late-onset sepsis or necrotising enterocolitis. Note: Prophylactic administration of trimethoprim or amoxicillin for the prevention of urinary tract infections with a suspected renal anomaly was not included.
0
100
200
300
400
500
600
A B C D E F G H I J K L M N O P Q R S T U V W X Y Z AA AB AC AD AE AF
AUR
per 1
000
patie
nt d
ays
Site

E. Site Comparisons
73
Presentation #39 Rate of treatment# for patent ductus arteriosus (PDA): GA<33 weeks who had PDA*:
Site specific crude rates
Site Treatment# for PDA among neonates who had PDA (%)
Site Treatment# for PDA among neonates who had PDA (%)
A 45.5 Q 54.6 B 17.5 R 100.0 C 58.1 S 45.9 D 46.7 T 67.7 E 86.7 U 51.6 F 48.8 V 56.5 G 40.0 W 76.9 H 0.0 X 45.8 I 40.6 Y 27.3 J 19.4 Z 63.6 K 72.7 AA 62.4 L 39.7 AB 47.5 M 23.1 AC 33.3 N 45.5 AD 0.0 O 17.1 AE 0.0 P 86.4 AF 33.3 CNN 48.6
Total number of neonates who had PDA = 1 303 *PDA diagnosis is based on clinical suspicion and/or echocardiography findings. #Treatment of PDA includes any of indomethacin, ibuprofen, acetaminophen, or ligation. The percentage of neonates with treated PDA was attributed to the site where the neonate was first admitted.
0
10
20
30
40
50
60
70
80
90
100
A B C D E F G H I J K L M N O P Q R S T U V W X Y Z AA AB AC AD AE AF
Perc
enta
ge
Site

E. Site Comparisons
74
Presentation #40 Surgical patent ductus arteriosus (PDA) ligation rate: GA<33 weeks who had PDA:
Site specific crude rates
Site
Surgical ligation for PDA among neonates who had PDA (%)
Site
Surgical ligation for PDA among neonates who had PDA (%)
A 9.1 Q 0.0 B 0.0 R 0.0 C 6.5 S 2.4 D 0.0 T 5.1 E 0.0 U 4.8 F 0.0 V 0.0 G 0.0 W 9.6 H 0.0 X 4.2 I 6.3 Y 9.1 J 0.0 Z 10.0 K 18.2 AA 8.9 L 0.0 AB 2.0 M 0.0 AC 3.7 N 0.0 AD 0.0 O 0.0 AE 0.0 P 4.6 AF 0.0 CNN 4.1
Total number of neonates who had PDA = 1 303 The percentage of neonates with treated PDA was attributed to the site where the neonate was first admitted.
0
2
4
6
8
10
12
14
16
18
20
A B C D E F G H I J K L M N O P Q R S T U V W X Y Z AA AB AC AD AE AF
Perc
enta
ge
site
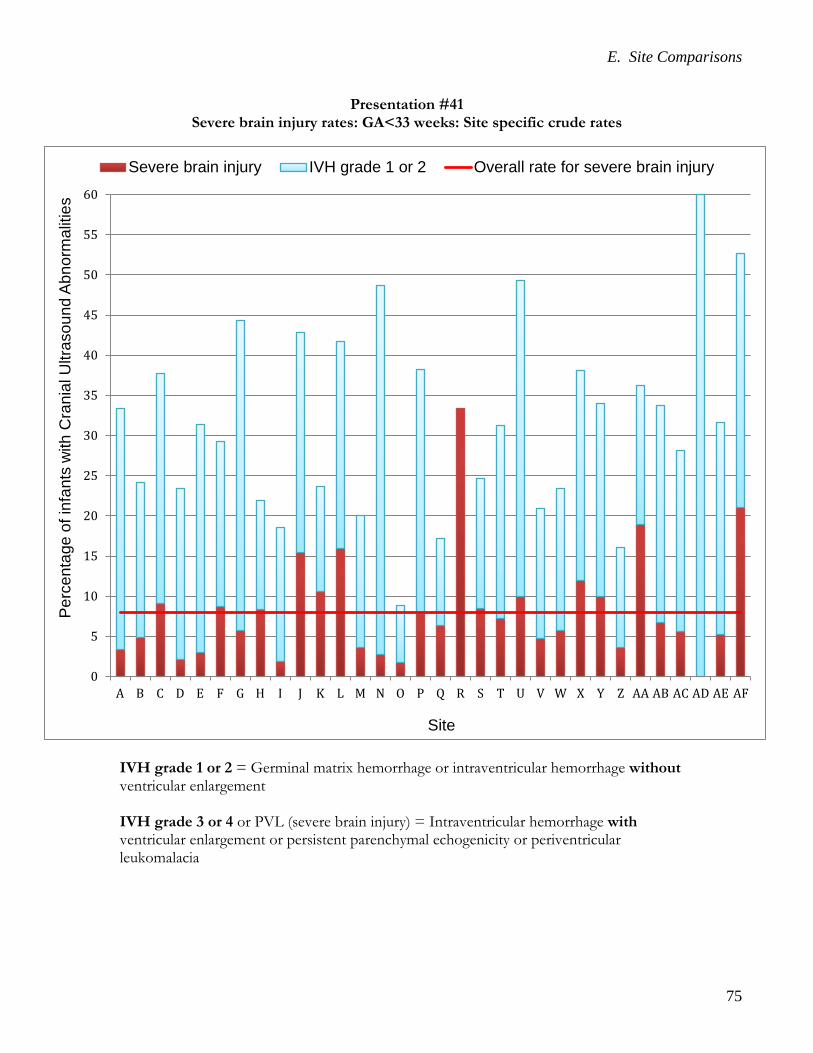
E. Site Comparisons
75
Presentation #41 Severe brain injury rates: GA<33 weeks: Site specific crude rates
IVH grade 1 or 2 = Germinal matrix hemorrhage or intraventricular hemorrhage without ventricular enlargement IVH grade 3 or 4 or PVL (severe brain injury) = Intraventricular hemorrhage with ventricular enlargement or persistent parenchymal echogenicity or periventricular leukomalacia
0
5
10
15
20
25
30
35
40
45
50
55
60
A B C D E F G H I J K L M N O P Q R S T U V W X Y Z AA AB AC AD AE AF
Per
cent
age
of in
fant
s w
ith C
rani
al U
ltras
ound
Abn
orm
aliti
es
Site
Severe brain injury IVH grade 1 or 2 Overall rate for severe brain injury

E. Site Comparisons
76
Presentation #41 (continued) Severe brain injury rate: GA<33 weeks: Site specific crude rates
Total number of neonates = 4 482
Severe brain injury includes Grade 3 or 4 IVH or PVL Note that the proportion of neonates with neuroimaging data available varies by GA. 763 neonates were excluded due to neuroimaging data not available. *Overall % = (number of neonates with cranial ultrasound abnormalities for site / total number of neonates for site with neuroimaging data available) *100 **Overall % = (number of neonates with cranial ultrasound abnormalities for GA category / total number of neonates in GA category with neuroimaging data available) *100 NA = no data available
Site <25 25-26 27-28 29-30 31-32 Overall rate* per site %
A 0.0 0.0 20.0 0.0 4.4 3.33 B 21.4 7.7 3.3 2.8 0.0 4.84 C 8.3 4.4 21.1 4.6 3.9 9.09 D NA 0.0 6.7 0.0 0.0 2.13 E 0.0 9.1 10.0 0.0 0.0 2.99 F 35.7 12.5 6.3 5.4 2.6 8.76 G 33.3 14.3 9.5 4.8 0.0 5.68 H 13.3 10.3 12.0 3.1 6.5 8.33 I 0.0 6.7 4.6 0.0 0.0 1.85 J 33.3 33.3 11.8 10.5 15.4 15.48 K 66.7 25.0 6.7 0.0 0.0 10.53 L 50.0 41.2 13.5 5.3 2.8 15.97 M NA 0.0 6.3 0.0 5.6 3.64 N 0.0 14.3 0.0 0.0 0.0 2.7 O 0.0 0.0 10.5 0.0 0.0 1.77 P 22.2 14.3 15.4 0.0 4.0 7.87 Q 40.0 11.8 7.1 2.9 2.4 6.31 R NA NA 50.0 NA 0.0 33.33 S 29.2 10.7 6.5 2.8 2.1 8.43 T 25.0 13.7 1.9 3.6 2.0 7.26 U 27.3 14.5 10.5 2.7 3.8 9.92 V 0.0 20.0 11.1 2.2 2.8 4.76 W 14.3 9.1 4.0 8.3 2.9 5.7 X 0.0 42.9 4.2 16.7 9.7 11.9 Y 66.7 20.0 16.7 0.0 0.0 10 Z 10.5 2.3 7.8 2.0 1.5 3.56 AA 59.4 29.4 11.3 4.4 4.0 18.97 AB 9.5 10.8 10.1 1.2 0.0 6.69 AC 30.0 8.3 0.0 5.9 0.0 5.62 AD NA NA 0.0 0.0 0.0 0 AE NA 0.0 50.0 0.0 0.0 5.26 AF 0.0 100.0 33.3 0.0 18.2 21.05 Overall rate** per GA group % 25.1 13.3 9.1 3.1 3.1 8.0

E. Site Comparisons
77
Presentation #42 Periventricular leukomalacia (PVL) rates: GA<33 weeks: Site specific crude rates
0.0
0.5
1.0
1.5
2.0
2.5
3.0
3.5
4.0
4.5
5.0
5.5
6.0
6.5
7.0
7.5
8.0
8.5
9.0
9.5
10.0
A B C D E F G H I J K L M N O P Q R S T U V W X Y Z AA AB AC AD AE AF
Per
cent
age
of in
fant
s w
ith P
VL
Site
PVL Overall rate

E. Site Comparisons
78
Presentation #42 (continued) Periventricular leukomalacia (PVL) rate: GA<33 weeks: Site specific crude rates
Total number of neonates = 4 482
Note that the proportion of neonates with neuroimaging data available varies by GA. 763 neonates were excluded due to neuroimaging data not available. *Overall % = (number of neonates with PVL for site / total number of neonates for site) *100 **Overall % = (number of neonates with PVL for GA category / total number of neonates in GA category) *100 NA = no data available
Site <25 25-26 27-28 29-30 31-32 Overall rate* per site %
A 0.0 0.0 0.0 0.0 4.4 1.7 B 0.0 7.7 0.0 2.8 0.0 1.6 C 0.0 0.0 13.2 2.3 0.0 4.2 D NA 0.0 0.0 0.0 0.0 0.0 E 0.0 9.1 10.0 0.0 0.0 3.0 F 0.0 6.3 0.0 2.7 0.0 1.5 G 0.0 14.3 4.8 0.0 0.0 2.3 H 6.7 10.3 4.0 0.0 3.2 4.6 I 0.0 6.7 4.6 0.0 0.0 1.9 J 0.0 0.0 0.0 0.0 5.1 2.4 K 33.3 25.0 6.7 0.0 0.0 7.9 L 0.0 23.5 5.4 2.6 0.0 4.9 M NA 0.0 0.0 0.0 5.6 1.8 N 0.0 0.0 0.0 0.0 0.0 0.0 O 0.0 0.0 5.3 0.0 0.0 0.9 P 22.2 7.1 15.4 0.0 4.0 6.7 Q 0.0 5.9 0.0 2.9 0.0 1.8 R NA NA 0.0 NA 0.0 0.0 S 4.2 7.1 6.5 2.8 2.1 4.2 T 0.0 3.9 0.0 3.6 0.0 1.7 U 12.7 10.1 3.0 0.9 1.3 4.7 V 0.0 0.0 5.6 2.2 2.8 2.9 W 0.0 0.0 0.0 2.8 1.5 1.3 X 0.0 14.3 0.0 5.6 0.0 2.4 Y 0.0 0.0 0.0 0.0 0.0 0.0 Z 5.3 2.3 5.9 2.0 0.0 2.5 AA 34.4 11.8 7.6 2.2 2.0 9.9 AB 2.4 1.4 2.5 0.0 0.0 1.3 AC 10.0 0.0 0.0 0.0 0.0 1.1 AD NA NA 0.0 0.0 0.0 0.0 AE NA 0.0 0.0 0.0 0.0 0.0 AF 0.0 0.0 0.0 0.0 9.1 5.3 Overall rate** per GA group % 7.6 6.0 3.7 1.5 1.2 3.2
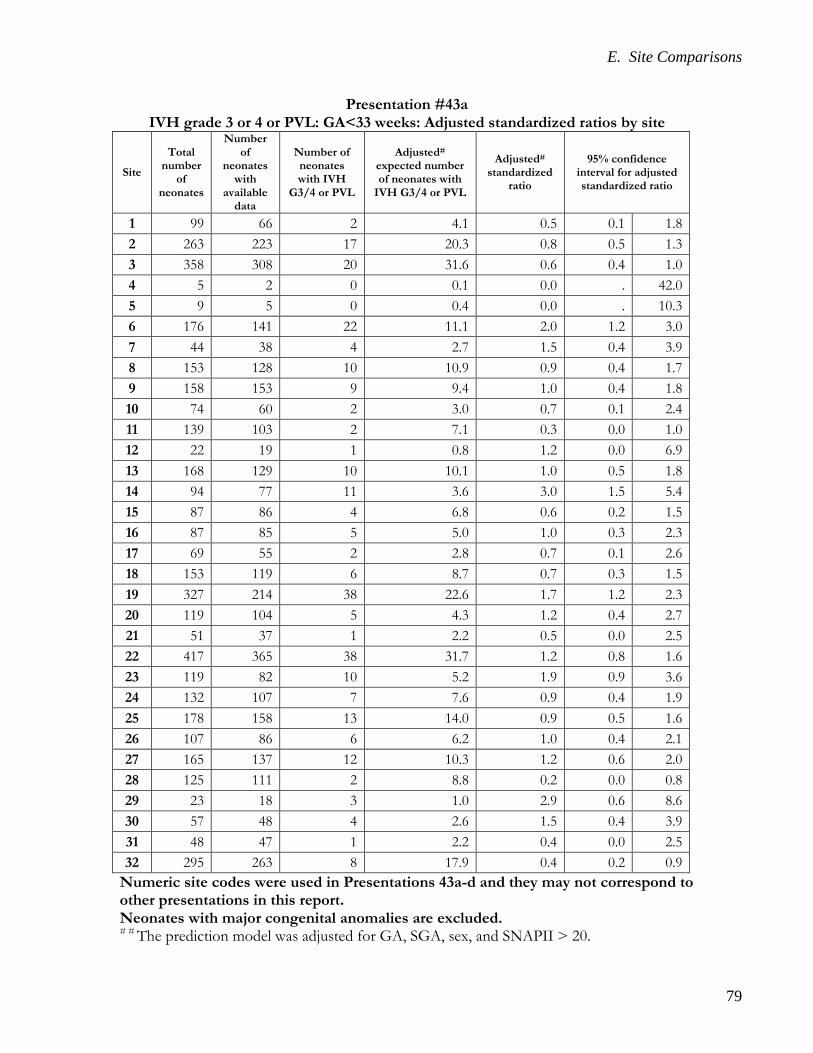
E. Site Comparisons
79
Presentation #43a IVH grade 3 or 4 or PVL: GA<33 weeks: Adjusted standardized ratios by site
Site
Total number
of neonates
Number of
neonates with
available data
Number of neonates with IVH
G3/4 or PVL
Adjusted# expected number of neonates with
IVH G3/4 or PVL
Adjusted# standardized
ratio
95% confidence interval for adjusted standardized ratio
1 99 66 2 4.1 0.5 0.1 1.8 2 263 223 17 20.3 0.8 0.5 1.3 3 358 308 20 31.6 0.6 0.4 1.0 4 5 2 0 0.1 0.0 . 42.0 5 9 5 0 0.4 0.0 . 10.3 6 176 141 22 11.1 2.0 1.2 3.0 7 44 38 4 2.7 1.5 0.4 3.9 8 153 128 10 10.9 0.9 0.4 1.7 9 158 153 9 9.4 1.0 0.4 1.8 10 74 60 2 3.0 0.7 0.1 2.4 11 139 103 2 7.1 0.3 0.0 1.0 12 22 19 1 0.8 1.2 0.0 6.9 13 168 129 10 10.1 1.0 0.5 1.8 14 94 77 11 3.6 3.0 1.5 5.4 15 87 86 4 6.8 0.6 0.2 1.5 16 87 85 5 5.0 1.0 0.3 2.3 17 69 55 2 2.8 0.7 0.1 2.6 18 153 119 6 8.7 0.7 0.3 1.5 19 327 214 38 22.6 1.7 1.2 2.3 20 119 104 5 4.3 1.2 0.4 2.7 21 51 37 1 2.2 0.5 0.0 2.5 22 417 365 38 31.7 1.2 0.8 1.6 23 119 82 10 5.2 1.9 0.9 3.6 24 132 107 7 7.6 0.9 0.4 1.9 25 178 158 13 14.0 0.9 0.5 1.6 26 107 86 6 6.2 1.0 0.4 2.1 27 165 137 12 10.3 1.2 0.6 2.0 28 125 111 2 8.8 0.2 0.0 0.8 29 23 18 3 1.0 2.9 0.6 8.6 30 57 48 4 2.6 1.5 0.4 3.9 31 48 47 1 2.2 0.4 0.0 2.5 32 295 263 8 17.9 0.4 0.2 0.9
Numeric site codes were used in Presentations 43a-d and they may not correspond to other presentations in this report. Neonates with major congenital anomalies are excluded. # # The prediction model was adjusted for GA, SGA, sex, and SNAPII > 20.

E. Site Comparisons
80
Presentation #43b IVH grade 3 or 4 or PVL: GA<33 weeks: Adjusted standardized ratios by site
Explanation for Presentation 43a Column 1: Numeric site codes Column 2: Total number of neonates at each site (<33 weeks GA and no major anomaly) Column 3: Number of eligible neonates at each site (<33 weeks GA and no major anomaly) who were actually used to fit the model Column 4: Number of neonates with outcome of interest among those eligible neonates Column 5: Expected number of neonates with outcome of interest after adjustment for GA, SGA, sex, and SNAPII > 20 Column 6: Adjusted standardized ratio calculated based on observed IVH or PVL/expected IVH or PVL Columns 7 and 8: 95% CI around the adjusted standardized ratio for the outcome Explanation for Presentation 43b X-axis: Expected number of neonates with outcome (value from Column 4 of previous presentation) Y-axis: Adjusted standardized ratio (value from Column 5 of previous presentation) Dark points with numerical notation: Site and its location matching x and y axis values Red funnel shaped lines: 95% confidence limits based on entire network information. Sites outside of red lines represent higher or lower (depending upon position in graph) adjusted standardized ratio. However, for determining whether site is statistically different from others, one should also assess 95% CI and check whether both upper and lower boundaries are also outside of the funnel area or not.
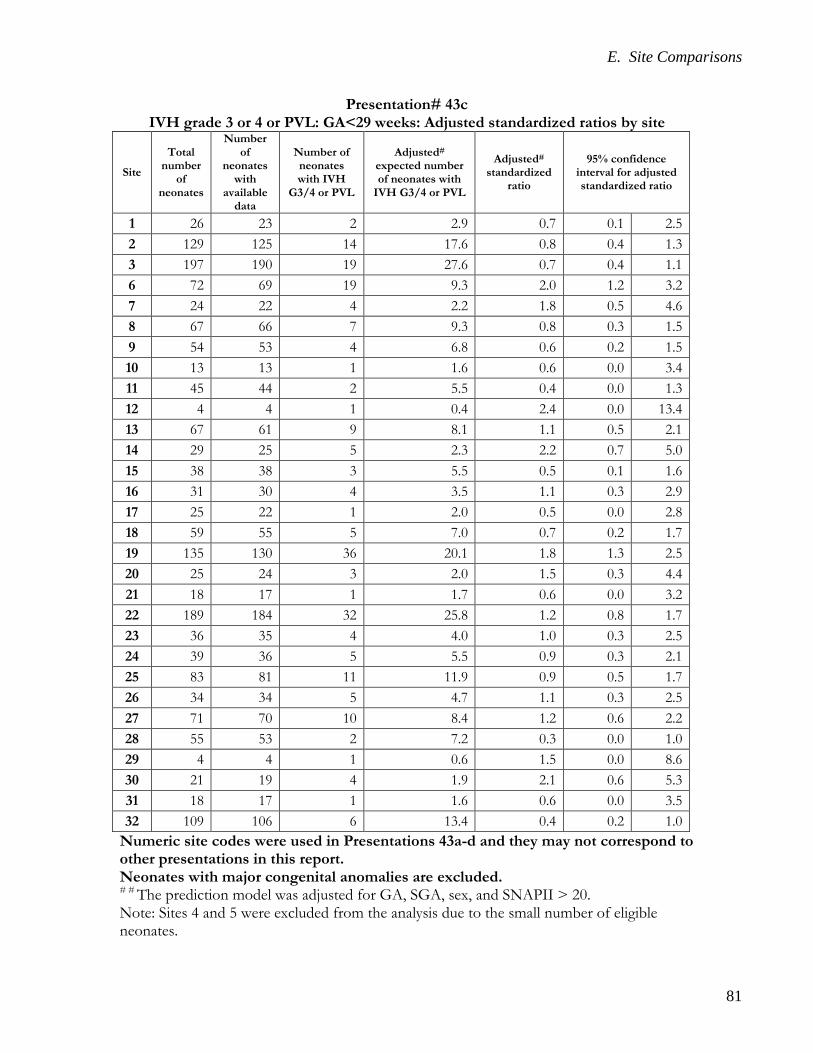
E. Site Comparisons
81
Presentation# 43c IVH grade 3 or 4 or PVL: GA<29 weeks: Adjusted standardized ratios by site
Site
Total number
of neonates
Number of
neonates with
available data
Number of neonates with IVH
G3/4 or PVL
Adjusted# expected number of neonates with
IVH G3/4 or PVL
Adjusted# standardized
ratio
95% confidence interval for adjusted standardized ratio
1 26 23 2 2.9 0.7 0.1 2.5 2 129 125 14 17.6 0.8 0.4 1.3 3 197 190 19 27.6 0.7 0.4 1.1 6 72 69 19 9.3 2.0 1.2 3.2 7 24 22 4 2.2 1.8 0.5 4.6 8 67 66 7 9.3 0.8 0.3 1.5 9 54 53 4 6.8 0.6 0.2 1.5 10 13 13 1 1.6 0.6 0.0 3.4 11 45 44 2 5.5 0.4 0.0 1.3 12 4 4 1 0.4 2.4 0.0 13.4 13 67 61 9 8.1 1.1 0.5 2.1 14 29 25 5 2.3 2.2 0.7 5.0 15 38 38 3 5.5 0.5 0.1 1.6 16 31 30 4 3.5 1.1 0.3 2.9 17 25 22 1 2.0 0.5 0.0 2.8 18 59 55 5 7.0 0.7 0.2 1.7 19 135 130 36 20.1 1.8 1.3 2.5 20 25 24 3 2.0 1.5 0.3 4.4 21 18 17 1 1.7 0.6 0.0 3.2 22 189 184 32 25.8 1.2 0.8 1.7 23 36 35 4 4.0 1.0 0.3 2.5 24 39 36 5 5.5 0.9 0.3 2.1 25 83 81 11 11.9 0.9 0.5 1.7 26 34 34 5 4.7 1.1 0.3 2.5 27 71 70 10 8.4 1.2 0.6 2.2 28 55 53 2 7.2 0.3 0.0 1.0 29 4 4 1 0.6 1.5 0.0 8.6 30 21 19 4 1.9 2.1 0.6 5.3 31 18 17 1 1.6 0.6 0.0 3.5 32 109 106 6 13.4 0.4 0.2 1.0
Numeric site codes were used in Presentations 43a-d and they may not correspond to other presentations in this report. Neonates with major congenital anomalies are excluded. # # The prediction model was adjusted for GA, SGA, sex, and SNAPII > 20. Note: Sites 4 and 5 were excluded from the analysis due to the small number of eligible neonates.

E. Site Comparisons
82
Presentation #43d IVH grade 3 or 4 or PVL: GA<29 weeks: Adjusted standardized ratios by site
Explanation for Presentation 43c Column 1: Numeric site codes Column 2: Total number of neonates at each site (<29 weeks GA and no major anomaly) Column 3: Number of eligible neonates at each site (<29 weeks GA and no major anomaly) who were actually used to fit the model Column 4: Number of neonates with outcome of interest among those eligible neonates Column 5: Expected number of neonates with outcome of interest after adjustment for GA, SGA, sex, and SNAPII > 20 Column 6: Adjusted standardized ratio calculated based on observed IVH or PVL/expected IVH or PVL Columns 7 and 8: 95% CI around the adjusted standardized ratio for the outcome Explanation for Presentation 43d X-axis: Expected number of neonates with outcome (value from Column 4 of previous presentation) Y-axis: Adjusted standardized ratio (value from Column 5 of previous presentation) Dark points with numerical notation: Site and its location matching x and y axis values Red funnel shaped lines: 95% confidence limits based on entire network information. Sites outside of red lines represent higher or lower (depending upon position in graph) adjusted standardized ratio. However, for determining whether site is statistically different from others, one should also assess 95% CI and check whether both upper and lower boundaries are also outside of the funnel area or not.

E. Site Comparisons
83
Presentation #44 Necrotizing enterocolitis (NEC) treatment rates: GA<33 weeks:
Site specific crude rates
0
1
2
3
4
5
6
7
8
9
A B C D E F G H I J K L M N O P Q R S T U V W X Y Z AA AB AC AD AE AF
Perc
enta
ges
Site
Medical treatment only Medical + peritoneal drainage Surgical treatment only Surgical + peritoneal drainage
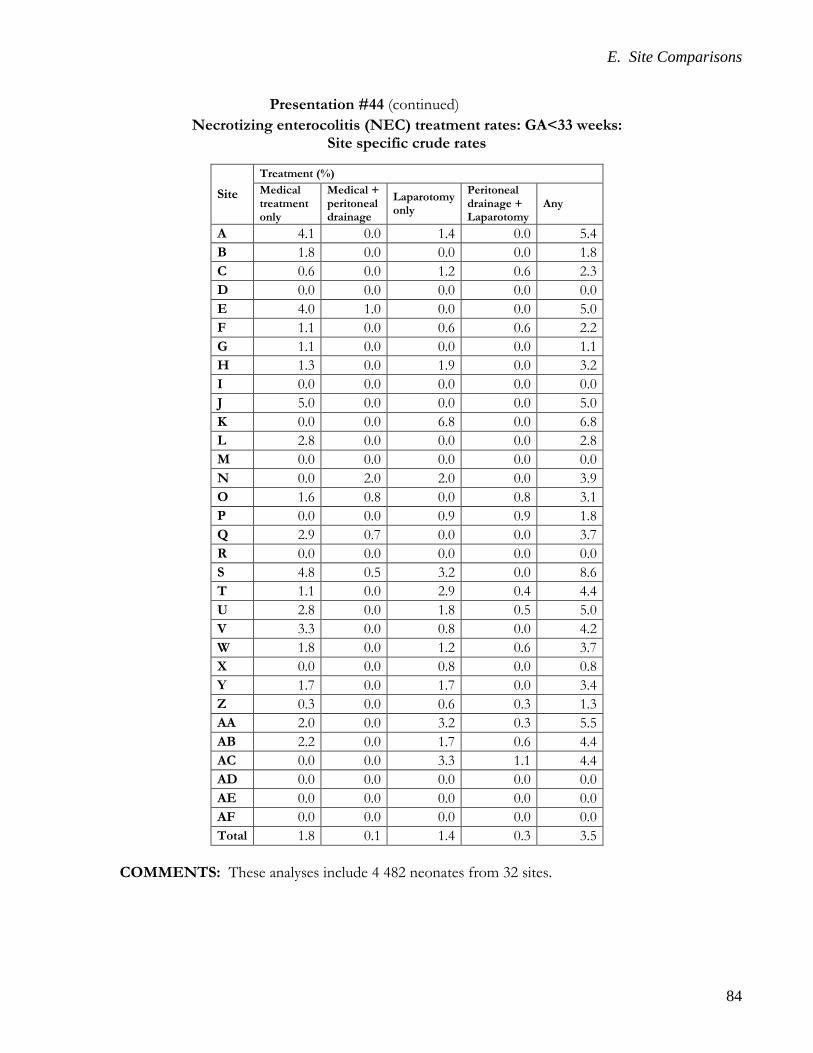
E. Site Comparisons
84
Presentation #44 (continued) Necrotizing enterocolitis (NEC) treatment rates: GA<33 weeks:
Site specific crude rates
Site Treatment (%) Medical treatment only
Medical + peritoneal drainage
Laparotomy only
Peritoneal drainage + Laparotomy
Any
A 4.1 0.0 1.4 0.0 5.4 B 1.8 0.0 0.0 0.0 1.8 C 0.6 0.0 1.2 0.6 2.3 D 0.0 0.0 0.0 0.0 0.0 E 4.0 1.0 0.0 0.0 5.0 F 1.1 0.0 0.6 0.6 2.2 G 1.1 0.0 0.0 0.0 1.1 H 1.3 0.0 1.9 0.0 3.2 I 0.0 0.0 0.0 0.0 0.0 J 5.0 0.0 0.0 0.0 5.0 K 0.0 0.0 6.8 0.0 6.8 L 2.8 0.0 0.0 0.0 2.8 M 0.0 0.0 0.0 0.0 0.0 N 0.0 2.0 2.0 0.0 3.9 O 1.6 0.8 0.0 0.8 3.1 P 0.0 0.0 0.9 0.9 1.8 Q 2.9 0.7 0.0 0.0 3.7 R 0.0 0.0 0.0 0.0 0.0 S 4.8 0.5 3.2 0.0 8.6 T 1.1 0.0 2.9 0.4 4.4 U 2.8 0.0 1.8 0.5 5.0 V 3.3 0.0 0.8 0.0 4.2 W 1.8 0.0 1.2 0.6 3.7 X 0.0 0.0 0.8 0.0 0.8 Y 1.7 0.0 1.7 0.0 3.4 Z 0.3 0.0 0.6 0.3 1.3 AA 2.0 0.0 3.2 0.3 5.5 AB 2.2 0.0 1.7 0.6 4.4 AC 0.0 0.0 3.3 1.1 4.4 AD 0.0 0.0 0.0 0.0 0.0 AE 0.0 0.0 0.0 0.0 0.0 AF 0.0 0.0 0.0 0.0 0.0 Total 1.8 0.1 1.4 0.3 3.5
COMMENTS: These analyses include 4 482 neonates from 32 sites.
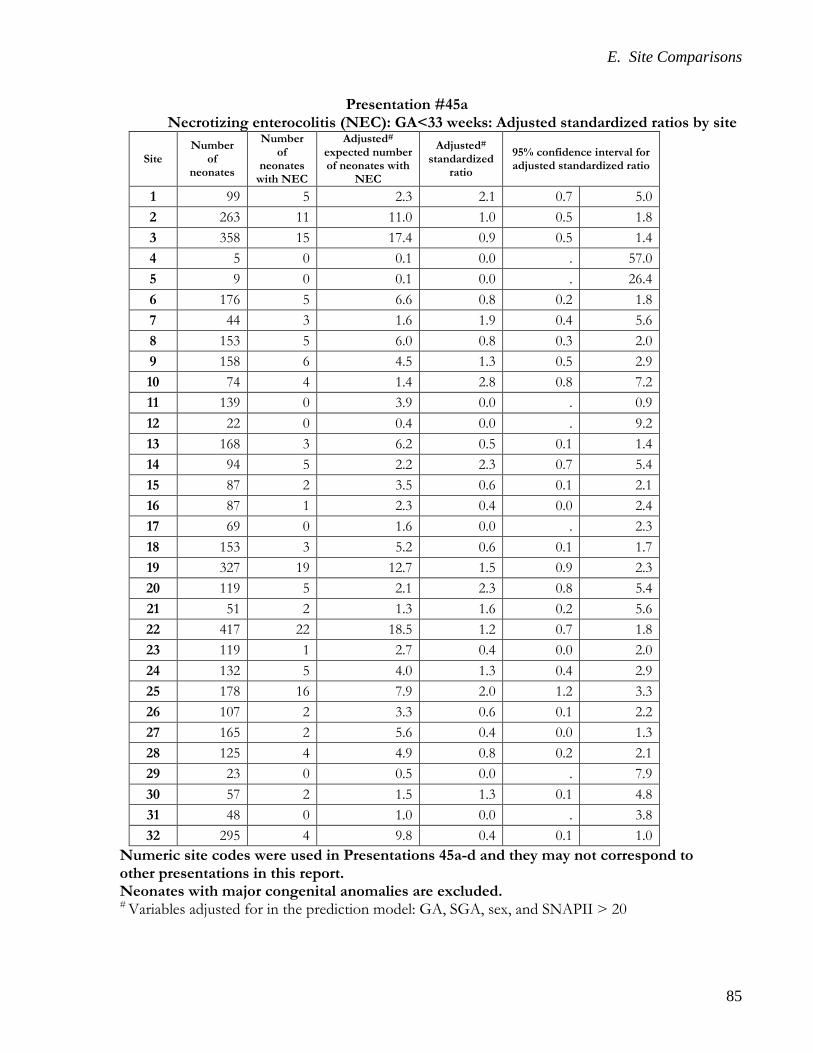
E. Site Comparisons
85
Presentation #45a Necrotizing enterocolitis (NEC): GA<33 weeks: Adjusted standardized ratios by site
Site Number
of neonates
Number of
neonates with NEC
Adjusted# expected number of neonates with
NEC
Adjusted# standardized
ratio
95% confidence interval for adjusted standardized ratio
1 99 5 2.3 2.1 0.7 5.0 2 263 11 11.0 1.0 0.5 1.8 3 358 15 17.4 0.9 0.5 1.4 4 5 0 0.1 0.0 . 57.0 5 9 0 0.1 0.0 . 26.4 6 176 5 6.6 0.8 0.2 1.8 7 44 3 1.6 1.9 0.4 5.6 8 153 5 6.0 0.8 0.3 2.0 9 158 6 4.5 1.3 0.5 2.9 10 74 4 1.4 2.8 0.8 7.2 11 139 0 3.9 0.0 . 0.9 12 22 0 0.4 0.0 . 9.2 13 168 3 6.2 0.5 0.1 1.4 14 94 5 2.2 2.3 0.7 5.4 15 87 2 3.5 0.6 0.1 2.1 16 87 1 2.3 0.4 0.0 2.4 17 69 0 1.6 0.0 . 2.3 18 153 3 5.2 0.6 0.1 1.7 19 327 19 12.7 1.5 0.9 2.3 20 119 5 2.1 2.3 0.8 5.4 21 51 2 1.3 1.6 0.2 5.6 22 417 22 18.5 1.2 0.7 1.8 23 119 1 2.7 0.4 0.0 2.0 24 132 5 4.0 1.3 0.4 2.9 25 178 16 7.9 2.0 1.2 3.3 26 107 2 3.3 0.6 0.1 2.2 27 165 2 5.6 0.4 0.0 1.3 28 125 4 4.9 0.8 0.2 2.1 29 23 0 0.5 0.0 . 7.9 30 57 2 1.5 1.3 0.1 4.8 31 48 0 1.0 0.0 . 3.8 32 295 4 9.8 0.4 0.1 1.0
Numeric site codes were used in Presentations 45a-d and they may not correspond to other presentations in this report. Neonates with major congenital anomalies are excluded. # Variables adjusted for in the prediction model: GA, SGA, sex, and SNAPII > 20

E. Site Comparisons
86
Presentation #45b Necrotizing enterocolitis (NEC): GA<33 weeks: Adjusted standardized ratios by site
Explanation for Presentation 45a Column 1: Numeric site codes Column 2: Number of eligible neonates at each site (<33 weeks GA and no major anomaly) Column 3: Number of neonates with outcome of interest among those eligible neonates Column 4: Expected number of neonates with outcome of interest after adjustment for GA, SGA, sex, and SNAPII > 20 Column 5: Adjusted standardized ratio calculated based on observed NEC/expected NEC Columns 6 and 7: 95% CI around the adjusted standardized ratio for the outcome Explanation for Presentation 45b X-axis: Expected number of neonates with outcome (value from Column 4 of previous presentation) Y-axis: Adjusted standardized ratio (value from Column 5 of previous presentation) Dark points with numerical notation: Site and its location matching x and y axis values Red funnel shaped lines: 95% confidence limits based on entire network information. Sites outside of red lines represent higher or lower (depending upon position in graph) adjusted standardized ratio. However, for determining whether site is statistically different from others, one should also assess 95% CI and check whether both upper and lower boundaries are also outside of the funnel area or not.
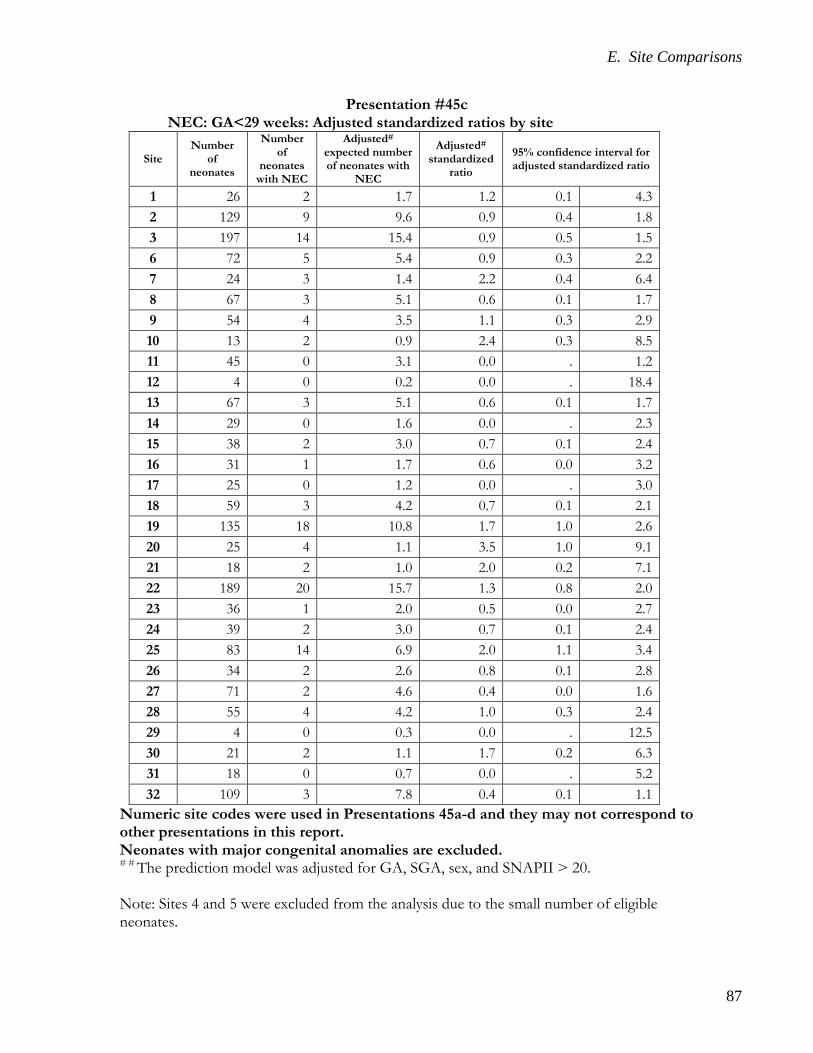
E. Site Comparisons
87
Presentation #45c NEC: GA<29 weeks: Adjusted standardized ratios by site
Site Number
of neonates
Number of
neonates with NEC
Adjusted# expected number of neonates with
NEC
Adjusted# standardized
ratio
95% confidence interval for adjusted standardized ratio
1 26 2 1.7 1.2 0.1 4.3 2 129 9 9.6 0.9 0.4 1.8 3 197 14 15.4 0.9 0.5 1.5 6 72 5 5.4 0.9 0.3 2.2 7 24 3 1.4 2.2 0.4 6.4 8 67 3 5.1 0.6 0.1 1.7 9 54 4 3.5 1.1 0.3 2.9 10 13 2 0.9 2.4 0.3 8.5 11 45 0 3.1 0.0 . 1.2 12 4 0 0.2 0.0 . 18.4 13 67 3 5.1 0.6 0.1 1.7 14 29 0 1.6 0.0 . 2.3 15 38 2 3.0 0.7 0.1 2.4 16 31 1 1.7 0.6 0.0 3.2 17 25 0 1.2 0.0 . 3.0 18 59 3 4.2 0.7 0.1 2.1 19 135 18 10.8 1.7 1.0 2.6 20 25 4 1.1 3.5 1.0 9.1 21 18 2 1.0 2.0 0.2 7.1 22 189 20 15.7 1.3 0.8 2.0 23 36 1 2.0 0.5 0.0 2.7 24 39 2 3.0 0.7 0.1 2.4 25 83 14 6.9 2.0 1.1 3.4 26 34 2 2.6 0.8 0.1 2.8 27 71 2 4.6 0.4 0.0 1.6 28 55 4 4.2 1.0 0.3 2.4 29 4 0 0.3 0.0 . 12.5 30 21 2 1.1 1.7 0.2 6.3 31 18 0 0.7 0.0 . 5.2 32 109 3 7.8 0.4 0.1 1.1
Numeric site codes were used in Presentations 45a-d and they may not correspond to other presentations in this report. Neonates with major congenital anomalies are excluded. # # The prediction model was adjusted for GA, SGA, sex, and SNAPII > 20. Note: Sites 4 and 5 were excluded from the analysis due to the small number of eligible neonates.

E. Site Comparisons
88
Presentation #45d NEC: GA<29 weeks: Adjusted standardized ratios by site
Explanation for Presentation 45c Column 1: Numeric site codes Column 2: Number of eligible neonates at each site (<29 weeks GA and no major anomaly) Column 3: Number of neonates with outcome of interest among those eligible neonates Column 4: Expected number of neonates with outcome of interest after adjustment for GA, SGA, sex, and SNAPII > 20 Column 5: Adjusted standardized ratio calculated based on observed NEC/expected NEC Columns 6 and 7: 95% CI around the adjusted standardized ratio for the outcome Explanation for Presentation 45d X-axis: Expected number of neonates with outcome (value from Column 4 of previous presentation) Y-axis: Adjusted standardized ratio (value from Column 5 of previous presentation) Dark points with numerical notation: Site and its location matching x and y axis values Red funnel shaped lines: 95% confidence limits based on entire network information. Sites outside of red lines represent higher or lower (depending upon position in graph) adjusted standardized ratio. However, for determining whether site is statistically different from others, one should also assess 95% CI and check whether both upper and lower boundaries are also outside of the funnel area or not.
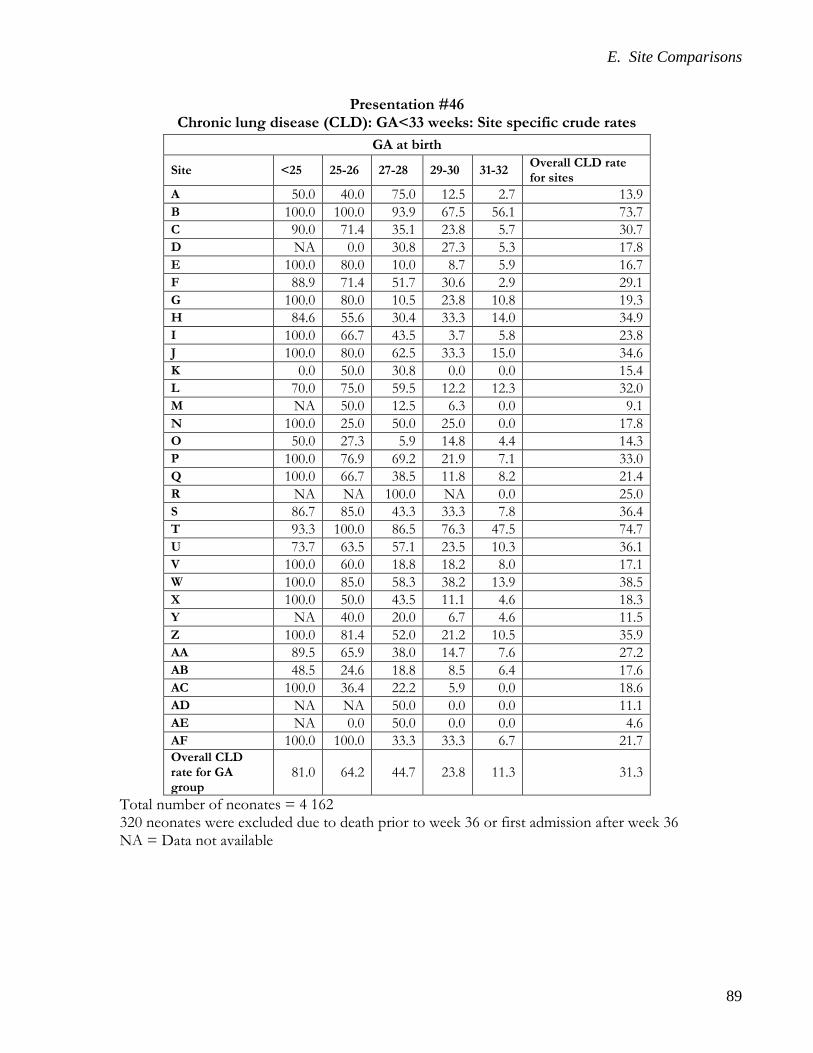
E. Site Comparisons
89
Presentation #46 Chronic lung disease (CLD): GA<33 weeks: Site specific crude rates
GA at birth
Site <25 25-26 27-28 29-30 31-32 Overall CLD rate for sites
A 50.0 40.0 75.0 12.5 2.7 13.9 B 100.0 100.0 93.9 67.5 56.1 73.7 C 90.0 71.4 35.1 23.8 5.7 30.7 D NA 0.0 30.8 27.3 5.3 17.8 E 100.0 80.0 10.0 8.7 5.9 16.7 F 88.9 71.4 51.7 30.6 2.9 29.1 G 100.0 80.0 10.5 23.8 10.8 19.3 H 84.6 55.6 30.4 33.3 14.0 34.9 I 100.0 66.7 43.5 3.7 5.8 23.8 J 100.0 80.0 62.5 33.3 15.0 34.6 K 0.0 50.0 30.8 0.0 0.0 15.4 L 70.0 75.0 59.5 12.2 12.3 32.0 M NA 50.0 12.5 6.3 0.0 9.1 N 100.0 25.0 50.0 25.0 0.0 17.8 O 50.0 27.3 5.9 14.8 4.4 14.3 P 100.0 76.9 69.2 21.9 7.1 33.0 Q 100.0 66.7 38.5 11.8 8.2 21.4 R NA NA 100.0 NA 0.0 25.0 S 86.7 85.0 43.3 33.3 7.8 36.4 T 93.3 100.0 86.5 76.3 47.5 74.7 U 73.7 63.5 57.1 23.5 10.3 36.1 V 100.0 60.0 18.8 18.2 8.0 17.1 W 100.0 85.0 58.3 38.2 13.9 38.5 X 100.0 50.0 43.5 11.1 4.6 18.3 Y NA 40.0 20.0 6.7 4.6 11.5 Z 100.0 81.4 52.0 21.2 10.5 35.9 AA 89.5 65.9 38.0 14.7 7.6 27.2 AB 48.5 24.6 18.8 8.5 6.4 17.6 AC 100.0 36.4 22.2 5.9 0.0 18.6 AD NA NA 50.0 0.0 0.0 11.1 AE NA 0.0 50.0 0.0 0.0 4.6 AF 100.0 100.0 33.3 33.3 6.7 21.7 Overall CLD rate for GA group
81.0 64.2 44.7 23.8 11.3 31.3
Total number of neonates = 4 162 320 neonates were excluded due to death prior to week 36 or first admission after week 36 NA = Data not available
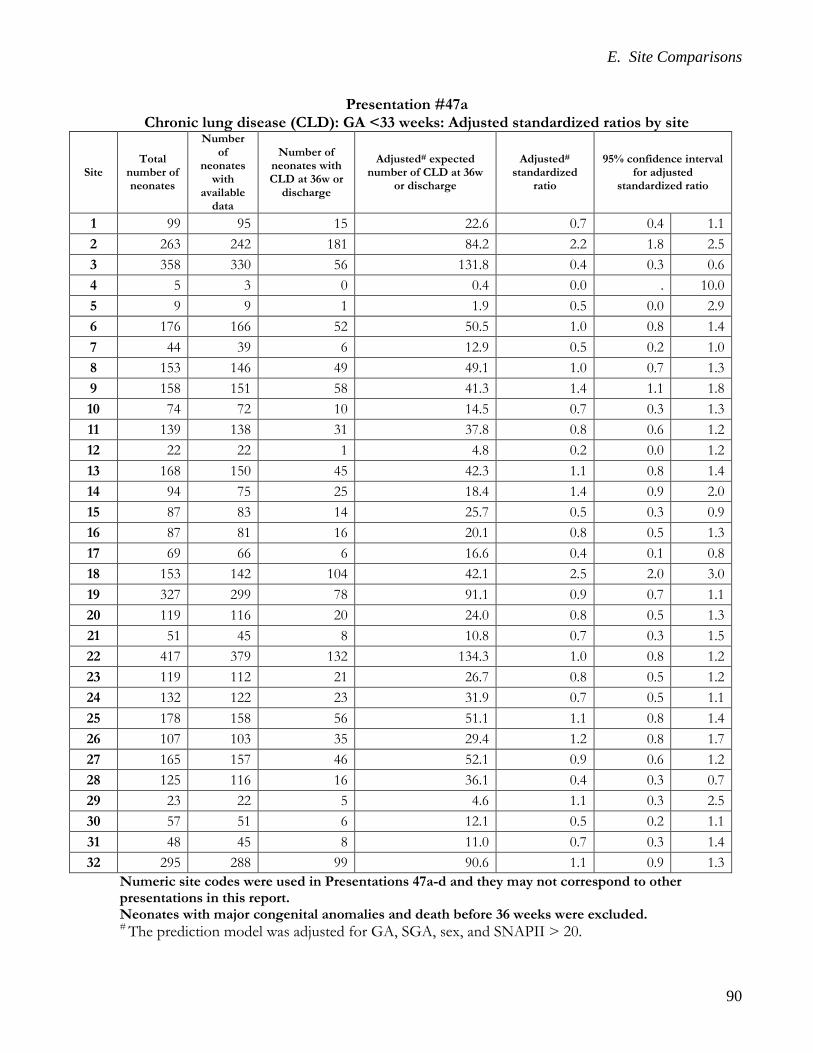
E. Site Comparisons
90
Presentation #47a Chronic lung disease (CLD): GA <33 weeks: Adjusted standardized ratios by site
Site Total
number of neonates
Number of
neonates with
available data
Number of neonates with CLD at 36w or
discharge
Adjusted# expected number of CLD at 36w
or discharge
Adjusted# standardized
ratio
95% confidence interval for adjusted
standardized ratio
1 99 95 15 22.6 0.7 0.4 1.1 2 263 242 181 84.2 2.2 1.8 2.5 3 358 330 56 131.8 0.4 0.3 0.6 4 5 3 0 0.4 0.0 . 10.0 5 9 9 1 1.9 0.5 0.0 2.9 6 176 166 52 50.5 1.0 0.8 1.4 7 44 39 6 12.9 0.5 0.2 1.0 8 153 146 49 49.1 1.0 0.7 1.3 9 158 151 58 41.3 1.4 1.1 1.8 10 74 72 10 14.5 0.7 0.3 1.3 11 139 138 31 37.8 0.8 0.6 1.2 12 22 22 1 4.8 0.2 0.0 1.2 13 168 150 45 42.3 1.1 0.8 1.4 14 94 75 25 18.4 1.4 0.9 2.0 15 87 83 14 25.7 0.5 0.3 0.9 16 87 81 16 20.1 0.8 0.5 1.3 17 69 66 6 16.6 0.4 0.1 0.8 18 153 142 104 42.1 2.5 2.0 3.0 19 327 299 78 91.1 0.9 0.7 1.1 20 119 116 20 24.0 0.8 0.5 1.3 21 51 45 8 10.8 0.7 0.3 1.5 22 417 379 132 134.3 1.0 0.8 1.2 23 119 112 21 26.7 0.8 0.5 1.2 24 132 122 23 31.9 0.7 0.5 1.1 25 178 158 56 51.1 1.1 0.8 1.4 26 107 103 35 29.4 1.2 0.8 1.7 27 165 157 46 52.1 0.9 0.6 1.2 28 125 116 16 36.1 0.4 0.3 0.7 29 23 22 5 4.6 1.1 0.3 2.5 30 57 51 6 12.1 0.5 0.2 1.1 31 48 45 8 11.0 0.7 0.3 1.4 32 295 288 99 90.6 1.1 0.9 1.3
Numeric site codes were used in Presentations 47a-d and they may not correspond to other presentations in this report. Neonates with major congenital anomalies and death before 36 weeks were excluded. # The prediction model was adjusted for GA, SGA, sex, and SNAPII > 20.
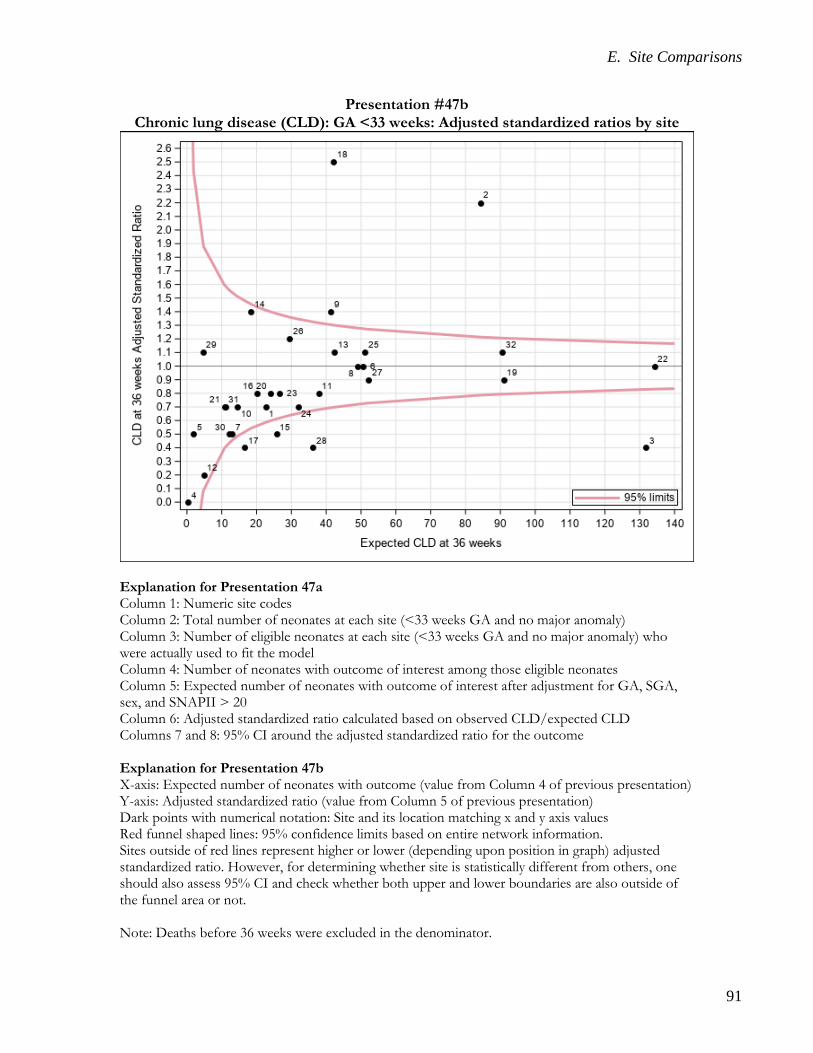
E. Site Comparisons
91
Presentation #47b Chronic lung disease (CLD): GA <33 weeks: Adjusted standardized ratios by site
Explanation for Presentation 47a Column 1: Numeric site codes Column 2: Total number of neonates at each site (<33 weeks GA and no major anomaly) Column 3: Number of eligible neonates at each site (<33 weeks GA and no major anomaly) who were actually used to fit the model Column 4: Number of neonates with outcome of interest among those eligible neonates Column 5: Expected number of neonates with outcome of interest after adjustment for GA, SGA, sex, and SNAPII > 20 Column 6: Adjusted standardized ratio calculated based on observed CLD/expected CLD Columns 7 and 8: 95% CI around the adjusted standardized ratio for the outcome Explanation for Presentation 47b X-axis: Expected number of neonates with outcome (value from Column 4 of previous presentation) Y-axis: Adjusted standardized ratio (value from Column 5 of previous presentation) Dark points with numerical notation: Site and its location matching x and y axis values Red funnel shaped lines: 95% confidence limits based on entire network information. Sites outside of red lines represent higher or lower (depending upon position in graph) adjusted standardized ratio. However, for determining whether site is statistically different from others, one should also assess 95% CI and check whether both upper and lower boundaries are also outside of the funnel area or not. Note: Deaths before 36 weeks were excluded in the denominator.
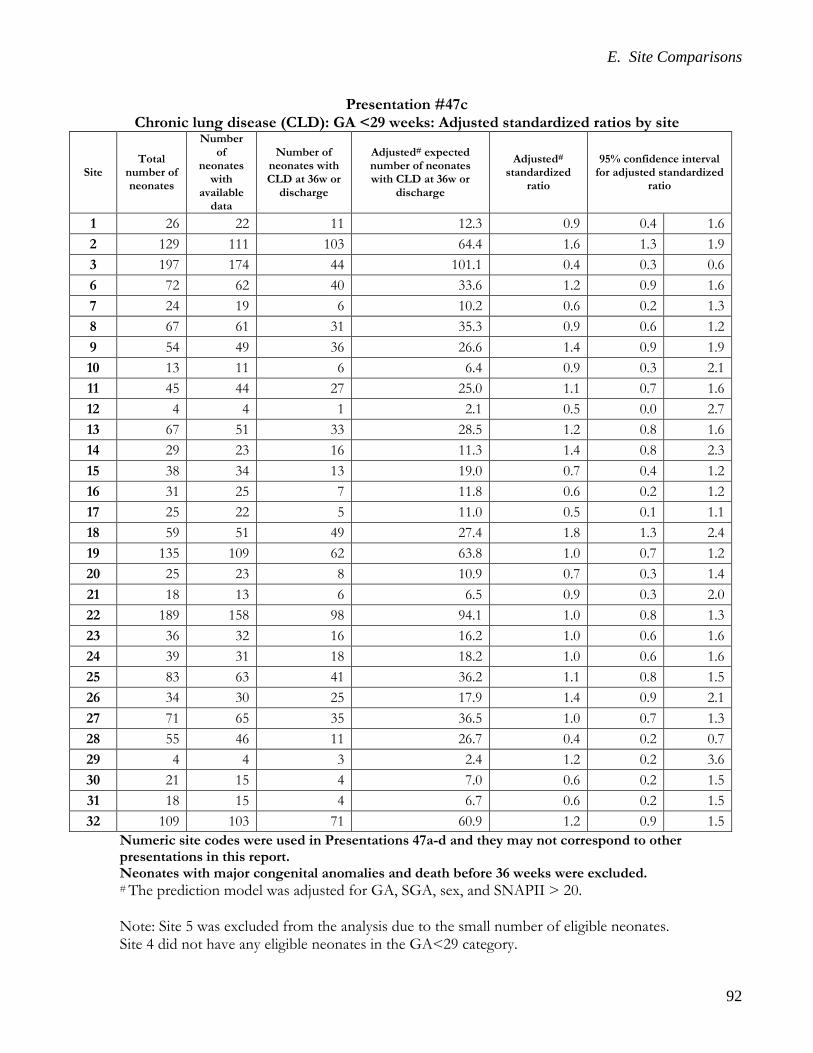
E. Site Comparisons
92
Presentation #47c Chronic lung disease (CLD): GA <29 weeks: Adjusted standardized ratios by site
Site Total
number of neonates
Number of
neonates with
available data
Number of neonates with CLD at 36w or
discharge
Adjusted# expected number of neonates with CLD at 36w or
discharge
Adjusted# standardized
ratio
95% confidence interval for adjusted standardized
ratio
1 26 22 11 12.3 0.9 0.4 1.6 2 129 111 103 64.4 1.6 1.3 1.9 3 197 174 44 101.1 0.4 0.3 0.6 6 72 62 40 33.6 1.2 0.9 1.6 7 24 19 6 10.2 0.6 0.2 1.3 8 67 61 31 35.3 0.9 0.6 1.2 9 54 49 36 26.6 1.4 0.9 1.9 10 13 11 6 6.4 0.9 0.3 2.1 11 45 44 27 25.0 1.1 0.7 1.6 12 4 4 1 2.1 0.5 0.0 2.7 13 67 51 33 28.5 1.2 0.8 1.6 14 29 23 16 11.3 1.4 0.8 2.3 15 38 34 13 19.0 0.7 0.4 1.2 16 31 25 7 11.8 0.6 0.2 1.2 17 25 22 5 11.0 0.5 0.1 1.1 18 59 51 49 27.4 1.8 1.3 2.4 19 135 109 62 63.8 1.0 0.7 1.2 20 25 23 8 10.9 0.7 0.3 1.4 21 18 13 6 6.5 0.9 0.3 2.0 22 189 158 98 94.1 1.0 0.8 1.3 23 36 32 16 16.2 1.0 0.6 1.6 24 39 31 18 18.2 1.0 0.6 1.6 25 83 63 41 36.2 1.1 0.8 1.5 26 34 30 25 17.9 1.4 0.9 2.1 27 71 65 35 36.5 1.0 0.7 1.3 28 55 46 11 26.7 0.4 0.2 0.7 29 4 4 3 2.4 1.2 0.2 3.6 30 21 15 4 7.0 0.6 0.2 1.5 31 18 15 4 6.7 0.6 0.2 1.5 32 109 103 71 60.9 1.2 0.9 1.5
Numeric site codes were used in Presentations 47a-d and they may not correspond to other presentations in this report. Neonates with major congenital anomalies and death before 36 weeks were excluded. # The prediction model was adjusted for GA, SGA, sex, and SNAPII > 20. Note: Site 5 was excluded from the analysis due to the small number of eligible neonates. Site 4 did not have any eligible neonates in the GA<29 category.

E. Site Comparisons
93
Presentation #47d Chronic lung disease (CLD): GA <29 weeks: Adjusted standardized ratios by site
Explanation for Presentation 47c Column 1: Numeric site codes Column 2: Total number of neonates at each site (<29 weeks GA and no major anomaly) Column 3: Number of eligible neonates at each site (<29 weeks GA and no major anomaly) who were actually used to fit the model Column 4: Number of neonates with outcome of interest among those eligible neonates Column 5: Expected number of neonates with outcome of interest after adjustment for GA, SGA, sex, and SNAPII > 20 Column 6: Adjusted standardized ratio calculated based on observed CLD/expected CLD Columns 7 and 8: 95% CI around the adjusted standardized ratio for the outcome Explanation for Presentation 47d X-axis: Expected number of neonates with outcome (value from Column 4 of previous presentation) Y-axis: Adjusted standardized ratio (value from Column 5 of previous presentation) Dark points with numerical notation: Site and its location matching x and y axis values Red funnel shaped lines: 95% confidence limits based on entire network information. Sites outside of red lines represent higher or lower (depending upon position in graph) adjusted standardized ratio. However, for determining whether site is statistically different from others, one should also assess 95% CI and check whether both upper and lower boundaries are also outside of the funnel area or not. Note: Deaths before 36 weeks were excluded in the denominator.
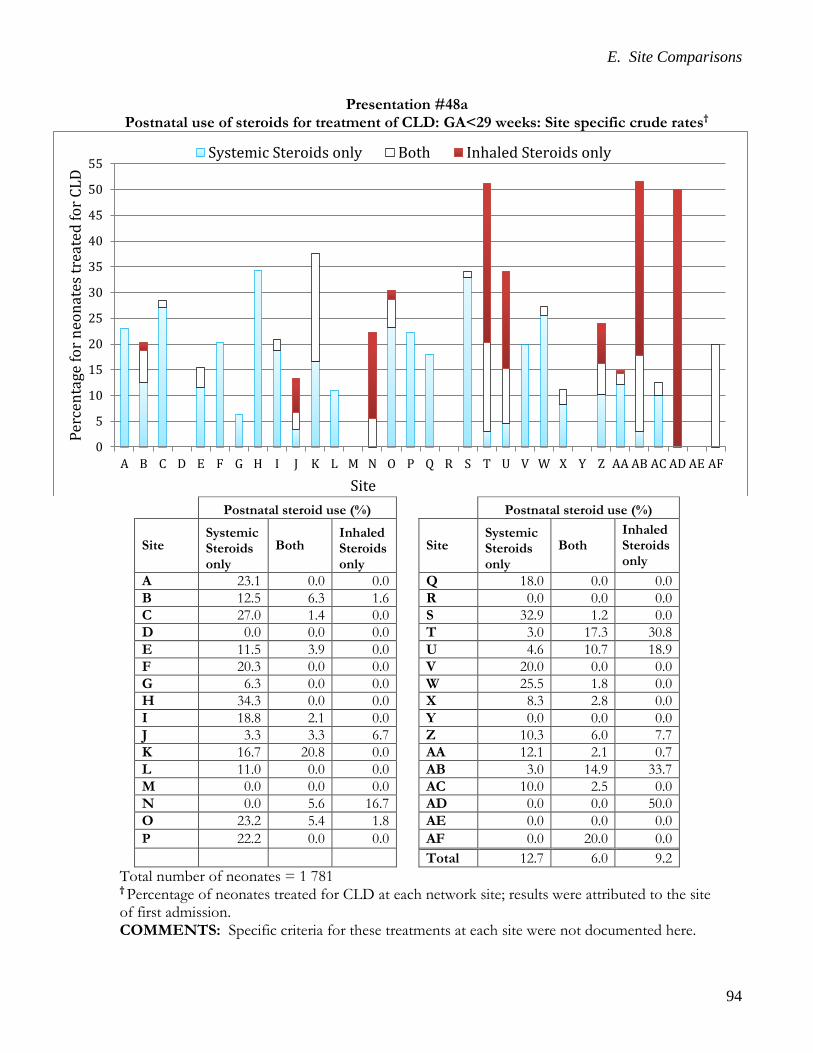
E. Site Comparisons
94
Presentation #48a Postnatal use of steroids for treatment of CLD: GA<29 weeks: Site specific crude rates†
Postnatal steroid use (%) Postnatal steroid use (%)
Site Systemic Steroids only
Both Inhaled Steroids only
Site Systemic Steroids only
Both Inhaled Steroids only
A 23.1 0.0 0.0 Q 18.0 0.0 0.0 B 12.5 6.3 1.6 R 0.0 0.0 0.0 C 27.0 1.4 0.0 S 32.9 1.2 0.0 D 0.0 0.0 0.0 T 3.0 17.3 30.8 E 11.5 3.9 0.0 U 4.6 10.7 18.9 F 20.3 0.0 0.0 V 20.0 0.0 0.0 G 6.3 0.0 0.0 W 25.5 1.8 0.0 H 34.3 0.0 0.0 X 8.3 2.8 0.0 I 18.8 2.1 0.0 Y 0.0 0.0 0.0 J 3.3 3.3 6.7 Z 10.3 6.0 7.7 K 16.7 20.8 0.0 AA 12.1 2.1 0.7 L 11.0 0.0 0.0 AB 3.0 14.9 33.7 M 0.0 0.0 0.0 AC 10.0 2.5 0.0 N 0.0 5.6 16.7 AD 0.0 0.0 50.0 O 23.2 5.4 1.8 AE 0.0 0.0 0.0 P 22.2 0.0 0.0 AF 0.0 20.0 0.0 Total 12.7 6.0 9.2
Total number of neonates = 1 781 † Percentage of neonates treated for CLD at each network site; results were attributed to the site of first admission. COMMENTS: Specific criteria for these treatments at each site were not documented here.
0
5
10
15
20
25
30
35
40
45
50
55
A B C D E F G H I J K L M N O P Q R S T U V W X Y Z AA AB AC AD AE AF
Perc
enta
ge fo
r neo
nate
s tre
ated
for C
LD
Site
Systemic Steroids only Both Inhaled Steroids only

E. Site Comparisons
95
Presentation #48b Systemic steroids for hypotension: GA<33 weeks: Site specific crude rates†
Site Postnatal systemic steroids use for hypotension (%)
Site Postnatal systemic steroids use for hypotension (%)
A 0.0 Q 10.3 B 1.8 R 0.0 C 9.8 S 10.2 D 0.0 T 7.3 E 3.0 U 9.4 F 10.1 V 0.0 G 4.4 W 0.6 H 7.6 X 5.7 I 3.5 Y 0.0 J 8.9 Z 3.2 K 4.6 AA 8.4 L 0.0 AB 9.1 M 0.0 AC 3.3 N 0.0 AD 0.0 O 9.4 AE 0.0 P 0.0 AF 0.0 Total 5.8
Total number of neonates = 4 482 † Percentage of neonates treated with systemic steroids for hypotension at each network site; results were attributed to the site of first admission. COMMENTS: Specific criteria for these treatments at each site were not documented here.
0
1
2
3
4
5
6
7
8
9
10
11
A B C D E F G H I J K L M N O P Q R S T U V W X Y Z AA AB AC AD AE AF
Perc
enta
ge o
f neo
nate
s tre
ated
with
sy
stem
atic
ster
oids
for h
ypot
ensi
on
Site
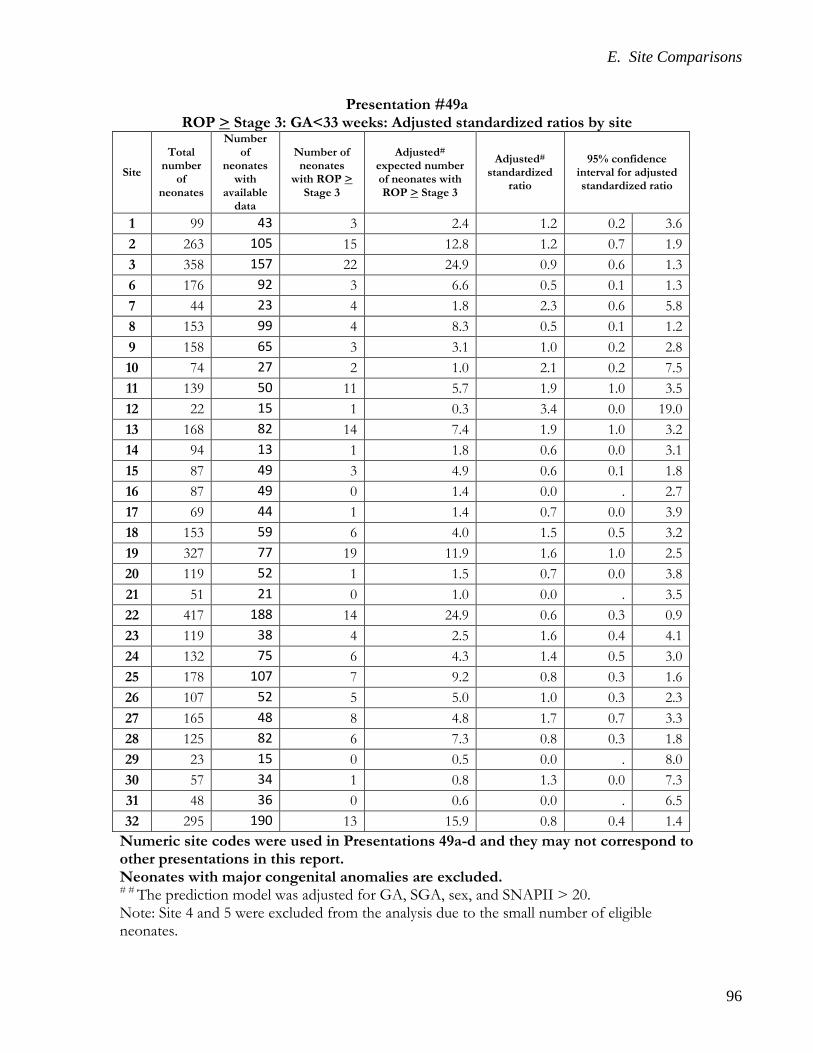
E. Site Comparisons
96
Presentation #49a ROP > Stage 3: GA<33 weeks: Adjusted standardized ratios by site
Site
Total number
of neonates
Number of
neonates with
available data
Number of neonates
with ROP > Stage 3
Adjusted# expected number of neonates with ROP > Stage 3
Adjusted# standardized
ratio
95% confidence interval for adjusted standardized ratio
1 99 43 3 2.4 1.2 0.2 3.6 2 263 105 15 12.8 1.2 0.7 1.9 3 358 157 22 24.9 0.9 0.6 1.3 6 176 92 3 6.6 0.5 0.1 1.3 7 44 23 4 1.8 2.3 0.6 5.8 8 153 99 4 8.3 0.5 0.1 1.2 9 158 65 3 3.1 1.0 0.2 2.8 10 74 27 2 1.0 2.1 0.2 7.5 11 139 50 11 5.7 1.9 1.0 3.5 12 22 15 1 0.3 3.4 0.0 19.0 13 168 82 14 7.4 1.9 1.0 3.2 14 94 13 1 1.8 0.6 0.0 3.1 15 87 49 3 4.9 0.6 0.1 1.8 16 87 49 0 1.4 0.0 . 2.7 17 69 44 1 1.4 0.7 0.0 3.9 18 153 59 6 4.0 1.5 0.5 3.2 19 327 77 19 11.9 1.6 1.0 2.5 20 119 52 1 1.5 0.7 0.0 3.8 21 51 21 0 1.0 0.0 . 3.5 22 417 188 14 24.9 0.6 0.3 0.9 23 119 38 4 2.5 1.6 0.4 4.1 24 132 75 6 4.3 1.4 0.5 3.0 25 178 107 7 9.2 0.8 0.3 1.6 26 107 52 5 5.0 1.0 0.3 2.3 27 165 48 8 4.8 1.7 0.7 3.3 28 125 82 6 7.3 0.8 0.3 1.8 29 23 15 0 0.5 0.0 . 8.0 30 57 34 1 0.8 1.3 0.0 7.3 31 48 36 0 0.6 0.0 . 6.5 32 295 190 13 15.9 0.8 0.4 1.4
Numeric site codes were used in Presentations 49a-d and they may not correspond to other presentations in this report. Neonates with major congenital anomalies are excluded. # # The prediction model was adjusted for GA, SGA, sex, and SNAPII > 20. Note: Site 4 and 5 were excluded from the analysis due to the small number of eligible neonates.

E. Site Comparisons
97
Presentation #49b ROP > Stage 3: GA<33 weeks: Adjusted standardized ratios by site
Explanation for Presentation 49a Column 1: Numeric site codes Column 2: Total number of neonates at each site (<33 weeks GA and no major anomaly) Column 3: Number of eligible neonates at each site (<33 weeks GA and no major anomaly) who were actually used to fit the model Column 4: Number of neonates with outcome of interest among those eligible neonates Column 5: Expected number of neonates with outcome of interest after adjustment for GA, SGA, sex, and SNAPII > 20 Column 6: Adjusted standardized ratio calculated based on observed ROP/expected ROP Columns 7 and 8: 95% CI around the adjusted standardized ratio for the outcome Explanation for Presentation 49b X-axis: Expected number of neonates with outcome (value from Column 4 of previous presentation) Y-axis: Adjusted standardized ratio (value from Column 5 of previous presentation) Dark points with numerical notation: Site and its location matching x and y axis values Red funnel shaped lines: 95% confidence limits based on entire network information. Sites outside of red lines represent higher or lower (depending upon position in graph) adjusted standardized ratio. However, for determining whether site is statistically different from others, one should also assess 95% CI and check whether both upper and lower boundaries are also outside of the funnel area or not. Note: site 25 is not shown in the funnel plot due to high ASR. Refer to the table for site 25.

E. Site Comparisons
98
Presentation# 49c ROP > Stage 3: GA<29 weeks: Adjusted standardized ratios by site
Site
Total number
of neonates
Number of
neonates with
available data
Number of neonates
with ROP> Stage 3
Adjusted# expected number of neonates with ROP> Stage 3
Adjusted# standardized
ratio
95% confidence interval for adjusted standardized ratio
1 26 22 3 2.3 1.3 0.3 3.8 2 129 92 15 12.8 1.2 0.7 1.9 3 197 144 22 24.6 0.9 0.6 1.4 6 72 56 3 6.3 0.5 0.1 1.4 7 24 18 4 1.7 2.3 0.6 5.9 8 67 62 4 8.0 0.5 0.1 1.3 9 54 33 3 3.0 1.0 0.2 3.0 10 13 7 2 0.9 2.2 0.3 8.1 11 45 38 9 5.6 1.6 0.7 3.1 12 4 4 1 0.2 4.5 0.1 24.9 13 67 48 14 7.1 2.0 1.1 3.3 14 29 10 1 1.8 0.6 0.0 3.1 15 38 34 3 4.8 0.6 0.1 1.8 16 31 25 0 1.2 0.0 . 3.1 17 25 22 1 1.4 0.7 0.0 4.1 18 59 44 6 3.8 1.6 0.6 3.5 19 135 65 18 11.8 1.5 0.9 2.4 20 25 22 1 1.3 0.7 0.0 4.2 21 18 13 0 1.0 0.0 . 3.7 22 189 147 14 24.4 0.6 0.3 1.0 23 36 24 4 2.4 1.7 0.4 4.2 24 39 32 6 4.1 1.5 0.5 3.2 25 83 66 6 8.8 0.7 0.2 1.5 26 34 28 5 4.7 1.1 0.3 2.5 27 71 41 8 4.8 1.7 0.7 3.3 28 55 46 6 7.2 0.8 0.3 1.8 29 4 3 0 0.4 0.0 . 8.5 30 21 15 0 0.7 0.0 . 5.5 31 18 14 0 0.5 0.0 . 7.6 32 109 102 13 15.3 0.8 0.5 1.4
Numeric site codes were used in Presentations 49a-d and they may not correspond to other presentations in this report. Neonates with major congenital anomalies are excluded. # # The prediction model was adjusted for GA, SGA, sex, and SNAPII > 20. Note: Sites 4 and 5 were excluded from the analysis due to the small number of eligible neonates.

E. Site Comparisons
99
Presentation #49d ROP > Stage 3: GA<29 weeks: Adjusted standardized ratios by site
Explanation for Presentation 49c Column 1: Numeric site codes Column 2: Total number of neonates at each site (<29 weeks GA and no major anomaly) Column 3: Number of eligible neonates at each site (<29 weeks GA and no major anomaly) who were actually used to fit the model Column 4: Number of neonates with outcome of interest among those eligible neonates Column 5: Expected number of neonates with outcome of interest after adjustment for GA, SGA, sex, and SNAPII > 20 Column 6: Adjusted standardized ratio calculated based on observed ROP/expected ROP Columns 7 and 8: 95% CI around the adjusted standardized ratio for the outcome Explanation for Presentation 49d X-axis: Expected number of neonates with outcome (value from Column 4 of previous presentation) Y-axis: Adjusted standardized ratio (value from Column 5 of previous presentation) Dark points with numerical notation: Site and its location matching x and y axis values Red funnel shaped lines: 95% confidence limits based on entire network information. Sites outside of red lines represent higher or lower (depending upon position in graph) adjusted standardized ratio. However, for determining whether site is statistically different from others, one should also assess 95% CI and check whether both upper and lower boundaries are also outside of the funnel area or not.
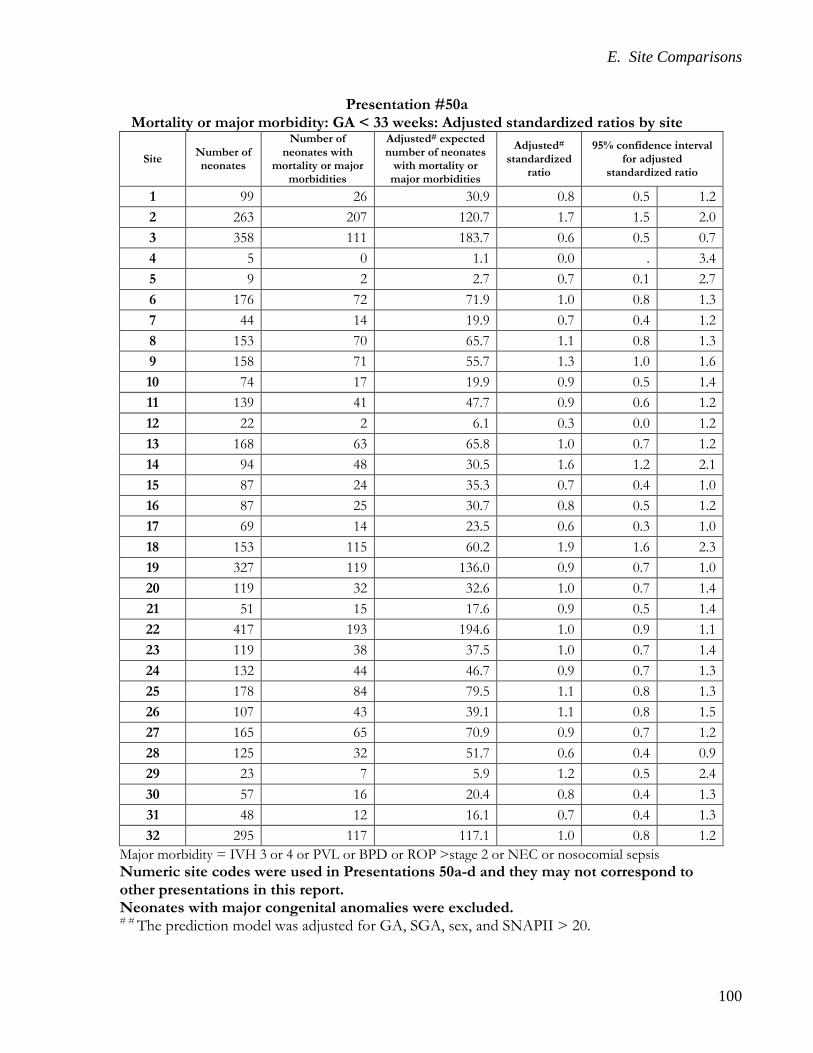
E. Site Comparisons
100
Presentation #50a Mortality or major morbidity: GA < 33 weeks: Adjusted standardized ratios by site
Site Number of neonates
Number of neonates with
mortality or major morbidities
Adjusted# expected number of neonates
with mortality or major morbidities
Adjusted# standardized
ratio
95% confidence interval for adjusted
standardized ratio
1 99 26 30.9 0.8 0.5 1.2 2 263 207 120.7 1.7 1.5 2.0 3 358 111 183.7 0.6 0.5 0.7 4 5 0 1.1 0.0 . 3.4 5 9 2 2.7 0.7 0.1 2.7 6 176 72 71.9 1.0 0.8 1.3 7 44 14 19.9 0.7 0.4 1.2 8 153 70 65.7 1.1 0.8 1.3 9 158 71 55.7 1.3 1.0 1.6 10 74 17 19.9 0.9 0.5 1.4 11 139 41 47.7 0.9 0.6 1.2 12 22 2 6.1 0.3 0.0 1.2 13 168 63 65.8 1.0 0.7 1.2 14 94 48 30.5 1.6 1.2 2.1 15 87 24 35.3 0.7 0.4 1.0 16 87 25 30.7 0.8 0.5 1.2 17 69 14 23.5 0.6 0.3 1.0 18 153 115 60.2 1.9 1.6 2.3 19 327 119 136.0 0.9 0.7 1.0 20 119 32 32.6 1.0 0.7 1.4 21 51 15 17.6 0.9 0.5 1.4 22 417 193 194.6 1.0 0.9 1.1 23 119 38 37.5 1.0 0.7 1.4 24 132 44 46.7 0.9 0.7 1.3 25 178 84 79.5 1.1 0.8 1.3 26 107 43 39.1 1.1 0.8 1.5 27 165 65 70.9 0.9 0.7 1.2 28 125 32 51.7 0.6 0.4 0.9 29 23 7 5.9 1.2 0.5 2.4 30 57 16 20.4 0.8 0.4 1.3 31 48 12 16.1 0.7 0.4 1.3 32 295 117 117.1 1.0 0.8 1.2
Major morbidity = IVH 3 or 4 or PVL or BPD or ROP >stage 2 or NEC or nosocomial sepsis Numeric site codes were used in Presentations 50a-d and they may not correspond to other presentations in this report. Neonates with major congenital anomalies were excluded. # # The prediction model was adjusted for GA, SGA, sex, and SNAPII > 20.

E. Site Comparisons
101
Presentation #50b Mortality or major morbidity: GA < 33 weeks: Adjusted standardized ratios by site
Explanation for Presentation 50a Column 1: Numeric site codes Column 2: Number of eligible neonates at each site (<33 weeks GA and no major anomaly) Column 3: Number of neonates with outcome of interest among those eligible neonates Column 4: Expected number of neonates with outcome of interest after adjustment for GA, small for gestational age, sex, and SNAPII > 20 Column 5: Adjusted standardized ratio calculated based on observed death or morbidities/expected deaths or morbidities Columns 6 and 7: 95% CI around the adjusted standardized ratio for the outcome Explanation for Presentation 50b X-axis: Expected number of neonates with outcome (value from Column 4 of previous presentation) Y-axis: Adjusted standardized ratio (value from Column 5 of previous presentation) Dark points with numerical notation: Site and its location matching x and y axis values Red funnel shaped lines: 95% confidence limits based on entire network information. Sites outside of red lines represent higher or lower (depending upon position in graph) adjusted standardized ratio. However, for determining whether site is statistically different from others, one should also assess 95% CI and check whether both upper and lower boundaries are also outside of the funnel area or not.
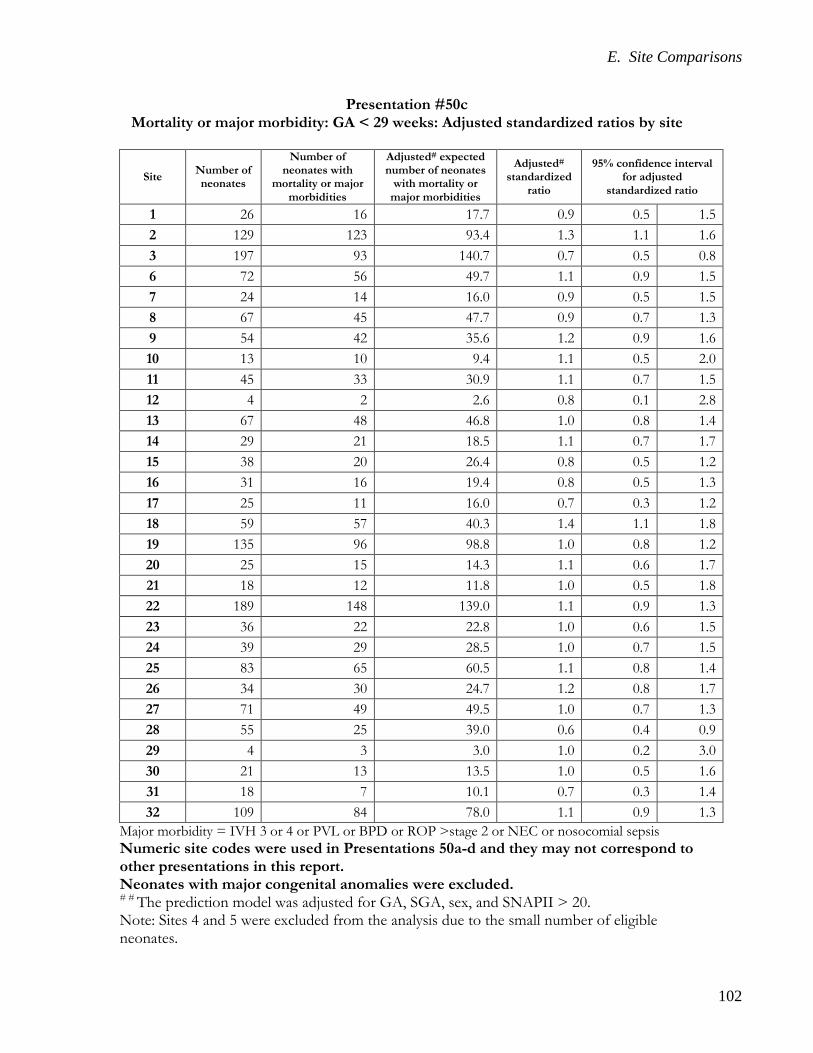
E. Site Comparisons
102
Presentation #50c Mortality or major morbidity: GA < 29 weeks: Adjusted standardized ratios by site
Site Number of neonates
Number of neonates with
mortality or major morbidities
Adjusted# expected number of neonates
with mortality or major morbidities
Adjusted# standardized
ratio
95% confidence interval for adjusted
standardized ratio
1 26 16 17.7 0.9 0.5 1.5 2 129 123 93.4 1.3 1.1 1.6 3 197 93 140.7 0.7 0.5 0.8 6 72 56 49.7 1.1 0.9 1.5 7 24 14 16.0 0.9 0.5 1.5 8 67 45 47.7 0.9 0.7 1.3 9 54 42 35.6 1.2 0.9 1.6 10 13 10 9.4 1.1 0.5 2.0 11 45 33 30.9 1.1 0.7 1.5 12 4 2 2.6 0.8 0.1 2.8 13 67 48 46.8 1.0 0.8 1.4 14 29 21 18.5 1.1 0.7 1.7 15 38 20 26.4 0.8 0.5 1.2 16 31 16 19.4 0.8 0.5 1.3 17 25 11 16.0 0.7 0.3 1.2 18 59 57 40.3 1.4 1.1 1.8 19 135 96 98.8 1.0 0.8 1.2 20 25 15 14.3 1.1 0.6 1.7 21 18 12 11.8 1.0 0.5 1.8 22 189 148 139.0 1.1 0.9 1.3 23 36 22 22.8 1.0 0.6 1.5 24 39 29 28.5 1.0 0.7 1.5 25 83 65 60.5 1.1 0.8 1.4 26 34 30 24.7 1.2 0.8 1.7 27 71 49 49.5 1.0 0.7 1.3 28 55 25 39.0 0.6 0.4 0.9 29 4 3 3.0 1.0 0.2 3.0 30 21 13 13.5 1.0 0.5 1.6 31 18 7 10.1 0.7 0.3 1.4 32 109 84 78.0 1.1 0.9 1.3
Major morbidity = IVH 3 or 4 or PVL or BPD or ROP >stage 2 or NEC or nosocomial sepsis Numeric site codes were used in Presentations 50a-d and they may not correspond to other presentations in this report. Neonates with major congenital anomalies were excluded. # # The prediction model was adjusted for GA, SGA, sex, and SNAPII > 20. Note: Sites 4 and 5 were excluded from the analysis due to the small number of eligible neonates.

E. Site Comparisons
103
Presentation #50d Mortality or major morbidity: GA < 29 weeks: Adjusted standardized ratios by site
Explanation for Presentation 50c Column 1: Numeric site codes Column 2: Number of eligible neonates at each site (<29 weeks GA and no major anomaly) Column 3: Number of neonates with outcome of interest among those eligible neonates Column 4: Expected number of neonates with outcome of interest after adjustment for GA, SGA, sex, and SNAPII > 20 Column 5: Adjusted standardized ratio calculated based on observed death or morbidities/expected deaths or morbidities Columns 6 and 7: 95% CI around the adjusted standardized ratio for the outcome Explanation for Presentation 50d X-axis: Expected number of neonates with outcome (value from Column 4 of previous presentation) Y-axis: Adjusted standardized ratio (value from Column 5 of previous presentation) Dark points with numerical notation: Site and its location matching x and y axis values Red funnel shaped lines: 95% confidence limits based on entire network information. Sites outside of red lines represent higher or lower (depending upon position in graph) adjusted standardized ratio. However, for determining whether site is statistically different from others, one should also assess 95% CI and check whether both upper and lower boundaries are also outside of the funnel area or not.

F. Discharge Disposition and Status
104
F. Discharge Disposition and Status
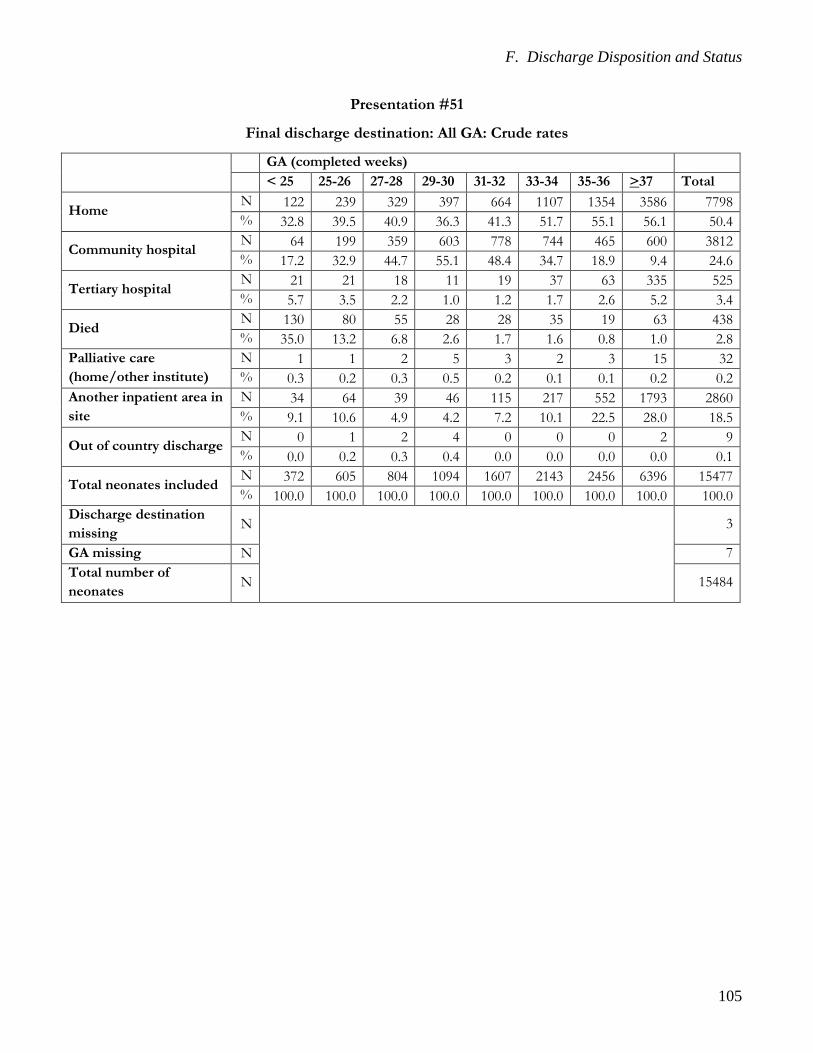
F. Discharge Disposition and Status
105
Presentation #51
Final discharge destination: All GA: Crude rates
GA (completed weeks) < 25 25-26 27-28 29-30 31-32 33-34 35-36 >37 Total
Home N 122 239 329 397 664 1107 1354 3586 7798 % 32.8 39.5 40.9 36.3 41.3 51.7 55.1 56.1 50.4
Community hospital N 64 199 359 603 778 744 465 600 3812 % 17.2 32.9 44.7 55.1 48.4 34.7 18.9 9.4 24.6
Tertiary hospital N 21 21 18 11 19 37 63 335 525 % 5.7 3.5 2.2 1.0 1.2 1.7 2.6 5.2 3.4
Died N 130 80 55 28 28 35 19 63 438 % 35.0 13.2 6.8 2.6 1.7 1.6 0.8 1.0 2.8
Palliative care (home/other institute)
N 1 1 2 5 3 2 3 15 32 % 0.3 0.2 0.3 0.5 0.2 0.1 0.1 0.2 0.2
Another inpatient area in site
N 34 64 39 46 115 217 552 1793 2860 % 9.1 10.6 4.9 4.2 7.2 10.1 22.5 28.0 18.5
Out of country discharge N 0 1 2 4 0 0 0 2 9 % 0.0 0.2 0.3 0.4 0.0 0.0 0.0 0.0 0.1
Total neonates included N 372 605 804 1094 1607 2143 2456 6396 15477 % 100.0 100.0 100.0 100.0 100.0 100.0 100.0 100.0 100.0
Discharge destination missing
N
3
GA missing N 7 Total number of neonates
N 15484

F. Discharge Disposition and Status
106
Presentation #52
Support at discharge: Neonates who were discharged directly home: Crude rates
GA (completed weeks) < 25 25-26 27-28 29-30 31-32 33-34 35-36 >37 Total
Total available N 372 605 804 1094 1607 2143 2456 6396 15477 Number of neonates who survived and were discharged home directly from the NICU
N 122 239 329 397 664 1107 1354 3586 7798
Oxygen N 46 55 38 25 18 36 26 69 313 % 37.7 23.0 11.6 6.3 2.7 3.3 1.9 1.9 4.0
Monitor N 12 28 21 20 22 30 27 117 277 % 9.8 11.7 6.4 5.0 3.3 2.7 2.0 3.3 3.6
Enterostomy N 0 1 4 0 2 1 2 13 23 % 0.0 0.4 1.2 0.0 0.3 0.1 0.2 0.4 0.3
Gavage N 16 24 21 15 13 22 25 68 204 % 13.1 10.0 6.4 3.8 2.0 2.0 1.9 1.9 2.6
Tracheostomy N 1 3 1 0 1 0 0 2 8 % 0.8 1.3 0.3 0.0 0.2 0.0 0.0 0.1 0.1
Gastrostomy N 7 6 7 5 3 2 6 20 56 % 5.7 2.5 2.1 1.3 0.5 0.2 0.4 0.6 0.7
Ventilation N 0 2 0 0 1 0 0 3 6 % 0.0 0.8 0.0 0.0 0.2 0.0 0.0 0.1 0.1
CPAP N 2 5 3 1 0 0 0 2 13 % 1.6 2.1 0.9 0.3 0.0 0.0 0.0 0.1 0.2
Feeding status at discharge directly home
Breast milk only N 42 70 108 127 254 401 430 1122 2554 % 34.4 29.3 32.8 32.0 38.3 36.2 31.8 31.3 32.8
Formula only N 42 90 122 121 179 262 324 760 1900 % 34.4 37.7 37.1 30.5 27.0 23.7 23.9 21.2 24.4
Both breast milk and formula
N 34 68 90 127 206 393 569 1565 3052 % 27.9 28.5 27.4 32.0 31.0 35.5 42.0 43.6 39.1
Note: In this presentation, denominators were based on the number of neonates who survived and were discharged directly home.

G. Hypoxic Ischemic Encephalopathy
107
G. Hypoxic Ischemic Encephalopathy

G. Hypoxic Ischemic Encephalopathy
108
Presentation #53
Hypoxic Ischemic Encephalopathy
A. Sarnat staging at the time of admission and receipt of hypothermia Sarnat’s staging of HIE on
admission
Stage 1
Stage 2
Stage 3
Unknown stage
Total
Hypothermia treatment
Yes 50 162 54 40 306 No 69 16 24 41 150 Unknown 8 12 1 89 110
Total 127 190 79 170 566
B. Reason for not receiving hypothermia treatment*
Reason Number Chromosomal anomalies 1 Major congenital anomalies 0 Weight < 2000g or GA < 35 weeks 35 Extreme condition 15 Head trauma or intracranial hemorrhage 1 Mild HIE 77 Unit policy 8 Health care team preference 10 Delayed transfer 16 Parental request 3 Unknown 13 *One neonate can have more than one reasons.
C. Time of admission
Time Number <6 hours from birth 354 6 – 12 hours from birth 151 >12 hours from birth 59 Total** 564 **2 neonates are missing either time of birth or time of admission.

G. Hypoxic Ischemic Encephalopathy
109
Presentation #53 (continued)
Hypoxic Ischemic Encephalopathy D. Characteristics of neonates who received hypothermia (N=306)
Characteristics N Results Method 306 Selective head 5 (2%)
Whole body cooling 301 (98%) Target temperature 306 < 330C 3 (1%)
33-340C 229 (75%) 33.5-34.50C 54 (18%) 34-350C 4 (1%) 34.5-35.50C 4 (1%) Unknown 12 (4%)
Seizures at initiation 306 80 (26%) Seizures at completion 306 29 (9%) GA < 33 weeks 306 1 (0%) Birthweight < 2000g 306 0 (0%) During hypothermia 295 Hypotension 85 (29%)
292 Thrombocytopenia 54 (18%) 296 Coagulopathy 83 (28%) 289 Persistent metabolic acidosis 46 (16%)
Death 306 22 (7%) Discharge on palliation 305 8 (3%)
E. Encephalopathy stage in relation to hypothermia treatment Encephalopathy stage*
At the end of hypothermia Stage 1 Stage 2 Stage 3 Unknown Normal Total
At the start of hypothermia
Stage 1 15 8 0 8 21 52 Stage 2 27 60 5 31 41 164 Stage 3 2 13 25 9 2 51 Unknown 0 0 1 23 13 37
Total 44 81 31 72 78 306 *The numbers may be different from table A because table E presents encephalopathy staging at the start and end of hypothermia, whereas table A presents encephalopathy staging at the first assessment.
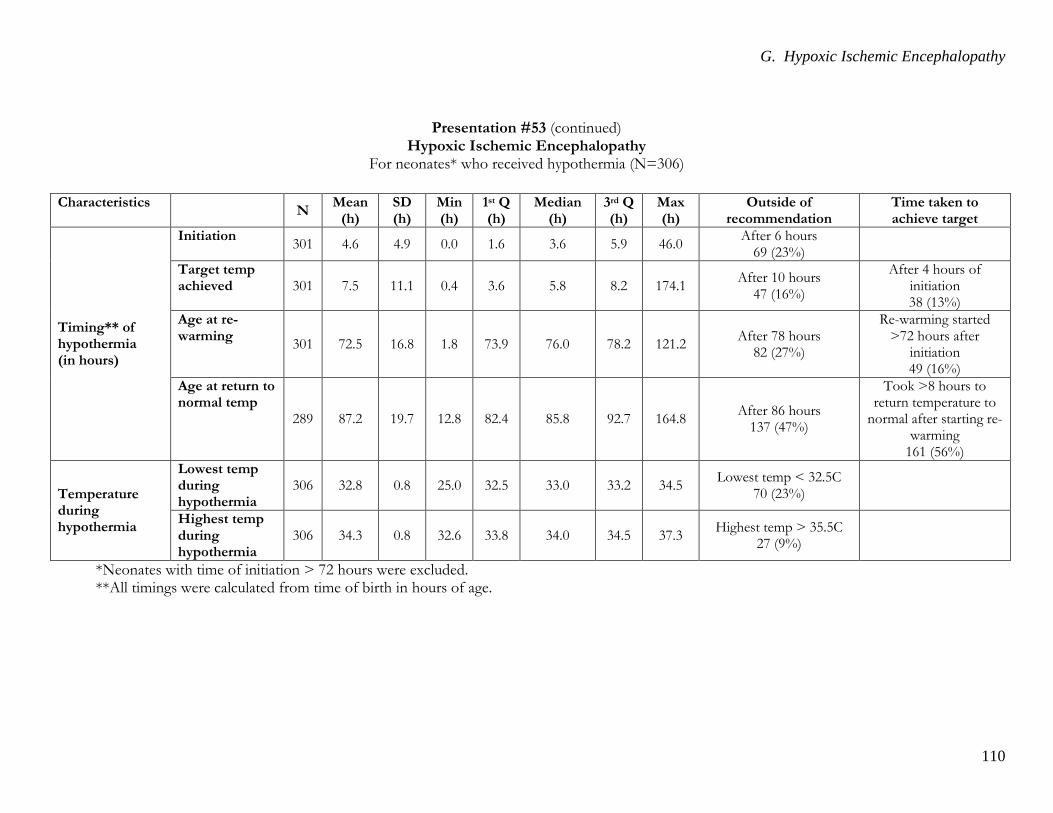
G. Hypoxic Ischemic Encephalopathy
110
Presentation #53 (continued) Hypoxic Ischemic Encephalopathy
For neonates* who received hypothermia (N=306)
Characteristics N Mean (h)
SD (h)
Min (h)
1st Q (h)
Median (h)
3rd Q (h)
Max (h)
Outside of recommendation
Time taken to achieve target
Timing** of hypothermia (in hours)
Initiation 301 4.6 4.9 0.0 1.6 3.6 5.9 46.0 After 6 hours 69 (23%)
Target temp achieved 301 7.5 11.1 0.4 3.6 5.8 8.2 174.1 After 10 hours
47 (16%)
After 4 hours of initiation 38 (13%)
Age at re-warming 301 72.5 16.8 1.8 73.9 76.0 78.2 121.2 After 78 hours
82 (27%)
Re-warming started >72 hours after
initiation 49 (16%)
Age at return to normal temp
289 87.2 19.7 12.8 82.4 85.8 92.7 164.8 After 86 hours 137 (47%)
Took >8 hours to return temperature to
normal after starting re-warming
161 (56%)
Temperature during hypothermia
Lowest temp during hypothermia
306 32.8 0.8 25.0 32.5 33.0 33.2 34.5 Lowest temp < 32.5C 70 (23%)
Highest temp during hypothermia
306 34.3 0.8 32.6 33.8 34.0 34.5 37.3 Highest temp > 35.5C 27 (9%)
*Neonates with time of initiation > 72 hours were excluded. **All timings were calculated from time of birth in hours of age.

H. Trend Analyses
111
H. Trend Analyses over last 9 years This section includes trend analyses of specific outcomes from the last 9 years (2010-18) for neonates <33 weeks’ GA in CNN sites. The following table describes the number of neonates in the respective GA categories that were included in these trend analyses. Delivery room deaths were excluded. Number of neonates by admission year and GA
GA Total
Year Number of Sites <23 23 24 25 26 27 28 29 30 31 32
2010
27
9 73 172 270 333 388 371 480 611 678 788 4173
2011
30 15 86 166 242 318 332 391 467 553 643 828 4041
2012
30 28 85 184 285 294 348 416 510 610 738 872 4370
2013
29 16 76 197 247 267 357 434 479 620 733 836 4262
2014
31 8 81 226 250 332 362 412 517 585 743 871 4387
2015
30 14 99 177 248 289 317 425 470 536 662 793 4030
2016
30 16 79 214 275 272 380 431 437 551 722 861 4238
2017
31 16 133 215 257 294 325 434 467 606 743 868 4358
2018
32 25 132 215 271 334 380 424 518 576 744 863 4482
Number of neonates by admission year and birth weight
Birth weight Total
Year Number of Sites < 500 500 - 749 750 - 999 1000 – 1249 1250 – 1499
2010
27
32 436 792 819 879 2958
2011
30 31 383 660 680 794 2548
2012
30 48 441 696 815 922 2922
2013
29 36 428 651 842 919 2876
2014
31 36 458 760 804 922 2980
2015
30 40 406 680 792 864 2782
2016
30 40 472 710 744 901 2867
2017
31 38 478 678 806 920 2920
2018
32 55 508 739 807 977 3086
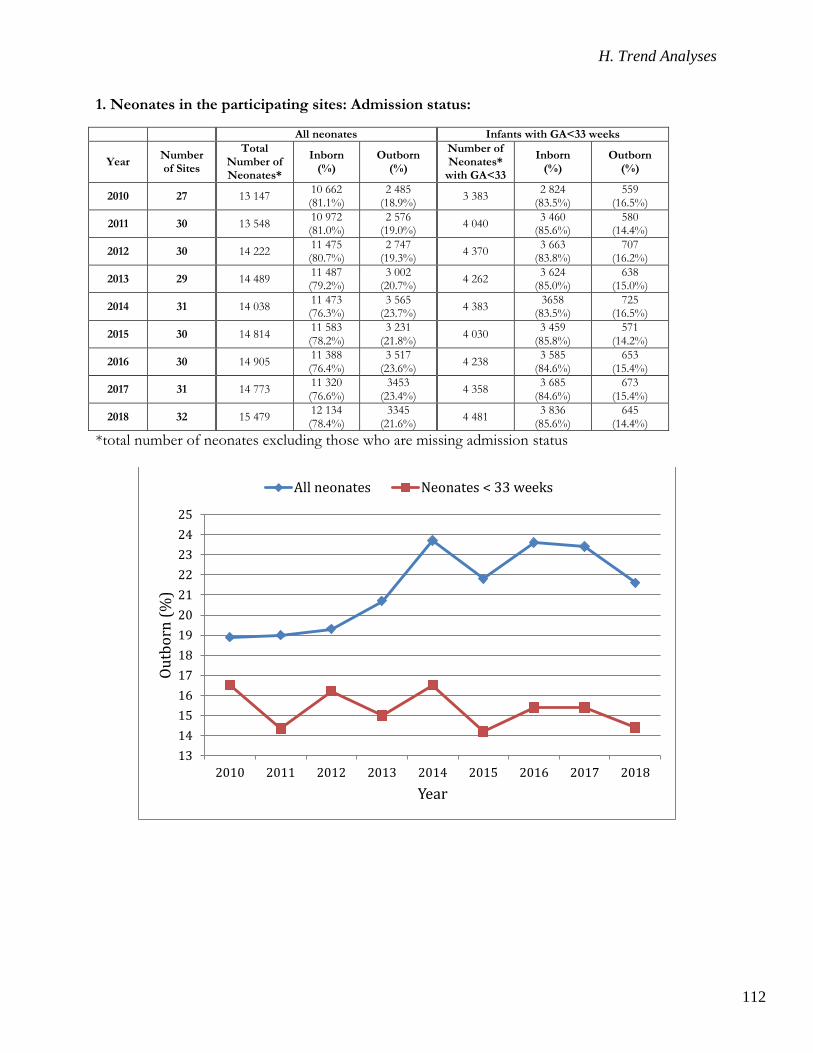
H. Trend Analyses
112
1. Neonates in the participating sites: Admission status:
All neonates Infants with GA<33 weeks
Year Number of Sites
Total Number of Neonates*
Inborn (%)
Outborn (%)
Number of Neonates*
with GA<33
Inborn (%)
Outborn (%)
2010 27 13 147 10 662 (81.1%)
2 485 (18.9%) 3 383 2 824
(83.5%) 559
(16.5%)
2011 30 13 548 10 972 (81.0%)
2 576 (19.0%) 4 040 3 460
(85.6%) 580
(14.4%)
2012 30 14 222 11 475 (80.7%)
2 747 (19.3%) 4 370 3 663
(83.8%) 707
(16.2%)
2013 29 14 489 11 487 (79.2%)
3 002 (20.7%) 4 262 3 624
(85.0%) 638
(15.0%)
2014 31 14 038 11 473 (76.3%)
3 565 (23.7%) 4 383 3658
(83.5%) 725
(16.5%)
2015 30 14 814 11 583 (78.2%)
3 231 (21.8%) 4 030 3 459
(85.8%) 571
(14.2%)
2016 30 14 905 11 388 (76.4%)
3 517 (23.6%) 4 238 3 585
(84.6%) 653
(15.4%)
2017 31 14 773 11 320 (76.6%)
3453 (23.4%) 4 358 3 685
(84.6%) 673
(15.4%)
2018 32 15 479 12 134 (78.4%)
3345 (21.6%) 4 481 3 836
(85.6%) 645
(14.4%) *total number of neonates excluding those who are missing admission status
13141516171819202122232425
2010 2011 2012 2013 2014 2015 2016 2017 2018
Outb
orn
(%)
Year
All neonates Neonates < 33 weeks
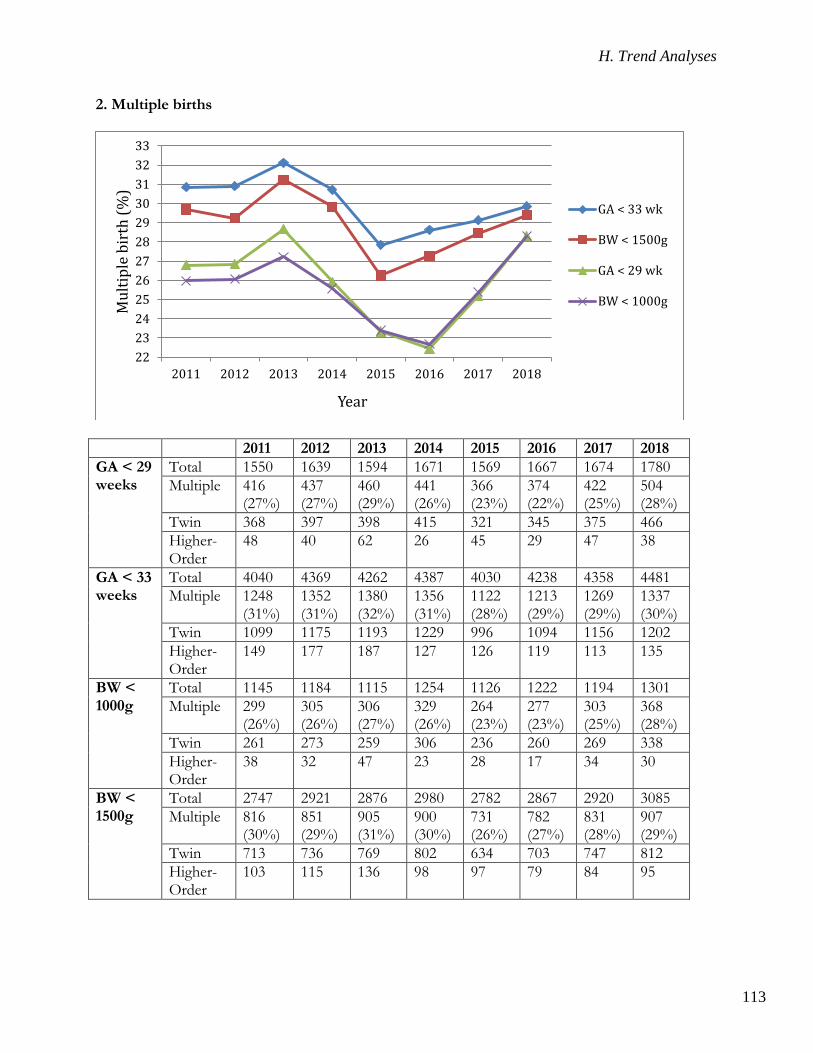
H. Trend Analyses
113
2. Multiple births
2011 2012 2013 2014 2015 2016 2017 2018 GA < 29 weeks
Total 1550 1639 1594 1671 1569 1667 1674 1780 Multiple 416
(27%) 437 (27%)
460 (29%)
441 (26%)
366 (23%)
374 (22%)
422 (25%)
504 (28%)
Twin 368 397 398 415 321 345 375 466 Higher-Order
48 40 62 26 45 29 47 38
GA < 33 weeks
Total 4040 4369 4262 4387 4030 4238 4358 4481 Multiple 1248
(31%) 1352 (31%)
1380 (32%)
1356 (31%)
1122 (28%)
1213 (29%)
1269 (29%)
1337 (30%)
Twin 1099 1175 1193 1229 996 1094 1156 1202 Higher-Order
149 177 187 127 126 119 113 135
BW < 1000g
Total 1145 1184 1115 1254 1126 1222 1194 1301 Multiple 299
(26%) 305 (26%)
306 (27%)
329 (26%)
264 (23%)
277 (23%)
303 (25%)
368 (28%)
Twin 261 273 259 306 236 260 269 338 Higher-Order
38 32 47 23 28 17 34 30
BW < 1500g
Total 2747 2921 2876 2980 2782 2867 2920 3085 Multiple 816
(30%) 851 (29%)
905 (31%)
900 (30%)
731 (26%)
782 (27%)
831 (28%)
907 (29%)
Twin 713 736 769 802 634 703 747 812 Higher-Order
103 115 136 98 97 79 84 95
222324252627282930313233
2011 2012 2013 2014 2015 2016 2017 2018
Mul
tiple
bir
th (%
)
Year
GA < 33 wk
BW < 1500g
GA < 29 wk
BW < 1000g

H. Trend Analyses
114
3. Proportion of neonates who received active care out of all (including delivery room (DR) deaths)
2012 2013 2014 2015 2016 2017 2018 <23 weeks
Number of neonates who received active care (a-c) +e 25 23 14 22 16 26 35
Total number of neonates including DR deaths a+d+e 79 63 58 68 67 65 95
Percentage of neonates who received active care 32% 37% 24% 32% 24% 40% 37%
23 weeks
Number of neonates who received active care (a-c) +e 83 85 92 106 82 136 133
Total number of neonates including DR deaths a+d+e 137 113 131 142 121 171 185
Percentage of neonates who received active care 61% 75% 70% 75% 68% 80% 72%
24 weeks
Number of neonates who received active care (a-c) +e 185 200 233 178 217 221 224
Total number of neonates including DR deaths a+d+e 202 207 245 190 227 231 235
Percentage of neonates who received active care 92% 97% 95% 94% 96% 96% 95%
Note: Refer to presentation #4 for detailed breakdown of neonates by GA in 2018. The alphabet notations used in the table above are carried from presentation #4. Information should be interpreted with caution as not all sites provided data on delivery room deaths. Active care refers to infants who received cardiopulmonary resuscitation at birth.
0
10
20
30
40
50
60
70
80
90
100
2012 2013 2014 2015 2016 2017 2018
Perc
enta
ge o
f neo
nate
s who
rece
ived
ac
tive
care
(%)
Year
24 weeks
23 weeks
< 23 weeks

H. Trend Analyses
115
4. Survival rate among those who were admitted to NICU: a. 22-26 weeks' GA:
b. 27-32 weeks’ GA:
0
10
20
30
40
50
60
70
80
90
100
2010 2011 2012 2013 2014 2015 2016 2017 2018
Surv
ival
rate
(%)
Year
26 week
25 week
24 week
23 week
<23 week
90
91
92
93
94
95
96
97
98
99
100
2010 2011 2012 2013 2014 2015 2016 2017 2018
Surv
ival
rate
(%)
Year
32 week
31 week
30 week
29 week
28 week
27 week

H. Trend Analyses
116
5. Late onset sepsis (with at least one infection) among neonates who survived beyond 2 days post birth a. 23-26 weeks’ GA:
b. 27-32 weeks’ GA:
161820222426283032343638404244464850
2010 2011 2012 2013 2014 2015 2016 2017 2018
Late
ons
et se
psis
(%)
Year
<=23 week
24 week
25 week
26 week
0
2
4
6
8
10
12
14
16
18
20
22
24
2010 2011 2012 2013 2014 2015 2016 2017 2018
Late
ons
et se
psis
(%)
Year
27 week
28 week
29 week
30 week
31 week
32 week

H. Trend Analyses
117
6. Surgical ligation of PDA among all neonates a. 23-26 weeks’ GA:
b. 27-32 weeks’ GA:
0
5
10
15
20
25
30
2010 2011 2012 2013 2014 2015 2016 2017 2018
Surg
ical
liga
tion
of P
DA (%
)
Year
<=23 week
24 week
25 week
26 week
0
1
2
3
4
5
6
7
8
2010 2011 2012 2013 2014 2015 2016 2017 2018
Surg
ical
liga
tion
of P
DA (%
)
Year
27 week
28 week
29 week
30 week
31 week
32 week

H. Trend Analyses
118
7. Ventricular enlargement (VE): (moderate and severe VE only; among neonates who received ultrasound exams) a. 23-26 weeks’ GA:
b. 27-32 weeks’ GA:
5
10
15
20
25
30
35
40
2010 2011 2012 2013 2014 2015 2016 2017 2018
Vent
ricu
lar e
nlar
gem
ent (
%)
Year
<=23 week
24 week
25 week
26 week
0
1
2
3
4
5
6
7
8
9
10
2010 2011 2012 2013 2014 2015 2016 2017 2018
Vent
ricu
lar e
nlar
gem
ent (
%)
Year
27 week
28 week
29 week
30 week
31 week
32 week
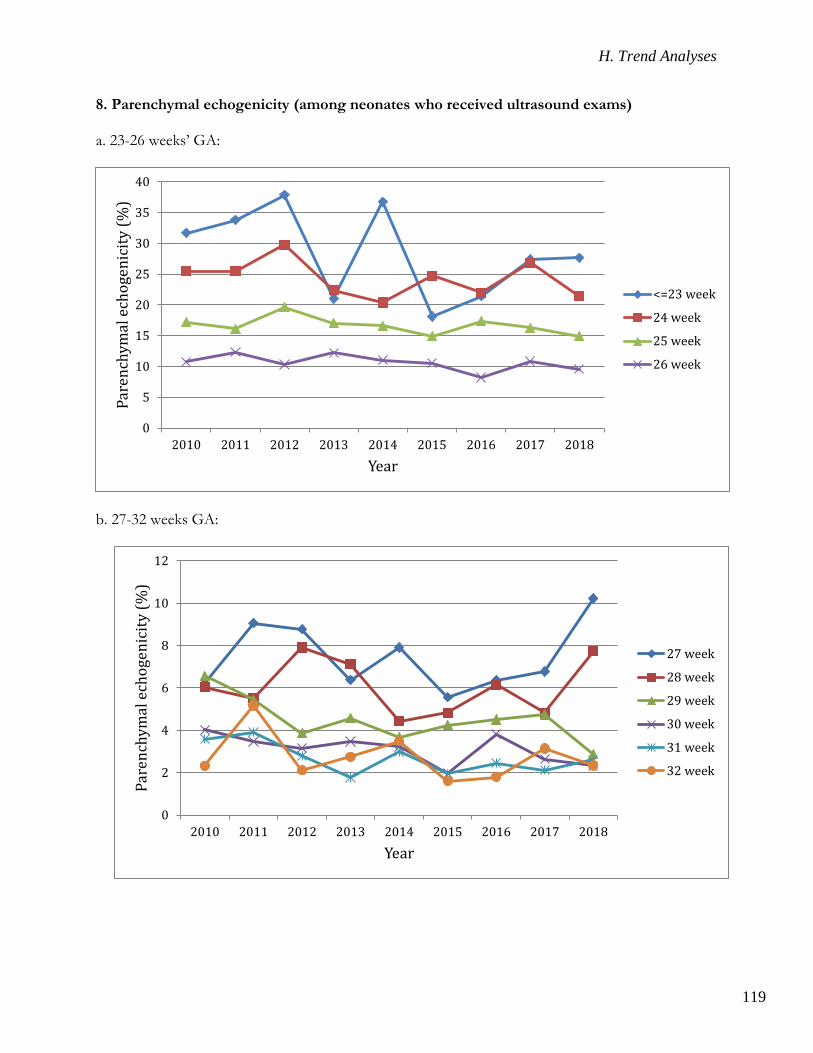
H. Trend Analyses
119
8. Parenchymal echogenicity (among neonates who received ultrasound exams) a. 23-26 weeks’ GA:
b. 27-32 weeks GA:
0
5
10
15
20
25
30
35
40
2010 2011 2012 2013 2014 2015 2016 2017 2018
Pare
nchy
mal
ech
ogen
icity
(%)
Year
<=23 week
24 week
25 week
26 week
0
2
4
6
8
10
12
2010 2011 2012 2013 2014 2015 2016 2017 2018
Pare
nchy
mal
ech
ogen
icity
(%)
Year
27 week
28 week
29 week
30 week
31 week
32 week

H. Trend Analyses
120
9. NEC:
a. 23-26 weeks’ GA:
b. 27-32 weeks’ GA:
6789
1011121314151617
1819
2010 2011 2012 2013 2014 2015 2016 2017 2018
NEC
(%)
Year
<=23 week
24 week
25 week
26 week
0
1
2
3
4
5
6
7
8
9
10
2010 2011 2012 2013 2014 2015 2016 2017 2018
NEC
(%)
Year
27 week
28 week
29 week
30 week
31 week
32 week

H. Trend Analyses
121
10. Severe ROP (> Stage 3 or ROP treatment) among neonates who received eye exams: a. 23-26 weeks’ GA:
b. 27-32 weeks’ GA:
0
10
20
30
40
50
60
70
2010 2011 2012 2013 2014 2015 2016 2017 2018
Seve
re R
OP (%
)
Year
<=23 week
24 week
25 week
26 week
0
1
2
3
4
5
6
7
8
9
2010 2011 2012 2013 2014 2015 2016 2017 2018
Seve
re R
OP (%
)
Year
27 week
28 week
29 week
30 week
31 week
32 week

H. Trend Analyses
122
11. Therapy for ROP (among neonates who received eye exams) a. 23-26 weeks’ GA :
b. 27-32 weeks’ GA:
0
5
10
15
20
25
30
35
40
45
50
55
60
2010 2011 2012 2013 2014 2015 2016 2017 2018
Ther
apy
for R
OP (%
)
Year
<=23 week
24 week
25 week
26 week
0.0
0.5
1.0
1.5
2.0
2.5
3.0
3.5
4.0
2010 2011 2012 2013 2014 2015 2016 2017 2018
Ther
apy
for R
OP (%
)
Year
27 week
28 week
29 week
30 week
31 week
32 week
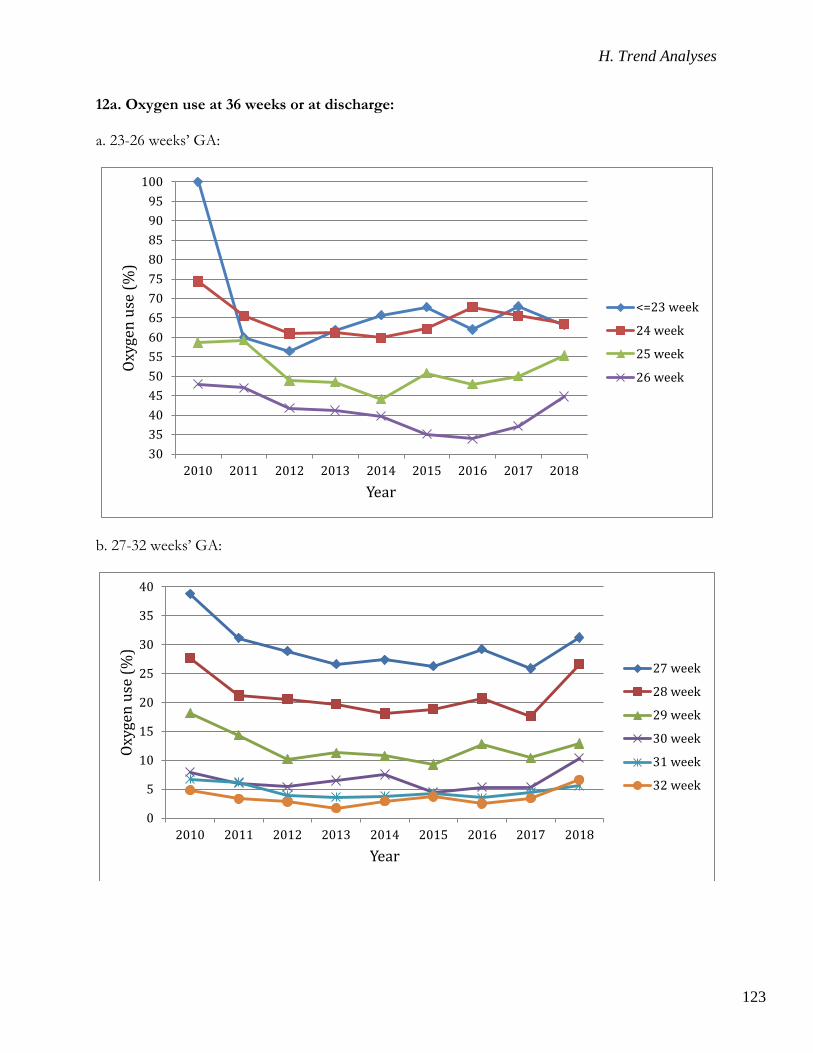
H. Trend Analyses
123
12a. Oxygen use at 36 weeks or at discharge: a. 23-26 weeks’ GA:
b. 27-32 weeks’ GA:
3035404550556065707580859095
100
2010 2011 2012 2013 2014 2015 2016 2017 2018
Oxyg
en u
se (%
)
Year
<=23 week
24 week
25 week
26 week
0
5
10
15
20
25
30
35
40
2010 2011 2012 2013 2014 2015 2016 2017 2018
Oxyg
en u
se (%
)
Year
27 week
28 week
29 week
30 week
31 week
32 week
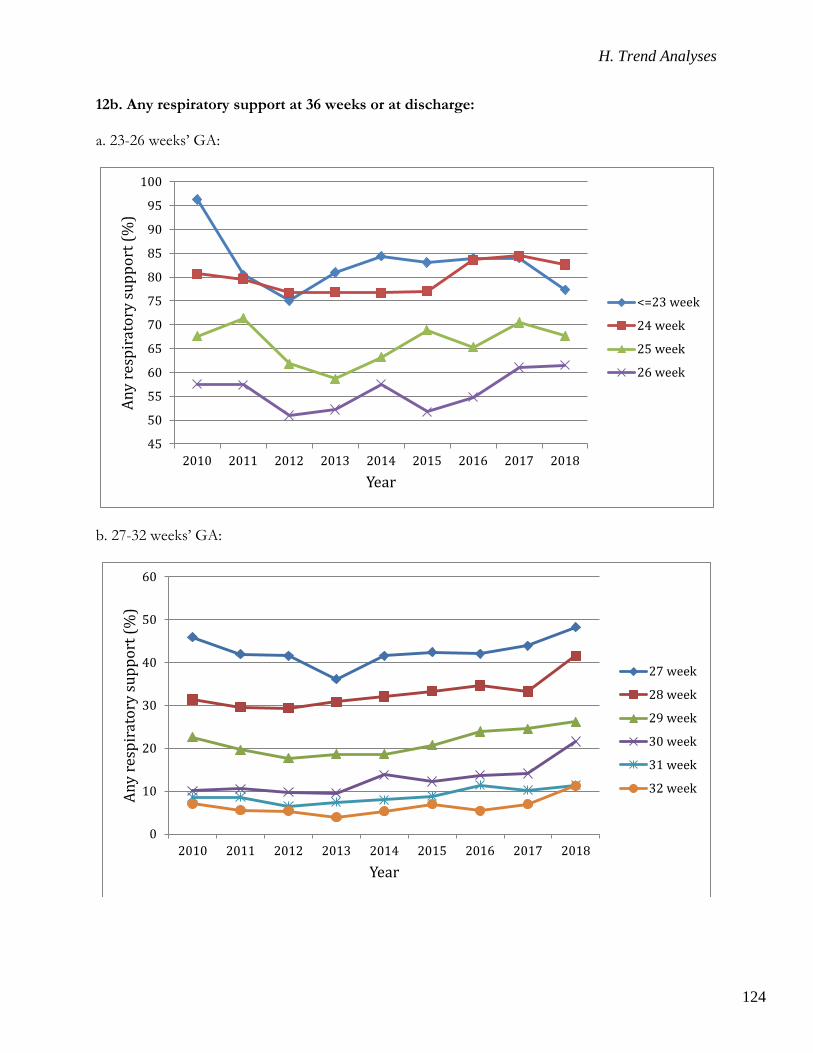
H. Trend Analyses
124
12b. Any respiratory support at 36 weeks or at discharge: a. 23-26 weeks’ GA:
b. 27-32 weeks’ GA:
45
50
55
60
65
70
75
80
85
90
95
100
2010 2011 2012 2013 2014 2015 2016 2017 2018
Any
resp
irat
ory
supp
ort (
%)
Year
<=23 week
24 week
25 week
26 week
0
10
20
30
40
50
60
2010 2011 2012 2013 2014 2015 2016 2017 2018
Any
resp
irat
ory
supp
ort (
%)
Year
27 week
28 week
29 week
30 week
31 week
32 week
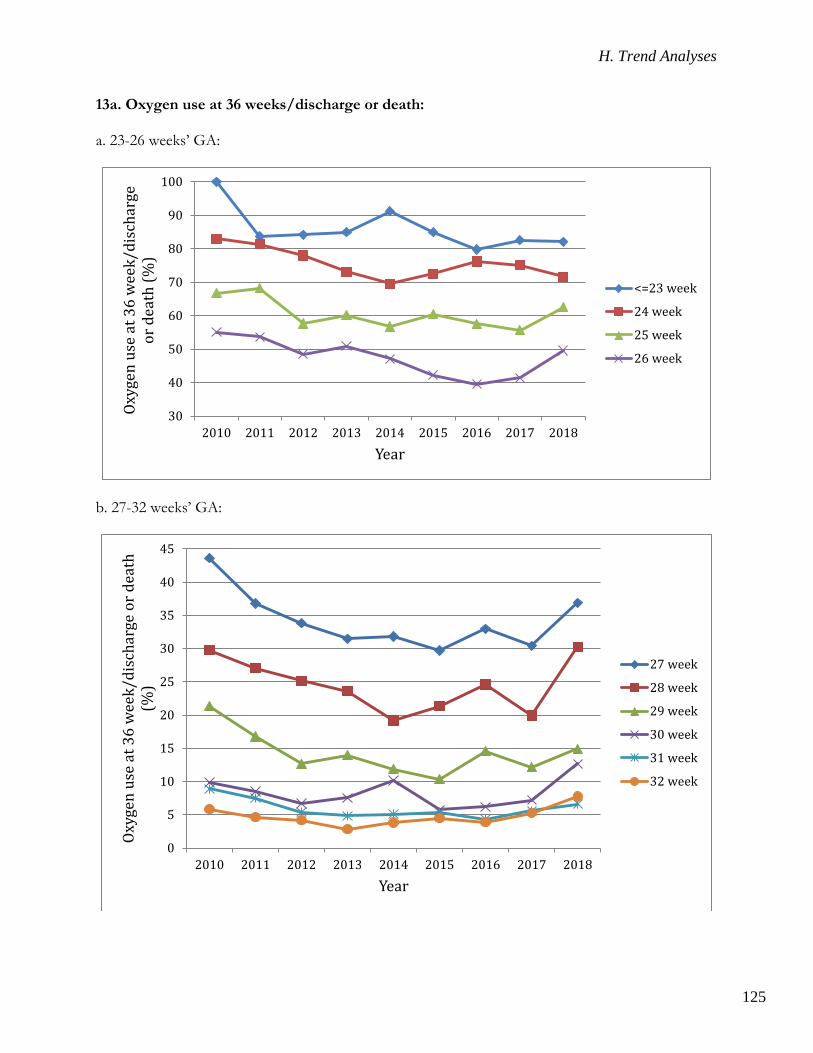
H. Trend Analyses
125
13a. Oxygen use at 36 weeks/discharge or death: a. 23-26 weeks’ GA:
b. 27-32 weeks’ GA:
30
40
50
60
70
80
90
100
2010 2011 2012 2013 2014 2015 2016 2017 2018
Oxyg
en u
se a
t 36
wee
k/di
scha
rge
or d
eath
(%)
Year
<=23 week
24 week
25 week
26 week
0
5
10
15
20
25
30
35
40
45
2010 2011 2012 2013 2014 2015 2016 2017 2018
Oxyg
en u
se a
t 36
wee
k/di
scha
rge
or d
eath
(%
)
Year
27 week
28 week
29 week
30 week
31 week
32 week
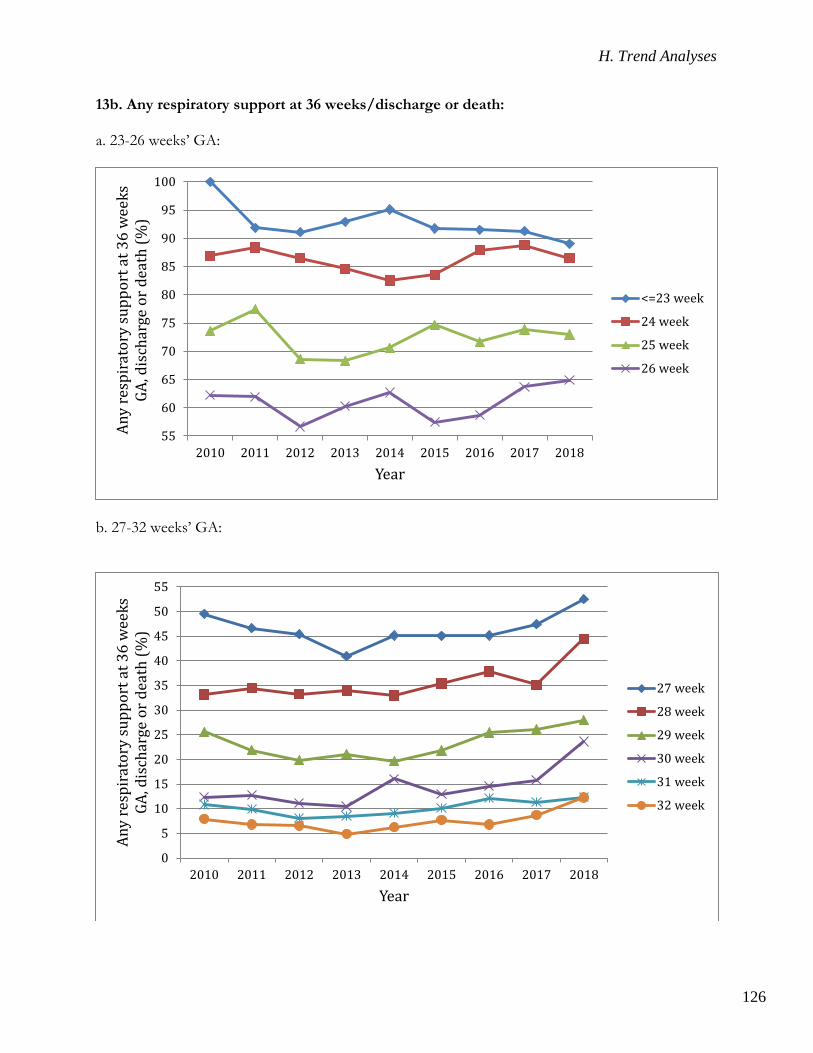
H. Trend Analyses
126
13b. Any respiratory support at 36 weeks/discharge or death: a. 23-26 weeks’ GA:
b. 27-32 weeks’ GA:
55
60
65
70
75
80
85
90
95
100
2010 2011 2012 2013 2014 2015 2016 2017 2018
Any
resp
irat
ory
supp
ort a
t 36
wee
ks
GA, d
isch
arge
or d
eath
(%)
Year
<=23 week
24 week
25 week
26 week
0
5
10
15
20
25
30
35
40
45
50
55
2010 2011 2012 2013 2014 2015 2016 2017 2018
Any
resp
irat
ory
supp
ort a
t 36
wee
ks
GA, d
isch
arge
or d
eath
(%)
Year
27 week
28 week
29 week
30 week
31 week
32 week
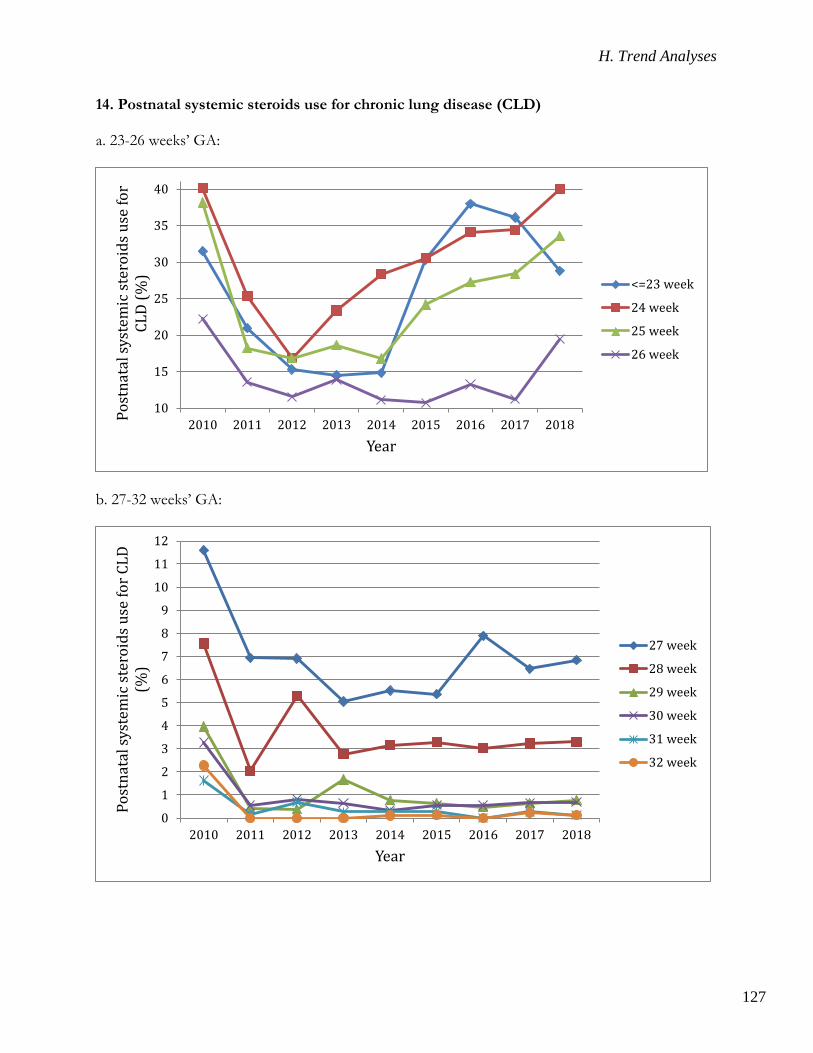
H. Trend Analyses
127
14. Postnatal systemic steroids use for chronic lung disease (CLD) a. 23-26 weeks’ GA:
b. 27-32 weeks’ GA:
10
15
20
25
30
35
40
2010 2011 2012 2013 2014 2015 2016 2017 2018Post
nata
l sys
tem
ic st
eroi
ds u
se fo
r CL
D (%
)
Year
<=23 week
24 week
25 week
26 week
0
1
2
3
4
5
6
7
8
9
10
11
12
2010 2011 2012 2013 2014 2015 2016 2017 2018
Post
nata
l sys
tem
ic st
eroi
ds u
se fo
r CLD
(%
)
Year
27 week
28 week
29 week
30 week
31 week
32 week

H. Trend Analyses
128
15. Mortality or major morbidity including CLD Major morbidity was counted as any one of the following:
1. CLD (any grade) 2. Severe ROP (stage 3,4,5 and/or those with ROP treatment) 3. Severe neurological injury (IVH grade 3 or grade 4 or PVL) 4. NEC (stage 2 or 3) 5. Late onset sepsis (any positive blood and/or cerebrospinal fluid culture after 2 days of age)
a. 23-26 weeks’ GA:
b. 27-32 weeks’ GA:
65
70
75
80
85
90
95
100
2010 2011 2012 2013 2014 2015 2016 2017 2018
Mor
talit
y or
maj
or m
orbi
dity
(%)
Year
<=23 week
24 week
25 week
26 week
0
10
20
30
40
50
60
70
2010 2011 2012 2013 2014 2015 2016 2017 2018
Mor
talit
y or
maj
or m
orbi
dity
(%)
Year
27 week
28 week
29 week
30 week
31 week
32 week

H. Trend Analyses
129
16. Mortality or major morbidity excluding CLD Major morbidity was counted as any one of the following:
1. Severe ROP (stage 3,4,5 and/or those with ROP treatment) 2. Severe neurological injury (IVH grade 3 or grade 4 or PVL) 3. NEC (stage 2 or 3) 4. Late onset sepsis (any positive blood and/or cerebrospinal fluid culture after 2 days
of age) a. 23-26 weeks’ GA:
b. 27-32 weeks’ GA:
30
40
50
60
70
80
90
100
2010 2011 2012 2013 2014 2015 2016 2017 2018
Mor
talit
y or
maj
or m
orbi
dity
w
ithou
t CLD
(%)
Year
<=23 week
24 week
25 week
26 week
0
5
10
15
20
25
30
35
40
45
2010 2011 2012 2013 2014 2015 2016 2017 2018
Mor
talit
y or
maj
or m
orbi
dity
w
ithou
t CLD
(%)
Year
27 week
28 week
29 week
30 week
31 week
32 week

I. Publications
130
I. 2018 CNN publications
Peer reviewed publications
1) Stockley EL, Ting JY, Kingdom J, McDonald SD, Barrett J, Synnes A, Monterrosa L, Shah
PS, Canadian Neonatal Network, Canadian Neonatal Follow-Up Network and Canadian Preterm Birth Network Investigators. Intrapartum Magnesium Sulphate is Associated with Neuroprotection in Growth Restricted Fetuses. Am J Obstet Gynecol. 2018 Dec;219(6):606.e1-606.e8.
2) Toye JM, Yang J, Sankaran K. Narcotics and sedatives use in the mechanical ventilation in preterm infants: predictors and outcome. J Neonatal Perinatal Med. 2018 Dec 31.
3) Leibel SL, Ye XY, Shah P, Shah V, Canadian Neonatal Network. Chronic lung disease in preterm infants receiving various modes of noninvasive ventilation at ≤30 weeks' postmenstrual age. J Matern Fetal Neonatal Med. 2018 Sep 26;1-7.
4) Darlow BA, Vento M, Beltempo M, Lehtonen L, Håkansson S, Reichman B, Helenius K, Sjörs G, Sigali E, Lee S, Noguchi A, Morisaki N, Kusuda S, Bassler D, San Feliciano L, Adams M, Isayama T, Shah PS, Lui K, on belalf of the International Network for Evaluating Outcomes (iNeo) of Neonates. Variations in Oxygen Saturation Targeting, and Retinopathy of Prematurity Screening and Treatment Criteria in Neonatal Intensive Care Units: An International Survey. Neonatology. 2018;114(4):323-331.
5) Shah V, Hodgson K, Seshia M, Dunn M, Schmölzer GM. Golden hour management practices for infants <32 weeks gestational age in Canada. Paediatr Child Health. 2018 Jul;23(4):e70-e76.
6) Esmaeilizand R, Shah PS, Seshia M, Yee W, Y oon EW, Dow K, Canadian Neonatal Network Investigators. Antibiotic exposure and development of necrotizing enterocolitis in very preterm neonates. Paediatr Child Health. 2018 Jul;23(4):e56-e61.
7) Bairam A, Laflamme N, Drolet C, Piedboeuf B, Shah PS, Kinkead R, Canadian Neonatal Network Investigators. Sex-based differences in apnoea of prematurity: A retrospective cohort study. Exp Physiol. 2018 Oct;103(10):1403-1411.
8) Ting JY, Synnes AR, Lee SK, Shah PS, Canadian Neonatal Network and Canadian Neonatal Follow-Up Network. Association of admission temperature and death or adverse neurodevelopmental outcomes in extremely low-gestational age neonates. J Perinatal. 2018 Jul;38(7):844-849.
9) Ting JY, Roberts A, Synnes A, Canning R, Bodani J, Monterossa L, Shah PS, Canadian Neonatal Network Investigators. Invasive Fungal Infections in Neonates in Canada: Epidemiology and Outcomes. Pediatr Infect Dis J. 2018 Nov;37(11):1154-1159.
10) Yusuf K, Alshaikh B, da Silva O, Lodha AK, Wilson RD, Alvaro RE, Lee SK, Shah PS; Canadian Neonatal Network Investigators. Neonatal outcomes of extremely preterm infants exposed to maternal hypertension and cigarette smoking. J Perinatol. 2018 Aug;38(8):1051-1059.
11) Haslam MD, Lisonkova S, Creighton D, Church P, Yang J, Shah PS, Joseph KS, Synnes A, Canadian Neonatal Network and Canadian Neonatal Follow-Up Network. Severe Neurodevelopmental Impairment in Neonates Born Preterm: Impact of Varying Definitions in a Canadian Cohort. J Pediatr. 2018 Jun;197:75-81.
I. Publications
131
12) Shah PS, McDonald SD, Barrett J, Synnes A, Robson K, Foster J, Pasquier JC, Joseph KS, Piedboeuf B, Lacaze-Masmonteil T, O'Brien K, Shivananda S, Chaillet N, Pechlivanoglou P; Canadian Preterm Birth Network Investigators. The Canadian Preterm Birth Network: a study protocol for improving outcomes for preterm infants and their families. CMAJ Open. 2018 Jan 18;6(1):E44-E49.
13) De Silva DA, Synnes AR, von Dadelszen P, Lee T, Bone JN; MAG-CP, CPN and CNN collaborative groups, Magee LA. MAGnesium sulphate for fetal neuroprotection to prevent Cerebral Palsy (MAG-CP)-implementation of a national guideline in Canada. Implement Sci. 2018 Jan 11;13(1):8.
14) Amer R, Moddemann D, Seshia M, Alvaro R, Synnes A, Lee KS, Lee SK, Shah PS; Canadian Neonatal Network and Canadian Neonatal Follow-up Network Investigators. Neurodevelopmental Outcomes of Infants Born at <29 Weeks of Gestation Admitted to Canadian Neonatal Intensive Care Units Based on Location of Birth. J Pediatr. 2018 May;196:31-37.
15) Sabri K, Woodward MA, Easterbrook B, Shivananda S; Canadian Neonatal Network. Retinopathy of prematurity practices: a national survey of Canadian Neonatal Intensive Care Units. J Perinatol. 2018 Apr;38(4):381-385.
16) Louis D, ElSayed YN, Ojah C, Alvaro R, Shah PS, Dunn M; Canadian Neonatal Network Investigators. Predictors of PDA Treatment in Preterm Neonates Who Had Received Prophylactic Indomethacin. Am J Perinatol. 2018 Apr;35(5):509-514.
17) Elboraee MS, Toye J, Ye XY, Shah PS, Aziz K, Canadian Neonatal Network Investigators. Association between Umbilical Catheters and Neonatal Outcomes in Extremely Preterm Infants. Am J Perinatol. 2018 Feb;35(3):233-241.
18) Stritzke A, Mohammad K, Shah PS, Ye XY, Bhandari V, Akierman A, Harrison A, Bertelle V, Lodha A. Use and timing of surfactant administration: impact on neonatal outcomes in extremely low gestational age infants born in Canadian Neonatal Intensive Care Units. J Matern Fetal Neonatal Med. 2018 Nov;31(21):2862-2869.
19) Kelly EN, Shah VS, Levenbach J, Vincer M, DaSilva O, Shah PS; Canadian Neonatal Network and Canadian Neonatal Follow-Up Network Investigators. Inhaled and systemic steroid exposure and neurodevelopmental outcome of preterm neonates. J Matern Fetal Neonatal Med. 2018 Oct;31(20):2665-2672.
20) Persson M, Shah PS, Rusconi F, Reichman B, Modi N, Kusuda S, Lehtonen L, Hakansson S, Yang J, Isayama T, Beltempo M, Lee SK, Norman M; for the International Network for Evaluating Outcomes of Neonates. Association of Maternal Diabetes With Neonatal Outcomes of Very Preterm and Very Low-Birth-Weight Infants: An International Cohort Study. JAMA Pediatrics. 2018 Sep 1;172(9):867-875.
21) Beltempo M, Isayama T, Vento M, Lui K, Kusuda S, Lehtonen L, Sjörs G, Håkansson S, Adams M, Noguchi A, Reichman B, Darlow BA, Morisaki N, Bassler D, Pratesi S, Lee SK, Lodha A, Modi N, Helenius K, Shah PS; on behalf of the International Network for Evaluating Outcomes of Neonates. Respiratory Management of Extremely Preterm Infants: An International Survey. Neonatology. 2018 April; 114(1): 28-36.
Abstracts
1) Shah V, Shah PS, Singhal N, Less is More Study Group. Variations in the Number of Blood
Tests in the First 14 Days in Infants <29 weeks' GA: A Case for Blood Testing Stewardship? E-PAS 2018:1500.820.

I. Publications
132
2) Lui K, Lee SK, Kusuda S, Adams M, Vento M, Reichman B, Darlow BA, Lehtonen L, Modi N, Modi N, Norman M, Håkansson S, Bassler D, Rusconi F, Lodha A, Shah PS. Trends in mortality and major morbidity of very preterm neonates in 10 national neonatal databases: A lesson from the International Network for Evaluation of Outcomes (iNeo) experience. E-PAS 2018:1503.850.
3) Beltempo M, Lee Sk, McMillan D, Seshia M, Singhal N, Dow K, Aziz K, Piedboeuf B, Shah PS, on behalf of the Canadian EPIQ study group. Outcomes and Care Practices of Preterm Infants in Canada: 12 Years of Quality Improvement. E-PAS 2018:1504.856.
4) Ting JY, Roberts AB, Sherlock R, Ojah C, Cieslak Z, Dunn M, Barrington KJ, Shah PS. Prolonged initial empirical antibiotic use and neonatal outcomes in very-low-birth-weight infants without culture-proven sepsis. E-PAS 2018:2660.1.
5) Zipursky AR, Yoon E, Emberley J, Bertelle V, Makary H, Kanungo J, Lee SK, Shah PS. Hospital Acquired Infections in Canadian Tertiary Care NICUs from 2010-2016: Surveillance of CLABSI and non-CLABSI. E-PAS 2018:2600.7.
6) Xu JH, Coo H, Fucile S, Ng E, Ting JY, Shah PS, Dow K. A national survey of enteral feeding practices in Canadian NICUs: Opportunities for improvement. E-PAS 2018:2785.2.
7) Shah PS, Kusuda S, Håkansson S, Reichman B, Lui K, Lehtonen L, Modi N, Vento M, Adams M, Rusconi F, Norman M, Darlow B, Lodha A, Yang J, Helenius K, Isayama T, Lee SK. Neonatal outcomes of VLBW/very preterm triplets compared to singletons: a matched cohort study. E-PAS 2018:2903.861.
8) Stockley EL, Ting JY, Kingdom J, McDonald S, Barrett J, Synnes A, Monterrosa L, Shah PS. Antenatal Magnesium Sulphate for Fetuses with IUGR: Neonatal and Neurodevelopmental Outcomes. E-PAS 2018:3335.6.
9) Persson M, Shah PS, Rusconi F, Reichman B, Modi N, Kusuda S, Lehtonen L, Håkansson S, Yang J, Isayama T, Beltempo M, Lee SK, Norman M. Neonatal outcomes of very preterm and VLBW neonates born to mothers with diabetes: an international cohort study. E-PAS 2018:3862.524.
10) Adams M, Bassler D, Lee SK, Lehtonen L, Kusuda S, Lui K, Gagliardi L, Håkansson, S, Vento M, Darlow B, Rusconi F, Isayama T, Modi N, Noguchi A, Helenius K, Norman M, Morisaki N, Reichman B, Lodha A, Shah PS. Variability in prophylactic approaches, risk factors, and rates of surgery for NEC among eight national neonatal networks. E-PAS 2018:3865.549.
11) Synnes A, Gillone J, Majnemer A, Lodha A, Creighton D, Moddemann D, Shah PS. Preterm children with suspected cerebral palsy at 19 months corrected age in the Canadian Neonatal Follow-Up Network. E-PAS 2018:3896.853.
12) Doucette SM, Kelly EN, Church PT, Lee SK, Shah VS. Utility of Inotropes in Preterm Infants <29 weeks GA and Neurodevelopmental Outcomes: A Retrospective Cohort Study. E-PAS 2018:3894.832.
13) O’Brien K, Synnes A, Petrie J, Grunau R, Mirea L, Ye X, Church P, Impact of Family Integrated Care (FICare) in the NICU on the behavioural outcome of infants born preterm. E-PAS 2018:3890.792.
14) Ting JY, Castaldo M, Lemyre B, Drolet C, Kalapesi Z, Dow K, Shah PS. Receipt of inotropes or hydrocortisone during neonatal period and outcomes in preterm small-for-gestational age infants. E-PAS 2018:4109.98.
15) Kharrat A, McNamara PJ, Weisz DE, Kelly EN, Masse E, Mukerji A, Louis D, Afifi J, Shah PS, Jain A. Clinical burden of postnatally acquired acute cardiopulmonary critical illness among preterm neonates of <32 weeks GA. E-PAS 2018:4130.292.

I. Publications
133
16) ElSayed E, Daspal S, Yee W, Pelausa E, Canning R, Shah PS, Yusuf K. Outcomes of singleton small for gestational age infants < 33 weeks gestation born to mothers with hypertensive disorders of pregnancy. E-PAS 2018:4137.361.
17) Shukla V, ElKhateeb O, Lee KS. Shah PS. Outcomes of Infants Born Less Than 26 Weeks Gestational Age After Extensive Resuscitation Versus Standard Delivery Room Care. E-PAS 2018:4113.133.
18) Keir A, Karam O, Hodyl N, Stark M, Shah PS, Stanworth S. Fluid bolus therapy in neonates: A multi-center, international cross-sectional study. E-PAS 2018:4140.384.
19) Abou Mehrem A, Singhal N, Shah PS, Shah V, Less is More study group. Diagnostic Imaging in the First 14 Days among Canadian Preterm Infants <29 Weeks’ Gestation: Is Variation Justified? E-PAS 2018:4141.396.
20) Chakkarapani AA, Whyte HE, Lee KS. Association between procedural interventions and stabilization times during inter-facility neonatal transport. E-PAS 2018:4141.399.
J. Appendices
134
J. Appendices
Outcomes Definitions
Mortality: Death prior to discharge from the NICU. Severe neurological injury: Intraventricular hemorrhage (IVH), ventricular enlargement or parenchymal echogenicity or periventricular leukomalacia (PVL): Defined as grade 3 IVH (intraventricular hemorrhage with ventricular enlargement) or grade 4 IVH (intraventricular hemorrhage and persistent parenchymal echogenicity) or persistent parenchymal echogenicity. Ventricular enlargement - None: Measurement of ventricles was <7 mm at any level section of lateral ventricle. - Mild: Measurement was 7 to 10 mm at any level of the larger lateral ventricle. Classify as “mild”
if there was no mention of “ventricular enlargement”, “ventriculomegaly” or “hydrocephalus”, or if the most severe report was of “mild ventriculomegaly” or “mild ventricular enlargement”, or if described as “suspected”
- Moderate: Measurement was 11 to 15 mm at any level of the larger lateral ventricle on sagittal scan. Classify as “moderate” if the terms “grade III IVH”, “ventricular enlargement”, “ventriculomegaly” or “hydrocephalus” were used with “moderate”, or without descriptors.
- Severe: Measurement was >15 mm at any level of the larger lateral ventricle on a sagittal scan, or ventricular drainage/shunting was required. If no measurement was made, classify as “severe” if the terms “severe” or “significant” were used to describe “grade III IVH”, “ventricular enlargement”, “ventriculomegaly” or “hydrocephalus”.
- Not measured - Unknown Severe retinopathy of prematurity (ROP): Stage 3, 4 or 5 ROP as defined by the International Classification of Retinopathy of Prematurity1 and/or those infants requiring treatment (laser or intraocular injection). ROP was scored as the highest stage in either eye identified at any time. Necrotizing enterocolitis (NEC): Stage 2 or 3 NEC according to Bell’s classification2, diagnosed by clinical and imaging findings. Sepsis: Isolation of bacterial, fungal or viral organism from blood or cerebrospinal fluid in a symptomatic infant.
1 An International Committee for the Classification of Retinopathy of Prematurity. The International Classificaiton of Retinopathy of Prematurity Revisited. Arch Ophthalmol 2005;123:991-999 2 Bell MJ, Ternberg JL, Feigin RD, et al. Neonatal necrotizing enterocolitis. Therapeutic decisions based upon clinical staging. Ann Surg 1978;187:1–7

J. Appendices
135
Chronic lung disease (CLD): Defined as respiratory support given at 36 weeks’ post menstrual age or at discharge (if earlier than 36 weeks’ PMA) to level 2 centers and was classified in different degrees of severity described as follows: Chronic lung disease (CLD) continued: Severity Respiratory support at time of classification
(at 36 weeks’ PMA or at discharge if baby was discharged prior to 36 weeks’ PMA)
Oxygen Flow rate
No CLD None 21% None Mild CLD Headbox or incubator >21% Any amount
Nasal cannula 100% <0.1L/min Nasal cannula blended air/oxygen 21-99% <1.5L/min
Moderate CLD Nasal cannula 100% >100cc/min Nasal cannula blended air/oxygen 21-29% >1.5L/min CPAP, SIPAP, NIPPV, NIHFV 21-29%
Severe CLD Nasal cannula blended oxygen >30% >1.5L/min CPAP, SIPAP, NIPPV, NIHFV >30% Mechanical ventilation (intubated) 21-100%
Survival without major morbidities: Defined as survival at discharge from the NICU without having any of CLD, NEC stage 2 or 3, IVH grade 3 or 4 or PVL, sepsis, or ROP stage 3, 4, 5, or ROP treatment.
Variables Definitions Definitions of CNN variables can be found in the CNN abstractors’ manual. The manual can be accessed on the CNN website (www.canadianneonatalnetwork.org/portal) via the following link: http://www.canadianneonatalnetwork.org/Portal/LinkClick.aspx?fileticket=krvGeUTtLck%3d&t
abid=69
Major Anomalies A list of major anomalies can be found in the 2013 annual report, pages 124-127.
It is available via the following link: http://www.canadianneonatalnetwork.org/Portal/LinkClick.aspx?fileticket=lreR0871sjA%3d&tabid=39

J. Appendices
136
Abbreviations
ANCS Antenatal Corticosteroids
BW Birth Weight
BPD Bronchopulmonary dysplasia
CONS Coagulase-Negative Staphylococcus
CPAP Continuous Positive Airway Pressure
CLABSI Central Line-Associated Bloodstream Infection
CLD Chronic Lung Disease
CVL Central Venous Line
DR Delivery Room
EPIQ Evidence-based Practice for Improving Quality
ETT Endotracheal Tube
GA Gestational Age
GBS Group B Streptococcus
GM Germinal Matrix
HFV High Frequency Ventilation
HIE Hypoxic Ischemic Encephalopathy
ICROP International Classification of Retinopathy of Prematurity
IPPV Intermittent Positive Pressure Ventilation
IVH Intra-Ventricular Hemorrhage
NEC Necrotizing Enterocolitis
NI Nosocomial Infection
NICE Neonatal-Perinatal Interdisciplinary Capacity Enhancement
NICU Neonatal Intensive Care Units
NTISS Neonatal Therapeutic Intervention Scoring System
PDA Patent Ductus Arteriosus
PEC Parenchymal Echogenicity
PICC Peripherally Inserted Central Catheters
PIV Peripheral Intravenous
PMA Postmenstrual Age
PPV Positive Pressure Ventilation

J. Appendices
137
PVL Periventricular Leukomalacia
RDS Respiratory Distress Syndrome
ROP Retinopathy of Prematurity
SD Standard Deviation
SEM Standard Error of Mean
SGA Small for Gestational Age
SNAP Score for Acute Neonatal Physiology
SNAP-IIPE Score for Acute Neonatal Physiology Version II, Perinatal Extension
SR Standardized Ratio
TPN Total Parenteral Nutrition
TRIPS Transport Risk Index of Physiologic Stability
UV Umbilical Vein
VE Ventricular Enlargement
VEGF Vascular Endothelial Growth Factor
VLBW Very Low Birth Weight
VP Ventriculoperitoneal

138
© Canadian Neonatal Network™ 2019
All rights reserved. No part of this publication may be reused, republished, stored in a retrieval
system or transmitted in any form or by any means-electronic, mechanical, photocopying, recordings or otherwise-without prior consent of the publisher.
Canadian Neonatal Network™, Maternal-Infant Care Research Centre
700 University Avenue, Suite 8-500, Toronto ON M5G 1X6


![Safety Data Sheet - Hewlett PackardN9J89Series[C][3]-SDS_CANADA-Canadian French-67.pdf N9J89Series[M][3]-SDS_CANADA-Canadian French-68.pdf N9J89Series[Y][3]-SDS_CANADA-Canadian French](https://static.fdocuments.fr/doc/165x107/60ac2f819fece4160408cfac/safety-data-sheet-hewlett-packard-n9j89seriesc3-sdscanada-canadian-french-67pdf.jpg)