Techno-economic analysis for the production of LaNi particles
15
Communications in Science and Technology 5(2) (2020) 70–84 COMMUNICATIONS IN SCIENCE AND TECHNOLOGY Homepage: cst.kipmi.or.id © 2020 KIPMI Techno-economic analysis for the production of LaNi 5 particles Asep Bayu Dani Nandiyanto a,* , Muhammad Irfansyah Maulana a , Jarot Raharjo b , Yayan Sunarya a , Asnul Dahar Minghat c a Department of Chemistry, Universitas Pendidikan Indonesia, Bandung 40154, Indonesia b Center for Materials Technology, Agency for the Assessment and Application of Technology, Tangerang Selatan 15314, Indonesia c Razak Faculty of Technology and Informatics, Universiti Teknologi Malaysia, Kuala Lumpur 54100, Malaysia Article history: Received: 6 August 2020 / Received in revised form: 2 November 2020 / Accepted: 25 November 2020 Abstract LaNi5 is widely used in various applications. Many methods to produce LaNi5 particles have been reported but information for the large-scale production, so far, is less available. This study aimed to evaluate the project for the production of LaNi5 particles using combustion-reduction (CR) and co-precipitation-reduction (CPR) methods based on engineering and economic perspective. Engineering evaluation was conducted by evaluating the CR and CPR processes from stoichiometry. For the economic evaluation, several economic parameters were calculated in the ideal condition including gross profit margin (GPM), payback period (PBP), break-even point (BEP), cumulative net present value (CNPV), profitability index (PI), internal rate return (IRR), and return on investment (ROI). For the worst cases in the project, it was done by calculating both the internal problems (i.e., raw materials, sales, utility, labor, employee, fixed cost, variable cost, and production capacity) and the external issues (i.e., taxes and subsidiaries). The engineering analysis provided the information that CR and CPR projects are prospective for being able to be done using commercial apparatuses. The economic analysis from GPM, PBP, BEP, CNPV, and PI showed the positive results, while IRR and ROI showed the negative ones, indicating that the projects are acceptable for large-scale production, but it seems to be less attractive for industrial investors. The analysis also confirmed that the CR process was more prospective than the CPR process. This work has demonstrated the important of the projects for further developments. Keywords: Techno-economic analysis; feasibility study; large-scale production; LaNi5 1. Introduction Lanthanum nickel (such as LaNi5) materials are the attractive materials due to their wide applications, such as in hydrogen storage applications, catalysts in the synthesis process of materials (methane and carbon nanotubes), hydrogen purification, accumulation of heat and heat pump, refrigeration, actuator, and compressor[1]. Table 1 presents the summary of current reports to synthesize LaNi5 materials. Many methods are available, and combustion-reduction (CR) and co-precipitation-reduction (CPR) methods have been found at the best. The methods allow the product with high purity, smaller sizes, excellent performance (i.e. faster kinetics, higher capacities, long-term cycling stability), less usage of raw materials, as well as the lower temperature process compared to other methods[2]. However, the methods are reported in the lab-scale work only. Since no information is available for the large-scale production, the work aimed to realize the mass production that can be used for commercialization. Hence, it will be interested for supporting industrial practitioners, especially in the optimization of the process [3]. To estimate the feasibility of large-scale production of materials, techno-economic analysis (TEA) was used. Many works regarding TEA [4-11] have been reported (Table 2), showing the important role of TEA in estimating the feasibility of the production of materials in large scale. However, reports regarding TEA - especially for the production of materials for hydrogen generation and storage applications such as DeSantis et al. [4]) - are limited so far. The reports also have limitations in the complete economic parameters without providing a report of several cases that can significantly affect the project from the economical perspectives. In fact, information for large-scale production from whole perspective and parameters is important. The purpose of this study was to report TEA for the production of LaNi5 particles. In this study, we calculated the LaNi5 production with the production capacity of 2.9 ton/year in ideal condition. The main reasons of the TEA for the production of LaNi5 are: (1) Lanthanum-typed materials are very suitable to be developed in Indonesia. Lanthanum is one of the most common rare earth elements in Indonesia. This metal has been exploited since the last 20 years with a refined tin production capacity of 30,000 tons/year[12]. This material reserves in Indonesia more than 951,000 tons[13]. (2) The use of rare earth elements in Indonesia has not been * Corresponding author. Tel.: +62 22 200 0579 Email: [email protected]
Transcript of Techno-economic analysis for the production of LaNi particles

Communications in Science and Technology 5(2) (2020) 70–84
COMMUNICATIONS IN
SCIENCE AND TECHNOLOGY Homepage: cst.kipmi.or.id
© 2020 KIPMI
Techno-economic analysis for the production of LaNi5 particles
Asep Bayu Dani Nandiyantoa,*, Muhammad Irfansyah Maulanaa, Jarot Raharjob, Yayan Sunaryaa,
Asnul Dahar Minghatc
aDepartment of Chemistry, Universitas Pendidikan Indonesia, Bandung 40154, Indonesia bCenter for Materials Technology, Agency for the Assessment and Application of Technology, Tangerang Selatan 15314, Indonesia
cRazak Faculty of Technology and Informatics, Universiti Teknologi Malaysia, Kuala Lumpur 54100, Malaysia
Article history: Received: 6 August 2020 / Received in revised form: 2 November 2020 / Accepted: 25 November 2020
Abstract
LaNi5 is widely used in various applications. Many methods to produce LaNi5 particles have been reported but information for the large-scale production, so far, is less available. This study aimed to evaluate the project for the production of LaNi5 particles using combustion-reduction (CR) and co-precipitation-reduction (CPR) methods based on engineering and economic perspective. Engineering evaluation was conducted by evaluating the CR and CPR processes from stoichiometry. For the economic evaluation, several economic parameters were calculated in the ideal condition including gross profit margin (GPM), payback period (PBP), break-even point (BEP), cumulative net present value (CNPV), profitability index (PI), internal rate return (IRR), and return on investment (ROI). For the worst cases in the project, it was done by calculating both the internal problems (i.e., raw materials, sales, utility, labor, employee, fixed cost, variable cost, and production capacity) and the external issues (i.e., taxes and subsidiaries). The engineering analysis provided the information that CR and CPR projects are prospective for being able to be done using commercial apparatuses. The economic analysis from GPM, PBP, BEP, CNPV, and PI showed the positive results, while IRR and ROI showed the negative ones, indicating that the projects are acceptable for large-scale production, but it seems to be less attractive for industrial investors. The analysis also confirmed that the CR process was more prospective than the CPR process. This work has demonstrated the important of the projects for further developments.
Keywords: Techno-economic analysis; feasibility study; large-scale production; LaNi5
1. Introduction
Lanthanum nickel (such as LaNi5) materials are the
attractive materials due to their wide applications, such as in
hydrogen storage applications, catalysts in the synthesis
process of materials (methane and carbon nanotubes),
hydrogen purification, accumulation of heat and heat pump,
refrigeration, actuator, and compressor[1].
Table 1 presents the summary of current reports to
synthesize LaNi5 materials. Many methods are available, and
combustion-reduction (CR) and co-precipitation-reduction
(CPR) methods have been found at the best. The methods
allow the product with high purity, smaller sizes, excellent
performance (i.e. faster kinetics, higher capacities, long-term
cycling stability), less usage of raw materials, as well as the
lower temperature process compared to other methods[2].
However, the methods are reported in the lab-scale work only.
Since no information is available for the large-scale
production, the work aimed to realize the mass production that
can be used for commercialization. Hence, it will be interested
for supporting industrial practitioners, especially in the
optimization of the process [3].
To estimate the feasibility of large-scale production of
materials, techno-economic analysis (TEA) was used. Many
works regarding TEA [4-11] have been reported (Table 2),
showing the important role of TEA in estimating the
feasibility of the production of materials in large scale.
However, reports regarding TEA - especially for the
production of materials for hydrogen generation and storage
applications such as DeSantis et al. [4]) - are limited so far.
The reports also have limitations in the complete economic
parameters without providing a report of several cases that can
significantly affect the project from the economical
perspectives. In fact, information for large-scale production
from whole perspective and parameters is important.
The purpose of this study was to report TEA for the
production of LaNi5 particles. In this study, we calculated the
LaNi5 production with the production capacity of 2.9 ton/year
in ideal condition. The main reasons of the TEA for the
production of LaNi5 are:
(1) Lanthanum-typed materials are very suitable to be
developed in Indonesia. Lanthanum is one of the most
common rare earth elements in Indonesia. This metal has been
exploited since the last 20 years with a refined tin production
capacity of 30,000 tons/year[12]. This material reserves in
Indonesia more than 951,000 tons[13].
(2) The use of rare earth elements in Indonesia has not been * Corresponding author. Tel.: +62 22 200 0579
Email: [email protected]

Nandiyanto et al. / Communications in Science and Technology 5(2) (2020) 70–84 71
optimally utilized, while the use of lanthanum in the electric
vehicle industry is recently increasing. Lanthanum is one of
the less expensive alternative materials for neodymium[14].
(3) Intermetallic LaNi5-based materials are the most rugged
materials and mainly used as the negative electrode in nickel-
metal hydride (NiMH) batteries, which are produced and sold
in more than 5 billion batteries per year.
Table 1. Current reports on the LaNi5 synthesis methods
Product size
(μm) Raw materials Method Synthesis condition Reference
10–20 La, Ni High temperature melting – [17]
20–100 Commercial LaNi5 Mechanical milling – [18]
40 La(NO3)3, Ni(NO3)2 Combustion-solid reduction 600°C [19]
30 La2O3, Ni Solid reduction 1500°C, 1 MPa [20]
0.20 LaCl3, NiCl2 Co-precipitation-reduction 1000°C [21]
0.17 La(NO3)3, Ni(NO3)2 Combustion-reduction 600°C [2]
0.25 LaCl3, NiCl2 Co-precipitation-reduction 600°C [2]
Table 2. Current reports on the techno-economic analysis in the production of materials
Topic materials Product Main analysis Reference
Metal-organic
frameworks
50-2,500 tons/year
via solvothermal
method
Evaluating the cost impact of reducing solvent
usage
Identifying additional opportunities for achieving
the expected production costs
[3]
Ammonia borane 4,795.4 kg/year via
sol-gel method
Optimizing the condition of process in the
production of materials economically
Predicting the production capacity with its
manufacturing cost
[4]
Lipase enzyme 365-3,650 kg/year
via solid-state
fermentation method
Proposing the best conditions and designed
equipment to produce the materials
Evaluating the economic parameters
[5]
Chitosan 12,152 tons/year via
deacetylation method
Evaluating the economic parameters
Evaluating the effect of changing raw materials
costs
[6]
Lactic acid 100,000 tons/year via
fermentation method
Evaluating and improving the feasibility of the
production
Estimating the production capacity and costs with
different fermentation pathways
[7]
Activated carbon and
silica
168-538 kg/year via
burning and
extraction method
Evaluating the economic parameters
Analyzing the project from economics perspective
in the ideal condition
Performing the economics condition of the project
in the circumstances that is out of the ideal
condition in several cases
[8]
Titanium dioxide 12 tons/year via
liquid-phases
synthesis method
Evaluating the economic parameters
Analyzing the project from economics perspective
in the ideal condition
Performing the economics condition of the project
in the circumstances that is out of the ideal
condition in several cases
[9]
Silica 135-360 tons/year via
burning and
extraction method
Evaluating the economic parameters
Analyzing the project from economics perspective
in the ideal condition
Performing the economics condition of the project
in the circumstances that is out of the ideal
condition in several cases
[10]

72 Nandiyanto et al. / Communications in Science and Technology 5(2) (2020) 70–84
(4) The use of LaNi5 materials is effective for catalysts in the
synthesis process of materials (methane and carbon
nanotubes). LaNi5 also has good applications for hydrogen
purification, accumulation of heat and heat pump,
refrigeration, actuator, and compressor[1].
(3) LaNi5 materials are easily converted into other materials
such as metal oxide (La2O3, NiO) and perovskite (LaNiO3)
through thermal decomposition. In addition, these materials
can be converted into pure lanthanum and nickel through
further process. Thus, the application of LaNi5 can be used for
further applications[15,16].
The above reasons make lanthanum to be one of the
popular artists in the world[17], while the information for
scaling-up production is still limited. The information on TEA
of LaNi5 will bring positive impacts on the understanding for
the production of LaNi5 particles. The production relates to
the usage of large amount of lanthanum, and the main idea of
this TEA is to find the best and optimum condition in the
production, which can minimize the use of raw materials.
Thus, this work compared two types of synthesis methods: CR
and CPR methods and reported an engineering process design
and economic evaluation in the large-scale production of
LaNi5 particles via both methods.
To support the analysis, this study used several economic
parameters (i.e., gross profit margin (GPM), payback period
(PBP), break-even point (BEP), cumulative net present value
(CNPV), profitability index (PI), internal rate return (IRR),
and return on investment (ROI)) in the ideal condition and the
worst cases of the project. The worst cases were applied to the
calculation based on internal problems (i.e., raw materials,
sales, utility, labor, employee, fixed cost, variable cost, and
production capacity) and external issues (i.e., taxes and
subsidiaries). These analyses are essential to obtain
information regarding the profitability of the process [18].
2. Materials and Methods
2.1. Theoretical Synthesis of LaNi5 Materials
The LaNi5 materials was produced by adopting CR and
CPR as suggested by Liu and Aguey-Zinsou[2].
In the CR typical synthesis, lanthanum (III) and nickel (II)
nitrate hexahydrate were mixed with glycine in a mole ratio of
1:5:7.2 and dissolved in distilled water under stirring for 1 h.
The solution was evaporated at 100°C for 4 h. The
combustion was ignited by increasing the temperature to
500°C and hold for 2 h. The heating process is important to
remove water and convert some organic components [19].
Prior the reduction step, the obtained black powder was firstly
mixed with CaH2 and LiCl in a mass ratio of 1:2:0.9 and
heated at 600°C. At this temperature, the powder was kept for
5 h and reduced under a H2 flow. At the end process,
byproduct materials were removed by suspending the
resulting powder in an absolute ethanol saturated with
ammonia chloride to obtain pure LaNi5. The suspension was
stirred for 6 h, separated by centrifugation, washed with
absolute ethanol and dried overnight.
In the CPR method, lanthanum (III) and nickel (II) chloride
hexahydrate in a mole ratio of 1:5 were dissolved in a mixture
of distilled water:acetone (volume = 2:1) under stirring for 1
h. Then, Na2CO3 was added dropwise into previous mixture
until reaching pH = 10. It was continued by slowly adding
NaOH solution until reaching pH = 12. Adding Na2CO3 and
NaOH led to gradually form the precipitate. The
solution/precipitate mixture was allowed to age at 40°C
overnight. In this method, the reduction was carried out in two
steps. In the first step, the precipitate was heated at a room
temperature of 750°C and reduced for 5 h under a H2 flow to
obtain the intermediate. The obtained material was again
reduced with CaH2 as followed by the previous procedure, in
the CR method, including the separating and washing steps.
2.2. Energy and mass balance
To design an engineering process and calculate mass
balance easier for producing LaNi5 on a large scale, the
following assumptions were used in a stoichiometric manner
in the calculation in both methods[20,21]:
(i) The cost of all apparatuses was based on commercially
available online market;
(ii) The compositions of the reactants, lanthanum: nickel
nitrate/chloride were 1:5 mole ratio;
(iii) All reactants were consumed perfectly. There were no
byproducts produced and reactants remained;
(iv) The reduced mass (as mass losses) of the materials was
5% in each process;
(v) The temperatures in each process were based on
reference [2];
(vi) The conversion rate of LaNi5 production was 80%;
(vii) The final products were LaNi5 materials only;
(viii) In one-day process, the total processing cycle was 1
cycle as well as 5 cycles/week.
Based on the energy and mass balance, in the baseline
of 100%, all methods produced 12.08 kg of LaNi5 in one
cycle. Under an ideal condition, the project could be scaled
up to 240 cycles in a year. As a result, the production
capacity of the project is 2,899.20 kg/year or 2.90 ton/year.
2.3. Economic evaluation
To estimate economic evaluation parameters including
GPM, PBP, BEP, BEC, IRR, CNPV, ROI, and PI, the data
(price and specification) for the use of equipment, raw
materials, and utility costs in the project were used as per
obtained from available online shopping websites. The
following economic evaluation parameters were calculated
through simple mathematical equations based on references
[9,11,27].
(i) GPM (IDR/pack) was calculated by reducing sales and
raw material costs.
(ii) PBP (year) was life time point (y axis) when CNPV/TIC
(x axis) equaled to zero.
(iii) BEP (pack) was calculated by dividing fixed costs
against sales with variable costs difference.
(iv) BEC (%) was calculated by dividing BEP with
production capacity over a period of time.
(v) IRR (%) was calculated through Equation (1) as follow:

Nandiyanto et al. / Communications in Science and Technology 5(2) (2020) 70–84 73
(1)
where:
Ct = net cash inflow during the period of t
r = discount rate
t = number of time periods
C0 = total initial investment cost
(vi) CNPV (%) was obtained from NPV at specific time. In
short, it was by adding up NPV from the initial
establishment of a project. NPV could be obtained by
multiplying cash flow with discount factor.
(vii) ROI (%) was calculated by dividing gained total profits
with investment costs.
(viii) PI (%) was calculated by dividing sales and
manufacturing costs difference with sales (profit-to-
sales) or investment (profit-to-TIC).
The following assumptions were needed to determine the
parameter values in the ideal condition:
(i) The calculation used fixed currency on the conversion of
1 USD = 15,000 IDR;
(ii) For CR method, the prices of La(NO3)3.6H2O,
Ni(NO3)2.6H2O, glycine, calcium hydride, and lithium
chloride per kg were 450,000; 570,000; 502,500;
1,102,500; and 180,000 IDR; respectively. The prices of
distilled water, ethanol (96%), ammonium chloride, and
hydrogen gas per liter were 5,400; 60,000; 15,000; and
189,900 IDR; respectively;
(iii) For CPR method, the prices of LaCl3.6H2O,
NiCl2.6H2O, sodium carbonate, sodium hydroxide,
calcium hydride, and lithium chloride per kg were
630,000; 489,000; 3,750; 19,350; 1,102,500; and
180,000 IDR; respectively. The prices of distilled water,
acetone, ethanol (96%), ammonium chloride, and
hydrogen gas per liter were 5,400; 100,000; 60,000;
15,000; and 189,900 IDR; respectively;
(iv) Labor wages were 48,000,000 IDR per employee per
year;
(v) Total number of employees working for the project were
20 people;
(vi) The project has been being operated for 20 years;
(vii) Utility costs that must be paid per year are 607,007,617
and 692,327,617 IDR for CR and CPR methods,
respectively;
(viii) One product containing LaNi5 materials was packed in
50 grams and the price was 2,250,000 IDR per pack;
(ix) The discount rate was 15%;
(x) The income tax was 10%;
(xi) Total investment cost (TIC) was calculated based on the
Lang Factor[27];
(xii) Direct-type depreciation was used to calculate
depreciation.
2.4. Parameters in the economic evaluation
To ensure the feasibility of the projects, the economic
condition was changed from an ideal condition to the worst
cases. Several cases were applied to the calculation by
manipulating some internal problems such as raw materials,
sales, utility, labor, variable cost, fixed cost, and production
capacity, as well as external issues such as taxes and
subsidiaries. The manipulated internal and external issues
were investigated and used as the basic points:
(i) Raw materials, sales, utility, and labor were varied from
-100% up to 300%.
(ii) Fixed cost was varied from 50% up to 200%.
(iii) Variable cost was varied from 50% up to 150%.
(iv) Number of employee was varied from 100% up to
200%.
(v) Production capacity was varied from 85% up to 100%.
(vi) Taxes and subsidiaries was varied from -50% up to 90%.
3. Results and Discussion
3.1. Engineering Perspective
Fig.1 shows the engineering process design in the large-
scale production of LaNi5 materials via CR and CPR methods.
All precursors in both methods were easily dissolved in
distilled water due to their chemical properties as nitrate and
chloride salts. The project for CR method needed a fuel, i.e.
glycine, to ignite the combustion occurred in the process when
the temperature raised to 600°C in the calciner. On the other
hand, CPR needed precipitating agents, i.e. Na2CO3 and
NaOH, to yield a precipitate in the reactor. The fuel and
precipitating agents were added in the reactor.
Referring to the type of the reactor needed, the reaction in
both methods worked in a 1.00 m3 semi batch-type reactor
with featuring of an aluminum silicate insulator and propeller
top centre-entry agitator system. This system was used for the
mixing process to create restrictive conditions in which the
solution was homogenous. The semi batch-type of reactor
supported the reactants to first add to form a precursor solution
before being added continuously precipitating agents during
operation. This operating model was used desirably to
maintain a low concentration of one reactant (the injected
reactant)[28] and to prevent the formation of byproducts[20].
Furthermore, the reactor increased the selectivity of the desired
product and supplied or removed heat by injecting an inert
species.
In the separator, the materials were separated using a fluid-
solid separation operation by the centrifugation method. The
centrifugation was very effective in increasing sedimentation
rates, particularly for the very small particles (<10 mm) in
which the liquid was very viscous and the differences in
density between particles and liquids were very small[29]. The
materials were fed into the drum through the feeding pipe on
the hermetic closure casing and rotated by a centrifuge device.
Then, the solid phase was stopped at the filter layer.
Meanwhile, the undesired liquid phase was removed under the
action of the centrifuge force field and passed through the filter
media to discharge out of the machine. This separator featured
with an ethanol washing system so the solid phase was
maintained in the drum and washed with ethanol. The solid
could be pushed into pipes to be distributed in the next process.

74 Nandiyanto et al. / Communications in Science and Technology 5(2) (2020) 70–84
Fig. 1. Engineering process design in the large-scale production of LaNi5 materials via (a) combustion-reduction (CR) and (b) co-precipitation-reduction (CPR)
The large-scale production of LaNi5 materials via CR and
CPR methods has been calculated stoichiometrically for
industrial scale[11]. All methods produced 12.08 kg of LaNi5
in one cycle. If the product consists of 0.05 kg of LaNi5
materials per pack, there will be about 242 packs/cycle. From
an engineering point of view, this result is very prospective. In
addition to the scaling-up process that can be carried out using
commercial equipment, the use of solvent such as distilled
water is very likely to be done in the industrial scale. Under an
ideal condition, the project can be scaled up to 240 cycles and
produce more than 57,972 packs/year. Furthermore, a cost
analysis of the total equipment per batch requires a total
equipment purchase cost of 3,862,500,000 and 3,757,500,000
IDR for the CR and CPR, respectively. When added with the
Lang Factor into the calculation, the TIC values were around
17,149,500,000 and 16,683,300,000 IDR; respectively. These
values are relatively economical for producing LaNi5
materials made from rare earth metals.
3.2. Ideal Condition
Fig. 2 illustrates the ideal condition of CNPV/TIC (%)
against the life time for CR and CPR methods. The initial time
showed the negative value of CNPV/TIC in the range of zero
to the third year. The value started to increase with the
increasing project time since the third year. All projects are

Nandiyanto et al. / Communications in Science and Technology 5(2) (2020) 70–84 75
able to still run up to more than 20 years. The CR scheme was
found to get the higher final CNPV/TIC and faster profitable
compared to the CPR.
Table 3 presents the economic evaluation parameters
including GPM, PBP, BEP, BEC, IRR, CNPV, ROI, and PI.
The decreases in CNPV/TIC in early years were caused by the
start-up fee at the beginning of the project, while the curves
started to increase since the production process began in the
third year. Several factors affecting this result included the
variable costs, fixed costs, sales, depreciation, pre-tax profits,
and income taxes that started to consider in the third year. As
shown in the curve, different trends occurred significantly in
each project of methods due to different variable costs and
fixed costs. The higher costs of raw materials, utilities, and
equipment to produce LaNi5 materials via CR made its curve
line longer to reach the payback, CNPV/TIC = 0.
Generally, the values of GPM, PBP, BEP, BEC, final
CNPV/TIC, and PI were positive, while other economic
parameters (IRR and ROI) were negative. Although the
project under the ideal condition was prospective, the negative
parameters indicated that the project seemed to be a less
attractive for industrial investors. This perspective is based on
the standard capital market in Indonesia. For further details,
the analysis of any parameters in the ideal case is discussed as
follows.
Fig. 2. Ideal condition in the production of LaNi5 materials via (a) combustion-reduction (CR) and (b) coprecipitation-reduction (CPR) for CNPV/TIC (%) to
life time (year)
Table 3. Summary economic analysis reports of LaNi5 using combustion-reduction (CR) and coprecipitation-reduction (CPR) methods
Economic evaluation
parameter
Combustion-reduction Coprecipitation-reduction
Value
GPM (IDR/pack) 979473 519456
PBP (years) 2.59 3.70
BEP (packs) 5282 12494
BEC (%) 9.11 21.55
IRR (%) 131.02 59.99
Final CNPV/TIC (%) 922.08 284.21
ROI (% per year) 13.63 5.13
Total ROI 245.30 92.34
PI profit-to-sales (%) 32.25 11.81
PI profit-to-TIC (%) 245.30 92.34
In short, GPM analysis determined the profitability of the
project. The project of both methods in this work showed a
moderate benefit, whereas the CR method had a greater
benefit compared to CPR. The difference of their GPMs was
almost two times. The expected profitable in selling product
of CR and CPR was more than 40 and 20%, respectively,

76 Nandiyanto et al. / Communications in Science and Technology 5(2) (2020) 70–84
when the project charged the product by 2,250,000 IDR/pack.
This result confirmed that GPM showed positive. Although
GPM analysis indicated profitable project, there were such
other basic economic evaluation parameters [9,11].
The result of PBP analysis showed that the project was
able to get payback after working in 2-4 years. The CR
scheme got payback faster once the CPR was almost a year
slower. The investment of more than 1,000,000 USD within
2-4 years was considered sufficiently short; thus, it showed a
quite competitive condition even if compared to the standard
capital market. The standard capital market in Indonesia for
investing is 1,000,000 USD that commonly promotes PBP
around 40 years.
In the economic analysis, BEP value estimates the amount
of minimum product that must be sold to cover total
production costs, while BEC is its percentage of minimum
product compared to total production capacity in a year. This
analysis shows that the total product of LaNi5 materials via
CR and CPR must be sold out per year at least 5,282 and
12,494 packs; respectively. The values are relatively easy to
market the product during a year. Once the number of
products that are ready to market in the ideal condition are
57,972 packs/year, it promotes BEC at least 9.11 and 21.55%
of available CR and CPR products, respectively that must be
in market to cover total production costs.
IRR analysis in this ideal condition showed the value of
131.02 (CR) and 59.99% (CPR) for 20 years by only 2-6% per
year. Since this value measured an indicator of efficiency
level from an investment, the calculation of this analysis gave
a very low rate. However, an investment for project can be
accepted when the IRR is greater than IRR investing in other
places such as deposit rates. The values indicate that the IRR
is not promising and creating conflicts against Indonesian
local bank interest of about 5-6%[9].
The final CNPV/TIC analysis showed a positive result.
This result seemed very high for the project to run for 20
years. The project always gets more additional benefits than
the invested funds. In addition, the final CNPV/TIC showed
that CR scheme is significantly more promising than CPR.
ROI analysis showed a negative result with a value of
around 5-14%. Compared to bank interest and capital markets,
the additional benefits are relatively less attractive. The local
capital market in Indonesia should be at least 10% of
profit/year in which 2.5% of it is usually used for zakat[9]. In
short, investing fund of 100 USD, for example, generates
additional benefits of only 5-14 USD.
PI analysis is a way to identify a relationship between
costs and impacts of a project. This analysis, i.e. PI profit-to-
sales and PI profit-to-TIC, showed some positive results in
which the product via CR had the best result for creating a
good impact on sales and investment costs of the project. That
result indicated the sufficient prospective of the project.
Based on the discussions, the analysis concluded that the
product of LaNi5 materials via CR was found more
prospective in all of economic parameters rather than via
CPR. The result of economic evaluation showed a sufficient
prospective but unattractive for industrial investors in
Indonesia. However, other perspectives must be considered
and the negative economic parameters need to be further
evaluated. The new idea in this research is intended to provide
information and knowledge about the feasibility in the
production of LaNi5 materials for the industrial practitioners
to consider.
Fig. 3. Effect of changing raw materials (reagents) to the GPM for (a) combustion-reduction (CR) and (b) coprecipitation-reduction (CPR)
3.3. Internal Issues: Changing raw materials, sales, labor,
and utility
Figs. 3, 4, and 5 present the effects of changing raw
materials and sales costs on GPM. In evaluating a project, the
issues must be estimated for a specific amount because these
costs varied with location. It is important in estimating
benefits without exaggerating and losing credibility[30]. The
purpose of positive analysis of changing cost is to investigate
the impact whether the merchant rises the raw materials cost
or the project increases the sales, while the negative is its
opposite. As shown in the curves, changing sales significantly
affects GPM but changing raw materials is not. Increases in
raw materials have impacts on the decreases in GPM in which
the project suffers a loss. However, increases in sales made
GPM more profitable. In this work, the raw materials
consisted of reagents and reducing agents. We evaluated them
separately considering that each method had different reagents
and reduction steps.
Fig. 3 shows the result of changing all reagents’ costs
against the GPM. The CR scheme could maintain to get GPM
more than 400,000 IDR/pack even if the cost increased up to
Nandiyanto et al. / Communications in Science and Technology 5(2) (2020) 70–84 77 300%. This result was better than reagents of CPR where the
GPM of NiCl2.6H2O in the exception was less than 400,000
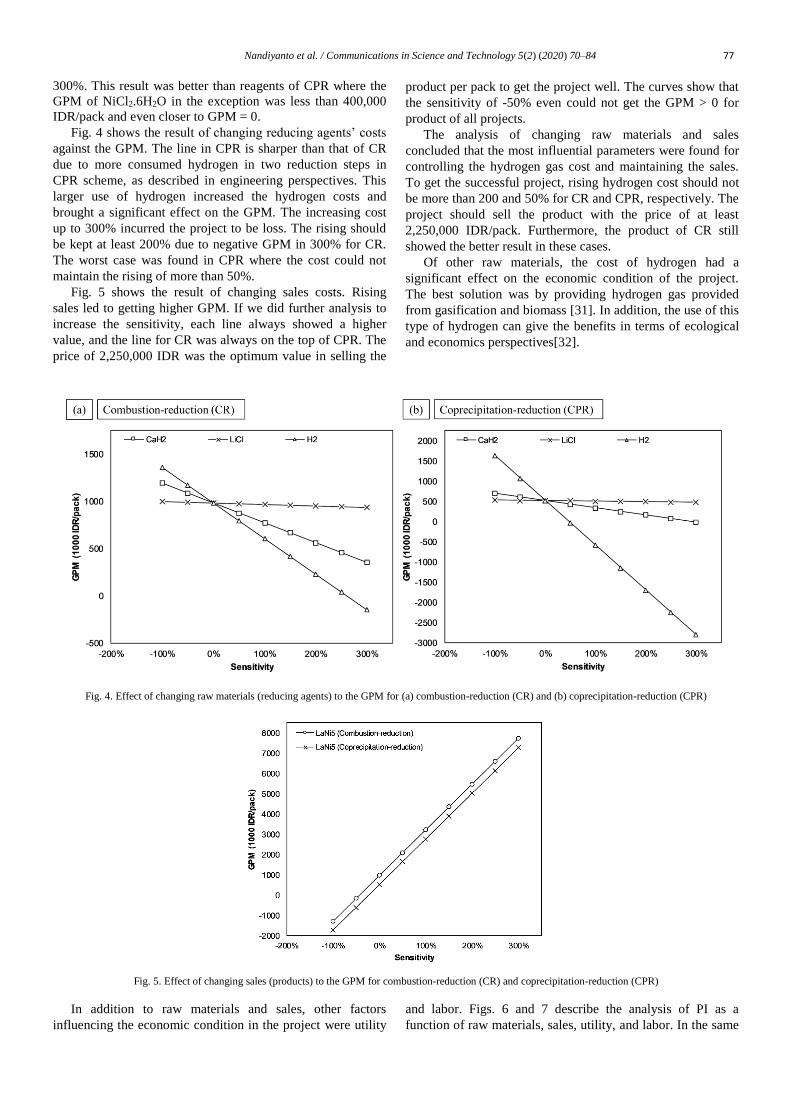
IDR/pack and even closer to GPM = 0. Fig. 4 shows the result of changing reducing agents’ costs
against the GPM. The line in CPR is sharper than that of CR
due to more consumed hydrogen in two reduction steps in
CPR scheme, as described in engineering perspectives. This
larger use of hydrogen increased the hydrogen costs and
brought a significant effect on the GPM. The increasing cost
up to 300% incurred the project to be loss. The rising should
be kept at least 200% due to negative GPM in 300% for CR.
The worst case was found in CPR where the cost could not
maintain the rising of more than 50%.
Fig. 5 shows the result of changing sales costs. Rising
sales led to getting higher GPM. If we did further analysis to
increase the sensitivity, each line always showed a higher
value, and the line for CR was always on the top of CPR. The
price of 2,250,000 IDR was the optimum value in selling the
product per pack to get the project well. The curves show that
the sensitivity of -50% even could not get the GPM > 0 for
product of all projects.
The analysis of changing raw materials and sales
concluded that the most influential parameters were found for
controlling the hydrogen gas cost and maintaining the sales.
To get the successful project, rising hydrogen cost should not
be more than 200 and 50% for CR and CPR, respectively. The
project should sell the product with the price of at least
2,250,000 IDR/pack. Furthermore, the product of CR still
showed the better result in these cases.
Of other raw materials, the cost of hydrogen had a
significant effect on the economic condition of the project.
The best solution was by providing hydrogen gas provided
from gasification and biomass [31]. In addition, the use of this
type of hydrogen can give the benefits in terms of ecological
and economics perspectives[32].
Fig. 4. Effect of changing raw materials (reducing agents) to the GPM for (a) combustion-reduction (CR) and (b) coprecipitation-reduction (CPR)
Fig. 5. Effect of changing sales (products) to the GPM for combustion-reduction (CR) and coprecipitation-reduction (CPR)
In addition to raw materials and sales, other factors
influencing the economic condition in the project were utility
and labor. Figs. 6 and 7 describe the analysis of PI as a
function of raw materials, sales, utility, and labor. In the same

78 Nandiyanto et al. / Communications in Science and Technology 5(2) (2020) 70–84
correlation with the GPM analysis, changing these factors
showed a similar trend. The sales factor had a positive
correlation to the GPM, while the others were in the opposite.
In the case of PI profit-to-sales, the raw materials, utility,
and labor showed the decreasing linear curves in relation with
their increasing cost, while the sales had an opposite
exponential curve. Changing utility and labor costs brought
some impacts on the value of PI but less significant impacts
compared to the changing raw materials and sales. Moreover,
they could still maintain the positive PI even if the changing
cost rose up to 300%. For product from CR, the positive PI
could be achieved when the raw materials cost did not rise
more than 50% and the sales did not change less than -25%.
Nevertheless, the sensitivity of raw materials and sales could
not be less than 0% for product of CPR to reach positive PI. Further increases in sales cost did not affect to the profit since
the increases in sales were related to the change in variable
cost[33]. In the case of PI profit-to-investment, all factors were
found to be relatively straight-linear curves. Changing utility
and labor costs of up to 300% could still achieve the positive
PI in all projects. But, a problem in changing raw materials
was found, in which they maintained only the rising cost up to
50% for CR and no less than 0% for CPR. Increases in sales
had a significant impact on the successful project. Based on
the analysis, changing raw materials and sales was found as
the most dominant factors to impact the value of PI. To confirm the effect of raw materials, sales, utility, and
labor on the profit, the analysis of BEP was conducted (see
Fig. 8). Changing these factors from -100% to 300%
confirmed the feasibility of the project, stating the condition
in feasible (above the zero point) or non-feasible (below the
zero point). As shown in an insert image in Fig. 8, increases in
sales have a good correlation with decreasing BEP. Therefore,
if the project increases the price of product, the amount of
minimum product that must be sold to cover total production
costs allowed decreasing. On the contrary, raw materials,
utility, and labor had an opposite impact compared to the
sales. The results showed that the project would be feasible
when the factors were conducted in the specific range.
Generally, changing utility and labor cost even up to 300%
could still allow the project to be feasible for product via all
methods. Specifically, the project was relatively in a non-
feasible condition when the sale decreased more than -50%
and an increase in raw materials of was more than 75% for
CR. In the same condition, decreases in sales of down to more
than -25% and increases in raw materials of up to 25% were
not suggested for CPR.
Fig. 6. Analysis of PI profit-to-sales as a function of sales, raw materials, utility, and labor for (a) combustion-reduction (CR) and (b) coprecipitation-reduction
(CPR)
3.4. Internal Issues: Changing fixed costs and variable costs
Operational activity costs were classified according to
their reaction to the changes of enterprise activities in which
the costs were divided into two groups: variable costs and
fixed costs[34]. Since fixed costs and variable costs started to
consider in the third year whereas the time when the
CNPV/TIC grew up and impacted on different trends in each
project, the analysis of CNPV/TIC curve based on changing
fixed costs and variable costs was investigated (see Figs. 9
and 10). In Fig. 9, although the increases in fixed costs made the
project a loss and the decreases got a benefit, the curve
showed no significant impact on the CNPV/TIC. It was
because there were not many factors affecting to the fixed
costs. The fixed cost only depended on the total price of
apparatus and other capital-related cost including
maintenance, operating supplies, environmental, local taxes,
or insurance cost. Furthermore, the project of CR scheme had
a better curve than CPR. However, the project of both
methods was still able to maintain the profitable project even
if the change raises up to two times of the fixed costs in the
ideal condition (200%). This condition also brought an impact
on PBP, as shown in an insert image in Fig 10. The increase in
fixed cost delayed the payback but there were only a few
months in every single 25% increases.
Nandiyanto et al. / Communications in Science and Technology 5(2) (2020) 70–84 79
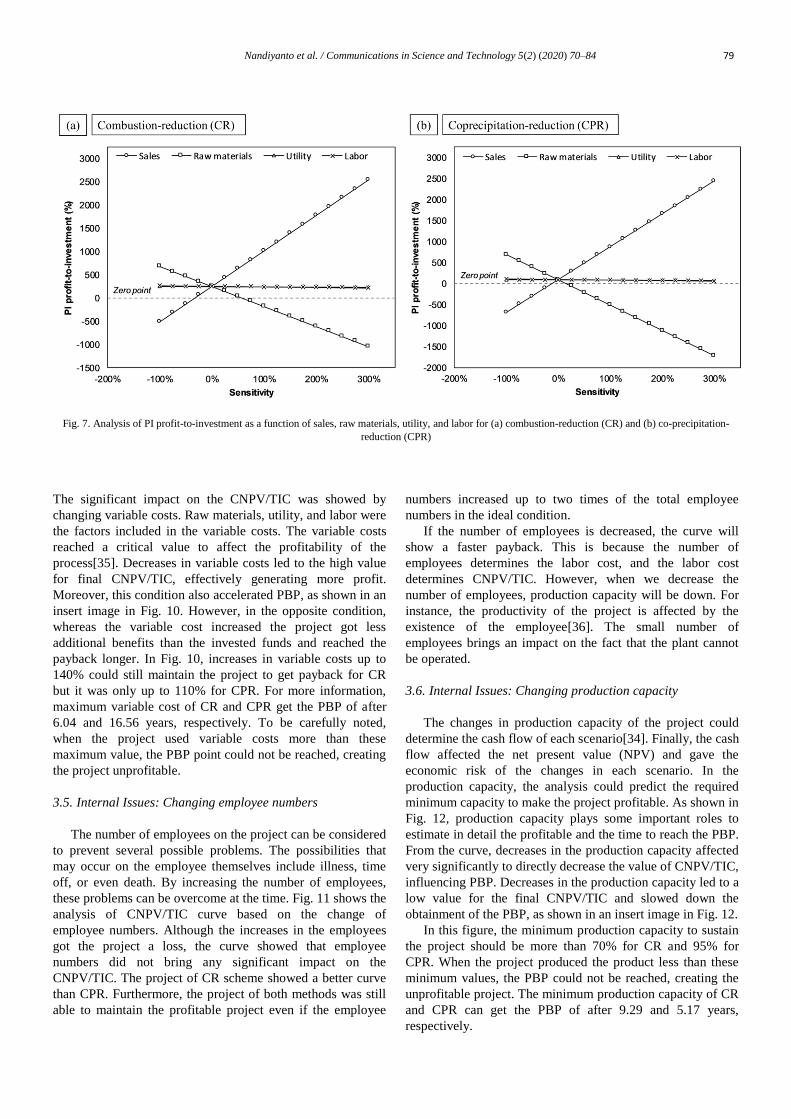
Fig. 7. Analysis of PI profit-to-investment as a function of sales, raw materials, utility, and labor for (a) combustion-reduction (CR) and (b) co-precipitation-
reduction (CPR)
The significant impact on the CNPV/TIC was showed by
changing variable costs. Raw materials, utility, and labor were
the factors included in the variable costs. The variable costs
reached a critical value to affect the profitability of the
process[35]. Decreases in variable costs led to the high value
for final CNPV/TIC, effectively generating more profit.
Moreover, this condition also accelerated PBP, as shown in an
insert image in Fig. 10. However, in the opposite condition,
whereas the variable cost increased the project got less
additional benefits than the invested funds and reached the
payback longer. In Fig. 10, increases in variable costs up to
140% could still maintain the project to get payback for CR
but it was only up to 110% for CPR. For more information,
maximum variable cost of CR and CPR get the PBP of after
6.04 and 16.56 years, respectively. To be carefully noted,
when the project used variable costs more than these
maximum value, the PBP point could not be reached, creating
the project unprofitable.
3.5. Internal Issues: Changing employee numbers
The number of employees on the project can be considered
to prevent several possible problems. The possibilities that
may occur on the employee themselves include illness, time
off, or even death. By increasing the number of employees,
these problems can be overcome at the time. Fig. 11 shows the
analysis of CNPV/TIC curve based on the change of
employee numbers. Although the increases in the employees
got the project a loss, the curve showed that employee
numbers did not bring any significant impact on the
CNPV/TIC. The project of CR scheme showed a better curve
than CPR. Furthermore, the project of both methods was still
able to maintain the profitable project even if the employee
numbers increased up to two times of the total employee
numbers in the ideal condition.
If the number of employees is decreased, the curve will
show a faster payback. This is because the number of
employees determines the labor cost, and the labor cost
determines CNPV/TIC. However, when we decrease the
number of employees, production capacity will be down. For
instance, the productivity of the project is affected by the
existence of the employee[36]. The small number of
employees brings an impact on the fact that the plant cannot
be operated.
3.6. Internal Issues: Changing production capacity
The changes in production capacity of the project could
determine the cash flow of each scenario[34]. Finally, the cash
flow affected the net present value (NPV) and gave the
economic risk of the changes in each scenario. In the
production capacity, the analysis could predict the required
minimum capacity to make the project profitable. As shown in
Fig. 12, production capacity plays some important roles to
estimate in detail the profitable and the time to reach the PBP.
From the curve, decreases in the production capacity affected
very significantly to directly decrease the value of CNPV/TIC,
influencing PBP. Decreases in the production capacity led to a
low value for the final CNPV/TIC and slowed down the
obtainment of the PBP, as shown in an insert image in Fig. 12.
In this figure, the minimum production capacity to sustain
the project should be more than 70% for CR and 95% for
CPR. When the project produced the product less than these
minimum values, the PBP could not be reached, creating the
unprofitable project. The minimum production capacity of CR
and CPR can get the PBP of after 9.29 and 5.17 years,
respectively.

80 Nandiyanto et al. / Communications in Science and Technology 5(2) (2020) 70–84
Fig. 8. Analysis of BEP as a function of sales, raw materials, utility, and labor for (a) combustion-reduction (CR) and (b) coprecipitation-reduction (CPR). An
insert image is the analysis of BEP in the specific range (-100% to 300%)

Nandiyanto et al. / Communications in Science and Technology 5(2) (2020) 70–84 81
Fig. 9. CNPV/TIC curves in accordance to life time for (a) combustion-reduction (CR) and (b) coprecipitation-reduction (CPR) under various fixed costs. An
insert image is the analysis of PBP based on fixed costs.
Fig. 10. CNPV/TIC curves in accordance to life time for (a) combustion-reduction (CR) and (b) coprecipitation-reduction (CPR) under various variable costs.
An insert image is the analysis of PBP based on variable costs.
Fig. 11. CNPV/TIC curves in accordance to life time for (a) combustion-reduction (CR) and (b) co-precipitation-reduction (CPR) under various employee
numbers

82 Nandiyanto et al. / Communications in Science and Technology 5(2) (2020) 70–84
Fig. 12. CNPV/TIC curves in accordance to life time for (a) combustion-reduction (CR) and (b) coprecipitation-reduction (CPR) under various production
capacities. An insert image is the analysis of PBP based on production capacities.
Fig. 13. CNPV/TIC curves in accordance to life time for (a) combustion-reduction (CR) and (b) co-precipitation-reduction (CPR) under various taxes. An insert
image is the analysis of PBP based on taxes.
3.7. External Issues: Changing taxes and subsidiaries
Economic condition in a country where the project is
conducted is one of the most influencing external
parameters[9]. This is a parameter to predict the successful
project in which the country could give a tax or a subsidiary
from the government itself. Moreover, this condition could be
beneficial or detrimental to the project dependent upon their
economic policies.
Fig. 13 shows CNPV/TIC curves under various taxes and
subsidiaries. The figure confirmed that changing taxes has
greatly affected to the value of CNPV/TIC started from the
second year. Initial years (from 0 to 2) showed the identical
results to the ideal condition, considering that the interval was
the initial period of project construction. The effects of taxes
on the CNPV/TIC could be obtained after the project was
established in the second year. Indeed, this condition also
influenced the PBP. Increases in taxes resulted in less benefit
for all methods, slowing down the PBP. In this figure, the
maximum tax to get PBP should be less than 90% for CR and
80% for CPR. Changing taxes to more than these values
created failure in the project.
The analysis of changing taxes also relates to PBP. The
maximum tax will get the payback after 8.49 years for CR and
13.21 years for CPR. As shown in an insert image in Fig. 13,
there is a negative tax on x axis. It means that the additional
charge was given by the government as a subsidiary cash for
the project. Applying additional subsidiary is getting more
benefits for the project. When the government gave the
subsidiary up to 50% (-50% in graph), the PBP was obtained
faster. However, the curves in an insert image describes that
the subsidiary was found as it had no significant impact on the

Nandiyanto et al. / Communications in Science and Technology 5(2) (2020) 70–84 83
project but increasing taxes to do more influences.
Furthermore, CR had a better result than CPR in this external
condition case.
Referring to all the results of each internal and external
issues, the analysis of feasibility of the project by changing
economic circumstances has been conducted and the project
of CR scheme has led to a better scheme than CPR. To be
carefully noted, both CR and CPR for the production of LaNi5
materials were profitable only in the specific economic
condition. However, if the project works in the circumstances
that is out of the specific economic condition, the project is
going to suffer much losses.
In addition, all these applications are also still in the
research stage. There are many aspects need to be improved
and applied in realistic condition. Therefore, the techno-
economic analysis could be useful for further developments.
4. Conclusion
This work reported an engineering process design and
economic evaluation in the large-scale production of LaNi5
materials using two types of processing schemes: CR and
CPR methods. The projects of both methods were found
prospective to be scaled up based on engineering evaluation
since the processes can be done using the commercially
available apparatuses. The economic analyses from GPM,
PBP, BEP, CNPV, and PI showed the positive result, while
the one from IRR and ROI showed the negative one,
indicating that the project was profitable but less attractive for
industrial investors. In the ideal condition and the worst cases,
CR method was found better than CPR. Both methods were
profitable only in the specific economic condition. This work
demonstrated the importance of the projects for supporting the
industrial practitioners to further develop.
5. Acknowledgments
We acknowledged RISTEK BRIN for grant Penelitian
Terapan Unggulan Perguruan Tinggi and Bangdos Universitas
Pendidikan Indonesia.
6. References
1. H. Van Mal, and A. Miedema. "Some applications of LaNi5-type
hydrides." In Hydrides for Energy Storage, 251-260: Elsevier, 1978.
2. W. Liu, and K.-F. Aguey-Zinsou, Low temperature synthesis of LaNi5
nanoparticles for hydrogen storage, Int. J. Hydrogen Energy, 41 (3)
(2016) 1679-1687.
3. R.F.S. Budi, S. Sarjiya, and S.P. Hadi, A review of potential method for
optimization of power plant expansion planning in Jawa-Madura-Bali
electricity system, Commun. Sci. Technol., 2 (1) (2017) 29-36.
4. D. DeSantis, J.A. Mason, B.D. James, C. Houchins, J.R. Long, and M.
Veenstra, Techno-economic analysis of metal–organic frameworks for
hydrogen and natural gas storage, Energy Fuel, 31 (2) (2017) 2024-
2032.
5. J.Q. Albarelli, D.T. Santos, M.A.A. Meireles, M. Salgado, and M. Rueda,
Techno-economic analysis of production of ammonia-borane confined in
silica aerogel microparticles by subcritical CO2 drying, J. Supercritical
Fluid, 138 (2018) 147-153.
6. I.M. Hidayatullah, R. Arbianti, T.S. Utami, M. Suci, M. Sahlan, A.
Wijanarko, M. Gozan, and H. Hermansyah, Techno-economic analysis of
lipase enzyme production from agro-industry waste with solid state
fermentation method, IOP Conference Series: Materials Science and
Engineering, 316 (1) (2018) 012064.
7. K. Cogollo-Herrera, H. Bonfante-Alvarez, G. De Avila-Montiel, A.
Herrera-Barros, and A.D. Gonzalez-Delgado, Techno-economic
sensitivity analysis of large scale chitosan production process from
shrimp shell wastes, Chem. Eng, Trans., 70 (2018) 2179-2184.
8. A. Manandhar, and A. Shah, Techno-Economic Analysis of Bio-Based
Lactic Acid Production Utilizing Corn Grain as Feedstock, Processes, 8
(2) (2020) 199.
9. A.B.D. Nandiyanto, Cost analysis and economic evaluation for the
fabrication of activated carbon and silica particles from rice straw waste,
J. Eng. Sci. Technol., 13 (6) (2018) 1523-1539.
10. R. Ragadhita, A.B.D. Nandiyanto, A.C. Maulana, R. Oktiani, A.
Sukmafitri, A. Machmud, and E. Surachman, Techo-economic analysis
for the production of titanium dioxide nanoparticle produced by liquid-
phase synthesis method, J. Eng. Sci. Technol., 14 (3) (2019) 1639-1652.
11. A.B.D. Nandiyanto, R. Ragadhita, and I. Istadi, Techno-economic
Analysis for the Production of Silica Particles from Agricultural Wastes,
Morrocon J. Chem., 8 (4) (2020) 801-818.
12. E. Suwargi, B. Pardiarto, and T. Ishlah, Potensi logam tanah jarang di
Indonesia, Bull. Sumber Daya Geologi, 5 (2010) 131-140.
13. D. Noviansyah. Logam Tanah Jarang (Rare Earths Element). Dunia
Pustaka Jaya, 2019.
14. T. Elwert, D. Goldmann, F. Römer, M. Buchert, C. Merz, D. Schueler,
and J. Sutter, Current developments and challenges in the recycling of
key components of (hybrid) electric vehicles, Recycling, 1 (1) (2016) 25-
60.
15. M. Blanco, E. Zelaya, and M. Esquivel, Study of the thermal stability in
air of LaNi5 by DSC, EDX, TEM and XRD combined techniques,
Procedia Mater. Sci., 1 (2012) 564-571.
16. P. Ferreira-Aparicio, J.J. Conde, and A.M. Chaparro. "Hydrogen storage
options for portable fuel-cell systems." In Portable Hydrogen Energy
Systems, 41-50: Elsevier, 2018.
17. B.F. Buletin Sumber Daya Geologi VoIndonesian Journal of Science and
TechnologyThornton, and S.C. Burdette, Seekers of the lost lanthanum,
Nature Chem., 11 (2) (2019) 188-188.
18. I. Wahyudi, and A. Sakti, Analyzing the profit-loss sharing contracts with
Markov model, Commun. Sci. Technol., 1 (2) (2016) 78-88.
19. A.B.D. Nandiyanto, G.C.S. Girsang, R. Maryanti, R. Ragadhita, S.
Anggraeni, F.M. Fauzi, P. Sakinah, A.P. Astuti, D. Usdiyana, and M.
Fiandini, Isotherm adsorption characteristics of carbon microparticles
prepared from pineapple peel waste, Commun. Sci. Technol., 5 (1)
(2020) 31-39.
20. A.B.D. Nandiyanto, K. Kurnia, D. Sofiani, C. Kusuma, F. Fitriani, I.P.
Rahayu, A. Rusli, P. A., A.S. Wiryani, and A. Rahim. Pengantar Kimia
Industri: Penerapan Ilmu Kimia Menjadi Produk Kimia Skala Besar.
Penerbit: UPI Press, 2016.
21. A.B.D. Nandiyanto, A. Sukmafitri, M. Fiandini, A.N. Pramadhanty, D.
Miftahurrahmah, F. Chintya, H.H. Fauzani, H. Khairunnisa, I.I. Fakhri,
I.H. Abbiyu, M. Muttoharoh, R. Rizkiyah, S. Madani, and S. Layli. Soal
dan pembahasan kimia industri penerapan ilmu kimia menjadi produk
kimia skala besar. Penerbit: UPI Press, 2020.
22. R. Sarhaddi, H. Arabi, and F. Pourarian, Structural, morphological,
magnetic and hydrogen absorption properties of LaNi 5 alloy: A
comprehensive study, Int. J. Modern Phys. B, 28 (14) (2014) 1450079.
84 Nandiyanto et al. / Communications in Science and Technology 5(2) (2020) 70–84
23. J. Kusiński, K. Kowalski, S. Kac, P. Matteazzi, M. Krebs, J. Morgiel, and
S. Cochet. "Microstructure of LaNi5 base nanopowders produced by high
energy ball milling." Paper presented at the Solid state Phenomena, 2012.
24. Y. Xiao, Y. Liu, D. Yuan, J. Zhang, and Y. Mi, Synthesis of rod-shaped
LaNi5 alloy via solid reduction method, Mater. Lett., 60 (21-22) (2006)
2558-2560.
25. N. Yasuda, T. Tsuchiya, S. Sasaki, N. Okinaka, and T. Akiyama, Self-
ignition combustion synthesis of LaNi5 at different hydrogen pressures,
Int. J. Hydrogen Energy, 36 (14) (2011) 8604-8609.
26. A. Burlakova, and S. Shilkin, Reaction of lanthanum carbonates with
nickel in aqueous medium, Russian J. General Chem., 73 (9) (2003)
1331-1334.
27. A.B.D. Nandiyanto, and R. Ragadhita. Evaluasi ekonomi perancangan
pabrik kimia. RPI Press, 2019.
28. U. Mann. Principles of chemical reactor analysis and design: new tools
for industrial chemical reactor operations. John Wiley & Sons, 2009.
29. J.D. Seader, E.J. Henley, and D.K. Roper. Separation process principles.
Vol. 25: Wiley New York, 1998.
30. J.P. Clark. "Economic Evaluation." In Case Studies in Food Engineering,
149-161: Springer, 2009.
31. R. Rinaldi. Catalytic Hydrogenation for Biomass Valorization. Royal
Society of Chemistry, 2014.
32. D. Stefanoiu, J. Culita, and O.N. Stanasila, HYRON—An Installation to
Produce High Purity Hydrogen and Soft Iron Powder from Cellulose
Waste, Materials, 12 (9) (2019) 1538.
33. N. Husna, and R. Desiyanti, The Analysis of Financial Performance on
Net Profit Margin at the Coal Company, Int. J. Manag. Appl. Sci., 2 (4)
(2016) 105-108.
34. A. Dyhdalewicz, The implementation of variable costing in the
management of profitability of sales in trade companies, e-Finanse, 11
(3) (2015) 116-127.
35. A. Zuorro, K.A. Moreno-Sader, and Á.D. González-Delgado, Economic
Evaluation and Techno-Economic Sensitivity Analysis of a Mass
Integrated Shrimp Biorefinery in North Colombia, Polymers, 12 (10)
(2020) 2397.
36. J. Steel, L. Godderis, and J. Luyten, Methodological challenges in the
economic evaluation of occupational health and safety programmes, Int.
J. Env. Res. Public Health, 15 (11) (2018) 2606.
37. J.A.B. Montevechi, R.F. da Silva Costa, F. Leal, A.F. de Pinho, and J.T.
de Jesus. "Economic evaluation of the increase in production capacity of
a high technology products manufacturing cell using discrete event
simulation." Paper presented at the Proceedings of the 2009 Winter
Simulation Conference (WSC), 2009.