Studying of parameters of two-phase displacement in porous ...
18
24 ème Congrès Français de Mécanique Brest, 26 au 30 Août 2019 Studying of parameters of two-phase displacement in porous media with MRI technique Fannir Jamal*, Panfilova Irina, Leclerc Sébastien, Stemmelen Didier LEMTA – UMR 7563 Laboratoire d Energétique et de Mécanique Théorique et Appliquée, 2 Avenue de la Forêt de Haye, BP90161, 54504 Vandœuvre-lès-Nancy Cedex. Abstract: This study describes experimental research on two-phase flow displacement using Magnetic Resonance Imaging (MRI) techniques. The overall purpose of this investigation is to determine kinetics process of phase trapping during (water-oil) two-phase flow, the front deformation and the phases saturation propagation along a vertical model. In these water flooding experiments, the porous medium model consists of packed beads of polystyrene (0.4 mm < dp < 0.6 mm) or sand grains (0.02 mm < dp < 0.50 mm). In order to conduct high accuracy experiments, a NMR spectrometer operating at 14 T (corresponding to a 600 MHz 1 H resonance) equipped with an imaging device was used. With this equipment we can measure and visualize the two-phase flow in a vertical model of porous medium under ambient conditions. The obtained results have shown that the oil saturation profile is strongly influenced by the material properties such as the phase wetting, the sample porosity and permeability as well as the injection rate. The influence of flow velocity on the residual oil saturation was also studied. The experimental results allow an essential understanding of immiscible fluid displacement in two different types of porous medium that differ from each other mainly by the effects of wettability. Keywords: MRI / porous media / oil-water displacement / viscous fingering / residual oil. Nomenclature Symbols Descriptions Units Bo Bond number [-] C Kozeny-Carman constant [-] Ca Capillary number [-] d Average pore size Mm dp Particle diameter Mm f Resonance frequency Hz FOV Field of view Cm g Gravitational constant m.s -2 1 H Number of protons [-] I Observed magnetic intensity [-]
Transcript of Studying of parameters of two-phase displacement in porous ...
24ème Congrès Français de Mécanique Brest, 26 au 30 Août 2019
Studying of parameters of two-phase displacement in
porous media with MRI technique
Fannir Jamal*, Panfilova Irina, Leclerc Sébastien, Stemmelen Didier
LEMTA – UMR 7563 Laboratoire d Energétique et de Mécanique Théorique et Appliquée,
2 Avenue de la Forêt de Haye, BP90161, 54504 Vandœuvre-lès-Nancy Cedex.
Abstract:
This study describes experimental research on two-phase flow displacement using Magnetic Resonance
Imaging (MRI) techniques. The overall purpose of this investigation is to determine kinetics process of
phase trapping during (water-oil) two-phase flow, the front deformation and the phases saturation
propagation along a vertical model. In these water flooding experiments, the porous medium model
consists of packed beads of polystyrene (0.4 mm < dp < 0.6 mm) or sand grains (0.02 mm < dp < 0.50
mm). In order to conduct high accuracy experiments, a NMR spectrometer operating at 14 T
(corresponding to a 600 MHz 1H resonance) equipped with an imaging device was used. With this
equipment we can measure and visualize the two-phase flow in a vertical model of porous medium under
ambient conditions. The obtained results have shown that the oil saturation profile is strongly influenced
by the material properties such as the phase wetting, the sample porosity and permeability as well as
the injection rate. The influence of flow velocity on the residual oil saturation was also studied. The
experimental results allow an essential understanding of immiscible fluid displacement in two different
types of porous medium that differ from each other mainly by the effects of wettability.
Keywords: MRI / porous media / oil-water displacement / viscous fingering
/ residual oil.
Nomenclature
Symbols
Descriptions
Units
Bo Bond number [-]
C Kozeny-Carman constant [-]
Ca Capillary number [-]
d Average pore size Mm
dp Particle diameter Mm
f Resonance frequency Hz
FOV Field of view Cm
g Gravitational constant m.s-2
1H Number of protons [-]
I Observed magnetic intensity [-]
24ème Congrès Français de Mécanique Brest, 26 au 30 Août 2019
I0 Intrinsic magnetic intensity [-]
Iref Reference MR signal intensity [-]
K Intrinsic permeability m2
PV Pore volume m3
Qinj Injection rate mL.min-1
So Saturation of oil phase %
TE Echo Time S
TR Repetition time S
T1 Longitudinal relaxation time S
T2 Transverse relaxation time S
v Darcy velocity of injected phase m.s-1
φ Sample porosity %
Density of oil phase kg.m-3
Density of wetting-phase kg.m-3
Δρ Density difference kg.m-3
Oil viscosity cP
Wetting-phase viscosity cP
Interfacial tension N.m-1
θ Contact angle Deg
1 Introduction
Two-phase flow in porous media is very important and widely applicable in the petroleum industry (such
as estimation of recoverable oil reserve, optimization of the recovery techniques…) but also in the sector
of chemical industry (catalytic reactors, separation and extraction) or in the hydrogeology domain
(pollution of aquifers by NAPL). This explains the importance of the studies aiming to improve the
description of multi-phase flow in porous media. Notably, the simultaneous flow of two immiscible
fluids (water-oil) in porous media is not always well described by Darcy's generalized law, which only
takes into account water/oil saturation as additional descriptive variable. This has a substantial impact
on the description of the two-phase flow stability under the simultaneous effect of the force of gravity,
viscosity and superficial tension.
For the study of two-phase flow in porous media, several kinds of imaging methods have been applied
including X-ray, computed tomography scanners (CT) [1,2,3] synchrotron imputed micro-tomography
[4] and magnetic resonance imaging (MRI) techniques [5,6,7,8,9]. Among these methods, only MRI is
able to visualize the internal structure of a system in three dimensions with a spatial resolution of the
species present. Furthermore, MRI also allows in-situ measurements of flow velocity, saturation and
diffusion-dispersion of the fluid flow within the porous media. Another opportunity of the MRI is that
it can be used to probe both microscopic and macroscopic properties.
The rapid development of new quantitative magnetic resonance imaging technologies led to new
opportunities with interesting results for measurements of fluid flow in porous media. Johns and
Gladden [10] have used MRI technique to visualize the dissolution of entrapped ganglia or “blobs” of
octanol within the pore space of a randomly packed bed of glass beads, by a mobile aqueous phase.
They also acquired three dimensional images and were able to distinguish the solid, hydrocarbon, and
24ème Congrès Français de Mécanique Brest, 26 au 30 Août 2019
aqueous phases. Finally, they also obtained velocity maps of the mobile aqueous phase. Ersland et al.
[11] used the MRI techniques to study how the oil recovery is affected by fractures. They have obtained
high spatial resolution images of the water-oil flow inside a 1 mm fracture. Furthermore, in a recent
work in LEMTA laboratory, MRI has been employed for studies of fluid flow within granular porous
media [12]. The authors have shown the possibility of visualization of the velocity field in porous media
and accurate measurements of interstitial and averaged velocities in packed beds.
The purpose of the present study is the investigation of the immiscible fluid displacement in porous
medium. We focus on the wettability properties of the fluids with the solid surfaces as this is an
important factor for secondary recovery of hydrocarbons. Furthermore, several types of forces such as
capillary, viscous and gravitational are extremely important to describe the two-phase flow. In this
project, MRI was used to experimentally examine the water-oil flux through а vertical porous model.
Using MRI technique, we also study the dynamics of the displacement front, its deformation and the
phase trapping during the two-phase flow process. Displacement in porous media is characterized by
the formation of different structures of the phase distribution in porous space. For the same saturation,
the fluids can form different shapes. So, these various shapes can be described by the displacing phase
saturation S and an additional parameter, responsible for the type of the shape. It is insufficient to only
have the specific surface of phase distribution in space, as proposed by several authors, because different
shapes can have a surface size of the same order. We recommend using two additional parameters of
shape: one to characterize the specific interface between the phases, and the other to evaluate the degree
of connectivity between the phases.
The saturation of the displacing phase, the connected displaced phase and disconnected traps, and also
the menisci distribution in the zone of the front deformation allow us to complete the phenomenological
menisci model proposed in Panfilova and Panfilov 2005 [13].
2 Experiments
2.1 Experimental system
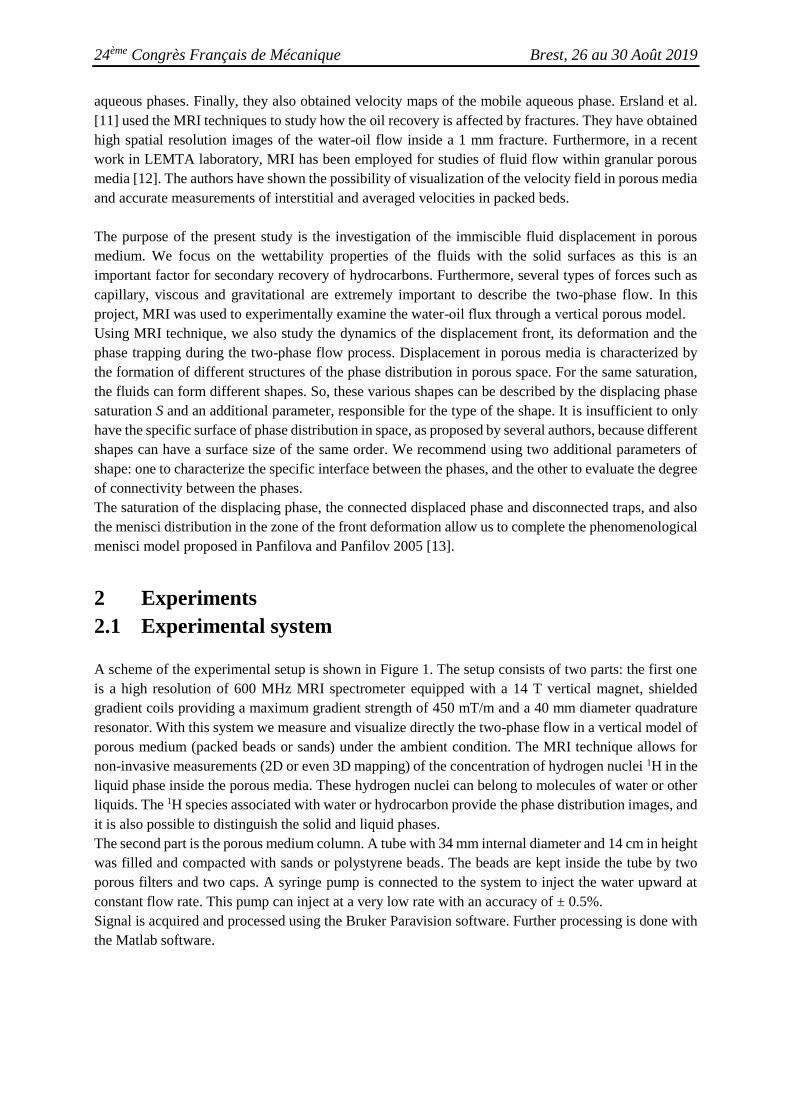
A scheme of the experimental setup is shown in Figure 1. The setup consists of two parts: the first one
is a high resolution of 600 MHz MRI spectrometer equipped with a 14 T vertical magnet, shielded
gradient coils providing a maximum gradient strength of 450 mT/m and a 40 mm diameter quadrature
resonator. With this system we measure and visualize directly the two-phase flow in a vertical model of
porous medium (packed beads or sands) under the ambient condition. The MRI technique allows for
non-invasive measurements (2D or even 3D mapping) of the concentration of hydrogen nuclei 1H in the
liquid phase inside the porous media. These hydrogen nuclei can belong to molecules of water or other
liquids. The 1H species associated with water or hydrocarbon provide the phase distribution images, and
it is also possible to distinguish the solid and liquid phases.
The second part is the porous medium column. A tube with 34 mm internal diameter and 14 cm in height
was filled and compacted with sands or polystyrene beads. The beads are kept inside the tube by two
porous filters and two caps. A syringe pump is connected to the system to inject the water upward at
constant flow rate. This pump can inject at a very low rate with an accuracy of ± 0.5%.
Signal is acquired and processed using the Bruker Paravision software. Further processing is done with
the Matlab software.
24ème Congrès Français de Mécanique Brest, 26 au 30 Août 2019
Figure 1: Experimental setup: (1) 600 MHz NMR system; (2) Computer for data process; (3) Porous
media sample; (4) Oil tank; (5) Water tank; (6) Water injection pump.
2.2 Sample material
2.2.1 Porous medium
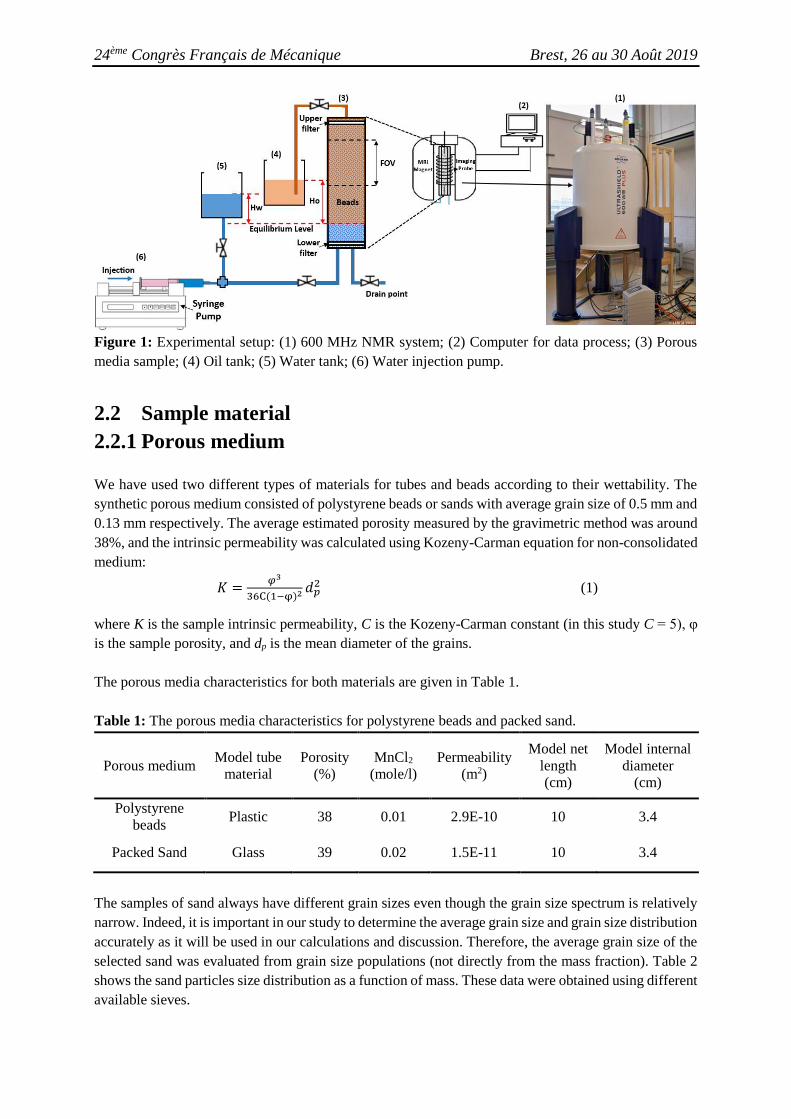
We have used two different types of materials for tubes and beads according to their wettability. The
synthetic porous medium consisted of polystyrene beads or sands with average grain size of 0.5 mm and
0.13 mm respectively. The average estimated porosity measured by the gravimetric method was around
38%, and the intrinsic permeability was calculated using Kozeny-Carman equation for non-consolidated
medium:
𝐾 =𝜑3
36C(1−φ)2 𝑑𝑝2 (1)
where K is the sample intrinsic permeability, C is the Kozeny-Carman constant (in this study C = 5), φ
is the sample porosity, and dp is the mean diameter of the grains.
The porous media characteristics for both materials are given in Table 1.
Table 1: The porous media characteristics for polystyrene beads and packed sand.
Porous medium Model tube
material
Porosity
(%)
MnCl2
(mole/l)
Permeability
(m2)
Model net
length
(cm)
Model internal
diameter
(cm)
Polystyrene
beads Plastic 38 0.01 2.9E-10 10 3.4
Packed Sand Glass 39 0.02 1.5E-11 10 3.4
The samples of sand always have different grain sizes even though the grain size spectrum is relatively
narrow. Indeed, it is important in our study to determine the average grain size and grain size distribution
accurately as it will be used in our calculations and discussion. Therefore, the average grain size of the
selected sand was evaluated from grain size populations (not directly from the mass fraction). Table 2
shows the sand particles size distribution as a function of mass. These data were obtained using different
available sieves.
24ème Congrès Français de Mécanique Brest, 26 au 30 Août 2019
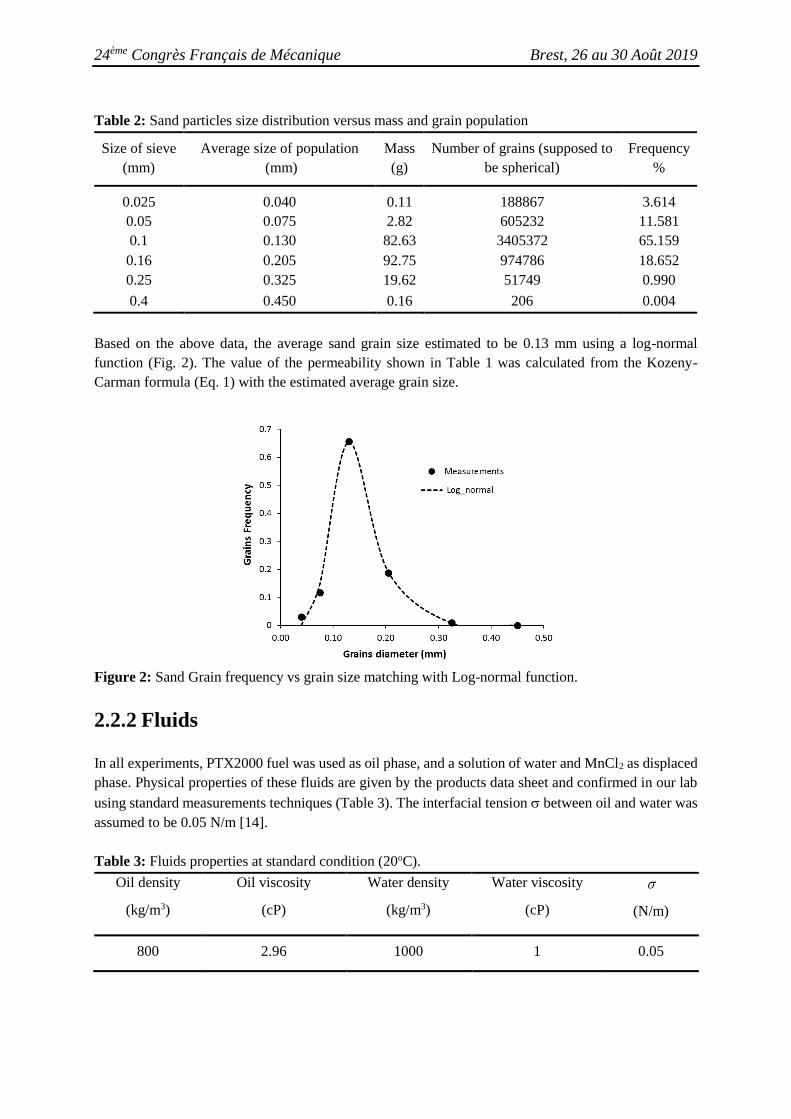
Table 2: Sand particles size distribution versus mass and grain population
Size of sieve
(mm)
Average size of population
(mm)
Mass
(g)
Number of grains (supposed to
be spherical)
Frequency
%
0.025 0.040 0.11 188867 3.614
0.05 0.075 2.82 605232 11.581
0.1 0.130 82.63 3405372 65.159
0.16 0.205 92.75 974786 18.652
0.25 0.325 19.62 51749 0.990
0.4 0.450 0.16 206 0.004
Based on the above data, the average sand grain size estimated to be 0.13 mm using a log-normal
function (Fig. 2). The value of the permeability shown in Table 1 was calculated from the Kozeny-
Carman formula (Eq. 1) with the estimated average grain size.
Figure 2: Sand Grain frequency vs grain size matching with Log-normal function.
2.2.2 Fluids
In all experiments, PTX2000 fuel was used as oil phase, and a solution of water and MnCl2 as displaced
phase. Physical properties of these fluids are given by the products data sheet and confirmed in our lab
using standard measurements techniques (Table 3). The interfacial tension between oil and water was
assumed to be 0.05 N/m [14].
Table 3: Fluids properties at standard condition (20oC). Oil density
(kg/m3)
Oil viscosity
(cP)
Water density
(kg/m3)
Water viscosity
(cP)
(N/m)
800 2.96 1000 1 0.05
24ème Congrès Français de Mécanique Brest, 26 au 30 Août 2019
2.3 Experimental process
As a first step, the sample tube was filled with oil. A vacuum pump is used to remove air in order to
obtain fully saturated samples. At initial state, we install a hydrostatic equilibrium of water-oil contact
inside of the porous sample which is calculated with the levels of water and oil in tanks (Fig. 1). In doing
so the water oil interface is homogeneously distributed near the bottom filter. The injection rate was
controlled by the syringe pump. The water solution (distilled water + MnCl2) was injected into the
column from below with the objective to prevent the deformation of water-oil interface by the gravity.
The volumetric injection flow rate was varied from 0.08 mL/min to 0.16 mL/min and the corresponding
superficial velocity was calculated using the geometry and porosity of the model. For each experiment,
the MR sequences were performed during more than 10 hours, a period corresponding to the injection
of 3 and more pore volumes (PV) of water [15].
2.4 Imaging protocol
The magnetic resonance imaging technique is an effective, non-invasive method for determining fluid
saturation in porous media by detecting 1H density. The imaging method used a classical multi-slice
spin echo sequence. The MRI echo signal can be described as [5, 16]:
𝐼(𝑓, 𝑇𝐸) = 𝐼0(𝑓) (1 − 𝑒𝑥𝑝 (−𝑇𝑅
𝑇1)) exp (−
𝑇𝐸
𝑇2) (2)
in which I is the observed intensity of the magnetic signal at resonance frequency f, I0 is the intrinsic
magnetic intensity, TE is the echo time, TR is the repetition time, T1 is the longitudinal relaxation time
and T2 is the transverse relaxation time. The intrinsic magnetic intensity I0 is in principle proportional
to the number of protons 1H. Taking TR > 5T1 and TE < T2/5, the observed magnetic intensity is close to
the intrinsic one, i.e. 𝐼(𝑓, 𝑇𝐸) ≈ 𝐼0(𝑓) which makes it possible to build an image in 1H density almost
independent of the relaxation times.
In this study, the MRI was mainly used to measure the oil signal intensity in each sample and to monitor
the oil saturation change during the experimental test. We made sure that the NMR signal is only
sensitive to oil. Indeed, both water and oil contain protons 1H and produce NMR signals that are acquired
in the same time. For this reason, we added a strong paramagnetic contrast agent (Mn2+) to reduce the
relaxation times of the water [16]. By taking an aqueous solution of MnCl2 at 0.01 mol/l, the relaxation
decay of the water phase could be greatly reduced: T2 of water fell from 3 s to below 1 ms. In this way
the signal of water disappeared so quickly that it was not possible to image it. However, MnCl2 is not
soluble in organic compounds, so there is no effect on the relaxation time of oil (~1 s). Therefore, the
signal of oil was the only measured signal. Consequently, instead of using pure water as the injection
phase, we used an aqueous solution of MnCl2 with a neglected T2 time. For the imaging sequences, it is
necessary to set the echo time TE between the transverse relaxation time T2 of the aqueous solution and
the oil (i.e. T2w << TE <<T2o) and to take a relatively large repetition time (TR ≃ T1o).
MR images are acquired using a slice selection procedure. By changing the orientation of the magnetic
field gradients in the imaging procedure, it is possible to obtain vertical sections along the axis of the
sample or horizontal axial sections. Subsequently we realized over time one vertical section (acquisition
time about 4 min) followed by 8 horizontal sections (acquisition time also about 4 min).
In this study, the mapping was done with the following acquisition parameters:
- Echo time TE: 15 ms for polystyrene beads and 5 ms for sand experiments.
24ème Congrès Français de Mécanique Brest, 26 au 30 Août 2019
- Time of repetition TR: 1 s.
- Field of View FOV: 50 × 50 mm2.
- Imaging matrix: 256 × 256 pixels with a resolution of 0.19 mm for 1 pixel.
- Slice thickness: 1 mm.
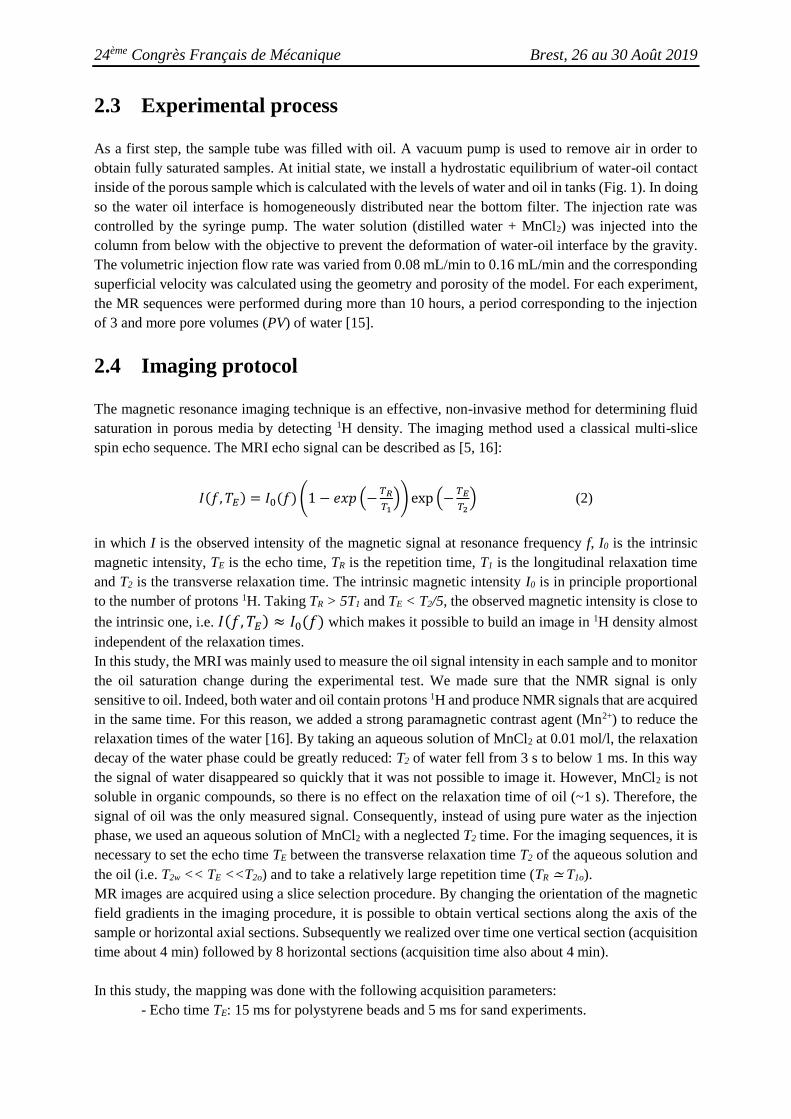
The obtained images were satisfactory from the point of view of high spatial resolution, and it is clearly
possible to visualize the oil trapping and the dynamic evolution of the two-phase flow (Fig. 3).
So
Figure 3: MRI vertical slice of a stack of polystyrene beads contained in a PVC tube and initially
saturated with oil. The aqueous solution of MnCl2 is injected from the bottom with a flow rate of 0.12
mL/min. The image is obtained after 3h45 of water injection. Water saturated regions appear in black
and those saturated with oil in white.
From the MR intensity images, the oil saturation can be calculated as following:
So = Ii / Iref (3)
where So is the saturation of the oil phase, Ii is the dynamic MR signal intensity at time i, I0 is the
reference MR signal intensity (initial image at oil saturation of 100%).
3 Results
The MRI raw data acquired are processed with Matlab software to obtain the visualization of the
displacement of the oil by the injected aqueous solution (water + manganese chloride). These images
have a resolution of 256 × 256 pixels for a field of view (FOV) of 5 x 5 cm2. The centre of the FOV for
vertical sections is located at 6.7 cm above the lower filter (bottom of the sample). For each model, data
are recorded on vertical and horizontal sections with an interval of 15 minutes between each series of
images. The recorded data are then processed with Matlab to retrieve the images on which statistical
analyzes can be done. To compare the tests at different rates, we introduce the porous volume parameter
(PV). It corresponds to the pore volume calculated from the height of the sample imaged by MRI.
24ème Congrès Français de Mécanique Brest, 26 au 30 Août 2019
3.1 Experiment with a packed polystyrene beads model
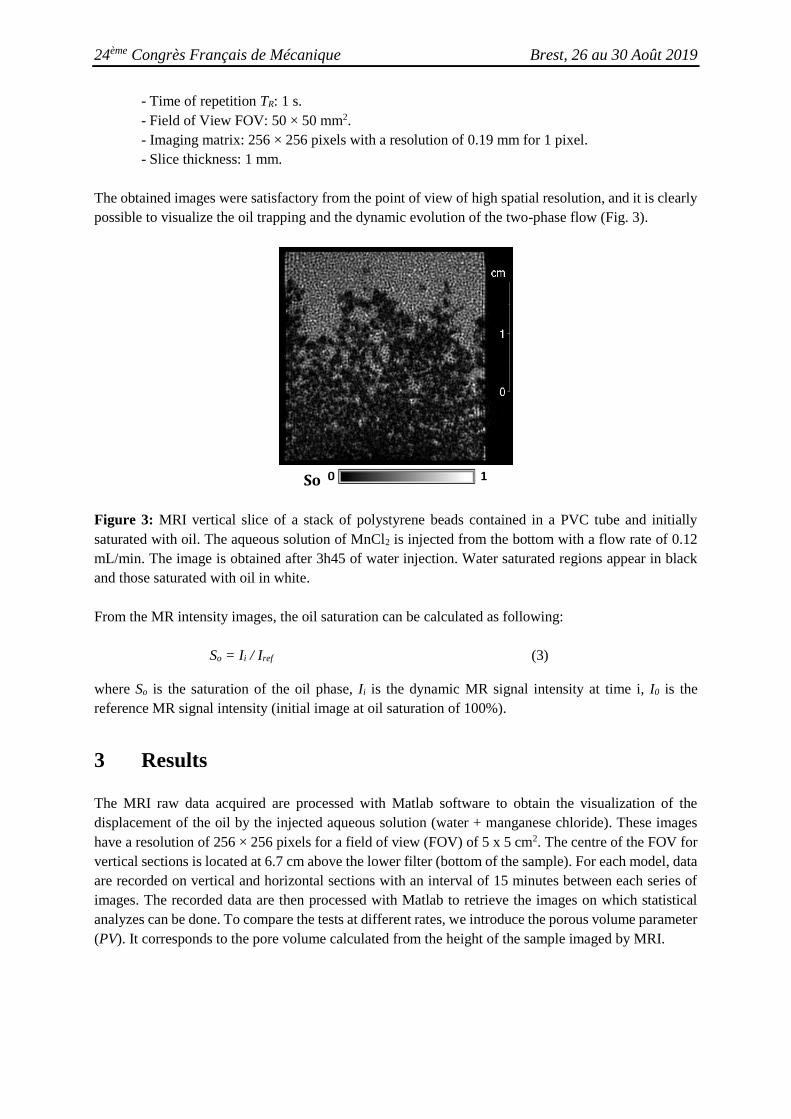
Figure 4 shows the consecutive series of images in vertical and horizontal directions, for the experiment
of the polystyrene beads model with the injection flow rate of 0.12 mL/min. The acquisition of MRI
signal was made each 15 minutes and shown here from the first water appearance in FOV. In this case
the first water appears around 3 hours after the start of the water injection.
Figure 4: Consecutive MRI images of the water–oil displacement in the model of polystyrene beads
with the injection flow rate of 0.12 mL/min. The oil is yellow and the water is light blue. The acquisition
of MRI signal was made each 15 minutes and shown here from the first water appearance in FOV. The
dotted line on the first vertical section indicates the position of the horizontal sections (and vice-versa
for the horizontal section below).
We note that the displacement of the oil by water does not correspond to a piston-like flow, but generates
fingers leading to a trapping of the oil during the two-phase flow. At the end of the displacement process,
the total residual oil saturation, averaged through the sample volume, is equal to 38%. Indeed, the
residual oil saturation obtained at the end of the process is an average saturation throughout the model,
while it is observed that the saturation is not uniformly distributed. It is therefore necessary to observe
in detail what happens at each position along of the model.
The analysis of the last image (Fig. 5) where the oil saturation was stabilized, shows an increasing
distribution of the residual oil saturation as a function of the vertical position. However, it is easy to
observe that the residual oil saturation is much greater in the higher sections of the model than in the
lower ones. These differences are caused by the development of fingerings along the model. We also
note that the continuous field of low oil saturation, observed in Figure 5(a) in light blue colour,
corresponds to the oil film left on the surface of the polystyrene beads. The variation of saturation of
these zones depends on the thickness of these films and the interactions between oil, water and surface
of the beads. Therefore, a distinction was made between these oil films and the oil trapped due to the
development of fingerings.
24ème Congrès Français de Mécanique Brest, 26 au 30 Août 2019
a) b)
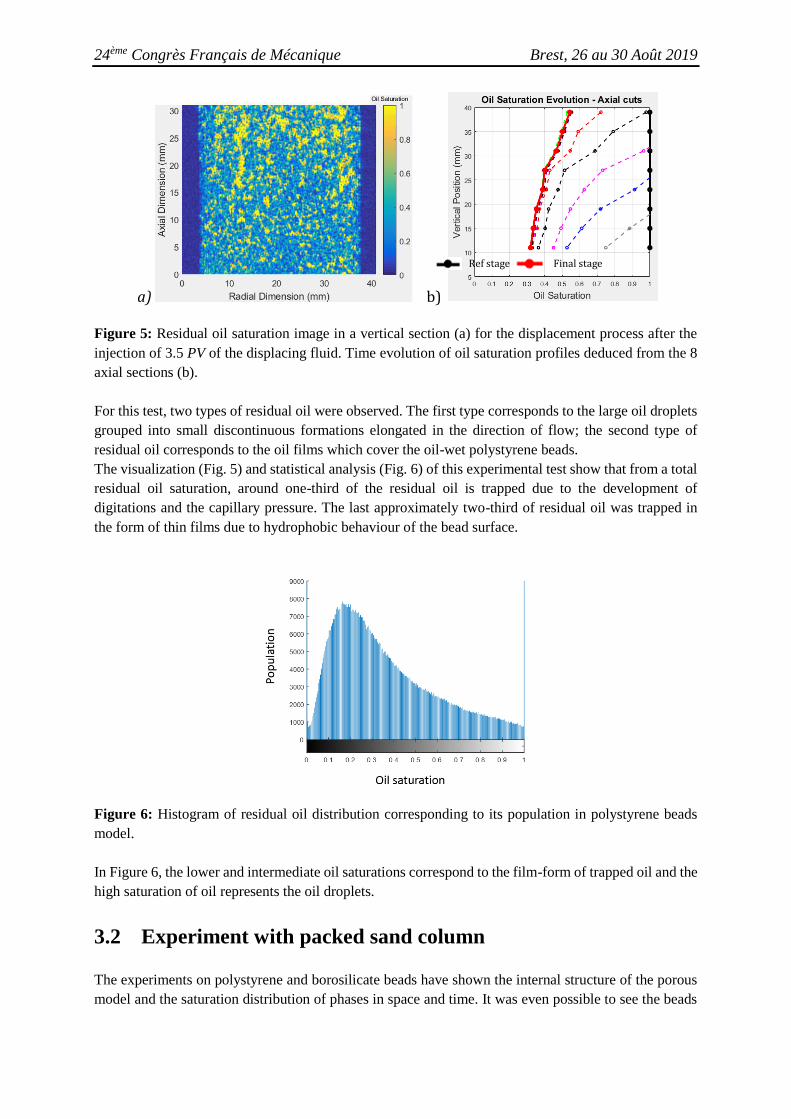
Figure 5: Residual oil saturation image in a vertical section (a) for the displacement process after the
injection of 3.5 PV of the displacing fluid. Time evolution of oil saturation profiles deduced from the 8
axial sections (b).
For this test, two types of residual oil were observed. The first type corresponds to the large oil droplets
grouped into small discontinuous formations elongated in the direction of flow; the second type of
residual oil corresponds to the oil films which cover the oil-wet polystyrene beads.
The visualization (Fig. 5) and statistical analysis (Fig. 6) of this experimental test show that from a total
residual oil saturation, around one-third of the residual oil is trapped due to the development of
digitations and the capillary pressure. The last approximately two-third of residual oil was trapped in
the form of thin films due to hydrophobic behaviour of the bead surface.
Figure 6: Histogram of residual oil distribution corresponding to its population in polystyrene beads
model.
In Figure 6, the lower and intermediate oil saturations correspond to the film-form of trapped oil and the
high saturation of oil represents the oil droplets.
3.2 Experiment with packed sand column
The experiments on polystyrene and borosilicate beads have shown the internal structure of the porous
model and the saturation distribution of phases in space and time. It was even possible to see the beads
Ref stage Final stage
24ème Congrès Français de Mécanique Brest, 26 au 30 Août 2019
of 0.6 mm diameter with the spatial resolution of MRI tool of 0.19 mm for 1 pixel. Unfortunately, this
size of grains of porous medium does not allow for the capillary forces to be important because of the
large diameter of the pores. To study the simultaneous effect of the viscous, capillary and gravity forces,
we have to reduce the grain size and also use some particle-size distribution. For this purpose, we used
silica sand, and the experiments were done at different injection rates (0.08, 0.12 and 0.16 mL/min). The
concentration of the manganese chloride was increased two times (0.02 mole/L) due to the small
adsorption effect of the sand on the solution.
Reference images of the sand model were acquired before starting the experiments in order to check its
compatibility with our imaging protocols. As the impact of the system on the signal and especially on
the relaxation times was not too important, the sand model was deemed acceptable. The sand was
compacted using a vibrating table, and an estimation of the porosity and the permeability was done.
The oil extraction by water flooding in the packed sand model was performed with the same injection
rates than in the polystyrene bead model, i.e. 0.08, 0.12 and 0.16 mL/min. The experiments were
repeated several times for each rate to check reproducibility.
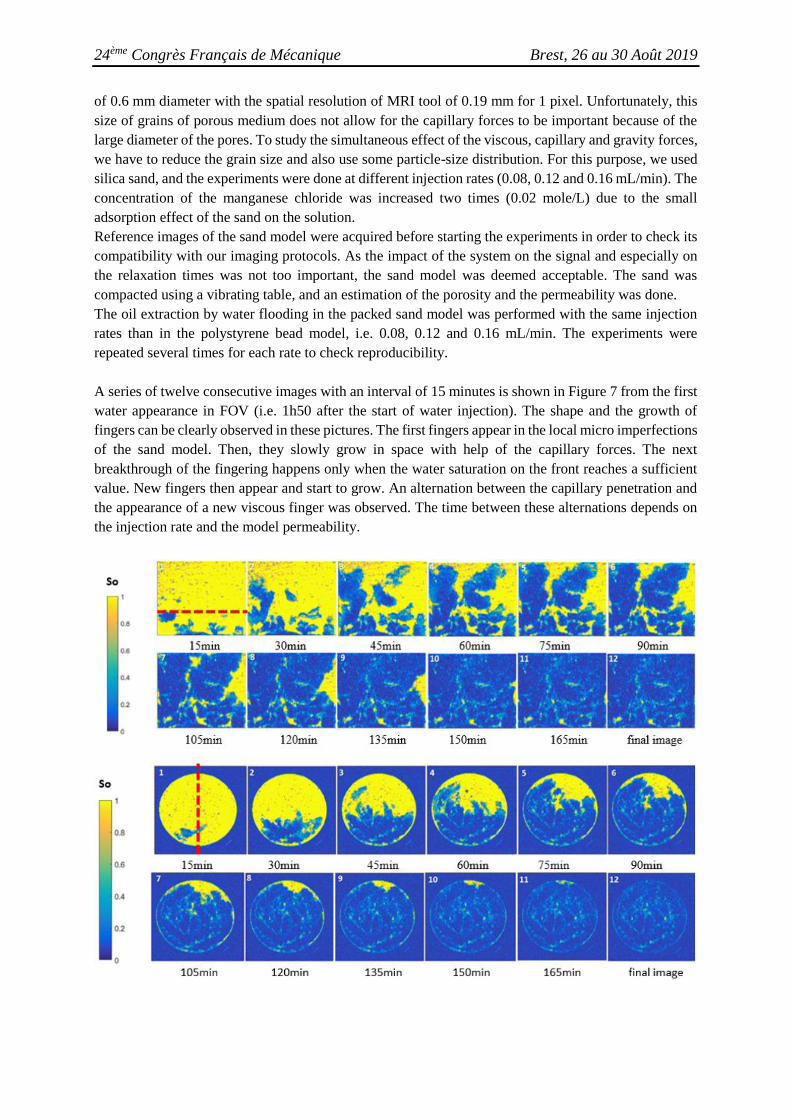
A series of twelve consecutive images with an interval of 15 minutes is shown in Figure 7 from the first
water appearance in FOV (i.e. 1h50 after the start of water injection). The shape and the growth of
fingers can be clearly observed in these pictures. The first fingers appear in the local micro imperfections
of the sand model. Then, they slowly grow in space with help of the capillary forces. The next
breakthrough of the fingering happens only when the water saturation on the front reaches a sufficient
value. New fingers then appear and start to grow. An alternation between the capillary penetration and
the appearance of a new viscous finger was observed. The time between these alternations depends on
the injection rate and the model permeability.
24ème Congrès Français de Mécanique Brest, 26 au 30 Août 2019
Figure 7: Consecutive MRI images of the water–oil displacement in the model of packed sand column
with the injection flow rate of 0.12 mL/min. The oil is yellow and the water is blue. The time interval
between each image equals 15 minutes from the first water appearance in FOV. The dotted line on the
first vertical section indicates the position of the horizontal sections (and vice-versa for the horizontal
section below).
The vertical and horizontal cross-sections from Figure 7 show that the loss of connectivity of the oil
phase between the water fingers leads to the formation of the trapped oil. For this experiment the final
residual oil saturation after injection of 3 pore volumes of water equals to 11 %.
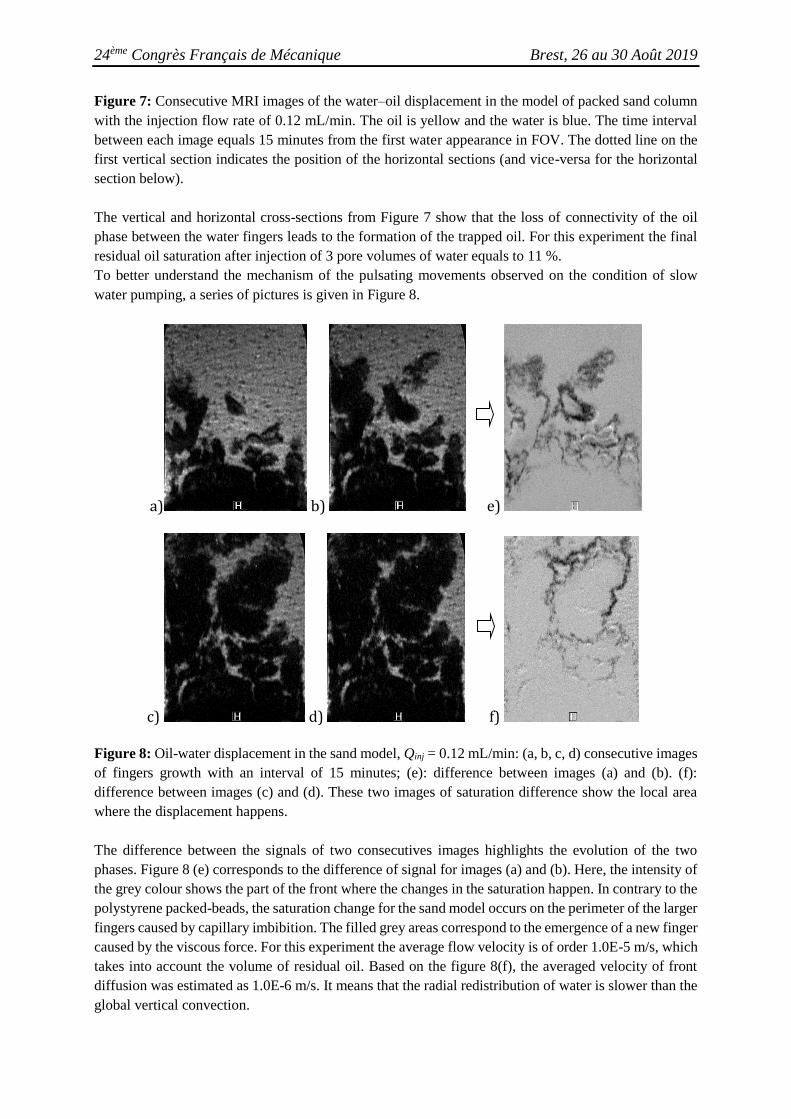
To better understand the mechanism of the pulsating movements observed on the condition of slow
water pumping, a series of pictures is given in Figure 8.
a) b) e)
c) d) f)
Figure 8: Oil-water displacement in the sand model, Qinj = 0.12 mL/min: (a, b, c, d) consecutive images
of fingers growth with an interval of 15 minutes; (e): difference between images (a) and (b). (f):
difference between images (c) and (d). These two images of saturation difference show the local area
where the displacement happens.
The difference between the signals of two consecutives images highlights the evolution of the two
phases. Figure 8 (e) corresponds to the difference of signal for images (a) and (b). Here, the intensity of
the grey colour shows the part of the front where the changes in the saturation happen. In contrary to the
polystyrene packed-beads, the saturation change for the sand model occurs on the perimeter of the larger
fingers caused by capillary imbibition. The filled grey areas correspond to the emergence of a new finger
caused by the viscous force. For this experiment the average flow velocity is of order 1.0E-5 m/s, which
takes into account the volume of residual oil. Based on the figure 8(f), the averaged velocity of front
diffusion was estimated as 1.0E-6 m/s. It means that the radial redistribution of water is slower than the
global vertical convection.
24ème Congrès Français de Mécanique Brest, 26 au 30 Août 2019
The water flooding experiments on sand were made with different flow rates. The observed process was
similar, with difference in the size of the fingers and the interval of alternation with the capillary
penetration. Saturation profiles along the vertical axis were reconstructed from vertical images for each
acquisition step.
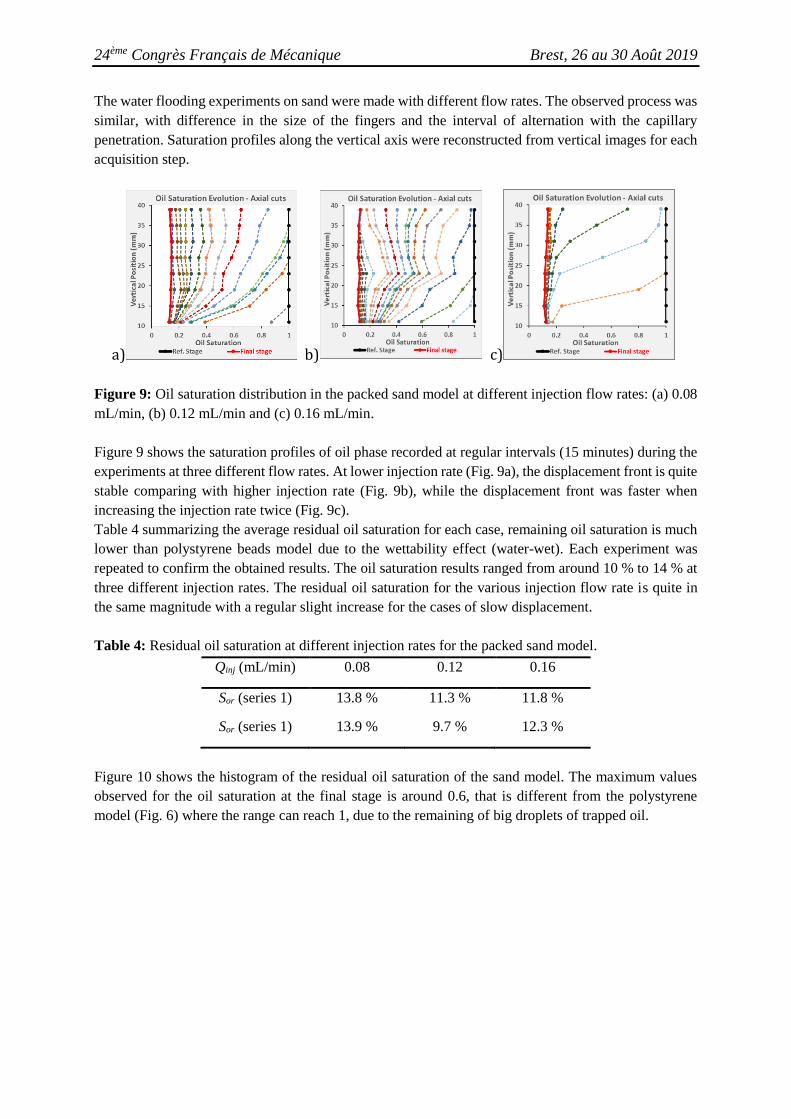
a) b) c)
Figure 9: Oil saturation distribution in the packed sand model at different injection flow rates: (a) 0.08
mL/min, (b) 0.12 mL/min and (c) 0.16 mL/min.
Figure 9 shows the saturation profiles of oil phase recorded at regular intervals (15 minutes) during the
experiments at three different flow rates. At lower injection rate (Fig. 9a), the displacement front is quite
stable comparing with higher injection rate (Fig. 9b), while the displacement front was faster when
increasing the injection rate twice (Fig. 9c).
Table 4 summarizing the average residual oil saturation for each case, remaining oil saturation is much
lower than polystyrene beads model due to the wettability effect (water-wet). Each experiment was
repeated to confirm the obtained results. The oil saturation results ranged from around 10 % to 14 % at
three different injection rates. The residual oil saturation for the various injection flow rate is quite in
the same magnitude with a regular slight increase for the cases of slow displacement.
Table 4: Residual oil saturation at different injection rates for the packed sand model.
Qinj (mL/min) 0.08 0.12 0.16
Sor (series 1) 13.8 % 11.3 % 11.8 %
Sor (series 1) 13.9 % 9.7 % 12.3 %
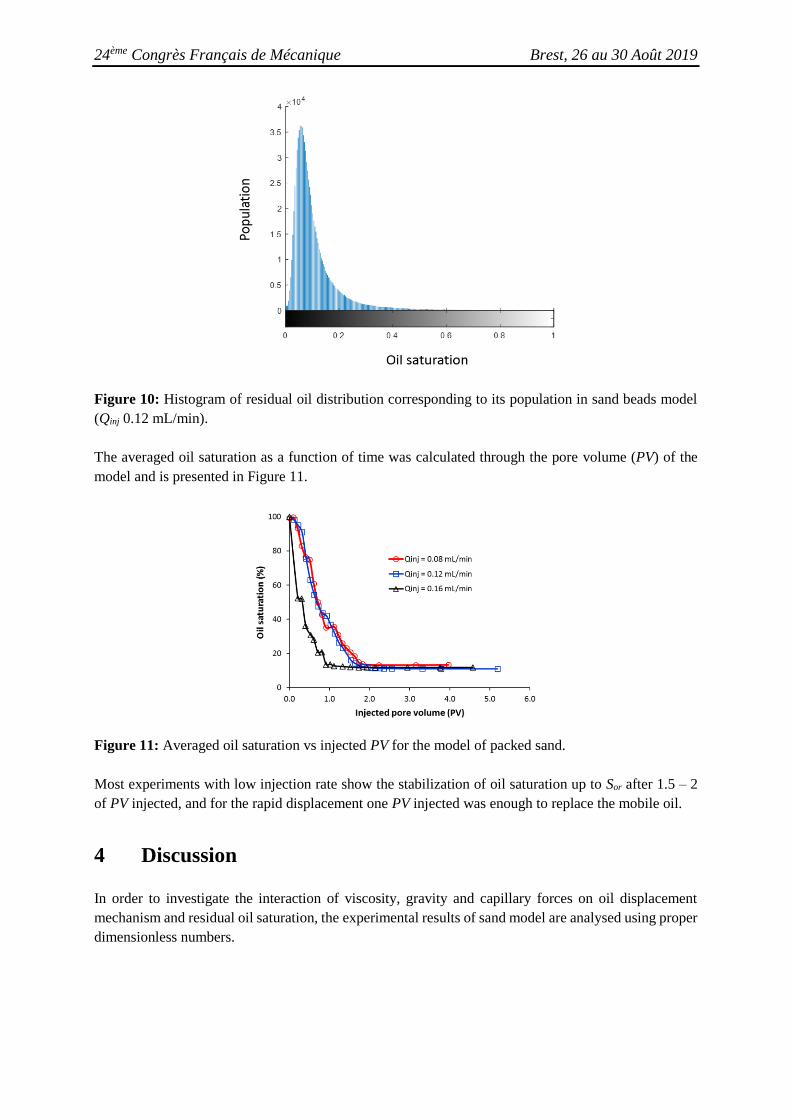
Figure 10 shows the histogram of the residual oil saturation of the sand model. The maximum values
observed for the oil saturation at the final stage is around 0.6, that is different from the polystyrene
model (Fig. 6) where the range can reach 1, due to the remaining of big droplets of trapped oil.
24ème Congrès Français de Mécanique Brest, 26 au 30 Août 2019
Figure 10: Histogram of residual oil distribution corresponding to its population in sand beads model
(Qinj 0.12 mL/min).
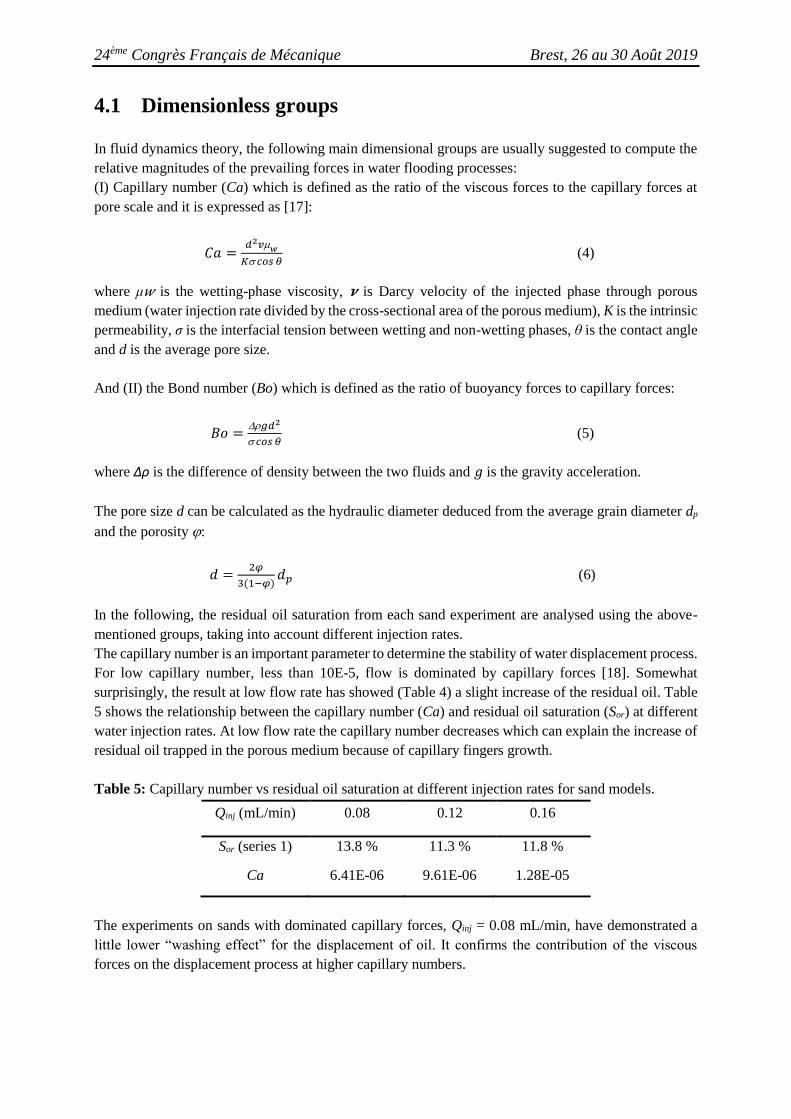
The averaged oil saturation as a function of time was calculated through the pore volume (PV) of the
model and is presented in Figure 11.
Figure 11: Averaged oil saturation vs injected PV for the model of packed sand.
Most experiments with low injection rate show the stabilization of oil saturation up to Sor after 1.5 – 2
of PV injected, and for the rapid displacement one PV injected was enough to replace the mobile oil.
4 Discussion
In order to investigate the interaction of viscosity, gravity and capillary forces on oil displacement
mechanism and residual oil saturation, the experimental results of sand model are analysed using proper
dimensionless numbers.
24ème Congrès Français de Mécanique Brest, 26 au 30 Août 2019
4.1 Dimensionless groups
In fluid dynamics theory, the following main dimensional groups are usually suggested to compute the
relative magnitudes of the prevailing forces in water flooding processes:
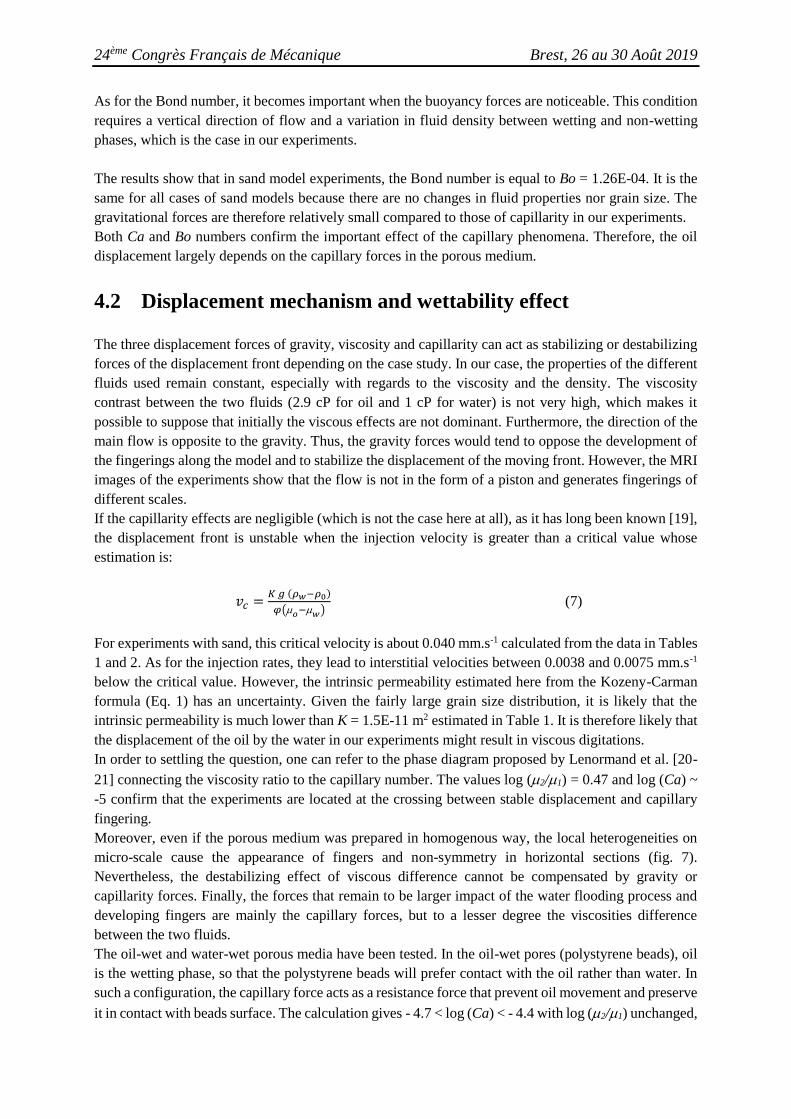
(I) Capillary number (Ca) which is defined as the ratio of the viscous forces to the capillary forces at
pore scale and it is expressed as [17]:
𝐶𝑎 =𝑑2𝑣𝑤
𝐾 𝑐𝑜𝑠 𝜃 (4)
where μ𝑤 is the wetting-phase viscosity, 𝝂 is Darcy velocity of the injected phase through porous
medium (water injection rate divided by the cross-sectional area of the porous medium), K is the intrinsic
permeability, σ is the interfacial tension between wetting and non-wetting phases, θ is the contact angle
and d is the average pore size.
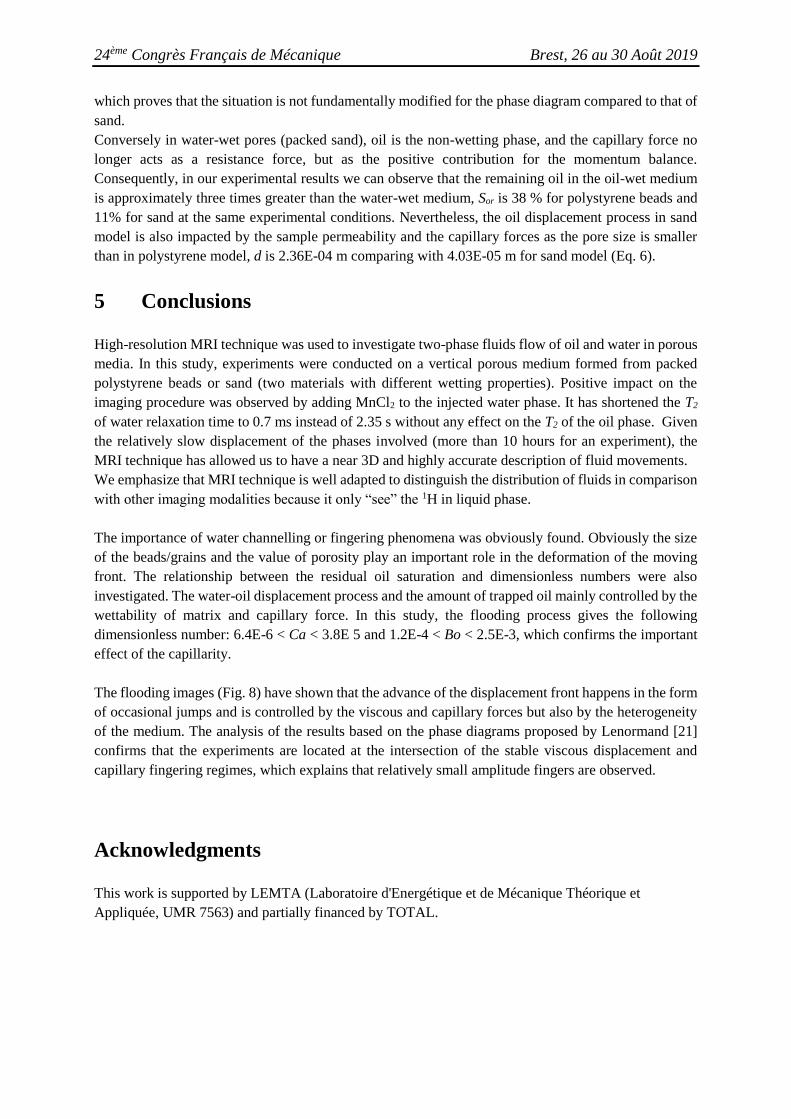
And (II) the Bond number (Bo) which is defined as the ratio of buoyancy forces to capillary forces:
𝐵𝑜 =𝑔𝑑2
𝑐𝑜𝑠 𝜃 (5)
where Δρ is the difference of density between the two fluids and 𝑔 is the gravity acceleration.
The pore size d can be calculated as the hydraulic diameter deduced from the average grain diameter dp
and the porosity :
𝑑 =2𝜑
3(1−𝜑)𝑑𝑝 (6)
In the following, the residual oil saturation from each sand experiment are analysed using the above-
mentioned groups, taking into account different injection rates.
The capillary number is an important parameter to determine the stability of water displacement process.
For low capillary number, less than 10E-5, flow is dominated by capillary forces [18]. Somewhat
surprisingly, the result at low flow rate has showed (Table 4) a slight increase of the residual oil. Table
5 shows the relationship between the capillary number (Ca) and residual oil saturation (Sor) at different
water injection rates. At low flow rate the capillary number decreases which can explain the increase of
residual oil trapped in the porous medium because of capillary fingers growth.
Table 5: Capillary number vs residual oil saturation at different injection rates for sand models.
Qinj (mL/min) 0.08 0.12 0.16
Sor (series 1) 13.8 % 11.3 % 11.8 %
Ca 6.41E-06 9.61E-06 1.28E-05
The experiments on sands with dominated capillary forces, Qinj = 0.08 mL/min, have demonstrated a
little lower “washing effect” for the displacement of oil. It confirms the contribution of the viscous
forces on the displacement process at higher capillary numbers.
24ème Congrès Français de Mécanique Brest, 26 au 30 Août 2019
As for the Bond number, it becomes important when the buoyancy forces are noticeable. This condition
requires a vertical direction of flow and a variation in fluid density between wetting and non-wetting
phases, which is the case in our experiments.
The results show that in sand model experiments, the Bond number is equal to Bo = 1.26E-04. It is the
same for all cases of sand models because there are no changes in fluid properties nor grain size. The
gravitational forces are therefore relatively small compared to those of capillarity in our experiments.
Both Ca and Bo numbers confirm the important effect of the capillary phenomena. Therefore, the oil
displacement largely depends on the capillary forces in the porous medium.
4.2 Displacement mechanism and wettability effect
The three displacement forces of gravity, viscosity and capillarity can act as stabilizing or destabilizing
forces of the displacement front depending on the case study. In our case, the properties of the different
fluids used remain constant, especially with regards to the viscosity and the density. The viscosity
contrast between the two fluids (2.9 cP for oil and 1 cP for water) is not very high, which makes it
possible to suppose that initially the viscous effects are not dominant. Furthermore, the direction of the
main flow is opposite to the gravity. Thus, the gravity forces would tend to oppose the development of
the fingerings along the model and to stabilize the displacement of the moving front. However, the MRI
images of the experiments show that the flow is not in the form of a piston and generates fingerings of
different scales.
If the capillarity effects are negligible (which is not the case here at all), as it has long been known [19],
the displacement front is unstable when the injection velocity is greater than a critical value whose
estimation is:
𝑣𝑐 =𝐾 𝑔 (𝜌𝑤−𝜌0)
𝜑(𝑜−𝑤) (7)
For experiments with sand, this critical velocity is about 0.040 mm.s-1 calculated from the data in Tables
1 and 2. As for the injection rates, they lead to interstitial velocities between 0.0038 and 0.0075 mm.s-1
below the critical value. However, the intrinsic permeability estimated here from the Kozeny-Carman
formula (Eq. 1) has an uncertainty. Given the fairly large grain size distribution, it is likely that the
intrinsic permeability is much lower than K = 1.5E-11 m2 estimated in Table 1. It is therefore likely that
the displacement of the oil by the water in our experiments might result in viscous digitations.
In order to settling the question, one can refer to the phase diagram proposed by Lenormand et al. [20-
21] connecting the viscosity ratio to the capillary number. The values log (2/1) = 0.47 and log (Ca) ~
-5 confirm that the experiments are located at the crossing between stable displacement and capillary
fingering.
Moreover, even if the porous medium was prepared in homogenous way, the local heterogeneities on
micro-scale cause the appearance of fingers and non-symmetry in horizontal sections (fig. 7).
Nevertheless, the destabilizing effect of viscous difference cannot be compensated by gravity or
capillarity forces. Finally, the forces that remain to be larger impact of the water flooding process and
developing fingers are mainly the capillary forces, but to a lesser degree the viscosities difference
between the two fluids.
The oil-wet and water-wet porous media have been tested. In the oil-wet pores (polystyrene beads), oil
is the wetting phase, so that the polystyrene beads will prefer contact with the oil rather than water. In
such a configuration, the capillary force acts as a resistance force that prevent oil movement and preserve
it in contact with beads surface. The calculation gives - 4.7 < log (Ca) < - 4.4 with log (2/1) unchanged,
24ème Congrès Français de Mécanique Brest, 26 au 30 Août 2019
which proves that the situation is not fundamentally modified for the phase diagram compared to that of
sand.
Conversely in water-wet pores (packed sand), oil is the non-wetting phase, and the capillary force no
longer acts as a resistance force, but as the positive contribution for the momentum balance.
Consequently, in our experimental results we can observe that the remaining oil in the oil-wet medium
is approximately three times greater than the water-wet medium, Sor is 38 % for polystyrene beads and
11% for sand at the same experimental conditions. Nevertheless, the oil displacement process in sand
model is also impacted by the sample permeability and the capillary forces as the pore size is smaller
than in polystyrene model, d is 2.36E-04 m comparing with 4.03E-05 m for sand model (Eq. 6).
5 Conclusions
High-resolution MRI technique was used to investigate two-phase fluids flow of oil and water in porous
media. In this study, experiments were conducted on a vertical porous medium formed from packed
polystyrene beads or sand (two materials with different wetting properties). Positive impact on the
imaging procedure was observed by adding MnCl2 to the injected water phase. It has shortened the T2
of water relaxation time to 0.7 ms instead of 2.35 s without any effect on the T2 of the oil phase. Given
the relatively slow displacement of the phases involved (more than 10 hours for an experiment), the
MRI technique has allowed us to have a near 3D and highly accurate description of fluid movements.
We emphasize that MRI technique is well adapted to distinguish the distribution of fluids in comparison
with other imaging modalities because it only “see” the 1H in liquid phase.
The importance of water channelling or fingering phenomena was obviously found. Obviously the size
of the beads/grains and the value of porosity play an important role in the deformation of the moving
front. The relationship between the residual oil saturation and dimensionless numbers were also
investigated. The water-oil displacement process and the amount of trapped oil mainly controlled by the
wettability of matrix and capillary force. In this study, the flooding process gives the following
dimensionless number: 6.4E-6 < Ca < 3.8E 5 and 1.2E-4 < Bo < 2.5E-3, which confirms the important
effect of the capillarity.
The flooding images (Fig. 8) have shown that the advance of the displacement front happens in the form
of occasional jumps and is controlled by the viscous and capillary forces but also by the heterogeneity
of the medium. The analysis of the results based on the phase diagrams proposed by Lenormand [21]
confirms that the experiments are located at the intersection of the stable viscous displacement and
capillary fingering regimes, which explains that relatively small amplitude fingers are observed.
Acknowledgments
This work is supported by LEMTA (Laboratoire d'Energétique et de Mécanique Théorique et
Appliquée, UMR 7563) and partially financed by TOTAL.
24ème Congrès Français de Mécanique Brest, 26 au 30 Août 2019
References
[1] Akin, S. and Kovscek, A.R., Computed tomography in petroleum engineering research, in
Application of X-ray computed tomography in the geosciences, Geological Society, London, Special
Publication, vol. 215, (2003), pp. 23-38.
[2] F.Larachi, R.Hannaoui, P. Horgue, F.Augier, Y.Haroun, S.Youssef, E.Rosenberg, M.Prat,
M.Quintard, X-ray micro-tomography and pore network modeling of single-phase fixed-bed reactors,
Chemical Engineering Journal, vol. 240, (2014), pp. 290-306.
[3] T. Pak, I.B. Butler, S. Geiger, M.I.J Van Dijke, K. S. Sabie, Droplet fragmentation: a new pore-scale
process, Proceedings of the national Academy of Sciences, 112 (7), (2015), pp. 1947-1952.
[4] D. Bernard, 3D Quantification of Pore Scale Geometrical Changes Using Synchrotron Computed
microtomography, Oil & Gas Science and Technology, Vol. 60, (2005), pp. 747-762.
[5] S. Chen, K-H. Kim, F. Qin, A.T. Watson, Quantitative NMR imaging of multiphase flow in porous
media, Magnetic Resonance Imaging Vol. 10, (1992), pp. 815-826.
[6] Y. Zhao, Y. Song, Y. Liu, H. Liang, B. Dou, Visualization and Measurement of CO2 Flooding in
Porous Media Using MRI, Industrial & Engineering Chemistry Research, Vol. 50, (2011), pp. 4707-
4715.
[7] Y. Zhao, Y. Song, Experimental investigation on spontaneous counter-current imbibition in water-
wet natural reservoir sandstone core using MRI, Magnetic Resonance in Chemistry, Vol. 55, (2016), pp.
546-552.
[8] J. Mitchell, T.C. Chandrasekera, D.J. Holland, L.F. Gladden, E.J. Fordham, Magnetic resonance
imaging in laboratory petrophysical core analysis, Physics Reports, Vol. 526, (2013), pp. 165-225.
[9] M. Li, L. Romero-Zerón, F. Marica, B. J. Balcom, Polymer Flooding Enhanced Oil Recovery
Evaluated with Magnetic Resonance Imaging and Relaxation Time Measurements, Energy Fuels, Vol.
31, (2017), pp. 4904-4914.
[10] Johns, M. L. and Gladden, L.F., Magnetic resonance imaging study of the dissolution kinetics of
octanol in porous media, Colloid and Interface Science, 210, (1999), 261–270.
[11] Ersland, G., Fernø, M.A., A. Graue, Baldwin, B.A., Stevens, J., Complementary imaging of oil
recovery mechanisms in fractured reservoirs, Chemical Engineering Journal, 158, (2010), 32–38.
[12] W. Salameh, S. Leclerc, D. Stemmelen, J.M Escanye, NMR Imaging of Water Flow in Packed
Beds, diffusion-fundamentals.org 14 (5), (2010), pp 1-5.
[13] Panfilova, I. and Panfilov, M. (2005) Phenomenological meniscus model for two-phase flow
through porous media. Transport in Porous Media, 58(1), (2005), 87-119.
[14] S. Zeppieri, J. Rodriguez, and A. L. Lopez de Ramos, Interfacial Tension of Alkane + Water
Sustems. Chemical Engineering Journal, 46, (2001), 1086-1088.
[15] J. Fannir, S. Leclerc, I. Panfilova, D. Stemmelen, Two-Phase Displacement In Porous Media
Studied By MRI Techniques, 16th European Conference on the Mathematics of Oil Recovery, (2018),
pp. 1-13.
[16] J. Yan, X. Luo, W. Wang, F. Chen, R. Toussaint, J. Schmittbuhl, G. Vasseur, L. Zhang, Testing oil
saturation distribution in migration paths using MRI, Journal of petroleum Science and Engineering 86-
87, (2012), pp. 237-245.
[17] G. Løvoll, Y. Meheust, K. Jørgen Maløy, E. Aker, J. Schmittbuhl, Competition of gravity, capillary
and viscous forces during drainage in a two-dimensional porous medium, a pore scale study. Energy 30,
(2005), 861–872.
[18] M. J. Blunt, Multiphase flow in permeable media, Cambridge University Press, 2017.
[19] C. Marle, Cours de production, Les écoulements polyphasiques en milieu poreux, tome 4, Technip,
1972.

24ème Congrès Français de Mécanique Brest, 26 au 30 Août 2019
[20] R. Lenormand, E. Touboul, C. Zarcone, Numerical models and experiments on immiscible
displacements in porous media, Journal Fluid Mechanics, 189 (1988), 165-187.
[21] R. Lenormand, Liquids in porous media, Journal of Physics: Condensed Matter, 2 (1990), 79-88.