MARIE SKLODOWSKA CURIE ACTIONS STATISTICS ITN -...
79
MARIE SKLODOWSKA CURIE ACTIONS STATISTICS ITN - INNOVATIVE TRAINING NETWORK 1
Transcript of MARIE SKLODOWSKA CURIE ACTIONS STATISTICS ITN -...
MARIE SKLODOWSKA CURIE ACTIONS
STATISTICS
ITN - INNOVATIVE TRAINING NETWORK
1
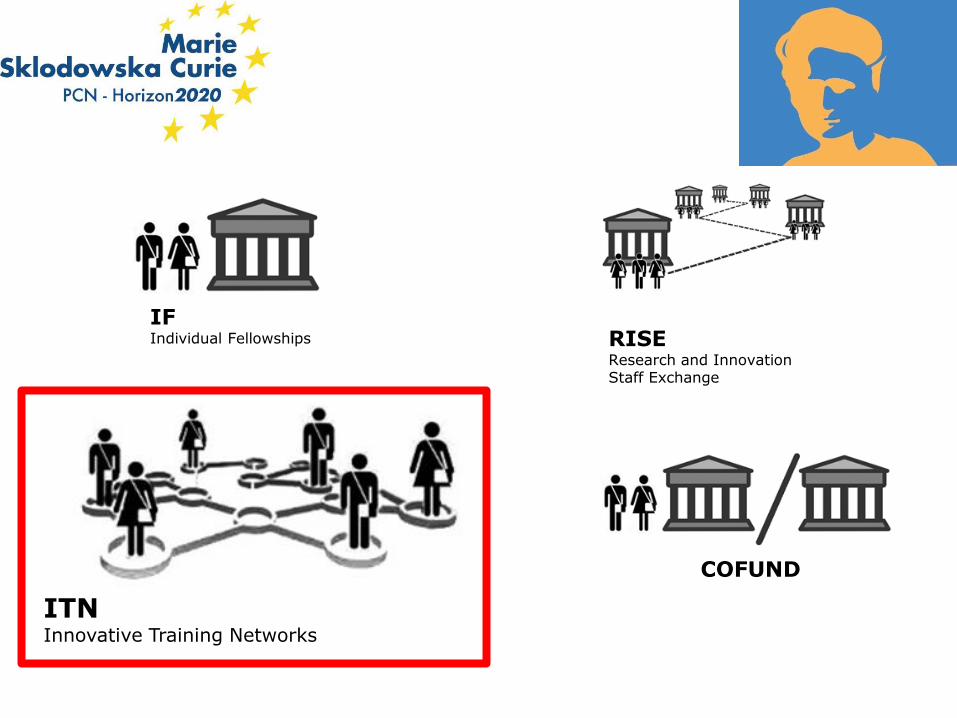
ITN Innovative Training Networks
IF Individual Fellowships RISE
Research and Innovation Staff Exchange
COFUND
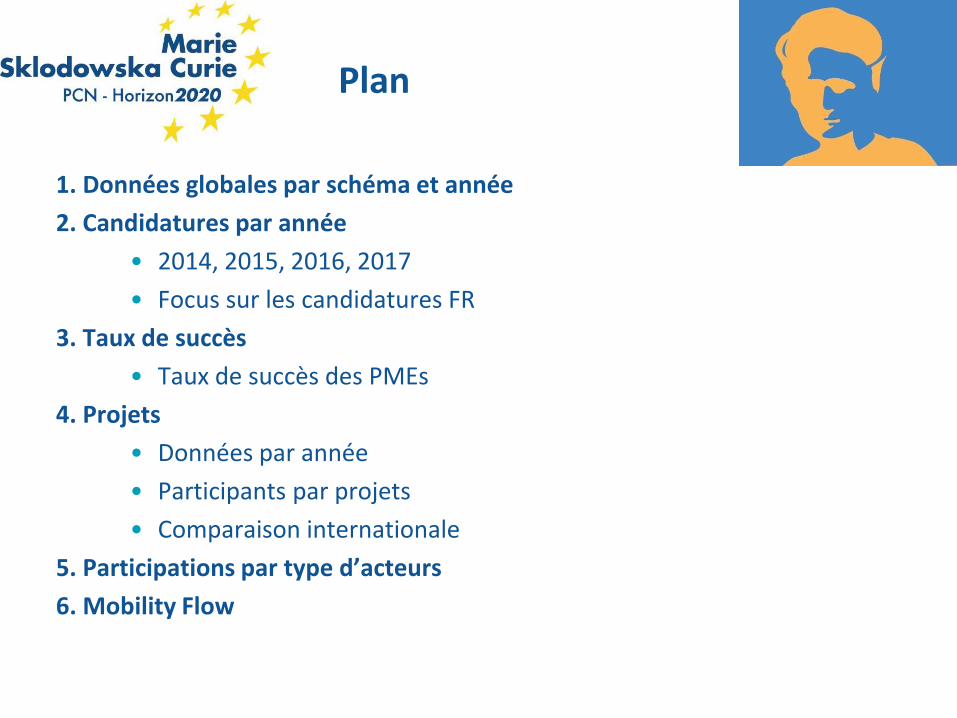
Plan
1. Données globales par schéma et année
2. Candidatures par année
• 2014, 2015, 2016, 2017
• Focus sur les candidatures FR
3. Taux de succès
• Taux de succès des PMEs
4. Projets
• Données par année
• Participants par projets
• Comparaison internationale
5. Participations par type d’acteurs
6. Mobility Flow
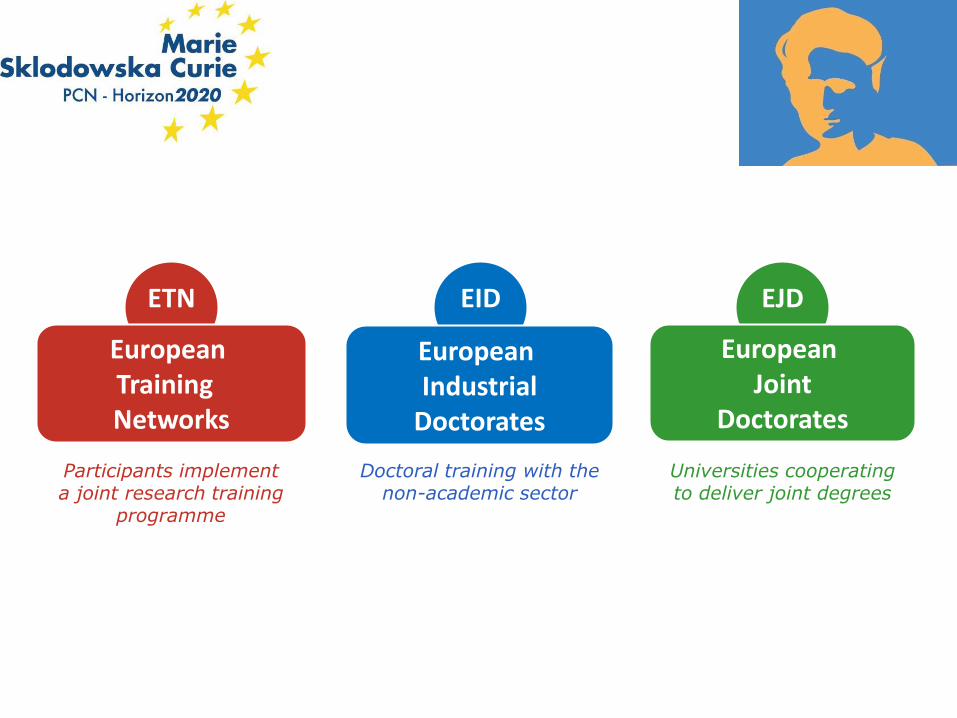
ETN EID EJD
European Training Networks
European Industrial
Doctorates
European Joint
Doctorates
Participants implement a joint research training
programme
Doctoral training with the non-academic sector
Universities cooperating to deliver joint degrees
1. DONNÉES GLOBALES PAR SCHÉMA ET PAR
ANNÉE
5
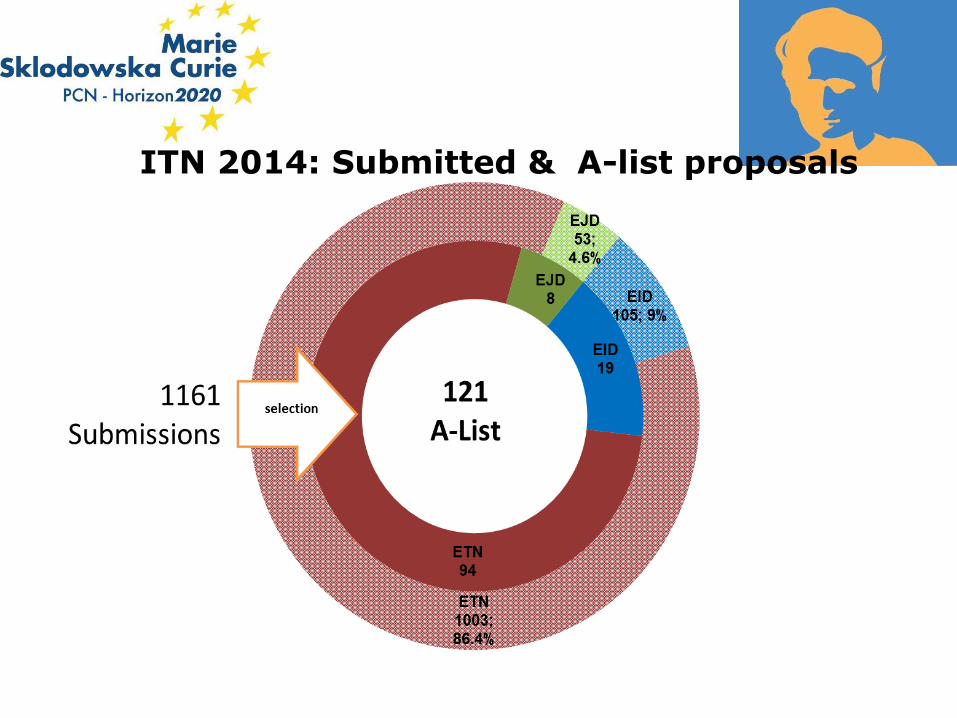
ITN 2014: Submitted & A-list proposals
selection
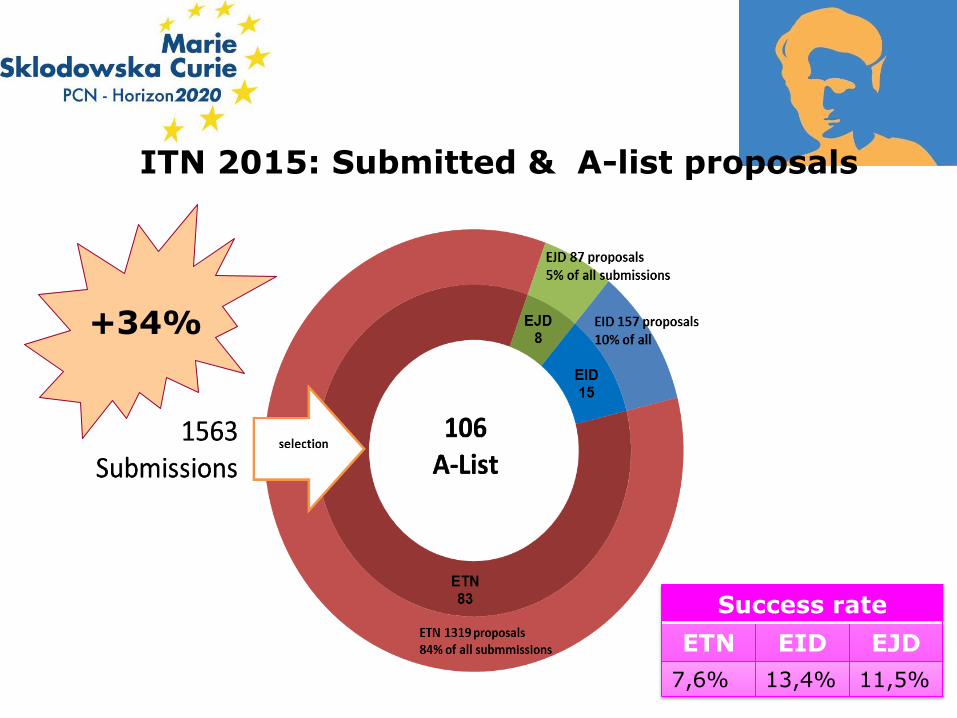
ITN 2015: Submitted & A-list proposals
+34%
Success rate
ETN EID EJD
7,6% 13,4% 11,5%
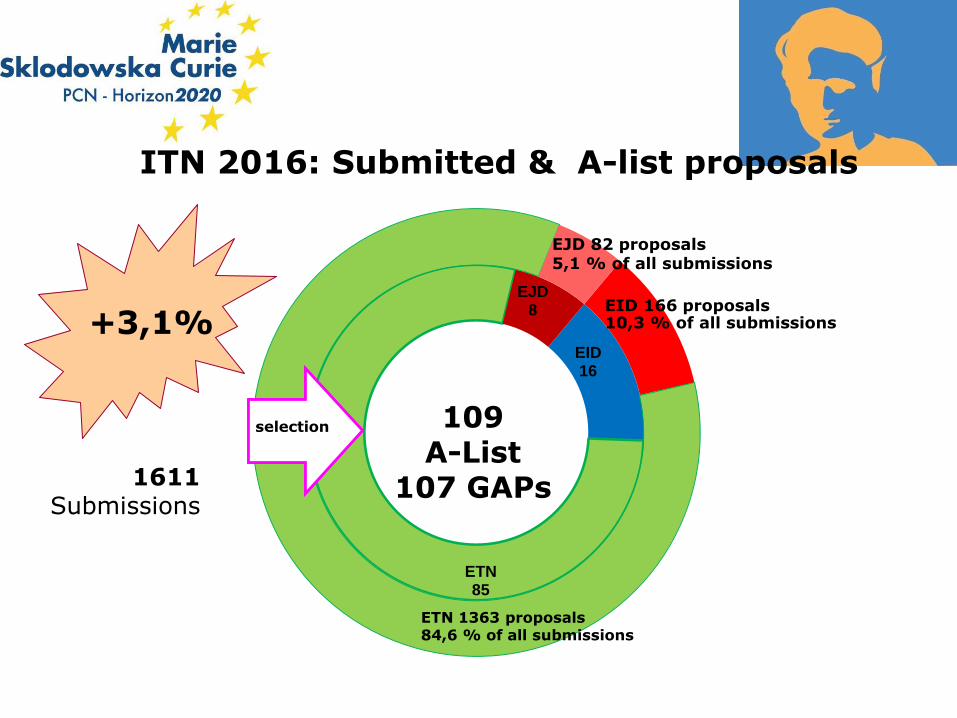
ETN 85
EJD 8
EID 16
selection
1611 Submissions
109 A-List
107 GAPs
selection
EJD 82 proposals 5,1 % of all submissions
EID 166 proposals 10,3 % of all submissions
ETN 1363 proposals 84,6 % of all submissions
ITN 2016: Submitted & A-list proposals
+3,1%
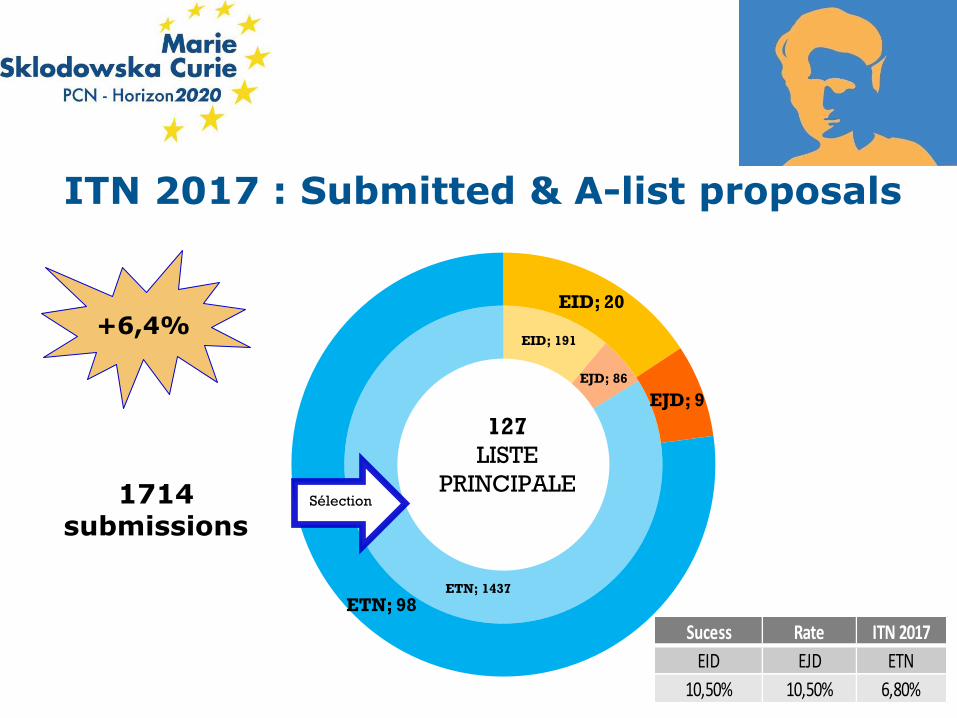
ITN 2017 : Submitted & A-list proposals
9
EID; 191
EJD; 86
ETN; 1437
EID; 20
EJD; 9
ETN; 98
127
LISTE
PRINCIPALE Sélection 1714
submissions
+6,4%
Sucess Rate ITN 2017
EID EJD ETN
10,50% 10,50% 6,80%
2. CANDIDATURES
10
• 2014 -2015 -2016-2017
11
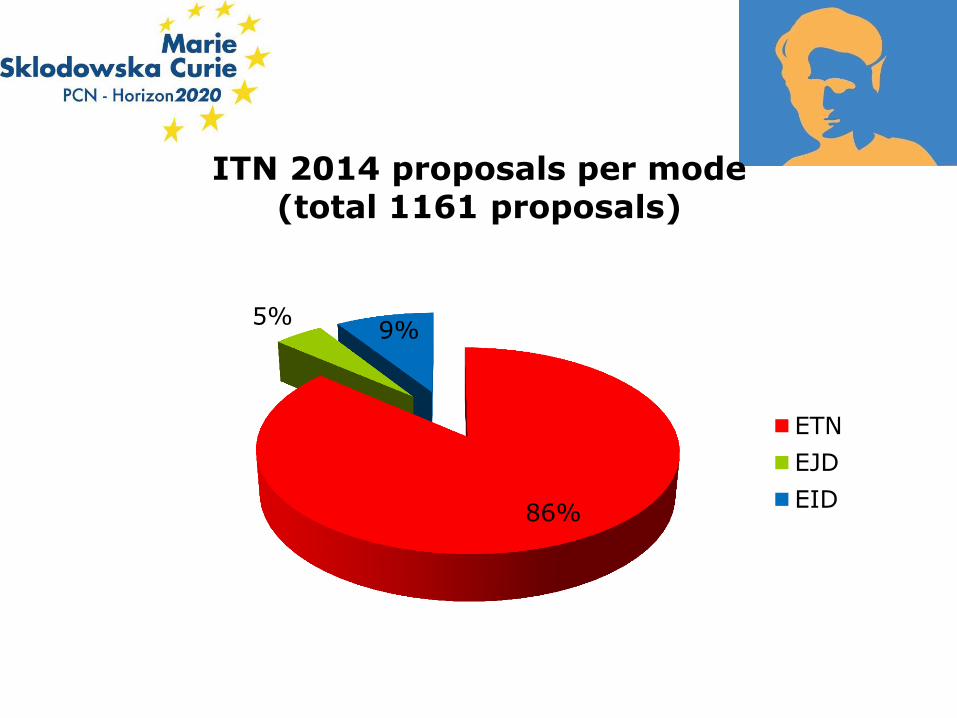
ITN 2014 proposals per mode (total 1161 proposals)
86%
5% 9%
ETN
EJD
EID
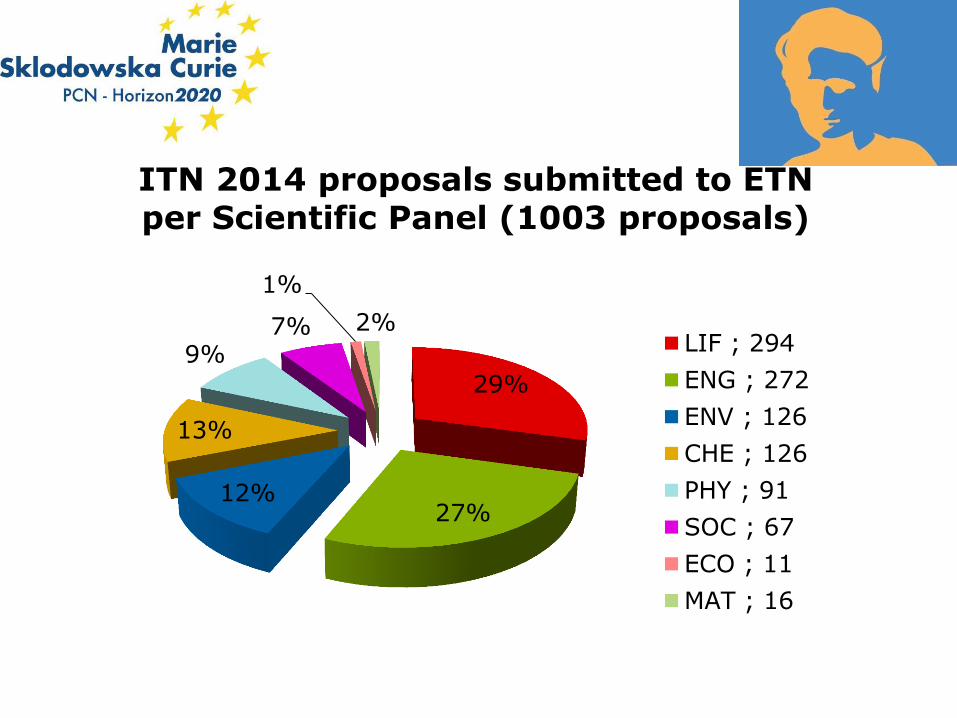
ITN 2014 proposals submitted to ETN per Scientific Panel (1003 proposals)
29%
27% 12%
13%
9% 7%
1%
2% LIF ; 294
ENG ; 272
ENV ; 126
CHE ; 126
PHY ; 91
SOC ; 67
ECO ; 11
MAT ; 16
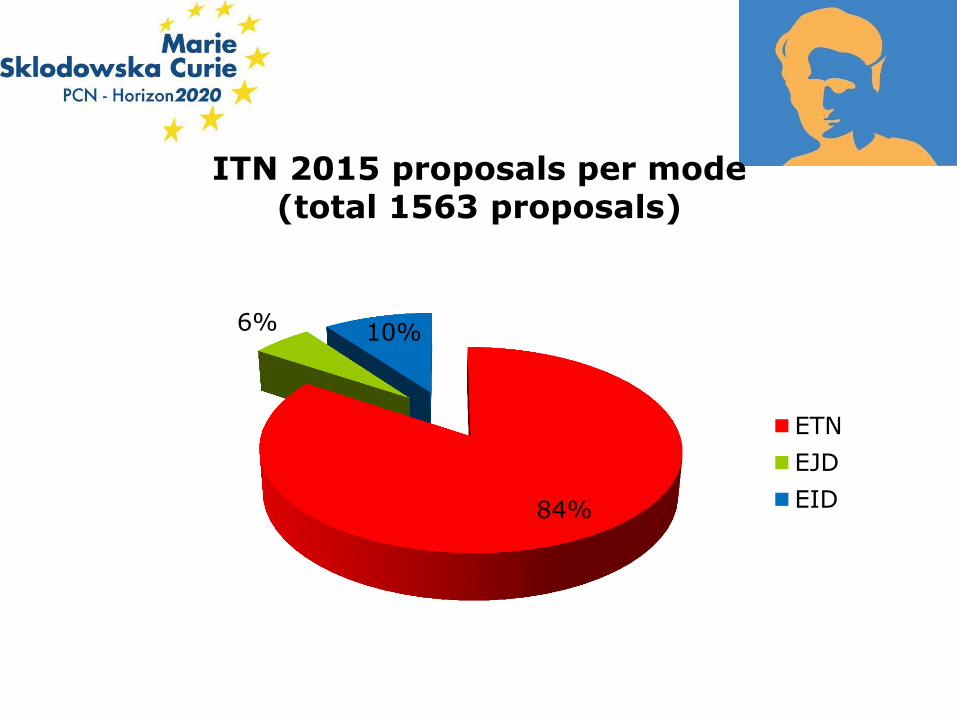
ITN 2015 proposals per mode (total 1563 proposals)
84%
6% 10%
ETN
EJD
EID
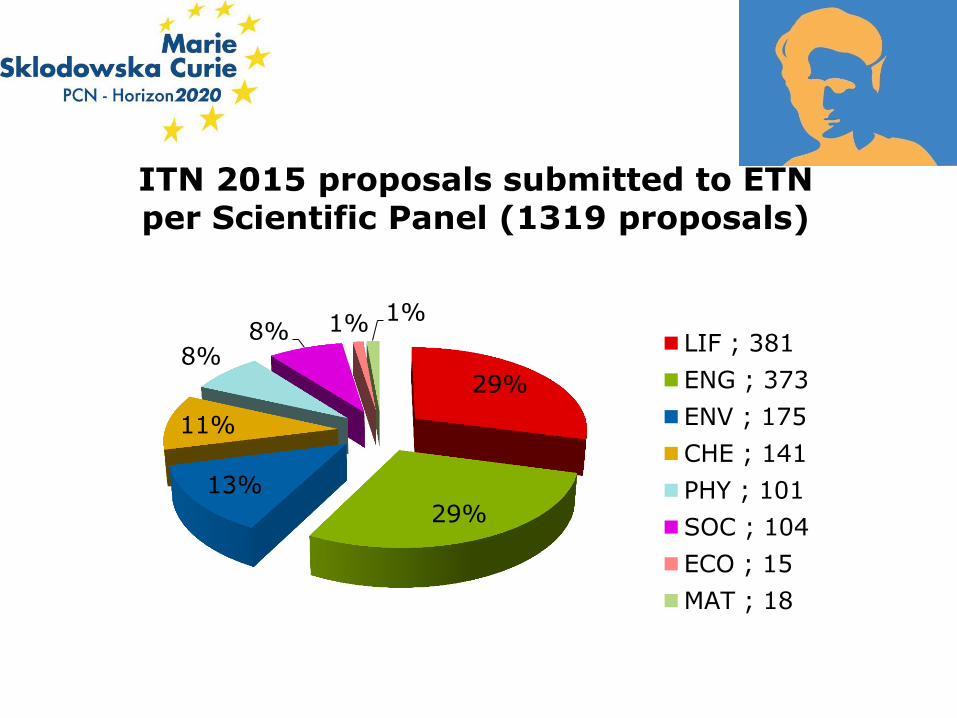
ITN 2015 proposals submitted to ETN per Scientific Panel (1319 proposals)
29%
29% 13%
11%
8% 8% 1% 1%
LIF ; 381
ENG ; 373
ENV ; 175
CHE ; 141
PHY ; 101
SOC ; 104
ECO ; 15
MAT ; 18

ITN 2016 proposals per mode (total 1611 proposals)
ETN; 1363
EID; 166
EJD; 82
ETN
EID
EJD
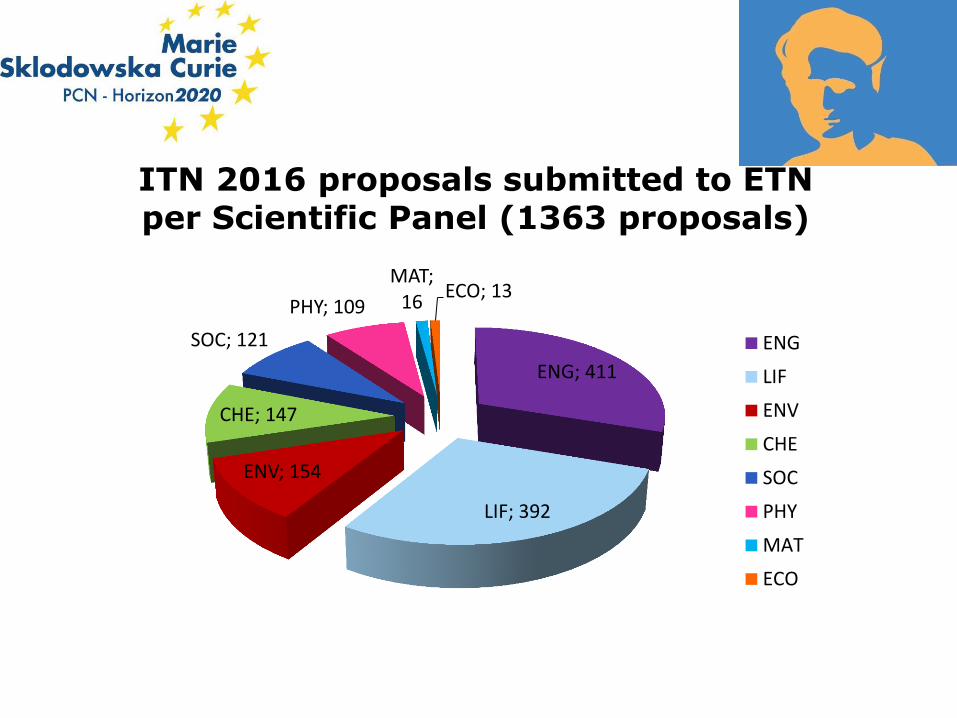
ITN 2016 proposals submitted to ETN per Scientific Panel (1363 proposals)
ENG; 411
LIF; 392
ENV; 154
CHE; 147
SOC; 121
PHY; 109
MAT; 16
ECO; 13
ENG
LIF
ENV
CHE
SOC
PHY
MAT
ECO
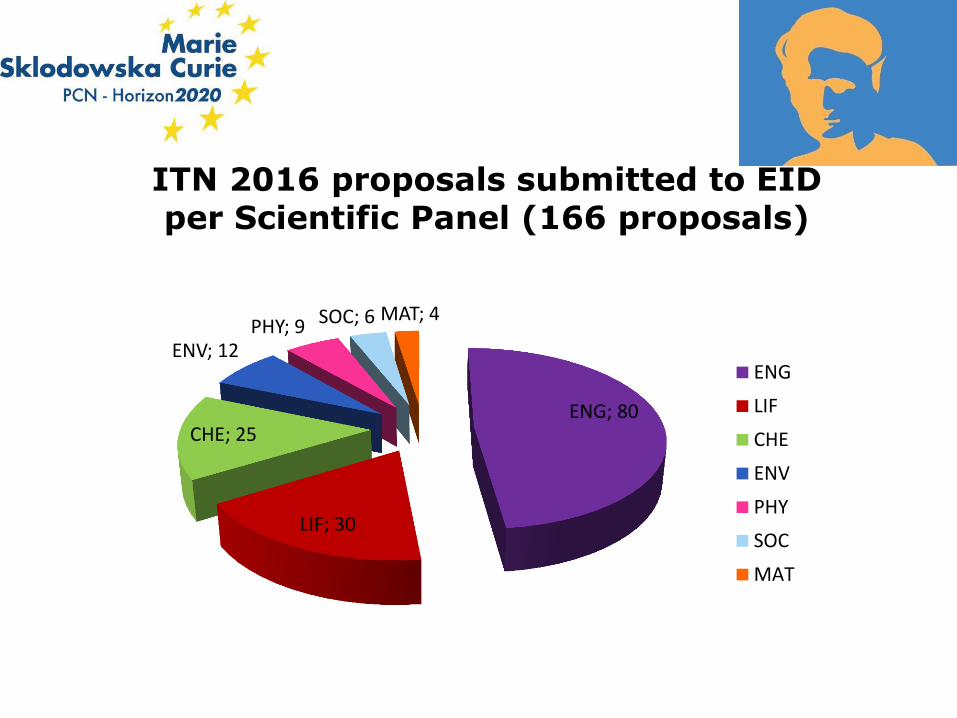
ITN 2016 proposals submitted to EID per Scientific Panel (166 proposals)
ENG; 80
LIF; 30
CHE; 25
ENV; 12 PHY; 9 SOC; 6 MAT; 4
ENG
LIF
CHE
ENV
PHY
SOC
MAT
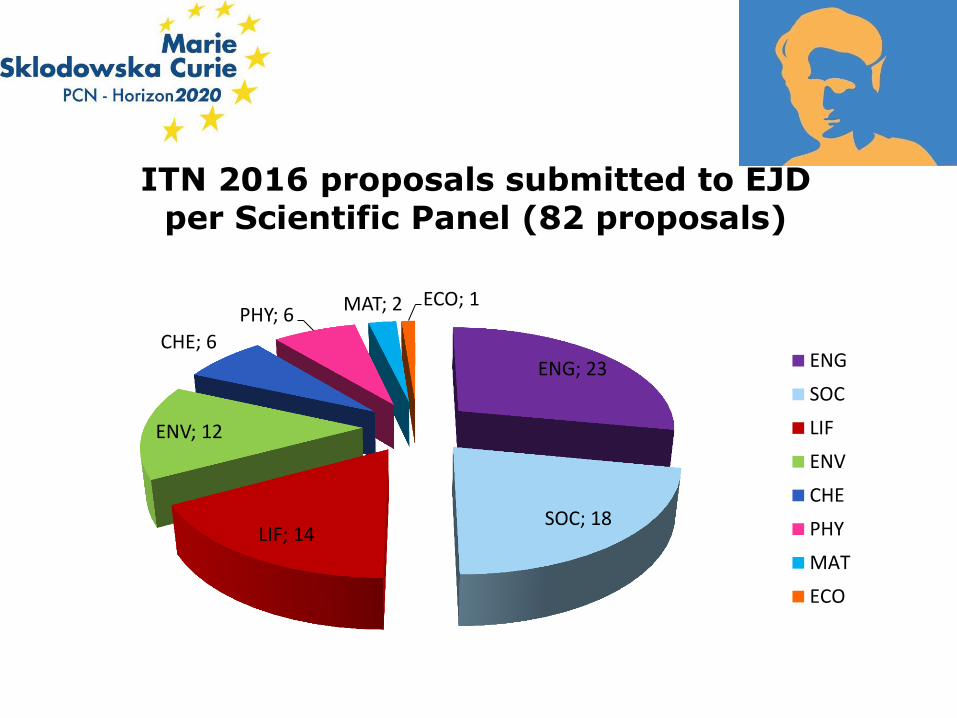
ITN 2016 proposals submitted to EJD per Scientific Panel (82 proposals)
ENG; 23
SOC; 18 LIF; 14
ENV; 12
CHE; 6
PHY; 6 MAT; 2 ECO; 1
ENG
SOC
LIF
ENV
CHE
PHY
MAT
ECO
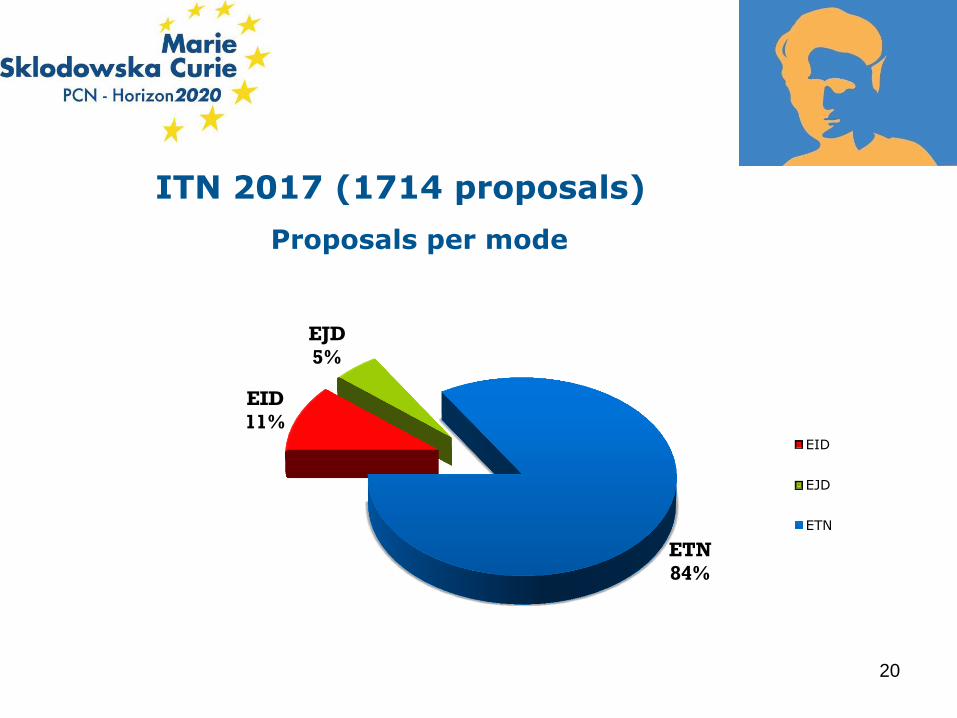
ITN 2017 (1714 proposals)
Proposals per mode
20
EID
11%
EJD
5%
ETN
84%
EID
EJD
ETN
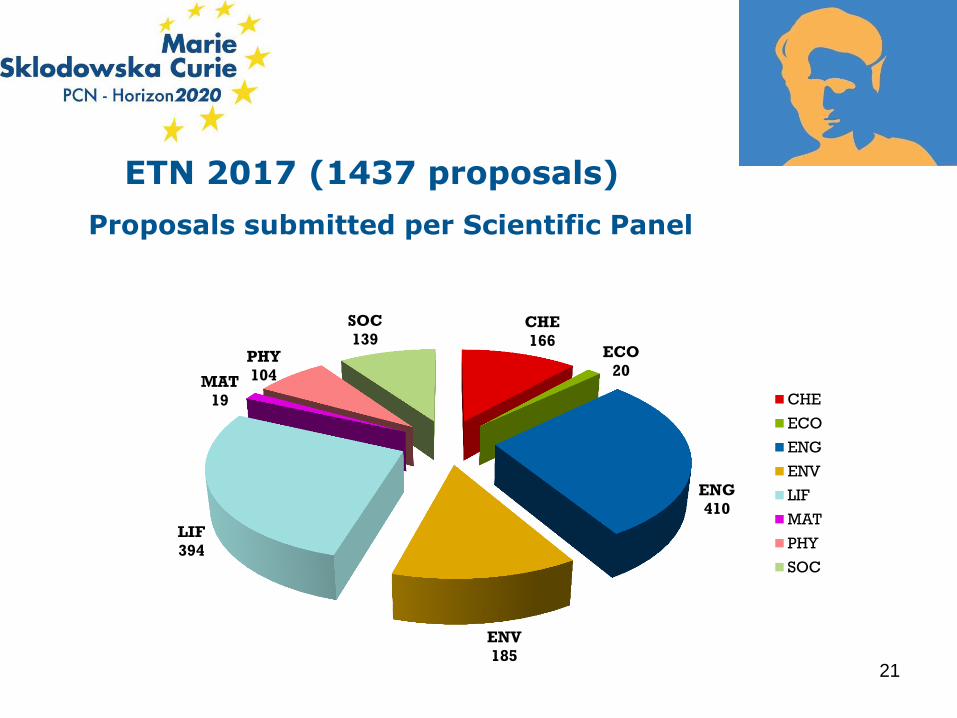
ETN 2017 (1437 proposals)
Proposals submitted per Scientific Panel
21
CHE
166 ECO
20
ENG
410
ENV
185
LIF
394
MAT
19
PHY
104
SOC
139
CHE
ECO
ENG
ENV
LIF
MAT
PHY
SOC
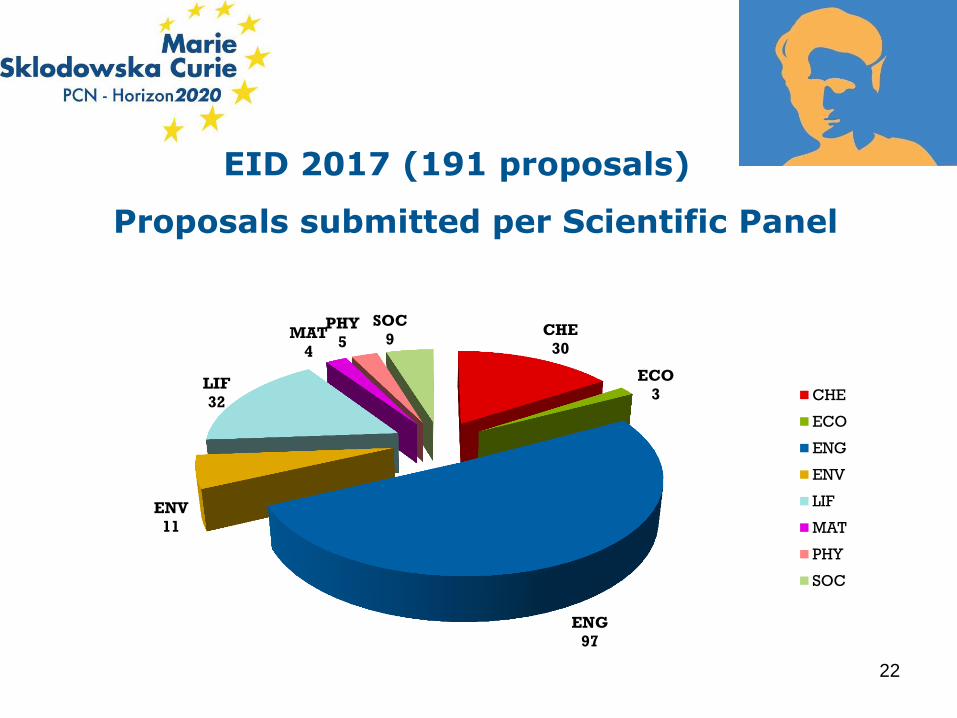
EID 2017 (191 proposals)
Proposals submitted per Scientific Panel
22
CHE
30
ECO
3
ENG
97
ENV
11
LIF
32
MAT
4
PHY
5
SOC
9
CHE
ECO
ENG
ENV
LIF
MAT
PHY
SOC
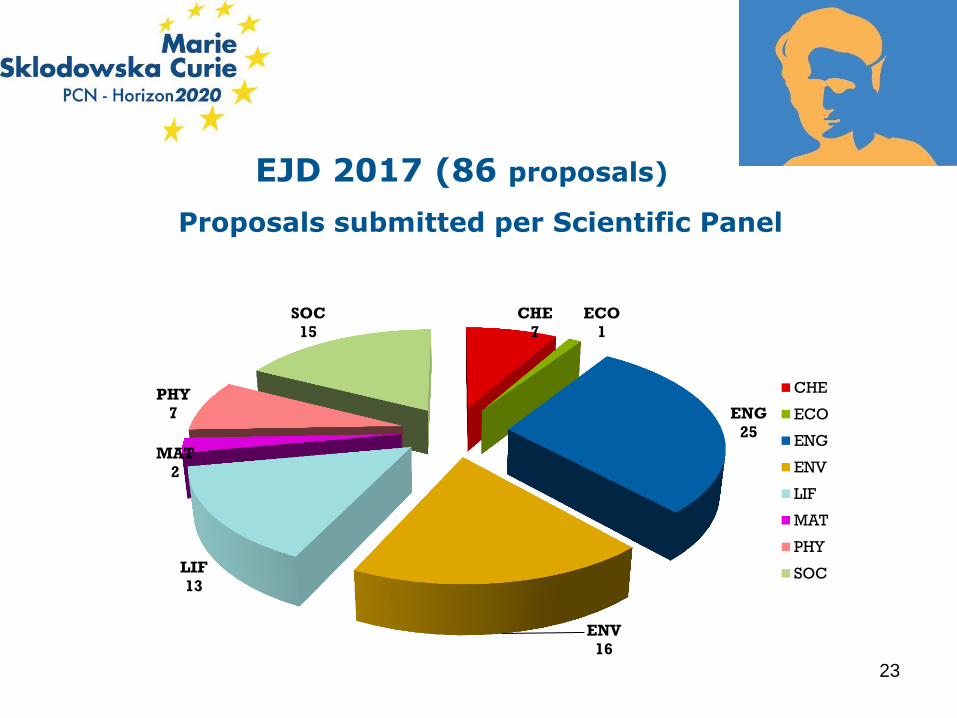
EJD 2017 (86 proposals)
Proposals submitted per Scientific Panel
23
CHE
7
ECO
1
ENG
25
ENV
16
LIF
13
MAT
2
PHY
7
SOC
15
CHE
ECO
ENG
ENV
LIF
MAT
PHY
SOC
• FOCUS SUR LES CANDIDATURES FRANÇAISES
24
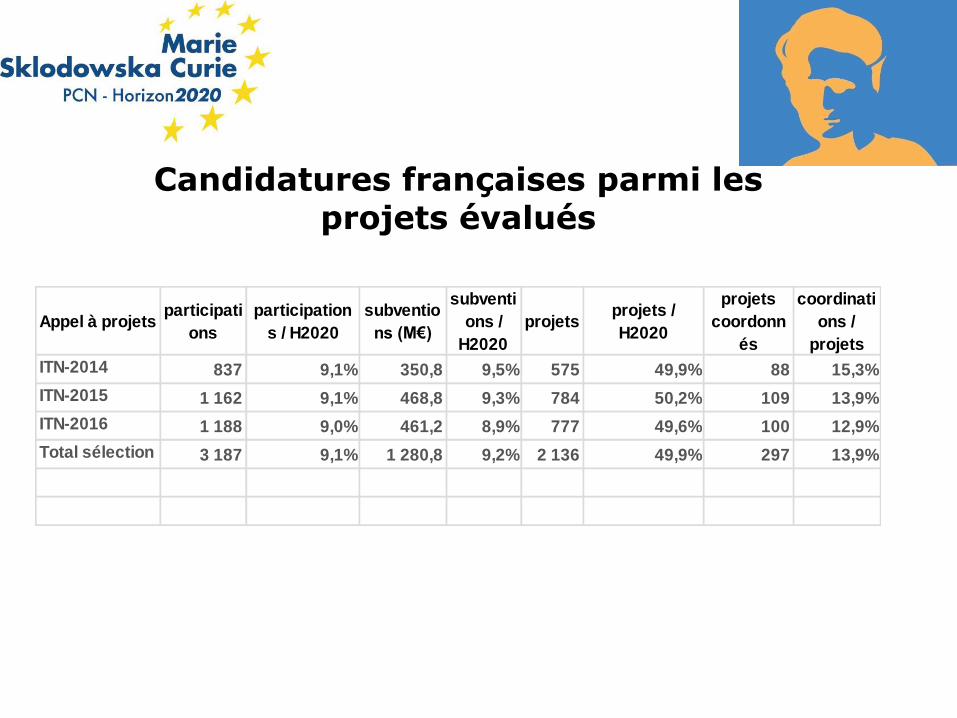
Candidatures françaises parmi les projets évalués
Appel à projetsparticipati
ons
participation
s / H2020
subventio
ns (M€)
subventi
ons /
H2020
projetsprojets /
H2020
projets
coordonn
és
coordinati
ons /
projets
ITN-2014 837 9,1% 350,8 9,5% 575 49,9% 88 15,3%
ITN-2015 1 162 9,1% 468,8 9,3% 784 50,2% 109 13,9%
ITN-2016 1 188 9,0% 461,2 8,9% 777 49,6% 100 12,9%
Total sélection 3 187 9,1% 1 280,8 9,2% 2 136 49,9% 297 13,9%
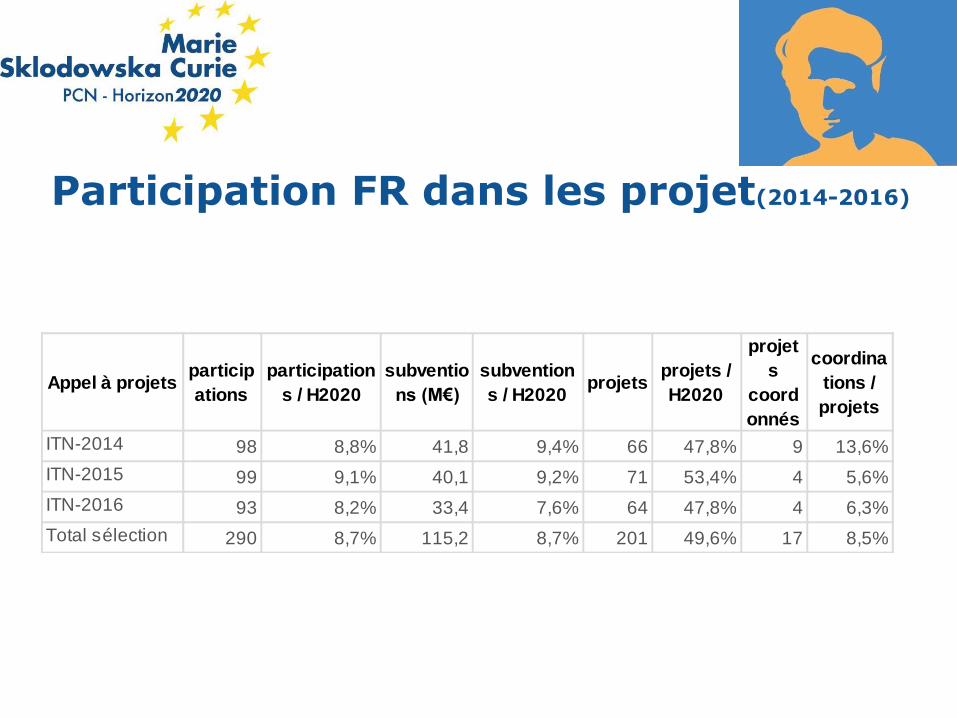
Participation FR dans les projet(2014-2016)
Appel à projetsparticip
ations
participation
s / H2020
subventio
ns (M€)
subvention
s / H2020projets
projets /
H2020
projet
s
coord
onnés
coordina
tions /
projets
ITN-2014 98 8,8% 41,8 9,4% 66 47,8% 9 13,6%
ITN-2015 99 9,1% 40,1 9,2% 71 53,4% 4 5,6%
ITN-2016 93 8,2% 33,4 7,6% 64 47,8% 4 6,3%
Total sélection 290 8,7% 115,2 8,7% 201 49,6% 17 8,5%
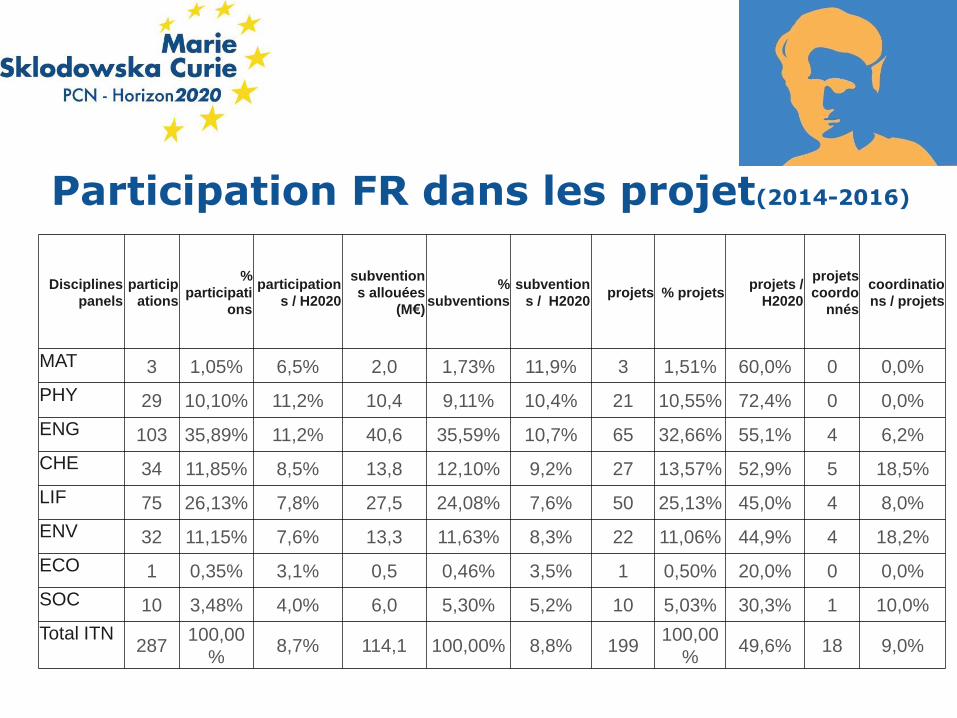
Participation FR dans les projet(2014-2016)
Disciplines
panels
particip
ations
%
participati
ons
participation
s / H2020
subvention
s allouées
(M€)
%
subventions
subvention
s / H2020 projets % projets
projets /
H2020
projets
coordo
nnés
coordinatio
ns / projets
MAT 3 1,05% 6,5% 2,0 1,73% 11,9% 3 1,51% 60,0% 0 0,0%
PHY 29 10,10% 11,2% 10,4 9,11% 10,4% 21 10,55% 72,4% 0 0,0%
ENG 103 35,89% 11,2% 40,6 35,59% 10,7% 65 32,66% 55,1% 4 6,2%
CHE 34 11,85% 8,5% 13,8 12,10% 9,2% 27 13,57% 52,9% 5 18,5%
LIF 75 26,13% 7,8% 27,5 24,08% 7,6% 50 25,13% 45,0% 4 8,0%
ENV 32 11,15% 7,6% 13,3 11,63% 8,3% 22 11,06% 44,9% 4 18,2%
ECO 1 0,35% 3,1% 0,5 0,46% 3,5% 1 0,50% 20,0% 0 0,0%
SOC 10 3,48% 4,0% 6,0 5,30% 5,2% 10 5,03% 30,3% 1 10,0%
Total ITN 287
100,00
% 8,7% 114,1 100,00% 8,8% 199
100,00
% 49,6% 18 9,0%
3. TAUX DE SUCCES
29
30
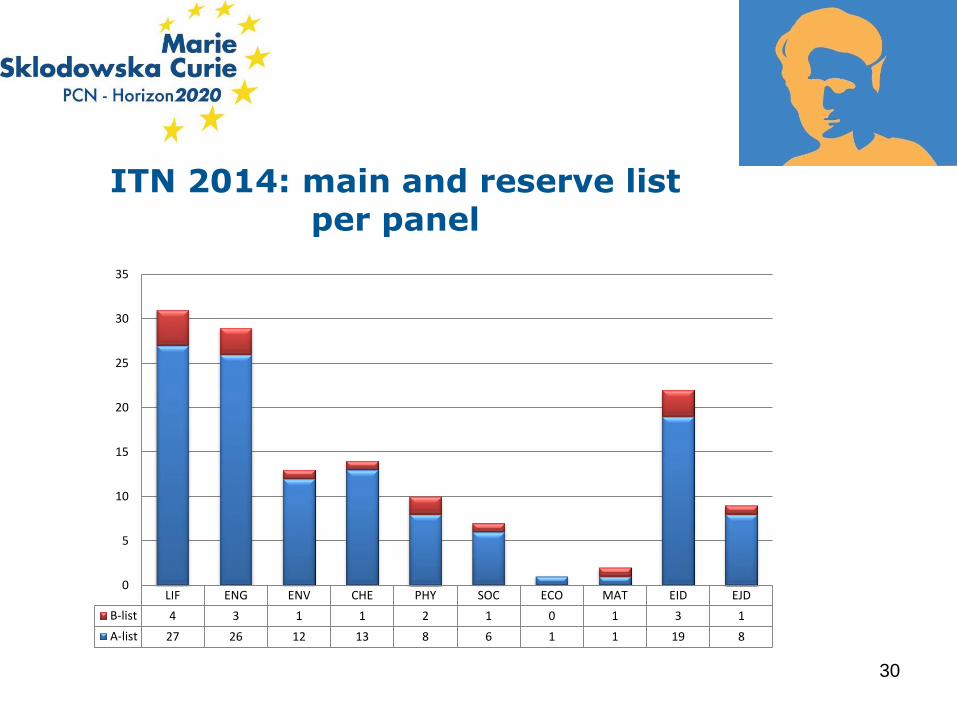
LIF ENG ENV CHE PHY SOC ECO MAT EID EJD
B-list 4 3 1 1 2 1 0 1 3 1
A-list 27 26 12 13 8 6 1 1 19 8
0
5
10
15
20
25
30
35
ITN 2014: main and reserve list per panel
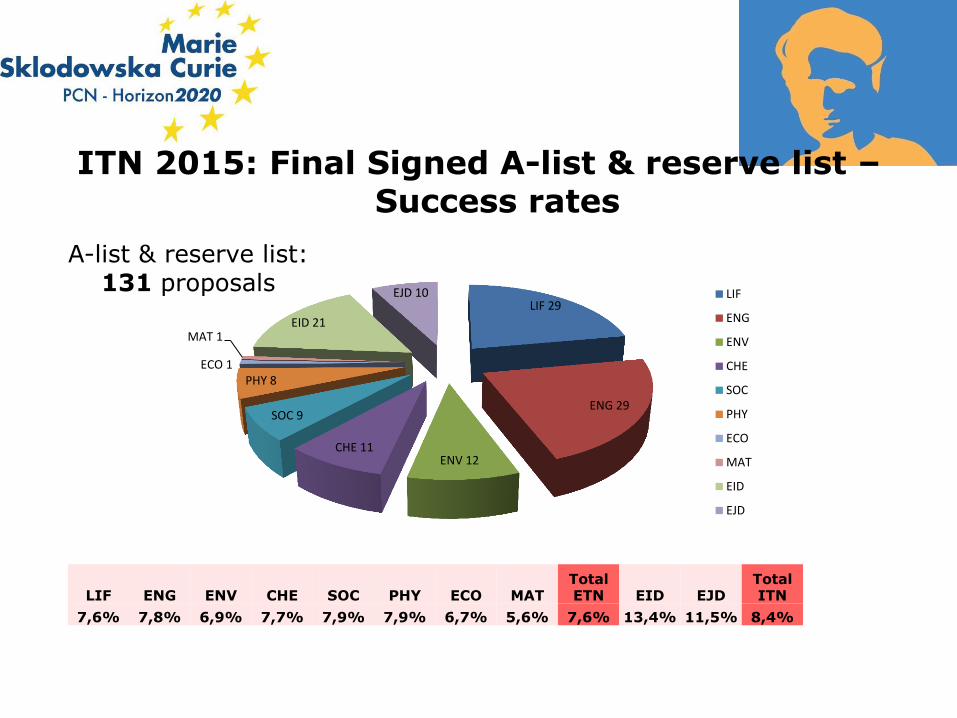
ITN 2015: Final Signed A-list & reserve list – Success rates
LIF 29
ENG 29
ENV 12 CHE 11
SOC 9
PHY 8 ECO 1
MAT 1 EID 21
EJD 10 LIF
ENG
ENV
CHE
SOC
PHY
ECO
MAT
EID
EJD
A-list & reserve list: 131 proposals
LIF ENG ENV CHE SOC PHY ECO MAT Total ETN EID EJD
Total ITN
7,6% 7,8% 6,9% 7,7% 7,9% 7,9% 6,7% 5,6% 7,6% 13,4% 11,5% 8,4%
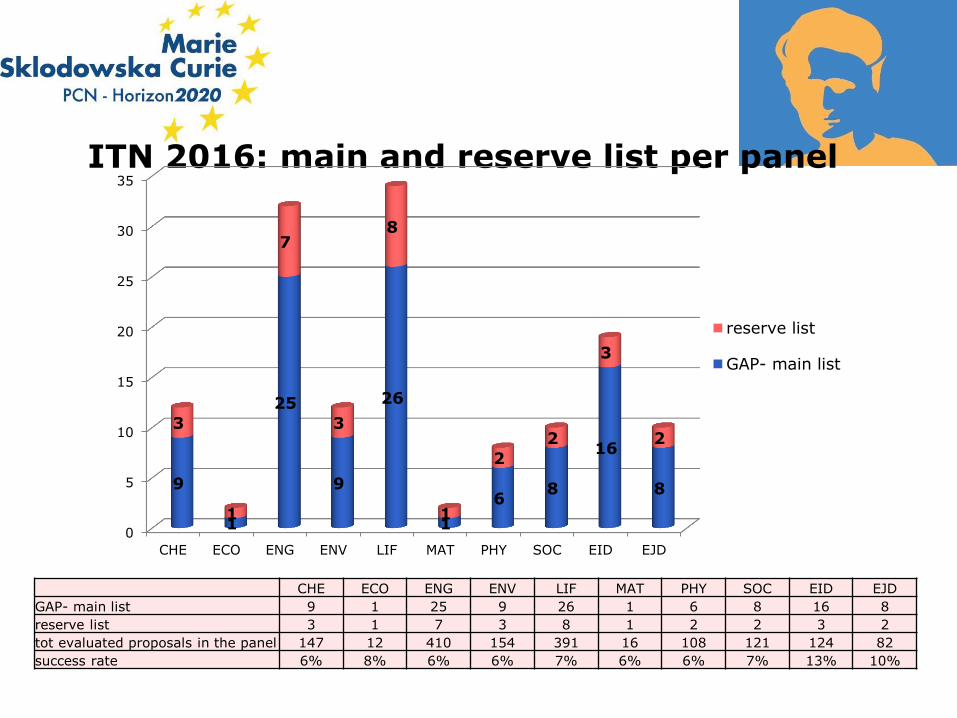
ITN 2016: main and reserve list per panel
0
5
10
15
20
25
30
35
CHE ECO ENG ENV LIF MAT PHY SOC EID EJD
9
1
25
9
26
1
6 8
16
8
3
1
7
3
8
1
2
2
3
2
reserve list
GAP- main list
CHE ECO ENG ENV LIF MAT PHY SOC EID EJD
GAP- main list 9 1 25 9 26 1 6 8 16 8
reserve list 3 1 7 3 8 1 2 2 3 2
tot evaluated proposals in the panel 147 12 410 154 391 16 108 121 124 82
success rate 6% 8% 6% 6% 7% 6% 6% 7% 13% 10%
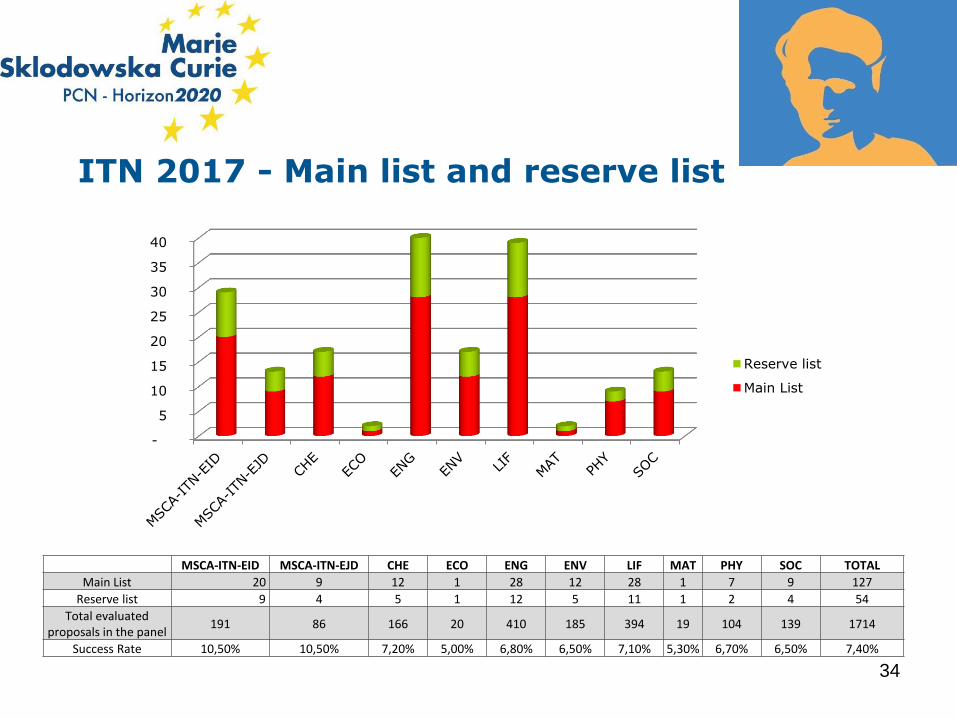
ITN 2017 - Main list and reserve list
34
-
5
10
15
20
25
30
35
40
Reserve list
Main List
Colonne1 MSCA-ITN-EID MSCA-ITN-EJD CHE ECO ENG ENV LIF MAT PHY SOC TOTAL
Main List 20 9 12 1 28 12 28 1 7 9 127
Reserve list 9 4 5 1 12 5 11 1 2 4 54
Total evaluated proposals in the panel
191 86 166 20 410 185 394 19 104 139 1714
Success Rate 10,50% 10,50% 7,20% 5,00% 6,80% 6,50% 7,10% 5,30% 6,70% 6,50% 7,40%
35
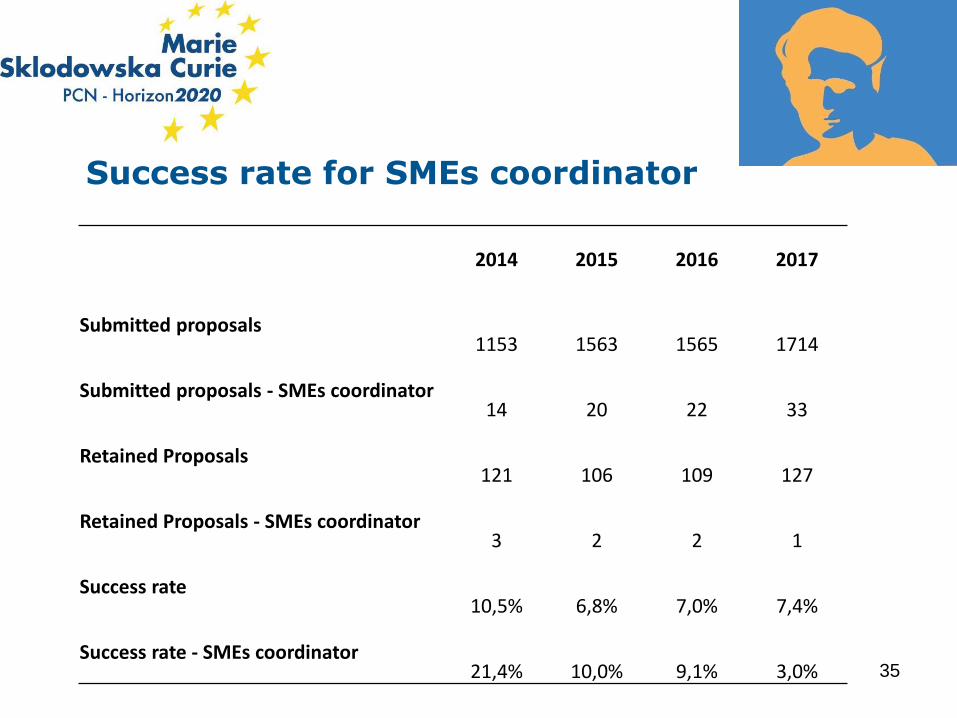
Success rate for SMEs coordinator
2014 2015 2016 2017
Submitted proposals 1153 1563 1565 1714
Submitted proposals - SMEs coordinator 14 20 22 33
Retained Proposals 121 106 109 127
Retained Proposals - SMEs coordinator 3 2 2 1
Success rate 10,5% 6,8% 7,0% 7,4%
Success rate - SMEs coordinator 21,4% 10,0% 9,1% 3,0%
36
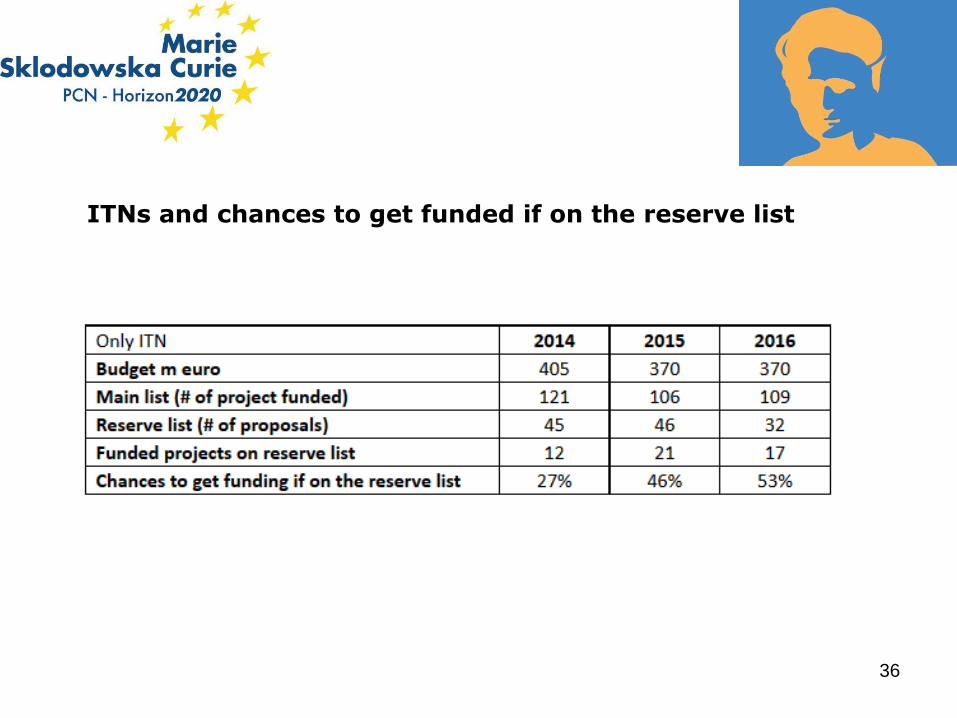
ITNs and chances to get funded if on the reserve list
4. Projet . Données par année
. Participants par projet
. Comparaison internationale
37
2014
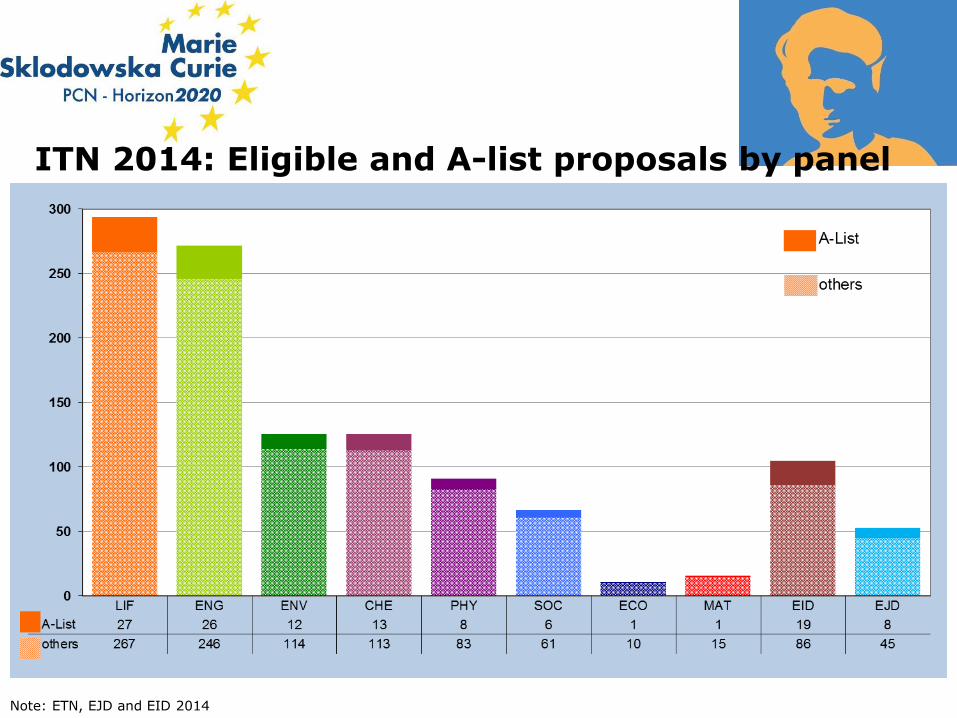
ITN 2014: Eligible and A-list proposals by panel
Note: ETN, EJD and EID 2014
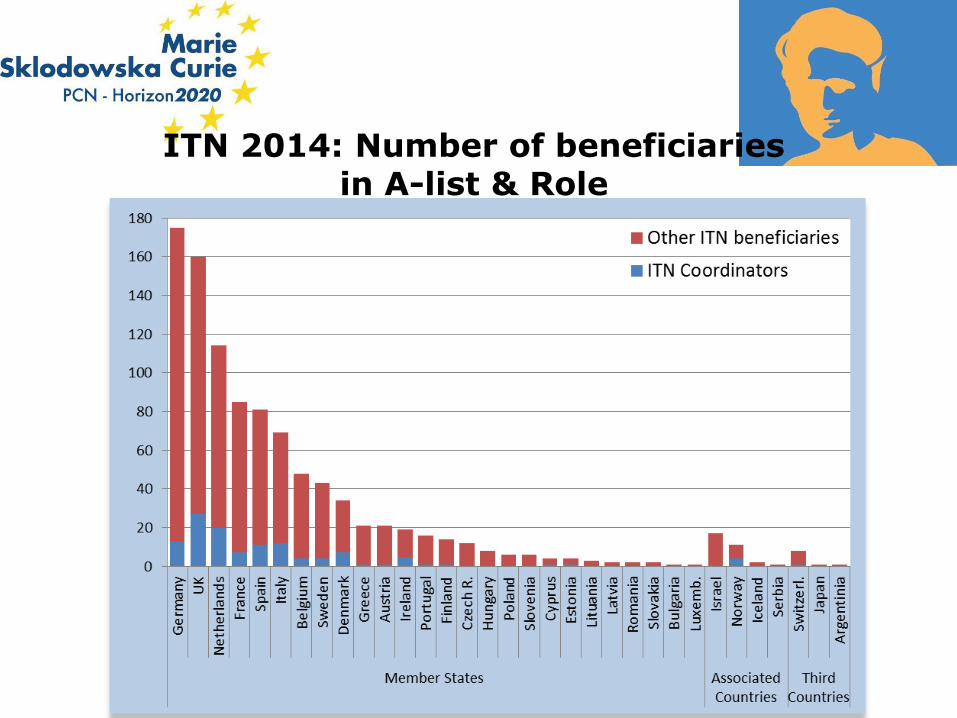
ITN 2014: Number of beneficiaries in A-list & Role
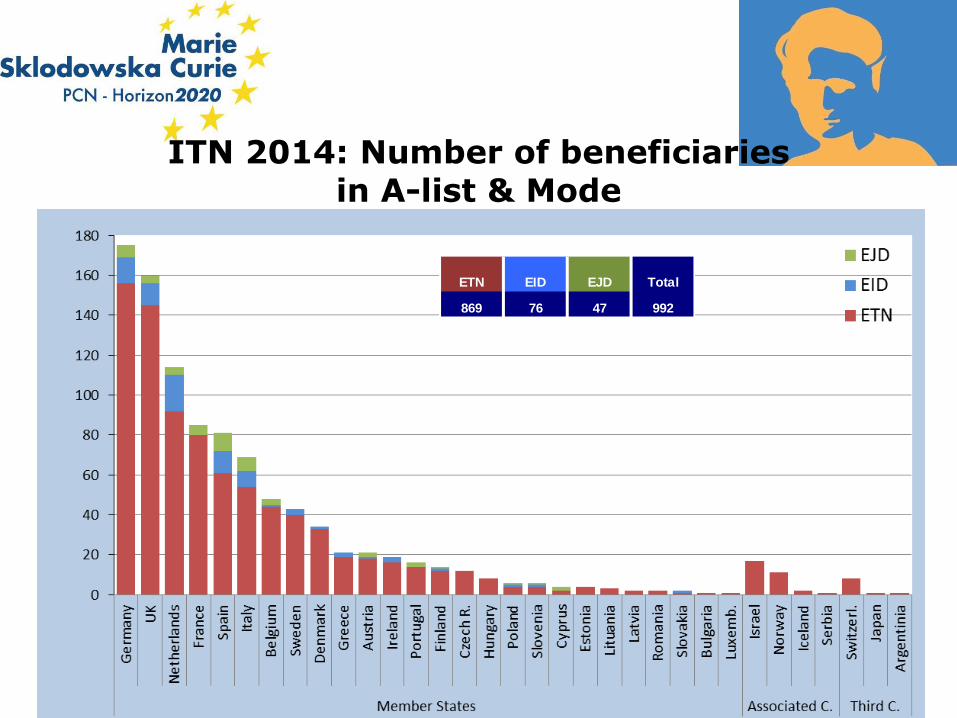
ITN 2014: Number of beneficiaries in A-list & Mode
ETN EID EJD Total
869 76 47 992
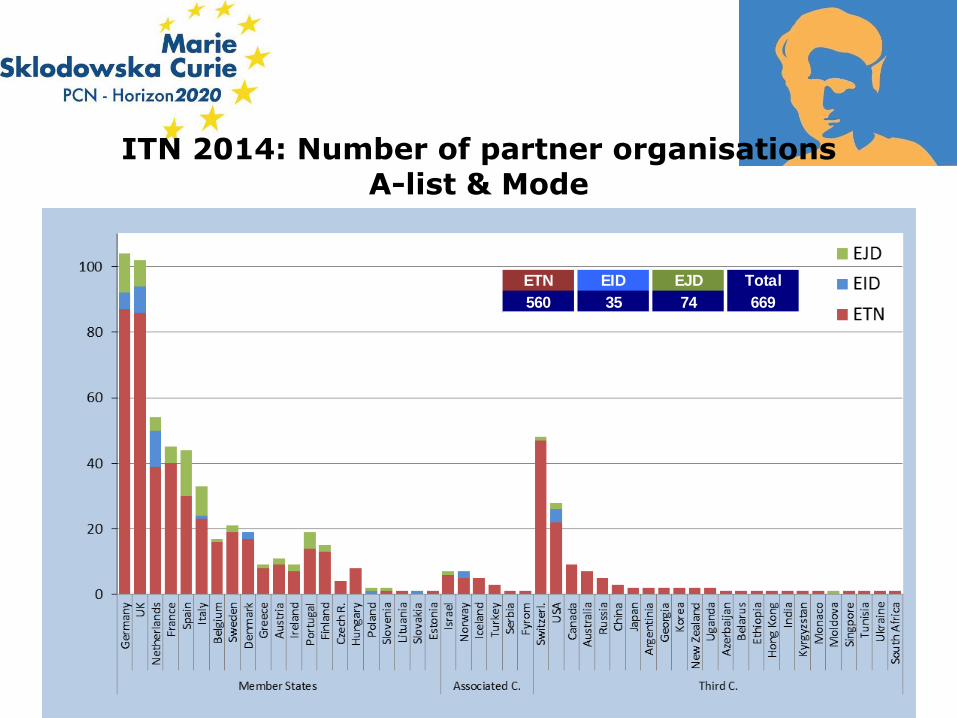
ITN 2014: Number of partner organisations A-list & Mode
ETN EID EJD Total
560 35 74 669

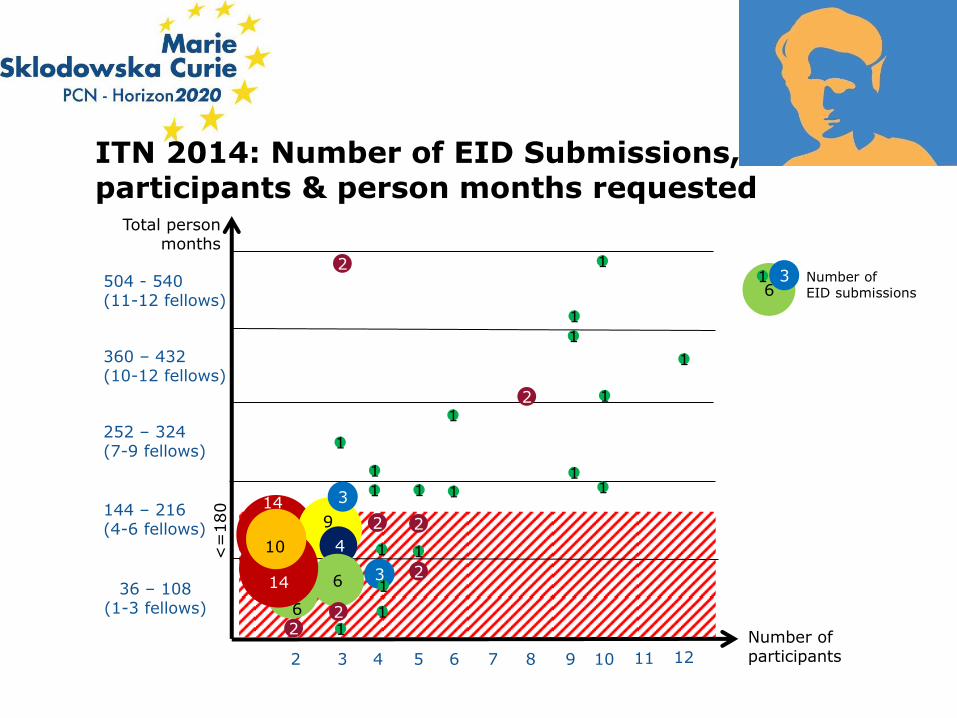
ITN 2014 - Number of EID beneficiaries & Role
19 EID A-List projects
6
6
9
36 – 108 (1-3 fellows)
144 – 216 (4-6 fellows)
252 – 324 (7-9 fellows)
360 – 432 (10-12 fellows)
504 - 540 (11-12 fellows)
2 3 4 5 6 7 8 9 10 11 12
Number of participants
Total person months
2
2 2
2
1
2
3
3
4
6
2
ITN 2014: Number of EID Submissions, participants & person months requested
14
10
14
2 6
1
1 1
1
1
1
1
1
1
1
1 1
1
1 1
1
1
<=
180
1 3 Number of EID submissions

2015
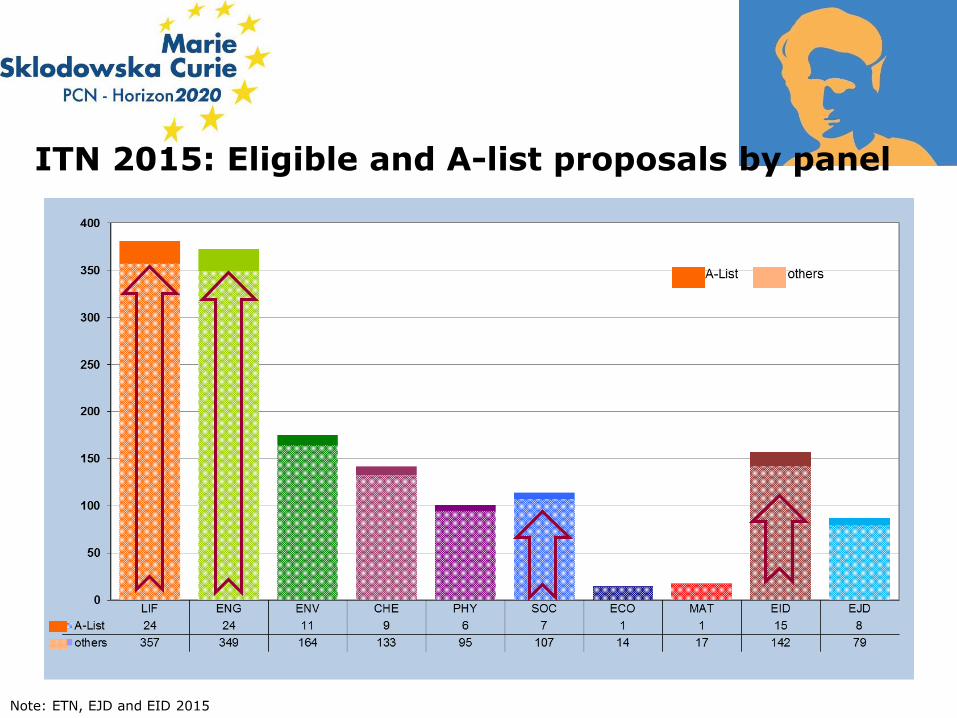
ITN 2015: Eligible and A-list proposals by panel
Note: ETN, EJD and EID 2015
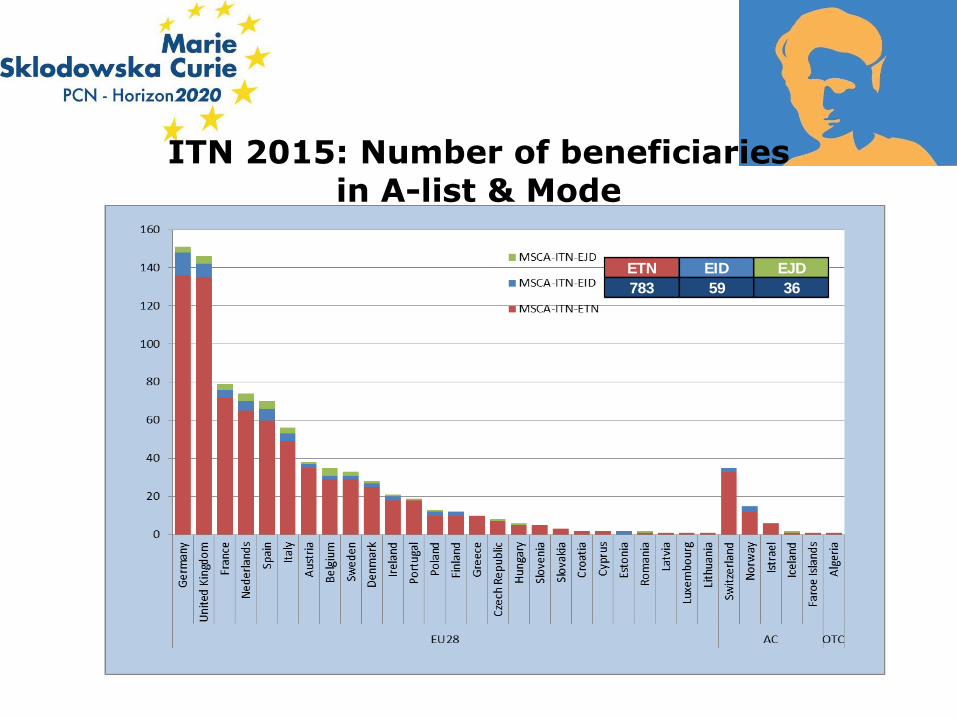
ITN 2015: Number of beneficiaries in A-list & Mode
ETN EID EJD
783 59 36
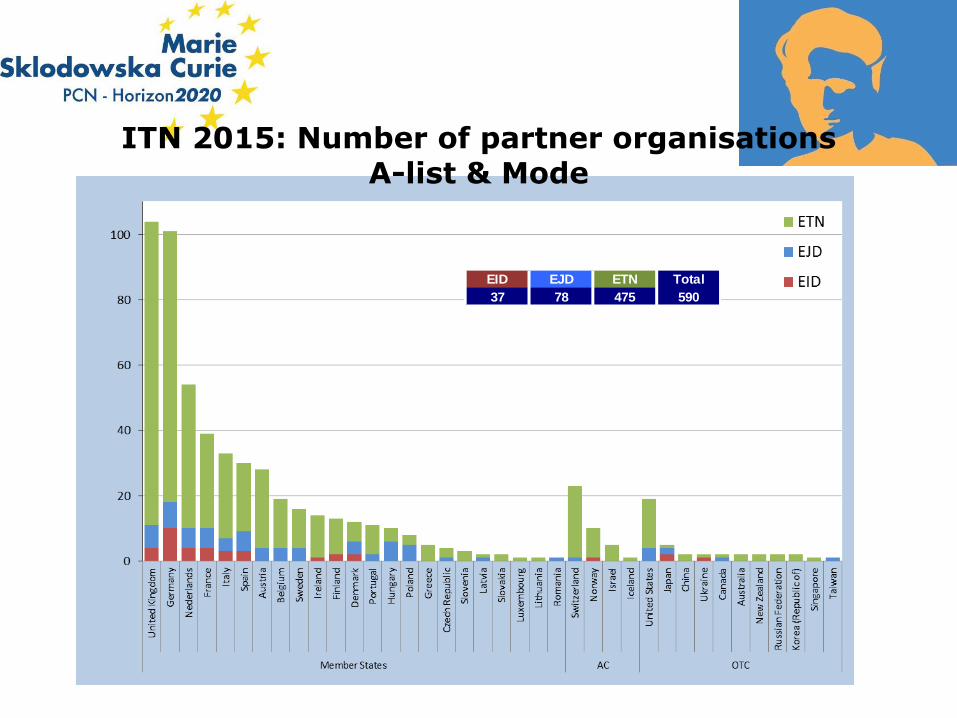
ITN 2015: Number of partner organisations A-list & Mode
EID EJD ETN Total
37 78 475 590

2016
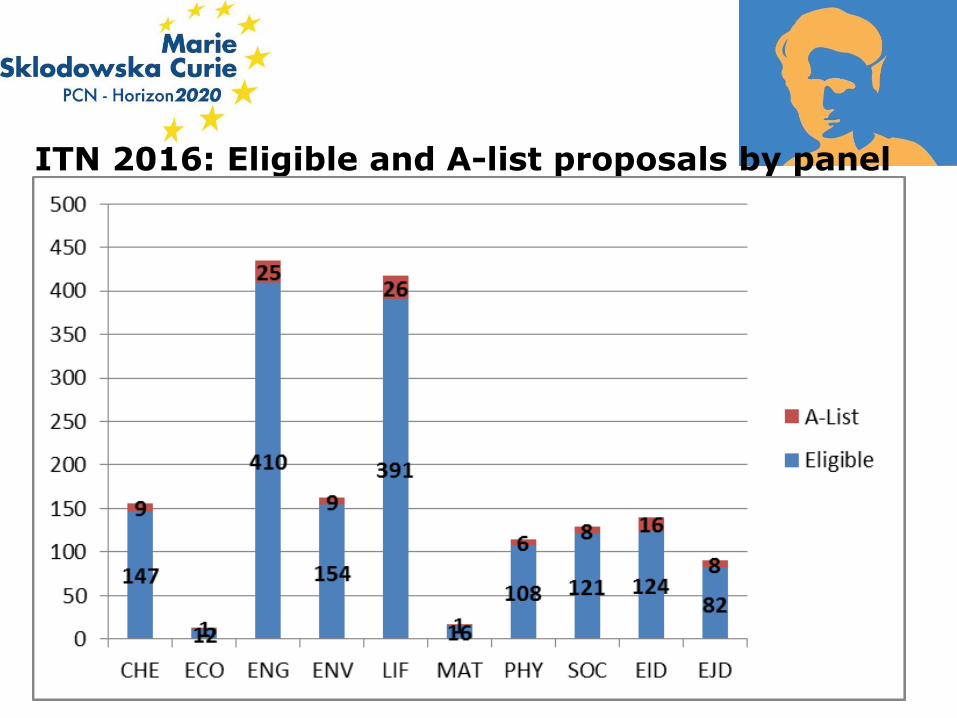
ITN 2016: Eligible and A-list proposals by panel

ITN 2016: main and reserve list per panel
0
5
10
15
20
25
30
35
CHE ECO ENG ENV LIF MAT PHY SOC EID EJD
9
1
25
9
26
1
6 8
16
8
3
1
7
3
8
1
2
2
3
2
reserve list
GAP- main list
CHE ECO ENG ENV LIF MAT PHY SOC EID EJD
GAP- main list 9 1 25 9 26 1 6 8 16 8
reserve list 3 1 7 3 8 1 2 2 3 2
tot evaluated proposals in the panel 147 12 410 154 391 16 108 121 124 82
success rate 6% 8% 6% 6% 7% 6% 6% 7% 13% 10%
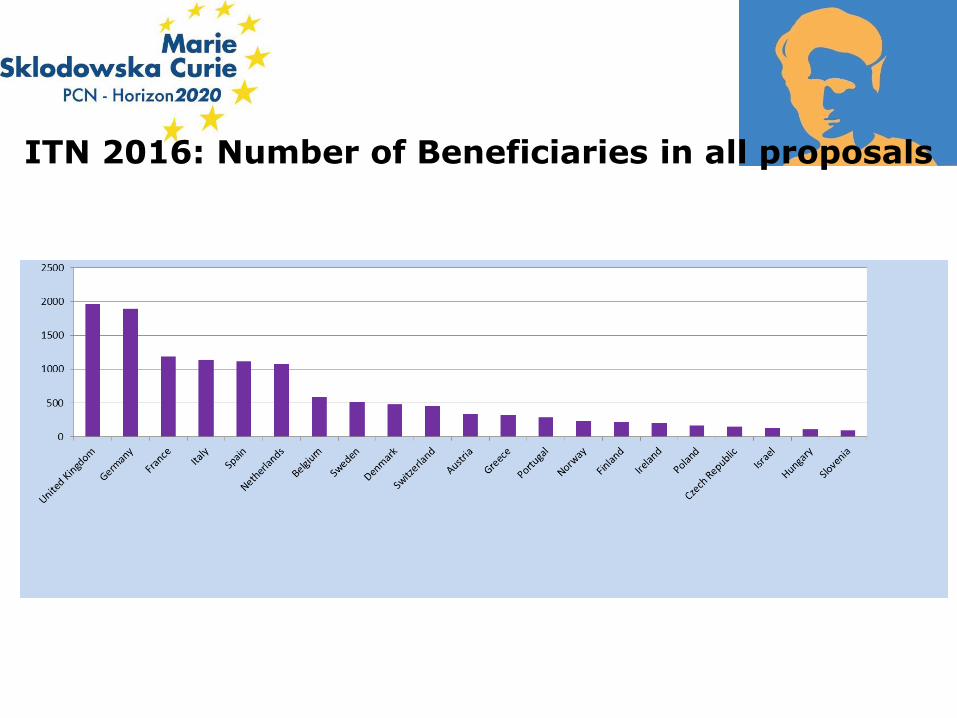
ITN 2016: Number of Beneficiaries in all proposals
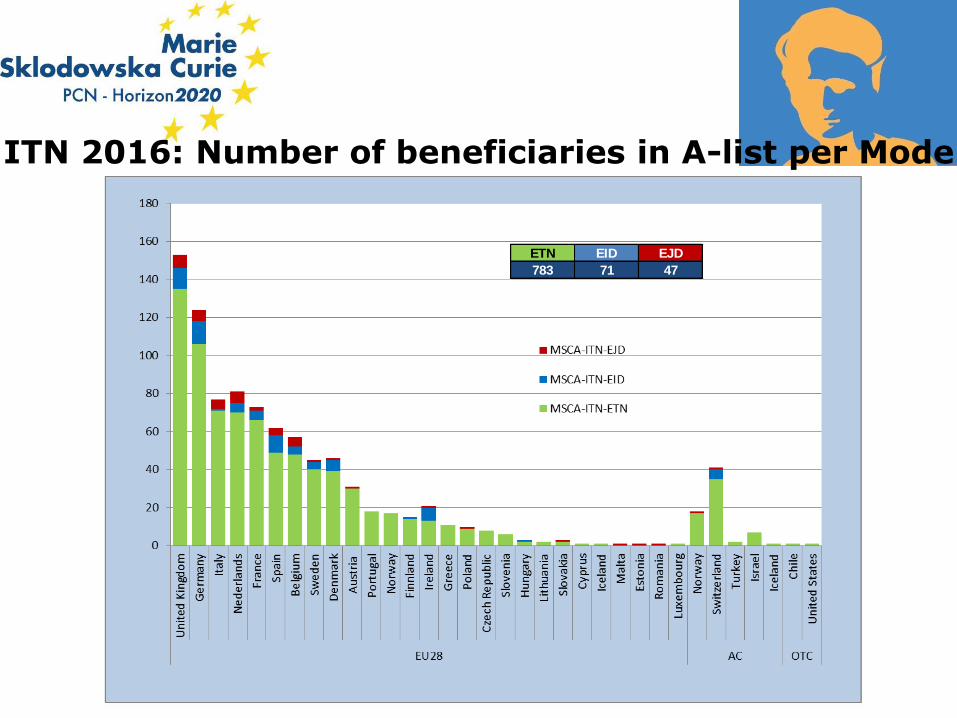
ITN 2016: Number of beneficiaries in A-list per Mode
ETN EID EJD
783 71 47
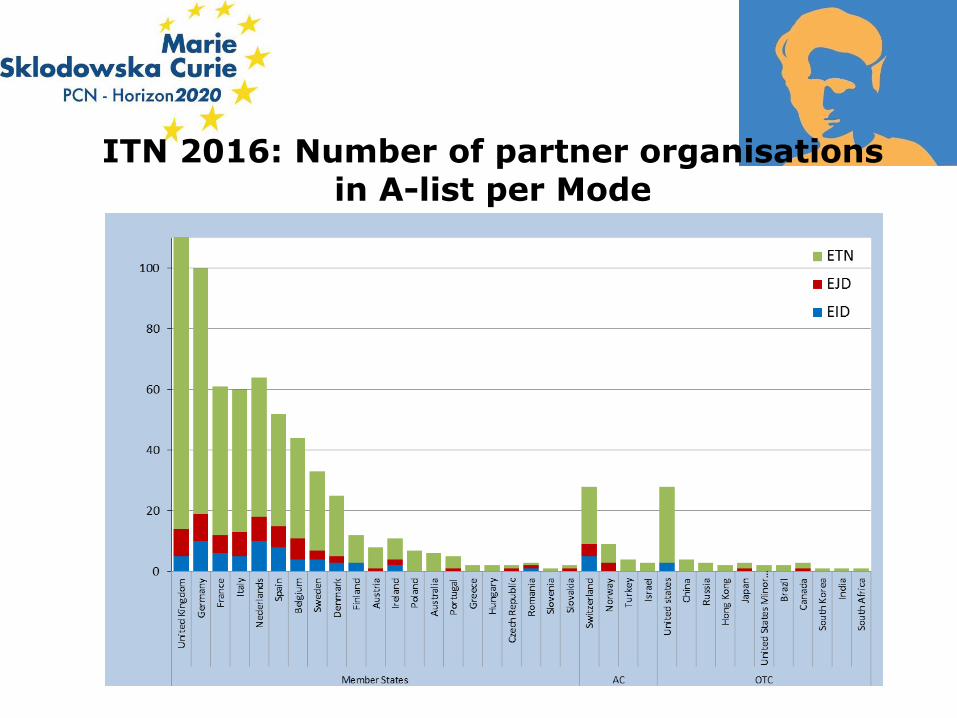
ITN 2016: Number of partner organisations in A-list per Mode
55
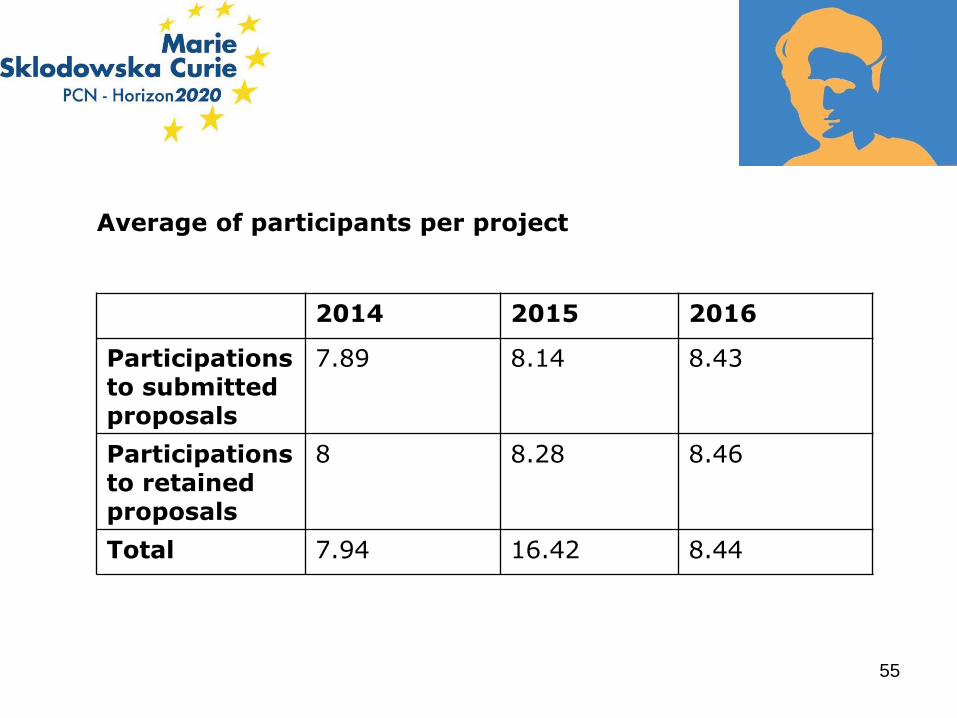
2014 2015 2016
Participations to submitted proposals
7.89 8.14 8.43
Participations to retained proposals
8 8.28 8.46
Total 7.94 16.42 8.44
Average of participants per project
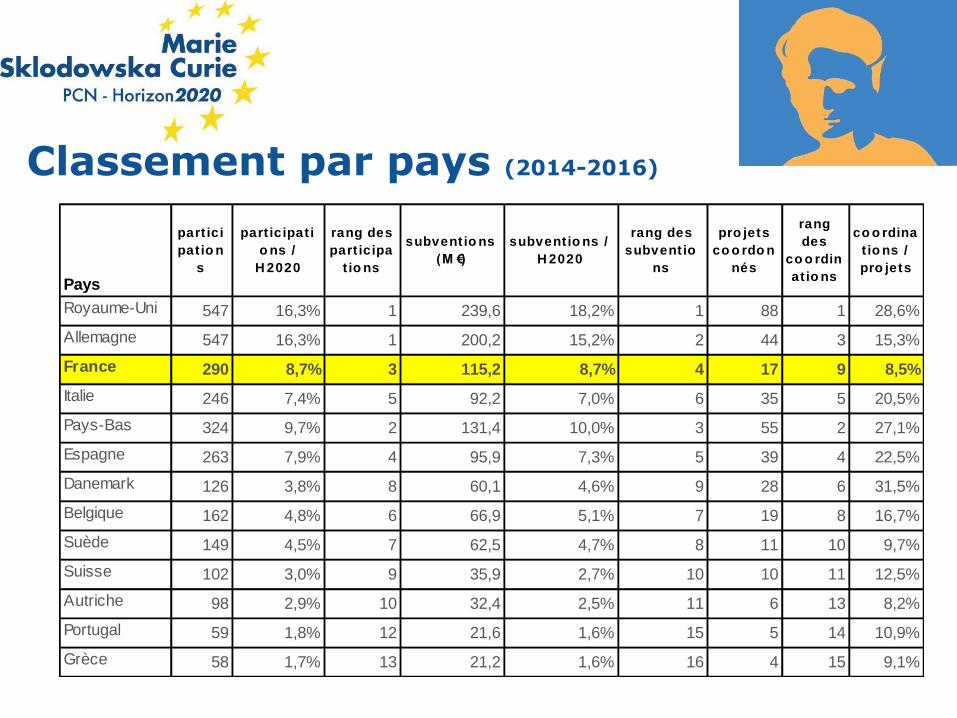
Classement par pays (2014-2016)
Pays
part ici
pat io n
s
part icipat i
o ns /
H 2020
rang des
part icipa
t io ns
subventio ns
(M €)
subventio ns /
H 2020
rang des
subventio
ns
pro jets
co o rdo n
nés
rang
des
co o rdin
at io ns
co o rdina
t io ns /
pro jets
Royaume-Uni 547 16,3% 1 239,6 18,2% 1 88 1 28,6%
Allemagne 547 16,3% 1 200,2 15,2% 2 44 3 15,3%
France 290 8,7% 3 115,2 8,7% 4 17 9 8,5%
Italie 246 7,4% 5 92,2 7,0% 6 35 5 20,5%
Pays-Bas 324 9,7% 2 131,4 10,0% 3 55 2 27,1%
Espagne 263 7,9% 4 95,9 7,3% 5 39 4 22,5%
Danemark 126 3,8% 8 60,1 4,6% 9 28 6 31,5%
Belgique 162 4,8% 6 66,9 5,1% 7 19 8 16,7%
Suède 149 4,5% 7 62,5 4,7% 8 11 10 9,7%
Suisse 102 3,0% 9 35,9 2,7% 10 10 11 12,5%
Autriche 98 2,9% 10 32,4 2,5% 11 6 13 8,2%
Portugal 59 1,8% 12 21,6 1,6% 15 5 14 10,9%
Grèce 58 1,7% 13 21,2 1,6% 16 4 15 9,1%
2017
57
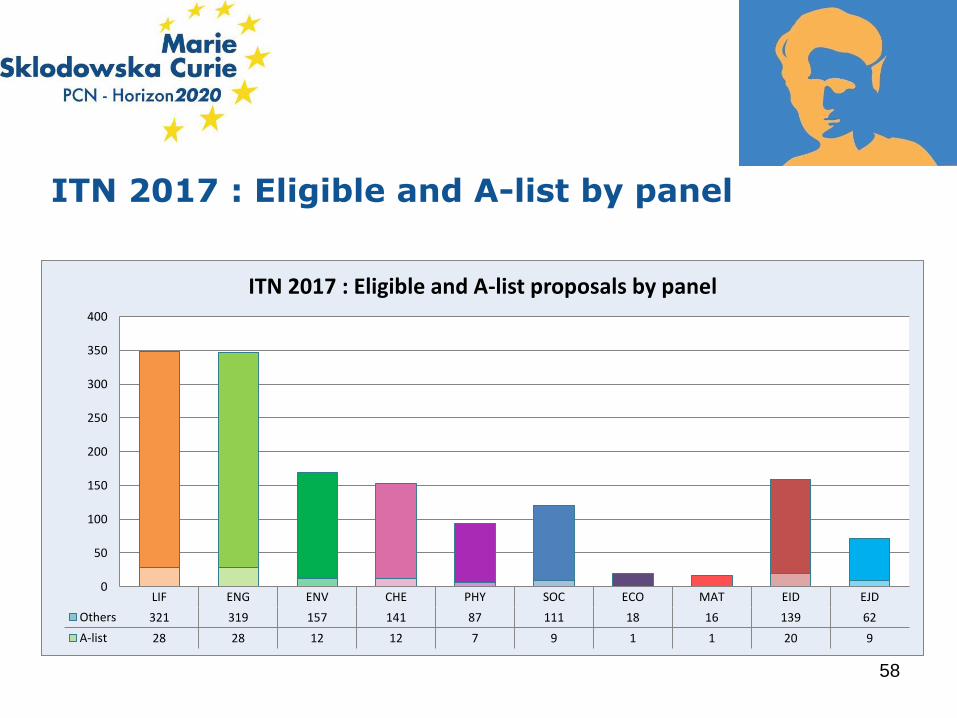
ITN 2017 : Eligible and A-list by panel
58
0
50
100
150
200
250
300
350
400
LIF ENG ENV CHE PHY SOC ECO MAT EID EJD
Others 321 319 157 141 87 111 18 16 139 62
A-list 28 28 12 12 7 9 1 1 20 9
ITN 2017 : Eligible and A-list proposals by panel
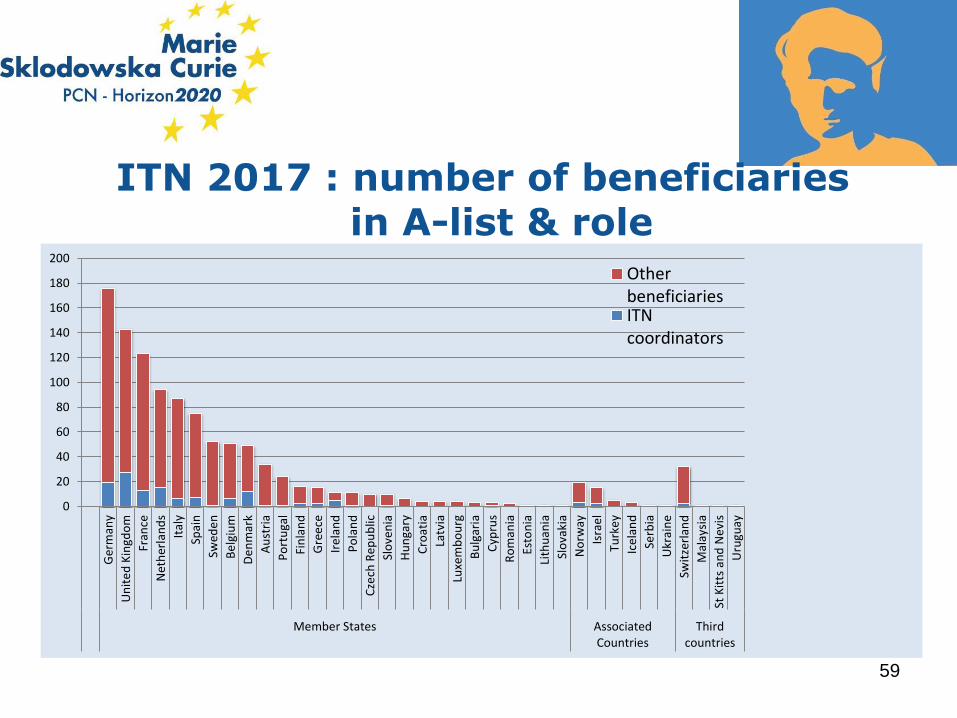
ITN 2017 : number of beneficiaries in A-list & role
59
0
20
40
60
80
100
120
140
160
180
200
Ger
man
y
Un
ite
d K
ingd
om
Fran
ce
Net
her
lan
ds
Ital
y
Spai
n
Swed
en
Be
lgiu
m
De
nm
ark
Au
stri
a
Po
rtu
gal
Fin
lan
d
Gre
ece
Ire
lan
d
Po
lan
d
Cze
ch R
epu
blic
Slo
ven
ia
Hu
nga
ry
Cro
atia
Latv
ia
Luxe
mb
ou
rg
Bu
lgar
ia
Cyp
rus
Ro
man
ia
Esto
nia
Lith
uan
ia
Slo
vaki
a
No
rway
Isra
el
Turk
ey
Ice
lan
d
Serb
ia
Ukr
ain
e
Swit
zerl
and
Mal
aysi
a
St K
itts
an
d N
evis
Uru
guay
Member States AssociatedCountries
Thirdcountries
OtherbeneficiariesITNcoordinators
5. PARTICIPATION
PAR TYPE D’ACTEUR
60
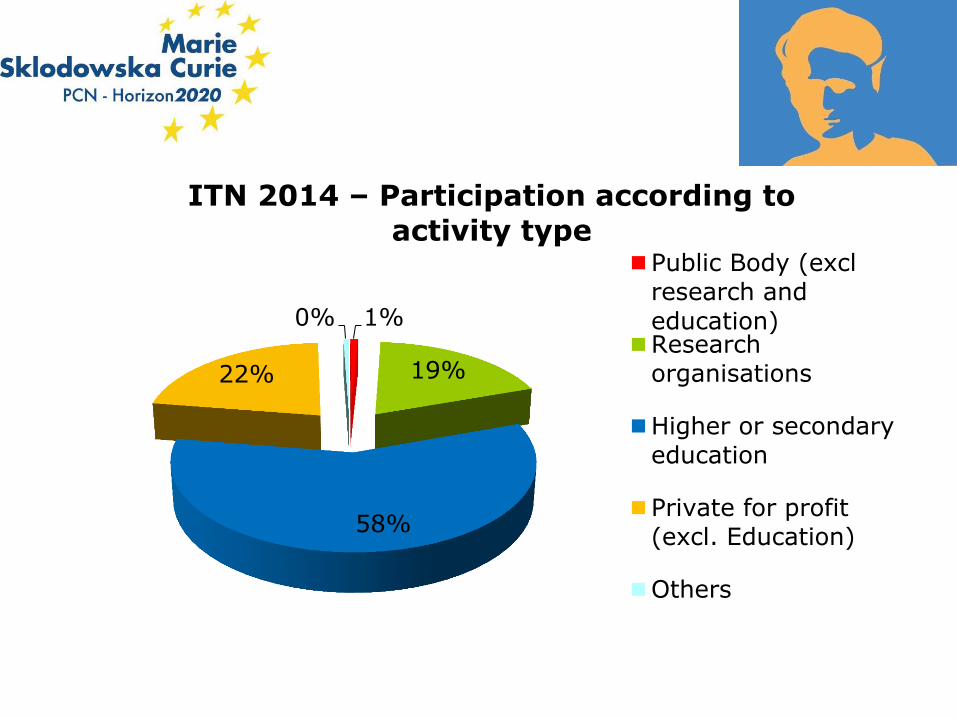
1%
19%
58%
22%
0%
ITN 2014 – Participation according to
activity type Public Body (exclresearch and
education)Researchorganisations
Higher or secondaryeducation
Private for profit(excl. Education)
Others
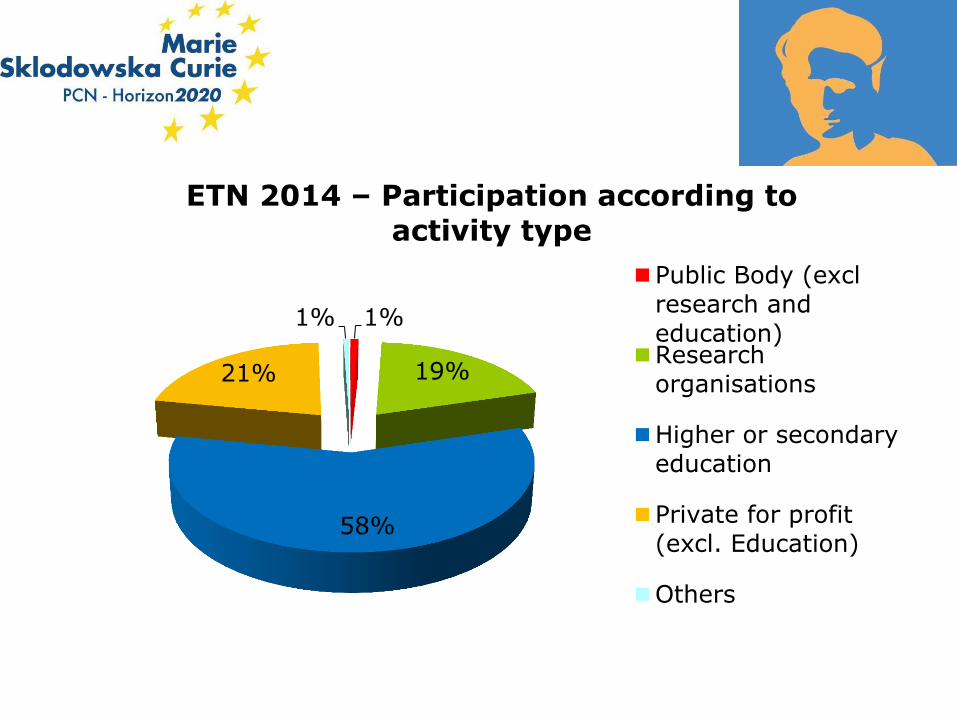
1%
19%
58%
21%
1%
ETN 2014 – Participation according to
activity type
Public Body (exclresearch and
education)Researchorganisations
Higher or secondaryeducation
Private for profit(excl. Education)
Others
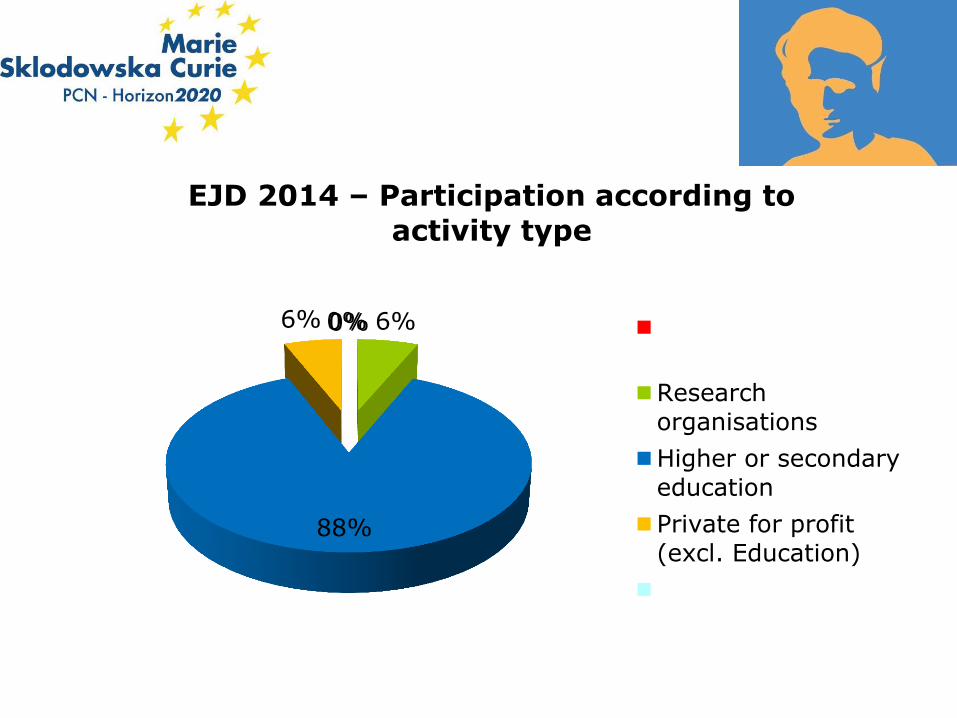
0% 6%
88%
6% 0%
EJD 2014 – Participation according to
activity type
Researchorganisations
Higher or secondaryeducation
Private for profit(excl. Education)
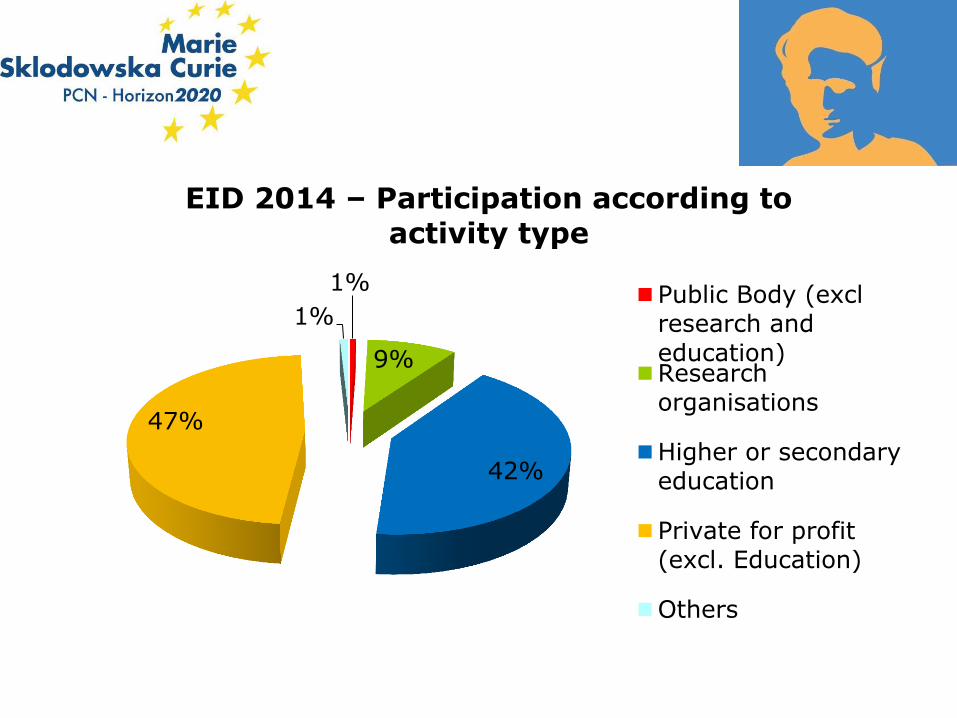
1%
9%
42%
47%
1%
EID 2014 – Participation according to
activity type
Public Body (exclresearch and
education)Researchorganisations
Higher or secondaryeducation
Private for profit(excl. Education)
Others
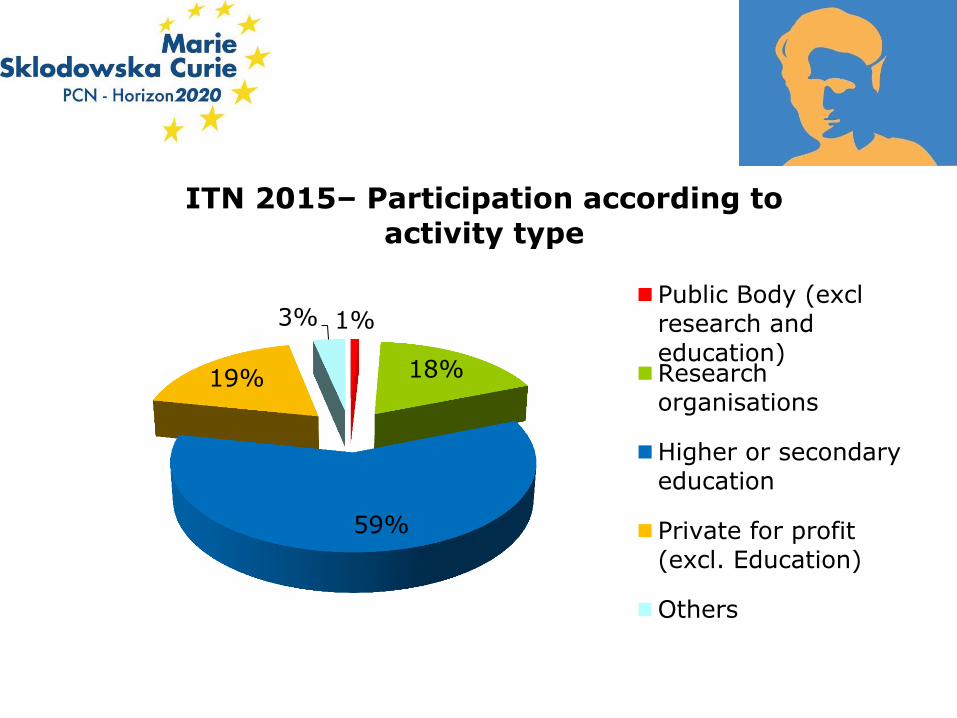
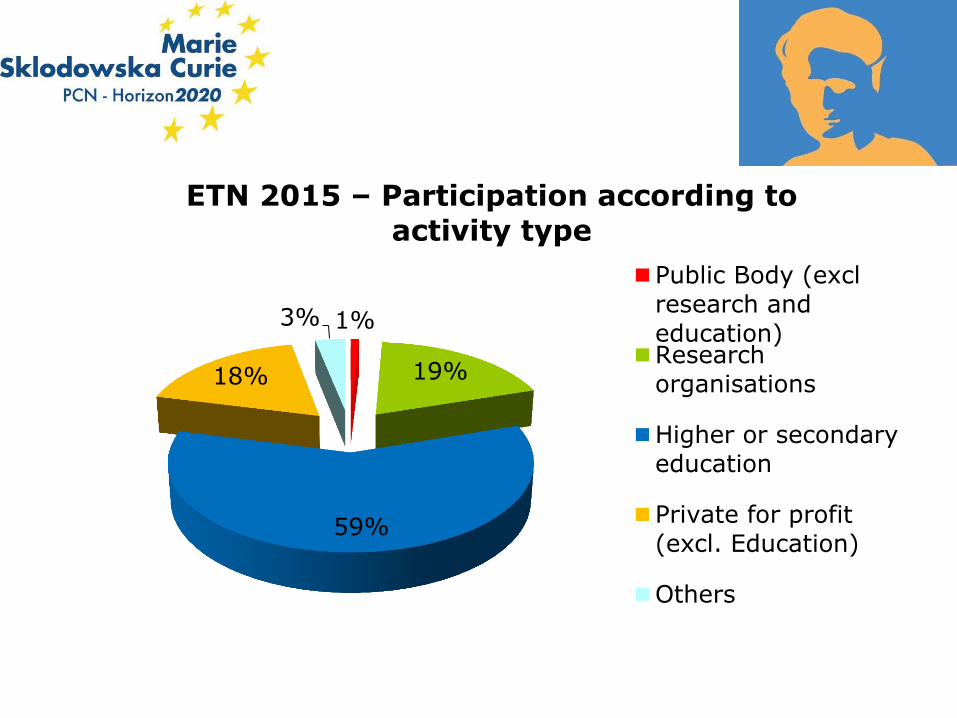
1%
18%
59%
19%
3%
ITN 2015– Participation according to
activity type
Public Body (exclresearch and
education)Researchorganisations
Higher or secondaryeducation
Private for profit(excl. Education)
Others
1%
19%
59%
18%
3%
ETN 2015 – Participation according to
activity type
Public Body (exclresearch and
education)Researchorganisations
Higher or secondaryeducation
Private for profit(excl. Education)
Others
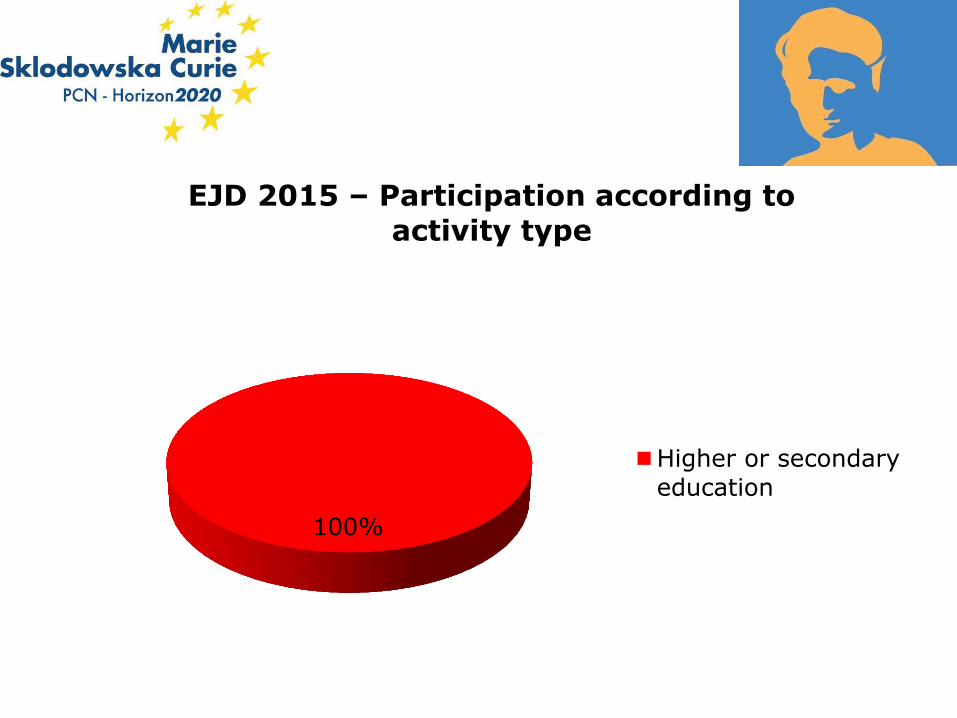
100%
EJD 2015 – Participation according to
activity type
Higher or secondaryeducation
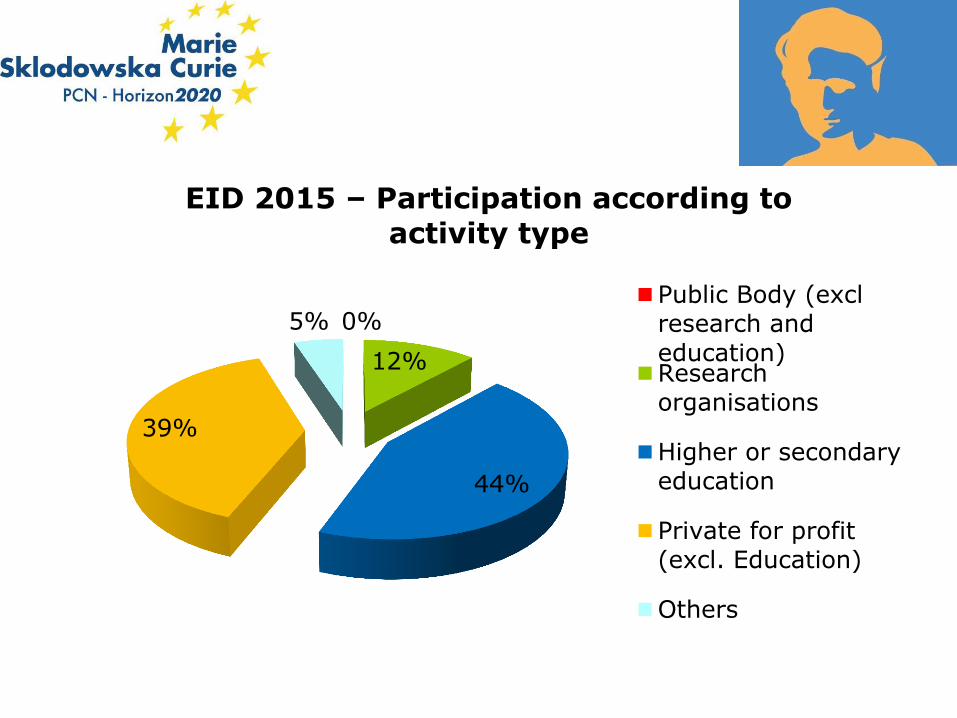
0%
12%
44%
39%
5%
EID 2015 – Participation according to
activity type
Public Body (exclresearch and
education)Researchorganisations
Higher or secondaryeducation
Private for profit(excl. Education)
Others
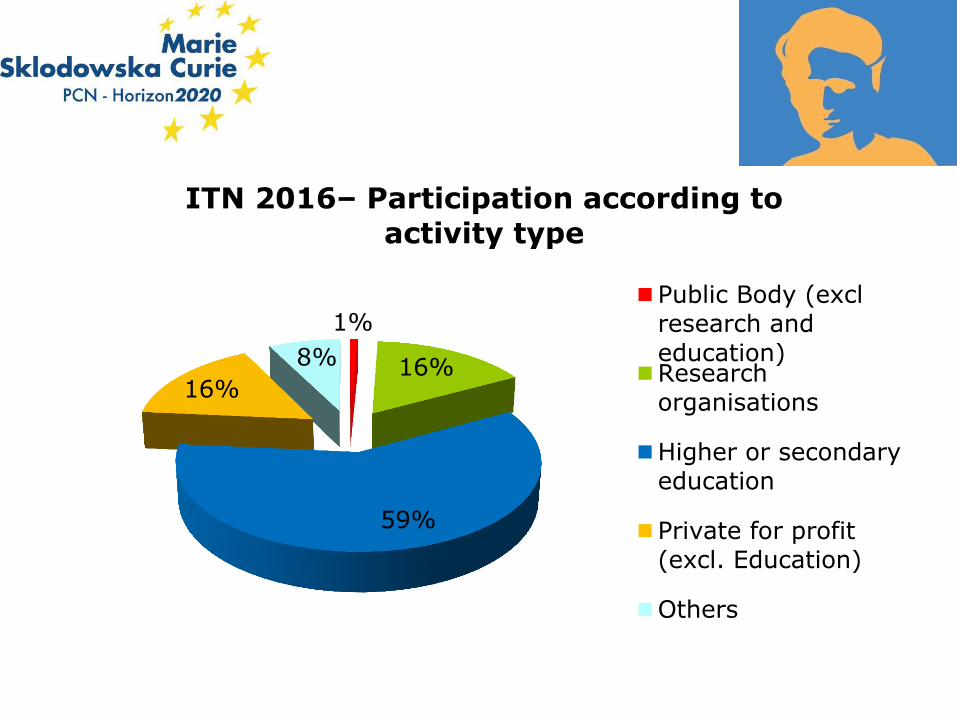
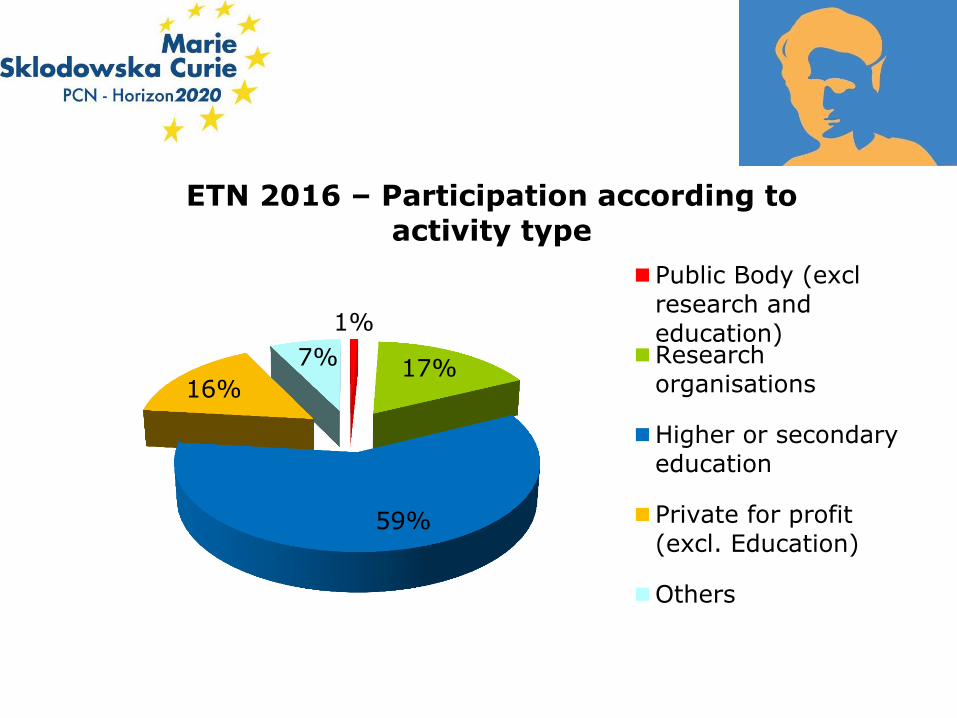
1%
16%
59%
16%
8%
ITN 2016– Participation according to
activity type
Public Body (exclresearch and
education)Researchorganisations
Higher or secondaryeducation
Private for profit(excl. Education)
Others
1%
17%
59%
16%
7%
ETN 2016 – Participation according to
activity type
Public Body (exclresearch and
education)Researchorganisations
Higher or secondaryeducation
Private for profit(excl. Education)
Others
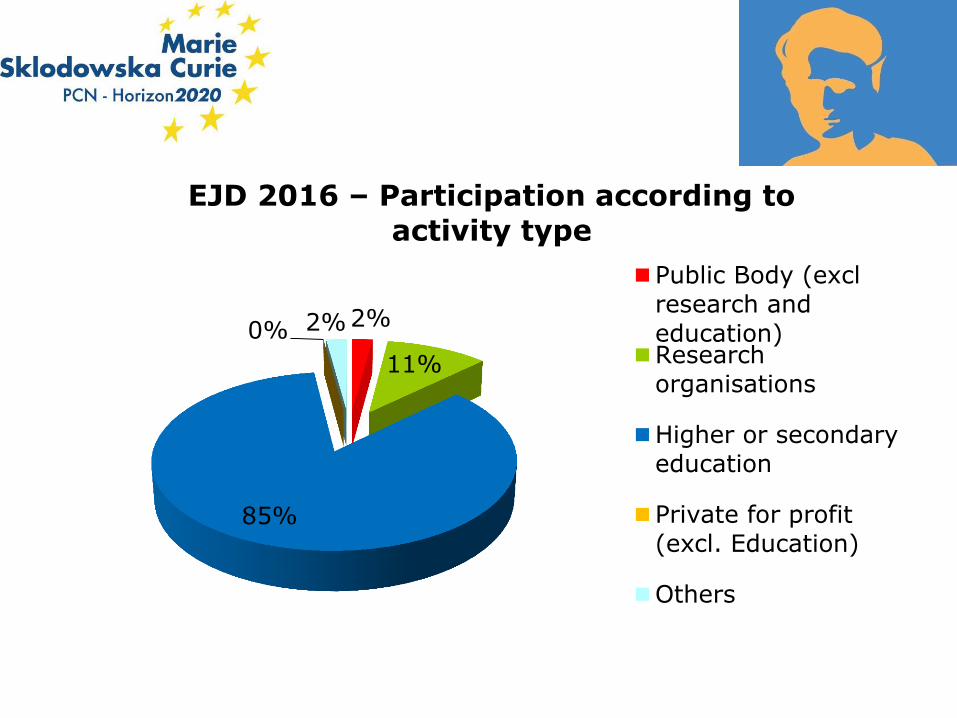
2%
11%
85%
0% 2%
EJD 2016 – Participation according to
activity type
Public Body (exclresearch and
education)Researchorganisations
Higher or secondaryeducation
Private for profit(excl. Education)
Others
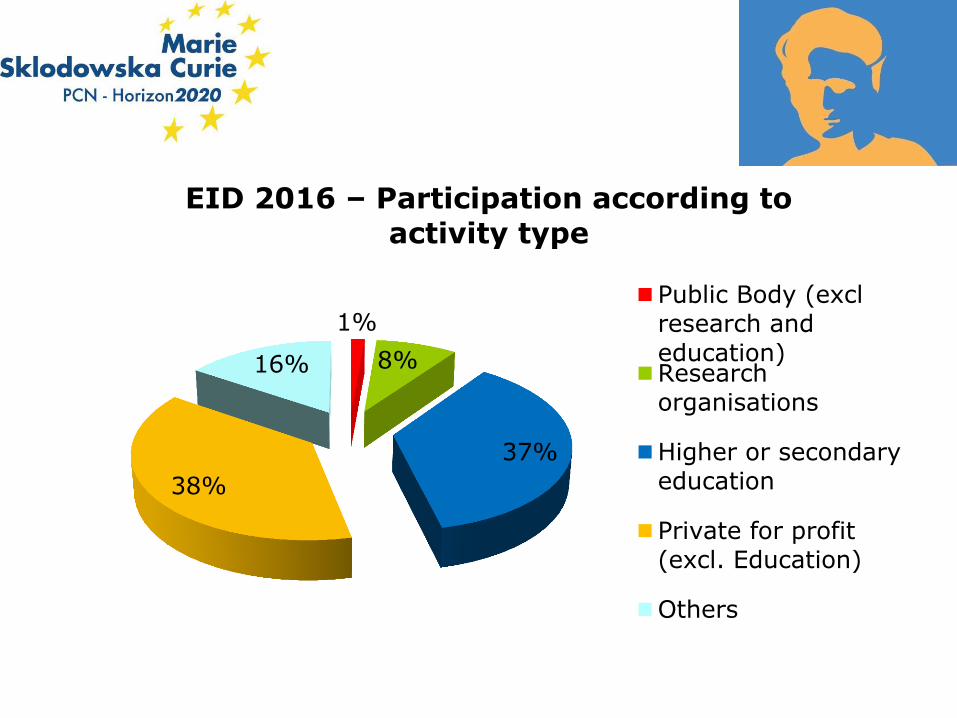
1%
8%
37%
38%
16%
EID 2016 – Participation according to
activity type
Public Body (exclresearch and
education)Researchorganisations
Higher or secondaryeducation
Private for profit(excl. Education)
Others
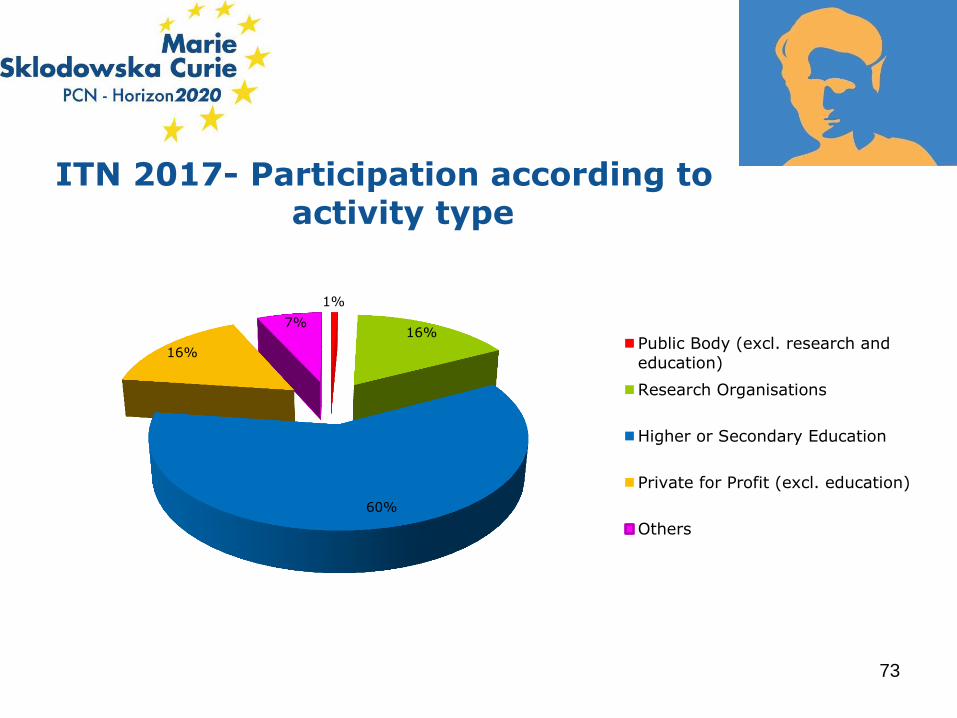
ITN 2017- Participation according to activity type
73
1%
16%
60%
16%
7%
Public Body (excl. research and
education)
Research Organisations
Higher or Secondary Education
Private for Profit (excl. education)
Others

ETN 2017- Participation according to activity type
74
1%
17%
60%
15%
7%
ETN
Public Body (excl. research and
education)
Research Organisations
Higher or Secondary Education
Private for Profit (excl. education)
Others
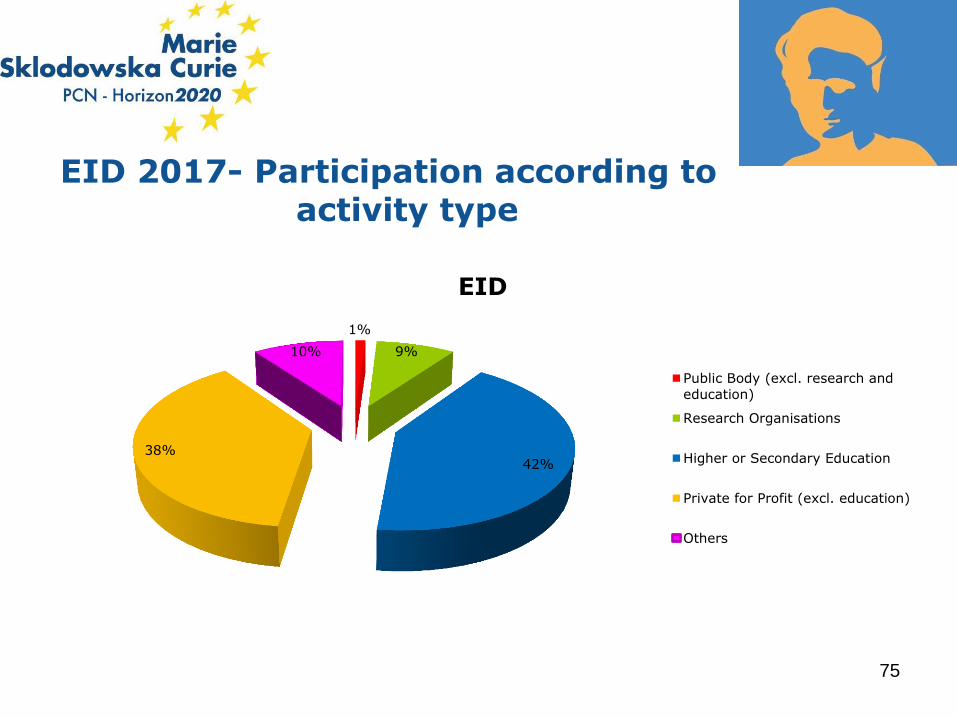
EID 2017- Participation according to activity type
75
1%
9%
42% 38%
10%
EID
Public Body (excl. research and
education)
Research Organisations
Higher or Secondary Education
Private for Profit (excl. education)
Others
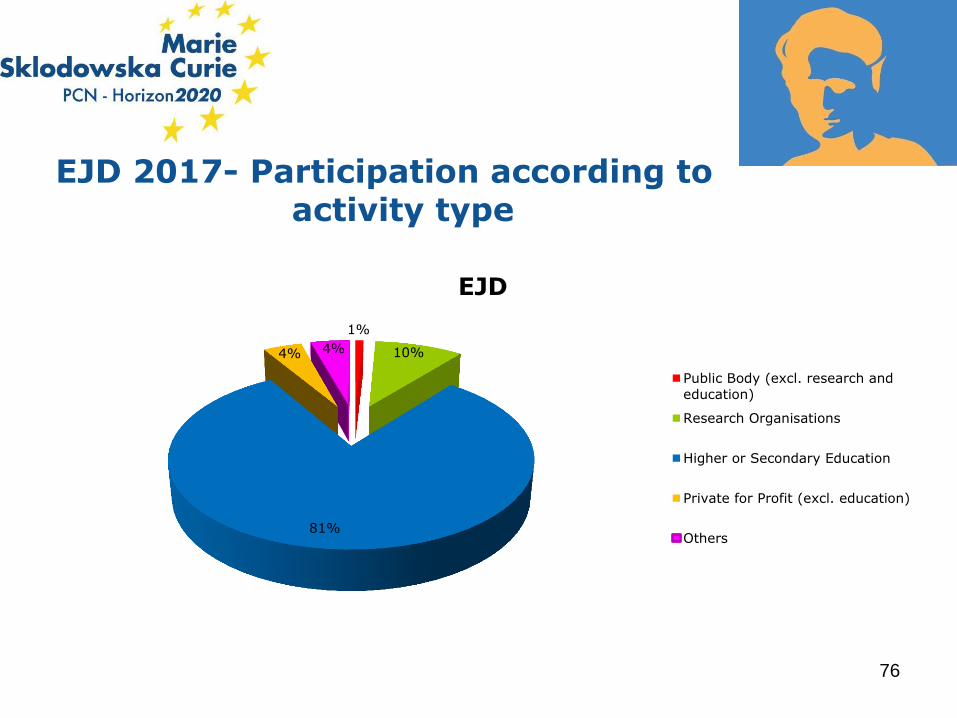
EJD 2017- Participation according to activity type
76
1%
10%
81%
4% 4%
EJD
Public Body (excl. research and
education)
Research Organisations
Higher or Secondary Education
Private for Profit (excl. education)
Others

6. MOBILITY FLOW
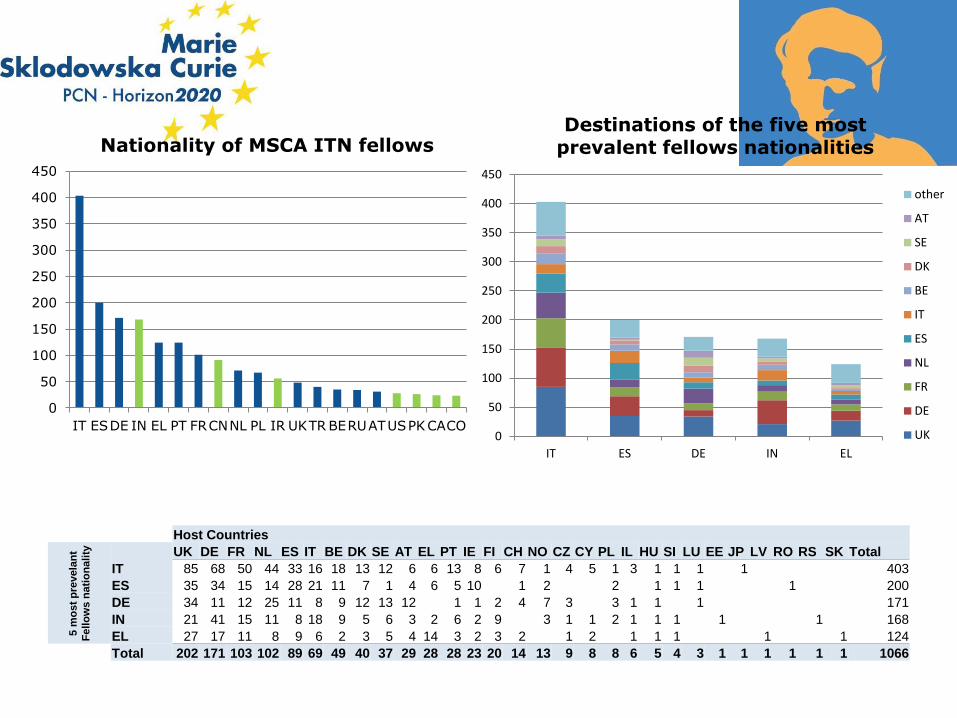
RECRUITED RESEARCHERS FROM ITN 2014-2016 CALLS
77
0
50
100
150
200
250
300
350
400
450
IT ES DE IN EL
Destinations of the five most prevalent fellows nationalities
other
AT
SE
DK
BE
IT
ES
NL
FR
DE
UK
Host Countries
5 m
os
t p
revela
nt
Fe
llo
ws n
ati
on
ali
ty
UK DE FR NL ES IT BE DK SE AT EL PT IE FI CH NO CZ CY PL IL HU SI LU EE JP LV RO RS SK Total
IT 85 68 50 44 33 16 18 13 12 6 6 13 8 6 7 1 4 5 1 3 1 1 1 1 403
ES 35 34 15 14 28 21 11 7 1 4 6 5 10 1 2 2 1 1 1 1 200
DE 34 11 12 25 11 8 9 12 13 12 1 1 2 4 7 3 3 1 1 1 171
IN 21 41 15 11 8 18 9 5 6 3 2 6 2 9 3 1 1 2 1 1 1 1 1 168
EL 27 17 11 8 9 6 2 3 5 4 14 3 2 3 2 1 2 1 1 1 1 1 124
Total 202 171 103 102 89 69 49 40 37 29 28 28 23 20 14 13 9 8 8 6 5 4 3 1 1 1 1 1 1 1066
0
50
100
150
200
250
300
350
400
450
IT ESDE IN EL PT FRCNNL PL IR UKTR BERUATUSPKCACO
Nationality of MSCA ITN fellows

Fellows Nationality
5 m
os
t p
revela
nt
Ho
st
Co
un
trie
s
IT ES IN DE PT EL FR CN PL IR NL BE UK TR RU AT RO US CA IE CO HR PK HU MX BR EG UA RS VN Other Total
DE 68 34 41 11 18 17 17 20 15 14 15 6 11 10 11 7 1 3 3 3 4 8 4 5 7 4 4 2 4 3 63 433
ES 33 28 8 11 22 9 12 2 7 1 2 5 3 4 2 1 2 1 2 1 1 1 3 1 2 1 1 17 183
FR 50 15 15 12 11 11 4 9 3 7 3 6 2 2 5 1 6 1 1 3 1 4 1 1 2 3 2 4 20 205
NL 44 14 11 25 9 8 12 9 4 11 5 5 9 5 4 2 1 6 5 1 2 2 3 3 1 2 1 26 230
UK 85 35 21 34 22 27 22 7 16 5 12 8 4 6 2 9 5 5 5 9 2 1 5 2 1 2 1 3 1 47 404
Total 280 126 96 93 82 72 67 47 45 38 37 30 29 27 24 20 15 15 14 14 13 13 13 12 12 11 10 10 9 8 173 1455
0
50
100
150
200
250
300
350
400
450
DE ES FR NL UK
MSCA ITN Fellows nationality in 5 most prevalent host countries
other
IR
PL
CN
FR
EL
PT
DE
IN
ES
IT
0
50
100
150
200
250
300
350
400
450
500
DEUK NL FR ES IT BE SE DK AT IE PT FI EL NOCHCZ IL HU PL
Number of MSCA ITN fellows in Host Countries
Thank you for your attention