ISA 2019 - fag.esn.ac.lk
246
Proceedings of the 2 nd International Symposium on Agriculture 2019 “Innovation and Invention on Sustainable Agriculture” 9 th January 2019 Faculty of Agriculture Eastern University, Sri Lanka Chenkalady ISA 2019
Transcript of ISA 2019 - fag.esn.ac.lk

Proceedings of the
2nd
International Symposium on Agriculture
2019
“Innovation and Invention on Sustainable Agriculture”
9
th
January 2019
Faculty of Agriculture
Eastern University, Sri Lanka
Chenkalady
ISA 2019

ii
Second International Symposium on Agriculture – 2019 (ISA 2019)
“Innovation and Invention on Sustainable Agriculture”
Responsibilities for the content of the manuscripts included in this publication
remains with the respective authors.
Website: http://www.fag.esn.ac.lk/
Tel: +94 (0) 6522 40530
Fax: +94 (0) 65 2240740
ISBN: 978-955-1443-97-9
© Copyright: Faculty of Agriculture, EUSL
Compiled by:
Dr.M.M. Mahusoon
Mr.M.Sugirtharan
Mr.M.Rajendran
Published by:
Faculty of Agriculture
Eastern University, Sri Lanka
Vantharumoolai
Chenkalady

iii
ORGANIZING COMMITTEE
Coordinator : Mr. M. Sugirtharan
Secretary : Mr. M. Rajendran
Members : Dr. M.M. Mahusoon
: Mr. R. Thivyatharsan
: Mr. S. Srikrishnah
: Mrs. S. Amuthenie
: Mrs. D.H.S. Komahan
: Mrs. S. Inthujaa
: Ms. S. Nishanthi
EDITORIAL BOARD
Dr. M.M. Mahusoon (Editor)
Senior Prof. (Mrs). Thevaki Mahendran
Prof. (Mrs.) Thayamini H. Seran
Dr. M. Pagthinathan
Dr. S. Mahendran
Mrs. T. Kirupananthan
Mrs. B. Raveendrakumaran
iv
PANEL OF REVIEWERS
Snr. Prof. T. Mahendran Eastern University, Sri Lanka
Snr. Prof. S. Subashinge University of Ruhuna
Prof. R.K.S. Dias University of Kelaniya
Prof. (Mrs.). N. Gnanavelrajah University of Jaffna
Prof. (Mrs.) T. Mikunthan University of Jaffna
Prof. MahindaAtapattu University of Ruhuna
Prof. Thayamini H. Seran Eastern University, Sri Lanka
Prof. S. Sutharsan Eastern University, Sri Lanka
Asst.Prof. A.M.Razmy South Eastern University of Sri Lanka
Dr P. Sivarajah Eastern University, Sri Lanka
Dr. K. Premakumar Eastern University, Sri Lanka
Dr. P.H.I.U. Waidyatilaka University of Colombo
Dr. S.Pathmarajah University of Peradeniya
Dr. M. Pagthinathan Eastern University, Sri Lanka
Dr. S. Mahendran Eastern University, Sri Lanka
Dr. (Mrs.).Kumuthini D. Harris Eastern University, Sri Lanka
Dr. R.F. Niranjana Eastern University, Sri Lanka
Dr. (Mrs.) Muttulachchumi Eastern University, Sri Lanka
Dr. K. Rajendram Eastern University, Sri Lanka
Dr. (Mrs.) DisnaRatnasekera University of Ruhuna
Dr. K.M.C Fernando University of Ruhuna
Dr. M.I.S. Safeena South Eastern University of Sri Lanka
Dr. (Mrs.).G. C. Samaraweera University of Ruhuna
Dr. Sujeewa De Silva University of Kelaniya
Dr. K. P. J. Perera University of Kelaniya
v
Dr. N.P. Ranathunge University of Ruhuna
Dr. M.G.T.S. Amarasekara Rajarata University of Sri Lanka
Dr. M. Umakanth Eastern University, Sri Lanka
Dr. Arulanantham Eastern University, Sri Lanka
Dr. S. Arasaretnam Eastern University, Sri Lanka
Dr. T. Bhavan Eastern University, Sri Lanka
Dr. VidurangaWaisundara Australian College of Business &Tec.
Dr. A. Jahufar South Eastern University of Sri Lanka
Dr. B.G.N Sewwandi South Eastern University of Sri Lanka
Dr. K.W.S.N. Kumari UvaWellassa University
Dr. AjithGunawardena Central Environmental Authority
Dr. M.S. Nijamudeen FCRDI, Mahailluppallama
Mr. M. Sugirtharan Eastern University, Sri Lanka
Mr. R. Thivyatharsan Eastern University, Sri Lanka
Ms. T. Kirupananthan Eastern University, Sri Lanka
Mrs. T. Geretharan Eastern University, Sri Lanka
Mr. S. Srikrishnah Eastern University, Sri Lanka
Mr. T. Geretharan Eastern University, Sri Lanka
Mr. K. Suresh Eastern University, Sri Lanka
Mr. S. Wijetunga University of Ruhuna
Mr. M. Nazeer Ahmed South Eastern University of Sri Lanka
Mr. Mohamed Rinos South Eastern University of Sri Lanka
Mr. YasinBawa Iqbal Department of Agriculture
Mr. A.L. Badurdeen Hardy College of Technology
vi
MESSAGE FROM
THE VICE CHANCELLOR
EASTERN UNIVERSITY, SRI LANKA
It is always a happy day when you have to pen this message for an International
Symposium at the University.
It is a prime function of the University to disseminate knowledge and facilitate
linkages between institutions and individuals, the key features of the conference
too.
“Innovation and Invention on Sustainable Agriculture” is the theme for the
conference which blends in with the current United Nation theme of Sustainable
development and Poverty alleviation targeted for Achievement by 2030.
I am aware that organizing a Symposium is an arduous task and starts long
before the day of the symposium and finish long after the symposium, the long
could be many months on either side.
I welcome all the participants International and National for taking the time to
join us and visit us. I wish them a fruitful stay in the lagoon environs of the
region.
I congratulate the Faculty and the Organizing Committee for undertaking the
Organization of the 2nd
such symposium on Agriculture, the first for the year at
Eastern University and wish the best for the event and its deliberations.
Dr. T. Jayasingam
Senior Professor of Botany &
Vice Chancellor
09.01.2019
vii
MESSAGE FROM
THE DEAN, FACULTY OF AGRICULTURE
EASTERN UNIVERSITY, SRI LANKA
It is with great pride that I write this message on the occasion of the 2nd
International Symposium of Agriculture 2919 organized by the Faculty of
Agriculture, Eastern University, Sri Lanka. Firstly, I wish to congratulate the
Organizing Committee of ISA 2019 for having done an excellent job in
organizing this Symposium through their untiring efforts in screening, calling
for papers, reviewing them and making the final selection of papers for
presentation. This is the 2nd
International Symposium being organized by the
Faculty to bring together both local and international researchers in tropical
agriculture under one roof.
Agriculture plays a vital role in the economy of many developing countries
through provision of food for the people, employment and food security to the
nation. Agriculture faces many challenges and constraints in the context of
climate change and the globalization process that has engulfed the world now.
Hence, research activities related to them are vital at this juncture and the
efforts of researchers should be directed towards this goal. I wish that this ISA
2019 will bring together researchers for a discussion and networking on the
challenges faced by agriculture currently. I hope that the papers presented today
will enhance knowledge and suggest solutions for the above issues.
I wish all the presenters and participants a wonderful day at Eastern University
and shall remember their visit to Sri Lanka.
Have a pleasant day to all.
Dr P Sivarajah
Dean / Agriculture
viii
MESSAGE FROM THE COORDINATOR/
2ND
INTERNATIONAL SYMPOSIUM ON
AGRICULTURE-2019
It is my great pleasure to deliver this message as a coordinator of the second
International Symposium on Agriculture (ISA 2019) of the Faculty of
Agriculture, Eastern University, Sri Lanka. The first International Symposium
on Agriculture (ISA 2017) of the faculty of agriculture was successfully
conducted in 2017. Subsequently the faculty decided to conduct the symposium
during January each year. Therefore, we pleased to conduct 2nd
international
Symposium on Agriculture on 09th
January 2019, at Eastern University,
Vantharumoolai. It has been a real honor and privilege to serve as the
coordinator of the symposium. This symposium will provide ample
opportunities for discussions, debate, and exchange of ideas and information
among conference participants.
I would like to express my appreciation to the Technical Session Chairs and
panel members for their valuable contribution in assembling the high quality
program. Special thanks to the Keynote Speaker, Dr. Sreenivasa Rao, Principal
Scientist at ICAR, Indian Institute of Horticultural Research, INDIA for sharing
his views on the symposium theme of „innovation and invention on sustainable
agriculture‟. We are also grateful to all the authors who trusted the symposium
with their work.
I wish to express my sincere gratitude to the Vice chancellor Eastern University
Sri Lanka for giving opportunity to conduct this symposium this year with
financial support and Dean Faculty of Agriculture and other officials from the
Eastern University Sri Lanka who rendered valuable help to make this event
success. I appreciate the editorial committee of ISA 2019 for their great effort in
editing the conference proceedings.
M.Sugirtharan
Coordinator/ ISA 2019
ix
CONTENTS
IMPACT OF TEA PACKAGING DESIGN ON CONSUMER BUYING
BEHAVIOR
R.A.P.I.S. Dharmadasa, A.M.C. Amarakoon, M.M.B.S. Silva and S.C.
Senevirathne
01
SOURCES OF AGRICULTURAL INFORMATION USED BY
INTEGRATED FARMING SYSTEM PRACTISING FARMERS:
EVIDENCE FROM PORATIVU PATTU DS DIVISION, BATTICALOA
DISTRICT
T. Geretharan and S. Amuthenie
09
DETERMINANTS OF OFFICERS IN CHARGE TURNOVER INTENTION:
A CASE OF KURUNEGALA PLANTATIONS LIMITED
M.M.B.S. Silva, S.M.M. Samarakoon and R.A.P.I.S. Dharmadasa
18
EXPLORING THE EFFECT OF GOOD AGRICULTURAL PRACTICES
(GAP) WITH SPECIAL REFERENCE TO SELECTED VEGETABLES
AND FRUITS FARMING: A CASE STUDY IN SELECTED DS DIVISION
IN ANURADHAPURA DISTRICT
S.P Wijethunge and T. Kirupananthan
24
SUSTAINABLE ECOTOURISM DEVELOPMENT: A CASE STUDY IN
MANDAITIVU ISLAND, JAFFNA
Kajanini Balasubramaniam and Mangala De Zoysa
31
ADOPTION OF MACHINERY IN TEA CULTIVATION AND
MANAGEMENT BY TEA SMALLHOLDERS IN KALUTARA DISTRICT
R.A.P.I.S Dharmadasa, U.M.Karunathilaka, K.G Premathilake,
M.M.B.S.Silva and D.M.J. Nakandala
40
EFFICIENCY OF ACTIVATED CARBON PRODUCED FROM PET
(POLYETHYLENE TEREPHTHALATE) WASTE MATERIALS FOR THE
TREATMENT OF MUNICIPAL SOLID WASTE LANDFILL LEACHATE
G. Puvitha and R. Thivyatharsan
48
ASSESSMENT OF PALMYRAH PALM DISTRIBUTION AND DENSITY
IN EAST AND SOUTH EAST OF VALIKAMAM REGION IN JAFFNA
PENINSULA USING VERY HIGH RESOLUTION SATELLITE IMAGESS.
Nareshkumar, Nalina Gnanavelrajah and S. Raveendran
55
x
SPATIAL VARIATION OF WATER QUALITY OF THE UNNICHCHAI
RIGHT BANK CANAL IN BATTICALOA DISTRICT
M. Pavithra, M. Sugirtharan and M. Rajendran
65
VARIATION OF IRRIGATION WATER QUALITY WITH PUMPING
DURATION AT TWO COASTAL VILLAGES OF BATTICALOA
DISTRICT
G. Niroash, M. Sugirtharan and M. Rajendran
77
INFLUENCE OF SOIL MOISTURE LEVELS AND FERTILIZER
POTASSIUM ON POTASSIUM CONTENT AND YIELD OF COWPEA
(Vignaunguiculata) IN SANDY REGOSOL
R. Vassanthini and P. Premanandarajah
85
IMPACTS OF BIOCHAR ON EROSION POTENTIAL OF SOIL IN SLOPE
LAND
K. G. S. Madhushani and A. Nanthakumaran
94
EFFECT OF INORGANIC POTASSIUM FERTILIZER AND SELECTED
ORGANIC MANURES ON THE POTASSIUM AVAILABILITY AND
YIELD OF COWPEA (Vignaunguiculata) IN SANDY REGOSOLS OF
BATTICALOA DISTRICT, SRI LANKA
S. Shakithya and P. Premanadarajah
101
PERCEPTION OF CLIMATE CHANGE AND ITS EFFECT ON HUMAN
HEALTH: A PRELIMINARY SURVEY AMONG THE STAFF AT
EASTERN UNIVERSITY, SRI LANKA
Kavuriel Eliyas Karunakaran, Selvanayagam Santharooban and Mohamed
Faleel Mohamed Marsook
109
ANTIBACTERIAL ACTIVITY AND PHYTOCHEMICAL PROPERTIES
OF SOME SELECTED MEDICINAL PLANTS FROM BATTICALOA
DISTRICT
C. Mahendranathan and H. Mahendrarajah
117
IDENTIFICATION OF MOST SUITABLE SILO FOR LIVESTOCK FARM
IN EASTERN UNIVERSITY, SRI LANKA
A.G.D. T. M. Wijerathna and M.M. Mahusoon
126
xi
SHELF LIFE EVALUATION OF SOURSOP (Annonamuricata L.) JELLY
WITHOUT PRESERVATIVES
G. G. A.Shashikala and T. Mahendran
132
ASSESSMENT OF ANTIOXIDANT AND MINERAL CONTENT IN
SELECTED WILD GREEN LEAFY VEGETABLES
K. Krishanthiny and U. Mathiventhan
142
INFLUENCE OF SOME MATERNAL ANTHROPOMETRIC
PARAMETERS ON HAEMOGLOBIN AND SERUM FERRITIN
CONCENTRATION AMONG PREGNANT MOTHERS AND THE BIRTH
WEIGHT OF THEIR BABIES IN THE BATTICALOA DISTRICT
S. Amuthenie and R. Sivakanesan
149
STUDY ON NURSERY MANAGEMENT TECHNIQUES FOR CHILLI
(Capsicum annum L)
H.M.P.T.K. Hettigedara, M.A.P.W.K. Malaviarachchi, R.L. Senanayake and
G.H.K. De Silva
159
MARKETABLE POD YIELD OF OKRA (Abelmoschusesculentus) CV.
HARITHA AS AFFECTED BY THE FOLIAR APPLICATION OF
MORINGA (Moringaoleifera) LEAF EXTRACT
K. D. Harris and A. M. K. D. M. Attanayaka
166
SCREENING OF MUNGBEAN (Vignaradiata) ACCESSIONS UNDER
INTERMITTENT DROUGHT STRESS
K.H.S.T Deshabandu, C.Y. Dissanayake, E.M.S.P. Ekanayake,
W.M.W.Weerakoon, M.S Nijamudeen, W.C.P.Egodawatta and P.
Kumararathna
174
PHYSIOLOGICAL RESPONSES AND YIELD OF THREE OKRA
(Abelmoschusesculentus L.) CULTIVARS AS AFFECTED BY SOIL
MOISTURE STRESS DURING THE FLOWERING STAGE
S. Premadasa, S. Mahendran and G. Hariharan
186
LABORATORY EVALUATION OF SOME SELECTED INDIGENOUS
PLANT LEAF AND GARLIC BULB EXTRACTS AGAINST
Triboliumcastaneum (Coleoptera: Tenebrionidae) IN CHICKPEA
(Cicerarietinum)
S. Karunakaran and R. F. Niranjana
196

xii
PESTICIDE RESIDUE ANALYSIS IN OKRA IN BATTICALOA
DISTRICT
P.A.N.P. Pandipperuma, R.F. Niranjana, D. Senevirathne and K.P.G.T.
Guruge
203
ALTERNATIVE OPTIONS FOR SYNTHETIC FUNGICIDE FOR
TREATING SEEDS OF CHILLI (Capsicum annuum L.)
D. G. Bawani Malsha and K. Prasannath
211
BIO EFFICACY OF PRE-PLANT HERBICIDE; TIAFENACIL 50g/L ME
R.M.U.S. Bandara, H.A.S.N. Hettiarachchi, Y.M.S.H.I.U. De Silva,
H.M.M.K.K.H. Dissanayaka, W.M.U.B. Wickrama, M.R.A.B. Madduma,
P.R.T.E.W.M.R.B. Ekanayake, J.D.H.E. Jayasinghe, M.M. Kumarage and
K.M.C.R. Bandara
219
ISOLATION, IDENTIFICATION AND EVALUATION OF MASS
CULTURE MEDIA FOR TRICHODERMA SPP. FROM SRI LANKA
W.M.K. Fernando, D.M.J.B. Senanayake, R.S. Wilson Wijeratnam,
C. M. Nanayakkara, W.A.R. Dhammika D.C.M.S.I. Wijewardana and
W.M.S.D.K.Wijerathne
224
Proceedings of the 2nd International Symposium on Agriculture (ISA-2019)
Eastern University, Sri Lanka
1
IMPACT OF TEA PACKAGING DESIGN ON CONSUMER BUYING
BEHAVIOR
R.A.P.I.S. Dharmadasa, A.M.C. Amarakoon, M.M.B.S. Silva* and S.C. Senevirathne
Department of Export Agriculture, Uva Wellassa University of Sri Lanka
*Corresponding author: [email protected]
Abstract
The tea sector has higher potential to contribute considerably to economic development
of Sri Lanka through export earnings. In 2017, contribution to export earning was more
than 1.4 billion US$. The production and manufacturing of black tea is of higher
importance in this regard. Moreover, in a competitive market arena, the way the
product is presented to the customer is also noteworthy. For instance, black Tea Inner
Cartons (TIC) are offered to consumer in many forms and it should be presented in
attractive forms to catch the consumer favor to the product. Therefore, this study is an
attempt to find the effects of selected packaging attributes on the consumer buying
behavior and the relationship between social economic factors of the consumer and the
tea inner carton buying behavior. A sample of 300 consumers who purchase tea with
inner cartons in the Colombo District was taken for the study. Appropriate
supermarkets were selected using Judgmental sampling technique while consumers
were taken using convenient sampling technique. Primary data were collected by
administrated structured questionnaire among the respondents in the sample. Conjoint
Analysis was performed to rank the importance of the packaging attributes and to find
the best combination of attribute levels. Accordingly, the consumers prefer image and
color of the packaging to size and material of the packaging while the most preferred
combination of packaging attribute was dark color, large size package with traditional
image and artificial material. Most of the consumers prefer green (29.6%), blue
(10.3%), yellow (9%), black (7.3%) and red color (7%) inner cartons respectively.
Research study recommends that manufactures should focus on the image of the
package more than other attributes while giving more emphasis in producing inner
cartons having dark color, large size package with traditional image and artificial
material.
Keywords: Black Tea Inner Cartons, Conjoint Analysis, Consumer Buying Behavior,
Packaging
Introduction
Consumer market for tea products grows rapidly every year and the number of
competitors among different types of tea products increases rapidly. Every company
tries to increase their customer base and earn more profit. To standout against
competitors, every company tries to invent something new and to get the competitive
advantage for providing the product to the end customer.
Proceedings of the 2nd International Symposium on Agriculture (ISA-2019)
Eastern University, Sri Lanka
2
Packaging is a term that comes under the subject of marketing. Products packaging is
an element that is commonly used by marketers to emphasis the buying decision of the
potential buyers. This common element can also be used for convenience and
information transmission and even for differentiation. Package design is one of the
most significant parts of product strategy (Ksenia, 2013). It is estimated that
approximately 70 percent of all purchase decisions of goods are made at the point of
purchase according to Schoormans and Robben (1997). Therefore, the package itself is
the only marketing communication the consumer may receive while evaluating the
product (Holmes and Paswan, 2012).
The packaging of a product will provide the product within safety. It is an essential
element to market the products. Mainly to gain the customer attraction a company or a
producer could use the products packaging strategically. The manufacturers should be
careful when adding value through the packaging. Recent decade studies focusing on
the visual impact of package on consumer attraction include categorization and
evaluation as Schoormans and Robben (1997) examined. Packaging plays a vital role
in competitive marketing environment. Dividing packaging design elements (size,
color, shape, material, etc.) into categories will give good conclusion to the procedures
to have good packaging strategy. This can lead to cost reduction and reduction of
unattractive elements of a packing design.Identifying what are the effective design
elements that influence consumer purchasing behavior and using them to have good
packaging strategy to attract consumers becoming more important and crucial for
success of the product. Therefore, this research study is conducted to identify the
impact of package design elements on consumer purchasing behavior.
Main Objective
To analyze the impact of packing design elements on consumer buying
behavior for black tea inner carton.
Specific Objectives
To determine the specific features of designing of inner cartons by producer for
improvement of designing.
To analyze the impact of socio economic factors on considering tea packaging
designing.
Materials and Methods
The population of our study was Tea Inner Carton customers who live in Colombo area
under age group ranging from 20 years to 65 years. Out of the population 300
customers were selected as sample from 15 zones of the Colombo area. Appropriate
supermarkets were selected using Judgmental sampling technique while consumers
were taken using convenient sampling technique.Primary data were collected through
questionnaires among the consumers who purchase tea inner carton products. The self-
administered questionnaires consisted of three sections.
Proceedings of the 2nd International Symposium on Agriculture (ISA-2019)
Eastern University, Sri Lanka
3
Section 01 : Questions regarding demographic variables
Section 02 : Questions regarding the package element experience of consumer
selection in Tea inner carton (Color, Package Size, Package Material, Package
Images, Package Logo, and Package Slogans, Package ingredients information,
health benefits, other information, tea type and package type)
Section 03 : General question on tea inner carton
This research is conducted by taking the buying behavior of the Tea inner carton by
customers as the dependent variable. Independent variables of this are color, size,
material and image.
Frequency distribution analysis with mean and standard deviation and was used to
accomplishment the objectives of the study.Conjoint analysis is a tool which is
extensively used for marketing purposes to design or modify the products. The survey
was conducted among consumers and they were allowed to rank the attributes levels of
the products. Then SPSS software was used to analyze the collected data. It was done
to estimate customers‟ value system. It showed how much value a consumer puts on
each level of each of the attributes. Therefore, the product class was divided in to
attributes and levels. In Conjoint analysis independent variables are product attributes
and dependent variable is buying behavior of the interviewed consumers for the tea
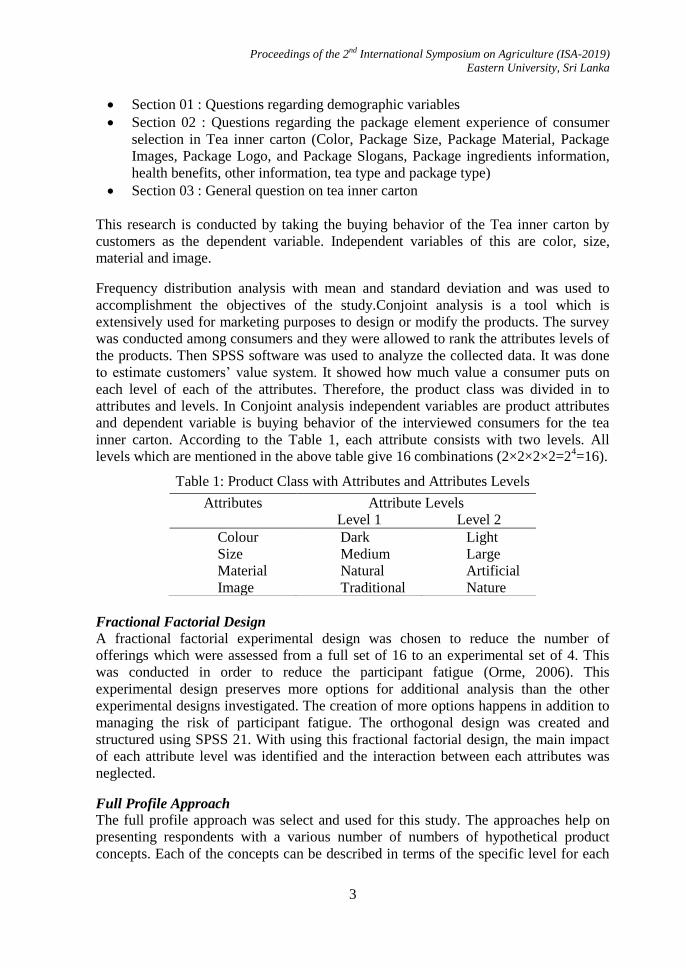
inner carton. According to the Table 1, each attribute consists with two levels. All
levels which are mentioned in the above table give 16 combinations (2×2×2×2=24=16).
Table 1: Product Class with Attributes and Attributes Levels
Fractional Factorial Design
A fractional factorial experimental design was chosen to reduce the number of
offerings which were assessed from a full set of 16 to an experimental set of 4. This
was conducted in order to reduce the participant fatigue (Orme, 2006). This
experimental design preserves more options for additional analysis than the other
experimental designs investigated. The creation of more options happens in addition to
managing the risk of participant fatigue. The orthogonal design was created and
structured using SPSS 21. With using this fractional factorial design, the main impact
of each attribute level was identified and the interaction between each attributes was
neglected.
Full Profile Approach
The full profile approach was select and used for this study. The approaches help on
presenting respondents with a various number of numbers of hypothetical product
concepts. Each of the concepts can be described in terms of the specific level for each
Attributes Attribute Levels
Level 1 Level 2
Colour Dark Light
Size Medium Large
Material Natural Artificial
Image Traditional Nature
Proceedings of the 2nd International Symposium on Agriculture (ISA-2019)
Eastern University, Sri Lanka
4
factor. The four attributes each with two levels the total number of profiles resulting
formal possible combinations of all attribute levels will be 24 = 16, and every profile
have been provided with heaviest unique combination of attribute levels. Then
consumers are asked to rank or rate these combinations. These data can be utilized to
estimate individual utility values (part worth fitting) to each attribute level (Gan, 1992).
However, it is difficult to analyze more than five attributes.
Model for the Conjoint Analysis
Uj = β0 + β1 X1+ β2 X2+ β3 X3+ β4 X4+ ԑ
Uj = Total utility of product elements combination
β0 = The constant term
β1, β2, β3, β4 = Part worth consumption
X1 = Color
X2 = Size
X3 = Material
X4 = Image
ԑ = Error
Total Utility and Partworth Utilities
Partworth utilities are numerical scores that measure how much each attribute and level
influenced the customer‟s decision to make that choice. The sum of the part worth
utilities where part worth utilities defined as the numerical relationship of each
attributes levels with consumer preference (Bond, 2001). These utilities could be linear,
quadratic or part worth relationships.
Results and Discussion
Descriptive Analysis
Out of the total sample 46.3% are male customers and 53.7% are female customers.
With respect to the descriptive analysis, mostly the buying decision of TIC has been
taken by females. Most of the tea inner carton users are distributed among age group of
20 years old to 35 years old. 73% of the respondents who possesses education levels
more than Advanced Level are using tea inner carton. 55% users of tea inner carton
employed in the private sector jobs. The most of the consumers who use the tea inner
carton are on the income range of Rs.20000 –Rs.70000. Out of the total sample of the
tea inner carton users, 81% considered the price as a significant factor when making
the purchasing decision. Out of those 81%, 20% of the customers considered the price
are extremely important and 61% customers have considered as important. With this
we can judge that the buying decision of the consumers will be thoroughly effected
with the influence of the price. While buying an inner carton, 55% of customers
considered logos. When considering slogans 40% of customers are considering the
slogans that are available in the packaging.
Proceedings of the 2nd International Symposium on Agriculture (ISA-2019)
Eastern University, Sri Lanka
5
According to the data gathered from the customers are possessing more likeness
towards the colors green (29.6%), blue (10.3%), yellow (9%), black (7.3%) and red
(7%). The customer consideration on information that is available in a tea inner carton.
With referring to these values they are trending closer to each other. These factors are
very important in package designing because these factors provide the relevant
information about the product to the customer.The packing design considered by the
consumers when the buying decision is made. Out of the total amount 78% are
considering the package design.
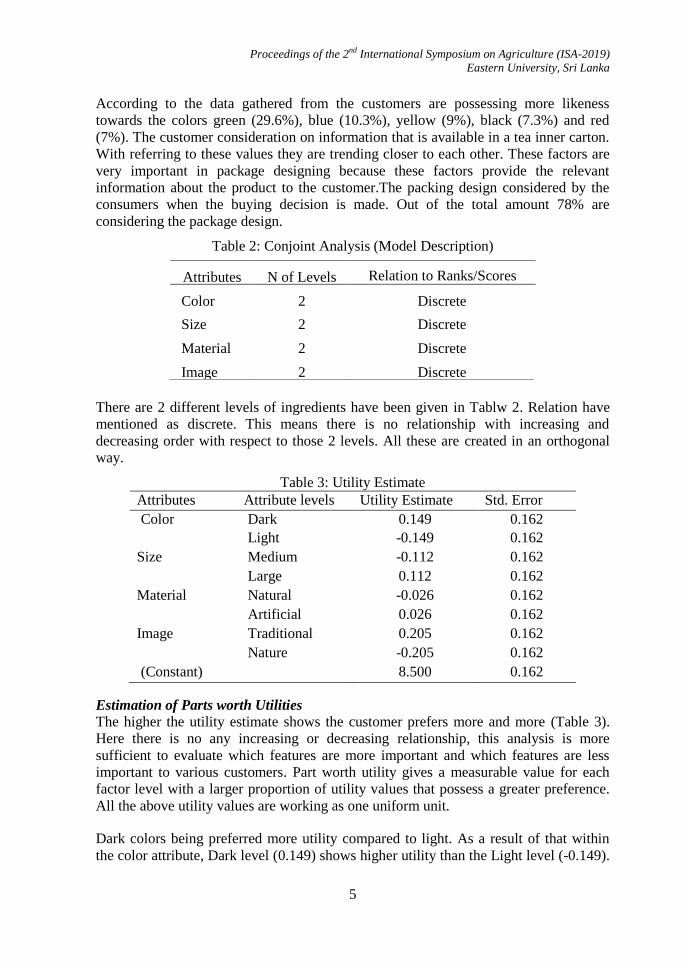
Table 2: Conjoint Analysis (Model Description)
There are 2 different levels of ingredients have been given in Tablw 2. Relation have
mentioned as discrete. This means there is no relationship with increasing and
decreasing order with respect to those 2 levels. All these are created in an orthogonal
way.
Table 3: Utility Estimate
Attributes Attribute levels Utility Estimate Std. Error
Color Dark 0.149 0.162
Light -0.149 0.162
Size Medium -0.112 0.162
Large 0.112 0.162
Material Natural -0.026 0.162
Artificial 0.026 0.162
Image Traditional 0.205 0.162
Nature -0.205 0.162
(Constant) 8.500 0.162
Estimation of Parts worth Utilities
The higher the utility estimate shows the customer prefers more and more (Table 3).
Here there is no any increasing or decreasing relationship, this analysis is more
sufficient to evaluate which features are more important and which features are less
important to various customers. Part worth utility gives a measurable value for each
factor level with a larger proportion of utility values that possess a greater preference.
All the above utility values are working as one uniform unit.
Dark colors being preferred more utility compared to light. As a result of that within
the color attribute, Dark level (0.149) shows higher utility than the Light level (-0.149).
Attributes N of Levels Relation to Ranks/Scores
Color 2 Discrete
Size 2 Discrete
Material 2 Discrete
Image 2 Discrete

Proceedings of the 2nd International Symposium on Agriculture (ISA-2019)
Eastern University, Sri Lanka
6
It implies that, sampled consumers prefer dark colored tea inner carton than light
colored tea inner carton. According to psychologists, color likeliness has been derived
as a key trait in personality. Large size being given more utility compared to medium.
When the size is considered, medium size gives a lower utility level (-0.112), with
respective to the large size (0.112), when it contains high level of utility. This implies
that when a customer makes the buying decision they give a larger priority to the larger
size.
Artificial materials are preferred more compared to natural. With discussing the
material attribute, the levels have been derived as artificial material and natural
material. With referring the utility level, the natural material using/buying likeliness is
at a lower position (-0.026) than using packaging that manufactured by artificial
material. Respondents have a high utility towards artificial material (0.026). The basic
reasons for this attitude of the respondents are the expectation of durable package and
the safety of the product.
Traditional images are more preferred compared to natural images. The image of the
packaging is a key attribute that is helpful to achieve the consumer attraction towards
Tea inner carton. Image attribute can be divided in to two attribute levels as traditional
images and nature. The traditional images contain a high utility level (0.205) rather
than for the natural images utility level (-0.205). This is also affected from the
physiological levels of the consumers. The values which are expressed in the
percentage shows the importance given by the consumers. According to the Table 4,
the most important attribute is image. Out of total, it obtains 41.667% as relative
importance. It is very important for producers to decide what type of image that they
are using in the package in order to advertise their product. Images provide the initial
impression to the customer about the product.
The next important attribute is the color out of the total. This indicates that the
consumers are considering the color attribute as an important factor. The reason is that
when companies are publishing their products they do branding and this branding
concept is done in order to capture the recognition of the customer, one of the key
components that producer can use to capture therecognition of the customer is the color
of the brand and using that color in the products packaging so that the customer could
identify the particular product apart from other similar products.
Table 4: Importance of Attributes
Size is another attribute that is considered by the customers but is not considered much
more than the previous both attributes. Size contains the 22.76% value out of the total
Attribute Score %
Color 30.376
Size 22.760
Material 5.197
Image 41.667
Proceedings of the 2nd International Symposium on Agriculture (ISA-2019)
Eastern University, Sri Lanka
7
attributes. This size has been a concern because it should be convenient for the user and
the usage should be supported from the packaging. The least concerned attribute out of
the total attributes is the material. The value that is allocated 5.197% out of the total
attributes. The material is considered but not in a very high level. This is where the
most of the consumers are giving more priority to the size because of the durability of
the package.
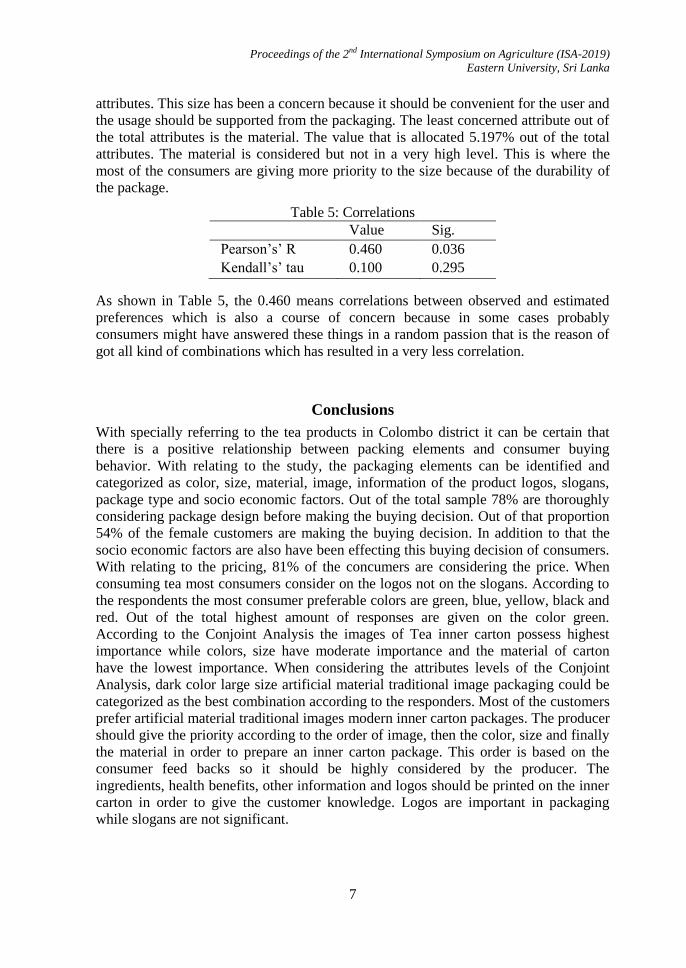
Table 5: Correlations
Value Sig.
Pearson‟s‟ R 0.460 0.036
Kendall‟s‟ tau 0.100 0.295
As shown in Table 5, the 0.460 means correlations between observed and estimated
preferences which is also a course of concern because in some cases probably
consumers might have answered these things in a random passion that is the reason of
got all kind of combinations which has resulted in a very less correlation.
Conclusions
With specially referring to the tea products in Colombo district it can be certain that
there is a positive relationship between packing elements and consumer buying
behavior. With relating to the study, the packaging elements can be identified and
categorized as color, size, material, image, information of the product logos, slogans,
package type and socio economic factors. Out of the total sample 78% are thoroughly
considering package design before making the buying decision. Out of that proportion
54% of the female customers are making the buying decision. In addition to that the
socio economic factors are also have been effecting this buying decision of consumers.
With relating to the pricing, 81% of the concumers are considering the price. When
consuming tea most consumers consider on the logos not on the slogans. According to
the respondents the most consumer preferable colors are green, blue, yellow, black and
red. Out of the total highest amount of responses are given on the color green.
According to the Conjoint Analysis the images of Tea inner carton possess highest
importance while colors, size have moderate importance and the material of carton
have the lowest importance. When considering the attributes levels of the Conjoint
Analysis, dark color large size artificial material traditional image packaging could be
categorized as the best combination according to the responders. Most of the customers
prefer artificial material traditional images modern inner carton packages. The producer
should give the priority according to the order of image, then the color, size and finally
the material in order to prepare an inner carton package. This order is based on the
consumer feed backs so it should be highly considered by the producer. The
ingredients, health benefits, other information and logos should be printed on the inner
carton in order to give the customer knowledge. Logos are important in packaging
while slogans are not significant.

Proceedings of the 2nd International Symposium on Agriculture (ISA-2019)
Eastern University, Sri Lanka
8
Acknowledgements
Sincerely grateful to thank, Managers of all supermarkets in Colombo area for
organizing all relevant arrangements and catering needs with regards to conducting the
research study.
References
Bond, S. (2001). The use of CA to assess the impact of environmental stigma. Pacific
Rim Property Research Journal, 7(3): 182-194.
Gan, C.E., (1992). A CA of Wetland-Based Recreation: A Case Study of Louisiana
Waterfowl Hunting PhD Thesis. Louisiana State University
Holmes, G.R. and Paswan, A. (2012). Consumer reaction to new package design.
Journal of Product & Brand Management, 21(2):109-116
Ksenia, P. (2013). Packaging design as a Marketing tool and Desire to purchase.
[Online]Available:https://www.theseus.fi/bitstream/handle/10024/55293/Polyakova
Ksenia.pdf. Accessed on 27th
August, 2018)
Orme, B. K. (2006). Getting started with conjoint analysis: Strategies for product
design and pricing research. Madison, WI: Research Publishers LLC.
Schoormans, J. P. L., & Robben, H. S. J. (1997). The effect of new package design on
product attention, categorization and evaluation. Journal of Economic Psychology,
18(2-3), 271–287. doi: 10.1016/s0167-4870(97)00008-1
Proceedings of the 2nd International Symposium on Agriculture (ISA-2019)
Eastern University, Sri Lanka
9
SOURCES OF AGRICULTURAL INFORMATION USED BY
INTEGRATED FARMING SYSTEM PRACTISING FARMERS:
EVIDENCE FROM PORATIVU PATTU DS DIVISION, BATTICALOA
DISTRICT
T. Geretharan
*1 and S. Amuthenie
2
1Department of Agricultural Economics, Faculty of Agriculture, Eastern University, Sri Lanka 2Department of Agricultural Chemistry, Faculty of Agriculture, Eastern University, Sri Lanka
*Corresponding author: [email protected]
Abstract
This study was carried out to explore the use of agricultural information sources by
farmers practising Integrated Farming System (IFS) in Porativu Pattu DS division,
Batticaloa district. Questionnaire survey was used to generate data. Data were collected
from randomly selected 150 IFS farmers. The collected data were analysed using
frequency distribution and percentages as well as Chi-Square test analysis. Among the
individual information sources, informal sources are mainly accessed by the IFS
farmers which include family members, friends and progressive farmers. Further, field
days, demonstrations and trainings were ranked as the main group information sources
by the IFS farmers. The study further highlights that among the mass information
sources available, the IFS farmers ranked radio as the mostly used source to get
integrated farming related information. Furthermore, a significant association (P< 0.01)
was observed between informal information sources and their regularity of usage.
Overall, the study concludes that the IFS farmers in the study area mostly rely on
informal information sources to obtain information regarding integrated farming
practices, followed by field days and demonstrations organized by relevant
departments. The farming community should be encouraged by relevant agricultural
support service providers to frequently utilize the agricultural information sources to
obtain upto date information on new farming practices.
Keywords: Agricultural information, Informal information sources, Integrated
farming, Rural farmers
Introduction
Information is a key factor and vital resource for any development. It is regarded as a
basic necessity in daily life, including farming activities (Badiru et al., 2016; Hassen et
al., 2012). To make decision, every person needs adequate information (Mchombu and
Cadbury, 2006). The access and utilization of information are main two fundamental
aspects to achieve agricultural development. As Mchombu and Cadbury (2006) argued,
this is mainly due to the fact that agricultural information is not delivered for its own
sake but for its use. Rural farmers access and utilize information from available sources
for better farming system and improved agricultural yield (Adio et al., 2016). Access to
Proceedings of the 2nd International Symposium on Agriculture (ISA-2019)
Eastern University, Sri Lanka
10
adequate information is essential to improve agricultural productivity (Mgbada, 2006)
and marketing efficiency (Brunnermeier, 2005). According to Alemna and Skouby
(2000), the pattern of information access and utilization of rural farmers is complex as
these farmers have particular requirements which vary according to resources at their
hand.
Agricultural information is not only essential for agricultural development but also to
enhance the living standard of rural farmers (Uwandu et al., 2018). This argument is
supported by Ronald et al. (2015) who see agricultural information as a key factor in
improving smallholder agricultural production, thus leading to enhanced livelihoods,
food security and national economics as a whole. Agricultural information is defined
by Agbamu (2006) as all published or unpublished knowledge in all aspects of
Agriculture. Recently, Amaechi and Ossaionah (2015) defined agricultural information
as the various sets of information and messages that are relevant to agricultural
production activities such as crop production and protection, animal production and
management and natural resource production and conservation. The present study was
conducted in relation to information utilization pattern of farmers practising integrated
farming system and the agricultural information in this study is therefore defined as
agricultural related data which are relevant to make effective decisions in integrated
farming system related activities.
Farmers utilize agricultural information from various information sources. According
to Bisto (2012), the information source is a medium in which information and/or
knowledge is stored, whereas Adio et al. (2016) view the information sources as tools
that can possibly meet the information needs of different kinds of users. Sources of
agricultural information can be; radio, television, extension workers, friends and
colleagues, magazines, newspapers, books, leaflets, and internet. In addition, speeches,
documents, picture and art work can also be described as information sources (Adio et
al., 2016). Two categories of information sources have proposed by Koyenikan (2011);
formal and informal sources. According to Koyenikan, the formal sources consist of
government radio stations, local and international print media (such as newspapers,
journals, newsletters and magazines), and seminars/workshops; while family members,
friends, and other farmers are included under informal sources of information. A study
based on sources of information carried out by Olaniyi et al. (2011) demonstrates that
interpersonal interaction exists in the rural areas are still of dominant in the
dissemination of agricultural information. Further, a very recent study carried out
among Sri Lankan vegetable farmers indicates traditional information sources such as
progressive farmers, neighbouring farmers and family members remain the most
adopted and trusted sources by the farmers (Mahindarathna and Min, 2018). Likewise,
another study among coconut farmers in Batticaloa district report that informal sources
such as relatives, friends and neighbouring farmers were frequently used by farmers to
get coconut farming related information (Selvarajah and Geretharan, 2013). Another
study reports that television ranked first among the mass media sources used by the
farmers followed by radio in Sri Lanka (Adikari, 2014). However, several scholars
(Lokanathan and Kapugama, 2012; Mahindarathna and Min, 2018) reveal that the

Proceedings of the 2nd International Symposium on Agriculture (ISA-2019)
Eastern University, Sri Lanka
11
usage of mass media as a sources of information was generally low among Sri Lankan
farmers.
Integrated farming is the characteristics of subsistence agriculture and longstanding
practice across the globe, especially in the developing countries which are dominated
by smallholdings (Bhuiya et al., 2014). The Integrated Farming System (IFS) is a term
generally and mostly used to explain a combined approach to farming as compared to
monoculture methods. The IFS denotes to agricultural systems that integrate crop and
livestock production and/or aquaculture. An inter related set of advantages practised in
this system, as such the waste from one component turn into an input for another
component of the system, which diminishes cost and expands production and income
(Soni et al., 2014; Dashora and Hari Singh, 2014). The IFS is one of the major sources
of livelihood of many farmers in Porativu Pattu Divisional Secretary‟s (DS) division of
Batticaloa district. As the IFS involves combination of farming approaches, farmers
practising the system need adequate and relevant information to obtain optimum
benefits from the system. The smallholder farmers practising IFS in the study area
obtain information from various information sources. These information sources, for
the purpose of this study, grouped into individual, group and mass information sources.
The information sources utilized by farming households in accessing agricultural
information related to the IFS are decisive in Batticaloa district, especially in Porativu
Pattu DS division, where their primary source of income is agriculture. It is imperative
therefore to study the available information sources and pattern of their utilization
among farmers who involve in the IFS in Porativu Pattu DS division, Batticaloa
district. As such, this study was conducted with the general focus to identify the
utilization pattern of agricultural information sources among IFS farmers in Porativu
Pattu DS division, Batticaloa district. The following section describes the methodology
used for the study.
Methodology
Study Area
This study was carried out in Porativu Pattu Divisional Secretary‟s division in
Batticaloa district. The total area of the division is 167.2 square kilometres of which
land area constitutes 150.3 square kilometres. The Porativu Pattu DS division is
administratively divided into 43 Grama Niladhari divisions with 120 villages. There are
7, 453 families residing under this division which make up the total population of the
division into 43, 579. Agriculture is the major livelihood activity of the population
which is supported by three major and medium irrigation tanks and 15 minor irrigation
tanks (Statistical handbook, 2016)
Data Collection and Analysis
The study was based on a survey that covered eight villages in Porativu Pattu DS
division, Batticaloa district namely: Thumpankerni, Suravanaiyadiyootu, Kanthipuram,
Vammiyadiyootu, Kalumunthanveli, Thumpankerni Youth Scheme, Thikkodai, and
Proceedings of the 2nd International Symposium on Agriculture (ISA-2019)
Eastern University, Sri Lanka
12
Punnaikulam. The study population consists of farmers who engaged in Integrated
Farming activities in the selected villages. Based on the number of farmers engaged in
Integrated farming activities in all selected villages, a total of 150 farmers were
randomly selected to participate in the survey. Primary data for the study were obtained
from selected respondents, who responded to the structured questionnaire administered
to elicit information related to the study. Secondary data were collected from relevant
published sources. The collected data were descriptively analysed to accomplish the
objective of study. Scoring was done to rank the agricultural information sources.
Further, Chi-Square analysis was done to find out the association between informal
information sources and their frequency of usage.
Scoring procedure
A total of sixteen agricultural information sources (individual, group and mass
information sources) were presented to the respondents. The sources were measured on
a 3-point scale of frequently used = 2, occasionally used = 1, and never used = 0.
Respondents were asked to respond to their use of these agricultural information
sources in order to obtain score for each respondent. The total score for each
information source was calculated by providing points for each variable (viz never,
occasionally and frequently as 0, 1 and 2 respectively) and multiplying each point by
number of respondents obtained the particular point and then by adding up the total
points obtained by each source. The mean score was calculated by dividing up the total
score for each information source by total number of respondents. The calculated mean
score was used to rank the agricultural information sources. The analysed results and
findings are discussed in the subsequent section.
Results and Discussion
This section discusses the major findings derived from the study which are related to
types of information sources and their utilization. Information sources, which can be
individual, group or mass, play a crucial role in disseminating farm related information
and adoption of new practices.
Agricultural information sources and their frequency of usage
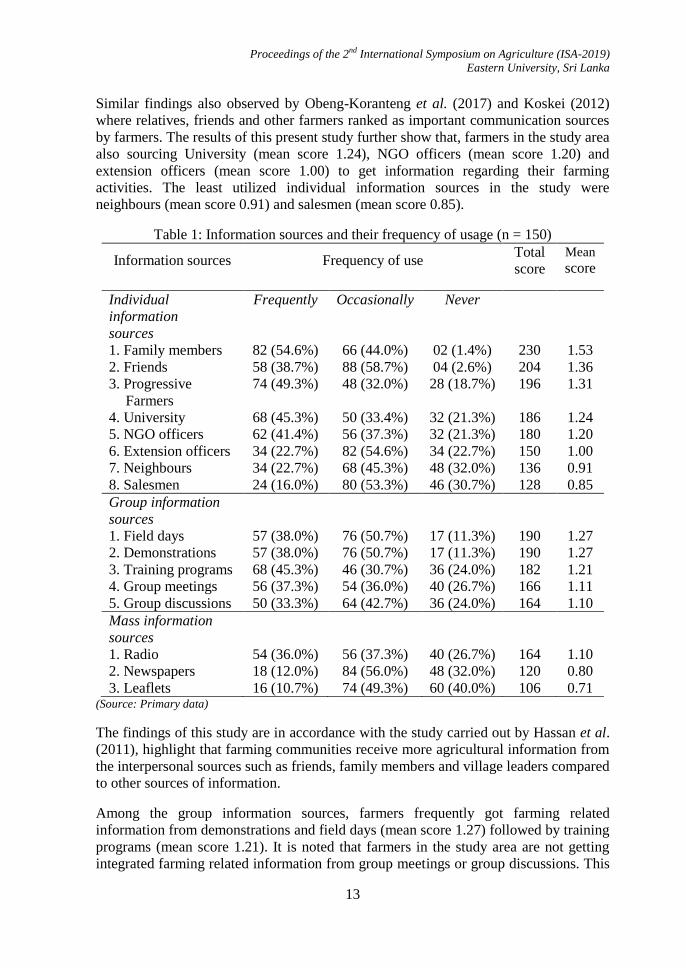
Results in Table 1 demonstrate the utilization of agricultural information sources by the
farmers engaged in integrated farming activities in Porativu Pattu DS division,
Batticaloa district.
It can be noted from Table 1, that farmers practising integrated farming frequently got
information related to their farming activities from family members (mean score 1.53),
followed by friends (mean score 1.36) and progressive farmers (mean score 1.31)
among the individual information sources. It could be inferred from this finding that
informal communication sources play a vital role in disseminating information among
the farmers.These results may be attributed to credibility, easy access and ready
availability of these information sources to farmers.
Proceedings of the 2nd International Symposium on Agriculture (ISA-2019)
Eastern University, Sri Lanka
13
Similar findings also observed by Obeng-Koranteng et al. (2017) and Koskei (2012)
where relatives, friends and other farmers ranked as important communication sources
by farmers. The results of this present study further show that, farmers in the study area
also sourcing University (mean score 1.24), NGO officers (mean score 1.20) and
extension officers (mean score 1.00) to get information regarding their farming
activities. The least utilized individual information sources in the study were
neighbours (mean score 0.91) and salesmen (mean score 0.85).
Table 1: Information sources and their frequency of usage (n = 150)
Information sources Frequency of use Total
score
Mean score
Individual
information
sources
1. Family members
2. Friends
3. Progressive
Farmers
4. University
5. NGO officers
6. Extension officers
7. Neighbours
8. Salesmen
Frequently
82 (54.6%)
58 (38.7%)
74 (49.3%)
68 (45.3%)
62 (41.4%)
34 (22.7%)
34 (22.7%)
24 (16.0%)
Occasionally
66 (44.0%)
88 (58.7%)
48 (32.0%)
50 (33.4%)
56 (37.3%)
82 (54.6%)
68 (45.3%)
80 (53.3%)
Never
02 (1.4%)
04 (2.6%)
28 (18.7%)
32 (21.3%)
32 (21.3%)
34 (22.7%)
48 (32.0%)
46 (30.7%)
230
204
196
186
180
150
136
128
1.53
1.36
1.31
1.24
1.20
1.00
0.91
0.85
Group information
sources
1. Field days
2. Demonstrations
3. Training programs
4. Group meetings
5. Group discussions
57 (38.0%)
57 (38.0%)
68 (45.3%)
56 (37.3%)
50 (33.3%)
76 (50.7%)
76 (50.7%)
46 (30.7%)
54 (36.0%)
64 (42.7%)
17 (11.3%)
17 (11.3%)
36 (24.0%)
40 (26.7%)
36 (24.0%)
190
190
182
166
164
1.27
1.27
1.21
1.11
1.10
Mass information
sources
1. Radio
2. Newspapers
3. Leaflets
54 (36.0%)
18 (12.0%)
16 (10.7%)
56 (37.3%)
84 (56.0%)
74 (49.3%)
40 (26.7%)
48 (32.0%)
60 (40.0%)
164
120
106
1.10
0.80
0.71 (Source: Primary data)
The findings of this study are in accordance with the study carried out by Hassan et al.
(2011), highlight that farming communities receive more agricultural information from
the interpersonal sources such as friends, family members and village leaders compared
to other sources of information.
Among the group information sources, farmers frequently got farming related
information from demonstrations and field days (mean score 1.27) followed by training
programs (mean score 1.21). It is noted that farmers in the study area are not getting
integrated farming related information from group meetings or group discussions. This
Proceedings of the 2nd International Symposium on Agriculture (ISA-2019)
Eastern University, Sri Lanka
14
may be due to the reason that during group meetings and group discussion, general
agricultural information rather than information on specific farming enterprise (in this
case about integrated farming system) is discussed. Therefore, farmers are not in a
position to fulfil their information needs which based on specific farming practices.
Among the mass information sources, radio (mean score 1.10) ranked first as the most
utilized information source for integrated farming in the study area. The second most
utilized mass information source was newspapers (mean score 0.80), followed by
leaflets (mean score 0.71). Lack of awareness of these information sources could
probably be the reason for poor utilization of these mass information sources by the
farmers. Further, among these three mass information sources, farmers in the study are
getting more information from radio compared to printed information sources
(newspapers and leaflets). This may be because printed information sources are not
widely used by the farmers due to their low literacy level. Majority of farmers in the
study area are low in literacy and unable to read out the information from the printed
information sources. Moreover, radio as an effective mass communication source to
disseminate agricultural information is very well acknowledged in literature related to
developing countries. Muhammed (2005) outlines that smallholder farmers can be
rapidly informed about pest and disease attack, weather disasters through radio.
Okunade (2007) also emphasizes that radio has its own distinct place in dissemination
of information and can play significant role in informing farmers in urgency and
emergency circumstances. Recently, Obeng-Koranteng et al. (2017) highlight that
radio is a convenient medium of mass communication as this source brings flexibility
to farmers in receiving the information, who may listen while at farm, at home or
elsewhere.
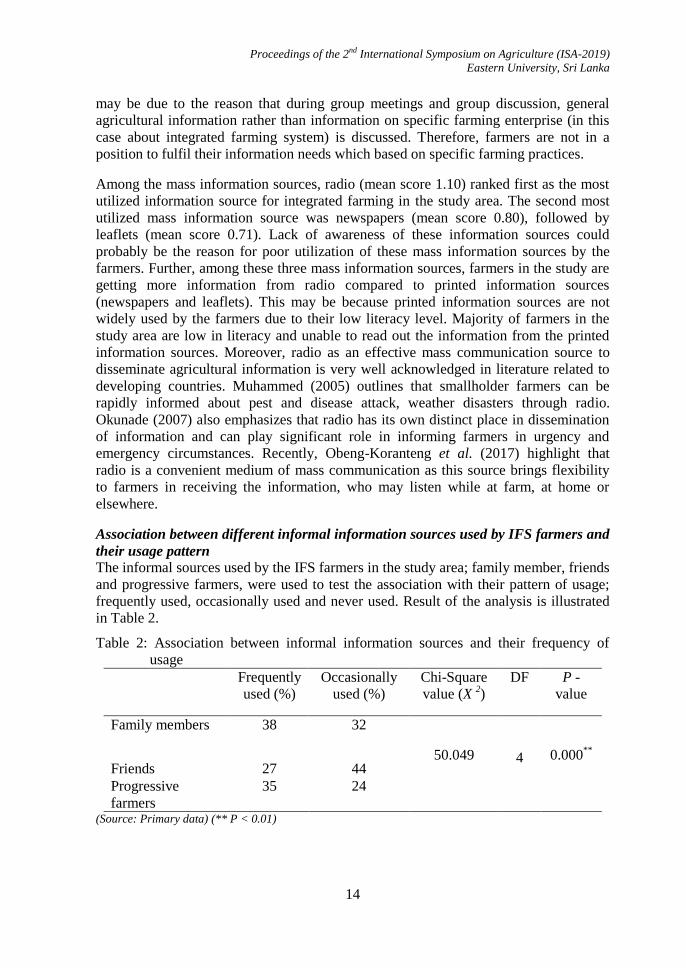
Association between different informal information sources used by IFS farmers and
their usage pattern
The informal sources used by the IFS farmers in the study area; family member, friends
and progressive farmers, were used to test the association with their pattern of usage;
frequently used, occasionally used and never used. Result of the analysis is illustrated
in Table 2.
Table 2: Association between informal information sources and their frequency of
usage
Frequently
used (%)
Occasionally
used (%)
Chi-Square
value (X 2)
DF P -
value
Family members 38 32
50.049
4
0.000**
Friends 27 44
Progressive
farmers
35 24
(Source: Primary data) (** P < 0.01)
Proceedings of the 2nd International Symposium on Agriculture (ISA-2019)
Eastern University, Sri Lanka
15
There was a significant association observed (X 2 = 53.049; P< 0.01) between informal
information sources and their pattern of usage. Among the frequent users of informal
information sources, 38% of the farmers discuss with family members to get
information regarding the integrated farming system followed by progressive farmers
(35%). Meanwhile, 27% of the farmers access friends to get information related to the
integrated farming system. Among the farmers who occasionally use informal sources
to obtain information regarding the integrated farming system, 44% access friends,
32% discuss with family members and rest of the farmers getting information from
progressive farmers in their area. It can be noted from the result that majority of the
frequent users of informal information sources go to family members and progressive
farmers for sourcing integrated farming related information. On the other hand,
majority of the occasional users are sourcing information from family members and
friends. As such, family members of IFS farmers considered as a major informal source
of agricultural information in the study area.
Conclusions
It is concluded from the study that IFS farmers mostly rely on informal information
sources such as family members, friends and progressive farmers to get farming
information rather than other individual information sources. Further, field days and
demonstrations are the mostly used group information sources by these farmers.
Among the mass information sources, radio play a vital role in disseminating integrated
farming related information to farmers in the study area. Frequency of usage of these
information sources among the IFS farmers should be improved by making these
sources easily available and accessible to them. Apart from the informal information
sources, other types of information sources need to be improved their competence in
disseminating necessary agricultural information to these farmers. The government and
other relevant authorities should invest on further improving these sources of
information. Besides, the farmers need to be informed and made aware regarding the
other available information sources.
References
Adikari, M.P. (2014). Usage of mass media by farmers in Sri Lanka. Developing
Country Studies, 4(4): 2-4.
Adio, E.O., Abu, Y., Yusuf, S.K. and Nansoh, S. (2016). Use of agricultural
information sources and services by farmers for improve productivity in Kwara
State. Library Philosophy and Practice, 1456: 1-6.
Agbamu, J.U. (2006). Essentials of Agricultural Communication in Nigeria. (1st edn.).
Lagos: Malthouse press Ltd.
Alemna, A.A. and Skouby, K.E. (2000). An investigation into the information needs
and information-seeking behaviour of members of Ghana‟s legislature. Library
Management, 21(5): 235–240.
Proceedings of the 2nd International Symposium on Agriculture (ISA-2019)
Eastern University, Sri Lanka
16
Amaechi, N.M. and Ossai-Onah, O.V. (2015). Utilization of agricultural information
among literate women in Ihiagwa Autonomous Community Owerri, Nigeria.
Journal of Information and Knowledge Management, 6(1): 41-50.
Badiru, I.O., Akande, M.E., and Ladigbolu, T.A. (2016). Utilization of agricultural
information on Ere Agbe radio broadcasts among farmer-listeners in Oke-Ogun
area of Oyo State, Nigeria. Journal of Agricultural and Food Information, 17(2-3):
142-150. DOI: 10.1080/10496505.2016.1170606
Bhuiya, M.S.U., Karim, M.M. and Hossain, S.M.A. (2014). Study on integrated
farming systems model development. Journal of Bangladesh Agricultural
University, 12(2): 325–336
Bisto, C.M.L. (2012). An analysis of the information behaviour of Geography Teachers
in developing African country –Lesotho. Review of International Geography
Education Online, 2: 192-218.
Brunnermeier, M.K. (2005). Information leakage and market efficiency. The Review of
Financial Studies, 18(2): 417-457.
Dashora, L.N. and Hari Singh. (2014) Integrated Farming System - Need of Today.
International Journal of Applied Life Sciences and Engineering, 1(1): 28-37.
Hassan, S. Yassin, Shaffril, H.A.M., Othman, Samah, B.A., Samali and Ramili, S.R.
(2011). Receiving the agricultural information through mass media and
interpersonal sources among the rural community. American Journal of
Agricultural and Biological Sciences, 6(3): 451-461.
Hassen, M.S., Shaffril, H.A.M., Samah, B.A., Ali, M.S., Ramali, S.R. and Azarian,
Z.S. (2012). The credibility of television in disseminating agricultural information
to Farmers in Malaysia. Asian Social Sciences, 8(12): 133-139.
Koskei, R.C. (2012). Access and use of information by smallholder tea farmers in
Bureti district, Kenya. MSc. Thesis submitted to Egerton University, Njoro, Kenya
Koyenikan, M.J. (2011). Extension workers‟ access to climate information and sources
in Edo State, Nigeria. Scholars Research Library Archives of Applied Science
Research, 3(4): 11-20.
Lokanathan, S. and Kapugama, N. (2012). Smallholders and micro-enterprises in
agriculture: Information needs and communication pattern. LIRNEasia, Colombo,
Sri Lanka.
Mahindarathne, M.G.P.P. and Min, Q. (2018). Information needs and seeking patterns
of farmers within changing information environment: A case of Sri Lankan
vegetable farmers. Information and Knowledge Management, 8(4): 37-49.
Mchombu, K.J. and Cadbury, N. (2006). Libraries, literacy and poverty reduction: A
key to African development. [Online] Available: https://core.ac.uk/download/
files/418/11882369.pdf. (Accessed on 19thSeptember, 2018)
Proceedings of the 2nd International Symposium on Agriculture (ISA-2019)
Eastern University, Sri Lanka
17
Mgbada, J.U. (2006). Effectiveness of information sources on improved farming
practices to women farmers in Enugu State, Nigeria. Global Approaches to
Extension Practice, 2(1): 67-78.
Muhammad, S. (2005) Agricultural Extension: Strategies and skills- (2nd ed.).
Faisalabad, Pakistan: Unitech Communications.
Obeng-Koranteng, G., Kavi, R. K., Bugyei, K. A. and Anafo, P. (2017). Information
sources used by Tiger Nut (Cyperus esculentus) farmers for improved sustainable
agriculture development in Aduamoa, Ghana. Journal of Sustainable Development
in Africa, 19(3): 84-102.
Okunade, E. O. (2007). Effectiveness of extension teaching methods in acquiring
knowledge, skill and attitude by women farmers in Osun State. Journal of Applied
Science Research, 3(4): 282–286.
Olaniyi, O. A., Adebayo O. O. and Akintola, S. (2011). Rural youth‟s perception and
utilization of agricultural information in Oyo State. Nigerian of Agriculture &
Social Sciences, 7(4): 117-123.
Ronald, B., Silayo, G. F. and Abdalah, K. J. (2015). Preference sources of information
used by seaweeds farmers in Unguja, Zanzibar. International Journal of Academic
Library and Information Science, 3(4): 106-116.
Selvarajah, V. and Geretharan, T. (2013). Information utilization pattern of coconut
farmers in Batticaloa district. Paper presented at the International Symposium on
Agriculture and Environment, University of Ruhuna, Sri Lanka.
Soni, R. P., Katoch, M. and Ladohia, R. (2014). Integrated Farming Systems - A
Review. IOSR Journal of Agriculture and Veterinary Science, 7(10): 36-42.
Statistical handbook (2016). Divisional Planning Unit, Porathivu Pattu D.S Division,
Batticaloa
Uwandu, C. N., Thomas, K. A. and Okoro, C. M. (2018). Utilization of agricultural
information sources and adoption of animal and crop technologies among farming
households in Imo State, Nigeria. Journal of Agricultural Extension, 22(1): 143-
155. DOI:10.4314/jae.v22i1.13

Proceedings of the 2nd International Symposium on Agriculture (ISA-2019)
Eastern University, Sri Lanka
18
DETERMINANTS OF OFFICERS IN CHARGE TURNOVER INTENTION: A
CASE OF KURUNEGALA PLANTATIONS LIMITED
M.M.B.S. Silva1*
, S.M.M. Samarakoon2 and R.A.P.I.S. Dharmadasa
1
1Export Agriculture Department, Uva Wellassa University of Sri Lanka 2Kurunegala Plantations Limited, Sri Lanka.
*Corresponding author:[email protected]
Abstract
The employee turnover has become one of the major problems causing a challenge to
very sustenance of agriculture sector in Sri Lanka. Therefore, it is utmost important to
find what causes employees to leave the sector to make relevant policy decisions.
Hence, this study attempts to explore the determinants of turnover intention of Officers
in charge in one of the government owned plantation companies in Sri Lanka. The data
for the study were collected from all the 72 Officers in charge in the company through
questionnaires. The data were analyzed using descriptive techniques and Logistic
Regression. The results reveal that monetary rewards, additional benefits to employees,
satisfaction with human resource management practices and job satisfaction reduce
turnover intention. Our results also suggest that young married Officers in charge with
prior job experience whose residences located farther from the company and having
other income sources tend to leave the job. The study recommended that strategies such
as creating conducive job environment, improving housing and infrastructure facilities
within work place, supply necessary tools for field work, providing with adequate
space and appropriate equipment to perform duties, giving support for employee
personal life balance, offering employees with rewards, providing proper job
descriptions and developing a succession plan to get promotions should be
implemented to better manage human resources and reduce employee turnover.
Keywords: Job satisfaction, logistic regression, turnover intention
Introduction
The employee turnover is the rate at which people leave an organization. Turnover is
costly, disruptive and impacts the morale of remaining employees (Armstrong, 2012).
High turnover rate among employees signals a major weakness towards organization‟s
achievement. Turnover intention is employee‟s behavioral intention to resign
permanently from current organization (Husain et al., 2015). The Sri Lankan
plantation sector is a main source of agricultural income. Labor resource is the most
important input entering the production process in plantation sector. But with the
industrialization, Agriculture sector suffers from high employee turnover rate (Ninan,
1984).
The Kurunegala Plantations Limited is a government owned Plantation Management
Company operates in Kurunegala, Gampaha and Anuradhapura districts in Sri Lanka.
Proceedings of the 2nd International Symposium on Agriculture (ISA-2019)
Eastern University, Sri Lanka
19
The main role of the company is to manage the plantations productively and profitably
(Kurunegala Plantations Limited, 2014). The Kurunegala Plantations Limited has been
suffering from higher Officers in Charge turnover. It is a considerable barrier to the
succession of Kurunegala Plantations Limited (Kurunegala Plantations Limited, 2014).
Skilled and trained employees are economically more important to the plantation
sector.However, at present employee turnover has become a burning issue in Sri
Lankan plantation sector. This situation is a problem for survival of the organization.
There are number of projects conducted to develop welfare conditions and increase
wage rates of employees in the Kurunegala Plantations Limited. However, still
employee turnover exists in plantation sector. Therefore, it is significant todo research
on this area. It is a timely needed study to make relevant policy decisions. Therefore,
this study was carried out with the following main and specific objectives.
Main objective
To determine the factors affecting employee turnover intention
Specific objectives
To determine the employee related factors affecting turnover intention
To determine the organization related factors affecting turnover intention
To suggest strategic solutions to retain employees within the current
organization
Materials and Methods
Data collection
The Kurunegala Plantations Limited which suffers from Officers in Charge turnover
was selected for the study. All 72 Officers in Charge who currently work within the
Kurunegala Plantations Limited were used as the respondents for the study.Semi
structured questionnaire was used to gather data. The questionnaire consisted with
employee related factors, organization related factors and general questions about
turnover intention. The study was conducted in two phases. The first phase was
conducted as a preliminary survey with a sample of 15 Officers in Charge from which
the questionnaire was validated. The pre-tested structured questionnaire contained nine
employee related parameters and seven organization related factors. For organization
related factors, responses were obtained using five-point Likert Scale with two ends of
strongly satisfied and strongly dissatisfied. The second phase was carried out by
administering the structured questionnaire among Officers in Charge.
Data analysis
Data were analyzed using both descriptive and inferential statistics. Cronbach‟s alpha
test was used to measure reliability of facet of Likert scale variables. Logistic
regression was used to identify the significant employee related factors [i.e. (1) Age (2)
Marital status (3) Number of family members (4) Education level (5) Prior experience
(6) Job tenure (7) Distance to work place from home (8) Salary and (9) Other Income
Proceedings of the 2nd International Symposium on Agriculture (ISA-2019)
Eastern University, Sri Lanka
20
availability] that affect turnover intention and to identify the significant organization
related factors [i.e. (1) Nature of work (2) Monetary rewards and incentives (3) Co-
worker relationship (4) Working environment (5) Additional benefits (6) Human
resource management and (7) Job satisfaction] that affect turnover intention. Two
logistic regression models for employee related factors and organizational related
factors were estimated to find the determinants of turnover intention respectively.
Results and Discussion
Demographic information of the employees
In Kurunegala Plantations Limited all Officers in Charge are males. Where the age is
considered, 51% of Officers in charge are within 20-29 years old age category. Most
of the Officers in Charge are young. There, most of the aging employees have
intention to turnover. Almost half (54%) of the Officers in Charge are married and
46% are unmarried. Majority of the Officers in Charge (34.3%) are educated up to
advanced level and completed various certificate courses. Only 3% of the Officers in
Charge are educated until Ordinary Level and 4% of the Officers in Charge have
educated up to degree level. Half (50%) of the Officers in Charge do not have prior
workexperience. More than half (69%) of the Officers in Charge have work
experience at the Kurunegala Plantations Limited from 1 to 5 years.
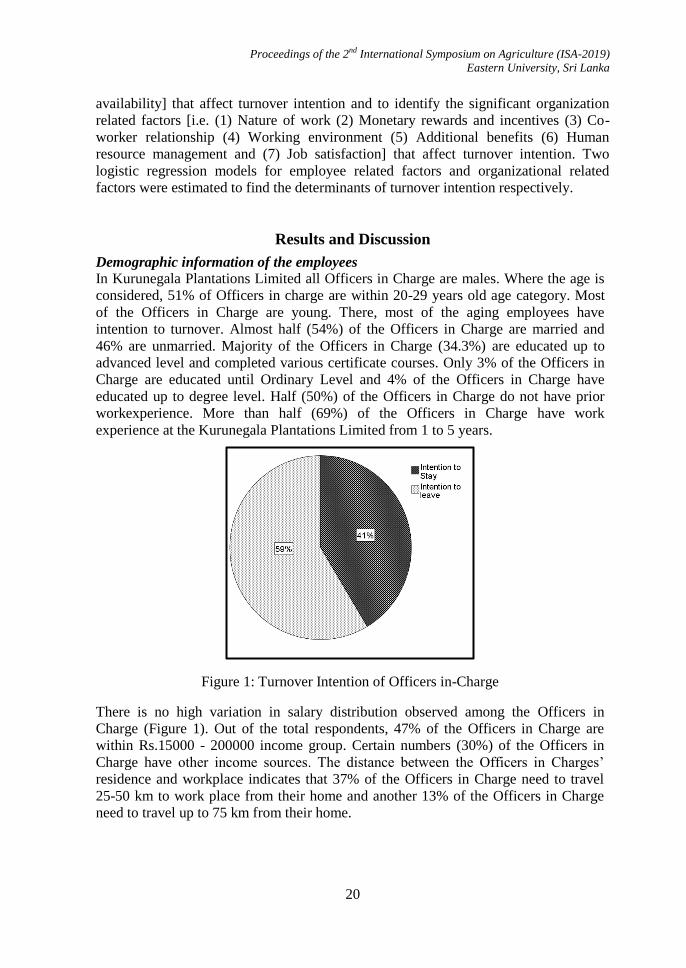
Figure 1: Turnover Intention of Officers in-Charge
There is no high variation in salary distribution observed among the Officers in
Charge (Figure 1). Out of the total respondents, 47% of the Officers in Charge are
within Rs.15000 - 200000 income group. Certain numbers (30%) of the Officers in
Charge have other income sources. The distance between the Officers in Charges‟
residence and workplace indicates that 37% of the Officers in Charge need to travel
25-50 km to work place from their home and another 13% of the Officers in Charge
need to travel up to 75 km from their home.
Proceedings of the 2nd International Symposium on Agriculture (ISA-2019)
Eastern University, Sri Lanka
21
Forty one percent of the Officers in Charge state that they have intention to stay with
the Kurunegala Plantations Limited. The majority of respondents (59%) state that they
have intention to leave from the Kurunegala Plantations Limited (Figure 1.).
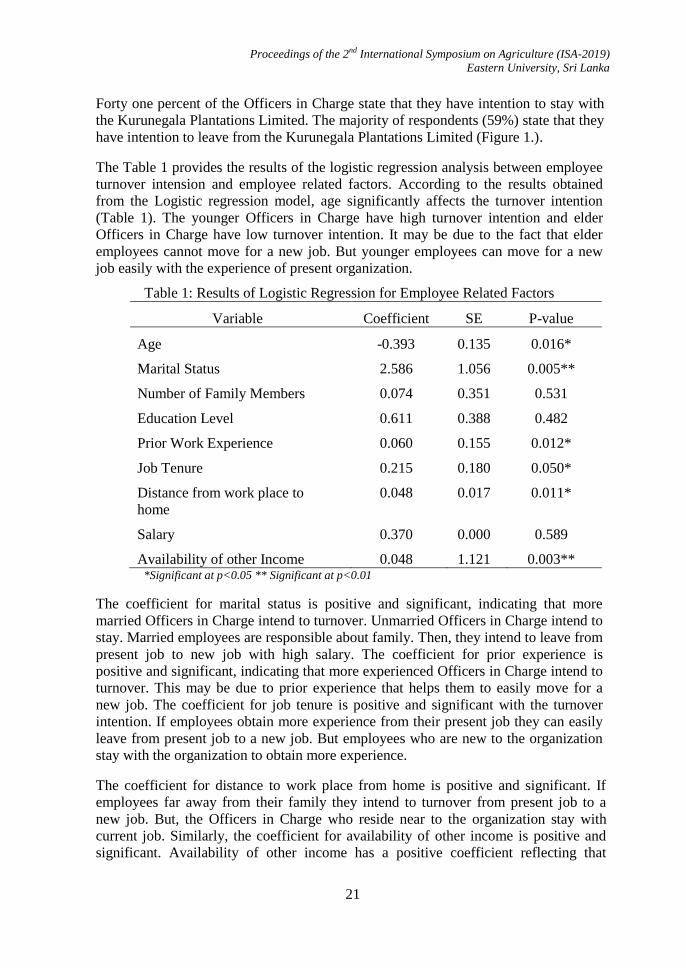
The Table 1 provides the results of the logistic regression analysis between employee
turnover intension and employee related factors. According to the results obtained
from the Logistic regression model, age significantly affects the turnover intention
(Table 1). The younger Officers in Charge have high turnover intention and elder
Officers in Charge have low turnover intention. It may be due to the fact that elder
employees cannot move for a new job. But younger employees can move for a new
job easily with the experience of present organization.
Table 1: Results of Logistic Regression for Employee Related Factors
Variable Coefficient SE P-value
Age -0.393 0.135 0.016*
Marital Status 2.586 1.056 0.005**
Number of Family Members 0.074 0.351 0.531
Education Level 0.611 0.388 0.482
Prior Work Experience 0.060 0.155 0.012*
Job Tenure 0.215 0.180 0.050*
Distance from work place to
home
0.048 0.017 0.011*
Salary 0.370 0.000 0.589
Availability of other Income 0.048 1.121 0.003** *Significant at p<0.05 ** Significant at p<0.01
The coefficient for marital status is positive and significant, indicating that more
married Officers in Charge intend to turnover. Unmarried Officers in Charge intend to
stay. Married employees are responsible about family. Then, they intend to leave from
present job to new job with high salary. The coefficient for prior experience is
positive and significant, indicating that more experienced Officers in Charge intend to
turnover. This may be due to prior experience that helps them to easily move for a
new job. The coefficient for job tenure is positive and significant with the turnover
intention. If employees obtain more experience from their present job they can easily
leave from present job to a new job. But employees who are new to the organization
stay with the organization to obtain more experience.
The coefficient for distance to work place from home is positive and significant. If
employees far away from their family they intend to turnover from present job to a
new job. But, the Officers in Charge who reside near to the organization stay with
current job. Similarly, the coefficient for availability of other income is positive and
significant. Availability of other income has a positive coefficient reflecting that

Proceedings of the 2nd International Symposium on Agriculture (ISA-2019)
Eastern University, Sri Lanka
22
availability of other income increases the turnover intention. If employees have other
income sources than monthly salary they intend leave from their present job without
future concern.
Results of Logistic regression for organization related factors
The Table 2 provides the results of logistic regression analysis between employee
turnover intension and organizational related factors. The results revealed that the
turnover intention of employees significantly determined by the monetary rewards,
additional benefits, human resource management and job satisfaction.The results
further show that there is no significant relationship between turnover intention and the
nature of work, co-worker relationship and work environment. The coefficients of the
variables, monetary value, additional benefits, human resource management and job
satisfaction are negative and prove that there is a negative relationship between
turnover intention and the said variables.
Table 2: Results of Logistic Regression for Organization Related Factors
Variable Coefficient SE P-value
Nature of Work -1.182 0.808 0.143
Monetary Rewards -1.548 0.554 0.005**
Co-worker Relationship -0.279 0.522 0.593
Work Environment 0.155 0.585 0.790
Additional Benefits -2.057 0.773 0.008**
Human Resource
Management -1.357 0.656 0.039*
Job Satisfaction -1.347 0.658 0.041*
*Significant at p<0.05 ** Significant at p<0.01
According to the results obtained through the analysis, satisfaction of monetary
rewards has a negative coefficient reflecting that availability of monetary rewards
decreases the turnover intention. If employees feel there are efficient monetary
rewards for their work they are willing to stay with organization. Employees who feel
there are no such monetary rewards for their work used to have intension to leave from
the organization. Further, negative coefficient of additional benefits is reflecting that
availability of additional benefits decreases the turnover intention. If employees feel
there are additional benefits they are willing to stay with organization. Employees
intend to leave organization if they feel they are not provided with additional benefits.
Employee satisfaction about human resource management has a negative coefficient
reflecting that satisfaction about human resource management in the organization
decreases turnover intention. If employees are satisfied with human resource
management within the organization they are willing to stay with the organization.
Employees who are not satisfied with human resource management they intend to
leave the organization. Job satisfaction has a negative coefficient reflecting that high
job satisfaction decreases the turnover intention. If employees‟ job satisfaction
Proceedings of the 2nd International Symposium on Agriculture (ISA-2019)
Eastern University, Sri Lanka
23
increases, they are willing to stay with the organization. Employees who are not
satisfied with their job intend to leave the organization.
Conclusions
The overall objective of the study was to determine the factors affecting turnover
intention of the Officers in Charge, specific reference to the Kurunegala Plantations
Limited.The results of the study revealed that, the turnover intention is significantly
affected by employee related factors such as; age of the Officers in charge, marital
status, prior experience, job tenure, distance to work place from home and availability
of other income. Similarly, turnover intention is significantly affected by organization
related factors such as; monetary rewards, additional benefits, human resource
management and job satisfaction. Moreover, factors like number of family members,
education level and salary have no direct effect on turnover intention. Likewise,
organization related factors, such as nature of work, co-worker relationships and work
environment have no direct effect on turnover intention of the employees. If plantation
sector can provide a better nature of work, work environment and facilitate harmonious
coworker relationships among employees, job satisfaction can be effectively improved.
Acknowledgement
Sincerely thank, Managers and Officers in charge of Kurunegala Plantations Limited
for organizing all relevant arrangements and catering needs with regards to conducting
the research study.
References
Armstrong, M. (2012). Armstrong‟s handbook of human resource management
practice. 12th edn. London: Kogan Page
Husain, S.W., Siddique, A., Ali, A.A., Ali, M.R., Akbar, M. (2015). Causes of
Employee Turnover intention: A study on Banking Industry of Pakistan.
International Interdisciplinary Journal of Scholarly Research, 1(2):6-19
Kurunegala Plantations Limited, (2014). Annual Report, Kurunegala Plantations
Limited, Sri Lanka
Ninan, K.N., (1984) Labour Use in Agriculture Case Studies of Topioca and Paddy.
Economic and Political Weekly,19, A199-A204.

Proceedings of the 2nd International Symposium on Agriculture (ISA-2019)
Eastern University, Sri Lanka
24
EXPLORING THE EFFECT OF GOOD AGRICULTURAL PRACTICES
(GAP) WITH SPECIAL REFERENCE TO SELECTED VEGETABLES
AND FRUITS FARMING: A CASE STUDY IN SELECTED DS IN
ANURADHAPURA DISTRICT
S.P Wijethunge* and T. Kirupananthan
Department of Agriculture Economics, Faculty of Agriculture, Eastern University, Sri Lanka
*Corresponding author: [email protected]
Abstract
Department of Agriculture was introduced the Good Agricultural Practices (GAP) in
2015, and operating on Provincial Agriculturaldepartments, Agricultural Department
under Central Government, and Mahawali Project. Over 550 farmers are engaged in
GAP in Sri Lanka. In Anuradhapura, 112 farmers applied for this program but only 25
famers received the GAP Certification. For this research, those 25 farmers have been
interviewed by the interviewer. The major objective of this study was, to evaluate the
economy of the farmers under GAP program and understand how the GAP affect the
total yield and total income of farmers. According to the study, it was found that Snake
gourd, Bitter gourd, Papaw, Capsicum, Guava and Mango were major crops which
cultivated under GAP. Average cost of production of cultivation per acre for selected
crops was comparatively lesser than its profit per acre except Guava. Because the yield
of Guava was damaged by monkeys. This study revealed that farming under the GAP
was profitable because GAP program guided farmers to least application of
agrochemicals to the cultivation with appropriate amount at right time. Regular
monitoring of farm is essentialto avoid the pest and diseases. Unawareness of existing
price for the products produced through GAP was the major limitation, that faced by
the farmers. Extension services and farmer‟s awareness of GAP should be enhanced
among the farming population and sales outlets should be opened for the GAP
products.
Keywords: Cost, Good Agricultural Practices (GAP), Soil sterilization
Introduction
Most of the time, farmers used to apply high dosage of agro chemicals in their
cultivation and these agro chemicals contain heavy metals. Those accumulated in
human through food chain and cause many health problems such as chronic kidney
disease, cancers etc. Such types of agricultural commodities (vegetables and fruits)
exported from Sri Lanka for foreign exchange are sometimes rejected by the foreign
countries including Europe. As a solution to these, Department of Agriculture initiated
the Good Agricultural Practices (GAP) in 2015, and operating through Provincial
Agricultural Departments.

Proceedings of the 2nd International Symposium on Agriculture (ISA-2019)
Eastern University, Sri Lanka
25
Over 550 farmers are currently engaged to use Sri Lankan GAP, which will be a
natural graduation to receive global certification. Nowadays, most of farmers focus on
farming of vegetables and fruits through Good Agricultural Practices (GAP) (EDB,
2013). This research dealt with the economic analysis on small scale farming of
selected vegetables and fruits which follow GAP in selected Divisional Secretariats in
Anuradhapura district, Sri Lanka. The objective of this study was to find out the status
of GAP program of selected vegetable and fruits production in the Anuradhapura
district.
Materials and Methods
This study consists of descriptive research design along with the quantitative and
qualitative data (interviewed responses) that shows economic status of GAP farming of
fruits and vegetables in selected divisional secretariats of Anuradhapura district.
Descriptive statistic is used to describe the basic features of data which studied.
Purposive sampling method was used to select the sample population to collect the
data. The sample that is selected based on features of population and objective of
study.
Study Area
This study was carried out in Anuradhapura District. There are 22 Divisional
Secretariats with total population of 856232. Target population for this study was small
scale GAP farmers in major selected Divisional Secretariats (which famous for GAP
agricultural activities) in Anuradhapura District such as, Madawachchiya, Rambawa,
Manupa, Thambuththegama, Thalawa, MahaVilachchiya, Kakirawa, Palagala,
Galnewa, Nochchiyagama and Galenbindunuwewa (Figure 1).
Figure 1: Study Area, Anuradhapura district
Selection of samples
The sample was selected among people who are engaged in small scale farming of
Good Agricultural Practices program which is conducted under Provincial Department
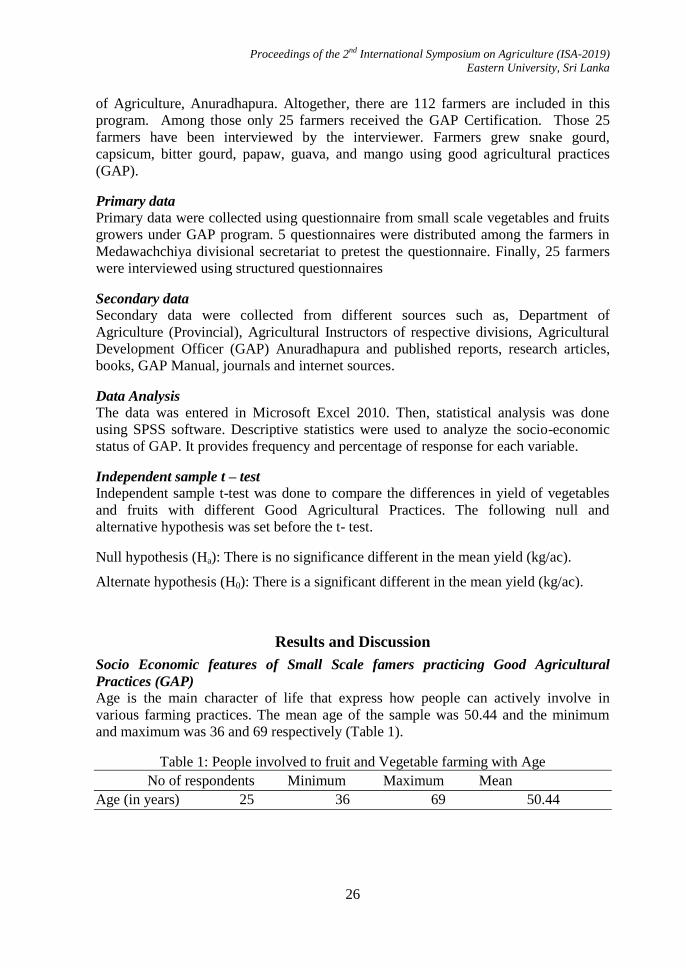
Proceedings of the 2nd International Symposium on Agriculture (ISA-2019)
Eastern University, Sri Lanka
26
of Agriculture, Anuradhapura. Altogether, there are 112 farmers are included in this
program. Among those only 25 farmers received the GAP Certification. Those 25
farmers have been interviewed by the interviewer. Farmers grew snake gourd,
capsicum, bitter gourd, papaw, guava, and mango using good agricultural practices
(GAP).
Primary data
Primary data were collected using questionnaire from small scale vegetables and fruits
growers under GAP program. 5 questionnaires were distributed among the farmers in
Medawachchiya divisional secretariat to pretest the questionnaire. Finally, 25 farmers
were interviewed using structured questionnaires
Secondary data Secondary data were collected from different sources such as, Department of
Agriculture (Provincial), Agricultural Instructors of respective divisions, Agricultural
Development Officer (GAP) Anuradhapura and published reports, research articles,
books, GAP Manual, journals and internet sources.
Data Analysis
The data was entered in Microsoft Excel 2010. Then, statistical analysis was done
using SPSS software. Descriptive statistics were used to analyze the socio-economic
status of GAP. It provides frequency and percentage of response for each variable.
Independent sample t – test
Independent sample t-test was done to compare the differences in yield of vegetables
and fruits with different Good Agricultural Practices. The following null and
alternative hypothesis was set before the t- test.
Null hypothesis (Ha): There is no significance different in the mean yield (kg/ac).
Alternate hypothesis (H0): There is a significant different in the mean yield (kg/ac).
Results and Discussion
Socio Economic features of Small Scale famers practicing Good Agricultural
Practices (GAP)
Age is the main character of life that express how people can actively involve in
various farming practices. The mean age of the sample was 50.44 and the minimum
and maximum was 36 and 69 respectively (Table 1).
Table 1: People involved to fruit and Vegetable farming with Age
No of respondents Minimum Maximum Mean
Age (in years) 25 36 69 50.44
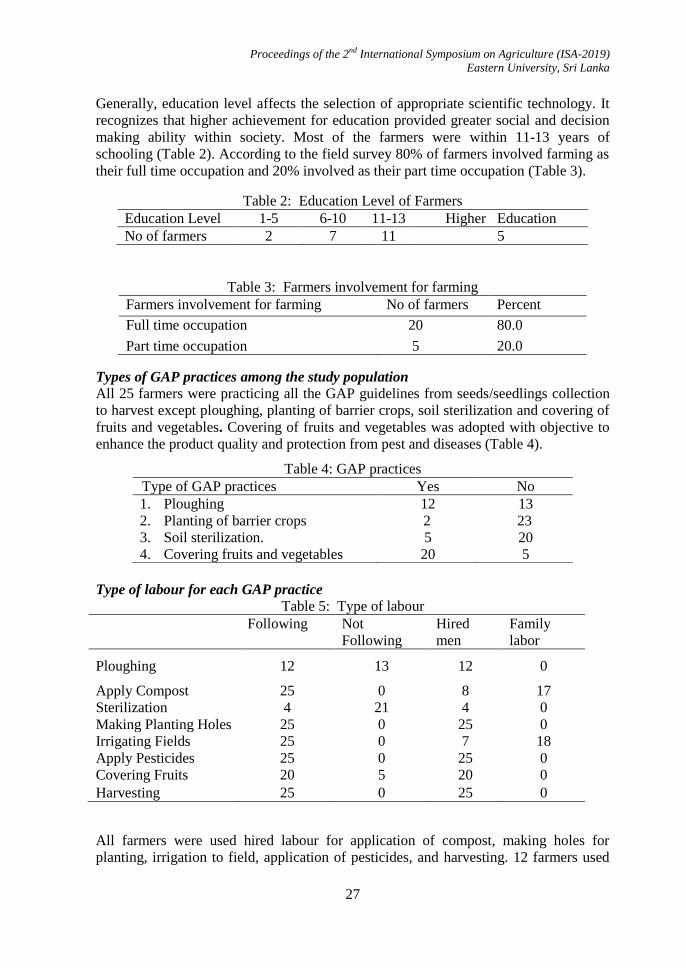
Proceedings of the 2nd International Symposium on Agriculture (ISA-2019)
Eastern University, Sri Lanka
27
Generally, education level affects the selection of appropriate scientific technology. It
recognizes that higher achievement for education provided greater social and decision
making ability within society. Most of the farmers were within 11-13 years of
schooling (Table 2). According to the field survey 80% of farmers involved farming as
their full time occupation and 20% involved as their part time occupation (Table 3).
Table 2: Education Level of Farmers
Education Level 1-5 6-10 11-13 Higher Education
No of farmers 2 7 11 5
Table 3: Farmers involvement for farming
Farmers involvement for farming No of farmers Percent
Full time occupation 20 80.0
Part time occupation 5 20.0
Types of GAP practices among the study population
All 25 farmers were practicing all the GAP guidelines from seeds/seedlings collection
to harvest except ploughing, planting of barrier crops, soil sterilization and covering of
fruits and vegetables. Covering of fruits and vegetables was adopted with objective to
enhance the product quality and protection from pest and diseases (Table 4).
Table 4: GAP practices
Type of labour for each GAP practice
Table 5: Type of labour
Following Not
Following
Hired
men
Family
labor
Ploughing 12 13 12 0
Apply Compost 25 0 8 17
Sterilization 4 21 4 0
Making Planting Holes 25 0 25 0
Irrigating Fields 25 0 7 18
Apply Pesticides 25 0 25 0
Covering Fruits 20 5 20 0
Harvesting 25 0 25 0
All farmers were used hired labour for application of compost, making holes for
planting, irrigation to field, application of pesticides, and harvesting. 12 farmers used
Type of GAP practices Yes No
1. Ploughing 12 13
2. Planting of barrier crops
3. Soil sterilization.
4. Covering fruits and vegetables
2
5
20
23
20
5
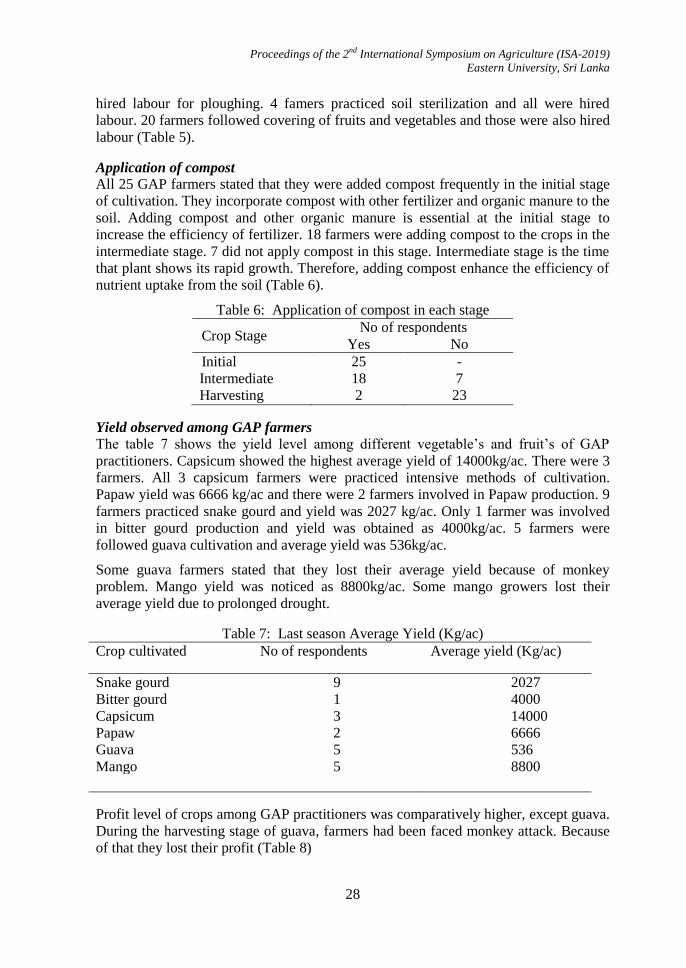
Proceedings of the 2nd International Symposium on Agriculture (ISA-2019)
Eastern University, Sri Lanka
28
hired labour for ploughing. 4 famers practiced soil sterilization and all were hired
labour. 20 farmers followed covering of fruits and vegetables and those were also hired
labour (Table 5).
Application of compost
All 25 GAP farmers stated that they were added compost frequently in the initial stage
of cultivation. They incorporate compost with other fertilizer and organic manure to the
soil. Adding compost and other organic manure is essential at the initial stage to
increase the efficiency of fertilizer. 18 farmers were adding compost to the crops in the
intermediate stage. 7 did not apply compost in this stage. Intermediate stage is the time
that plant shows its rapid growth. Therefore, adding compost enhance the efficiency of
nutrient uptake from the soil (Table 6).
Table 6: Application of compost in each stage
Crop Stage No of respondents
Yes No
Initial
Intermediate
Harvesting
25
18
2
-
7
23
Yield observed among GAP farmers
The table 7 shows the yield level among different vegetable‟s and fruit‟s of GAP
practitioners. Capsicum showed the highest average yield of 14000kg/ac. There were 3
farmers. All 3 capsicum farmers were practiced intensive methods of cultivation.
Papaw yield was 6666 kg/ac and there were 2 farmers involved in Papaw production. 9
farmers practiced snake gourd and yield was 2027 kg/ac. Only 1 farmer was involved
in bitter gourd production and yield was obtained as 4000kg/ac. 5 farmers were
followed guava cultivation and average yield was 536kg/ac.
Some guava farmers stated that they lost their average yield because of monkey
problem. Mango yield was noticed as 8800kg/ac. Some mango growers lost their
average yield due to prolonged drought.
Table 7: Last season Average Yield (Kg/ac)
Crop cultivated No of respondents Average yield (Kg/ac)
Snake gourd 9 2027
Bitter gourd 1 4000
Capsicum 3 14000
Papaw 2 6666
Guava 5 536
Mango 5 8800
Profit level of crops among GAP practitioners was comparatively higher, except guava.
During the harvesting stage of guava, farmers had been faced monkey attack. Because
of that they lost their profit (Table 8)

Proceedings of the 2nd International Symposium on Agriculture (ISA-2019)
Eastern University, Sri Lanka
29
Table 8: Profit from each crop (Rs/ac)
Crop cultivated Average Income
(Rs/ac)
Average
Production Cost
(Rs/ac)
Profit (Rs/ac)
Snake gourd 219692 38056 18163
Bitter gourd 880000 29330 850670
Capsicum 2240000 852800 1387200
Papaw 933333 141933 791399
Guava 34600 124466 89866
Mango 97321 66412 30908
According to the results of independent sample T-test: Effect of different Good Agricultural
practices and Total crop mean yield at 5% significance level.
Difference in yield by GAP in t- test
Among the different GAP adopted, soil sterilization caused difference in yield among
the adopters and non-adopters. The mean yield of 7460 kg/ac was observed among soil
sterilization practitioners. The non-adopters received the mean yield 2287.50 kg/ac
which is significantly (p<0.05) lower than the yield of adopters (Table 9).
Table 9: Independent sample t-test
Soil Sterilization Mean t-test for Equality
of Means Sig. (2– tailed)
Yield (kg/ac) Yes (05) 7460.00 .034**
No (20) 2287.50
** significance at 5% significant level.
Ploughing and Planting crops with pest deterring value or barrier crops were not
affected the total mean yield of fruits and vegetables at 5% significance level.
Soil Sterilization was affected the total mean yield of fruits and vegetables 5%
significance level.
Conclusions
This study has revealed the state of small scale faming of fruits and vegetables through
Good Agricultural Practices (GAP), Anuradhapura district. GAP has contributed to
enhance the living standards of farmers as well as consumer‟s health. Growing of
fruits and vegetables through Good Agricultural Practices may reduce the risk of health
problems. According to the study it was found that GAP farming is profitable. Soil
sterilization as a GAP effects on increasing the total mean yield. Extension services and
farmer‟s awareness on GAP should be enhanced among the farming population and
sales outlets should be established for the GAP products.
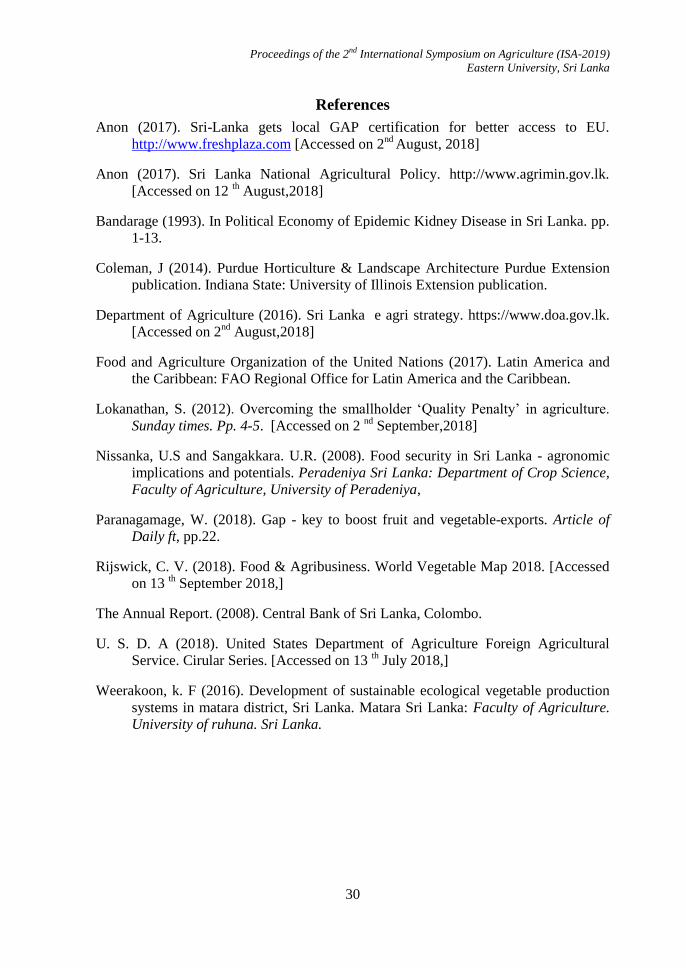
Proceedings of the 2nd International Symposium on Agriculture (ISA-2019)
Eastern University, Sri Lanka
30
References
Anon (2017). Sri-Lanka gets local GAP certification for better access to EU.
http://www.freshplaza.com [Accessed on 2nd
August, 2018]
Anon (2017). Sri Lanka National Agricultural Policy. http://www.agrimin.gov.lk.
[Accessed on 12 th August,2018]
Bandarage (1993). In Political Economy of Epidemic Kidney Disease in Sri Lanka. pp.
1-13.
Coleman, J (2014). Purdue Horticulture & Landscape Architecture Purdue Extension
publication. Indiana State: University of Illinois Extension publication.
Department of Agriculture (2016). Sri Lanka e agri strategy. https://www.doa.gov.lk.
[Accessed on 2nd
August,2018]
Food and Agriculture Organization of the United Nations (2017). Latin America and
the Caribbean: FAO Regional Office for Latin America and the Caribbean.
Lokanathan, S. (2012). Overcoming the smallholder „Quality Penalty‟ in agriculture.
Sunday times. Pp. 4-5. [Accessed on 2 nd
September,2018]
Nissanka, U.S and Sangakkara. U.R. (2008). Food security in Sri Lanka - agronomic
implications and potentials. Peradeniya Sri Lanka: Department of Crop Science,
Faculty of Agriculture, University of Peradeniya,
Paranagamage, W. (2018). Gap - key to boost fruit and vegetable-exports. Article of
Daily ft, pp.22.
Rijswick, C. V. (2018). Food & Agribusiness. World Vegetable Map 2018. [Accessed
on 13 th September 2018,]
The Annual Report. (2008). Central Bank of Sri Lanka, Colombo.
U. S. D. A (2018). United States Department of Agriculture Foreign Agricultural
Service. Cirular Series. [Accessed on 13 th July 2018,]
Weerakoon, k. F (2016). Development of sustainable ecological vegetable production
systems in matara district, Sri Lanka. Matara Sri Lanka: Faculty of Agriculture.
University of ruhuna. Sri Lanka.

Proceedings of the 2nd International Symposium on Agriculture (ISA-2019)
Eastern University, Sri Lanka
31
SUSTAINABLE ECOTOURISM DEVELOPMENT: A CASE STUDY IN
MANDAITIVU ISLAND, JAFFNA
Kajanini Balasubramaniam*1
and Mangala De Zoysa2
1Department of Agricultural Engineering, University of Ruhuna, Sri Lanka 2Department of Agricultural Economics and Extension, University of Ruhuna, Sri Lanka
*Corresponding author: [email protected]
Abstract
In spite of degradations of natural resources by anthropogenic activities and lack of
apparent options, there are potentials for ecotourism development in Mandaitivu Island.
The ecotourism improves the livelihood of local communities and conservation of
natural resources. The major objective of this study was to analyze the potential of
sustainable ecotourism in Mandaitivu Island. The study was conducted through a field
survey using convenience sampling method interviewing 120 target participants.
According to the study, the main potentials for ecotourism opportunities available in
the Mandaitivu Island include diversified species of birds, some mammals, scenic
landscapes, mangrove forests, sea grass beds and stunning beaches. Mangrove
encroachment, sand mining and expansion of farming activities were revealed as the
major problems contributing to the degradations of natural resources of the island. The
study has identified the income generating alternatives through potential ecotourism
opportunities which could help to reduce the present degradations of natural resources.
The analysis of the study were carried-out by Wilcoxon signed rank test and
descriptive statistics that exposed, there is a positive attitude among the 68.3% of the
local community towards ecotourism. Further the outcome of the study conducted
shows there is a significant among people to protect the natural resources (P: 0.0007)
and ecotourism will lay a path for more employment opportunities (P: 0.0000) for the
youth of this local community. People who reside in the local community agreed with
the idea of the implementing ecotourism in a well positive manner, however they
require more education on environment (P: 0.0000) to understand the concept of
ecotourism and to support cause. Tourism will improve the access to attract ecotourism
locations and stimulate the development of new facilities infrastructure and
communication. However, some negative impacts mainly cultural modification and
secondly waste accumulation can be an adverse impact for the ecotourism. Finally,
introducing sustainable ecotourism is an important strategic direction for sustainable
management of natural resources and improving alternative economic opportunities in
Mandaitivu Island.
Keywords: Alternative opportunities, Local community, Mandaitivu Island, Natural
resources, Sustainable ecotourism
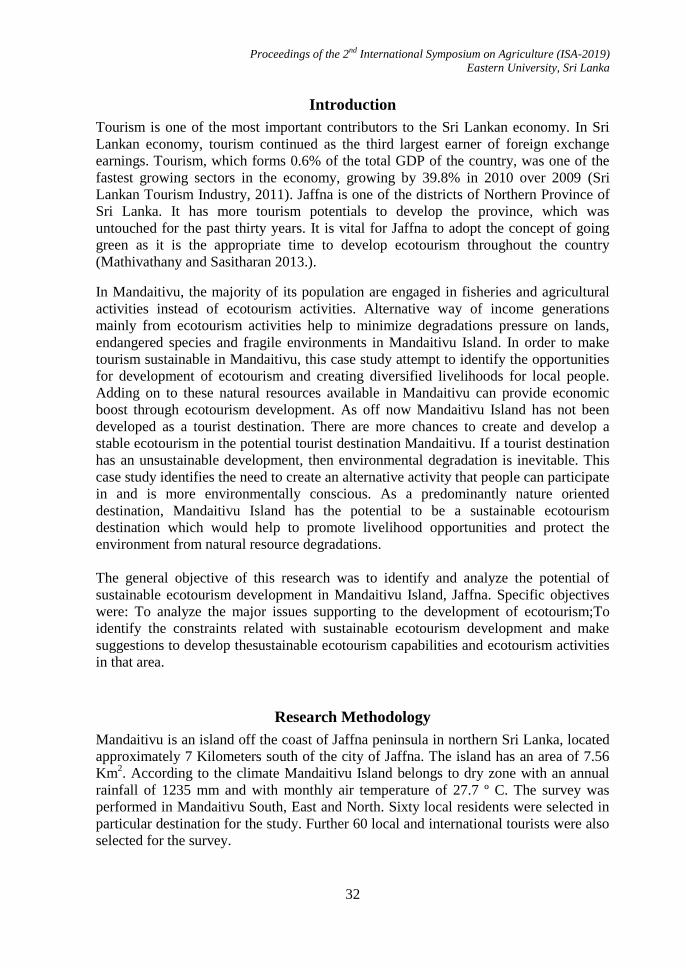
Proceedings of the 2nd International Symposium on Agriculture (ISA-2019)
Eastern University, Sri Lanka
32
Introduction
Tourism is one of the most important contributors to the Sri Lankan economy. In Sri
Lankan economy, tourism continued as the third largest earner of foreign exchange
earnings. Tourism, which forms 0.6% of the total GDP of the country, was one of the
fastest growing sectors in the economy, growing by 39.8% in 2010 over 2009 (Sri
Lankan Tourism Industry, 2011). Jaffna is one of the districts of Northern Province of
Sri Lanka. It has more tourism potentials to develop the province, which was
untouched for the past thirty years. It is vital for Jaffna to adopt the concept of going
green as it is the appropriate time to develop ecotourism throughout the country
(Mathivathany and Sasitharan 2013.).
In Mandaitivu, the majority of its population are engaged in fisheries and agricultural
activities instead of ecotourism activities. Alternative way of income generations
mainly from ecotourism activities help to minimize degradations pressure on lands,
endangered species and fragile environments in Mandaitivu Island. In order to make
tourism sustainable in Mandaitivu, this case study attempt to identify the opportunities
for development of ecotourism and creating diversified livelihoods for local people.
Adding on to these natural resources available in Mandaitivu can provide economic
boost through ecotourism development. As off now Mandaitivu Island has not been
developed as a tourist destination. There are more chances to create and develop a
stable ecotourism in the potential tourist destination Mandaitivu. If a tourist destination
has an unsustainable development, then environmental degradation is inevitable. This
case study identifies the need to create an alternative activity that people can participate
in and is more environmentally conscious. As a predominantly nature oriented
destination, Mandaitivu Island has the potential to be a sustainable ecotourism
destination which would help to promote livelihood opportunities and protect the
environment from natural resource degradations.
The general objective of this research was to identify and analyze the potential of
sustainable ecotourism development in Mandaitivu Island, Jaffna. Specific objectives
were: To analyze the major issues supporting to the development of ecotourism;To
identify the constraints related with sustainable ecotourism development and make
suggestions to develop thesustainable ecotourism capabilities and ecotourism activities
in that area.
Research Methodology
Mandaitivu is an island off the coast of Jaffna peninsula in northern Sri Lanka, located
approximately 7 Kilometers south of the city of Jaffna. The island has an area of 7.56
Km2. According to the climate Mandaitivu Island belongs to dry zone with an annual
rainfall of 1235 mm and with monthly air temperature of 27.7 º C. The survey was
performed in Mandaitivu South, East and North. Sixty local residents were selected in
particular destination for the study. Further 60 local and international tourists were also
selected for the survey.
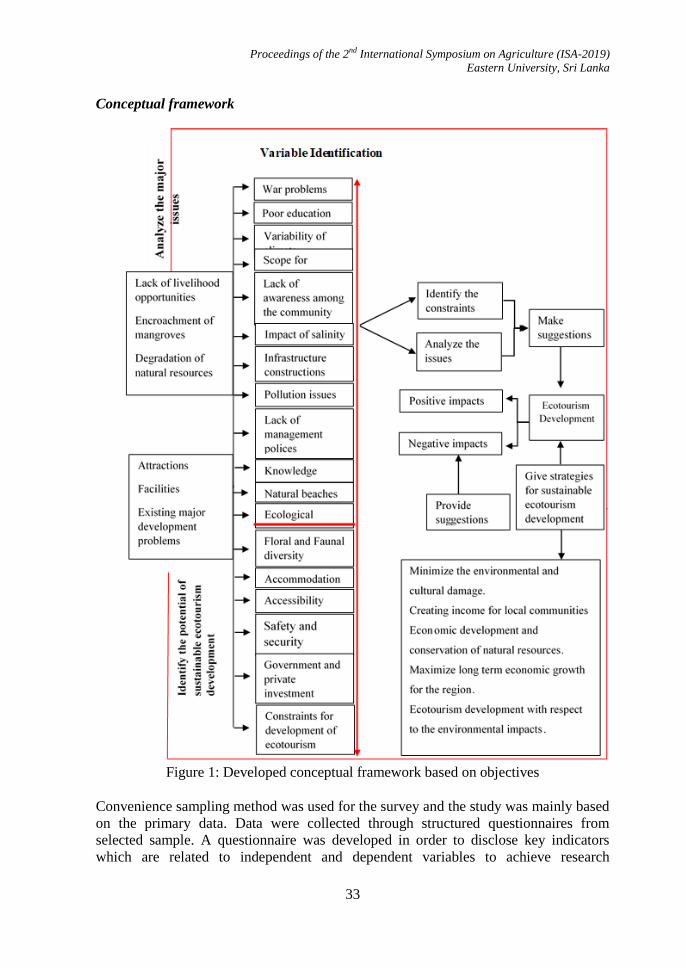
Proceedings of the 2nd International Symposium on Agriculture (ISA-2019)
Eastern University, Sri Lanka
33
Conceptual framework
Figure 1: Developed conceptual framework based on objectives
Convenience sampling method was used for the survey and the study was mainly based
on the primary data. Data were collected through structured questionnaires from
selected sample. A questionnaire was developed in order to disclose key indicators
which are related to independent and dependent variables to achieve research
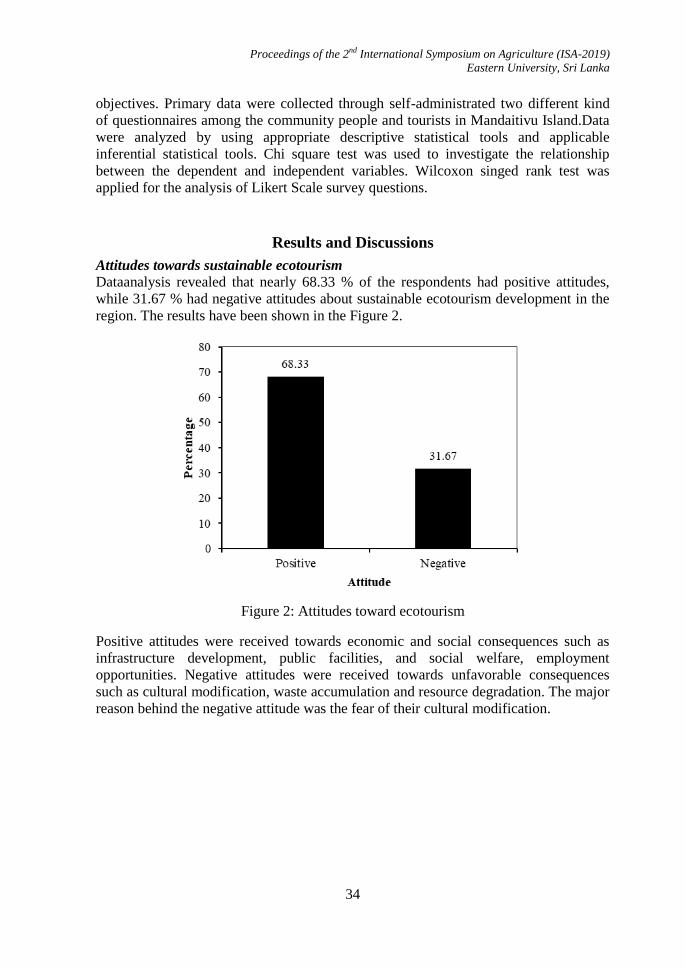
Proceedings of the 2nd International Symposium on Agriculture (ISA-2019)
Eastern University, Sri Lanka
34
objectives. Primary data were collected through self-administrated two different kind
of questionnaires among the community people and tourists in Mandaitivu Island.Data
were analyzed by using appropriate descriptive statistical tools and applicable
inferential statistical tools. Chi square test was used to investigate the relationship
between the dependent and independent variables. Wilcoxon singed rank test was
applied for the analysis of Likert Scale survey questions.
Results and Discussions
Attitudes towards sustainable ecotourism
Dataanalysis revealed that nearly 68.33 % of the respondents had positive attitudes,
while 31.67 % had negative attitudes about sustainable ecotourism development in the
region. The results have been shown in the Figure 2.
Figure 2: Attitudes toward ecotourism
Positive attitudes were received towards economic and social consequences such as
infrastructure development, public facilities, and social welfare, employment
opportunities. Negative attitudes were received towards unfavorable consequences
such as cultural modification, waste accumulation and resource degradation. The major
reason behind the negative attitude was the fear of their cultural modification.

Proceedings of the 2nd International Symposium on Agriculture (ISA-2019)
Eastern University, Sri Lanka
35
Respondents’ attitudes associated with demographic variables
Table 1: Demographic variables vs. respondents‟ attitudes
Variables Positive attitude Negative attitude Chi-square value P value
Gender
Female
Male
17
24
8
11
0.002 0.963
Age
18-24
25-34
35-44
45
8
12
9
12
5
5
5
4
0.752 0.861
Education
Primary
Secondary
High school
Degree
No schooling
6
16
12
5
2
8
8
3
0
0
8.417 0.000*
Occupation
Farming
Fishing
Student
Not employed
Other
14
5
8
5
9
3
5
5
3
3
3.747 0.441
Length of
residency
All my life
More than 20
years
30
11
16
3
0.347 0.885
*Significant at P = 0.05
Identify and analyze the potential of sustainable ecotourism development
Attractions
According to the results (Table 2), “Island is suitable for beach based activities”
positively and significantly. That means there is a significant potential for suitable
beach based activities in that area. “Environment is rich biodiversity and high value
destination”. And question “Development of ecotourism will give benefits for this
area” answered positively and significantly. These results also compatible with the
findings of Keshini De Silva, (2017) that indicated Mandaitivu has the potential for
nature related activities and rich in bio diversity. The question “Tourism destination
respect the natural environment” was not answered positively.
Proceedings of the 2nd International Symposium on Agriculture (ISA-2019)
Eastern University, Sri Lanka
36
Table 2: Questions about attractions in the site
*Calculated P value < P 0.05, significant
Facilities
According to the Table 3, most of the tourists felt disagree for all statements. For the
question “Enough safety and security facilities available in Mandaitivu” they felt
“Enough accommodation facilities available around this Island” and “Enough
transportation facilities available within Mandaitivu” are negatively significant. The
question “Enough transportation facilities available from Jaffna to Mandaitivu” has
been received positive response.
Table 3: Questions about facilities available in the site
* Calculated P value < P 0.05, significant
Analyze the major issues supporting to the development of ecotourism
Lack of livelihood opportunities According to the Table 4, the majority of respondents mentioned “unemployed youth
of this area will get alternative livelihood opportunities by this ecotourism
development” which is highly significant. Tao and Wall (2009) reviewed that,
sustainable livelihood approach is useful because it acknowledges particularly in
communities, people gain their livelihoods through ecotourism activities rather than
one formal job. If a community decides to incorporate tourism as one of their
livelihood strategies in order to achieve sustainable livelihood, tourism will be a form
of livelihood diversification. Community people that they felt “Regional development
increasing the level of living standard and self-esteem of local people” is also highly
significant. Answer for the question “Tourism will promote local products and
services” is not significant. Hence question “community people support the need of
Questions Mean value P value
Suitable for beach based activities 1.7667 0.0000*
Environment is rich in bio diversity and high
value destination
1.0833 0.0000*
Tourist destination respect the natural
environment
-0.1170 0.6780
Development of ecotourism will give
benefits for this area
0.5830 0.0000*
Questions Mean value P value
Enough transportation facilities available from
Jaffna to Mandaitivu
0.4170 0.1156
Enough transportation facilities available within
Mandaitivu
-1.3670 0.0000*
Enough accommodation facilities available around
this island
-1.5830 0.0000*
Enough safety and security facilities available in
Mandaitivu
-1.1833 0.0000*
Proceedings of the 2nd International Symposium on Agriculture (ISA-2019)
Eastern University, Sri Lanka
37
ecotourism in this region” most of the people reacted neither agreed nor disagreed for
this statement. The P value for this statement is however not significant.
Table 4: Questions about lack of livelihood opportunities
Questions Mean
value
P value
Community people support the need of ecotourism 0.0830 0.5181
Regional development increasing the level of living
standard and self-esteem of local people
0.7830 0.0000*
Unemployed youth get livelihood opportunities 0.9670 0.0000*
Tourism will promote local products and services 0.1000 0.4326 * Calculated P value < P 0.05, significant
Mangrove, natural resource degradation
According to the Table 5, majority of the community people significantly mentioned
that they were felt “environmental education is important on natural resource to the
local people”. They felt “tourism development will increase the pollution and salinity
level on the environment”. And the majority of the tourist mentioned that they felt
“Infrastructure developments increasing the level of Mangrove destruction”. Hence,
Question “Tourism will promote Protection of natural resources of this region” most of
the respondents felt agree this statement. According to Sunlu (2003)tourism can
significantly contribute to environmental protection, conservation and restoration of
biological diversity and sustainable use of natural resources.
Table 5: Questions about mangrove and natural resource degradation
Questions Mean
value
P value
Infrastructure developments increasing the level of
mangrove destruction
0.1170 0.1907
Tourism development will increase the pollution and
salinity level on the environment
0.4830 0.0309*
Tourism will promote protection of natural resources of
this region
1.0170 0.0007*
Importance of environmental education regarding
natural resource to the people
1.2170 0.0000*
* Calculated P value < P 0.05, significant
Existing major development problems
According to the Table 6, “Government and NGO provide fund for develop
Mandaitivu”, “Government and private sectors are help to create new job opportunities
and promote local products in Mandaitivu” In these following statementsmost of the
local people exactly did not know the situation and they felt neither agree or disagree.
Those statements are not significantly. Most of the people positively and significantly
reacted in a less involvement manner to the question of “There is high political
influence in Mandaitivu tourism development”.
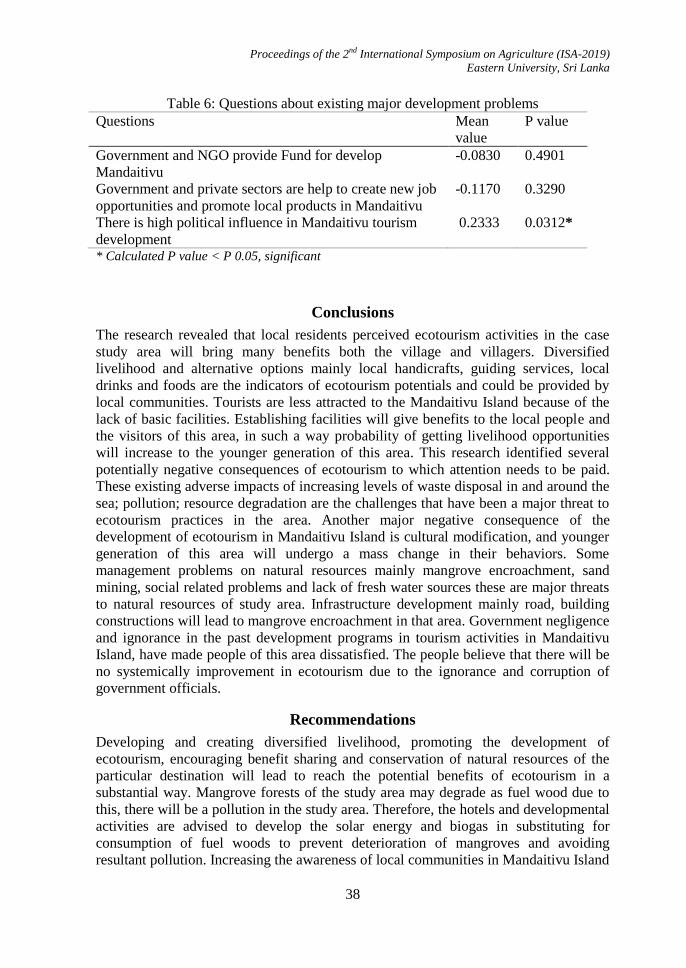
Proceedings of the 2nd International Symposium on Agriculture (ISA-2019)
Eastern University, Sri Lanka
38
Table 6: Questions about existing major development problems
Questions Mean
value
P value
Government and NGO provide Fund for develop
Mandaitivu
-0.0830 0.4901
Government and private sectors are help to create new job
opportunities and promote local products in Mandaitivu
-0.1170 0.3290
There is high political influence in Mandaitivu tourism
development
0.2333 0.0312*
* Calculated P value < P 0.05, significant
Conclusions
The research revealed that local residents perceived ecotourism activities in the case
study area will bring many benefits both the village and villagers. Diversified
livelihood and alternative options mainly local handicrafts, guiding services, local
drinks and foods are the indicators of ecotourism potentials and could be provided by
local communities. Tourists are less attracted to the Mandaitivu Island because of the
lack of basic facilities. Establishing facilities will give benefits to the local people and
the visitors of this area, in such a way probability of getting livelihood opportunities
will increase to the younger generation of this area. This research identified several
potentially negative consequences of ecotourism to which attention needs to be paid.
These existing adverse impacts of increasing levels of waste disposal in and around the
sea; pollution; resource degradation are the challenges that have been a major threat to
ecotourism practices in the area. Another major negative consequence of the
development of ecotourism in Mandaitivu Island is cultural modification, and younger
generation of this area will undergo a mass change in their behaviors. Some
management problems on natural resources mainly mangrove encroachment, sand
mining, social related problems and lack of fresh water sources these are major threats
to natural resources of study area. Infrastructure development mainly road, building
constructions will lead to mangrove encroachment in that area. Government negligence
and ignorance in the past development programs in tourism activities in Mandaitivu
Island, have made people of this area dissatisfied. The people believe that there will be
no systemically improvement in ecotourism due to the ignorance and corruption of
government officials.
Recommendations
Developing and creating diversified livelihood, promoting the development of
ecotourism, encouraging benefit sharing and conservation of natural resources of the
particular destination will lead to reach the potential benefits of ecotourism in a
substantial way. Mangrove forests of the study area may degrade as fuel wood due to
this, there will be a pollution in the study area. Therefore, the hotels and developmental
activities are advised to develop the solar energy and biogas in substituting for
consumption of fuel woods to prevent deterioration of mangroves and avoiding
resultant pollution. Increasing the awareness of local communities in Mandaitivu Island

Proceedings of the 2nd International Symposium on Agriculture (ISA-2019)
Eastern University, Sri Lanka
39
towards ecotourism is very important. Therefore, such awareness about environmental
education might be affected. Illegal activities mainly sand mining, mangrove
destruction will be a threat on natural resources of this area. Therefore, government
should undertake and regulate strict policy on environmental act and natural resources
conservation act. Involving the community is a critically important component in a
successful ecotourism program. Hence community participation in all aspects of
ecotourism activities should be ensured. For the enhancement of the economic standard
of the community, educated youth in the villages should be trained and employed. Tour
operators should use appropriately trained local residents as interpreters and should
encourage the tourists to buy local products. Encouraging and incorporating local
residents‟ concerns into the decision making process can serve to build local residents‟
self-confidence and enthusiasm. Local villagers‟ effective involvement in the
ecotourism activity can be accomplished through identifying and strengthening their
capacities.
References
Keshini De Silva. (2017). Discovering Mandaitivu. [online]Available: http://www.
serendib.btoptions.lk /article.php?issue=90&id=2051 (Accessed on 9th October
2018).
Mathivathany, V., and Sasitharan, P. (2013). Potentials for Regional Development of
Tourism Industry - Post War at Jaffna District in Sri Lanka.
Sri Lankan Tourism industry. (2011). Annual Report. 2-30.
Sunlu, U. (2003). Environmental impacts of tourism. In: Camarda D. (Eds.), Grassini
L. (Eds.). Local resources and global trades: Environments and agriculture in the
Mediterranean region. Bari: CIHEAM, 2003. p. 263-2 7 0 (Option s
Méditerranéennes: Série A. Séminaires Méditerranéens; n. 57).
Tao, T.C.H., and Wall, G. (2009). Tourism as a sustainable livelihood strategy.
Tourism Management, 30(1), (pp.90–98).
Proceedings of the 2nd International Symposium on Agriculture (ISA-2019)
Eastern University, Sri Lanka
40
ADOPTION OF MACHINERY IN TEA CULTIVATION AND
MANAGEMENT BY TEA SMALLHOLDERS IN KALUTARA
DISTRICT
R.A.P.I.S Dharmadasa1*
, U.M.Karunathilaka1, K.G Premathilake
1,
M.M.B.S Silva1 andD.M.J. Nakandala
2
1Department of Export Agriculture, Uva Wellassa University of Sri Lanka 2 Tea Small Holding Development Authority, Kalutara Regional Office, Kalutara
*Corresponding author: [email protected]
Abstract
Use of machinery is a vital investment to enhance the productivity and overall
performance of the tea industry.It is considered to be a better solution for the problems
of labor shortage and high cost of production. However, what factors determine the
level of adoption of machineries is questionable. Therefore, taking 154 tea
smallholders representing 4 smallholder societies of 4 Tea Inspector (TI) ranges, this
study was conducted to find the determinants of adoption level of machinery. The
sample for the research study was selected using multistage sampling technique. The
data were analyzed using descriptive techniques and three regression models; Tobit and
Logistic Regression. According to the results of the descriptive analysis, overall
adoption level is 12.73%. Smallholders have higher adoption on pruning machine
(29.22%) and TRI selective tea harvester (20.13%) while lower adoption is recorded on
Holing machine (7.14%), Fuel operated plucking machine (5.19%) and Battery
operated plucking machine (1.95%). The results of Tobit and Logistic regressions
reveal that young male tea land owners with sufficient experience in cultivation who
uses family labor and extension facilities from Tea Research Institute tend to adopt
machineries. Our results also suggest that they tend to use more machineries if their
tea yield is higher. However, more educated tea smallholders do not tend to use
machineries while time spent on tea land for management practices also reduces the
machinery usage. The decisions to adopt the machineries do not depend on the
extension facilities given by the TRI while the tea smallholders who adopted the
machineries seek more information. Therefore, it is recommended to improve and
strengthen the extension facilities to gain productive gains from the use of machineries.
Keywords: Adoption level, Kalutara District, Machineries, Tea smallholders
Introduction
The commercial tea plantations in Sri Lanka has over 150 years of the plantation
history to build the name of Ceylon tea. Tea continues to remain as the major
plantation crop in the country and provides substantial support to the national
economy. The total production of the Tea Small Holding sector 239.86 million kg per
year. The contribution to the national production was about 73%. (Tea Small Holding
Development Authority, 2015). Lands less than 10 acres in extent are treated as “tea
Proceedings of the 2nd International Symposium on Agriculture (ISA-2019)
Eastern University, Sri Lanka
41
small holdings” according the tea control act. Though the plantation estate sector is
rather stagnated, the small holing sector has performed better during the past few
decades (Basnayake and Guneratne, 2002)
In the past few decades, there are some critical issues in tea industry such as lower
productivity, high cost of production, a decline in the quality of made tea,
technologized issues and negative attitudes of the associates in tea industry that has
been to a leading labor shortage (Dissanayake and Athauda, 2011).The concept of
machinery usage is an innovative potential to the tea small holding sector as a best
solution for labor shortage, low productivity and high cost of production. Therefore the
tea small holding sector is looking for a better approach from machinery usage to
obtain high quality and low cost output for long term survival of the tea industry in Sri
Lanka.
TRI1 selective tea harvester (TRI shear), Fuel operated machine harvester, Battery
operated machine harvester, Pruning machine and Holing machine are machineries
introduced for tea cultivation and management practices. In case of encouraging
sustained agricultural intensification and enhancing the land productivity (Kienzle
etal., 2013) in an era of much young blood moves away from agricultural sector
(Dissanayake and Athauda, 2011), machineries may be of great interest to smallholder
farmers as the adoption of machineries in their production within the limited land
extent may lead to save cost and reduce drudgery (Kienzle et al., 2013). Use of such
machineries also help facilitate the conservation of resources (Krupnik et al., 2013).
However, the question remain as to what factors are associated with smallholder
adoption of those machineries. To answer the question, it is necessary and important to
understand the farm level characteristics, household characteristics and availability of
extension services. Therefore, this study sheds lights in determining the factors
affecting the adoption level of and decision to adopt machineries available to tea
smallholders in Kalutara District of Sri Lanka.
Materials and Methods
Kalutara district has 7,823 ha of total extend of tea small holdings and 35, 908 number
of tea small holdings (Tea Small Holding Authority, 2015). The survey was carried out
in Kelinkanda, Meegahathenna, Galmaththa and Thinniyawala “Pragathi” tea small
holding societies. As those above societies have largest number of tea small holders.
There were 3100 of tea small holdings in above selected societies. This study was
conducted using 154 tea smallholders connected to those societies in Kalutara District.
The sample for the research study was drawn using multistage sampling technique.
Data were collected using structured questionnaire and interviewing the tea small
holders at their residences. Production factors, household level characteristics, and data
related to machinery usage were identified in preparing of questionnaire.
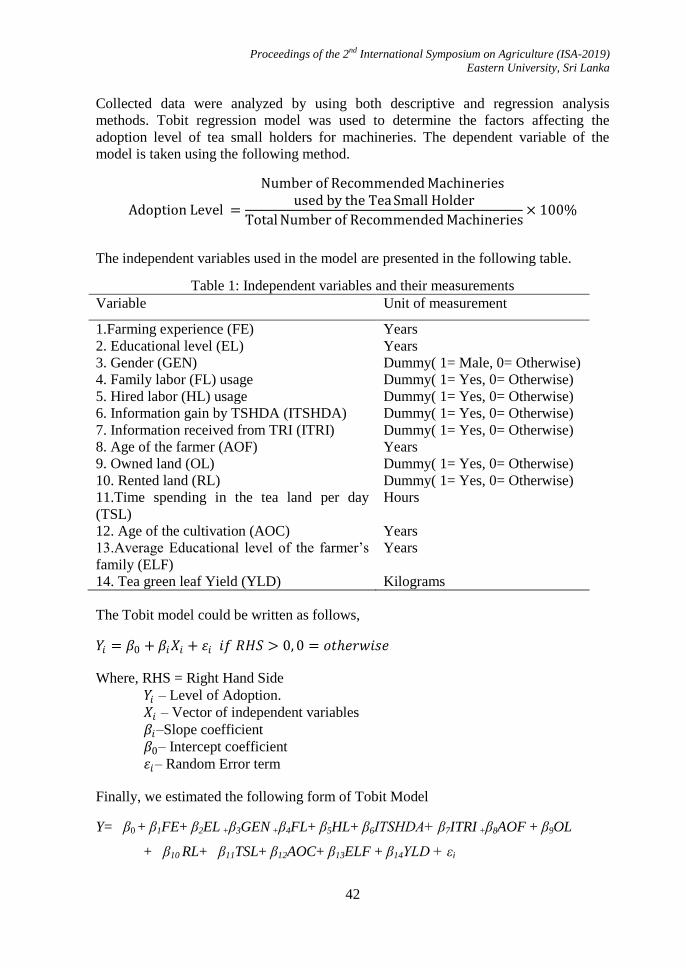
Proceedings of the 2nd International Symposium on Agriculture (ISA-2019)
Eastern University, Sri Lanka
42
Collected data were analyzed by using both descriptive and regression analysis
methods. Tobit regression model was used to determine the factors affecting the
adoption level of tea small holders for machineries. The dependent variable of the
model is taken using the following method.
Adoption Level =
Number of Recommended Machineries used by the Tea Small Holder
Total Number of Recommended Machineries× 100%
The independent variables used in the model are presented in the following table.
Table 1: Independent variables and their measurements
Variable Unit of measurement
1.Farming experience (FE) Years
2. Educational level (EL) Years
3. Gender (GEN) Dummy( 1= Male, 0= Otherwise)
4. Family labor (FL) usage Dummy( 1= Yes, 0= Otherwise)
5. Hired labor (HL) usage Dummy( 1= Yes, 0= Otherwise)
6. Information gain by TSHDA (ITSHDA) Dummy( 1= Yes, 0= Otherwise)
7. Information received from TRI (ITRI) Dummy( 1= Yes, 0= Otherwise)
8. Age of the farmer (AOF) Years
9. Owned land (OL) Dummy( 1= Yes, 0= Otherwise)
10. Rented land (RL) Dummy( 1= Yes, 0= Otherwise)
11.Time spending in the tea land per day
(TSL)
Hours
12. Age of the cultivation (AOC) Years
13.Average Educational level of the farmer‟s
family (ELF)
Years
14. Tea green leaf Yield (YLD) Kilograms
The Tobit model could be written as follows,
𝑌𝑖 = 𝛽0 + 𝛽𝑖𝑋𝑖 + 𝜀𝑖 𝑖𝑓 𝑅𝐻𝑆 > 0, 0 = 𝑜𝑡𝑒𝑟𝑤𝑖𝑠𝑒
Where, RHS = Right Hand Side
𝑌𝑖 – Level of Adoption.
𝑋𝑖 – Vector of independent variables
𝛽𝑖–Slope coefficient
𝛽0– Intercept coefficient
𝜀𝑖– Random Error term
Finally, we estimated the following form of Tobit Model
Y= β0 + β1FE+ β2EL +β3GEN +β4FL+ β5HL+ β6ITSHDA+ β7ITRI +β8AOF + β9OL
+ β10 RL+ β11TSL+ β12AOC+ β13ELF + β14YLD + εi
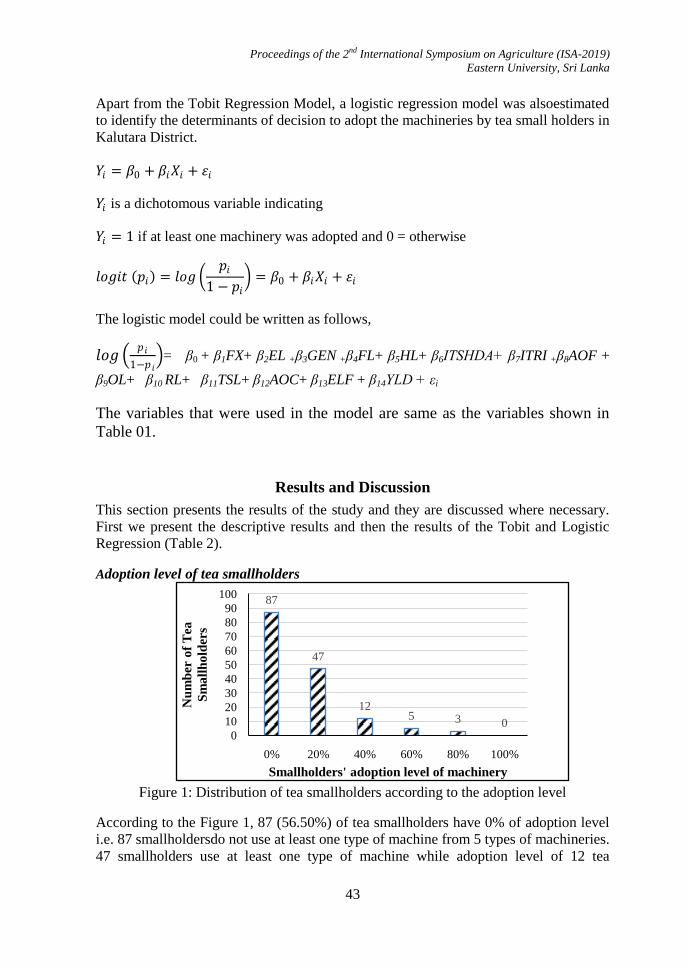
Proceedings of the 2nd International Symposium on Agriculture (ISA-2019)
Eastern University, Sri Lanka
43
87
47
125 3 0
0
10
20
30
40
50
60
70
80
90
100
0% 20% 40% 60% 80% 100%
Nu
mb
er o
f T
ea
Sm
all
ho
lder
s
Smallholders' adoption level of machinery
Apart from the Tobit Regression Model, a logistic regression model was alsoestimated
to identify the determinants of decision to adopt the machineries by tea small holders in
Kalutara District.
𝑌𝑖 = 𝛽0 + 𝛽𝑖𝑋𝑖 + 𝜀𝑖
𝑌𝑖 is a dichotomous variable indicating
𝑌𝑖 = 1 if at least one machinery was adopted and 0 = otherwise
𝑙𝑜𝑔𝑖𝑡 𝑝𝑖 = 𝑙𝑜𝑔 𝑝𝑖
1 − 𝑝𝑖 = 𝛽0 + 𝛽𝑖𝑋𝑖 + 𝜀𝑖
The logistic model could be written as follows,
𝑙𝑜𝑔 𝑝𝑖
1−𝑝𝑖 = β0 + β1FX+ β2EL +β3GEN +β4FL+ β5HL+ β6ITSHDA+ β7ITRI +β8AOF +
β9OL+ β10 RL+ β11TSL+ β12AOC+ β13ELF + β14YLD + εi
The variables that were used in the model are same as the variables shown in
Table 01.
Results and Discussion
This section presents the results of the study and they are discussed where necessary.
First we present the descriptive results and then the results of the Tobit and Logistic
Regression (Table 2).
Adoption level of tea smallholders
Figure 1: Distribution of tea smallholders according to the adoption level
According to the Figure 1, 87 (56.50%) of tea smallholders have 0% of adoption level
i.e. 87 smallholdersdo not use at least one type of machine from 5 types of machineries.
47 smallholders use at least one type of machine while adoption level of 12 tea

Proceedings of the 2nd International Symposium on Agriculture (ISA-2019)
Eastern University, Sri Lanka
44
31
3
8
45
11
0
5
10
15
20
25
30
35
40
45
50
TRI Selective
tea harvester
Battery
operated
plucking
machine
Fuel operated
plucking
machine
Pruning
machine
Holing
machine
Num
ber
of
Tea
Sm
allh
old
ers
Type of Machine
smallholdersis 40%. Only 5 smallholdersuse 3 machineries so that their adoption level
accounts to 60% while only 3 smallholdersuse 4 machineries accounting to adoption
level of 80%. There is not a single smallholderwho uses all the five machineries.
Figure 2: Distribution of tea smallholders according to machinery usage
Machinery usage of the adopted tea smallholders
According to the Figure 2, highest number of tea smallholders (29.22%) use pruning
machine. It is a fact that tea harvesting is a costly operation and it accounts for much
cost. It is also to a certain extent time consuming. Therefore, TRI has introduced
selective harvesting shear. If it is used, it will increase the labor productivity while
reducing cost. The present study found that only 20.13% tea smallholders use TRI
selective tea harvester. 7.14% tea smallholders use holing machine. Only 5.19% of tea
smallholders use fuel operated plucking machine while 1.95% of tea smallholders use
battery operated plucking machine.
Tobit Model Estimation
Tobit regression analysis was conducted to satisfy the main objective of the study i.e.to
identify the factors affecting to the adoption level of machinery by tea small holders in
Kalutara District. The results of Tobit regression model is presented in the Table 2.
The results revealed that the adoption level on machinery is significantly determined by
the Farming experience, educational level of the tea smallholder, gender, family labor,
information by TRI, age of the famer, owned land, time spending in the tea land and
the tea yield. Farming experience, gender, family labor, information by TRI, owned
land of the tea small holder are positively related with the adoption level of
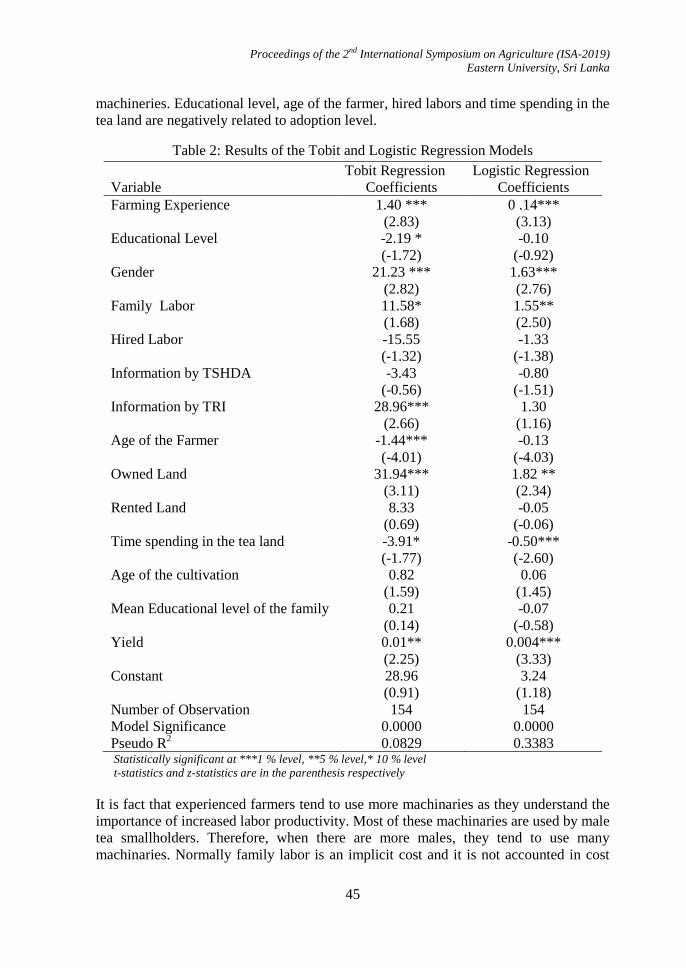
Proceedings of the 2nd International Symposium on Agriculture (ISA-2019)
Eastern University, Sri Lanka
45
machineries. Educational level, age of the farmer, hired labors and time spending in the
tea land are negatively related to adoption level.
Table 2: Results of the Tobit and Logistic Regression Models
Tobit Regression Logistic Regression
Variable Coefficients Coefficients
Farming Experience 1.40 ***
(2.83)
0 .14***
(3.13)
Educational Level -2.19 *
(-1.72)
-0.10
(-0.92)
Gender 21.23 ***
(2.82)
1.63***
(2.76)
Family Labor 11.58*
(1.68)
1.55**
(2.50)
Hired Labor -15.55
(-1.32)
-1.33
(-1.38)
Information by TSHDA -3.43
(-0.56)
-0.80
(-1.51)
Information by TRI 28.96***
(2.66)
1.30
(1.16)
Age of the Farmer -1.44***
(-4.01)
-0.13
(-4.03)
Owned Land 31.94***
(3.11)
1.82 **
(2.34)
Rented Land 8.33
(0.69)
-0.05
(-0.06)
Time spending in the tea land -3.91*
(-1.77)
-0.50***
(-2.60)
Age of the cultivation 0.82
(1.59)
0.06
(1.45)
Mean Educational level of the family 0.21
(0.14)
-0.07
(-0.58)
Yield 0.01**
(2.25)
0.004***
(3.33)
Constant 28.96
(0.91)
3.24
(1.18)
Number of Observation 154 154
Model Significance 0.0000 0.0000
Pseudo R2 0.0829 0.3383
Statistically significant at ***1 % level, **5 % level,* 10 % level
t-statistics and z-statistics are in the parenthesis respectively
It is fact that experienced farmers tend to use more machinaries as they understand the
importance of increased labor productivity. Most of these machinaries are used by male
tea smallholders. Therefore, when there are more males, they tend to use many
machinaries. Normally family labor is an implicit cost and it is not accounted in cost
Proceedings of the 2nd International Symposium on Agriculture (ISA-2019)
Eastern University, Sri Lanka
46
calculations. Smallholders feel that if they use family labour, it is not a cost to them.
When they use family labor and machineries, their overall cost could be minimized and
productivity also increases which ultimately leads to increase the family income.
Therefore, they prefer to adopt machineries with more family members. Extension
services play an important role in increasing the productivity and making the
smallholders aware of new technologies and machineries. More they use the
information provided by extension agent like TRI, more will be the use of machineries
in their production process. This is really important in the case of tea cultivation. It is
also a fact that young farmers easily embrace the new technologies. Therefore, more
young tea smallholders tend to use these technologies. It is also an incentive for tea
smallholders to use more machinaries when they own a land as their sole objective is to
maximize profit through increase in productivity and minimizing cost. If tea
smallholders spend more time on field operations and attending to cultural practices, it
implies that they do not tend to use machineries. However, with increase in tea yield
they tend to use more machinaries.
Logistic Regression Estimation
Logistic regression was conducted to identify the determinants of decision to adopt by
tea small holders in Kalutara District. The result revealed that the adoption of
machinery is significantly determined by the farming experience, gender, age of the
farmer, time spending in the tea land, yield, family labor and owned land. According to
the analysis, there is no significant relationship between adoption and educational level
of the farmer, age of the cultivation, educational level of the family members, hired
labor, information by TSHDA, Information by TRI and rented land.
Logistic regression results presented in Table 2 suggest that more experienced farmers
tend to make the decision to adopt machineries in their production process. So is the
case with gender of the tea smallholder, use of family labor in tea production, land
ownership and yield of tea. The most important thing in the results is that age of the
tea smallholder and the extension services provided by the TRI do not contribute to
make decision to adopt machineries. This result provides important implications. For
example, tea smallholders adoption rate increases with TRI information but not
significant in decision to adopt at the first instant. It is a fact that introduction of a new
technology is difficult according to the extension theories. But once it adopted, the
others also tend to use it. This may be the reason not to make the decision to adopt but
adoption rates goes up when providing information by TRI. Results also suggest that
age of the tea smallholder is not significant determinant of adoption decision.
Conclusions
Tea small holders in Kalutara district have 12.73% of overall adoption level on
machinery. Among 5 machineries more farmers adopt to use TRI selective harvester
and pruning machine. Famers have least adoption level on battery operated plucking
machine.Young male tea land owners with sufficient experience in cultivation who
uses family labor and extension facilities from Tea Research Institute tend to adopt
Proceedings of the 2nd International Symposium on Agriculture (ISA-2019)
Eastern University, Sri Lanka
47
machineries. Our results also suggest that they tend to use more machineries if their
tea yield is higher. However, more educated tea smallholders do not tend to use
machineries while time spent on tea land for management practices also reduces the
machinery usage. The decisions to adopt the machineries do not depend on the
extension facilities given by the TRI while the tea smallholders who adopted the
machineries seek more information. Therefore, it is recommended to improve and
strengthen the extension facilities to gain productive gains from the use of machineries.
Acknowledgement
We thank Mr. D. M. J. Nakandala, Regional Manager, Tea Small Holding
Development Authority, Kalutara,for enlightening assistance throughout research.
References
Basnayake, B. M. J. K., and Gunaratne, L. H. P. (2002), “Estimation of Technical
Efficiency and Its Determinants in the Tea Small Holding Sector in the Mid
Country Wet Zone of Sri Lanka”, Sri Lanka Journal of Agricultural
Economics,4:137-150.
Dissanayake D.K. and Athauda A.M.T.P. (2011). The Impact of Worker Attitudes and
its Attributes on Labour Out-migration in the Tea Plantation Sector of Sri Lanka,
Proceedings of 11th Agricultural Research Symposium 2011, Faculty of Agriculture
and Plantation Management, Wayamba University of Sri Lanka, 154-158
Kienzle, J., Ashburner, J.E., and Sims, B.G., (2013). Mechanization for Rural
Development: a Review of Patterns and Progress from Around the World. Plant
Production and Protection Division, Food and Agriculture Organization of the
United Nations (FAO), Rome.
Krupnik, T.J., Valle, S.S., McDonald, A.J., Justice, S., Hossain, I., and Gathala, M.K.,
(2013). Made in Bangladesh: Scale-appropriate Machinery for Agricultural
Resource Conservation. International Maize and Wheat Improvement Centre
(CIMMYT), Mexico, D.F.
Tea Small Holdings Development Authority (2015).Annual Report, Tea Small Holding
Development Authority. 34-47.
Proceedings of the 2nd International Symposium on Agriculture (ISA-2019)
Eastern University, Sri Lanka
48
EFFICIENCY OF ACTIVATED CARBON PRODUCED FROM
POLYETHYLENE TEREPHTHALATE (PET) WASTE MATERIALS
FOR THE TREATMENT OF MUNICIPAL SOLID WASTE LANDFILL
LEACHATE
G. Puvitha and R. Thivyatharsan
Department of Agricultural Engineering, Faculty of Agriculture, Eastern University, Sri Lanka
*Corresponding author: [email protected]
Abstract
Municipal Solid Waste (MSW) is a major growing problem in urban areas of Sri
Lanka. Municipal solid waste mainly composed of plastics namely polyethylene
terephthalate (PET) waste. Further, percolation of landfill leachate into the
groundwater tables and aquifer system, which poses a potential risk and hazardous
towards the public health and ecosystem. Therefore, there is a need for the efficient
management of PET waste and to treat leachate before discharging into surrounding
environment. The objectives of this study were (i) to produce the activated carbon from
PET (Polyethylene terephthalate) waste materials (ii) to determine the efficiency of
activated carbon for the treatment of MSW landfill leachate. Activated carbon was
prepared by carbonization followed by chemical activation with KOH. Leachate was
collected from the Koduwamadu MSW landfill Batticaloa. Production rate of activated
carbon was obtained as 27.92%. Adsorption experiments were performed in a 250ml of
conical flask. 250ml of leachate sample was poured in to 7g of activated carbon in
conical flask. The effluent from conical flask was collected at 3rd
, 5th, 7
th, and 9
th day
interval and analyzed for different water quality parameters. The initial value of TDS,
COD, BOD5, phosphate, pH and EC were 5846.66±55.76mg/l, 2112.66±2.90mg/l,
360±2.88mg/l, 16.93±0.1mg/l, 8.543±0.072 and 10.3±0.11mS/cm, respectively. The
treated samples were collected at 3rd
, 5th, 7
th and 9
th day to measure the above
mentioned parameters. In 9th day, the maximum removal of TDS (71.44%), COD
(84.66%), BOD5 (69.16%), phosphate (55.16%) was observed and pH and EC were
7.28±0.2 and 6.49±0.11mS/cm, respectively. Therefore, it revealed that the activated
carbon produced from PET waste materials effectively removed the above mentioned
parameters from leachate and considered as an efficient medium for the treatment of
MSW leachate.
Keywords: Activated carbon, Landfill, Leachate, Municipal solid waste, PET bottles.
Introduction
Solid waste specially Municipal Solid Waste (MSW), is a major growing problem in
urban areas of Sri Lanka and this problem arises due to the absence of proper solid
waste management system in the country. In many instances solid waste is collected in
Proceedings of the 2nd International Symposium on Agriculture (ISA-2019)
Eastern University, Sri Lanka
49
mixed state without proper waste separation and dumped in environmentally very
sensitive places like road sides, marshy lands, low laying areas, public places, forest
and wild life areas, and near to water sources etc. Those will cause numerous negative
environmental impacts such as air pollution, soil pollution, ground water and surface
water pollution. Also, improper solid waste management reduces the aesthetic value
and scenic beauty of the environment and open dumping sites act as ideal places for the
breeding of disease vectors like mosquitoes, flies, rats, and rodents.In solid waste,
mainly plastic waste namely polyethylene terephthalate (PET) which is most
commonly associated with plastic drink bottles, is one of the major problems of our
society (Adibfar et al., 2017). The current PET consumption rate constitutes a relevant
environmentally unsustainable problem due to the huge amount of solid waste
produced and to its low bio- and photo degradability. The rate of waste generation in
the society is increasing with the increase of population, technical development, and
changes of the life style of the people. National Strategy for Solid Waste Management
(NSSWM) has shown the importance of focusing on waste avoidance, reduction, reuse,
recycling and final disposal in an environmentally sound manner and still giving higher
priority for waste recycling over disposal. And also it is very important to separate
waste at the source of generation to different components to facilitate subsequent waste
management practice, especially recycling. In Sri Lanka, MSW generation per day is
around 6400 tons (Madhushan et al., 2011) and according to statistics of National Solid
Waste Management Support Centre (NSWMSC), 10,497 tons of waste generated per
day in the year 2014. In Eastern province, generates 785 tons waste per day
(NSWMSC, 2013). Percentage of MSW collection amount is 347 tons per day
(NSWMSC, 2013).Water scarcity is another most urgent environmental problem faced
in 21st century. Percolation of landfill leachate into the groundwater tables and aquifer
system poses a potential risk and potential hazards towards the public health and
ecosystem. Production of activated carbon from waste PET bottles is an efficient
method for recycling PET bottles (Adibfar et al., 2017) as well as treating the MSW
landfill leachate. Thus, this study aimed to evaluate the efficiency of activated carbon
produced from PET waste materials for the treatment of leachate collected from
Koduwamadu MSW landfill.
Materials and Methods
Raw material collection
Polyethylene terephthalate (PET) waste bottles were collected from different areas in
Batticaloa. Bottles were washed thoroughly to eliminate the impurities.
Production of Activated Carbon from PET waste bottles by chemical activation
The vertical type cylindrical metal furnace (Length- 20cm and diameter- 3.5cm) was
constructed at the department of Agricultural Engineering, Eastern University, Sri
Lanka for the purpose of producing activated carbon. The PET bottle wastes were
crushed and sieved to obtain desired size fraction (1-3 mm) using conventional sieve-
shaker. Then, 20-25g of raw PET was placed in a metal furnace. The furnace was
heated to 500˚C under N2 gas (99.99%) flow pass through the tube and remained in this

Proceedings of the 2nd International Symposium on Agriculture (ISA-2019)
Eastern University, Sri Lanka
50
temperature for 1.5hours and the system was cooled overnight. 100g of char obtained
was soaked in KOH solution at impregnation ratio of 1:1 (W/V) for 24 hours. The
mixture was dehydrated in an oven overnight at the temperature of 105˚C. Thereafter,
sample was activated at the temperature of 500˚C for 15minutes. The product was
cooled to room temperature and washed using distilled water to remove the remaining
chemical until the pH become around 6-7. The final product was crushed and sieved to
get powdered activated carbon (typical diameter of less than 0.074mm (Metcalf and
Eddy, 2003).
Production rate of activated carbon
50g of crushed raw PET waste was used as an input and after the carbonization obtains
char (output) was weighted.
Production rate of activated carbon was calculated using following equation:
Production rate of activated carbon= Amount of activated carbon obtained (g) *100
Amount of raw PET waste used (g)
Landfill leachate collection and Analysis
Leachate samples were collected from koduwamadu Municipal solid waste landfill in
Batticaloa and analyzed for the water quality parameters of TDS, COD, BOD5,
phosphate pH, and EC. Collected samples were analyzed by standard methods and
equipments as given in Table 1. Laboratory analysis was conducted at the Department
of Agricultural Engineering, Faculty of Agriculture, Eastern University, Sri Lanka.
Table 1: Methods/instrument to analyze chemical and physical properties of leachate Parameters Method/ Instrument
pH Portable pH meter (Model-EUTEC pH-700)
Electrical Conductivity Portable pH meter (Model-EUTEC pH-700)
Total Dissolved Solid (TDS) Oven dry method
Chemical oxygen demand (COD) Back titration method
Biochemical oxygen demand (BOD) Electrometric method
Phosphate Spectrophotometric method (Model – Genesis
10S UV-Vis)
Treatment of landfill leachate by activated carbon and effluent analysis
Adsorption experiments were performed in a 250ml of conical flask. 250ml of leachate
sample was poured in to 7g of activated carbon in a conical flask. The effluent from
conical flask was collected at 3rd
, 5th, 7
th, and 9
th day interval and analyzed for different
water quality parameters. The experiment was laid out in a complete randomized
design (CRD). There were four treatments (T1- 3rd
, T2-5th, T3-7
th, T4-9
th day) based on
the retention time and each treatment has three replicates. The data were statistically
analyzed by SAS software (SAS version 9.1.3).

Proceedings of the 2nd International Symposium on Agriculture (ISA-2019)
Eastern University, Sri Lanka
51
Result and Discussion
Production rate of activated carbon
Amount of raw PET waste used (input) = 50g
Amount of activated carbon obtained (output) = 13.96g
Production rate of activated carbon= Amount of activated carbon obtained (g) *100
Amount of raw PET waste used (g)
= 13.96g *100
50g
= 27.92%
Leachate quality
Table 2: Changes of MSW landfill leachate quality parameters with retention time Parameters Initial 3rd Day 5th Day 7th Day 9th day
pH 8.543±0.072 7.84±0.03 7.52±0.02 7.44±0.03 7.28±0.2
TDS (mg/l) 5846.66±55.76 5122.66±31.18 3637.2±23.31 2473.1±3.04 1669±65.54
BOD5
(mg/l)
360±2.88 282±8.386 172.66±4.05 133.66±3.38 111.67±2.72
COD
(mg/l)
2112.66±2.90 1536±18.475 954.667±3.528 567.33±11.795 339.33±9.821
Phosphate
(mg/l)
16.93±0.1 13.86±0.07 11.54±0.19 9.21±0.05 7.59±0.22
EC
(mS/cm)
10.3±0.11 9.09±0.06 8.04±0.22 7.28±0.09 6.49±0.11
Values are means ± standard error of replicate determination.
Table 2 shows the changes of MSW landfill leachate‟s quality parameters with
retention time from initial to 9th day. All the tested parameters showed significant
reduction from initial value to 9th day.
Total dissolved solids (TDS)
Initial and final TDS present in the leachate were 5846.66±55.82mg/l and
1669±65.54mg/l respectively. The removal efficiency was 12.38%, 37.79%, 57.70%,
and 71.44% at 3rd
, 5th, 7
th, and 9
th day, respectively. Removal of TDS was achieved by
ion-exchange. CEA permissible level of TDS in treated wastewater to be
discharged into inland water bodies is 2100mg/l. In this activated carbon treatment,
the treated leachate had the TDS about 1669±65.54mg/l. Thus, the activated carbon
treatment for TDS removal is considered as an efficient method.
Proceedings of the 2nd International Symposium on Agriculture (ISA-2019)
Eastern University, Sri Lanka
52
Chemical oxygen demand (COD)
The initial COD of landfill leachate was 2112.66mg/l. The measured value was
considerably higher than the standard limit (CEA permissible level of COD in treated
wastewater to be discharged into inland water bodies is 250mg/l). COD reduction with
retention time is given in Table 2. COD was reduced to 1536±18.475mg/l,
954.667±3.528mg/l, 567.33±11.795mg/l, 339.33±9.821mg/l at 3rd
, 5th, 7
th and 9
th day,
respectively. In 9th day, percentage of COD removal was 84.66% but the amount of
COD in treated leachate in 9th day was higher than the CEA permissible level. In 3
rd
day, the COD removal was 30.58% and the removal efficiency increased with retention
time but the rate of removal was decreased. It was mainly due to an accumulation of
non-biodegradable organic compounds present in the system (Aghamohammadi et al.,
2007).
Biochemical oxygen demand (BOD5)
BOD is the measure of biodegradable organic mass of leachate and that indicates the
maturity of the landfill which typically decreases with time (Qasim and Chaiang,
1994). Initial value of BOD of leachate was 360±2.887mg/l and in 9th day, it was
reduced to 111.67±2.72mg/l. In 9th day, the BOD removal was attained to 69.16%. In
this study, the maximum rate of BOD removal achieved at 5th day was 52.22%.
Following days, the BOD removal increased but the rate of removal was decreased.
Lavrova and Koumanova (2013) also reported that the elimination of BOD occurs fast
in most cases during the initial six days.
Phosphate
In nature, phosphorus usually exists as part of a phosphate molecule (PO43-
) (APHA,
1992). The initial phosphate of leachate was 16.93±0.1mg/l. Phosphate was reduced to
13.86±0.07mg/l and 7.59±0.22mg/l in 3rd
and 9th
day (Table: 2). In 9th day, phosphate
removal was attained to 55.16%. Uygur and Kargi (2004) indicated that the leachate
phosphate removal by commercial activated carbon is achieved 44%. It showed that
our prepared activated carbon exhibited better performance than commercial activated
carbon. In 9th day, phosphate in the treated effluent was 7.59±0.22mg/l, but it was more
than the standard limits of CEA (CEA permissible level of phosphate in treated
wastewater to be discharged into inland water bodies is 5mg/l.)
pH
Leachate is generally found to have pH between 4.5 and 9 (Christensen et al., 2001).
The mean initial pH was 8.54±0.07, it indicated that the landfill is in the methanogenic
phase. During this phase characteristic pH value of leachate is close to 8 (Granet et al.,
1986). The changes in pH with retention time were clearly shown in the Table: 2. pH of
effluent at 9th
day became closer to the neutral value. Treatment of activated carbon
showed significant reduction in pH (7.28±0.2). The pH of effluent from activated
carbon treatment met the CEA standards of maximum permissible limit (6.5-8.5).
Electrical Conductivity (EC)
Conductivity is a measure of water‟s capability to pass electrical flow. This ability is
directly related to the concentration of ions in the water (Wetzel, 2001). These
conductive ions come from dissolved salts and inorganic materials such as alkalis,
Proceedings of the 2nd International Symposium on Agriculture (ISA-2019)
Eastern University, Sri Lanka
53
chlorides, sulfides and carbonate compounds (Langland and Cronin, 2003). The initial
EC of leachate sample was 10.3mS/cm and final was 6.49mS/cm in 9th day.
Conductivity is generally influenced by the total amount of dissolved organic and
inorganic materials present in the solution, and is used to demonstrate the degree of
salinity and mineral contents of leachate (Naveen et al., 2014).
Conclusions
The results of the study showed that the activated carbon produced from PET
waste materials have an ability to treat landfill leachate. Production rate of
activated carbon was obtained as 27.92%. The initial mean values of leachate during
this study period were 8.543±0.072, 846.66±55.76mg/l, 360±2.88mg/l,
2112.66±2.90mg/l, 16.93±0.1mg/l and 10.3±0.11mS/cm for pH, TDS, BOD5, COD,
phosphate and EC, respectively. In 9th
day, the maximum removal of TDS
(71.44%), COD (84.66%), BOD5 (69.16%), phosphate (55.16%) was achieved
and changes in pH and EC were 7.28±0.2 and 6.49±0.11mS/cm, respectively. The
activated carbon treatment exhibited more efficient in the removal of TDS, COD and
pH from the MSW landfill leachate. However, COD, BOD5, phosphate, EC were
higher than maximum permissible limits of CEA standard for safe discharge
wastewater into inland water bodies. Finally, it is concluded that activated carbon is
an efficient material for the removal of TDS, COD and pH from the leachate
compare to other parameters which were investigated.
References
Adibfar, M., Kaghazchi, T., Asasian, N. and Soleimani, M. (2014). Conversion of poly
(ethylene terephthalate) waste into activated carbon: chemical activation and
characterization. Chemical Engineering & Technology, 37(6): 979-986.
Aghamohammadi, N., HAMIDI, A.A., Hasnain, I.M., ZINATIZADEH, A., NASR,
E.S.H. and Ghafari, S. (2007). Performance of a Powdered Activated Carbon
(PAC) Augmented Activated Sludge Process Treating Semi-Aerobic Leachate. Int.
J. Environ. Res, 1(2): 1-8.
APHA, (1992). Standard methods for the examination of water and
wastewater. 18th ed. American Public Health Association, Washington, DC.
CEA, Central Environmental Authority. (2008). Retrieved July 2018, from Central
Environmental Authority Sri Lanka: https://www.cea.lk /web/images
/pdf/Guidlines-on-solid-waste-management.pdf.
Christensen, T.H., Kjeldsen, P., Bjerg, P.L., Jensen, D.L., Christensen, J.B., Baun, A.,
Albrechtsen, H.J. and Heron, G. (2001). Biogeochemistry of landfill leachate
plumes. Applied geochemistry, 16(7-8): 659-718.
Proceedings of the 2nd International Symposium on Agriculture (ISA-2019)
Eastern University, Sri Lanka
54
Granet, C., Courant, N., Millot, N., Rousseau, and Navarro, N. (1986). Diagnostic
detrailabilite dex lixivials: definition d‟une methodologie,L‟Eau et l‟ Industrie.
Janvier.
Langland, M., and Cronin, T. (2003). A Summary Report of Sediment Processes in
Chesapeake Bay and Watershed. USGS Science, 1-99.
Lavrova, S., and Koumanova, B. (2013). Nutrients and organic matter removal in a
vertical-flow constructed wetland. Applied Bioremediation-Active and Passive
Approaches. Intech Open Science Online Publisher, Croatia, 69-99.
Madhushan, K.G.W., and Fujiwara, T. (2011). Survey of residents‟ willingness to
separate waste collection and improvement of waste management in Sri Lanka.
Metcalf, E.,and Eddy, H. P. I. (2003). Wastewater Engineering: Treatment and reuse.
(4Th Edition ed.). Newyork: McGraw Hiil Education.
Naveen, B. P., Sivapullaiah, P. V., and Sitharam, T. G. (2014). Characteristics of a
municipal solid waste landfill leachate. Proceedings of Indian Geotechnical
Conference (pp. 1-7). India: IGC.
Qasim, S. R., and Chaiang, W. (1994). Sanitory Landfill Leachate: Generation Control
and Treatment. Lancaster: Tecnomic Publication.
Uygur, A., and Kargi, F. (2004). Biological nutrient removal from pre-treated landfill
leachate in a seguencing batch reactor. J.Environ.Manage, 71: 9-14.
Wetzel, R. G. (2001). Limnology: lake and River Ecosystem (3rd Edition). San Diego,
CA: Academic Press.
Proceedings of the 2nd International Symposium on Agriculture (ISA-2019)
Eastern University, Sri Lanka
55
ASSESSMENT OF PALMYRAH PALM DISTRIBUTION AND
DENSITY IN EAST AND SOUTH EAST OF VALIKAMAM REGION IN
JAFFNA PENINSULA USING VERY HIGH RESOLUTION
SATELLITE IMAGES
S. Nareshkumar1, Nalina Gnanavelrajah
2and S. Raveendran
3*
1Department of Agriculture, Northern Province 2Department of Agricultural Chemistry, Faculty of Agriculture, University of Jaffna
3Department of Geography, University of Jaffna
*Corresponding Author Email: [email protected]
Abstract
Palmyrah palms are considered very valuable plant species because of its ecological
and economic values derived by environment and people in Jaffna region. It is clearly
witnessed that the number and distribution of palmyrah plants have been declining due
to destructions of the plants for various purposes. There are no reliable and up to date
data on the number, density and distribution of palmyrah plants in the region which are
essential for conservation, management and development of palmyrah plants.
Conventional methods of counting the plants have many shortcomings and new
methods are experimented to inventorize the plants. This research has been undertaken
to inventorize the number and distribution of plants using visual interpretation of high
resolution Quickbird satellite images of Valikamam East Region of Jaffna Peninsula.
The images used have multispectral resolution of 2.4 meters and panchromatic
resolution of 0.6 meters. Image enhancement techniques were used to improve the
lucidness of the image for visual image interpretation using Erdas Imagine 14 image
processing software. ArcMap 10.4 version was used to digitize the distribution of
plants from the image. Uduvil, Kopay, Nallur and Jaffna DS divisions were mapped
out for density and distribution of the plants. The data on number of plants which is 49,
746 were derived directly from the digitized data table and the densities of the plants
were calculated using geometric calculator functions in ArcMap. According to the
analysis, Kopay division had higher number of plants and Jaffna DS division has lower
number of plants. The Kopay Division has higher number of plants which is 20,800 in
9790 hectares. The Kopay South GN Division has higher density of plants which is
1831. In Uduvil Division, there are 17,676 plants in 2131 hectares and Erlalai Division
has higher density of plants which is 1925. Nallur division has 10,243 plants in 3441
hectares and Ariyalai GN Division has higher density of plants which is 6542. Jaffna
DS division has lower number of plants in the study area which is 1027 and Small
Bazaar GN Division has 331 plants. This method of visual interpretation had few
shortcomings of time and confusion in the identification of the canopy of palmyrah
plants. Numbers of random locations were clarified from ground samples to verify the
accuracy of the classification which has proved that the mapping was 99% accurate.
This method of inventory consumed more time and few plants were not mapped due to
the indiscriminate nature of green vegetation cover. There are object based image
Proceedings of the 2nd International Symposium on Agriculture (ISA-2019)
Eastern University, Sri Lanka
56
classification methods which can be used to classify the high resolution satellite images
for object identification.
Keywords: Palmyrah Palm, Remote Sensing, High Resolution Images, Visual
Classification
Introduction
Palmyrah plants in Jaffna Peninsula and other parts of the North and Eastern Provinces
of Sri Lanka which entail greater ecological and economic values to the environment
and the society, have been threatened due to the prolonged war and unplanned
development. Palmyra palm known as Borassus flabellifer botanically, is a tropical
plant type grow in arid and marginal lands without cultivation or irrigation, is an
important component of the environment in the region that enrich the environment and
economy. The plants do not require irrigation, manure and protection. Palmyra palm
creates substantial extent of green cover and provides ecosystem services in Jaffna
Peninsula. The palm generates direct and indirect economic opportunities for people in
the region. It was roughly estimated that there were 7 million plants in 1980s in nearly
40,000 hectares of lands, out of which substantial numbers of plants have been fell
down and the current distribution is unknown.
Field observation shows that the density and distribution have been declined in various
parts of Jaffna Peninsula. The global conditions of environmental vulnerabilities are the
cumulative outcome of local events like these in Jaffna and other areas. Environmental
resources in Jaffna have played an important role to create economic opportunities and
in recent times, the losses of the plant vegetation have deprived the economic potentials
for development. The economic and environmental revival requires local action. Since
Jaffna Peninsula consist of larger areas of marginal lands combined with water
scarcity, palmyra palms are very suitable plant types that can be planted and it will help
to improve the environmental quality. Planning, management and development of
palmyra plants in Jaffna require data on the distribution and density of palmyra plants.
The public policy and institutional capacities concerned with environmental
conservation and management, there is no any consolidated efforts to gather data and
take measures to revive the resources of palmyra plants. Since the conventional
methods of collecting data about plants require larger amount of financial and human
resources with substantial time span. Space based remote sensing techniques provide
very cost effective and accurate methods to count the palmyra plants and gather data on
the distribution and density of palmyra plant vegetation. Very high resolution satellite
images of the study area acquired by Quickbird satellite in 2016. This study was
conducted by three researchers covering four Divisional Secretariat Divisions of
16,438 hectares; namely Uduvul, Kopay, Nallur and Jaffna, divided into 129 Grama
Niladhari Divisions. The research was conducted from February to July in 2017. 16
random samples were selected from the map and they were checked on the ground for
accuracy which conformed to 99.22% to the ground situation.
Proceedings of the 2nd International Symposium on Agriculture (ISA-2019)
Eastern University, Sri Lanka
57
Research Problem
Distribution and density of palmyra plants have environmental, economic and social
implications at local, regional, national and global level. Palmyra plants play a pivotal
role in the local and regional contexts of Jaffna peninsula improving the ecosystem and
economic system more resilient. The plants are part of the system that creates the
ecosystem of the region and they are very valuable resources. The plants have been fell
down for various purposes and destroyed during the war in the region. There are no
proper replantation schemes to replace loses. Larger number of people depends on
economical and material needs on the plants. There is no any clue about the number
and distribution of palmyra plants in the region since no any enumeration was
undertaken in this regard. The palmyra plant resources must be improved in order to
promote the economy of the region. Development of palmyra resources requires the
data and information on the distribution and density of palmyra plants. There is no any
institution in the region that has any of these data that can be used for decisions related
to the management of the plants. There should be a system to manage the palmyra
plants which require data and information about the plants. Conventional methods of
enumeration have many inconveniences and short comings. Conventional methods of
inventorizing the plants will require longer period of time, larger number of
enumerators and huge financial resources. An effective method of enumeration was
required with higher accuracy and low cost which is where the satellite images have
played a role for inventorizing the plants.
Research Objectives
This research has been undertaken to complete the following objectives related to
palmyra plants in the 4 Divisional Secretariat Divisions in Jaffna. The objectives are;
To map out the distribution of Palmyra plants in Uduvil, Kopay, Nallur and
Jaffna DS Divisions using high resolution satellite images
To assess the density of Palmyra plants in the above DS Divisions
Research Methodology
This research began with reviewing researches conducted in the region relevant to
palmyra plants and researches done in foreign countries. There were researches carried
out in the region and 15 researches conducted in foreign countries were reviewed to
critically assesse the research gap and devise methods for this research.
Data and specification
There are sophisticated methods and techniques available for collecting data about
different vegetation. For this research, high resolution satellite images have been used
to extract information on distribution of palmyra plants. There are satellite images with
different resolutions which are useful for various contexts and uses. Images from Quick
bird satellite were acquired for this purpose in multi spectral and panchromatic bands.
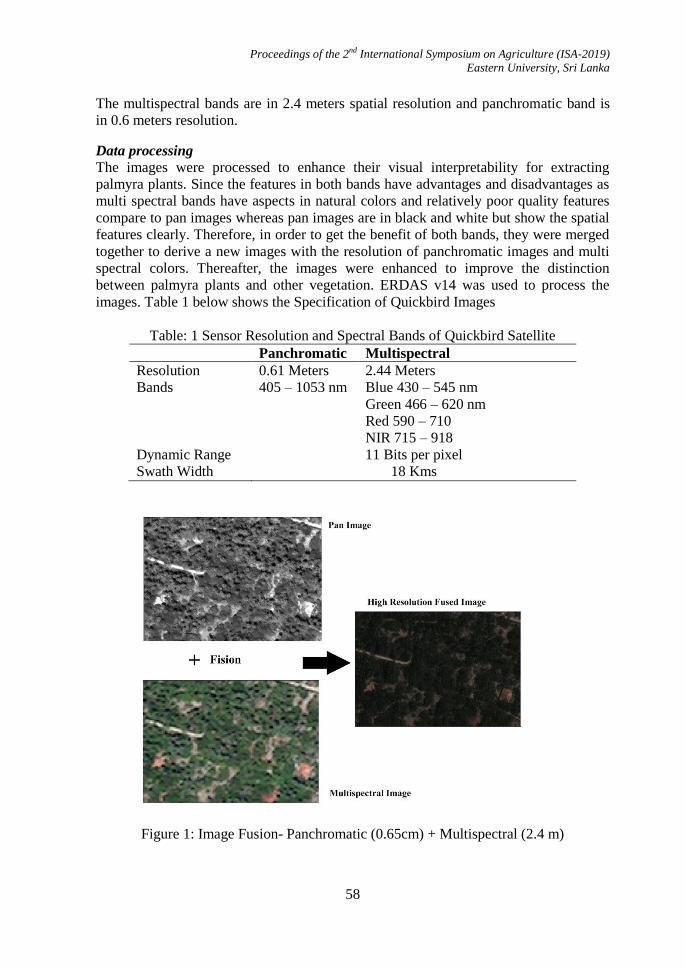
Proceedings of the 2nd International Symposium on Agriculture (ISA-2019)
Eastern University, Sri Lanka
58
The multispectral bands are in 2.4 meters spatial resolution and panchromatic band is
in 0.6 meters resolution.
Data processing
The images were processed to enhance their visual interpretability for extracting
palmyra plants. Since the features in both bands have advantages and disadvantages as
multi spectral bands have aspects in natural colors and relatively poor quality features
compare to pan images whereas pan images are in black and white but show the spatial
features clearly. Therefore, in order to get the benefit of both bands, they were merged
together to derive a new images with the resolution of panchromatic images and multi
spectral colors. Thereafter, the images were enhanced to improve the distinction
between palmyra plants and other vegetation. ERDAS v14 was used to process the
images. Table 1 below shows the Specification of Quickbird Images
Table: 1 Sensor Resolution and Spectral Bands of Quickbird Satellite
Panchromatic Multispectral
Resolution 0.61 Meters 2.44 Meters
Bands 405 – 1053 nm Blue 430 – 545 nm
Green 466 – 620 nm
Red 590 – 710
NIR 715 – 918
Dynamic Range 11 Bits per pixel
Swath Width 18 Kms
Figure 1: Image Fusion- Panchromatic (0.65cm) + Multispectral (2.4 m)

Proceedings of the 2nd International Symposium on Agriculture (ISA-2019)
Eastern University, Sri Lanka
59
There are mainly two methods used to extract information; visual interpretation and
digital interpretation. This research has employed the visual interpretation methods
Visual Interpretation and Data collection
The palmyra plants were extracted through visual image interpretation using ArcMap
software. The images of the respective DS divisions were carefully inspected manually
and palmyra plants were traced using digitizing tools embedded in ArcMap software.
All plants in the four DS Divisions were digitized and collected in shapefile format.
Location of every plant and a attribute table for the plant was developed in the process.
Distribution of palmyra plants were in each DS Division was worked out by overlaying
GN Division Maps on the palmyra plant layer. The points that fall within the GN
Divisions were calculated and obtained as the number of plants in that particular GN
Division. The density of palmyra plants were calculated using the plant layer and GN
Division data. The numbers of palmyra plants were divided by the extent of each GN
Division. This density was calculated using the arithmetic operator facilities available
in the attribute data of the plant layer.
Results and discussion
Distribution and density of palmyra plants in four DS Divisions; Uduvil, Kopay, Jaffna,
Nallur were obtained from the above analysis of satellite images. The following data
extracted from the images show the distribution and density of the plants in the
respective divisions.
Palmyra Palm Distribution in Uduvil DS Division
Figure 2: Distribution of Palmyra plants in Uduvil DS division in Jaffna- 2016
There are 17,676 plants in 2131 hectares of land covered by 30 GN Divisions. Highest
numbers of plants of 1925 exist in Erlalai North GN Division and lowest number 20
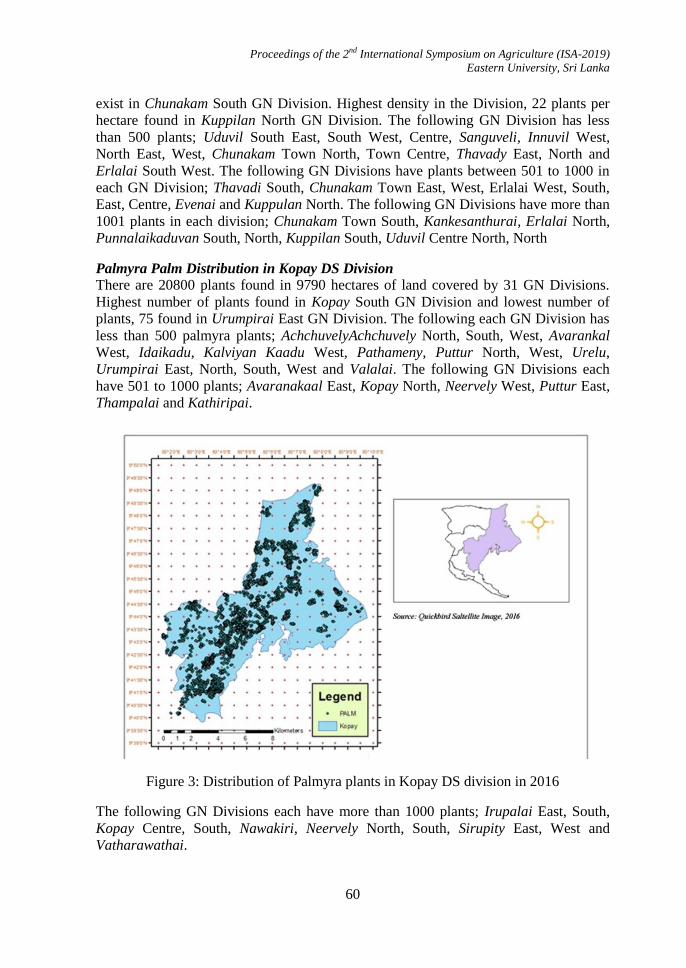
Proceedings of the 2nd International Symposium on Agriculture (ISA-2019)
Eastern University, Sri Lanka
60
exist in Chunakam South GN Division. Highest density in the Division, 22 plants per
hectare found in Kuppilan North GN Division. The following GN Division has less
than 500 plants; Uduvil South East, South West, Centre, Sanguveli, Innuvil West,
North East, West, Chunakam Town North, Town Centre, Thavady East, North and
Erlalai South West. The following GN Divisions have plants between 501 to 1000 in
each GN Division; Thavadi South, Chunakam Town East, West, Erlalai West, South,
East, Centre, Evenai and Kuppulan North. The following GN Divisions have more than
1001 plants in each division; Chunakam Town South, Kankesanthurai, Erlalai North,
Punnalaikaduvan South, North, Kuppilan South, Uduvil Centre North, North
Palmyra Palm Distribution in Kopay DS Division
There are 20800 plants found in 9790 hectares of land covered by 31 GN Divisions.
Highest number of plants found in Kopay South GN Division and lowest number of
plants, 75 found in Urumpirai East GN Division. The following each GN Division has
less than 500 palmyra plants; AchchuvelyAchchuvely North, South, West, Avarankal
West, Idaikadu, Kalviyan Kaadu West, Pathameny, Puttur North, West, Urelu,
Urumpirai East, North, South, West and Valalai. The following GN Divisions each
have 501 to 1000 plants; Avaranakaal East, Kopay North, Neervely West, Puttur East,
Thampalai and Kathiripai.
Figure 3: Distribution of Palmyra plants in Kopay DS division in 2016
The following GN Divisions each have more than 1000 plants; Irupalai East, South,
Kopay Centre, South, Nawakiri, Neervely North, South, Sirupity East, West and
Vatharawathai.
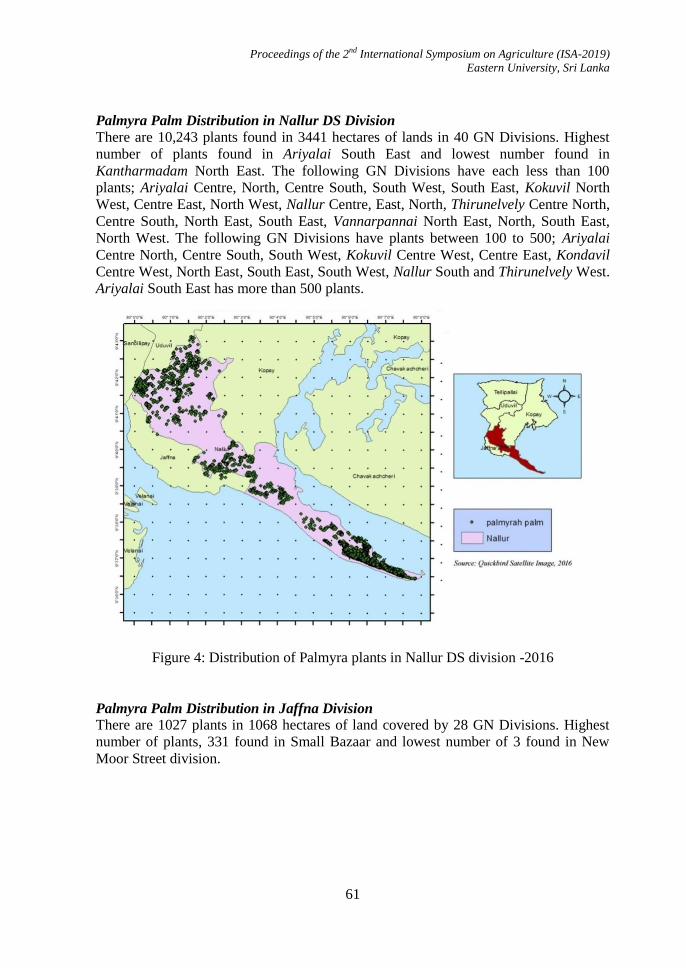
Proceedings of the 2nd International Symposium on Agriculture (ISA-2019)
Eastern University, Sri Lanka
61
Palmyra Palm Distribution in Nallur DS Division
There are 10,243 plants found in 3441 hectares of lands in 40 GN Divisions. Highest
number of plants found in Ariyalai South East and lowest number found in
Kantharmadam North East. The following GN Divisions have each less than 100
plants; Ariyalai Centre, North, Centre South, South West, South East, Kokuvil North
West, Centre East, North West, Nallur Centre, East, North, Thirunelvely Centre North,
Centre South, North East, South East, Vannarpannai North East, North, South East,
North West. The following GN Divisions have plants between 100 to 500; Ariyalai
Centre North, Centre South, South West, Kokuvil Centre West, Centre East, Kondavil
Centre West, North East, South East, South West, Nallur South and Thirunelvely West.
Ariyalai South East has more than 500 plants.
Figure 4: Distribution of Palmyra plants in Nallur DS division -2016
Palmyra Palm Distribution in Jaffna Division
There are 1027 plants in 1068 hectares of land covered by 28 GN Divisions. Highest
number of plants, 331 found in Small Bazaar and lowest number of 3 found in New
Moor Street division.

Proceedings of the 2nd International Symposium on Agriculture (ISA-2019)
Eastern University, Sri Lanka
62
Table 2: Distribution of Palmyrah Plants in the Study area
Level of Distribution Number of Plants Number of GN Divisions
Very Low < 400 90
Low 401 – 800 18
Medium 801 – 1200 10
High 1201 – 1600 07
Very High > 1600 04
Table: 3 Density of Palmyrah Plants in the Study Area
(Number of Plants per Hectare)
Level of Density Number of Plants Number of Divisions
Very Low 0 – 2 79
Low 3 – 4 23
Medium 5 – 7 18
High 8 – 10 08
Very High > 10 01
Figure 5: Density of Palmyra plants in East and South East of Valikaamam Region
2016 (Source: Quickbird Satellite Image, 2016)
Accuracy Assessment
Analysis and data extraction from remotely sensed images require ground verification
to verify its accuracy. Randomly selected 16 patches from the map were used for
ground verification. The corner coordinates of each isolated patches were used to find
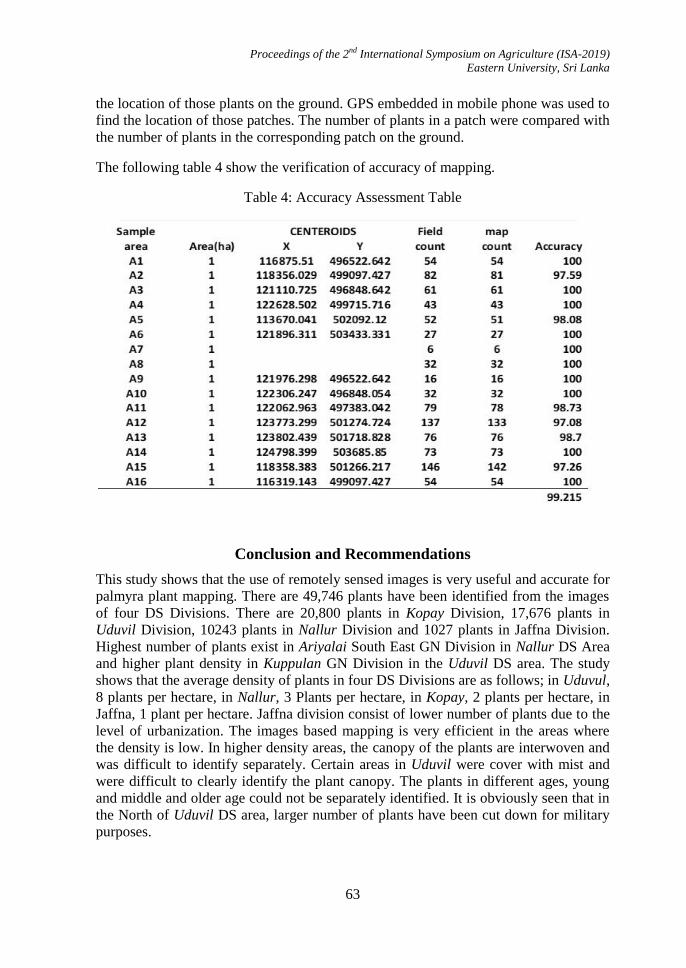
Proceedings of the 2nd International Symposium on Agriculture (ISA-2019)
Eastern University, Sri Lanka
63
the location of those plants on the ground. GPS embedded in mobile phone was used to
find the location of those patches. The number of plants in a patch were compared with
the number of plants in the corresponding patch on the ground.
The following table 4 show the verification of accuracy of mapping.
Table 4: Accuracy Assessment Table
Conclusion and Recommendations
This study shows that the use of remotely sensed images is very useful and accurate for
palmyra plant mapping. There are 49,746 plants have been identified from the images
of four DS Divisions. There are 20,800 plants in Kopay Division, 17,676 plants in
Uduvil Division, 10243 plants in Nallur Division and 1027 plants in Jaffna Division.
Highest number of plants exist in Ariyalai South East GN Division in Nallur DS Area
and higher plant density in Kuppulan GN Division in the Uduvil DS area. The study
shows that the average density of plants in four DS Divisions are as follows; in Uduvul,
8 plants per hectare, in Nallur, 3 Plants per hectare, in Kopay, 2 plants per hectare, in
Jaffna, 1 plant per hectare. Jaffna division consist of lower number of plants due to the
level of urbanization. The images based mapping is very efficient in the areas where
the density is low. In higher density areas, the canopy of the plants are interwoven and
was difficult to identify separately. Certain areas in Uduvil were cover with mist and
were difficult to clearly identify the plant canopy. The plants in different ages, young
and middle and older age could not be separately identified. It is obviously seen that in
the North of Uduvil DS area, larger number of plants have been cut down for military
purposes.
Proceedings of the 2nd International Symposium on Agriculture (ISA-2019)
Eastern University, Sri Lanka
64
The mapping based on very high resolution satellite images must be extended to other
areas of the peninsula and other parts of the country. There are very high resolution
images than Quickbird images such as Worldview 3 and Worldview 4 which have 30
centimeter panchromatic resolutions. In it easier and more precise to demarcate
palmyra plants from Worldview images. Another recommendation is that the object
based image analysis software such as eCognition can be used to identify the palmyra
plant areas more accurately. The manual identification in this method take relatively
more time to complete. Object based Image Analysis software will automatically detect
and create map data. Drone mapping also is recommended because of the minimized
cost. This drone mapping can be continued to other areas with the initial and operating
cost.
References
Anon. (1972). Report of palmyrah Industry committee, ministry of plantations
Industries and Constitutional Affairs, Srilanka.
Guérin, M.; Mouton, J.-F. (2002) The individual tree crown approach applied to
IKONOS images of a coniferous plantation area, Remote Sensing, Geo-Informatics
and Space Technology Development Agency.
Gougeon, F.; Labrecque, P.; Guérin, M.; Leckie; A.; Dawson, A. (2001) Specialized
forest inventory from an IKONOS image, In Proc. 23rd Canadian Symposium on
Remote Sensing
Heywood, I., Cornelius, S., and Carver, S. (2006). An Introduction to Geographical
Information Systems. 3rd edition: Prentice Hall.
Labrecque, P.; Gougeon, F.; Guérin, M.; Mouton, J.-F. (2002) ITC species
classification and regrouping with an IKONOS image, Remote Sensing, Geo-
Informatics and Space Technology Development Agency
Preesan Rakwatin (2014) Oil Palm Tree Detection with High Resolution Multi-Spectral
Satellite Imagery, Remote Sensing, Geo-Informatics and Space Technology
Development Agency
Theivendirarajah, K. (2008). Palmyrah Palm (Borassus flabellifer.L) A Monograph. 37,
Roxanne crescent, scarbough, Ontario M1V4J5. Canada.
Proceedings of the 2nd International Symposium on Agriculture (ISA-2019)
Eastern University, Sri Lanka
65
SPATIAL VARIATION OF WATER QUALITY OF THE UNNICHCHAI
RIGHT BANK CANAL IN BATTICALOA DISTRICT
M. Pavithra*, M. Sugirtharan and M. Rajendran
Department of Agricultural Engineering, Faculty of Agriculture, Eastern University, Sri Lanka
*Corresponding author: [email protected]
Abstract
Over the past decades, quality of irrigation water has become a serious issue faced by
the agricultural sector all over the world. Poor quality of irrigation water adversely
affects both soil quality and crop production. Hence, irrigating the crops with good
quality water is vital to get optimum crop yield without affecting soil quality.
Unnichchai is one of the major irrigation systems in Batticaloa district. Great spatial
and temporal variations in paddy yield were observed in this system. Among several
factors, quality of irrigation water has great influence on crop yield. In the above
context, the present study aimed at assessing the suitability of Right Bank (RB) canal
water of Unnichchai irrigation system for irrigation purpose. Water samples were taken
at 1 km interval along the RB canal during cultivation and harvesting periods in Yala
season and analyzed for some important quality parameters. It was found that the
quality of RB canal water varies along the canal. Seasonal variation was also observed
and the variation was significant at some places. The pH of canal water varied from
6.72-7.55 indicating slightly acidic in nature. The range of Electric Conductivity (EC),
Total Suspended Solids (TSS), Total Dissolved Solids (TDS) and PO43-
was lower than
the maximum acceptable limit for irrigation purpose. In addition, the derived quality
parameters such as RSC, SAR and SSP were varied from 0.048 me/l to 0.48 me/l, 0.07
to 1.48 and 8.8% to 46.2%, respectively. The Ca2+
/Mg2+
ratio of samples was found as
more than one. It was observed that the level of these quality parameters was more or
less constant up to 15 km from the tank and thereafter increased substantially and
reached the maximum level at tail end. In overall, RB canal water is safe for irrigation
in Yala season. However, appropriate management intervention must be implemented
to avoid further deterioration of canal water especially 15 km from tank to the canal
distance up to tail end.
Keywords: Irrigation, Unnichchai irrigation scheme, Water quality
Introduction
Supply of good quality irrigation water is critical to obtain optimum crop yield while
maintaining soil fertility, ecological balance and human health. Poor quality of
irrigation water adversely affects both soil quality and crop production (Bello, 2001).
Therefore, ensuring water quality in an irrigation system is vital to ensure the
sustainable yield. In the dry season, high nutrient enrichment cause eutrophication
Proceedings of the 2nd International Symposium on Agriculture (ISA-2019)
Eastern University, Sri Lanka
66
which affects the quality of water in water bodies especially in dams, canals, or slow
flowing shallow rivers.
Soluble salts are the major factor to determine the irrigation water quality. The
concentration and proportion of these dissolved ions determine the suitability of water
for irrigation purpose (Ajayi et al., 1990). The amount and characteristics of these
dissolved salts depend on the source and chemical composition. The most ordinarily
dissolved ions in water are sodium (Na+), magnesium (Mg
2+), calcium (Ca
2+), sulphate
(SO42+
), nitrate (NO32-
), chloride (Cl-), carbonate (CO3
2-) and bicarbonate (HCO3
-)and
their concentration may change the salt concentration. There are three major types of
irrigation water quality related problems which are salinity, solidity and toxicities. Use
of problematic water for irrigation deteriorates soil properties (Ghafoor et al., 1997;
Qureshi and Masih, 2002), and reduces crop yields.
Unnichchai is one of the major irrigation systems in Batticaloa district. It supplies
irrigation water through left bank (LB) and right bank (RB) canals. This canal water is
being polluted by number of pollution sources. Animal wastes and agricultural runoff
directly reach irrigation canals as most of the paddy outlets are diverted into
Unnichchai irrigation canals. Further, excessive use of fertilizers has the potential of
being leached or washed into the canal. However, there is lack of information on the
quality of canal water in this irrigation system. In this view, the present study aimed at
assessing the quality of RB canal water and ascertaining its suitability for irrigation
purpose.
Materials and Methods
Description of study area
Unnichchai tank is one of the major irrigation tanks located at Unnichchai village of
Batticaloa district. The latitude and longitude of the tank are 7o 37' N and 81
o 33' E,
respectively. It supplies water through both RB and LB canals mainly for irrigation
purpose. The length of the RB and LB canals are 23 km and 13.2 km, respectively.
According to the Divisional Irrigation Engineer‟s Office, Rugam- Chenkalady (2018),
the RB canal supplies water to the command area of 3691 acres whilst LB canal
supplies water to the command of 4495 acres. This tank receives runoff water from the
catchment which is covered with thick jungle and grassland.
Sampling
In the present study, RB canal of Unnichchai irrigation system was selected. Canal
water samples were collected at 1 km interval starting from tank to tail end during
cultivation and harvesting periods in Yala season. Prior to water sampling, the
sampling bottles (one liter plastic bottles) were cleaned and rinsed with distilled water.
Those were then rinsed three times with the canal water at the time of sampling. Water
samples were collected at the mid-stream at the depth of 15-20 cm from the surface.
Figure 1 shows location of Unnichchai tank and sampling locations along the RB canal.
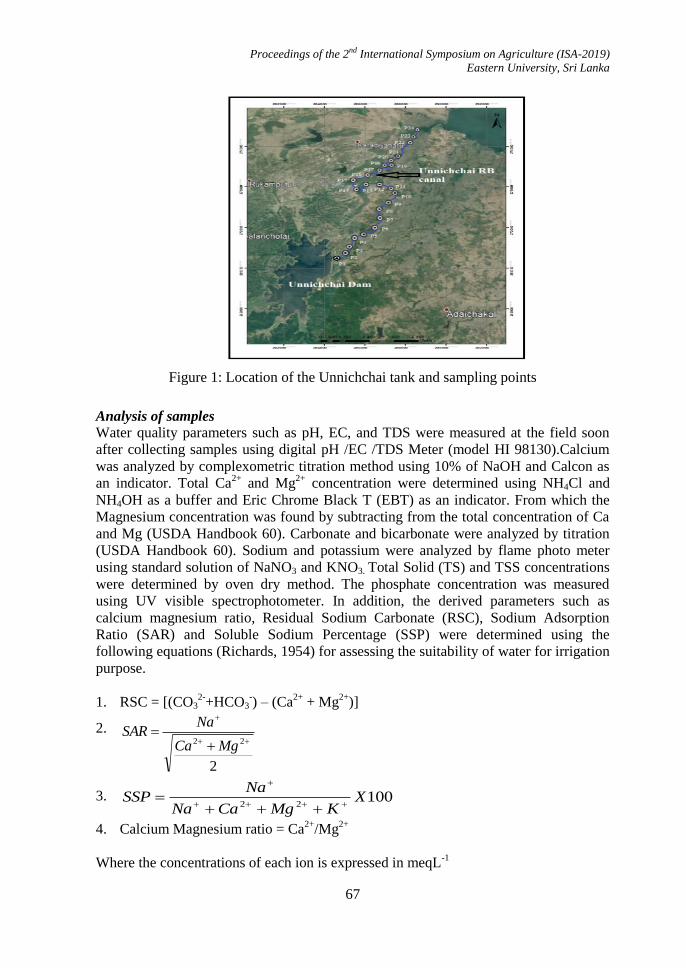
Proceedings of the 2nd International Symposium on Agriculture (ISA-2019)
Eastern University, Sri Lanka
67
Figure 1: Location of the Unnichchai tank and sampling points
Analysis of samples Water quality parameters such as pH, EC, and TDS were measured at the field soon
after collecting samples using digital pH /EC /TDS Meter (model HI 98130).Calcium
was analyzed by complexometric titration method using 10% of NaOH and Calcon as
an indicator. Total Ca2+
and Mg2+
concentration were determined using NH4Cl and
NH4OH as a buffer and Eric Chrome Black T (EBT) as an indicator. From which the
Magnesium concentration was found by subtracting from the total concentration of Ca
and Mg (USDA Handbook 60). Carbonate and bicarbonate were analyzed by titration
(USDA Handbook 60). Sodium and potassium were analyzed by flame photo meter
using standard solution of NaNO3 and KNO3. Total Solid (TS) and TSS concentrations
were determined by oven dry method. The phosphate concentration was measured
using UV visible spectrophotometer. In addition, the derived parameters such as
calcium magnesium ratio, Residual Sodium Carbonate (RSC), Sodium Adsorption
Ratio (SAR) and Soluble Sodium Percentage (SSP) were determined using the
following equations (Richards, 1954) for assessing the suitability of water for irrigation
purpose.
1. RSC = [(CO32-
+HCO3-) – (Ca
2+ + Mg
2+)]
2.
2
22
MgCa
NaSAR
3. 10022
XKMgCaNa
NaSSP
4. Calcium Magnesium ratio = Ca2+
/Mg2+
Where the concentrations of each ion is expressed in meqL-1

Proceedings of the 2nd International Symposium on Agriculture (ISA-2019)
Eastern University, Sri Lanka
68
Data Analysis Data analysis was performed using MS Excel 2010 and SPSS Statistical package
version 22.0.
Results and Discussion
pH
The pH of canal water ranged from 6.62-7.55 (mean value 6.9 ± 0.26) and 6.62 to 7.5
(mean value of 6.89 ± 0.22) during cultivation and harvesting period, respectively,
indicating that the water in the canal is slightly acidic in nature (Figure 2). The
maximum pH value of 7.55 was observed at the tail end whereas the lowest pH value
of 6.72 was observed at 10 km distance from the tank during cultivation period. The
corresponding values measured during harvesting period were 7.5 (at tail end) and 6.62
at 10 km from the tank. The pH value was almost constant up to 20 km during both
periods. However, a substantial increase in pH was observed from 20 km onwards.
This variation might be due to the land use pattern and the geology of the surrounding
area. During cultivation period, water from the paddy fields drains into the canal
through number of outlets which is containg nutrient rich water. Using chi- Square test
the pH value show the significant difference (p=0.001) and (p=0.016) during
cultivation and harvesting period. The pH was positively correlated with the canal
distance the results are consistent with previous study conducted by Adeniyi and
Mbagwu (1990). Further, pH level of RB canal water during both periods falls within
the acceptable range of 6.5-8.5 (WHO 2004).
Electrical Conductivity (EC)
EC is viewed as a valuable indicator of the amount of dissolved materials in water. The
canal water EC ranged from 0.02 - 0.51 (mean value 0.1196 ± 0.16 dS m-1
) and 0.02-
0.45 dSm-1
(mean value 0.0958 ± 0.13 dS m-1
) and EC shows significant different
(p=0.00) and (P=0.001) during cultivation and harvesting period, respectively (Figure
2). Maximum value of EC was observed at the tail end whereas the minimum value
was recorded at the Unnichchai tank (0 km) during both periods. The EC level of RB
canal water was more or less constant up to 15 km, and thereafter it has increased.
Further, the EC level was higher during the cultivation period than harvesting period. It
was observed that the elevation of canal bank up to 15 km from the tank is higher than
the paddy fields. Therefore, direct discharge from the paddy fields into the canal is not
possible. Nevertheless, number of discharge points draining water from paddy fields
into the canal was observed in the downstream. This might be the reason for the
increase in EC level in the downstream. Leaching of dissolved solids from the
agricultural area near to the RB canal may also influence on EC level. Both period of
sampling, Table 1 shows suitability classification of irrigation water based on EC
values. Accordingly, canal water up to 17 km from the tank falls under low salinity
class while from 17 km to 22 km it falls under medium salinity class during cultivation
period. The water at the tail end exceeded the EC level of 0.5 dSm-1
and thus not
suitable for irrigation. However, all samples collected during harvesting period were
within the maximum EC level of 0.5 dSm-1
.
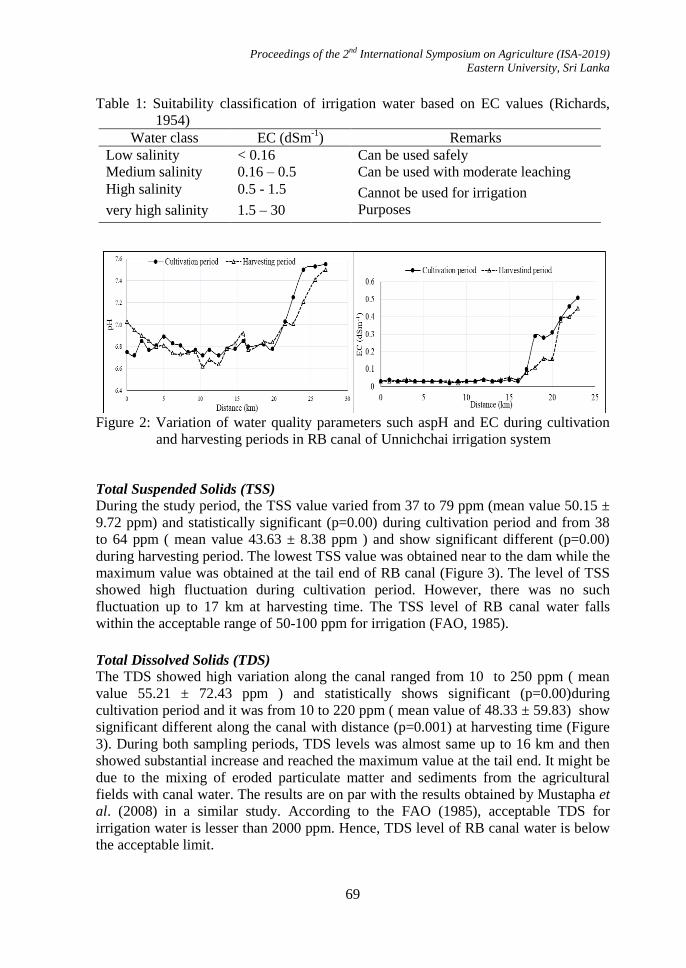
Proceedings of the 2nd International Symposium on Agriculture (ISA-2019)
Eastern University, Sri Lanka
69
Table 1: Suitability classification of irrigation water based on EC values (Richards,
1954)
Figure 2: Variation of water quality parameters such aspH and EC during cultivation
and harvesting periods in RB canal of Unnichchai irrigation system
Total Suspended Solids (TSS)
During the study period, the TSS value varied from 37 to 79 ppm (mean value 50.15 ±
9.72 ppm) and statistically significant (p=0.00) during cultivation period and from 38
to 64 ppm ( mean value 43.63 ± 8.38 ppm ) and show significant different (p=0.00)
during harvesting period. The lowest TSS value was obtained near to the dam while the
maximum value was obtained at the tail end of RB canal (Figure 3). The level of TSS
showed high fluctuation during cultivation period. However, there was no such
fluctuation up to 17 km at harvesting time. The TSS level of RB canal water falls
within the acceptable range of 50-100 ppm for irrigation (FAO, 1985).
Total Dissolved Solids (TDS)
The TDS showed high variation along the canal ranged from 10 to 250 ppm ( mean
value 55.21 ± 72.43 ppm ) and statistically shows significant (p=0.00)during
cultivation period and it was from 10 to 220 ppm ( mean value of 48.33 ± 59.83) show
significant different along the canal with distance (p=0.001) at harvesting time (Figure
3). During both sampling periods, TDS levels was almost same up to 16 km and then
showed substantial increase and reached the maximum value at the tail end. It might be
due to the mixing of eroded particulate matter and sediments from the agricultural
fields with canal water. The results are on par with the results obtained by Mustapha et
al. (2008) in a similar study. According to the FAO (1985), acceptable TDS for
irrigation water is lesser than 2000 ppm. Hence, TDS level of RB canal water is below
the acceptable limit.
Water class EC (dSm-1
) Remarks
Low salinity < 0.16 Can be used safely
Medium salinity 0.16 – 0.5 Can be used with moderate leaching
High salinity 0.5 - 1.5 Cannot be used for irrigation
Purposes very high salinity 1.5 – 30
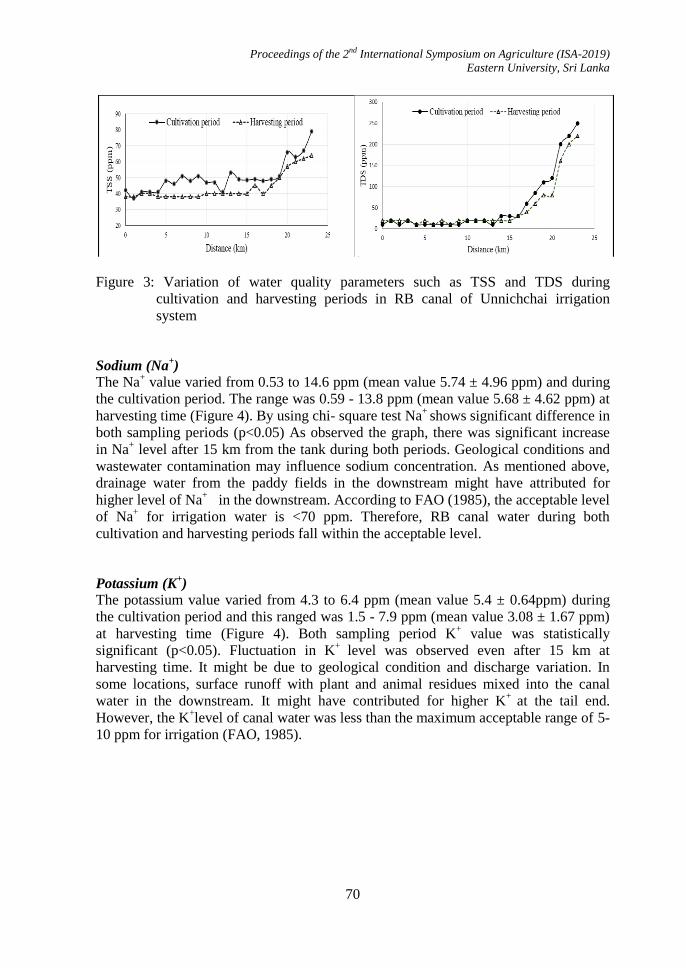
Proceedings of the 2nd International Symposium on Agriculture (ISA-2019)
Eastern University, Sri Lanka
70
Figure 3: Variation of water quality parameters such as TSS and TDS during
cultivation and harvesting periods in RB canal of Unnichchai irrigation
system
Sodium (Na+)
The Na+ value varied from 0.53 to 14.6 ppm (mean value 5.74 ± 4.96 ppm) and during
the cultivation period. The range was 0.59 - 13.8 ppm (mean value 5.68 ± 4.62 ppm) at
harvesting time (Figure 4). By using chi- square test Na+
shows significant difference in
both sampling periods (p<0.05) As observed the graph, there was significant increase
in Na+ level after 15 km from the tank during both periods. Geological conditions and
wastewater contamination may influence sodium concentration. As mentioned above,
drainage water from the paddy fields in the downstream might have attributed for
higher level of Na+ in the downstream. According to FAO (1985), the acceptable level
of Na+ for irrigation water is <70 ppm. Therefore, RB canal water during both
cultivation and harvesting periods fall within the acceptable level.
Potassium (K+)
The potassium value varied from 4.3 to 6.4 ppm (mean value 5.4 ± 0.64ppm) during
the cultivation period and this ranged was 1.5 - 7.9 ppm (mean value 3.08 ± 1.67 ppm)
at harvesting time (Figure 4). Both sampling period K+ value was statistically
significant (p<0.05). Fluctuation in K+
level was observed even after 15 km at
harvesting time. It might be due to geological condition and discharge variation. In
some locations, surface runoff with plant and animal residues mixed into the canal
water in the downstream. It might have contributed for higher K+
at the tail end.
However, the K+level of canal water was less than the maximum acceptable range of 5-
10 ppm for irrigation (FAO, 1985).
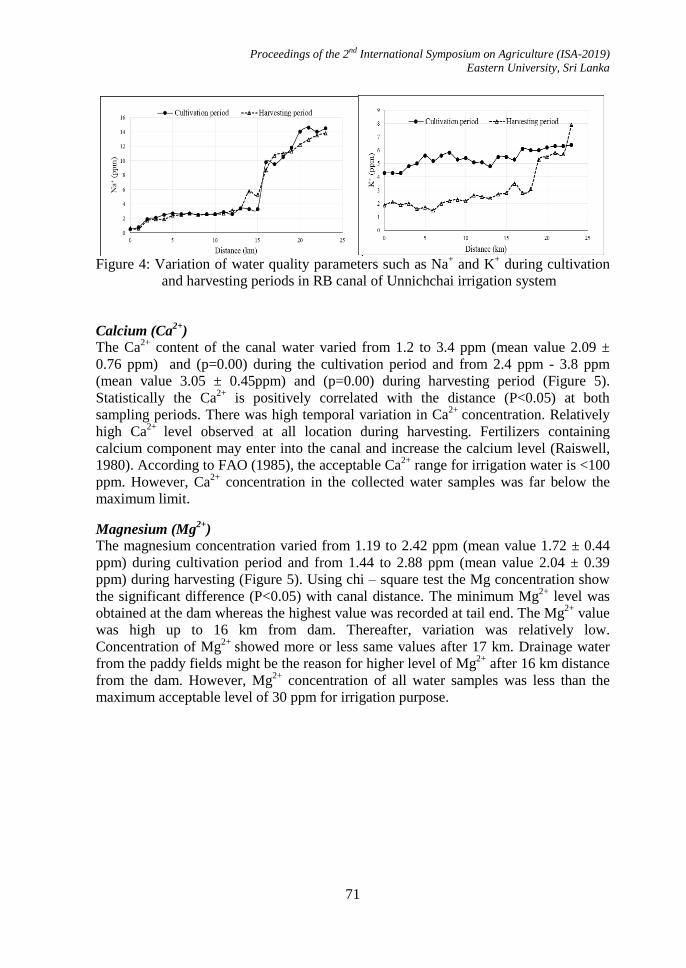
Proceedings of the 2nd International Symposium on Agriculture (ISA-2019)
Eastern University, Sri Lanka
71
Figure 4: Variation of water quality parameters such as Na
+ and K
+ during cultivation
and harvesting periods in RB canal of Unnichchai irrigation system
Calcium (Ca2+
)
The Ca2+
content of the canal water varied from 1.2 to 3.4 ppm (mean value 2.09 ±
0.76 ppm) and (p=0.00) during the cultivation period and from 2.4 ppm - 3.8 ppm
(mean value 3.05 ± 0.45ppm) and (p=0.00) during harvesting period (Figure 5).
Statistically the Ca2+
is positively correlated with the distance (P<0.05) at both
sampling periods. There was high temporal variation in Ca2+
concentration. Relatively
high Ca2+
level observed at all location during harvesting. Fertilizers containing
calcium component may enter into the canal and increase the calcium level (Raiswell,
1980). According to FAO (1985), the acceptable Ca2+
range for irrigation water is <100
ppm. However, Ca2+
concentration in the collected water samples was far below the
maximum limit.
Magnesium (Mg2+
)
The magnesium concentration varied from 1.19 to 2.42 ppm (mean value 1.72 ± 0.44
ppm) during cultivation period and from 1.44 to 2.88 ppm (mean value 2.04 ± 0.39
ppm) during harvesting (Figure 5). Using chi – square test the Mg concentration show
the significant difference (P<0.05) with canal distance. The minimum Mg2+
level was
obtained at the dam whereas the highest value was recorded at tail end. The Mg2+
value
was high up to 16 km from dam. Thereafter, variation was relatively low.
Concentration of Mg2+
showed more or less same values after 17 km. Drainage water
from the paddy fields might be the reason for higher level of Mg2+
after 16 km distance
from the dam. However, Mg2+
concentration of all water samples was less than the
maximum acceptable level of 30 ppm for irrigation purpose.
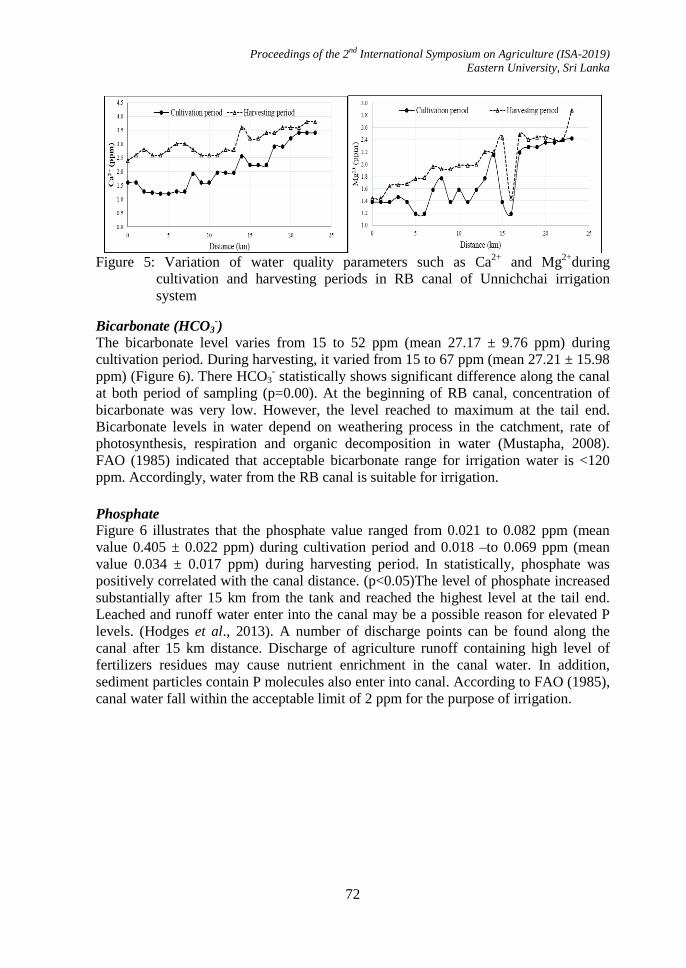
Proceedings of the 2nd International Symposium on Agriculture (ISA-2019)
Eastern University, Sri Lanka
72
Figure 5: Variation of water quality parameters such as Ca
2+ and Mg
2+during
cultivation and harvesting periods in RB canal of Unnichchai irrigation
system
Bicarbonate (HCO3-)
The bicarbonate level varies from 15 to 52 ppm (mean 27.17 ± 9.76 ppm) during
cultivation period. During harvesting, it varied from 15 to 67 ppm (mean 27.21 ± 15.98
ppm) (Figure 6). There HCO3- statistically shows significant difference along the canal
at both period of sampling (p=0.00). At the beginning of RB canal, concentration of
bicarbonate was very low. However, the level reached to maximum at the tail end.
Bicarbonate levels in water depend on weathering process in the catchment, rate of
photosynthesis, respiration and organic decomposition in water (Mustapha, 2008).
FAO (1985) indicated that acceptable bicarbonate range for irrigation water is <120
ppm. Accordingly, water from the RB canal is suitable for irrigation.
Phosphate
Figure 6 illustrates that the phosphate value ranged from 0.021 to 0.082 ppm (mean
value 0.405 ± 0.022 ppm) during cultivation period and 0.018 –to 0.069 ppm (mean
value 0.034 ± 0.017 ppm) during harvesting period. In statistically, phosphate was
positively correlated with the canal distance. (p<0.05)The level of phosphate increased
substantially after 15 km from the tank and reached the highest level at the tail end.
Leached and runoff water enter into the canal may be a possible reason for elevated P
levels. (Hodges et al., 2013). A number of discharge points can be found along the
canal after 15 km distance. Discharge of agriculture runoff containing high level of
fertilizers residues may cause nutrient enrichment in the canal water. In addition,
sediment particles contain P molecules also enter into canal. According to FAO (1985),
canal water fall within the acceptable limit of 2 ppm for the purpose of irrigation.
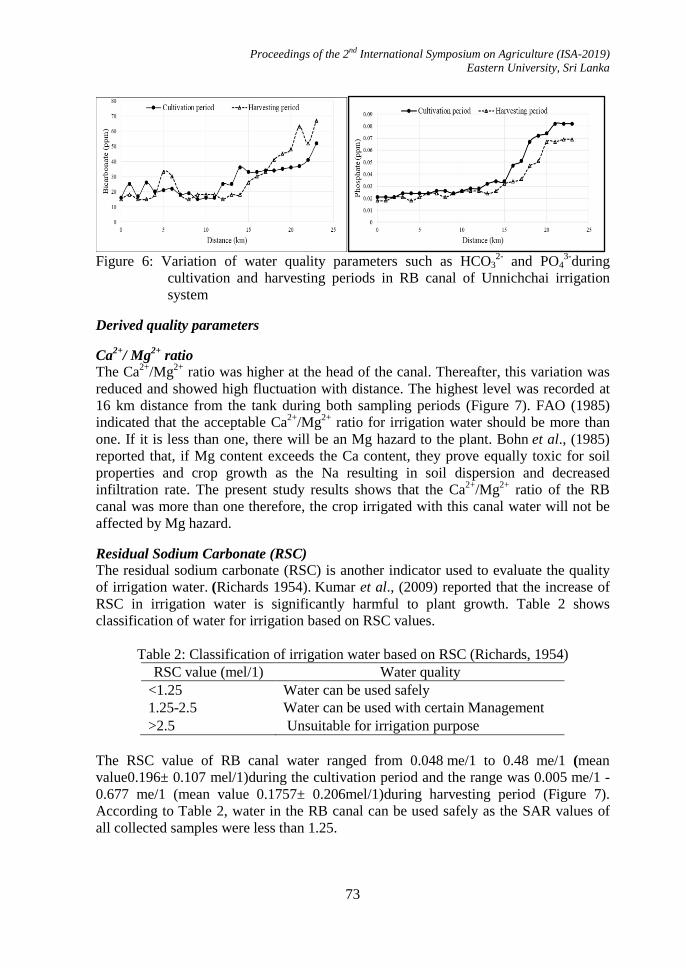
Proceedings of the 2nd International Symposium on Agriculture (ISA-2019)
Eastern University, Sri Lanka
73
Figure 6: Variation of water quality parameters such as HCO3
2- and PO4
3-during
cultivation and harvesting periods in RB canal of Unnichchai irrigation
system
Derived quality parameters
Ca2+
/ Mg2+
ratio
The Ca2+
/Mg2+
ratio was higher at the head of the canal. Thereafter, this variation was
reduced and showed high fluctuation with distance. The highest level was recorded at
16 km distance from the tank during both sampling periods (Figure 7). FAO (1985)
indicated that the acceptable Ca2+
/Mg2+
ratio for irrigation water should be more than
one. If it is less than one, there will be an Mg hazard to the plant. Bohn et al., (1985)
reported that, if Mg content exceeds the Ca content, they prove equally toxic for soil
properties and crop growth as the Na resulting in soil dispersion and decreased
infiltration rate. The present study results shows that the Ca2+
/Mg2+
ratio of the RB
canal was more than one therefore, the crop irrigated with this canal water will not be
affected by Mg hazard.
Residual Sodium Carbonate (RSC)
The residual sodium carbonate (RSC) is another indicator used to evaluate the quality
of irrigation water. (Richards 1954). Kumar et al., (2009) reported that the increase of
RSC in irrigation water is significantly harmful to plant growth. Table 2 shows
classification of water for irrigation based on RSC values.
Table 2: Classification of irrigation water based on RSC (Richards, 1954)
RSC value (mel/1) Water quality
<1.25 Water can be used safely
1.25-2.5 Water can be used with certain Management
>2.5 Unsuitable for irrigation purpose
The RSC value of RB canal water ranged from 0.048 me/1 to 0.48 me/1 (mean
value0.196± 0.107 mel/1)during the cultivation period and the range was 0.005 me/1 -
0.677 me/1 (mean value 0.1757± 0.206mel/1)during harvesting period (Figure 7).
According to Table 2, water in the RB canal can be used safely as the SAR values of
all collected samples were less than 1.25.
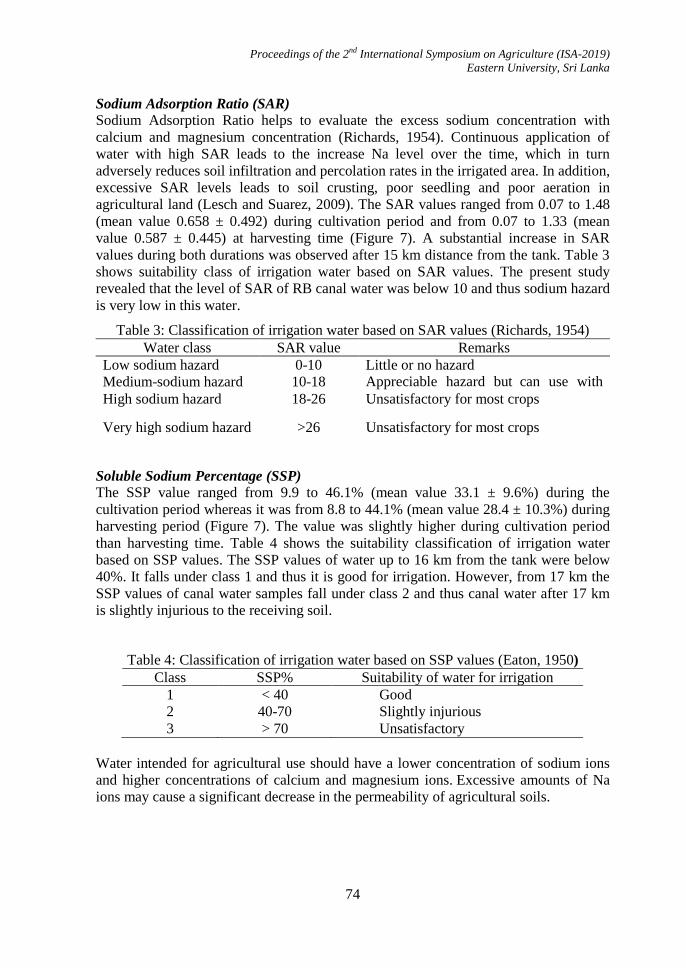
Proceedings of the 2nd International Symposium on Agriculture (ISA-2019)
Eastern University, Sri Lanka
74
Sodium Adsorption Ratio (SAR)
Sodium Adsorption Ratio helps to evaluate the excess sodium concentration with
calcium and magnesium concentration (Richards, 1954). Continuous application of
water with high SAR leads to the increase Na level over the time, which in turn
adversely reduces soil infiltration and percolation rates in the irrigated area. In addition,
excessive SAR levels leads to soil crusting, poor seedling and poor aeration in
agricultural land (Lesch and Suarez, 2009). The SAR values ranged from 0.07 to 1.48
(mean value 0.658 ± 0.492) during cultivation period and from 0.07 to 1.33 (mean
value 0.587 ± 0.445) at harvesting time (Figure 7). A substantial increase in SAR
values during both durations was observed after 15 km distance from the tank. Table 3
shows suitability class of irrigation water based on SAR values. The present study
revealed that the level of SAR of RB canal water was below 10 and thus sodium hazard
is very low in this water.
Table 3: Classification of irrigation water based on SAR values (Richards, 1954)
Soluble Sodium Percentage (SSP)
The SSP value ranged from 9.9 to 46.1% (mean value 33.1 ± 9.6%) during the
cultivation period whereas it was from 8.8 to 44.1% (mean value 28.4 ± 10.3%) during
harvesting period (Figure 7). The value was slightly higher during cultivation period
than harvesting time. Table 4 shows the suitability classification of irrigation water
based on SSP values. The SSP values of water up to 16 km from the tank were below
40%. It falls under class 1 and thus it is good for irrigation. However, from 17 km the
SSP values of canal water samples fall under class 2 and thus canal water after 17 km
is slightly injurious to the receiving soil.
Table 4: Classification of irrigation water based on SSP values (Eaton, 1950)
Class SSP% Suitability of water for irrigation
1 < 40 Good
2 40-70 Slightly injurious
3 > 70 Unsatisfactory
Water intended for agricultural use should have a lower concentration of sodium ions
and higher concentrations of calcium and magnesium ions. Excessive amounts of Na
ions may cause a significant decrease in the permeability of agricultural soils.
Water class SAR value Remarks
Low sodium hazard 0-10 Little or no hazard
Medium-sodium hazard 10-18 Appreciable hazard but can use with
appropriate management High sodium hazard 18-26 Unsatisfactory for most crops
Very high sodium hazard >26 Unsatisfactory for most crops
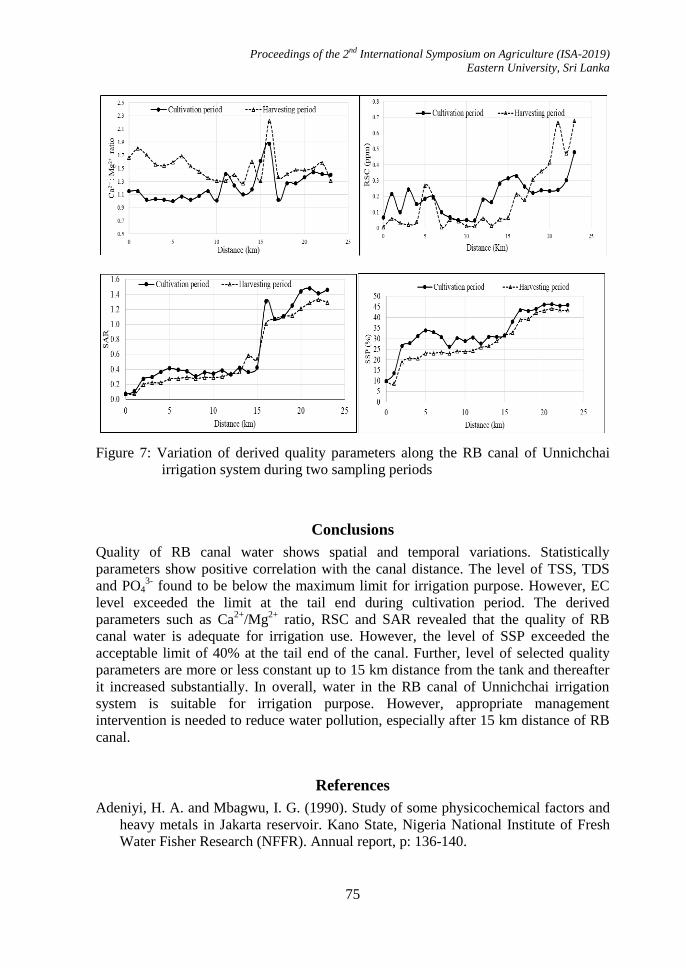
Proceedings of the 2nd International Symposium on Agriculture (ISA-2019)
Eastern University, Sri Lanka
75
Figure 7: Variation of derived quality parameters along the RB canal of Unnichchai
irrigation system during two sampling periods
Conclusions
Quality of RB canal water shows spatial and temporal variations. Statistically
parameters show positive correlation with the canal distance. The level of TSS, TDS
and PO43-
found to be below the maximum limit for irrigation purpose. However, EC
level exceeded the limit at the tail end during cultivation period. The derived
parameters such as Ca2+
/Mg2+
ratio, RSC and SAR revealed that the quality of RB
canal water is adequate for irrigation use. However, the level of SSP exceeded the
acceptable limit of 40% at the tail end of the canal. Further, level of selected quality
parameters are more or less constant up to 15 km distance from the tank and thereafter
it increased substantially. In overall, water in the RB canal of Unnichchai irrigation
system is suitable for irrigation purpose. However, appropriate management
intervention is needed to reduce water pollution, especially after 15 km distance of RB
canal.
References
Adeniyi, H. A. and Mbagwu, I. G. (1990). Study of some physicochemical factors and
heavy metals in Jakarta reservoir. Kano State, Nigeria National Institute of Fresh
Water Fisher Research (NFFR). Annual report, p: 136-140.
Proceedings of the 2nd International Symposium on Agriculture (ISA-2019)
Eastern University, Sri Lanka
76
Ajayi, F., Nduru, M and Oningue, A. (1990). Halting the salt that kills crops African
Farmer No.4, p 10-12.
Bello, S. (2001). Quality of irrigation water and soil characteristics of wetlands in
Sokoto metropolis. Unpublished B.Sc. Project. Department of Soil Science and
Agricultural Engineering, Usman Danfodio University, Sokoto. p 69.
Bohn, H. R., McNeal, N. L. and Conar, G. O. A. (1985). Soil chemistry. In: Soil
chemistry. USA.p.241-243
Eaton, EM. (1950).Significance of carbonate in irrigation water. Soil Science 69:p123–
133.
FAO, (1985). IPTRID, World Bank, Modern water control and management practices
in irrigation, impact on performance, Water Report 19.
Ghafoor, A. M. R., Chaudhry, M., Qadir, G., and Ahmed, H. R. (1997). Saline water
management for irrigation in India. Agric. Water Management, pp30: 1-2.
Hodges, A.W., M. Rahmani, T.J. and Stevens. (2013). Economic Contributions of
Agriculture, Natural Resources, and Related Food Industries Florida, University of
Florida Institute of Food and Agricultural Sciences.
Irrigation Department, Rugam- Chenkalady, Annual report. (2017). Batticaloa, Sri
Lanka
Kumar S. K., Rammohan V., Sahayam, J. And Jeevanandam, M. (2009), Assessment
of groundwater quality and hydrogeochemistry of Manimuktha River basin, Tamil
Nadu, India. Environmental Monitoring and Assessment 159, p341–351.
Lesch, S. M. and Suarez, D. L. (2009). A Short on Calculating the Adjusted SAR
Index. American Society of Agricultural and Biological Engineering ISSN. 0001-
2351, Vol 52(2): 493-596.
Mustapha, M. K. (2008). Assessment of the water quality of Oyun Reservoir, Offa,
Nigeria, using selected physico-chemical parameters. Turk J Fish Aquat Sci 8:
p309-319.
Qureshi, A. S. and Masih, I. (2002). Proc. Inter. Workshop on “Conjunctive Water
Management for Sustainable Irrigated Agriculture in South Asia” held at IWMI,
Lahore, 3: 73-81.
Raiswell, R.W. E.A. (1980). Environmental Chemistry. The Earth-Air-Water Factory.
London, Edward Arnold (Publishers) Ltd.
Richards, L. A. (1954). Diagnosis of saline and alkali soils. Washington: United States
Salinity Laboratory, 1954. USDA. Agriculture Handbook, 60.p160.
WHO (World Health Organization), (2004).Water treatment and pathogen control.
Edited by Mark, W., LeChevallier and Kwok-Keung Au. International Water
Association, London. UK.p:1-12.
Proceedings of the 2nd International Symposium on Agriculture (ISA-2019)
Eastern University, Sri Lanka
77
VARIATION OF IRRIGATION WATER QUALITY WITH PUMPING
DURATION AT TWO COASTAL VILLAGES OF BATTICALOA
DISTRICT
G. Niroash*, M. Sugirtharan and M. Rajendran
Department of Agricultural Engineering, Faculty of Agriculture, Eastern University, Sri Lanka
*Corresponding author: [email protected]
Abstract
Groundwater quality deterioration in the coastal areas due to excess pumping is
concerned recently due to shortage of surface water. The present study was aimed to
investigate the variation of groundwater quality with pumping duration in Kaluthavalai
and Cheddipalayam farming villages in the coastal area of Batticaloa district.
Groundwater samples were collected in July, 2018 from six agricultural fields from
each village at different pumping durations (01, 21, 41 and 61-minutes) and analysed
for some important water quality parameters such as pH, EC, TDS, TSS, Ca2+
/Mg2+
ratio and Sodium Adsorption Ratio (SAR). The study revealed that there were some
variations observed in water quality parameters with pumping duration. However, the
variation was not significant (≤0.05).The pH, EC, TDS and TSS ranged from 6.94 -
7.04, 0.5 - 1.53 dS/m, 250 - 760 mg/l and 32 - 546 mg/l, respectively. The Ca2+
/Mg2+
ratio and SAR varied from 0.43 - 6.0 and 0 - 3.94 respectively. High level of EC and
TDS was observed in Kaluthavalai area. However, Cheddipalayam area recorded high
level of SAR. Further, significant variation (<0.05) was observed in EC, TDS and SAR
between the readings taken at Kaluthavalai and Cheddipalayam areas at all pumping
durations. In overall, one-hour pumping duration did not have significant impact on
groundwater quality in both areas. Even though some quality parameters were at high
level, groundwater in these farming areas is suitable for irrigation purposes.
Keywords: Coastal aquifers, Groundwater, Irrigation water quality, Salinity
Introduction
Groundwater is one of the most important natural resources, widely used for domestic,
irrigation, commercial and industrial, water supply schemes and other purposes. The
availability of groundwater offers farmers to grow more crops, minimize the damage
caused by droughts, and achieve enhanced incomes from higher cropping intensity and
cultivation of high-value crops (Pathmarajah, 2016). Aquifers in the coastal areas are
recharged during rainy seasons or from nearby surface water sources. Volume of the
fresh water in these aquifers increases during the rainy seasons and contracts during the
dry seasons (Sugirtharan and Rajendran, 2015). Groundwater quality deterioration in
the coastal areas due to excess pumping is concerned recently due to shortage of
surface water. Groundwater quality in an aquifer differs with depth due to aquifer
geology and rock formation having different chemical characteristics (Michael, 1992).
Proceedings of the 2nd International Symposium on Agriculture (ISA-2019)
Eastern University, Sri Lanka
78
Further, depletion of groundwater level by continuous pumping from an aquifer may
degrade water quality (Al-Naeem, 2014). It is well known that over pumping of fresh
water aquifers leads to seawater intrusion in the coastal areas. In general, salinity
problem in coastal aquifers is observed when the depletion of freshwater aquifers is
faster than the recharge.
Kaluthavalai and Cheddipalayam are the two popular intensive farming villages in the
coastal area of Batticaloa district in Sri Lanka. Groundwater is the only source of water
for irrigation. Farmers have adopted sprinkler irrigation technology to irrigate the
crops. They irrigate the crops more frequently due to low water holding capacity of the
soil in these areas. Over exploitation of groundwater from this shallow coastal aquifer
may cause saline water intrusion. So far, the variation of water quality with the
pumping durations in these areas is not well documented. Assessment of irrigation
water quality with pumping duration would be useful to manage the freshwater aquifer
for sustainable crop production in these areas. In the above context, the present study
was carried out to assess the variation of irrigation water quality with pumping duration
in these two farming villages.
Materials and Methods
Study area
The present study was carried out at Cheddipalayam and Kaluthavalai villages in
Batticaloa district. The latitude and longitude of Cheddipalayam and Kaluthavalai are
7o34‟N & 81
o47‟E and 7
o32‟N & 81
o47‟E, respectively. Both areas fall under DL2b
agro-ecological region, which receives an average annual rainfall about 1,700 mm.
Most of the farmers cultivate chilli as the main crop. Groundwater in the sandy aquifer
is the only source of water used for irrigation, domestic and drinking purposes.
Site selection and sampling
Irrigation water samples from twelve farms, six from each village, at one minute,
twenty-one minutes, forty-one minutes and sixty-one minutes of pumping duration
were collected in July, 2018. The depths of the tube wells were between 15 to 20 feet.
The pumping rate of the pumps was 564.5 l/min. The bottles were rinsed two to three
times with sample water before taking water samples. The procedure was repeated
thrice to get average values. Figure 1 shows the location of study area and sampling
locations at each village.
Analysis of samples In-situ measurements were taken for parameters such as pH, electrical conductivity
(EC) and total dissolved solids (TDS) using portable digital pH/EC/TDS meter (model:
HI 98130) respectively. Calcium was analysed by titration with Versenate
(Ethylenediaminetetraacetatic acid) using calcon as an indicator.Calcium and
magnesium were analysed by titration with Versenate (EDTA) using Erichrome Black
T as an indicator. Magnesium concentration was calculated by deducting the calcium
concentration from total concentration of calcium and magnesium. Sodium and
potassium were analysed by flame photometer using standard solutions of sodium
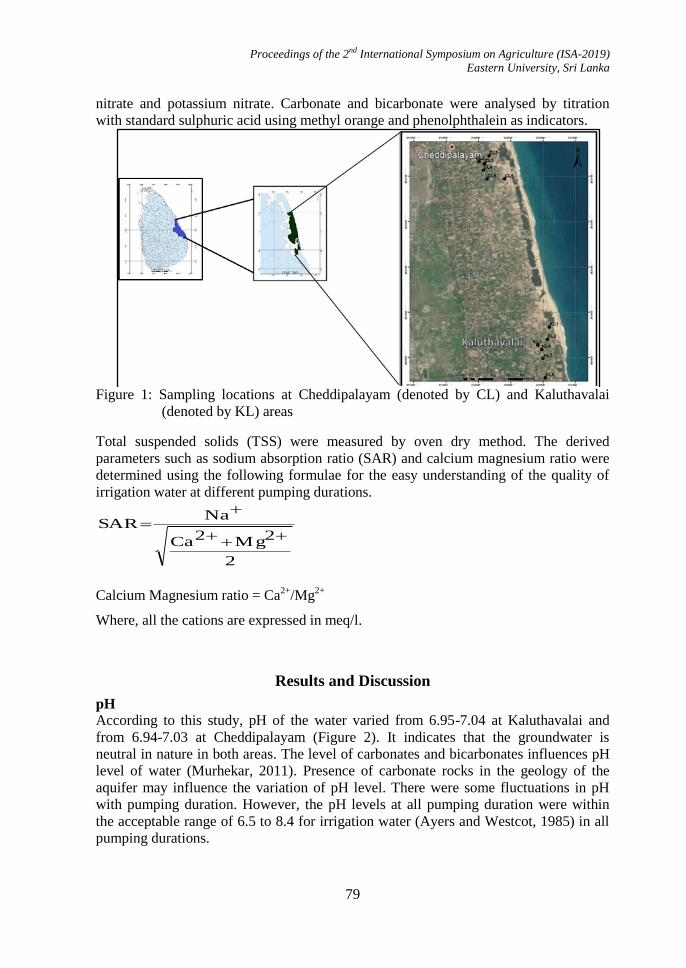
Proceedings of the 2nd International Symposium on Agriculture (ISA-2019)
Eastern University, Sri Lanka
79
nitrate and potassium nitrate. Carbonate and bicarbonate were analysed by titration
with standard sulphuric acid using methyl orange and phenolphthalein as indicators.
Figure 1: Sampling locations at Cheddipalayam (denoted by CL) and Kaluthavalai
(denoted by KL) areas
Total suspended solids (TSS) were measured by oven dry method. The derived
parameters such as sodium absorption ratio (SAR) and calcium magnesium ratio were
determined using the following formulae for the easy understanding of the quality of
irrigation water at different pumping durations.
2
2Mg2Ca
NaSAR
Calcium Magnesium ratio = Ca2+
/Mg2+
Where, all the cations are expressed in meq/l.
Results and Discussion
pH
According to this study, pH of the water varied from 6.95-7.04 at Kaluthavalai and
from 6.94-7.03 at Cheddipalayam (Figure 2). It indicates that the groundwater is
neutral in nature in both areas. The level of carbonates and bicarbonates influences pH
level of water (Murhekar, 2011). Presence of carbonate rocks in the geology of the
aquifer may influence the variation of pH level. There were some fluctuations in pH
with pumping duration. However, the pH levels at all pumping duration were within
the acceptable range of 6.5 to 8.4 for irrigation water (Ayers and Westcot, 1985) in all
pumping durations.
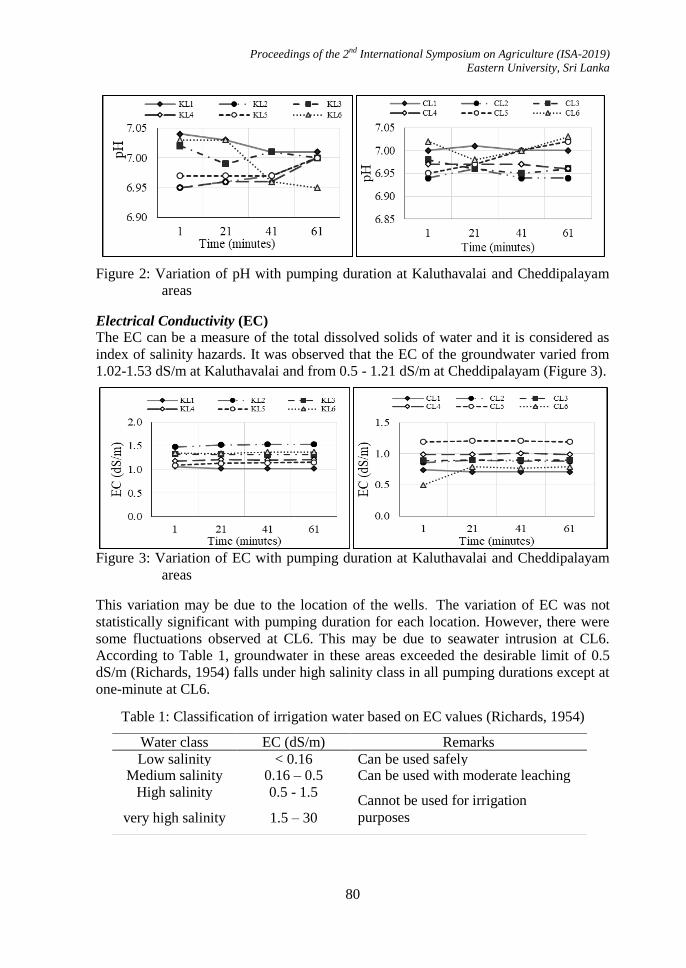
Proceedings of the 2nd International Symposium on Agriculture (ISA-2019)
Eastern University, Sri Lanka
80
Figure 2: Variation of pH with pumping duration at Kaluthavalai and Cheddipalayam
areas
Electrical Conductivity (EC)
The EC can be a measure of the total dissolved solids of water and it is considered as
index of salinity hazards. It was observed that the EC of the groundwater varied from
1.02-1.53 dS/m at Kaluthavalai and from 0.5 - 1.21 dS/m at Cheddipalayam (Figure 3).
Figure 3: Variation of EC with pumping duration at Kaluthavalai and Cheddipalayam
areas
This variation may be due to the location of the wells. The variation of EC was not
statistically significant with pumping duration for each location. However, there were
some fluctuations observed at CL6. This may be due to seawater intrusion at CL6.
According to Table 1, groundwater in these areas exceeded the desirable limit of 0.5
dS/m (Richards, 1954) falls under high salinity class in all pumping durations except at
one-minute at CL6.
Table 1: Classification of irrigation water based on EC values (Richards, 1954)
Water class EC (dS/m) Remarks
Low salinity < 0.16 Can be used safely Medium salinity 0.16 – 0.5 Can be used with moderate leaching
High salinity 0.5 - 1.5 Cannot be used for irrigation
purposes very high salinity 1.5 – 30
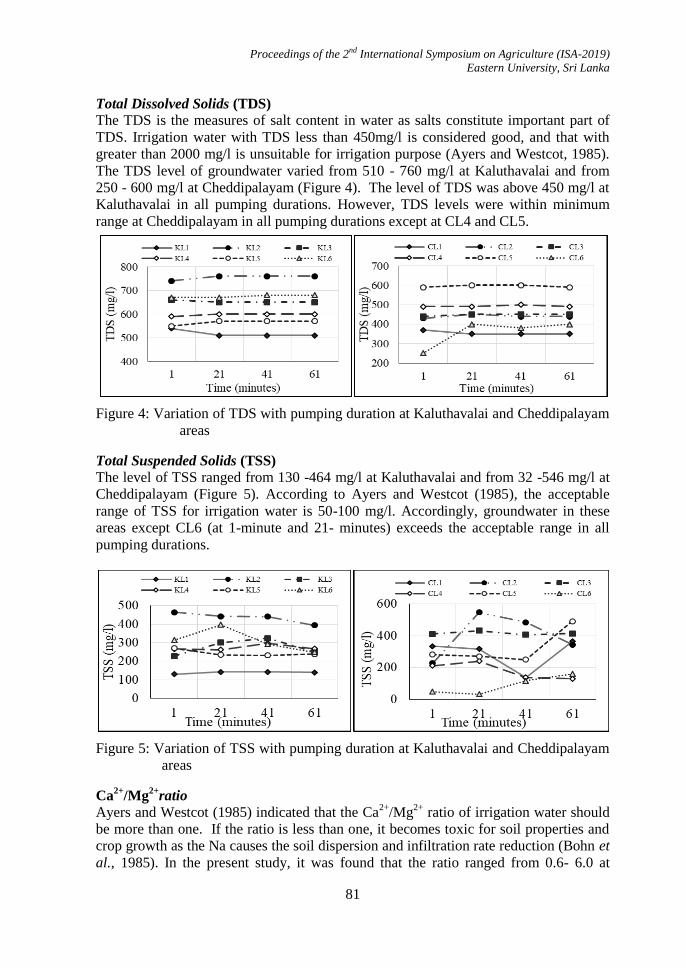
Proceedings of the 2nd International Symposium on Agriculture (ISA-2019)
Eastern University, Sri Lanka
81
Total Dissolved Solids (TDS)
The TDS is the measures of salt content in water as salts constitute important part of
TDS. Irrigation water with TDS less than 450mg/l is considered good, and that with
greater than 2000 mg/l is unsuitable for irrigation purpose (Ayers and Westcot, 1985).
The TDS level of groundwater varied from 510 - 760 mg/l at Kaluthavalai and from
250 - 600 mg/l at Cheddipalayam (Figure 4). The level of TDS was above 450 mg/l at
Kaluthavalai in all pumping durations. However, TDS levels were within minimum
range at Cheddipalayam in all pumping durations except at CL4 and CL5.
Figure 4: Variation of TDS with pumping duration at Kaluthavalai and Cheddipalayam
areas
Total Suspended Solids (TSS)
The level of TSS ranged from 130 -464 mg/l at Kaluthavalai and from 32 -546 mg/l at
Cheddipalayam (Figure 5). According to Ayers and Westcot (1985), the acceptable
range of TSS for irrigation water is 50-100 mg/l. Accordingly, groundwater in these
areas except CL6 (at 1-minute and 21- minutes) exceeds the acceptable range in all
pumping durations.
Figure 5: Variation of TSS with pumping duration at Kaluthavalai and Cheddipalayam
areas
Ca2+
/Mg2+
ratio
Ayers and Westcot (1985) indicated that the Ca2+
/Mg2+
ratio of irrigation water should
be more than one. If the ratio is less than one, it becomes toxic for soil properties and
crop growth as the Na causes the soil dispersion and infiltration rate reduction (Bohn et
al., 1985). In the present study, it was found that the ratio ranged from 0.6- 6.0 at
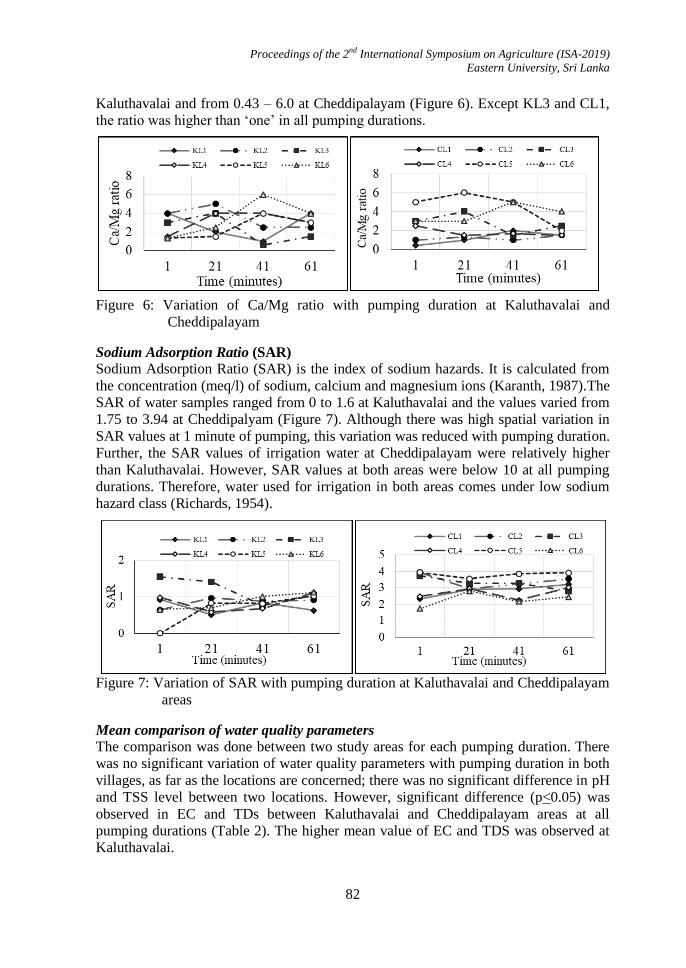
Proceedings of the 2nd International Symposium on Agriculture (ISA-2019)
Eastern University, Sri Lanka
82
Kaluthavalai and from 0.43 – 6.0 at Cheddipalayam (Figure 6). Except KL3 and CL1,
the ratio was higher than „one‟ in all pumping durations.
Figure 6: Variation of Ca/Mg ratio with pumping duration at Kaluthavalai and
Cheddipalayam
Sodium Adsorption Ratio (SAR)
Sodium Adsorption Ratio (SAR) is the index of sodium hazards. It is calculated from
the concentration (meq/l) of sodium, calcium and magnesium ions (Karanth, 1987).The
SAR of water samples ranged from 0 to 1.6 at Kaluthavalai and the values varied from
1.75 to 3.94 at Cheddipalyam (Figure 7). Although there was high spatial variation in
SAR values at 1 minute of pumping, this variation was reduced with pumping duration.
Further, the SAR values of irrigation water at Cheddipalayam were relatively higher
than Kaluthavalai. However, SAR values at both areas were below 10 at all pumping
durations. Therefore, water used for irrigation in both areas comes under low sodium
hazard class (Richards, 1954).
Figure 7: Variation of SAR with pumping duration at Kaluthavalai and Cheddipalayam
areas
Mean comparison of water quality parameters
The comparison was done between two study areas for each pumping duration. There
was no significant variation of water quality parameters with pumping duration in both
villages, as far as the locations are concerned; there was no significant difference in pH
and TSS level between two locations. However, significant difference (p<0.05) was
observed in EC and TDs between Kaluthavalai and Cheddipalayam areas at all
pumping durations (Table 2). The higher mean value of EC and TDS was observed at
Kaluthavalai.
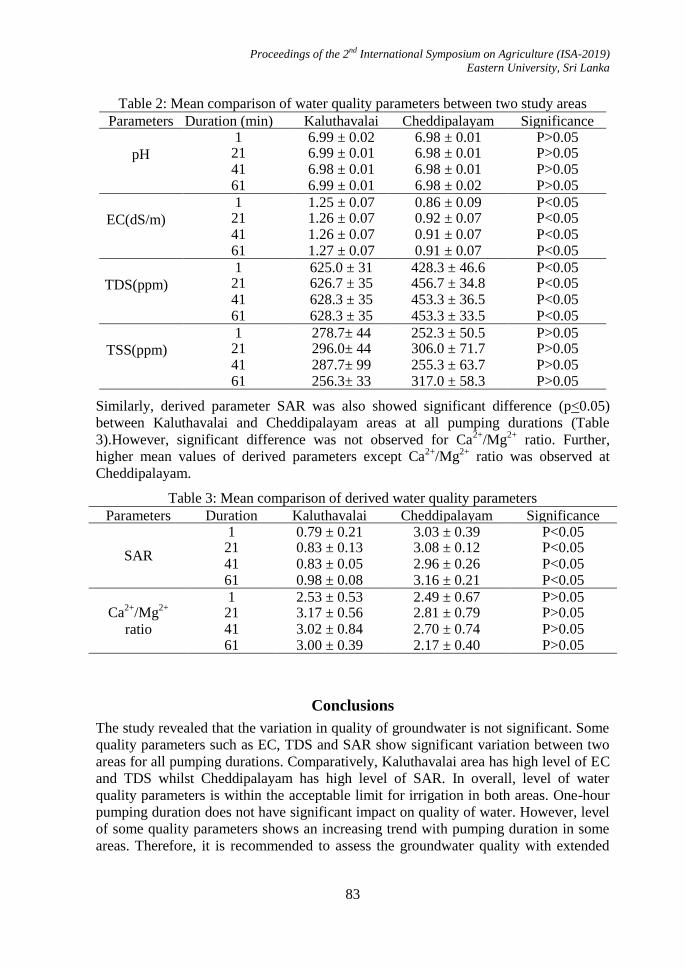
Proceedings of the 2nd International Symposium on Agriculture (ISA-2019)
Eastern University, Sri Lanka
83
Table 2: Mean comparison of water quality parameters between two study areas
Parameters Duration (min) Kaluthavalai Cheddipalayam Significance
level pH
1 6.99 ± 0.02 6.98 ± 0.01 P>0.05 21 6.99 ± 0.01 6.98 ± 0.01 P>0.05 41 6.98 ± 0.01 6.98 ± 0.01 P>0.05 61 6.99 ± 0.01 6.98 ± 0.02 P>0.05
EC(dS/m)
1 1.25 ± 0.07 0.86 ± 0.09 P<0.05 21 1.26 ± 0.07 0.92 ± 0.07 P<0.05 41 1.26 ± 0.07 0.91 ± 0.07 P<0.05 61 1.27 ± 0.07 0.91 ± 0.07 P<0.05
TDS(ppm)
1 625.0 ± 31 428.3 ± 46.6 P<0.05 21 626.7 ± 35 456.7 ± 34.8 P<0.05 41 628.3 ± 35 453.3 ± 36.5 P<0.05 61 628.3 ± 35 453.3 ± 33.5 P<0.05
TSS(ppm)
1 278.7± 44 252.3 ± 50.5 P>0.05 21 296.0± 44 306.0 ± 71.7 P>0.05 41 287.7± 99 255.3 ± 63.7 P>0.05 61 256.3± 33 317.0 ± 58.3 P>0.05
Similarly, derived parameter SAR was also showed significant difference (p<0.05)
between Kaluthavalai and Cheddipalayam areas at all pumping durations (Table
3).However, significant difference was not observed for Ca2+
/Mg2+
ratio. Further,
higher mean values of derived parameters except Ca2+
/Mg2+
ratio was observed at
Cheddipalayam.
Table 3: Mean comparison of derived water quality parameters
Parameters Duration
(min)
Kaluthavalai Cheddipalayam Significance
level
SAR
1 0.79 ± 0.21 3.03 ± 0.39 P<0.05 21 0.83 ± 0.13 3.08 ± 0.12 P<0.05 41 0.83 ± 0.05 2.96 ± 0.26 P<0.05 61 0.98 ± 0.08 3.16 ± 0.21 P<0.05
Ca2+
/Mg2+
ratio
1 2.53 ± 0.53 2.49 ± 0.67 P>0.05 21 3.17 ± 0.56 2.81 ± 0.79 P>0.05 41 3.02 ± 0.84 2.70 ± 0.74 P>0.05 61 3.00 ± 0.39 2.17 ± 0.40 P>0.05
Conclusions
The study revealed that the variation in quality of groundwater is not significant. Some
quality parameters such as EC, TDS and SAR show significant variation between two
areas for all pumping durations. Comparatively, Kaluthavalai area has high level of EC
and TDS whilst Cheddipalayam has high level of SAR. In overall, level of water
quality parameters is within the acceptable limit for irrigation in both areas. One-hour
pumping duration does not have significant impact on quality of water. However, level
of some quality parameters shows an increasing trend with pumping duration in some
areas. Therefore, it is recommended to assess the groundwater quality with extended
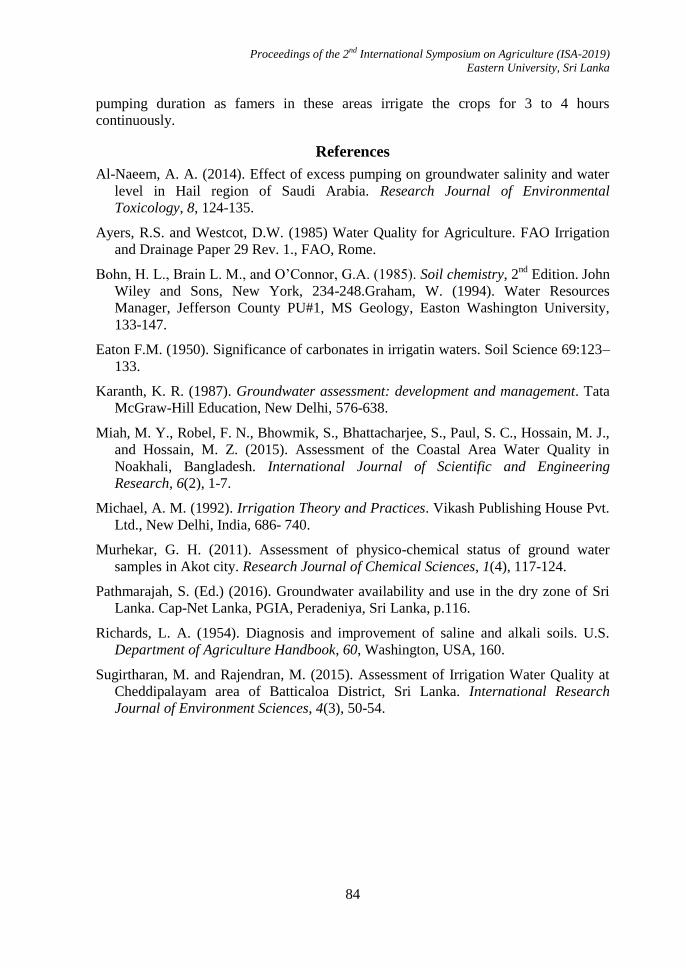
Proceedings of the 2nd International Symposium on Agriculture (ISA-2019)
Eastern University, Sri Lanka
84
pumping duration as famers in these areas irrigate the crops for 3 to 4 hours
continuously.
References
Al-Naeem, A. A. (2014). Effect of excess pumping on groundwater salinity and water
level in Hail region of Saudi Arabia. Research Journal of Environmental
Toxicology, 8, 124-135.
Ayers, R.S. and Westcot, D.W. (1985) Water Quality for Agriculture. FAO Irrigation
and Drainage Paper 29 Rev. 1., FAO, Rome.
Bohn, H. L., Brain L. M., and O‟Connor, G.A. (1985). Soil chemistry, 2nd
Edition. John
Wiley and Sons, New York, 234-248.Graham, W. (1994). Water Resources
Manager, Jefferson County PU#1, MS Geology, Easton Washington University,
133-147.
Eaton F.M. (1950). Significance of carbonates in irrigatin waters. Soil Science 69:123–
133.
Karanth, K. R. (1987). Groundwater assessment: development and management. Tata
McGraw-Hill Education, New Delhi, 576-638.
Miah, M. Y., Robel, F. N., Bhowmik, S., Bhattacharjee, S., Paul, S. C., Hossain, M. J.,
and Hossain, M. Z. (2015). Assessment of the Coastal Area Water Quality in
Noakhali, Bangladesh. International Journal of Scientific and Engineering
Research, 6(2), 1-7.
Michael, A. M. (1992). Irrigation Theory and Practices. Vikash Publishing House Pvt.
Ltd., New Delhi, India, 686- 740.
Murhekar, G. H. (2011). Assessment of physico-chemical status of ground water
samples in Akot city. Research Journal of Chemical Sciences, 1(4), 117-124.
Pathmarajah, S. (Ed.) (2016). Groundwater availability and use in the dry zone of Sri
Lanka. Cap-Net Lanka, PGIA, Peradeniya, Sri Lanka, p.116.
Richards, L. A. (1954). Diagnosis and improvement of saline and alkali soils. U.S.
Department of Agriculture Handbook, 60, Washington, USA, 160.
Sugirtharan, M. and Rajendran, M. (2015). Assessment of Irrigation Water Quality at
Cheddipalayam area of Batticaloa District, Sri Lanka. International Research
Journal of Environment Sciences, 4(3), 50-54.
Proceedings of the 2nd International Symposium on Agriculture (ISA-2019)
Eastern University, Sri Lanka
85
INFLUENCE OF SOIL MOISTURE LEVELS AND FERTILIZER
POTASSIUM ON POTASSIUM CONTENT AND YIELD OF COWPEA
(Vigna unguiculata) IN SANDY REGOSOL
R.Vassanthini* and P.Premanandarajah
Department of Agricultural Chemistry, Faculty of Agriculture, Eastern University, Sri Lanka
*Corresponding author:[email protected]
Abstract
Cowpea (Vigna unguiculata) is an important legume crop widely cultivated in Sri
Lanka, has great potential for improving human nutrition due to its high protein
content. However, drought stress was found to be one of the major constraints to
cowpea production in Sri Lanka. Potassium decreases drought stress effects in plants.
A study was conducted from July to September 2018 to investigate the effect of four
rates of fertilizer potassium (MOP) including recommended level (75Kg/ha), 125% of
recommended level, 150% of recommended level, 175% of recommended level with
two different soil moisture levels as optimal (25% depletion of available soil moisture)
and sub-optimal (75% depletion of available soil moisture) on potassium content and
yield of cowpea. These 8 treatments replicated three times in a Completely
Randomized Design (CRD) in a factorial manner. Potassium content and yield
parameters of cowpea were recorded. The data were statistically analyzed using SAS
and difference between treatment means was compared using Duncan‟s Multiple
Range Test (DMRT). Water stress produced significant effects (P<0.05) on potassium
content and yield parameters. The number of pods per plant showed a greater response
to potassium fertilizer under optimal soil moisture. Although differences were observed
in the responses of potassium content and yield of cowpea to moisture and potassium,
in overall terms potassium promoted potassium content and yield of cowpea when
subject to optimal and suboptimal soil moisture. Among all applications 175% of
recommended potassium level of cowpea proved to be the best to increase the
potassium content and yield under optimal and sub-optimal moisture conditions
compared to recommended level of potassium in sandy regosol. The results of this
study suggested that the increased application of potassium fertilizer can be considered
as significant factor in overcoming soil moisture stress in cowpea.
Keywords: Cowpea, Drought, Moisture, Potassium, Yield
Introduction
World population is growing at a higher rate and its greatest impacts are on the
developing countries of Asia and Africa. Sri Lanka is a South Asian developing
country mainly depends on agriculture for the economic growth and affected by
increasing population (Sangakkara and Nissanka, 2017). Due to this, food security has
become a major issue in Sri Lanka. Hence to enhance the crop productivity to ensure
food security is more important to provide better nutrition to our people.
Proceedings of the 2nd International Symposium on Agriculture (ISA-2019)
Eastern University, Sri Lanka
86
Water is becoming a scarce commodity for irrigation especially under the present
changing climatic scenario. Scarcity of water for agriculture has a negative impact on
the crop production. Drought is the most severe abiotic stress which affects the growth
and yield of various crops (Sara and Roghieh, 2017). It is important to recover from
abiotic stress to increase the food production to feed the increasing population.
Cowpea is an important legume crop widely cultivated in Sri Lanka. It is an
inexpensive and rich source of protein.Cowpea is often subjected to drought stress in
both seedling and terminal growth stages which cause a considerable amount of loss in
yield. Among the plant nutrients, potassium (K) is one of the major nutrients essential
for the plant growth and physiology. Under drought stress condition potassium
regulates the stomatal opening and makes the plants adaptive to water deficit (Mirza et
al., 2018). So, drought stress cultivars combined with adequate external potassium
supply may be a good strategy to increase the productivity in arid and semi-arid
regions. Some findings showed that yield limiting effect of water stress could be
overcome by increasing potassium supply (Sara and Roghieh, 2017).
The predominant soil group in Batticaloa district and the coastal belt of Eastern
province, Sri Lanka is sandy regosol (Quartzipsamments) which contain 95-98% sand
with no confining horizons in its soil profile (Bawatharani et al., 2004). Sandy regosol
soil is light and easy to work. Also the cultivation can be carried out all year round and
it favours better air and water movement and root penetration.
Though the effects of water stress on cowpea production have been studied, a little is
known about the effects of water stress on yield components. A better understanding of
the effects of water stress on cowpea yield will provide useful information to farmers
on how to manage the cowpea production under drought conditions, and also a few
studies have demonstrated that the use of potassium fertilizer can reduce the adverse
effects of water stress in cowpeas in controlled environmental conditions
(Fooladivanda et al., 2014). Fertilizer potassium would be expected to have some
effects on cowpea in overcoming moisture stress. Though there are ample amount of
research findings on the impact of potassium on the yield of cowpea under moisture
stress there is no such amount of data for the crop grown under exposed environmental
conditions. Therefore to, investigate this possibility, an experiment was carried out
under exposed environmental conditions in the sandy regosols of Batticaloa district to
determine the impact of fertilizer potassium on the potassium content and yield of
cowpea under the two different soil moisture levels.
Materials and Methods
Description of experimental site
The experiment was conducted during the Yala season of the year 2018 at the Eastern
University, Sri Lanka which is situated in the Batticaloa district, Sri Lanka. The
elevation of this area is 75m above mean sea level and it is classified under the agro-
ecological zone of the low country dry zone (DL2). The mean annual rainfall of

Proceedings of the 2nd International Symposium on Agriculture (ISA-2019)
Eastern University, Sri Lanka
87
Batticaloa district varies from 1800mm to 2100 mm and most of the showers were
received during the months of October to January (Maha season ) brought about by the
North East monsoon. The annual mean temperature varies from 28 to 320c and
humidity ranges from 60% to 90%.
Description of the experiment and growth conditions
A pot experiment was carried out from July to September, 2018 in a wire house with
rainproof roof, in order to avoid interruption by rainfall. The soil was collected from
the surface layer (0-15 cm) of the Crop Farm, Eastern University, Sri Lanka. The soil
used in this study was sandy regosol. Cowpea seeds of Wijaya variety were used for
this experiment and seeds were collected from the seed unit of Crop Farm, Eastern
University, Sri Lanka.
Black polythene bags were used for this experiment with the dimension of 36cm in
diameter and 40cm in height. A bulk soil sample was collected was processed, air dried
and sieved by using 2mm mesh sieve, for homogeneity. Each polythene bag was filled
with seven (7) Kg of processed soil. Then they were properly labeled and arranged
according to the design. Nitrogen and phosphorus fertilizers were incorporated with the
soil as per the recommendation and potassium was incorporated according to the
treatments. Four seeds were sown in each bag and two weeks after germination, two
plants per bag were maintained and all the agronomic practices were applied according
to the recommendation of Department of Agriculture, Sri Lanka.
Experimental design and preparation of treatments
The experiment was conducted in two factor factorial completely randomized design
with eight treatments (4 potassium levels and 2 soil moisture conditions) and three
replicates. A total number of 24 bags were used for this experiment.
Treatments
Soil‟s field capacity (52%) was measured in volume basis (Wang et al., 2012).
Depletion of available soil moisture at 25% and 75% were determined in volume basis
and defined as optimal moisture level and sub-optimal moisture level, respectively.
Soil moisture was monitored at every two days interval by weighing the bags (Lopo de
Sá et al., 2014).
Treatment structure
F1K1- Sub-optimal moisture level+potassium at 125% of recommendation
F1K2- Sub-optimal moisture level+potassium at 150% of recommendation
F1K3- Sub-optimal moisture level+potassium at 175% of recommendation
F1K0- Sub-optimal moisture level+potassium at recommendation (control)
F2K1- Optimal moisture level+potassium at 125% of recommendation
F2K2- Optimal moisture level+potassium at 150% of recommendation
F2K3- Optimal moisture level+potassium at 175% of recommendation
F2K0- Optimal moisture level+potassium at recommendation (control)
Proceedings of the 2nd International Symposium on Agriculture (ISA-2019)
Eastern University, Sri Lanka
88
According to the Department of Agriculture recommendation the optimum potassium
level for cowpea is 75kg/ha. For this experiment 25%, 50% and 75% increase of
recommended potassium levels were used and they were defined as 125%, 150% and
175% potassium level, respectively. According to the recommended above rates,
treatments were applied to the bag three days before planting.
Measurements
Potassium content and yield parameters of cowpea were measured to evaluate the
performances of cowpea in each treatment at harvesting stage (60 days after planting).
Potassium content in plant at harvest (mg/g) - measured using flame photometer
Pod number per plant
Seed weight per pod(g) – measured using electronic balance
Yield (Kg/ha)
Statistical analysis
All the data were analyzed using Analysis of Variance (ANOVA) procedure to know
the variance if any at the treatment level. Duncan‟s Multiple Range Test (DMRT) was
used to compare the significant differences between treatment means at p < 0.05 using
SAS 9.1.3 statistical software package.
Results and Discussion
Potassium content in plant at harvest
The results pertaining to the available potassium content in plant at harvest indicated
that there was a significant influence of soil moisture and fertilizer potassium on the
available potassium content in plant at harvest as P value is less than 0.05 (Table 1).
The results showed that the available potassium content was high under optimal
moisture level compared to sub-optimal moisture level. Similar results were found by
Felício Lopo de Sá et al. (2014) and he stated that potassium contents in plants were
greater under conditions of high moisture. Reduction in potassium content under sub-
optimal condition may due to low uptake of potassium under low soil moisture level.
Because potassium mobility to the roots from soil is low under low soil moisture level.
Wang et al. (2013) reported that soil moisture can influence the uptake rate of
potassium via affecting its mobility from the soil to the root surface. 175% potassium
level significantly increased the available potassium content in plant. This was
supported by FelícioLopo et al. (2014). This may be due to the high potassium
application to the soil. Wang et al. (2013) stated that higher application rate of
potassium fertilizer was responsible for larger potassium concentrations in all organs.
Mahouachi et al. (2006) found that highest potassium doses in the soil resulted in a
greater accumulation of this element in plant tissues.
Asao et al. (2013) reported that changes in the potassium supply to a growing plant can
cause significant alterations of the potassium content in the melon plant tissues. The
interaction between the moisture level and potassium rates had a significant effect on

Proceedings of the 2nd International Symposium on Agriculture (ISA-2019)
Eastern University, Sri Lanka
89
plant potassium content on harvest. Under optimal moisture level 175% potassium
level significantly increased the plant potassium content.
Table 1: Effect of soil moisture level and potassium rates on available potassium
content in plant (mg/g) at harvest in cowpea
Means with dissimilar letters within the spacing are significant (p < 0.05).
This may due to increased mobility of potassium under high moisture level Wang et
al., (2013). Under sub-optimal moisture level also 175% potassium level significantly
increased the plant potassium content. This may due to increased accumulation of soil
potassium by the extended root growth due to moisture stress. Sangakkara et al. (2001)
stated that under low moisture levels plants extend their roots to absorb moisture from
the deeper layers of soil and they absorb more soil potassium.
Pod number per plant
The results belong to the pod number per plant indicated that there was a significant
influence of soil moisture on number of pods per plant as P value is less than 0.05
(Table 2). The highest number of pods (4.0) was observed in plants subjected to
optimal moisture and the lowest (1.0) was observed in the plants subjected to sub-
optimal moisture. This result is in conformity to the results observed by Manjeru et al.
(2007). Abelardo et al. (2005) stated that, the yield component mostly affected during
the stress period was pods per plant.Reduction of number of pods with reduced
moisture level may be due to the abscission of flowers caused by moisture stress. This
was supported by Boutraa and Sanders (2001). Islam et al. (2004) concluded that under
severe stress, pod number is decreased. Xia (1994) further stated that under water
stress, the decrease on the number of flowers and pods for some legumes is due to a
great extent to a limited vegetative growth. Limiting the vegetative growth of branches
may decrease the source-sink relationship between leaves and pods (Abelardo et al.,
2005).
The results pertaining to the pod number per plant indicated that there was a significant
influence of potassium rates on number of pods per plant as P value is less than 0.05
(Table 2). Increasing level of potassium significantly increased the pods per plant
under optimal moisture level. 175% potassium level also increased the pod number
compared to recommended, 125% and 150% levels under sub-optimal condition. Islam
et al. (2004) stated that potassium increased the number of pods per plant irrespective
Rate of MOP
Potassium Content in Plant(mg/g)
Sub-optimal moisture Optimal moisture
125% 2.27± 0.02b 2.72± 0.14
b
150% 2.31± 0.02b 2.77± 0.02
b
175% 2.39± 0.01a 3.36± 0.12
a
Recommendation 2.18± 0.01c 2.64± 0.01
b
Moisture content P < 0.05
MOP P <0.05
Interaction P < 0.05
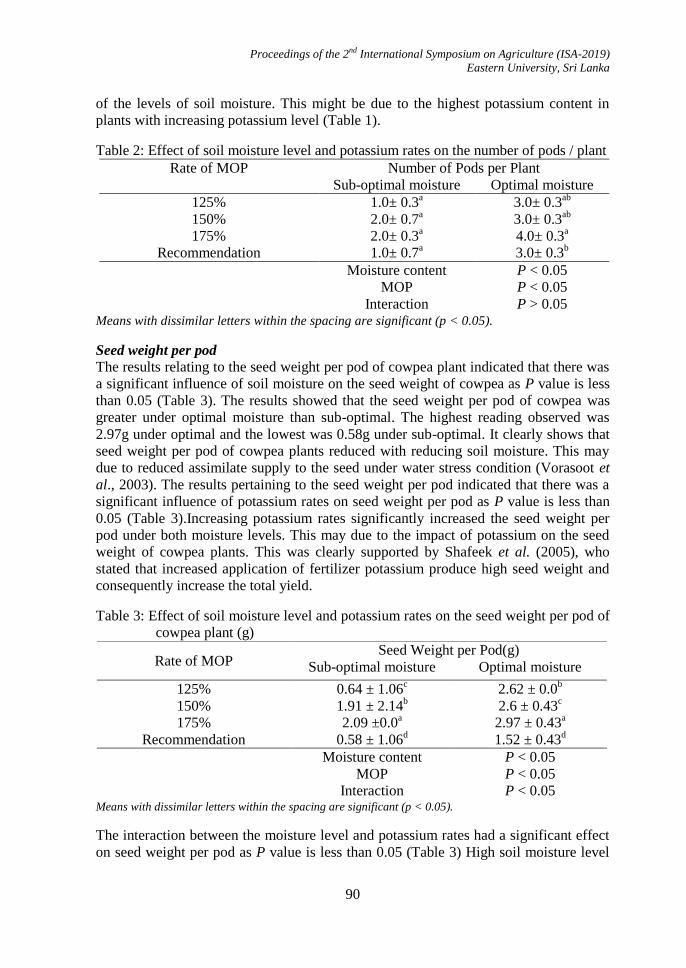
Proceedings of the 2nd International Symposium on Agriculture (ISA-2019)
Eastern University, Sri Lanka
90
of the levels of soil moisture. This might be due to the highest potassium content in
plants with increasing potassium level (Table 1).
Table 2: Effect of soil moisture level and potassium rates on the number of pods / plant
Means with dissimilar letters within the spacing are significant (p < 0.05).
Seed weight per pod
The results relating to the seed weight per pod of cowpea plant indicated that there was
a significant influence of soil moisture on the seed weight of cowpea as P value is less
than 0.05 (Table 3). The results showed that the seed weight per pod of cowpea was
greater under optimal moisture than sub-optimal. The highest reading observed was
2.97g under optimal and the lowest was 0.58g under sub-optimal. It clearly shows that
seed weight per pod of cowpea plants reduced with reducing soil moisture. This may
due to reduced assimilate supply to the seed under water stress condition (Vorasoot et
al., 2003). The results pertaining to the seed weight per pod indicated that there was a
significant influence of potassium rates on seed weight per pod as P value is less than
0.05 (Table 3).Increasing potassium rates significantly increased the seed weight per
pod under both moisture levels. This may due to the impact of potassium on the seed
weight of cowpea plants. This was clearly supported by Shafeek et al. (2005), who
stated that increased application of fertilizer potassium produce high seed weight and
consequently increase the total yield.
Table 3: Effect of soil moisture level and potassium rates on the seed weight per pod of
cowpea plant (g)
Means with dissimilar letters within the spacing are significant (p < 0.05).
The interaction between the moisture level and potassium rates had a significant effect
on seed weight per pod as P value is less than 0.05 (Table 3) High soil moisture level
Rate of MOP
Number of Pods per Plant
Sub-optimal moisture Optimal moisture
125% 1.0± 0.3a 3.0± 0.3
ab
150% 2.0± 0.7a 3.0± 0.3
ab
175% 2.0± 0.3a 4.0± 0.3
a
Recommendation 1.0± 0.7a 3.0± 0.3
b
Moisture content P < 0.05
MOP P < 0.05
Interaction P > 0.05
Rate of MOP Seed Weight per Pod(g)
Sub-optimal moisture Optimal moisture
125% 0.64 ± 1.06c 2.62 ± 0.0
b
150% 1.91 ± 2.14b 2.6 ± 0.43
c
175% 2.09 ±0.0a 2.97 ± 0.43
a
Recommendation 0.58 ± 1.06d 1.52 ± 0.43
d
Moisture content P < 0.05
MOP P < 0.05
Interaction P < 0.05
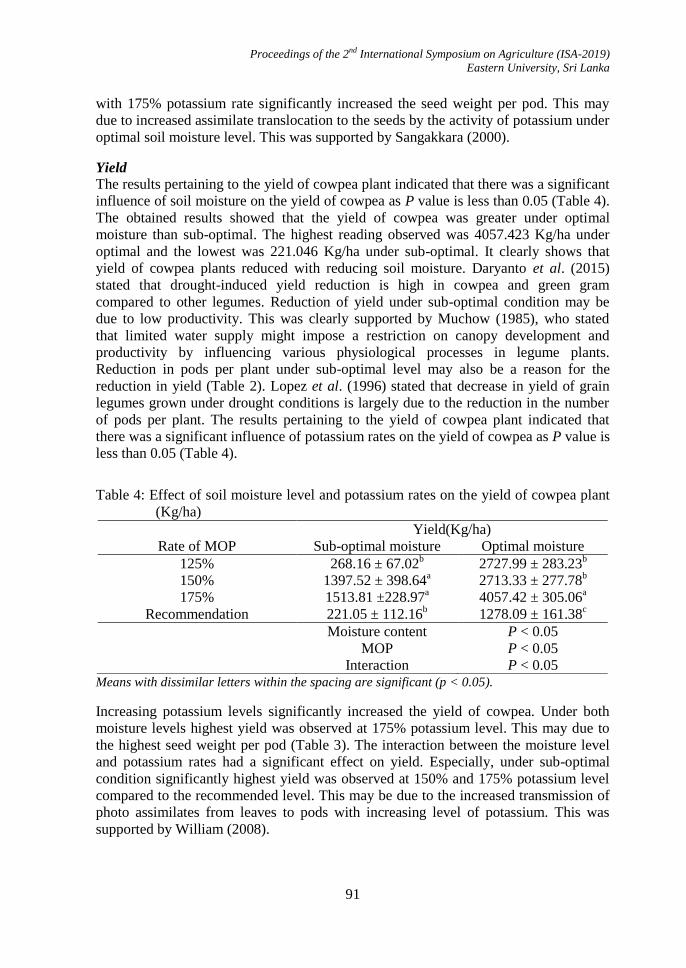
Proceedings of the 2nd International Symposium on Agriculture (ISA-2019)
Eastern University, Sri Lanka
91
with 175% potassium rate significantly increased the seed weight per pod. This may
due to increased assimilate translocation to the seeds by the activity of potassium under
optimal soil moisture level. This was supported by Sangakkara (2000).
Yield
The results pertaining to the yield of cowpea plant indicated that there was a significant
influence of soil moisture on the yield of cowpea as P value is less than 0.05 (Table 4).
The obtained results showed that the yield of cowpea was greater under optimal
moisture than sub-optimal. The highest reading observed was 4057.423 Kg/ha under
optimal and the lowest was 221.046 Kg/ha under sub-optimal. It clearly shows that
yield of cowpea plants reduced with reducing soil moisture. Daryanto et al. (2015)
stated that drought-induced yield reduction is high in cowpea and green gram
compared to other legumes. Reduction of yield under sub-optimal condition may be
due to low productivity. This was clearly supported by Muchow (1985), who stated
that limited water supply might impose a restriction on canopy development and
productivity by influencing various physiological processes in legume plants.
Reduction in pods per plant under sub-optimal level may also be a reason for the
reduction in yield (Table 2). Lopez et al. (1996) stated that decrease in yield of grain
legumes grown under drought conditions is largely due to the reduction in the number
of pods per plant. The results pertaining to the yield of cowpea plant indicated that
there was a significant influence of potassium rates on the yield of cowpea as P value is
less than 0.05 (Table 4).
Table 4: Effect of soil moisture level and potassium rates on the yield of cowpea plant
(Kg/ha)
Means with dissimilar letters within the spacing are significant (p < 0.05).
Increasing potassium levels significantly increased the yield of cowpea. Under both
moisture levels highest yield was observed at 175% potassium level. This may due to
the highest seed weight per pod (Table 3). The interaction between the moisture level
and potassium rates had a significant effect on yield. Especially, under sub-optimal
condition significantly highest yield was observed at 150% and 175% potassium level
compared to the recommended level. This may be due to the increased transmission of
photo assimilates from leaves to pods with increasing level of potassium. This was
supported by William (2008).
Rate of MOP
Yield(Kg/ha)
Sub-optimal moisture Optimal moisture
125% 268.16 ± 67.02b 2727.99 ± 283.23
b
150% 1397.52 ± 398.64a 2713.33 ± 277.78
b
175% 1513.81 ±228.97a
4057.42 ± 305.06a
Recommendation 221.05 ± 112.16b 1278.09 ± 161.38
c
Moisture content P < 0.05
MOP P < 0.05
Interaction P < 0.05
Proceedings of the 2nd International Symposium on Agriculture (ISA-2019)
Eastern University, Sri Lanka
92
Conclusions
From the experiment, it would be possible to conclude that, among the combinations
potassium rate at 175% of recommendation at optimal moisture level highly improved
cowpea potassium content and yield. It also increased the potassium content and yield
under sub-optimal moisture compared to recommended rate of potassium.
Acknowledgement
Staff of the Department of Agric.Chemistry who contributed in the experiment are
highly appreciated.
References
Abelardo Nuñez Barrios., Gerrit Hoogenboom and Dennis Scott Nesmith. (2005).
Drought stress and the distribution of vegetative and reproductive traits of a bean
cultivar. Scientia Agricola, (Piracicaba, Braz.), 62.
Asao, T., Asaduzzaman, M., Mondal, M.F., Tokura, M., Adachi, F., Ueno, M. and
Ban, T. (2013). Impact of reduced potassium nitrate concentrations in nutrient
solution on the growth, yield and fruit quality of melon in hydroponics. Scientia
Horticulturae. 164: 221–231.
Bawatharani, T., Mowjood, M. M., Dayawansa, N. K. and Kumaragamage, D. (2004).
Nitrate leaching as a function of fertilization and irrigation practices in sandy
regosols. Tropical Agricultural Research, 16, 172-180.
Boutraa, T. and Sanders, F.E. (2001). Influence of water stress on grain yield and
vegetative growth of two cultivars of bean (Phaseolus vulgaris L.). Journal of
Agronomy and Crop Science, 187, 251-257.
Daryanto, S., Wang, L. and Jacinthe, P.A. (2015). Global synthesis of drought effects
on food legume production. PLoS ONE, 10(6), e0127401.
Felício Lopo de Sá, A., Valiengo Valeri, S., Pessoa da Cruz, M., Barbosa, J., Machado
Rezende, G. and Pozzetti Teixeira, M. (2014). Effects of potassium application and
soil moisture on the growth of Corymbia citriodora plants. CERNE, 20(4), 645-651.
Fooladivanda, Z., Hassanzadehdelouei, M. and Zarifinia, N. (2014). Effects of water
stress and potassium on quantity traits of two varieties of mung bean (Vigna radiata
L.). Cercetari Agronomice in Moldova, 47,157.
Islam, M.S., Haque, M.M., Khan, M.M., Hidaka, T. and Karim, M.M. (2004). Effect of
fertilizer potassium on growth, yield and water relations of bushbean (Phaseolus
vulgaris L.) under water stress conditions. Japan Journal of Tropical Agriculture,
48(1), 1-9.
Lopez, F.B., Johansen, C. and Chauhan, Y.S. (1996). Effect of timing of drought stress
on phenology, yield and yield components of a short duration pigeon pea. Journal of
Agronomy and Crop Science, 177, 311-320.
Proceedings of the 2nd International Symposium on Agriculture (ISA-2019)
Eastern University, Sri Lanka
93
Mahouachi, J., Socorro, A.R. and Talon, M. (2006). Responses of papaya seedlings
(Carica papaya L.) to water stress and rehydration: growth, photosynthesis and
mineral nutrient imbalance. Plant and Soil, 281, 137-146.
Manjeru, P., Madanzi, T., Makeredza, B., Nciizah, A. and Sithole, M. (2007). Effects
of water stress at different growth stages on components and grain yield of common
bean (Phaseolus vulgaris L.). African Crop Science Conference Proceedings, 8,
299-303.
Mirza Hasanuzzaman., Borhannuddin Bhuyan, M.M., Kamrun Nahar., Shahadat
Hossain, M., Jubayer Al Mahmud., Shahadat Hossen, M., Abdul Awal Chowdhury
Masud., Moumita. and Masayuki, Fujita. (2018). Potassium: A vital regulator of
plant responses and tolerance to abiotic stresses. Agronomy, 8, 31.
Muchow, R.C. (1985). Analysis of the effects of water deficits on grain legumes grown
in a semi-arid tropical environment in terms of radiation, interception and its
efficiency of use. Field Crops Research, 1, 309-323.
Sangakkara, U. and Nissanka, S. (2017). Food security in Sri Lanka-agronomic
implication and potentials. Journal of the National Science Foundation of Sri
Lanka, 36, 17-24.
Sangakkara, U., Frehner, M. and Nosberger, J. (2001). Influence of soil moisture and
fertilizer potassium on the vegetative growth of mungbean (Vigna radiata L.
Wilczek) and cowpea (Vigna unguiculata L. Walp). Journal of Agronomy and Crop
Science, 186(2), 73-81.
Sara Bahrami-Radb. and Roghieh Hajibolanda. (2017). Effect of potassium application
in drought-stressed tobacco (Nicotiana rustica L.) plants: Comparison of root with
foliar application. Annals of Agricultural Science, 62(2), 121-130.
Shafeek, M.R., El-Zeiny, O.A.H. and Ahmed, M.E. (2005). Effect of natural phosphate
and potassium fertilizer on growth, yield and seed components of pea plant in new
reclaimed soil. Asian Journal of Plant Sciences, 4(6): 608-612.
Vorasoot, N., Patcharin, S., Chuttipong, S., Sanun, J. and Aran, P. (2003). Effect of
water stress on yield and agronomic characters of peanut (Arachis hypogaea L.).
Songklanakarin Journal of Science and Technology, 25(3) : 283-288.
Wang, M., Zheng, Q., Shen, Q. and Guo, S. (2013).The critical role of potassium in
plant stress response. International Journal of Molecular Sciences, 14, 7370-7390.
Wang, X., Xia, Y., Wang, L. and Chen, F. (2012). Research on the response of
different potassium efficiency cotton genotypes to water and low potassium stress.
Chinese Agricultural Science Bulletin, 28, 60-65.
William, T. P. (2008). Potassium influences on yield and quality production for maize,
wheat, soybean and cotton. Physiologia plantarum, 133(4), 670-81.
Xia, M.Z. (1994). Effect of soil drought during the generative development phase of
faba bean (Vicia faba L.) on photosynthetic characters and biomass
production. Journal of Agricultural Science, 122, 67-72.
Proceedings of the 2nd International Symposium on Agriculture (ISA-2019)
Eastern University, Sri Lanka
94
IMPACTS OF BIOCHAR ON EROSION POTENTIAL OF SOIL IN
SLOPE LAND
K. G. S. Madhushani* and A. Nanthakumaran
Department of Bio-Science, Faculty of Applied Science, Vavuniya Campus, University of Jaffna, Sri Lanka
*Corresponding author: [email protected]
Abstract
The study was conducted to evaluate the soil erosion potential in the slope land
incorporated with biochar produced by Pinus pinaster (Pinus), Eucalyptus tereticornis
(Eucalyptus) and Camellia sinensis (Tea). This study was conducted in Kandy district
between latitudes 7.2906° N, 80.6337° E during 27th of August to 20
th of November,
2017. There were sixteen plots of land prepared with the plot size of 1.5m x 2.0 mand
each type of biochar made from pinus, eucalyptus and tea incorporated into the 5 cm
top soilin each plotseparately. The Complete Randomized Design was used with four
treatments such as soil with tea biochar, soil with eucalyptus biochar, soil with pinus
biochar and the control with each of four replicates. At the bottom of these plots, a
ditch was excavated and covered with polythene and collected the eroded soil once in
two weeks after the incorporation of different biochar with soil. Duncan‟s multiple
range tests were carried out using SPSS 25.0. The estimated soil losses in the plots with
tea biochar, pinus biochar, eucalyptus biochar and control were 98.81g, 219.77g,
218.96g and 781.83 g respectively. There was a significant reduction in the rate of soil
erosion in the plots with tea biochar as 2.74 gm-2
week-1
. Plots with pinus and with
eucalyptus biochar had almost similar reduction in the soil erosion rate as 6.08 gm-
2week
-1 and 6.12 gm
-2week
-1 respectively while the erosion rate in the control plot
recorded as 21.72 gm-2
week-1
. Hence, application of tea biochar as a soil amendment
could be recommended to reduce the soil erosion significantly in slope land in the hilly
area.
Keywords: Biochar, Sloppy lands, Soil erosion
Introduction
Soil degradation refers the decline in soil condition caused by its improper use or poor
management. Erosion, hard setting and desertification affected the productivity of
agricultural lands and threatened the world‟s food security (Qadir et al., 2013;
Mandalandv and Sharda, 2013; Ziadatanda and Taimeh, 2013). Biochar is the carbon
rich product obtained from biomass such as wood, manure or leaves, heated in a closed
container with little or no available air. Biochar was used as a soil amendment
(McElligott, 2011). Biochar using locally available and renewable materials improved
soil fertility and nutrient use efficiency in a sustainable way (Lehman et al., 2009).
Biochar had been considered as a material for suitable organic amendment for
improving the physical properties and maintaining the fertility of soil, particularly for
degraded soils in subtropical and tropical regions (Chan et al., 2007; Deenik et al.,
Proceedings of the 2nd International Symposium on Agriculture (ISA-2019)
Eastern University, Sri Lanka
95
2011; VanZwieten et al., 2007). Hence, biochar may be a potential material for soil
amendment that could protect the erosion of soil from rapid degradation in the long
term, thus increasing the value and productivity of upcountry soils. Greater proportion
of the micro pores was yielded a higher surface area, and thus greater nutrient retention
capability (Warnock et al., 2007). Clay and Malo, (2012) reported that depending on
the type and amount of biochar applied, the changes in soil properties associated with
application as well as the physiochemical properties of the char itself, may impact the
use, rates and efficacious properties (Lehmann et al., 2003). Numerous studies have
indicated that biochar effectively improved soil structure (Atkinson et al., 2010; Jien
and Wang., 2013), soil aggregate stability (Herath et al., 2013; Dimoyiannis et al.,
2012; Cerda, 2000), and porosity (Lehmann et al., 2006) because of its high specific
area and inner porous structure.
Biochar had the potential impact on sustainable soil management in regional levels.
The contribution of biochar as a soil amendment was currently being assessed in two
main aspects. One was related to its potential to enhance the productivity of
agricultural systems and to combat land degradation by improving soil physical,
biological, and chemical properties. Natural organic materials (e.g. green manure) and
artificial polymers (e.g. polyacrylamides) had been used to ameliorate degraded soils
(Busscher et al., 2011; Hueso-Gonz´alez et al., 2014). Maintaining the long-term
aggregate stability of soils by applying fresh organic residues was difficult because of
the rapid degradation of the traditional amendments (Busscher et al., 2011). In
subtropical and tropical regions techniques such as retaining walls and shotcretes were
commonly used to protect soil from erosion; however, these techniques were
ineffective in in-situ condition (Chan et al., 2008). Therefore, the study was conducted
to explore the effect of biochar on the erosion potential in slope land soil.
Materials and Methods
Biochar preparation
The biochar preparation was done according to the Hansen et al. (2011). A small one
side open drum was taken. The center of the bottom and lid of the drum was
determined and square shape cuts with length and width about 10 cm in each side were
obtained. An iron bar was taken and drilled 2cm in diameter nozzles with 3 cm gaps in
each side. Then the prepared iron bar was vertically inserted into the prepared metal
drum. The bottom of the iron bar was reverted into bottom of the drum. Metal drum
was filled with cut pieces of tea wood chips, pinus cones and eucalyptus barks
separately. The lid was closed very tightly and the whole drum was placed on a rim.
Firewood was applied to the upper open of the iron bar and burnt around 90 minutes.
Pyrolysis process for the preparation of tea and eucalyptus biochar was taken 90
minutes whereas in pinus it was taken 120 minutes. After certain time the drum was
allowed to cool and biochar was taken out to air dry. Finally, biochar was grained,
sieved through mesh size of 2 mm sieve and packed into bags separately for the field
application. The field was selected in Kandy district between latitudes 7.2906° N,
80.6337° E.
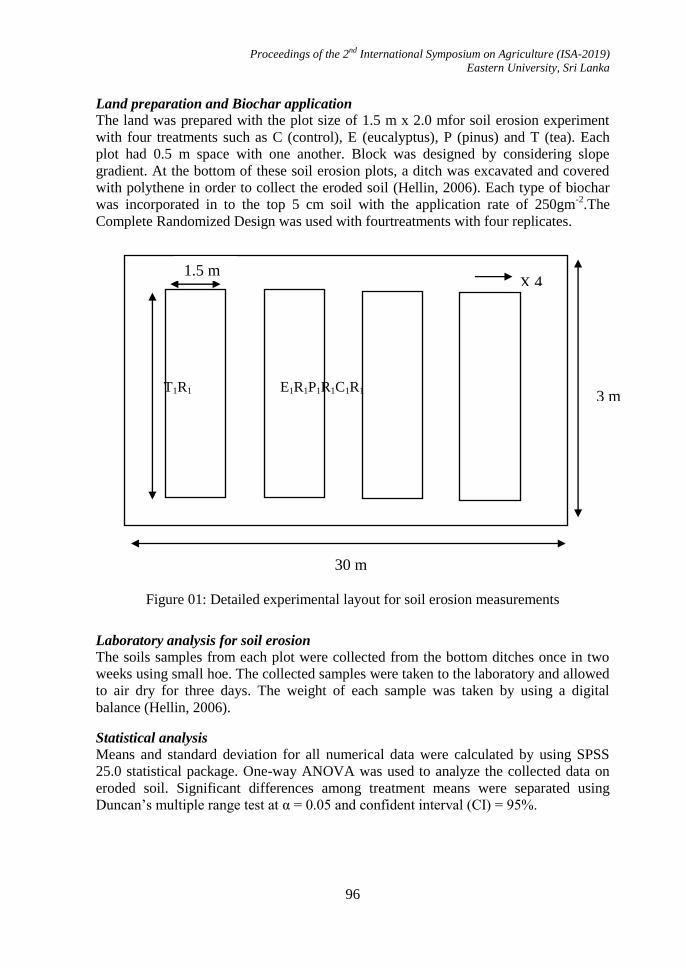
Proceedings of the 2nd International Symposium on Agriculture (ISA-2019)
Eastern University, Sri Lanka
96
2 m
Land preparation and Biochar application
The land was prepared with the plot size of 1.5 m x 2.0 mfor soil erosion experiment
with four treatments such as C (control), E (eucalyptus), P (pinus) and T (tea). Each
plot had 0.5 m space with one another. Block was designed by considering slope
gradient. At the bottom of these soil erosion plots, a ditch was excavated and covered
with polythene in order to collect the eroded soil (Hellin, 2006). Each type of biochar
was incorporated in to the top 5 cm soil with the application rate of 250gm-2
.The
Complete Randomized Design was used with fourtreatments with four replicates.
T1R1 E1R1P1R1C1R1
Figure 01: Detailed experimental layout for soil erosion measurements
Laboratory analysis for soil erosion
The soils samples from each plot were collected from the bottom ditches once in two
weeks using small hoe. The collected samples were taken to the laboratory and allowed
to air dry for three days. The weight of each sample was taken by using a digital
balance (Hellin, 2006).
Statistical analysis
Means and standard deviation for all numerical data were calculated by using SPSS
25.0 statistical package. One-way ANOVA was used to analyze the collected data on
eroded soil. Significant differences among treatment means were separated using
Duncan‟s multiple range test at α = 0.05 and confident interval (CI) = 95%.
30 m
3 m
1.5 m X 4
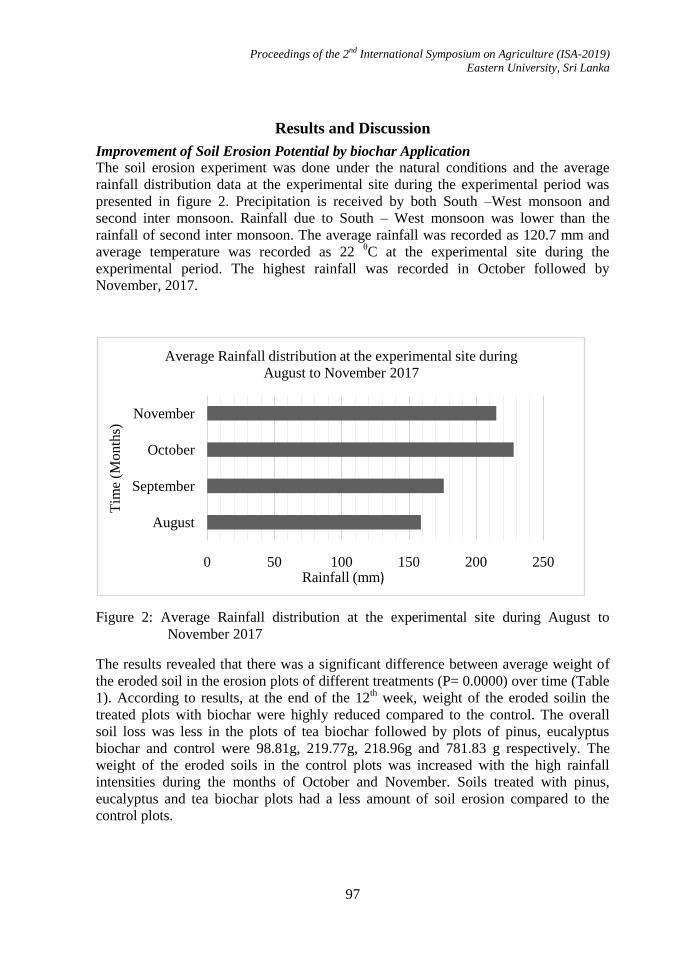
Proceedings of the 2nd International Symposium on Agriculture (ISA-2019)
Eastern University, Sri Lanka
97
Results and Discussion
Improvement of Soil Erosion Potential by biochar Application
The soil erosion experiment was done under the natural conditions and the average
rainfall distribution data at the experimental site during the experimental period was
presented in figure 2. Precipitation is received by both South –West monsoon and
second inter monsoon. Rainfall due to South – West monsoon was lower than the
rainfall of second inter monsoon. The average rainfall was recorded as 120.7 mm and
average temperature was recorded as 22 θC at the experimental site during the
experimental period. The highest rainfall was recorded in October followed by
November, 2017.
Figure 2: Average Rainfall distribution at the experimental site during August to
November 2017
The results revealed that there was a significant difference between average weight of
the eroded soil in the erosion plots of different treatments (P= 0.0000) over time (Table
1). According to results, at the end of the 12th week, weight of the eroded soilin the
treated plots with biochar were highly reduced compared to the control. The overall
soil loss was less in the plots of tea biochar followed by plots of pinus, eucalyptus
biochar and control were 98.81g, 219.77g, 218.96g and 781.83 g respectively. The
weight of the eroded soils in the control plots was increased with the high rainfall
intensities during the months of October and November. Soils treated with pinus,
eucalyptus and tea biochar plots had a less amount of soil erosion compared to the
control plots.
0 50 100 150 200 250
August
September
October
November
Rainfall (mm)
Tim
e (M
onth
s)
Average Rainfall distribution at the experimental site during
August to November 2017
Proceedings of the 2nd International Symposium on Agriculture (ISA-2019)
Eastern University, Sri Lanka
98
Table 1: Variation of mean weight of eroded soils with biochar from different materials
weekly
Weeks Control
g
Tea biochar
with Soil
g
Eucalyptus
biochar with Soil
g
Pinus biochar
with Soil
g
2nd
week 115.83 ± 1.70a 18.06 ± 0.67
c 40.83 ± 0.82
b 41.77 ± 1.17
b
4th week 127.56 ± 1.78
a 17.40 ± 0.46
c 39.50 ± 0.53
b 39.00 ± 0.62
b
6th week 133.67 ± 0.29
a 16.91 ± 0.38
c 35.70 ± 0.22
b 37.52 ± 0.16
b
8th week 129.47 ± 0.14
a 16.36 ± 0.34
c 37.40 ± 0.19
b 35.37 ± 0.23
b
10th week 142.66 ± 0.26
a 15.40 ± 0.16
c 36.52 ± 0.33
b 33.63 ± 0.29
b
12th week 131.82 ± 1.21
a 14.63 ± 0.18
c 32.98 ± 1.17
b 31.41 ± 0.19
b
(Means with the same letter are not significantly different at P <0.05 level based on Duncan‟s multiple
range test)
The erosion rate was determined by the loss of soil per area of soil erosion plot (3m2)
per week. There was a significant reduction of soil erosion rate in the plots of tea
biochar as 2.74 gm-2
week-1
. Plots of pinus and eucalyptus biochar had almost similar
reduction in the soil erosion rate as 6.08 gm-2
week-1
and 6.12 gm-2
week-1
respectively
while the erosion rate in the control plot recorded as 21.72 gm-2
week-1
.
Conclusions
Applying biochar as a suitable organic amendment can be effectively improves soil
physical properties and reduces potential for erosion in slope lands in hilly area. Soil
erosion was significantly decreased in biochar treated soils. Further the rate ofsoil erosion was greatly reduced in the plots applied with tea biochar. Meanwhile, biochar
application could be expected to significantly reduce soil loss contents by 21.72 gm-2
week-1
to 2.74 gm-2
week-1
. Hence, biochar may be a potential amendment that could
protect from soil erosion in rapid degraded soils in the long term, thus increasing the
value and productivity of the soils in hilly area.
Acknowledgement
Staff of the Physiology Division who contributed in collecting data are highly
appreciated.
References
Atkinson.C.J., Fitzgerald.J.D, and Hipps.N.A (2010). Potential mechanisms for
achieving agricultural benefits from biochar application to temperate soils: a
review, Plant and Soil, vol. 337, no. 1, pp. 1–18, 2010.
Busscher.W.J., Novak.J.M and Ahmedna.A (2011). Soil Science in Physical effects of
organic matter amendment of a southeastern US coastal loamy sand, vol. 176, pp.
661–667.

Proceedings of the 2nd International Symposium on Agriculture (ISA-2019)
Eastern University, Sri Lanka
99
Cerd`a (2000) Aggregate stability against water forces under different climates on
agriculture land and scrubland in southern Bolivia, Soil and Tillage Research, vol.
57, no. 3, pp.159–166.
Chan, K.Y., Van Zwieten, L., Maszaros, I., Downie, A and Joseph,S (2007).
Agronomic values of green waste biochar as a soil amendment. Australian Journal
of Soil Research, 45, 629-634.
Chan, K.Y., Van ZwietenL, Y., Eszaros, I., Downie, A and Joseph, S (2008). Using
poultry litter biochars as soil amendments. Australian journal of soil research, 46,5,
437–444.
Clay, S., and Malo, D. (2012) The Influence of Biochar Production on Herbicide
Sorption Characteristics. In: M. Hasaneen. Ed. Herbicides – Properties, Synthesis
and Control of Weeds. USA: InTech,pp.59-74.
Deenik, J.L., Diarra, A., Uehara, G., Campbell, S., Sumiyoshi, Y and Antaljr, M.J
(2011). Charcoal ash and volatile matter effects on soil properties and plant grow
thin an acidult, vol.176, pp.336–345.
Dimoyiannis, D. (2012). “Wet aggregate stability as affected by excess carbonate and
other soil properties,” Land Degradation and Development, vol.23, no.5, pp.450–
455.
Edwards, L., Burney, J.R., Richter, G., and MacRae, A.H. (2000) Evaluation of
compost and straw mulching on soil loss characteristics in erosion plots of potatoes
in Prince Edward Island, Canada,” Agriculture, Ecosystems and Environment,
vol.81, no.3, pp.217– 222.
Hansen, J., Kharecha, P., Sato, M., Epstein, P., Hearty, P., Hoegh-Guldberg, O.,
Parmesan, C., Rahmstorf, S., Rockstrom, J., Rohling, E., Sachs, J., Smith, P., Von
Schuckmann, K and Zachos, J. (2011). The Case for Young People and Nature in A
Path to a Healthy, Natural, Prosperous Future.
Hellin. J (2006). Better Land Husbandry in From Soil Conservation to Holistic Land
Management., (4: pp. 315). Enfield, USA: Science Publishers.
Herath, H.M.S.K,. Camps-Arbestain, M., and Hedley, M. (2013) Effect of biochar on
soil physical properties in two contrasting soils: anAlfisoland anAndisol.
Geoderma,vol.209-210,pp.188–197.
Hueso-Gonz´alez.P., Martinez-Murillo.J.F and Ruiz- Sinoga.J.D (2014). Land
Degradation & Development in the impact of organic amendments on forest soil
properties under Mediterranean climatic conditions.
Jien, S.H., and Wang, C.S. (2013) Effects of biochar on soil properties and erosion
potential in a highly weathered soil,Catena, vol. 110,pp.225–233.
Lehmann, J., De Silva J.P., Steiner, C., T. Nehls, Zech, W., and Glaser, B. (2003).
Nutrient availability and leaching in an archeological Anthrosols and a Ferralsol of
the Central Amazon Basin: Fertilizer, manure and charcoal amendments. Plant and
soil, Volume 249, pp.343-357.
Proceedings of the 2nd International Symposium on Agriculture (ISA-2019)
Eastern University, Sri Lanka
100
Lehmann, J., Gaunt J., and Rondon, M. (2006). Biochar sequestration in terrestrial
ecosystem – A review, Mitigation and Adaptation strategies for Global Changes,
Volume 11, pp.403-427.
Lehmann.J and Joseph.S (2009). Biochar for Environmental Management in An
Introduction to Biochar for Environmental Management pp 1-12.
Mandalandv.D and Sharda,N (2013) Land Degradation and Development in Appraisal
of soil erosion risk in the eastern Himalayan region of India for soil conservation
planning, (Series no 24 pp. 430–437).
McElligot, K. M (2011). Biochar amendments of forests soils in Effects on soil
properties and tree growth. M.Sc. Thesis, College of Graduate Studies, University of
Idaho. USA.
Qadir, M., Noble, A.D and Chartres, C (2013). Land Degradation and Development in
Adapting to climate change by improving water productivity of soils in dry areas
(pp. 12–21)
Van Zwieten, L., Kimber, S., Downie, A., Chan, K,Y., Cowie, A., Wainberg, R and
Morris, S (2007). Apermill char,Benefits to soil health and plant production.
Conference of the International Agrichar Initiative. Australia, Terrigal.
Warnock, D.D., Lehmann, J., Kuyper, T.W., and Rillig, M.C. (2007). Mycorrhizal
responses to biochar to mitigate global climate change. Nature Communications,
Volume 1, 56, pp.1-9.
Ziadatanda, F.M.Y and Taimeh, (2013) Land degradation and development in Effect of
rain fall intensity, slope, land use and antecedent soil moisture on soil erosion in an
arid environment, (Series no 24, pp. 582–590).
Proceedings of the 2nd International Symposium on Agriculture (ISA-2019)
Eastern University, Sri Lanka
101
EFFECT OF INORGANIC POTASSIUM FERTILIZER AND
SELECTED ORGANIC MANURES ON THE POTASSIUM
AVAILABILITY AND YIELD OF COWPEA (Vigna unguiculata) IN
SANDY REGOSOLS OF BATTICALOA DISTRICT, SRI LANKA
S. Shakithya*and P. Premanadarajah
Department of Agricultural Chemistry, Faculty of Agriculture, Eastern University, Sri Lanka
*Corresponding author: [email protected]
Abstract
Potassium fertilization facilitates the crops to survive under drought condition and
adding organic manures increases the soil moisture content in sandy soils. A pot
experiment was carried out at Eastern University, Sri Lanka during the period of July
to September 2018, to evaluate the effect of organic manures and different rates of
inorganic potassium on the yield of cowpea (Vigna unguiculata) in sandy regosol using
variety „Wijaya‟. There were eight treatments combining cow dung and compost with
muriate of potash (MOP) at the rate of 100%, 125%, 150% and 175% of the fertilizer
recommendation and were replicated three times in two factor factorial completely
randomized design (CRD). Highest yield was recorded in compost applied treatments.
Increasing rate of potassium increased the potassium uptake in plants. Highest yield
was obtained at treatment consists of combination of compost with 175% of the
recommended dosage of MOP. Therefore combination of compost with increasing rate
of MOP can be suggested to farmers especially for the cultivation of cowpea on sandy
regosols in order to obtain better yield.
Keywords: compost, cow dung, potassium, sandy soil, yield
Introduction
Sri Lanka has diverse soil types. Regosol is one of the major soil groups found in the
dry zone of Sri Lanka It is found along or near the coastal line such as Kalpitiya,
Nilavelly and most parts of Batticaloa district (Panabokke, 1996). Batticaloa district is
one of the intensive agricultural area in the eastern province of Sri Lanka. According to
the characteristics of the sandy regosol it is low in agricultural value and these soils are
light sandy textured with very low cation exchange properties. Thereby their nutrient
supplying capacity is very low (Imsamut and Boonsompoppan, 1999). In addition their
water holding capacity and organic matter content is very low. Therefore proper
management practices should be adopted to increase crop productivity.
As a result of climate change, drought is becoming a serious threat in Agriculture.
Drought is a major factor limiting productivity in agriculture and have caused a
collapse in food production by reducing uptake of water and nutrient (Du, et al., 2010).
In Sri Lanka about 66% of crop lands are rain-fed (Biradar, et al., 2009) and therefore
Proceedings of the 2nd International Symposium on Agriculture (ISA-2019)
Eastern University, Sri Lanka
102
increasingly vulnerable to the impacts of climate variability and extremes. So climate
change impacts should be overcome by appropriate management strategies.
Pulses are important component of the Agricultural sector in Developing countries due
to their significant capacity of protein rich seed production. Cowpea is an important
leguminous crop grown in Sri Lanka. It is grown in both Maha and Yala season as
mono and intercrop. It is used as green vegetables, pulses and also fodder. It plays an
important role in human diet and has its importance in Agriculture for various cropping
systems. Soil moisture is the principal environmental factor that limiting the legumes
productivity in Tropical countries (De Costa, et al., 1999).
Potassium (K+) is an essential element for plant growth. It is the most abundant cation
in plants, and increasing plant‟s total dry weight by 3–5% (Marschner, 1995). This
macronutrient is essential for many plant processes such as enzyme activation, protein
synthesis, photosynthesis, osmoregulation during cell expansion, stomatal movements,
solute phloem transport, electrical neutralization, regulation of membrane potential,
transport of sugars, and the maintenance of cation–anion balance in the cytosol as well
as in the vacuole (Maser, et al., 2002).
Drought is a significant limiting factor for agricultural productivity and generally
inhibits plant growth through reduced water absorption and nutrient uptake. Decreased
water availability generally results in reduced growth and final yield in crop plants.
Potassium ions contribute significantly to the osmotic potential of the vacuoles even
under drought conditions (Marschner, 1995). Plants adopted different mechanism to
survive with the different stresses. The use of minerals plays an important role in plants
resistance against the abiotic stresses. Among the nutrients, Potassium (K+) plays an
important role in growth and development and contributes significantly towards the
plants survival under drought stress (Hassan, et al., 2017).
Water Holding Capacity of soil is controlled primarily by the number of pores and
specific surface area of soil. Water Holding Capacity is increased when the number of
small pores increases. Sandy soils have much less surface area than clay soils, thus
retain less water at higher tensions. Addition of organic manures increases the specific
surface area and resulting in increased Water Holding Capacity. Soil texture and
organic manures are the key components that determine the soil water holding capacity
and the water retain by the organic manure is used by the plants and this addition
enhances plant growth and improves water use efficiency (Vengadaramana and
Jashothan, 2012).
Climate change is one of the major challenge in Agriculture. Drought causes severe
problems in cowpea cultivation in Eastern Region of Sri Lanka. Adding organic
manures increases the water holding capacity and application of potassium reduces the
moisture stress in cowpea (Hassan, et al., 2017). But the level of potassium and type
and amount of organic manure can applicable to increase the yield performance of
cowpea is scanty. The main emphasis here to determine the impact of type of organic
manure, rate of potassium and their interaction effect on the yield of cowpea variety
wijaya at drought condition.
Proceedings of the 2nd International Symposium on Agriculture (ISA-2019)
Eastern University, Sri Lanka
103
Materials and Methods
Description of experimental site
A pot experiment was conducted during yala season (July to September 2018) at
Eastern University, Sri Lanka, which is located in the low country, dry zone (DL2)
agro ecological zone. The monthly average temperature and humidity were 30-36ºC
and 66-81% respectively during the experiment period.
Description of soil and organic manures used in the experiment
The soil type used in this study was sandy regosol. It belongs to the group of
Tropofluvents as per United States Department of Agriculture soil taxonomy (De
Alwis and Panabokke, 1972). Initial potassium content of soil was analyzed using
flame photometer and value was 0.026mg/kg soil. Organic manures used in this
experiment were cow dung and compost and their available potassium contents were
0.67% and 0.53% respectively.
Treatments and experimental design
The treatments were evaluated to select the best combination of organic manure and
rate of potassium to tolerate the drought condition in sandy regosol at Batticaloa
region. The treatment combinations were laid out in two factor factorial Completely
Randomized Design and there were eight treatments with three replicates. Cow dung
and compost were used at the rate of 10 tons/ha and MOP was added at 100%, 125%,
150% and 175% of fertilizer recommendation for cowpea by the Department of
Agriculture, Sri Lanka. The treatments were,
O1K0- cow dung + 100% MOP
O1K1- cow dung + 125% MOP
O1K2- cow dung + 150% MOP
O1K3- cow dung + 175% MOP
O2K0- compost + 100% MOP
O2K1- compost + 125% MOP
O2K2- compost + 150% MOP
O2K3- compost + 175% MOP
Planting
A bulk soil sample was collected from an area where cultivation was not previously
carried out at 0-20 cm depth. The collected soil sample was processed and air dried for
a day. Then it was sieved (2mm mesh sieve) to avoid the soil heterogeneity. Each
polyethylene bag was filled with 7 kg processed soil. According to the treatments,
organic manures and fertilizers were incorporated in to the soil 3 days prior to the
planting. Pre-treated seeds were sown in each bag and two plants per bag were
maintained.
Watering
Water holding capacity of sole soil and soil with organic manures were measured in
volume basis. Watering was done according to the weight loss of individual treatments
at two days interval to maintain the required water holding capacity.

Proceedings of the 2nd International Symposium on Agriculture (ISA-2019)
Eastern University, Sri Lanka
104
Measurements
Manure analysis
Available potassium content of manures were extracted by triple acid and analyzed by
flame photometric method (Toth and Prince, 1949).
Plant analysis
Potassium content of plants in each treatment were extracted by triple acid and
analyzed by flame photometer.
Soil analysis
At harvesting potassium content of soil in each treatment were determined by flame
photometer.
Yield
Mature cowpea pods were harvested and dry seeds weight were taken in each
treatments.
Analysis of results
The data from experimental plants were statistically analyzed using Analysis of
Variance (ANOVA) to detect if there was any significance at treatment level. The
differences between treatment means were compared using Duncan‟s Multiple Range
Test (DMRT) using SAS 9.1.3 package.
Results and Discussion
Potassium content in soil and plant at harvesting
Significantly (p<0.05) highest potassium content in soil was recorded at the
combination of compost with 175% of the recommended dosage of MOP. Among the
organic manures highest soil potassium content was observed at compost applied soil
than cow dung. It could be due to the high exchangeable potassium content in compost
than cow dung (Tanseem et al., 2004 and Hossein 2014). Compost also increases
available form of nutrients in soil for plant (Soheil et al., 2012). Adugna (2016) stated
that compared to cow manure, compost release nutrients more slowly and have longer
lasting effects and the slow decomposition was more effective in increasing soil
nutrient content. Among the rate of potassium highest potassium content in soil was
observed at K3 followed by K2 and lowest was at K0. This statement was strengthen
by AFL Sa et al (2014) and Tariq et al (2011). They found that increase of potassium
content in soil was proportional to the increase of the doses of potassium fertilizer.
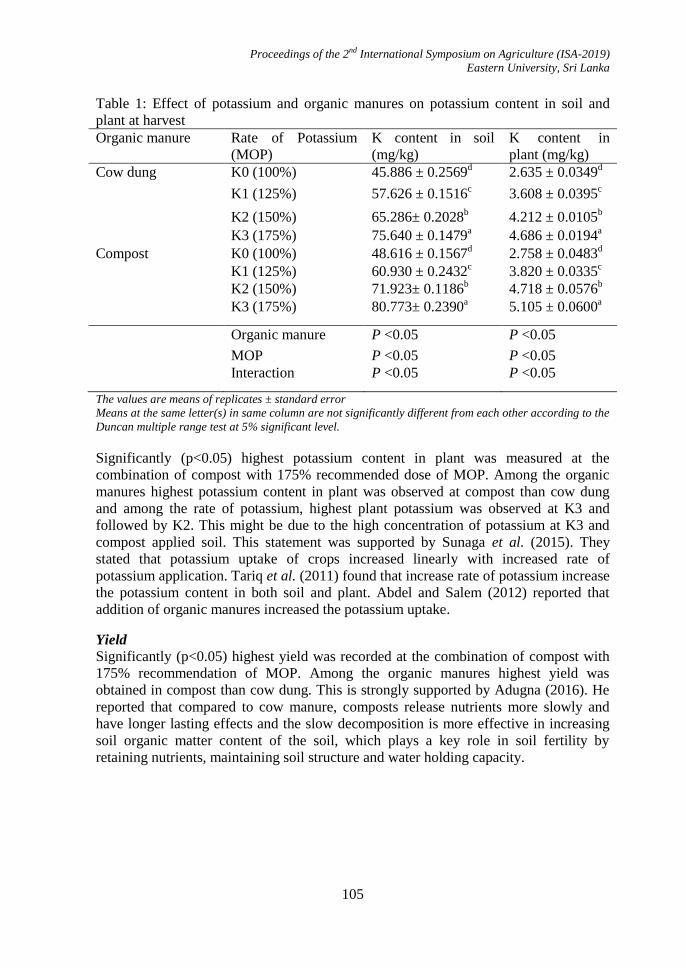
Proceedings of the 2nd International Symposium on Agriculture (ISA-2019)
Eastern University, Sri Lanka
105
Table 1: Effect of potassium and organic manures on potassium content in soil and
plant at harvest
Organic manure Rate of Potassium
(MOP)
K content in soil
(mg/kg)
K content in
plant (mg/kg)
Cow dung K0 (100%) 45.886 ± 0.2569d 2.635 ± 0.0349
d
K1 (125%) 57.626 ± 0.1516c 3.608 ± 0.0395
c
K2 (150%) 65.286± 0.2028b 4.212 ± 0.0105
b
K3 (175%) 75.640 ± 0.1479a 4.686 ± 0.0194
a
Compost K0 (100%) 48.616 ± 0.1567d 2.758 ± 0.0483
d
K1 (125%) 60.930 ± 0.2432c 3.820 ± 0.0335
c
K2 (150%) 71.923± 0.1186b 4.718 ± 0.0576
b
K3 (175%) 80.773± 0.2390a 5.105 ± 0.0600
a
Organic manure P <0.05 P <0.05
MOP P <0.05 P <0.05
Interaction P <0.05 P <0.05
The values are means of replicates ± standard error
Means at the same letter(s) in same column are not significantly different from each other according to the
Duncan multiple range test at 5% significant level.
Significantly (p<0.05) highest potassium content in plant was measured at the
combination of compost with 175% recommended dose of MOP. Among the organic
manures highest potassium content in plant was observed at compost than cow dung
and among the rate of potassium, highest plant potassium was observed at K3 and
followed by K2. This might be due to the high concentration of potassium at K3 and
compost applied soil. This statement was supported by Sunaga et al. (2015). They
stated that potassium uptake of crops increased linearly with increased rate of
potassium application. Tariq et al. (2011) found that increase rate of potassium increase
the potassium content in both soil and plant. Abdel and Salem (2012) reported that
addition of organic manures increased the potassium uptake.
Yield
Significantly (p<0.05) highest yield was recorded at the combination of compost with
175% recommendation of MOP. Among the organic manures highest yield was
obtained in compost than cow dung. This is strongly supported by Adugna (2016). He
reported that compared to cow manure, composts release nutrients more slowly and
have longer lasting effects and the slow decomposition is more effective in increasing
soil organic matter content of the soil, which plays a key role in soil fertility by
retaining nutrients, maintaining soil structure and water holding capacity.
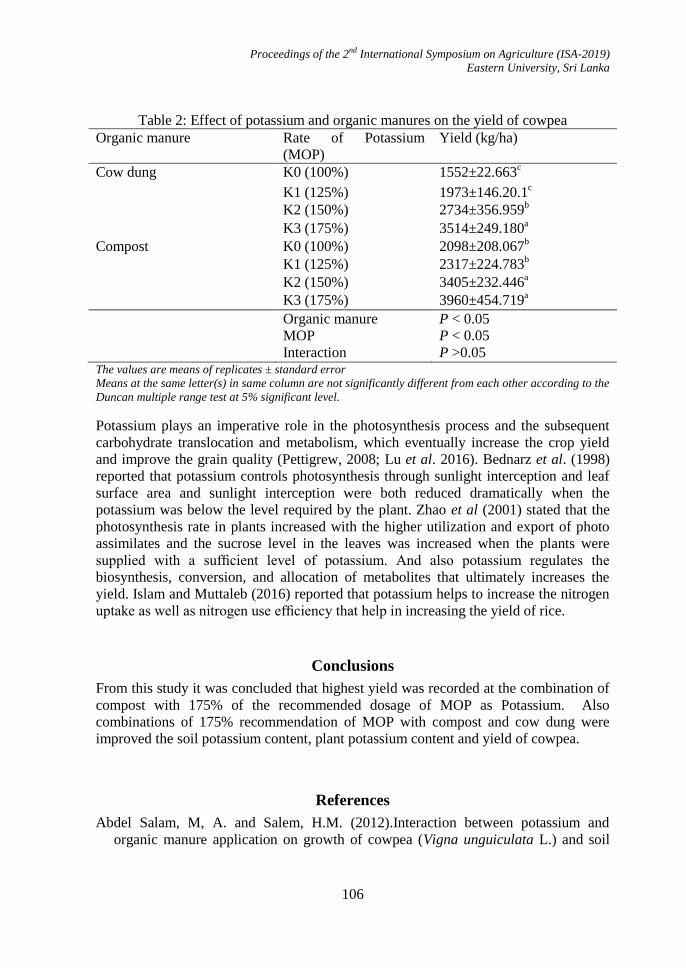
Proceedings of the 2nd International Symposium on Agriculture (ISA-2019)
Eastern University, Sri Lanka
106
Table 2: Effect of potassium and organic manures on the yield of cowpea
Organic manure Rate of Potassium
(MOP)
Yield (kg/ha)
Cow dung K0 (100%) 1552±22.663c
K1 (125%) 1973±146.20.1c
K2 (150%) 2734±356.959b
K3 (175%) 3514±249.180a
Compost K0 (100%) 2098±208.067b
K1 (125%) 2317±224.783b
K2 (150%) 3405±232.446a
K3 (175%) 3960±454.719a
Organic manure P < 0.05
MOP P < 0.05
Interaction P >0.05 The values are means of replicates ± standard error
Means at the same letter(s) in same column are not significantly different from each other according to the
Duncan multiple range test at 5% significant level.
Potassium plays an imperative role in the photosynthesis process and the subsequent
carbohydrate translocation and metabolism, which eventually increase the crop yield
and improve the grain quality (Pettigrew, 2008; Lu et al. 2016). Bednarz et al. (1998)
reported that potassium controls photosynthesis through sunlight interception and leaf
surface area and sunlight interception were both reduced dramatically when the
potassium was below the level required by the plant. Zhao et al (2001) stated that the
photosynthesis rate in plants increased with the higher utilization and export of photo
assimilates and the sucrose level in the leaves was increased when the plants were
supplied with a sufficient level of potassium. And also potassium regulates the
biosynthesis, conversion, and allocation of metabolites that ultimately increases the
yield. Islam and Muttaleb (2016) reported that potassium helps to increase the nitrogen
uptake as well as nitrogen use efficiency that help in increasing the yield of rice.
Conclusions
From this study it was concluded that highest yield was recorded at the combination of
compost with 175% of the recommended dosage of MOP as Potassium. Also
combinations of 175% recommendation of MOP with compost and cow dung were
improved the soil potassium content, plant potassium content and yield of cowpea.
References
Abdel Salam, M, A. and Salem, H.M. (2012).Interaction between potassium and
organic manure application on growth of cowpea (Vigna unguiculata L.) and soil
Proceedings of the 2nd International Symposium on Agriculture (ISA-2019)
Eastern University, Sri Lanka
107
properties in newly reclaimed sandy soil. World Journal of Agricultural Sciences. 8
(2): 141-149.
Adugna Getinet. (2016). A review on impact of compost on soil properties, water use
and crop productivity. Academic Research Journal of Agricultural Science and
Research. 4(3): 93-104.
Ariadne Felicio Lopa de Sa., Sergio Valiengo Valeri., Mara Cristina Pessoa da Cruz.,
Jose Carlos Barbosa., Gustavo Machado Rezende. And Matheus Pozzetti Teixeira.
(2014). Effects of potassium application and soil moisture on the growth of
Corymbia citridora plants. CERNE. 20(4): 645-651.
Bednarz, C.W., Oosterhuis, D.M. and Evans, R.D. (1998) Leaf photosynthesis and
carbon isotope discrimination of cotton in response to potassium deficiency.
Environmental and Experimental Botany. 39: 131–139.
Biradar, C., Thenkabail, P., Noojipady, P., Yuanjie, L., Dheeravath, V., & Velpuri, M.
(2009). A global map of rainfed cropland areas millenium using remote sensing.
International Journal of applied earth observation and geo information, 11: 114-129.
DaCosta, M., and Huang, B. (2006). Osmotic adjustment associated with variation in
bentgrass tolerance to drought stress. American society of horticultural science, 131:
338-344.
De Alwis, K. A. and Panabokke, C.R. (1972). Handbook of the soils of Sri Lanka.
Journal of Soil Science Society Ceylon, 2:43.
Du, N., Guo, W., Zhang, X., and Wang, R. (2010). Morphological and physiological
responses of Vitex negundo L. var. heterophylla (Franch.) Rehd to drought stress.
Acta Physiologiae Plantarum, 32: 839-848.
Hassan, M. U., Aamer, M., Chattha, M. U., Ullah, M. A., Sulaman, S., Nawaz, M.,
Guoqin, H. (2017). The Role of Potassium in Plants under Drought Stress: Mini
Review. Journal of Basic & Applied Sciences, 13: 268-271.
Hussain, T.A. (1994). Effect of NPK application on the growth and yield of mungbean
(Vigna radiata L.) Agronomy. 37(3): 549-551.
Imsamut, S., and Boonsompoppan, B. (1999). Established Soil Series in the Northeast
of Thailand. Thailand: Department of Land Development, Bangkok.
Islam, A and Muttaleb, A. (2016). Effect of potassium fertilization on yield and
potassium nutrition of Boro rice in a wetland ecosystem of Bangladesh. Archives of
Agronomy and Soil Science.62: 1530–1540.
Lu, Z., Lu, J., Pan, Y., Lu, P., Li, X., Cong, R. and Ren, T. (2016) Anatomical variation
of mesophyll conductance under potassium deficiency has a vital role in
determining leaf photosynthesis. Plant Cell Environment. 39: 2428–2439.
Marschner, H. (1995). Mineral Nutrition of Higher Plants (2nd Ed.). San Diego:
Academic Press.
Proceedings of the 2nd International Symposium on Agriculture (ISA-2019)
Eastern University, Sri Lanka
108
Maser, P., Gierth, M., and Schroeder, J. (2002). Molecular mechanisms of potassium
and sodium uptake in plants. Plant and soil. 247: 43-54.
Panabokke, C. (1996). Soils and Agro-Ecological Environments of Sri Lanka. Sri
Lanka: Natural Resources, Energy and Science Authority of Sri Lanka.
Pettigrew, W.T. (2008). Potassium influences on yield and quality production for
maize, wheat, soybean and cotton. Physiologia Plantarum.133: 670–681.
Soheil, R., Hossien, M, H., Gholamreza, S., Leila, H., Mozhdeh, J and Hassan, E.
(2012). Effects of Composted municipal waste and its Leachate on Some Soil
Chemical Properties and Corn Plant Responses. International Journal of Agriculture.
2(6): 801-814.
Sunanga, Yoshihito., Hisatomi Harada and Tahei Kawachi. (2015). Potassium
fertilization and soil diagnostic criteria for forage corn (Zea mays L.) production
contributing to lower potassium input in regional fertilizer recommendation. Soil
science and plant nutrition. 61: 957-971.
Tariq, M., A. Saeed., M. Nisar., I.A. Mian and M. Afzal. (2011). Effect of potassium
rates and sources on the growth performance and on chloride accumulation of maize
in two different textured soils of Haripur, Hazara Division. Sarhad Journal of
Agriculture. 27(3): 415-422.
Tasneem, K., Tariq, M., Kamal, J. and Masood, A. (2004). Effectiveness of farmyard
manure and poultry manure and nitrogen for corn productivity. International Journal
of Agriculture and Biology. 6 (2): 260-263.
Toth, S., and Prince, A. (1949). Estimation of cation exchange capacity and
exchangeable Ca, K and Na contents of soils by flame photometer techniques. Soil
Science. 67: 439-446.
Vengadaramana, A., and Jashothan, P. (2012). Effect of organic fertilizers on the water
holding capacity of soil in different terrains of Jaffna peninsula in Sri Lanka. Journal
of natural product and plant resources. 4: 500-503.
Zhao, D., Oosterhuis, D.M. and Bednarz, C.W. (2001). Influence of potassium
deficiency on photosynthesis, chlorophyll content, and chloroplast ultrastructure of
cotton plants. Photosynthetica. 39: 103–109.
Proceedings of the 2nd International Symposium on Agriculture (ISA-2019)
Eastern University, Sri Lanka
109
PERCEPTION OF CLIMATE CHANGE AND ITS EFFECT ON
HUMAN HEALTH: A PRELIMINARY SURVEY AMONG THE STAFF
AT EASTERN UNIVERSITY, SRI LANKA
Kavuriel Eliyas Karunakaran1*
, Selvanayagam Santharooban2 and
Mohamed Faleel Mohamed Marsook3
1 Department of Clinical Sciences, Faculty of Health-Care Sciences, Eastern University, Sri Lanka 2 Senior Assistant Librarian, Faculty of Health-Care Sciences, Eastern University, Sri Lanka
3 Senior Assistant Registrar, Eastern University, Sri Lanka
*Corresponding author: [email protected]
Abstract
Climate change has been a global issue and Sri Lanka is no exception. The projected
temperature rise rainfall change impact on crops yield and human health are at
alarming levels along with natural disasters. Awareness on minimizing the adverse
climate change to mitigate becomes mandatory. This preliminary study among the
employees of Eastern University, Sri Lanka (EUSL) aims at analyzing their perception
with regard to the climate change, happening in their living vicinity. A number of fifty
four staff volunteered to enroll in this study. A pre-tested questionnaire was used to
gather data through statements with five point Likert scale and analyzed using
descriptive statistics and chi-square-goodness of test. Among the participants 43 (80%)
has educational qualifications GCE Advanced level or beyond and 61% were holding
the intermediate position. 61.1% responded that there has been high level of change in
the climate in their living environment during last ten years with regard to the increase
of heat and low rainfall . The result was statistically significant for chi-squared-
goodness- of-fit test (p<0.05). With regard to the crop production in recent years, the
response was that 37% said no change in yield of agricultural crops while 57.4% said
reduction in the yield (p<0.05). Majority, (85.1%) responded increase in the illnesses in
recent years and illness such as Dengue, Bronchial asthma and common cold were the
most common illnesses. The participants opinions regarding the steps taken to
minimize/mitigate climate change were categorized into three topics such as
Preservation of nature, Control of greenhouse gas emission and Making awareness
among public. Majority of the participants prefer to know more on the climate change
issues. The study thus concludes that the staff in the study are well aware on the ill
effects of the climate change on the environment, crops yield and human health,
measures to be taken to minimize them and prefer further training indicating that
climate change education should need to be an agenda in university activities.
Keywords: Climate change, Crop production, Human health, Staff perception, Yield of
agriculture.

Proceedings of the 2nd International Symposium on Agriculture (ISA-2019)
Eastern University, Sri Lanka
110
Introduction
Climate change has been a global issue and Sri Lanka is no exception. It appears that
the climatic parameters are gradually worsen in Sri Lanka along with global trend. The
second national commission on climatic change report that during the 40 years period
from 1961-2000, revealed that temperature increase of minimum of 0.27ºC and
maximum of 0.46ºC per decade had been noted in Sri Lanka (Ministry of Environment,
2011). As per the World Health Organization (WHO) report, the mean annual
temperature of Sri Lanka is expected to rise by 3.7ºC from 1900 to 2100 under the high
emission scenario (WHO, 2015). The projections of rainfall also changes which may
lead even to change the demarcation of dry and wet zone with reduction in the land
area of wet zone. It has also been projected that an annual average of 65,600 people
will be affected by sea level rise between 2070 and 2100 (Ministry of Environment,
2011).
As projected, drought, floods, storm surges, increased rainfall variability, landslide, sea
erosion and related crop destruction are the regular occurrences for the last two decades
in Sri Lanka which might be the result of direct and indirect impacts on climatic
condition. These direct and indirect effects ultimately have impact on agriculture and
food security, loss of water resources and finally affect the economy of the county.
Apart from the effect of climate change on economy and property, impact of climate
change on health system has also been reported by researchers. As noted by the WHO,
the climate change not only affects the biological system but also pose „significant and
emerging threat to public health‟ particularly in low income countries (Dunlap and
McCright, 2008; IPCC, 2001). The increased temperature may also lead to spread of
vector borne diseases especially the disease like Dengue which is spread by Mosquito.
Further, the polluted water, extreme weather events also increase the risk of vector-
borne, rodent-borne, food and water borne diseases (Ministry of Environment, 2011).It
has been predicted that diseases such as malaria and dengue will increase towards 2070
under both high and low emissions scenarios and likewise, elderly death has been
predicted to increase 22 deaths/100,000 by 2080 (WHO, 2015).
In this context, it is essential to study the public perception of effect of climate change
which would help designing specific programs on this issue. There are several similar
studies both in developed (DeBono et al., 2012; González and Da Silveira, 1997;
McMichael and Butler, 2006; Preet et al., 2010) and developing countries (Chaudhary
and Bawa, 2011; Emch et al., 2008; Haque et al., 2012; Toan et al., 2014) in this
regard.
Objectives of the study
This study aims to analyze the perception of the staff working at Eastern University,
Sri Lanka (EUSL) with regard to the climate change, happening in their living vicinity.
Specific Objectives
To analyze perception of staff on the climate change in their surroundings
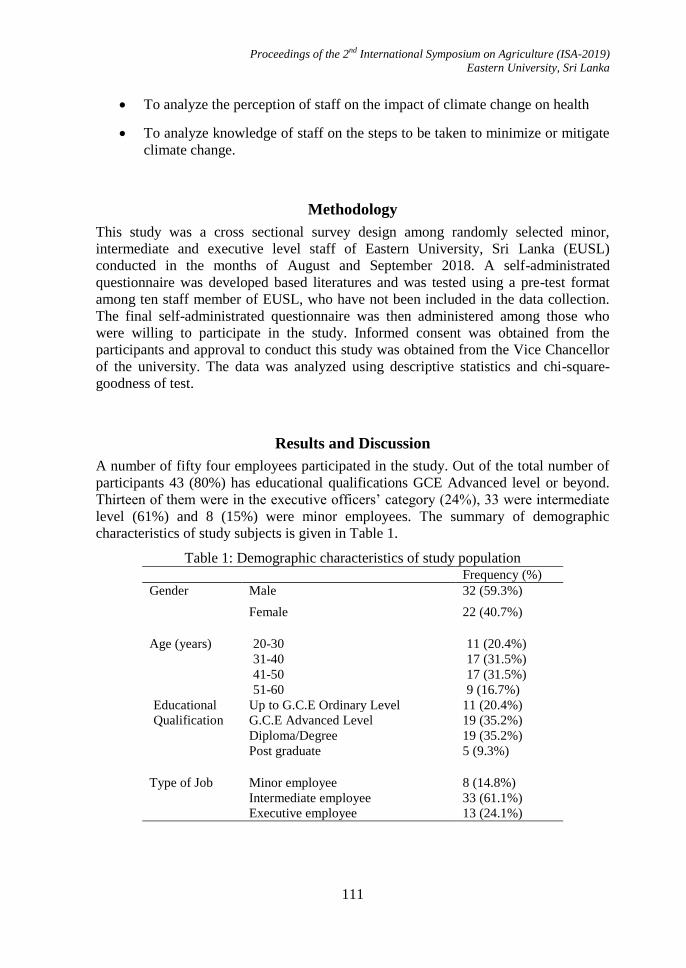
Proceedings of the 2nd International Symposium on Agriculture (ISA-2019)
Eastern University, Sri Lanka
111
To analyze the perception of staff on the impact of climate change on health
To analyze knowledge of staff on the steps to be taken to minimize or mitigate
climate change.
Methodology
This study was a cross sectional survey design among randomly selected minor,
intermediate and executive level staff of Eastern University, Sri Lanka (EUSL)
conducted in the months of August and September 2018. A self-administrated
questionnaire was developed based literatures and was tested using a pre-test format
among ten staff member of EUSL, who have not been included in the data collection.
The final self-administrated questionnaire was then administered among those who
were willing to participate in the study. Informed consent was obtained from the
participants and approval to conduct this study was obtained from the Vice Chancellor
of the university. The data was analyzed using descriptive statistics and chi-square-
goodness of test.
Results and Discussion
A number of fifty four employees participated in the study. Out of the total number of
participants 43 (80%) has educational qualifications GCE Advanced level or beyond.
Thirteen of them were in the executive officers‟ category (24%), 33 were intermediate
level (61%) and 8 (15%) were minor employees. The summary of demographic
characteristics of study subjects is given in Table 1.
Table 1: Demographic characteristics of study population Frequency (%)
Gender Male 32 (59.3%)
Female 22 (40.7%)
Age (years) 20-30 11 (20.4%)
31-40 17 (31.5%)
41-50 17 (31.5%)
51-60 9 (16.7%)
Educational
Qualification
Up to G.C.E Ordinary Level 11 (20.4%)
G.C.E Advanced Level 19 (35.2%)
Diploma/Degree 19 (35.2%)
Post graduate 5 (9.3%)
Type of Job Minor employee 8 (14.8%)
Intermediate employee 33 (61.1%)
Executive employee 13 (24.1%)
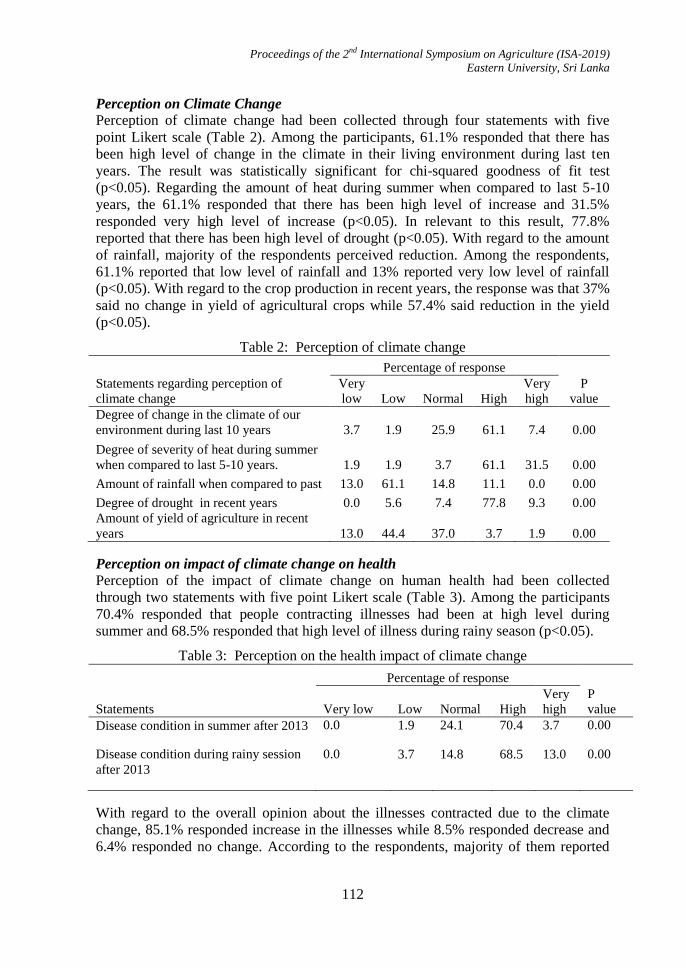
Proceedings of the 2nd International Symposium on Agriculture (ISA-2019)
Eastern University, Sri Lanka
112
Perception on Climate Change Perception of climate change had been collected through four statements with five
point Likert scale (Table 2). Among the participants, 61.1% responded that there has
been high level of change in the climate in their living environment during last ten
years. The result was statistically significant for chi-squared goodness of fit test
(p<0.05). Regarding the amount of heat during summer when compared to last 5-10
years, the 61.1% responded that there has been high level of increase and 31.5%
responded very high level of increase (p<0.05). In relevant to this result, 77.8%
reported that there has been high level of drought (p<0.05). With regard to the amount
of rainfall, majority of the respondents perceived reduction. Among the respondents,
61.1% reported that low level of rainfall and 13% reported very low level of rainfall
(p<0.05). With regard to the crop production in recent years, the response was that 37%
said no change in yield of agricultural crops while 57.4% said reduction in the yield
(p<0.05).
Table 2: Perception of climate change
Statements regarding perception of
climate change
Percentage of response
P
value
Very
low Low Normal High
Very
high
Degree of change in the climate of our
environment during last 10 years 3.7 1.9 25.9 61.1 7.4 0.00
Degree of severity of heat during summer
when compared to last 5-10 years. 1.9 1.9 3.7 61.1 31.5 0.00
Amount of rainfall when compared to past 13.0 61.1 14.8 11.1 0.0 0.00
Degree of drought in recent years 0.0 5.6 7.4 77.8 9.3 0.00
Amount of yield of agriculture in recent
years 13.0 44.4 37.0 3.7 1.9 0.00
Perception on impact of climate change on health Perception of the impact of climate change on human health had been collected
through two statements with five point Likert scale (Table 3). Among the participants
70.4% responded that people contracting illnesses had been at high level during
summer and 68.5% responded that high level of illness during rainy season (p<0.05).
Table 3: Perception on the health impact of climate change
Statements
Percentage of response
P
value Very low Low Normal High
Very
high
Disease condition in summer after 2013 0.0 1.9 24.1 70.4 3.7 0.00
Disease condition during rainy session
after 2013
0.0 3.7 14.8 68.5 13.0 0.00
With regard to the overall opinion about the illnesses contracted due to the climate
change, 85.1% responded increase in the illnesses while 8.5% responded decrease and
6.4% responded no change. According to the respondents, majority of them reported
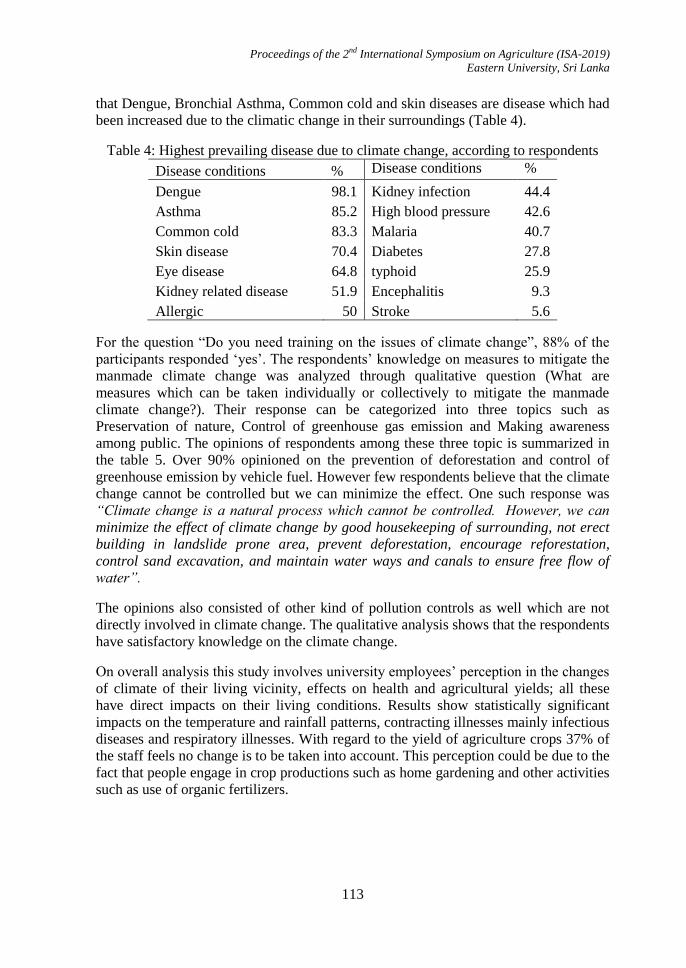
Proceedings of the 2nd International Symposium on Agriculture (ISA-2019)
Eastern University, Sri Lanka
113
that Dengue, Bronchial Asthma, Common cold and skin diseases are disease which had
been increased due to the climatic change in their surroundings (Table 4).
Table 4: Highest prevailing disease due to climate change, according to respondents
Disease conditions % Disease conditions %
Dengue 98.1 Kidney infection 44.4
Asthma 85.2 High blood pressure 42.6
Common cold 83.3 Malaria 40.7
Skin disease 70.4 Diabetes 27.8
Eye disease 64.8 typhoid 25.9
Kidney related disease 51.9 Encephalitis 9.3
Allergic 50 Stroke 5.6
For the question “Do you need training on the issues of climate change”, 88% of the
participants responded „yes‟. The respondents‟ knowledge on measures to mitigate the
manmade climate change was analyzed through qualitative question (What are
measures which can be taken individually or collectively to mitigate the manmade
climate change?). Their response can be categorized into three topics such as
Preservation of nature, Control of greenhouse gas emission and Making awareness
among public. The opinions of respondents among these three topic is summarized in
the table 5. Over 90% opinioned on the prevention of deforestation and control of
greenhouse emission by vehicle fuel. However few respondents believe that the climate
change cannot be controlled but we can minimize the effect. One such response was
“Climate change is a natural process which cannot be controlled. However, we can
minimize the effect of climate change by good housekeeping of surrounding, not erect
building in landslide prone area, prevent deforestation, encourage reforestation,
control sand excavation, and maintain water ways and canals to ensure free flow of
water”.
The opinions also consisted of other kind of pollution controls as well which are not
directly involved in climate change. The qualitative analysis shows that the respondents
have satisfactory knowledge on the climate change.
On overall analysis this study involves university employees‟ perception in the changes
of climate of their living vicinity, effects on health and agricultural yields; all these
have direct impacts on their living conditions. Results show statistically significant
impacts on the temperature and rainfall patterns, contracting illnesses mainly infectious
diseases and respiratory illnesses. With regard to the yield of agriculture crops 37% of
the staff feels no change is to be taken into account. This perception could be due to the
fact that people engage in crop productions such as home gardening and other activities
such as use of organic fertilizers.
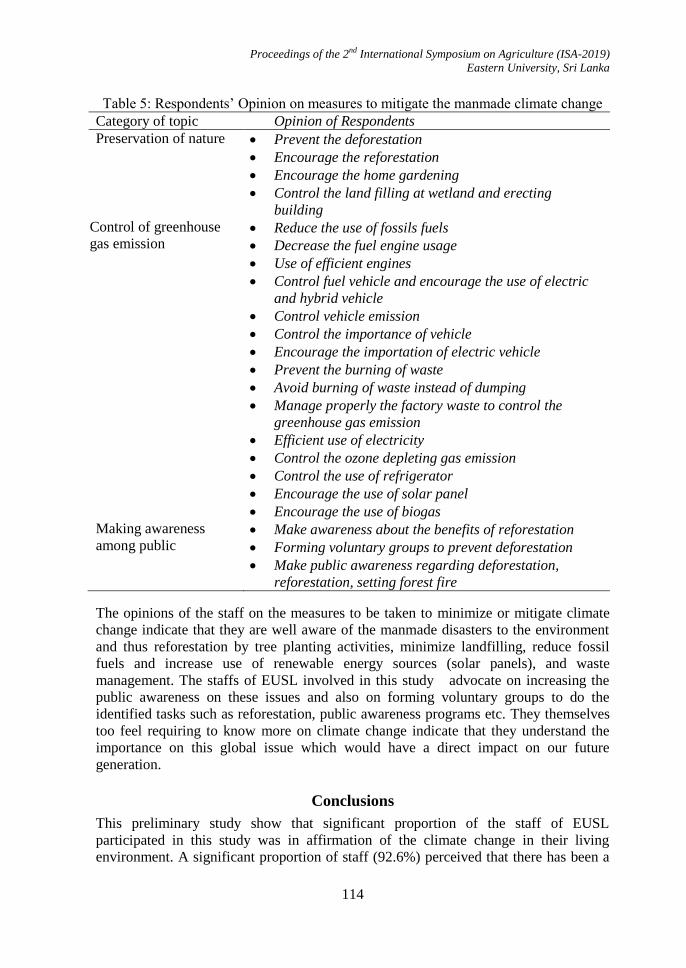
Proceedings of the 2nd International Symposium on Agriculture (ISA-2019)
Eastern University, Sri Lanka
114
Table 5: Respondents‟ Opinion on measures to mitigate the manmade climate change
Category of topic Opinion of Respondents
Preservation of nature
Prevent the deforestation
Encourage the reforestation
Encourage the home gardening
Control the land filling at wetland and erecting
building
Control of greenhouse
gas emission
Reduce the use of fossils fuels
Decrease the fuel engine usage
Use of efficient engines
Control fuel vehicle and encourage the use of electric
and hybrid vehicle
Control vehicle emission
Control the importance of vehicle
Encourage the importation of electric vehicle
Prevent the burning of waste
Avoid burning of waste instead of dumping
Manage properly the factory waste to control the
greenhouse gas emission
Efficient use of electricity
Control the ozone depleting gas emission
Control the use of refrigerator
Encourage the use of solar panel
Encourage the use of biogas
Making awareness
among public
Make awareness about the benefits of reforestation
Forming voluntary groups to prevent deforestation
Make public awareness regarding deforestation,
reforestation, setting forest fire
The opinions of the staff on the measures to be taken to minimize or mitigate climate
change indicate that they are well aware of the manmade disasters to the environment
and thus reforestation by tree planting activities, minimize landfilling, reduce fossil
fuels and increase use of renewable energy sources (solar panels), and waste
management. The staffs of EUSL involved in this study advocate on increasing the
public awareness on these issues and also on forming voluntary groups to do the
identified tasks such as reforestation, public awareness programs etc. They themselves
too feel requiring to know more on climate change indicate that they understand the
importance on this global issue which would have a direct impact on our future
generation.
Conclusions
This preliminary study show that significant proportion of the staff of EUSL
participated in this study was in affirmation of the climate change in their living
environment. A significant proportion of staff (92.6%) perceived that there has been a
Proceedings of the 2nd International Symposium on Agriculture (ISA-2019)
Eastern University, Sri Lanka
115
high and very high level of increase in temperature while 74% of perceived that low
and very low level of rainfall in their surroundings. They also have a mixed perception
with regard to yield of agricultural crops and 57.4% of them stated that there is a
reduction in crop production. Majority of them (85.1%) responded that the climate
change has significantly increased the illness level in their surroundings and among
them 70.4% of responded that people contracting illnesses had been at high level
during summer and 68.5% responded that high level of illness during rainy season. The
majority of respondent stated that Dengue (98.1%), Asthma (85.2%), common cold
(83.3%) and skin diseases (70.4%) are most prevailing diseases in their surroundings,
due to climate change. According to the qualitative analysis, their responses for the
measures to mitigate the manmade climate change can be considered into three
categoury such as measures to preserve of nature, measures to control the greenhouse
gas emission and ways to make awareness among public. These responses indicate
satisfactory level of awareness among respondents. Even though there quite majority of
the respondents‟ responses consist of other kind of pollution controls which are not
directly involved in climate change, 90% of them opinioned on the prevention of
deforestation and control of greenhouse emission by fuel vehicle as measure to mitigate
the made climate change. A majority of them (88%) prefer to know more on the
climate change and training on mitigating indicates that climate change education
should need to be an agenda in university activities. This study is a part of ongoing
study on the perception climate among general public at Batticaloa district, so that it
has small sample size among the staff of Eastern University, Sri Lanka. However, the
findings further suggest to start awareness programme on climate change initially
among the staff of Eastern University and to expand to general public.
References
Chaudhary, P. and Bawa, K. S. (2011). Local perceptions of climate change validated
by scientific evidence in the Himalayas. Biology Letters, 7(5), 767–770.
https://doi.org/10.1098/rsbl.2011.0269
DeBono, R., Vincenti, K. and Calleja, N. (2012). Risk communication: climate change
as a human-health threat, a survey of public perceptions in Malta. European Journal
of Public Health, 22(1), 144–149.
Dunlap, R. E. and McCright, A. M. (2008). A Widening Gap: Republican and
Democratic Views on Climate Change. Environment: Science and Policy for
Sustainable Development, 50(5), 26–35. https://doi.org/10.3200/ENVT.50.5.26-35
Emch, M., Feldacker, C., Yunus, M., Streatfield, P. K., DinhThiem, V., Canh, D.
G.,Yunis, M. (2008). Local environmental predictors of cholera in Bangladesh and
Vietnam. American Journal of Tropical Medicine and Hygiene, 78(5), 823–832.
https://doi.org/10.1186/1476-069X-9-2
González, L. E. and Da Silveira, P. (1997). The people‟s attitudes towards global
environmental phenomena: A case study. Climate Research, 9(1–2), 95–100.
https://doi.org/10.3354/cr009095
Proceedings of the 2nd International Symposium on Agriculture (ISA-2019)
Eastern University, Sri Lanka
116
Haque, M. A., Yamamoto, S. S., Malik, A. A. and Sauerborn, R. (2012). Households‟
perception of climate change and human health risks: A community perspective.
Environmental Health: A Global Access Science Source, 11(1), 1–12.
https://doi.org/10.1186/1476-069X-11-1
IPCC. (2001). Climate change 2001: IPCC third assessment report. Geneva:
Secretariat, Intergovernmental Panel on Climate Change.
McMichael, A. J. and Butler, C. D. (2006). Emerging health issues: the widening
challenge for population health promotion. Health Promotion International,
21(suppl_1), 15–24. Retrieved from http://dx.doi.org/10.1093/heapro/dal047
Ministry of Environment. (2011). Sri Lanka Second National Commission on Climate
Change. Retrieved from http://www.climatechange.lk/SNC/snc_index.html
Preet, R., Nilsson, M., Schumann, B. and Evengård, B. (2010). The gender perspective
in climate change and global health. Global Health Action, 3,
10.3402/gha.v3i0.5720. https://doi.org/10.3402/gha.v3i0.5720
Toan, D. T. T., Kien, V. D., Giang, K. B., Van Minh, H. and Wright, P. (2014).
Perceptions of climate change and its impact on human health: An integrated
quantitative and qualitative approach. Global Health Action, 7(1).
https://doi.org/10.3402/gha.v7.23025
WHO. (2015). Climate and Health Country Profile, Sri Lanka – 2015. Retrieved
fromhttp://www.searo.who.int/entity/water sanitation/srl c h profile.pdf?ua=1
Proceedings of the 2nd International Symposium on Agriculture (ISA-2019)
Eastern University, Sri Lanka
117
ANTIBACTERIAL ACTIVITY AND PHYTOCHEMICAL PROPERTIES
OF SOME SELECTED MEDICINAL PLANTS FROM BATTICALOA
DISTRICT
C. Mahendranathan* and H. Mahendrarajah
Department of Botany, Eastern University, Sri Lanka
*Corresponding author: [email protected]
Abstract
Plants as a source of medicinal compounds have continued to play a dominant role to
maintain the human health. This study was carried out to investigate the antibacterial
activity and phytochemical properties of some selected medicinal plants, namely,
Erythrina variegata, Adhatoda vasica and Ocimum sanctum. All the leaf samples were
collected from different localities of Batticaloa district, Sri Lanka.The acetone and
ethanol extracts of leaf samples at the concentrations of 25, 50 and 75mg/100μl were
tested for phytochemical properties and antibacterial activity against Escherichia coli
and Staphylococcus aureus, using well diffusion method. The highest inhibitory effect
on E. coli and S.aureus was produced by ethanol extract of the tested leaf samples. The
highest inhibitory effect was observed at all three concentrations of Ocimum sanctum
against both bacteriafollowed by Erythrina variegata. The ethanolic extract of
Adhatoda vasica showed the least antibacterial activity (16.8±0.7mm) against S.aureus
and the E.coli (15.8±0.7mm) at 75mg/100μl concentration.The results of the qualitative
analysis of phytochemicals revealed that alkaloids, saponins, flavonoids and tannins
were present in ethanol and acetone extracts of Ocimum sanctum.Saponin, flavonoids
and tannins were found in the acetone and ethanol extracts of Erythrina variegate.
Saponin and tannins were found in the acetone and ethanol extracts of Adhatoda vasica
and flavonoids were found in the ethanol extract of Adhatoda vasica.
Keywords: Medicinal plants, Antibacterial activity, phytochemicals, Escherichia coli,
Staphylococcus aureus
Introduction
Plants have not only nutritional value but also, medicinal, ritual and magical values
(Compean and Ynalvez, 2014). Majority of the population, especially those living in
rural areas depends largely on medicinal plants for treatment of diseases (Pekamwar et
al., 2013). They play an important role in health care, about 80% of the world‟s
population rely on traditional medicines for their primary health care (Muthukrishnan
et al., 2014). The medicinal properties of plants may be based on the antioxidant,
antimicrobial antipyretic effects of the phytochemicals (Pradhan et al., 2015). Plants
are producing a diverse range of bioactive molecules, making them rich source of
different types of medicines (Hussain et al., 2010).
Proceedings of the 2nd International Symposium on Agriculture (ISA-2019)
Eastern University, Sri Lanka
118
This study too was aimed to determine (i) the antibacterial activity of some selected
medicinal plants namely, Erythrina variegata, Adhatoda vasica and Ocimum sanctum,
by determining the zone of inhibition of leaf extracts against Escherichia coli and
Staphylococcus aureus and (ii) tostudythe phytochemical constituents of the leaf
extracts of these three medicinal plants, qualitatively.
Materials and Methods
Collection of leaf samples
Ocimum sanctum and Adhatoda vasica were collected from the home garden at
Chenkalady. Erythrina variegata was collected from the paddy fields of the same area.
All samples were collected on the same day. The identification of these plant samples
was done at the Department of Botany, Eastern University, Sri Lanka.
Preparation of leaf extracts The leaves were washed thoroughly with tap water to remove associated debris
followed by sterile distilled water. Then each leaf part was cut into small pieces (1-2
cm) to make it suitable for grinding. Then leaves were dried under shaded condition at
room temperature until obtained constant weight. Completely dried leaves were
crushed into fine powder using grinding machine. Powder was stored at room
temperature in light airtight bottle until further usage. The resulting powders were
extracted by two different solvents as described below.
Preparation of acetone and ethanol extract
20 g powder of each leaf was separately soaked in 60 ml of ethanol in airtight conical
flask for two days on an orbital shaker, and then they were first filtered through double
layered Muslin cloth followed by Whatman No 1 filter paper. The filtrates were
collected into airtight bottles. Similar process was repeated twice with fresh ethanol
and the filtrates were pooled together. Finally, ethanol was removed from the filtrates
at 40oC in an oven. The resulting extracts were then stored into refrigerator until use for
further study (Jeyaseelan et al., 2012). The similar method was followed to obtain the
acetone extract too.
Phytochemical analysis The phytochemical screening of the sample was carried out by using the standard
qualitative procedures as mentioned in literature (Trease and Evans, 1989).
a) Alkaloids
One milliliter of 1% HCl was added to the 3 ml of leaf extract into test tube and was
treated with few drops of Meyer‟s reagent. A creamy white precipitate indicated the
presence of alkaloids.
b) Glycosides
Ten milliliter of 50% H2SO4 was added to the 1 ml of leaf extract into the boiling tube.
The mixture was heated in boiling water bath for 5 minutes. 10 ml of Fehling‟s solution
Proceedings of the 2nd International Symposium on Agriculture (ISA-2019)
Eastern University, Sri Lanka
119
(5 ml of each solution A and B) was added and boiled. A brick red precipitate indicated
the presence of glycosides.
c) Flavonoids
A few drops of 1% NH3 solution was added to the 2 ml of leaf extract into the test tube.
A yellow coloration was observed for the presence of flavonoids.
d) Saponins
Five milliliter of leaf extract was shaken vigorously to obtain a stable persistent froth.
The frothing was then mixed with 3 drops of olive oil and observed for the formation
of emulsion, which indicated the presence of saponins.
e) Tannins
To 0.5 ml of leaf extract solution, 1 ml of distilled water and 1-2 drops of ferric
chloride solution were added and observed for brownish green or a blue-black
coloration.
f) Phlobatannins
Ten milliliter of leaf extract was boiled with 1% HCl in a boiling tube. Deposition of a
red precipitate indicated the presence of phlobatannins.
g) Terpenoids
Five milliliter of extract was mixed with 2 ml of CHCl3 into the test tube. 3 ml of
concentrated H2SO4 was carefully added along the wall of the test tube to form a layer.
An interface with a reddish-brown coloration was confirmed the presence of
terpenoids.
h) Cardiac glycosides
Five milliliter of leaf extract was mixed with 2 ml of glacial acetic acid containing 1
drop of FeCl3.The above mixture was carefully added to the 1ml of concentrated
H2SO4. Presence of cardiac glycosides was detected by the formation of brown ring.
i) Anthraquinones
Leaf extract was mixed well with benzene, and then half of its own volume of 10%
ammonia solution was added into that. Presence of a pink, red or violet coloration in
the ammonial phase indicated the anthraquinones.
Testing the antibacterial activity Escherichia coli (E.coli) and Staphylococcus aureus (S.aureus) were used to test the
antibacterial activity of the leaf samples. Both pure cultures were obtained from
Microbiology lab, Teaching hospital, Batticaloa. These bacteria were stored on nutrient
agar slope at 4 ºC and they were sub cultured before using.
Leaf sample preparation The test concentration of 25, 50 and 75mg/100μl were prepared using the solvent of
ethanol and acetone separately.

Proceedings of the 2nd International Symposium on Agriculture (ISA-2019)
Eastern University, Sri Lanka
120
Assessment of antibacterial activity A well diffusion method was used to test the antibacterial activity of ethanol and
acetone extracts of the different plant leaves. Briefly 25ml of autoclaved nutrient agar
was cooled down to 40 ºC and poured into a sterile petri dish allowed to set. 18 nutrient
agar petri dishes were prepared for three different type of leaf extracts of each solvent
and each bacterium. Totally 72 nutrient agar petri dishes were prepared and was
repeated 6 times.
Bacterial suspension (1×10⁶cells/ml) were taken from serial dilution by using
hemocytometer and 0.1ml of bacterial suspension was spread on the media plates, by
sterilized glass spreader. Wells with 8mm diameter were filled with 100μl of each
concentration of acetone and ethanol extracts, separately. Streptomycin (25μg/100μl)
was used as positive control. 100μl of acetone and ethanol extracts were used as
negative control. The plates were incubated at 37 ºC for 24 hours, and the antibacterial
activity was determined by measuring the diameter of clear inhibition zone around the
well.
Statistical analysis Diameter of inhibition zone resulted from replicates were expressed as mean ± standard
deviation (SD). The data were analyzed by one-way analysis of variance (ANOVA, P
value < 0.05) using statistical software, MINITAB 14 system.
Results and Discussion
Collection of leaves of the medicinal plants
Phyto-chemical screening
The qualitative test for the presence of phytochemicals showed the presence of
different types of phytochemicals in ethanol and acetone extracts of selected medicinal
plants. Solvents, used for the extraction, play a significant role in the solubility of the
active principles of plant materials influence on the antibacterial activities of the
extracts (Jeyaseelan et al., 2010).
Phytochemicals in acetone and ethanol extractions
The results of the qualitative analysis of phytochemicals revealed that alkaloids,
saponins, flavonoids and tannins were present in ethanol and acetone extracts of
Ocimum sanctum.
(Thulasi)
Erythrina variegate
(Mulmurukkai)
Adhatoda vasica
(Adathodai)
Proceedings of the 2nd International Symposium on Agriculture (ISA-2019)
Eastern University, Sri Lanka
121
Ocimum sanctum.Saponin, flavonoids and tannins were found in the acetone and
ethanol extracts of Erythrina variegate. Saponin and tannins were found in the acetone
and ethanol extracts of Adhatoda vasica and flavonoids were found in the ethanol
extract of Adhatoda vasica (Table 1).
Table 1: Qualitative analysis of phytochemicals the leaf samples.
Adhatoda vasica Erythrina variegate Ocimum sanctum
Phytochemicals Acetone Ethanol Acetone Ethanol Acetone Ethanol
Glycosides - - - - - -
Alkaloids - - - - + +
Saponins + + + + + +
Flavonoids - + + + + +
Tannins + + + + + +
Terpenoids - - - - - -
Cardiac
glycosides - - - - - -
Phlobatannins - - - - - -
Anthraquinones - - - - - - (+) Presence or (-) Absence of phytochemical
Antibacterial activity
As shown in table 2, the inhibition zone increasd with concentration of leaf extract in
acetone. The acetone extract of all three leaf samples showed the inhibitory effect to
E.coli at 75 mg/100μl but there was a significant difference in level of antibacterial
activity among the three types of leaf samples. The E.coli showed most susceptibility
to the acetone extract of Ocimum sanctum at 75 mg/100μl.Erythrina variegata
exhibited moderate effect to the E.coli and the Adhatoda vasica showed the least
inhibitory effect at this concentration.
Table 2: Mean Diameter of inhibition zones, caused by acetone extract of leaf samples
against E.coli at different concentrations
Plant samples Concentration (mg/100μl)
25 50 75
Adhatoda vasica - - 9.2±0.4d
Erythrina variegata - - 10.7±0.5c
Ocimum sanctum 10.3±0.5c 12.7±0.5
b 16.8±0.4
a
Streptomycin (25μg/100μl) 28.3±0.5
Acetone - Values are diameter of zone of inhibition in mm (Mean± SD), (-) No activity, values with different
superscripts are significantly (P<0.05) different.
As per the study by Sheeba and Mohan (2012), the acetone extract of Adhatoda vasica
(100μg-500μg) was able to inhibit the growth of E.coli. However, the present study
showed that acetone extract of Adhatoda vasica inhibited the E.coli at 75 mg/100μl but
no inhibition zones were observed at 25 mg/100μl and 50 mg/100μl (Plate 1).
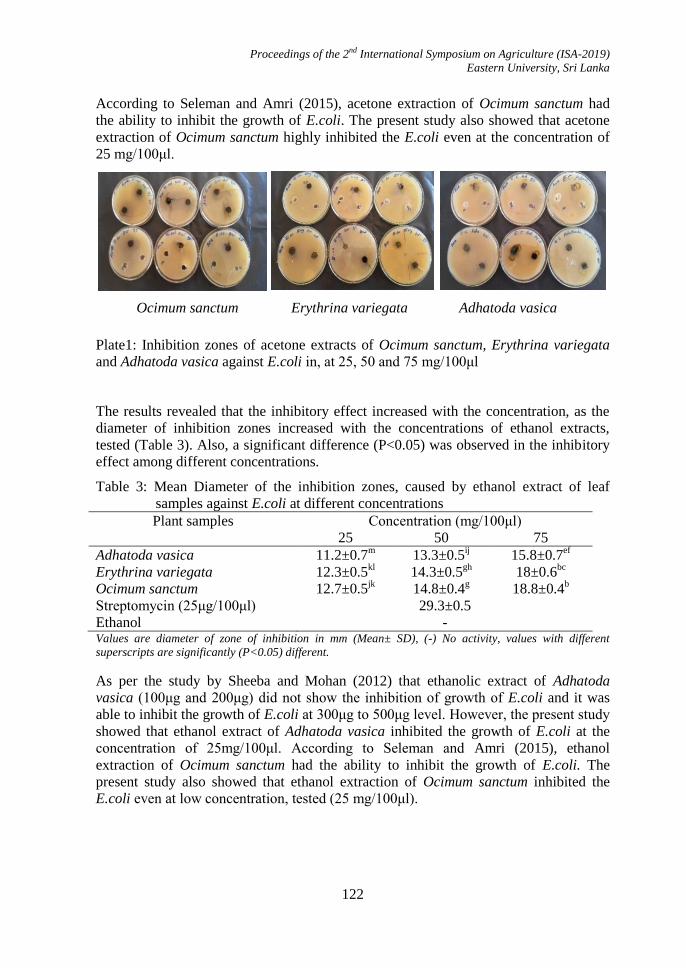
Proceedings of the 2nd International Symposium on Agriculture (ISA-2019)
Eastern University, Sri Lanka
122
According to Seleman and Amri (2015), acetone extraction of Ocimum sanctum had
the ability to inhibit the growth of E.coli. The present study also showed that acetone
extraction of Ocimum sanctum highly inhibited the E.coli even at the concentration of
25 mg/100μl.
Plate1: Inhibition zones of acetone extracts of Ocimum sanctum, Erythrina variegata
and Adhatoda vasica against E.coli in, at 25, 50 and 75 mg/100μl
The results revealed that the inhibitory effect increased with the concentration, as the
diameter of inhibition zones increased with the concentrations of ethanol extracts,
tested (Table 3). Also, a significant difference (P<0.05) was observed in the inhibitory
effect among different concentrations.
Table 3: Mean Diameter of the inhibition zones, caused by ethanol extract of leaf
samples against E.coli at different concentrations
Plant samples Concentration (mg/100μl)
25 50 75
Adhatoda vasica 11.2±0.7m 13.3±0.5
ij 15.8±0.7
ef
Erythrina variegata 12.3±0.5kl 14.3±0.5
gh 18±0.6
bc
Ocimum sanctum 12.7±0.5jk 14.8±0.4
g 18.8±0.4
b
Streptomycin (25μg/100μl) 29.3±0.5
Ethanol - Values are diameter of zone of inhibition in mm (Mean± SD), (-) No activity, values with different
superscripts are significantly (P<0.05) different.
As per the study by Sheeba and Mohan (2012) that ethanolic extract of Adhatoda
vasica (100μg and 200μg) did not show the inhibition of growth of E.coli and it was
able to inhibit the growth of E.coli at 300μg to 500μg level. However, the present study
showed that ethanol extract of Adhatoda vasica inhibited the growth of E.coli at the
concentration of 25mg/100μl. According to Seleman and Amri (2015), ethanol
extraction of Ocimum sanctum had the ability to inhibit the growth of E.coli. The
present study also showed that ethanol extraction of Ocimum sanctum inhibited the
E.coli even at low concentration, tested (25 mg/100μl).
Ocimum sanctum Erythrina variegata Adhatoda vasica
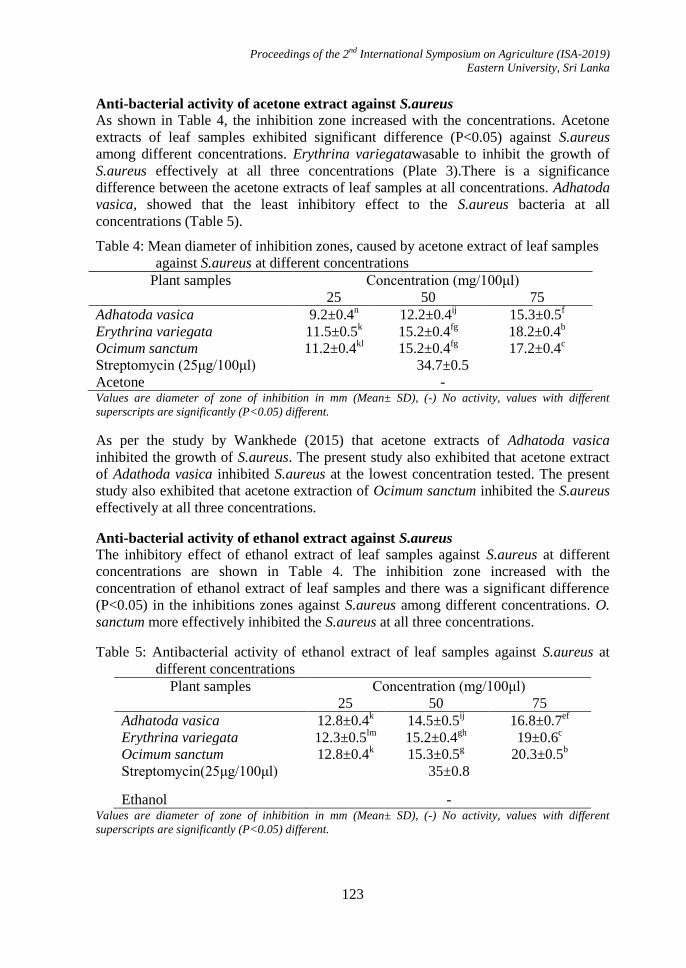
Proceedings of the 2nd International Symposium on Agriculture (ISA-2019)
Eastern University, Sri Lanka
123
Anti-bacterial activity of acetone extract against S.aureus
As shown in Table 4, the inhibition zone increased with the concentrations. Acetone
extracts of leaf samples exhibited significant difference (P<0.05) against S.aureus
among different concentrations. Erythrina variegatawasable to inhibit the growth of
S.aureus effectively at all three concentrations (Plate 3).There is a significance
difference between the acetone extracts of leaf samples at all concentrations. Adhatoda
vasica, showed that the least inhibitory effect to the S.aureus bacteria at all
concentrations (Table 5).
Table 4: Mean diameter of inhibition zones, caused by acetone extract of leaf samples
against S.aureus at different concentrations
Plant samples Concentration (mg/100μl)
25 50 75
Adhatoda vasica 9.2±0.4n 12.2±0.4
ij 15.3±0.5
f
Erythrina variegata 11.5±0.5k 15.2±0.4
fg 18.2±0.4
b
Ocimum sanctum 11.2±0.4kl 15.2±0.4
fg 17.2±0.4
c
Streptomycin (25μg/100μl) 34.7±0.5
Acetone - Values are diameter of zone of inhibition in mm (Mean± SD), (-) No activity, values with different
superscripts are significantly (P<0.05) different.
As per the study by Wankhede (2015) that acetone extracts of Adhatoda vasica
inhibited the growth of S.aureus. The present study also exhibited that acetone extract
of Adathoda vasica inhibited S.aureus at the lowest concentration tested. The present
study also exhibited that acetone extraction of Ocimum sanctum inhibited the S.aureus
effectively at all three concentrations.
Anti-bacterial activity of ethanol extract against S.aureus
The inhibitory effect of ethanol extract of leaf samples against S.aureus at different
concentrations are shown in Table 4. The inhibition zone increased with the
concentration of ethanol extract of leaf samples and there was a significant difference
(P<0.05) in the inhibitions zones against S.aureus among different concentrations. O.
sanctum more effectively inhibited the S.aureus at all three concentrations.
Table 5: Antibacterial activity of ethanol extract of leaf samples against S.aureus at
different concentrations
Plant samples Concentration (mg/100μl)
25 50 75
Adhatoda vasica 12.8±0.4k 14.5±0.5
ij 16.8±0.7
ef
Erythrina variegata 12.3±0.5lm
15.2±0.4gh
19±0.6c
Ocimum sanctum 12.8±0.4k 15.3±0.5
g 20.3±0.5
b
Streptomycin(25μg/100μl) 35±0.8
Ethanol - Values are diameter of zone of inhibition in mm (Mean± SD), (-) No activity, values with different
superscripts are significantly (P<0.05) different.
Proceedings of the 2nd International Symposium on Agriculture (ISA-2019)
Eastern University, Sri Lanka
124
A significant difference in the antibacterial activity among the leaf samples extracts at
all three concentrations. Erythrina variegata exhibited moderate effect to the S.aureus.
Adhatoda vasica, showed that the least inhibitory effect to the S.aureus at all
concentrations (Plate 4). The standard antibiotic streptomycin showed higher inhibitory
effect on S.aureus than E.coli. As per the study by Wankhede (2015), the ethanol
extract of Adhatoda vasica (100μg-500μg) was able to inhibit the growth of S.aureus
and ethanol extract inhibited higher level than acetone extract.
Conclusions
As per this study, Adhatoda vasica, Erythrina variegata and Ocimum sanctumof
acetone and ethanol extract were found to have antibacterial effect against Escherichia
coli and Staphylococcus aureus. Among the both tested bacteria, Staphylococcus
aureus was more sensitive to all leaf extracts than Escherichia coli. The qualitative
analysis of phytochemical showed that alkaloids, saponins, flavonoids and tannins were
present in ethanol and acetone extracts ofOcimum sanctum. Saponins and tannins were
found in both extracts of all tested medicinal plants. Thus, it could be concluded that
the medicinal plants used in this study consist antibacterial effect against Escherichia
coli and Staphylococcus aureus. The phytochemical properties of these plants might
play the major role for such antibacterial activity. Thus, these plants could be
considered for finding bioactive natural products that can be a part in the development
of new pharmaceuticals research activities.
Acknowledgement
We would like to extend our sincere esteems to all staff members of Department of
Botany for their timely support.
References
Compean, K.L. and Ynalvez, R.A. (2014). Antimicrobial activity of plant secondary
metabolites: A Review.Research Journal of MedicinalPlants, 8(5): 204-213.
Hussain, A., Wahab, S., Zarin, I. and Hussain, M.D.S. (2010). Antibacterial activity of
the leaves of Coccinia indica (W. and A) Wof India. Advances in Biological
Research, 4 (5): 241-248.
Jeyaseelan, E. C., Kothai, S., Kavitha, R., Tharmila, S. and Thavaranjit, A.C. (2012).
Antibacterial activity of some selected algae present in the costal lines of Jaffna
Peninsula. International Journal of Pharmaceutical and Biological Archives, 3(2):
352-356.
Muthukrishnan, S., Palanisamy, S., Santhanam, I. and Kaveriyappan, G. (2014).
Phytochemical screening and antimicrobial activity of Erythrina variegata.World
Journal of Pharmacy and Pharmaceutical Sciences, 3(6): 680-690.
Proceedings of the 2nd International Symposium on Agriculture (ISA-2019)
Eastern University, Sri Lanka
125
Pathmanathan, M.., Jeyadevan, J. P. and Jeyaseelan, E. C. (2010).In vitroantibacterial
activity and phytochemical analysis of some selected medicinal plants.
International Journal of Pharmaceutical and Biological Archives, 1(3):291 –299.
Pekamwar, S. S., Kalyankar T. M., and Kokate S. S. (2013). Pharmacological activities
of Coccinia Grandis: Review. Journal of Applied Pharmaceutical Science, 3(05):
114-119.
Pradhan, B., Bhatt, D., Mishra, S. K. and Sahoo, S. (2015). Antimicrobial potential of
leaves of Adhatoda vasica Nees. against human pathogens causing infections of
UT, GIT and Skin. Pharmaceutical and biological evaluations, 2(1): 36-39.
Seleman, N. S. and Amri, E. (2015).Antibacterial Activity of Aqueous, Ethanol and
Acetone Extracts of Ocimum sanctum Linn. American Journal of BioScience,
3(6): 256-261.
Sheeba, B. J. and Mohan, T. S. (2012). Antimicrobial activity of Adhatoda vasica
against clinical pathogens. Asian Journal of Plant Science and Research, 2(2): 83-
88.
Trease, G.E and Evans, W.C. Phytochemical screening. In: Textbook of
Pharmacognosy. 10th Edn., London: Bailiere Tindal Limited; 1989.
Wankhede, T. B. (2015). Antioxidant and antimicrobial properties of Adhatoda vasica
L. Nees. Int. J. of Life Sciences, 3(2): 152-156.
Proceedings of the 2nd International Symposium on Agriculture (ISA-2019)
Eastern University, Sri Lanka
126
IDENTIFICATION OF MOST SUITABLE SILO FOR LIVESTOCK
FARM IN EASTERN UNIVERSITY, SRI LANKA
A.G.D. T. M. Wijerathna and M.M. Mahusoon*
Department of Animal Science, Faculty of Agriculture, Eastern University, Sri Lanka
* Corresponding author: [email protected]
Abstract
Limitation of feeds in dry season is the main barrier for small scale and medium scale
dairy farmers in the Eastern region of Sri Lanka. Forage conservation in the form of
silage is an option to increase dry season feed availability. Therefore, this study was
carried out in the Livestock Farm, faculty of Agriculture, Eastern University, Sri Lanka
to identify the most suitable silo among plastic barrel silo, polybag silo, stack silo and
trench silo. The four silos mentioned above were used as treatments with four
replications. The experiment was conducted as Complete Randomized Design.
Chopped CO3 grasses were used as silage material and silos were filled and sealed
properly. Sugar was added by mixing with silage material as a silage additive. After 21
days silos were opened and samples were analyzed for silage characteristics. Physical
properties such as colour, odour and texture of silage were measured by eye appraisal
and sensory evaluation. Wastage, pH and proximate composition of silage were
determined. Among the tested silo types, the barrel silo reported low pH value and low
wastage. In barrel silo proximate composition of silage also in agreement with the
standard range of proximate components. There are high pH value and high wastage of
silage from polybag silo than plastic barrel silo, stack silo and trench silo.
Keywords: Silo, Forage, Dry season, CO3 grass
Introduction
In Sri Lanka Eastern region has a good potential for dairy farming due to the higher
land and labor availability. Many of farmers in eastern region are small scale and
medium scale farmers. Limitation of feeds in dry season is the main barrier for small
and medium scale farmers to be a large scale farmer. Furthermore, feed limitation
causes to low production in dry season. Forage conservation in the form of silage is an
option to increase dry-season feed availability. However, in the tropics silage adoption
among smallholders in general has been limited (Mannetje, 2000).
Silage making is an old agricultural practice that started more than 3,000 years ago
(Wilkinson et al., 2003). However, a rapid increase in the application of this
technology occurred after the 1940s as a result of the mechanization of forage
harvesting (Wilkinson et al., 2003). Silage making is well established in the temperate
regions of North America and Europe but has only recently become popular and
widespread in tropical regions (Wilkins and Wilkinson, 2015).Important factors to
Proceedings of the 2nd International Symposium on Agriculture (ISA-2019)
Eastern University, Sri Lanka
127
improve adoption of silage by smallholders in the tropics are low investment costs, low
risks, and the potential of rapid and significant returns on investments.
The investigation was planned to identify the most suitable silo for Livestock Farm in
Eastern University Sri Lanka and to evaluate the quality of silage from different silos.
Materials and Methods
The experiment was conducted during the month July, 2018 to identify most suitable
silo for Livestock Farm in Eastern University, Sri Lanka. Comparisons were made with
four different silos namely polythene bag silo, plastic barrel silo, stack silo and trench
silo.The experiment was conducted in the Livestock farm, Department of Animal
Science, Faculty of Agriculture, Eastern University, Sri Lanka. Rough roughage (CO3)
was cut from the CO3 cultivation of the Livestock Farm in Eastern University, Sri
Lanka just before the flowering stage and they were chopped into small pieces around
2cm using a knife. They were let to wilt slightly in breeze to reduce moisture content.
Then the silage materials were mixed thoroughly to reduce variations in readings.
Four different silos were used as treatments with four replicates according to Complete
Randomized Design. All silos were filled with prepared silage materials with mixing
sugar. Sugar is an additive of silage that enhances the activity of lactic acid bacteria.
All treatments were covered by a wooden fence and ant poison and rat poison were
scattered on the surrounding floor to prevent damages on the silos by field mice, ants
and other animals. After 21 days of preparation silos were opened and samples
representing silage were taken from each treatment for further testing. Although there
were standard methods (odor meter) available to measure physical properties (color,
odor and texture), due to the time limitation for experiment those were measured by
eye appraisal and sensory evaluation and the amount of deteriorate and moldy silage
was measured in dry basis. pH was measured using pH meter from the extracts.
All the samples were analyzed for dry matter content, total ash content, protein content
and fiber content using Proximate analysis AOAC (2000) standard method.
Final results were statistically analyzed using „SAS 9.1.3. service pack 4, XP-PRO
platform‟ according to Complete Randomized Design (CRD).
Results and Discussion
The physical properties of silage were given in Table 1 (colour, odour and texture).
Colour The olive green colour was obtained in the barrel silo in the study. It was close to the
original colour of the grass which was an indication of good quality silage that was
well preserved (Oduguwa et al., 2007). In this experiment silage in barrel silo has olive
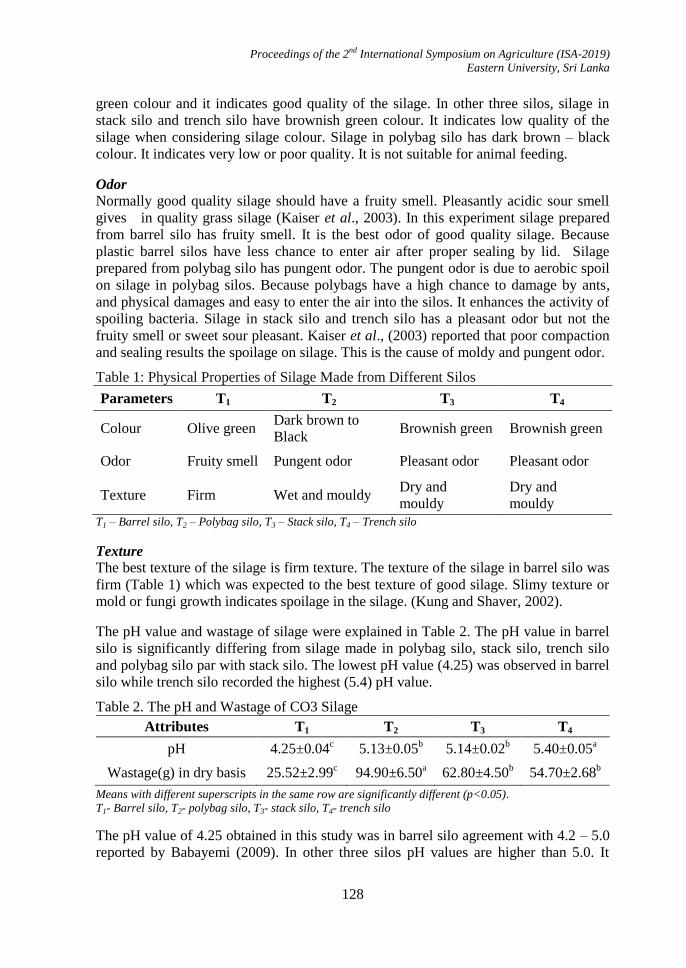
Proceedings of the 2nd International Symposium on Agriculture (ISA-2019)
Eastern University, Sri Lanka
128
green colour and it indicates good quality of the silage. In other three silos, silage in
stack silo and trench silo have brownish green colour. It indicates low quality of the
silage when considering silage colour. Silage in polybag silo has dark brown – black
colour. It indicates very low or poor quality. It is not suitable for animal feeding.
Odor Normally good quality silage should have a fruity smell. Pleasantly acidic sour smell
gives in quality grass silage (Kaiser et al., 2003). In this experiment silage prepared
from barrel silo has fruity smell. It is the best odor of good quality silage. Because
plastic barrel silos have less chance to enter air after proper sealing by lid. Silage
prepared from polybag silo has pungent odor. The pungent odor is due to aerobic spoil
on silage in polybag silos. Because polybags have a high chance to damage by ants,
and physical damages and easy to enter the air into the silos. It enhances the activity of
spoiling bacteria. Silage in stack silo and trench silo has a pleasant odor but not the
fruity smell or sweet sour pleasant. Kaiser et al., (2003) reported that poor compaction
and sealing results the spoilage on silage. This is the cause of moldy and pungent odor.
Table 1: Physical Properties of Silage Made from Different Silos
Parameters T1 T2 T3 T4
Colour Olive green Dark brown to
Black Brownish green Brownish green
Odor Fruity smell Pungent odor Pleasant odor Pleasant odor
Texture Firm Wet and mouldy Dry and
mouldy
Dry and
mouldy
T1 – Barrel silo, T2 – Polybag silo, T3 – Stack silo, T4 – Trench silo
Texture The best texture of the silage is firm texture. The texture of the silage in barrel silo was
firm (Table 1) which was expected to the best texture of good silage. Slimy texture or
mold or fungi growth indicates spoilage in the silage. (Kung and Shaver, 2002).
The pH value and wastage of silage were explained in Table 2. The pH value in barrel
silo is significantly differing from silage made in polybag silo, stack silo, trench silo
and polybag silo par with stack silo. The lowest pH value (4.25) was observed in barrel
silo while trench silo recorded the highest (5.4) pH value.
Table 2. The pH and Wastage of CO3 Silage
Attributes T1 T2 T3 T4
pH 4.25±0.04c 5.13±0.05
b 5.14±0.02
b 5.40±0.05
a
Wastage(g) in dry basis 25.52±2.99c 94.90±6.50
a 62.80±4.50
b 54.70±2.68
b
Means with different superscripts in the same row are significantly different (p<0.05).
T1- Barrel silo, T2- polybag silo, T3- stack silo, T4- trench silo
The pH value of 4.25 obtained in this study was in barrel silo agreement with 4.2 – 5.0
reported by Babayemi (2009). In other three silos pH values are higher than 5.0. It

Proceedings of the 2nd International Symposium on Agriculture (ISA-2019)
Eastern University, Sri Lanka
129
indicates the silage in polybag silo, stack silo and trench silo have poor quality. High
pH indicates poor fermentation due to dry condition of silage while low pH indicates
high amount of acid production that can be detrimental to ruminants (Keady, 2011). pH
is generally around 3.8-4.4 in good quality silage (Food and Agriculture Organization,
2008).
Further results showed that wastage is significantly lower in barrel silo and
significantly higher in polybag silo. Stack silo is par with trench silo. Wastage is more
important when selecting a good silo. Kaiser et al., (2003) reported that poor
compaction and sealing results aerobic spoil on silage. This is the cause of high
wastage.
In this study pH value in barrel silo is significantly differ from silage made in polybag
silo, stack silo, trench silo and polybag silo par with stack silo. The lowest pH value
(4.25) was observed in barrel silo while trench silo recorded the highest (5.4) pH value.
The proximate compositions of silage and standared ranges of proximate parameters of
silage were given in Table 3 and Table 4.
Crude protein
Crude protein percentage represents total nitrogen in silage which enhances nutrition
level of ruminants to their activities of maintenance, lactation, growth and reproduction
(Keady, 2011). Crude protein percentages of all four treatments in this study are in
agreement with the standard range according to Table 4. Among these four treatments
barrel silo is significantly different from polybag silo, stack silo and trench silo. There
is no significant difference between polybag silo, stack silo and trench silo. Crude
protein percentage in barrel silo is significantly higher than other treatments.
Table 3: Proximate Composition of Silage in Four Different Silos:
Treatments Parameters
DM% CP% CF% Ash%
T1 26.18±0.15a 13.30±0.10
a 34.70±0.40
a 14.67±0.13
b
T2 17.10±0.15c 12.50±0.07
b 31.33±0.18
c 16.40±0.12
a
T3 19.40±0.16b 12.43±0.10
b 33.02±0.15
b 14.97±0.11
b
T4 15.80±0.09d 12.35±0.13
b 33.25±0.11
ab 16.12±0.06
a
Means with different superscripts in the same column are significantly different (p<0.05)
DM – dry matter, CP – crude protein, CF – crude fiber
T1 – Barrel silo, T2 – Polybag silo, T3 – Stack silo, T4 – Trench silo
Crude fiber Crude fiber percentage is one of crucial parameter of silage due to high crude fiber
content enhance the ability of palatability and amount of metabolic energy intake by
animal while low crude fiber content indicates deterioration of silage (Keady, 2011). In
this study barrel silo is significantly differ from polybag silo and stack silo. There is a
lower significant difference between barrel silo and trench silo than barrel silo and

Proceedings of the 2nd International Symposium on Agriculture (ISA-2019)
Eastern University, Sri Lanka
130
polybag silo. The highest crude fiber percentage was observed in barrel silo (34.70%)
and polybag silo was recorded lower (31.33%) crude fiber level (Table 3). Due to the
standard ranges (Table 4) crude fiber content of silage in barrel silo (34.70%) is in
between the standard range (34-37%) and in other three treatments crude fiber content
is less than the standard range.
Table 4: Standard Ranges of Proximate Parameters of CO-3 Silage
DM% CP% CF% Ash%
25-35 12-15 34-37 9-12 DM – dry matter, CP – crude protein, CF – crude fiber Senanayake et al. (2016).
Ash content
Ash is the parameter that indicates mineral content in silage. High ash content is
observed due to poor fermentation of silage (Keady, 2011). The results of tested
parameters of ash indicated that polybag silo was significantly higher (16.40%) and
barrel silo was significantly lower (14.67%). But ash content in all treatments are
above the standard level according to the Table 4. There is a significant difference
between barrel silo and polybag silo. Barrel silo par with stack silo and polybag silo par
with trench silo.
Conclusions
The study revealed that quality parameters of silage in terms of colour, odor, texture,
pH and nutritional composition are better in barrel silo than polybag silo, stack silo and
trench silo. Most of nutritional values and pH value of silage in barrel silo are
agreement with the standard rangers of silage quality parameters. Wastage also very
low in barrel silo compare with other three silos. Among these four different silos,
quality of silage is poor and wastage is high in polybag silo. Because there is high
chance to damage polythene bag. For stack silo and trench silo need huge amounts of
silage materials to proper sealing and for low wastage. Therefore, they are not suitable
for small holders.When compare the barrel silo with polybag silo, initial cost is high for
barrels or any other plastic container that suitable for a silo. But its durability is very
longer than polybags. Polythene bags can be used only one time as a silo due to high
ability to damages. Therefore, barrel silo can be recommended for Livestock farm in
Eastern University, Sri Lanka.
References
Babayemi, O.J (2009). Silage quality, dry matter intake and digestibility by African
Dwarf Sheep of Guinea grass (Panicum maximum cv ntchisi) harvested at 4 and 12
week regrowths. Afr. J. Biotechnol., 8: 3988-3989.
Kaiser, A.G Piltz., J.W. Burns, H.M. and Griffiths., N.W., (2003). Successful silage.
Top fodder, Dairy Australia and New South Wales, Department of Primary
Industries.
Proceedings of the 2nd International Symposium on Agriculture (ISA-2019)
Eastern University, Sri Lanka
131
Keady, T., ed (2011). High feed value grass silage: its importance and production.
Animal and Grassland Research and Innovation Centre, Mellows Campus, Athenry,
Co. Galway press:
Kung, L., and R. Shaver, (2002). Interpretation and use of silage fermentation analyses
reports. Dept. of animal and food science, University of Delaware Newark, DE
19717.Li
Mannetje, L. (2000). The future of silage making in the tropics.In silage making in the
tropics with particular emphasis on smallholders. FAO Plant Production and
Protection Paper No.161,169-171(ED L. „t Mannetje). Rome (Italy): FAO.
Oduguwa, B.O., A.O. Jolaosho and M.T. Ayankoso, (2007). Effect of ensiled on
physical properties, chemical composition and mineral contents of guinea grass and
cassava tops silage. Nig. J. Anim. Prod., 34: 100-106.
Senanayake, S.R.H.L.K., K.A.H.T. Kodithuwakku, H.K.J.P. Wickramasinghe (2016).
Effect of Polythene Film on Grass Silage Quality as Investigated under Ambient
Conditions
Wilkinson, J. M., K. K. Bolsen, and C. J. Lin. (2003). History of silage. Pages 1–30 in
Silage Science and Technology. Vol. 42. D. R. Buxton, R. E. Muck, and J. H.
Harrison, ed. Am. Soc. Agron., Crop Sci. Soc. Am., Soil Sci. Soc. Am., Madison,
WI.
Wilkins, R., and M. Wilkinson. (2015). Major contributions in 45 years of International
Silage Conferences. Pages 26–51 in Proc. XVII Intl. Silage Conf., Piracicaba,
Brazil. University of São Paulo, Piracicaba, Brazil.
Proceedings of the 2nd International Symposium on Agriculture (ISA-2019)
Eastern University, Sri Lanka
132
SHELF LIFE EVALUATION OF SOURSOP (Annona muricata L.) JELLY
WITHOUT PRESERVATIVES
G. G. A.Shashikala* and T. Mahendran
Department of Agricultural Chemistry, Faculty of Agriculture, Eastern University,
Chenkalady (E.P), Sri Lanka.
*Corresponding author: [email protected]
Abstract
Soursop fruit has a great potential to ensure food security, nutrition and generate
income. Food processing industries tend to prepare various value added products using
soursop fruits. Fruit jelly is a semi solid gel made from the juice, mixing with
sweetening compounds. This study was focused to develop a soursop jelly and to
assess its sensory qualities, physico-chemical properties and storage stability. Soursop
jelly was prepared according to Sri Lankan Standard Specification for jelly by using
fruit juice, sugar, pectin, citric acid and water. Assessment of physico-chemical
parameters, total plate count and sensory properties was carried out after formulation
and during storage. Seven points hedonic scale was used in sensory evaluation. Three
formulations of 80% soursop pulp, 60% soursop pulp and 40% soursop pulp were
selected based on sensory evaluation for storage studies at 28±1⁰C temperature and 80-
90% of RH for 12 weeks. The nutritional analysis of jelly decreasing trends in pH,
ascorbic acid and an increasing trend in moisture, total soluble solids, titrable acidity
and total sugar was noted with advancement of storage period of 12 weeks. The
sensory analysis also showed that there were significance differences (p<0.05) for
organoleptic characters of jelly. Mean scores of all organoleptic characters were
gradually decreased during 12 weeks storage period. Highest overall acceptability was
observed in formulation with 80% soursop pulp and all formulations were
microbiologically safe for consumption. Based on the results, the jelly with 80%
soursop pulp concentration was selected as best formulation and could be stored for 12
weeks at 28±1⁰C temperature and 80-90% of RH without any significant changes.
Keywords: Fruit jelly, Physico-chemical parameters, Sensory evaluation, Soursop.
Introduction
Soursop is one of minor crop that is gaining popularity because of its economic uses
and great demand in processing industry especially in producing of soursop drinks. The
fruit is now very popular in world market therefore expansion and production should
be encouraged. It is widely known to possess medicinal properties like cancer fighting,
diabetes mellitus herpes inhibiting, anti-depressive, anti-bacterial and effect against
Staphylococcus aureus and Vibrio cholera (Tesio, 2013). It is a nutritious fruit, it
consists of 67.5% white edible pulp and it contains 80-81% water, 1% protein, 18%
carbohydrate. As well as it has ascorbic acid, potassium, phosphorous and calcium and
Proceedings of the 2nd International Symposium on Agriculture (ISA-2019)
Eastern University, Sri Lanka
133
particularly fructose, also contains significant amounts of vitamin B1, B2and vitamin B6
(Barrette, 2013). Jelly is Fruit flavored dessert made by warming and then cooling a
liquid containing setting agent in a dish it sets in semi solid someone elastic mass. It is
transparent. It should be good color. Not flow, when taken from mold, with texture so
tender it may be cut easily with a spoon, and yet so firm that the angles produced by
cutting retain their shape.
However, it softens very rapidly following harvest, become mushy and difficult to
consume as fresh fruit. So it cannot be stored for a long period of time. Therefore, it is
rejected at market due to external injury, uneven shape and size.As well as soursop has
sour citrus taste and no attractive external features. Through processing, the shelf life
of such product can be increased. For instances juices, jam, jellies stay for a longer
period. This process not only enhances the life of perishable products but also creates a
good market relative to that in raw form. It helps to stabilize the prices and assists in
maintaining a stock of fruits to meet the demand in off- seasons (Sinthiya and
Poornima, 2017). Therefore, the research was carried out to develop a soursop jelly and
to assess its sensory qualities, physico-chemical properties and storage stability.
Materials and Methods
The undamaged, healthy, mature soursop fruits were used for this study. The outer
cover and seeds were removed. The flesh was cut in to small pieces and it was put in
stainless steel pan and drinking water (1½ time of fruit pulp) was added in it. Then 0.2
g of citric acid was mixed and allowed to boil about 20-25 minutes. Finally boiled fruit
sample was filtered through the muslin cloth and the pulp was separated. The soursop
jelly was prepared by using of extracted soursop pulp and water in different ratio with
certain amount of sugar, pectin and citric acid to formulate different formulations and it
was boiled. Following Table 1 shows the different formulations of jelly preparation.
Table 1: Experimental Formulations for Soursop Jelly Preparation
Ingredients T1 T2 T3 T4 T5
Soursop pulp (%) 100 80 60 40 20
Water(%) 00 20 40 60 80
Pectin (g/100g) 1.7 1.7 1.7 1.7 1.7
Citric acid (g/100 g) 0.5 0.5 0.5 0.5 0.5
Sugar(g/100 g) 50 50 50 50 50
The soursop pulp and water were mixed in different ratio 100:00, 80:20, 60:40, 40:60
and 20:80, respectively. The formulation varying volumes of each one were lies
between 100 ml to 20 ml soursop pulp and 0 ml to 80ml of water, respectively. For the
preparation of soursop jelly, requisite amount of sugar 50 g was added. Then 0.5 g
citric acid was added and mixture was well stirred to dissolve the sugar completely.
After it was cooked by stirring continuously about 30 minutes until it was reached the
end point, total soluble solid of 68⁰ Brix value. Foam was removed and egg yellow

Proceedings of the 2nd International Symposium on Agriculture (ISA-2019)
Eastern University, Sri Lanka
134
colouring 0.5ml was added. Finally it was removed from the fire and cool for 5
minutes and it was filled in to sterilized plastic cups and sealed with lids.
Based on the physico-chemical analysis, microbial assessment and sensory evaluation,
three jelly formulations of 80% soursop pulp, 60% soursop pulp and 40% soursop pulp
were selected for the storage studies. All the physico-chemical parameters were
analyzed using the recommended AOAC (2002) methods. Moisture, pH, titratable
acidity, total soluble solids, ascorbic acid and total sugar were analyzed during the
storage period.
Results and Discussion
1.0 Physico-Chemical Qualities of Soursop Jelly during Storage
a. Moisture
The changes in moisture content during storage of soursop jelly are shown in Table
2.In all treatments, moisture content significantly (p<0.05) increased throughout the
storage period.Maximum value of 42.43% was observed in jelly with 40% soursop
pulp at the end of 12 weeks storage period. Minimum moisture content observed in
Jelly with 80% soursop pulp value is 22.23%.
Table 2: Changes in Moisture Content of Soursop Jelly during Storage
Duration
(Weeks)
T2 T3 T4
2 22.23±0.08c
28.73±0.14b
34.15±0.07a
4 23.27±0.08c
29.33±0.08b
36.40±0.17a
6 25.37±0.03c
30.56±0.12b
38.33±0.06a
8 26.53±0.08c
32.57±0.12b
39.07±0.08c
10 30.20±0.05c
33.57±0.12b
40.27±0.12a
12 31.70±0.10c
33.33±0.12b
42.43±0.12a
Values are means of triplicates ± standard error
Values of the different superscripts in the same column are significantly different at p<0.05.
T2 - 80% soursop pulp; T3 - 60% soursop pulp and T4 - 40% soursop pulp concentration.
The moisture content gradually increase during storage because of it may be due to the
hydrolysis of sugar into alcohol, carbon dioxide and water. Same result was reported
by Rasheda (2011) guava jelly.
b. The pH
The result pertaining to the response of storage duration and different treatments of
soursop jelly on pH are present in Table 03.The results indicated that the pH of soursop
jelly decreased with increased duration of storage in all the formulation. There was a
significant (5%) decrease in pH during storage period at ambient temperature
(28±1⁰C). It was observed that the maximum pH (4.22) in the 40% of soursop pulp
jelly formulation in 2th
week and the least pH (3.18) was observed in 80% of soursop
pulp in last week.
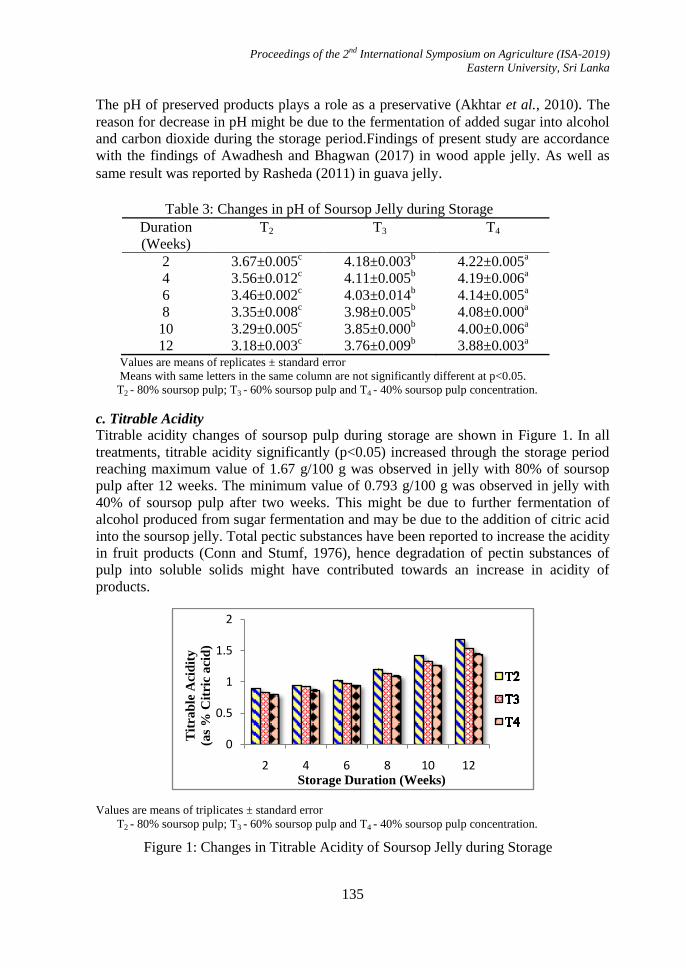
Proceedings of the 2nd International Symposium on Agriculture (ISA-2019)
Eastern University, Sri Lanka
135
The pH of preserved products plays a role as a preservative (Akhtar et al., 2010). The
reason for decrease in pH might be due to the fermentation of added sugar into alcohol
and carbon dioxide during the storage period.Findings of present study are accordance
with the findings of Awadhesh and Bhagwan (2017) in wood apple jelly. As well as
same result was reported by Rasheda (2011) in guava jelly.
Table 3: Changes in pH of Soursop Jelly during Storage
Duration
(Weeks)
T2 T3 T4
2 3.67±0.005c
4.18±0.003b
4.22±0.005a
4 3.56±0.012c
4.11±0.005b
4.19±0.006a
6 3.46±0.002c
4.03±0.014b
4.14±0.005a
8 3.35±0.008c
3.98±0.005b
4.08±0.000a
10 3.29±0.005c
3.85±0.000b
4.00±0.006a
12 3.18±0.003c
3.76±0.009b
3.88±0.003a
Values are means of replicates ± standard error
Means with same letters in the same column are not significantly different at p<0.05.
T2 - 80% soursop pulp; T3 - 60% soursop pulp and T4 - 40% soursop pulp concentration.
c. Titrable Acidity
Titrable acidity changes of soursop pulp during storage are shown in Figure 1. In all
treatments, titrable acidity significantly (p<0.05) increased through the storage period
reaching maximum value of 1.67 g/100 g was observed in jelly with 80% of soursop
pulp after 12 weeks. The minimum value of 0.793 g/100 g was observed in jelly with
40% of soursop pulp after two weeks. This might be due to further fermentation of
alcohol produced from sugar fermentation and may be due to the addition of citric acid
into the soursop jelly. Total pectic substances have been reported to increase the acidity
in fruit products (Conn and Stumf, 1976), hence degradation of pectin substances of
pulp into soluble solids might have contributed towards an increase in acidity of
products.
Values are means of triplicates ± standard error T2 - 80% soursop pulp; T3 - 60% soursop pulp and T4 - 40% soursop pulp concentration.
Figure 1: Changes in Titrable Acidity of Soursop Jelly during Storage
0
0.5
1
1.5
2
2 4 6 8 10 12
Tit
rab
le A
cid
ity
(as
% C
itri
c a
cid
)
Storage Duration (Weeks)
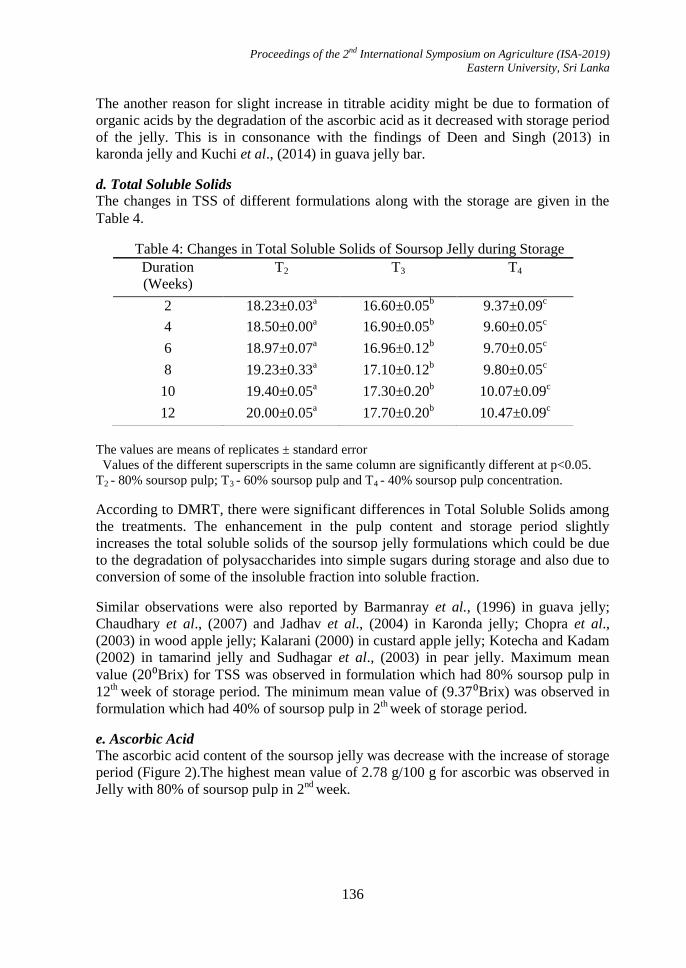
Proceedings of the 2nd International Symposium on Agriculture (ISA-2019)
Eastern University, Sri Lanka
136
The another reason for slight increase in titrable acidity might be due to formation of
organic acids by the degradation of the ascorbic acid as it decreased with storage period
of the jelly. This is in consonance with the findings of Deen and Singh (2013) in
karonda jelly and Kuchi et al., (2014) in guava jelly bar.
d. Total Soluble Solids
The changes in TSS of different formulations along with the storage are given in the
Table 4.
Table 4: Changes in Total Soluble Solids of Soursop Jelly during Storage
The values are means of replicates ± standard error
Values of the different superscripts in the same column are significantly different at p<0.05.
T2 - 80% soursop pulp; T3 - 60% soursop pulp and T4 - 40% soursop pulp concentration.
According to DMRT, there were significant differences in Total Soluble Solids among
the treatments. The enhancement in the pulp content and storage period slightly
increases the total soluble solids of the soursop jelly formulations which could be due
to the degradation of polysaccharides into simple sugars during storage and also due to
conversion of some of the insoluble fraction into soluble fraction.
Similar observations were also reported by Barmanray et al., (1996) in guava jelly;
Chaudhary et al., (2007) and Jadhav et al., (2004) in Karonda jelly; Chopra et al.,
(2003) in wood apple jelly; Kalarani (2000) in custard apple jelly; Kotecha and Kadam
(2002) in tamarind jelly and Sudhagar et al., (2003) in pear jelly. Maximum mean
value (20⁰Brix) for TSS was observed in formulation which had 80% soursop pulp in
12th
week of storage period. The minimum mean value of (9.37⁰Brix) was observed in
formulation which had 40% of soursop pulp in 2th
week of storage period.
e. Ascorbic Acid
The ascorbic acid content of the soursop jelly was decrease with the increase of storage
period (Figure 2).The highest mean value of 2.78 g/100 g for ascorbic was observed in
Jelly with 80% of soursop pulp in 2nd
week.
Duration
(Weeks)
T2 T3 T4
2 18.23±0.03a
16.60±0.05b
9.37±0.09c
4 18.50±0.00a
16.90±0.05b
9.60±0.05c
6 18.97±0.07a
16.96±0.12b
9.70±0.05c
8 19.23±0.33a
17.10±0.12b
9.80±0.05c
10 19.40±0.05a
17.30±0.20b
10.07±0.09c
12 20.00±0.05a
17.70±0.20b
10.47±0.09c
Proceedings of the 2nd International Symposium on Agriculture (ISA-2019)
Eastern University, Sri Lanka
137
Values are means of triplicates ± standard error.
T2 - 80% soursop pulp; T3 - 60% soursop pulp and T4 - 40% soursop pulp concentration.
Figure 2: Changes in Ascorbic Acid Content during Storage period
The loss of ascorbic acid during storage may be due to oxidation of ascorbic acid. This
oxidation due to temperature and greater catalytic activity of fructose in the
catabolization of vitamin C.Similar evidences have also been reported by Jadhav et al.,
(2004) in Karonda jelly and Selvamuthukumaran (2007) in sea buckthorn jelly.
f. Total Sugar
According to Duncan‟s Multiple Range Test, total sugar increased significantly
(p<0.05) throughout the storage. Total sugar in all treatments had the increasing trend
with the storage period shown in (Figure 3). The highest mean value of 82.4% was
recorded by Jelly formulation with 80% soursop pulp in 12th
week and least mean value
of 53.11% was recorded Jelly formulation with 40% soursop pulp in 2nd
week.
Due to the hydrolysis of polysaccharides like pectin and starch could also be one of the
reasons for increase in the sugars content. Similar observations were also recorded by
the several workers like Deen and Singh (2013) in karonda jelly and Awadhesh and
Bhagwan (2017) in wood apple jelly. The highest mean value (82.4%) was recorded by
Jelly formulation with 80% soursop pulp in 12th
week and least mean value (53.11%)
was recorded Jelly formulation with 40% soursop pulp in 2nd
week.
0
0.5
1
1.5
2
2.5
3
2 4 6 8 10 12
Asc
orb
ic A
cid
(g
/10
0g
)
Storage Duration (Weeks)
T2
T3
T4

Proceedings of the 2nd International Symposium on Agriculture (ISA-2019)
Eastern University, Sri Lanka
138
Values are means of triplicates ± standard error.
T2 - 80% soursop pulp; T3 - 60% soursop pulp and T4 - 40% soursop pulp concentration.
Figure 3: Changes in Total Sugar Content during Storage period
2.0 Microbiological Test for Soursop Jelly
a. Microbial Evaluation of Soursop Jelly Stored at 28±1⁰C after One Month
There was no any microbial contamination observed in the jelly samples, which were
stored at ambient temperature (28±1⁰C). This may due to inhibition of microbial
growth by sugar. Sugar interference with a microbe‟s enzyme activity and weakening
the molecular structure of its DNA.
b. Microbial Evaluation of Soursop Jelly Stored at 28±1⁰C after Three months
There were some numbers of microbes present in the jelly sample (100
concentration
level) of T4 and diluted jelly samples (10-2
, 10-3
concentration level) of T4, T3 and T2 at
ambient temperature (28 ±1⁰C). The microbial count should not exceed to 103 per ml or
g of jelly. The tested microbiological parameter total plate count below the reference
standard.
3.0 Sensory qualities of Soursop Jelly during Storage
a. Colour
Colour is the first attribute considered by the consumer to judge the acceptability and
overall quality of food (Al-Hooti and Sidhu, 1997). Therefore among this, colour is a
one of the most important sensory quality. Attractive colour of the end product gives
good demand for it. The sensory scores with respect to colour of all formulations were
slightly decreased after 12 weeks of storage (Table 5). These jellies had natural colour
pigments. In storage it could be attributed to enzymatic or non-enzymatic browning
(Maillard reactions) In fact, the presence of a higher amount of reducing sugars after
0
20
40
60
80
100
2 4 6 8 10 12
To
tal
Su
ga
r (
%)
Storage Duration (Weeks)
T2
T3
T4
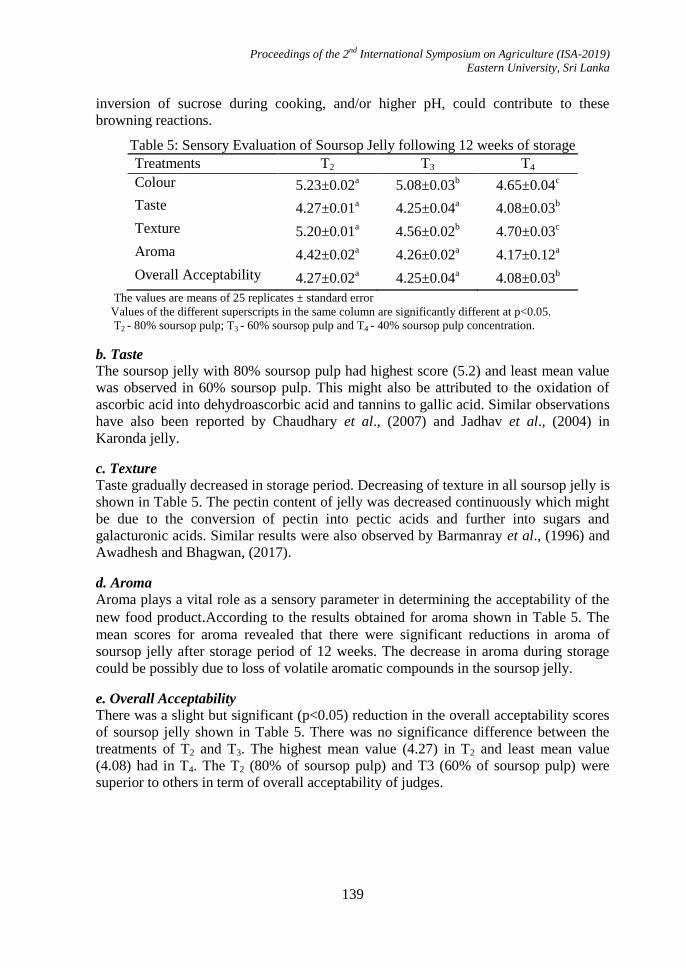
Proceedings of the 2nd International Symposium on Agriculture (ISA-2019)
Eastern University, Sri Lanka
139
inversion of sucrose during cooking, and/or higher pH, could contribute to these
browning reactions.
Table 5: Sensory Evaluation of Soursop Jelly following 12 weeks of storage
Treatments T2 T3 T4
Colour 5.23±0.02a
5.08±0.03b
4.65±0.04c
Taste 4.27±0.01a
4.25±0.04a
4.08±0.03b
Texture 5.20±0.01a
4.56±0.02b
4.70±0.03c
Aroma 4.42±0.02a
4.26±0.02a
4.17±0.12a
Overall Acceptability 4.27±0.02a
4.25±0.04a
4.08±0.03b
The values are means of 25 replicates ± standard error
Values of the different superscripts in the same column are significantly different at p<0.05.
T2 - 80% soursop pulp; T3 - 60% soursop pulp and T4 - 40% soursop pulp concentration.
b. Taste
The soursop jelly with 80% soursop pulp had highest score (5.2) and least mean value
was observed in 60% soursop pulp. This might also be attributed to the oxidation of
ascorbic acid into dehydroascorbic acid and tannins to gallic acid. Similar observations
have also been reported by Chaudhary et al., (2007) and Jadhav et al., (2004) in
Karonda jelly.
c. Texture Taste gradually decreased in storage period. Decreasing of texture in all soursop jelly is
shown in Table 5. The pectin content of jelly was decreased continuously which might
be due to the conversion of pectin into pectic acids and further into sugars and
galacturonic acids. Similar results were also observed by Barmanray et al., (1996) and
Awadhesh and Bhagwan, (2017).
d. Aroma
Aroma plays a vital role as a sensory parameter in determining the acceptability of the
new food product.According to the results obtained for aroma shown in Table 5. The
mean scores for aroma revealed that there were significant reductions in aroma of
soursop jelly after storage period of 12 weeks. The decrease in aroma during storage
could be possibly due to loss of volatile aromatic compounds in the soursop jelly.
e. Overall Acceptability
There was a slight but significant (p<0.05) reduction in the overall acceptability scores
of soursop jelly shown in Table 5. There was no significance difference between the
treatments of T2 and T3. The highest mean value (4.27) in T2 and least mean value
(4.08) had in T4. The T2 (80% of soursop pulp) and T3 (60% of soursop pulp) were
superior to others in term of overall acceptability of judges.
Proceedings of the 2nd International Symposium on Agriculture (ISA-2019)
Eastern University, Sri Lanka
140
Conclusions
Soursop is one of the underutilized fruit in our country which is rich in various
nutritious, bioactive components and antioxidant properties. However, there are
limitations in exploitation of soursop because of seasonal availability, scarcity and less
facility long term storage without causing alternations to their sensory qualities.
Though several productive research have been done based on soursop valve
addition.Formulation of soursop jelly is a new product popularizing the effective
utilization of Soursop fruit and promoting the jelly production for commercial purpose
from underutilized fruits. According to physico-chemical and sensory qualities of jelly
with 80% of soursop pulp is the best combination for maintain the without any
significant changes and extend the shelf life at 28±1⁰C temperature and 80-90% RH
which has no any harmful effect for consumers during 12 weeks storage period.
References
Akltar, S., Riaz, M., Ahamad, A. and Nisar, A. (2010). Physico-chemical,
microbiological and sensory stability of chemistry preserved mango pulp.
PakistanJournal of Nutrition, 45(2): 853-862.
Al-Hooti, S., Sidha, J., Alotaibai, J., Al Ameeri, H. and Qabazard, H. (1997).
Processing quality of important date cultivars grown in the united Arab Emirates for
jam, butter and dates in syrup. Advance Food Science, 32: 35-40.
AOAC. (2002). Official Methods of Analysis (17th ed.). Association of official
Analytical Chemists. 125-139.
Barmanray, A., Gopta, O. and Dhawan, S. (1996). Comparison of guava hybrids with
commercial cultivars for jelly making jelly. Haryana Journal of Horticultural
Science, 25(4): 196-204.
Barrette, M. (2014). Guyabano-health-benefits of soursop-fruits. Available:
http://www.naturalsociety.com. (January 04, 2014).
Chaudhary, R., Yadav, M. and Singh, D. (2007). Changes in physico-chemical
characteristics of Karonda jelly during storage period. Plant Archives, 7( 2): 885-
887.
Chopra, C., Singh, P. and Singh, R. (2003). Studies on preparation of jelly from
woodapple (Limonia acidissima L.) Fruits. Beverage and Food World, 30(3): 13-14.
Conn, E. and Stumf, P. (1976). Outines of Biochemistry. NewDelhi: Wiley Eastern
Ltd, 30-40.
Deen, B. and Singh, I. (2013). Studies on preparation and storage of jelly from
Karonda (Carissa carandas L.) fruits. Beverage and Food World, 40(1): 60-64.
Proceedings of the 2nd International Symposium on Agriculture (ISA-2019)
Eastern University, Sri Lanka
141
Jadav, S.B., Joshi, G.D. and Garande, V.K. (2004). Studies on preparation and storage
of Karonda (Carissa carandas L.) fruit products. Beverage and Food World,31(5):
46-47.
Kalarani, R. (2000). Processing of value added products from custard apple.Journal
ofFood Science and Nutrition,35: 67-69.
Khatun, R. (2011). Studies on storage stability of guava juice and jelly. Thesis, M.
Tech, Bangladesh Agricultural University, Mymensingh, Bangladesh. 1-68.
Kotecha, P. and Kadam, S. (2002). Processing of tarmarind in to value added products.
Beverage and Food World, 29 (10): 11-12.
kuchi, V., Gopta, R. and Tamang, S. (2014). Standardization of recipe for preparation
of guava jelly bar. Journal of Crop Weed, 10(2): 22-81.
Kumar, A. & Deen , B. (2017). Studies on preparation and storage of jelly from
woodapple fruits. Journal of Pharmacognosy and Phytochemistry, 6(6): 224-229.
Selvamuthukumaran, M., Khanum, F. and Bawa, A. (2007). Development of sea
buckthorn mixed fruit jelly. International Journal of Food Science and Technology,
42: 403-410.
Sinthiya, R. and Poornima, k. (2017). Value added products from Annona fruit.
Journal of Environment Science, 11: 01-05.
Sudhagar, T., Manimegalai, G. & Saravanakumar, R. (2003). Storage behaviour of pear
jelly in different packaging materials. Beverage Food world, 3: 41-42.
Tesio, H. (2013). healing- powers- guyabano. Available: http://www.sunstar.com. (July
05, 2013).
Proceedings of the 2nd International Symposium on Agriculture (ISA-2019)
Eastern University, Sri Lanka
142
ASSESSMENT OF ANTIOXIDANT AND MINERAL CONTENT IN
SELECTED WILD GREEN LEAFY VEGETABLES
K. Krishanthiny* and U. Mathiventhan
Department of Botany, Faculty of Science, Eastern University, Sri Lanka
*Corresponding author:[email protected]
Abstract
Wild greens make up a significant source of antioxidants and Phyto-chemicals. In
recent times natural antioxidants have gained considerable interest among nutritionists,
food manufacturers, and consumers because of their safety, potential therapeutic value,
and long shelf life. Minerals are inorganic substances used by the body in many ways.
Three Wild Green Leafy Vegetables (WGLVs) such as Allmania nodiflora, Borreria
hispida and Rivea ornata were selected based on the market survey. The analysis for
Vitamin C, Total Phenolic Content (TPC) and Total Antioxidant Activities (TAA) was
carried out using fresh WGLVs. Selected Dry WGLVs were also used to investigate
some essential major elements such as Na, K, Ca and Mg by using standard methods of
food analysis. The Vitamin C content was determined by 2, 4-dinitrophenyl hydrazine
method (DNPH), TPC was measured using Folin-Ciocalteu reagent method and TAA
was determined by the ferric reducing ability method. Among these leafy vegetables
Rivea ornata shows higher Vitamin C, TPC and higher K, Ca and Mg content.
Allmania nodiflora shows high TAA and Na content.
Keywords: Wild Green Leafy Vegetables, Vitamin C, Total Phenolic Content
Introduction
Plants have always been a source of inspiration and way of livelihood to human kind
since time immemorial. Green leafy vegetables are rich sources of antioxidant vitamins
(Gupta et al., 2005). The wild edible plants growing in their natural conditions have
been a source of food to the rural people inhabiting to the remote areas of the world
including Sri Lanka.
Wild plants contain many natural antioxidant compounds which have been identified as
a free radical or active oxygen scavengers (Zheng and Wang, 2001). Mathiventhan et
al., (2014) reported that 30 species of edible green leaves were obtained from home
gardens, river side‟s and forest lands for consumption in Eastern Province of Sri
Lanka.There are more wild edible leafy vegetables available in Batticaloa district, few
of them are subjected to investigate Antioxidant activity and Mineral contents.
Therefore, this study was aimed to investigate the presence of antioxidants and mineral
content in selected WGLVs.
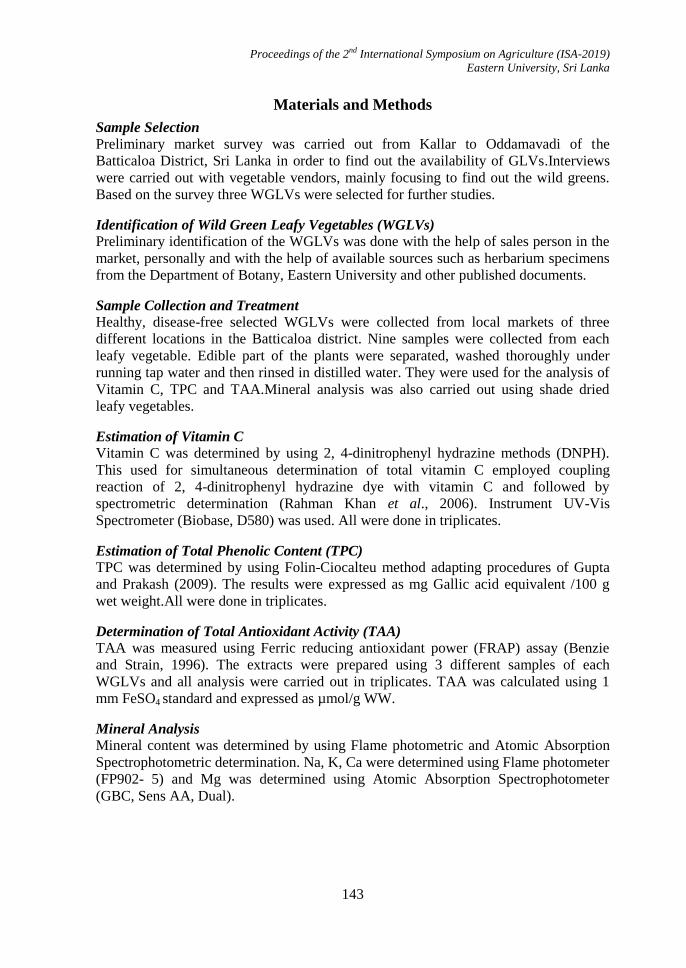
Proceedings of the 2nd International Symposium on Agriculture (ISA-2019)
Eastern University, Sri Lanka
143
Materials and Methods
Sample Selection
Preliminary market survey was carried out from Kallar to Oddamavadi of the
Batticaloa District, Sri Lanka in order to find out the availability of GLVs.Interviews
were carried out with vegetable vendors, mainly focusing to find out the wild greens.
Based on the survey three WGLVs were selected for further studies.
Identification of Wild Green Leafy Vegetables (WGLVs)
Preliminary identification of the WGLVs was done with the help of sales person in the
market, personally and with the help of available sources such as herbarium specimens
from the Department of Botany, Eastern University and other published documents.
Sample Collection and Treatment
Healthy, disease-free selected WGLVs were collected from local markets of three
different locations in the Batticaloa district. Nine samples were collected from each
leafy vegetable. Edible part of the plants were separated, washed thoroughly under
running tap water and then rinsed in distilled water. They were used for the analysis of
Vitamin C, TPC and TAA.Mineral analysis was also carried out using shade dried
leafy vegetables.
Estimation of Vitamin C
Vitamin C was determined by using 2, 4-dinitrophenyl hydrazine methods (DNPH).
This used for simultaneous determination of total vitamin C employed coupling
reaction of 2, 4-dinitrophenyl hydrazine dye with vitamin C and followed by
spectrometric determination (Rahman Khan et al., 2006). Instrument UV-Vis
Spectrometer (Biobase, D580) was used. All were done in triplicates.
Estimation of Total Phenolic Content (TPC)
TPC was determined by using Folin-Ciocalteu method adapting procedures of Gupta
and Prakash (2009). The results were expressed as mg Gallic acid equivalent /100 g
wet weight.All were done in triplicates.
Determination of Total Antioxidant Activity (TAA)
TAA was measured using Ferric reducing antioxidant power (FRAP) assay (Benzie
and Strain, 1996). The extracts were prepared using 3 different samples of each
WGLVs and all analysis were carried out in triplicates. TAA was calculated using 1
mm FeSO4 standard and expressed as µmol/g WW.
Mineral Analysis
Mineral content was determined by using Flame photometric and Atomic Absorption
Spectrophotometric determination. Na, K, Ca were determined using Flame photometer
(FP902- 5) and Mg was determined using Atomic Absorption Spectrophotometer
(GBC, Sens AA, Dual).
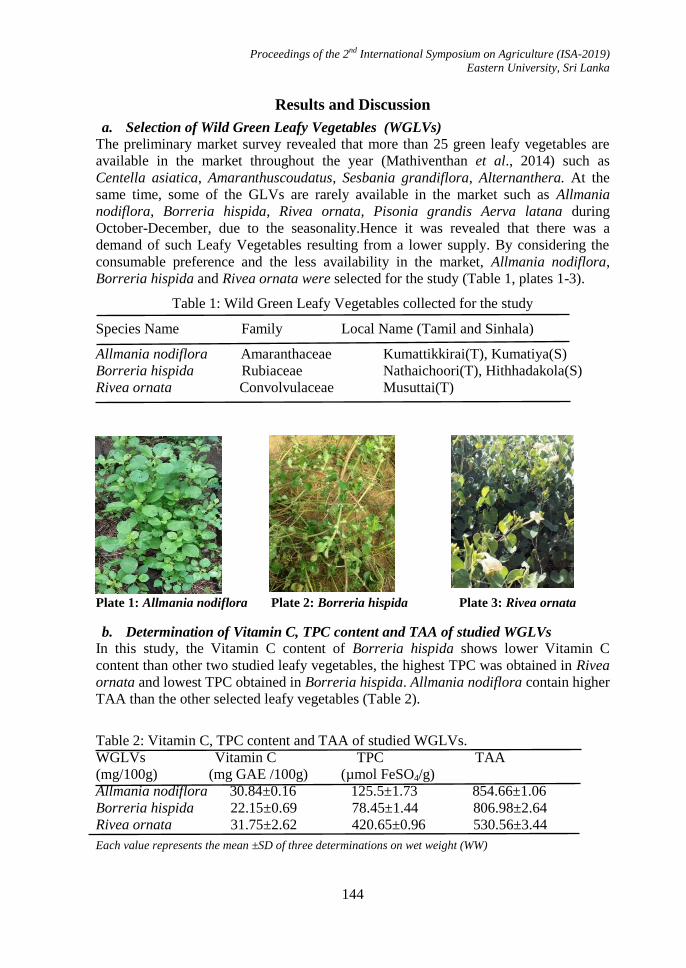
Proceedings of the 2nd International Symposium on Agriculture (ISA-2019)
Eastern University, Sri Lanka
144
Results and Discussion
a. Selection of Wild Green Leafy Vegetables (WGLVs) The preliminary market survey revealed that more than 25 green leafy vegetables are
available in the market throughout the year (Mathiventhan et al., 2014) such as
Centella asiatica, Amaranthuscoudatus, Sesbania grandiflora, Alternanthera. At the
same time, some of the GLVs are rarely available in the market such as Allmania
nodiflora, Borreria hispida, Rivea ornata, Pisonia grandis Aerva latana during
October-December, due to the seasonality.Hence it was revealed that there was a
demand of such Leafy Vegetables resulting from a lower supply. By considering the
consumable preference and the less availability in the market, Allmania nodiflora,
Borreria hispida and Rivea ornata were selected for the study (Table 1, plates 1-3).
Table 1: Wild Green Leafy Vegetables collected for the study
Species Name Family Local Name (Tamil and Sinhala)
Allmania nodiflora Amaranthaceae Kumattikkirai(T), Kumatiya(S)
Borreria hispida Rubiaceae Nathaichoori(T), Hithhadakola(S)
Rivea ornata Convolvulaceae Musuttai(T)
Plate 1: Allmania nodiflora Plate 2: Borreria hispida Plate 3: Rivea ornata
b. Determination of Vitamin C, TPC content and TAA of studied WGLVs
In this study, the Vitamin C content of Borreria hispida shows lower Vitamin C
content than other two studied leafy vegetables, the highest TPC was obtained in Rivea
ornata and lowest TPC obtained in Borreria hispida. Allmania nodiflora contain higher
TAA than the other selected leafy vegetables (Table 2).
Table 2: Vitamin C, TPC content and TAA of studied WGLVs.
WGLVs Vitamin C TPC TAA
(mg/100g) (mg GAE /100g) (µmol FeSO4/g)
Allmania nodiflora 30.84±0.16 125.5±1.73 854.66±1.06
Borreria hispida 22.15±0.69 78.45±1.44 806.98±2.64
Rivea ornata 31.75±2.62 420.65±0.96 530.56±3.44
Each value represents the mean ±SD of three determinations on wet weight (WW)
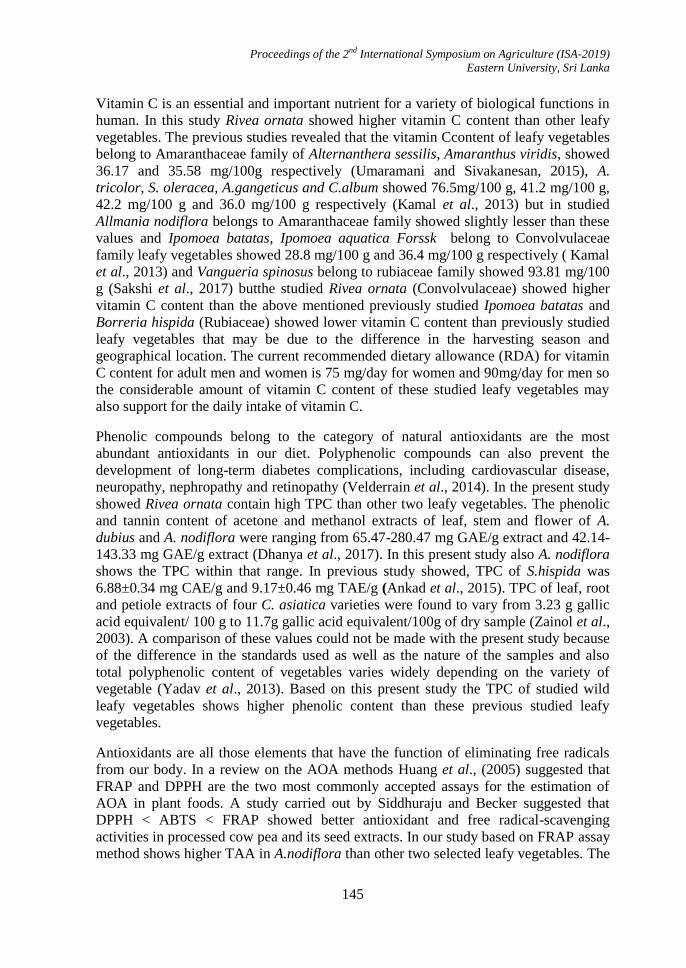
Proceedings of the 2nd International Symposium on Agriculture (ISA-2019)
Eastern University, Sri Lanka
145
Vitamin C is an essential and important nutrient for a variety of biological functions in
human. In this study Rivea ornata showed higher vitamin C content than other leafy
vegetables. The previous studies revealed that the vitamin Ccontent of leafy vegetables
belong to Amaranthaceae family of Alternanthera sessilis, Amaranthus viridis, showed
36.17 and 35.58 mg/100g respectively (Umaramani and Sivakanesan, 2015), A.
tricolor, S. oleracea, A.gangeticus and C.album showed 76.5mg/100 g, 41.2 mg/100 g,
42.2 mg/100 g and 36.0 mg/100 g respectively (Kamal et al., 2013) but in studied
Allmania nodiflora belongs to Amaranthaceae family showed slightly lesser than these
values and Ipomoea batatas, Ipomoea aquatica Forssk belong to Convolvulaceae
family leafy vegetables showed 28.8 mg/100 g and 36.4 mg/100 g respectively ( Kamal
et al., 2013) and Vangueria spinosus belong to rubiaceae family showed 93.81 mg/100
g (Sakshi et al., 2017) butthe studied Rivea ornata (Convolvulaceae) showed higher
vitamin C content than the above mentioned previously studied Ipomoea batatas and
Borreria hispida (Rubiaceae) showed lower vitamin C content than previously studied
leafy vegetables that may be due to the difference in the harvesting season and
geographical location. The current recommended dietary allowance (RDA) for vitamin
C content for adult men and women is 75 mg/day for women and 90mg/day for men so
the considerable amount of vitamin C content of these studied leafy vegetables may
also support for the daily intake of vitamin C.
Phenolic compounds belong to the category of natural antioxidants are the most
abundant antioxidants in our diet. Polyphenolic compounds can also prevent the
development of long-term diabetes complications, including cardiovascular disease,
neuropathy, nephropathy and retinopathy (Velderrain et al., 2014). In the present study
showed Rivea ornata contain high TPC than other two leafy vegetables. The phenolic
and tannin content of acetone and methanol extracts of leaf, stem and flower of A.
dubius and A. nodiflora were ranging from 65.47-280.47 mg GAE/g extract and 42.14-
143.33 mg GAE/g extract (Dhanya et al., 2017). In this present study also A. nodiflora
shows the TPC within that range. In previous study showed, TPC of S.hispida was
6.88±0.34 mg CAE/g and 9.17±0.46 mg TAE/g (Ankad et al., 2015). TPC of leaf, root
and petiole extracts of four C. asiatica varieties were found to vary from 3.23 g gallic
acid equivalent/ 100 g to 11.7g gallic acid equivalent/100g of dry sample (Zainol et al.,
2003). A comparison of these values could not be made with the present study because
of the difference in the standards used as well as the nature of the samples and also
total polyphenolic content of vegetables varies widely depending on the variety of
vegetable (Yadav et al., 2013). Based on this present study the TPC of studied wild
leafy vegetables shows higher phenolic content than these previous studied leafy
vegetables.
Antioxidants are all those elements that have the function of eliminating free radicals
from our body. In a review on the AOA methods Huang et al., (2005) suggested that
FRAP and DPPH are the two most commonly accepted assays for the estimation of
AOA in plant foods. A study carried out by Siddhuraju and Becker suggested that
DPPH < ABTS < FRAP showed better antioxidant and free radical-scavenging
activities in processed cow pea and its seed extracts. In our study based on FRAP assay
method shows higher TAA in A.nodiflora than other two selected leafy vegetables. The
Proceedings of the 2nd International Symposium on Agriculture (ISA-2019)
Eastern University, Sri Lanka
146
previous studies showed that lettuce in Brazil was 447.1 µmol Fe2+
/g (Ana et al., 2012)
but the studied WGLVs showed higher than this value. So based on this study the
selected three WGLVs are good source for Anti-oxidants than lettuce in Brazil. And
also in an earlier investigation, the levels of TAC of A.viridis , A.sessilis and O.rubra
belongs to the family Amaranthaceae showed 3525.00 AEAC/100g, 1100.00 mg
AEAC/100g and 2576.00 AEAC/100g respectively and V.spinosus belongs to the
family rubiaceae and I.batatas belongs to the family Convolvulaceae showed 2584.00
and 4083.33 AEAC/100g respectively (Sakshi et al., 2017). In this present study,
compared to R.ornata the total phenolic compound was low in A.nodiflora and
B.hispida but these two leafy vegetables showed higher antioxidant activity than
R.ornata. This may be due to the non-phenolic substances responsible for the anti-
oxidant activity (Adriana et al., 2012).
c. Mineral Content of Studied WGLVs
Table 3: Mineral composition of selected leafy vegetables (mg /100g)
Minerals Allmania nodiflora Borreria hispida Rivea ornata
Na 253.77±6.71 133.9±7.16 127.3±2.4
K 289.87±5.23 483.3±12.52 2523.3±11.53
Ca 996.67±18.3 525.53±22.54 2514.43±6.50
Mg 1513.1±10.53 1138.13±23.76 2504.17±9.97 Each value represents the mean ±SD of three determinations on dry weight (DW) basis.
Sodium content of studied leafy vegetables was remarkably similar to 246.7 mg/100g
reported for the leaves of Alternanthera sessilis (Gotruvalli et al., 2016). But
Amaranthus viridis has 108 mg/100g (Nisha et al., 2012). Potassium concentrations in
the analyzed samples were showed lower than Amaranthus viridis and Alternanthera
sessilis having value of 3460 mg/100g and 412.2 mg/100g respectively. Sodium to
potassium ratio of less than one has been recommended for the prevention of high
blood pressure. Calcium functions as a constituent of bones and teeth, regulation of
nerve and muscle function. Calcium content was found to be high in Rivea ornata
(2514.43 mg/100g) and low in Borreria hispida (525.53 mg/100g). Magnesium is
known to prevent cardiomyopathy, muscle degeneration, growth retardation, alopecia,
dermatitis, immunologic dysfunction, gonadal atrophy, impaired spermatogenesis,
congenital malformations and bleeding disorders. Based on this study Rivea ornata
showed higher Potassium, Calcium and Magnesium content than other two WGLVs.
but Sodium content is high in Allmania nodiflora (253.77 mg/100g) so these cheap and
locally available Wild Green leafy vegetables are recommended to add in main diet as
they contain considerable amount of minerals.
Conclusion and Recommendation
All three WGLVs contain Vitamin C, TPC, TAA and the Mineral Na, K, Ca and Mg.
Rivea ornata has high Vitamin C, high TPC, high Potassium, Calcium and Magnesium
content and Allmania nodiflora has high TAA and Sodium content. Therefore, these
two WGLVs may considered as promising WGLVs. By considering the consumer
Proceedings of the 2nd International Symposium on Agriculture (ISA-2019)
Eastern University, Sri Lanka
147
preferences and the antioxidant properties, it is advisable to domesticate these WGLVs
for wider consumers and this will lead to available throughout the year.
Acknowledgments
I express my sincere thanks to my research supervisor Mrs.U.Mathiventhan
Department of Botany, and Dr.T.Mathiventhan, Head, Department of Botany Eastern
University, Sri Lanka for valuable guidance to this work and Prof. (Mrs). Thevaki
Mahendran, Senior Professor in Agricultural Chemistry, Department of Agricultural
Chemistry and Dr.M.Sithambaresan, Head, Department of Chemistry, Eastern
University, Sri Lanka for providing the laboratory facility and technical officers for
their genuine support during this study.
References
Adriana, M.F.O., Lilian, S.P., Charlane, K. S. P., Wemerson, N. M., Roosevelt,
A.G., Otemberg,S. C., Maria, F. V. S., Reinaldo, N. A., and Temilce, S. A. (2012).
Total Phenolic Content and Antioxidant Activity of Some Malvaceae Family
Species, Multidisciplinary Digital Publishing Institute (MDPI), 1 (1): 33–43.
Ana P. Tiveron, Priscilla S. Melo, Keityane B. Bergamaschi, Thais M. F. S. Vieira,
Marisa A. B. Regitano-d‟Arce and Severino M. Alencar (2012)Antioxidant Activity
of Brazilian Vegetables and Its Relation with Phenolic Composition, International
Journal of Molecular Sciences ,13: 8943-8957.
Ankad, G. M., Konakeri, R. T., Hegde, H. V., and Roy.S. (2015)Variation in
Pharmacognostic Characters and Polyphenolic Contents among Four Species of
Medicinal Plants from the Genus Spermacoce (Rubiaceae), Indian Journal of
Pharmaceutical Sciences, 77(4):446-452.
Benzie, I. F. F. and Dan Strain J. J. (1996). The Ferric Reducing Ability of Plasma
(FRAP) as Measure of „Antioxidant Power‟: The Frap Assay. Journal of
Biochemistryand Analytical Biochemistry, 239:70-76.
Dhanya, V., Ragavendran, U., Aathira, M., Saipriya, V., Sangeetha Priya, M.,
Palanisamy, S and Siddhuraju. P. (2017). Biochemical Composition and
Antioxidant Potential of Raw and Hydrothermal Treated of Two Underutilized
Leafy Vegetables Amaranthus dubius and Allmania nodiflora. International Journal
of Food Science and Nutrition, 2(4): 95-107.
Gotruvalli, M., Prashanth, K., Lava, C. and Shiddamallayya, N. (2016). Nutritional
analysis of edible wild plants used by hakki pikki tribes of Hassan district,
Karnataka, India, International Journal of Pharmacy and Pharmaceutical Science,
8(8): 390-393.
Gupta, S., Lakshmi, J. A., Manjunath, M. N. and Prakash, J. (2005). Analysis of
nutrient and antinutrient content of underutilized green leafy vegetables.
Lebensmittel-Wissenschaft und Technologie (LWT), 38:339–345.
Proceedings of the 2nd International Symposium on Agriculture (ISA-2019)
Eastern University, Sri Lanka
148
Huang, D., Ou, B., and Prior, R. L. (2005). “Review on AOA methods: the chemistry
behind antioxidant capacity assays,” Journal of Agricultural and Food Chemistry,
53(6): 1841–1856.
I.O.M. (2000). Food and Nutrition Board Dietory Reference Intakes for Vitamin C,
Vitamin E, Selenium and Carotenoids. National Academy Press, Washington, D.C,
95-185.
Kamal, K., Tanvir, M. and Azizur, R. (2013). Chemical Composition of Some Leafy
Vegetables of Bangladesh, Journal of Science, 61(2): 199-201.
Mathiventhan, U., Sivakanesan, R. and Mathiventhan, T. (2014). Identification, market
availability and consumption of green leafy vegetables in Batticaloa, Sri Lanka,
Tropical Plant Research, 1(2): 17–25.
Nisha, S., Gupta, P. C. and Rao, C. V. (2012). Nutrient Content, Mineral Content and
Antioxidant Activity of Amaranthus viridis and Moringa oleifera Leaves. Research
Journal of Medicinal Plants, 6: 253-259.
Rahman Khan, M. M., Rahman, M. M., Islam, M. S., Begum, S. A. (2006). A Simple
UV-spectrophotometric method for the determination of Vitamin C content in
various fruits and vegetables at Sylhet Area in Bangaladesh, Journal of Biological
Sciences,6: 388-392.
Sakshi, G., Anuradha, S. and Eugenia, PL. (2017). Indigenous Leafy Vegetables for
Food and Nutritional Security in two districts of Jharkhand, India, Journal of
Pharmacognosy and Phytochemistry, 6(6): 901-909.
Siddhuraju, P., and Becker, K. (2007). “The antioxidant and free radical scavenging
activities of processed cowpea (Vigna unguiculata (L.) Walp.) Seed extracts,” Food
Chemistry, 101(1): 10–19.
Umaramani, M and Sivakanesan, R. (2015) Vitamin C content of commonly eaten
green leafy vegetables in fresh and under different storage conditions in Batticaloa,
Sri Lank, Tropical Plant Research, 2(3): 240–245.
Velderrain, G. R., Palafox, H., Wall, A., Ayala, J. F., Chen, C. Y. O., Robles,
M., Astiazaran, H., Alvarez, E. and González, G. A. (2014). Phenolic
compounds. Food Functions, 5: 189–197.
Yadav, R.K., Kalia, P., Raj Kumar and Varsha Jain. (2013).Antioxidant and
Nutritional Activity Studies of Green Leafy Vegetables, International Journal of
Agriculture and Food Science Technology, 4: 707-712.
Zainol, M. K., Abd Hamid, A., Yusof, S and Muse, R. (2003). Antioxidative activity
and total phenolic compounds of leaf, root and petiole of four Centella
asiaticaaccessions of (L) Urban. Food Chemistry, 81(4):575-581.
Zheng,W., and Wang, S.Y. (2001). Antioxidant activity and phenolic
compounds in selected herbs. Journal of Agricultural and Food Chemistry,
49: 5165-5170.

Proceedings of the 2nd International Symposium on Agriculture (ISA-2019)
Eastern University, Sri Lanka
149
INFLUENCE OF SOME MATERNAL ANTHROPOMETRIC
PARAMETERS ON HAEMOGLOBIN AND SERUM FERRITIN
CONCENTRATION AMONG PREGNANT MOTHERS AND THE
BIRTH WEIGHT OF THEIR BABIES IN THE BATTICALOA
DISTRICT
S. Amuthenie1*
and R. Sivakanesan2
1Department of Agric. Chemistry, Faculty of Agriculture, Eastern University, Sri Lanka 2Department of Biochemistry, Faculty of Medicine, University of Peradeniya, Peradeniya
*Corresponding author: [email protected]
Abstract
This cross sectional study was carried out during the period from April, 2013 to March,
2015. The survey covered a representative sample size of 382 at 95% confidence level.
The sampling frames for the clinics were obtained from the office of the Ministry of
Health, Batticaloa. The selected subjects were informed about the study and those who
were willing to participate in the study were screened by measuring their Erythrocyte
Sedimentation Rate (ESR) to determine whether they were having any subclinical
infections. Those who had any clinical and subclinical infections were excluded from
the study. Finally, a sample size of 382 pregnant mothers aged 15 to 49 years in the
second trimester was selected for this study. Pre-pregnancy height and weight, body fat
percentage, birth weight of the baby, haemoglobin level, and serum ferritin level of the
mothers during their second trimester were measured to assess the relationship between
the anthropometric and the biochemical parameters during pregnancy. Haemoglobin
level was measured by Cyanmethemoglobin method, and the serum ferritin level was
measured by ELISA method. Body fat percentage was directly measured by using
Warrior Digital Body Mass Caliper. Finally, data were entered and analyzed using
SPSS (Version 19) and MINITAB (Version 15). Serum ferritin correlated positively
with body fat percentage (r=0.771**, p=0.001) and negatively correlated with the early
pregnancy BMI (r=-0.153**, p=0.003). Further, pre pregnancy BMI positively
correlated with haemoglobin level (r=0.118*, p= 0.021) and their babies birth weight
(r=0.22**, p=0.001) and percentage of pre pregnancy obesity decreased with
increasing parity of the mothers.
Keywords: Anthropometric parameters, Birth weight, Haemoglobin, Pregnancy.
Introduction
Nutritional status, which indicates the total well-being of a population (Bhandari et al.,
2016) is important for good health and for increased work capacity of women,
especially those who are pregnant as it affects the health of their offspring (Black et al.,
2008). Poor nutritional status is a greater risk to both mother and children born to them
(Branca et al., 2015). The intake of sufficient nutrition during pregnancy is important
to the foetus to grow and develop physically and mentally to its full potential (Mann

Proceedings of the 2nd International Symposium on Agriculture (ISA-2019)
Eastern University, Sri Lanka
150
and Truswell, 2012). Cetin et al. (2010) found that micronutrients have an important
role to play in enzymes and transcription factors, and signal transduction pathways that
regulate development, and any imbalance in micronutrients can affect pregnancy
outcome. In a country like Sri Lanka where wide variations are noticeable in
socioeconomic status as well as in diet, the prevalence of iron deficiency anaemia
could show variations in different geographical and demographic subgroups. Since iron
deficiency anaemia (IDA) is a major contributory factor for maternal morbidity as well
as mortality. Due to the internal conflict over the last three decades in Sri Lanka
especially in the Batticaloa region there is an absence of reliable data on nutritional
status of pregnant women; especially on iron deficiency anaemia.There is lack of
information regarding maternal anthropometric parametersand its association with iron
status of pregnant women and their off springs in the Batticaloa district. Hence, there is
a need for a rationalized data on this important health problem in this region in order to
minimize this problem. Therefore, the purpose of this study was to identify the
influence of some maternal anthropometric parameters on the haemoglobin and serum
ferritin concentration among pregnant mothers and the birth weight of their babies in
the Batticaloa District.
Materials and Methods
The study was carried out during April 2013 to March 2015 on a population based
cross sectional study. The study population consisted of pregnant women attending the
Ministry of Health (MOH) antenatal clinics in the selected seven Divisional Secretariat
(DS) areas among 14 DS Division in the Batticaloa District. According to Cochran
(1977) the sample size was calculated. In Batticaloa District, the projected 2011
population statistics showed that the number of women of child bearing age (15-49
years) was 77349 out of 162398(total female population) which is about 47.62%
(Statistics hand book of Batticaloa District, 2012). The survey covered a representative
sample size of 382 at 95% confidence level. The sampling frames for the clinics were
obtained from the office of the Ministry of Health, Batticaloa. The selected subjects
were informed about the study and those who were willing to participate in the study
were screened by measuring their Erythrocyte Sedimentation Rate (ESR) to determine
whether they were having any subclinical infections. Those who had any clinical and
subclinical infections were excluded from the study. A detailed consent form
containing the description of the study and the information about the blood collection
was given to the subjects who were free from any infections and they were further
explained about the nature of the study. Finally 382 apparently healthy pregnant
mothers aged 15 to 49 years in the second trimester were selected.
The study was approved by the Ethical Committee of the Faculty of Health Care
Science, Eastern University of Sri Lanka. Some anthropometric parameters such as
pregnant mothers‟ weight in the second trimester of gestation (14- 26 weeks) was
measured using a physician scale (Detecto, USA) with the precision of 0.1kg, height of
the barefooted subjects was measured in centimetres by using a wall mounted
stadiometer (Doherty, UK), pre pregnancy weight was obtained from the B card at the

Proceedings of the 2nd International Symposium on Agriculture (ISA-2019)
Eastern University, Sri Lanka
151
first booking visit ≤ 6 weeks of gestation and it is generally agreed that the weight gain
during this period is negligible (Jananthan et al., 2009)., body fat percentage were
measured directly by using Warrior body mass caliper (Sequoia fitness products,
USA), Weights of the new born were recorded to the nearest 0.01kg within 24 hours of
delivery in the labour room by senior registered nursing officer using an electronic
scale. Venous blood (5ml) was collected from subjects by venipuncture. Blood
collections were carried out at the antenatal clinics by the nursing officer in-charge for
the clinics. Part (2ml) of collected blood was allowed to clot and then centrifuged at
3000 rpm for 5 minutes using a bench top centrifuge (Gemmy, Taiwan) to separate the
serum. Finally the serum was analyzed for ferritin content by using ELISA method and
the haemoglobin was determined by cyanmethemoglobin method. Processed data was
analyzed using Statistical Package for Social Sciences (SPSS) and MINITAB.
Descriptive statistics were used to get the percentages and frequencies of variables used
in this study. Pearson‟s correlation analysis was performed to estimate the correlations
among pre pregnancy BMI, new born‟s weight and the ferritin content of the mothers.
Results and Discussion
Pre pregnancy BMI of the mothers
The pre pregnancy BMI of mothers calculated based onweight at first booking visit and
the mean pre pregnancy BMI of the mothers was 22.79 kg/m2
(SD ±4.74) with a range
from 13.14kg/m2 to 40.63 kg/m
2. Of them around 40% were in the normal category,
20.4% were overweight, 21.7% were obese and 8.1% were under weight.
Table 1: Pre pregnancy BMI of mothers
Relationship between the pre pregnancy BMI and the body Fat percentage according
to parity
According to the Chi square analysis, the table 2 shows the relationship between the
pre pregnancy BMI and the fat percentage of mothers according to their parity. The
result from the descriptive analysis revealed that the percentage of pre pregnancy
obesity decreased with increasing parity of the mothers. The body fat percentage also
reduced with increasing parity in the present study. Similar result was reported by
Lassek and Gaulin (2006) in the USA.
Pre pregnant BMI (kg/m2)
Frequency Percentage
Under weight(< 18.5) 69 8.1
Normal(18.5-23) 152 39.8
Over weight(23-27) 78 20.4
Obese (> 27) 83 21.7
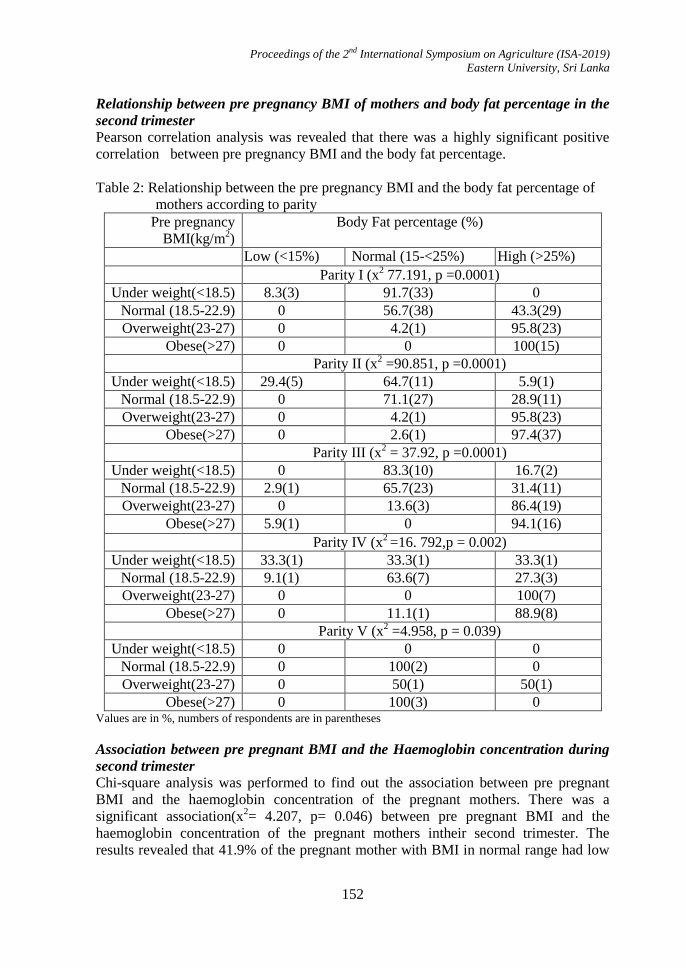
Proceedings of the 2nd International Symposium on Agriculture (ISA-2019)
Eastern University, Sri Lanka
152
Relationship between pre pregnancy BMI of mothers and body fat percentage in the
second trimester
Pearson correlation analysis was revealed that there was a highly significant positive
correlation between pre pregnancy BMI and the body fat percentage.
Table 2: Relationship between the pre pregnancy BMI and the body fat percentage of
mothers according to parity
Pre pregnancy
BMI(kg/m2)
Body Fat percentage (%)
Low (<15%) Normal (15-<25%) High (>25%)
Parity I (x2 77.191, p =0.0001)
Under weight(<18.5) 8.3(3) 91.7(33) 0
Normal (18.5-22.9) 0 56.7(38) 43.3(29)
Overweight(23-27) 0 4.2(1) 95.8(23)
Obese(>27) 0 0 100(15)
Parity II (x2 =90.851, p =0.0001)
Under weight(<18.5) 29.4(5) 64.7(11) 5.9(1)
Normal (18.5-22.9) 0 71.1(27) 28.9(11)
Overweight(23-27) 0 4.2(1) 95.8(23)
Obese(>27) 0 2.6(1) 97.4(37)
Parity III (x2 = 37.92, p =0.0001)
Under weight(<18.5) 0 83.3(10) 16.7(2)
Normal (18.5-22.9) 2.9(1) 65.7(23) 31.4(11)
Overweight(23-27) 0 13.6(3) 86.4(19)
Obese(>27) 5.9(1) 0 94.1(16)
Parity IV (x2 =16. 792,p = 0.002)
Under weight(<18.5) 33.3(1) 33.3(1) 33.3(1)
Normal (18.5-22.9) 9.1(1) 63.6(7) 27.3(3)
Overweight(23-27) 0 0 100(7)
Obese(>27) 0 11.1(1) 88.9(8)
Parity V (x2 =4.958, p = 0.039)
Under weight(<18.5) 0 0 0
Normal (18.5-22.9) 0 100(2) 0
Overweight(23-27) 0 50(1) 50(1)
Obese(>27) 0 100(3) 0 Values are in %, numbers of respondents are in parentheses
Association between pre pregnant BMI and the Haemoglobin concentration during
second trimester
Chi-square analysis was performed to find out the association between pre pregnant
BMI and the haemoglobin concentration of the pregnant mothers. There was a
significant association(x2= 4.207, p= 0.046) between pre pregnant BMI and the
haemoglobin concentration of the pregnant mothers intheir second trimester. The
results revealed that 41.9% of the pregnant mother with BMI in normal range had low

Proceedings of the 2nd International Symposium on Agriculture (ISA-2019)
Eastern University, Sri Lanka
153
haemoglobin concentration and 39.5% had haemoglobin in normal range. Likewise
among underweight pregnant mothers, 23.3% had low level of haemoglobin and 16.5%
had haemoglobin in normal range.
40353025201510
50
40
30
20
10
0
Pre pregnancy BMI
fat%
Figure 1: Relationship between pre pregnant BMI of the mothers and body fat
percentage
When we consider the overweight and obese categories low percentage of mothers
(19.8%, 15.1%) had low level of haemoglobin while high percentage (21%, 23%) were
in the normal range. Chi square analysis showed clearly that higher pre pregnancy BMI
is significantly and positively associated (x2= 4.207, p= 0.046) with the haemoglobin
level of the pregnant mothers. High pre pregnancy BMI was related to high
haemoglobin levels. Under weight during pre pregnancy could be a result of under
nutrition, including the fewer intakes of various micronutrients that are essential for
haemato-poiesis. Similar result was reported by Mocking et al. (2018) in Indonesia.
Table 3: Haemoglobin concentration according to pre pregnancy BMI
Haemoglobin Pre pregnancy BMI
Under weight Normal Over weight Obese
Low Frequency 20 36 17 13
Percentage 23.3% 41.9% 19.8% 15.1%
Normal Frequency 48 115 61 67
Percentage 16.5% 39.5% 21.0% 23.0% Low Hb=<11g/dl, normal = ≥ 11g/dl
Further Pearson correlation analysis was performed to assess the relationship between
haemoglobin level and the pre pregnancy BMI among mothers. The results showed
that, haemoglobin had a significant positive correlation (r=0.118*, p= 0.021) with pre
pregnancy BMI among mothers. Likewise Bamaiyi et al., (2013) found that there was a
significant positive correlation between BMI at first trimester and haemoglobin
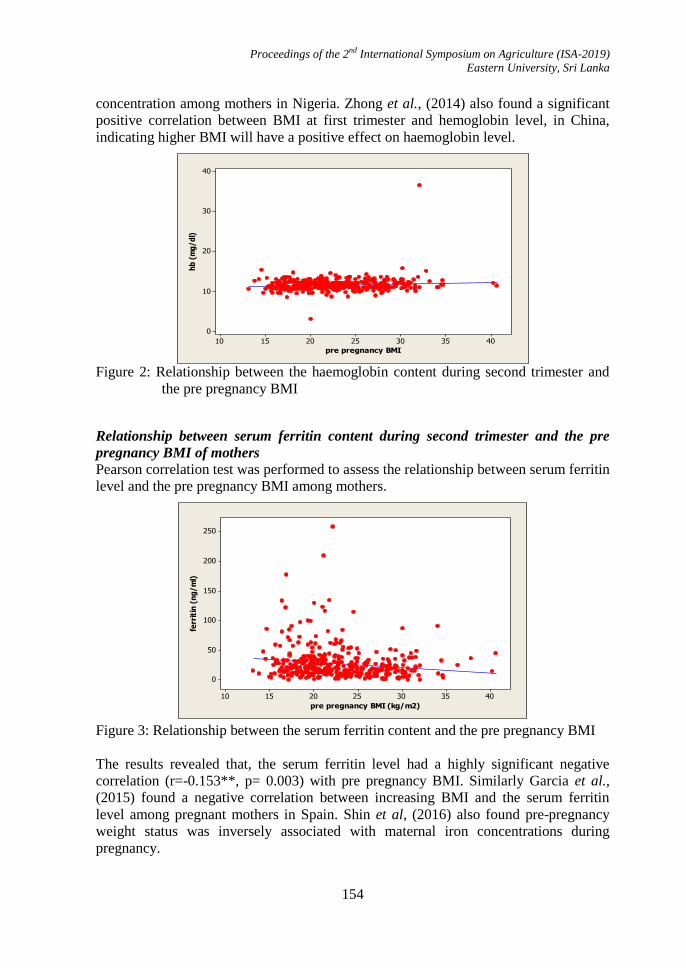
Proceedings of the 2nd International Symposium on Agriculture (ISA-2019)
Eastern University, Sri Lanka
154
concentration among mothers in Nigeria. Zhong et al., (2014) also found a significant
positive correlation between BMI at first trimester and hemoglobin level, in China,
indicating higher BMI will have a positive effect on haemoglobin level.
40353025201510
40
30
20
10
0
pre pregnancy BMI
hb
(m
g/
dl)
Figure 2: Relationship between the haemoglobin content during second trimester and
the pre pregnancy BMI
Relationship between serum ferritin content during second trimester and the pre
pregnancy BMI of mothers Pearson correlation test was performed to assess the relationship between serum ferritin
level and the pre pregnancy BMI among mothers.
40353025201510
250
200
150
100
50
0
pre pregnancy BMI (kg/m2)
ferr
itin
(n
g/
ml)
Figure 3: Relationship between the serum ferritin content and the pre pregnancy BMI
The results revealed that, the serum ferritin level had a highly significant negative
correlation (r=-0.153**, p= 0.003) with pre pregnancy BMI. Similarly Garcia et al.,
(2015) found a negative correlation between increasing BMI and the serum ferritin
level among pregnant mothers in Spain. Shin et al, (2016) also found pre-pregnancy
weight status was inversely associated with maternal iron concentrations during
pregnancy.
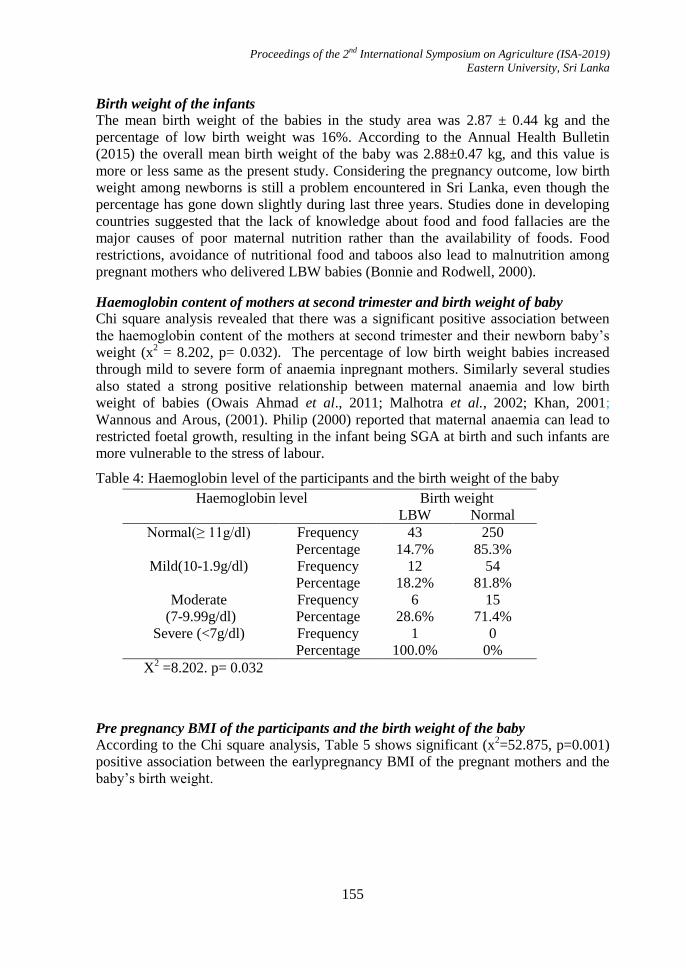
Proceedings of the 2nd International Symposium on Agriculture (ISA-2019)
Eastern University, Sri Lanka
155
Birth weight of the infants
The mean birth weight of the babies in the study area was 2.87 ± 0.44 kg and the
percentage of low birth weight was 16%. According to the Annual Health Bulletin
(2015) the overall mean birth weight of the baby was 2.88±0.47 kg, and this value is
more or less same as the present study. Considering the pregnancy outcome, low birth
weight among newborns is still a problem encountered in Sri Lanka, even though the
percentage has gone down slightly during last three years. Studies done in developing
countries suggested that the lack of knowledge about food and food fallacies are the
major causes of poor maternal nutrition rather than the availability of foods. Food
restrictions, avoidance of nutritional food and taboos also lead to malnutrition among
pregnant mothers who delivered LBW babies (Bonnie and Rodwell, 2000).
Haemoglobin content of mothers at second trimester and birth weight of baby
Chi square analysis revealed that there was a significant positive association between
the haemoglobin content of the mothers at second trimester and their newborn baby‟s
weight (x2 = 8.202, p= 0.032). The percentage of low birth weight babies increased
through mild to severe form of anaemia inpregnant mothers. Similarly several studies
also stated a strong positive relationship between maternal anaemia and low birth
weight of babies (Owais Ahmad et al., 2011; Malhotra et al., 2002; Khan, 2001;
Wannous and Arous, (2001). Philip (2000) reported that maternal anaemia can lead to
restricted foetal growth, resulting in the infant being SGA at birth and such infants are
more vulnerable to the stress of labour.
Table 4: Haemoglobin level of the participants and the birth weight of the baby
Haemoglobin level Birth weight
LBW Normal
Normal(≥ 11g/dl) Frequency 43 250
Percentage 14.7% 85.3%
Mild(10-1.9g/dl) Frequency 12 54
Percentage 18.2% 81.8%
Moderate
(7-9.99g/dl)
Frequency 6 15
Percentage 28.6% 71.4%
Severe (<7g/dl) Frequency 1 0
Percentage 100.0% 0%
X2 =8.202. p= 0.032
Pre pregnancy BMI of the participants and the birth weight of the baby
According to the Chi square analysis, Table 5 shows significant (x2=52.875, p=0.001)
positive association between the earlypregnancy BMI of the pregnant mothers and the
baby‟s birth weight.
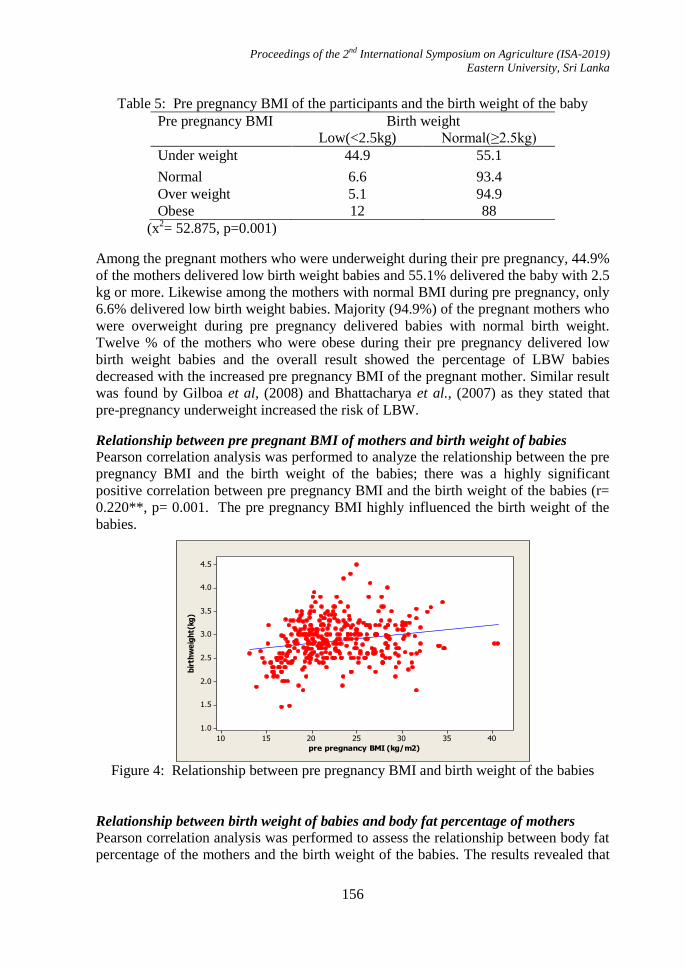
Proceedings of the 2nd International Symposium on Agriculture (ISA-2019)
Eastern University, Sri Lanka
156
Table 5: Pre pregnancy BMI of the participants and the birth weight of the baby
Pre pregnancy BMI Birth weight
Low(<2.5kg) Normal(≥2.5kg)
Under weight 44.9 55.1
Normal 6.6 93.4
Over weight 5.1 94.9
Obese 12 88
(x2= 52.875, p=0.001)
Among the pregnant mothers who were underweight during their pre pregnancy, 44.9%
of the mothers delivered low birth weight babies and 55.1% delivered the baby with 2.5
kg or more. Likewise among the mothers with normal BMI during pre pregnancy, only
6.6% delivered low birth weight babies. Majority (94.9%) of the pregnant mothers who
were overweight during pre pregnancy delivered babies with normal birth weight.
Twelve % of the mothers who were obese during their pre pregnancy delivered low
birth weight babies and the overall result showed the percentage of LBW babies
decreased with the increased pre pregnancy BMI of the pregnant mother. Similar result
was found by Gilboa et al, (2008) and Bhattacharya et al., (2007) as they stated that
pre-pregnancy underweight increased the risk of LBW.
Relationship between pre pregnant BMI of mothers and birth weight of babies
Pearson correlation analysis was performed to analyze the relationship between the pre
pregnancy BMI and the birth weight of the babies; there was a highly significant
positive correlation between pre pregnancy BMI and the birth weight of the babies (r=
0.220**, p= 0.001. The pre pregnancy BMI highly influenced the birth weight of the
babies.
40353025201510
4.5
4.0
3.5
3.0
2.5
2.0
1.5
1.0
pre pregnancy BMI (kg/m2)
bir
thw
eig
ht(
kg
)
Figure 4: Relationship between pre pregnancy BMI and birth weight of the babies
Relationship between birth weight of babies and body fat percentage of mothers
Pearson correlation analysis was performed to assess the relationship between body fat
percentage of the mothers and the birth weight of the babies. The results revealed that
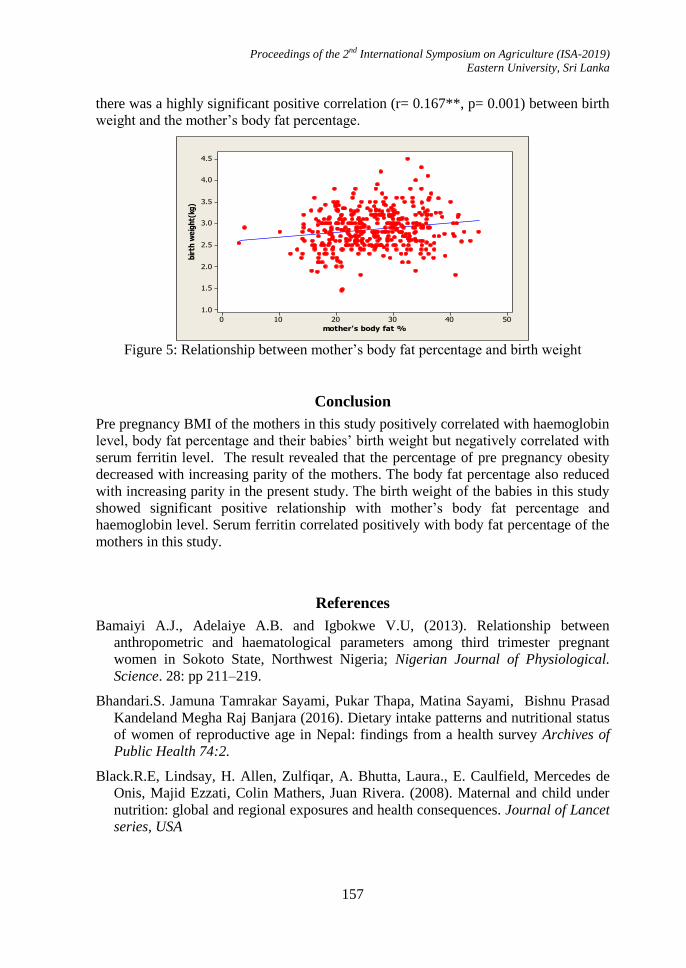
Proceedings of the 2nd International Symposium on Agriculture (ISA-2019)
Eastern University, Sri Lanka
157
there was a highly significant positive correlation (r= 0.167**, p= 0.001) between birth
weight and the mother‟s body fat percentage.
50403020100
4.5
4.0
3.5
3.0
2.5
2.0
1.5
1.0
mother's body fat %
bir
th w
eig
ht(
kg)
Figure 5: Relationship between mother‟s body fat percentage and birth weight
Conclusion
Pre pregnancy BMI of the mothers in this study positively correlated with haemoglobin
level, body fat percentage and their babies‟ birth weight but negatively correlated with
serum ferritin level. The result revealed that the percentage of pre pregnancy obesity
decreased with increasing parity of the mothers. The body fat percentage also reduced
with increasing parity in the present study. The birth weight of the babies in this study
showed significant positive relationship with mother‟s body fat percentage and
haemoglobin level. Serum ferritin correlated positively with body fat percentage of the
mothers in this study.
References
Bamaiyi A.J., Adelaiye A.B. and Igbokwe V.U, (2013). Relationship between
anthropometric and haematological parameters among third trimester pregnant
women in Sokoto State, Northwest Nigeria; Nigerian Journal of Physiological.
Science. 28: pp 211–219.
Bhandari.S. Jamuna Tamrakar Sayami, Pukar Thapa, Matina Sayami, Bishnu Prasad
Kandeland Megha Raj Banjara (2016). Dietary intake patterns and nutritional status
of women of reproductive age in Nepal: findings from a health survey Archives of
Public Health 74:2.
Black.R.E, Lindsay, H. Allen, Zulfiqar, A. Bhutta, Laura., E. Caulfield, Mercedes de
Onis, Majid Ezzati, Colin Mathers, Juan Rivera. (2008). Maternal and child under
nutrition: global and regional exposures and health consequences. Journal of Lancet
series, USA
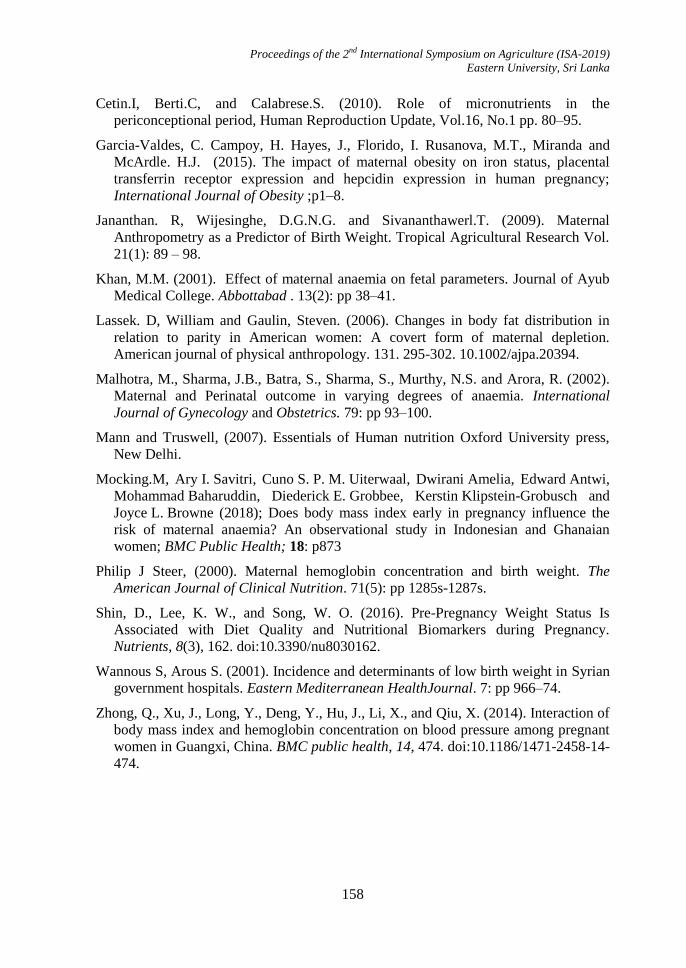
Proceedings of the 2nd International Symposium on Agriculture (ISA-2019)
Eastern University, Sri Lanka
158
Cetin.I, Berti.C, and Calabrese.S. (2010). Role of micronutrients in the
periconceptional period, Human Reproduction Update, Vol.16, No.1 pp. 80–95.
Garcia-Valdes, C. Campoy, H. Hayes, J., Florido, I. Rusanova, M.T., Miranda and
McArdle. H.J. (2015). The impact of maternal obesity on iron status, placental
transferrin receptor expression and hepcidin expression in human pregnancy;
International Journal of Obesity ;p1–8.
Jananthan. R, Wijesinghe, D.G.N.G. and Sivananthawerl.T. (2009). Maternal
Anthropometry as a Predictor of Birth Weight. Tropical Agricultural Research Vol.
21(1): 89 – 98.
Khan, M.M. (2001). Effect of maternal anaemia on fetal parameters. Journal of Ayub
Medical College. Abbottabad . 13(2): pp 38–41.
Lassek. D, William and Gaulin, Steven. (2006). Changes in body fat distribution in
relation to parity in American women: A covert form of maternal depletion.
American journal of physical anthropology. 131. 295-302. 10.1002/ajpa.20394.
Malhotra, M., Sharma, J.B., Batra, S., Sharma, S., Murthy, N.S. and Arora, R. (2002).
Maternal and Perinatal outcome in varying degrees of anaemia. International
Journal of Gynecology and Obstetrics. 79: pp 93–100.
Mann and Truswell, (2007). Essentials of Human nutrition Oxford University press,
New Delhi.
Mocking.M, Ary I. Savitri, Cuno S. P. M. Uiterwaal, Dwirani Amelia, Edward Antwi,
Mohammad Baharuddin, Diederick E. Grobbee, Kerstin Klipstein-Grobusch and
Joyce L. Browne (2018); Does body mass index early in pregnancy influence the
risk of maternal anaemia? An observational study in Indonesian and Ghanaian
women; BMC Public Health; 18: p873
Philip J Steer, (2000). Maternal hemoglobin concentration and birth weight. The
American Journal of Clinical Nutrition. 71(5): pp 1285s-1287s.
Shin, D., Lee, K. W., and Song, W. O. (2016). Pre-Pregnancy Weight Status Is
Associated with Diet Quality and Nutritional Biomarkers during Pregnancy.
Nutrients, 8(3), 162. doi:10.3390/nu8030162.
Wannous S, Arous S. (2001). Incidence and determinants of low birth weight in Syrian
government hospitals. Eastern Mediterranean HealthJournal. 7: pp 966–74.
Zhong, Q., Xu, J., Long, Y., Deng, Y., Hu, J., Li, X., and Qiu, X. (2014). Interaction of
body mass index and hemoglobin concentration on blood pressure among pregnant
women in Guangxi, China. BMC public health, 14, 474. doi:10.1186/1471-2458-14-
474.

Proceedings of the 2nd International Symposium on Agriculture (ISA-2019)
Eastern University, Sri Lanka
159
STUDY ON NURSERY MANAGEMENT TECHNIQUES FOR CHILLI
(Capsicum annum L)
H.M.P.T.K. Hettigedara*, M.A.P.W.K. Malaviarachchi, R.L. Senanayake and G.H.K.
De Silva
Agronomy Division, Field Crops Research and Development Institute, Mahailuppallama
*Corresponding author: [email protected]
Abstract
A field experiment was carried out at the Field Crops Research and Development
Institute, Mahailluppallama (DL1b agro-ecological region) of Sri Lanka during Maha
2014/2015, Yala 2015 and Maha 2017/2018 seasons. The objective of the study was to
identify a proper nursery technique to reduce the transplanting shock, to find out the
most suitable age of transplanting and to increase the productivity by reducing the
transplanting shock. The experiment was conducted both in the nursery with the
objective of investigating the effect of three nursery techniques and in the field to
investigate the effect of three nursery techniques and three times of transplanting on
performance of chilli, respectively. As nursery techniques, normal ground nursery,
parachute nursery trays, black colour plastic nursery trays and as times of transplanting,
25, 30 and 35 days old seedlings were tested. The chilli (Capsicum annum L) variety
MICH3 was used as the test crop. Germination percentage, number of leaves at
transplanting and seedling height at transplanting was highest in seedlings from the
ground nursery. Field establishment percentage was lower in ground nurseries in one
season while same in other two seasons. Dry chilli yield was not affected by the
applied nursery techniques or age at transplanting. Production of chilli seedlings is
better from well managed ground nurseries.
Keywords: Chilli, Nursery techniques, Nursery trays, Seedlings, Transplanting.
Introduction
Chilli (Capsicum annum L) is one of the important cash crops grown in Sri Lanka.
Though the potential yield of green chilli is approximately 15 t/ha, the national average
yield is only 4.74 t/ha in 2016 (DOA, 2017). Proper agronomic management practices
are essential to bridge the yield gap. Chilli seeds are small and have limited food
reserves. Therefore the seedlings are raised in nurseries during the early growth stages
with care before transplant in the field. Nursery is the most important stage of the crop
to develop a healthy and vigorous seedling that is better adapted to the harsh conditions
in the field. Various nursery techniques are available for chilli mentioning ground
nurseries to develop normal seedlings and nursery trays to develop plug tray seedlings.
Besides normal ground nursery seedlings, plug tray seedlings have several advantages.
They have little or no transplant shock leading to higher survival rate, transplanting can
be done at later stages, handling is easier and can be mechanized (Jeong, 1999).
Proceedings of the 2nd International Symposium on Agriculture (ISA-2019)
Eastern University, Sri Lanka
160
Vacant spaces in the field lead to low productivity. Pest and diseases, death of plants
due to transplanting shock and inability of plants to withstand unfavorable weather
conditions are some of the reasons for having vacancies in the field. Although the
seedlings are uprooted carefully from moistened soil for transplanting some of the roots
may be damaged. It leads to a transplanting shock and death of plants. Although the
vacancies are filled by transplanting again, some vacancies remain in the field. The
roots are not damaged by removing plug tray seedlings from the nursery tray.
Therefore the transplanting shock can be minimized. There are several nursery trays
available in the market. The parachute tray is (434 holes) used for paddy nurseries.
Medium size black colour plastic tray is available (128 holes) with the dimensions of
4.5 cm height and 3 cm diameter. Planting 35 days old seedlings in the field is the
general recommendation (Kannangara and Karunathilake, 2013). If the roots are not
damaged during transplanting, earlier transplanting may be possible. Therefore, the
objective of the study was to identify a proper nursery technique to reduce the
transplanting shock, to find out the most suitable age of transplanting and to increase
the productivity by reducing the transplanting shock.
Materials and Methods
The experiment was conducted in Maha 2014/2015,Yala 2015 and Maha 2017/2018
seasons at the research fields of the Field Crops Research and Development Institute,
Mahailuppallama (8006‟ 42.73” N and 80
028‟ 03.27” E, Elevation 117 m above mean
sea level), located in the North Central province (DL1b agro-ecological region) of Sri
Lanka (Punyawardana, 2008). The soil type of the tested location is classified as
Reddish Brown Earths (local) or Typic Rhodustalfs (USDA soil Taxonomy) or Rhodic
Otherieutic Cutanic Luvisols (FAO classification) (Mapa et al., 2010).
The experiment was conducted in the nursery with the objective of investigating the
effect of three nursery techniques and in the field to investigate the effect of three
nursery techniques and three times of transplanting on performance of chilli. As
nursery techniques, normal ground nursery, parachute nursery trays, and black colour
plastic nursery trays and as times of transplanting, 25, 30 and 35 days old seedlings
were tested. The chilli (Capsicum annum L) variety MICH3 was used as the test crop.
Seeds were sown according to the treatment structure keeping five days gap in
respective nursery techniques to synchronize the date of transplanting. Top soil 1:
compost 1 was taken as the nursery media. It was sterilized by burning. The nursery
trays were filled with media and seeds were sown in the rate of one seed per hole in
parachute trays and two seeds per hole in black colour plastic nursery trays. Normal
ground nursery was prepared and sterilized by burning before seeding. Row seeding
was done. All the nurseries were mulched using paddy straw and treated with a
fungicide solution. Straw mulch was removed at the time of germination and nursery
was maintained as recommended by the Department of Agriculture. Land preparation,
fertilizer application, and organic matter applications were done as recommended by
the Department of Agriculture. Plots were 14.6 m2
in size. Seedlings were planted in
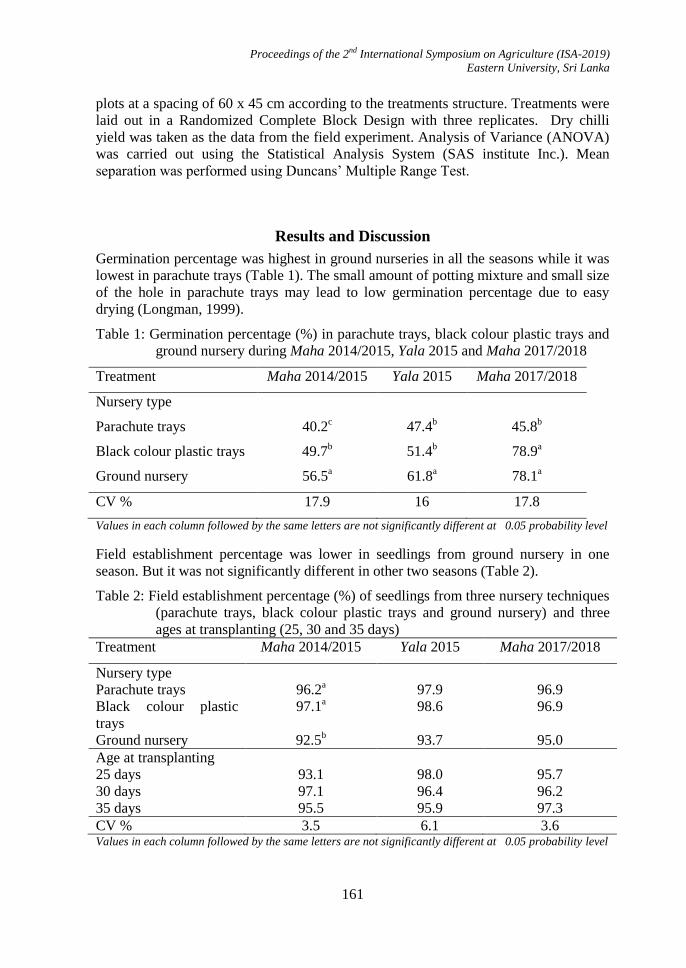
Proceedings of the 2nd International Symposium on Agriculture (ISA-2019)
Eastern University, Sri Lanka
161
plots at a spacing of 60 x 45 cm according to the treatments structure. Treatments were
laid out in a Randomized Complete Block Design with three replicates. Dry chilli
yield was taken as the data from the field experiment. Analysis of Variance (ANOVA)
was carried out using the Statistical Analysis System (SAS institute Inc.). Mean
separation was performed using Duncans‟ Multiple Range Test.
Results and Discussion
Germination percentage was highest in ground nurseries in all the seasons while it was
lowest in parachute trays (Table 1). The small amount of potting mixture and small size
of the hole in parachute trays may lead to low germination percentage due to easy
drying (Longman, 1999).
Table 1: Germination percentage (%) in parachute trays, black colour plastic trays and
ground nursery during Maha 2014/2015, Yala 2015 and Maha 2017/2018
Treatment Maha 2014/2015 Yala 2015 Maha 2017/2018
Nursery type
Parachute trays 40.2c 47.4
b 45.8
b
Black colour plastic trays 49.7b 51.4
b 78.9
a
Ground nursery 56.5a 61.8
a 78.1
a
CV % 17.9 16 17.8
Values in each column followed by the same letters are not significantly different at 0.05 probability level
Field establishment percentage was lower in seedlings from ground nursery in one
season. But it was not significantly different in other two seasons (Table 2).
Table 2: Field establishment percentage (%) of seedlings from three nursery techniques
(parachute trays, black colour plastic trays and ground nursery) and three
ages at transplanting (25, 30 and 35 days)
Treatment Maha 2014/2015 Yala 2015 Maha 2017/2018
Nursery type
Parachute trays 96.2a 97.9 96.9
Black colour plastic
trays
97.1a 98.6 96.9
Ground nursery 92.5b 93.7 95.0
Age at transplanting
25 days 93.1 98.0 95.7
30 days 97.1 96.4 96.2
35 days 95.5 95.9 97.3
CV % 3.5 6.1 3.6 Values in each column followed by the same letters are not significantly different at 0.05 probability level
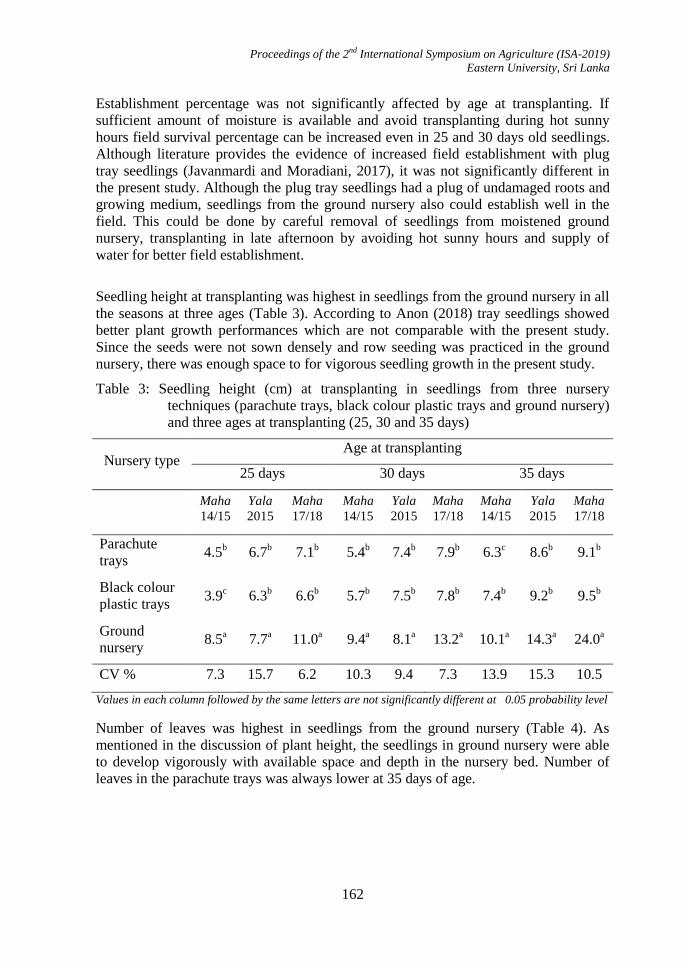
Proceedings of the 2nd International Symposium on Agriculture (ISA-2019)
Eastern University, Sri Lanka
162
Establishment percentage was not significantly affected by age at transplanting. If
sufficient amount of moisture is available and avoid transplanting during hot sunny
hours field survival percentage can be increased even in 25 and 30 days old seedlings.
Although literature provides the evidence of increased field establishment with plug
tray seedlings (Javanmardi and Moradiani, 2017), it was not significantly different in
the present study. Although the plug tray seedlings had a plug of undamaged roots and
growing medium, seedlings from the ground nursery also could establish well in the
field. This could be done by careful removal of seedlings from moistened ground
nursery, transplanting in late afternoon by avoiding hot sunny hours and supply of
water for better field establishment.
Seedling height at transplanting was highest in seedlings from the ground nursery in all
the seasons at three ages (Table 3). According to Anon (2018) tray seedlings showed
better plant growth performances which are not comparable with the present study.
Since the seeds were not sown densely and row seeding was practiced in the ground
nursery, there was enough space to for vigorous seedling growth in the present study.
Table 3: Seedling height (cm) at transplanting in seedlings from three nursery
techniques (parachute trays, black colour plastic trays and ground nursery)
and three ages at transplanting (25, 30 and 35 days)
Nursery type Age at transplanting
25 days 30 days 35 days
Maha
14/15
Yala
2015
Maha
17/18
Maha
14/15
Yala
2015
Maha
17/18
Maha
14/15
Yala
2015
Maha
17/18
Parachute
trays 4.5
b 6.7
b 7.1
b 5.4
b 7.4
b 7.9
b 6.3
c 8.6
b 9.1
b
Black colour
plastic trays 3.9
c 6.3
b 6.6
b 5.7
b 7.5
b 7.8
b 7.4
b 9.2
b 9.5
b
Ground
nursery 8.5
a 7.7
a 11.0
a 9.4
a 8.1
a 13.2
a 10.1
a 14.3
a 24.0
a
CV % 7.3 15.7 6.2 10.3 9.4 7.3 13.9 15.3 10.5
Values in each column followed by the same letters are not significantly different at 0.05 probability level
Number of leaves was highest in seedlings from the ground nursery (Table 4). As
mentioned in the discussion of plant height, the seedlings in ground nursery were able
to develop vigorously with available space and depth in the nursery bed. Number of
leaves in the parachute trays was always lower at 35 days of age.
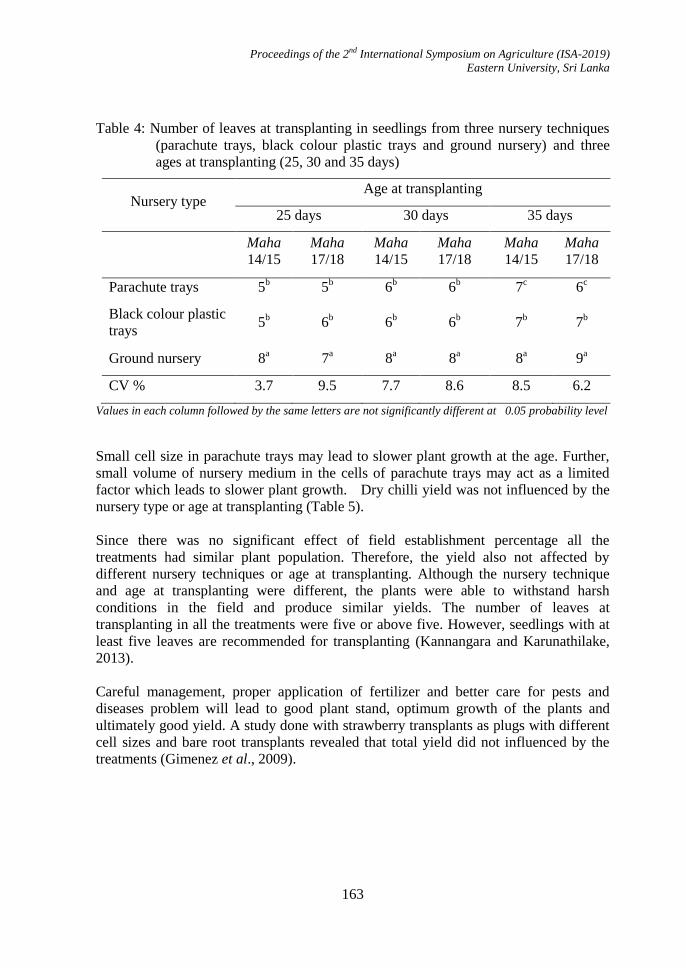
Proceedings of the 2nd International Symposium on Agriculture (ISA-2019)
Eastern University, Sri Lanka
163
Table 4: Number of leaves at transplanting in seedlings from three nursery techniques
(parachute trays, black colour plastic trays and ground nursery) and three
ages at transplanting (25, 30 and 35 days)
Nursery type Age at transplanting
25 days 30 days 35 days
Maha
14/15
Maha
17/18
Maha
14/15
Maha
17/18
Maha
14/15
Maha
17/18
Parachute trays 5b 5
b 6
b 6
b 7
c 6
c
Black colour plastic
trays 5
b 6
b 6
b 6
b 7
b 7
b
Ground nursery 8a 7
a 8
a 8
a 8
a 9
a
CV % 3.7 9.5 7.7 8.6 8.5 6.2
Values in each column followed by the same letters are not significantly different at 0.05 probability level
Small cell size in parachute trays may lead to slower plant growth at the age. Further,
small volume of nursery medium in the cells of parachute trays may act as a limited
factor which leads to slower plant growth. Dry chilli yield was not influenced by the
nursery type or age at transplanting (Table 5).
Since there was no significant effect of field establishment percentage all the
treatments had similar plant population. Therefore, the yield also not affected by
different nursery techniques or age at transplanting. Although the nursery technique
and age at transplanting were different, the plants were able to withstand harsh
conditions in the field and produce similar yields. The number of leaves at
transplanting in all the treatments were five or above five. However, seedlings with at
least five leaves are recommended for transplanting (Kannangara and Karunathilake,
2013).
Careful management, proper application of fertilizer and better care for pests and
diseases problem will lead to good plant stand, optimum growth of the plants and
ultimately good yield. A study done with strawberry transplants as plugs with different
cell sizes and bare root transplants revealed that total yield did not influenced by the
treatments (Gimenez et al., 2009).
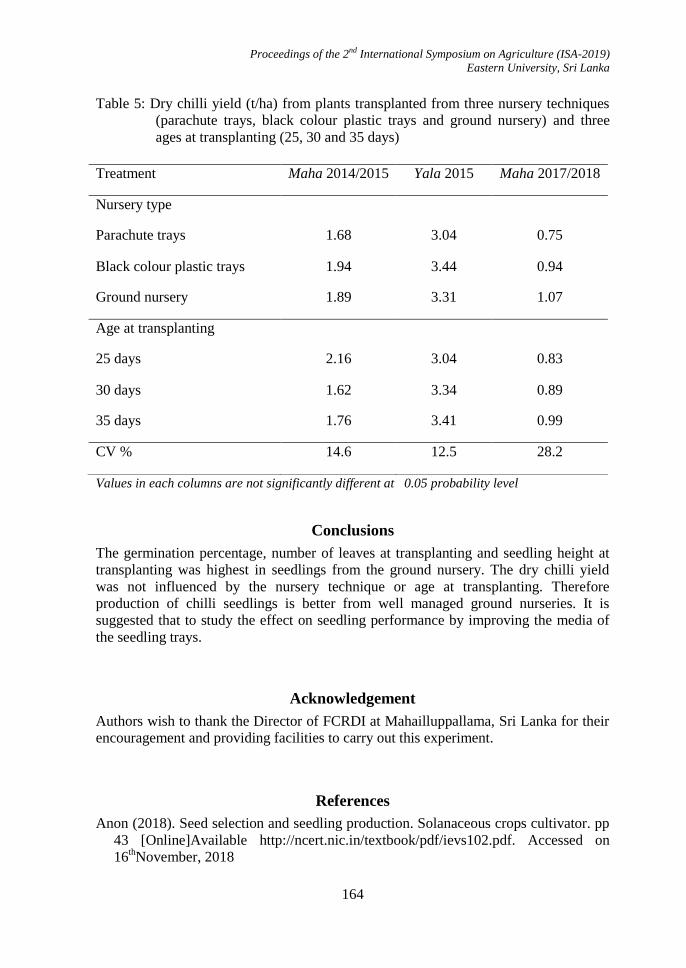
Proceedings of the 2nd International Symposium on Agriculture (ISA-2019)
Eastern University, Sri Lanka
164
Table 5: Dry chilli yield (t/ha) from plants transplanted from three nursery techniques
(parachute trays, black colour plastic trays and ground nursery) and three
ages at transplanting (25, 30 and 35 days)
Values in each columns are not significantly different at 0.05 probability level
Conclusions
The germination percentage, number of leaves at transplanting and seedling height at
transplanting was highest in seedlings from the ground nursery. The dry chilli yield
was not influenced by the nursery technique or age at transplanting. Therefore
production of chilli seedlings is better from well managed ground nurseries. It is
suggested that to study the effect on seedling performance by improving the media of
the seedling trays.
Acknowledgement
Authors wish to thank the Director of FCRDI at Mahailluppallama, Sri Lanka for their
encouragement and providing facilities to carry out this experiment.
References
Anon (2018). Seed selection and seedling production. Solanaceous crops cultivator. pp
43 [Online]Available http://ncert.nic.in/textbook/pdf/ievs102.pdf. Accessed on
16thNovember, 2018
Treatment Maha 2014/2015 Yala 2015 Maha 2017/2018
Nursery type
Parachute trays 1.68 3.04 0.75
Black colour plastic trays 1.94 3.44 0.94
Ground nursery 1.89 3.31 1.07
Age at transplanting
25 days 2.16 3.04 0.83
30 days 1.62 3.34 0.89
35 days 1.76 3.41 0.99
CV % 14.6 12.5 28.2

Proceedings of the 2nd International Symposium on Agriculture (ISA-2019)
Eastern University, Sri Lanka
165
Department of Agriculture (2017). Pocket book of Agricultural statistics. Vol XIV.
Department of Agriculture, Peradeniya, Sri Lanka: 16.
Gimenez, g., Andriolo, J.L., Janisch, D., Cocco, C. and Picio, M.D. (2009). Cell size in
trays for the production of strawberry plug transplants. Pesquisa Agropecuaria bras.
Brasileira. V 44. N. 7. P 726-729.
Javanmardi, J. and Moradiani, M. (2017) Tomato transplant production method affects
plant development and field performance. International Journal of Vegetable
Science, 23, 31-41.
Jeong, B.R. (1999). The Use of Plug Transplants in Korea. Division of Plant Resources
and the Environment. College of Agriculture. Gyeongsang National University.
Chinju, Korea 660-701. [Online] Available: http://www.fftc.agnet.org /library.
php?func=view&id=20110809104917.Accessed on 16thNovember, 2018.
Kannangara. K.N and Karunathilake, K.E. (2013). Chilli cultivation (Sinhala).
Department of Agriculture. Peradeniya.
Longman, A. (1999). Raising seedlings of tropical trees. Tropical trees. Propagation
and the planting manuals. Vol.2 [Online]Available at :http:// www.fao.org
/docrep/006/ad230e/AD230E05.htm.Accessed on 21st November, 2018
Mapa, R.B., Somasiri, S. and Dassanayake, A.R. (2010). Soils of the Dry Zone of Sri
Lanka Special publication no.7. Soil Science Society of Sri Lanka. pp. 95
Punyawardana, B.V.R. (2008). Precipitation and Agro-ecological regions of Sri Lanka
(Sinhala)Department of Agriculture, Peradeniya, Sri Lanka. Pp 49-51.

Proceedings of the 2nd International Symposium on Agriculture (ISA-2019)
Eastern University, Sri Lanka
166
MARKETABLE POD YIELD OF OKRA (Abelmoschus esculentus) CV.
HARITHA AS AFFECTED BY THE FOLIAR APPLICATION OF
MORINGA (Moringa oleifera) LEAF EXTRACT
K. D. Harris and A. M. K. D. M. Attanayaka*
Department of Crop Science, Faculty of Agriculture, Eastern University, Chenkalady, Sri Lanka.
*Corresponding author: [email protected]
Abstract
The modern intensification of agricultural practices has an impact on degradation of
soil fertility, balance of the eco-system and eventually on crop yields. In fact, usage of
organic and low-cost technologies to enhance the crop yield is most favorable to
environment as well as human. In this regard, a field experiment was conducted at the
Crop Farm, Eastern University, Sri Lanka to find out the effects of Moringa Leaf
Extract (MLE) as foliar application on marketable pod yield of okra cv. Haritha. The
experiment was laid out in a Randomized Complete Block Design (RCBD) with three
replicates. The treatments were; T0 - control (Distilled water),T1 - 10% MLE at once a
week interval, T2 - 10% MLE at once in two weeks interval, T3 - 20% MLE at once a
week interval, T4 - 20% MLE at once in two weeks interval, T5 - 30% MLE at once a
week interval and T6 - 30% MLE at once in two weeks interval. Foliar application of
MLE was started at two weeks after germination to pod formation and each plant was
sprayed with 25 ml of MLE. All agronomic practices were carried out in accordance
with the department of agriculture recommendation. Foliar application of MLE with
10% concentration at one week interval had significant (p<0.05) effects on tested
parameters compared to control. Foliar application of MLE with 10% concentration at
one week interval increased the length of pod, girth of pod, number of seeds/pod,
number of pods/plant and fresh weight of pods/plant. Therefore, it is concluded that the
foliar application of MLE at 10% concentration level at one week interval can be used
to enhance the marketable pod yield of okra cv. Haritha.
Keywords: Foliar application, Moringa Leaf Extract (MLE), Okra, Organic, Yield.
Introduction
Tropical soils are mostly affected by erosion, result in depletion of the soil nutrients
and population of soil organism. Hence, preserving the soil nutrient is one of the major
problems in tropical agriculture. However, due to the above reasons, the crop yield
reduces gradually while challenging the fulfillment of the demand of the growing
population. Inorganic fertilizers can be applied to improve yield, but they are
deleterious to the environment and human health and increase the cost of production.
Therefore, there is a need to find out a mechanism that provides high yield by low cost.
Recently, there has been a growing trend of applying Moringa (Moringa oleifera) Leaf
Extract (MLE) as a foliar application which is one of the cheap and environmentally
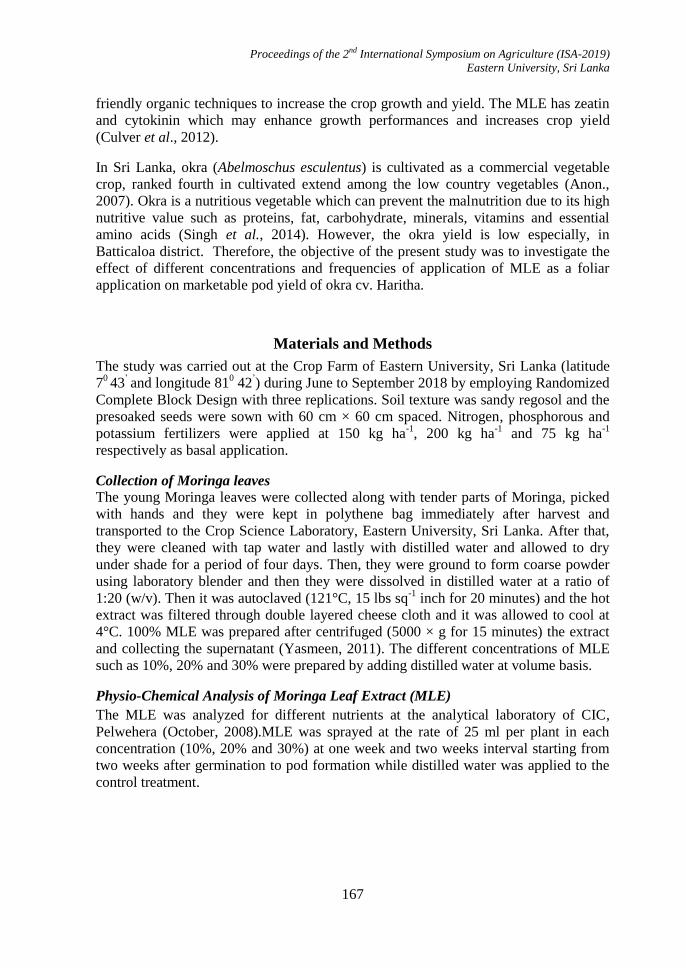
Proceedings of the 2nd International Symposium on Agriculture (ISA-2019)
Eastern University, Sri Lanka
167
friendly organic techniques to increase the crop growth and yield. The MLE has zeatin
and cytokinin which may enhance growth performances and increases crop yield
(Culver et al., 2012).
In Sri Lanka, okra (Abelmoschus esculentus) is cultivated as a commercial vegetable
crop, ranked fourth in cultivated extend among the low country vegetables (Anon.,
2007). Okra is a nutritious vegetable which can prevent the malnutrition due to its high
nutritive value such as proteins, fat, carbohydrate, minerals, vitamins and essential
amino acids (Singh et al., 2014). However, the okra yield is low especially, in
Batticaloa district. Therefore, the objective of the present study was to investigate the
effect of different concentrations and frequencies of application of MLE as a foliar
application on marketable pod yield of okra cv. Haritha.
Materials and Methods
The study was carried out at the Crop Farm of Eastern University, Sri Lanka (latitude
70 43
‟ and longitude 81
0 42
‟) during June to September 2018 by employing Randomized
Complete Block Design with three replications. Soil texture was sandy regosol and the
presoaked seeds were sown with 60 cm × 60 cm spaced. Nitrogen, phosphorous and
potassium fertilizers were applied at 150 kg ha-1
, 200 kg ha-1
and 75 kg ha-1
respectively as basal application.
Collection of Moringa leaves
The young Moringa leaves were collected along with tender parts of Moringa, picked
with hands and they were kept in polythene bag immediately after harvest and
transported to the Crop Science Laboratory, Eastern University, Sri Lanka. After that,
they were cleaned with tap water and lastly with distilled water and allowed to dry
under shade for a period of four days. Then, they were ground to form coarse powder
using laboratory blender and then they were dissolved in distilled water at a ratio of
1:20 (w/v). Then it was autoclaved (121°C, 15 lbs sq-1
inch for 20 minutes) and the hot
extract was filtered through double layered cheese cloth and it was allowed to cool at
4°C. 100% MLE was prepared after centrifuged (5000 × g for 15 minutes) the extract
and collecting the supernatant (Yasmeen, 2011). The different concentrations of MLE
such as 10%, 20% and 30% were prepared by adding distilled water at volume basis.
Physio-Chemical Analysis of Moringa Leaf Extract (MLE)
The MLE was analyzed for different nutrients at the analytical laboratory of CIC,
Pelwehera (October, 2008).MLE was sprayed at the rate of 25 ml per plant in each
concentration (10%, 20% and 30%) at one week and two weeks interval starting from
two weeks after germination to pod formation while distilled water was applied to the
control treatment.
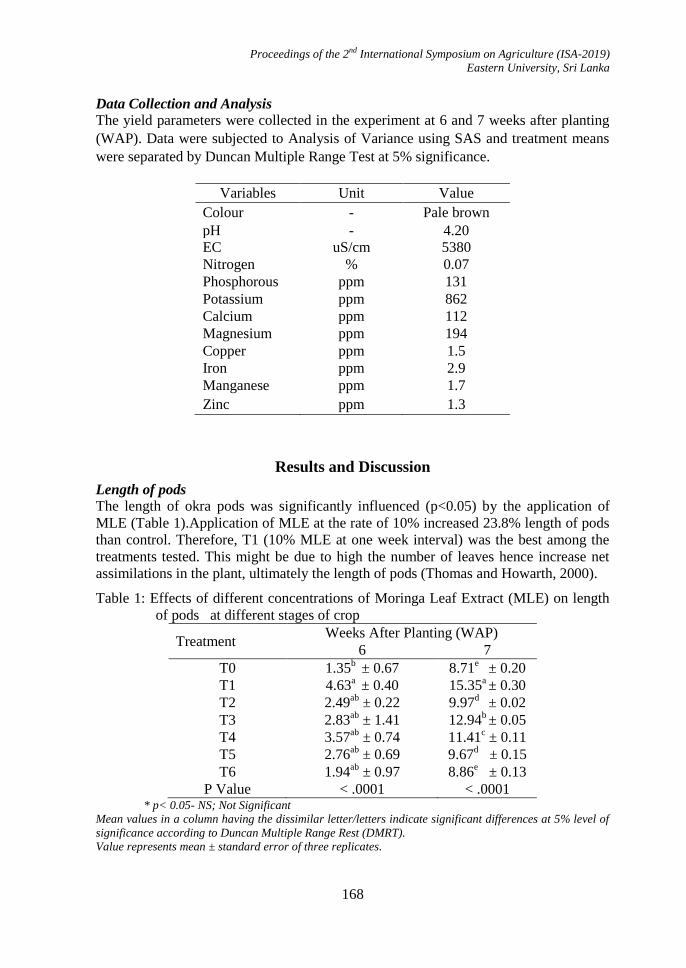
Proceedings of the 2nd International Symposium on Agriculture (ISA-2019)
Eastern University, Sri Lanka
168
Data Collection and Analysis
The yield parameters were collected in the experiment at 6 and 7 weeks after planting
(WAP). Data were subjected to Analysis of Variance using SAS and treatment means
were separated by Duncan Multiple Range Test at 5% significance.
Variables Unit Value
Colour - Pale brown
pH - 4.20
EC uS/cm 5380
Nitrogen % 0.07
Phosphorous ppm 131
Potassium ppm 862
Calcium ppm 112
Magnesium ppm 194
Copper ppm 1.5
Iron ppm 2.9
Manganese ppm 1.7
Zinc ppm 1.3
Results and Discussion
Length of pods
The length of okra pods was significantly influenced (p<0.05) by the application of
MLE (Table 1).Application of MLE at the rate of 10% increased 23.8% length of pods
than control. Therefore, T1 (10% MLE at one week interval) was the best among the
treatments tested. This might be due to high the number of leaves hence increase net
assimilations in the plant, ultimately the length of pods (Thomas and Howarth, 2000).
Table 1: Effects of different concentrations of Moringa Leaf Extract (MLE) on length
of pods at different stages of crop
Treatment Weeks After Planting (WAP)
6 7
T0 1.35b ± 0.67 8.71
e ± 0.20
T1 4.63a ± 0.40 15.35
a ± 0.30
T2 2.49ab
± 0.22 9.97d
± 0.02
T3 2.83ab
± 1.41 12.94b ± 0.05
T4 3.57ab
± 0.74 11.41c ± 0.11
T5 2.76ab
± 0.69 9.67d ± 0.15
T6 1.94ab
± 0.97 8.86e ± 0.13
P Value < .0001 < .0001 * p< 0.05- NS; Not Significant
Mean values in a column having the dissimilar letter/letters indicate significant differences at 5% level of
significance according to Duncan Multiple Range Rest (DMRT).
Value represents mean ± standard error of three replicates.
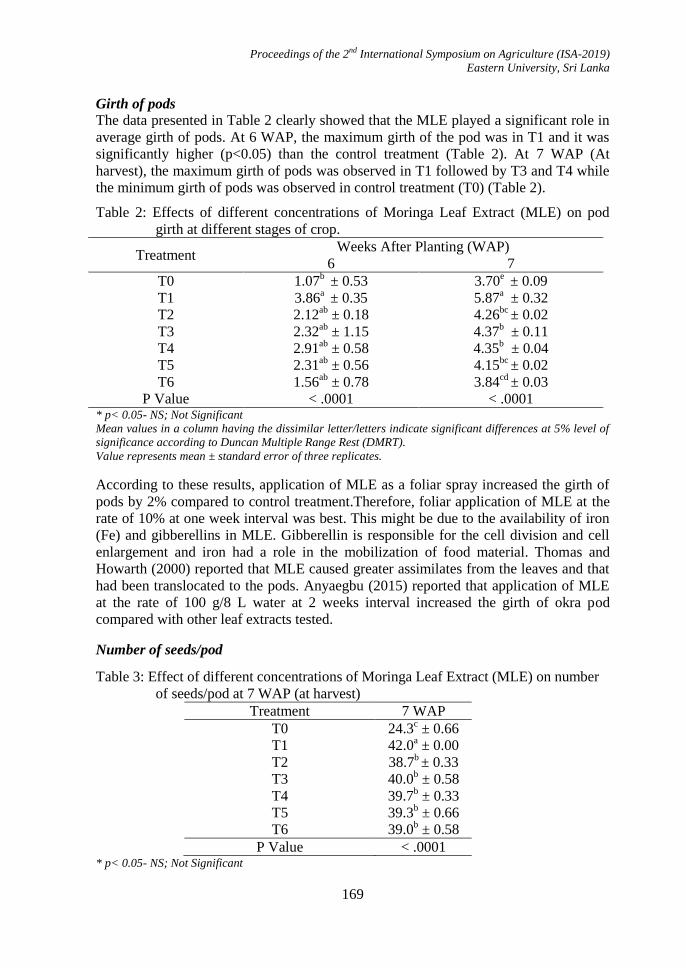
Proceedings of the 2nd International Symposium on Agriculture (ISA-2019)
Eastern University, Sri Lanka
169
Girth of pods
The data presented in Table 2 clearly showed that the MLE played a significant role in
average girth of pods. At 6 WAP, the maximum girth of the pod was in T1 and it was
significantly higher (p<0.05) than the control treatment (Table 2). At 7 WAP (At
harvest), the maximum girth of pods was observed in T1 followed by T3 and T4 while
the minimum girth of pods was observed in control treatment (T0) (Table 2).
Table 2: Effects of different concentrations of Moringa Leaf Extract (MLE) on pod
girth at different stages of crop.
Treatment Weeks After Planting (WAP)
6 7
T0 1.07b ± 0.53 3.70
e ± 0.09
T1 3.86a ± 0.35 5.87
a ± 0.32
T2 2.12ab
± 0.18 4.26bc
± 0.02
T3 2.32ab
± 1.15 4.37b
± 0.11
T4 2.91ab
± 0.58 4.35b ± 0.04
T5 2.31ab
± 0.56 4.15bc
± 0.02
T6 1.56ab
± 0.78 3.84cd
± 0.03
P Value < .0001 < .0001 * p< 0.05- NS; Not Significant
Mean values in a column having the dissimilar letter/letters indicate significant differences at 5% level of
significance according to Duncan Multiple Range Rest (DMRT).
Value represents mean ± standard error of three replicates.
According to these results, application of MLE as a foliar spray increased the girth of
pods by 2% compared to control treatment.Therefore, foliar application of MLE at the
rate of 10% at one week interval was best. This might be due to the availability of iron
(Fe) and gibberellins in MLE. Gibberellin is responsible for the cell division and cell
enlargement and iron had a role in the mobilization of food material. Thomas and
Howarth (2000) reported that MLE caused greater assimilates from the leaves and that
had been translocated to the pods. Anyaegbu (2015) reported that application of MLE
at the rate of 100 g/8 L water at 2 weeks interval increased the girth of okra pod
compared with other leaf extracts tested.
Number of seeds/pod
Table 3: Effect of different concentrations of Moringa Leaf Extract (MLE) on number
of seeds/pod at 7 WAP (at harvest)
Treatment 7 WAP
T0 24.3c ± 0.66
T1 42.0a ± 0.00
T2 38.7b ± 0.33
T3 40.0b ± 0.58
T4 39.7b ± 0.33
T5 39.3b ± 0.66
T6 39.0b ± 0.58
P Value < .0001 * p< 0.05- NS; Not Significant

Proceedings of the 2nd International Symposium on Agriculture (ISA-2019)
Eastern University, Sri Lanka
170
The number of okra seeds was significantly influenced (p<0.05) with the application of
MLE. At 7 WAP (At harvest), the highest number of seeds was observed in T1 while
the lowest number of seeds was observed in the control treatment (Table 3).
The treatment T2 was on par with T3, T4, T5 and T6 (Table 3). Therefore, application
of MLE significantly influenced (p<0.05) the number of seeds/pod (by 1.7%). This
result is in agreement with Phiri (2010) who reported that more grain formation due to
growth hormones and micronutrients present in MLE. Afzal et al. (2015) reported that
the number of grains per spike of wheat was increased with 2% MLE. However, in this
study, the concentration was five (5) times greater than Afzal et al. (2015).
Hundred (100) Seed weight
Effect of different concentrations of MLE on 100- seed weight is given in Table 04.
There was no significant difference among the treatments tested. Foliar application of
MLE not significantly (p<0.005) affect the 100 seed weight of okra. In contrast, Zaky
and Rady (2015) reported that the application of MLE (1:30) at 25 and 40 days after
sowing as both seed soaking and foliar application, increased the seed weight/plant of
common bean compared to control treatment. Similar results have been reported.
Table 4: Effects of different concentrations of Moringa Leaf Extract (MLE) on 100
seed weight of okra
Treatment 100 seed weight (g)
T0 6.55 ± 0.26
T1 6.28± 0.08
T2 5.58± 1.12
T3 5.71 ± 0.31
T4 5.35 ± 0.61
T5 5.63 ± 0.36
T6 5.66 ± 0.20
P Value NS * p< 0.05- NS; Not Significant
Mean values in a column having the dissimilar letter/letters indicate significant differences at 5% level of
significance according to Duncan Multiple Range Rest (DMRT).
Value represents mean ± standard error of three replicates. NS means no significant difference.
Number of pods
Exogenous application of MLE significantly influenced (p<0.05) the number of
pods/plant. Although, at 4 WAP, no significant difference was observed among the
treatments tested (Table 5). At 7 WAP, the maximum number of pods/plant was
observed in T1 followed by T3 and the minimum number of pods/plant was observed
in T0 (Table 5). This is in accordance with Bashir et al. (2014) who reported that MLE
increased the number of pods/plant (by 2.85%). MLE at 10% concentration at one
week interval was best in this investigation. This might be due to the presence of indol
acetic acid (IAA) and gibberellins (GA3) in MLE increased the number of pods. These
results were parallel to those of Khandaker et al. (2018) who reported that IAA and
GA3 increased the number of okra pods. The micronutrients that are enriched in MLE
also influenced to fruit set. Zinc improves the number of fruits and this might be due to
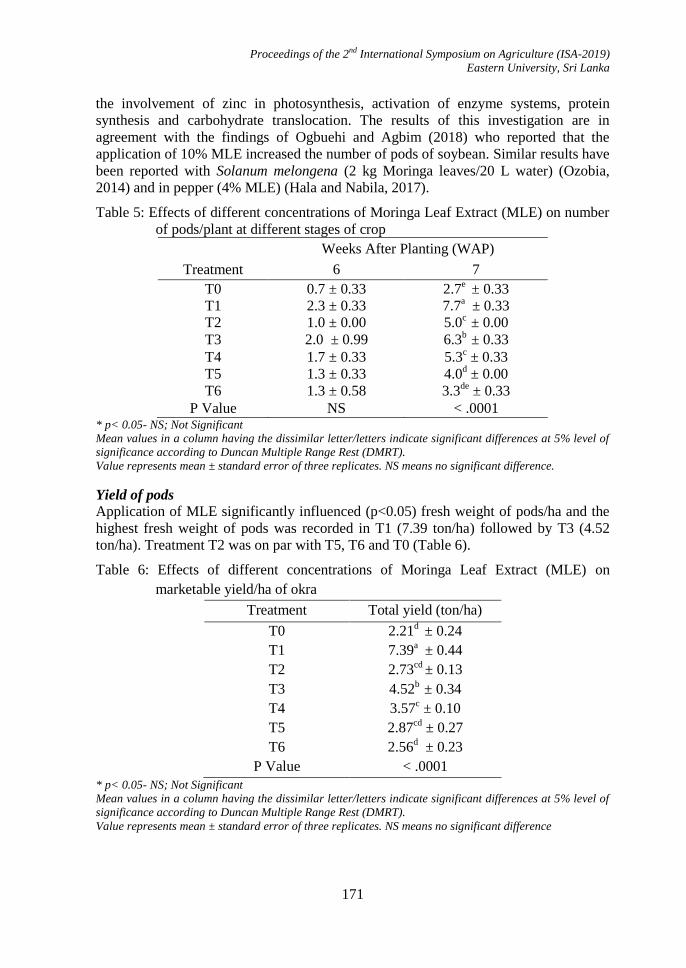
Proceedings of the 2nd International Symposium on Agriculture (ISA-2019)
Eastern University, Sri Lanka
171
the involvement of zinc in photosynthesis, activation of enzyme systems, protein
synthesis and carbohydrate translocation. The results of this investigation are in
agreement with the findings of Ogbuehi and Agbim (2018) who reported that the
application of 10% MLE increased the number of pods of soybean. Similar results have
been reported with Solanum melongena (2 kg Moringa leaves/20 L water) (Ozobia,
2014) and in pepper (4% MLE) (Hala and Nabila, 2017).
Table 5: Effects of different concentrations of Moringa Leaf Extract (MLE) on number
of pods/plant at different stages of crop
Weeks After Planting (WAP)
Treatment 6 7
T0 0.7 ± 0.33 2.7e ± 0.33
T1 2.3 ± 0.33 7.7a
± 0.33
T2 1.0 ± 0.00 5.0c
± 0.00
T3 2.0 ± 0.99 6.3b
± 0.33
T4 1.7 ± 0.33 5.3c ± 0.33
T5 1.3 ± 0.33 4.0d ± 0.00
T6 1.3 ± 0.58 3.3de
± 0.33
P Value NS < .0001 * p< 0.05- NS; Not Significant
Mean values in a column having the dissimilar letter/letters indicate significant differences at 5% level of
significance according to Duncan Multiple Range Rest (DMRT).
Value represents mean ± standard error of three replicates. NS means no significant difference.
Yield of pods Application of MLE significantly influenced (p<0.05) fresh weight of pods/ha and the
highest fresh weight of pods was recorded in T1 (7.39 ton/ha) followed by T3 (4.52
ton/ha). Treatment T2 was on par with T5, T6 and T0 (Table 6).
Table 6: Effects of different concentrations of Moringa Leaf Extract (MLE) on
marketable yield/ha of okra
Treatment Total yield (ton/ha)
T0 2.21d ± 0.24
T1 7.39a
± 0.44
T2 2.73cd
± 0.13
T3 4.52b
± 0.34
T4 3.57c ± 0.10
T5 2.87cd
± 0.27
T6 2.56d ± 0.23
P Value < .0001
* p< 0.05- NS; Not Significant
Mean values in a column having the dissimilar letter/letters indicate significant differences at 5% level of
significance according to Duncan Multiple Range Rest (DMRT).
Value represents mean ± standard error of three replicates. NS means no significant difference
Proceedings of the 2nd International Symposium on Agriculture (ISA-2019)
Eastern University, Sri Lanka
172
Jason (2013) and Fuglie (2008) documented that MLE increased yields by 25-30% for
nearly any crop due to the presence of Zeatin, a plant growth hormone. In this study,
yield increased by three-fold compared to control. This might be due to increased
chlorophyll contents by the application of MLE which in turn led to greater production
of yield in crops because higher chlorophyll resulted in greater photosynthesis.
MLE makes the best use of photosynthesis and increasing sink capacity through supply
the photo-assimilates from leaves and translocation to produce higher yield and also
zeatin, a cytokinin maintain the green photosynthetic area by delaying senescence and
affecting source-sink strength to increase yield. This result is in agreement with the
findings of increased yield in orange (3% MLE) (Abo El-Enien et al., 2015) and in
grape (2% MLE) (Bassiony and Ibrahim, 2016).
Conclusions
Application of MLE significantly improves the length of pod, the girth of the pod,
number of seeds/pod, number of pods/plant and fresh weight of pods/plant of okra. It is
concluded that application of MLE can be used to improve the marketable pod yield of
okra.
References
Abo El-Enien, M. M., El-Azazy, A. M. and El- Sayed, F. S. (2015). Effect of moringa
leaves extract as a natural product compared with other synthetic compounds on
yield production and fruit quality of navel orange trees. Egyptian Journal of
Horticulture, 42(2): 899-911.
Afzal, M.I., Iqbal, M.A., Cheema, Z.A. (2015). Triggering growth and boosting
economic yield of late sown wheat (Triticum aestivum L.) with foliar application of
allelopathic water extracts. World Journal of Agricultural Sciences, 11: 94–100.
Anon (2007). AgStat Socio Economic and Planning Centre, Department of Agriculture,
Sri Lanka.
Anyaegbu, P.O., Iwuanyanwu, U.P. and Omaliko, C.P.E. (2013). Comparative
evaluation of effects of Moringa oleifera extracts and different Fertilizers on the
Performance of Telfaria occidentalis. International Journal of Applied Research
and Technology, 2(11):127-134.
Anyaegbu, P. O. (2015). Comparative evaluation of effects of leaf extracts of selected
fallow species and N.P.K (15:15:15) fertilizer on the performance of okra,
Abelmoschus esculentus in Abuja, Nigeria. Report and Opinion, 7(10): 39-46.
Bashir, K. A., Bawa, J. A. and Mohammed, I. (2014). Efficacy of leaf extract of
drumstick tree (Moringaoleifera Lam.) on the growth of local tomato (Lycopersicon
esculentum). IOSR Journal of Pharmacy andBiological Sciences, 9(4): 74-79.
Proceedings of the 2nd International Symposium on Agriculture (ISA-2019)
Eastern University, Sri Lanka
173
Bassiony, S. S. and Ibrahim, M. G. (2016). Effect of Silicon Foliar Sprays Combined
with Moringa Leaves Extract on Yield and Fruit Quality of "Flame Seedless" Grape
(Vitis vinifera L.). International Journal of Plant Production, 7(10):1127-1135.
Culver, M., Fanuel, T. and Chiteka, A. Z. (2012). Effect of moringa extract on growth
and yield of tomato. Greener Journal of Agricultural Sciences, 2(5): 207-211.
Fuglie L. J. (2008). New Uses of Moringa Studied in Nicaragua: ECHO's Technical
Network Site-networking global hunger solutions. ECHO, Nicaragua. p. 1.
Hala, H. A. and Nabila, A.E. (2017). Effect of Moringa oleifera leaf extract (MLE) on
pepper seed germination, seedling improvement, growth, fruit yield and its quality.
Middle East Journal of Agriculture, 6(2): 448-463.
Jason, P. (2013). Pepe‟s Fruit Trees. [Online] Available: http://www.pepesplants.com.
(Accessed on 14th November, 2018).
Khandaker, M. M., Azam, H. M., Rosnah, J., Tahir, D. and Nashriyah, M. (2018). The
effects of application of exogenous IAA and GA3 on the physiological activities and
quality of Abelmoschus esculentus (Okra) var. Singa 979. Tropical Agricultural
Science, 41(1): 209-224.
Ogbuehi, H. C. and Agbim, J. U. (2018). Impact of Moringa oleifera leaf extract on
biochemical contents and yield of soybean (Glycine max L.). International Journal
of Advanced Research in Science, Engineering and Technology, 5(2): 5162-5168.
Ozobia A.P. (2014). Comparative assessment of effect of moringa extracts, NPK
fertilizer and poultry manure on soil properties and growth performance of
Solanium menlongina in Abuja,NorthCentral Region of Nigeria. Journal of
Agricultural and Crop Research, 2(5): 88-93.
Phiri, C. (2010). Influence of Moringa oleifera leaf extracts on germination and early
seedling development of major cereals. Agriculture and Biology Journal of North
America, 1(5): 774-777.
Singh, P., Chauhan,V., Tiwari, B.K. , Singh Chauhan, S. , Simon, S., Bilal, S. and
Abidi, A. B. (2014). An overview on okra (abelmoschus esculentus) and it‟s
importance as a nutritive vegetable in the world. International Journal of Pharmacy
and Biological Sciences, 4(2): 227-233.
Thomas, H. and Howarth, C.J. (2000). "Five ways to stay green. Journal of
Experimental Botany, (51): 329-337.
Yasmeen, A. (2011). Exploring the potential of moringa (Moringa oleifera) leaf extract
as natural plant growth enhancer. Ph. D. Thesis. Department of Agronomy, Faculty
of Agriculture, University of Agriculture, Faisalabad, Pakistan.
Zaki, S.S. and Rady, M.M. (2015). Moringa oleifera leaf extract improves growth,
physio-chemical attributes, antioxidant defense system and yieldsof salt-stressed
Phaseolus vulgaris L. plants. International Journal of ChemTech Research, 8(11):
120-134.
Proceedings of the 2nd International Symposium on Agriculture (ISA-2019)
Eastern University, Sri Lanka
174
SCREENING OF MUNGBEAN (Vigna radiata) ACCESSIONS UNDER
INTERMITTENT DROUGHT STRESS
K.H.S.T Deshabandu1, C.Y. Dissanayake
2, E.M.S.P.Ekanayake
1, W.M.W.Weerakoon
1,
M.S Nijamudeen1, W.C.P.Egodawatta
2 and P. Kumararathna
1
1Field Crops Research and Development Institute, Mahailluppallama, Sri Lanka 2 Department of Plant Sciences, Faculty of Agriculture, Rajarata University of Sri Lanka. Puliyankulma,
Anuradhapura, Sri Lanka
Corresponding author: [email protected]
Abstract
Drought or low soil moisture is a one of the key problem of achieving potential yield
from munbean (vigna radiata). This study was planned to assess and screen suitable
mungbean germplasam for drought survival using morphological and physiological
traits. Trial was conducted at the Field Crops Research and Development Institute,
Mahailluppallama, Sri Lanka during season of 2015/16. The experiment was laid out
as two factor factorial in randomized complete block design with two replicates.
Thirty-four mungbean lines were evaluated against three irrigation regimes. Multiple
variance analysis and principal component analysis were used to screen best mungbean
genotypes. Tolerance index of tested genotypes were shown 10 potential elite
genotypes including MI5. Principal components were determined firstly by canopy
diameter, leaf area and leaf dry weight, secondly by shoot and root length indicating
possibilities of using such characters for screening. Bi-plots showed different clustering
in two irrigation regimes, though sound performing nine mungbean genotypes were
recognized as potential candidates for drought endurance.
Keywords; Drought, Genotypes, Irrigation regimes, Mungbean, Screen
Introduction
Mungbean (Vigna radiata) is an important, self-pollinated diploid legume crop and
environment friendly food grain legume of dry land agriculture with rich source of
nutrients. Fast growth, nitrogen fixation ability, soil reinforcement and prevention of
soil erosion are some other advantages of mungbean (Ranawake et al., 2011).
Mungbean is a common crop in low-land paddy as a relay or inter-seasonal crop, in
uplands as a major crop in Yala and also appeared in many other minor cropping
systems in Sri Lanka (Sangakkara et al 2000 and Costa et al ,1999). Yield response of
mungbean to irrigation at various phenological stages in terms of radiation interception,
radiation-use efficiency and harvest index differs (Costa et al., 1999). Yield of
mungbean is more dependent on adequate supply of water than on any other single
environmental factor (Kramer and Boyer, 1997).
Mungbean in dry zone is often influenced by intermittent drought or different degrees
of low moisture stresses is the major constrain for achieving optimum growth and
Proceedings of the 2nd International Symposium on Agriculture (ISA-2019)
Eastern University, Sri Lanka
175
effective pod filling (Ranawake et al., 2011). Despite mungbean has been recognized
as a drought enduring crop, inconsistency in yields depending on the degree of
moisture stress is evident (De Costa et al., 1999) Low moisture had significant impact
on plant height, number of leaves, number of floral buds, dry matter weight of shoot
system, number of lateral roots, length of tap root, number of root nodules and dry
matter weight of root system (Ranawake et al., 2011).
Out of many solutions, a drought enduring variety or a plant type is a much feasible
solution. The path of producing such variety can be started by screening the current
germplasms for drought enduing characters and associating such with high yielding
plant types by breeding. Therefore, this study was designed to screen out possible
candidate plant types for drought endurance using some easily accessible plant
characters.
Materials and Methods
The study was conducted at Field Crops Research and Development Institute (FCRDI),
Mahailluppallama, Sri Lanka which is located in North Central Province of Sri Lanka,
(8° 07‟ 00‟‟ N, 80° 28‟ 00‟‟ E) during season of 2015/2016. Location belongs to DL 1b
agro ecological region (Punyawardena et al., 2003), where the altitude is 117.25m
above from mean sea level. The average rainfall is less than 1140mm and the mean
temperature is 25.5°C during Maha season. Soil type is Reddish Brown Earth (RBE)
characteristically with high gravel content (Mapa et al., 2005). The experiment was
conducted in a movable rainout shelter and one treatment was conducted outside the
rainout shelter.
Experiment was laid out in a Randomized Complete Block Design (RCBD) with two
factor factorial experiment. Main factor was Irrigation regime based on the allowable
depletion level (ADL) and sub factor was genotype. In two replicates, each containing
three (3) allowable depletion level and thirty-four (34) genotypes were maintained
respectively. Three irrigation regimes were used defined as ADL of 50-55, 65-70 and
above 80% with the irrigation interval of 7-8, 14-16 and 21-24 days, respectively. 34
mungbean genotypes were named as MI6, MI5, MIMB1016, MIMB918, MIMB908,
MIMB1000, MIMB945, MIMB1022, MIMB937, MIMB923, MIMB924, MIMB1019,
MIMB936, MIMB922, MIMB950, MIMB952, MIMB949, MIMB948, MIMB938,
MIMB940, MIMB939, MIMB953, MIMB971, MIMB976, MIMB901, MIMB1005,
Ari, MIMB902, MIMB986, MIMB914, MIMB921, MIMB911, MIMB907 and
MIMB910. Drip irrigation was used for irrigation scheduling. Sixteen (16) plants were
maintained for each treatment combination in 10 x 15 cm spacing. Fertilizer was
applied as recommended by the Department of Agriculture.At each treatment level, all
measurements were collected prior to apply respective irrigation treatment. Destructive
plant sampling was done to measure total dry matter accumulation of each genotype in
each treatment. SPAD reading, IR reading, morphological parameters named as canopy
diameter, plant height, number of branches, root and shoot length and leaf area and
yield parameters named as number of pods per plant, no of seeds per plant and seed

Proceedings of the 2nd International Symposium on Agriculture (ISA-2019)
Eastern University, Sri Lanka
176
weight were measured. SPAD-502 plus Chlorophyll meter, LI-3100C leaf area meter
were used respectively to measure chlorophyll content and leaf area. Soil samples were
collected just before the irrigation and oven dried soil samples were measured to
calculate gravimetric soil moisture content (Shukla et al., 2014).Interaction between
genotypes and irrigation regimes was derived for measured parameters using an
analysis of variance and Tukey‟s procedures. A principle component analysis was
executed for constructing variables that account greater variability. Scores by each
variable were used to screen the best performing genotypes at each stress
level.Tolerance index was calculated using a modified equation by Dutta et al., (2008).
Tolerance Index = Dry weight of plant in stress (g)
Dry weight of plant in control (g)
Results and Discussion
Meteorological conditions Rainfall and pan evaporation were measured to calculate the water balance of the rain
fed conditions and in order to visualise the severity of stress at outside environment.
During the study period, cumulative rainfall was 441.8 mm and cumulative pan
evaporation was 158.5 mm, with a net water deficit/balance of 283.3mm. (Figure 1)
Except few days, daily rainfall was greater than daily pan evaporation. A brief period
of negative water balance was observed from 12 to 16 DAS, 36 to 43 DAS, and 55 to
61 DAS. These periods were coinciding with vegetative growth, at flower initiation and
seed filling respectively. Nevertheless, rain fed treatment had sufficient moisture for
plant growth through the crop duration.
Figure 1: Fluctuation of mean rainfall (mm) and mean pan evaporation (mm) within the
study period
Impact on morphological characters
Neither main effect of genotypes nor the interaction between genotypes and irrigation
regime were significant (p<0.05), however significance was detected among the three
irrigation regimes. Measured characters were far inferior in rainfed condition in
contrast (Table 1). Between two irrigation regimes i.e. 14-16 and 21-24 days, canopy
diameter, branch number and leaf area were similar, but interestingly, 14-16 days
resulted quantitatively higher values. On contrary, plant height, and shoot length were
significantly varied among 14-16 days irrigation regime and 21-24 days irrigation
-40
10
60
1 4 7 10 13 16 19 22 25 28 31 34 37 40 43 46 49 52 55 58 61
Mea
n r
ain
fall
&
Mea
n p
an
eva
po
rati
on
(m
m)
Days after sowing
pan evaporation rainfall(mm)
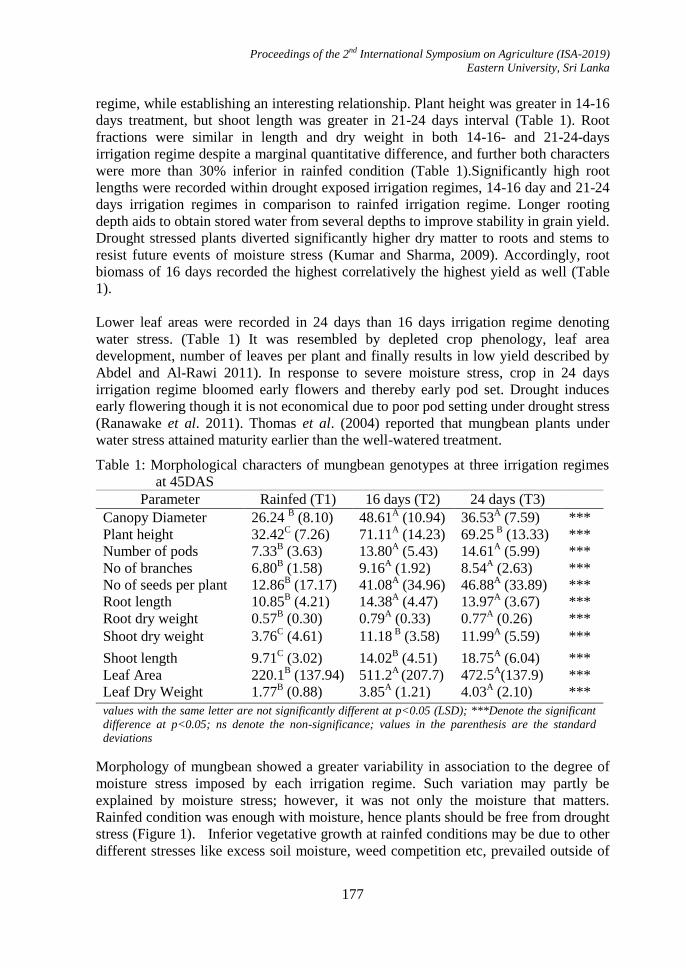
Proceedings of the 2nd International Symposium on Agriculture (ISA-2019)
Eastern University, Sri Lanka
177
regime, while establishing an interesting relationship. Plant height was greater in 14-16
days treatment, but shoot length was greater in 21-24 days interval (Table 1). Root
fractions were similar in length and dry weight in both 14-16- and 21-24-days
irrigation regime despite a marginal quantitative difference, and further both characters
were more than 30% inferior in rainfed condition (Table 1).Significantly high root
lengths were recorded within drought exposed irrigation regimes, 14-16 day and 21-24
days irrigation regimes in comparison to rainfed irrigation regime. Longer rooting
depth aids to obtain stored water from several depths to improve stability in grain yield.
Drought stressed plants diverted significantly higher dry matter to roots and stems to
resist future events of moisture stress (Kumar and Sharma, 2009). Accordingly, root
biomass of 16 days recorded the highest correlatively the highest yield as well (Table
1).
Lower leaf areas were recorded in 24 days than 16 days irrigation regime denoting
water stress. (Table 1) It was resembled by depleted crop phenology, leaf area
development, number of leaves per plant and finally results in low yield described by
Abdel and Al-Rawi 2011). In response to severe moisture stress, crop in 24 days
irrigation regime bloomed early flowers and thereby early pod set. Drought induces
early flowering though it is not economical due to poor pod setting under drought stress
(Ranawake et al. 2011). Thomas et al. (2004) reported that mungbean plants under
water stress attained maturity earlier than the well-watered treatment.
Table 1: Morphological characters of mungbean genotypes at three irrigation regimes
at 45DAS
Parameter Rainfed (T1) 16 days (T2) 24 days (T3)
Canopy Diameter 26.24 B (8.10) 48.61
A (10.94) 36.53
A (7.59) ***
Plant height 32.42C (7.26) 71.11
A (14.23) 69.25
B (13.33) ***
Number of pods 7.33B (3.63) 13.80
A (5.43) 14.61
A (5.99) ***
No of branches 6.80B (1.58) 9.16
A (1.92) 8.54
A (2.63) ***
No of seeds per plant 12.86B (17.17) 41.08
A (34.96) 46.88
A (33.89) ***
Root length 10.85B (4.21) 14.38
A (4.47) 13.97
A (3.67) ***
Root dry weight 0.57B (0.30) 0.79
A (0.33) 0.77
A (0.26) ***
Shoot dry weight 3.76C (4.61) 11.18
B (3.58) 11.99
A (5.59) ***
Shoot length 9.71C (3.02) 14.02
B (4.51) 18.75
A (6.04) ***
Leaf Area 220.1B (137.94) 511.2
A (207.7) 472.5
A(137.9) ***
Leaf Dry Weight 1.77B (0.88) 3.85
A (1.21) 4.03
A (2.10) ***
values with the same letter are not significantly different at p<0.05 (LSD); ***Denote the significant
difference at p<0.05; ns denote the non-significance; values in the parenthesis are the standard
deviations
Morphology of mungbean showed a greater variability in association to the degree of
moisture stress imposed by each irrigation regime. Such variation may partly be
explained by moisture stress; however, it was not only the moisture that matters.
Rainfed condition was enough with moisture, hence plants should be free from drought
stress (Figure 1). Inferior vegetative growth at rainfed conditions may be due to other
different stresses like excess soil moisture, weed competition etc, prevailed outside of
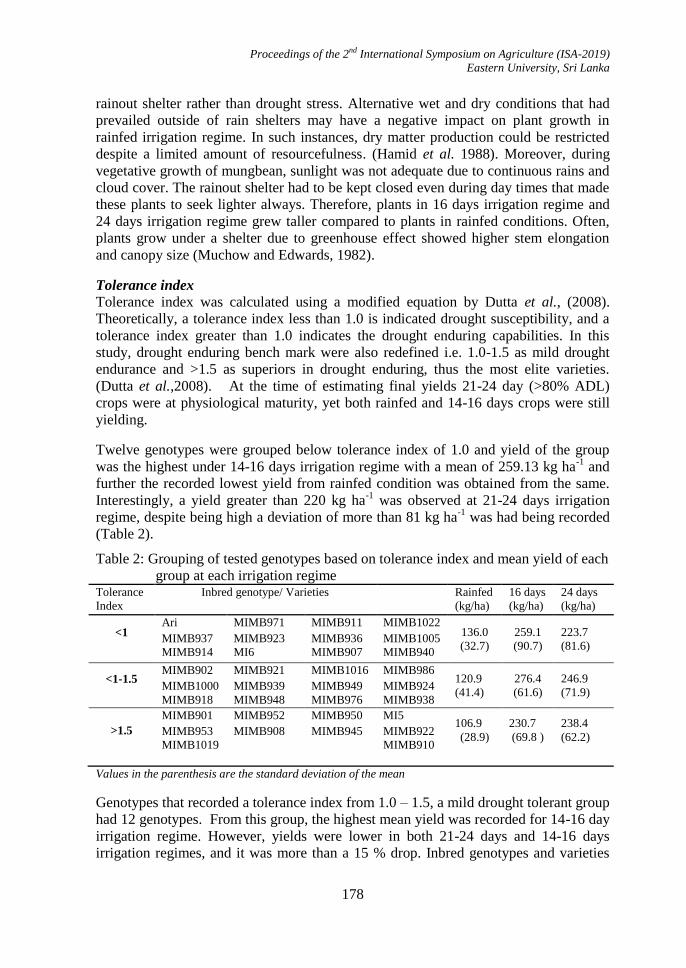
Proceedings of the 2nd International Symposium on Agriculture (ISA-2019)
Eastern University, Sri Lanka
178
rainout shelter rather than drought stress. Alternative wet and dry conditions that had
prevailed outside of rain shelters may have a negative impact on plant growth in
rainfed irrigation regime. In such instances, dry matter production could be restricted
despite a limited amount of resourcefulness. (Hamid et al. 1988). Moreover, during
vegetative growth of mungbean, sunlight was not adequate due to continuous rains and
cloud cover. The rainout shelter had to be kept closed even during day times that made
these plants to seek lighter always. Therefore, plants in 16 days irrigation regime and
24 days irrigation regime grew taller compared to plants in rainfed conditions. Often,
plants grow under a shelter due to greenhouse effect showed higher stem elongation
and canopy size (Muchow and Edwards, 1982).
Tolerance index
Tolerance index was calculated using a modified equation by Dutta et al., (2008).
Theoretically, a tolerance index less than 1.0 is indicated drought susceptibility, and a
tolerance index greater than 1.0 indicates the drought enduring capabilities. In this
study, drought enduring bench mark were also redefined i.e. 1.0-1.5 as mild drought
endurance and >1.5 as superiors in drought enduring, thus the most elite varieties.
(Dutta et al.,2008). At the time of estimating final yields 21-24 day (>80% ADL)
crops were at physiological maturity, yet both rainfed and 14-16 days crops were still
yielding.
Twelve genotypes were grouped below tolerance index of 1.0 and yield of the group
was the highest under 14-16 days irrigation regime with a mean of 259.13 kg ha-1
and
further the recorded lowest yield from rainfed condition was obtained from the same.
Interestingly, a yield greater than 220 kg ha-1
was observed at 21-24 days irrigation
regime, despite being high a deviation of more than 81 kg ha-1
was had being recorded
(Table 2).
Table 2: Grouping of tested genotypes based on tolerance index and mean yield of each
group at each irrigation regime Tolerance
Index
Inbred genotype/ Varieties
Rainfed
(kg/ha)
16 days
(kg/ha)
24 days
(kg/ha)
<1
Ari MIMB971 MIMB911 MIMB1022 136.0
(32.7)
259.1
(90.7)
223.7
(81.6) MIMB937 MIMB923 MIMB936 MIMB1005
MIMB914 MI6 MIMB907 MIMB940
<1-1.5
MIMB902 MIMB921 MIMB1016 MIMB986 120.9
(41.4)
276.4
(61.6)
246.9
(71.9) MIMB1000 MIMB939 MIMB949 MIMB924
MIMB918 MIMB948 MIMB976 MIMB938
>1.5
MIMB901 MIMB952 MIMB950 MI5 106.9
(28.9)
230.7
(69.8 )
238.4
(62.2) MIMB953 MIMB908 MIMB945 MIMB922
MIMB1019 MIMB910
Values in the parenthesis are the standard deviation of the mean
Genotypes that recorded a tolerance index from 1.0 – 1.5, a mild drought tolerant group
had 12 genotypes. From this group, the highest mean yield was recorded for 14-16 day
irrigation regime. However, yields were lower in both 21-24 days and 14-16 days
irrigation regimes, and it was more than a 15 % drop. Inbred genotypes and varieties

Proceedings of the 2nd International Symposium on Agriculture (ISA-2019)
Eastern University, Sri Lanka
179
showed a greater superiority in with a tolerance index more than 1.5. Yield of these
genotypes were approximately similar in contrary to mild drought tolerant genotypes at
rainfed. Quantitatively higher yield was recorded despite any significance between
mild and superior tolerant groups (Table 2).
Total biomass, yield and harvest index
Total biomass, seed yield and harvest index were compared in order to understand the
performance of inbred genotypes in different irrigation regimes. The highest total
biomass was observed in 21-24 days irrigation regime and the lowest was observed in
rainfed. Further, 14-16 days irrigation regime recorded substantially higher biomass,
nevertheless the quantity was significantly lower to 24 days (Table 3). The highest seed
yield was recorded in 14-16 days irrigation regime and no significant difference
(p>0.05) was observed by 21-24 days, despite a low quantitative value. Unexpectedly,
rainfed recorded the lowest on contrary (Table 3). However, HI was around 0.30-0.35,
which was a typical HI of a legume. With restricted vegetative growth, HI of rainfed
was more than 0.40, which was highly un-characteristic (Table 3). High intensity
rainfall caused flower drop in rainfed irrigation regime and roots were inundated for
long hours which would have confirmed yield reduced. On the contrary, 24 days
irrigation regime also resulted an excessive flower drop due to low moisture stress
causing a yield drop.
Table 3: Effect of different irrigation treatments on biomass, seed yield and harvest
index
Irrigation regime Rainfed (T1) 16 days (T2) 24 days (T3)
Biomass (kg/ha) 296.4C
(63.5)
705.7B
(124.9)
786.0A
(192.1)
***
Seed yield (kg/ha) 122.1B
(36.03)
256.9A
(75.4)
236.2A
(71.4)
***
Harvest Index 0.41A(0.09)
0.36
B (0.07)
0.30
C (0.08)
***
values with the same letter are not significantly different at p<0.05 (LSD); ***Denote the significant
difference at p<0.05; ns denote the non-significance; values in the parenthesis are the standard
deviations
There was no significant (p>0.05) yield difference between 16 days and 24 days
irrigation regimes for some measured parameters. Time gap between two
irrigationregimes may not have been sufficient enough to create an exact impact of
drought stress. Even though, irrigation was done according to a schedule, soil moisture
content by gravimetric method showed no significant difference between 16 days and
24 days irrigation regimes. This may associate to high soil moisture retention ability of
Reddish Brown Earth (RBE) soil with high clay content (Mapa et al., 2005). The
development of reproductive organs, which is under the control of photo-assimilate
production and partitioning by the source tissues are most critical (Taiz and Zeiger,
2002; Wahid and Rasul, 2004). A 20 kg ha-1
yield difference between 16 days and 24
days irrigation regimes may have observed mainly due to high rate of floral and pod
abortion (Liu et al. 2003).Even though highest biomass was recorded in 24 days
irrigation regime with a satisfactory vegetative growth, translation of vegetative growth
to yield was poor at stress with loss of reproductive parts (Baroowa and Gogoi, 2012).
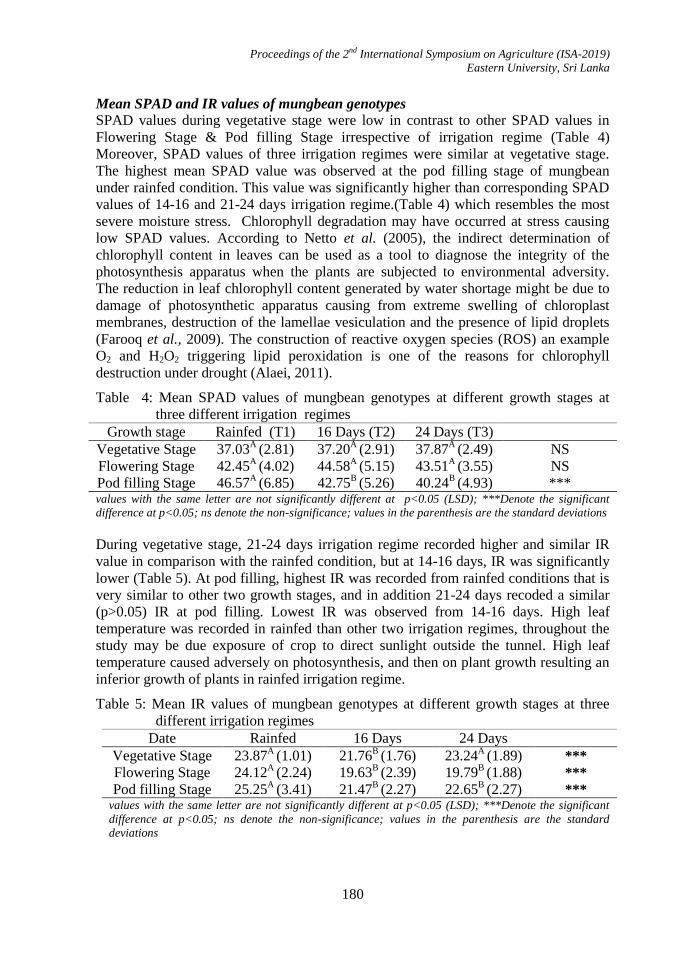
Proceedings of the 2nd International Symposium on Agriculture (ISA-2019)
Eastern University, Sri Lanka
180
Mean SPAD and IR values of mungbean genotypes
SPAD values during vegetative stage were low in contrast to other SPAD values in
Flowering Stage & Pod filling Stage irrespective of irrigation regime (Table 4)
Moreover, SPAD values of three irrigation regimes were similar at vegetative stage.
The highest mean SPAD value was observed at the pod filling stage of mungbean
under rainfed condition. This value was significantly higher than corresponding SPAD
values of 14-16 and 21-24 days irrigation regime.(Table 4) which resembles the most
severe moisture stress. Chlorophyll degradation may have occurred at stress causing
low SPAD values. According to Netto et al. (2005), the indirect determination of
chlorophyll content in leaves can be used as a tool to diagnose the integrity of the
photosynthesis apparatus when the plants are subjected to environmental adversity.
The reduction in leaf chlorophyll content generated by water shortage might be due to
damage of photosynthetic apparatus causing from extreme swelling of chloroplast
membranes, destruction of the lamellae vesiculation and the presence of lipid droplets
(Farooq et al., 2009). The construction of reactive oxygen species (ROS) an example
O2 and H2O2 triggering lipid peroxidation is one of the reasons for chlorophyll
destruction under drought (Alaei, 2011).
Table 4: Mean SPAD values of mungbean genotypes at different growth stages at
three different irrigation regimes
Growth stage Rainfed (T1) 16 Days (T2) 24 Days (T3)
Vegetative Stage 37.03A
(2.81)
37.20A
(2.91)
37.87A
(2.49)
NS
Flowering Stage 42.45A
(4.02)
44.58A
(5.15)
43.51A
(3.55)
NS
Pod filling Stage 46.57A
(6.85)
42.75B
(5.26)
40.24B
(4.93)
*** values with the same letter are not significantly different at p<0.05 (LSD); ***Denote the significant
difference at p<0.05; ns denote the non-significance; values in the parenthesis are the standard deviations
During vegetative stage, 21-24 days irrigation regime recorded higher and similar IR
value in comparison with the rainfed condition, but at 14-16 days, IR was significantly
lower (Table 5). At pod filling, highest IR was recorded from rainfed conditions that is
very similar to other two growth stages, and in addition 21-24 days recoded a similar
(p>0.05) IR at pod filling. Lowest IR was observed from 14-16 days. High leaf
temperature was recorded in rainfed than other two irrigation regimes, throughout the
study may be due exposure of crop to direct sunlight outside the tunnel. High leaf
temperature caused adversely on photosynthesis, and then on plant growth resulting an
inferior growth of plants in rainfed irrigation regime.
Table 5: Mean IR values of mungbean genotypes at different growth stages at three
different irrigation regimes
Date Rainfed 16 Days 24 Days
Vegetative Stage 23.87A
(1.01)
21.76B
(1.76)
23.24A
(1.89)
***
Flowering Stage 24.12A
(2.24)
19.63B
(2.39)
19.79B
(1.88)
***
Pod filling Stage 25.25A
(3.41)
21.47B
(2.27)
22.65B
(2.27)
*** values with the same letter are not significantly different at p<0.05 (LSD); ***Denote the significant
difference at p<0.05; ns denote the non-significance; values in the parenthesis are the standard
deviations

Proceedings of the 2nd International Symposium on Agriculture (ISA-2019)
Eastern University, Sri Lanka
181
Principle Component Analysis score plots of three treatments
Measured plant and yield characters were used to construct principle components to
limit the number of parameters by accounting a maximum variability. Several
components were constructed and first two were used for preliminary screening
process. In rainfed conditions, first two principle components were accounted a total of
72% variability, while 47% and 25% were the respective variability accounted by 1st
two. With a third, cumulative variability accounted was more than 80% (In rainfed
conditions, first principle component was driven by leaf dry weight and shoot length,
while second was driven by number of seeds, number of flowers and total dry weight
(Figure 4).There wasno drought stress in rainfed conditions, thus genotypes were
screened considering performance of candidate genotypes in response to other
environmental characters. Seven candidate genotypes were screened, which performed
well under rainfed conditions. Mungbean genotype MIMB986, MIMB 1016,
MIMB952, MI5, MIMB945 MIMB1022 and MIMB907 that were indicated by
genotype number 29, 3, 16, 2, 7, 8 and 33 respectively were the best performing
candidate genotypes in rainfed conditions (Figure 4). Mungbean genotype MIMB949,
MIMB938, MIMB936, MIMB918 and MIMB940, which were indicated by genotype
number 17, 19, 13, 4 and 20 showed far inferior performance in rainfed conditions.
Figure 2: PCA score plot between first two components of 34 genotypes in rainfed
conditions
Seven candidate genotypes that showed outstanding performances were screened in
mild stress condition. Mungbean genotype MI5, MIMB976, MIMB986, MIMB907 and
MIMB938, which were indicated by genotype number 2, 24, 29, 33 and 19 respectively
were the best performing candidate genotypes in 16 days irrigation regime. Mungbean
genotype MIMB908, MIMB1019, MIMB937, MI6, MIMB1000, MIMB918, 953 and
MIMB971, which were indicated by genotype number 5, 12, 9, 1, 6, 4, 22, 23 and 14,
had far inferior performance in 16 days irrigation regime (Figure 3).
In 24 day irrigation regime, first two components account a variability of 37.4% and
28.9% respective with a cumulative variability of 66.3%. With a third, cumulative
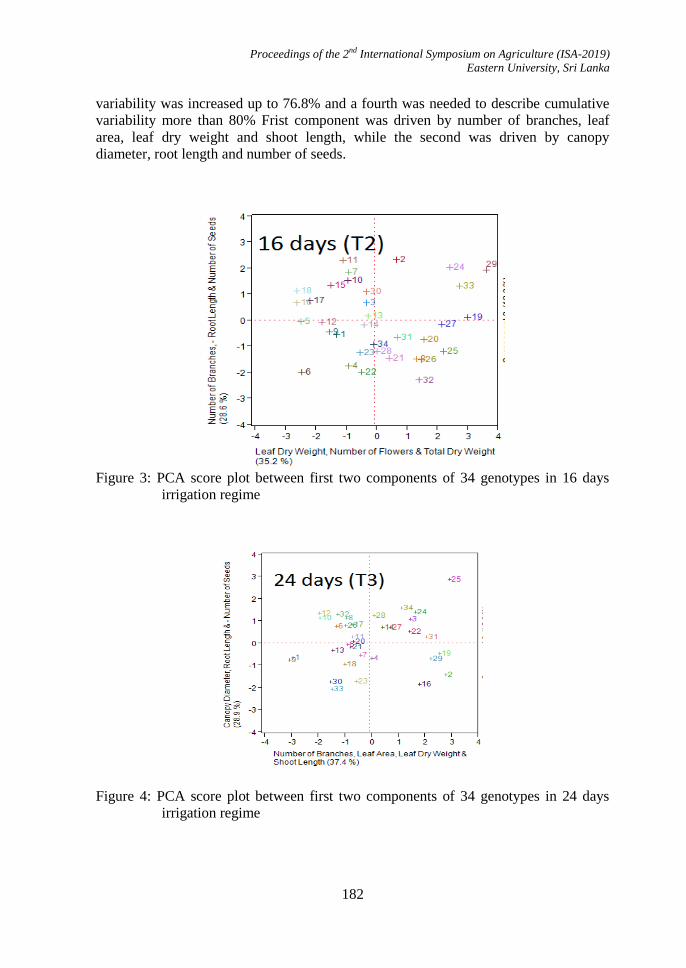
Proceedings of the 2nd International Symposium on Agriculture (ISA-2019)
Eastern University, Sri Lanka
182
variability was increased up to 76.8% and a fourth was needed to describe cumulative
variability more than 80% Frist component was driven by number of branches, leaf
area, leaf dry weight and shoot length, while the second was driven by canopy
diameter, root length and number of seeds.
Figure 3: PCA score plot between first two components of 34 genotypes in 16 days
irrigation regime
Figure 4: PCA score plot between first two components of 34 genotypes in 24 days
irrigation regime
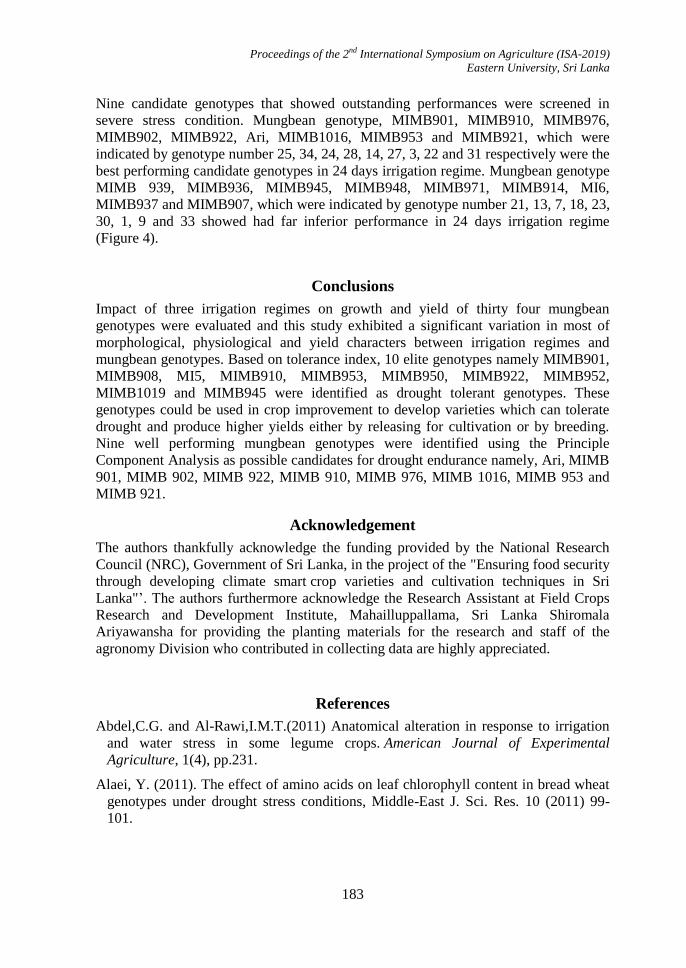
Proceedings of the 2nd International Symposium on Agriculture (ISA-2019)
Eastern University, Sri Lanka
183
Nine candidate genotypes that showed outstanding performances were screened in
severe stress condition. Mungbean genotype, MIMB901, MIMB910, MIMB976,
MIMB902, MIMB922, Ari, MIMB1016, MIMB953 and MIMB921, which were
indicated by genotype number 25, 34, 24, 28, 14, 27, 3, 22 and 31 respectively were the
best performing candidate genotypes in 24 days irrigation regime. Mungbean genotype
MIMB 939, MIMB936, MIMB945, MIMB948, MIMB971, MIMB914, MI6,
MIMB937 and MIMB907, which were indicated by genotype number 21, 13, 7, 18, 23,
30, 1, 9 and 33 showed had far inferior performance in 24 days irrigation regime
(Figure 4).
Conclusions
Impact of three irrigation regimes on growth and yield of thirty four mungbean
genotypes were evaluated and this study exhibited a significant variation in most of
morphological, physiological and yield characters between irrigation regimes and
mungbean genotypes. Based on tolerance index, 10 elite genotypes namely MIMB901,
MIMB908, MI5, MIMB910, MIMB953, MIMB950, MIMB922, MIMB952,
MIMB1019 and MIMB945 were identified as drought tolerant genotypes. These
genotypes could be used in crop improvement to develop varieties which can tolerate
drought and produce higher yields either by releasing for cultivation or by breeding.
Nine well performing mungbean genotypes were identified using the Principle
Component Analysis as possible candidates for drought endurance namely, Ari, MIMB
901, MIMB 902, MIMB 922, MIMB 910, MIMB 976, MIMB 1016, MIMB 953 and
MIMB 921.
Acknowledgement
The authors thankfully acknowledge the funding provided by the National Research
Council (NRC), Government of Sri Lanka, in the project of the "Ensuring food security
through developing climate smart crop varieties and cultivation techniques in Sri
Lanka"‟. The authors furthermore acknowledge the Research Assistant at Field Crops
Research and Development Institute, Mahailluppallama, Sri Lanka Shiromala
Ariyawansha for providing the planting materials for the research and staff of the
agronomy Division who contributed in collecting data are highly appreciated.
References
Abdel,C.G. and Al-Rawi,I.M.T.(2011) Anatomical alteration in response to irrigation
and water stress in some legume crops. American Journal of Experimental
Agriculture, 1(4), pp.231.
Alaei, Y. (2011). The effect of amino acids on leaf chlorophyll content in bread wheat
genotypes under drought stress conditions, Middle-East J. Sci. Res. 10 (2011) 99-
101.

Proceedings of the 2nd International Symposium on Agriculture (ISA-2019)
Eastern University, Sri Lanka
184
Baroowa, B. and Gogoi, N. (2012) Effect of induced drought on different growth and
biochemical attributes of black gram (Vigna mungo L.) and green gram (Vigna
radiata L.). Journal ofenvironmental research and development, 6(3A), pp. 584-593.
De Costa, W.A.J.M., Shanmugathasan, K.N. and Joseph, K.D.S.M. (1999) Physiology
of yield determination of mungbean (Vignaradiata (L.) Wilczek) under various
irrigation regimes in the dry and intermediate zones of Sri Lanka. Field Crops
Research, 61(1), pp. 1-12.
Dutta, P. and Bera, A.K. (2008) Screening of Mungbean Genotypes for Drought
Tolerance. Legume Research, 31, 145-148.
Farooq, M., A. Wahid, N. Kobayashi, D. Fujita, S.M.A. Basra, Plant drought stress:
effects, mechanisms and management, Agron. Sustain. Dev. 29 (2009) 185–212.
Hamid, A., Banik, M. L. and Hashem, A. (1988) Stand establishment of mungbean in
Bangladesh.TVIS News. 3 (2), pp. 21-24.
Kramer, P.J., Boyer, J.S. and Carlson, W.C., (1997) Water relations of plants and soils.
Forest Science, 43(1), pp. 151-152.
Kumar, A. and Sharma, K.D. (2009) Physiological responses and dry matter
partitioning of summer mungbean (Vigna radiata L.) genotypes subjected to drought
conditions. Journal of agronomy and crop science, 95, pp. 270-277.
Liu, F., Andersen, M.N. and Jensen, C.R. (2003) Loss of pod set caused by drought
stress is associated with water status and ABA content of reproductive structures in
soybean. Functional Plant Biology, 30(3), pp.271-280.
Mapa, R.B., Dassanayake, A.R. and Nayakekorale, H.B. (2005) Soils of the
intermediate zone of Sri Lanka: morphology, characterization and classification.
Peradeniya: Soil Science Society of Sri Lanka
Muchow, R.C. and Charles-Edwards, D.A. (1982) An analysis of the growth of
mungbeans at a range of plant densities in tropical Australia. I. Dry matter
Netto, A. T., Compostrini, E., De Oliveira, J. G. and Bressan-Smith, R. E. (2005)
Photosynthetic pigments, nitrogen, chlorophyll a fluorescence and SPAD-502
readings in coffee leaves. Scientia Horticulturae, 104(2), pp.199-209.
Punyawardena, B.V.R., Bandara, T.M.j., Munasinghe, M.A.K. and Banda, N.J. (2003)
Agro-ecological regions of Sri Lanka.Peradeniya: Natural resources Management
Centre, Department of Agriculture, Peradeniya, Sri Lanka
Ranawake, A.L., Dahanayaka, N., Amarasingha, U.G.G., Rodrigo, W.D.R.J. and
Rodrigo, U.T.D. (2011) Effect of water stress on growth and yield of mungbean
(Vigna radiata L). Tropical Agriculture Research and Extension, 14 (4), pp.1-4.
Sangakkara, U.R., Frehner, M. and Nosberger, J. (2000) Effect of soil moisture and
potassium fertilizer on shoot water potential, photosynthesis and partitioning of
carbon in mungbean and cowpea. Journal of Agronomy and Crop Science, 185(3),
pp.201-207.

Proceedings of the 2nd International Symposium on Agriculture (ISA-2019)
Eastern University, Sri Lanka
185
Shukla, A., Panchal, H., Mishra, M., Patel, P.R., Srivastava, H.S., Patel, P. and Shukla,
A.K. (2014) Soil moisture estimation using gravimetric technique and FDR probe
technique: a comparative analysis. American International Journal of Research in
Formal, Applied & Natural Sciences, 8. pp. 89-92.
Taiz, L. and Zeiger, E. (2002) Plant Physiology. Massachusetts: Sinauer Associates Inc
Publishers.
Thomas, R.M.J., Fukai, S. and Peoples, M.B. (2004) The effect of timing and severity
of water deficit on growth, development, yield accumulation and nitrogen fixation of
mungbean. Field Crops Research, 86(1), pp.67-80.
Wahid, A., Hameed, M. and Rasul, E. (2004) Salt-induced injury symptoms, changes
in nutrient and pigment composition, and yield characteristics of
mungbean. International journal of agriculture and biology, 6, pp. 1143-1152.
Proceedings of the 2nd International Symposium on Agriculture (ISA-2019)
Eastern University, Sri Lanka
186
PHYSIOLOGICAL RESPONSES AND YIELD OF THREE OKRA
(Abelmoschus esculentus L.) CULTIVARS AS AFFECTED BY SOIL
MOISTURE STRESS DURING THE FLOWERING STAGE
S. Premadasa, S. Mahendran and G. Hariharan*
Department of Agricultural Biology, Faculty of Agriculture, Eastern University, Sri Lanka.
*Corresponding author: [email protected]
Abstract
Drought being the most important environmental stress severely impairs plant growth
and development, limits plant production and the performance of crop plants more than
any other environmental factor. In concern with this, an experiment was conducted to
assess moisture stress responses of three okra cultivars on selected physiological
attributes and yield when the stress was imposed during the flowering stage and to
select the most suitable okra cultivar which can resist drought and produce substantial
yield under water deficit condition. The okra cultivars were grown in one hundred and
ninety-two polyethylene bags (36 cm height and 45 cm diameter). Moisture stress was
imposed for the three okra cultivars for a period of ten days during the flowering stage
by withholding water completely at once. This experiment was laid out in the
Randomized Complete Block Design with six treatments and four replications and the
treatments were arranged in 3 × 2 factor factorial manner. There were significant (p
<0.05) differences between treatments in the measured physiological attributes and
yield of okra cultivars under moisture stress condition. The highest Relative Water
Content (63.4%) was obtained in „EUOK 2‟okra cultivar and the lowest (39.0%) was
found in „MI 5‟. The highest values of „Chlorophyll a‟ (0.75 mgg-1
), „Chlorophyll b‟
(0.77 mgg-1
) and „total Chlorophyll‟ (1.6 mgg-1
) were recorded in „EUOK 2‟okra
cultivar and the lowest „Chl. a‟ (0.19 mgg-1
), „Chl. b‟ (0.23 mgg-1
) and „total
Chlorophyll‟ (0.52 mgg-1
) were recorded in „MI 5‟. The highest yield (3.8 tha-1
) was
obtained in „EUOK 2‟okra cultivar and the lowest (0.6 tha-1
) was found in „MI 5‟.
From these results, it was found that „EUOK 2‟ okra cultivar has produced the highest
physiological attributes and yield than the others under drought condition and hence, it
was identified as the most drought resistant okra genotype among the tested ones.
Keywords: Chlorophyll content, Moisture stress, Okra, Relative Water Content, Yield
Introduction
Plant growth and development as well as crop production are highly influenced and
sometimes limited by environmental conditions such as drought, salinity and
temperature stresses. Among these, drought stress is the most important environmental
constraint to world agricultural production (Bray et al., 2000). The overall plant
responses to the abiotic stresses could be generalized into morphological, physiological
and biochemical responses (Fahad et al., 2017). Drought induced changes are mainly
Proceedings of the 2nd International Symposium on Agriculture (ISA-2019)
Eastern University, Sri Lanka
187
related to altered metabolic functions such as reduced synthesis of photosynthetic
pigments (Batra et al., 2014), accumulation of osmo protectants like proline in the cell
(Ashraf and Harris, 2004), decline in cell membrane integrity and alterations in
physiological parameters such as reduced leaf water content (Baroowa and Gogoi,
2015).
Exposure of plants to soil moisture stress substantially decreased the Leaf Water
Potential, Relative Water Content and Transpiration Rate with a concomitant increase
in leaf temperature (Siddique et al., 2000). Relative Water Content is an important
characteristic feature that influence plant water relations. It is considered a measure of
plant water status reflecting the metabolic activity in tissues and used as the most
meaningful index for dehydration tolerance (Anjum et al., 2011). Appraisal of water
relations in plants grown under moisture stress condition is necessary to ascertain that
up to what extent cellular water content is maintained because almost all metabolic
activities within the cell are dependent on the availability of sufficient amount of water
therein (Ashraf et al., 2011).
The measurement of Relative Water Content under low soil moisture is of importance
since high Relative Water Content appears to be a common trait in drought resistant
species as species which exhibit restricted changes in Relative Water Content per unit
reduction in water potential are often considered to be relatively drought resistant
(Rahaman et al., 2000).
Drought damages the photosynthetic pigments and the thylakoid membranes (Anjum et
al., 2011). The reduction in Chlorophyll content under drought has been reported (Din
et al., 2011). It seems to depend on crop and cultivar type. For instance, Chlorophyll
contents in some cultivars of black gram were increased while in some others they
were decreased under moisture stress (Ashraf and Karim, 1991). This varied behavior
was attributed to the variation in the activities of enzymes involved in chlorophyll
biosynthesis. It has been reported that concentration of „Chlorophyll a‟ was higher as
compared to „Chlorophyll b‟ in drought stressed plants (Jain et al., 2010).
Okra (Abelmoschus esculentus L.) is one of the most important warm season fruit
vegetables grown throughout the tropics and valued for its edible green pods that are
popular vegetables in Sri Lanka ranked fourth in cultivated extent (Anon, 2007). It is
cultivated in the dry zone as a mono crop in irrigated uplands and rice-based cropping
systems during the „Yala‟ season and also in well drained highlands during the „Maha‟
season. Okra plants are characterized by indeterminate growth. Flowering continues
but highly dependent upon biotic and abiotic stresses. Matlob et al. (1989) have
indented the importance of time of irrigation and number of irrigations (irrigation
interval) in increasing the yield and quality of okra. Okra is reported to be
comparatively drought tolerant (Singh et al., 2014) but, drought can reduce yield
depending on severity (Romaisa et al., 2015). In okra, the stages of reproductive
development prior to flowering, at flowering and at early pod development are
particularly sensitive to moisture stress. It causes adverse effects on water relations,
growth, metabolism, mineral nutrition and yield.

Proceedings of the 2nd International Symposium on Agriculture (ISA-2019)
Eastern University, Sri Lanka
188
Okra cultivation in the Batticaloa district is heavily affected by drought. It is therefore
necessary to study the growth performance of different okra cultivars under moisture
stress condition. Hence, the present study was conducted with the objectives of
determining the effects of soil moisture stress during the flowering stage on the
physiological attributes and yield of three okra cultivars, comparing the physiological
performance of these cultivars under moisture stress condition and identifying the most
drought resistant okra cultivar which can resist drought and produce substantial yield
under water limited situation.
Materials and Methods
This experiment was conducted at the Agronomy farm of the Eastern University, Sri
Lanka from June to September 2018. The type of soil of this area is sandy regosols.
The altitude of the site is around 100 m above mean sea level and it comes under the
Agro-ecological zone of Low Country Dry Zone (DL2b). The annual mean temperature
varies from 28 to 32°C and the humidity ranges from 60 to 90%. The mean annual
rainfall of this district is between 1800 to 2100 mm.
Black polyethylene sheets having the thickness of 500 gauge were used to prepare the
bags. A number of one hundred and ninety-two polyethylene bags (36 cm height and
45 cm diameter) were made for this experiment. These bags were filled with the
potting mixture of top soil, red soil and compost at the ratio of 1:1:1. Basal dressing of
fertilizers Urea (32.3 gbag-1
), Triple Super Phosphate (126.9 gbag-1
) and Muriate of
Potash (16.2 gbag-1
) was done two days before sowing. The okra seeds cvs. „Haritha‟,
„MI 5‟ and „EUOK 2‟ were sown in these bags. The first top dressing (Urea –
20.4gbag-1
) was done at two weeks after sowing. The second (20.4gbag-1
) and third
(16.3 gbag-1
) top dressings were done on the 5th and 8
th week after sowing respectively.
Watering was done daily in the morning and evening until germination. Thereafter, it
was applied at two days interval to Field Capacity.
Soil moisture stress was imposed for the selected okra cultivars for a period of 10 days
during the flowering stage by withholding water completely at once. The control plants
were watered at two days interval to Field Capacity. The experiment was laid out in the
Randomized Complete Block Design with 3×2 factor factorial arrangement having six
treatments and four replications and the treatments were as follows:
T1 = Regular watering for the „Haritha‟ okra cultivar at two days interval to Field Capacity- Control
T2 = Moisture stress was imposed for the „Haritha‟ cultivar for 10 days during the flowering stage.
T3 = Regular watering for the „MI 5‟ okra cultivar at two days interval to Field Capacity- Control
T4 = Moisture stress was imposed for the „MI 5‟ cultivar for 10 days during the flowering stage.
T5 = Regular watering for the „EUOK 2‟ okra cultivar at two days interval to Field Capacity- Control
T6 = Moisture stress was given for the „EUOK 2‟ cultivar for 10 days during the flowering stage.
Proceedings of the 2nd International Symposium on Agriculture (ISA-2019)
Eastern University, Sri Lanka
189
Rain shelters were erected above the experimental area to prevent the entry of rain
water into the experimental field.
Determination of soil moisture content
The soil moisture content of the water stressed soil in the bags was determined on dry
weight basis using a soil co-sampler. The soil samples were collected at a depth of 30
cm from the surface of the soil on the 10th day from the commencement of the stress.
The fresh weights of the samples were measured by an electronic balance (Ohaus
PA313). The dry weights were determined by using an oven at 105°C for two days.
The soil moisture content was calculated on percentage basis as follows:
Soil moisture content (%) =𝐹𝑤−𝐷𝑤
𝐹𝑤 × 100
Where, Fw = Fresh weight of the soil sample
Dw = Dry weight of the soil sample
Physiological measurements
Relative Water Content
A number of two leaves representing two plants were randomly collected from each
replicate of the treatments and the Relative Water Content was determined as follows:
The leaves were cut into 10 discs of 1cm diameter each and were weighed to determine
the Fresh Weight (FW). These discs were immersed in distilled water for 24 hours,
removed from water and were blotted by filter papers. These discs were then weighed
to determine the Turgid Weight (TW) and the samples were dried by an oven at 80°C
for 24 hours to record the Dry Weight (DW). The Relative Water Content was
calculated as follows:
Relative Water Content (%) =𝐹𝑊−𝐷𝑊
𝑇𝑊−𝐷𝑊 × 100
Chlorophyll content
The Chlorophyll content of the okra leaves was estimated as described by Smith and
Benitez (1955). A number of two leaves representing two plants were randomly
collected from each replicate of the treatments and were washed thoroughly with water,
blotted with filter papers and were cut into small pieces. A quantity of 1g of fresh leaf
sample was weighed by an electronic balance and was macerated by a mortar and
pestle with the addition of 10 ml of 80% acetone (w/v). The homogenate was then
centrifuged (Heraeus Pico 17 Micro centrifuge) at 5000 rpm for 10 minutes and the
supernatant was collected. The residues were washed again with 80% acetone and were
centrifuged. This process was repeated again and the final volume of the pooled
supernatant was collected. The optical density of the Chlorophyll extract was recorded
by a spectrophotometer (BK-V1600 VIS) at 646, 663 and 750 nm wavelengths using
10 mm cuvettes. The amount of Chlorophylls present in the leaf extract was estimated
as follows:
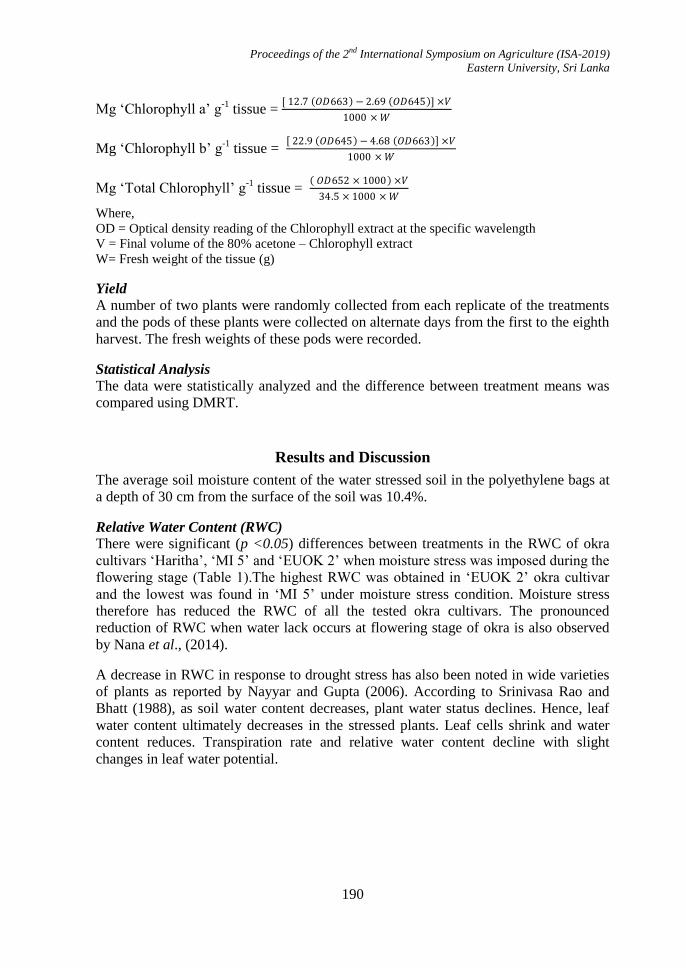
Proceedings of the 2nd International Symposium on Agriculture (ISA-2019)
Eastern University, Sri Lanka
190
Mg „Chlorophyll a‟ g-1
tissue = [ 12.7 𝑂𝐷663 − 2.69 𝑂𝐷645 ] ×𝑉
1000 × 𝑊
Mg „Chlorophyll b‟ g-1
tissue = 22.9 𝑂𝐷645 − 4.68 𝑂𝐷663 ×𝑉
1000 × 𝑊
Mg „Total Chlorophyll‟ g-1
tissue = 𝑂𝐷652 × 1000 ×𝑉
34.5 × 1000 × 𝑊
Where,
OD = Optical density reading of the Chlorophyll extract at the specific wavelength
V = Final volume of the 80% acetone – Chlorophyll extract
W= Fresh weight of the tissue (g)
Yield
A number of two plants were randomly collected from each replicate of the treatments
and the pods of these plants were collected on alternate days from the first to the eighth
harvest. The fresh weights of these pods were recorded.
Statistical Analysis
The data were statistically analyzed and the difference between treatment means was
compared using DMRT.
Results and Discussion
The average soil moisture content of the water stressed soil in the polyethylene bags at
a depth of 30 cm from the surface of the soil was 10.4%.
Relative Water Content (RWC)
There were significant (p <0.05) differences between treatments in the RWC of okra
cultivars „Haritha‟, „MI 5‟ and „EUOK 2‟ when moisture stress was imposed during the
flowering stage (Table 1).The highest RWC was obtained in „EUOK 2‟ okra cultivar
and the lowest was found in „MI 5‟ under moisture stress condition. Moisture stress
therefore has reduced the RWC of all the tested okra cultivars. The pronounced
reduction of RWC when water lack occurs at flowering stage of okra is also observed
by Nana et al., (2014).
A decrease in RWC in response to drought stress has also been noted in wide varieties
of plants as reported by Nayyar and Gupta (2006). According to Srinivasa Rao and
Bhatt (1988), as soil water content decreases, plant water status declines. Hence, leaf
water content ultimately decreases in the stressed plants. Leaf cells shrink and water
content reduces. Transpiration rate and relative water content decline with slight
changes in leaf water potential.
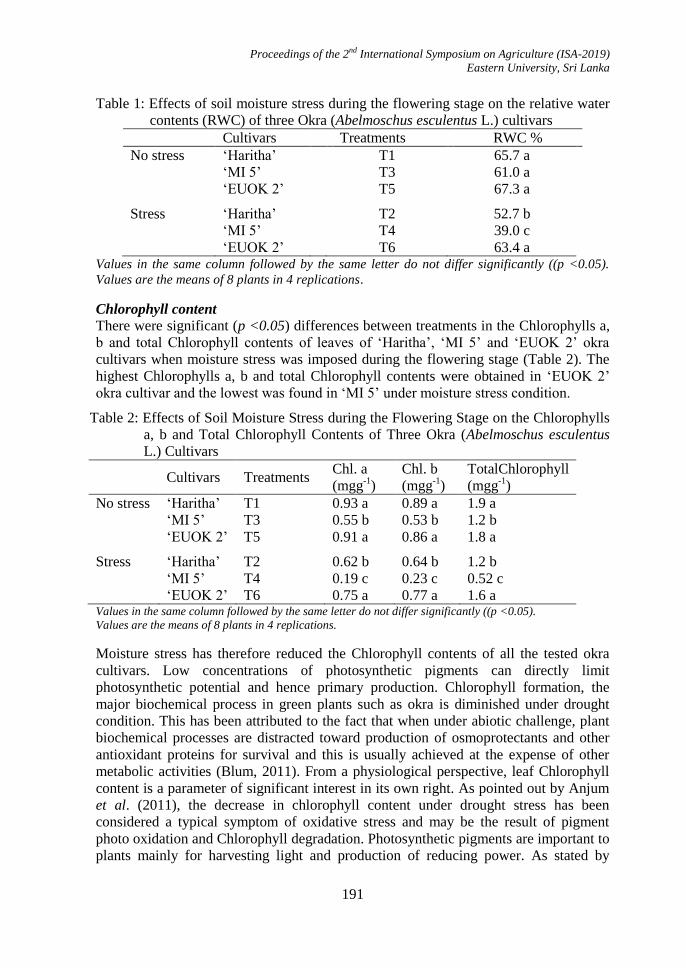
Proceedings of the 2nd International Symposium on Agriculture (ISA-2019)
Eastern University, Sri Lanka
191
Table 1: Effects of soil moisture stress during the flowering stage on the relative water
contents (RWC) of three Okra (Abelmoschus esculentus L.) cultivars
Cultivars Treatments RWC %
No stress „Haritha‟ T1 65.7 a
„MI 5‟ T3 61.0 a
„EUOK 2‟ T5 67.3 a
Stress „Haritha‟ T2 52.7 b
„MI 5‟ T4 39.0 c
„EUOK 2‟ T6 63.4 a Values in the same column followed by the same letter do not differ significantly ((p <0.05).
Values are the means of 8 plants in 4 replications.
Chlorophyll content
There were significant (p <0.05) differences between treatments in the Chlorophylls a,
b and total Chlorophyll contents of leaves of „Haritha‟, „MI 5‟ and „EUOK 2‟ okra
cultivars when moisture stress was imposed during the flowering stage (Table 2). The
highest Chlorophylls a, b and total Chlorophyll contents were obtained in „EUOK 2‟
okra cultivar and the lowest was found in „MI 5‟ under moisture stress condition.
Table 2: Effects of Soil Moisture Stress during the Flowering Stage on the Chlorophylls
a, b and Total Chlorophyll Contents of Three Okra (Abelmoschus esculentus
L.) Cultivars
Cultivars Treatments
Chl. a
(mgg-1
)
Chl. b
(mgg-1
)
TotalChlorophyll
(mgg-1
)
No stress „Haritha‟ T1 0.93 a 0.89 a 1.9 a
„MI 5‟ T3 0.55 b 0.53 b 1.2 b
„EUOK 2‟ T5 0.91 a 0.86 a 1.8 a
Stress „Haritha‟ T2 0.62 b 0.64 b 1.2 b
„MI 5‟ T4 0.19 c 0.23 c 0.52 c
„EUOK 2‟ T6 0.75 a 0.77 a 1.6 a Values in the same column followed by the same letter do not differ significantly ((p <0.05).
Values are the means of 8 plants in 4 replications.
Moisture stress has therefore reduced the Chlorophyll contents of all the tested okra
cultivars. Low concentrations of photosynthetic pigments can directly limit
photosynthetic potential and hence primary production. Chlorophyll formation, the
major biochemical process in green plants such as okra is diminished under drought
condition. This has been attributed to the fact that when under abiotic challenge, plant
biochemical processes are distracted toward production of osmoprotectants and other
antioxidant proteins for survival and this is usually achieved at the expense of other
metabolic activities (Blum, 2011). From a physiological perspective, leaf Chlorophyll
content is a parameter of significant interest in its own right. As pointed out by Anjum
et al. (2011), the decrease in chlorophyll content under drought stress has been
considered a typical symptom of oxidative stress and may be the result of pigment
photo oxidation and Chlorophyll degradation. Photosynthetic pigments are important to
plants mainly for harvesting light and production of reducing power. As stated by
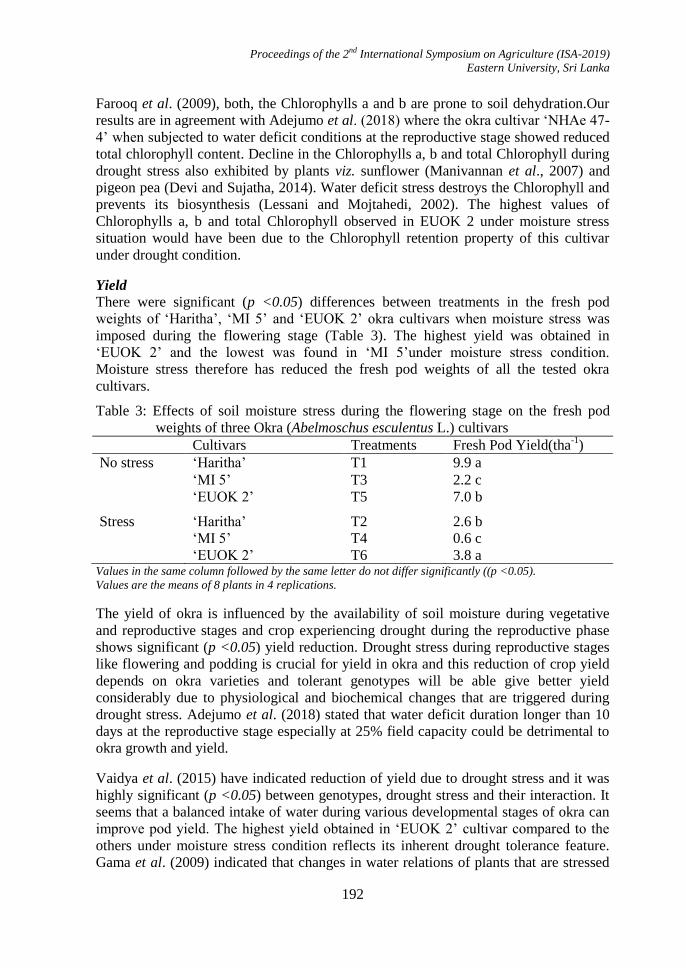
Proceedings of the 2nd International Symposium on Agriculture (ISA-2019)
Eastern University, Sri Lanka
192
Farooq et al. (2009), both, the Chlorophylls a and b are prone to soil dehydration.Our
results are in agreement with Adejumo et al. (2018) where the okra cultivar „NHAe 47-
4‟ when subjected to water deficit conditions at the reproductive stage showed reduced
total chlorophyll content. Decline in the Chlorophylls a, b and total Chlorophyll during
drought stress also exhibited by plants viz. sunflower (Manivannan et al., 2007) and
pigeon pea (Devi and Sujatha, 2014). Water deficit stress destroys the Chlorophyll and
prevents its biosynthesis (Lessani and Mojtahedi, 2002). The highest values of
Chlorophylls a, b and total Chlorophyll observed in EUOK 2 under moisture stress
situation would have been due to the Chlorophyll retention property of this cultivar
under drought condition.
Yield
There were significant (p <0.05) differences between treatments in the fresh pod
weights of „Haritha‟, „MI 5‟ and „EUOK 2‟ okra cultivars when moisture stress was
imposed during the flowering stage (Table 3). The highest yield was obtained in
„EUOK 2‟ and the lowest was found in „MI 5‟under moisture stress condition.
Moisture stress therefore has reduced the fresh pod weights of all the tested okra
cultivars.
Table 3: Effects of soil moisture stress during the flowering stage on the fresh pod
weights of three Okra (Abelmoschus esculentus L.) cultivars
Cultivars Treatments Fresh Pod Yield(tha-1
)
No stress „Haritha‟ T1 9.9 a
„MI 5‟ T3 2.2 c
„EUOK 2‟ T5 7.0 b
Stress „Haritha‟ T2 2.6 b
„MI 5‟ T4 0.6 c
„EUOK 2‟ T6 3.8 a Values in the same column followed by the same letter do not differ significantly ((p <0.05).
Values are the means of 8 plants in 4 replications.
The yield of okra is influenced by the availability of soil moisture during vegetative
and reproductive stages and crop experiencing drought during the reproductive phase
shows significant (p <0.05) yield reduction. Drought stress during reproductive stages
like flowering and podding is crucial for yield in okra and this reduction of crop yield
depends on okra varieties and tolerant genotypes will be able give better yield
considerably due to physiological and biochemical changes that are triggered during
drought stress. Adejumo et al. (2018) stated that water deficit duration longer than 10
days at the reproductive stage especially at 25% field capacity could be detrimental to
okra growth and yield.
Vaidya et al. (2015) have indicated reduction of yield due to drought stress and it was
highly significant (p <0.05) between genotypes, drought stress and their interaction. It
seems that a balanced intake of water during various developmental stages of okra can
improve pod yield. The highest yield obtained in „EUOK 2‟ cultivar compared to the
others under moisture stress condition reflects its inherent drought tolerance feature.
Gama et al. (2009) indicated that changes in water relations of plants that are stressed
Proceedings of the 2nd International Symposium on Agriculture (ISA-2019)
Eastern University, Sri Lanka
193
could be seen in certain studies which confirmed that many plants undergo reduced
plant water status when they are exposed to drought stress. The highest RWC obtained
in „EUOK 2‟ okra cultivar under moisture stress condition would have been due to its
inherent drought resistant property. Cultivars which are believed to be more drought
resistant usually maintain higher leaf RWC under drought condition.
Conclusions
Soil moisture stress imposed during the flowering stage has reduced the physiological
attributes and yield of tested okra cultivars. The highest physiological performance in
terms of Relative Water Content, Chlorophylls a, b and total Chlorophyll contents and
yield was obtained in „EUOK 2‟ okra cultivar and the lowest of these was found in „MI
5‟ under moisture stress condition. Hence, „EUOK 2‟ was identified as the drought
tolerant okra cultivar among the tested ones which can resist drought and produce
substantial yield under water scarce situation in the sandy regosols of the Batticaloa
district.
References
Adejumo, S.A., Okechukwu S., Ezeh, O.S. and Mur, L.A.J. (2018). Okra growth and
drought tolerance when exposed to water regimes at different growth stages,
InternationalJournal of Vegetable Science, https://doi.org/10.1080/19315260.
2018.1501788.
Anjum, S.A., Xie, X.Y., Wang, L.C., Saleem, M.F., Man, C. and Lei, W. (2011).
Morphological, physiological and biochemical responses of plants to drought
stress. African Journal of Agricultural Research, 6(9): 2026-2032.
Anonymous. (2007). Agriculture statistics of socio economic and planning sector.
Department of Agriculture. Peradeniya, Sri Lanka.
Ashraf, M. and Harris, P.J.C. (2004). Potential biochemical indicators of salinity
tolerance in plants. Plant Science, 166(1): 3-16.
Ashraf, M. and Karim, F. (1991). Screening of some cultivars/lines of blackgram
(Vigna mungo (L.) Hepper) for resistance to water stress. Tropical Agriculture, 68:
57-62.
Ashraf, M., Akram, N.A., Al-Qurainy, F. and Foolad, M.R. (2011). Drought tolerance:
Roles of organic osmolytes, growth regulators, and mineral nutrients. Advances in
Agronomy, 111: 249-296.
Baroowa, B. and Gogoi, N. (2015). Changes in plant water status, biochemical
attributes and seed quality of black gram and green gram genotypes under drought.
International Letters of Natural Sciences, 42: 1-12.
Proceedings of the 2nd International Symposium on Agriculture (ISA-2019)
Eastern University, Sri Lanka
194
Batra, N.G., Sharma, V. and Kumari, N. (2014). Drought-induced changes in
chlorophyll fluorescence, photosynthetic pigments, and thylakoid membrane
proteins of Vigna radiate. Journal of Plant Interactions, 9(1): 712-721.
Blum, A. (2011). Drought tolerance, is it really a complex trait?. Functional Plant
Biology, 38: 753-757.
Bray, E.A., Serres, B.J. and Weretilnyk, E. (2000). Responses to abiotic stress.
Pp.1158-1203. In: Buchanan, B.B., Gruissem, W. and Jones, R. L. Eds.,
Biochemistry and Molecular Biology of Plants. American Society of Plant
Physiologists, USA.
Devi, S.P.S. and Sujatha, B. (2014). Drought-induced accumulation of soluble sugars
and proline in two pigeon pea (Cajanus cajan Mill.) cultivars. International
Journal of Innovative Research and Development, 3(4): 302-306.
Din, J., Khan, S.U., Ali, I. and Gurmani, A.R. (2011). Physiological and agronomic
response of canola varieties to drought stress. Journal of Animal and Plant
Sciences, 21(1): 78-82.
Fahad, S., Bajwa, A. A., Nazir, U., Anjum, S. A., Farooq, A., Zohaib, A., Sadia, S.,
Nasim, W., Adkins, S., Saud, S., Ihsan, M. Z., Alharby, H., Wu, C., Wang, D. and
Huang, J. (2017). Crop Production under Drought and Heat Stress: Plant
Responses and Management Options. Frontiers in plant science, 8(1147): 1-16.
Farooq, M., Wahid, A., Kobayashi, N., Fujita, D. and Basra, S.M.A. (2009). Plant
drought stress: effects, mechanisms and management. Agronomy for Sustainable
Development, 29(1): 185-212.
Gama, P.B.S., Tanaka, K., Eneji, A.E., Eltayeb, A.E. and Siddig, K.E. (2009). Salt-
induced stress effects on biomass, photosynthetic rate, and reactive oxygen
species-scavenging enzyme accumulation in common bean. Journal of Plant
Nutrition, 32(5): 837-854.
Jain, M., Tiwary, S.K. and Gadre, R.S. (2010). Sorbitol-induced changes in various
growth and biochemical parameters in maize. Plant, Soil and Environment, 56(6):
263-267.
Lessani, H. and Mojtahedi M. (2002). Introduction to plant physiology (Translation).
6th Edn., Tehran University Press. Iran. pp: 726.
Manivannan, P., Jaleel, C.A., Sankar, B., Kishorekumar, A., Somasundaram, R.,
Lakshmanan, G.M.A. and Panneerselvam, R. (2007). Growth, biochemical
modifications and proline metabolism in Helianthus annuus L. as induced by
drought stress. Colloids and Surfaces B: Biointerfaces, 59(2): 141-149.
Matlob, A.N., Sultan, A.M. and Abdul, K.S. (1989). Production of vegetables. The
Directorate of Library for Publishing. University of Mosul. Iraq. pp. 674.
Nana, R., Sawadogo, M. and Tamini, Z. (2014). Response of okra [Abelmoschus
esculentus (L.) Moench] to water stress in the soil.African Journal of
Biotechnology, 13(35): 3591-3596.
Proceedings of the 2nd International Symposium on Agriculture (ISA-2019)
Eastern University, Sri Lanka
195
Nayyar, H. and Gupta, D. (2006). Differential sensitivity of C3 and C4 plants to water
deficit stress: association with oxidative stress and antioxidants. Environmental
and Experimental Botany, 58: 106-113
Rahman, S., Shaheen, M.S., Rahman, M. and Malik, T. A. (2000). Evaluation of
excised leaf water loss and relative water content, as screening techniques for
breeding drought resistant wheat. Pakistan Journal of Biological Sciences, 3: 663-
665.
Romaisa, K.H., Ujala, M., Khalid, N., Naima, M. and Siddiqi, E.H. (2015). Effect of
different levels of drought on growth, morphology and photosynthetic pigments of
lady finger (Abelmoschus esculentus). World Journal of Agricultural
Sciences,11(4): 198-201.
Siddique, M.R.B., Hamid, A. and Islam, M.S. (2000). Drought stress effects on water
relations of wheat. Botanical Bulletin of Academia Sinica, 41: 35-39.
Singh, P., Chauhan, V., Tiwari, B.K., Chauhan, S.S., Simon., S. Bilal., S. and Abidi,
A.B. (2014). An overview on okra (Abelmoschus esculentus) and its importance as
a nutritive vegetable in the world. International Journal of Pharmacy and
Biological Sciences, 4(2): 227-233.
Smith, J.H.C. and Benitez, A. (1955). Chlorophylls: Analysis in plant materials. Pp.
142-196. In: Paech K., Tracey M.V. (eds) Modern Methods of Plant Analysis
/Modern Methods of Plant Analysis. Springer- Verlag. Berlin, Heidelberg,
Germany.
Srinivasa Rao, N.K. and Bhatt, R.M. (1988). Photosynthesis, transpiration, stomatal
diffusive resistance, and relative water content of Capsicum annuum L. Grossum
(bell pepper) grown under water stress. Photosynthetica, 22: 377-382.
Vaidya, S., Vanaja, M., Lakshmi, N.J., Sowmya, P., Anitha, Y. and Sathish, P. (2015).
Variability in drought stress induced responses of groundnut (Arachis hypogaea L.)
genotypes. Biochemical Physiology, 4(149): 2.
Proceedings of the 2nd International Symposium on Agriculture (ISA-2019)
Eastern University, Sri Lanka
196
LABORATORY EVALUATION OF SOME SELECTED INDIGENOUS
PLANT LEAF AND GARLIC BULB EXTRACTS AGAINST Tribolium
castaneum (Coleoptera: Tenebrionidae) IN CHICKPEA (Cicer arietinum)
S. Karunakaran*1 and R. F. Niranjana
1Department of Agricultural Biology, Faculty of Agriculture, Eastern University, Sri Lanka
*Corresponding author: [email protected]
Abstract
Globally red flour beetle, Tribolium castaneum is the foremost limiting factor to
profitable storage of pulse grains. The effect of leaf extracts of nochi (Vitex negundo),
eucalyptus (Eucalyptus globulus), neem (Azadirachta indica), anona (Annona
squamosa) and extract of garlic (Allium sativum) was evaluated as grain protectant
based on adult mortality, grain damage and new emergence of T. castaneum in
chickpea. The extract of garlic bulb 10% significantly superior in controlling T.
castaneum however neem 10% also proved its efficacy with 100% mortality of the
weevil at 4th week after the treatment and showed significantly (p≤0.01) most effective
in controlling seed damage and new emergence of weevils than other treatments. In
untreated control, the percentage of damaged grains and number of new progenies
gradually increased until the 18th week with significantly very low mortality in T.
castaneum. The survival of T. castaneum in the grains treated with nochi 10% and
anona 10% were noted until 10th weeks, thereafter 100% mortality was caused by these
botanicals and thus damage was completely controlled in the grains. Furthermore, the
leaf extract of eucalyptus showed significantly least efficient for protecting chickpea
grains from the infestation of T. castaneum.
Keywords: Control, Damage, Leaf extracts, Mortality, Tribolium castaneum,
Introduction
Chickpea is an essential pulse crop cultivated all over the world predominantly in the
Afro-Asian countries (Jukanti et al., 2012). Among these, India is the large-scale
chickpea producing country and accounting for 66% of global chickpea production
(FAOSTAT, 2011). Even though the pulse grains such as cowpea, black gram, green
gram and soybean are grown in Sri Lanka for their needs (Wijeratne, 2012;
Nugaliyadda and Babu, 2013) chickpea is not grown highly in Sri Lanka due to its
major constraints like vulnerability to high temperature and terminal drought, however,
chickpea is consumed widely in Sri Lanka, and the whole demands are met through
imports (Anon, 2004).
As it is known, chickpea is an important cereal grain for starch food, every year it is
being fell down its demands by various storage pests. Among them, T. castaneum is
one of the major starch dependent storage pests, which is accountable for drastic stored
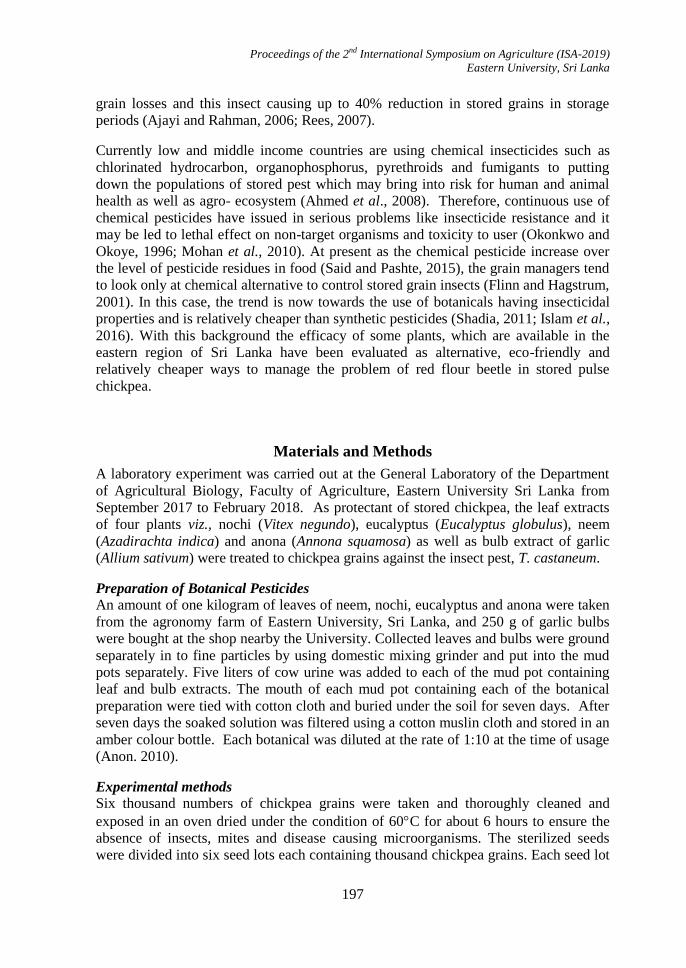
Proceedings of the 2nd International Symposium on Agriculture (ISA-2019)
Eastern University, Sri Lanka
197
grain losses and this insect causing up to 40% reduction in stored grains in storage
periods (Ajayi and Rahman, 2006; Rees, 2007).
Currently low and middle income countries are using chemical insecticides such as
chlorinated hydrocarbon, organophosphorus, pyrethroids and fumigants to putting
down the populations of stored pest which may bring into risk for human and animal
health as well as agro- ecosystem (Ahmed et al., 2008). Therefore, continuous use of
chemical pesticides have issued in serious problems like insecticide resistance and it
may be led to lethal effect on non-target organisms and toxicity to user (Okonkwo and
Okoye, 1996; Mohan et al., 2010). At present as the chemical pesticide increase over
the level of pesticide residues in food (Said and Pashte, 2015), the grain managers tend
to look only at chemical alternative to control stored grain insects (Flinn and Hagstrum,
2001). In this case, the trend is now towards the use of botanicals having insecticidal
properties and is relatively cheaper than synthetic pesticides (Shadia, 2011; Islam et al.,
2016). With this background the efficacy of some plants, which are available in the
eastern region of Sri Lanka have been evaluated as alternative, eco-friendly and
relatively cheaper ways to manage the problem of red flour beetle in stored pulse
chickpea.
Materials and Methods
A laboratory experiment was carried out at the General Laboratory of the Department
of Agricultural Biology, Faculty of Agriculture, Eastern University Sri Lanka from
September 2017 to February 2018. As protectant of stored chickpea, the leaf extracts
of four plants viz., nochi (Vitex negundo), eucalyptus (Eucalyptus globulus), neem
(Azadirachta indica) and anona (Annona squamosa) as well as bulb extract of garlic
(Allium sativum) were treated to chickpea grains against the insect pest, T. castaneum.
Preparation of Botanical Pesticides
An amount of one kilogram of leaves of neem, nochi, eucalyptus and anona were taken
from the agronomy farm of Eastern University, Sri Lanka, and 250 g of garlic bulbs
were bought at the shop nearby the University. Collected leaves and bulbs were ground
separately in to fine particles by using domestic mixing grinder and put into the mud
pots separately. Five liters of cow urine was added to each of the mud pot containing
leaf and bulb extracts. The mouth of each mud pot containing each of the botanical
preparation were tied with cotton cloth and buried under the soil for seven days. After
seven days the soaked solution was filtered using a cotton muslin cloth and stored in an
amber colour bottle. Each botanical was diluted at the rate of 1:10 at the time of usage
(Anon. 2010).
Experimental methods
Six thousand numbers of chickpea grains were taken and thoroughly cleaned and
exposed in an oven dried under the condition of 60C for about 6 hours to ensure the
absence of insects, mites and disease causing microorganisms. The sterilized seeds
were divided into six seed lots each containing thousand chickpea grains. Each seed lot

Proceedings of the 2nd International Symposium on Agriculture (ISA-2019)
Eastern University, Sri Lanka
198
was separately treated with each of the diluted botanical solution viz., leaf extracts of
neem 10%, anona 10%, nochi 10%, and eucalyptus 10% and bulb extract of garlic 10%
and untreated control (a seed lot treated with water only). The treated and untreated
seed lots were air dried under shaded condition.
Each of the treated and untreated seed lot consisting thousand chickpea grains was
further grouped into four as one contained two hundred and fifty grains in order to set 4
replications. Each seed lot was kept in a gunny bag and introduced with 10 adult T.
castaneum. After the introduction of stored pest, the treated and untreated gunny bags
were tightly tied with thread to prevent the movement of insects from inside to outside
or vice versa.
Percentage mortality of T. castaneum, the number of chickpea grains damaged and
new emergence of T. castaneum were recorded fortnightly. The percentage of mortality
was calculated by following equation;
Percentage of mortality =
Data Analysis
One-way ANOVA was performed using SAS 9.1 version and mean comparison was
done by Duncan‟s Multiple Range Test. All the comparisons were considered
significant when p≤ 0.01.
Results and Discussion
Effect of some indigenous leaf and garlic extract on red flour beetle (Tribolium
castaneum)
Percentage adult mortality of T. castaneum
Table 01 provides the percentage mortality of T. castaneum in stored chickpea treated
with botanical pesticides. Significantly (p ≤ 0.01) highest mortality was observed in
garlic (65.0%) treated chickpea in 2nd
week after treatment followed by neem (45.5%)
and anona. Eucalyptus treated chickpea showed a least significant in controlling the T.
castaneum.
Though the studies on efficiency of botanicals against T. castaneum on chickpea are
rare, the present study has been discussed with the studies carried out on efficiency of
botanicals against T. castaneum on different other hosts. The study of Patil et al.,
(2015) stated that the application of neem seed powder at 5g would be an efficacious
treatment with respect to killing of T. castaneum in stored rice followed by black
pepper seed powder at 5 g for protecting the rice grains. The authors also observed the
substantial reduction of the population of T. castaneum in stored rice by the
application of karanj (Pongamia pinnata), tulsi (Occimum basilicum), turmeric
rhizomes (Cucurma longa), onion (Allium cepa)and garlic (A. sativum).Further Mamun
et al., (2009) also reported that the neem seed extract had highest toxic effect (52.50 %
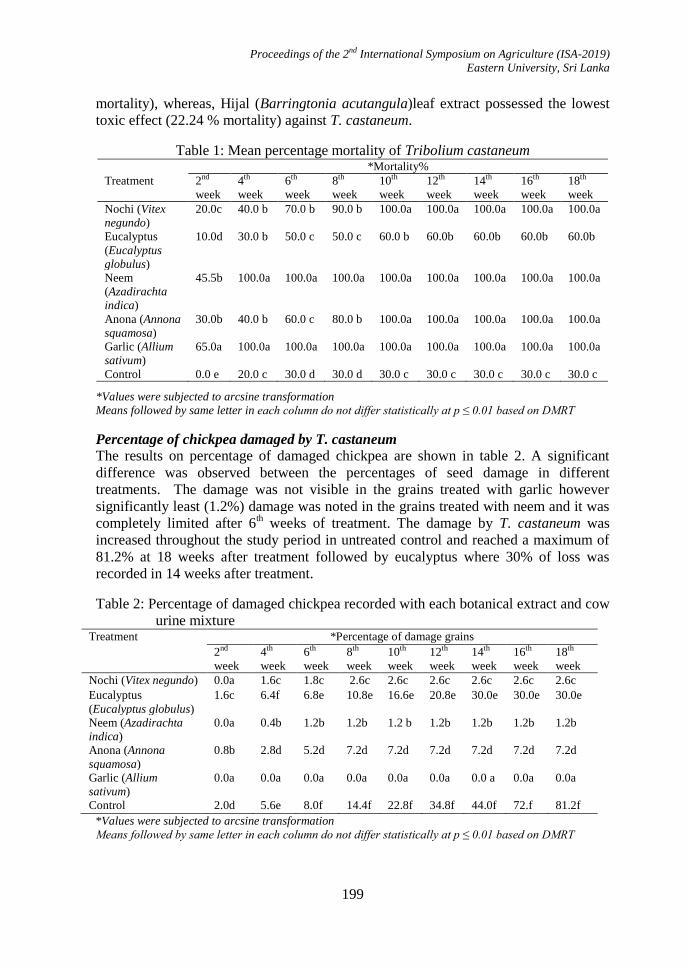
Proceedings of the 2nd International Symposium on Agriculture (ISA-2019)
Eastern University, Sri Lanka
199
mortality), whereas, Hijal (Barringtonia acutangula)leaf extract possessed the lowest
toxic effect (22.24 % mortality) against T. castaneum.
Table 1: Mean percentage mortality of Tribolium castaneum *Mortality%
Treatment 2nd
week
4th
week
6th
week
8th
week
10th
week
12th
week
14th
week
16th
week
18th
week
Nochi (Vitex
negundo)
20.0c 40.0 b 70.0 b 90.0 b 100.0a 100.0a 100.0a 100.0a 100.0a
Eucalyptus
(Eucalyptus
globulus)
10.0d 30.0 b 50.0 c 50.0 c 60.0 b 60.0b 60.0b 60.0b 60.0b
Neem
(Azadirachta
indica)
45.5b 100.0a 100.0a 100.0a 100.0a 100.0a 100.0a 100.0a 100.0a
Anona (Annona
squamosa)
30.0b 40.0 b 60.0 c 80.0 b 100.0a 100.0a 100.0a 100.0a 100.0a
Garlic (Allium
sativum)
65.0a 100.0a 100.0a 100.0a 100.0a 100.0a 100.0a 100.0a 100.0a
Control 0.0 e 20.0 c 30.0 d 30.0 d 30.0 c 30.0 c 30.0 c 30.0 c 30.0 c
*Values were subjected to arcsine transformation
Means followed by same letter in each column do not differ statistically at p ≤ 0.01 based on DMRT
Percentage of chickpea damaged by T. castaneum
The results on percentage of damaged chickpea are shown in table 2. A significant
difference was observed between the percentages of seed damage in different
treatments. The damage was not visible in the grains treated with garlic however
significantly least (1.2%) damage was noted in the grains treated with neem and it was
completely limited after 6th weeks of treatment. The damage by T. castaneum was
increased throughout the study period in untreated control and reached a maximum of
81.2% at 18 weeks after treatment followed by eucalyptus where 30% of loss was
recorded in 14 weeks after treatment.
Table 2: Percentage of damaged chickpea recorded with each botanical extract and cow
urine mixture Treatment *Percentage of damage grains
2nd
week
4th
week
6th
week
8th
week
10th
week
12th
week
14th
week
16th
week
18th
week
Nochi (Vitex negundo) 0.0a 1.6c 1.8c 2.6c 2.6c 2.6c 2.6c 2.6c 2.6c
Eucalyptus
(Eucalyptus globulus)
1.6c 6.4f 6.8e 10.8e 16.6e 20.8e 30.0e 30.0e 30.0e
Neem (Azadirachta
indica)
0.0a 0.4b 1.2b 1.2b 1.2 b 1.2b 1.2b 1.2b 1.2b
Anona (Annona
squamosa)
0.8b 2.8d 5.2d 7.2d 7.2d 7.2d 7.2d 7.2d 7.2d
Garlic (Allium
sativum)
0.0a 0.0a 0.0a 0.0a 0.0a 0.0a 0.0 a 0.0a 0.0a
Control 2.0d 5.6e 8.0f 14.4f 22.8f 34.8f 44.0f 72.f 81.2f
*Values were subjected to arcsine transformation
Means followed by same letter in each column do not differ statistically at p ≤ 0.01 based on DMRT

Proceedings of the 2nd International Symposium on Agriculture (ISA-2019)
Eastern University, Sri Lanka
200
Number of development of progeny
The new progeny of T. castaneum is shown in table 3. After 30 days onward the
development of new progeny of T. castaneum was observed in control treatment and it
was increased day by day until 113 of the last reading, which revealed the host
preference of T. castaneum towards chickpea. Furthermore, significantly minimum
number of new emergences was observed in anona and eucalyptus treated seeds and it
was stopped after 8th and 12
th weeks onwards. None of the progenies of T. castaneum
have been noted in nochi, neem and garlic treated grains.
Table 3: Effect of botanicals on number of adult emergence *Number of adult emergence
Treatment 2nd
week
4th
week
6th
week
8th
week
10th
week
12th
week
14th
week
16th
week
18th
week
Nochi (Vitex
negundo)
0.0 a 0.0 a 0.0 a 0.0 a 0.0 a 0.0 a 0.0 a 0.0 a 0.0 a
Eucalyptus
(Eucalyptus
globulus)
0.0 a 0.0 a 0.0 a 3.0 b 3.0 b 9.0 c 9.0 c 9.0 c 9.0 c
Neem
(Azadirachta
indica)
0.0 a 0.0 a 0.0 a 0.0 a 0.0 a 0.0 a 0.0 a 0.0 a 0.0 a
Anona
(Annona
squamosa)
0.0 a 0.0 a 2.0 b 3.0 b 3.0 b 3.0 b 3.0 b 3.0 b 3.0 b
Garlic
(Allium
sativum)
0.0 a 0.0 a 0.0 a 0.0 a 0.0 a 0.0 a 0.0 a 0.0 a 0.0 a
Control 0.0 a 0.0 a 10.0 c 21.0 c 34.0 c 45.0d 61.0d 93.0d 113.0d
*Values were subjected to square root transformation.
Means followed by same letter in each column do not differ statistically at p ≤ 0.01 based on DMRT
Inamullah et al. (2016) revealed that the development of new emergence of Tribolium
beetle was significantly low when the different concentration of the tested plants,
Verbana tenuisecta, Parthenium hysterophorus, Calotropis procera and Azadiracta
indica were added to the flour. The extracts of V. tenuisecta (at 500 ppm) effectively
controlled egg laying of T.castaneum, i.e., the minimum mean number of eggs was
61.00, followed by the standard A. indica at 1000 ppm with 77.50 eggs. Further the
comparative insecticidal activity of different plants were evaluated against T.castaneum
earlier by Ahmed et al, (2018) in Pakistan, the results have recommended that
A.sativam (garlic) and Z. officinale (ginger) were more effective resulting in to 15
times higher adult mortality and 4 to 5 times reduction in grain weight losses when
mixed with rice grain.
Meanwhile, the researchers Gunarathna and Karunaratne, (2009) in Sri Lanka,
evaluated thirty-seven Sri Lankan plants as post-harvest grain protectants for the
control of rice weevil Sitophilus oryzea. The results revealed that, out of these twenty
plants Ocimum gratissimum (Lamiaceae), Cinnamomum verum (Lauraceae), Mentha
viridis (Laminaceae), Plectranthus amboinicus (Laminaceae) and Citrus reticulate
(Rutaceae) showed highest repellent activity whereas M.viridis elicited the highest and

Proceedings of the 2nd International Symposium on Agriculture (ISA-2019)
Eastern University, Sri Lanka
201
strongest repellency (89.0%) against the weevils when compared with the other
treatment.
Conclusions
The application of garlic (Allium sativum) and neem (Azadirachta indica) were
effective treatments with respect to the mortality of Tribolium castaneum as well as
suppress the new progeny and completely control the seed damage of chickpea in
storage condition. The botanicals nochi (Vitex negundo) and anona (Annona
squamosa) also protected the chickpea as much as possible whereas eucalyptus
(Eucalyptus globulus) provided a least protection against T. castaneum.
References
Ahmed, A., Ahmad T., Arian M.A. and Ahmed M. (2008). Management of bagged
wheat godowns to control the stored grain insect pests. Pak. Entomol. 30: 31-35.
Ajayi, F.A., Rahman, S.A. (2006). Susceptibility of some staple processed meals to red
flour beetle, Tribolium castaneum (Herbst) (Coleoptera: Tenebrionidae). Pak. J.
Biol.Sci.9. 1744-1748.
Anonymous. (2004). www.icrisat.org. (Sri Lanka and ICRISAT: A partnership for
prosperity in the drylands- Sep 2004). (Accessed 12th June 2018).
Anonymous. (2010).www.angoc.org/wp-content/uplods/2010/07/06 (Accessed 12th
June 2018).
Ahmad, F., Iqbal, N., Zaka, S.M., Qureshi, M.K., Saeed, Q., Khan, K.A., Ghramh,
H.A., Ansari, M.J., Jaleel, W., Aasim, M. and Awar, M.B. (2018). Comparative
insecticidal activity of different plant materials from six common plant species
against Tribolium castaneum (Herbst) (Coleoptera:Tenebrionidae) Saudi Journal of
Biological Sciences. (2018), https://doi.org/10.1016/j.sjbs.2018.02.018.
FAOSTAT. (2011). http://faostat.fao.org/site/567/DesktopDefault.aspx. (Accessed 12th
August 2018).
Flinn, P.W., Hagstrum D.W. (2001). Augmentative release of parasitoid wasps in
stored reduces insect fragments in flour. Journal of Stored Products Research, 37:
179-186.
Gunarathna, T.V.N.M. and Karunaratne, M.M.S.C. (2009). Laboratory evaluation of
some Sri Lankan plants as post-harvest grain protectants for the control of rice
weevil Sitophilus oryzea, Vidyodaya J of Sci, 14 (11): 69-83.
Inamullah, K., Nosheen, Q., Shah, A. K., Asad, Ali., Musharaf, A. and Khwaja, J.
(2016). Efficacy of Several Plant Extracts as Growth Inhibitors against Red Flour
Beetle, Tribolium castaneum (Herbst) (Coleoptera: Tenebrionidae). Acta Zoologica
Bulgarica, 68 (3): 443-450.
Proceedings of the 2nd International Symposium on Agriculture (ISA-2019)
Eastern University, Sri Lanka
202
Islam, W., Awais, M., Noman, A. and Wu, Z. (2016). Success of bio products against
bacterial leaf blight disease of rice caused by Xanthomonas oryzae pv. oryzae. PSM
Microbiol, 1(2): 50-55.
Jukanti, A. K. P. M., Gaur1, C. L. L., Gowda and Chibbar. R. N. (2012). Nutritional
quality and health benefits of chickpea (Cicer arietinum L.): A review. British
Journal of Nutrition, 108 (51): 511-526.
Mamun, M.S.A., Shahjahan, M. and Ahmad, M. (2009). Laboratory evaluation of some
indigenous plant extracts as toxicants against red flour beetle, Tribolium castaneum
Herbst. J. Bangladesh Agril. Univ. 7(1): 1-5.
Mohan, S., Pretheep-Kumar, P. and Balasubramanian, P. (2010). Insecticide resistance-
stored-product insects-LAP (Labert Academi Publishing).
Nugaliyadde, M.M. and Babu, A.G.C. (2013). Popularizing multiple cropping
innovation as means to raise crop productivity and farm income in Sri Lanka. In
Popularizing multiple cropping innovation as a means to raise crop productivity
and farm income in SAARC countries. Eds Musa, M., Azad, A.K. and Gurung,
T.R). SAARC Agriculture Centre (SAC), Dhaka, Bangladesh Pulses.
Okonkwo, E. U. and Okoye, W. I. (1996). The efficacy of four seed powders and the
essential oils as protectantsof cowpea and maize grains against infestation by
Callosobruchus maculatus (Fabricius) (Coleoptera: Bruchidae) and Sitophilus
zeamais (Motschulsky) (Coleoptera: Curculionidae) in Nigeria.
InternationalJournal of Pest Management, 42: 143-146.
Patil, S. J., Radadia, G. G. and Shinde, C. U. (2015). Efficacy of ceratin grain
protectant against rust red flour beetle, Trobolium castaneum (Herbst) on stored
rice. Global Journal of Bio-science and Biotechnology, 4(1): 112-115.
Rees, D.P.(2007). Insects of Stored Products. CSIRD Publishing Australia.
Said, P. P. and Pashte, V. V. (2015). Review Article, Botanicals: The Protectants of
Stored Grains Pests. Trends in Biosciences, 8 (15), Print: ISSN 0974-8, 3750-
3755.
Shadia, E. A. (2011). Control strategies of stored product pests. J Entomol, 8: 101-122.
Wijeratne, P.M. (2012). Current Status and Future Prospects of Pulse Production in Sri
Lanka. In Current Status and Future Prospect of Pulse Production in SAARC
Countries. SAARC \ Agriculture Centre (SAC), Momin Offset Press, Dhaka,
Bangladesh, pp 159-172.
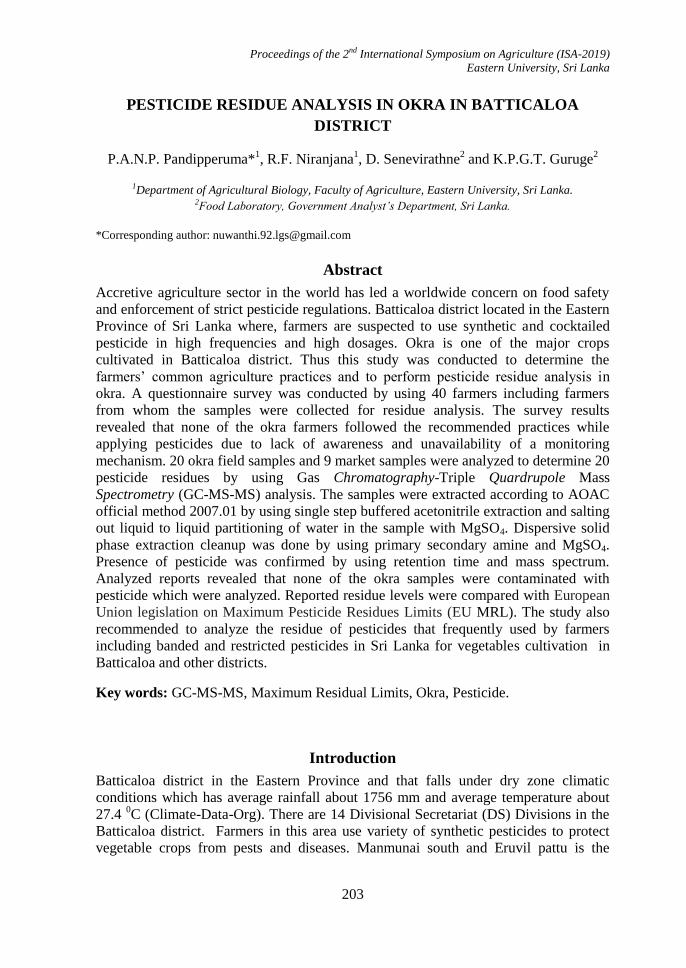
Proceedings of the 2nd International Symposium on Agriculture (ISA-2019)
Eastern University, Sri Lanka
203
PESTICIDE RESIDUE ANALYSIS IN OKRA IN BATTICALOA
DISTRICT
P.A.N.P. Pandipperuma*1, R.F. Niranjana
1, D. Senevirathne
2 and K.P.G.T. Guruge
2
1Department of Agricultural Biology, Faculty of Agriculture, Eastern University, Sri Lanka. 2Food Laboratory, Government Analyst’s Department, Sri Lanka.
*Corresponding author: [email protected]
Abstract
Accretive agriculture sector in the world has led a worldwide concern on food safety
and enforcement of strict pesticide regulations. Batticaloa district located in the Eastern
Province of Sri Lanka where, farmers are suspected to use synthetic and cocktailed
pesticide in high frequencies and high dosages. Okra is one of the major crops
cultivated in Batticaloa district. Thus this study was conducted to determine the
farmers‟ common agriculture practices and to perform pesticide residue analysis in
okra. A questionnaire survey was conducted by using 40 farmers including farmers
from whom the samples were collected for residue analysis. The survey results
revealed that none of the okra farmers followed the recommended practices while
applying pesticides due to lack of awareness and unavailability of a monitoring
mechanism. 20 okra field samples and 9 market samples were analyzed to determine 20
pesticide residues by using Gas Chromatography-Triple Quardrupole Mass
Spectrometry (GC-MS-MS) analysis. The samples were extracted according to AOAC
official method 2007.01 by using single step buffered acetonitrile extraction and salting
out liquid to liquid partitioning of water in the sample with MgSO4. Dispersive solid
phase extraction cleanup was done by using primary secondary amine and MgSO4.
Presence of pesticide was confirmed by using retention time and mass spectrum.
Analyzed reports revealed that none of the okra samples were contaminated with
pesticide which were analyzed. Reported residue levels were compared with European
Union legislation on Maximum Pesticide Residues Limits (EU MRL). The study also
recommended to analyze the residue of pesticides that frequently used by farmers
including banded and restricted pesticides in Sri Lanka for vegetables cultivation in
Batticaloa and other districts.
Key words: GC-MS-MS, Maximum Residual Limits, Okra, Pesticide.
Introduction
Batticaloa district in the Eastern Province and that falls under dry zone climatic
conditions which has average rainfall about 1756 mm and average temperature about
27.4 0C (Climate-Data-Org). There are 14 Divisional Secretariat (DS) Divisions in the
Batticaloa district. Farmers in this area use variety of synthetic pesticides to protect
vegetable crops from pests and diseases. Manmunai south and Eruvil pattu is the

Proceedings of the 2nd International Symposium on Agriculture (ISA-2019)
Eastern University, Sri Lanka
204
highest vegetable growing DS Division in the Batticaloa district. Brinjal and okra is
one of the major crop cultivate in the Batticaloa district (Sutharsan et al., 2014).
Pesticides have extensively been used in agricultural production in Sri Lanka to control
pests and diseases and hence to get maximum yield (Sutharsan et al., 2014). However,
indiscriminate use of pesticides leads to the accumulation of pesticide residues in the
crop produced, and causes numerous health and environmental impacts (Lakshani et
al., 2017).
Under the control of pesticides act no. 33 of 1980, provisions has been set out to
declare safe limits for pesticide residues in local consumptions of fresh fruits and
vegetables. In order to complement national food safety assurance, 221 pesticides
tolerance limits (maximum residue limits, MRLS) on 39 crop/food categories for 65
active ingredients (Anonymous, 2016) were finalized for the Government gazette
extraordinary notification. Use of pesticides in dissentient manner has several
drawbacks such as health risks, residues remains may pollute the environment
including water bodies and may disrupt the ecological balance of pest control by
natural enemies and may lead to secondary pest upsets.
In the Batticaloa district it was suspected that farmers are using cocktail mixtures of
pesticides in vegetable farming. It was also commented highly that the farmers are not
rely on the recommendation of the Department of Agriculture while using pesticides
(Sutharsan et al., 2014). Sheikh et al., (2013) showed that spray of pesticides on
vegetable crops was a very common practice which not only kills pests but also remain
in outside or get inside the vegetables through minute pores thereby become its
component (i.e. pesticide residues) that become a great health hazard after
consumption. Pesticides are potentially toxic to humans and can have both acute and
chronic health effects, depending on the quantity and ways in which the person is
exposed to pesticides (WHO, 2018).
Thus, the present study focused on analyzing some selected pesticide residues in okra
according to the AOAC official method 2007.01 and by using Gas Chromatography-
Triple Quardrupole Mass Spectrometry (GC-MS-MS) detection in okra. Prior to
pesticide residue analysis, information on types of pesticides that are being used
frequently by farmers were collected in order to determine common practices used by
farmers during pesticides application and to identify the common media used by
farmers to get information about pesticides.
Materials and Methods
Questionnaire Survey
A questionnaire survey was conducted inManmunai south and Eruvil pattu DS
Division and Poratheevu pattu DS Division in Batticaloa districtduring July – August
2018 by using 40 farmers who engaged in okra cultivation. Questionnaire was designed
in both English and Tamil languages. This questionnaire survey was carried out by
interviewing individual farmers in their own cultivation field in the presence of an

Proceedings of the 2nd International Symposium on Agriculture (ISA-2019)
Eastern University, Sri Lanka
205
Agriculture Instructor. The questionnaire was arranged to collect relevant information
viz., socio-economic background, safety measures while applying pesticides and the
types of frequently used pesticides, farmer‟s common practices during application of
pesticides, the common media used by farmers to get information about pesticides and
their knowledge regarding pesticide usage. The data obtained from the questionnaire
survey were analyzed by using SPSS 19.0 statistical software.
Pesticide Residue Analysis in Vegetables
Dimethoate, Carbofuran, Diazinon, Chlorothalonil, Metalaxyl, Malathion, Fenthion,
Chloropyrifos, Isoprothiolane, Thiamethoxam, Flutolanil, Profenofos, Oxadixyl,
Bifenthrin, Phosalone, Pyraclostrobin, Difenoconazole I, Difenoconazole II,
Dimethomorph 1 and Dimethomorph2 were selected for the study due to their extensive
usage, toxicological effects and also based on the availablility of analytical facilities.
Among the selected pesticides Dimethoate and Fenthion, are banned and Carbofuran,
Chloropyrifos and Diazinon are restricted in Sri Lanka.
Sample collection was done by using 20 farmers at their farm gate from Manmunai
South and Eruvil Pattu DS Division and Poratheevu Pattu DS Division in Batticaloa
district. They were selected based on the production quantity of vegetables where
Manmunai south and Eruvil pattu DS Division is the major vegetable cultivating DS
Division in Batticaloa district. And the markets were selected based on the population/
consumer availability in each area. Here the selected market places were Batticaloa
(Manmunai North DS division), Vellavely (Poratheevu Pattu DS Division),
Arayampathy (Manmunai Pattu DS Division), Kaluwanchikudy and Kaluthavalai
(Manmunai south and Eruvil pattu DS Division), Eravur (Eravur Town DS Division),
Chenkalady (Eravur Pttu DS Division), Oddamavadi (Koralai pattu west DS Division)
and Valaichchenai (Koralai Pattu DS Division). 1 kg of okra farmer field samples was
collected at their farm gate and 1kg of okra market samples were collected by using 9
market places in Batticaloa district at the time of they are ready for selling to
consumers. Then collected samples were taken for pesticide residue analysis within 24
hours after collection. The sample analysis was done in the food laboratory of the
Government Analyst‟s Department of Sri Lanka.
The samples were extracted according to the AOAC official method 2007.01. A
kilogram of samples was homogenized by using a blender and 15 g of it was
transferred into 50 ml centrifuge tube. Then 15 ml of acetic acid in acetonitrile was
added into it for sample extraction. Then the sample drying and buffering was done by
adding a packet ofAOAC salt (QuEChERS) containing 6 g of anhydrous magnesium
sulfate (MgSO4) and 1.5 g of sodium acetate (NaOAc). Then for the phase separation,
the sample was centrifuged at 400 rpm for 5 minutes. Dispersive- solid- phase
extraction (SPE) cleanup was done by transferring 1 ml of supernatant into Dispersive
SPE tube (2 ml) which contained 150 mg of MgSO4, 50mg of primary secondary amine
(PSA) and 50 mg of C18. The resultant mixture was centrifuged at 13000 rpm for 2
minutes, then immediately 250 µl of it was transferred into glass auto-sampling vials (1
ml). Then 25 µl of 500 ng/ml Triphenyl Phosphate (TPP) internal standard and 15 µl
Proceedings of the 2nd International Symposium on Agriculture (ISA-2019)
Eastern University, Sri Lanka
206
D-sorbitol analyte protectant was added and the vial was capped and transferred for
Gas Chromatography Triple Quardrupole Mass Spectrometry analysis.
The presence of pesticide was confirmed based on the retention time (RT) and
analyzing the mass spectrum. Recovery studies were performed at a range of
0.01mg/kg to 0.1mg/kg and recoveries were obtained within the range of 70- 120%,
with an associated repeatability RSDr ≤ 20% (Relative Standard Deviation RSD) for all
analytes. The recoveries were obtained with a linearity criteria of R2
≥ 0.98- 0.99 and
the 0.01 mg/kg was used as the Limit of Quantification (LOQ). Acceptable mean
recoveries should be within the range of 70- 120% with an associated repeatability
RSDr ≤ 20% for all analytes (SANCO, 2015).Reported residue levels were compared
with the EU MRL values. The data from sample analysis were statistically analyzed by
using SPSS 19.0 statistical software.
Gas Chromatography- Triple Quardrupole Mass Spectrometry instrument
configuration
For analysis, Agilent 7890A GC gas chromatograph system equipped with Agilent
7000 C triple quardrupole GC/MS andAgilent 7693A automatic liquid sampler was
used. Residues were separated through Agilent J&W HP-5MS 5% phenyl Methyl Silox;
30m× 250µm, 0.25µmN2 collision gas flow rate: 1.5 ml/min. carrier gas used was He
and He quench gas flow rate: 2.25 ml/min.
Temperature program: Initial temperature 70 °C for 0.06 min followed by 600 °C/min
to 310 °C (10 min hold) and then 20 °C/min to 150 °C (until the end of the analysis).
Oven temperature program: 60 °C for 1.0 min; then 40 °C/min to 120 °C; then 5
°C/min to 300 °C: then 50 °C/min to 280 °C (1.5 min hold).
Results and Discussions
Questionnaire survey
According to the data obtained in the present study, most of the farmers did not have
formal education. Only 22.5% studied up to G. C. E. Ordinary Level and 20% of
farmers studied up to G. C. E. Advanced Level. Among the interviewed farmers,
majority of them (45%) represented the age group between 31 to 50 and 17.5% were
above 50 and others were below 31. Majority of the farmers were engaged in farming
as their main occupation. Annual income varied from Rs.80000 to Rs.400000 and the
majority (65%) represented the income level between Rs.100000 to Rs.200000. 47.5%
of them have below 10 years of experience and 32.5% of them have 10 to 20 years of
experience and remaining have more than 20 years of experience in farming.
During cultivation there was 100% pest attack in their fields and all the farmers were
following chemical control measures. Majority of them (90%) used chemical pesticides
as soon as they observed pests in the field. The study of Nagenthirarajah and
Thiruchelvam (2008) also reported that almost all the farmers in Sri Lanka depended
on chemical pesticides to control pests in their cultivation. Sutharsan et al., (2014) also
revealed that there is a high frequency of chemical pesticide usage in Manmunai south
Proceedings of the 2nd International Symposium on Agriculture (ISA-2019)
Eastern University, Sri Lanka
207
and Eruvil Pattu DS Division.Further the survey stated that majority of the farmers
obtained recommendation from sellers rather than getting through proper channels. The
findings of the present par with findings of Kumarapeli (2006) which suggested that
farmers ignore technical recommendations and they apply pesticides based on their
own experience. 90% of the farmers in study area use high dosages of pesticide than
the recommendation to dilute with water (Sutharsan et al., 2014).
Study shows that few okra farmers were maintained the proper pre harvesting intervals
where majority ignored it. Chandra et al, (2010) recorded that some of the pesticides
used in the country by farmers do not maintain proper pre-harvest interval after last
application. Agnihotri, (1999) stated that repeated application of wide range of
pesticides may lead to undesirable residues on crop produce. During the pre-harvest
interval, the pesticide may be broken down in the plant, or on its surface. Sun, rain and
warm temperatures may affect on this breaking down process of pesticide in plant or on
its surface.
The survey also pointed out thatcocktailed pesticides were used by 75% of farmers in
the study area. According to Sutharsan et al., 2014 majority of (91%) the farmers
applied cocktailed pesticides. It is obvious that indiscriminate application of pesticides
and use of incorrect pesticide mixtures can cause many problems to the human health
(Kumarapeli, 2006; Lakshani et al., 2017). Although the majority (70%) of the farmers
well aware about safety measures while applying insecticides viz., wind direction and
safety clothes, 30% of them ignorant to the safety measures and imprecisely handling
the toxic insecticides.
The survey also revealed that the restricted pesticide, Diazinon in Sri Lanka
(Anonymous, 2016) was used by 15% of the farmers, which is totally an unethical in
cultivation. Their frequent pesticides were Acetamprid, Diazinon, Abamectin,
Profenofos and Etofenporx, It was observed from the survey that most of the pesticides
used by the farmers are not recommended for okra, which clearly showed that the
farmers had lack of knowledge about the relevant pest and on which the pesticides have
been recommended. Khan et al., (2006) reported that the 90% of vegetable growers
were found with lack of knowledge regarding the recommended doses, pre harvest
intervals and the harmful effects of these chemicals on human health.
Pesticide residues in okra samples
The GC/MS/MS analysis showed that there were negligible amount or no pesticide
residues of tested pesticides viz., Dimethoate, Carbofuran, Diazinon, Chlorothalonil,
Metalaxyl, Malathion, Fenthion, Chloropyrifos, Isoprothiolane, Thiamethoxam,
Flutolanil, Profenofos, Oxadixyl, Bifenthrin, Phosalone, Pyraclostrobin,
Difenoconazole I, Difenoconazole II, Dimethomorph 1 and Dimethomorph2 were
found in okra farmer field samples collected at Manmunai south and Eruvil pattu DS
division and Poratheevu Pattu DS division and also in 9 market samples in Batticaloa
district. From them Chlorothalonil, Carbofuran, Malathion, Thiamethoxam, Phosalone
and Pyraclostrobin were not in recovery study for okra matrix.
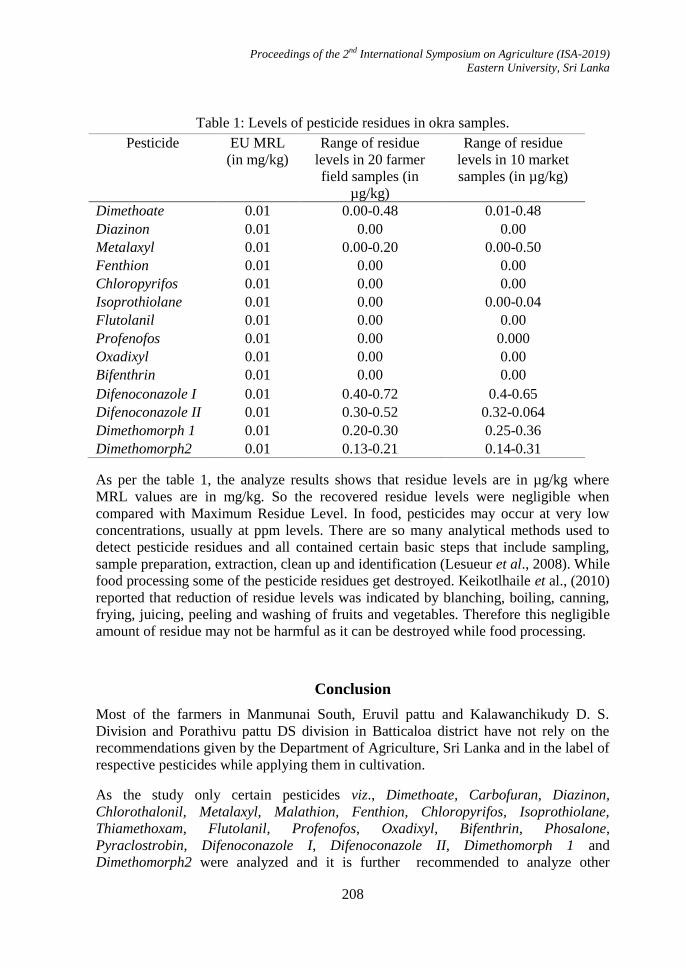
Proceedings of the 2nd International Symposium on Agriculture (ISA-2019)
Eastern University, Sri Lanka
208
Table 1: Levels of pesticide residues in okra samples.
Pesticide EU MRL
(in mg/kg)
Range of residue
levels in 20 farmer
field samples (in
µg/kg)
Range of residue
levels in 10 market
samples (in µg/kg)
Dimethoate 0.01 0.00-0.48 0.01-0.48
Diazinon 0.01 0.00 0.00
Metalaxyl 0.01 0.00-0.20 0.00-0.50
Fenthion 0.01 0.00 0.00
Chloropyrifos 0.01 0.00 0.00
Isoprothiolane 0.01 0.00 0.00-0.04
Flutolanil 0.01 0.00 0.00
Profenofos 0.01 0.00 0.000
Oxadixyl 0.01 0.00 0.00
Bifenthrin 0.01 0.00 0.00
Difenoconazole I 0.01 0.40-0.72 0.4-0.65
Difenoconazole II 0.01 0.30-0.52 0.32-0.064
Dimethomorph 1 0.01 0.20-0.30 0.25-0.36
Dimethomorph2 0.01 0.13-0.21 0.14-0.31
As per the table 1, the analyze results shows that residue levels are in µg/kg where
MRL values are in mg/kg. So the recovered residue levels were negligible when
compared with Maximum Residue Level. In food, pesticides may occur at very low
concentrations, usually at ppm levels. There are so many analytical methods used to
detect pesticide residues and all contained certain basic steps that include sampling,
sample preparation, extraction, clean up and identification (Lesueur et al., 2008). While
food processing some of the pesticide residues get destroyed. Keikotlhaile et al., (2010)
reported that reduction of residue levels was indicated by blanching, boiling, canning,
frying, juicing, peeling and washing of fruits and vegetables. Therefore this negligible
amount of residue may not be harmful as it can be destroyed while food processing.
Conclusion
Most of the farmers in Manmunai South, Eruvil pattu and Kalawanchikudy D. S.
Division and Porathivu pattu DS division in Batticaloa district have not rely on the
recommendations given by the Department of Agriculture, Sri Lanka and in the label of
respective pesticides while applying them in cultivation.
As the study only certain pesticides viz., Dimethoate, Carbofuran, Diazinon,
Chlorothalonil, Metalaxyl, Malathion, Fenthion, Chloropyrifos, Isoprothiolane,
Thiamethoxam, Flutolanil, Profenofos, Oxadixyl, Bifenthrin, Phosalone,
Pyraclostrobin, Difenoconazole I, Difenoconazole II, Dimethomorph 1 and
Dimethomorph2 were analyzed and it is further recommended to analyze other
Proceedings of the 2nd International Symposium on Agriculture (ISA-2019)
Eastern University, Sri Lanka
209
pesticides namely, Acetamprid, Diazinon, Abamectin, and Etofenoprox, which are
highly available in the Batticaloa district.The study stated that the okra is not 100%
free from pesticide residues that were subjected to the present study and some of other
pesticides are needed to be tested.
Acknowledgement
Authors are thankful to the Academic and non-academic staff in Faculty of
Agriculture, Eastern University Sri Lanka and all the staff in food laboratory of
Government Analyst‟s Department of Sri Lanka. Also thanks for the Agriculture
Instructors in Batticaloa District for their tremendous support given throughout the
questionnaire survey and sample collection period.
References
Agnihortri, N. P. (1999). Pesticide safety evaluation and monitoring. All India
Coordinated Research Project (AICRP) on pesticide residues divisions of
agricultural chemicals. Indian Agricultural Research Institute, New Delhi, India,
132-146.
Anonymous (2016). Performance report, 2016 . Peradeniya, Department of
Agriculture, Sri Lanka.
AOACofficial method 2007.01, (2010) pesticide residues in food by acetonitrile
extraction and partitioning with magnesium sulfate.AOAC Official Methods of
Analysis,90(2): 17- 26.
Chandra, S., Mahindrakar, A. N. and Shinde, L. P. (2010). Climate-Data-Org [online]
Available at http://en.climate-data.org/asia/sri-lanka/eastern/batticaloa-
1061571/?amp=true (Accessed on 19th December, 2018). International Journal of
ChemTech Research,2(2): 908-911.
Keikotlhaile, B.M., Spanoghe, P. and Steurbaut, W. (2010) Effects of food processing
on pesticide residues in fruits and vegetables: A meta-analysis approach, Food and
Chemical Toxicology,48: 1–6.
Khan, B. A., AbidFarid, Khan, N., Rasul, K. and Perveen, K. (2006). Survey of
pesticide use on fruits and vegetables in District Peshawar. Sarhad Journal of
Agriculture, 22(3): 497-501.
Kumarapeli, C. P. (2006). Farmers preference for agro-chemicals used for food crops.
Sri Jayewardenepura University of Sri Lanka, 23-46
Lakshani, P. W., Rajapaksha, K. M. and Sendthuran, K. (2017). Pesticide residues in
selected vegetables in several growing areas by gc/ms/using quechers technique.
Annals of Sri Lanka Department of Agriculture, 19(2): 188-208.
Proceedings of the 2nd International Symposium on Agriculture (ISA-2019)
Eastern University, Sri Lanka
210
Lesueur, C., Knittl, P., Gartner, M., Mentler, A. and Fuerhacker, M. (2008). Analysis
of 140 pesticides from conventional farming foodstuff samples after extraction
with the modified QuECheRS method. Food Control, 19(9): 906–914.
Nagenthirarajah, S. and Thiruchelvam, S. (2008). Knowledge of farmers about pest
management practices in Pambaimadu, Vavuniya district: an orders probitmodel
approach. Sabaragamuwa University Journal,8(1): 79-78.
SANCO, (2015). Guidance document on analytical quality control and method
validation procedures for pesticides residues analysis in food and feed. European
commission. SANTE/11945/2015, 3-42.
Sheikh, S. A., Nizamani, S. M., Panhwar, A. A. and Mirani, B. N. (2013). Monitoring
of pesticide residues in vegetables collected from markets of sindh, pakistan. Food
Science And Technology, 19(2): 188-208.
Sutharsan, S., Sivakumar, K. and Srikrishnah, S. (2014). Pesticide usage pattern for
vegetable cultivation in Manmunai South & Eruvil Pattu Divisional Secretariat
Division of Batticaloa district, Sri Lanka. International Journal Of Agriculture
Research Innovation And Technology, 4(1): 53-56.
WHO, (2018).Pesticide-residues-in-food [online] Available at https://www.who.int/
news-room/fact-sheets/detail/pesticide-residues-in-food (20th December, 2018).
Proceedings of the 2nd International Symposium on Agriculture (ISA-2019)
Eastern University, Sri Lanka
211
ALTERNATIVE OPTIONS FOR SYNTHETIC FUNGICIDE FOR
TREATING SEEDS OF CHILLI (Capsicum annuum L.)
D. G. Bawani Malsha and K. Prasannath*
Department of Agricultural Biology, Faculty of Agriculture, Eastern University, Sri Lanka
*Corresponding author: [email protected]
Abstract
Seed borne pathogens can cause ample damage to seeds and seedlings of chilli.
Currently, farmers treat chilli seeds with synthetic fungicides to control fungal
diseases. Therefore, developing alternative fungicidal approaches is crucial to avoid the
detrimental effects of synthetic fungicides. Therefore, the present investigation was
undertaken to evaluate different seed treatment methods for chilli cv. PC-1. The
experiments were laid out in completely randomized design. Four treatments namely,
5% clorox for 40 min soaking period, 20% bougainvillea leaf extract for 24 h soaking
period), captan synthetic fungicide (4 g/kg of seeds) and also water as control treatment
were replicated five times in both laboratory and potexperiments. Data were recorded
for seed germination percentage and number of days taken to germinate 50% of seeds
during petri dish method of seed germination. Total number of viable microorganisms
present in seeds was also counted using serial dilution plate technique. Disease
incidence percentage, leaf area, seedling length and seedling vigour index were
measured during the pot experiment. Data were statistically analysed at 5% significant
level. Among the seed treatments tested, clorox was found to be as significantly-
efficient as captan in improving germination percentage. There were no significant
differences between clorox and bougainvillea leaf extract in germination percentage
and number of days taken to germinate 50% of seeds. Significantly least total count of
viable microorganisms was recorded in both captan and clorox treated seeds. Results of
pot experiment revealed that seedling characters viz. seedling length and leaf area were
significantly greatest in captan treatment followed by clorox. Seedling vigour index
and disease incidence percentage were significantly highest in both captan and clorox
treatments. However, bougainvillea leaf extract seemed to be less effective for seed
treatment of chilli. Clorox has proved to be a good seed treatment agent in controlling
seed borne fungal pathogens as equally-capable as captan fungicide. Therefore, clorox
could be recommended as seed treatment agent for chilli instead of using captan
fungicide to control seed borne fungal diseases.
Keywords: Bougainvillea leaf extract, Captan, Chilli, Clorox, Seed treatment
Introduction
Chilli (Capsicum annuum L.) is considered as one of the commercially grown universal
spice crops. It has become an essential ingredient in Sri Lankan meal. In case of Sri
Lanka in 2015 production was 62,866 Mt and extent was 13,029 ha. Average annual
production is 30,000 Mt (Department of Agriculture, Sri Lanka, 2015). Per capita

Proceedings of the 2nd International Symposium on Agriculture (ISA-2019)
Eastern University, Sri Lanka
212
consumption of chilli in the form of dry chilli is estimated 2.84 kg per annum and the
national annual requirement of dry chilli is around 57,400 Mt. Chilli is cultivated in
large scale in the dry zone especially in north central province and the intermediate
zone. At present, major chilli growing districts are Anuradhapura, Moneragala,
Ampara, Puttlam, Vavuniya, Kurunegala and Hambantota.Chilli suffers from many
diseases caused by fungi, bacteria, viruses, nematodes and also abiotic stresses. Fungal
diseases play a vital role in reducing the germination of chilli. Among the fungal
diseases; damping off, anthracnose, powdery mildew and leaf spots are the most
prevalent ones. The fungi Fusarium oxysporum, Sclerotium rolfsii and Rhizoctonia
solani are soil inhibiting pathogens with wide host range. Anthracnose is a seed borne
disease caused by Colletotrichum capsici, limiting the profitable cultivation
(Choudhary et al., 2013).
The effect of certain plant extracts on the management of some diseases of chilli such
as die back, fruit rot, anthracnose were identified. At present synthetic fungicides are
commonly being used to control these diseases. But the practice is highly risk for
public health as the green fruit is eaten with or without cooking. These toxic chemicals
directly enter into human tissue, get deposited and at critical concentration cause
serious health disorder. This realization emphasizes the importance of finding materials
and products, which are safe for human health as well as environment. Therefore, use
of plant and natural products may guarantee for safe and healthy production of chilli.
The phytochemicals present in bougainvillea leaf extracts are responsible for
antimicrobial activity of the leaf extract (Umamaheswari et al., 2008).
Seed treatment is a process of treating seeds by any physical, chemical, biological or
other agents to destroy harmful seed – borne organisms or to protect the seeds against
infection. It is done to prevent germination failure and seedling infection, to destroy
external and internal seed borne pathogens and to develop protective zone around the
seed in the soil which protects the germinating seeds and seedlings from the attack of
certain soil borne pathogens (Alam et al., 2014). To increase the production of chilli
qualitatively and quantitatively, farmer requires healthy and quality seeds with high
percentage of germination and purity. Another adverse effect of seed borne pathogen is
it will contaminate the areas which were disease free previously. So it necessitates the
eradication of seed borne inoculums through various seed treatments. Hence, the
present investigation was undertaken to evaluate the effects of seed treatments with
chemicals and botanicals on the prevalence of major seed borne fungi, germination
percentage, seedling health and vigour of chilli. The objectives of the present study
were to identify alternative options for synthetic fungicidal seed treatment to remove
the seed borne fungal pathogens of chilli and determine the effects of seed treatments
on seedling performance of chilli plants.
Materials and Methods
The experiments were conducted at the microbiology laboratory and the plant house of
the Department of Agricultural Biology, Faculty of Agriculture, Eastern University, Sri
Proceedings of the 2nd International Symposium on Agriculture (ISA-2019)
Eastern University, Sri Lanka
213
Lanka to evaluate different seed treatments for chilli. PC-1 variety was used for this
study as it is the most cultivated chilli variety in Batticaloa district.Bougainvillea leaf
aqueous extract, clorox (commercial bleach solution), captan fungicide and water were
used as seed treatment agents in the present study. Preliminary experiments were
conducted to determine the best concentration and soaking period of bougainvillea
plant leaf extract and clorox solution.
Evaluation of different seed treatments in laboratory experiment
Chilli seeds were undergone the following four seed treatments and each treatment was
replicated five times. Each replicate had 20 seeds in a petri dish.
Treatment 1 - 5% Clorox solution for 40 min soaking period
Treatment 2 - 20% Bougainvillea leaf extract for 24 h soaking period
Treatment 3 - Captan (4 g/kg of seeds)
Treatment 4 - Water (Control treatment)
Captan treatment was done according to the recommendation of the Department of
Agriculture, Sri Lanka. Germination percentage of the treated seeds was determined by
petri dish method. The treated seeds were placed on sterilized filter paper kept inside a
sterilized petri dish and incubated at the room temperature till germination of seeds.
Data collected include number of days taken to germinate 50% of seeds and the
germination percentage after 14 days. One gram of seeds from each treatment was
taken for serial dilution plate technique to count the total number of viable
microorganisms as colony forming unit (CFU) present in the seeds.
Evaluation of different seed treatments in pot experiment
This experiment was conducted using plastic pots having the height and diameter of 25
cm and 30 cm respectively. The pots were filled with top soil thoroughly mixed with
compost. The same four seed treatments were tested for their efficacy in the pot
experiment as well. Four seeds were directly sown in each pot after the respective seed
treatment and the pots were kept in the plant house. The experiment was laid out in the
completely randomized design with five replications. The following parameters were
measured at transplanting stage:
a) Disease incidence
Damping off and wilting are most common diseases in seedling which are in
transplanting stage. Number of seedlings suffered by the diseases was
recorded.
b) Seedling length
The length of the chilli seedlings was measured at transplanting stage. Two
plants were randomly selected from each replicate for the measurement of
seedling length.

Proceedings of the 2nd International Symposium on Agriculture (ISA-2019)
Eastern University, Sri Lanka
214
c) Leaf area
Two plants were randomly selected from each replicate of the treatments.
Chilli seedlings were uprooted from the pots and the leaves were cut from the
base of the petiole. The total leaf area of each chilli seedling was measured by
a leaf area meter (Model: LI-3100C).
d) Seedling vigour index
It was calculated by the formula as suggested by Abdul Baki and Anderson
(1973) and expressed in whole number.
Seedling vigour index = Germination % x Mean seedling length (cm)
Significance of treatment effects on the measured variables were determined by
analysis of variance using SAS 9.1 software. Treatment means were compared using
Duncan Multiple Range Test at p=0.05.
Results and Discussion
Evaluation of different seed treatments in laboratory experiment
1. Germination percentage of chilli seeds
It was observed that germination percentage of chilli seeds was significantly (p<0.05)
influenced by the treatments (Figure 01). Captan and clorox treatments showed highest
germination percentages without significant difference between them. The lowest
germination was recorded in untreated (water) seeds because of presence of seed borne
microflora.
Bars indicate the mean values of five replicates.
Mean values with similar letter are not significant at p=0.05.
Figure 1: Germination percentage of chilli seeds under different treatments
This study might reflect the effect of seed borne microbes on germination of chilli
seeds. Among the treatments, captan and clorox were most effective which improved
germination of chilli seeds by minimizing infection of the pathogens. This was in
confirmation with the findings of Hedge (1998) reporting that seed treatment of chilli
with captan and thiram reduced the seedling damping off to maximum extent and thus
abb
a
c
0
20
40
60
80
100
Clororx Bougainvillea
leaf extract
Captan Water
Ger
min
atio
n
per
centa
ge
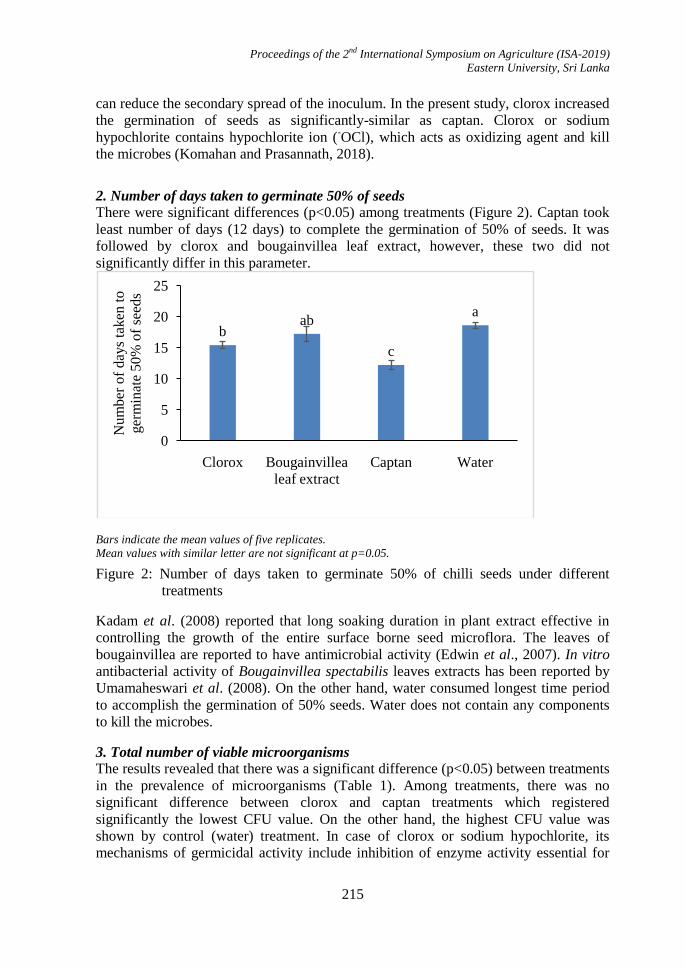
Proceedings of the 2nd International Symposium on Agriculture (ISA-2019)
Eastern University, Sri Lanka
215
can reduce the secondary spread of the inoculum. In the present study, clorox increased
the germination of seeds as significantly-similar as captan. Clorox or sodium
hypochlorite contains hypochlorite ion (-OCl), which acts as oxidizing agent and kill
the microbes (Komahan and Prasannath, 2018).
2. Number of days taken to germinate 50% of seeds
There were significant differences (p<0.05) among treatments (Figure 2). Captan took
least number of days (12 days) to complete the germination of 50% of seeds. It was
followed by clorox and bougainvillea leaf extract, however, these two did not
significantly differ in this parameter.
Bars indicate the mean values of five replicates.
Mean values with similar letter are not significant at p=0.05.
Figure 2: Number of days taken to germinate 50% of chilli seeds under different
treatments
Kadam et al. (2008) reported that long soaking duration in plant extract effective in
controlling the growth of the entire surface borne seed microflora. The leaves of
bougainvillea are reported to have antimicrobial activity (Edwin et al., 2007). In vitro
antibacterial activity of Bougainvillea spectabilis leaves extracts has been reported by
Umamaheswari et al. (2008). On the other hand, water consumed longest time period
to accomplish the germination of 50% seeds. Water does not contain any components
to kill the microbes.
3. Total number of viable microorganisms
The results revealed that there was a significant difference (p<0.05) between treatments
in the prevalence of microorganisms (Table 1). Among treatments, there was no
significant difference between clorox and captan treatments which registered
significantly the lowest CFU value. On the other hand, the highest CFU value was
shown by control (water) treatment. In case of clorox or sodium hypochlorite, its
mechanisms of germicidal activity include inhibition of enzyme activity essential for
bab
c
a
0
5
10
15
20
25
Clorox Bougainvillea
leaf extract
Captan Water
Num
ber
of
day
s ta
ken
to
ger
min
ate
50%
of
seed
s

Proceedings of the 2nd International Symposium on Agriculture (ISA-2019)
Eastern University, Sri Lanka
216
the growth, damage to the membrane and DNA, and perhaps an injury to membrane
transport capacity (Fukuzaki, 2006).
Table 1: Prevalence of microorganisms in chilli seeds under different treatments
Mean values with similar letter are not significant at p=0.05
Evaluation of different seed treatments in pot experiment
1. Disease incidence of chilli seedlings under different treatments
Table 2 shows that the disease incidence of chilli seedlings was significantly (p<0.05)
influenced by the treatments. Results indicated that the disease incidence was
significantly reduced by clorox as equally-capable as captan fungicide. Commonly
observed disease was pre-emergence damping off. Seed borne fungi are responsible for
poor vigour and low seedling emergence in the nursey. The seedling emergence in seed
sample could have been low due to proliferation of pathogenic fungal species on
germinating seedlings and resulting in seed and seedling death (Singh and Maheshwari,
2002). Better results from the bougainvillea leaf extract could have been achieved if
leaves were extracted using organic solvents (Krishna et al., 1997).
2. Seedling length of chilli seedlings under different treatments
Table 2 shows that there was a significant difference (p<0.05) between treatments in
the seedling length. Significantly highest shoot length was noticed in captan treated
seeds as compared with other treatments. Captan was followed by clorox and
bougainvillea leaf extract, however, the last two did not significantly differ in seedling
length. Meanwhile, water treatment gave the lowest seedling length. Similar findings
were noticed by Mathur et al. (1975) who reported that sowing seeds infected by fungi,
showed shoots appearing highly blighted and shoots length was greatly affected.
3. Leaf area of chilli seedlings under different treatments
Table 2 shows that highest leaf area was given by captan treatment as it promoted the
growth of seedlings by preventing them from pathogenic infections. On the other hand,
the lowest leaf area was recorded by water treatment. Clorox and bougainvillea leaf
extract were not significantly different in leaf area of seedlings.
4. Seedling vigour index of chilli seedlingsunder different treatments
Clorox and captan significantly (p<0.05) enhanced the seedling vigour index compared
to the other treatments (Table 2). Both treatments were equally efficient in improving
seedling vigour. There was no significant difference between bougainvillea leaf extract
and water in seedling vigour index. Common and dominant seed borne fungi were
Treatment CFU / g of seeds
T1 1.52 x 10⁹ c
T2 3.26 x 10⁹ b
T3 1.18 x 10⁹ c
T4 1.02 x 10¹⁰
a

Proceedings of the 2nd International Symposium on Agriculture (ISA-2019)
Eastern University, Sri Lanka
217
found to be inhibitory for seed germination and caused great loss in seedling vigour
(Pathania and Chandel, 2004; Telang, 2010).
Table 2: Effects of different seed treatments on disease incidence, seedling length, leaf
area and seedling vigour index of chilli seedlings
Treatment Disease
Incidence (%)
Seedling
Length
(cm)
Leaf Area
(cm2)
Seedling
Vigour Index
T1 16.3 b 3.3 b 1.22 b 369.2 a
T2 28.8 a 3.7 b 0.88 b 207.2 b
T3 13.8 b 6.9 a 2.13 a 458.8 a
T4 30.0 a 2.3 c 0.04 c 129.6 b Mean values with similar letter are not significant at p=0.05.
Conclusion
The results of the study revealed that seed treatment with clorox which is generally
regarded as safe was found to be equally efficient in comparison to Captan fungicide.
Hence, clorox would be helpful in preventing germination failure and producing
healthy seedling with good vigour. However, bougainvillea leaf extract did not exhibit
a significant effect on seed treatment of chilli. Therefore, it could be concluded that
clorox would be an alternative option for synthetic fungicides as a seed treatment agent
for chilli.
References
Abdul Baki, A. and Anderson, J. (1973).Vigour Determination by Multiple Criteria.
CropScience, 13(6), 630-637.
Alam, M., Hamim, I., Ali, M. and Asrafuzzaman, M. (2014). Effect of Seed Treatment
on Seedling Healthof Chili. Journal of Environment Science. & Natural Resource,
7(1), 177-181.
Choudhary, C.S., Jain, C., Ritesh, K. and Jaipal, C. (2013). Efficacy of different
fungicides, biocides and botanical extract seed treatment for controlling seed-borne
Colletotrichum spp. in chilli (Capsicum annuum), Bioscan. 8, 123-126.
Department of Agriculture. (2015). Chilli. [Online] Available: https://www.doa.gov.lk/
FCRDI/index.php/en/crop/34-chilli (25th August, 2018).
Edwin, E., Sheeja, E., Tiwari, E., Rajeswar Dutt, V. and Kunduri. (2007). Anti-
diarrhoeal, anti-ulcer and antimicrobial activities of leaves of Bougainvillea glabra
Choisy. Ars Pharmaceutica, 48, 135-144.
Proceedings of the 2nd International Symposium on Agriculture (ISA-2019)
Eastern University, Sri Lanka
218
Fukuzaki, S. (2006). Mechanisms of Actions of Sodium Hypochlorite in Cleaning and
Disinfection Processes. Biocontrol Science, 11(4), 147-157.
Hegde, G.M. (1998). Studies on fruit rot of chilli (Capsicum annuum L.) caused by
Colletotrichum capsici (Sydow.) Butler and Bisby. M.Sc.(Agri.) Thesis, Univ.
Agric. Sci., Dharwad.
Kadam, R., Dhavle, S., Allapure, R. and Nagpurne, V. (2008). Protection of pathogenic
seed borne fungi of groundnut by using leaf extract of Azadirachta
indica.International Journal of Plant Protection, 1, 110-111.
Komahan, D.H.S. and Prasannath, K. (2018). Response of Selected Tomato
Germplasm to Different Seed Treatment Methods (Commercial Bleach; Chlorox®
and Commercial Fungicide; Thiram) in Control of Damping-off Disease. Scholars
Journal of Agriculture and Veterinary Sciences, 5(8), 430-434.
Krishna, K.T., C.E. Ranjini and V.K. Sasidharan, (1997). Antibacterial and antifungal
activity of secondary metabolities from some medicinal and other common plant
species. Journal Life Sciences, 2: 14-19.
Mathur, S.K., Mathur, S.B. and Neergaard, P. (1975). Detection of seed-borne fungi in
sorghum and location of Fusarium moniliforme in the seed. Seed Sci. Technol., 3,
683-690.
Pathania, N. and Chandel, S. (2004). Evaluation of Seed Health and Germination of
Bell Pepper. Journal of Mycology and Plant Pathology, 34(2), 368-369.
Singh, D. and Maheshwari, V.K. (2002). Health status of chilli seeds in India and its
impact on germination and seedling vigour. Seed Res, 30(1), 128- 133.
Telang, S. (2010). Effect of Extracts of various Plants Parts on Seed Mycroflora and
Seed Germination of Tomato. Asian Science, 5(1), 15-18.
Umamaheswari, A., Shreevidya, R. and Aparna Nuni. (2008). In vitro Antibacterial
Activity of Bougainvillea spectabilis Leaves Extracts. Advances in Biological
Research, 2(12), 01-05.
Proceedings of the 2nd International Symposium on Agriculture (ISA-2019)
Eastern University, Sri Lanka
219
BIO EFFICACY OF PRE-PLANT HERBICIDE:TIAFENACIL 50g/LME
R.M.U.S.Bandara1*
, H.A.S.N. Hettiarachchi2, Y.M.S.H.I.U. De Silva
1, H.M.M.K.K.H.
Dissanayaka1, W.M.U.B. Wickrama
1, M.R.A.B. Madduma
1, P.R.T.E.W.M.R.B.
Ekanayake3 J.D.H.E. Jayasinghe
3, M.M. Kumarage
2 and K.M.C.R. Bandara
2
1Rice Research and Development Institute, Batalagoda, Ibbagamuwa, Sri Lanka 2 Agriculture Research Station, Seetha Eliya
3Lankem Ceylon PLC, Sri Sangaraja Mawatha, Colombo, Sri Lanka
* Corresponding Author: [email protected]
Abstract
Glyphosate and Glufosinate ammonium are the two non-selective herbicides
recommended by the Department of Agriculture (DOA), Sri Lanka for control weeds in
lands. Government imposed banned glyphosate and restricted glufosinate ammonium
in recent past due to many reasons such as toxicity profile of pesticides, chronic kidney
disease (CKDU) developed in North Central region of Sri Lanka, new government
regulations, etc. Recently, Tiafenacil 50 g/l ME has been granted approval for testing in
Paddy and Non crop land to address the issue of weed management as a non-selective
weedicide. A field experiment was conducted adopting RCB Design with three
replicates during the month of July 2018 at four different locations namely Manapaha,
Mukalanyaya, Maha Illuppallama and Seetha Eliya, Sri Lanka in order to evaluate bio
efficacy of pre-plant herbicide; Tiafenacil 50 g/l ME and to find out the most suitable
dosage to be used in paddy and non-crop lands. All data were analyzed using SAS
Statistical software. Two dosage of 3.125 l/ha (T3) and 3.75 l/ha (T4) control weeds in
-low land and high land satisfactorily. However, the rates could be reduced to 2. 5 l/ ha
(T2) under lowland conditions (paddy) and increased under high land (Non crop)
condition 5l/ ha (T6). Under highland conditions, increasing the rate from 3.75 l/ha
(T4) to 5 l/ha (T6), WCE will increase by 9%.Therefore, Tiafenacil 5% ME
formulation at 187.5 - 250g a.i. /ha (3750-5000 ml/ ha) could be selected to control
weeds in highlands whereas Tiafenacil 5% ME formulation at 125 - 156.25 g a.i./ ha
(2500 - 3125ml/ ha) could be effectively used to control weeds in lowlands.
Keywords: Bio efficacy, Quadrate, Pre-plant herbicide, Tiafenacil 50% ME, Herbicide
testing
Introduction
Glyphosate and Paraquat like total weed killers have been banned in Sri Lanka in the
past. Since then, most of the agricultural sectors; especially paddy, tea and other field
crop cultivations had to find solutions to control weeds. However, most of the methods
used currently are highly labor required, high time consuming and highly expensive.
Therefore, to address the issue a total weed killer is highly required at the moment.
Tiafenacil 5% ME is a broad spectrum, non-selective weed killer with newly invented
mode of action. (Inhibiting PPO (Protoporphyrinogen IX oxidase) in Plants) This study
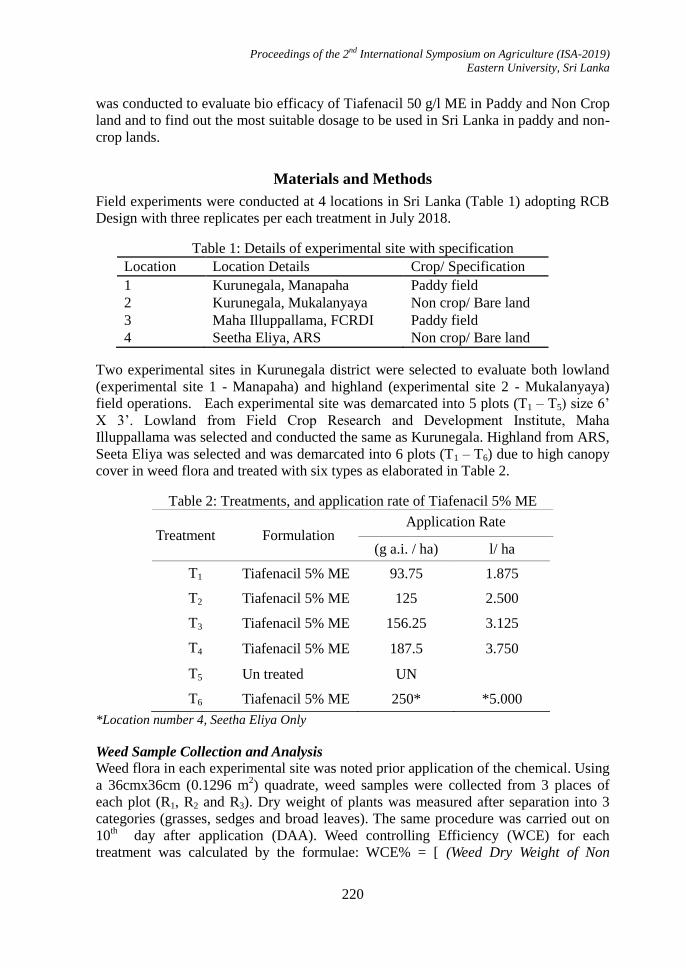
Proceedings of the 2nd International Symposium on Agriculture (ISA-2019)
Eastern University, Sri Lanka
220
was conducted to evaluate bio efficacy of Tiafenacil 50 g/l ME in Paddy and Non Crop
land and to find out the most suitable dosage to be used in Sri Lanka in paddy and non-
crop lands.
Materials and Methods
Field experiments were conducted at 4 locations in Sri Lanka (Table 1) adopting RCB
Design with three replicates per each treatment in July 2018.
Table 1: Details of experimental site with specification
Location Location Details Crop/ Specification
1 Kurunegala, Manapaha Paddy field
2 Kurunegala, Mukalanyaya Non crop/ Bare land
3 Maha Illuppallama, FCRDI Paddy field
4 Seetha Eliya, ARS Non crop/ Bare land
Two experimental sites in Kurunegala district were selected to evaluate both lowland
(experimental site 1 - Manapaha) and highland (experimental site 2 - Mukalanyaya)
field operations. Each experimental site was demarcated into 5 plots (T1 – T5) size 6‟
X 3‟. Lowland from Field Crop Research and Development Institute, Maha
Illuppallama was selected and conducted the same as Kurunegala. Highland from ARS,
Seeta Eliya was selected and was demarcated into 6 plots (T1 – T6) due to high canopy
cover in weed flora and treated with six types as elaborated in Table 2.
Table 2: Treatments, and application rate of Tiafenacil 5% ME
Treatment Formulation Application Rate
(g a.i. / ha) l/ ha
T1 Tiafenacil 5% ME 93.75 1.875
T2 Tiafenacil 5% ME 125 2.500
T3 Tiafenacil 5% ME 156.25 3.125
T4 Tiafenacil 5% ME 187.5 3.750
T5 Un treated UN
T6 Tiafenacil 5% ME 250* *5.000
*Location number 4, Seetha Eliya Only
Weed Sample Collection and Analysis
Weed flora in each experimental site was noted prior application of the chemical. Using
a 36cmx36cm (0.1296 m2) quadrate, weed samples were collected from 3 places of
each plot (R1, R2 and R3). Dry weight of plants was measured after separation into 3
categories (grasses, sedges and broad leaves). The same procedure was carried out on
10th day after application (DAA). Weed controlling Efficiency (WCE) for each
treatment was calculated by the formulae: WCE% = [ (Weed Dry Weight of Non
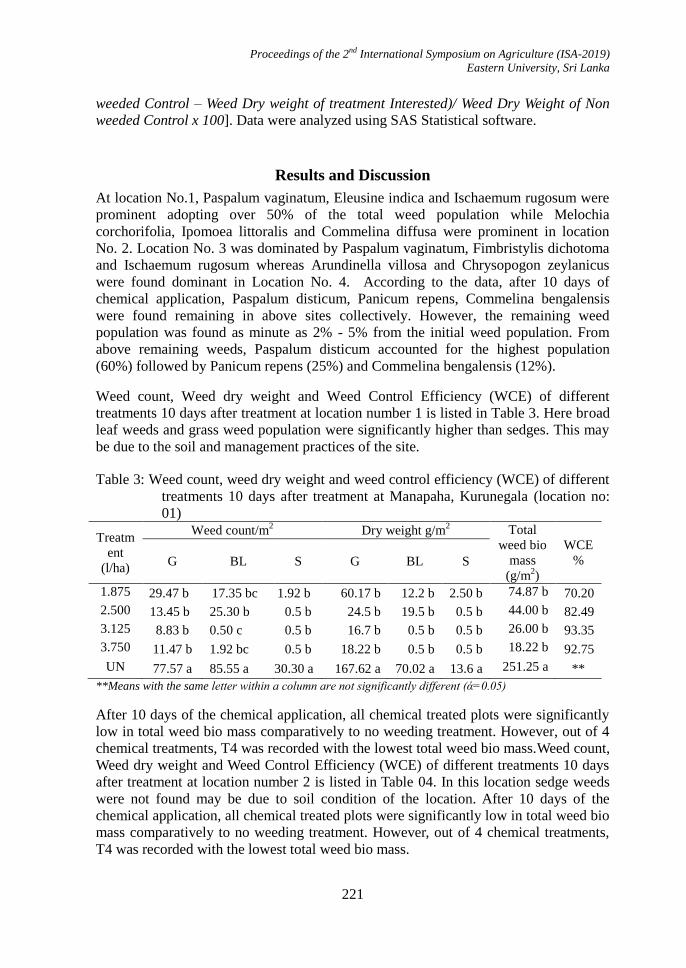
Proceedings of the 2nd International Symposium on Agriculture (ISA-2019)
Eastern University, Sri Lanka
221
weeded Control – Weed Dry weight of treatment Interested)/ Weed Dry Weight of Non
weeded Control x 100]. Data were analyzed using SAS Statistical software.
Results and Discussion
At location No.1, Paspalum vaginatum, Eleusine indica and Ischaemum rugosum were
prominent adopting over 50% of the total weed population while Melochia
corchorifolia, Ipomoea littoralis and Commelina diffusa were prominent in location
No. 2. Location No. 3 was dominated by Paspalum vaginatum, Fimbristylis dichotoma
and Ischaemum rugosum whereas Arundinella villosa and Chrysopogon zeylanicus
were found dominant in Location No. 4. According to the data, after 10 days of
chemical application, Paspalum disticum, Panicum repens, Commelina bengalensis
were found remaining in above sites collectively. However, the remaining weed
population was found as minute as 2% - 5% from the initial weed population. From
above remaining weeds, Paspalum disticum accounted for the highest population
(60%) followed by Panicum repens (25%) and Commelina bengalensis (12%).
Weed count, Weed dry weight and Weed Control Efficiency (WCE) of different
treatments 10 days after treatment at location number 1 is listed in Table 3. Here broad
leaf weeds and grass weed population were significantly higher than sedges. This may
be due to the soil and management practices of the site.
Table 3: Weed count, weed dry weight and weed control efficiency (WCE) of different
treatments 10 days after treatment at Manapaha, Kurunegala (location no:
01)
Treatm
ent
(l/ha)
Weed count/m2 Dry weight g/m
2 Total
weed bio
mass
(g/m2)
WCE
% G BL S G BL S
1.875 29.47 b 17.35 bc 1.92 b 60.17 b 12.2 b 2.50 b 74.87 b 70.20
2.500 13.45 b 25.30 b 0.5 b 24.5 b 19.5 b 0.5 b 44.00 b 82.49
3.125 8.83 b 0.50 c 0.5 b 16.7 b 0.5 b 0.5 b 26.00 b 93.35
3.750 11.47 b 1.92 bc 0.5 b 18.22 b 0.5 b 0.5 b 18.22 b 92.75
UN 77.57 a 85.55 a 30.30 a 167.62 a 70.02 a 13.6 a 251.25 a **
**Means with the same letter within a column are not significantly different (ά=0.05)
After 10 days of the chemical application, all chemical treated plots were significantly
low in total weed bio mass comparatively to no weeding treatment. However, out of 4
chemical treatments, T4 was recorded with the lowest total weed bio mass.Weed count,
Weed dry weight and Weed Control Efficiency (WCE) of different treatments 10 days
after treatment at location number 2 is listed in Table 04. In this location sedge weeds
were not found may be due to soil condition of the location. After 10 days of the
chemical application, all chemical treated plots were significantly low in total weed bio
mass comparatively to no weeding treatment. However, out of 4 chemical treatments,
T4 was recorded with the lowest total weed bio mass.
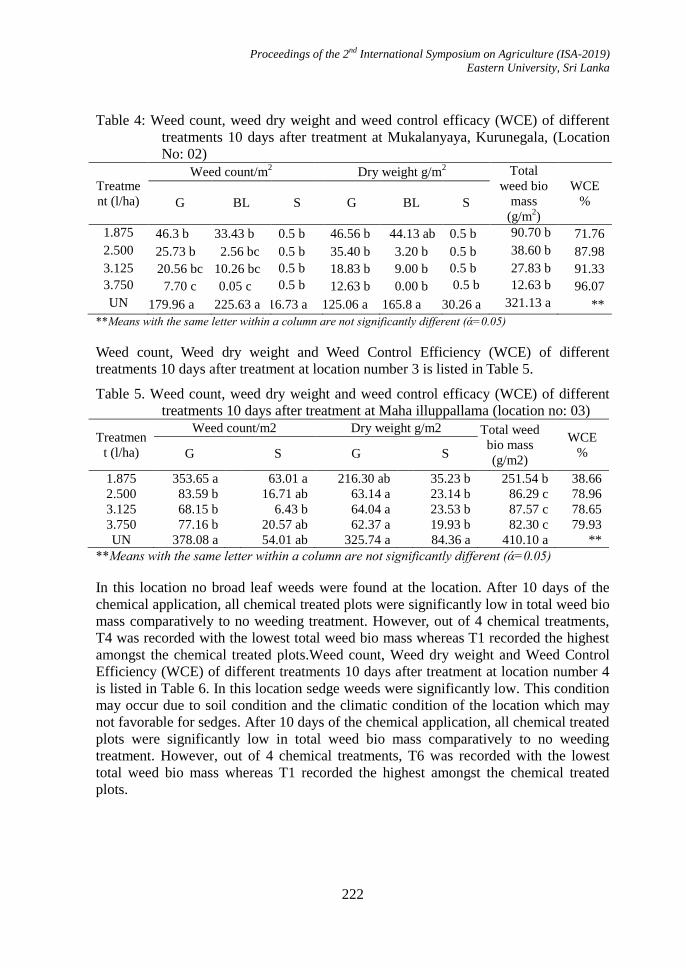
Proceedings of the 2nd International Symposium on Agriculture (ISA-2019)
Eastern University, Sri Lanka
222
Table 4: Weed count, weed dry weight and weed control efficacy (WCE) of different
treatments 10 days after treatment at Mukalanyaya, Kurunegala, (Location
No: 02)
Treatme
nt (l/ha)
Weed count/m2 Dry weight g/m
2 Total
weed bio
mass
(g/m2)
WCE
% G BL S G BL S
1.875 46.3 b 33.43 b 0.5 b 46.56 b 44.13 ab 0.5 b 90.70 b 71.76
2.500 25.73 b 2.56 bc 0.5 b 35.40 b 3.20 b 0.5 b 38.60 b 87.98
3.125 20.56 bc 10.26 bc 0.5 b 18.83 b 9.00 b 0.5 b 27.83 b 91.33
3.750 7.70 c 0.05 c 0.5 b 12.63 b 0.00 b 0.5 b 12.63 b 96.07
UN 179.96 a 225.63 a 16.73 a 125.06 a 165.8 a 30.26 a 321.13 a **
**Means with the same letter within a column are not significantly different (ά=0.05)
Weed count, Weed dry weight and Weed Control Efficiency (WCE) of different
treatments 10 days after treatment at location number 3 is listed in Table 5.
Table 5. Weed count, weed dry weight and weed control efficacy (WCE) of different
treatments 10 days after treatment at Maha illuppallama (location no: 03)
Treatmen
t (l/ha)
Weed count/m2 Dry weight g/m2 Total weed
bio mass
(g/m2)
WCE
% G S G S
1.875 353.65 a 63.01 a 216.30 ab 35.23 b 251.54 b 38.66
2.500 83.59 b 16.71 ab 63.14 a 23.14 b 86.29 c 78.96
3.125 68.15 b 6.43 b 64.04 a 23.53 b 87.57 c 78.65
3.750 77.16 b 20.57 ab 62.37 a 19.93 b 82.30 c 79.93
UN 378.08 a 54.01 ab 325.74 a 84.36 a 410.10 a **
**Means with the same letter within a column are not significantly different (ά=0.05)
In this location no broad leaf weeds were found at the location. After 10 days of the
chemical application, all chemical treated plots were significantly low in total weed bio
mass comparatively to no weeding treatment. However, out of 4 chemical treatments,
T4 was recorded with the lowest total weed bio mass whereas T1 recorded the highest
amongst the chemical treated plots.Weed count, Weed dry weight and Weed Control
Efficiency (WCE) of different treatments 10 days after treatment at location number 4
is listed in Table 6. In this location sedge weeds were significantly low. This condition
may occur due to soil condition and the climatic condition of the location which may
not favorable for sedges. After 10 days of the chemical application, all chemical treated
plots were significantly low in total weed bio mass comparatively to no weeding
treatment. However, out of 4 chemical treatments, T6 was recorded with the lowest
total weed bio mass whereas T1 recorded the highest amongst the chemical treated
plots.

Proceedings of the 2nd International Symposium on Agriculture (ISA-2019)
Eastern University, Sri Lanka
223
Table 6: Weed count, weed dry weight and weed control efficacy (WCE ) 10 days after
treatment of different treatments at Seeta eliya (location no: 04)
Treatmen
t (l/ha)
Weed count/m2 Dry weight g/m
2 Total
weed bio
mass
(g/m2)
WCE
% G BL S G BL S
1.875 66.9ab 7.7ab 0.5b 197.1b 8.5a 0.5 b 205.6b 76
2.500 82.3abc 5.1ab 0.5b 148.9b 7.2a 0.5 b 156.1b 81
3.125 141.4ab 0.0b 0.5b 132.3b 0.0a 0.5 b 132.3b 84
3.750 77.2bc 10.3ab 18.0b 105.3b 7.8a 5.1 b 118.2b 86
5.000 12.9c 12.9ab 0.0 19.1b 29.9a 0.5 b 49.1b 94
UN 254.6a 69.4a 15.4b 740.7a 78.4b 20.9a 840.1a
**Means with the same letter within a column are not significantly different (ά=0.05)
Conclusions
In experimental location 1 and 3 (Paddy/ Low land), 2.5 l/ha (T2), 3.125 l/ ha (T3) and
3.75 l/ ha (T4) showed the better weed control efficacy over 75 % of WCE whereas
1.875 l/ha also showed satisfactory level of weed control at location Manapaha,
Kurunegala (Around 70% of WCE). Two dosage of 3.75 l/ha and 5 l/ha (187.5 g a.i.
/ha and – 250g a.i. /ha) were highly effective to control weeds in highlands Therefore,
Tiafenacil 5% ME formulation at 187.5 - 250g a.i. /ha (3750-5000 ml/ ha) could be
selected to control weeds in highlands whereas Tiafenacil 5% ME formulation at 125 -
156.25 g a.i./ ha (2500 - 3125ml/ ha) could be effectively used to control weeds in
lowlands. Further, It is noted and recommended 156.25 g a. i./ ha (5000 ml/ ha) for
highlands if weed canopy at high stage.
Acknowledgement
Authors are acknowledge staff members and other volunteers who contributed in
numerous ways.
References
Department of Agriculture (2015), Pest Management Recommendations.
Hess, D. and Warren, F. (2002). The Herbicide Handbook of the Weed Science Society
of America, 8th Edition. pp 159-161. Weed Science Society of America,
Westminster, USA.
Proceedings of the 2nd International Symposium on Agriculture (ISA-2019)
Eastern University, Sri Lanka
224
ISOLATION, IDENTIFICATION AND EVALUATION OF MASS
CULTURE MEDIA FOR TRICHODERMA SPP. FROM SRI LANKA
W.M.K. Fernando*1,D.M.J.B. Senanayake
2,R.S. Wilson Wijeratnam
3, C. M.
Nanayakkara4, W.A.R. Dhammika
1 D.C.M.S.I. Wijewardana
1and
W.M.S.D.K.Wijerathne1
1Field Crops Research and Development Institute, Mahailluppallama, Sri Lanka 2Rice Research and Development Institute, Bathalagoda
3Industrial Technology Institute, Colombo 4 Faculty of Sciences, University of Colombo
*Corresponding author: [email protected]
Abstract
Trichoderma spp. are a group of free living microorganisms commonly found in soil
and root zones of plants. Some members of this species are widely and effectively used
as bio control agents against diverse plant pathogens. More than 60% of the registered
fungi-based bio-fungicides developed and in use today are based on Trichoderma spp.
Hence, this study was carried out with the objectives of isolation and identification of
locally available effective Trichoderma spp. and identification of solid state mass
culturing media for the identified Trichoderma isolate. Soil samples were collected
from farmer fields and Trichoderma was isolated and purified. Morphological and
molecular studies of PCR amplification with ITS1/ITS4 universal primers confirmed
the isolated bio control agent as T. asperellum. Seven media namely; sorghum grains,
sweet sorghum grains, cracked maize grains, rice bran, cow dung, rice straw and dried
banana leaves were tested as mass culturing media for identified T. asperellum under
laboratory conditions during 2018. According to the results, sweet sorghum gave
significantly highest conidial yield of 1.02x10⁹cfu/g 17 days after inoculation.
Sorghum grains and cracked maize grains secondly showed better results compared
with other selected media. Among the media used, sweet sorghum can be used as
effective mass culturing media for the isolated Trichoderma asperellum mass
multiplication.
Keywords: Bio-control agent Mass culture media, Trichoderma asperellum
Introduction
Diseases play a major role in reduction of worldwide crop yields and thereby
contributing to loss of farmer income. For the period of 2001-2003 nearly 16% yield
losses occurred globally due to plant diseases (Popp and Hantos, 2011). Though correct
use of fungicides can deliver reduction of disease pressure, there are problems
associated with these pesticides. Hence, less harmful natural (bio) products are
increasingly preferred substitutes to synthetic pesticides. Trichoderma is a widely used
Proceedings of the 2nd International Symposium on Agriculture (ISA-2019)
Eastern University, Sri Lanka
225
bio control agent, which is known to have effective control on diverse plant pathogens
(Kandhelwal et al., 2012).
Trichoderma arefree-living fungi commonly found in soil and root ecosystems. They
are opportunistic, virulent plant symbionts, as well as being parasites of other fungi
(Harman et al., 2004). The ability to parasitically antagonize and kill other fungi
(mycoparasitism) emphasizes the wide spread nature of Trichoderma as a bio control
agent around the world (Atanasova et al., 2013). Other than the mycoparasitism;
spatial and nutrient competition, antibiosis by enzymes and secondary metabolites, and
induction of plant defense system are considered as the major bio-control actions of
these fungi (Verma et al., 2007).
Trichoderma is effective against diverse plant pathogens; Armillaria, Botrytis,
Chondrostereum, Colletotrichum, Dematophora, Diaporthe, Endothia, Fulvia,
Fusarium, Fusicladium, Helminthosporium, Macrophomina, Nectria, Phoma,
Phytophthora, Plasmopara, Pythium, Rhizoctonia, Rhizopus, Sclerotinia, Sclerotium,
Thielaviopsi, Venturia, Verticillium, etc. (Jegathambigai et al., 2009; Wijesinghe et al.,
2010).Ithas a wide species range; T. harzianum, T. atroviride, T. longibrachiatum, T.
asperellum, T. koningiopsis and T. hamatum as common(You et al., 2016). More than
60% of the registered fungus-based bio-fungicides have been developed based on
Trichoderma spp. (Verma et al., 2007). Solid-state fermentation for mass production of
Trichoderma is very common. Rice and wheat straw (Tewari and Chandrabanu, 2003),
sorghum, millets and ragi (Jayaranjan, 2006), rice, corn bran and wheat bran
(Cavalcante et al., 2008), dried banana leaves, rice bran, farmyard manure (Thangavelu
et al., 2003), maize cobs, maize grains, cracked maize grains, sorghum grains, paddy
straw, etc. (Kumar et al., 2009) have been used as solid state media by various
researchers.
The identification of an effective bio control agent and an easy and cheap method of its
mass production are important considerations for the widespread adoption and
commercial application of such bio-pesticides by farmers. Hence, this study was
conducted with the objectives of isolation and identification of locally available
Trichoderma spp. and identification of solid state mass culturing media for the
identified Trichoderma spp.
Materials and methods
Isolation of the bio-control agent
Twenty-three soil samples were collected from onion farmer fields of Anuradhapura,
Mahailluppallama and Matale districts. Trichoderma spp. was isolated from these
samples using multiple tube dilution technique on Potato Dextrose Agar (PDA)
medium. Inoculated plates were incubated at 28°C for 4-5 days and green color single
colonies were selected from mixed colonies and purified by sub culturing. Pure
cultures were incubated at 28 °C for 6-7 days and maintained on PDA slants for further
use.
Proceedings of the 2nd International Symposium on Agriculture (ISA-2019)
Eastern University, Sri Lanka
226
Morphological identification
Morphological observations were done for the purified cultures showing green conidia
forming fungal bodies. Microscopic observations were carried out by slide culture
technique using microscope (Olympus CX 41, Japan).
Confirmation of identity
Luria broth culture was prepared in a 250ml conical flask and 8mm diameter mycelia
disk taken from 7 days old actively growing fungal cultures was placed in luria broth.
Already identified and characterized T. asperellum isolate obtained from Horticulture
Research and Development Institute, Gannoruwa, Peradeniya (Rajapakse et al., 2016)
was taken as the positive sample. Inoculated flasks were incubated in an orbital shaker
at 30 rpm for 7 days at 28 °C temperature. Total genomic DNA was extracted from the
mycelia of the 7 day old broth culture using Cetrimide Tetradecyl Trimethyl
Ammonium Bromide (CTAB) extraction method described by Rajapakse et al. (2016).
PCR amplification was done for the samples with the universal primers; ITS -
1(Forward): 5‟- TCCGTAGGTGAACCTGCGG-3‟ and ITS- 4 (Reverse): 5‟-
TCCTCCGCTTATTGATATGC - 3‟ (White et al., 1990).PCR mix in a total volume of
10µl consisted of 1µl of the template DNA (100ng DNA) with 0.5µl of each primer
(10mM), 0.5µl of 10mM dNTP and 0.2µl of Taq DNA polymerase (5U/ µl), 2µl of 5x
PCR Buffer with loading dye (Promega, USA), 0.8µl of 25mM Mgcl2 and 4.5µl of
sterilized distilled water.
The PCR cycle consisted of steps; an initial denaturation of 5 min at 94°C, followed by
35 cycles of 1min at 94°C, 1 min at 50°C, and 1 min at 72°C, with a final extension of
10 min at 72°C followed by termination of the cycle at 4°C. The PCR was carried out
in ABS Verity thermal cycler (Applied Bio Systems, USA). Amplified products were
analyzed by electrophoresis in 1.0% (wt/vol) agarose gel in 1XTAE buffer stained with
ethidium bromide(0.5 µg/ml) , and photographed over a UV transilluminator. A 100bp
ladder (Promega, USA) was used as the marker.PCR products of the samples were
sequenced (Macrogen, Korea). BLAST (NCBI) was carried out. Similar sequences
were compared with the sequence data obtained in this study using Bio Edit (Version
7.2.5.). A phylogenetic tree was developed using MEGA 6 Software.
Mass culturing of Trichoderma
Mass culturing media were selected considering past research findings, local
availability, easy access and cost effectiveness. Seven different media; sorghum grains
(T1), sweet sorghum grains (T2), cracked maize grains (T3), rice bran (T4), cow dung
(T5), rice straw (T6) and dried banana leaves (T7) were tested as Trichoderma mass
culturing media under laboratory conditions during 2018 at the Field Crops Research
and Development Institute, Mahailluppallama. The experiment was conducted in a
complete randomized block (CRD) design with three repeats. Maize grains were
cracked into pieces using a laboratory grinder. Rice straw and dried banana leaves were
cut into 1-2cm small pieces. Then 50g of each dry media (grains, rice bran, cow dung,
rice straw and dried banana leaves) were taken and put in 500ml conical flasks. Media
were moistened, sterilized at 15 PSI for 20 minutes in an autoclave and cooled to 50-
60°C. 2ml of 2 x 10⁷ CFU/ml suspension of Trichoderma conidia pure culture
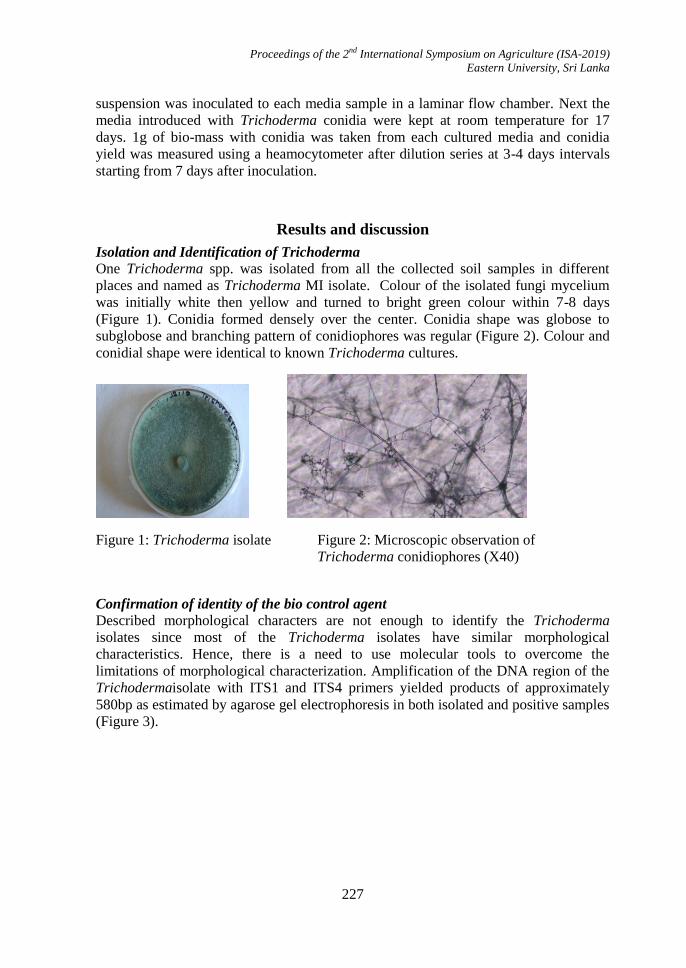
Proceedings of the 2nd International Symposium on Agriculture (ISA-2019)
Eastern University, Sri Lanka
227
suspension was inoculated to each media sample in a laminar flow chamber. Next the
media introduced with Trichoderma conidia were kept at room temperature for 17
days. 1g of bio-mass with conidia was taken from each cultured media and conidia
yield was measured using a heamocytometer after dilution series at 3-4 days intervals
starting from 7 days after inoculation.
Results and discussion
Isolation and Identification of Trichoderma
One Trichoderma spp. was isolated from all the collected soil samples in different
places and named as Trichoderma MI isolate. Colour of the isolated fungi mycelium
was initially white then yellow and turned to bright green colour within 7-8 days
(Figure 1). Conidia formed densely over the center. Conidia shape was globose to
subglobose and branching pattern of conidiophores was regular (Figure 2). Colour and
conidial shape were identical to known Trichoderma cultures.
Figure 1: Trichoderma isolate Figure 2: Microscopic observation of
Trichoderma conidiophores (X40)
Confirmation of identity of the bio control agent
Described morphological characters are not enough to identify the Trichoderma
isolates since most of the Trichoderma isolates have similar morphological
characteristics. Hence, there is a need to use molecular tools to overcome the
limitations of morphological characterization. Amplification of the DNA region of the
Trichodermaisolate with ITS1 and ITS4 primers yielded products of approximately
580bp as estimated by agarose gel electrophoresis in both isolated and positive samples
(Figure 3).
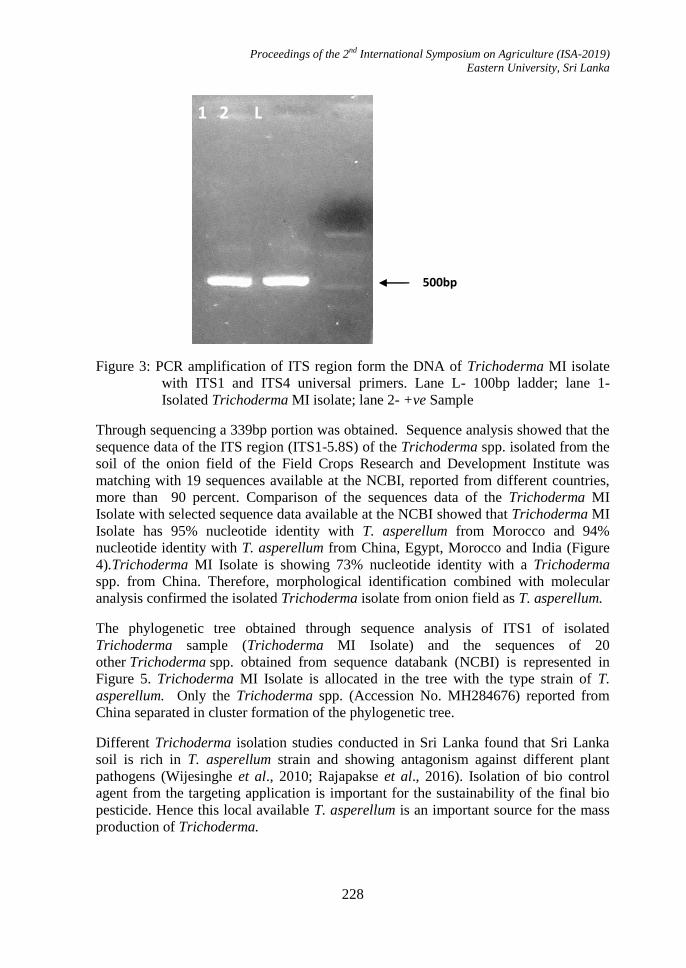
Proceedings of the 2nd International Symposium on Agriculture (ISA-2019)
Eastern University, Sri Lanka
228
Figure 3: PCR amplification of ITS region form the DNA of Trichoderma MI isolate
with ITS1 and ITS4 universal primers. Lane L- 100bp ladder; lane 1-
Isolated Trichoderma MI isolate; lane 2- +ve Sample
Through sequencing a 339bp portion was obtained. Sequence analysis showed that the
sequence data of the ITS region (ITS1-5.8S) of the Trichoderma spp. isolated from the
soil of the onion field of the Field Crops Research and Development Institute was
matching with 19 sequences available at the NCBI, reported from different countries,
more than 90 percent. Comparison of the sequences data of the Trichoderma MI
Isolate with selected sequence data available at the NCBI showed that Trichoderma MI
Isolate has 95% nucleotide identity with T. asperellum from Morocco and 94%
nucleotide identity with T. asperellum from China, Egypt, Morocco and India (Figure
4).Trichoderma MI Isolate is showing 73% nucleotide identity with a Trichoderma
spp. from China. Therefore, morphological identification combined with molecular
analysis confirmed the isolated Trichoderma isolate from onion field as T. asperellum.
The phylogenetic tree obtained through sequence analysis of ITS1 of isolated
Trichoderma sample (Trichoderma MI Isolate) and the sequences of 20
other Trichoderma spp. obtained from sequence databank (NCBI) is represented in
Figure 5. Trichoderma MI Isolate is allocated in the tree with the type strain of T.
asperellum. Only the Trichoderma spp. (Accession No. MH284676) reported from
China separated in cluster formation of the phylogenetic tree.
Different Trichoderma isolation studies conducted in Sri Lanka found that Sri Lanka
soil is rich in T. asperellum strain and showing antagonism against different plant
pathogens (Wijesinghe et al., 2010; Rajapakse et al., 2016). Isolation of bio control
agent from the targeting application is important for the sustainability of the final bio
pesticide. Hence this local available T. asperellum is an important source for the mass
production of Trichoderma.
500bp
1 2 L
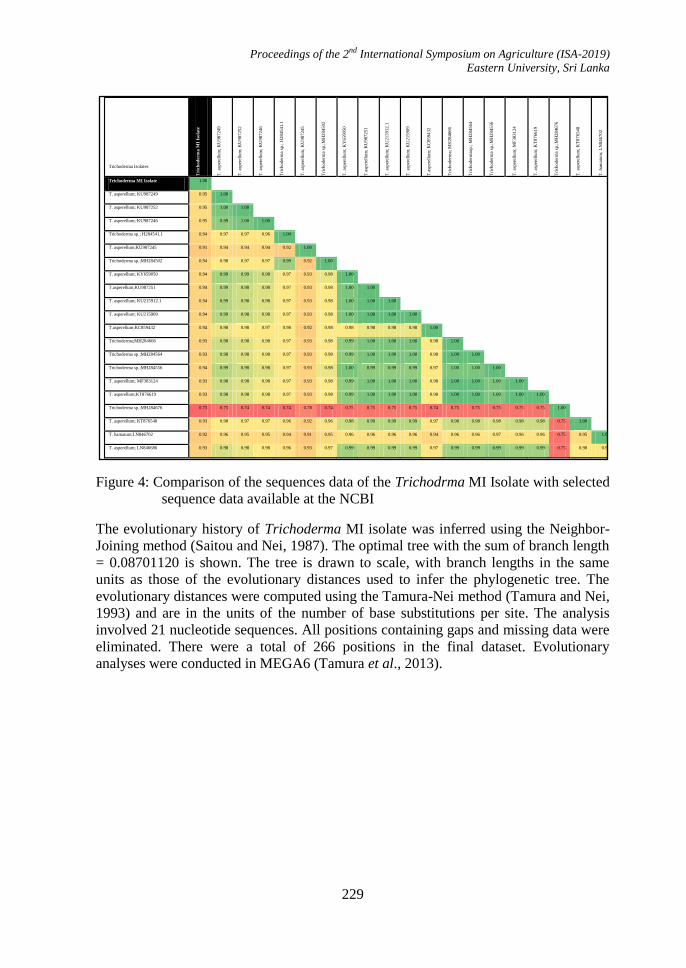
Proceedings of the 2nd International Symposium on Agriculture (ISA-2019)
Eastern University, Sri Lanka
229
Figure 4: Comparison of the sequences data of the Trichodrma MI Isolate with selected
sequence data available at the NCBI
The evolutionary history of Trichoderma MI isolate was inferred using the Neighbor-
Joining method (Saitou and Nei, 1987). The optimal tree with the sum of branch length
= 0.08701120 is shown. The tree is drawn to scale, with branch lengths in the same
units as those of the evolutionary distances used to infer the phylogenetic tree. The
evolutionary distances were computed using the Tamura-Nei method (Tamura and Nei,
1993) and are in the units of the number of base substitutions per site. The analysis
involved 21 nucleotide sequences. All positions containing gaps and missing data were
eliminated. There were a total of 266 positions in the final dataset. Evolutionary
analyses were conducted in MEGA6 (Tamura et al., 2013).
Trichoderma Isolates
Tri
ch
od
erm
a M
I Is
ola
te
T.
asp
erel
lum
; K
U9
87
24
9
T.
asp
erel
lum
; K
U9
87
25
2
T.
asp
erel
lum
; K
U9
87
24
6
Tri
cho
der
ma
sp.;
H2
84
54
1.1
T.
asp
erel
lum
; K
U9
87
24
5
Tri
cho
der
ma
sp.;
MH
28
45
02
T.
asp
erel
lum
; K
Y6
59
05
0
T.a
sper
ellu
m;
KU
98
72
51
T.
asp
erel
lum
; K
U2
15
91
2.1
T.
asp
erel
lum
; K
U2
15
90
9
T.a
sper
ellu
m;
KC
85
94
32
Tri
cho
der
ma;
MH
28
46
66
Tri
cho
der
mas
p.;
MH
28
45
64
Tri
cho
der
ma
sp.;
MH
28
45
56
T.
asp
erel
lum
; M
F3
83
12
4
T.
asp
erel
lum
; K
T8
76
61
9
Tri
cho
der
ma
sp.;
MH
28
46
76
T.
asp
erel
lum
; K
T8
76
54
8
T.
ham
atu
m;
LN
84
67
02
T.
asp
erel
lum
; L
N8
46
68
6
Trichoderma MI Isolate 1.00
T. asperellum; KU987249 0.95 1.00
T. asperellum; KU987252 0.95 1.00 1.00
T. asperellum; KU987246 0.95 0.99 1.00 1.00
Trichoderma sp.; H284541.1 0.94 0.97 0.97 0.96 1.00
T. asperellum;KU987245 0.91 0.94 0.94 0.94 0.92 1.00
Trichoderma sp.;MH284502 0.94 0.98 0.97 0.97 0.99 0.92 1.00
T. asperellum; KY659050 0.94 0.99 0.99 0.98 0.97 0.93 0.98 1.00
T.asperellum;KU987251 0.94 0.99 0.98 0.98 0.97 0.93 0.98 1.00 1.00
T. asperellum; KU215912.1 0.94 0.99 0.98 0.98 0.97 0.93 0.98 1.00 1.00 1.00
T. asperellum; KU215909 0.94 0.99 0.98 0.98 0.97 0.93 0.98 1.00 1.00 1.00 1.00
T.asperellum;KC859432 0.94 0.98 0.98 0.97 0.98 0.92 0.98 0.98 0.98 0.98 0.98 1.00
Trichoderma;MH284666 0.93 0.98 0.98 0.98 0.97 0.93 0.98 0.99 1.00 1.00 1.00 0.98 1.00
Trichoderma sp.;MH284564 0.93 0.98 0.98 0.98 0.97 0.93 0.98 0.99 1.00 1.00 1.00 0.98 1.00 1.00
Trichoderma sp.;MH284556 0.94 0.99 0.98 0.98 0.97 0.93 0.98 1.00 0.99 0.99 0.99 0.97 1.00 1.00 1.00
T. asperellum; MF383124 0.93 0.98 0.98 0.98 0.97 0.93 0.98 0.99 1.00 1.00 1.00 0.98 1.00 1.00 1.00 1.00
T. asperellum;KT876619 0.93 0.98 0.98 0.98 0.97 0.93 0.98 0.99 1.00 1.00 1.00 0.98 1.00 1.00 1.00 1.00 1.00
Trichoderma sp.;MH284676 0.73 0.75 0.74 0.74 0.74 0.78 0.74 0.75 0.75 0.75 0.75 0.74 0.75 0.75 0.75 0.75 0.75 1.00
T. asperellum; KT876548 0.93 0.98 0.97 0.97 0.96 0.92 0.96 0.98 0.99 0.99 0.99 0.97 0.98 0.98 0.98 0.98 0.98 0.75 1.00
T. hamatum;LN846702 0.92 0.96 0.95 0.95 0.94 0.91 0.95 0.96 0.96 0.96 0.96 0.94 0.96 0.96 0.97 0.96 0.96 0.75 0.95 1.00
T. asperellum; LN846686 0.93 0.98 0.98 0.98 0.96 0.93 0.97 0.99 0.99 0.99 0.99 0.97 0.99 0.99 0.99 0.99 0.99 0.75 0.98 0.97 1.00
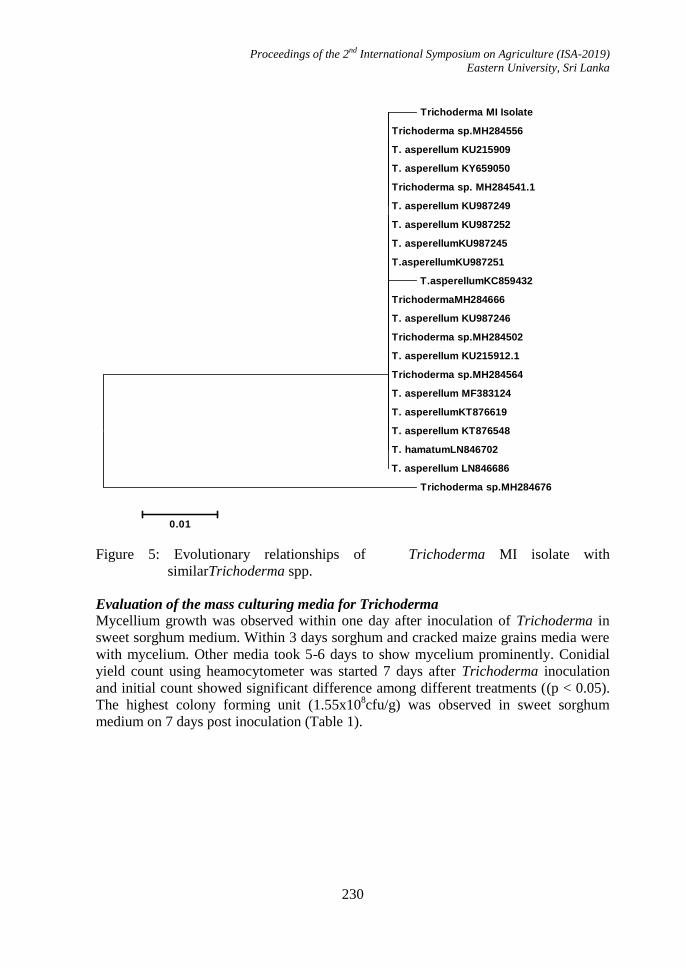
Proceedings of the 2nd International Symposium on Agriculture (ISA-2019)
Eastern University, Sri Lanka
230
Figure 5: Evolutionary relationships of Trichoderma MI isolate with
similarTrichoderma spp.
Evaluation of the mass culturing media for Trichoderma
Mycellium growth was observed within one day after inoculation of Trichoderma in
sweet sorghum medium. Within 3 days sorghum and cracked maize grains media were
with mycelium. Other media took 5-6 days to show mycelium prominently. Conidial
yield count using heamocytometer was started 7 days after Trichoderma inoculation
and initial count showed significant difference among different treatments ((p < 0.05).
The highest colony forming unit (1.55x10⁸cfu/g) was observed in sweet sorghum
medium on 7 days post inoculation (Table 1).
Trichoderma MI Isolate
Trichoderma sp.MH284556
T. asperellum KU215909
T. asperellum KY659050
Trichoderma sp. MH284541.1
T. asperellum KU987249
T. asperellum KU987252
T. asperellumKU987245
T.asperellumKU987251
T.asperellumKC859432
TrichodermaMH284666
T. asperellum KU987246
Trichoderma sp.MH284502
T. asperellum KU215912.1
Trichoderma sp.MH284564
T. asperellum MF383124
T. asperellumKT876619
T. asperellum KT876548
T. hamatumLN846702
T. asperellum LN846686
Trichoderma sp.MH284676
0.01
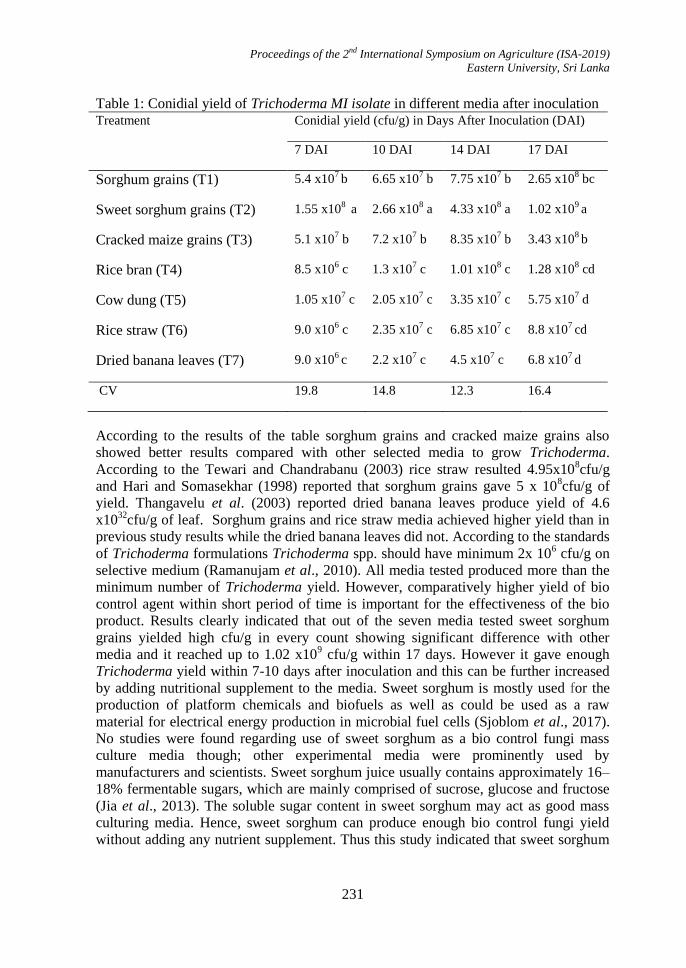
Proceedings of the 2nd International Symposium on Agriculture (ISA-2019)
Eastern University, Sri Lanka
231
Table 1: Conidial yield of Trichoderma MI isolate in different media after inoculation Treatment Conidial yield (cfu/g) in Days After Inoculation (DAI)
7 DAI 10 DAI 14 DAI 17 DAI
Sorghum grains (T1) 5.4 x10⁷ b 6.65 x10
7 b 7.75 x10
7 b 2.65 x10
8 bc
Sweet sorghum grains (T2) 1.55 x10⁸ a 2.66 x10
8 a 4.33 x10
8 a 1.02 x10
9 a
Cracked maize grains (T3) 5.1 x10⁷ b 7.2 x10
7 b 8.35 x10
7 b 3.43 x10
8 b
Rice bran (T4) 8.5 x10⁶ c 1.3 x10
7 c 1.01 x10
8 c 1.28 x10
8 cd
Cow dung (T5) 1.05 x10⁷ c 2.05 x10
7 c 3.35 x10
7 c 5.75 x10
7 d
Rice straw (T6) 9.0 x10⁶ c 2.35 x10
7 c 6.85 x10
7 c 8.8 x10
7 cd
Dried banana leaves (T7) 9.0 x10⁶ c 2.2 x10
7 c 4.5 x10
7 c 6.8 x10
7 d
CV 19.8 14.8 12.3 16.4
According to the results of the table sorghum grains and cracked maize grains also
showed better results compared with other selected media to grow Trichoderma.
According to the Tewari and Chandrabanu (2003) rice straw resulted 4.95x10⁸cfu/g
and Hari and Somasekhar (1998) reported that sorghum grains gave 5 x 10⁸cfu/g of
yield. Thangavelu et al. (2003) reported dried banana leaves produce yield of 4.6
x1032
cfu/g of leaf. Sorghum grains and rice straw media achieved higher yield than in
previous study results while the dried banana leaves did not. According to the standards
of Trichoderma formulations Trichoderma spp. should have minimum 2x 10⁶ cfu/g on
selective medium (Ramanujam et al., 2010). All media tested produced more than the
minimum number of Trichoderma yield. However, comparatively higher yield of bio
control agent within short period of time is important for the effectiveness of the bio
product. Results clearly indicated that out of the seven media tested sweet sorghum
grains yielded high cfu/g in every count showing significant difference with other
media and it reached up to 1.02 x10⁹ cfu/g within 17 days. However it gave enough
Trichoderma yield within 7-10 days after inoculation and this can be further increased
by adding nutritional supplement to the media. Sweet sorghum is mostly used for the
production of platform chemicals and biofuels as well as could be used as a raw
material for electrical energy production in microbial fuel cells (Sjoblom et al., 2017).
No studies were found regarding use of sweet sorghum as a bio control fungi mass
culture media though; other experimental media were prominently used by
manufacturers and scientists. Sweet sorghum juice usually contains approximately 16–
18% fermentable sugars, which are mainly comprised of sucrose, glucose and fructose
(Jia et al., 2013). The soluble sugar content in sweet sorghum may act as good mass
culturing media. Hence, sweet sorghum can produce enough bio control fungi yield
without adding any nutrient supplement. Thus this study indicated that sweet sorghum
Proceedings of the 2nd International Symposium on Agriculture (ISA-2019)
Eastern University, Sri Lanka
232
may be used as an effective and efficient media for the mass culturing of Trichoderma
with or without nutrient supplement.
Conclusions
Based on the molecular confirmation isolated Trichoderma was identified as T.
asperellum and is similar to T. asperellum found in other parts of the world. Results
indicated that sweet sorghum has potential for use as an effective mass culturing media
for Trichoderma mass multiplication and nutrient supplement addition and sustainable
application should be further studied.
Acknowledgement
The authors wish to express their sincere thanks to Sri Lanka Council for Agricultural
research Policy for funding this study. Also wish to express their sincere thanks to
former Additional director, HORDI Gannoruwa Dr. R.G.A.S. Rajapaksa, W.A.P.
Weerarathna, Principal Agriculture Scientist (Pathology) and their staff for their fullest
support. Sincere thanks also going to the extension officers of the DOA for the sample
collection support.
References
Atanasova, L., Le Crom, S., Gruber, S., Coulpier, F., SeidlSeiboth, V., Kubicek, C.P.,
Druzhinina, I.S., (2013). Comparative transcriptomics reveals different strategies of
Trichoderma mycoparasitism. BMC Genomics 14, 121.
Cavalcante, R. S., and Helder, L. S. L., Gustavo, A. S. P., Carlos A. T. G., and
Rodrigues, S. (2008). Effect of Moisture on Trichoderma Conidia Production on
Corn and Wheat Bran by Solid State Fermentation. Food Bioprocess Technology
1:100–104.
Harman, G.E., Howell, C.R., Viterbo, A., Chet, I. and Lorito, M. (2004).Trichoderma
species--opportunistic, avirulent plant symbionts.Nat Rev Microbiology. 2(1):43-
56.
Jegathambigai V, Wilson Wijeratnam R.S. and Wijesundera R.L.C. (2010) Effect of
Trichoderma sp. on Sclerotium rolfsii, the Causative Agent of Collar Rot on
Zamioculcas zamiifolia and an on Farm Method to Mass Produce Trichoderma
species Plant Pathology Journal : 9 Issue: 2, pp 47-55
Jegathambigai,V., Wilson.Wijeratnam R.S. and Wijesundera, R.L.C. (2009)
“Trichoderma as a seed treatment to control Helminthosporium leaf spot disease of
Chrysalidocarpus utescens.” World Journal of Agricultural Sciences.5(6):720-728.

Proceedings of the 2nd International Symposium on Agriculture (ISA-2019)
Eastern University, Sri Lanka
233
Jeyaranjan, R. (2006). Prospects of indigenous mass production and formulation of
Trichoderma. Pp 74-80.
Jia, F., Chawhuaymak, J. and Riley, M.R. (2013).Efficient extraction method to collect
sugar from sweet sorghum. Journal of Biological Engineering, 7:1-12.
Khandelwal, M., Datta, S., Mehta, J., Naruka, R., Makhijani, K., Sharma, G., Kumar,
R., Chandra, S. (2012) Isolation, characterization and biomass production of
Trichoderma viride using various agro products- A biocontrol agent. Adv Appl Sci
Res 3:3950–3955
Kumar, P., Tarafder, J.C., Painuli, D.K., Raina, P., Singhm M.P., Beniwal, R.K., Soni,
M.L., Kumar, M., Santra, P. and Shamsudin, M. (2009). Variability in arid soils
characteristics. In: Trends in Arid zone Research in India (Eds. A. Kar, B.K. Garg,
M.P. Singh and S. Kathju). Central Arid Zone Research Institute, Jodhpur, India.
pp. 78-112.
Popp, J and Hantos, K. (2011). The impact of crop protection on agricultural
production. Studies in Agricultural Economics No. 113, Research Institute of
Agricultural Economics, Budapest, Hungary. pp. 47-66.
Rajapakse, R.G.A.S., Fariz, F.S., Wickramarachchi,.W.A.R.T, Dissanayake, D.M.K.K.
Premarathne, M.P.T. and Kahawatte, K.J.P.K. (2016). Morphological amnd
molecular characterization of Trichoderma isolates used as bio control agents in Sri
Lanka. Tropical Agriculturists, Vol. 164.
Ramanujam, B., Prasad, R.D., Sriram, S. and Rangeswaran, R. (2010). Mass
production formulation and quality control and delivery of Trichoderma for plant
disease management. The journal of plant protection sciences, 2(2): 1-8.
Saitou, N. and Nei, M. (1987). The neighbor-joining method: A new method for
reconstructing phylogenetic trees. Molecular Biology and Evolution 4:406-425.
Sjoblom,M., Matsakas, L., Krige, A Rova, U. and Christakopoulos, P. (2017). Direct
electricity generation from sweet sorghum stalks and anaerobic sludge. Journal of
Industrial crops and products. 108:505-511.
Tamura, K. and Nei, M. (1993). Estimation of the number of nucleotide substitutions
in the control region of mitochondrial DNA in humans and chimpanzees. Molecular
Biology and Evolution 10:512-526.
Tamura, K., Stecher, G., Peterson, D., Filipski, A., and Kumar. S. (2013). MEGA6:
Molecular Evolutionary Genetics Analysis version 6.0. Molecular Biology and
Evolution. 30: 2725-2729.
Tewari, L. and Chandrabhanu, (2003), Screening of various substrates for sporulation
and mass multiplication of biocontrol agent Trichoderma harzianum through solid
state fermentation. Indian Phytopathology., 56 : 476.
Thangawelu, R., Palaniswami, A. and Velazhahan, R. (2003). Mass production of
Trichoderma harzinianum for managing fusarium wilt of banana. Online
https://doi.org/10.1016/j.agee.20 (Accessed on 2018.09.18 )
Proceedings of the 2nd International Symposium on Agriculture (ISA-2019)
Eastern University, Sri Lanka
234
Verma, M., Brar, S.K., Tyagi, R.D., Surampalli, R.Y. and Valero, J.R. (2007).
Antagonistic fungi, Trichoderma spp.: Panoply of biological control. Bio chemical
engineering journal. 37 (1) : 1-20.
White, T.J., Bruns, T., Lee, s. and Taylor, J.W. (1990). Amplification and direct
sequencing of fungal ribosomal RNA genes for phylogenetics. In: Innis, M.A.,
Gefand, D.H., Sninsky, J.J. and White, T.J. (Eds.), PCR Protocols: A Guide to
Methods and Applications. Acedemic press, New york, pp. 315-322.
Wijesinghe C.J., Wilson Wijeratnam R.S., Samarasekara J.K.R.R., Wijesundara
R.L.C. (2010) “Biological control of Thielaviopsis paradoxa on pineapple by an
isolate of Trichoderama asperellum”. Biological Control.53, 285-290.
You, J., Zhang, J., Wu, M., Yang, L., Chen, W and Li, G. (2016). Multiple criteria-
based screening of Trichoderma isolates for biological control of Botrytis cinera on
tomato. Biological control 101: 31-38