Dialyse à domicile, évaluation du modèle de dialyse …Université de Montréal Dialyse à...
143
Université de Montréal Dialyse à domicile, évaluation du modèle de dialyse à domicile intégrée par Annie-Claire Nadeau-Fredette Département de Médecine Faculté de Médecine Mémoire présenté en vue de l’obtention du grade de M.Sc. en Sciences Biomédicales option Recherche clinique Avril 2016 © Annie-Claire Nadeau-Fredette, 2016
Transcript of Dialyse à domicile, évaluation du modèle de dialyse …Université de Montréal Dialyse à...

Université de Montréal
Dialyse à domicile, évaluation du modèle de dialyse à
domicile intégrée
par Annie-Claire Nadeau-Fredette
Département de Médecine
Faculté de Médecine
Mémoire présenté
en vue de l’obtention du grade de M.Sc.
en Sciences Biomédicales
option Recherche clinique
Avril 2016
© Annie-Claire Nadeau-Fredette, 2016

i
Résumé Les modalités de dialyse à domicile, soit la dialyse péritonéale (DP) et l’hémodialyse à
domicile (HDD), offrent plusieurs avantages aux patients avec insuffisance rénale terminale
(IRT), que ce soit par rapport à la qualité de vie ou à une diminution des complications liées à
l’IRT. Peu de données sont toutefois disponibles quant aux répercussions cliniques de
l’initiation de la thérapie de suppléance rénale via la DP ou l’HDD et de l’optimisation
subséquente du traitement à domicile.
Le présent mémoire visait donc à répondre aux trois questions suivantes soit (1) la
comparaison entre la survie des patients débutant la thérapie de suppléance rénale par une ou
l’autre des modalités à domicile, (2) l’évaluation du modèle de dialyse à domicile intégrée
(c’est la dire l’initiation de la suppléance rénale en DP avec un transfert subséquent en HDD)
et (3) l’évaluation des prédicteurs dudit modèle de dialyse à domicile intégrée.
L’évaluation de 11 416 patients ayant débuté la suppléance rénale en Australie et Nouvelle-
Zélande entre 2000 et 2012 a montré une association entre une mortalité globale inférieure
chez les patients traités par HDD comparativement à ceux traités par DP (rapport des risques
[hazard ratio - HR] 0.47, intervalle de confiance [IC] de 95%, 0.38-0.59). Par contre, les
patients ayant débuté la suppléance rénale en DP et ayant ensuite été transférés en HDD
(modèle de dialyse à domicile intégrée) avaintt une survie en dialyse à domicile similaire à
ceux directement traités par l’HDD (HR 0.92, IC de 95%, 0.52-1.62). Finalement, les
caractéristiques démographiques de base (jeune âge, sexe masculin, ethnie), les comorbidités,
la cause de l’insuffisance rénale terminale, la durée du traitement et la raison de l’arrêt de la
DP étaient des prédicteurs du modèle de dialyse à domicile intégrée.
Mots-clés : Insuffisance rénale terminale, dialyse à domicile, dialyse péritonéale, hémodialyse
à domicile, survie, modèle de dialyse à domicile intégrée

ii
Abstract Treatment of end-stage renal disease with home dialysis modalities (peritoneal dialysis [PD]
and home hemodialysis [HHD]) is associated with significant patient-related benefits,
including improved quality of life, greater autonomy and lower rates of medical
complications. Although home dialysis is being increasingly promoted internationally, little
data has been published to evaluate outcomes of patients treated with PD and HDD at time of
renal replacement therapy (RRT) initiation and evaluate the optimal home dialysis treatment
pattern.
The current project specifically aimed to answer the following questions: (1) what is the
survival associated with initiation of RRT with PD or HDD, (2) what is the survival associated
with the integrated home dialysis model (PD with subsequent transfer to HHD) compared to
PD or HDD treatment initially, (3) what are the predictors associated with the integrated home
dialysis model.
The first study included 11 416 incident dialysis patients from Australia and New Zealand
between 2000 and 2012. Treatment with HHD at start of RRT was associated with a lower
mortality compared to initial treatment with PD (hazard ratio [HR] 0.47, 95% confidence
interval [CI] 0.38-0.59). The second study assessed the integrated home dialysis model per se
and showed a similar mortality among patients treated with the integrated home model (PD
with transfer to HHD after PD ending) and patients treated with HHD from start of RRT
(hazard ratio [HR] 0.92, 95% confidence interval [CI] 0.52-1.62). Finally, the third study
assessed the predictors of the integrated home dialysis model and identified baseline
characteristics such as lower age, male sex, race, cause of end-stage renal disease,
comorbidities and duration of PD therapy as potential predictors of a transfer from PD to
HHD.
Keywords : End-stage kidney disease, home dialysis, peritoneal dialysis, home hemodialysis,
survival, integrated home dialysis model

iii
Table des matières Résumé ......................................................................................................................................... i
Abstract ....................................................................................................................................... ii
Table des matières ..................................................................................................................... iii
Liste des tableaux ........................................................................................................................ v
Liste des figures ........................................................................................................................ vii
1- Introduction ............................................................................................................................. 1
1.1 Insuffisance rénale terminale et dialyse à domicile ........................................................... 1
1.2 Dialyse péritonéale ............................................................................................................ 3
1.2.1 Bénéfices de la dialyse péritonéale ............................................................................. 3
1.2.2 Survie avec la dialyse péritonéale et l’hémodialyse hospitalière ............................... 6
1.3 Hémodialyse à domicile .................................................................................................... 8
1.3.1 Bénéfices de l’hémodialyse à domicile ...................................................................... 8
1.3.2 Survie avec l’hémodialyse à domicile et l’hémodialyse hospitalière ....................... 11
1.4 Comparaison entre la dialyse péritonéale et l’hémodialyse à domicile ........................... 13
1.5 Rationnelle pour le modèle de dialyse à domicile intégrée ............................................. 15
2 – Méthodologie ....................................................................................................................... 17
2.1 Population et base de données étudiées ........................................................................... 17
2.2 Questions de recherche .................................................................................................... 19
2.3 Stratégies d’analyse ......................................................................................................... 20
2.3.1 Modèle épidémiologique .......................................................................................... 20
2.3.2 Approche statistique ................................................................................................. 20
3 - Initiation de la suppléance rénale avec la dialyse péritonéale et l’hémodialyse à domicile 24
3.1 Sommaire du premier article ........................................................................................... 24
3.2 Article 1 - An incident cohort study comparing survival on home hemodialysis and
peritoneal dialysis – a multicenter ANZDATA Registry analysis. ....................................... 25
Figures and Tables ............................................................................................................. 39
Supplementary data ........................................................................................................... 48
4 - Évaluation du modèle de dialyse à domicile intégrée .......................................................... 56
4.1 Sommaire du second article ............................................................................................. 56

iv
4.2 Article 2 - Outcomes of Integrated Home Dialysis Care: A Multi-centre, Multi-national
Registry Study ....................................................................................................................... 57
Figures and Tables ............................................................................................................. 73
Supplementary data ........................................................................................................... 80
5 - Prédicteurs d’un transfert en hémodialyse à domicile après la dialyse péritonéale ............. 87
5.1 Sommaire du troisième article ......................................................................................... 87
5.2 Article 3 - Predictors of Transfer to Home Hemodialysis after Peritoneal Dialysis
Completion ............................................................................................................................ 88
Figures and Tables ........................................................................................................... 102
Supplementary data ......................................................................................................... 112
6 – Discussion .......................................................................................................................... 117
6.1 Sommaire des principaux résultats ................................................................................ 117
6.2 Mise en contexte et limites des résultats ....................................................................... 119
6.3 Directions futures .......................................................................................................... 122
7 – Conclusion ......................................................................................................................... 123
Bibliographie ................................................................................................................................ i
v
Liste des tableaux Article 1.
Table 1 – Baseline characteristics ............................................................................................. 44
Table 2 –Adjusted hazard ratios for mortality (primary outcome) comparing HHD to PD ...... 46
Table 3 – Adjusted hazard ratios for secondary outcomes comparing HHD to PD .................. 47
Table S1 – Baseline characteristics in propensity score matched model .................................. 51
Table S2 - Sensitivity analysis for secondary outcomes: competing risk model, 30-day
technique failure / lag definition model ..................................................................................... 52
Table S3 – Sensitivity analysis: Comparison of outcomes from start of home dialysis training
................................................................................................................................................... 53
Table S4 – Sensitivity analysis: Adjustment for the proportion of PD and HHD in each
Australian state and New Zealand ............................................................................................. 53
Table S5 – Sensitivity analysis: Restricted cohort of patients with 60 days on home dialysis
(‘60-day’ attrition rule) .............................................................................................................. 54
Table S6 - Primary and secondary outcomes by age group, race and diabetes status where two-
way interactions were significant (<0.05) ................................................................................. 55
Article 2.
Table 1: Baseline characteristic – global cohort ........................................................................ 76
Table 2 – Baseline characteristics of matched cohort ............................................................... 78
Table 3 – Adjusted hazard ratio for primary and secondary outcomes in main and sensitivity
models ........................................................................................................................................ 79
Table S1 - Baseline characteristics of matched groups in model allowing up to 180 days of
facility hemodialysis between PD completion and HHD initiation .......................................... 85
Table S2 - Hazard ratio for primary and secondary outcomes in covariates adjusted, propensity
score model ................................................................................................................................ 86
Article 3.
Table 1 – Baseline characteristics of the study cohort ............................................................ 104
Table 2 - Causes of PD technique failure in patients transferred to HHD and facility HD only
................................................................................................................................................. 106
Table 3 - Predictors of transition to HHD in the restricted and unrestricted cohort ................ 107

vi
Table 4 – Multivariable adjusted predictors of transfer to HHD in the restricted cohort -
sensitivity models .................................................................................................................... 109
Table 5 – Predictors of longer facility HD transition time before HHD initiation, Multivariable
ordinal logistic regression ........................................................................................................ 111
Table S1 – Causes of PD technique failure in patients transferred to HHD and facility HD only
................................................................................................................................................. 112
Table S2 – Unadjusted predictors of transfer to HHD after PD completion in the restricted
cohort ....................................................................................................................................... 113
Table S3 – Multivariable adjusted predictors of transfer to HHD in the restricted cohort -
sensitivity models .................................................................................................................... 115

vii
Liste des figures Article 1.
Figure 1 – Survival curves for primary outcome. ...................................................................... 39
Figure 2 - Subgroup analyses for primary and secondary outcomes. ....................................... 40
Figure 3 - Survival curves for secondary outcomes. ................................................................ 41
Figure 4 - Cumulative Incidence Function of technique failure censored for death and
stratified by age group and modality in competing risk model. ................................................ 43
Figure S1 – Flow chart .............................................................................................................. 48
Figure S2 - Standardized differences before and after matching .............................................. 48
Figure S3 – Kaplan-Meier survival curve in primary outcome (overall survival) with
propensity score matched model ............................................................................................... 49
Figure S4 - Kaplan-Meier survival curves in secondary outcomes with propensity score
matched models. ........................................................................................................................ 50
Article 2.
Figure 1 - Study design ............................................................................................................. 73
Figure 2 - Patient and home dialysis technique survival. .......................................................... 74
Figure 3 - Patient survival on home dialysis ............................................................................. 75
Figure S1 – Distribution of propensity scores before and after matching ................................. 80
Figure S2 - Competing risk regression – Cumulative subhazard for death and technique failure
in main analysis (transplantation as competing risk) ................................................................. 81
Figure S3 - Competing risk regression – Cumulative subhazard for death on home dialysis in
main analysis (transplantation as competing risk) ..................................................................... 82
Figure S4 - Patient and home dialysis technique survival in model allowing up to 180 days
facility hemodialysis between PD completion and HHD initiation .......................................... 83
Figure S5 - Survival on home dialysis in model allowing up to 180 days facility hemodialysis
between PD completion and HHD initiation ............................................................................. 84
Article 3.
Figure 1 – Flow chart .............................................................................................................. 102
Figure 2 - Time on temporary facility HD in patients transferred to HHD during the first year
after PD completion. ................................................................................................................ 103

viii
Liste des abréviations
Français
IC Intervalle de confiance
DP Dialyse péritonéale
HDD Hémodialyse à domicile
HD Hémodialyse
HR Hazard ratio (ratio des risques)
IRT Insuffisance rénale terminale
RCITO Registre canadien des insuffisances et transplantation d’organes
USRDS United States Renal Dialysis System
Anglais
ANZDATA Australia and New Zealand Dialysis and Transplantation
CKD Chronic kidney disease
CI Confidence interval
HD Hemodialysis
HHD Home hemodialysis
HR Hazard ratio
PD Peritoneal dialysis
RRT Renal replacement therapy
1
1- Introduction
1.1 Insuffisance rénale terminale et dialyse à domicile
L’insuffisance rénale terminale (IRT) est une maladie chronique, croissante depuis la dernière
décennie, qui touche près de 42 000 individus au Canada. De ce nombre, plus de 24 000
personnes reçoivent des traitements de dialyse, principalement sous forme d’hémodialyse
hospitalière alors qu’environ 27 000 personnes sont porteuses d’une greffe rénale
fonctionnelle (1).
Chaque année, plus de 5000 Canadiens reçoivent un diagnostic d’IRT et pour ces patients, la
survie moyenne non-ajustée à cinq ans est inférieure à 50% (1). Non seulement l’IRT est-elle
associée à une mortalité significative, mais celle-ci entraîne plusieurs modifications touchant
directement la qualité de vie des patients, que ce soit les complications médicales nécessitant
une hospitalisation, la diète particulièrement contraignante, l’asthénie fréquemment associée
aux traitement de dialyse intermittente ou l’importance du temps consacré aux traitements de
dialyse et au transport vers les centres de dialyse (2, 3).
Au cours des dernières années, plusieurs organismes, tant au plan provincial, que national et
international, ont tenté de promouvoir les modalités de dialyse à domicile, soit la dialyse
péritonéale (DP) et l’hémodialyse à domicile (HDD). Certaines provinces canadiennes tel
l’Ontario ont identifié des cibles de 40% d’utilisation des modes de dialyse à domicile pour les
patients incidents en dialyse depuis quelques années déjà (4). Au niveau international,
l’Australie cible également une utilisation accrue des modes de dialyse à domicile avec une
incidence d’au moins 40% dans la majorité de ses états et territoires (5, 6). Plus récemment, le
Québec a établi de nouvelles recommandations ministérielles pour l’utilisation des modalités
de dialyse à domicile en ciblant 25% d’utilisation des thérapies de dialyse à domicile en 2019
et 40% en 2025, chez les patients débutant la dialyse (7).

2
Considérant l’accroissement de l’intérêt pour les traitements de dialyse à domicile au plan
local, national et international, il s’avère essentiel de mieux cerner les caractéristiques des
patients traités par ces modalités de dialyse, et d’identifier les bénéfices et les répercussions
cliniques de l’initiation de la thérapie de remplacement rénal avec les modalités à domicile,
soit la DP et l’HDD.

3
1.2 Dialyse péritonéale
La dialyse péritonéale (DP) est la thérapie de dialyse à domicile la plus répandue, tant au
Canada qu’à l’international. Au Canada, près de 20% des nouveaux patients (incidents)
atteints d’IRT sont traités avec la dialyse péritonéale. De façon globale, plus de 4000
Canadiens recevaient des traitements de DP en 2013 (1). Au niveau international, on retrouve
une grande variation quant au recours à la DP chez la population souffrant d’IRT avec des
proportions variant de 3% au Japon, à 10% aux États-Unis, 18% au Canada, 20% en Australie,
45% au Mexique et 72% à Hong Kong (8). Cette variation s’explique par divers facteurs,
notamment certaines politiques gouvernementales obligeant la PD comme première modalité
de dialyse (PD-first) (9), différents accès aux traitements par hémodialyse (HD) et DP, une
structure financière variable ainsi que des habitudes locales diverses (10-12).
1.2.1 Bénéfices de la dialyse péritonéale
Bien que la prévalence du traitement par DP soit variable d’un pays à l’autre, la DP présente
plusieurs avantages par rapport au traitement, plus répandu, par HD hospitalière.
Autonomie et qualité de vie
Les patients traités par la DP jouissent d’une plus grande indépendance et autonomie en raison
du caractère « à domicile » du traitement. Ils sont plus en contrôle de leurs traitements,
comprennent souvent mieux leur maladie rénale chronique et sont mieux à même d’adapter la
thérapie de dialyse à leur mode de vie usuel (13, 14). Ces derniers sont également plus enclins
à conserver un travail rémunéré, bien que cela puisse être au moins partiellement lié aux
différences intrinsèques de la population en DP comparativement à celle en HD (15, 16).
La liberté de déplacement est souvent mentionnée comme un avantage de la DP puisque les
patients peuvent facilement voyager tout en poursuivant leur traitement de DP dans différents
pays. Plusieurs publications ont tenté d’évaluer la qualité de vie des patients en DP, parfois en
comparaison avec ceux traités par HD hospitalière. De façon générale, ces données présentent

4
des résultats mitigés qui indiquent globalement une qualité de vie similaire ou parfois
supérieure, pour les patients ayant recours à la DP (17-21). De plus, le traitement par DP, bien
que réalisé à domicile, n’a pas été associé à un plus grand fardeau de travail ou une
détérioration de la qualité de vie chez les aidants naturels des patients traités par DP (17).
Fonction rénale résiduelle
La préservation de la diurèse résiduelle est étroitement associée à l’amélioration de la survie
chez les patients traités par la dialyse chronique (22-26). Cette association a été décrite tant
pour les patients ayant recours à la dialyse péritonéale (22, 24, 26) qu’à l’HD hospitalière (23,
26). Diverses stratégies sont d’ailleurs utilisées pour optimiser la préservation de la fonction
rénale résiduelle, notamment l’évitement des néphrotoxines (agents de contraste, anti-
inflammatoires nonstéroïdiens) et de l’hypovolémie ainsi que l’utilisation des bloqueurs du
système rénine-angiotensine-aldostérone (27, 28) .
Par ailleurs, diverses études ont montré une supériorité de la DP par rapport à l’HD
hospitalière quant à la préservation de la diurèse résiduelle (29-31). Ainsi, dans la réanalyse de
l’étude CANUSA, une étude prospective avec 680 patients en DP issus de 14 centres
canadiens et américains, un volume urinaire supérieur à 250 ml/jour était associé à une
réduction du risque relatif (RR) de décès (RR 0.64, intervalle de confiance de 95% [IC] 95%
0.51-0.80) (22). De plus, l’utilisation, même transitoire, de l’HD hospitalière a été associée à
une diminution de la fonction rénale résiduelle dans une petite cohorte de patients débutant la
suppléance rénale (32).
Ultrafiltration et dialyse incrémentale
La DP permet une ultrafiltration constante et continue, ce qui améliore grandement la
tolérance hémodynamique de la dialyse, principalement par rapport aux traitements d’HD
intermittente faits à raison de quatre heures, trois fois par semaine. Cette stabilité de
l’ultrafiltration permet d’éviter les épisodes d’hypotension artérielle fréquemment observés en
hémodialyse intermittente et reliés au retrait d’un important volume liquidien durant une
courte période. Conséquemment, la DP est mieux tolérée chez une majorité de patients, et plus
particulièrement chez ceux souffrant d’insuffisance cardiaque sévère. Diverses études

5
observationnelles ont d’ailleurs montré une association entre la DP et une amélioration de la
fraction d’éjection du ventricule gauche ainsi qu’avec une amélioration de la classe
fonctionnelle d’insuffisance cardiaque (New York Heart Association) (33-35).
Finalement, la DP se veut une modalité de choix pour les patients débutant la dialyse et ne
nécessitant pas d’une dose élevée de dialyse (ou clairance), par exemple dans le cas d’un
syndrome cardio-rénal où une dialyse progressive (dite incrémentale) permet de contrôler la
volémie du patient tout en assurant un support à la fonction rénale résiduelle (36, 37).
Accès vasculaires, bactériémies et hépatites
De par sa technique même, la DP préserve le potentiel d’accès vasculaire des patients avec
IRT. En effet, plusieurs patients vivront des décennies avec l’IRT, que ce soit sous la forme de
traitements de dialyse ou grâce à une transplantation rénale. Malheureusement, il arrive
occasionnellement que l’utilisation répétée des accès vasculaires en HD entraine diverses
complications vasculaires sévères (sténose sévère, thrombose, syndrome de la veine cave
supérieure), qui peuvent éventuellement menacer la survie du patient qui devient parfois à
court d’options pour la dialyse (38, 39). Ainsi, le traitement initial des patients avec IRT par la
DP retarde l’utilisation desdits accès vasculaires et évite le développement des complications à
long terme. Cette stratégie a également comme conséquence de réduire les risques de
bactériémies (40) et de transmission des hépatites (41) par rapport à un traitement en
hémodialyse hospitalière.
Coûts
Les coûts liés au traitement par DP sont normalement inférieurs à ceux associés au traitement
par HD hospitalière, principalement en raison du ratio patient-infirmière beaucoup plus bas et
de la technologie même de la DP, moins dispendieuse que celle de l’HD (11, 42-44). De plus,
considérant la nature « à domicile » de la DP dans la quasi-totalité des situations, surtout au
Québec, une économie significative est faite de façon indirecte en ce qui concerne le transport
des patients comparativement à l’HD hospitalière (avec trois transports aller-retour par
semaine) où le transport doit souvent se faire avec des ressources adaptées et/ou
subventionnées par l’état (45). De même, tel que mentionnée précédemment, les patients

6
traités par DP peuvent plus souvent maintenir un statut de travailleur, ce qui réduit les coûts
indirects reliés à l’IRT pour la société.
Plusieurs études ont évalué les coûts des différentes modalités de dialyse et montré un
avantage pour la DP, même en considérant un potentiel échec de technique et transfert en HD
hospitalière (44, 46, 47). Les montants rapportés dans les études publiées varient grandement
en fonction du type de coûts considérés (coûts directs seulement ou incluant les coûts
indirects : transport, hospitalisation, médication), du type de système de santé et de la devise
étudiée. Par exemple, dans une étude américaine publiée en 2002, le coût global (direct +
indirect) lié à la dialyse était approximativement 24 000$ inférieur pour les patients traités par
DP comparativement au patient traités par HD hospitalière (48). Plus récemment, une étude
canadienne rapportait des coûts annuels globaux de 30 000$ à 40 000$ inférieurs pour les
patients traités par DP comparativement à ceux traités par HD hospitalière (49).
1.2.2 Survie avec la dialyse péritonéale et l’hémodialyse hospitalière
Depuis deux décennies, de nombreuses études ont été réalisées pour tenter d’évaluer l’impact
du choix de la modalité de dialyse sur la survie des patients avec IRT. La très grande majorité
de ces études comparait les répercussions cliniques de la DP et de l’HD hospitalière. Toutes
ces données sont toutefois observationnelles, ou tirées de bases de données, et les auteurs ont
ainsi dû avoir recours à diverses stratégies d’ajustement afin d’éviter, autant que possible, le
biais de sélection intrinsèque à ces deux modalités. Ces études ont généralement rapporté une
survie similaire chez les patients traités par DP et HD hospitalière, avec un possible bénéfice
pour la dialyse péritonéale chez les patients jeunes, non-diabétiques ou non-obèses ainsi que
pour les premières années (1 à 3 ans) suivant l’initiation de la dialyse (50-58).
Au Canada, l’analyse des données du Registre canadien des insuffisances et des
transplantations d'organes (RCITO) incluant 46 839 patients ayant débuté la suppléance rénale
entre 1991 et 2007 a montré un léger avantage de survie pour la DP durant les 1ers 18 mois,
suivi d’un léger avantage pour l’HD après 18 mois. Toutefois, lorsque seulement la période la
plus récente était analysée, la DP était associée avec un bénéfice de survie pour le premier 24
7
mois alors qu’il n’y avait aucune différence statistiquement significative entre les deux
modalités après 24 mois (50).
De façon intéressante, une seconde analyse avec les données du RCITO chez les patients ayant
débuté le traitement de suppléance rénale entre 2001 et 2009 a permis de montrer que
l’avantage de survie décrit précédemment avec la DP était uniquement présent en comparant
ces patients avec la cohorte ayant débuté l’HD avec un cathéter veineux central (ratio de
risque [hazard ratio, HR] pour la mortalité à 1 an 1.8, IC 95% 1.6-1.9), mais disparaissait
lorsque comparé aux patients ayant initié l’HD avec une fistule artérioveineuse native ou
synthétique (HR 0.9, intervalle de confiance [IC] 95% 0.8-1.1) (59) , laissant sous-entendre
que l’association pourrait être liée à un facteur confondant.
De façon similaire, une autre étude canadienne, issue des bases de données de l’Ontario a
montré que l’association bénéfique entre la DP et la survie décrite dans plusieurs études était
potentiellement liée à un facteur confondant puisque le risque de mortalité était le même
lorsque seuls les patients avec un suivi pré-dialyse et ayant débuté la dialyse de façon élective
étaient comparés (HR 0.96, IC 95% 0.88–1.06) (60).
Au contraire, une étude américaine avec 1003 patients incidents en DP appariés 1 :1 avec des
patients incidents en HD (et ayant reçu un suivi pré-dialyse) a rapporté une survie supérieure
pour les trois premières années dans le groupe traité par DP dans l’analyse par intention de
traitement (61). De façon similaire, une étude récente néo-zélandaise rapportait aussi une
mortalité 20% inférieure pour les trois premières années après de début de la dialyse chez les
patients en DP (comparativement à l’HD), aux dépens d’une hausse de 33% du risque de décès
après trois ans (62). Auparavant, l’avantage de survie de la DP avait été décrit seulement pour
la première année après le début de la suppléance rénale dans une étude incluant la population
incidente en dialyse de la Nouvelle-Zélande ainsi que de l’Australie (56).

8
1.3 Hémodialyse à domicile
L’hémodialyse à domicile (HDD) est une forme de thérapie de suppléance rénale qui existe
depuis plus de40 ans, mais ayant connu un regain de popularité au cours des dernières années.
L’HDD peut être effectuée selon différents régimes, soit dans un format dit « conventionnel »
avec trois traitements de quatre heures par semaine (similaire à l’HD hospitalières) ou, le plus
souvent, sous une forme dite « intensive » que ce soit avec des traitements quotidiens courts (
cinq à sept traitements de deux à trois heures par semaine) ou des traitements nocturnes (sept à
huit heures) à une fréquence minimale de trois à quatre fois et jusqu’à six nuits par semaines
(63).
1.3.1 Bénéfices de l’hémodialyse à domicile
Plusieurs études, rétrospectives et prospectives, ont évalué les bénéfices du traitement d’HDD.
En raison du caractère souvent « intensif » du traitement d’HDD, il est important de noter que
les avantages décrits ci-contre peuvent, dans plusieurs cas, être associés à l’augmentation de la
fréquence et/ou durée des sessions d’HD autant sinon plus qu’au lieu du traitement (domicile
versus hospitalier).
Qualité de vie
L’influence de l’HDD sur la qualité de vie a été évaluée dans plusieurs études qui montrent, le
plus souvent, une amélioration de la qualité de vie surtout en regard des paramètres liés à la
maladie rénale chronique (64-68). Ainsi, une étude randomisée contrôlée du Alberta Kidney
Disease Network évaluant 52 patients a rapporté une amélioration significative du fardeau de
la maladie rénale et de la qualité de vie spécifiquement liée à l’IRT après six mois de suivi,
bien que la qualité de vie globale (mesurée par l’EuroQol five dimensions questionnaire) soit
demeurée similaire (64). Une amélioration de la qualité de vie a également été rapportée dans
l’étude London Daily/Noctural Hemodialysis chez les 23 patients traités à domicile (11 sous
HD quotidienne courte et 12 sous HD nocturne) comparativement à 22 patients en HD
conventionnelle (68) .

9
Au contraire, l’étude randomisée nocturne du Frequent Hemodialysis Network (FHN) n’a pu
démontrer de changement dans la qualité de vie entre le groupe nocturne et conventionnel,
bien que les deux groupes aient amélioré leur score de qualité de vie après 12 mois. Il faut
toutefois préciser que dans cette étude, une large proportion de patients dans le groupe
conventionnel recevait leur traitement à domicile (65).
Par ailleurs, les traitements par HDD ont également été associés à une diminution des
symptômes de dépression (65, 69) et, dans certains cas, à une amélioration du sommeil,
principalement chez les patients avec syndrome des jambes sans repos (70) et d’apnée du
sommeil (71).
Hypertension artérielle et volémie
Le meilleur contrôle de la tension artérielle est l’un des bénéfices les plus fréquemment cités
dans les études traitant de l’HDD, principalement en raison de la prolongation du temps de
dialyse (65, 72-77). L’étude du FHN rapportait une diminution significative de la tension
artérielle après 12 mois chez les patients traités par HD nocturne (-9.7 [IC 95% -16.9, -2.5]
mm Hg) alors qu’aucun changement n’avait été noté chez les patients du groupe
conventionnel.
Dans une autre petite étude prospective utilisant un devis croisé, la tension artérielle
ambulatoire de 24 heures diminuait également après huit semaines de traitement par HDD.
Cette réduction de la tension artérielle survenait sans qu’il n’y ait de changement au poids
post-dialytique, laissant supposer une contribution hormonale et/ou un effet lié à la réduction
de la résistance vasculaire périphérique au-delà d’une simple diminution du statut volémique
(76, 77). Au contraire, l’amélioration de la tension artérielle pour les patients traités par HD
quotidienne courte semblerait principalement liée à un meilleur contrôle de la volémie (74, 75,
78).
Masse cardiaque

10
La réduction de la masse ventriculaire gauche chez les patients en HDD a été rapportée dans
plusieurs études observationnelles (72, 74, 78) ainsi que dans une méta-analyse, bien que
celle-ci ait aussi inclus les patients recevants de l’HD intensive en centre hospitalier (79). Une
diminution de la masse ventriculaire gauche a également été rapportée dans une étude
randomisée albertaine avec une différence de 15.3 grammes (1.0-29.6 g) après six mois chez
les 26 patients randomisés au traitement d’HD nocturne comparativement à ceux randomisés
au traitement conventionnel (64) .
Au contraire, l’étude du FHN n’a pu démontrer d’effet statistiquement significatif de l’HD
nocturne par rapport à la réduction de l’hypertrophie ventriculaire gauche. Toutefois, la
puissance de cette étude a été grandement limitée par les difficultés de recrutement des
patients ainsi que par l’inclusion d’une majorité de patients avec une masse ventriculaire
normale à l’initiation de l’étude, limitant ainsi l’observation potentielle d’une réduction de la
masse ventriculaire (65). De plus, l’étude diurne du FHN (six sessions courtes en centre versus
trois sessions de 4 heures en centre) a montré une diminution significative de la masse
ventriculaire gauche ainsi que des volumes ventriculaires droits et gauches chez les patients
traités avec HD quotidienne comparativement au groupe contrôle (80). Cette dernière étude a
également rapporté une amélioration de la variabilité de la fréquence cardiaque, bénéfique au
niveau cardiovasculaire, chez les patients traités avec HD courte six fois par semaine (81).
Métabolisme osseux
L’HD intensive, principalement sous la forme de l’HD nocturne, a fréquemment été associée à
une réduction des taux de phosphate. Dans l’étude nocturne du FHN, une diminution
d’environ 0.40 mmol/L (IC 95% 0.02-0.57 mmol/L) dans le group intensif a été observé après
12 mois de traitement alors que 73% des patients traités par HD nocturne ne requéraient plus
de chélateurs pour le phosphore à la fin de l’étude comparativement à seulement 8% dans le
groupe conventionnel (82). Une amélioration du même ordre avait été rapportée dans une
autre étude randomisée canadienne (0.49 mmol/L, 95% CI 0.24-0.74) (64). De plus, l’étude
nocturne du FHN présentait une tendance vers une diminution de la PTH dans le groupe
intensif (-38%, IC 95% -63 à 4.2) avec une valeur-p toutefois non significative à 0.07 (82).

11
Fertilité
L’IRT est fréquemment associée à des troubles de la fertilité ainsi que des complications
sévères lors des grossesses avec des risques élevés de prématurité, d’avortement spontané et
de décès in-utero chez l’enfant et d’hypertension, de pré-éclampsie et de syndrome du
Hemolysis, Elevated liver enzyme, Low platelet count (HELLP) chez la mère (83). Une
augmentation du nombre d’heures hebdomadaires de dialyse a toutefois été associée à une
amélioration des répercussions cliniques, tant pour la mère que l’enfant (84, 85). Plus
récemment, une étude canado-américaine a rapporté un effet majeur du traitement de dialyse
intensif par HDD nocturne avec un taux de survie de 85% chez les enfants des patientes
recevant plus de 36 heures de dialyse par semaine (versus 48% chez celles avec 20 heures ou
moins par semaine), un âge gestationnel plus avancé ainsi qu’un poids plus élevé à la
naissance (86).
Coûts
Tout comme la dialyse péritonéale, l’HDD est associée à un avantage socioéconomique par
rapport à l’HD hospitalière, principalement en raison d’une diminution des coûts liés au travail
infirmier ainsi qu’aux coûts indirects tels que la médication et les hospitalisations liées à des
complications médicales (44, 49, 87-89). Ces bénéfices socioéconomiques sont toutefois plus
prononcés chez les patients qui ont une courte période de formation. En effet, la période de
formation nécessaire afin qu’un patient puisse faire ses traitements à domicile est souvent
considérée plus coûteuse puisque l’enseignement se fait à un ratio d’une infirmière pour un ou
deux patients. De façon similaire, les patients qui poursuivent l’HDD pour une longue période
après leur formation présentent un avantage économique accru par rapport aux patients qui ont
un échec de technique hâtif suivi d’un retour un HD hospitalière (49).
1.3.2 Survie avec l’hémodialyse à domicile et l’hémodialyse hospitalière
Plusieurs études de cohortes et de registres ont évalué la survie des patients en HDD, montrant
le plus souvent une excellente survie avec, par exemple, une survie à 1 an supérieure à 95% et
à 5 ans supérieure à 80% dans deux cohortes australiennes et canadiennes traitées
principalement avec de l’HDD nocturne (90, 91).

12
De façon similaire, des études observationnelles ont rapporté une plus faible mortalité, malgré
diverses stratégies d’ajustement, chez les patients traités par HDD comparativement aux
patients traités par HD hospitalière (55, 92-96). Une étude issue du registre d’Australie et
Nouvelle-Zélande incluant tous les nouveaux patients avec insuffisance rénale terminale entre
1996 et 2007 avait, par exemple, montré une réduction du risque de la mortalité ajustée de près
de 50% (HR 0.53, IC 95% 0.41-0.68) comparativement aux patient avec HD conventionnelle
hospitalière (55).
Une seconde étude issue d’un registre international de dialyse (France, Canada, États-Unis)
rapportait une grandeur d’effet similaire comparant, encore une fois, les patients avec HDD
intensive et HD hospitalière conventionnelle (HR 0.55, IC 95% 0.34-0.87) (92). Plus
récemment, une association comparable a été décrite chez la population néo-zélandaise avec
une mortalité près de deux fois plus basse chez les patients traités par HDD par rapport aux
patients traités par HD conventionnelle hospitalière (HR 0.48, IC 95% 0.41-0.56) (62).
Une réduction plus modeste de la mortalité a été rapportée chez les patients traités par HDD
quotidienne courte, notamment dans une étude avec la base de données du US Renal Data
System (USRDS) où les patients sous HDD quotidienne courte étaient appariés à des patients
avec HD conventionnelle hospitalière (HR 0.87, IC 95% 0.78-0.97) (96).
Dans tous les cas, aucune donnée issue d’études randomisées avec une puissance suffisante
n’a été publiée pour préciser l’effet de l’HDD sur la mortalité. Cette limite s’explique
notamment par les difficultés de recrutement dans les études tentant d’évaluer l’effet de la
fréquence et/ou l’intensité de l’HD (97).
13
1.4 Comparaison entre la dialyse péritonéale et l’hémodialyse à
domicile
Malgré l’intérêt grandissant pour les modalités de dialyse à domicile, peu de données
probantes ont été publiées pour comparer directement les répercussions cliniques de la DP et
de l’HDD.
Une étude observationnelle du Royaume-Uni évaluant la survie des patients incidents en HDD
(mais potentiellement prévalents en dialyse) entre 1997 et 2005 avait rapporté une mortalité
inférieure chez 225 patients traités par HDD comparativement à 900 patients traités par DP
(HR 0.61, IC 95% 0.40-0.93) (98). Toutefois, cette analyse évaluait tous les patients ayant
débuté l’HDD (peu importe le délai après de début de la thérapie de suppléance rénale) alors
que seuls les patients traités par DP moins de 90 jours après le début de la dialyse étaient
analysés. Bien que les auteurs aient utilisé une analyse variable selon le temps (time-
dependent), la différence du critère de sélection entre les deux groupes introduisait un
potentiel biais de survie dans les résultats (98).
Dans une analyse de toute la population avec traitement de suppléance rénale en Australie et
Nouvelle-Zélande entre 1996 et 2007, le traitement par HDD intensif était associé à une
diminution significative du risque de décès (HR 0.53, IC 95% 0.41-0.68) comparativement à
l’HD hospitalière conventionnelle alors que le traitement par DP montrait une association avec
une légère hausse de la mortalité (HR 1.10, IC 95% 1.06-1.16) (55). Dans tous les cas, la
comparaison entre l’HDD et la DP demeurait indirecte et cette cohorte, englobant toutes les
modalités utilisées pour un patient durant la période à l’étude et analysée selon un modèle de
structure marginal, ne pouvait témoigner de l’effet de chaque modalité chez les patients
débutant la suppléance rénale (55).
Plus récemment, une étude chez tous les patients prévalents en dialyse en Nouvelle-Zélande a
montré une association semblable soit, une plus faible mortalité sous HDD (HR 0.48, IC 95%
0.41-0.56) et un risque de décès similaire sous DP (HR 0.98, IC 95% 0.90-1.06),

14
comparativement à l’HD conventionnelle (62). Dans les deux cas, une interaction était
présente avec le temps, avec un effet plus bénéfique de l’HDD et la DP durant les trois
premières années de traitement. Cette fois encore, cette étude englobait les cohortes
prévalentes en dialyse selon une approche « time-dependent » si bien que l’effet des modalités
au moment de l’initiation de la dialyse demeurait incertain (62).
Depuis la publication (ou l’acceptation) des articles ci-joints, quelques études supplémentaires
ont été publiées concernant la survie en DP et HDD. Une étude américaine avec 4200 patients
traités par HDD quotidienne courte (avec la technique de dialysat à faible débit NxStage) et
jumelés à des patients en DP a montré une mortalité inférieure chez les patients avec HHD
(HR 0.80, IC 95% 0.73-0.87) (99). Toutefois, cette cohorte était principalement prévalente en
thérapie de suppléance rénale avec un historique moyen de 44 mois en dialyse avant le début
de l’étude. De plus, lorsque seuls les patients ayant initié la dialyse à domicile durant les six
premiers mois après le début de la thérapie de remplacement rénal étaient considérés,
l’avantage de l’HDD se dissipait (HR 0.95, IC 95% 0.80-1.13) (99).
Récemment, une étude très similaire, issue de données du USRDS avec, encore une fois des
patients recevant de l’HDD quotidienne courte ayant été appariés à des patients traités par HD
conventionnelle, a montré des résultats concordants, c’est-à-dire une mortalité de 25% plus
basse chez les patients sous HDD (HR 0.75, IC 95% 0.68-0.82) (100). Dans ces deux études,
les résultats sont toutefois limités par l’évaluation de patients prévalents en dialyse avec une
durée de traitement préalable à l’étude de plus de deux à quatre ans. Ceci peut potentiellement
limiter la généralisation des résultats aux cohortes incidentes en dialyse, surtout considérant
les bénéfices potentiellement plus marqués de la DP pour la ou les premières années après le
début de la suppléance rénale. La seconde étude, récemment publiée, rapportait toutefois un
bénéfice préservé de l’HDD, même chez les patients ayant initié la dialyse à domicile moins
de six mois après le début de la suppléance rénale (100).

15
1.5 Rationnelle pour le modèle de dialyse à domicile intégrée
Face à l’intérêt grandissant pour les techniques de dialyse à domicile, une interrogation
persiste quant à la place de chacune des modalités à domicile (DP et HDD) dans le parcours
du patient avec insuffisance rénale terminale. En effet, bien que la majorité des études tentent
de définir l’impact des différentes modalités de dialyse prises individuellement, une grande
proportion de patients transfèrent d’une modalité à l’autre durant leur vie en dialyse.
Le modèle de dialyse à domicile intégrée, soit l’initiation de la dialyse avec la DP avec un
transfert subséquent en HDD, est calqué sur le modèle de dialyse intégrée classique promu
depuis plus de 15 ans et suggérant l’initiation de la dialyse en DP avec un transfert subséquent
en HD, principalement hospitalière, au moment de l’arrêt de la DP (101, 102).
Le modèle de dialyse à domicile classique reposait initialement sur les résultats d’une étude
observationnelle belge (avec plus de 400 patients incidents en dialyse) ayant rapporté une
survie supérieure chez les patients traités initialement par la DP et ensuite transférés en HD
hospitalière comparativement à ceux d’abord traités par l’HD puis transférés en DP (102). De
plus, malgré les limites dues au potentiel biais de survie, les patients transférés de la DP vers
l’HD présentaient une survie supérieure à ceux uniquement traités avec la DP.
Dans le contexte actuel où la dialyse à domicile est de plus en plus promue et constatant la
plus grande popularité de l’hémodialyse à domicile, la question persiste à savoir quelle devrait
être la place de l’HDD dans le modèle de dialyse intégrée.
Quelques séries de cas ont été publiées avec des patients traités avec la DP et transférés avec
succès en HDD lors de l’arrêt de la DP. Parmi une cohorte de 69 patients ayant cessé la DP
entre 2003 et 2005 dans un centre universitaire de Toronto, seulement huit avaient été
transférés en HDD. Ces patients avaient fait en moyenne 4.8 ans de DP avant le transfert et
présentaient des causes principalement noninfectieuses pour expliquer leur arrêt de DP (103).
Une série japonaise rapportait avec succès le cas de 10 patients transférés successivement de la
16
DP à une combinaison de la DP + HDD puis finalement l’HDD seule (104). Ces patients
étaient principalement des hommes avec en moyenne quatre ans de DP préalablement au
transfert. Plus récemment, une étude descriptive d’un autre centre torontois rapportait 12
patients transférés en HDD après l’arrêt de la DP parmi une cohorte de 75 patients avec échec
de DP. Les patients transférés en HDD étaient plus jeunes que ceux transférés en HD
hospitalière (47.7 versus 60.3 ans) et avaient, ici encore, principalement des causes non-
infectieuses pour expliquer l’arrêt de la DP (105).
Avant l’initiation de ce projet de maîtrise, les seules données publiées évaluant spécifiquement
les répercussions cliniques de l’HDD après la DP étaient issues de la cohorte de University
Health Network à Toronto. Cette étude (rédigée par moi-même durant une année de formation
complémentaire à Toronto), évaluait la survie des patients et de la technique chez les patients
en HDD avec ou sans exposition préalable en DP. Dans un modèle multivarié, le risque de
décès ou échec de technique n’était pas statistiquement différent pour les patients avec ou sans
DP préalable (HR 1.15, IC 95% 0.51-2.59) (106). Toutefois, les résultats de l’étude étaient
notamment limités par une durée d’IRT significativement plus longue chez les patients avec
DP, laissant place, malgré une tentative d’ajustement multivariée, à un potentiel biais de survie
dans le groupe avec DP préalable.
Au final, l’intérêt du nouveau paradigme qu’est le modèle de dialyse à domicile intégrée
réside sur la maximisation des avantages de la dialyse à domicile avec l’optimisation des
bénéfices, surtout initiaux, de la DP suivi de ceux, potentiellement plus importants à long
terme, de l’HDD. L’objectif demeure d’offrir le meilleur traitement de dialyse au patient tout
en maximisant, autant que possible, la durée du traitement à domicile. Dans tous les cas, les
répercussions cliniques du modèle de dialyse à domicile intégrée demeurent imprécises et
seront explorées dans le présent mémoire.
17
2 – Méthodologie
La méthodologie détaillée pour les trois articles inclus dans ce mémoire se trouve dans la
section méthodologie de chaque article. Par souci d’unicité et afin de ne pas répéter indûment
les mêmes informations, le présent chapitre s’intéressera principalement à la population
globale évaluée dans ce mémoire, l’élaboration des questions de recherche et les stratégies
d’analyse utilisées afin d’éviter – autant que possible – les principaux biais épidémiologiques
rencontrés.
2.1 Population et base de données étudiées
Choix de la base de données
Le choix de l’évaluation des modalités de dialyse à domicile au sein de la population
d’Australie et de Nouvelle-Zélande s’explique par plusieurs éléments. D’abord, l’Australie et
la Nouvelle-Zélande sont deux pays avec un niveau socioéconomique similaire à celui du
Canada. Leur système de santé est également comparable avec un accès universel aux
traitements médicaux comme c’est le cas au Canada.
Deuxièmement, au niveau de la recherche, il existe une excellente base de données,
« Australia and New Zealand Dialysis and Transplant Registry » (ANZDATA), qui permet
d’avoir accès à toutes les données principales chez tous les patients ayant recours à la thérapie
de suppléance rénale dans ces deux pays, et ce, de façon rigoureuse tel que démontré par les
nombreuses publications de qualité émanant du ANZDATA (55, 56, 107-109).
Cette base de données, remplie obligatoirement par chacun des centres de dialyse d’Australie
et Nouvelle-Zélande au minimum une fois par année, comporte un faible nombre de données
manquantes, surtout pour les données de bases et de survies (principalement utilisées dans ce
projet), ce qui augmente la validité des résultats obtenus (107).
18
Finalement, le choix d’évaluer les données d’Australie et de la Nouvelle-Zélande repose aussi
sur la grande proportion de patients traités avec DP et HDD dans ces pays. En effet, cette
région du monde est reconnue en tant que chef de file mondial pour la dialyse à domicile avec
une proportion de patients traités par la DP égale à 32% en Nouvelle-Zélande et 20% en
Australie, et une proportion de patients traités par l’HD à domicile égale à 18% en Nouvelle-
Zélande et 9% en Australie (8). En raison de notre question de recherche voulant notamment
évaluer les transitions entre les modalités de dialyse à domicile, il apparaissait essentiel que le
nombre total (et la proportion) de patients traités à domicile soit suffisamment élevé, d’où le
choix de l’utilisation des données du ANZDATA.
Population
Pour les trois articles inclus dans ce mémoire, toute la population adulte (≥ 18 ans) d’Australie
et de Nouvelle-Zélande ayant débuté la thérapie de suppléance rénale entre le 1er janvier 2000
et le 31 décembre 2012 a été incluse. Les patients ayant reçu des traitements de dialyse durant
moins de 90 jours et ceux ayant débuté la thérapie de suppléance rénale à l’extérieur de
l’Australie et de la Nouvelle-Zélande ont été exclus.
19
2.2 Questions de recherche
L’objectif principal de ce mémoire était d’évaluer le modèle de dialyse à domicile intégrée,
soit l’initiation de la thérapie de suppléance rénale avec la DP, suivi du transfert en HDD après
l’arrêt de la DP. L’hypothèse principale était que le modèle de dialyse à domicile intégrée
serait associé à des répercussions cliniques similaires ou supérieures au traitement initial par
DP ou HDD.
Afin de répondre à la principale question de recherche, trois sous-questions ont été élaborées.
D’abord, devant le peu d’évidences publiées comparant le traitement initial par DP et HDD, il
a été planifié de comparer la survie globalement des patients incidents à la thérapie de
suppléance rénale et traités initialement par la DP ou l’HDD.
Disposant maintenant de données pour le traitement individuel par chacune des modalités de
dialyse à domicile, le modèle de dialyse à domicile intégrée a été évalué en comparant la
survie de la technique à domicile et des patients traités selon le principe du modèle de dialyse
à domicile intégrée (PD puis HDD) comparativement à ceux traités initialement et uniquement
par DP ou HDD.
Finalement, il a été déterminé d’évaluer les prédicteurs de la réalisation du modèle de dialyse à
domicile intégrée, selon différentes définitions, au sein des patients ayant expérimenté un
échec de technique de la DP et de toute la cohorte ayant débuté la suppléance rénale en DP.
Les critères de répercussions primaires et secondaires spécifiques pour chacun des articles
inclus dans ce mémoire sont détaillés dans la section méthodologie des trois articles ci-contre.
20
2.3 Stratégies d’analyse
2.3.1 Modèle épidémiologique
En raison du thème et des principales questions de recherche, le modèle de recherche de ce
mémoire devait être observationnel (ou par analyse de base de données), puisqu’un devis de
recherche de type randomisé se serait avéré très difficilement réalisable considérant l’impact
du traitement étudié sur le mode de vie des patients (97). Le choix de l’analyse du registre du
ANZDATA a été détaillé ci-haut.
2.3.2 Approche statistique
Modèles de survie
Les principales questions de recherche évaluées dans ce projet concernent la survie (et la
mortalité) des patients traités par différentes modalités de dialyse et les analyses de survie
constituent donc la base des analyses statistiques effectuées dans les articles ci-contre. Les
différents modèles de survies utilisés incluent la courbe de survie de Kaplan-Meier (KM)
(110), le modèle de survie de Cox (avec risques proportionnels) (111) ainsi que le modèle de
risque compétitif de Fine & Gray (112). Le modèle de risque compétitif a été utilisé en analyse
de sensibilité étant donné un possible biais lié à la censure des patients au moment de la
transplantation rénale, principalement dans un contexte de déséquilibre entre la proportion de
transplantations réalisées dans les groupes (113).
Dans chaque article, le respect du postulat de proportionnalité des risques pour le modèle de
Cox (proportional hazard assumption) a été vérifié par des graphiques « log-minus-log »,
courbes observées (KM) versus prédites (Cox) et la représentation graphique des résidus de
Schoenfeld (114).
Dans les trois articles inclus dans ce mémoire, l’ajustement des résultats pour les potentiels
facteurs de confusion était de la plus haute importance en raison des différences majeures
reconnues entre les patients traités par les différentes modalités de dialyse à domicile (115).

21
Modèle d’ajustement multivarié
Diverses stratégies d’ajustement ont été utilisées dans chacun des articles. D’abord, dans le 1er
article, un modèle multivarié de Cox a été construit. Les variables initialement incluses dans le
modèle multivarié ont été sélectionnées a priori en fonction de leur plausibilité biologique et
des données publiées antérieurement. Par la suite, les autres facteurs de confusion potentiels
ont été éliminés du modèle final lorsque leur retrait ne modifiait pas le ratio de risque (hazard
ratio HR) principal de plus de 5% (114, 116). Pour cette première analyse ainsi que pour les
analyses des articles subséquents, la présence d’interaction à deux niveaux (two-way) a été
testée pour des variables présélectionnées à l’aide du test de rapport de vraisemblance
(likelihood ratio). Des analyses de sous-groupes ont été faites en présence d’interaction
significative (p<0.05).
Score de propension
Bien que le modèle multivarié de Cox soit fréquemment utilisé dans l’ajustement des analyses
de survie, ce dernier permet uniquement d’ajuster pour les facteurs de confusion connus et
pour lesquels les données sont disponibles. De plus, le nombre de facteurs de confusion
potentiels inclus dans les modèles multivariés est parfois limité par le nombre restreint
d’évènements (ou de patients) dans les cohortes (114). L’utilisation d’un score de propension
permet d’ajuster pour des potentiels facteurs de confusion connus et possiblement inconnus.
Différentes approches peuvent être utilisées avec le score de propension, soit l’appariement
(matching), la stratification et l’ajustement (117).
Dans le cadre du premier article de ce mémoire comparant l’initiation de la dialyse en DP et
HDD, un score de propension a été calculé dans un modèle de régression logistique afin de
prédire la modalité de traitement à 90 jours (DP versus HDD). Le risque de mortalité a ensuite
été analysé en ajustant pour les quintiles du score de propension. Finalement, le score de
propension a été utilisé dans un appariement sans remplacement 1 :1 (propensity score
matching) où chaque patient avec HDD a été associé à un patient avec DP (118). La différence
standardisée (standardized difference) a été calculée entre les deux groupes avant et après
l’appariement.
22
Une approche similaire a été utilisée dans le second article où le traitement par DP, HDD ou
DP puis HDD (modèle de dialyse à domicile intégrée) a été prédit dans une régression
logistique multinomiale. Les patients du groupe d’intérêt (DP + HDD) ont par la suite été
appariés 1 :2 avec les patients traités uniquement par DP et HDD.
Atténuation du biais de survie
Dans le 2e article, une stratégie a dû être adoptée afin d’éviter le biais de survie chez les
patients dans le groupe DP + HDD (comparativement aux groupes DP seul et HDD seul). En
effet, les patients traités successivement par la DP et l’HDD étaient potentiellement sujets à un
biais de survie (immortal time bias) puisqu’ils devaient vraisemblablement survivre un certain
temps avant d’être transférés de la DP à l’HDD.
Afin de minimiser ce biais, pour chaque jumelage entre un patient du groupe d’intérêt (DP +
HDD) et un patient du groupe DP seul ou HHD seul, la survie dans la modalité initiale (du
patient en DP ou HHD) devait être supérieure à la durée de temps après laquelle le patient du
groupe DP + HHD transférait vers l’HDD (119). De plus, toutes les analyses de survie
effectuée dans le 2e article, ont eu comme point de départ le moment du jumelage, soit le
moment du transfert en HDD dans le groupe d’intérêt et le suivi après la période de
l’appariement pour les autres groupes.
Régression logistique multivariée
L’évaluation des prédicteurs d’un transfert vers l’HDD chez les patients traités par DP s’est
effectuée selon deux approches. D’abord, une régression logistique multivariée a été planifiée
afin d’identifier les caractéristiques associées au transfert en HDD dans la cohorte restreinte de
patients en DP avec un arrêt de technique (excluant le décès ou la transplantation). La
calibration et discrimination du modèle final ont été évaluées la par méthode de « goodness-
of-fit » et la statistique-C (aire sous la courbe), respectivement (120).

23
Un second modèle basé sur une analyse de risque compétitif a été réalisé pour évaluer les
prédicteurs de transfert vers l’HDD chez tous les patients ayant initié la DP, en considérant le
décès et le transfert en transplantation rénale en tant qu’évènements compétitifs.
Principales définitions
Les définitions détaillées de chacun des critères de répercussion principaux et secondaires sont
spécifiées dans les articles ci-joints. De façon globale, la cohorte de patients incluse dans ce
mémoire comportait tous les patients incidents à la thérapie de suppléance rénale et traités par
la DP ou l’HDD 90 jours après le début de la dialyse. Cette définition se base sur le concept de
dialyse chronique, défini par plusieurs instances comme 90 jours ou plus de traitement.
Dans les analyses principales, l’échec de technique a été défini par l’arrêt d’une modalité pour
90 jours successifs. Cette définition a été choisie afin d’éviter les périodes d’HD hospitalière
transitoires suivie d’un retour à la modalité à domicile initiale. En effet, dans certains cas, et
plus spécifiquement pour la DP, des complications infectieuses ou autres peuvent mener à un
transfert transitoire en HD hospitalière suivi d’un retour vers la modalité à domicile (90, 121).
Dans l’étude des patients ayant transféré de la DP à l’HDD, la transition directe entre la DP et
l’HDD a été définie comme une transition avec un délai de moins de 90 jours entre l’arrêt de
la DP et l’initiation de l’HDD (ou l’entraînement pour l’HDD qui définit le traitement par
HDD dans le ANZDATA).
Dans tous les cas, les évènements (décès, transplantation) survenus moins de 90 jours après un
changement de modalité ont été attribués à la modalité précédente. En raison de l’absence de
consensus par rapport à plusieurs définitions utilisées dans ce mémoire (patients incidents,
échec de technique, transition directe, période d’attributions après un changement de
modalité), plusieurs analyses de sensibilité, variant les intervalles de temps utilisés dans les
définitions ci-haut, ont été effectuées dans les trois articles afin de valider la concordance des
résultats.

24
3 - Initiation de la suppléance rénale avec la dialyse
péritonéale et l’hémodialyse à domicile
3.1 Sommaire du premier article
Chez les patients initiant la suppléance rénale, le choix de la modalité de dialyse est
primordial. Les thérapies de dialyse à domicile sont souvent privilégiées lors de l’initiation de
la dialyse en raison de leurs bénéfices liés à la préservation de l’autonomie, l’amélioration de
la qualité de vie et les avantages socioéconomiques. Dans les dernières années, tel que
mentionné précédemment, plusieurs organismes et juridictions ont d’ailleurs tenté d’inciter les
néphrologues à promouvoir la dialyse à domicile auprès des patients touchés par l’insuffisance
rénale terminale.
Peu de données probantes ont toutefois été publiées pour comparer les répercussions cliniques
des patients traités par la dialyse péritonéale et l’hémodialyse à domicile, principalement au
moment de l’initiation de la dialyse.
L’article qui suit se penche précisément sur l’évaluation de la survie globale des patients ayant
débuté la thérapie de remplacement rénale avec la dialyse péritonéale ou l’hémodialyse à
domicile, en Australie et en Nouvelle-Zélande, entre janvier 2000 et décembre 2012.
Dans cette population, le traitement initial par HDD s’est montré être associé à une mortalité
près de 50% inférieure comparativement au traitement par DP, et ce, de façon constante en
utilisant différentes approches d’ajustement pour les facteurs confondants potentiels.
25
3.2 Article 1 - An incident cohort study comparing survival on
home hemodialysis and peritoneal dialysis – a multicenter
ANZDATA Registry analysis.
Le manuscrit ci-dessous a été publié dans le Clinical Journal of the American Society of
Nephrology (CJASN) le 7 août 2015.
Je suis le 1er auteur de cet article. J’ai joué un rôle de premier plan dans l’élaboration de la
question de recherche et des hypothèses, la revue de littérature, la conception et l’exécution
des analyses statistiques, ainsi que la rédaction.
26
An incident cohort study comparing survival on home hemodialysis and peritoneal
dialysis – a multicenter ANZDATA Registry analysis.
Annie-Claire Nadeau-Fredette MD1,2,3, Carmel Hawley MBBS (Hons) M Med Sci1,2,4, Elaine
Pascoe MBiostat5, Christopher T Chan MD6, Philip A. Clayton PhD2,7, Kevan R.
Polkinghorne MBChB PhD2,8,9, Neil Boudville MBBS MMedSci2,10, Martine Leblanc3, David
W Johnson MBBS (Hons) PhD1,2,4 1Department of Renal Medicine, University of Queensland at Princess Alexandra Hospital,
Brisbane, Australia; 2Australia and New Zealand Dialysis and Transplant Registry,
Adelaide, Australia; 3Université de Montreal, Montreal, Canada; 4Centre for Kidney
Disease Research, Translational Research Institute, Brisbane, Australia; 5School of
Medicine, University of Queensland, Brisbane, Australia; 6Toronto General Hospital,
University Health Network, University of Toronto,
Toronto, Canada; 7 Sydney Medical School, University of Sydney, Sydney, Australia; 8Department of Nephrology, Monash Medical Centre Monash Health, Clayton, Australia; 9Departments of Medicine & Epidemiology & Preventative Medicine, Monash University,
Melbourne, Australia; 10School of Medicine and Pharmacology, University of Western
Australia, Perth, Australia
Corresponding author:
Professor David Johnson,
Department of Nephrology,
Tel: XXXXX
Fax: XXXXX
Email: XXXXX
Running title: Incident home hemodialysis and peritoneal dialysis

27
Abstract word count: 261
Manuscript word count: 3240
Key words: Peritoneal dialysis, Home hemodialysis, survival, technique failure, ANZDATA

28
Abstract
Background and objectives
Home dialysis is often recognized as a first-choice therapy for patients initiating dialysis.
However, studies comparing clinical outcomes between peritoneal dialysis and home
hemodialysis have been very limited.
Design, setting, participants, and measurements
This Australia and New Zealand Dialysis and Transplantation (ANZDATA) registry study
assessed all Australian and New Zealand adult patients receiving home dialysis on day 90 after
initiation of renal replacement therapy between 2000 and 2012. The primary outcome was
overall survival. The secondary outcomes were ‘on-treatment’ survival, patient and technique
survival, and death-censored technique survival. All results were adjusted with three pre-
specified models: multivariable Cox proportional hazards model (main model), propensity
score quintile-stratified model and PS matched model.
Results
The study included 10,710 incident peritoneal dialysis patients and 706 incident home
hemodialysis patients. Treatment with home hemodialysis was associated with better patient
survival than treatment with peritoneal dialysis (5-year survival 85% versus 44%, respectively,
log-rank p<0.001). Using multivariable Cox proportional hazards analysis, home hemodialysis
was associated with superior patient survival (adjusted hazard ratio [HR] 0.47, 95%
confidence interval [CI] 0.38-0.59), as well as better on-treatment survival (HR 0.34, 95% CI
0.26-0.45), composite patient and technique survival (HR 0.34, 95% CI 0.29-0.40) and death-
censored technique survival (HR 0.34, 95% CI 0.28-0.41). Similar results were obtained with
the propensity score models, as well as with sensitivity analyses using competing risks models
and different definitions for technique failure and lag period after modality switch during
which events were attributed to the initial modality.
Conclusions
Home hemodialysis was associated with superior patient and technique survival compared to
peritoneal dialysis.

29
Introduction
Interest in home dialysis has been intensifying in the nephrology community over recent years
(122). Home dialysis is frequently considered as a first-choice option for patients requiring
dialysis therapy (6, 123-125) as it is reported to improve patient autonomy and quality of life
while providing equal, if not superior, outcomes compared to facility hemodialysis (50, 53, 62,
65, 69, 126). From the socio-economic perspective, home dialysis limits dialysis-related costs
(11, 44, 87).
Peritoneal dialysis (PD), the commonest home-based dialysis modality, has generally been
associated with comparable survival to that of facility hemodialysis, and possibly superior
survival in young, non-diabetic, non-overweight patients and during the early years after
replacement therapy (RRT) initiation (50-58). Similarly, cohort studies have generally
reported a survival benefit of home hemodialysis (HHD) compared to facility hemodialysis,
irrespective of the dialysis regimen employed (55, 62, 92-96). However, only a few studies
have directly compared clinical outcomes of PD and HHD (55, 62, 98), and none have
specifically evaluated patients initiating RRT with a home-based modality.
The aim of this study was to compare the survival of incident, HHD and PD patients in
Australia and New Zealand between 2000 and 2012. The secondary objectives were to
compare ‘on-treatment’ survival, composite patient and technique survival, and death-
censored technique survival between these two groups.
Material and Methods
Study design and population
This observational cohort study included all incident, adult home dialysis patients in Australia
and New Zealand between January 1st 2000 and December 31st 2012. Cohorts were defined by
home dialysis modality (PD or HHD) on day 90 after RRT initiation. Patients <18 years and
those with <90 days of RRT therapy were excluded. Data were prospectively collected from
30
each dialysis center and transmitted to the Australia and New Zealand Dialysis and Transplant
(ANZDATA) Registry.
Exposure assessment
PD was defined by treatment with continuous ambulatory PD or automated PD. HHD included
all forms of hemodialysis performed in a home setting (conventional, long, frequent or
long/frequent sessions). Conventional hemodialysis machines were used to provide HHD
treatments. Most Australian and New Zealand centers allow HHD patients to dialyze without a
helper. Units followed the small solute clearance targets recommended by the CARI
guidelines for PD (127) and hemodialysis (128).
Outcomes assessment
The primary outcome was patient survival. Patients were followed until death, without
consideration of a switch in dialysis modality. In all analyses, data were censored at the time
of kidney transplantation, loss to follow up, kidney function recovery and the end of the study
(December 1st, 2012). Follow-up time started at day 90 after RRT initiation.
Secondary outcomes included [1] ‘on-treatment’ survival, [2] composite patient and technique
survival, and [3] death-censored technique survival. ‘On-treatment’ survival was defined by
any death occurring during the initial home dialysis modality and up to 90 days after a switch
from this modality (90). Patients were censored at the time of technique failure.
In the composite patient and technique survival assessment, patients were followed until the
first occurrence of technique failure or death. Technique failure was defined as ≥90 days of
facility dialysis or the other home modality in order to allow use of temporary hemodialysis,
especially among the PD cohort (121). Any event occurring <90 days after a switch from the
initial home modality was considered to have occurred while the patient was on the initial
modality.
For death-censored technique survival analysis, only technique failure was considered a failure
event and data were censored at the time of death.

31
Covariates assessment
All baseline characteristics were determined at the time of RRT inception. Less than 1% of all
covariate data were missing and such patients were excluded from the analyses, when
applicable. In the main analysis, race was dichotomized as Non-Indigenous or Indigenous,
where the latter, for the purpose of the study, included Australian Aboriginals, Torres Strait
Islanders, Maoris and Pacific Islanders. Primary renal disease was categorized as
“glomerulonephritis/autoimmune” and “other”. Late referral was defined as referral to a
nephrologist <3 months before RRT initiation. Estimated glomerular filtration rate (eGFR)
(129) was calculated for each patient using creatinine at time of RRT initiationusing the 4-
variable Modification of Diet in Renal Disease equation, without any adjustment for racial
minorities considering the racial distribution in Australia and New Zealand (129, 130).
Statistical analysis
Survival times were analyzed with the Kaplan-Meier (KM) product limit method and
compared between PD and HHD cohorts using the log-rank test.
Adjusted analyses were performed with three pre-specified statistical approaches: (1)
multivariable Cox proportional hazards model (main model); (2) propensity score (PS) Cox
model with PS quintiles stratification; and (3) PS matching Cox model.
Multivariable models
The main analysis was performed with a multivariable Cox proportional hazards regression
model (111). Multivariable Cox models were constructed using all covariates listed in Table 1.
The following variables were pre-specified as potential confounders and forced into the
model: age, sex, race, diabetes and primary kidney disease. Other potential confounders were
removed when their exclusion did not appreciably change (<5%) the hazard ratio (HR) of
dialysis modality compared to the complete model (131). The final model was based on
variables selected a priori, biological plausibility, statistical significance and our aim to select
a parsimonious model, and included: age, sex, race, diabetes, primary renal disease, ischemic
heart disease, peripheral vascular disease and late referral. The proportional hazards

32
assumption was visually assessed with log-minus-log plots, observed (KM) and predicted
(Cox) graphs and plotting of Schoenfeld residuals.
Pre-specified two-way interactions were tested between dialysis modality and the following
covariates: age, race, diabetes, primary kidney disease. Interaction effects were assessed with
likelihood ratio. Where an interaction was statistically significant (p-values<0.05), subgroup
analyses were performed. A time varying effect of dialysis modality on outcomes was also
assessed with the likelihood ratio test.
Propensity score models
As the number of covariates in the main model was limited, the results were validated with
two propensity score (PS) approaches (132). The dialysis modality at 90 days was predicted
with a logistic regression model that estimated treatment assignment with all the covariates
listed in Table 1. Race was collapsed into three groups (Caucasian, Asian and
Indigenous/other). All two-way interactions involving age, race, diabetes mellitus and primary
kidney disease with other covariates were evaluated and included in the final logistic
regression model when significant. The final logistic regression model included covariates in
Table 1 and the following interaction terms: age by sex, age by ischemic heart disease, race by
BMI, race by peripheral vascular disease, diabetes by BMI and diabetes by era. The PS
obtained from this logistic regression model was evaluated with a receiver-operating curve
(area under curve 0.84) and for covariate balance within quintiles of PS.
Survival times were analyzed using Cox proportional hazards models with dialysis modality as
the exposure variable and stratification for PS quintiles. Finally, the continuous PS was used to
perform 1:1 nearest neighbor matching without replacement (118). Survival times for the
matched dialysis modality groups were compared using Cox proportional hazards models with
robust standard errors. Standardized differences before and after matching were calculated
(Figure S2).
Sensitivity analysis
33
Fine and Gray competing risk survival models (112) were performed with the covariates
included in the main model and transplantation as the competing event. Death-censored
technique failure was evaluated in a specific model with death and transplantation considered
as a composite competing event. In a second sensitivity analysis, the definition of technique
failure and the lag period after a modality switch during which events were attributed to the
initial PD/HHD modality were changed to 30 days (instead of 90 days for each in the main
analysis). A third sensitivity analysis compared survival outcomes starting from the initiation
of home dialysis training, whenever this training was initiated during the first 90 days of RRT.
A fourth sensitivity model compared primary and secondary outcomes with an adjustment for
the proportion of patients treated with PD (10% to 40%) or HHD (2.5% to 16%) in each
Australian state and New Zealand. A fifth sensitivity model restricted the study cohort to
patients treated with home dialysis for at least 60 days.
All statistical analyses were performed using Stata IC software (version 12.1 StataCorp,
College Station, TX). A two-tailed P-value <0.05 was considered statistically significant.
Results
The study included 11,416 incident home dialysis patients at 90 days after RRT initiation. Of
these, 10,710 patients received PD and 706 patients received HHD. Baseline characteristics
stratified by dialysis modality are displayed in Table 1. Overall, patients treated with HHD
were younger and healthier than patients treated with PD. Baseline characteristics of patients
included in the PS matched cohort are presented in Table S1.
Patient survival
A total of 5056 events were observed in the primary analysis, with 4970 and 86 deaths in the
PD and HHD cohorts, respectively. Patients with HHD had a significantly lower mortality in
the unadjusted analysis (HR 0.25, 95% confidence interval (CI) 0.21-0.32) with respective 1, 2
and 5-year survival rates of 98%, 95% and 85%, in the HHD cohort compared to 89%, 76%
and 44% in the PD cohort (log-rank p<0.001) (Figure 1). In the multivariable Cox model, the
lower risk of death associated with HHD compared to PD was attenuated but still highly
significant (HR 0.47, 95% CI 0.38-0.59). Similar results were found in the PS-quintile

34
stratified (HR 0.48, 95% CI 0.39-0.60) and PS matching models (HR 0.48, 95% CI 0.37-0.62)
(Table 2). Adjusted hazard ratios for subgroups formed by age, race, diabetes status and length
of follow-up are presented in Figure 2.
Secondary outcomes
Unadjusted mortality on home dialysis therapy (censored for technique failure) was
significantly lower in the HHD cohort compared to the PD cohort (unadjusted HR 0.17, 95%
CI 0.13-0.22) with 1, 2 and 5-year survival rates of 98%, 96% and 87% versus 89%, 75% and
39% in the HHD and PD cohorts, respectively (log-rank p<0.001) (Figure 3). This association
was also seen in the multivariable Cox proportional hazard model (HR 0.34, 95% CI 0.26-
0.45) and the PS models (Table 3).
The composite risk for death or technique failure was significantly lower in the HHD group
compared to PD (unadjusted HR 0.26, 95% CI 0.23-0.31; adjusted HR 0.34, 95% CI 0.29-
0.40). Similar HRs were obtained with the PS models (Table 3).
The assessment of death-censored technique survival provided similar results with a lower
unadjusted mortality (HR 0.37, 95% CI 0.30-0.44) and adjusted mortality (HR 0.34, 95% CI
0.28-0.41) in the HHD cohort compared to the PD cohort. Analyses for subgroups formed by
age, race and diabetes status are displayed in Figure 2. Overall, the positive association
between HHD and technique survival was attenuated in older age categories, and for
Indigenous and diabetic patients.
Sensitivity analysis
Evaluation of study outcomes with a competing risk approach provided similar results. There
were 86 deaths, 345 transplantations and 275 other censoring events in the HHD cohort, and
4970 deaths, 2088 transplantations and 3651 other censoring events in the PD cohort. For the
primary outcome and with transplantation as a competing risk event, the HR for death was
0.42 (95% CI 0.34-0.52) in favor of the HHD group. The respective HRs for death on a
specific dialysis modality and the composite of death and technique failure in the competing
risk model were 0.33 (95% CI 0.25-0.43) and 0.34 (95% CI 0.29-0.40). In the evaluation of
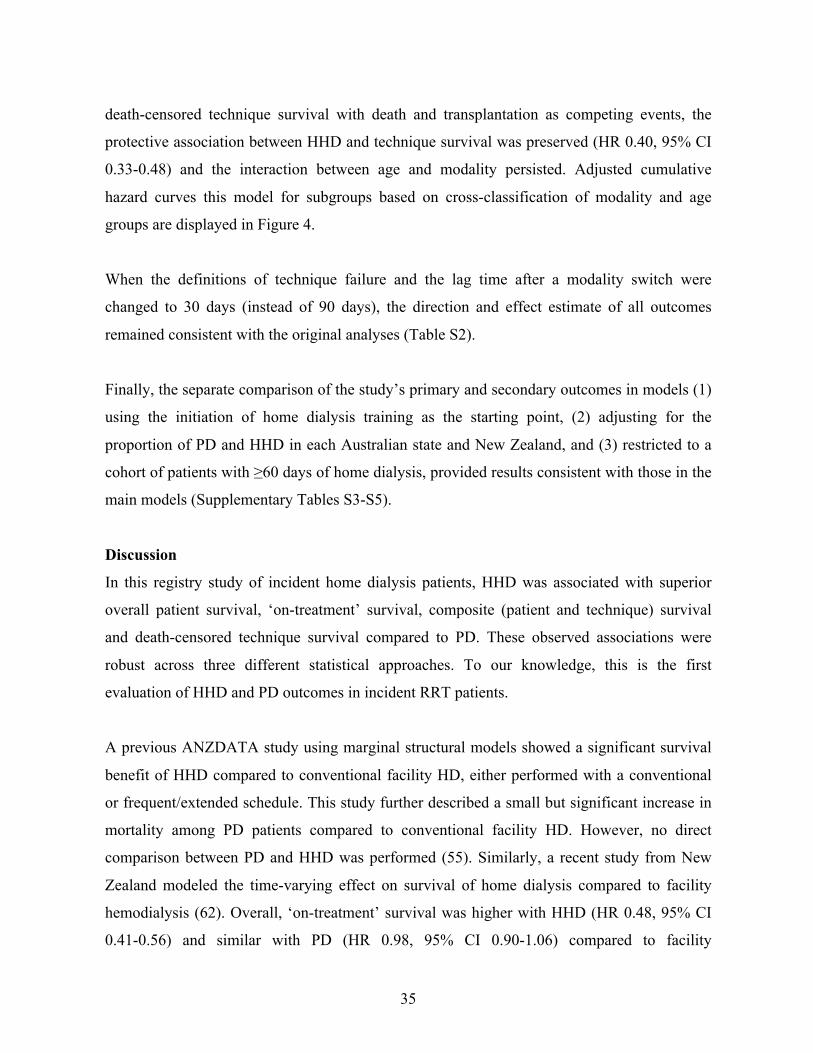
35
death-censored technique survival with death and transplantation as competing events, the
protective association between HHD and technique survival was preserved (HR 0.40, 95% CI
0.33-0.48) and the interaction between age and modality persisted. Adjusted cumulative
hazard curves this model for subgroups based on cross-classification of modality and age
groups are displayed in Figure 4.
When the definitions of technique failure and the lag time after a modality switch were
changed to 30 days (instead of 90 days), the direction and effect estimate of all outcomes
remained consistent with the original analyses (Table S2).
Finally, the separate comparison of the study’s primary and secondary outcomes in models (1)
using the initiation of home dialysis training as the starting point, (2) adjusting for the
proportion of PD and HHD in each Australian state and New Zealand, and (3) restricted to a
cohort of patients with ≥60 days of home dialysis, provided results consistent with those in the
main models (Supplementary Tables S3-S5).
Discussion
In this registry study of incident home dialysis patients, HHD was associated with superior
overall patient survival, ‘on-treatment’ survival, composite (patient and technique) survival
and death-censored technique survival compared to PD. These observed associations were
robust across three different statistical approaches. To our knowledge, this is the first
evaluation of HHD and PD outcomes in incident RRT patients.
A previous ANZDATA study using marginal structural models showed a significant survival
benefit of HHD compared to conventional facility HD, either performed with a conventional
or frequent/extended schedule. This study further described a small but significant increase in
mortality among PD patients compared to conventional facility HD. However, no direct
comparison between PD and HHD was performed (55). Similarly, a recent study from New
Zealand modeled the time-varying effect on survival of home dialysis compared to facility
hemodialysis (62). Overall, ‘on-treatment’ survival was higher with HHD (HR 0.48, 95% CI
0.41-0.56) and similar with PD (HR 0.98, 95% CI 0.90-1.06) compared to facility

36
hemodialysis. However, this study was limited by the inclusion of prevalent patients leading to
possible survivor bias, given that many HHD patients receive sustained facility HD treatment
before transitioning to HHD (98, 115).
A cohort study from England and Wales also reported a survival advantage of HHD over PD
(HR 0.61, 95% CI 0.40-0.93) (98). However, PD patients included in this study were treated
with PD on day 90 after RRT initiation while patients included in the HHD cohort were
prevalent RRT patients (but incident on HHD). This difference potentially limited the
conclusions that could be drawn. Another recent study including prevalent American home
dialysis patients reported increased technique failure among PD patients compared to daily-
HHD patients (HR 3.4, 95% CI 2.9–4.0) (133). Although limited by the prevalent nature of the
cohort and specificities of American dialysis technologies, these results are similar to those
obtained in the present study.
The survival advantage associated with HHD in the present study, as well as in previous
investigations (55, 62, 98), may have been potentially explained by improved volume control
and solute clearance. Non-randomized studies have demonstrated higher survival in patients
treated with HHD compared to conventional facility HD (55, 92-96). Improvement in cardiac
geometry (64, 65, 134), blood pressure (65, 76) and mineral metabolism (65, 134) have also
been reported in randomized trials comparing HHD to facility HD. Although none of these
studies used PD as a comparison group, it is plausible that some of the known benefits of
HHD over facility HD also apply when comparing HHD to PD. Indeed, while PD allows
constant ultrafiltration, total fluid removal can sometimes be limited and possibly lead to
hypervolemia and hypertension (135-138). Comparison of clearance quality between PD and
hemodialysis is limited, although it seems reasonable to postulate that patients treated with
long or long/frequent HHD receive a higher dialysis dose than most PD patients. Although the
benefit of a higher dialysis dose is debatable (65, 139, 140), a difference in dialysis dose may
have played a role in the results of the present study.
Alternatively, the differential survival of HHD and PD patients may have resulted from
indication bias with residual confounding. Fundamental differences between patients choosing

37
PD and HHD have been well described in the literature (115). Patients treated with HHD tend
to be younger, have less comorbidity and have different etiologies of primary kidney disease
(55, 62, 98, 115). They are also less likely to have late nephrology referral, another factor
associated with poor clinical outcomes (141-143). While the previous factors can be addressed
by statistical adjustment, other components, such as commitment to dialysis treatment,
education level, psychological skills, social support and economic status, are much harder to
account for, especially in a registry analysis. Although PD and HHD both require a certain
degree of autonomy and commitment, the relative complexity of HHD demands higher levels
of empowerment, which might have accounted for the relatively small proportion of HHD
patients in this study and the problems encountered with patient recruitment in previous HHD
trials (97). Nephrologists are also known to have a major influence over a patient’s choice of
modality and their own opinion towards PD and HHD can contribute to differences in PD and
HHD cohorts (124, 144-146). Thus, the survival advantage associated with HHD in this
incident cohort could be related to unmeasured differences in patients treated with PD and
HHD rather than by the treatment itself.
In the present investigation, the association between HHD and technique survival was more
important among younger patients than older patients. Interestingly, this interaction revealed a
poorer PD technique survival in younger patients than in older ones, even after adjustment for
other covariates and taking into account transplantation and death in a competing risk model.
This observation may be potentially explained by a higher rate of kidney transplantation in
younger patients as well as a lower threshold to transfer to hemodialysis in the case of
potential or actual PD complications.
The strengths of this study included its large sample size and multi-center design, which
greatly enhanced its external validity. All incident HHD and PD patients in all centers in
Australia and New Zealand (two countries with a very high prevalence of home dialysis) were
included. This study was also the first to evaluate HHD and PD outcomes among incident
RRT patients, thereby mitigating the effect of Neyman (selective survival) bias (147). The
consistency of results across a range of statistical methodologies, including multivariable
adjustment, PS and competing risk analyses, supported the internal validity of the findings.

38
These strengths should be balanced against the study’s limitations, the main ones being the
potential for indication bias and residual confounding. Another limitation was the constrained
depth of data collection by the ANZDATA Registry, such that important patient
characteristics (education level, psychological skills, social support and treatment adherence)
that may have confounded the relationship between home dialysis modality and outcomes
were not collected. Laboratory measures, except for eGFR, could not be incorporated in the
analysis. Further, different PD modalities were not evaluated because of frequent shifts
between them and the fact that these modalities have previously been associated with similar
outcomes (148, 149). Similarly, specific HHD treatment schedules were not examined due to
power issues and inconsistency in classification over the study period. However, previous
ANZDATA studies reported similar outcomes in intensive and conventional HHD, both being
superior to conventional facility HD (55). It should also be acknowledged that a large
proportion of HHD patients in this previous study received 5 hours, three times per week
(considered standard treatment in Australia and New Zealand), which is more than in many
other countries (150). Importantly, this study did not assess the outcomes of patients initiated
on home dialysis after >90 days of RRT, which is a situation more frequently encountered
among patients treated with HHD than PD (55). While the study design allowed for the
evaluation of incident cohorts (thereby mitigating immortal bias), it may not be representative
of overall HHD cohorts and the study results should not be extrapolated to prevalent home
dialysis cohorts. Finally, the findings of this study might not apply to other countries with less
experience in home dialysis or different home dialysis practices and technologies.
In conclusion, treatment with HHD on day 90 after RRT initiation was associated with a two-
fold higher survival compared to treatment with PD. Whether or not this advantage is due to
the dialysis treatment itself or related to intrinsic patient differences remains uncertain.

39
Figures and Tables Article 1. Figure 1 – Survival curves for primary outcome.
Unadjusted Kaplan-Meier survival curve (A) Log-rank P <0.001, adjusted survival curve for a
50 years non-Indigenous male, with non-glomerular kidney disease and without diabetes,
coronary disease, peripheral vascular disease and late referral (B) and adjusted survival curve
for a 60 years non-Indigenous female, with non-glomerular kidney disease, diabetes and
coronary disease, and without peripheral vascular disease and late referral (C)

40
Figure 2 - Subgroup analyses for primary and secondary outcomes.

41
Figure 3 - Survival curves for secondary outcomes.
Hazard ratios for HHD relative to PD (adjusted in multivariable models) by age group, race
and diabetes status for overall mortality (A), ‘on-treatment’ mortality (B), composite of
mortality and technique failure (C) and technique failure only (D). * P-value for interaction
< 0.05

42
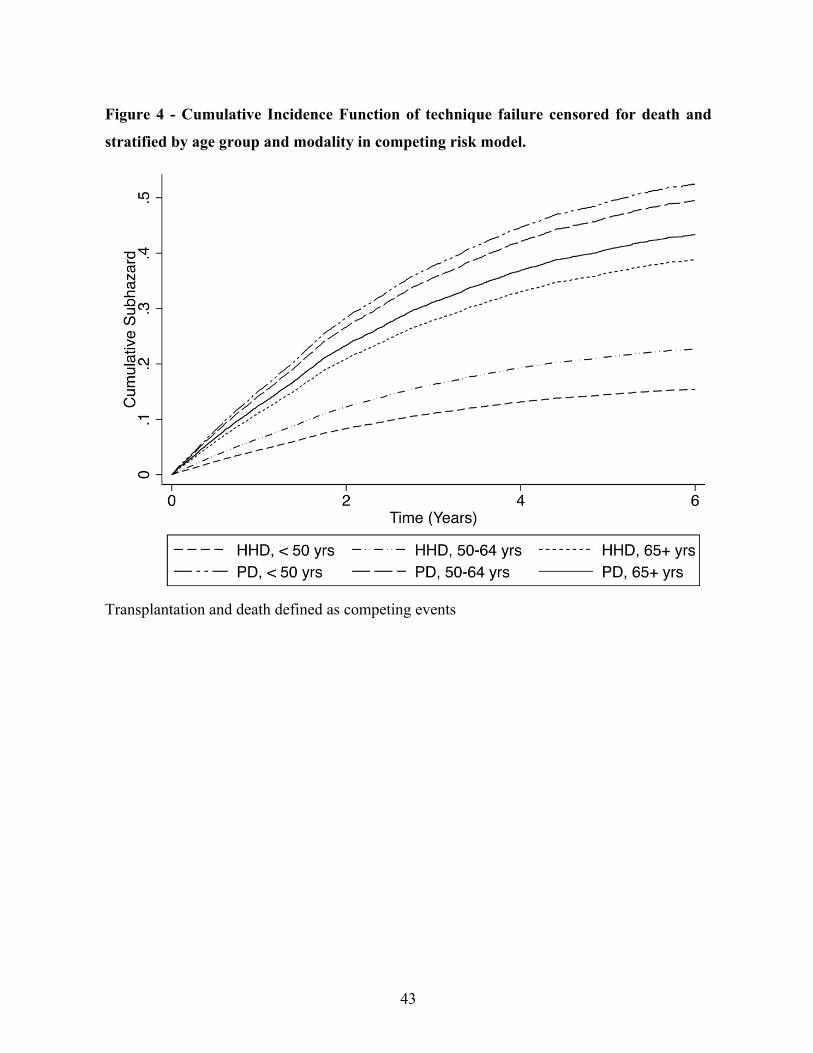
43
Figure 4 - Cumulative Incidence Function of technique failure censored for death and
stratified by age group and modality in competing risk model.
Transplantation and death defined as competing events

44
Article 1. Table 1 – Baseline characteristics
Characteristic PD (n=10 710) HHD (n=706) P
Age 62 (50, 71) 50 (42, 58) <0.001
Sex Male 6082 (57) 531 (75) <0.001
Race <0.001
Caucasian 7389 (69) 590 (84)
Asian 1236 (12) 47 (7)
Aboriginal/Torres Strait
Islander
601 (6) 7 (1)
Maori 899 (8) 33 (5)
Pacific Peoples 468 (4) 24 (3)
Other 117 (1) 5 (1)
Primary kidney disease <0.001
Glomerulonephritis –
autoimmune
2662 (25) 273 (39)
Diabetes 3739 (35) 126 (18)
Hypertension / Renovascular 1526 (14) 47 (7)
Polycystic kidney disease 593 (6) 132 (19)
Reflux 338 (3) 39 (6)
Other/unknown 1852 (17) 89 (13)
Cigarette (current) 1458 (14) 85 (12) 0.23
Comorbidities at dialysis entry
Chronic lung disease 1606 (15) 54 (8) <0.001
Coronary disease 4060 (38) 122 (17) <0.001
Periphery vascular disease 2585 (24) 61 (9) <0.001
Cerebrovascular disease 1594 (15) 32 (5) <0.001
Diabetes 4648 (43) 159 (23) <0.001
Body mass index <0.001
<20 kg/m2 823 (7) 32 (5)

45
20-24.9 kg/m2 3451 (32) 177 (25)
25-29.9 kg/m2 3712 (35) 248 (35)
≥30 kg/m2 2682 (25) 243 (35)
Late referral (< 3 months) 2128 (20) 45 (6) <0.001
eGFR 7.5 (5.6-9,9) 7.5 (5.8-9.4) 0.59
RRT initiation era 0.12
2000-2005 4843 (45) 298 (42)
2006-2012 5876 (55) 408 (58)
Country 0.007
Australia 8090 (76) 565 (80)
New Zealand 2620 (24) 141 (20)
Data are presented as number (percentile) or median (interquartile range). RRT = renal
replacement therapy, eGFR = estimated glomerular filtration rate (Modification of Diet in
Renal Disease [MDRD] study equation)

46
Table 2 –Adjusted hazard ratios for mortality (primary outcome) comparing HHD to PD
Models HR 95% CI p
Main model
Multivariable adjustment$ 0.47 0.38-0.59 <0.001
Secondary models
PS quintile stratified& 0.48 0.39-0.60 <0.001
PS matching (robust)# 0.48 0.37-0.62 <0.001
Sensitivity model
Competing risk * 0.42 0.34-0.52 <0.001 $ Other variables in multivariable model: age, sex, race (indigenous/other), primary kidney
disease (glomerulonephritis/other), diabetes, ischemic heart disease, peripheral vascular
disease, late referral (< 3 months). PD n=10 685, HHD n=705, Significant interaction with
time*modality. See Figure 3 for stratified models. & PS stratified model: PD n=10 638, HHD n=697 # PS matching model: PD n=682, HHD n=682
* Multivariable adjustment model. Transplantation as competing event.

47
Table 3 – Adjusted hazard ratios for secondary outcomes comparing HHD to PD
Models HR 95% CI p
Death on specific dialysis modality
(‘on-treatment’ mortality)
Main model
Multivariable adjustment 0.34 0.26-0.45 <0.001
Secondary models
PS quintile stratification 0.34 0.25-0.44 <0.001
PS matching (robust) 0.32 0.23-0.44 <0.001
Death or technique failure (composite
outcome)
Main model
Multivariable adjustment$ 0.34 0.29-0.40 <0.001
Secondary models
PS quintile stratification 0.33 0.28-0.39 <0.001
PS matching (robust) 0.32 0.26-0.38 <0.001
Technique failure only
Main model
Multivariable adjustment# 0.34 0.28-0.41 <0.001
Secondary models
PS quintile stratification 0.33 0.27-0.40 <0.001
PS matching (robust) 0.32 0.25-0.40 <0.001
Other variables in multivariable model: age, sex, race (indigenous/other), primary kidney
disease (glomerulonephritis/other), diabetes, ischemic heart disease, peripheral vascular
disease, late nephrology referral (< 3 months) $ Significant interactions with race*modality. See Figure 3 for stratified models # Significant interactions with age*modality, race*modality and diabetes*modality. See Figure
2 for stratified models

48
Supplementary data
Figure S1 – Flow chart
Figure S2 - Standardized differences before and after matching
-100 -50 0 50Standardized % bias across covariates
AgeCoronary disease
DiabetesPeripheral vascular disease
Late referralCerebrovascular disease
Race - IndigenousPulmonary disease
BMI, less than 20 kg/m2Country
eGFREra
Cigarette (current)BMI, 25-29.9 kg/m2
BMI, 30 kg/m2 and overKidney disease (GN)
Gender
UnmatchedMatched

49
Figure S3 – Kaplan-Meier survival curve in primary outcome (overall survival) with
propensity score matched model
Log-rank p<0.001
0.00
0.25
0.50
0.75
1.00
Cum
ulat
ive
Surv
ival
682 501 352 264 177 120 78PD682 517 376 272 199 142 95HHD
Number at risk
0 1 2 3 4 5 6Time (Years)
PD HHD

50
Figure S4 - Kaplan-Meier survival curves in secondary outcomes with propensity score
matched models.
(A) ‘On-treatment’ survival, (B) Patient and technique survival, (C) Death-censored technique
survival, Log-rank p<0.001 (A-B-C)
0.00
0.25
0.50
0.75
1.00
Cum
ulat
ive
Surv
ival
682 421 248 141 79 43 22PD682 482 334 232 161 104 65HHD
Number at risk
0 1 2 3 4 5 6Time (Years)
PD HHD
0.00
0.25
0.50
0.75
1.00
Cum
ulat
ive
Surv
ival
682 421 248 141 79 43 22PD682 482 334 232 161 104 65HHD
Number at risk
0 1 2 3 4 5 6Time (Years)
PD HHD
A"
B"
0.00
0.25
0.50
0.75
1.00
Cum
ulat
ive
Surv
ival
682 421 248 141 79 43 22PD682 482 334 232 161 104 65HHD
Number at risk
0 1 2 3 4 5 6Time (Years)
PD HHD
C"

51
Table S1 – Baseline characteristics in propensity score matched model
Characteristic PD (n=682) HHD (n=682) ASD (%)
Age 51 (39-61) 50 (42-58) 2.6
Sex Male 519 (76) 509 (75) 3.2
Race - Indigenous 57 (8) 63 (9) 2.6
Kidney disease - Glomerulonephritis 255 (37) 267 (39) 3.8
Cigarette (current) 78 (11) 83 (12) 2.2
Comorbidities at RRT entry
Chronic lung disease 51 (7) 53 (8) 0.9
Coronary disease 114 (17) 119 (17) 1.7
Periphery vascular disease 69 (10) 61 (9) 3.2
Cerebrovascular disease 41 (6) 32 (5) 4.5
Diabetes 155 (23) 157 (23) 0.6
Body mass index
<20 kg/m2 31 (5) 34 (5) 1.8
20-24.9 kg/m2 168 (25) 176 (26) 2.6
25-29.9 kg/m2 260 (38) 241 (35) 5.8
≥30 kg/m2 223 (33) 231 (34) 2.6
Late referral (< 3 months) 45 (7) 44 (6) 0.4
eGFR 7.5 (5.5-9.3) 7.5 (5.5-9.3) 0.3
Era: 2000-2005 (vs. 2006-2012) 271 (40) 294 (43) 6.8
Country – New Zealand 142 (21) 140 (21) 0.7
Data are presented as number (percentile) or median (interquartile range). RRT = renal
replacement therapy, ref = reference, eGFR = estimated glomerular filtration rate using
MDRD 4 variable formula. ASD = absolute standardized difference

52
Table S2 - Sensitivity analysis for secondary outcomes: competing risk model, 30-day
technique failure / lag definition model
Models
PD n= 10 685, HHD n=705
HR 95% CI p
Death on specific dialysis modality
Competing risk model* 0.33 0.25-0.43 <0.001
30 days technique failure definition/ lag after
modality switch, multivariable model
0.35 0.27-0.46 <0.001
Death or technique failure
Competing risk model* 0.34 0.29-0.40 <0.001
30 days technique failure definition/ lag after
modality switch, multivariable model
0.32 0.28-0.37 <0.001
Technique failure only
Competing risk model** 0.40 0.33-0.48 <0.001
30 days technique failure definition/ lag after
modality switch, multivariable model
0.31 0.26-0.37 <0.001
*Competing event: transplantation
** Competing events: death and transplantation
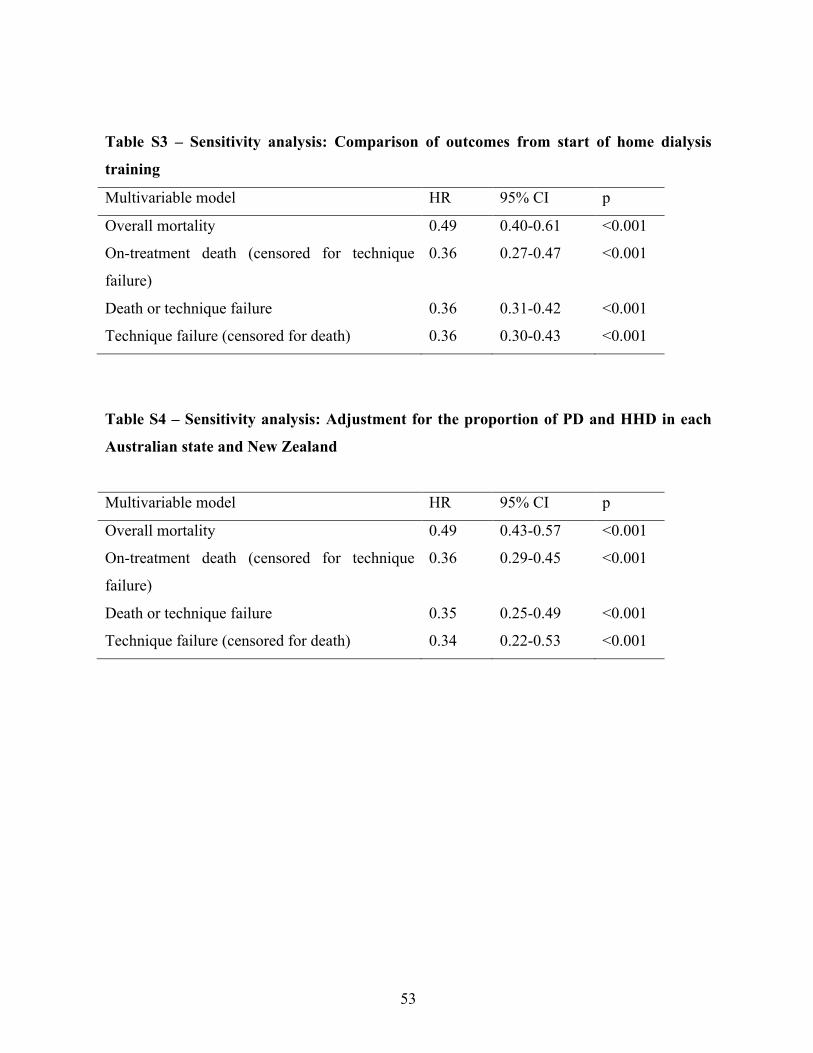
53
Table S3 – Sensitivity analysis: Comparison of outcomes from start of home dialysis
training
Multivariable model HR 95% CI p
Overall mortality 0.49 0.40-0.61 <0.001
On-treatment death (censored for technique
failure)
0.36 0.27-0.47 <0.001
Death or technique failure 0.36 0.31-0.42 <0.001
Technique failure (censored for death) 0.36 0.30-0.43 <0.001
Table S4 – Sensitivity analysis: Adjustment for the proportion of PD and HHD in each
Australian state and New Zealand
Multivariable model HR 95% CI p
Overall mortality 0.49 0.43-0.57 <0.001
On-treatment death (censored for technique
failure)
0.36 0.29-0.45 <0.001
Death or technique failure 0.35 0.25-0.49 <0.001
Technique failure (censored for death) 0.34 0.22-0.53 <0.001
54
Table S5 – Sensitivity analysis: Restricted cohort of patients with 60 days on home
dialysis (‘60-day’ attrition rule)
Multivariable model HR 95% CI p
Overall mortality 0.47 0.37-0.58 <0.001
On-treatment death (censored for technique
failure)
0.34 0.26-0.45 <0.001
Death or technique failure 0.33 0.28-0.39 <0.001
Technique failure (censored for death) 0.33 0.27-0.49 <0.001
Peritoneal dialysis, n=10637; Home hemodialysis, n=697
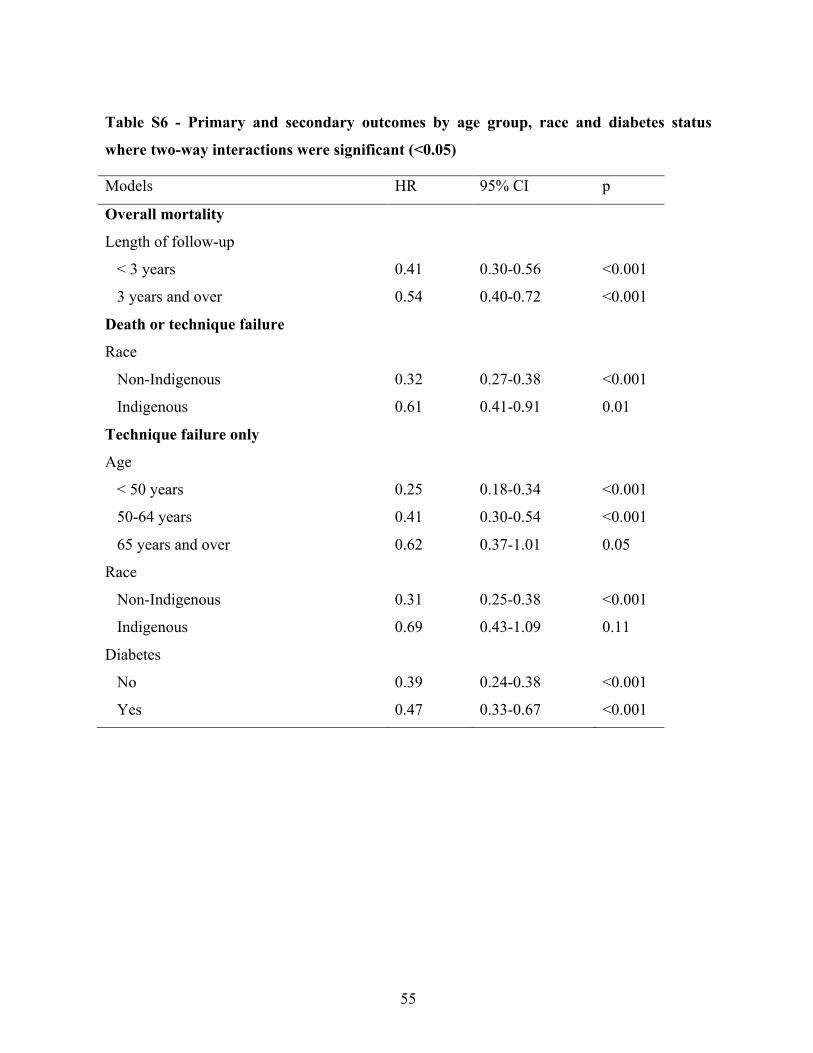
55
Table S6 - Primary and secondary outcomes by age group, race and diabetes status
where two-way interactions were significant (<0.05)
Models HR 95% CI p
Overall mortality
Length of follow-up
< 3 years 0.41 0.30-0.56 <0.001
3 years and over 0.54 0.40-0.72 <0.001
Death or technique failure
Race
Non-Indigenous 0.32 0.27-0.38 <0.001
Indigenous 0.61 0.41-0.91 0.01
Technique failure only
Age
< 50 years 0.25 0.18-0.34 <0.001
50-64 years 0.41 0.30-0.54 <0.001
65 years and over 0.62 0.37-1.01 0.05
Race
Non-Indigenous 0.31 0.25-0.38 <0.001
Indigenous 0.69 0.43-1.09 0.11
Diabetes
No 0.39 0.24-0.38 <0.001
Yes 0.47 0.33-0.67 <0.001

56
4 - Évaluation du modèle de dialyse à domicile intégrée
4.1 Sommaire du second article
Dans l’article précédent, il a été établi que chez la population d’Australie/Nouvelle-Zélande
ayant initié la suppléance rénale entre 2000 et 2012, le traitement avec HDD était associé à
une plus faible mortalité que le traitement avec DP. Bien que statistiquement rigoureux, ces
résultats demeurent sujets à différents biais propres aux études observationnelles, tel que le
biais de confusion puisque les patients ayant recours à la DP et l’HDD ont classiquement des
caractéristiques initiales différentes. En effet, malgré diverses stratégies d’ajustements pour les
variables confondantes connues, il demeure impossible d’ajuster totalement pour des facteurs
dont nous ne discernons pas l’ampleur, ou pour lesquelles les bases de données ne fournissent
pas d’information.
Une autre interrogation propre aux modes de dialyse à domicile concerne la répercussion
clinique de l’initiation d’un patient avec la DP avec un transfert subséquent en HDD, défini,
tel que présenté précédemment comme le modèle de dialyse à domicile intégrée.
L’objectif de l’étude ci-contre était donc d’évaluer les répercussions cliniques de l’initiation de
la thérapie de suppléance rénale avec la DP suivie d’un transfert en HDD (modèle de dialyse à
domicile intégrée), comparativement à une initiation avec l’HDD d’emblée et une initiation en
DP, sans transfert subséquent en hémodialyse à domicile.
Les résultats présentés dans l’étude ci-contre indiquent une survie du patient et de la technique
à domicile similaire chez les patients traités en fonction du modèle de dialyse à domicile
intégrée (DP + HDD) et chez les patients directement traités avec l’HDD. Au contraire, le
traitement uniquement avec la DP était associé à une survie près de trois fois inférieure.
57
4.2 Article 2 - Outcomes of Integrated Home Dialysis Care: A
Multi-centre, Multi-national Registry Study
Le manuscrit ci-dessous a été publié dans Nephrology Dialysis and Transplantation (NDT) le
30 novembre 2015.
Je suis l’auteur principal de cet article. J’ai joué un rôle de premier plan dans l’élaboration de
la question de recherche et des hypothèses, la revue de littérature, la conception et l’exécution
des analyses statistiques, ainsi que la rédaction.

58
Outcomes of Integrated Home Dialysis Care: A Multi-centre, Multi-national Registry
Study
Annie-Claire Nadeau-Fredette MD1,2,3, Christopher T Chan MD4, Yeoungjee Cho MBBS1,2,5,
Carmel Hawley MBBS (Hons) MMedSci1,2,5, Elaine Pascoe MBiostat6, Philip A. Clayton
PhD1,7, Kevan R. Polkinghorne MBChB PhD1,8,9, Neil Boudville MBBS MMedSci1,10,
Martine Leblanc MD3, David W Johnson PhD1,2,5
1Australia and New Zealand Dialysis and Transplant Registry, Adelaide, Australia; 2Department of Renal Medicine, University of Queensland at Princess Alexandra Hospital,
Brisbane, Australia; 3Université de Montreal, Montreal, Canada; 4Toronto General
Hospital, University Health Network, University of Toronto, Toronto, Canada; 5Centre for
Kidney Disease Research, Translational Research Institute, Brisbane, Australia; 6School of
Medicine, University of Queensland, Brisbane, Australia; 7 Sydney Medical School,
University of Sydney, Sydney, Australia; 8Department of Nephrology, Monash Medical
Centre Monash Health, Clayton, Australia; 9Departments of Medicine & Epidemiology &
Preventative Medicine, Monash University, Melbourne, Australia; 10School of Medicine
and Pharmacology, University of Western Australia, Perth, Australia
Corresponding author:
Professor David Johnson,
Department of Nephrology,
XXXXXXXX
Tel: XXXXXXXX
Email: XXXXXXXXX
Running title: Integrated Home Dialysis Model

59
Manuscript word count: 3440
Abstract word count: 272
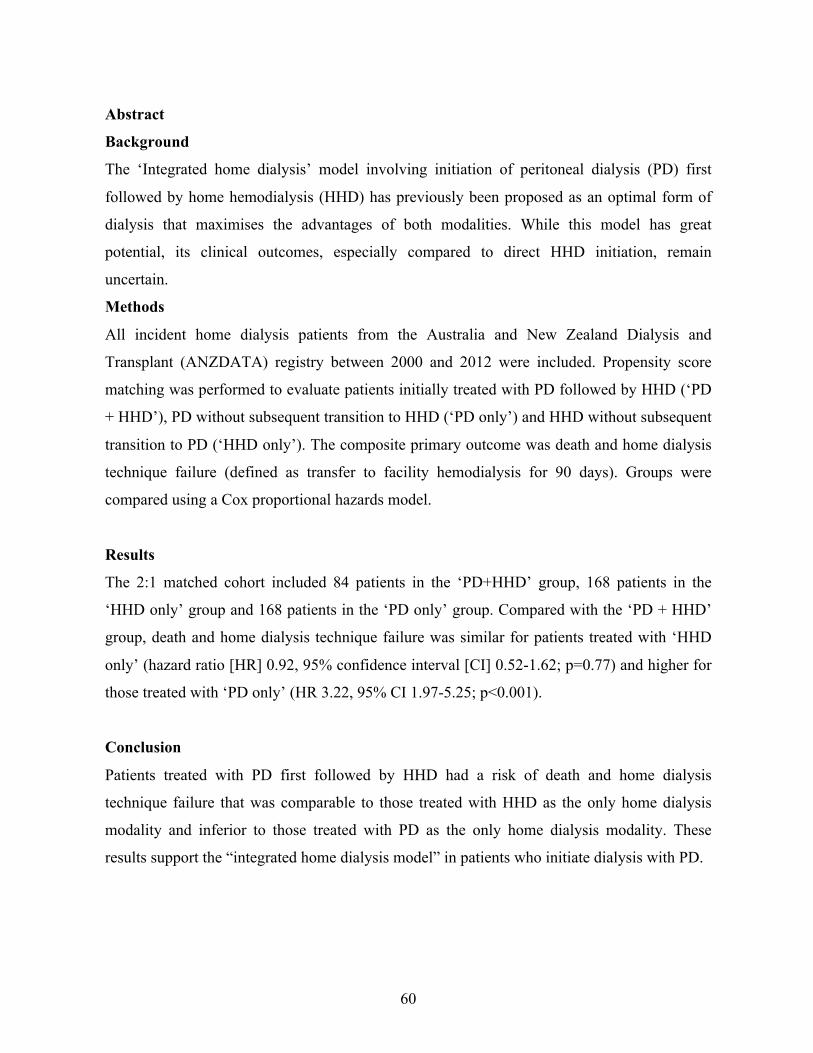
60
Abstract
Background
The ‘Integrated home dialysis’ model involving initiation of peritoneal dialysis (PD) first
followed by home hemodialysis (HHD) has previously been proposed as an optimal form of
dialysis that maximises the advantages of both modalities. While this model has great
potential, its clinical outcomes, especially compared to direct HHD initiation, remain
uncertain.
Methods
All incident home dialysis patients from the Australia and New Zealand Dialysis and
Transplant (ANZDATA) registry between 2000 and 2012 were included. Propensity score
matching was performed to evaluate patients initially treated with PD followed by HHD (‘PD
+ HHD’), PD without subsequent transition to HHD (‘PD only’) and HHD without subsequent
transition to PD (‘HHD only’). The composite primary outcome was death and home dialysis
technique failure (defined as transfer to facility hemodialysis for 90 days). Groups were
compared using a Cox proportional hazards model.
Results
The 2:1 matched cohort included 84 patients in the ‘PD+HHD’ group, 168 patients in the
‘HHD only’ group and 168 patients in the ‘PD only’ group. Compared with the ‘PD + HHD’
group, death and home dialysis technique failure was similar for patients treated with ‘HHD
only’ (hazard ratio [HR] 0.92, 95% confidence interval [CI] 0.52-1.62; p=0.77) and higher for
those treated with ‘PD only’ (HR 3.22, 95% CI 1.97-5.25; p<0.001).
Conclusion
Patients treated with PD first followed by HHD had a risk of death and home dialysis
technique failure that was comparable to those treated with HHD as the only home dialysis
modality and inferior to those treated with PD as the only home dialysis modality. These
results support the “integrated home dialysis model” in patients who initiate dialysis with PD.
61
Key words:
Home hemodialysis, Integrated home dialysis model, Peritoneal dialysis, Survival, Transition
Short Summary:
In a propensity score matched model, initial treatment with peritoneal dialysis (PD) followed
by transition to home hemodialysis (HHD) was associated with comparable risk of death and
home dialysis technique failure (composite outcome) than initial treatment with HHD. Both of
these home dialysis approaches were associated with a lower risk of death and home dialysis
technique failure compared to treatment with PD as the only home dialysis modality.
Similarly, mortality on home dialysis was comparable in patients treated with HHD only and
PD followed by HHD while it was higher for patients treated with PD only.
62
Introduction
Selection of the optimal dialysis modality, based on patients’ needs and economic
considerations, is central to good nephrology practice. Over the past 15 years, the ‘integrated
dialysis’ model (or peritoneal dialysis [PD]-first model) has been advocated by a number of
groups as a strategy for optimising dialysis care (9, 46, 101, 102, 151-153). This model
proposes initiation of dialysis with PD followed by transition to hemodialysis (HD) after PD
completion, thereby capitalising on the economic and clinical advantages of PD, especially
during the first years after dialysis initiation (11, 43, 44, 154, 155). Some potential advantages
of a PD-first model of care include preservation of residual kidney function (22, 156),
protection of potential vascular access and reduction in bacteremia risk (40, 157), improved
ability to provide incremental dialysis (36, 37), maintenance of lifestyle with a more flexible
dialysis schedule (17, 18), reduced hepatitis virus transmission (41), and possibly an early
survival advantage in the first few years of dialysis (50, 56, 59, 62, 158, 159). Following
completion of PD therapy, most patients transfer to facility HD (105, 160).
More recently, an ‘integrated home dialysis’ model, proposing the initiation of dialysis
treatment with PD with subsequent transition to HHD (when possible) at the time of PD
completion has been advocated (106). This new dialysis paradigm offers the benefit of
maximising home-based dialysis therapy while still capitalising on the putative early
advantages of PD and the potential survival advantages afforded by HHD (62). However, the
‘integrated home dialysis’ model does involve more intensive training in two distinct forms of
home dialysis and its clinical outcomes compared with other forms of home dialysis (PD only
or HHD only) have not been formally evaluated.
The aim of this study was to evaluate patient and technique survival in patients treated with
the ‘integrated home dialysis’ model compared to those treated with PD only or HHD only
prior to other forms of renal replacement therapy.

63
Subjects and Methods
Study design and population
All Australian and New Zealand patients treated with PD or HHD on day 90 after renal
replacement therapy (RRT) initiation between January 1st 2000 and December 31st 2012 were
included in this observational cohort study. Data were accessed through the Australia and
New Zealand Dialysis and Transplant (ANZDATA) registry, which includes prospectively
collected data from all dialysis centers across these two countries. Patients with less than 90
days of RRT and those younger than 18 years at initiation of RRT were excluded.
Exposure definitions
The study cohort was divided into four groups based on dialysis modality on day 90 after RRT
initiation and direct transfer (or not) to the other home dialysis modality (defined as transfer
within less than 90 days of the initial home modality completion): (1) PD on day 90 after RRT
initiation without direct transfer to HHD after PD completion (‘PD only’), (2) HHD on day 90
after RRT initiation without direct transfer to PD after HHD completion (‘HHD only’), (3) PD
on day 90 after RRT initiation with direct transfer to HHD after PD completion (‘PD + HHD’)
and (4) HHD on day 90 after RRT initiation with direct transfer to PD after HHD completion
(‘HHD + PD’). PD and HHD completion were defined by at least 90 days of another dialysis
modality (facility hemodialysis or the other home dialysis modality). It was pre-specified to
exclude patients in the last group (‘HHD + PD’) from the analyses since this group was
expected to contain a very small number of patients (Figure 1). Patients treated with PD on
day 90 who directly transferred to HHD after PD failure and eventually directly switched back
to PD (PD-HHD-PD pattern) were included in the ‘PD + HHD’ group and followed until the
end of the total home dialysis period.
Outcomes assessment
The primary outcome of this study was the composite of patient and home dialysis technique
survival. Patients were followed until death or home dialysis technique failure, defined as 90
days or more of facility hemodialysis. All data were censored at the time of transplantation,
recovery of kidney function, loss to follow-up or the end of the study (December 1st, 2012),
whichever came first. Any events (death or censoring event) occurring less than 90 days after
64
a switch from home dialysis to facility hemodialysis were counted as occurring during home
dialysis.
Patient survival on home dialysis treatment was evaluated as a secondary outcome, in which
case data were censored at the time of technique failure or any of the censoring events
described above.
Covariates assessment
Baseline characteristics were evaluated at the time of RRT initiation and include: age, gender,
race (Caucasian, Asian and Indigenous/others), primary kidney disease (diabetes,
glomerulonephritis, hypertensive, reflux, polycystic, other), suspected or proven comorbidities
(cerebrovascular, peripheral vascular, pulmonary and coronary disease), diabetes (type 1 and
2), active cigarette smoking, categories of body mass index (BMI; <20, 20-24.9, 25-29.9 and
≥30 kg/m2), late nephrology referral (less than 3 months before RRT start), era (2000-2005,
2006-2012), estimated glomerular filtration rate (eGFR)(129) and region. Less than 1% of
patients had missing covariate data and were excluded from the analyses.
Statistical analysis
Baseline characteristics were reported as count with percentage for categorical variables and
median with interquartile range for continuous non-normally distributed variables. Differences
between non-matched groups were compared by chi-square tests for categorical data and
Kruskal-Wallis tests for non-normally distributed continuous data. Matched groups were
compared using conditional logistic regression for categorical data and Friedman test for non-
normally distributed continuous data.
Propensity score matching
Propensity score matching (PSM) was used to create comparable dialysis groups for
evaluation on time-to-event outcomes. First, the probability of patients belonging to a
particular home dialysis treatment group (PD only, HHD only, or PD + HHD) was predicted
by a multinomial logistic regression including all covariates listed in Table 1 with region
further subcategorized into Australian state of residence and New Zealand. Two-way

65
interactions involving age, race, diabetes mellitus, BMI and primary kidney disease with other
covariates were evaluated with a likelihood ratio test and included in the final multivariable
multinomial logistic regression model when significant (p<0.05). The PS model had a
McFadden R-square of 0.22 (good fit) (161) and its distribution was balanced across the three
groups (Supplementary Figure S1). Patients were further stratified in two age groups (< 50
years and ≥ 50 years) and then underwent a propensity score (PS) 1:2 nearest neighbour
matching whereby each ‘PD+HHD’ patient was matched to 2 ‘PD only’ and 2 ‘HHD only’
patients belonging to the same age strata. Furthermore, in order to mitigate risk of immortal
time bias in the ‘PD + HHD’ group, only patients from the ‘PD only’ and ‘HHD only’ groups
with home dialysis durations greater than the time each ‘PD+HHD’ patient spent on PD (plus
time on temporary facility HD, if applicable) before starting HHD were selected in the
matched cohort (119).
Survival analyses
For all time-to-event analyses, time zero was defined as the time when HHD was initiated for
patients in the ‘PD+HHD’ group and matching time for the other groups. Survival times for
the primary and secondary outcomes were analysed with the Kaplan-Meier product limit
method. To account for the matched design of the study, unadjusted Cox proportional hazards
models with cluster robust standard errors were used to compare survival across groups. The
proportional hazards assumption was assessed visually with log-minus-log plots, observed
(KM) and predicted (Cox) graphs, and Schoenfeld residuals.
Sensitivity analysis
Several sensitivity analyses were performed. Firstly, in order to address potential residual
imbalances in covariates after PS matching, multivariable analyses adjusting for covariates
with a p-value < 0.20 in the post-match comparison (sex, coronary disease, BMI, country)
were performed. Secondly, the primary and secondary outcomes survival analyses were
repeated in second PSM models with a more permissive (< 180 days) duration of facility HD
between PD completion and HHD initiation. Thirdly, a competing risk model with
transplantation defined as the competing event was performed. Finally, the primary and
secondary outcomes were assessed in the global cohort with a multivariable model including

66
home dialysis modality as a time-varying covariate. Other pre-specified covariates included
age, race, gender, diabetes, primary kidney disease and late referral.
All statistical analyses were performed using Stata IC software (version 12.1 StataCorp,
College Station, TX). A two-tailed P-value <0.05 was considered statistically significant.
Results
Overall, 11 416 incident home dialysis patients were evaluated in this study. Among them, 10
617 patients were included in the ‘PD only’ group (patients with PD on day 90 after RRT
initiation and not directly transferred to HHD at time of PD completion), 698 patients were
included in the ‘HHD only’ group (patients with HHD on day 90 after RRT initiation and not
directly transferred to PD at time of HHD completion), and 93 patients were included in the
‘PD+HHD’ group (patients with PD on day 90 after RRT initiation and transferred to HHD
less than 90 days after PD completion, including 1 patient with a ‘PD-HHD-PD’ pattern).
Inadequate dialysis (clearance or ultrafiltration-related) was the main cause of PD technique
failure among the ‘PD+HHD’ group (54 patients [58%]), followed by infection (16 patients
[17%]) and mechanical complications (9 patients [10%]). Twenty-one patients initially treated
with HHD and then transferred to PD were excluded from the analyses, as pre-specified due to
the anticipated small number. Baseline characteristics for the overall cohort are presented in
Table 1. Patients in both the PD + HHD and HHD groups were more likely to be young, male
and in the higher BMI categories with fewer comorbidities than patients in the PD group.
Matched cohort analyses
The primary and secondary outcomes were compared on matched samples incorporating
survival time since RRT initiation (until start of HHD or matching time) in order to mitigate a
potential immortal bias among patients in the ‘PD+HHD’ group. Indeed, these patients had a
mean chronic dialysis vintage of 2.3 (1.3-3.6) years before transfer to HHD. The matched
cohort included 84 patients treated with ‘PD+HHD’, 168 patients treated with ‘PD only’ and
168 patients treated with ‘HHD only’. Baseline characteristics of matched patients are
presented in Table 2. Overall, groups were similar after the matching process.

67
Patient and home dialysis technique survival
A total of 140 events (51 deaths) were observed in the matched cohort primary analysis; 15
events (7 deaths) in patients treated with ‘PD+HHD’, 34 events (13 deaths) in those treated
with ‘HHD only’ and 91 events (31 deaths) in patients treated with ‘PD only’. Patient and
technique survival was different in the three groups with respective 1-, 2- and 5-year survival
rates of 94%, 86% and 55% in the ‘PD + HHD’ group, 95%, 87% and 66% in the ‘HHD only’
group and 81%, 59% and 20% in the ‘PD only’ group (Figure 2). As previously mentioned,
time zero for survival analysis was based on the time when the matched ‘PD + HHD’ patient
started HHD and matching time for the ‘PD only’ and ‘HHD only’ groups. Compared to
patients in the ‘PD + HHD’ group, the risk of death or home dialysis technique failure was
similar for patients treated with ‘HHD only’ (hazard ratio [HR] 0.92 (95% confidence interval
[CI] 0.52-1.62; p=0.77) but higher for those treated with ‘PD only’ (HR 3.22, 95% CI 1.97-
5.25; p<0.001).
Patient survival on home dialysis
Survival on home dialysis, censored for technique failure, was also different in the three
matched groups. Compared to patients treated with ‘PD + HHD’, mortality on home dialysis
was similar among patient treated with ‘HHD only’ (HR 0.77, 95% CI 0.34-1.72; p=0.52) but
higher among those treated with ‘PD only’ (HR 2.44, 95% CI 1.19-4.99; p=0.01) (Figure 3).
Sensitivity analysis
In order to account for potential residual imbalance between the groups after PSM,
multivariable adjusted sensitivity analyses were performed (in the PSM cohort), including all
covariates with a p-value ≤ 0.20 in the post-match comparison. The results of these analyses,
adjusted for sex, coronary disease, BMI and country of RRT initiation, were consistent with
those of the main models (Table S2).
The evaluation of the study primary outcome (patient and home dialysis technique survival)
with transplantation as a competing outcome in competing risk regression model provided
similar results to those obtained in the main Cox proportional hazards model (HHD only HR

68
0.98, 95% CI 0.54-1.78, p=0.94; PD only HR 3.88, 95% CI 2.26-6.65, p<0.001). Furthermore,
transplantation occurrence was similar in the HHD group (HR 1.12, 95% CI 0.77-1.63;
p=0.57), but less likely in the PD only group (HR 0.37, 95% CI 0.23-0.60; p<0.001). The
assessment of mortality risk on home dialysis in the competing risk model yielded comparable
results to those of the main model (Table 3). Competing risk regression cumulative subhazard
curves are presented in Figures S2 and S3.
The study primary and secondary outcomes were evaluated in models allowing for longer
duration of facility HD between the times of PD discontinuation and HHD initiation. Overall,
allowing for a less than 180-day transition (rather than a less than 90-day transition in our
main model) gave similar results to those obtained in the main model (Table 3). Baseline
characteristics of matched patients and survival curves from this sensitivity model are
presented in Supplementary Table S1 and Figures S4 and S5.
Finally, evaluation of the entire cohort in a multivariable model incorporating home dialysis
modality as a time-varying covariate led to comparable associations with an increase in death
and technique failure among patient starting dialysis with PD (HR 3.45, 95% CI 2.92-4.08,
p<0.001), compared to HHD and a subsequent reduction of the risk at time of transfer from
PD to HHD (HR 0.32, 95% CI 0.20-0.52, p<0.001).
Discussion
In this matched cohort study, incident RRT patients initially treated with PD followed by
HHD had patient and home dialysis technique survival that was comparable to those treated
with HHD as the only home dialysis modality and superior to those treated with PD as the
only home dialysis modality. Similar results were obtained when only patient survival was
evaluated.
Very little data have been published to date regarding patients treated successively with PD
and HHD. The feasibility of a ‘PD-to-HHD’ transition was reported by Canadian and Japanese
groups in small observational studies (103-105). To our knowledge, only one Canadian study
69
specifically evaluated outcomes of patients treated with HHD after PD therapy. This
investigation showed similar risk of death or technique failure in patients with and without
previous PD (HR 1.15, 95% CI 0.51-2.59, p=0.60) (106). However, the results were limited by
the inclusion of patients treated with PD at any given time before HHD initiation, the
prevalent nature of the dialysis cohort and differences in transplantation history between
patients with and without PD exposure. Furthermore, patients with PD exposure before HHD
start had a much longer dialysis vintage than PD-naïve patients, leading to a potential
immortal time bias.
In the present study, the risk of immortal time bias was mitigated by the matching process
taking the survival period between RRT initiation and matching time into account (119).
Furthermore, only incident patients with home dialysis on day 90 after RRT initiation were
included. Moreover, patients included in the ‘PD-HHD’ group were all initiated on home
dialysis less than 90 days after PD completion, further limiting potential for immortal time
bias.
Direct transition to HHD after PD completion (in less than 90 days) might require
considerable planning and organization of the transfer prior to PD discontinuation, which
could limit the generalization of the study results to PD patients experiencing sudden
technique failure (for example, due to severe acute peritonitis). Nonetheless, similar results
were obtained in this study when the time between PD completion and HHD initiation was
extended to up to 180 days, which should have been long enough to include most patients with
unplanned transition to HHD after acute PD failure. It is however important to recognize that
these data only include patients who were successfully transferred to HHD. It is possible that a
larger number of patients might have been suitable HHD candidates, had they not lost interest
in HHD after a prolonged facility HD period (162).
The initiation of dialysis with PD followed by HHD has been proposed as a strategy for
providing optimal dialysis care that combines these complementary dialysis modalities in a
way that maximises their advantages and mitigates their disadvantages (9, 105, 106). On the
one hand, initiating patients on PD while they still have residual kidney function has been
70
associated with better preservation of residual kidney function (22, 156), protection of
potential vascular access and reduction in bacteremia risk (40, 157), improved ability to
provide incremental dialysis (36, 37), maintenance of lifestyle with a more flexible dialysis
schedule (17, 18), reduced hepatitis virus transmission (41), and enhanced cost-effectiveness
(11, 43, 44, 154). On the other hand, long-term PD therapy is limited by high rates of
technique failure, mostly related to infectious complications, but also to mechanical issues and
changes in peritoneal membrane structure and function over time leading to impaired
ultrafiltration and/or small solute clearance capacity (163-166). In contrast, HHD has been
associated with excellent long-term survival, with a 5-year patient and technique survival
around 70-80% in recent observational studies (90, 91, 167). HHD however requires a longer
and more intensive training period compared to PD, which can be a limitation to its uptake.
Vascular access complications and faster decline of residual kidney function may also be a
concern in patients treated with HHD (65, 168, 169). Hence, the combination of PD first with
a timely transfer to HHD might allow the greatest benefits from the two modalities and extend
overall home dialysis treatment. The present study supports the benefits of an integrated home
dialysis approach for patients commencing PD first. Although integrated home dialysis was
not superior to a HHD first strategy with respect to the outcomes of patient survival and home
dialysis technique survival in this study, further evaluation of other outcomes, such as dialysis
access, infectious complications, residual renal function and health economic outcomes are
warranted before drawing conclusions regarding the relative merits of these two home dialysis
approaches.
This study has several strengths. The global cohort included all patients from Australia and
New Zealand treated with home dialysis on day 90 after renal replacement therapy initiation.
These two countries have among the highest home dialysis prevalence rates in the world and
are renowned for their expertise in home dialysis. The study design based on propensity score-
matched cohorts and including survival time since renal replacement therapy initiation made it
possible to address the complicated question of modality switch while limiting potential
immortal time bias. Furthermore, the primary outcome was tested with different sensitivity
models, which all generated similar results.
71
Several limitations should also be considered while interpreting these results. First and
foremost is the potential for indication bias and residual confounding, given that, prior to
matching, patients in the PD + HHD and HHD only groups were younger and healthier than
those in the PD only groups. While the matching process was performed in an attempt to limit
potential bias, it may not have accounted for all differences in characteristics between the
groups. Indeed, factors, such as psychological and socioeconomic characteristics, social
support and physician-related preferences, that were not recorded in the ANZDATA registry
may have varied significantly between the study groups. Furthermore, variation in the burden
of comorbidity during home dialysis therapy (but before matching time) could not be taken
into account. Importantly, the registry nature of the study did not allow the inclusion of
patients who intended to transit to HHD after PD completion, but were unable to do so, either
because of medical complications, change of mind or death. Despite the matching process
taking into account survival time since renal replacement therapy initiation, patients in the
study could still be considered ‘survivors’ and the study results could therefore have been
potentially subject to immortal time bias. It was also impossible to identify PD patients who
were offered HHD at time of PD technique failure but chose not to pursue this option, which
would have represented an important comparator group. Finally, due to the strict definition of
direct transition to HHD (<90 days of facility HD after PD completion), only a small
proportion of the global home dialysis cohort was included in the ‘PD-HHD’ transition group,
which could have limited the generalisability of the study.
In conclusion, this study showed that initial treatment with PD followed by transition to HHD
was associated with comparable clinical outcomes (both patient and home dialysis technique
survival and patient survival only) to initial treatment with HHD. Both of these home dialysis
approaches were associated with a lower risk of patient death and home dialysis technique
failure to treatment with PD as the only home dialysis modality. These findings support the
“integrated home dialysis model” where PD is offered as the initial dialysis modality. Future
prospective studies are warranted to evaluate the impact of the “integrated home dialysis
model” on a broad range of outcomes (e.g. dialysis access, infectious complications, residual
renal function, technique survival, patient survival, resource utilisation and health economic

72
outcomes), assess its implication for a larger population, identify the optimal timing of
transition from PD to HHD and potentially increase global home dialysis therapy.
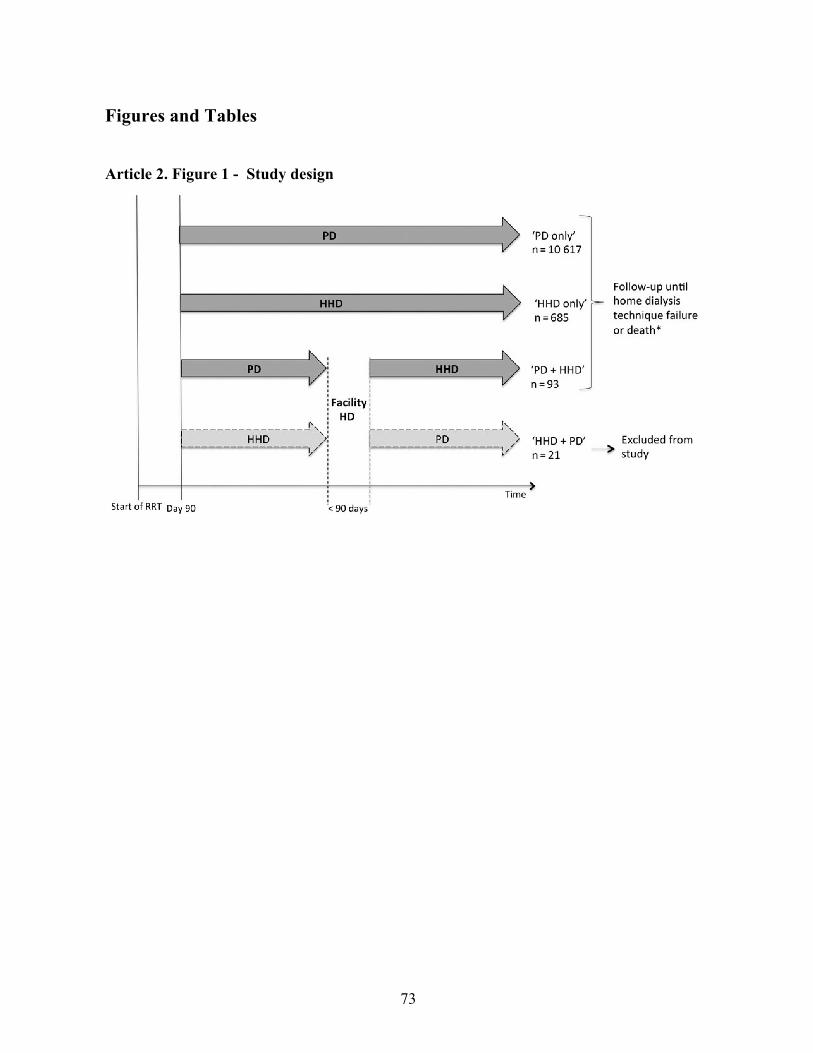
73
Figures and Tables
Article 2. Figure 1 - Study design

74
Figure 2 - Patient and home dialysis technique survival.
Survival from start of HHD (PD + HHD cohort) or time of matching (matched PD and HHD
cohorts)
HR: 0.92, 95% CI 0.52-1.62; p=0.77, ‘HHD only’
HR: 3.22, 95% CI 1.97-5.25; p<0.001, ‘PD only’

75
Figure 3 - Patient survival on home dialysis
Survival from start of HHD (PD + HHD cohort) or time of matching (matched PD and HHD
cohorts)
HR: 0.77, 95% CI 0.34-1.72; p=0.52, ‘HHD only’
HR: 2.44, 05% CI 1.19-4.98; p=0.01, ‘PD only’

76
Article 2. Table 1: Baseline characteristic – global cohort
Characteristic PD + HHD
(93)
PD (10 617) HHD (685) P
Age 50 (42-57) 62 (50-71) 46 (40-54) <0.001
Sex Male 71 (76) 6011 (57) 516 (75) <0.001
Race <0.001
Caucasian 60 (65) 7329 (69) 572 (84)
Asian 19 (20) 1217 (11) 46 (7)
Indigenous 11 (12) 1957 (18) 62 (9)
Other 3 (3) 114 (1) 5 (1)
Primary kidney disease <0.001
Glomerulonephritis 50 (54) 2612 (25) 263 (38)
Diabetes 10 (11) 3729 (35) 123 (18)
Hypertension 2 (2) 1524 (14) 45 (7)
Polycystic 9 (10) 584 (6) 130 (19)
Reflux 5 (5) 333 (3) 38 (6)
Other 17 (18) 1835 (17) 86 (13)
Cigarette (active at entry) 9 (10) 1449 (14) 80 (12) 0.19
Comorbidities
Pulmonary disease 10 (11) 1596 (15) 52 (8) <0.001
Coronary disease 9 (10) 4051 (38) 117 (17) <0.001
Peripheral vascular disease 6 (6) 2579 (24) 57 (8) <0.001
Cerebrovascular disease 4 (4) 1590 (15) 30 (4) <0.001
Diabetes 17 (28) 4631 (44) 156 (23) <0.001
BMI <0.001
<20 kg/m2 2 (2) 821 (8) 33 (5)
20-24.9 kg/m2 27 (29) 3424 (32) 168 (25)
25-29.9 kg/m2 31 (33) 3681 (34) 242 (36)
30 kg/m2 and over 33 (35) 2649 (25) 238 (35)
Late nephrology referral 15 (16) 2113 (20) 43 (6) <0.001
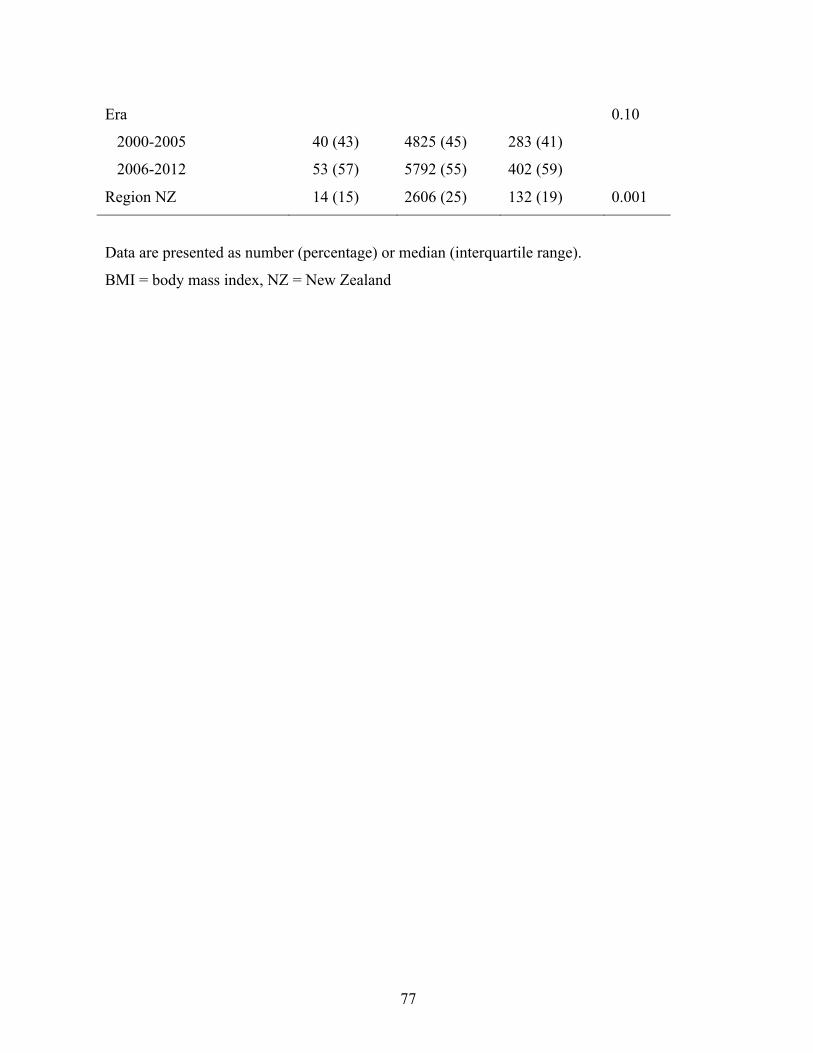
77
Era 0.10
2000-2005 40 (43) 4825 (45) 283 (41)
2006-2012 53 (57) 5792 (55) 402 (59)
Region NZ 14 (15) 2606 (25) 132 (19) 0.001
Data are presented as number (percentage) or median (interquartile range).
BMI = body mass index, NZ = New Zealand
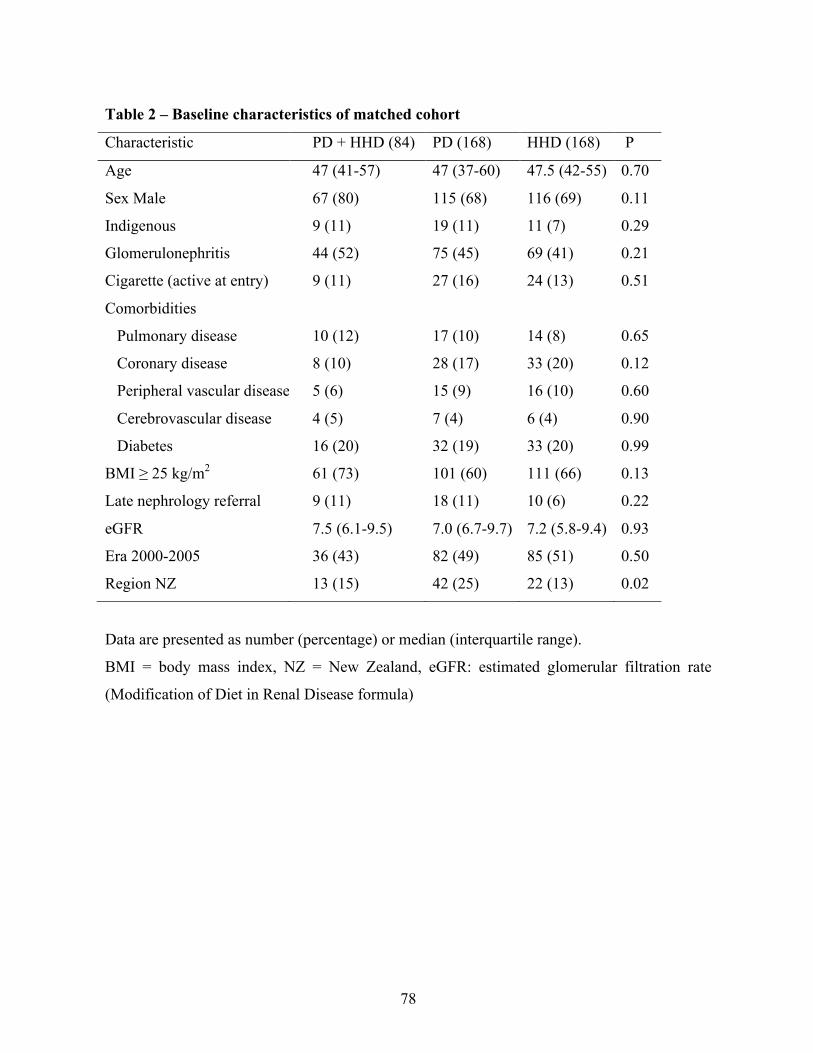
78
Table 2 – Baseline characteristics of matched cohort
Characteristic PD + HHD (84) PD (168) HHD (168) P
Age 47 (41-57) 47 (37-60) 47.5 (42-55) 0.70
Sex Male 67 (80) 115 (68) 116 (69) 0.11
Indigenous 9 (11) 19 (11) 11 (7) 0.29
Glomerulonephritis 44 (52) 75 (45) 69 (41) 0.21
Cigarette (active at entry) 9 (11) 27 (16) 24 (13) 0.51
Comorbidities
Pulmonary disease 10 (12) 17 (10) 14 (8) 0.65
Coronary disease 8 (10) 28 (17) 33 (20) 0.12
Peripheral vascular disease 5 (6) 15 (9) 16 (10) 0.60
Cerebrovascular disease 4 (5) 7 (4) 6 (4) 0.90
Diabetes 16 (20) 32 (19) 33 (20) 0.99
BMI ≥ 25 kg/m2 61 (73) 101 (60) 111 (66) 0.13
Late nephrology referral 9 (11) 18 (11) 10 (6) 0.22
eGFR 7.5 (6.1-9.5) 7.0 (6.7-9.7) 7.2 (5.8-9.4) 0.93
Era 2000-2005 36 (43) 82 (49) 85 (51) 0.50
Region NZ 13 (15) 42 (25) 22 (13) 0.02
Data are presented as number (percentage) or median (interquartile range).
BMI = body mass index, NZ = New Zealand, eGFR: estimated glomerular filtration rate
(Modification of Diet in Renal Disease formula)

79
Table 3 – Adjusted hazard ratio for primary and secondary outcomes in main and
sensitivity models
Models* HHD only PD only
HR 95% CI p HR 95% CI p
Death and technique failure
Main model& 0.92 0.52-1.62 0.77 3.22 1.97-5.25 <0.001
Competing risk model# 0.98 0.54-1.78 0.94 3.88 2.26-6.65 <0.001
180-day transition& 1.38 0.53-2.24 0.19 4.42 2.83-6.9 <0.001
Death on home dialysis
Main model& 0.77 0.34-1.72 0.52 2.44 1.19-4.99 0.01
Competing risk model# 0.79 0.32-1.94 0.61 2.86 1.30-6.34 0.01
180-day transition& 1.33 0.64-2.79 0.45 4.96 2.03-8.14 <0.001
* Reference group: ‘PD + HHD’ &Cox proportional hazards with robust standard error # Transplantation as competing event
Main and competing risk models, n=84/168/168
180-day transition model, n=124/248/248

80
Supplementary data
Figure S1 – Distribution of propensity scores before and after matching
0.2
.4.6
Prop
ensi
ty s
core
s
hhd pd pd_hhdexcludes outside values
0.2
.4.6
Prop
ensi
ty s
core
s
hhd pd pd_hhd
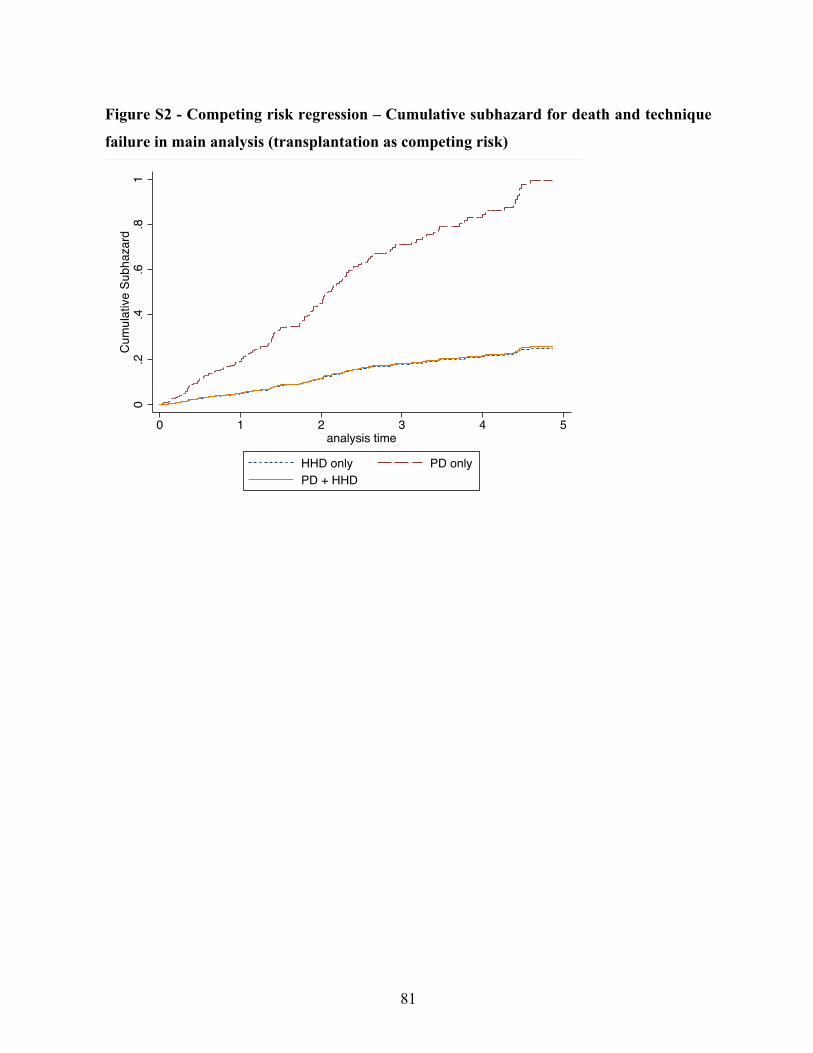
81
Figure S2 - Competing risk regression – Cumulative subhazard for death and technique
failure in main analysis (transplantation as competing risk)
0.2
.4.6
.81
Cum
ulat
ive
Subh
azar
d
0 1 2 3 4 5analysis time
HHD only PD onlyPD + HHD

82
Figure S3 - Competing risk regression – Cumulative subhazard for death on home
dialysis in main analysis (transplantation as competing risk)
0.2
.4.6
.81
Cum
ulat
ive
Subh
azar
d
0 1 2 3 4 5analysis time
HHD only PD onlyPD + HHD

83
Figure S4 - Patient and home dialysis technique survival in model allowing up to 180
days facility hemodialysis between PD completion and HHD initiation
0.00
0.25
0.50
0.75
1.00
Cum
ulat
ive
surv
ival
248 156 77 35 18 4PD248 164 105 72 43 23HHD124 88 60 39 27 20PD-HHD
Number at risk
0 1 2 3 4 5Time (Years)
HHD only PD onlyPD + HHD

84
Figure S5 - Survival on home dialysis in model allowing up to 180 days facility
hemodialysis between PD completion and HHD initiation
0.00
0.25
0.50
0.75
1.00
Cum
ulat
ive
Surv
ival
248 156 77 35 18 4 2PD248 164 105 72 43 23 15HHD124 88 60 39 27 20 15PD-HHD
Number at risk
0 1 2 3 4 5 6Time (Years)
HHD only PD onlyPD + HHD

85
Table S1 - Baseline characteristics of matched groups in model allowing up to 180 days
of facility hemodialysis between PD completion and HHD initiation
Characteristic PD + HHD
(124)
PD (248) HHD (248) P
Age 48 (39.5-57) 48 (38-60.5) 49 (42-56.5) 0.47
Male 99 (80) 171 (69) 179 (72) 0.08
Indigenous 16 (13) 20 (8) 17 (7) 0.13
Glomerulonephritis 58 (47) 108 (44) 102 (41) 0.56
Cigarette (active at entry) 17 (14) 34 (14) 27 (11) 0.59
Comorbidities
Pulmonary disease 12 (10) 20 (8) 17 (7) 0.63
Coronary disease 22 (18) 41 (17) 49 (20) 0.60
Peripheral vascular disease 9 (7) 24 (10) 25 (10) 0.64
Cerebrovascular disease 2 (2) 15 (6) 13 (5) 0.20
Diabetes 21 (17) 44 (18) 53 (21) 0.47
Body mass index ≥ 25 kg/m2 87 (71) 160 (65) 170 (69) 0.45
Late nephrology referral 24 (19) 18 (7) 19 (8) 0.002
Era 2000-2005 64 (52) 123 (50) 124 (50) 0.93
Region New Zealand 27 (22) 62 (25) 35 (14) 0.007

86
Table S2 - Hazard ratio for primary and secondary outcomes in covariates adjusted,
propensity score model
PSM with multivariable
adjustment
HHD only PD only
HR 95% CI p HR 95% CI p
Death and technique failure 0.76 0.42-1.36 0.35 2.81 1.69-4.65 <0.001
Death on home dialysis 0.66 0.27-1.59 0.35 2.33 1.10-4.94 0.03
* PSM cohort with adjustment for sex, coronary disease, body mass index and country

87
5 - Prédicteurs d’un transfert en hémodialyse à domicile
après la dialyse péritonéale
5.1 Sommaire du troisième article
L’article précédent s’est intéressé à l’évaluation du modèle en dialyse à domicile intégrée. Tel
que décrit dans l’article ci-haut, seule une faible proportion de patients traités par la DP ont pu
transférer en HDD suite à l’arrêt de la DP. Afin de promouvoir un tel transfert, il s’avère
primordial de savoir identifier, dans un premier temps, les caractéristiques des patients ayant
fait la transition entre la DP et l’HDD.
Quelques séries de cas ont été publiées rapportant un petit nombre de patients traités selon le
principe du modèle de dialyse à domicile intégrée. Des caractéristiques telles que le jeune âge,
le sexe masculin ou la durée prolongée du traitement par DP semblaient plus présentes parmi
ce groupe de patients. Toutefois, ces études comportaient toutes un faible nombre de patients,
limitant l’évaluation des facteurs associés au modèle de dialyse à domicile intégrée.
Dans l’article ci-contre, les caractéristiques des patients ayant transféré de la DP à l’HDD à
domicile moins de 180 jours après l’arrêt de la DP ont été identifiées selon deux approches,
soit dans la cohorte restreinte des patients transférés en HD (hospitalière et à domicile) après
un échec de technique et dans la cohorte globale de tous les patients traités à DP à l’initiation
de la thérapie de suppléance rénale. Globalement, les prédicteurs du modèle de dialyse à
domicile intégrée étaient similaires dans les deux approches soit les caractéristiques
démographiques (jeune âge, sexe masculin, race non indigène), l’étiologie de la maladie rénale
terminale (non diabétique et nonhypertensive), la plus longue durée de traitement par la DP
ainsi qu’une cause non infectieuse liée à l’arrêt de la DP.

88
5.2 Article 3 - Predictors of Transfer to Home Hemodialysis after
Peritoneal Dialysis Completion
Le manuscrit ci-dessous a été publié en ligne de 2 novembre 2015 dans le journal Peritoneal
Dialysis International (PDI).
J’ai joué un rôle de premier plan dans cet article à titre de premier auteur (élaboration de la
question de recherche, revue de littérature, conception et exécution des analyses statistiques et
rédaction).

89
Predictors of Transfer to Home Hemodialysis after Peritoneal Dialysis Completion
Annie-Claire Nadeau-Fredette MD1,2,3, Carmel Hawley MBBS (Hons) MMedSci1,2,4, Elaine
Pascoe MBiostat5, Christopher T Chan MD6, Martine Leblanc MD3, Philip A. Clayton PhD1,7,
Kevan R. Polkinghorne MBChB PhD1,8,9, Neil Boudville MBBS MMedSci1,10, David W
Johnson PhD1,2,4
1Australia and New Zealand Dialysis and Transplant Registry, Adelaide, Australia; 2Department of Nephrology, University of Queensland at Princess Alexandra Hospital,
Brisbane, Australia; 3Université de Montreal, Montreal, Canada; 4Centre for Kidney Disease Research,
Translational Research Institute, Brisbane, Australia; 5School of Medicine, University of
Queensland, Brisbane, Australia; 6Toronto General Hospital, University Health Network,
University of Toronto, Toronto, Canada; 7Sydney Medical School, University of Sydney,
Sydney, Australia; 8Department of Nephrology, Monash Medical Centre Monash Health,
Clayton, Australia; 9Departments of Medicine & Epidemiology & Preventative Medicine,
Monash University, Melbourne, Australia; 10School of Medicine and Pharmacology,
University of Western Australia, Perth, Australia
Short title: Home Hemodialysis After Peritoneal Dialysis
Manuscript word count: 3113
Abstract word count: 261
Financial disclosures:
AC Nadeau-Fredette is supported by a Baxter Healthcare Clinical Evidence Council (CEC)
research grant and is a current recipient of a Fonds de la recherche du Québec en Santé
scholarship. David Johnson is a current recipient of a Queensland Government Health
Research Fellowship. He has previously received consultancy fees, research grants, speaker’s
honoraria and travel sponsorships from Baxter Healthcare and Fresenius Medical Care.
Christopher Chan holds R Fraser Elliott Chair in Home Dialysis. Neil Boudville has

90
previously received research funds from Roche, travel grants from Roche, Amgen and Jansen
Cilag, and speaking honoraria from Roche. The other authors have no financial disclosures.
Corresponding author:
Professor David Johnson,
Department of Nephrology,
Tel: XXXXXXX
Fax: XXXXXXX
Email: XXXXXXX
Key words: Home hemodialysis; Peritoneal dialysis; Technique failure; Dialysis transition;
ANZDATA

91
Abstract
Background: The aim of this study was to evaluate the predictors of transfer to home
hemodialysis (HHD) after peritoneal dialysis (PD) completion.
Methods: All Australian and New Zealand patients treated with PD on day 90 after renal
replacement therapy initiation between 2000 and 2012 were included. PD completion was
defined by death, transplantation or hemodialysis (HD) for ≥180 days. Patients were
categorized as ‘transferred to HHD’ if they initiated HHD <180 days after PD ending.
Predictors of transfer to HHD were evaluated in a restricted cohort with PD technique failure
using multivariable logistic regression and in the unrestricted cohort using a competing risk
analysis.
Results: Of 10710 incident PD patients, 3752 patients died, 1549 patients underwent
transplantation and 2915 patients transferred to HD, among whom 156 (5.4%) started HHD.
The positive predictors of transfer to HHD in the restricted cohort were male gender (odds
ratio [OR] 2.81), obesity (OR 2.20) and PD therapy duration (OR 1.10 per year). Negative
predictors included age (OR 0.95 per year), infectious cause of technique failure (OR 0.48),
underweight (OR 0.50), kidney disease due to hypertension (OR 0.38) or diabetes (OR 0.32),
Maori (OR 0.65) and Aboriginal and Torres Strait Islander peoples (OR 0.30). Comparable
results were obtained with a competing risk model.
Conclusion: Transfer to HHD following PD completion is rare and predicted by patients’
characteristics at baseline and at time of PD ending. Transition to HHD should be considered
more often in patients with PD, especially when fulfilling these identified characteristics.
92
Introduction
Peritoneal dialysis (PD) is increasingly recognized as a first-choice dialysis modality (9, 46,
152, 155), especially during the early years of renal replacement therapy (RRT) where it may
be associated with a small survival benefit compared to facility hemodialysis (HD) (50, 56,
158).
Continuation of PD beyond the first few years is however frequently limited by PD technique
failure, with recent registry studies reporting a 20% HD transfer rate during the first year after
PD initiation (163, 170). PD technique failure has inconsistently been associated with older
age, demographic characteristics (race, female gender), diabetes, body mass index (BMI),
membrane transport status and poor ultrafiltration, although the overall predictive capacity of
these variables is poor (166, 170-176). Hence, considering the relatively short technique
survival of PD without a readily identifiable additional preventative strategy to target, forward
planning and optimization of dialysis therapy once patients have completed PD therapy is of
paramount importance.
Different groups have recently advocated the use of HHD after PD completion as an
opportunity to improve patients’ care and increase home dialysis uptake (105, 106, 177).
Small studies have indeed shown the feasibility of such a transition (104, 105, 178) and
reported good clinical outcomes once HHD is initiated (106). While it is assumed that only a
minority of patients treated with PD could be potential HHD candidates, the predictors of a
transfer to HHD after PD completion remain largely uncertain. Assessment of such predictors
appears critical in order to identify patients more likely to transit to HHD and encourage
continuation of home dialysis.
Hence, the primary objective of this study was to identify the predictors of a transfer to HHD
after PD completion. The secondary objective was to ascertain predictors of length of facility
HD transition period in patients transferred to HHD after PD completion.
Methods
Population and data collection
93
This study included all patients from Australia and New Zealand treated with PD on day 90
after renal replacement therapy (RRT) initiation between January 1, 2000 and December 31,
2012. Data were accessed through the Australia and New Zealand Dialysis and Transplant
(ANZDATA) registry, which includes prospectively collected data from all dialysis centers
across these two countries. Patients were excluded for any of the following reasons: a) on RRT
less than 90 days; or, b) age <18 years. PD completion was defined by death, transplantation
or PD technique failure with ≥180 consecutive days on hemodialysis.
Outcome definitions
The primary outcome was transfer to HHD after PD completion. Transfer to HHD was defined
by initiation of HHD less than 180 days after PD ending (date of first day of HD treatment).
The predictors of transfer to HHD were evaluated in two models based on different
populations. First, in a restricted cohort, only patients with PD completion after technique
failure were studied such that patients experiencing death, kidney transplantation, kidney
function recovery, loss to follow-up or the end of the study period while still receiving PD or
within 180 days of PD cessation were excluded. Second, the predictors of transfer to HHD
were evaluated in an unrestricted cohort including all patients treated with PD on day 90 after
RRT start.
The secondary outcome was the time spent on facility HD during the transition between PD
and HHD for an extended cohort of patients transferring to HHD less than one year after PD
completion. This transition time was calculated from the first day of facility HD to the first
day of HHD and then categorized as < 90 days, 90-180 days, or 181 days to 365 days.
Covariates and potential predictors
Baseline characteristics were evaluated at the time of RRT initiation and included: age,
gender, race, primary kidney disease, body mass index [BMI], diabetes mellitus (including
type 1 and type 2), coronary disease, peripheral vascular disease, cerebrovascular disease,
pulmonary disease, active smoking, late nephrology referral (<3 months before RRT
initiation), era (2000-2005 versus 2006-2012) and country (Australia or New Zealand). In
patients with PD completion due to technique failure, duration of PD treatment was calculated
from day 90 after RRT initiation (inclusion criterion) to the first days of permanent HD

94
treatment. Cause of transfer to HD was also documented at the time of PD ending by each
dialysis center and submitted to the ANZDATA registry. Temporary facility HD time was
calculated from the first day of facility HD (at the time of PD ending) until HHD initiation.
Statistical analysis
Predictors of HHD transfer after PD technique failure - restricted cohort
Predictors of transfer to HHD (compared to facility HD only) after PD completion were first
evaluated in unadjusted and multivariable adjusted logistic regression models. Due to
differences in the prevalence and access to HHD across states, standard errors were clustered
for initial state of residence. The adjusted model included the following pre-specified
variables, based on biologic plausibility, clinical relevance and previous publications (105,
170): age, gender, race (categorized as Caucasian - Other, Asian, Australian Aboriginals and
Torres Strait Islanders [ATSI], Maori, and Pacific Islanders), primary kidney disease
(categorized as, glomerulonephritis, diabetes, hypertension, and other), diabetes,
cardiovascular disease (defined as any of coronary, peripheral vascular or cerebrovascular
disease), BMI, country, infectious cause of PD technique failure (versus non-infectious) and
time on PD. Pre-specified two-way interactions were evaluated between all pairs of variables
formed by age, race, gender, diabetes and cause of PD completion using a likelihood ratio test
with a p-value<0.05 considered significant. The calibration and discrimination of the final
model were assessed through the goodness-of-fit and c-statistic, respectively.
Sensitivity analyses
Predictors of a transfer to HHD were evaluated in two sensitivity models based on different
definitions of PD completion and transition time between PD ending and HHD initiation.
First, the definition of PD completion was changed to 30 days or more of HD (compared to
180 days in the main model) while keeping the same allowed transition time (< 180 days).
Second, the transition time between PD ending and HHD initiation was increased to less than
365 days of facility HD (compared to <180 days in main model), while keeping the definition
of PD completion unchanged (180 days of HD).
Predictors of transfer to HHD after PD start - unrestricted cohort

95
The primary outcome was also assessed in a competing risk survival model, with transfer to
HHD as the ‘failure’ event and transfer to facility HD, death or transplantation considered as
competing events. The same pre-specified covariates described above were included in this
model, with the exception of infectious cause of PD technique failure and time on PD, which
could not be included in the survival analysis. The proportional hazards assumption was
visually assessed with standard strategies using graphs and Schoenfeld residuals.
Predictors of length of time on temporary facility HD
Unadjusted and adjusted ordinal logistic regression models, with standard errors clustered for
initial state of residence, were used to identify the predictors of a longer facility HD transition
time. The multivariable adjusted model included pre-specified variables (age, gender, race,
diabetes and cause of PD completion) and all variables with a p-value<0.05 in unadjusted
ordinal logistic regression models (primary kidney disease and country). For the purpose of
this analysis, race was re-categorized as Caucasian, Asian or Indigenous/Others. Two-way
interactions were evaluated between all pairs of the following covariates: age, gender, race,
diabetes and cause of PD completion. The proportional odds assumption was assessed through
a likelihood ratio test.
Statistical analyses were performed using Stata IC software (version 12.1 StataCorp, College
Station, TX). A two-tailed P-value <0.05 was considered statistically significant.
Results
Population characteristics
Figure 1 depicts the flow algorithm for patients included in the study. Of the 10710 patients
who were treated with PD on day 90 after RRT initiation, 2915 (27%) experienced PD
completion due to technique failure during the study period, among whom 156 (5.4%) were
transferred to HHD within 180 days of PD cessation and the remaining 2759 (94.6%) were
classified as permanently transferred to facility HD. Furthermore, 1549 patients completed PD
at time of kidney transplantation and 3752 patients at time of death. The characteristics of PD
patients in the overall cohort are presented in Table 1.

96
Inadequate dialysis (mostly related to inadequate solute clearance) was the most frequent
cause of PD technique failure among patients transferred to HHD (n=76 [49%]) while
infection (mostly peritonitis) was the most frequent cause among facility HD patients (n=1362
[49%]). Mechanical complications and other cause of technique failure were evenly
distributed in the two groups. Detailed causes of PD completion after PD technique failure are
listed in Table 2. For patients transferred to HHD within 180 days of PD completion, the
median duration of temporary facility HD was 84 (IQR, 55-127) days.
Predictors of transfer to HHD – restricted cohort
In the multivariable logistic regression model, positive predictors of transfer to HHD included
male gender, non-infectious cause of PD technique failure, obesity (BMI ≥30 kg/m2), and
longer duration of PD therapy. In contrast, older age, underweight (BMI <20 kg/m2),
Indigenous race (both ATSI and Maori) and diabetic or hypertensive causes of kidney disease
(compared to glomerulonephritis) were negative predictors of transfer to HHD. The final
model had a good predictive capacity (c-statististic 0.82) and appropriate calibration. There
were no significant effects among the pre-specified interaction terms. Detailed results from the
multivariable adjusted logistic regression model are presented in Table 3.
Sensitivity analysis
When the definition of PD technique failure was changed to 30 days of HD (instead of 180
days), 3955 patients were categorized as having PD completion, among whom 153 (3.8%)
were transferred to HHD less than 180 days after PD ending. In a second sensitivity model, the
allowance of a longer transition time (<365 days) between PD ending and HHD initiation
(while keeping the same 180-day definition for PD technique failure) increased the number of
patients transferred to HHD to 272 (9.3%). In both sensitivity models, predictors of transfer to
HHD after PD completion were globally similar to those identified in the main model (Table
4). Of note, treatment in New Zealand (compared to Australia) was associated with a two-fold
increase in the odds of transfer to HHD when the allowed transition time between PD
completion and HHD initiation was increased to 365 days.
Predictors of transfer to HHD after PD start – unrestricted cohort

97
The competing risk model included all 10710 patients treated with PD on day 90 after RRT
initiation. Of them, 2759 patients were transferred to facility HD, 3752 patients died and 1549
underwent renal transplantation. With the exception of Pacific Islander race, other positive
predictors of time to transfer to HHD (n=156) were similar to those from the logistic
regression model and included: male gender, and overweight / obesity. Similarly, older age,
diabetic or hypertensive diseases (compared to glomerulonephritis) and cardiovascular disease
were associated with a lower chance of transfer to HHD after PD initiation (Table 3).
Predictors of transition time length
Based on the sensitivity model showing similar predictors of transfer to HHD after PD
technique failure when using a 180 or 365-day maximum transition time between PD ending
and HHD starting, this secondary outcome included all 272 patients who initiated HHD less
than one year after PD completion. The distribution of the duration of this transition time
among these patients is displayed in Figure 2. When the transition time was categorized, 87
(32%) patients had a transition time shorter than 90 days, 71 (26%) patients remained on
temporary facility HD between 90 and 180 days and 114 (42%) patients had more than 180
days (and less than 365 days) of facility HD transition time. Predictors of transition time,
based on multivariable ordinal logistic regression, are presented in Table 5. Older age,
infectious cause of PD ending and treatment in New Zealand (compared to Australia) were
associated with a longer transition time while male gender and Asian race (compared to
Caucasian) were associated with a shorter transition time.
Discussion
In this registry study, only 5% of all patients with PD completion after PD technique failure
were transferred to HHD in less than 180 days after PD ending. The positive predictors of
such a HHD transfer included male gender, obesity and longer duration of PD therapy. In
contrast, older age, diabetic and hypertensive kidney disease (compared to
glomerulonephritis), cardiovascular disease, infectious cause of PD ending and Australian and
New Zealand Indigenous racial origin were associated with lower odds of transfer to HHD. In
a competing risk model assessing the unrestricted cohort, male gender, Pacific Islander race
and overweight / obesity were associated with a higher SHR for transfer to HHD while older

98
age, diabetic or hypertensive kidney diseases (compared to glomerulonephritis) and
cardiovascular disease were associated with lower SHR of transfer to HHD. Furthermore,
longer duration of transition time in facility HD between PD completion and HHD initiation
was predicted by older age, infectious causes of PD ending, treatment in New Zealand and
female gender.
In this study, it was elected to use the term ‘PD completion’ instead of the more classic ‘PD
technique failure’ in order to reflect the long duration of HD treatment required to be included
in this category. This 180-HD day definition was selected in order to exclude patients with
temporary HD who eventually switched back to PD.
Despite the high probability of PD ending (or technique failure) in the journey of PD therapy,
knowledge about this transition period remains limited. Many studies have attempted to
identify predictors of PD technique failure (and transfer to HD), with somewhat inconsistent
results, and overall poor predictive capacity (166, 170-175).
While the use of HHD after PD completion could be seen as an optimal scenario in many
countries promoting home dialysis, very few data are available regarding this specific
transition. A Canadian single-center study reported the outcomes of 85 patients with PD
technique failure, among whom 12 (16%) patients were transferred to HHD and the other 63
patients to facility HD (105). This represented a much higher HHD transfer rate than (what
they stated was) the Canadian national average of 1% (105). In unadjusted analyses, patients
transferred to HHD were younger and had less infection-related causes of PD technique
failure. Other publications assessing HHD after PD completion have been mostly descriptive,
without direct comparison with patients transferred to facility HD (103, 104).
In this study, predictors of transfer to HHD were somewhat similar to baseline characteristics
of patients included in incident HHD cohorts (55, 62, 90, 98, 115, 167). Indeed, older age was
associated with a lower chance of transfer to HHD, which is in keeping with the young age of
most HHD cohorts (62, 98, 167). Similarly, patients with non-diabetic kidney disease had a
higher chance of transfer to HHD, which is also in accordance with the HHD literature, with,
99
for instance, diabetes being associated with higher risk of HHD training failure (179).
Although not explored in this study, complications related to aging and diabetes, such as
decreased sight and dexterity could be associated with both PD failure and inability to transfer
to HHD. Australian (ATSI) and New Zealand (Maori) indigenous patients were also less likely
to transfer to HHD during the first 180 days after PD completion (55, 62). Finally, males were
twice as likely to switch to HHD and had shorter transition times, which might be related to
easier arteriovenous fistula creation in males (180-182) and, perhaps, a more traditional
caregiver role for female spouses (183, 184).
Nevertheless, this study also identified predictors more closely related to PD therapy. Patients
with an infectious cause of PD ending had lower chances of transfer to HHD and, when they
did, took longer to transition, which might reflect the acuteness of their PD ending. In contrast,
‘insufficient dialysis’ was the cause of PD ending for almost half of the HHD transfer group,
which could have potentially allowed time for advance planning of PD completion, creation of
arteriovenous access and initiation of home hemodialysis education (160, 170). The positive
association between longer duration of PD therapy and transfer to HHD after PD completion
could be related to a lower rate of PD complications, perhaps due to greater skill with self-care
therapy.
Finally, patients with larger BMI (>30 kg/m2) in this study were more likely to transfer to
HHD. Since increased BMI has previously been associated with higher risks of peritonitis
(163, 185-187) and technique failure (108, 165), it is possible that obese patients committed to
home dialysis but experiencing complications on PD were more steadily encouraged to
transfer to HHD. Likewise, the association between higher BMI and HHD transfer could be
related to a need for more intensive dialysis, easily accessible through HHD (188).
It is also important to note the impact of healthcare systems when assessing transition between
dialysis modality. Indeed, in this study, being treated in New Zealand (compared to Australia)
was associated with a longer transition between PD completion and HHD initiation. However,
when this transition time was extended to 365 days, patients in New Zealand were twice as
likely to be transferred to HHD than Australian patients. Of note, there were no specific

100
policies addressing transfer to HHD after PD completion in Australia and New Zealand during
the study period.
Among this study’s strengths is the inclusion of PD patients from all centers across Australia
and New Zealand, two countries having among the highest proportion of dialysis patients
treated with home dialysis (189). Hence, this study offers a unique opportunity to describe the
transition between PD and HHD and to highlight how infrequent this transition can be, even in
home dialysis-oriented countries having, for instance, the highest proportion of HHD
internationally with 18% in New Zealand and 9% in Australia, compared to only 4% in
Canada and 1% in the United States. The use of sensitivity models allowing for different
definitions of PD completion and maximum transition time between PD ending and HHD
initiation also strengthens the study results, especially considering the lack of formal
definitions in this area. Moreover, the evaluation of the primary outcome in a competing risk
survival model, allowing inclusion of the entire or unrestricted PD cohort and taking into
account PD completion due to death and transplantation, yielded consistent results.
This study also had several limitations, including the limited depth of registry data collection
and consequent lack of access to other potentially important characteristics, such as education
level, marital status and other socio-economic factors. Due to the nature of the data,
identification of anticipated and/or planned transfer to HHD was impossible. Furthermore,
center-specific characteristics that might influence dialysis modality selection were unable to
be ascertained. Specific associations between centers or states and transfer from PD to HHD,
could not be assessed due to statistical power constrains. Finally, the results of this study
might not apply to other countries where jurisdiction or experiences with home dialysis differ.
In conclusion, this study showed that only 5% of patients with PD completion were transferred
into HHD in less than 180 days after PD ending due to technique failure. Positive predictors of
transition to HHD included younger age, male gender, obesity, and longer duration of PD
therapy. In contrast, Australian and New Zealand Indigenous patients, those with diabetic or
hypertensive kidney disease, and those with infectious causes of PD ending were less likely to
be transferred to HHD. Further studies should be performed to validate these findings in other
101
populations, to identify patients for which HHD might be associated with the greatest benefits
and, most importantly, to identify strategies to increase the frequency of transition between PD
and HHD. Such strategies could notably include elective (and planned) transfer to HHD for
PD patients with multiple and repetitive PD-related complications, initiation of unplanned HD
by specific HD teams performing home-dialysis oriented training and integration of PD and
HHD into a global home dialysis program to facilitate increased patient exposure to both
modalities.

102
Figures and Tables
Article 3. Figure 1 – Flow chart
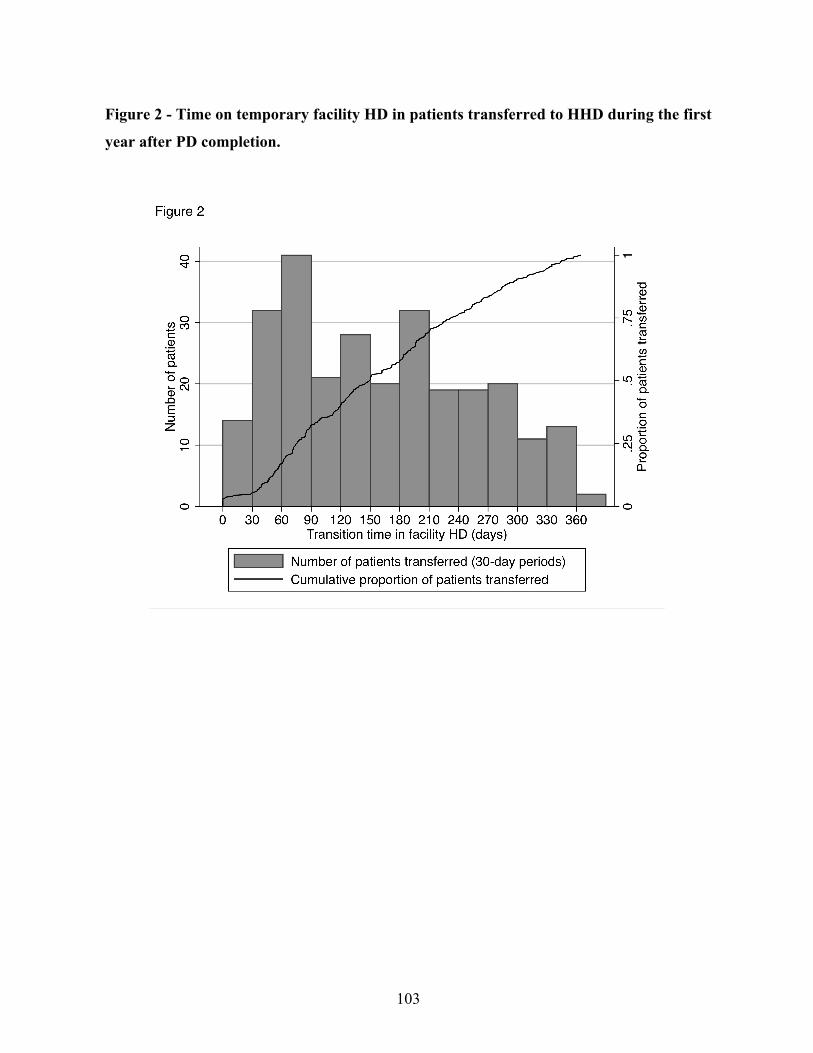
103
Figure 2 - Time on temporary facility HD in patients transferred to HHD during the first
year after PD completion.

104
Article 3. Table 1 – Baseline characteristics of the study cohort
Characteristic PD cohort (n=10710)
Age at RRT start 62 (50-71)
Sex Male 6082 (57)
Race
Caucasian 7389 (69)
Asian 1236 (12)
ATSI 601 (6)
Maori 89 (8)
Pacific Islander 468 (4)
Other 117 (1)
Primary kidney disease
Diabetes 3739 (35)
Glomerulonephritis 2662 (25)
Hypertension 1526 (14)
Polycystic kidney disease 593 (5)
Reflux 338 (3)
Other 1852 (17)
Cigarette (active at entry) 1458 (14)
Comorbidities
Diabetes 4648 (43)
Coronary disease 4060 (38)
Peripheral vascular disease 2585 (24)
Cerebrovascular disease 1594 (15)
Pulmonary disease 1606 (15)
BMI (kg/m2)
<20 823 (8)
20-24 3451 (32)
25-29 3712 (35)
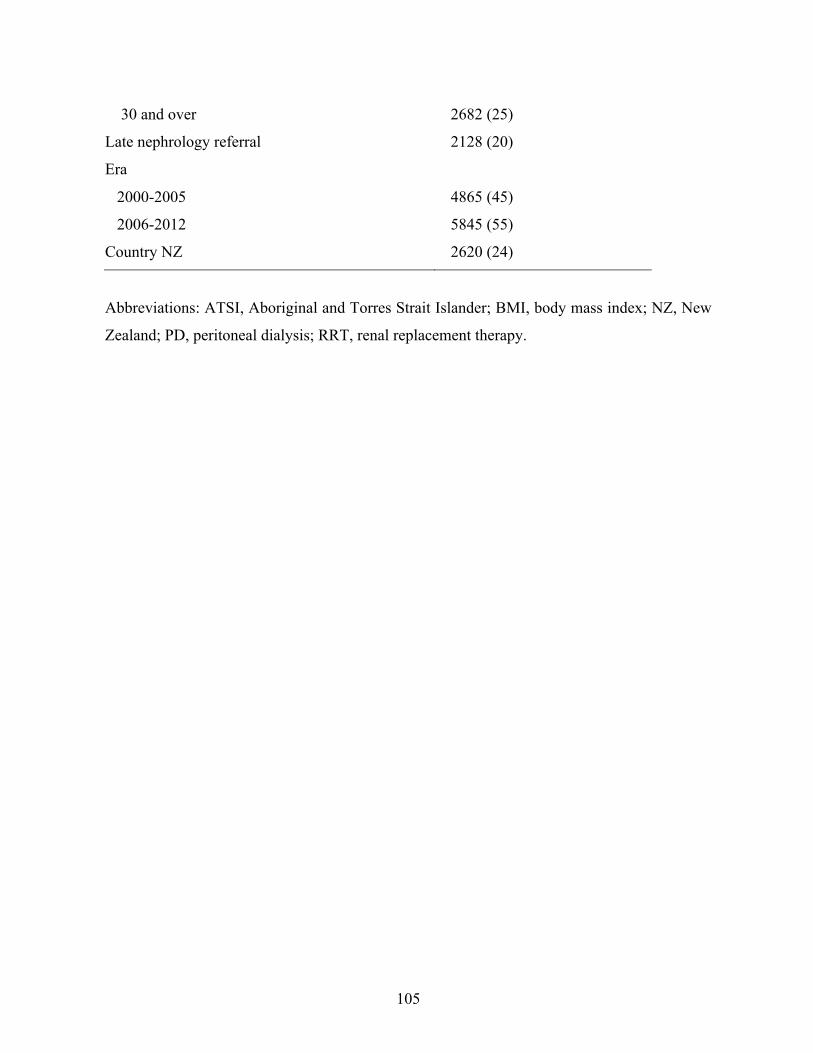
105
30 and over 2682 (25)
Late nephrology referral 2128 (20)
Era
2000-2005 4865 (45)
2006-2012 5845 (55)
Country NZ 2620 (24)
Abbreviations: ATSI, Aboriginal and Torres Strait Islander; BMI, body mass index; NZ, New
Zealand; PD, peritoneal dialysis; RRT, renal replacement therapy.

106
Table 2 - Causes of PD technique failure in patients transferred to HHD and facility HD
only
Causes of PD technique failure HHD transfer
(n=156)
Facility HD only
(n=2759)
Infections
Peritonitis 39 (25) 1229 (45)
Tunnel / exit site infection 3 (2) 96 (3)
Other abdominal infection 0 (0) 37 (1)
Total 42 (27) 1362 (49)
Inadequate dialysis
Inadequate solute clearance 61 (39) 384 (14)
Inadequate fluid ultra-filtration 15 (10) 147 (5)
Total 76 (49) 531 (19)
Mechanical complications
Dialysate leak 7 (5) 162 (6)
Catheter-related problems 1 (<1) 78 (3)
Other mechanical problems 11 (7) 113 (4)
Total 19 (12) 353 (13)
Other
Abdominal/other surgery 4 (3) 113 (4)
Patient choice 9 (6) 128 (5)
Inability to manage self-care 0 (0) 179 (6)
Other/unknown 6 (4) 93 (3)
Total 19 (13) 513 (19)
Abbreviations: HD, hemodialysis; HHD, home hemodialysis; PD, peritoneal dialysis.
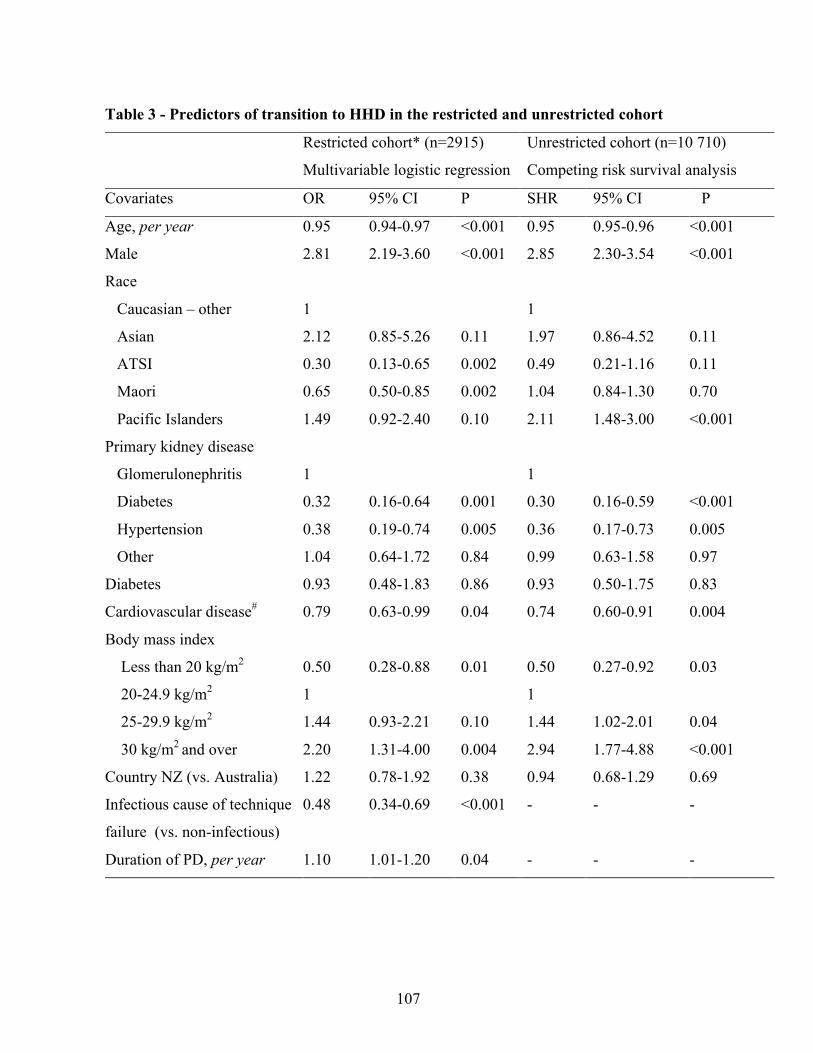
107
Table 3 - Predictors of transition to HHD in the restricted and unrestricted cohort
Restricted cohort* (n=2915)
Multivariable logistic regression
Unrestricted cohort (n=10 710)
Competing risk survival analysis
Covariates OR 95% CI P SHR 95% CI P
Age, per year 0.95 0.94-0.97 <0.001 0.95 0.95-0.96 <0.001
Male 2.81 2.19-3.60 <0.001 2.85 2.30-3.54 <0.001
Race
Caucasian – other 1 1
Asian 2.12 0.85-5.26 0.11 1.97 0.86-4.52 0.11
ATSI 0.30 0.13-0.65 0.002 0.49 0.21-1.16 0.11
Maori 0.65 0.50-0.85 0.002 1.04 0.84-1.30 0.70
Pacific Islanders 1.49 0.92-2.40 0.10 2.11 1.48-3.00 <0.001
Primary kidney disease
Glomerulonephritis 1 1
Diabetes 0.32 0.16-0.64 0.001 0.30 0.16-0.59 <0.001
Hypertension 0.38 0.19-0.74 0.005 0.36 0.17-0.73 0.005
Other 1.04 0.64-1.72 0.84 0.99 0.63-1.58 0.97
Diabetes 0.93 0.48-1.83 0.86 0.93 0.50-1.75 0.83
Cardiovascular disease# 0.79 0.63-0.99 0.04 0.74 0.60-0.91 0.004
Body mass index
Less than 20 kg/m2 0.50 0.28-0.88 0.01 0.50 0.27-0.92 0.03
20-24.9 kg/m2 1 1
25-29.9 kg/m2 1.44 0.93-2.21 0.10 1.44 1.02-2.01 0.04
30 kg/m2 and over 2.20 1.31-4.00 0.004 2.94 1.77-4.88 <0.001
Country NZ (vs. Australia) 1.22 0.78-1.92 0.38 0.94 0.68-1.29 0.69
Infectious cause of technique
failure (vs. non-infectious)
0.48 0.34-0.69 <0.001 - - -
Duration of PD, per year 1.10 1.01-1.20 0.04 - - -

108
* Restricted cohort of patients with PD completion due to technique failure with transfer to
hemodialysis # Any of coronary, peripheral vascular or cerebrovascular disease
Abbreviations: ATSI, Aboriginal and Torres Strait Islander; HD, hemodialysis; HHD, home
hemodialysis; NZ, New Zealand; PD, peritoneal dialysis; OR, odd ratio; SHR, subhazard ratio
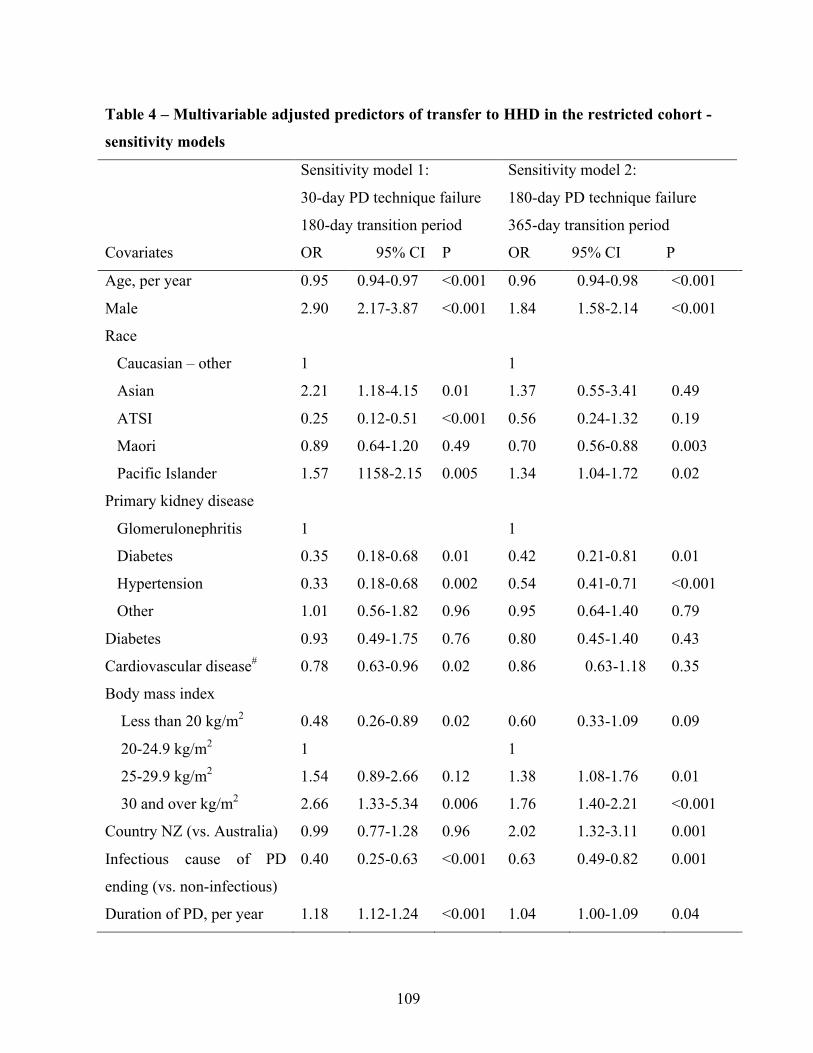
109
Table 4 – Multivariable adjusted predictors of transfer to HHD in the restricted cohort -
sensitivity models
Sensitivity model 1:
30-day PD technique failure
180-day transition period
Sensitivity model 2:
180-day PD technique failure
365-day transition period
Covariates OR 95% CI P OR 95% CI P
Age, per year 0.95 0.94-0.97 <0.001 0.96 0.94-0.98 <0.001
Male 2.90 2.17-3.87 <0.001 1.84 1.58-2.14 <0.001
Race
Caucasian – other 1 1
Asian 2.21 1.18-4.15 0.01 1.37 0.55-3.41 0.49
ATSI 0.25 0.12-0.51 <0.001 0.56 0.24-1.32 0.19
Maori 0.89 0.64-1.20 0.49 0.70 0.56-0.88 0.003
Pacific Islander 1.57 1158-2.15 0.005 1.34 1.04-1.72 0.02
Primary kidney disease
Glomerulonephritis 1 1
Diabetes 0.35 0.18-0.68 0.01 0.42 0.21-0.81 0.01
Hypertension 0.33 0.18-0.68 0.002 0.54 0.41-0.71 <0.001
Other 1.01 0.56-1.82 0.96 0.95 0.64-1.40 0.79
Diabetes 0.93 0.49-1.75 0.76 0.80 0.45-1.40 0.43
Cardiovascular disease# 0.78 0.63-0.96 0.02 0.86 0.63-1.18 0.35
Body mass index
Less than 20 kg/m2 0.48 0.26-0.89 0.02 0.60 0.33-1.09 0.09
20-24.9 kg/m2 1 1
25-29.9 kg/m2 1.54 0.89-2.66 0.12 1.38 1.08-1.76 0.01
30 and over kg/m2 2.66 1.33-5.34 0.006 1.76 1.40-2.21 <0.001
Country NZ (vs. Australia) 0.99 0.77-1.28 0.96 2.02 1.32-3.11 0.001
Infectious cause of PD
ending (vs. non-infectious)
0.40 0.25-0.63 <0.001 0.63 0.49-0.82 0.001
Duration of PD, per year 1.18 1.12-1.24 <0.001 1.04 1.00-1.09 0.04

110
*C-statistic sensitivity model 1 = 0.83, sensitivity model 2 = 0.77
Abbreviations: ATSI, Aboriginal and Torres Strait Islander; NZ, New Zealand; PD, peritoneal
dialysis;

111
Table 5 – Predictors of longer facility HD transition time before HHD initiation,
Multivariable ordinal logistic regression
Covariates OR 95% CI P
Age, per year 1.02 1.00-1.03 <0.001
Male 0.53 0.34-0.83 0.006
Race
Caucasian 1
Asian 0.48 0.33-0.72 <0.001
Indigenous - Other 0.80 0.51-1.27 0.35
Primary kidney disease
Glomerulonephritis 1
Hypertension 2.42 0.80-7.35 0.12
Diabetes 1.57 0.91-2.69 0.10
Other 1.04 0.59-1.84 0.90
Diabetes 0.88 0.53-1.45 0.61
Infectious cause of PD technique
failure (vs. non-infectious)
2.08 1.08-4.03 0.03
Region NZ (vs. Australia) 2.55 1.50-4.34 0.001
Level 1: < 90 days (n=87), Level 2: 90-180 days (n=71), Level 3: 181-365 days (n=114)
Abbreviations: HD, hemodialysis; HHD, home hemodialysis; NZ, New Zealand; PD,
peritoneal dialysis.

112
Supplementary data
Table S1 – Causes of PD technique failure in patients transferred to HHD and facility
HD only
Causes of PD technique failure HHD transfer
(n=156)
Facility HD only
(n=2759)
Infections
Peritonitis 39 (25) 1229 (45)
Tunnel / exit site infection 3 (2) 96 (3)
Other abdominal infection 0 (0) 37 (1)
Total 42 (27) 1362 (49)
Inadequate dialysis
Inadequate solute clearance 61 (39) 384 (14)
Inadequate fluid ultra-filtration 15 (10) 147 (5)
Total 76 (49) 531 (19)
Mechanical complications
Dialysate leak 7 (5) 162 (6)
Catheter-related problems 1 (<1) 78 (3)
Other mechanical problems 11 (7) 113 (4)
Total 19 (12) 353 (13)
Other
Abdominal/other surgery 4 (3) 113 (4)
Patient choice 9 (6) 128 (5)
Inability to manage self-care 0 (0) 179 (6)
Other/unknown 6 (4) 93 (3)
Total 19 (13) 513 (19)
Abbreviations: HD, hemodialysis; HHD, home hemodialysis; PD, peritoneal dialysis.
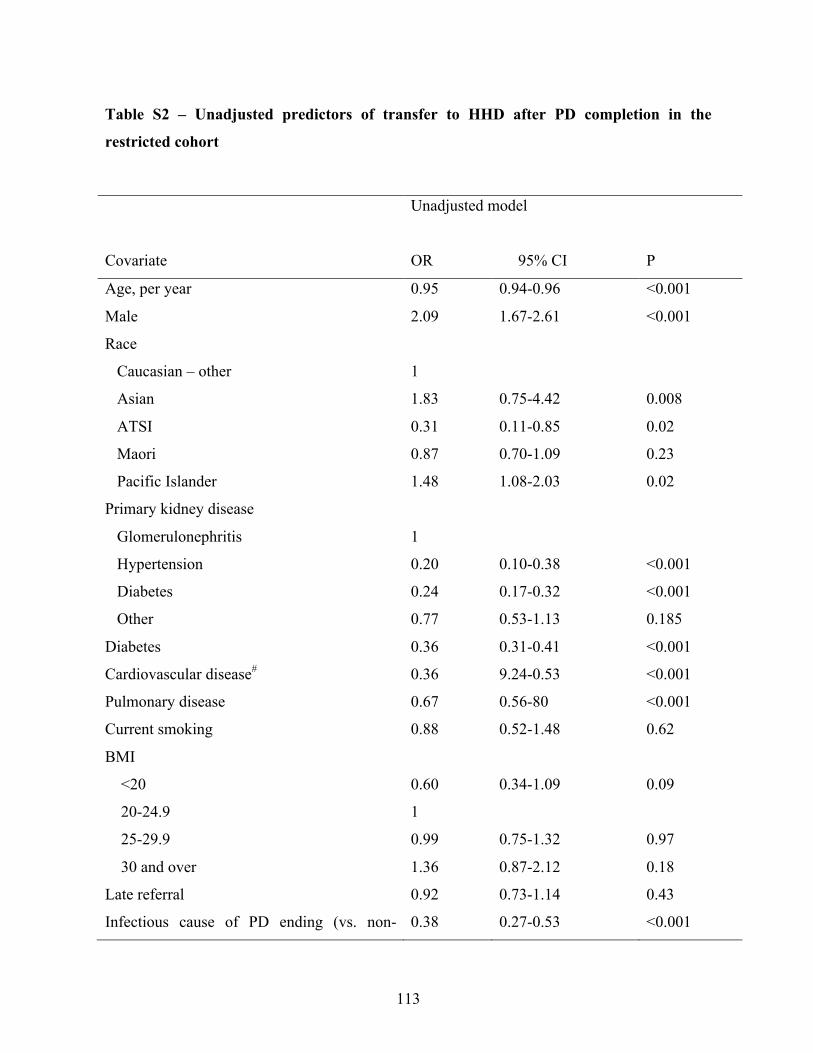
113
Table S2 – Unadjusted predictors of transfer to HHD after PD completion in the
restricted cohort
Unadjusted model
Covariate OR 95% CI P
Age, per year 0.95 0.94-0.96 <0.001
Male 2.09 1.67-2.61 <0.001
Race
Caucasian – other 1
Asian 1.83 0.75-4.42 0.008
ATSI 0.31 0.11-0.85 0.02
Maori 0.87 0.70-1.09 0.23
Pacific Islander 1.48 1.08-2.03 0.02
Primary kidney disease
Glomerulonephritis 1
Hypertension 0.20 0.10-0.38 <0.001
Diabetes 0.24 0.17-0.32 <0.001
Other 0.77 0.53-1.13 0.185
Diabetes 0.36 0.31-0.41 <0.001
Cardiovascular disease# 0.36 9.24-0.53 <0.001
Pulmonary disease 0.67 0.56-80 <0.001
Current smoking 0.88 0.52-1.48 0.62
BMI
<20 0.60 0.34-1.09 0.09
20-24.9 1
25-29.9 0.99 0.75-1.32 0.97
30 and over 1.36 0.87-2.12 0.18
Late referral 0.92 0.73-1.14 0.43
Infectious cause of PD ending (vs. non- 0.38 0.27-0.53 <0.001

114
infectious)
Region NZ (vs. Australia) 1.34 0.94-1.91 0.11
PD vintage, per year 1.10 1.0-1.18 0.01
Era 2000-2005
(vs. 2006-2012)
0.93 0.57-1.53 0.78

115
Table S3 – Multivariable adjusted predictors of transfer to HHD in the restricted cohort
- sensitivity models
Sensitivity model 1:
30-day PD technique failure
180-day transition period
Sensitivity model 2:
180-day PD technique failure
365-day transition period
Covariate OR 95% CI P OR 95% CI P
Age, per year 0.95 0.94-0.97 <0.001 0.96 0.94-0.98 <0.001
Male 2.90 2.17-3.87 <0.001 1.84 1.58-2.14 <0.001
Race
Caucasian – other 1 1
Asian 2.21 1.18-4.15 0.01 1.37 0.55-3.41 0.49
ATSI 0.25 0.12-0.51 <0.001 0.56 0.24-1.32 0.19
Maori 0.89 0.64-1.20 0.49 0.70 0.56-0.88 0.003
Pacific Islander 1.57 1158-2.15 0.005 1.34 1.04-1.72 0.02
Primary kidney disease
Glomerulonephritis 1 1
Diabetes 0.35 0.18-0.68 0.01 0.42 0.21-0.81 0.01
Hypertension 0.33 0.18-0.68 0.002 0.54 0.41-0.71 <0.001
Other 1.01 0.56-1.82 0.96 0.95 0.64-1.40 0.79
Diabetes 0.93 0.49-1.75 0.76 0.80 0.45-1.40 0.43
Cardiovascular disease# 0.78 0.63-0.96 0.02 0.86 0.63-1.18 0.35
BMI
<20 0.48 0.26-0.89 0.02 0.60 0.33-1.09 0.09
20-24.9 1 1
25-29.9 1.54 0.89-2.66 0.12 1.38 1.08-1.76 0.01
30 and over 2.66 1.33-5.34 0.006 1.76 1.40-2.21 <0.001
Country NZ (vs. Australia) 0.99 0.77-1.28 0.96 2.02 1.32-3.11 0.001

116
Infectious cause of PD
ending (vs. non-infectious)
0.40 0.25-0.63 <0.001 0.63 0.49-0.82 0.001
Duration of PD, per year 1.18 1.12-1.24 <0.001 1.04 1.00-1.09 0.04
*C-statistic sensitivity model 1 = 0.83, sensitivity model 2 = 0.77

117
6 – Discussion
Chacun des articles présentés ci-haut comporte une discussion détaillée. Afin d’éviter toute
répétition indue, les informations incluses dans les articles ne seront pas reproduites en totalité
dans cette section. La présente discussion se voudra principalement un rappel et une mise en
contexte des principaux résultats présentés dans ce mémoire suivi d’une analyse de leurs
principales limites pour conclure avec les projets futurs planifiés afin de pouvoir,
éventuellement, appliquer ces résultats chez la population locale et internationale avec
insuffisance rénale terminale.
6.1 Sommaire des principaux résultats
Ce mémoire s’est intéressé aux répercussions cliniques de la dialyse à domicile (dialyse
péritonéale et hémodialyse à domicile) avec comme principal sujet d’intérêt l’évaluation du
modèle de dialyse à domicile intégrée, soit l’initiation de la suppléance rénale avec la DP
suivie d’un transfert en HDD au moment de l’arrêt de la DP.
Le premier article s’attardait à l’analyse de tous les patients ayant débuté la thérapie de
suppléance rénale avec la DP ou l’HDD entre janvier 2000 et décembre 2012, en Australie et
en Nouvelle-Zélande. Dans cette étude de registre (ANZDATA) avec 11 416 patients ayant
débuté la suppléance rénale, le traitement par HHD était associé à une mortalité globale près
de deux fois inférieure au traitement par DP. Les risques de décès sous traitement de dialyse à
domicile (‘on-treatment’ mortality) et d’échec de la technique à domicile étaient également
près de trois fois moindres chez les patients traités par HDD comparativement à ceux traités
par la DP. De plus, les résultats observés dans l’étude étaient robustes à travers trois approches
statistiques, c’est à dire dans un modèle multivarié, un pairage avec score de propension
(propensity score matching) et un ajustement pour les quintiles du score de propension, ainsi
que dans maintes analyses de sensibilité.

118
Dans le second article, l’évaluation des répercussions cliniques du modèle de dialyse à
domicile intégrée dans une analyse de cohorte pairée par score de propension (propensity
score matching) a montré une survie des patients et de la technique à domicile similaire chez
les patients traités par le modèle de dialyse à domicile intégrée (DP puis HDD) ainsi que chez
les parents traités initialement par HDD. Les patients traités uniquement par DP avaient
toutefois un risque de décès et d’échec de technique trois fois supérieure aux patients traités
par le modèle de dialyse à domicile intégrée. Des associations similaires étaient présentes lors
de l’évaluation de la survie isolée (censuré pour l’échec de technique).
Finalement, le troisième article a permis d’identifier les prédicteurs du transfert en HDD au
moment de l’arrêt de la DP. Dans l’analyse principale, seulement 5% des patients ayant cessé
la DP en raison d’un échec de technique (excluant les décès et transplantations) ont été
transférés en HDD moins de 180 jours après l’arrêt de la DP. Les prédicteurs positifs d’un
transfert en HDD comprenaient le sexe masculin, l’obésité ainsi qu’une longue durée de
traitement par DP. Au contraire, l’âge avancé, la maladie rénale diabétique et hypertensive
(comparativement aux glomérulonéphrites), la maladie cardiovasculaire ainsi que les causes
infectieuses liées à l’arrêt de la DP étaient associés à un plus faible transfert en HDD. Un
modèle de risque compétitif comprenant tous les patients ayant initié la DP moins de 90 jours
après le début de la suppléance rénale a également permis d’identifier des prédicteurs positifs
et négatifs similaires.

119
6.2 Mise en contexte et limites des résultats
Ce mémoire comporte des forces importantes avec, en premier lieu, la taille importante de
l’échantillon incluant tous les patients incidents traités par dialyse à domicile en Australie et
Nouvelle-Zélande, deux pays reconnus pour leur grande population de patients en dialyse à
domicile. Le travail présenté plus haut est le premier évaluant l’effet de la DP et l’HDD dans
une cohorte de patients incidents à la thérapie de suppléance rénale, limitant ainsi le risque de
biais de survie sélective potentiellement présent dans une cohorte prévalente. C’est également
la première évaluation rigoureuse publiée des répercussions du modèle de dialyse à domicile
intégrée. De puis, les résultats présentés dans les articles ci-haut ont été validés à travers
différentes approches statistiques, améliorant ainsi la validité interne des résultats.
Les résultats présentés ci-haut doivent toutefois être mis en contexte face à leurs principales
limites, soit la présence de facteurs de confusion et biais résiduels, les limites liées à la
population étudiée et la taille de l’échantillon.
Facteurs confondants et biais résiduels
Comme dans toute analyse observationnelle, la principale limite des études décrites ci-haut est
liée la présence possible de facteurs de confusion résiduels pouvant expliquer les associations
observées, notamment pas un biais d’indication ou de sélection. En effet, en ce qui concerne la
première étude, il est possible que la mortalité inférieure rapportée avec l’HDD soit liée à des
différences fondamentales entre les patients ayant sélectionné le traitement par DP et HDD, tel
le niveau d’éducation, les habiletés psychologiques, le degré d’autonomie et le soutient social.
Ces facteurs n’ont pu être directement adressés par les stratégies d’ajustement en raison de
l’absence de données recueillis à cet égard dans le ANZDATA. Bien que l’analyse par score
de propension ait tenté de limiter l’impact de facteurs de confusion résiduels, étant donné
l’absence de données sur toute la sphère psychosociale des patients inclus dans l’étude, l’effet
ajouté de cette approche d’ajustement demeure probablement limité.
Il est également possible que l’influence des néphrologues, ayant eux-mêmes une opinion
quant aux bénéfices de la DP et l’HDD, ait pu influencer le choix de modalité des patients et

120
potentiellement contribué aux différences observées (124, 144-146). De façon similaire, l’effet
de potentiels facteurs de confusion résiduels pourrait expliquer, au moins partiellement, les
résultats obtenus dans les deux autres articles discutés ci-haut.
Dans le second article évaluant les répercussions cliniques du modèle de dialyse à domicile
intégrée, la présence d’un biais de survie (immortal time bias) chez le groupe avec DP + HDD
ne peut être exclue. En effet, malgré le choix d’adopter une stratégie d’analyse par
appariement (matching) basée sur l’inclusion de la durée de la dialyse avant le transfert en
HDD, il n’est pas exclu que ce groupe présente un effet de « survivant », sachant que les
périodes de transition sont souvent associées à une haute morbidité et mortalité chez les
patients en insuffisance rénale terminale (190, 191).
Par ailleurs, l’analyse basée sur les données du ANZDATA a rendu impossible l’identification
des patients qui avaient l’intention de transférer en HDD après l’arrêt de la DP, mais pour qui
le transfert fût impossible en raison de complications médicales, changement d’intention ou
décès. De façon similaire, aucune donnée n’était disponible pour identifier les patients jugés
bons candidats au transfert en HDD par l’équipe médicale, mais qui auraient refusé pour
diverses raisons.
Population spécifique et validité externe
La validité externe de cette étude est limitée par la nature de la population étudiée, soit la
population d’Australie et Nouvelle-Zélande, c’est-à-dire deux des pays avec un des meilleurs
accès aux modalités de dialyse à domicile (8). Ainsi, il est possible que les résultats obtenus
dans cette étude ne soient pas généralisables à une population où l’accessibilité à la dialyse à
domicile n’est pas aussi développée et où le soutien aux patients traités à domicile n’est pas
présent. De plus, les particularités du traitement de la DP et plus spécifiquement de l’HDD
dans cette région, soit principalement des traitements d’HD prolongés et souvent nocturnes,
pourraient limiter l’application des résultats obtenus dans des régions avec d’autres pratiques
de dialyse à domicile. À cet égard, il serait probablement imprudent d’étendre les résultats
obtenus dans cette étude aux régions où l’HDD est principalement offerte sous la forme d’HD
121
quotidiennes courtes avec un dialysat à faible débit (ex. technologie NxStage), comme c’est
notamment le cas aux États-Unis.
Les critères d’inclusion stricts sélectionnés afin de minimiser le potentiel biais de survie et
évaluer une cohorte réellement incidente en suppléance rénale (dialyse à domicile au jour 90
après l’initiation de la thérapie de suppléance rénale) ont également pu limiter la possibilité de
généraliser les résultats obtenus dans cette étude. En effet, les patients ayant initié l’HDD
durant les trois premiers mois après le début de la suppléance rénale pourraient avoir des
caractéristiques différentes de ceux ayant débuté plus tardivement (meilleur observance
thérapeutique, motivation exemplaire et détermination à être traité à domicile, etc.) et ils
pourraient ne pas être représentatifs de la cohorte globale de patients traités par HDD, laquelle
pourrait avoir des répercussions cliniques moins favorables en termes de survie.
De façon similaire, le modèle principal de dialyse à domicile intégrée ciblait les patients ayant
transféré de la DP à l’HDD avec un temps maximal de 90 jours en HD hospitalière entre les
deux modalités à domicile, afin de minimiser, une fois de plus, un potentiel biais de survie.
Bien qu’une analyse de sensibilité allouant jusqu’à 180 jours de transition ait présenté des
résultats similaires, il est possible que cette restriction ait limité la portée des résultats.
Taille de l’échantillon
Finalement, l’évaluation des répercussions cliniques du modèle de dialyse à domicile intégrée
(2e article) a été significativement limitée par le faible nombre de patients ayant respecté les
critères prédéfinis de transition directe entre le DP et l’HDD (< 90 jours d’HD hospitalière en
l’arrêt de la DP et le début de l’HDD), si bien que seule une petite proportion de la cohorte
globale de patients incidents en dialyse à domicile a été incluse dans l’analyse appariée avec le
score de propension, limitant une fois de plus la validité externe de l’étude.

122
6.3 Directions futures
Différents projets sont déjà en cours afin de poursuivre l’évaluation du modèle de dialyse à
domicile intégrée et de façon plus vaste, l’évaluation des transitions entre les diverses
modalités de dialyse.
Les données canadiennes du RCITO ont récemment été obtenues pour tous les patients ayant
débuté la thérapie de remplacement rénal avec la DP ou l’HDD entre 2000 et 2014. Ainsi, des
analyses similaires à celles réalisées dans ce mémoire seront effectuées afin de valider les
résultats obtenus et de déterminer leur applicabilité dans d’autres populations et plus
spécifiquement en ce qui nous concerne, la population canadienne.
Un projet futur souhaitable serait une évaluation prospective de tous les patients traités par les
modalités de dialyse à domicile avec des informations plus détaillées sur les caractéristiques
manquantes dans ce mémoire tel que les facteurs psychosociaux. Une évaluation prospective
devrait également adresser la question des patients pour qui l’intention était d’appliquer le
modèle de dialyse à domicile intégrée, mais qui, pour une raison ou une autre, n’ont pu le
réaliser.
Finalement, une collaboration internationale est actuellement en cours afin d’évaluer les
répercussions cliniques des transitions en dialyse de façon globale, soit entre les diverses
formes de dialyse à domicile et hospitalière. Cette collaboration internationale permettra de
valider les résultats obtenus lors de l’évaluation des bases de données nationales ainsi que de
mettre sur pied des études prospectives, tant au niveau qualitatif que quantitatif.

123
7 – Conclusion
Le présent mémoire avait comme objectif principal l’évaluation de la dialyse à domicile et du
modèle de dialyse à domicile intégrée chez la population de patients incidents à la thérapie de
suppléance rénale en Australie et Nouvelle-Zélande entre 2000 et 2012.
Le premier volet du mémoire a montré une mortalité inférieure chez les patients traités par
HDD dès l’initiation de la suppléance rénale (< 90 jours après le début de la dialyse)
comparativement aux patients traités par DP. La seconde section du mémoire a évalué les
répercussions cliniques du modèle de dialyse à domicile intégrée, montrant une survie de la
technique à domicile et du patient similaire chez les patients traités par la DP avec un transfert
en HDD après l’arrêt de la DP comparativement aux patients traités par HDD dès l’initiation
de la suppléance rénale. Finalement, le dernier article a identifié les caractéristiques
démographiques, les comorbidités et les caractéristiques du traitement de la DP qui prédisaient
un transfert en HDD après l’arrêt de la DP.
Les thèmes abordés dans ce mémoire ont une signification clinique importante puisqu’elles
adressent un questionnement réel chez les patients et professionnels traitant des patients avec
IRT, soit la sélection de la modalité de dialyse optimale pour un patient, et plus
particulièrement, le choix de la meilleure modalité de dialyse à domicile. Bien que les critères
de survie et maintien de la technique à domicile ne soient pas les seuls critères importants du
point de vue des patients, l’accès à des données fiables sur la survie des patients traités par les
modalités de dialyse à domicile, et l’effet de différentes trajectoires de thérapie à domicile est
primordial.
Sachant que les patients avec IRT ont parfois de longues années de thérapie de suppléance
rénale face à eux, l’évaluation favorable du modèle de dialyse à domicile intégrée dans ce
mémoire est prometteuse et mérite une évaluation plus poussée dans d’autres études
observationnelles et, idéalement, prospectives.

Bibliographie
1. Canadian Institute for Health Information, Canadian Organ Replacement Register Annual Report: Treatment of End-Stage Organ Failure in Canada, 2004 to 2013. Ottawa, ON: CIHI, 2015. 2. Polaschek N. Living on dialysis: concerns of clients in a renal setting. J Adv Nurs. 2003;41(1):44-52. 3. Tong A, Cheung KL, Nair SS, et al. Thematic synthesis of qualitative studies on patient and caregiver perspectives on end-of-life care in CKD. Am J Kidney Dis. 2014;63(6):913-27. 4. Ontario Renal Network, Independent Dialysis Data 2016 [9 april 2016]. http://www.renalnetwork.on.ca/ckd_data/independent_dialysis_data/ - .VwlKOoSTR64]. 5. Queensland Government (2007), Queensland Statewide Renal Health Services Plan, 2008-17, Part One: The Way Forward. Queensland Government, Brisbane. 6. Kidney Health Australia. A model for Home Dialysis, Australia. Jan 2012 ISBN: 978-0-9808596-6-9. 7. Ministere de la Sante et des Services sociaux. Orientations ministérielles pour les personnes atteintes de maaldies rénales - Paramètres d'organisation des services pour les personnes nécessitant des services de protection et de suppléance rénales par des traitements de dialyse. Gouvernement du Québec, 2015. 8. United States Renal Data System. 2015 USRDS annual data report: Epidemiology of kidney disease in the United States, International comparisons. National Institutes of Health, National Institute of DIabetes and Digestive and Kidney DIsease. Bethesda, MD, 2015. 9. Li PK, Chow KM. Peritoneal dialysis-first policy made successful: perspectives and actions. Am J Kidney Dis. 2013;62(5):993-1005. 10. Golper TA. The possible impact of the US prospective payment system ("bundle") on the growth of peritoneal dialysis. Perit Dial Int. 2013;33(6):596-9. 11. Karopadi AN, Mason G, Rettore E, et al. Cost of peritoneal dialysis and haemodialysis across the world. Nephrol Dial Transplant. 2013;28(10):2553-69. 12. Karopadi AN, Mason G, Rettore E, et al. The role of economies of scale in the cost of dialysis across the world: a macroeconomic perspective. Nephrol Dial Transplant. 2014;29(4):885-92. 13. Bargman JM. Advances in peritoneal dialysis: a review. Semin Dial. 2012;25(5):545-9. 14. Bargman JM. Peritoneal dialysis should be the first choice for renal replacement therapy in the elderly. Semin Dial. 2012;25(6):668-70. 15. Helantera I, Haapio M, Koskinen P, et al. Employment of patients receiving maintenance dialysis and after kidney transplant: a cross-sectional study from Finland. Am J Kidney Dis. 2012;59(5):700-6. 16. Muehrer RJ, Schatell D, Witten B, et al. Factors affecting employment at initiation of dialysis. Clin J Am Soc Nephrol. 2011;6(3):489-96. 17. Fan SL, Sathick I, McKitty K, et al. Quality of life of caregivers and patients on peritoneal dialysis. Nephrol Dial Transplant. 2008;23(5):1713-9.
18. Kutner NG, Zhang R, Barnhart H, et al. Health status and quality of life reported by incident patients after 1 year on haemodialysis or peritoneal dialysis. Nephrol Dial Transplant. 2005;20(10):2159-67. 19. Brown EA, Johansson L, Farrington K, et al. Broadening Options for Long-term Dialysis in the Elderly (BOLDE): differences in quality of life on peritoneal dialysis compared to haemodialysis for older patients. Nephrol Dial Transplant. 2010;25(11):3755-63. 20. Cameron JI, Whiteside C, Katz J, et al. Differences in quality of life across renal replacement therapies: a meta-analytic comparison. Am J Kidney Dis. 2000;35(4):629-37. 21. Wu AW, Fink NE, Marsh-Manzi JV, et al. Changes in quality of life during hemodialysis and peritoneal dialysis treatment: generic and disease specific measures. J Am Soc Nephrol. 2004;15(3):743-53. 22. Bargman JM, Thorpe KE, Churchill DN, et al. Relative contribution of residual renal function and peritoneal clearance to adequacy of dialysis: a reanalysis of the CANUSA study. J Am Soc Nephrol. 2001;12(10):2158-62. 23. Shemin D, Bostom AG, Laliberty P, et al. Residual renal function and mortality risk in hemodialysis patients. Am J Kidney Dis. 2001;38(1):85-90. 24. Szeto CC, Wong TY, Chow KM, et al. Are peritoneal dialysis patients with and without residual renal function equivalent for survival study? Insight from a retrospective review of the cause of death. Nephrol Dial Transplant. 2003;18(5):977-82. 25. Termorshuizen F, Dekker FW, van Manen JG, et al. Relative contribution of residual renal function and different measures of adequacy to survival in hemodialysis patients: an analysis of the Netherlands Cooperative Study on the Adequacy of Dialysis (NECOSAD)-2. J Am Soc Nephrol. 2004;15(4):1061-70. 26. Termorshuizen F, Korevaar JC, Dekker FW, et al. The relative importance of residual renal function compared with peritoneal clearance for patient survival and quality of life: an analysis of the Netherlands Cooperative Study on the Adequacy of Dialysis (NECOSAD )-2. Am J Kidney Dis. 2003;41(6):1293-302. 27. Li PK, Chow KM, Wong TY, et al. Effects of an angiotensin-converting enzyme inhibitor on residual renal function in patients receiving peritoneal dialysis. A randomized, controlled study. Ann Intern Med. 2003;139(2):105-12. 28. Zhang L, Zeng X, Fu P, et al. Angiotensin-converting enzyme inhibitors and angiotensin receptor blockers for preserving residual kidney function in peritoneal dialysis patients. Cochrane Database Syst Rev. 2014;6:CD009120. 29. Moist LM, Port FK, Orzol SM, et al. Predictors of loss of residual renal function among new dialysis patients. J Am Soc Nephrol. 2000;11(3):556-64. 30. Misra M, Vonesh E, Van Stone JC, et al. Effect of cause and time of dropout on the residual GFR: a comparative analysis of the decline of GFR on dialysis. Kidney Int. 2001;59(2):754-63. 31. Lang SM, Bergner A, Topfer M, et al. Preservation of residual renal function in dialysis patients: effects of dialysis-technique-related factors. Perit Dial Int. 2001;21(1):52-7. 32. Kim DJ, Park JA, Huh W, et al. The effect of hemodialysis during break-in period on residual renal function in CAPD patients. Perit Dial Int. 2000;20(6):784-5. 33. Koch M, Haastert B, Kohnle M, et al. Peritoneal dialysis relieves clinical symptoms and is well tolerated in patients with refractory heart failure and chronic kidney disease. Eur J Heart Fail. 2012;14(5):530-9.
34. Bertoli SV, Musetti C, Ciurlino D, et al. Peritoneal ultrafiltration in refractory heart failure: a cohort study. Perit Dial Int. 2014;34(1):64-70. 35. Nunez J, Gonzalez M, Minana G, et al. Continuous ambulatory peritoneal dialysis as a therapeutic alternative in patients with advanced congestive heart failure. Eur J Heart Fail. 2012;14(5):540-8. 36. Burkart JM, Golper TA. Should we treat patients with incremental dialysis prescriptions? Blood Purif. 2000;18(4):298-303. 37. Viglino G, Neri L, Barbieri S. Incremental peritoneal dialysis: effects on the choice of dialysis modality, residual renal function and adequacy. Kidney Int Suppl. 2008 (108):S52-5. 38. Lok CE, Foley R. Vascular access morbidity and mortality: trends of the last decade. Clin J Am Soc Nephrol. 2013;8(7):1213-9. 39. Rose DA, Sonaike E, Hughes K. Hemodialysis access. Surg Clin North Am. 2013;93(4):997-1012, x. 40. Ishani A, Collins AJ, Herzog CA, et al. Septicemia, access and cardiovascular disease in dialysis patients: the USRDS Wave 2 study. Kidney Int. 2005;68(1):311-8. 41. Johnson DW, Dent H, Yao Q, et al. Frequencies of hepatitis B and C infections among haemodialysis and peritoneal dialysis patients in Asia-Pacific countries: analysis of registry data. Nephrol Dial Transplant. 2009;24(5):1598-603. 42. Chiu K, Alam A, Iqbal S. Predictors of suboptimal and crash initiation of dialysis at two tertiary care centers. Hemodial Int. 2012;16 Suppl 1:S39-46. 43. Coentrao LA, Araujo CS, Ribeiro CA, et al. Cost analysis of hemodialysis and peritoneal dialysis access in incident dialysis patients. Perit Dial Int. 2013;33(6):662-70. 44. Klarenbach S, Manns B. Economic evaluation of dialysis therapies. Semin Nephrol. 2009;29(5):524-32. 45. Diamant MJ, Harwood L, Movva S, et al. A comparison of quality of life and travel-related factors between in-center and satellite-based hemodialysis patients. Clin J Am Soc Nephrol. 2010;5(2):268-74. 46. Liu FX, Gao X, Inglese G, et al. A Global Overview of the Impact of Peritoneal Dialysis First or Favored Policies: An Opinion. Perit Dial Int. 2014. 47. Couchoud C, Couillerot AL, Dantony E, et al. Economic impact of a modification of the treatment trajectories of patients with end-stage renal disease. Nephrol Dial Transplant. 2015;30(12):2054-68. 48. Lee H, Manns B, Taub K, et al. Cost analysis of ongoing care of patients with end-stage renal disease: the impact of dialysis modality and dialysis access. Am J Kidney Dis. 2002;40(3):611-22. 49. Klarenbach S, Tonelli M, Pauly R, et al. Economic evaluation of frequent home nocturnal hemodialysis based on a randomized controlled trial. J Am Soc Nephrol. 2014;25(3):587-94. 50. Yeates K, Zhu N, Vonesh E, et al. Hemodialysis and peritoneal dialysis are associated with similar outcomes for end-stage renal disease treatment in Canada. Nephrol Dial Transplant. 2012;27(9):3568-75. 51. Stack AG, Murthy BV, Molony DA. Survival differences between peritoneal dialysis and hemodialysis among "large" ESRD patients in the United States. Kidney Int. 2004;65(6):2398-408. 52. Vonesh EF, Snyder JJ, Foley RN, et al. Mortality studies comparing peritoneal dialysis and hemodialysis: what do they tell us? Kidney Int Suppl. 2006 (103):S3-11.

53. Mehrotra R, Chiu YW, Kalantar-Zadeh K, et al. Similar outcomes with hemodialysis and peritoneal dialysis in patients with end-stage renal disease. Arch Intern Med. 2011;171(2):110-8. 54. Liem YS, Wong JB, Hunink MG, et al. Comparison of hemodialysis and peritoneal dialysis survival in The Netherlands. Kidney Int. 2007;71(2):153-8. 55. Marshall MR, Hawley CM, Kerr PG, et al. Home hemodialysis and mortality risk in Australian and New Zealand populations. Am J Kidney Dis. 2011;58(5):782-93. 56. McDonald SP, Marshall MR, Johnson DW, et al. Relationship between dialysis modality and mortality. J Am Soc Nephrol. 2009;20(1):155-63. 57. Jaar BG, Coresh J, Plantinga LC, et al. Comparing the risk for death with peritoneal dialysis and hemodialysis in a national cohort of patients with chronic kidney disease. Ann Intern Med. 2005;143(3):174-83. 58. Termorshuizen F, Korevaar JC, Dekker FW, et al. Hemodialysis and peritoneal dialysis: comparison of adjusted mortality rates according to the duration of dialysis: analysis of The Netherlands Cooperative Study on the Adequacy of Dialysis 2. J Am Soc Nephrol. 2003;14(11):2851-60. 59. Perl J, Wald R, McFarlane P, et al. Hemodialysis vascular access modifies the association between dialysis modality and survival. J Am Soc Nephrol. 2011;22(6):1113-21. 60. Quinn RR, Hux JE, Oliver MJ, et al. Selection bias explains apparent differential mortality between dialysis modalities. J Am Soc Nephrol. 2011;22(8):1534-42. 61. Kumar VA, Sidell MA, Jones JP, et al. Survival of propensity matched incident peritoneal and hemodialysis patients in a United States health care system. Kidney Int. 2014;86(5):1016-22. 62. Marshall MR, Walker RC, Polkinghorne KR, et al. Survival on home dialysis in New Zealand. PLoS One. 2014;9(5):e96847. 63. Tennankore K, Nadeau-Fredette AC, Chan CT. Intensified home hemodialysis: clinical benefits, risks and target populations. Nephrol Dial Transplant. 2014. 64. Culleton BF, Walsh M, Klarenbach SW, et al. Effect of frequent nocturnal hemodialysis vs conventional hemodialysis on left ventricular mass and quality of life: a randomized controlled trial. JAMA. 2007;298(11):1291-9. 65. Rocco MV, Lockridge RS, Jr., Beck GJ, et al. The effects of frequent nocturnal home hemodialysis: the Frequent Hemodialysis Network Nocturnal Trial. Kidney Int. 2011;80(10):1080-91. 66. Van Eps CL, Jeffries JK, Johnson DW, et al. Quality of life and alternate nightly nocturnal home hemodialysis. Hemodial Int. 2010;14(1):29-38. 67. Vos PF, Zilch O, Jennekens-Schinkel A, et al. Effect of short daily home haemodialysis on quality of life, cognitive functioning and the electroencephalogram. Nephrol Dial Transplant. 2006;21(9):2529-35. 68. Heidenheim AP, Muirhead N, Moist L, et al. Patient quality of life on quotidian hemodialysis. Am J Kidney Dis. 2003;42(1 Suppl):36-41. 69. Jaber BL, Lee Y, Collins AJ, et al. Effect of daily hemodialysis on depressive symptoms and postdialysis recovery time: interim report from the FREEDOM (Following Rehabilitation, Economics and Everyday-Dialysis Outcome Measurements) Study. Am J Kidney Dis. 2010;56(3):531-9. 70. Jaber BL, Schiller B, Burkart JM, et al. Impact of short daily hemodialysis on restless legs symptoms and sleep disturbances. Clin J Am Soc Nephrol. 2011;6(5):1049-56.
71. Hanly PJ, Pierratos A. Improvement of sleep apnea in patients with chronic renal failure who undergo nocturnal hemodialysis. N Engl J Med. 2001;344(2):102-7. 72. Chan CT, Floras JS, Miller JA, et al. Regression of left ventricular hypertrophy after conversion to nocturnal hemodialysis. Kidney Int. 2002;61(6):2235-9. 73. Lockridge RS, Jr., Spencer M, Craft V, et al. Nightly home hemodialysis: five and one-half years of experience in Lynchburg, Virginia. Hemodial Int. 2004;8(1):61-9. 74. Nesrallah G, Suri R, Moist L, et al. Volume control and blood pressure management in patients undergoing quotidian hemodialysis. Am J Kidney Dis. 2003;42(1 Suppl):13-7. 75. Kraus M, Burkart J, Hegeman R, et al. A comparison of center-based vs. home-based daily hemodialysis for patients with end-stage renal disease. Hemodial Int. 2007;11(4):468-77. 76. McGregor DO, Buttimore AL, Lynn KL, et al. A Comparative Study of Blood Pressure Control with Short In-Center versus Long Home Hemodialysis. Blood Purif. 2001;19(3):293-300. 77. Chan CT, Harvey PJ, Picton P, et al. Short-term blood pressure, noradrenergic, and vascular effects of nocturnal home hemodialysis. Hypertension. 2003;42(5):925-31. 78. Fagugli RM, Reboldi G, Quintaliani G, et al. Short daily hemodialysis: blood pressure control and left ventricular mass reduction in hypertensive hemodialysis patients. Am J Kidney Dis. 2001;38(2):371-6. 79. Susantitaphong P, Koulouridis I, Balk EM, et al. Effect of frequent or extended hemodialysis on cardiovascular parameters: a meta-analysis. Am J Kidney Dis. 2012;59(5):689-99. 80. Chan CT, Greene T, Chertow GM, et al. Effects of frequent hemodialysis on ventricular volumes and left ventricular remodeling. Clin J Am Soc Nephrol. 2013;8(12):2106-16. 81. Chan CT, Chertow GM, Daugirdas JT, et al. Effects of daily hemodialysis on heart rate variability: results from the Frequent Hemodialysis Network (FHN) Daily Trial. Nephrol Dial Transplant. 2014;29(1):168-78. 82. Daugirdas JT, Chertow GM, Larive B, et al. Effects of frequent hemodialysis on measures of CKD mineral and bone disorder. J Am Soc Nephrol. 2012;23(4):727-38. 83. Nadeau-Fredette AC, Hladunewich M, Hui D, et al. End-Stage Renal Disease and Pregnancy. Advances in Chronic Kidney Disease. 2013;20(3):246-52. 84. Asamiya Y, Otsubo S, Matsuda Y, et al. The importance of low blood urea nitrogen levels in pregnant patients undergoing hemodialysis to optimize birth weight and gestational age. Kidney Int. 2009;75(11):1217-22. 85. Okundaye I, Abrinko P, Hou S. Registry of pregnancy in dialysis patients. Am J Kidney Dis. 1998;31(5):766-73. 86. Hladunewich MA, Hou S, Odutayo A, et al. Intensive hemodialysis associates with improved pregnancy outcomes: a Canadian and United States cohort comparison. J Am Soc Nephrol. 2014;25(5):1103-9. 87. Walker R, Marshall MR, Morton RL, et al. The cost-effectiveness of contemporary home haemodialysis modalities compared with facility haemodialysis: A systematic review of full economic evaluations. Nephrology (Carlton). 2014;19(8):459-70. 88. Kroeker A, Clark WF, Heidenheim AP, et al. An operating cost comparison between conventional and home quotidian hemodialysis. Am J Kidney Dis. 2003;42(1 Suppl):49-55. 89. McFarlane PA, Pierratos A, Redelmeier DA. Cost savings of home nocturnal versus conventional in-center hemodialysis. Kidney Int. 2002;62(6):2216-22.

90. Jun M, Jardine MJ, Gray N, et al. Outcomes of extended-hours hemodialysis performed predominantly at home. Am J Kidney Dis. 2013;61(2):247-53. 91. Pauly RP, Maximova K, Coppens J, et al. Patient and technique survival among a Canadian multicenter nocturnal home hemodialysis cohort. Clin J Am Soc Nephrol. 2010;5(10):1815-20. 92. Nesrallah GE, Lindsay RM, Cuerden MS, et al. Intensive hemodialysis associates with improved survival compared with conventional hemodialysis. J Am Soc Nephrol. 2012;23(4):696-705. 93. Johansen KL, Zhang R, Huang Y, et al. Survival and hospitalization among patients using nocturnal and short daily compared to conventional hemodialysis: a USRDS study. Kidney Int. 2009;76(9):984-90. 94. Lockridge RS, Kjellstrand CM. Nightly home hemodialysis: outcome and factors associated with survival. Hemodial Int. 2011;15(2):211-8. 95. Blagg CR, Kjellstrand CM, Ting GO, et al. Comparison of survival between short-daily hemodialysis and conventional hemodialysis using the standardized mortality ratio. Hemodial Int. 2006;10(4):371-4. 96. Weinhandl ED, Liu J, Gilbertson DT, et al. Survival in daily home hemodialysis and matched thrice-weekly in-center hemodialysis patients. J Am Soc Nephrol. 2012;23(5):895-904. 97. Sergeyeva O, Gorodetskaya I, Ramos R, et al. Challenges to enrollment and randomization of the Frequent Hemodialysis Network (FHN) Daily Trial. J Nephrol. 2012;25(3):302-9. 98. Nitsch D, Steenkamp R, Tomson CR, et al. Outcomes in patients on home haemodialysis in England and Wales, 1997-2005: a comparative cohort analysis. Nephrol Dial Transplant. 2011;26(5):1670-7. 99. Weinhandl ED, Nieman KM, Gilbertson DT, et al. Hospitalization in daily home hemodialysis and matched thrice-weekly in-center hemodialysis patients. Am J Kidney Dis. 2015;65(1):98-108. 100. Nesrallah GE, Li L, Suri RS. Comparative effectiveness of home dialysis therapies: a matched cohort study. Can J Kidney Health Dis. 2016;3:19. 101. Mendelssohn DC, Pierratos A. Reformulating the integrated care concept for the new millennium. Perit Dial Int. 2002;22(1):5-8. 102. Van Biesen W, Vanholder RC, Veys N, et al. An evaluation of an integrative care approach for end-stage renal disease patients. J Am Soc Nephrol. 2000;11(1):116-25. 103. Wong JH, Pierratos A, Oreopoulos DG, et al. The use of nocturnal home hemodialysis as salvage therapy for patients experiencing peritoneal dialysis failure. Perit Dial Int. 2007;27(6):669-74. 104. Suzuki H, Hoshi H, Inoue T, et al. New modality of dialysis therapy: peritoneal dialysis first and transition to home hemodialysis. Adv Perit Dial. 2012;28:106-11. 105. Cina DP, Dacouris N, Kashani M, et al. Use of home hemodialysis after peritoneal dialysis technique failure. Perit Dial Int. 2013;33(1):96-9. 106. Nadeau-Fredette AC, Bargman JM, Chan CT. Clinical Outcome of Home Hemodialysis in Patients with Previous Peritoneal Dialysis Exposure: Evaluation of the Integrated Home Dialysis Model. Perit Dial Int. 2014. 107. McDonald SP. Australia and New Zealand Dialysis and Transplant Registry. Kidney Int Suppl (2011). 2015;5(1):39-44.

108. Badve SV, Hawley CM, McDonald SP, et al. Automated and continuous ambulatory peritoneal dialysis have similar outcomes. Kidney Int. 2008;73(4):480-8. 109. Johnson DW, Cho Y, Livingston BE, et al. Encapsulating peritoneal sclerosis: incidence, predictors, and outcomes. Kidney Int. 2010;77(10):904-12. 110. Kaplan EL, Meier P. Nonparametric Estimation from Incomplete Observations. Journa of the American Statistical Association. 1958;53(282):457-81. 111. Cox D. Regression Models and Life-Tables. Journal of the Royal Statistical Society Series B (Methodological). 1972;34(1):187-220. 112. Fine J, Gray R. A propotional hazards model for the subdistribution of a competing risk. Journal ot the American Statistical Association. 1999;94:496-509. 113. Beuscart JB, Pagniez D, Boulanger E, et al. Overestimation of the probability of death on peritoneal dialysis by the Kaplan-Meier method: advantages of a competing risks approach. BMC Nephrol. 2012;13:31. 114. Kleinbaum DG, Klein M. Survival Analysis, a Self-Learning Text, Third Edition. USA: Springer; 2012. 700 p. 115. Rioux JP, Bargman JM, Chan CT. Systematic differences among patients initiated on home haemodialysis and peritoneal dialysis: the fallacy of potential competition. Nephrol Dial Transplant. 2010;25(7):2364-7. 116. Mickey RM, Greenland S. The impact of confounder selection criteria on effect estimation. Am J Epidemiol. 1989;129(1):125-37. 117. Austin PC. A Tutorial and Case Study in Propensity Score Analysis: An Application to Estimating the Effect of In-Hospital Smoking Cessation Counseling on Mortality. Multivariate Behav Res. 2011;46(1):119-51. 118. Leuven E, Sianesi B. PSMATCH2: Stata module to perform full Mahalanobis and propensity score matching, common support graphing, and coraviate imbalance testing (2003). version 4.0.11; 2014. 119. Shariff SZ, Cuerden MS, Jain AK, et al. The secret of immortal time bias in epidemiologic studies. J Am Soc Nephrol. 2008;19(5):841-3. 120. Kleinbaum DG, Klein M. Logistic Regression, A Self-Learning Text, Third Edition. USA: Springer; 2010. 121. Cho Y, Badve SV, Hawley CM, et al. Peritoneal dialysis outcomes after temporary haemodialysis transfer for peritonitis. Nephrol Dial Transplant. 2014;29(10):1940-7. 122. Rivara MB, Mehrotra R. The changing landscape of home dialysis in the United States. Curr Opin Nephrol Hypertens. 2014. 123. Ghaffari A, Kalantar-Zadeh K, Lee J, et al. PD First: peritoneal dialysis as the default transition to dialysis therapy. Semin Dial. 2013;26(6):706-13. 124. Ludlow MJ, George CR, Hawley CM, et al. How Australian nephrologists view home dialysis: results of a national survey. Nephrology (Carlton). 2011;16(4):446-52. 125. Osterlund K, Mendelssohn D, Clase C, et al. Identification of facilitators and barriers to home dialysis selection by canadian adults with ESRD. Semin Dial. 2014;27(2):160-72. 126. Finkelstein FO, Schiller B, Daoui R, et al. At-home short daily hemodialysis improves the long-term health-related quality of life. Kidney Int. 2012;82(5):561-9. 127. Johnson D, Brown F, Lammi H, et al. The CARI guidelines. Dialysis adequacy (PD) guidelines. Nephrology (Carlton). 2005;10 Suppl 4:S81-107. 128. Kerr P, Perkovic V, Petrie J, et al. The CARI guidelines. Dialysis adequacy (HD) guidelines. Nephrology (Carlton). 2005;10 Suppl 4:S61-80.

129. Levey AS, Bosch JP, Lewis JB, et al. A more accurate method to estimate glomerular filtration rate from serum creatinine: a new prediction equation. Modification of Diet in Renal Disease Study Group. Ann Intern Med. 1999;130(6):461-70. 130. Mathew TH, Johnson DW, Jones GR, et al. Chronic kidney disease and automatic reporting of estimated glomerular filtration rate: revised recommendations. Med J Aust. 2007;187(8):459-63. 131. Mickey R, Greenland S. The impact of confounder selection creteria on effect estimation. American Journal of Epidemiology. 1989;129(1):125-37. 132. Rosenbaum P, Rubin D. The central role of the propensity score in observational studies for causal effects. Biometrika. 1983;70(1):41-55. 133. Suri RS, Li L, Nesrallah GE. The risk of hospitalization and modality failure with home dialysis. Kidney Int. 2015. 134. Walsh M, Manns BJ, Klarenbach S, et al. The effects of nocturnal compared with conventional hemodialysis on mineral metabolism: A randomized-controlled trial. Hemodial Int. 2010;14(2):174-81. 135. Chen YC, Lin CJ, Wu CJ, et al. Comparison of extracellular volume and blood pressure in hemodialysis and peritoneal dialysis patients. Nephron Clin Pract. 2009;113(2):c112-6. 136. Ferreira-Filho SR, Machado GR, Ferreira VC, et al. Back to basics: pitting edema and the optimization of hypertension treatment in incident peritoneal dialysis patients (BRAZPD). PLoS One. 2012;7(5):e36758. 137. Papakrivopoulou E, Booth J, Pinney J, et al. Comparison of volume status in asymptomatic haemodialysis and peritoneal dialysis outpatients. Nephron Extra. 2012;2(1):48-54. 138. Van Biesen W, Williams JD, Covic AC, et al. Fluid status in peritoneal dialysis patients: the European Body Composition Monitoring (EuroBCM) study cohort. PLoS One. 2011;6(2):e17148. 139. Eknoyan G, Beck GJ, Cheung AK, et al. Effect of dialysis dose and membrane flux in maintenance hemodialysis. N Engl J Med. 2002;347(25):2010-9. 140. Group FHNT, Chertow GM, Levin NW, et al. In-center hemodialysis six times per week versus three times per week. N Engl J Med. 2010;363(24):2287-300. 141. Mendelssohn DC, Curtis B, Yeates K, et al. Suboptimal initiation of dialysis with and without early referral to a nephrologist. Nephrol Dial Transplant. 2011;26(9):2959-65. 142. Nadeau-Fredette AC, Tennankore KK, Kim SJ, et al. Suboptimal initiation of home hemodialysis: determinants and clinical outcomes. Nephron Clin Pract. 2013;124(1-2):132-40. 143. Goldstein M, Yassa T, Dacouris N, et al. Multidisciplinary predialysis care and morbidity and mortality of patients on dialysis. Am J Kidney Dis. 2004;44(4):706-14. 144. Tong A, Palmer S, Manns B, et al. Clinician beliefs and attitudes about home haemodialysis: a multinational interview study. BMJ Open. 2012;2(6). 145. Van Biesen W, van der Veer SN, Murphey M, et al. Patients' perceptions of information and education for renal replacement therapy: an independent survey by the European kidney patients' Federation on information and support on renal replacement therapy. PLoS One. 2014;9(7):e103914.

146. Castledine CI, Gilg JA, Rogers C, et al. Renal centre characteristics and physician practice patterns associated with home dialysis use. Nephrol Dial Transplant. 2013;28(8):2169-80. 147. Delgado-Rodriguez M, Llorca J. Bias. J Epidemiol Community Health. 2004;58(8):635-41. 148. Lan PG, Johnson DW, McDonald SP, et al. The association between peritoneal dialysis modality and peritonitis. Clin J Am Soc Nephrol. 2014;9(6):1091-7. 149. Rabindranath KS, Adams J, Ali TZ, et al. Continuous ambulatory peritoneal dialysis versus automated peritoneal dialysis for end-stage renal disease. Cochrane Database Syst Rev. 2007 (2):CD006515. 150. Tentori F, Zhang J, Li Y, et al. Longer dialysis session length is associated with better intermediate outcomes and survival among patients on in-center three times per week hemodialysis: results from the Dialysis Outcomes and Practice Patterns Study (DOPPS). Nephrol Dial Transplant. 2012;27(11):4180-8. 151. Coles GA, Williams JD. What is the place of peritoneal dialysis in the integrated treatment of renal failure? Kidney Int. 1998;54(6):2234-40. 152. Lameire N, Van Biesen W, Vanholder R. The role of peritoneal dialysis as first modality in an integrative approach to patients with end-stage renal disease. Perit Dial Int. 2000;20 Suppl 2:S134-41. 153. Davies SJ, Van Biesen W, Nicholas J, et al. Integrated care. Perit Dial Int. 2001;21 Suppl 3:S269-74. 154. Chui BK, Manns B, Pannu N, et al. Health care costs of peritoneal dialysis technique failure and dialysis modality switching. Am J Kidney Dis. 2013;61(1):104-11. 155. Chaudhary K, Sangha H, Khanna R. Peritoneal dialysis first: rationale. Clin J Am Soc Nephrol. 2011;6(2):447-56. 156. Jansen MA, Hart AA, Korevaar JC, et al. Predictors of the rate of decline of residual renal function in incident dialysis patients. Kidney Int. 2002;62(3):1046-53. 157. Koch M, Kohnle M, Trapp R, et al. Comparable outcome of acute unplanned peritoneal dialysis and haemodialysis. Nephrol Dial Transplant. 2012;27(1):375-80. 158. Lukowsky LR, Mehrotra R, Kheifets L, et al. Comparing mortality of peritoneal and hemodialysis patients in the first 2 years of dialysis therapy: a marginal structural model analysis. Clin J Am Soc Nephrol. 2013;8(4):619-28. 159. Heaf JG, Wehberg S. Relative survival of peritoneal dialysis and haemodialysis patients: effect of cohort and mode of dialysis initiation. PLoS One. 2014;9(3):e90119. 160. Boissinot L, Landru I, Cardineau E, et al. Is transition between peritoneal dialysis and hemodialysis really a gradual process? Perit Dial Int. 2013;33(4):391-7. 161. McFadden D. Quantitative Methods for Analyzing Travel Behaviour of Individuals: Some Recent Developments. Behavioural Travel Modelling. London: Croom Helm; 1978. p. 279-318. 162. Cafazzo JA, Leonard K, Easty AC, et al. Patient-perceived barriers to the adoption of nocturnal home hemodialysis. Clin J Am Soc Nephrol. 2009;4(4):784-9. 163. Pulliam J, Li NC, Maddux F, et al. First-year outcomes of incident peritoneal dialysis patients in the United States. Am J Kidney Dis. 2014;64(5):761-9. 164. Perl J, Wald R, Bargman JM, et al. Changes in patient and technique survival over time among incident peritoneal dialysis patients in Canada. Clin J Am Soc Nephrol. 2012;7(7):1145-54.

165. Jaar BG, Plantinga LC, Crews DC, et al. Timing, causes, predictors and prognosis of switching from peritoneal dialysis to hemodialysis: a prospective study. BMC Nephrol. 2009;10:3. 166. Shen JI, Mitani AA, Saxena AB, et al. Determinants of peritoneal dialysis technique failure in incident US patients. Perit Dial Int. 2013;33(2):155-66. 167. Tennankore KK, Kim SJ, Baer HJ, et al. Survival and hospitalization for intensive home hemodialysis compared with kidney transplantation. J Am Soc Nephrol. 2014;25(9):2113-20. 168. Daugirdas JT, Greene T, Rocco MV, et al. Effect of frequent hemodialysis on residual kidney function. Kidney Int. 2013;83(5):949-58. 169. Suri RS, Larive B, Sherer S, et al. Risk of vascular access complications with frequent hemodialysis. J Am Soc Nephrol. 2013;24(3):498-505. 170. Lan PG, Clayton PA, Saunders J, et al. Predictors and Outcomes of Transfers from Peritoneal Dialysis to Hemodialysis. Perit Dial Int. 2014. 171. Brimble KS, Walker M, Margetts PJ, et al. Meta-analysis: peritoneal membrane transport, mortality, and technique failure in peritoneal dialysis. J Am Soc Nephrol. 2006;17(9):2591-8. 172. Chidambaram M, Bargman JM, Quinn RR, et al. Patient and physician predictors of peritoneal dialysis technique failure: a population based, retrospective cohort study. Perit Dial Int. 2011;31(5):565-73. 173. Jansen MA, Termorshuizen F, Korevaar JC, et al. Predictors of survival in anuric peritoneal dialysis patients. Kidney Int. 2005;68(3):1199-205. 174. Rumpsfeld M, McDonald SP, Johnson DW. Higher peritoneal transport status is associated with higher mortality and technique failure in the Australian and New Zealand peritoneal dialysis patient populations. J Am Soc Nephrol. 2006;17(1):271-8. 175. Jager KJ, Merkus MP, Dekker FW, et al. Mortality and technique failure in patients starting chronic peritoneal dialysis: results of The Netherlands Cooperative Study on the Adequacy of Dialysis. NECOSAD Study Group. Kidney Int. 1999;55(4):1476-85. 176. Pajek J, Hutchison AJ, Bhutani S, et al. Outcomes of peritoneal dialysis patients and switching to hemodialysis: a competing risks analysis. Perit Dial Int. 2014;34(3):289-98. 177. Nesrallah G, Mendelssohn DC. Modality options for renal replacement therapy: the integrated care concept revisited. Hemodial Int. 2006;10(2):143-51. 178. Wong B, Zimmerman D, Reintjes F, et al. Procedure-related serious adverse events among home hemodialysis patients: a quality assurance perspective. Am J Kidney Dis. 2014;63(2):251-8. 179. Schachter ME, Tennankore KK, Chan CT. Determinants of training and technique failure in home hemodialysis. Hemodial Int. 2013;17(3):421-6. 180. Allon M, Ornt DB, Schwab SJ, et al. Factors associated with the prevalence of arteriovenous fistulas in hemodialysis patients in the HEMO study. Hemodialysis (HEMO) Study Group. Kidney Int. 2000;58(5):2178-85. 181. Ethier J, Mendelssohn DC, Elder SJ, et al. Vascular access use and outcomes: an international perspective from the Dialysis Outcomes and Practice Patterns Study. Nephrol Dial Transplant. 2008;23(10):3219-26. 182. Pounds LL, Teodorescu VJ. Chronic kidney disease and dialysis access in women. J Vasc Surg. 2013;57(4 Suppl):49S-53S e1.

183. Belasco AG, Sesso R. Burden and quality of life of caregivers for hemodialysis patients. Am J Kidney Dis. 2002;39(4):805-12. 184. Wise M, Schatell D, Klicko K, et al. Successful daily home hemodialysis patient-care partner dyads: benefits outweigh burdens. Hemodial Int. 2010;14(3):278-88. 185. Lim WH, Johnson DW, McDonald SP. Higher rate and earlier peritonitis in Aboriginal patients compared to non-Aboriginal patients with end-stage renal failure maintained on peritoneal dialysis in Australia: analysis of ANZDATA. Nephrology (Carlton). 2005;10(2):192-7. 186. McDonald SP, Collins JF, Rumpsfeld M, et al. Obesity is a risk factor for peritonitis in the Australian and New Zealand peritoneal dialysis patient populations. Perit Dial Int. 2004;24(4):340-6. 187. Prasad N, Sinha A, Gupta A, et al. Effect of body mass index on outcomes of peritoneal dialysis patients in India. Perit Dial Int. 2014;34(4):399-408. 188. Batt J, Linton K, Bennett PN. Home hemodialysis: a successful option for obese and bariatric people with end-stage kidney disease. Hemodial Int. 2012;16 Suppl 1:S26-31. 189. Liu IT, Wu JS, Yang YC, et al. Mild chronic kidney disease associated with greater risk of arterial stiffness in elderly adults. J Am Geriatr Soc. 2013;61(10):1758-62. 190. Foley RN, Chen SC, Solid CA, et al. Early mortality in patients starting dialysis appears to go unregistered. Kidney Int. 2014;86(2):392-8. 191. Robinson BM, Zhang J, Morgenstern H, et al. Worldwide, mortality risk is high soon after initiation of hemodialysis. Kidney Int. 2014;85(1):158-65.