
CRANEX® D / PDF Brochure - Soredex
16
Challenges and solutions for robust microRNA profiling in biofluids Thorarinn Blondal, Søren Jensby Nielsen, Ditte Andreasen, Niels Tolstrup, Maria Wrang Teilum, Adam Baker and Peter Mouritzen
Transcript of CRANEX® D / PDF Brochure - Soredex

Challenges and solutions for robust microRNA profiling in biofluidsThorarinn Blondal, Søren Jensby Nielsen, Ditte Andreasen, Niels Tolstrup, Maria Wrang Teilum, Adam Baker and Peter Mouritzen

Components of a blood sample. Nucleic acids present in differ-ent blood fractions from a 10 ml blood sample.
10 mL blood sample
Plasma• ~5.5 mL• 1-50 ng RNA• <100 ng DNA ( in disease)
Red Blood Cells• ~4.5 mL• ‘low’ RNA• ‘0’ DNA
Buffy coat• <0.1 mL• 10-100 µg RNA• 200-600 µg DNA
Challenge: Plasma contains small amounts of RNA
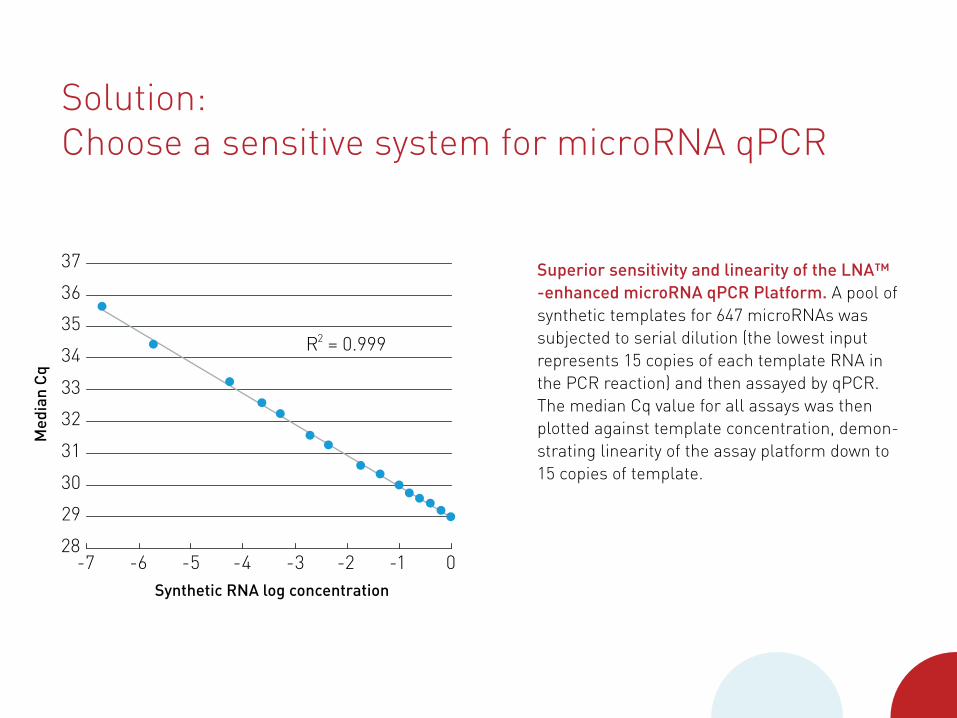
Superior sensitivity and linearity of the LNA™ -enhanced microRNA qPCR Platform. A pool of synthetic templates for 647 microRNAs was subjected to serial dilution (the lowest input represents 15 copies of each template RNA in the PCR reaction) and then assayed by qPCR. The median Cq value for all assays was then plotted against template concentration, demon-strating linearity of the assay platform down to 15 copies of template.
Solution:Choose a sensitive system for microRNA qPCR
Med
ian
Cq
28
30
29
31
32
33
34
35
36
37
-6-7 -5 -4 -3 -2 -1 0Synthetic RNA log concentration
Sensitivity and linearity of Exiqons qPCR system
R = 0.9992
All -MedianLinear (All - Median)

Solution:Use carrier RNA to improve plasma purification
29
31
33
35
37
39
Mea
n C
q
miR-192 let-7a miR-103
Plasma I, no carrier
Plasma II, no carrier
Plasma I, with carrier
Plasma II, with carrier
Addition of carrier RNA improves microRNA purification. Plasma (200 µl) from two individuals was purified in the absence or presence of car-rier RNA (MS2 phage RNA) and assayed by qPCR for the presence of three microRNAs. Error bars: standard deviation between 3 extraction replicates. Note the increased detection and decreased variability in samples purified with carrier RNA.
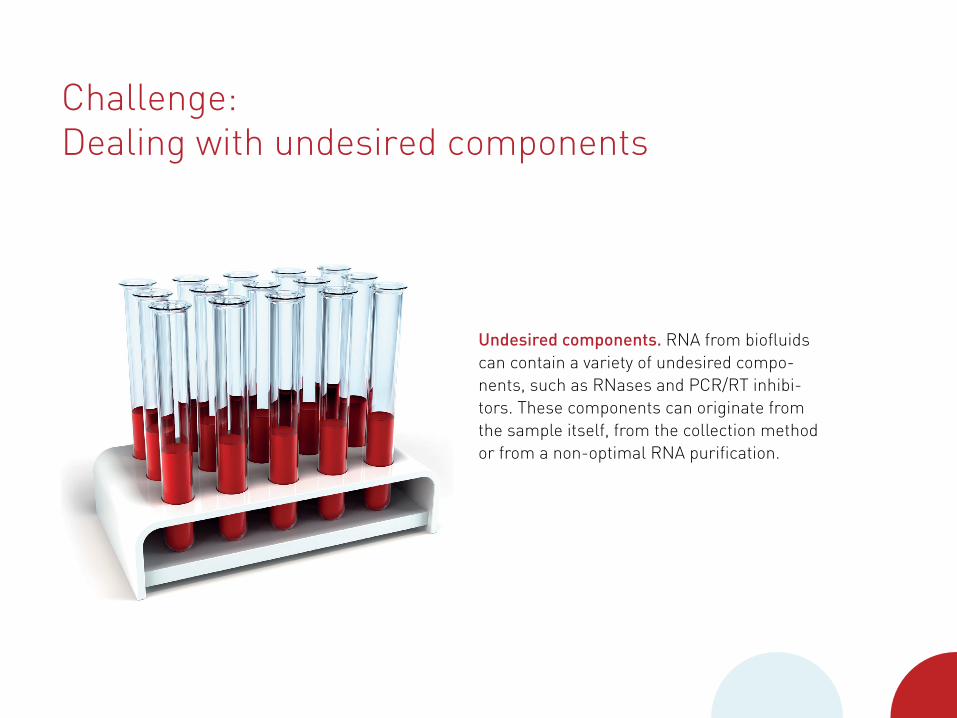
Undesired components. RNA from biofluids can contain a variety of undesired compo-nents, such as RNases and PCR/RT inhibi-tors. These components can originate from the sample itself, from the collection method or from a non-optimal RNA purification.
Challenge: Dealing with undesired components

Solution: Avoid heparin blood collection tubes
25
30
35
40
45
Expr
essi
on (C
q)
miR-103 miR-21
PlasmaEDTA
PlasmaCitrate
PlasmaHeparin
PlasmaEDTA
PlasmaCitrate
PlasmaHeparin
•
Patient 1
•
Patient 2
Blood collection tubes and subse-quent effect on microRNA qPCR. Blood was collected from two different patients in various types of collection tubes. Plasma prepared using EDTA or Citrate as anti-coagulant works well, while hepa-rin as anti-coagulant greatly inhib-its RT and PCR reactions.

Determine RNA yields using RNA spike-ins. MicroRNA QC PCR Panels offer a convenient way of determining RNA yields. In this exam-ple, a plasma sample was purified 5 times using three different RNA isolation methods. Exiqon’s RNA spike-ins were added to the lysis buffers of the isolation kits according to the RNA Spike-in kit instruction manual. RNA isolation B gives the highest yield as seen from the lower Cq values. Overall PCR effi-ciency is similar between the methods as determined by the similar UniSp3 results. The high Cq value of UniSp6 from isolation A could indicate the presence of a PCR inhibitor in this sample.
40
35
30
25
20
15
Raw
Cq
valu
es
UniSp2 UniSp4 UniSp5 UniSp6 UniSp3IPC
Solution: Use RNA spike-ins for RNA QC
RNA isolation kit ARNA isolation kit BRNA isolation kit C

Challenge:Cellular contamination
5mm
Cellular contamination. For analysis of cell free biofluid samples, cellular contamination must be avoided. For serum and plasma samples, cellular contamination (e.g. red and white blood cells, circulating tumor cells etc) can occur during sample handling.

Solution: Use a reference range for microRNA expression in serum and plasma
Use a reference range of microRNA expression to identify cellular contamination. Mean Cq values for 119 human miRNAs based on 381 high quality serum/plasma samples (dark gray). Raw Cq values from a repre-sentative high quality plasma sample is shown in blue and raw Cq values from a compromised plasma sample (with cellular contamination) is shown in red. The compromised sample has lower Cq values for a majority of microRNAs.
High qualityserum sample Compromisedserum sample
Mean signal
119 microRNAs
Cq
valu
es
40
35
30
25
20
15
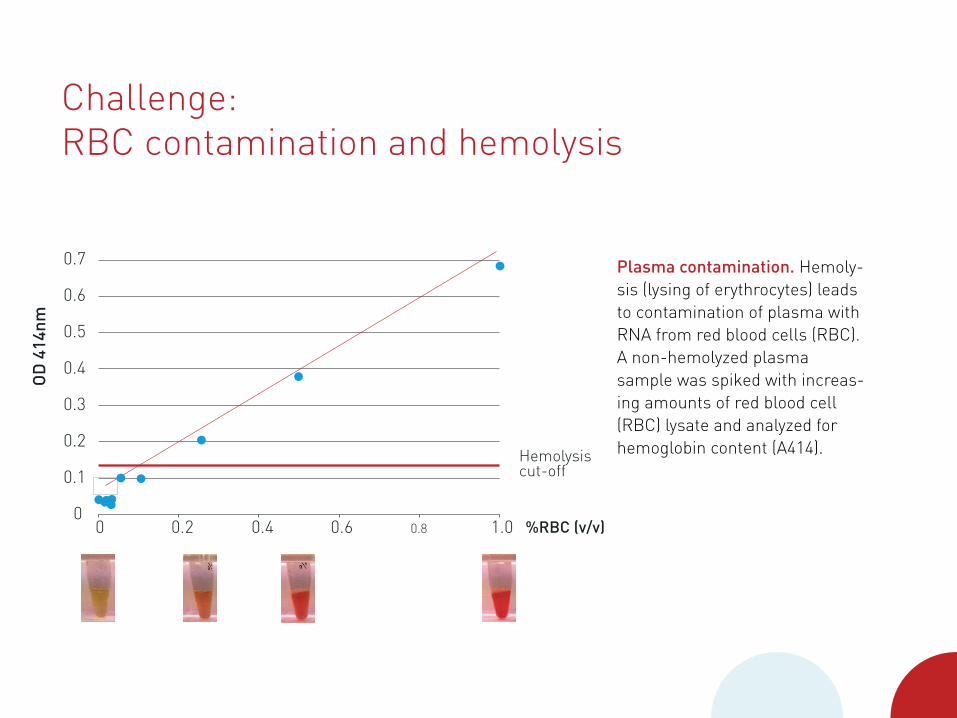
Plasma contamination. Hemoly-sis (lysing of erythrocytes) leads to contamination of plasma with RNA from red blood cells (RBC). A non-hemolyzed plasma sample was spiked with increas-ing amounts of red blood cell (RBC) lysate and analyzed for hemoglobin content (A414).
Challenge: RBC contamination and hemolysis
0.7
0.6
0.5
0.4
0.3
0.2
0.1
0
OD
414
nm
%RBC (v/v)0 0.2 0.4 0.6 0.8 1.0
Hemolysiscut-off

Solution:microRNAs can be used as a hemolysis indicator
S1 Serum
S2 Plasma
S3 Serum (hemolyzed)
S4 Plasma (hemolyzed) Abs
orba
nce
(A)
λ (nm)
3
2
1
220 340 400 460 5202800
Sample Cq values dCq (miR-23a - miR-451)miR-23a miR-451
S1 Serum 29.05 24.15 4.90S2 Serum 28.65 24.53 4.13S3 Serum 30.05 21.55 8.50S4 Plasma 29.56 21.93 7.64
A microRNA-based hemolysis indicator for RNA and archival data. Left: Absorbance spectrum of non-hemolyzed and hemolyzed serum and plasma samples. Hemolyzed samples show a peak at 414nm. Right: If original serum or plasma samples are no longer avialable, ΔCq between miR-23a and miR-451 can be used as an indicator of hemolysis in serum or plasma samples. If the ΔCq is lower than 5 the indication is no hemolysis. If the ΔCq is close to or higher than 7 there is an increased risk of hemolysis.
NanoDrop measurements
qPCR measurements

Profiling examples: Similarities between serum & plasma microRNAs
40
35
30
25
20
151 4 7 10 13 16 19 22 25 28 31 34 37 40 43 46 49 52 55 58 61 64 67 70 73 76 79 82 85 88 91 94 97 10
0
Cq
valu
es
103 microRNAs
PlasmaSerum

Profiling examples: microRNA detected in urine cell pellet & cell free urine following medical treatment
Cell pellet urineCell free urine
40
35
30
25
20
151 7 13 19 25 31 37 43 49 55 61 67 73 79 85 91 97 10
310
911
512
112
713
313
914
515
115
716
316
917
518
118
719
3
Cq
valu
es
197 microRNAs

Profiling examples: A number of microRNA can be detected in Cerebrospinal fluids (CSF)
CSF
40
35
30
25
20
151 4 7 10 13 16 19 22 25 28 31 34 37 40 43 46 49 52 55 58 61 64 67 70 73 76 79 82 85 88 91 94 97 10
0
Cq
valu
es
103 microRNAs

Summary: Challenges and solutions for microRNA profiling in biofluids
Limited amounts of RNA
Cellular contaminationand hemolysis
Undesired components,especially PCR inhibitors
• Use highly sensitive detection method• Use carrier RNA and optimized RNA isolation protocol• Monitor isolation efficiency (using RNA spike-ins)
• Avoid heparin tubes, use column based isolation method• Monitor RNases & inhibitors by using RNA spike-ins for QC
• Ensure consistent and optimal sampling method• Compare data to Reference Range• Hemolysis QC
Challenge Solution

NOTICE TO PURCHASER: DISCLAIMER OF LICENSE No license is conveyed with the purchase of this product under any of US Patents Nos. 5,804,375, 5,994,056, 6,171,785, 5,538,848, 5,723,591, 5,876,930, 6,030,787, and 6,258,569, and corresponding patents outside the United States, or any other patents or patent applications, relating to the 5' Nuclease and dsDNA-Binding Dye Pro-cesses. For further information contact the Director of Licensing, Applied Biosystems, 850 Lin-coln Centre Drive, Foster City, California 94404, USA.