Cancer imaging phenomics toolkit: quantitative …Cancer imaging phenomics toolkit: quantitative...
21
Cancer imaging phenomics toolkit: quantitative imaging analytics for precision diagnostics and predictive modeling of clinical outcome Christos Davatzikos, a, * Saima Rathore, a Spyridon Bakas, a Sarthak Pati, a Mark Bergman, a Ratheesh Kalarot, a Patmaa Sridharan, a Aimilia Gastounioti, a Nariman Jahani, a Eric Cohen, a Hamed Akbari, a Birkan Tunc, a Jimit Doshi, a Drew Parker, a Michael Hsieh, a Aristeidis Sotiras, a Hongming Li, a Yangming Ou, b Robert K. Doot, a Michel Bilello, a Yong Fan, a Russell T. Shinohara, a,c Paul Yushkevich, a Ragini Verma, a and Despina Kontos a a Center for Biomedical Image Computing and Analytics (CBICA), Philadelphia, Pennsylvania, United States b Massachusetts General Hospital, Martinos Center for Biomedical Imaging, Boston, Massachusetts, United States c University of Pennsylvania, Perelman School of Medicine, Center for Clinical Epidemiology and Biostatistics (CCEB), Department of Biostatistics, Epidemiology, and Informatics, Philadelphia, Pennsylvania, United States Abstract. The growth of multiparametric imaging protocols has paved the way for quantitative imaging pheno- types that predict treatment response and clinical outcome, reflect underlying cancer molecular characteristics and spatiotemporal heterogeneity, and can guide personalized treatment planning. This growth has underlined the need for efficient quantitative analytics to derive high-dimensional imaging signatures of diagnostic and pre- dictive value in this emerging era of integrated precision diagnostics. This paper presents cancer imaging phe- nomics toolkit (CaPTk), a new and dynamically growing software platform for analysis of radiographic images of cancer, currently focusing on brain, breast, and lung cancer. CaPTk leverages the value of quantitative imaging analytics along with machine learning to derive phenotypic imaging signatures, based on two-level functionality. First, image analysis algorithms are used to extract comprehensive panels of diverse and complementary fea- tures, such as multiparametric intensity histogram distributions, texture, shape, kinetics, connectomics, and spa- tial patterns. At the second level, these quantitative imaging signatures are fed into multivariate machine learning models to produce diagnostic, prognostic, and predictive biomarkers. Results from clinical studies in three areas are shown: (i) computational neuro-oncology of brain gliomas for precision diagnostics, prediction of outcome, and treatment planning; (ii) prediction of treatment response for breast and lung cancer, and (iii) risk assessment for breast cancer. © 2018 Society of Photo-Optical Instrumentation Engineers (SPIE) [DOI: 10.1117/1.JMI.5.1.011018] Keywords: cancer imaging phenomics; radiomics; radiogenomics; precision diagnostics; treatment response; open source software. Paper 17196SSRR received Jun. 30, 2017; accepted for publication Dec. 5, 2017; published online Jan. 11, 2018. 1 Introduction Modern medical images are complex, often derived from differ- ent and complementary acquisition protocols or modalities, and can elucidate multifaceted phenotypic aspects of cancer. Traditional measurements (e.g., tumor diameter and volume) capture only a small fraction of such multifaceted and hetero- geneous phenotypes, and therefore, limit evaluation to basic fea- tures of a tumor and its progression during treatment. Extensive literature over the past decade has shown that diverse and com- plementary multiparametric imaging features, beyond the tradi- tional visually observable measurements, such as volumetric, textural, morphologic, kinetic, connectomics, spatial patterns, and intensity histograms (i.e., radiomic features), may result in comprehensive phenotypic imaging signatures that can offer additional diagnostic, prognostic, and predictive value for many types of cancer. 1 This emerging field, which we will herein refer to as quantitative imaging phenomics (QIP), consistently shows that phenotypic imaging signatures of various cancers relate to underlying molecular characteristics, treatment response, and patient survival, with the potential to augment conventional prognostic and predictive assays. 2 Although such QIP signatures and their use are progressively reported throughout scientific literature, 1 they have yet to be adopted in clinical studies and practice. The increasingly com- plex nature of computational imaging algorithms and the chal- lenge of accessing clinical datasets for training and validating these algorithms limit the availability of QIP signatures for both clinical researchers and practitioners. The current paper describes an evolving effort in the development of the cancer imaging phenomics toolkit (CaPTk), an imaging analytics suite of open-source software algorithms, designed to derive extensive panels of QIP features and integrate them into non- invasive diagnostic and predictive models, as well as systems supporting optimized personalized cancer treatment planning. Appendix B presents a detailed overview of the features cur- rently supported by CaPTk. Quantitative cancer imaging phenomics, and hence the CaPTk software, builds upon work often referred to as radio- mics and radiogenomics, which use various textural and shape features to build a comprehensive representation of the tumor. Additional features used in CaPTk, such as spatial pat- terns obtained after atlas registration, shapes of histograms in various subregions, and peritumoral heterogeneity indices, are *Address all correspondence to: Christos Davatzikos, E-mail: christos@rad. upenn.edu 2329-4302/2018/$25.00 © 2018 SPIE Journal of Medical Imaging 011018-1 Jan–Mar 2018 • Vol. 5(1) Journal of Medical Imaging 5(1), 011018 (Jan–Mar 2018) Downloaded From: https://www.spiedigitallibrary.org/journals/Journal-of-Medical-Imaging on 2/24/2018 Terms of Use: https://www.spiedigitallibrary.org/terms-of-use
Transcript of Cancer imaging phenomics toolkit: quantitative …Cancer imaging phenomics toolkit: quantitative...
Cancer imaging phenomics toolkit: quantitativeimaging analytics for precision diagnostics andpredictive modeling of clinical outcome
Christos Davatzikos,a,* Saima Rathore,a Spyridon Bakas,a Sarthak Pati,a Mark Bergman,a Ratheesh Kalarot,aPatmaa Sridharan,a Aimilia Gastounioti,a Nariman Jahani,a Eric Cohen,a Hamed Akbari,a Birkan Tunc,aJimit Doshi,a Drew Parker,a Michael Hsieh,a Aristeidis Sotiras,a Hongming Li,a Yangming Ou,b Robert K. Doot,aMichel Bilello,a Yong Fan,a Russell T. Shinohara,a,c Paul Yushkevich,a Ragini Verma,a and Despina Kontosa
aCenter for Biomedical Image Computing and Analytics (CBICA), Philadelphia, Pennsylvania, United StatesbMassachusetts General Hospital, Martinos Center for Biomedical Imaging, Boston, Massachusetts, United StatescUniversity of Pennsylvania, Perelman School of Medicine, Center for Clinical Epidemiology and Biostatistics (CCEB), Department of Biostatistics,Epidemiology, and Informatics, Philadelphia, Pennsylvania, United States
Abstract. The growth of multiparametric imaging protocols has paved the way for quantitative imaging pheno-types that predict treatment response and clinical outcome, reflect underlying cancer molecular characteristicsand spatiotemporal heterogeneity, and can guide personalized treatment planning. This growth has underlinedthe need for efficient quantitative analytics to derive high-dimensional imaging signatures of diagnostic and pre-dictive value in this emerging era of integrated precision diagnostics. This paper presents cancer imaging phe-nomics toolkit (CaPTk), a new and dynamically growing software platform for analysis of radiographic images ofcancer, currently focusing on brain, breast, and lung cancer. CaPTk leverages the value of quantitative imaginganalytics along with machine learning to derive phenotypic imaging signatures, based on two-level functionality.First, image analysis algorithms are used to extract comprehensive panels of diverse and complementary fea-tures, such as multiparametric intensity histogram distributions, texture, shape, kinetics, connectomics, and spa-tial patterns. At the second level, these quantitative imaging signatures are fed into multivariate machine learningmodels to produce diagnostic, prognostic, and predictive biomarkers. Results from clinical studies in three areasare shown: (i) computational neuro-oncology of brain gliomas for precision diagnostics, prediction of outcome,and treatment planning; (ii) prediction of treatment response for breast and lung cancer, and (iii) risk assessmentfor breast cancer. © 2018 Society of Photo-Optical Instrumentation Engineers (SPIE) [DOI: 10.1117/1.JMI.5.1.011018]
Keywords: cancer imaging phenomics; radiomics; radiogenomics; precision diagnostics; treatment response; open source software.
Paper 17196SSRR received Jun. 30, 2017; accepted for publication Dec. 5, 2017; published online Jan. 11, 2018.
1 IntroductionModern medical images are complex, often derived from differ-ent and complementary acquisition protocols or modalities, andcan elucidate multifaceted phenotypic aspects of cancer.Traditional measurements (e.g., tumor diameter and volume)capture only a small fraction of such multifaceted and hetero-geneous phenotypes, and therefore, limit evaluation to basic fea-tures of a tumor and its progression during treatment. Extensiveliterature over the past decade has shown that diverse and com-plementary multiparametric imaging features, beyond the tradi-tional visually observable measurements, such as volumetric,textural, morphologic, kinetic, connectomics, spatial patterns,and intensity histograms (i.e., radiomic features), may result incomprehensive phenotypic imaging signatures that can offeradditional diagnostic, prognostic, and predictive value for manytypes of cancer.1 This emerging field, which we will herein referto as quantitative imaging phenomics (QIP), consistently showsthat phenotypic imaging signatures of various cancers relate tounderlying molecular characteristics, treatment response, andpatient survival, with the potential to augment conventionalprognostic and predictive assays.2
Although such QIP signatures and their use are progressivelyreported throughout scientific literature,1 they have yet to beadopted in clinical studies and practice. The increasingly com-plex nature of computational imaging algorithms and the chal-lenge of accessing clinical datasets for training and validatingthese algorithms limit the availability of QIP signatures forboth clinical researchers and practitioners. The current paperdescribes an evolving effort in the development of the cancerimaging phenomics toolkit (CaPTk), an imaging analyticssuite of open-source software algorithms, designed to deriveextensive panels of QIP features and integrate them into non-invasive diagnostic and predictive models, as well as systemssupporting optimized personalized cancer treatment planning.Appendix B presents a detailed overview of the features cur-rently supported by CaPTk.
Quantitative cancer imaging phenomics, and hence theCaPTk software, builds upon work often referred to as radio-mics and radiogenomics, which use various textural andshape features to build a comprehensive representation of thetumor. Additional features used in CaPTk, such as spatial pat-terns obtained after atlas registration, shapes of histograms invarious subregions, and peritumoral heterogeneity indices, are
*Address all correspondence to: Christos Davatzikos, E-mail: [email protected] 2329-4302/2018/$25.00 © 2018 SPIE
Journal of Medical Imaging 011018-1 Jan–Mar 2018 • Vol. 5(1)
Journal of Medical Imaging 5(1), 011018 (Jan–Mar 2018)
Downloaded From: https://www.spiedigitallibrary.org/journals/Journal-of-Medical-Imaging on 2/24/2018 Terms of Use: https://www.spiedigitallibrary.org/terms-of-use
also shown to offer highly informative feature sets, especiallywhen properly integrated via machine learning tools.3,4 Inthis paper, we present results from brain, breast, and lung cancerstudies that underline the value of CaPTk imaging signatures asprecision diagnostic and predictive tools.
2 Methods and Software
2.1 Overview
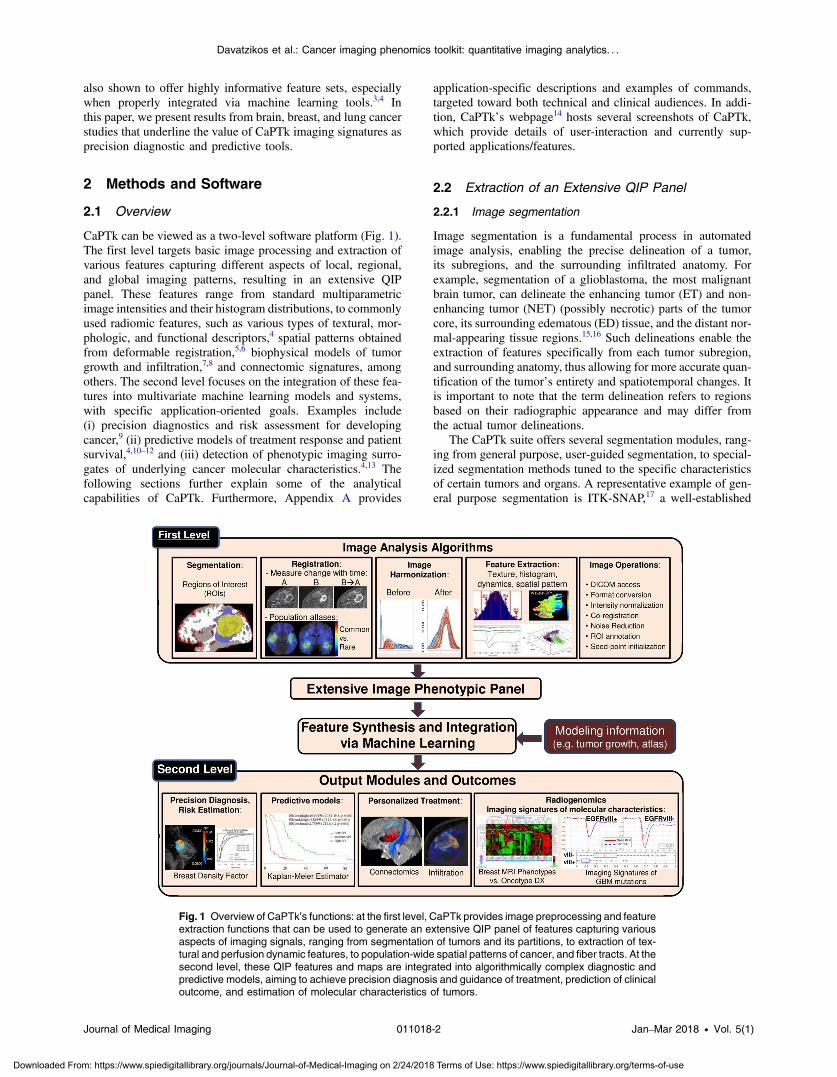
CaPTk can be viewed as a two-level software platform (Fig. 1).The first level targets basic image processing and extraction ofvarious features capturing different aspects of local, regional,and global imaging patterns, resulting in an extensive QIPpanel. These features range from standard multiparametricimage intensities and their histogram distributions, to commonlyused radiomic features, such as various types of textural, mor-phologic, and functional descriptors,4 spatial patterns obtainedfrom deformable registration,5,6 biophysical models of tumorgrowth and infiltration,7,8 and connectomic signatures, amongothers. The second level focuses on the integration of these fea-tures into multivariate machine learning models and systems,with specific application-oriented goals. Examples include(i) precision diagnostics and risk assessment for developingcancer,9 (ii) predictive models of treatment response and patientsurvival,4,10–12 and (iii) detection of phenotypic imaging surro-gates of underlying cancer molecular characteristics.4,13 Thefollowing sections further explain some of the analyticalcapabilities of CaPTk. Furthermore, Appendix A provides
application-specific descriptions and examples of commands,targeted toward both technical and clinical audiences. In addi-tion, CaPTk’s webpage14 hosts several screenshots of CaPTk,which provide details of user-interaction and currently sup-ported applications/features.
2.2 Extraction of an Extensive QIP Panel
2.2.1 Image segmentation
Image segmentation is a fundamental process in automatedimage analysis, enabling the precise delineation of a tumor,its subregions, and the surrounding infiltrated anatomy. Forexample, segmentation of a glioblastoma, the most malignantbrain tumor, can delineate the enhancing tumor (ET) and non-enhancing tumor (NET) (possibly necrotic) parts of the tumorcore, its surrounding edematous (ED) tissue, and the distant nor-mal-appearing tissue regions.15,16 Such delineations enable theextraction of features specifically from each tumor subregion,and surrounding anatomy, thus allowing for more accurate quan-tification of the tumor’s entirety and spatiotemporal changes. Itis important to note that the term delineation refers to regionsbased on their radiographic appearance and may differ fromthe actual tumor delineations.
The CaPTk suite offers several segmentation modules, rang-ing from general purpose, user-guided segmentation, to special-ized segmentation methods tuned to the specific characteristicsof certain tumors and organs. A representative example of gen-eral purpose segmentation is ITK-SNAP,17 a well-established
Fig. 1 Overview of CaPTk’s functions: at the first level, CaPTk provides image preprocessing and featureextraction functions that can be used to generate an extensive QIP panel of features capturing variousaspects of imaging signals, ranging from segmentation of tumors and its partitions, to extraction of tex-tural and perfusion dynamic features, to population-wide spatial patterns of cancer, and fiber tracts. At thesecond level, these QIP features and maps are integrated into algorithmically complex diagnostic andpredictive models, aiming to achieve precision diagnosis and guidance of treatment, prediction of clinicaloutcome, and estimation of molecular characteristics of tumors.
Journal of Medical Imaging 011018-2 Jan–Mar 2018 • Vol. 5(1)
Davatzikos et al.: Cancer imaging phenomics toolkit: quantitative imaging analytics. . .
Downloaded From: https://www.spiedigitallibrary.org/journals/Journal-of-Medical-Imaging on 2/24/2018 Terms of Use: https://www.spiedigitallibrary.org/terms-of-use
interactive tool, which has been integrated into the main inter-face of CaPTk. ITK-SNAP is based on random forest classifiers,trained using a manual definition of tissues of interest, to pro-duce an initial segmentation subsequently refined using level-sets. GLISTRboost,15,16,18,19 available through the web-basedimage processing portal20 of the Center for BiomedicalImage Computing and Analytics (CBICA), leverages CaPTkas a user-friendly means of initialization. GLISTRboost per-forms multimodal brain glioma segmentation and atlas registra-tion, which describes a semiautomatic hybrid generative-discriminative method. The generative part is based on anexpectation–maximization framework to segment brain scansinto tumor (i.e., edema, enhancing and nonenhancing tumor),as well as “healthy” tissue labels (i.e., white and gray matter,cerebrospinal fluid, vessels, and cerebellum), and incorporatesthe modeling of tumor growth and infiltration via reaction–dif-fusion–advection equations.7,8 The discriminative part is basedon a gradient boosting21,22 multiclass classification scheme, torefine tumor labels based on information from multiple patients.Last, a Bayesian strategy23 is employed to further refine andfinalize the tumor segmentation labels, based on patient-specificintensity statistics from the multiple modalities available.GLISTRboost provides estimates of the segmentation labels,parameters of underlying tumor growth models, as well asthe tumor anatomical location in a standardized anatomical sys-tem via deformable atlas registration.6 In addition to providesegmentation labels, such application-specialized segmentationapproaches allow evaluation of cancer spatial patterns in stand-ardized coordinate systems, which is receiving increasing atten-tion as predictors of clinical outcome, as well as biomarkers ofmolecular characteristics of the underlying tumor.24 Future workwill result in tighter integration between the CaPTk desktop cli-ent and IPP web server.
2.2.2 Imaging features
Analytic functions in CaPTk are based on an extensive QIPpanel of features (Fig. 1), which are integrated into imaging sig-natures, using analytics and machine learning to produce a vari-ety of diagnostic, prognostic, and predictive biomarkers.Although features can be common across many diagnosticand predictive tasks, the way in which they are integratedinto a specific imaging signature depends entirely on the taskof interest, such as predicting response to treatment13 or estimat-ing underlying mutations.10,12,25 Examples of QIP featuresimplemented in CaPTk include: (i) multiparametric imaging sig-nals of different coregistered protocols/modalities, such asnative T1- and T2-weighted images, T1 with gadolinium(T1-Gd), T2-fluid attenuated inversion recovery (T2-FLAIR),diffusion tensor imaging (DTI), dynamic susceptibility contrast(DSC), or dynamic contrast-enhanced (DCE) MRI; (ii) texturalfeatures [e.g., co-occurrence, run-length, size-zone matrices,local binary patterns (LBPs), fractal dimensions, wavelets], cap-turing characteristics of the local microarchitecture of tissue.Such features have been used extensively in mammographicimage analysis and breast cancer risk assessment,9 as well asin predictive modeling of glioblastoma;3,4,26 (iii) histograms,reflecting various imaging signal distributions within differentdelineated tumor subregions. The shapes of these histogramsexpress anatomical and functional changes caused by thetumor that result in signal changes and have demonstrated a con-nection to clinical endpoints, such as survival, risk factors, andunderlying cancer molecular characteristics;4 (iv) temporal
perfusion dynamics captured via principal component analysis(PCA), which have been related to recurrence and infiltration, aswell as molecular tumor characteristics;3,10,11,25,26 (v) DTI-derived features, including fractional anisotropy (FA), radial dif-fusivity (RAD), axial diffusivity (AX), apparent diffusion coef-ficient (ADC), water-free diffusion, fiber tract connectivity andother properties; (vi) DSC-MRI derived features: peak height(PH), percent signal recovery (PSR), and relative cerebralblood volume (rCBV); (vii) spatial patterns of cancer distribu-tion:24 although previously relatively unappreciated, such spatialpatterns that capture the spatial distribution and pattern of atumor’s entirety (i.e., to which parts of the brain does thetumor extend), obtained via deformable registration to a stand-ardized atlas space, receive increasing attention due to their rela-tionship to prognosis and genotype.27 Connectomic signatures,later discussed in Secs. 3.3 and 5.3.2, will also be incorporatedin the immediate future.
An essential step in the aforementioned segmentation andfeature extraction processes is image normalization and harmo-nization. In particular, image characteristics vary, often consid-erably, across different scanners, acquisition protocols, clinicalcenters, as well as patients. This renders the extraction ofreproducible imaging features and signatures challenging.Appropriate histogram normalization is therefore particularlyimportant. Toward this end, CaPTk provides the WhiteStripeapproach28 (Appendix A, Table 7), which normalizes conven-tional MRI by detecting a latent subdistribution of normal tissueand linearly scaling the histogram of images. In addition, histo-gram matching techniques available through the insight toolkit(ITK)29 are also provided.
2.2.3 Image registration
Coregistration of different imaging sequences, i.e., alignment ofdifferent anatomical regions, is very important in order to ana-lyze in tandem voxel-by-voxel features, coming from the inten-sity signals of aligned imaging sequences. For example,building QIP features for analysis of brain tumors often requiresthe coregistration of conventional MRI scans, such as T1-weighted and T2-FLAIR but also various diffusion- and perfu-sion-based images. In addition to rigid registration (or fusion) ofmultichannel images, deformable registration is also importantin cancer imaging and is used in two contexts: (i) the evaluationof temporal changes between longitudinal scans, as the tumor,its surrounding anatomy, and patient positioning may havechanged between consecutive scans, and hence, appropriateregistration can augment therapy response evaluation and pre-diction of survival and (ii) formation of population-based atlasesof the spatial distribution and pattern of cancer, in order to evalu-ate the relationship between such distributions and molecularcharacteristics or clinical outcomes. CaPTk has access to a vari-ety of image similarity metrics offered through ITK. Moreover,specialized deformable registration methods optimized for spe-cific types of problems are available on CBICA’s IPP.20 Forexample, the deformable registration described in Ref. 30,which is based on DRAMMS,31,32 enables follow-up scans tobe superimposed onto baseline scans in order to evaluatetumor volume changes over time as a measure of response toneoadjuvant chemotherapy for breast cancer. DRAMMS isa separate, standalone package, which is compatible with CaPTkand has been tested along with the breast CaPTk modules asa means for finding breast MRI changes.
Journal of Medical Imaging 011018-3 Jan–Mar 2018 • Vol. 5(1)
Davatzikos et al.: Cancer imaging phenomics toolkit: quantitative imaging analytics. . .
Downloaded From: https://www.spiedigitallibrary.org/journals/Journal-of-Medical-Imaging on 2/24/2018 Terms of Use: https://www.spiedigitallibrary.org/terms-of-use
3 Feature Integration and ModelingAs described above (Fig. 1), CaPTk has a two-level organiza-tion, with the first level of complexity, offering various imageprocessing and analysis tools that lead to the formation of com-prehensive QIP feature sets. The second level functions aim atintegrating these features into decision support tools. A numberof models and indices are offered, based on our priorstudies.3,4,10,24,26,33–35 In Sec. 5, we present results obtained infour specific contexts, which are described below. ThroughCaPTk, a wide range of QIP features can be extracted directlyfrom any set of images, with user-defined parameters, and exter-nal clinical and genomic variables can be easily used for train-ing. These QIP features can form the basis for a CaPTk user todevelop their own decision support systems, by using the QIPalong with machine learning algorithms in different contexts, forexample, to predict clinical outcome or genomic variables ofinterest. CaPTk’s software architecture provides interfacesthat make it relatively straightforward to access the machinelearning module of OpenCV.
3.1 Precision Diagnostics and Risk Assessment
In parallel with developing precision diagnostics33,35,36 driven bygenomics, risk assessment of cancer has seen similar advancesin the recent past. CaPTk incorporates routines that characterizeproperties of the normal tissue, predisposed to a higher risk ofcancer. For example, the heterogeneity of the breast parenchy-mal patterns has shown to augment established risk factors,including breast density.37,38
3.2 Predictive Modeling
The ability to predict patient outcome, particularly after receiv-ing a specific treatment, is important for treatment planning,patient management, and enrollment of relatively homogeneouspatient subgroups into clinical trials to increase the detection oftreatment effects. CaPTk applies machine learning methods toits QIP panel to predict various outcome measures. Examplesinclude prediction of patient survival after glioblastoma treat-ment,4 patient response, and prediction of long-term survival
after breast cancer neoadjuvant chemotherapy,13 response tostereotactic body radiation therapy for lung cancer,39 and peri-tumoral infiltration and probability of cancer recurrence.3
3.3 Optimized Neurosurgical Planning
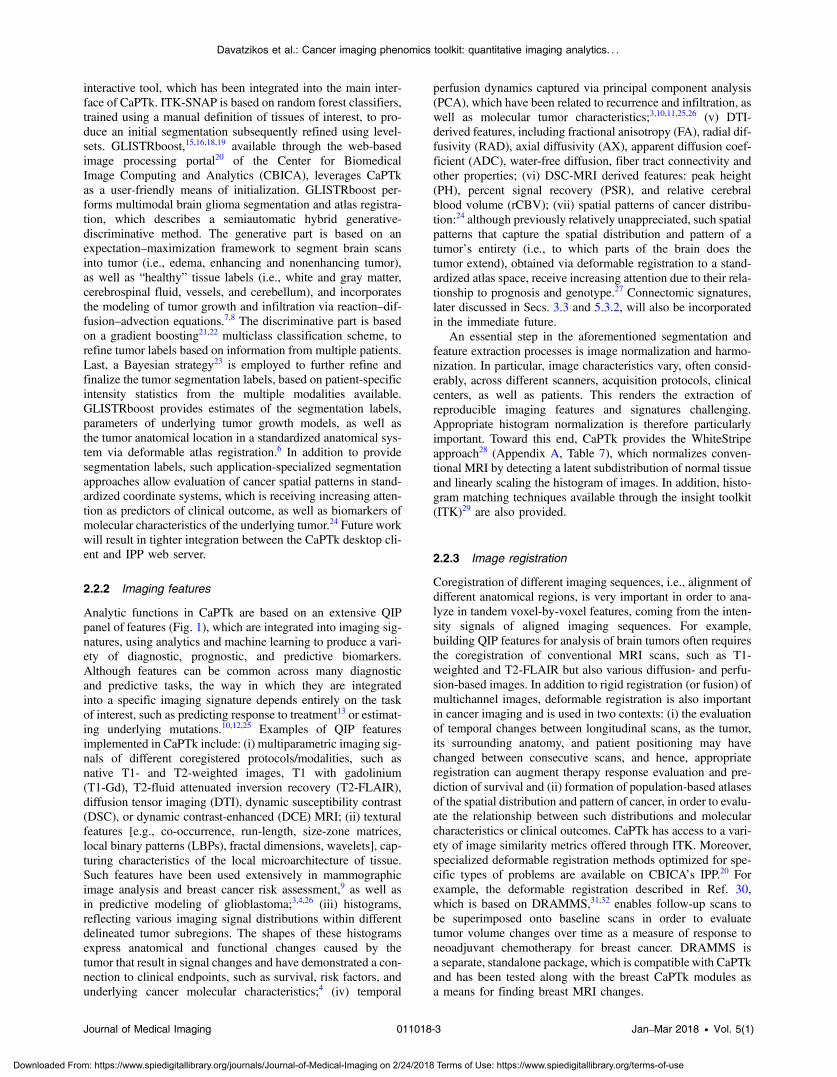
Knowing the tumor location and, more importantly, the peritu-moral infiltrated functional brain tissue, in relation to importantstructures and fiber tracts, is critical in neurosurgical planning.CaPTk offers algorithms for neurosurgeons and radiation oncol-ogists to plan extensive tumor resection and peritumoral radia-tion while preserving neurological function.40 This CaPTkfunctionality aims to allow clinicians to simultaneously evaluateperitumoral glioblastoma infiltration in edematous brain tissueand target functional brain tissue likely to present early recur-rence while considering the location of fiber tracts that should bepreserved as much as possible. To this end, CaPTk will providetools for edema invariant tractography41,42 and automated tractdetection based on connectivity signatures,40,43 to extract fibertracts, even distorted or broken, in the presence of mass effectand edema (Fig. 2). The edema invariant tractography41,42 isbased on the multicompartment modeling of diffusion data, thatfits a free-water compartment representative of the edema and acompartment representing the underlying tissue, fitted with atensor or a higher-order diffusion model, based on the acquis-ition. Having separated the edema compartment from the tissue,which is used for tracking, enables tracking through the edemaregions. Existing tracking algorithms that are not based on mul-ticompartment models are unable to track through edema. Thisis currently being validated in the clinic using direct electricalstimulation. Once the tracts are created, our connectivity-basedsignatures of tracts enable clustering of tracts that have been dis-torted by the tumor. These displaced/distorted tracts cannot bereadily captured by existing tract clustering algorithms that arebased on shape/geometric information.44–49 Thus, the edemainvariant tractography in combination with the connectivity-based clustering produces tracts that are robust in the presenceof edema and mass effect. These are expected to go beyond thecapabilities of existing planning tools, once they have been vali-dated in the clinic. Currently, connectomic-signature-based tractextraction is available, with the other diffusion-based surgical
Fig. 2 Various aspects of the diffusion based surgical planning tools: (a) tracking through edema madepossible with multicompartment modeling of diffusion data; (b) atlas-based reconstruction of tracts, resil-ient to mass effect induced tract distortions, and vulnerability map of the brain indicating the global effectof the resection and treatment; and (c) the surgical plan with the tumor and surrounding eloquent tract.
Journal of Medical Imaging 011018-4 Jan–Mar 2018 • Vol. 5(1)
Davatzikos et al.: Cancer imaging phenomics toolkit: quantitative imaging analytics. . .
Downloaded From: https://www.spiedigitallibrary.org/journals/Journal-of-Medical-Imaging on 2/24/2018 Terms of Use: https://www.spiedigitallibrary.org/terms-of-use
planning components being in the optimization phase. The sur-gical planning tool is proposed as a separate visualization envi-ronment within CaPTk that will combine the tumor, tractsaround it, the vulnerability and the recurrence maps. Relatedprocessing and analysis tools will be provided as a diffusiontoolkit, expanding upon CaPTk.
3.4 Radiogenomics
Following the rapid growth of radiogenomics, where imagingfeatures are correlated with genomic information, an expandingpart of CaPTk focuses on deriving imaging signatures of clin-ically relevant cancer molecular characteristics. Although con-ventional anatomical and physiological imaging does notspecifically label molecular targets, their presence can bederived indirectly through the application of machine learningmethods to the QIP features extracted from clinically acquiredimaging, as described above. Section 5 presents results from aradiogenomic signature of epidermal growth factor receptor(EGFR) mutations,10,12 which also captures overexpression ofwild-type EGFR,11 and an imaging signature of oncotype DXin breast cancer.25
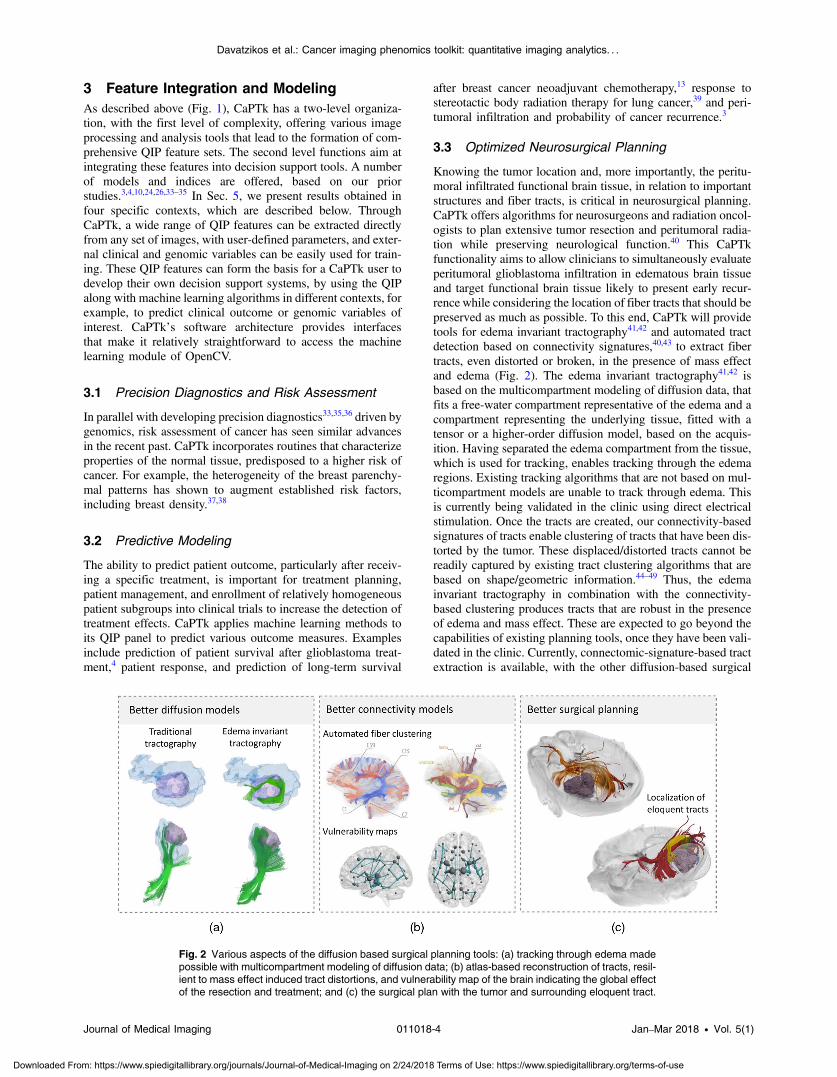
4 Software ArchitectureCaPTk employs widely used, community- and industry-drivenlibraries, including the ITK, visualization toolkit, and OpenCV,as the foundation for basic functions, such as data input/output,preprocessing tasks (registration, bias correction, etc.), render-ing and machine learning (Fig. 3), which make up many of thefirst-level image processing operations, as shown in Fig. 1. Theadvantage of using these broadly established libraries is that
they are large-scale projects with deep resources, extensive test-ing and validation, and highly optimized algorithms. Locallydeveloped libraries provide similar low-level functions thatare specific to CaPTk (Fig. 3). All foundation routines are acces-sible as C++ objects, making complex algorithms available tohigher-level CaPTk components and to software developedby external CaPTk users through well-defined, extensible inter-faces. The documented APIs allow applications written by exter-nal users of CaPTk to access algorithms at each level of thetoolkit through function calls and ITK image structures.
Internally, CaPTk uses both ITK and OpenCV data structuresas appropriate to the particular image processing operation,allowing any user to extend the CaPTk code by calling any algo-rithm implemented in either of these libraries. Since both ITKand OpenCV are based on high quality C++ code, any otherpackage developed using these tools can be tightly consolidatedwith CaPTk. This provides computational imaging researcherswith a fast track to integrate their complex algorithms into a full-featured graphical environment, without the need to duplicateroutine tasks, such as file I/O, image reorientation, etc.Another aspect of CaPTk’s architecture is the focus on modu-larity of the code. This ensures that CaPTk can be used as a verylightweight and efficient image viewer without the burden of thecomputationally expensive functions affecting the interactiveexperience.
All applications within the CaPTk graphical user interface(GUI) are exposed via command line wrappings, giving theoption to researchers to also construct automated, scripted,and customized pipelines based on the same algorithms, for sub-ject- or population-based studies. CaPTk is under active devel-opment, with frequent updates available to developers and
Fig. 3 An overview of the CaPTk software architecture. Command-line and GUI of CaPTk communicatewith individual applications for preprocessing, basic analysis, and decisions support outcomes via func-tion calls (black arrows). Applications may be tightly integrated in CaPTk, accessed as C++ objects via adocumented API, or applications may be external software, such as Confetti, launched via system calls.Integrated applications utilize low-level libraries, such as ITK or libraries developed specifically for CaPTkfor common tasks. Data are passed between libraries and returned to integrated applications in the formof ITK and OpenCV data structures (green arrow). Results are presented graphically through the GUI(light blue arrow) or saved to disk (red arrows). External applications return data directly to disk storage.The documented APIs allow applications written by external users of CaPTk to access algorithms at eachlevel of the toolkit through function calls and ITK image passing.
Journal of Medical Imaging 011018-5 Jan–Mar 2018 • Vol. 5(1)
Davatzikos et al.: Cancer imaging phenomics toolkit: quantitative imaging analytics. . .
Downloaded From: https://www.spiedigitallibrary.org/journals/Journal-of-Medical-Imaging on 2/24/2018 Terms of Use: https://www.spiedigitallibrary.org/terms-of-use
clinical collaborators. The current status of the package andlinks to stable public releases can be found at Ref. 14.
5 Results Obtained Using CaPTkIn this section, we present several representative results obtainedby using CaPTk, as described in Sec. 3, which highlight thevalue of QIP signatures for precision diagnostics, personalizedpredictions, and decision support for treatment planning.
5.1 Precision Diagnostics and Risk Assessment inBreast Cancer
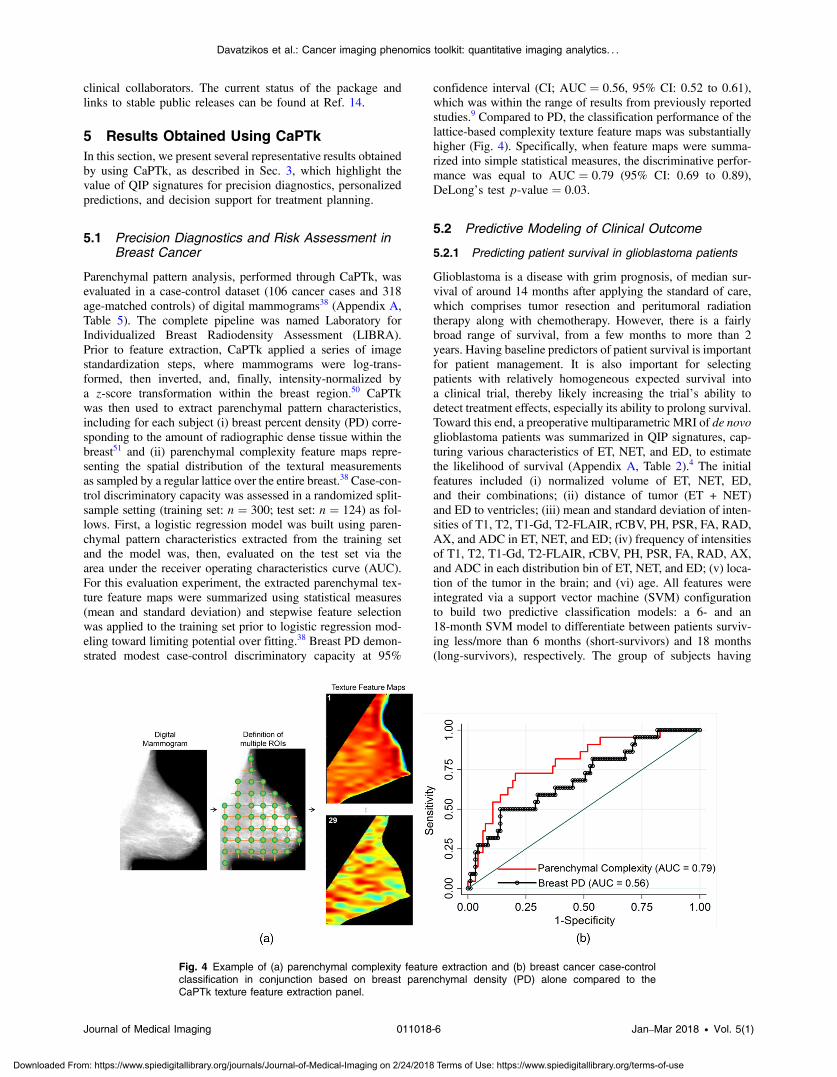
Parenchymal pattern analysis, performed through CaPTk, wasevaluated in a case-control dataset (106 cancer cases and 318age-matched controls) of digital mammograms38 (Appendix A,Table 5). The complete pipeline was named Laboratory forIndividualized Breast Radiodensity Assessment (LIBRA).Prior to feature extraction, CaPTk applied a series of imagestandardization steps, where mammograms were log-trans-formed, then inverted, and, finally, intensity-normalized bya z-score transformation within the breast region.50 CaPTkwas then used to extract parenchymal pattern characteristics,including for each subject (i) breast percent density (PD) corre-sponding to the amount of radiographic dense tissue within thebreast51 and (ii) parenchymal complexity feature maps repre-senting the spatial distribution of the textural measurementsas sampled by a regular lattice over the entire breast.38 Case-con-trol discriminatory capacity was assessed in a randomized split-sample setting (training set: n ¼ 300; test set: n ¼ 124) as fol-lows. First, a logistic regression model was built using paren-chymal pattern characteristics extracted from the training setand the model was, then, evaluated on the test set via thearea under the receiver operating characteristics curve (AUC).For this evaluation experiment, the extracted parenchymal tex-ture feature maps were summarized using statistical measures(mean and standard deviation) and stepwise feature selectionwas applied to the training set prior to logistic regression mod-eling toward limiting potential over fitting.38 Breast PD demon-strated modest case-control discriminatory capacity at 95%
confidence interval (CI; AUC ¼ 0.56, 95% CI: 0.52 to 0.61),which was within the range of results from previously reportedstudies.9 Compared to PD, the classification performance of thelattice-based complexity texture feature maps was substantiallyhigher (Fig. 4). Specifically, when feature maps were summa-rized into simple statistical measures, the discriminative perfor-mance was equal to AUC ¼ 0.79 (95% CI: 0.69 to 0.89),DeLong’s test p-value ¼ 0.03.
5.2 Predictive Modeling of Clinical Outcome
5.2.1 Predicting patient survival in glioblastoma patients
Glioblastoma is a disease with grim prognosis, of median sur-vival of around 14 months after applying the standard of care,which comprises tumor resection and peritumoral radiationtherapy along with chemotherapy. However, there is a fairlybroad range of survival, from a few months to more than 2years. Having baseline predictors of patient survival is importantfor patient management. It is also important for selectingpatients with relatively homogeneous expected survival intoa clinical trial, thereby likely increasing the trial’s ability todetect treatment effects, especially its ability to prolong survival.Toward this end, a preoperative multiparametric MRI of de novoglioblastoma patients was summarized in QIP signatures, cap-turing various characteristics of ET, NET, and ED, to estimatethe likelihood of survival (Appendix A, Table 2).4 The initialfeatures included (i) normalized volume of ET, NET, ED,and their combinations; (ii) distance of tumor (ET + NET)and ED to ventricles; (iii) mean and standard deviation of inten-sities of T1, T2, T1-Gd, T2-FLAIR, rCBV, PH, PSR, FA, RAD,AX, and ADC in ET, NET, and ED; (iv) frequency of intensitiesof T1, T2, T1-Gd, T2-FLAIR, rCBV, PH, PSR, FA, RAD, AX,and ADC in each distribution bin of ET, NET, and ED; (v) loca-tion of the tumor in the brain; and (vi) age. All features wereintegrated via a support vector machine (SVM) configurationto build two predictive classification models: a 6- and an18-month SVM model to differentiate between patients surviv-ing less/more than 6 months (short-survivors) and 18 months(long-survivors), respectively. The group of subjects having
Fig. 4 Example of (a) parenchymal complexity feature extraction and (b) breast cancer case-controlclassification in conjunction based on breast parenchymal density (PD) alone compared to theCaPTk texture feature extraction panel.
Journal of Medical Imaging 011018-6 Jan–Mar 2018 • Vol. 5(1)
Davatzikos et al.: Cancer imaging phenomics toolkit: quantitative imaging analytics. . .
Downloaded From: https://www.spiedigitallibrary.org/journals/Journal-of-Medical-Imaging on 2/24/2018 Terms of Use: https://www.spiedigitallibrary.org/terms-of-use
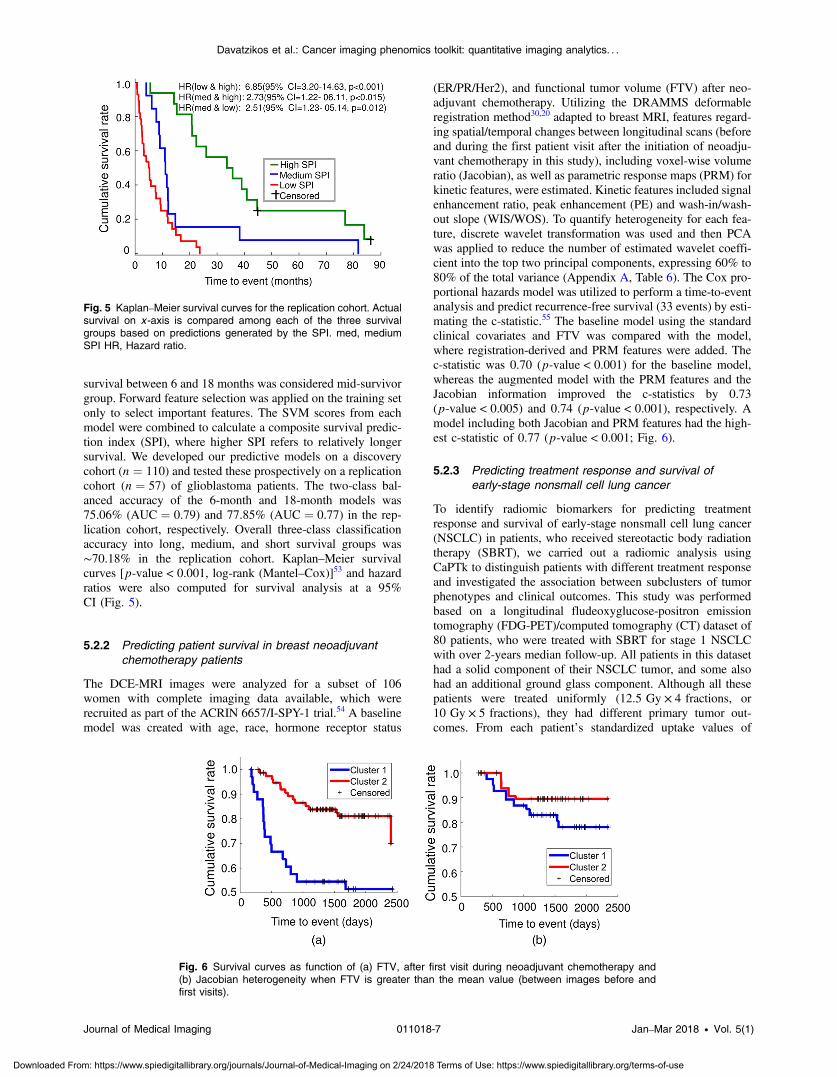
survival between 6 and 18 months was considered mid-survivorgroup. Forward feature selection was applied on the training setonly to select important features. The SVM scores from eachmodel were combined to calculate a composite survival predic-tion index (SPI), where higher SPI refers to relatively longersurvival. We developed our predictive models on a discoverycohort (n ¼ 110) and tested these prospectively on a replicationcohort (n ¼ 57) of glioblastoma patients. The two-class bal-anced accuracy of the 6-month and 18-month models was75.06% (AUC ¼ 0.79) and 77.85% (AUC ¼ 0.77) in the rep-lication cohort, respectively. Overall three-class classificationaccuracy into long, medium, and short survival groups was∼70.18% in the replication cohort. Kaplan–Meier survivalcurves [p-value < 0.001, log-rank (Mantel–Cox)]53 and hazardratios were also computed for survival analysis at a 95%CI (Fig. 5).
5.2.2 Predicting patient survival in breast neoadjuvantchemotherapy patients
The DCE-MRI images were analyzed for a subset of 106women with complete imaging data available, which wererecruited as part of the ACRIN 6657/I-SPY-1 trial.54 A baselinemodel was created with age, race, hormone receptor status
(ER/PR/Her2), and functional tumor volume (FTV) after neo-adjuvant chemotherapy. Utilizing the DRAMMS deformableregistration method30,20 adapted to breast MRI, features regard-ing spatial/temporal changes between longitudinal scans (beforeand during the first patient visit after the initiation of neoadju-vant chemotherapy in this study), including voxel-wise volumeratio (Jacobian), as well as parametric response maps (PRM) forkinetic features, were estimated. Kinetic features included signalenhancement ratio, peak enhancement (PE) and wash-in/wash-out slope (WIS/WOS). To quantify heterogeneity for each fea-ture, discrete wavelet transformation was used and then PCAwas applied to reduce the number of estimated wavelet coeffi-cient into the top two principal components, expressing 60% to80% of the total variance (Appendix A, Table 6). The Cox pro-portional hazards model was utilized to perform a time-to-eventanalysis and predict recurrence-free survival (33 events) by esti-mating the c-statistic.55 The baseline model using the standardclinical covariates and FTV was compared with the model,where registration-derived and PRM features were added. Thec-statistic was 0.70 (p-value < 0.001) for the baseline model,whereas the augmented model with the PRM features and theJacobian information improved the c-statistics by 0.73(p-value < 0.005) and 0.74 (p-value < 0.001), respectively. Amodel including both Jacobian and PRM features had the high-est c-statistic of 0.77 (p-value < 0.001; Fig. 6).
5.2.3 Predicting treatment response and survival ofearly-stage nonsmall cell lung cancer
To identify radiomic biomarkers for predicting treatmentresponse and survival of early-stage nonsmall cell lung cancer(NSCLC) in patients, who received stereotactic body radiationtherapy (SBRT), we carried out a radiomic analysis usingCaPTk to distinguish patients with different treatment responseand investigated the association between subclusters of tumorphenotypes and clinical outcomes. This study was performedbased on a longitudinal fludeoxyglucose-positron emissiontomography (FDG-PET)/computed tomography (CT) dataset of80 patients, who were treated with SBRT for stage 1 NSCLCwith over 2-years median follow-up. All patients in this datasethad a solid component of their NSCLC tumor, and some alsohad an additional ground glass component. Although all thesepatients were treated uniformly (12.5 Gy × 4 fractions, or10 Gy × 5 fractions), they had different primary tumor out-comes. From each patient’s standardized uptake values of
Fig. 5 Kaplan–Meier survival curves for the replication cohort. Actualsurvival on x -axis is compared among each of the three survivalgroups based on predictions generated by the SPI. med, mediumSPI HR, Hazard ratio.
Fig. 6 Survival curves as function of (a) FTV, after first visit during neoadjuvant chemotherapy and(b) Jacobian heterogeneity when FTV is greater than the mean value (between images before andfirst visits).
Journal of Medical Imaging 011018-7 Jan–Mar 2018 • Vol. 5(1)
Davatzikos et al.: Cancer imaging phenomics toolkit: quantitative imaging analytics. . .
Downloaded From: https://www.spiedigitallibrary.org/journals/Journal-of-Medical-Imaging on 2/24/2018 Terms of Use: https://www.spiedigitallibrary.org/terms-of-use
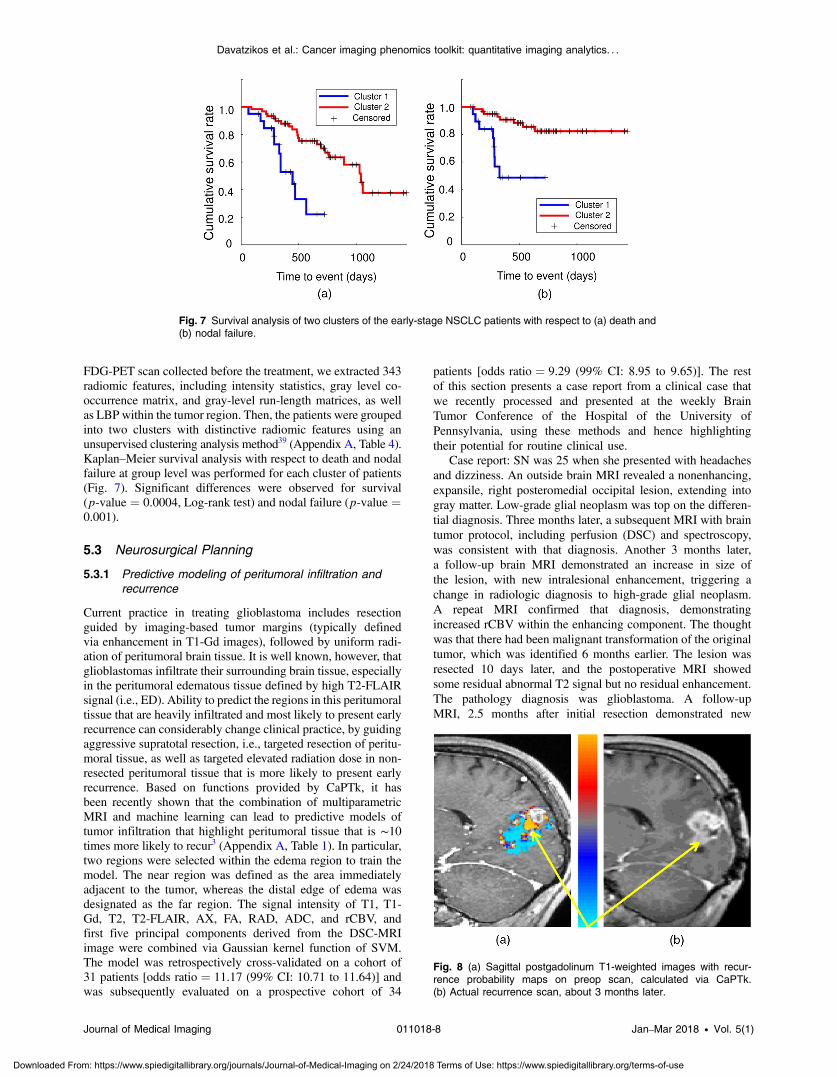
FDG-PET scan collected before the treatment, we extracted 343radiomic features, including intensity statistics, gray level co-occurrence matrix, and gray-level run-length matrices, as wellas LBP within the tumor region. Then, the patients were groupedinto two clusters with distinctive radiomic features using anunsupervised clustering analysis method39 (Appendix A, Table 4).Kaplan–Meier survival analysis with respect to death and nodalfailure at group level was performed for each cluster of patients(Fig. 7). Significant differences were observed for survival(p-value ¼ 0.0004, Log-rank test) and nodal failure (p-value ¼0.001).
5.3 Neurosurgical Planning
5.3.1 Predictive modeling of peritumoral infiltration andrecurrence
Current practice in treating glioblastoma includes resectionguided by imaging-based tumor margins (typically definedvia enhancement in T1-Gd images), followed by uniform radi-ation of peritumoral brain tissue. It is well known, however, thatglioblastomas infiltrate their surrounding brain tissue, especiallyin the peritumoral edematous tissue defined by high T2-FLAIRsignal (i.e., ED). Ability to predict the regions in this peritumoraltissue that are heavily infiltrated and most likely to present earlyrecurrence can considerably change clinical practice, by guidingaggressive supratotal resection, i.e., targeted resection of peritu-moral tissue, as well as targeted elevated radiation dose in non-resected peritumoral tissue that is more likely to present earlyrecurrence. Based on functions provided by CaPTk, it hasbeen recently shown that the combination of multiparametricMRI and machine learning can lead to predictive models oftumor infiltration that highlight peritumoral tissue that is ∼10times more likely to recur3 (Appendix A, Table 1). In particular,two regions were selected within the edema region to train themodel. The near region was defined as the area immediatelyadjacent to the tumor, whereas the distal edge of edema wasdesignated as the far region. The signal intensity of T1, T1-Gd, T2, T2-FLAIR, AX, FA, RAD, ADC, and rCBV, andfirst five principal components derived from the DSC-MRIimage were combined via Gaussian kernel function of SVM.The model was retrospectively cross-validated on a cohort of31 patients [odds ratio ¼ 11.17 (99% CI: 10.71 to 11.64)] andwas subsequently evaluated on a prospective cohort of 34
patients [odds ratio ¼ 9.29 (99% CI: 8.95 to 9.65)]. The restof this section presents a case report from a clinical case thatwe recently processed and presented at the weekly BrainTumor Conference of the Hospital of the University ofPennsylvania, using these methods and hence highlightingtheir potential for routine clinical use.
Case report: SN was 25 when she presented with headachesand dizziness. An outside brain MRI revealed a nonenhancing,expansile, right posteromedial occipital lesion, extending intogray matter. Low-grade glial neoplasm was top on the differen-tial diagnosis. Three months later, a subsequent MRI with braintumor protocol, including perfusion (DSC) and spectroscopy,was consistent with that diagnosis. Another 3 months later,a follow-up brain MRI demonstrated an increase in size ofthe lesion, with new intralesional enhancement, triggering achange in radiologic diagnosis to high-grade glial neoplasm.A repeat MRI confirmed that diagnosis, demonstratingincreased rCBV within the enhancing component. The thoughtwas that there had been malignant transformation of the originaltumor, which was identified 6 months earlier. The lesion wasresected 10 days later, and the postoperative MRI showedsome residual abnormal T2 signal but no residual enhancement.The pathology diagnosis was glioblastoma. A follow-upMRI, 2.5 months after initial resection demonstrated new
Fig. 7 Survival analysis of two clusters of the early-stage NSCLC patients with respect to (a) death and(b) nodal failure.
Fig. 8 (a) Sagittal postgadolinum T1-weighted images with recur-rence probability maps on preop scan, calculated via CaPTk.(b) Actual recurrence scan, about 3 months later.
Journal of Medical Imaging 011018-8 Jan–Mar 2018 • Vol. 5(1)
Davatzikos et al.: Cancer imaging phenomics toolkit: quantitative imaging analytics. . .
Downloaded From: https://www.spiedigitallibrary.org/journals/Journal-of-Medical-Imaging on 2/24/2018 Terms of Use: https://www.spiedigitallibrary.org/terms-of-use
enhancement, is consistent with tumor progression/recurrence.Using multiparametric analysis with CaPTk, we determinedthe areas of high likelihood for recurrence on the preoperativescan and superimposed the corresponding probability maps[Fig. 8(a)]. The actual recurrence [Fig. 8(b)] was centered pre-cisely on the predicted high likelihood area.
5.3.2 Fiber tracking
Two of the major challenges faced by fiber tracking in the realmof neurosurgical planning are that the reconstruction of tracts isaffected by mass effect, when the tracts are displaced and dis-torted, and edema and infiltration, when the tracts are broken asa result of the change of diffusion parameters due to the pathol-ogy. These underline the need for methods that can track
through edema and reconstruct even partial and displaced tracts.We are developing tractography algorithms that are invariantto edema, based on multicompartment modeling of the diffusiondata.41,42 The improvement in tracking with this modeling, over-traditional tracking, can be seen in Fig. 2(a). We have developedautomated atlas-based tract reconstruction called Confetti(connectivity-based fiber extraction and identification;43
Appendix A, Table 8). The applicability, the reliability, andthe repeatability of the Confetti were validated in a dataset ofhealthy individuals acquired repeatedly.43 Compared to the clus-tering of fibers for each scan independently, our framework pro-vided better test–retest reproducibility results, with decreased(25%) mean intraindividual distance (i.e., disagreement of clus-ters between different timepoints of the same individual), whilepreserving interindividual differences. Additionally, the Confetti
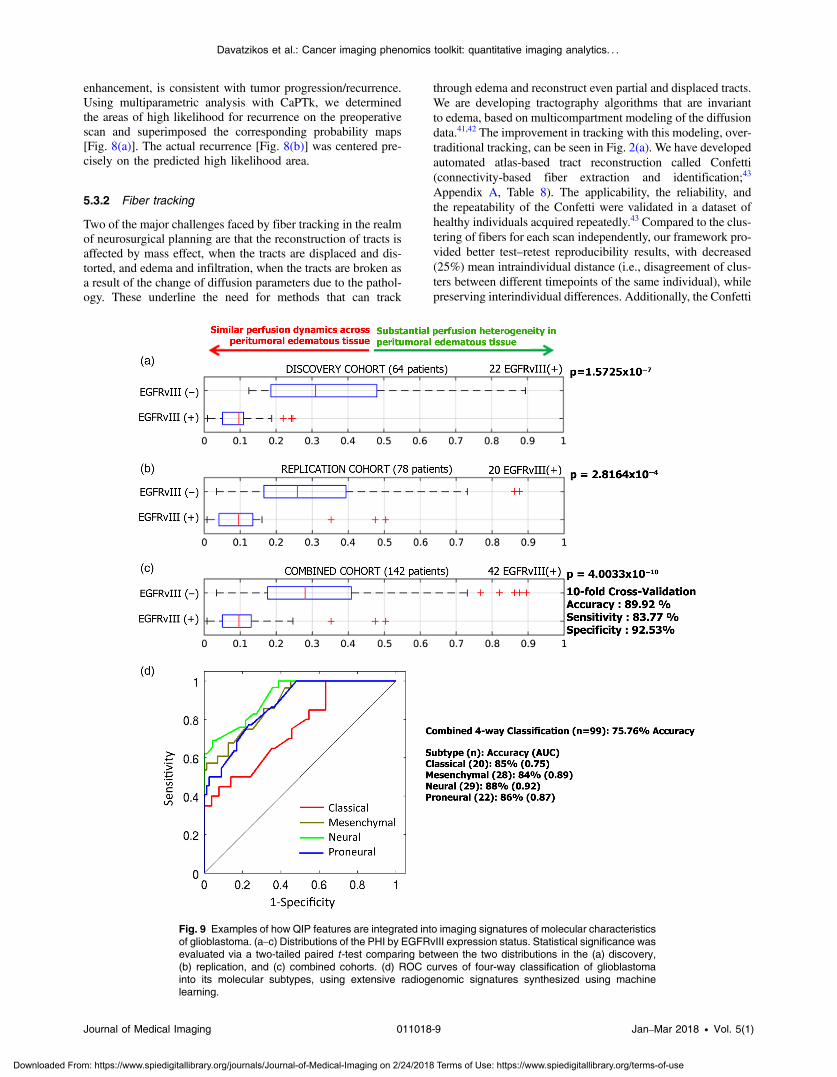
Fig. 9 Examples of how QIP features are integrated into imaging signatures of molecular characteristicsof glioblastoma. (a–c) Distributions of the PHI by EGFRvIII expression status. Statistical significance wasevaluated via a two-tailed paired t -test comparing between the two distributions in the (a) discovery,(b) replication, and (c) combined cohorts. (d) ROC curves of four-way classification of glioblastomainto its molecular subtypes, using extensive radiogenomic signatures synthesized using machinelearning.
Journal of Medical Imaging 011018-9 Jan–Mar 2018 • Vol. 5(1)
Davatzikos et al.: Cancer imaging phenomics toolkit: quantitative imaging analytics. . .
Downloaded From: https://www.spiedigitallibrary.org/journals/Journal-of-Medical-Imaging on 2/24/2018 Terms of Use: https://www.spiedigitallibrary.org/terms-of-use
was also tested in tumor patients40 on six major fiber bundles:cingulum bundle; fornix, uncinate fasciculus (UF), arcuate fas-ciculus, inferior fronto-occipital fasciculus, and inferior longi-tudinal fasciculus (ILF). The agreement between clusteringand experts as quantified by Cohen’s kappa ranged between0.6 and 0.76. Except two tracts, ILF and UF, the agreementbetween clustering and experts was higher than agreementbetween experts themselves, highlighting the reliability of theparadigm. When the tumor demonstrated significant mass effector shift, the automated approach was useful to provide an ini-tialization to guide the expert with identification of the specifictract of interest.
We have developed a measure of injury called disruptionindex of the structural connectome (DISC), based on how theinformation transfer in the brain is affected by changes in differ-ent regions.56 A representation of the vulnerability of the brain toinjury can be seen in Fig. 2(b). We have tested the DISC ona dataset of traumatic brain injury (TBI) patients with moderateto severe TBI examined at 3 months postinjury.56 DISC was sig-nificantly correlated with post-traumatic amnesia (Pearson r ¼0.52, p-value: 0.0007), verbal learning (Pearson r ¼ −0.42,p-value: 0.0075), executive function (Pearson r ¼ −0.41,p-value: 0.0083), and processing speed (Pearson r ¼ −0.58,p-value: 0.0001), demonstrating that assessing structural con-nectivity alterations may be useful in development of patient-oriented diagnostic and prognostic tools.
These diffusion MRI-based tools are being developed asa separate suite in CaPTk because of special visualizationneeds for such data. A preliminary view of the proposed surgicalplan can be seen in Fig. 2(c) in which the automaticallyextracted tracts are presented with regard to the tumor.The tracts, vulnerability maps, and recurrence maps will be
incorporated in this plan in the future. Radiation plans can becreated by using the resection cavity instead of the tumor.
5.4 Radiogenomics
As described earlier, the emerging field of radiogenomics prom-ises to develop an arsenal of imaging signatures reflectingunderlying molecular characteristics of various cancers.CaPTk allows the construction of such imaging signatures.We present results from two such examples: imaging signaturesof the EGFRvIII mutation and of molecular subtypes ofglioblastoma4,10 (Fig. 9), as well as an imaging signature ofOncotypeDX in breast cancer (Fig. 10).
5.4.1 Imaging signatures of the EGFRvIII mutation, aswell as transcriptomic subtype, in glioblastoma
CaPTk offers an imaging signature highly distinctive of theEGFRvIII mutation in glioblastoma. This imaging signature lev-erages the heterogeneity of DSC-MRI signals throughout theperitumoral region, which is depicted by abnormal/bright T2-FLAIR signal10 (Appendix A, Table 3). In particular, this sig-nature is based on the observation that the gradient of perfusionbetween tissue immediate to the active tumor and tissue distantfrom the tumor but within this peritumoral edematous region(bright FLAIR) is significantly higher in tumors that do not har-bor the mutation (i.e., EGFRvIII- glioblastoma). This observa-tion is reflecting the more local invasion and neovascularizationof the EGFRvIII- tumors, and vice versa, the potentially deeperinvasion of EGFRvIII+ tumors. Principal component featuresare extracted from the DSC-MRI images using CaPTk andthe Bhattacharya distance is calculated to form the peritumoral
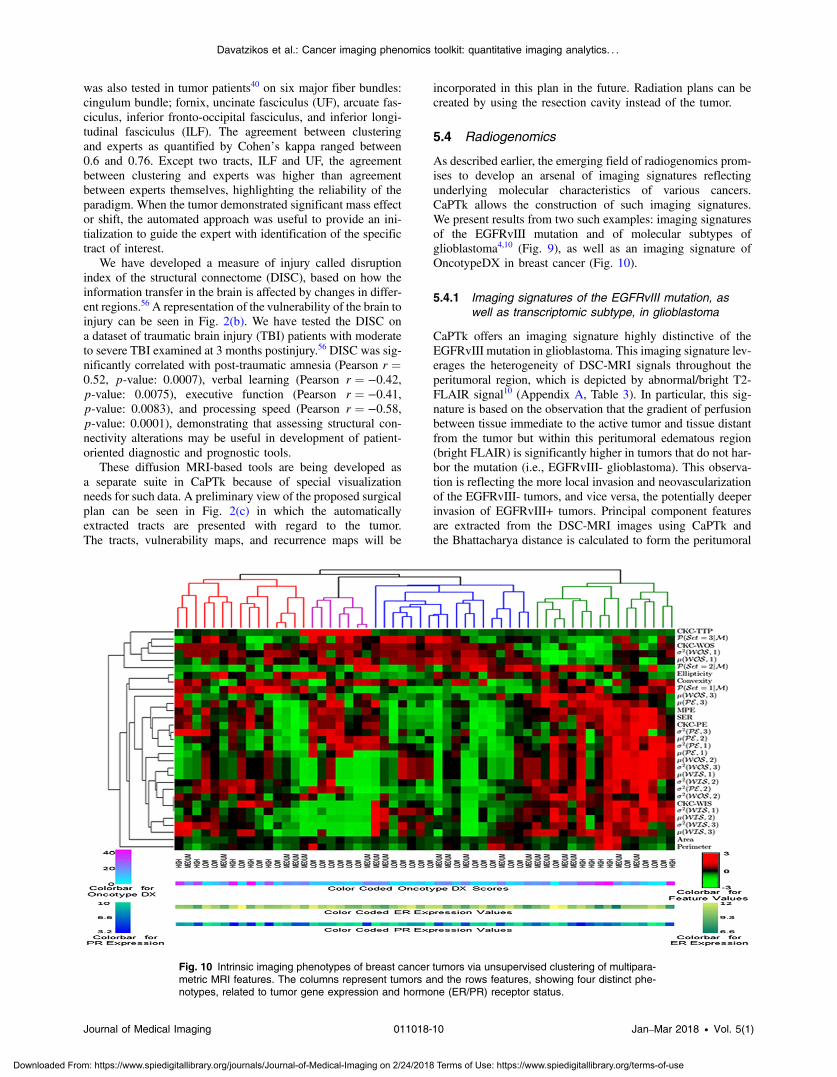
Fig. 10 Intrinsic imaging phenotypes of breast cancer tumors via unsupervised clustering of multipara-metric MRI features. The columns represent tumors and the rows features, showing four distinct phe-notypes, related to tumor gene expression and hormone (ER/PR) receptor status.
Journal of Medical Imaging 011018-10 Jan–Mar 2018 • Vol. 5(1)
Davatzikos et al.: Cancer imaging phenomics toolkit: quantitative imaging analytics. . .
Downloaded From: https://www.spiedigitallibrary.org/journals/Journal-of-Medical-Imaging on 2/24/2018 Terms of Use: https://www.spiedigitallibrary.org/terms-of-use
heterogeneity index (PHI). The method was evaluated in preop-erative perfusion scans of independent discovery (n ¼ 64) andvalidation (n ¼ 78) cohorts. Analysis in cohorts demonstratedhigh accuracy (89.92%), specificity (92.35%), and sensitivity(83.77%), with significantly distinctive ability (p-value ¼4.0033 × 10⁻¹⁰, AUC ¼ 0.8869). Figures 9(a)–9(c) show theclear separation between PHI values of EGFRvIII(+) andEGFRvIII(−) tumors.
Related work in glioblastoma was applied by obtaininga more extensive QIP integrating T1, T1-Gd, T2, T2-FLAIR,DTI extracted measurements, principal components of DSC-MRI, along with parameters of the tumor growth model, spatiallocation, and other features. The multiparametric obtained sig-nature aimed to detect molecular subtypes of glioblastoma, asdescribed in Ref. 57. Figure 9(d) shows ROC curves obtainedin this four-way classification experiment (baseline “chance”level is ∼25%). The AUC for classical, mesenchymal, neural, andproneural subtypes, respectively, was 0.75, 0.89, 0.92, and 0.87.
5.4.2 Breast DCE-MRI phenotypes correlate to gene-expression based breast tumor profiling
Preoperative breast DCE-MRI images from women with ER+breast cancer were retrospectively analyzed.25,58 All women hadtheir primary tumor tested with Oncotype DX,59 an assay thatmeasures RNA expression of 21 genes from formalin-fixed par-affin-embedded tissue and provides a score recurrence risk 10years after treatment (low ≤ 17%, 18% < medium < 30%,high ≥ 31%). Validated morphologic, kinetic, and spatialheterogeneity features were extracted from each primarytumor: tumor area and perimeter were used to measure tumorsize and ellipticity and convexity were computed to captureshape and structure.25,58 Voxel-wise kinetic tumor features ofPE, time-to-peak, WIS/WOS were also estimated, from whichstatistics were calculated to capture spatial kinetic tumorheterogeneity.25 Multivariate linear regression was used totest associations between radiomic features and the gene-expres-sion based recurrence score. To identify intrinsic imaging phe-notypes, unsupervised clustering was applied on the extractedfeature vectors.25 There was significant correlation (r ¼ 0.78,p-value < 0.01) between MRI features and the recurrencescore.60 Four imaging phenotypes were detected (Fig. 10),with two including only low and medium recurrence risktumors. Tumors with a gene expression profile at high risk ofrecurrence showed a predominantly rapid contrast uptake, sug-gesting high levels of perfusion and vessel permeability. Whenphenotypes were used in a model to predict recurrence risk, theAUC reached up to 0.82 (p-value < 0.01).
6 DiscussionWe have presented CaPTk, a software suite developed to deriveextensive QIP signatures, synthesize them into diagnostic andpredictive markers, and facilitate the clinical translation of suchcomplex algorithms. The described software extends beyondstandard radiomic signatures that primarily investigate shapeand texture properties and incorporates multiparametric MRImeasures of diffusion and perfusion that reflect underlyingcell density, microarchitecture, and neovascularization. Impor-tantly, CaPTk extracts spatial patterns of cancer distribution,obtained via deformable registration methods, as well as bio-physical parameters obtained via tumor growth modeling. Integra-tion of these comprehensive imaging and spatial signatures via
machine learning methods was found to result into indices ofdiagnostic, prognostic, and predictive value.
The ability to predict clinical outcome, for example, as evi-denced by our results in Sec. 5.2.1, is important as it can directlyinfluence patient management and treatment decisions.Although glioblastoma has a grim prognosis, some patientslive just for a few months, whereas others can survive formore than 2 years, under combination of surgical resection, radi-ation therapy, and chemotherapy. Consequently, knowing inadvance, the likelihood of an individual patient to respond pos-itively to this combination treatment directly influences treat-ment decisions. Perhaps even more importantly, evaluation ofpotential therapies is tremendously confounded by high interpa-tient variability of survival. Given that early-stage testing typi-cally involves a dozen or two patients, for treatment effects to bedetectable under such heterogeneity, they must be very strong,which is typically not the case. However, having a baseline pre-dictor of response/survival can significantly improve our abilityto detect subtle treatment effects in two ways. First, relativelymore homogeneous patient subgroups can be selected into atreatment trial. Second, post-treatment survival can be comparedwith baseline predicted survival, thereby providing a self-nor-malization mechanism that reduces heterogeneity and allowsfor treatment effects to be detected more easily.
Although the main scope of CaPTk is to provide decisionsupport diagnostic and predictive indices, it was found toalso enhance our understanding of disease mechanisms thatmight be related to various imaging signatures. Most notably,the EGFRvIII QIP revealed that tumors harboring the mutationmight become more infiltrative and less prone to neovasculari-zation, as evidenced by peritumoral perfusion MRI measures.On the contrary, EGFRvIII(−) tumors seem to build local vas-culature to support the growth of the tumor, and hence might bemore responsive to localized peritumoral treatment (resectionand/or radiation). Moreover, future work will further investigatethe spatial and temporal heterogeneity of this QIP signature ofEGFRvIII mutation, via investigation of the spatial gradient ofperfusion-derived metrics, as well as their change over time. Thesurgical and treatment planning environment (e.g., Figs. 2 and 8)will additionally provide a means for the surgeon to view (i) theplacement of the tracts around the tumor/resection cavity,(ii) recurrence maps showing regions most likely to be affectedin the future, and (iii) vulnerability maps depicting the globaleffect on the connectivity of the brain that could lead to futurecognitive deficits.
For breast cancer, the goal of neoadjuvant chemotherapy is todown-stage locally advanced cancers prior to surgery to increasebreast conservation rates and, ideally, achieve pathologic com-plete response (pCR), as patients with pCR have generally betterlong-term outcomes.61,62 Imaging can be useful both for deter-mining disease extent to inform surgery and for monitoringtumor response in vivo for tailoring treatment to the individualpatient.63 As new anticancer therapies are increasingly intro-duced, including targeted and combination therapies, there isan opportunity for personalized treatment. In neoadjuvantchemotherapy, while several patients may exhibit a clinicalresponse, the vast majority of patients do not achieve pCR solelyon the basis of standard first-line chemotherapy.61,62 In an idealpersonalized regimen, those are the patients we would like to beable to identify as early as possible during first-line neoadjuvanttreatment, so that there is an opportunity to offer them alterna-tive or supplemental therapies that could increase their chance of
Journal of Medical Imaging 011018-11 Jan–Mar 2018 • Vol. 5(1)
Davatzikos et al.: Cancer imaging phenomics toolkit: quantitative imaging analytics. . .
Downloaded From: https://www.spiedigitallibrary.org/journals/Journal-of-Medical-Imaging on 2/24/2018 Terms of Use: https://www.spiedigitallibrary.org/terms-of-use
achieving pCR.63 Breast cancer patients may now benefit froma number of novel therapies, such as aromatase inhibitors forER+ cancer, trastuzumab plus lepatinib/pertuzumab with stan-dard anthracycline/taxane chemotherapy for Her2+ tumors,PARP-inhibitors for triple-negative breast cancer, and/orBRCA carriers, shown to have significant benefits.64 Results,however, from I-SPY 165 indicate that early prediction of pCRbased on tumor volume and aggregate MRI features is far fromperfect, having moderate discriminatory accuracy at the individ-ual level. Our results suggest that the tools developed withCaPTk could allow to more accurately characterize the hetero-geneous tissue changes induced by treatment. The rationaleis that this more comprehensive way of characterizing the com-plex biological properties targeted by treatment,60,66 especiallychanges related to functional angiogenic response, which occurprior to changes in tumor size,63 will ultimately result in betterprediction of response than the current standard imaging mea-sures. Therefore, QIP signatures hold the promise of shifting thecurrent paradigm in tailoring neoadjuvant treatment by introduc-ing imaging biomarkers that are better earlier predictors ofresponse and survival. Ultimately, by integrating imaging withhistopathologic and molecular markers, we will be able todevelop integrative predictive models that can be more accuratefor specific tumor subtypes and individual patients.
Early prediction of treatment response and survival for lungcancer patients is important in terms of optimal treatment plan-ning and prognosis. Radiomics analysis using quantitative im-aging features to predict clinical outcomes has been widelyinvestigated recently.67,68 Most prior analyses were designed topredict clinical outcomes using univariate or multivariate analy-ses in a supervised manner. However, due to data imbalance andcurse of dimensionality (small sample size and larger featuredimensionality), it is nontrivial to obtain a reliable prediction,and feature selection or dimension reduction techniques are typ-ically used to improve the prediction performance. Unsuper-vised clustering of radiomic features is a promising alternativetechnique for risk stratification. As demonstrated by the resultsshown in Fig. 7, early-stage NSCLC patients clustered into dif-ferent groups based on their radiomic features had distinctivetreatment outcomes with respect to both survival and nodal failurealthough they were treated uniformly with SBRT. Our results sug-gest that the tools developed with CaPTk could be used to stratifypatients based on their PET scans collected before the treatmentso that personalized treatment could be implemented.
The flexible architecture of CaPTk enables its use in differentcontexts. For example, individual components and pipelines canbe used as command-line modules, either on a local computeror, ultimately, on a high performance computing infrastructureand even the cloud. CaPTk’s graphical interface can providefocused and minimally complex tools. For example, a combina-tion of tractography with predictive maps of infiltration andrecurrence can be used for neurosurgical and radiation therapyplanning. LIBRA and related modules are currently used forbreast cancer risk estimation purposes. Finally, longer-termgoals of CaPTk development include its integration withother packages offering complementary capabilities, such as3-DSlicer. CaPTk describes a platform that facilitates transla-tion, enabling operators to conduct quantitative analyses in astraightforward manner without requiring a substantial compu-tational background. Thus, CaPTk can be seamlessly integratedinto the typical quantification, analysis, and reporting workflowof a radiologist, underscoring its clinical potential.
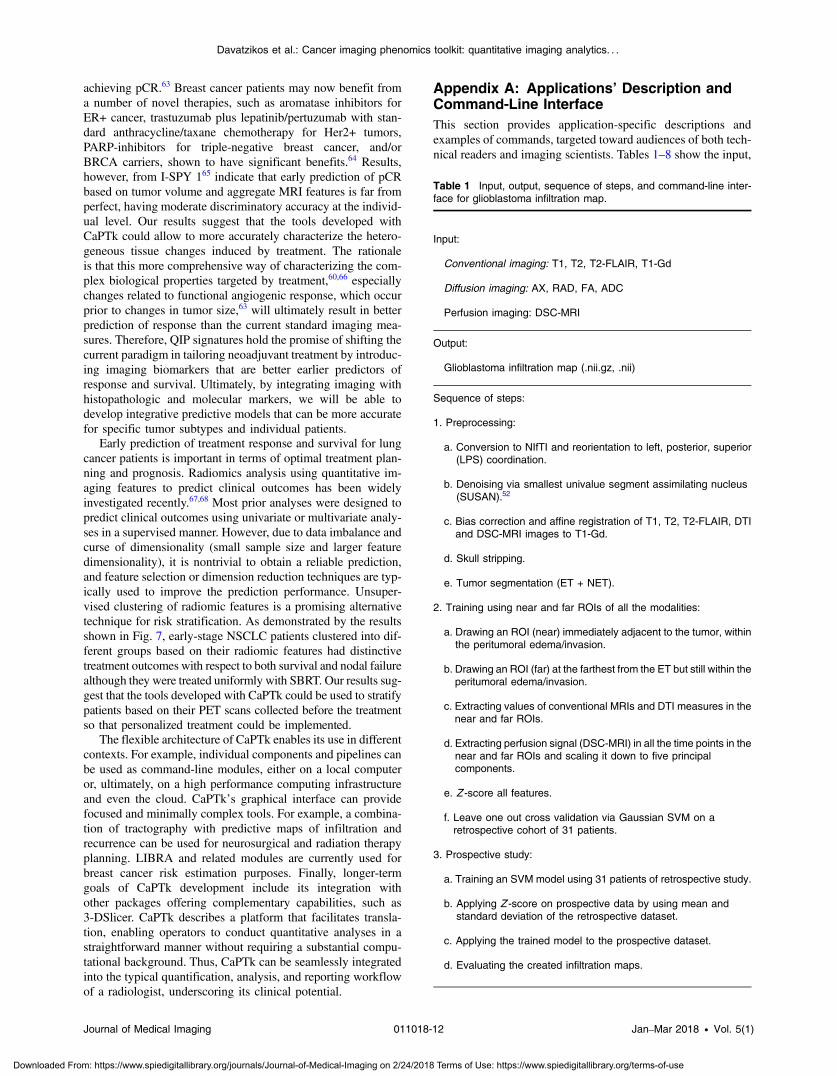
Appendix A: Applications’ Description andCommand-Line InterfaceThis section provides application-specific descriptions andexamples of commands, targeted toward audiences of both tech-nical readers and imaging scientists. Tables 1–8 show the input,
Table 1 Input, output, sequence of steps, and command-line inter-face for glioblastoma infiltration map.
Input:
Conventional imaging: T1, T2, T2-FLAIR, T1-Gd
Diffusion imaging: AX, RAD, FA, ADC
Perfusion imaging: DSC-MRI
Output:
Glioblastoma infiltration map (.nii.gz, .nii)
Sequence of steps:
1. Preprocessing:
a. Conversion to NIfTI and reorientation to left, posterior, superior(LPS) coordination.
b. Denoising via smallest univalue segment assimilating nucleus(SUSAN).52
c. Bias correction and affine registration of T1, T2, T2-FLAIR, DTIand DSC-MRI images to T1-Gd.
d. Skull stripping.
e. Tumor segmentation (ET + NET).
2. Training using near and far ROIs of all the modalities:
a. Drawing an ROI (near) immediately adjacent to the tumor, withinthe peritumoral edema/invasion.
b. Drawing an ROI (far) at the farthest from the ET but still within theperitumoral edema/invasion.
c. Extracting values of conventional MRIs and DTI measures in thenear and far ROIs.
d. Extracting perfusion signal (DSC-MRI) in all the time points in thenear and far ROIs and scaling it down to five principalcomponents.
e. Z -score all features.
f. Leave one out cross validation via Gaussian SVM on aretrospective cohort of 31 patients.
3. Prospective study:
a. Training an SVM model using 31 patients of retrospective study.
b. Applying Z -score on prospective data by using mean andstandard deviation of the retrospective dataset.
c. Applying the trained model to the prospective dataset.
d. Evaluating the created infiltration maps.
Journal of Medical Imaging 011018-12 Jan–Mar 2018 • Vol. 5(1)
Davatzikos et al.: Cancer imaging phenomics toolkit: quantitative imaging analytics. . .
Downloaded From: https://www.spiedigitallibrary.org/journals/Journal-of-Medical-Imaging on 2/24/2018 Terms of Use: https://www.spiedigitallibrary.org/terms-of-use
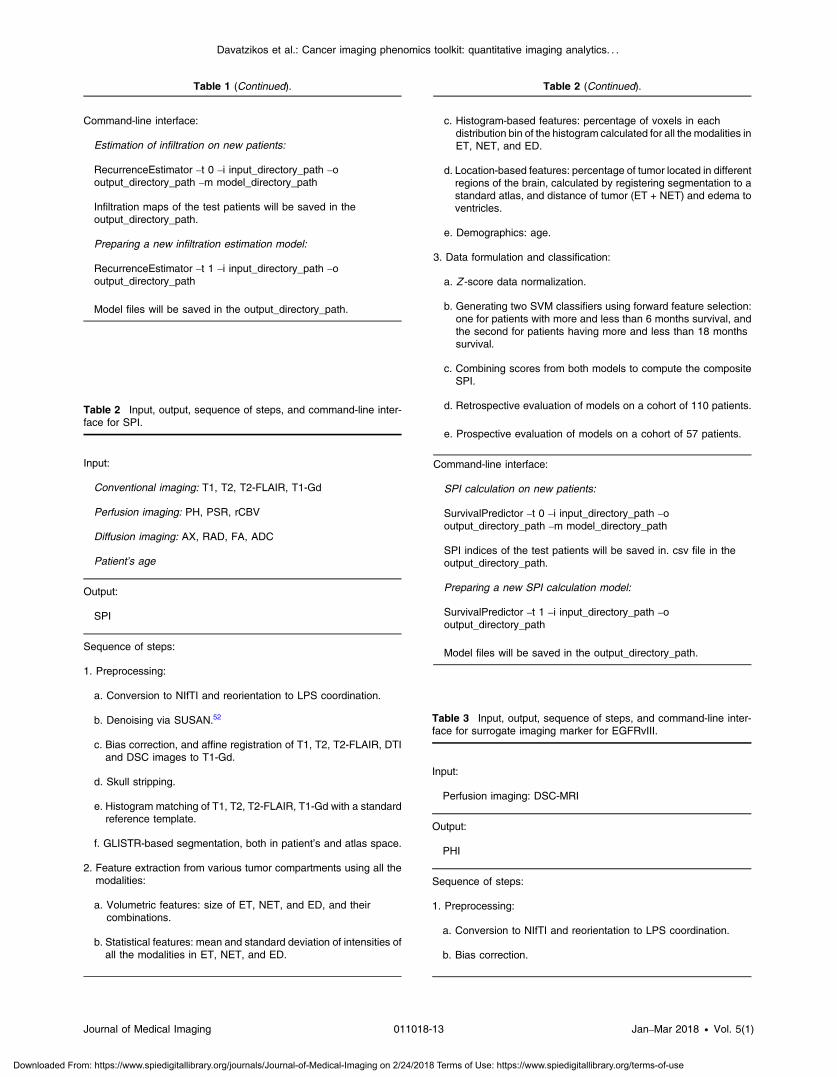
Table 1 (Continued).
Command-line interface:
Estimation of infiltration on new patients:
RecurrenceEstimator –t 0 –i input_directory_path –ooutput_directory_path –m model_directory_path
Infiltration maps of the test patients will be saved in theoutput_directory_path.
Preparing a new infiltration estimation model:
RecurrenceEstimator –t 1 –i input_directory_path –ooutput_directory_path
Model files will be saved in the output_directory_path.
Table 2 Input, output, sequence of steps, and command-line inter-face for SPI.
Input:
Conventional imaging: T1, T2, T2-FLAIR, T1-Gd
Perfusion imaging: PH, PSR, rCBV
Diffusion imaging: AX, RAD, FA, ADC
Patient’s age
Output:
SPI
Sequence of steps:
1. Preprocessing:
a. Conversion to NIfTI and reorientation to LPS coordination.
b. Denoising via SUSAN.52
c. Bias correction, and affine registration of T1, T2, T2-FLAIR, DTIand DSC images to T1-Gd.
d. Skull stripping.
e. Histogram matching of T1, T2, T2-FLAIR, T1-Gd with a standardreference template.
f. GLISTR-based segmentation, both in patient’s and atlas space.
2. Feature extraction from various tumor compartments using all themodalities:
a. Volumetric features: size of ET, NET, and ED, and theircombinations.
b. Statistical features: mean and standard deviation of intensities ofall the modalities in ET, NET, and ED.
Table 2 (Continued).
c. Histogram-based features: percentage of voxels in eachdistribution bin of the histogram calculated for all the modalities inET, NET, and ED.
d. Location-based features: percentage of tumor located in differentregions of the brain, calculated by registering segmentation to astandard atlas, and distance of tumor (ET + NET) and edema toventricles.
e. Demographics: age.
3. Data formulation and classification:
a. Z -score data normalization.
b. Generating two SVM classifiers using forward feature selection:one for patients with more and less than 6 months survival, andthe second for patients having more and less than 18 monthssurvival.
c. Combining scores from both models to compute the compositeSPI.
d. Retrospective evaluation of models on a cohort of 110 patients.
e. Prospective evaluation of models on a cohort of 57 patients.
Command-line interface:
SPI calculation on new patients:
SurvivalPredictor –t 0 –i input_directory_path –ooutput_directory_path –m model_directory_path
SPI indices of the test patients will be saved in. csv file in theoutput_directory_path.
Preparing a new SPI calculation model:
SurvivalPredictor –t 1 –i input_directory_path –ooutput_directory_path
Model files will be saved in the output_directory_path.
Table 3 Input, output, sequence of steps, and command-line inter-face for surrogate imaging marker for EGFRvIII.
Input:
Perfusion imaging: DSC-MRI
Output:
PHI
Sequence of steps:
1. Preprocessing:
a. Conversion to NIfTI and reorientation to LPS coordination.
b. Bias correction.
Journal of Medical Imaging 011018-13 Jan–Mar 2018 • Vol. 5(1)
Davatzikos et al.: Cancer imaging phenomics toolkit: quantitative imaging analytics. . .
Downloaded From: https://www.spiedigitallibrary.org/journals/Journal-of-Medical-Imaging on 2/24/2018 Terms of Use: https://www.spiedigitallibrary.org/terms-of-use
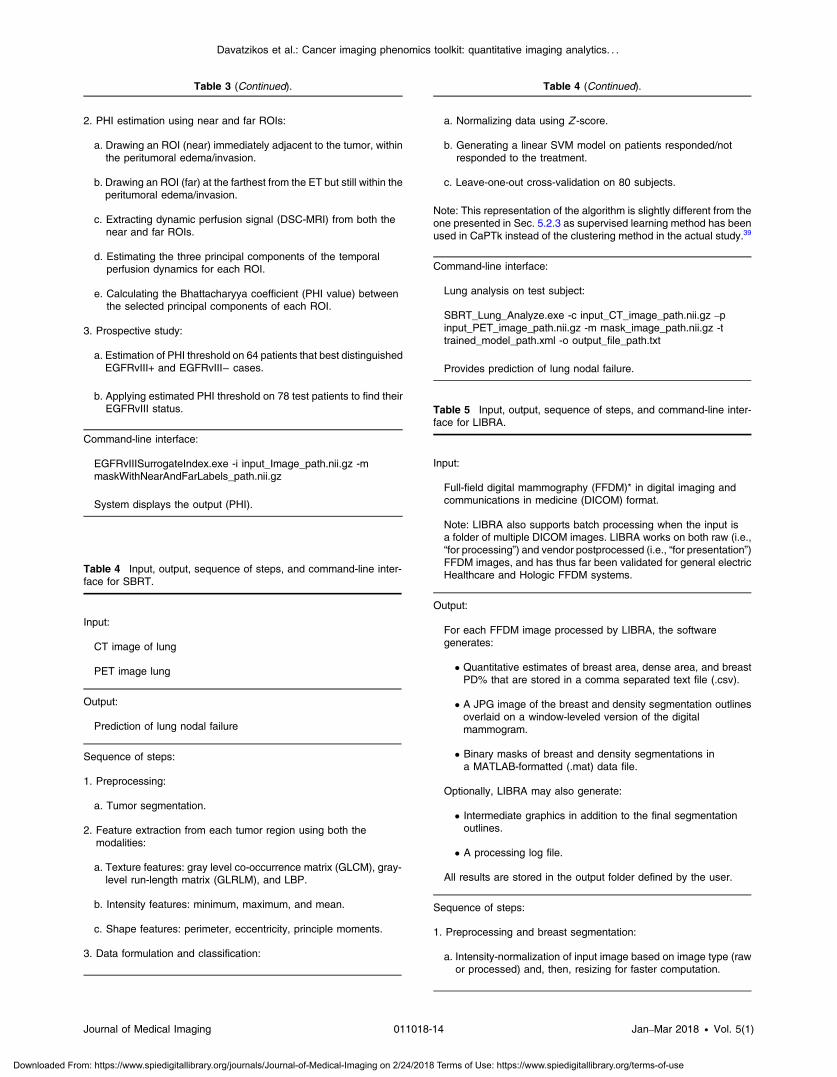
Table 3 (Continued).
2. PHI estimation using near and far ROIs:
a. Drawing an ROI (near) immediately adjacent to the tumor, withinthe peritumoral edema/invasion.
b. Drawing an ROI (far) at the farthest from the ET but still within theperitumoral edema/invasion.
c. Extracting dynamic perfusion signal (DSC-MRI) from both thenear and far ROIs.
d. Estimating the three principal components of the temporalperfusion dynamics for each ROI.
e. Calculating the Bhattacharyya coefficient (PHI value) betweenthe selected principal components of each ROI.
3. Prospective study:
a. Estimation of PHI threshold on 64 patients that best distinguishedEGFRvIII+ and EGFRvIII− cases.
b. Applying estimated PHI threshold on 78 test patients to find theirEGFRvIII status.
Command-line interface:
EGFRvIIISurrogateIndex.exe -i input_Image_path.nii.gz -mmaskWithNearAndFarLabels_path.nii.gz
System displays the output (PHI).
Table 4 Input, output, sequence of steps, and command-line inter-face for SBRT.
Input:
CT image of lung
PET image lung
Output:
Prediction of lung nodal failure
Sequence of steps:
1. Preprocessing:
a. Tumor segmentation.
2. Feature extraction from each tumor region using both themodalities:
a. Texture features: gray level co-occurrence matrix (GLCM), gray-level run-length matrix (GLRLM), and LBP.
b. Intensity features: minimum, maximum, and mean.
c. Shape features: perimeter, eccentricity, principle moments.
3. Data formulation and classification:
Table 4 (Continued).
a. Normalizing data using Z -score.
b. Generating a linear SVM model on patients responded/notresponded to the treatment.
c. Leave-one-out cross-validation on 80 subjects.
Note: This representation of the algorithm is slightly different from theone presented in Sec. 5.2.3 as supervised learning method has beenused in CaPTk instead of the clustering method in the actual study.39
Command-line interface:
Lung analysis on test subject:
SBRT_Lung_Analyze.exe -c input_CT_image_path.nii.gz –pinput_PET_image_path.nii.gz -m mask_image_path.nii.gz -ttrained_model_path.xml -o output_file_path.txt
Provides prediction of lung nodal failure.
Table 5 Input, output, sequence of steps, and command-line inter-face for LIBRA.
Input:
Full-field digital mammography (FFDM)* in digital imaging andcommunications in medicine (DICOM) format.
Note: LIBRA also supports batch processing when the input isa folder of multiple DICOM images. LIBRA works on both raw (i.e.,“for processing”) and vendor postprocessed (i.e., “for presentation”)FFDM images, and has thus far been validated for general electricHealthcare and Hologic FFDM systems.
Output:
For each FFDM image processed by LIBRA, the softwaregenerates:
• Quantitative estimates of breast area, dense area, and breastPD% that are stored in a comma separated text file (.csv).
• A JPG image of the breast and density segmentation outlinesoverlaid on a window-leveled version of the digitalmammogram.
• Binary masks of breast and density segmentations ina MATLAB-formatted (.mat) data file.
Optionally, LIBRA may also generate:
• Intermediate graphics in addition to the final segmentationoutlines.
• A processing log file.
All results are stored in the output folder defined by the user.
Sequence of steps:
1. Preprocessing and breast segmentation:
a. Intensity-normalization of input image based on image type (rawor processed) and, then, resizing for faster computation.
Journal of Medical Imaging 011018-14 Jan–Mar 2018 • Vol. 5(1)
Davatzikos et al.: Cancer imaging phenomics toolkit: quantitative imaging analytics. . .
Downloaded From: https://www.spiedigitallibrary.org/journals/Journal-of-Medical-Imaging on 2/24/2018 Terms of Use: https://www.spiedigitallibrary.org/terms-of-use
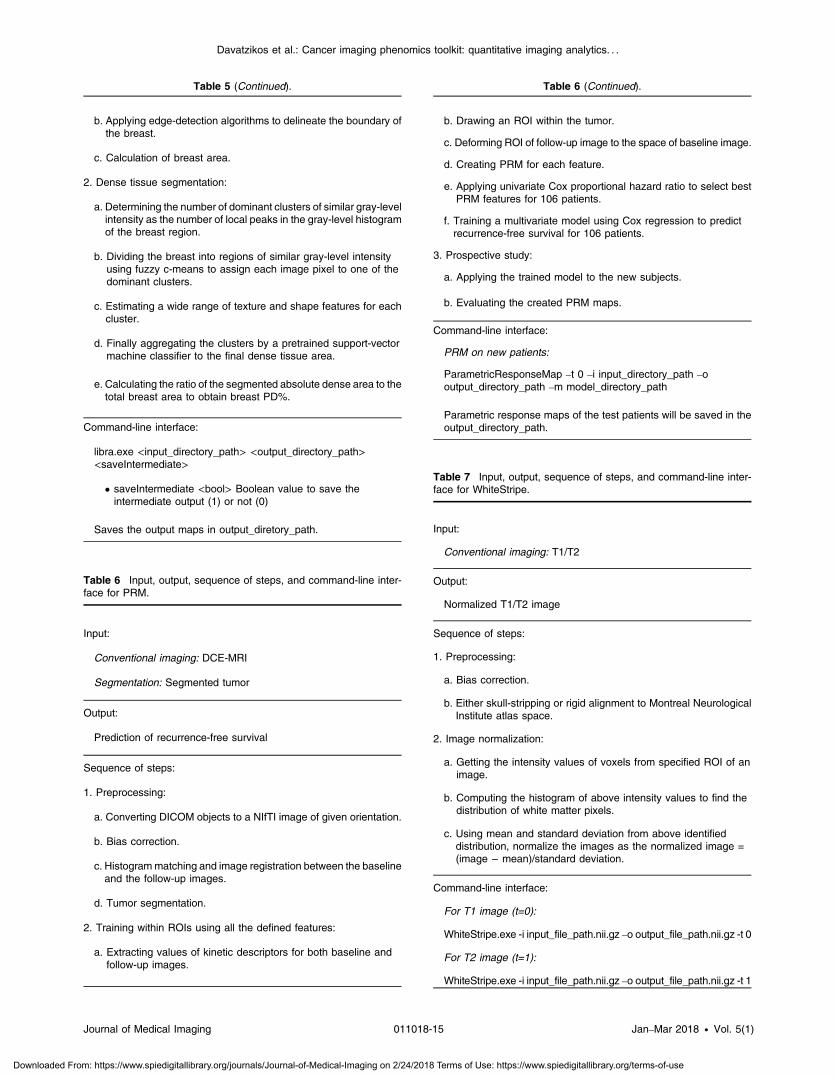
Table 5 (Continued).
b. Applying edge-detection algorithms to delineate the boundary ofthe breast.
c. Calculation of breast area.
2. Dense tissue segmentation:
a. Determining the number of dominant clusters of similar gray-levelintensity as the number of local peaks in the gray-level histogramof the breast region.
b. Dividing the breast into regions of similar gray-level intensityusing fuzzy c-means to assign each image pixel to one of thedominant clusters.
c. Estimating a wide range of texture and shape features for eachcluster.
d. Finally aggregating the clusters by a pretrained support-vectormachine classifier to the final dense tissue area.
e. Calculating the ratio of the segmented absolute dense area to thetotal breast area to obtain breast PD%.
Command-line interface:
libra.exe <input_directory_path> <output_directory_path><saveIntermediate>
• saveIntermediate <bool> Boolean value to save theintermediate output (1) or not (0)
Saves the output maps in output_diretory_path.
Table 6 Input, output, sequence of steps, and command-line inter-face for PRM.
Input:
Conventional imaging: DCE-MRI
Segmentation: Segmented tumor
Output:
Prediction of recurrence-free survival
Sequence of steps:
1. Preprocessing:
a. Converting DICOM objects to a NIfTI image of given orientation.
b. Bias correction.
c. Histogrammatching and image registration between the baselineand the follow-up images.
d. Tumor segmentation.
2. Training within ROIs using all the defined features:
a. Extracting values of kinetic descriptors for both baseline andfollow-up images.
Table 6 (Continued).
b. Drawing an ROI within the tumor.
c. Deforming ROI of follow-up image to the space of baseline image.
d. Creating PRM for each feature.
e. Applying univariate Cox proportional hazard ratio to select bestPRM features for 106 patients.
f. Training a multivariate model using Cox regression to predictrecurrence-free survival for 106 patients.
3. Prospective study:
a. Applying the trained model to the new subjects.
b. Evaluating the created PRM maps.
Command-line interface:
PRM on new patients:
ParametricResponseMap –t 0 –i input_directory_path –ooutput_directory_path –m model_directory_path
Parametric response maps of the test patients will be saved in theoutput_directory_path.
Table 7 Input, output, sequence of steps, and command-line inter-face for WhiteStripe.
Input:
Conventional imaging: T1/T2
Output:
Normalized T1/T2 image
Sequence of steps:
1. Preprocessing:
a. Bias correction.
b. Either skull-stripping or rigid alignment to Montreal NeurologicalInstitute atlas space.
2. Image normalization:
a. Getting the intensity values of voxels from specified ROI of animage.
b. Computing the histogram of above intensity values to find thedistribution of white matter pixels.
c. Using mean and standard deviation from above identifieddistribution, normalize the images as the normalized image =(image − mean)/standard deviation.
Command-line interface:
For T1 image (t=0):
WhiteStripe.exe -i input_file_path.nii.gz –o output_file_path.nii.gz -t 0
For T2 image (t=1):
WhiteStripe.exe -i input_file_path.nii.gz –o output_file_path.nii.gz -t 1
Journal of Medical Imaging 011018-15 Jan–Mar 2018 • Vol. 5(1)
Davatzikos et al.: Cancer imaging phenomics toolkit: quantitative imaging analytics. . .
Downloaded From: https://www.spiedigitallibrary.org/journals/Journal-of-Medical-Imaging on 2/24/2018 Terms of Use: https://www.spiedigitallibrary.org/terms-of-use
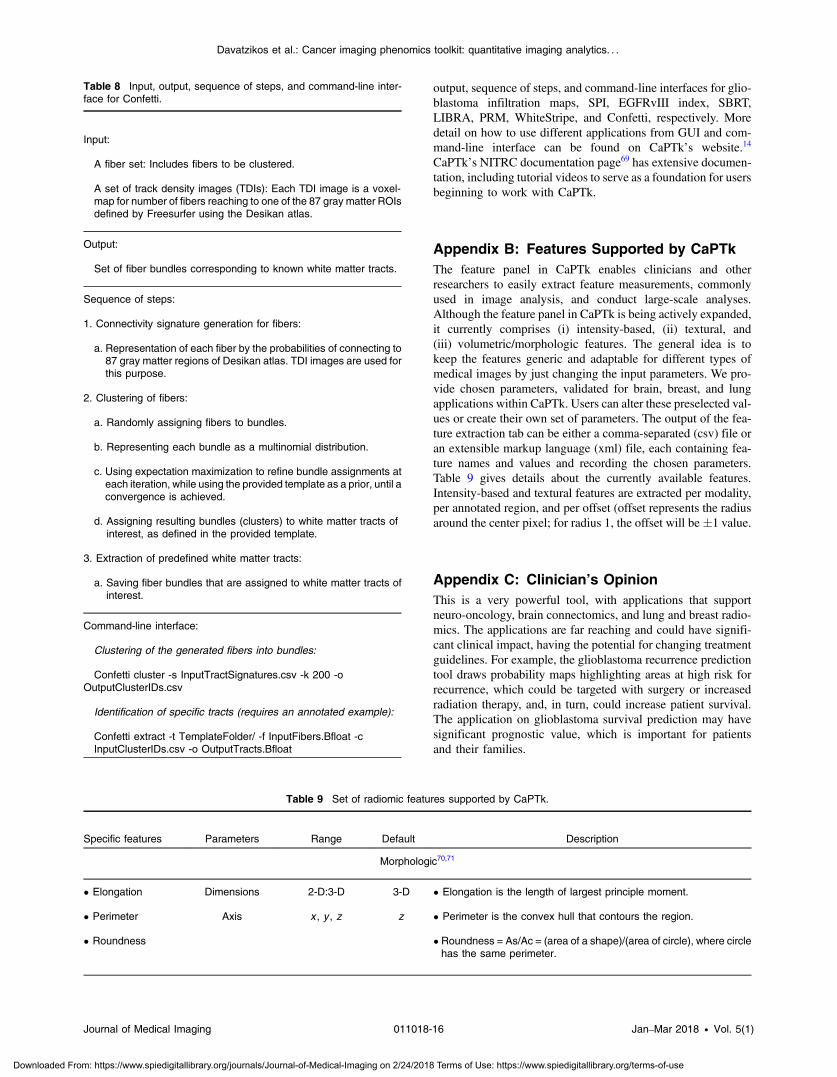
output, sequence of steps, and command-line interfaces for glio-blastoma infiltration maps, SPI, EGFRvIII index, SBRT,LIBRA, PRM, WhiteStripe, and Confetti, respectively. Moredetail on how to use different applications from GUI and com-mand-line interface can be found on CaPTk’s website.14
CaPTk’s NITRC documentation page69 has extensive documen-tation, including tutorial videos to serve as a foundation for usersbeginning to work with CaPTk.
Appendix B: Features Supported by CaPTkThe feature panel in CaPTk enables clinicians and otherresearchers to easily extract feature measurements, commonlyused in image analysis, and conduct large-scale analyses.Although the feature panel in CaPTk is being actively expanded,it currently comprises (i) intensity-based, (ii) textural, and(iii) volumetric/morphologic features. The general idea is tokeep the features generic and adaptable for different types ofmedical images by just changing the input parameters. We pro-vide chosen parameters, validated for brain, breast, and lungapplications within CaPTk. Users can alter these preselected val-ues or create their own set of parameters. The output of the fea-ture extraction tab can be either a comma-separated (csv) file oran extensible markup language (xml) file, each containing fea-ture names and values and recording the chosen parameters.Table 9 gives details about the currently available features.Intensity-based and textural features are extracted per modality,per annotated region, and per offset (offset represents the radiusaround the center pixel; for radius 1, the offset will be �1 value.
Appendix C: Clinician’s OpinionThis is a very powerful tool, with applications that supportneuro-oncology, brain connectomics, and lung and breast radio-mics. The applications are far reaching and could have signifi-cant clinical impact, having the potential for changing treatmentguidelines. For example, the glioblastoma recurrence predictiontool draws probability maps highlighting areas at high risk forrecurrence, which could be targeted with surgery or increasedradiation therapy, and, in turn, could increase patient survival.The application on glioblastoma survival prediction may havesignificant prognostic value, which is important for patientsand their families.
Table 8 Input, output, sequence of steps, and command-line inter-face for Confetti.
Input:
A fiber set: Includes fibers to be clustered.
A set of track density images (TDIs): Each TDI image is a voxel-map for number of fibers reaching to one of the 87 gray matter ROIsdefined by Freesurfer using the Desikan atlas.
Output:
Set of fiber bundles corresponding to known white matter tracts.
Sequence of steps:
1. Connectivity signature generation for fibers:
a. Representation of each fiber by the probabilities of connecting to87 gray matter regions of Desikan atlas. TDI images are used forthis purpose.
2. Clustering of fibers:
a. Randomly assigning fibers to bundles.
b. Representing each bundle as a multinomial distribution.
c. Using expectation maximization to refine bundle assignments ateach iteration, while using the provided template as a prior, until aconvergence is achieved.
d. Assigning resulting bundles (clusters) to white matter tracts ofinterest, as defined in the provided template.
3. Extraction of predefined white matter tracts:
a. Saving fiber bundles that are assigned to white matter tracts ofinterest.
Command-line interface:
Clustering of the generated fibers into bundles:
Confetti cluster -s InputTractSignatures.csv -k 200 -oOutputClusterIDs.csv
Identification of specific tracts (requires an annotated example):
Confetti extract -t TemplateFolder/ -f InputFibers.Bfloat -cInputClusterIDs.csv -o OutputTracts.Bfloat
Table 9 Set of radiomic features supported by CaPTk.
Specific features Parameters Range Default Description
Morphologic70,71
• Elongation Dimensions 2-D:3-D 3-D • Elongation is the length of largest principle moment.
• Perimeter Axis x , y , z z • Perimeter is the convex hull that contours the region.
• Roundness • Roundness = As/Ac = (area of a shape)/(area of circle), where circlehas the same perimeter.
Journal of Medical Imaging 011018-16 Jan–Mar 2018 • Vol. 5(1)
Davatzikos et al.: Cancer imaging phenomics toolkit: quantitative imaging analytics. . .
Downloaded From: https://www.spiedigitallibrary.org/journals/Journal-of-Medical-Imaging on 2/24/2018 Terms of Use: https://www.spiedigitallibrary.org/terms-of-use
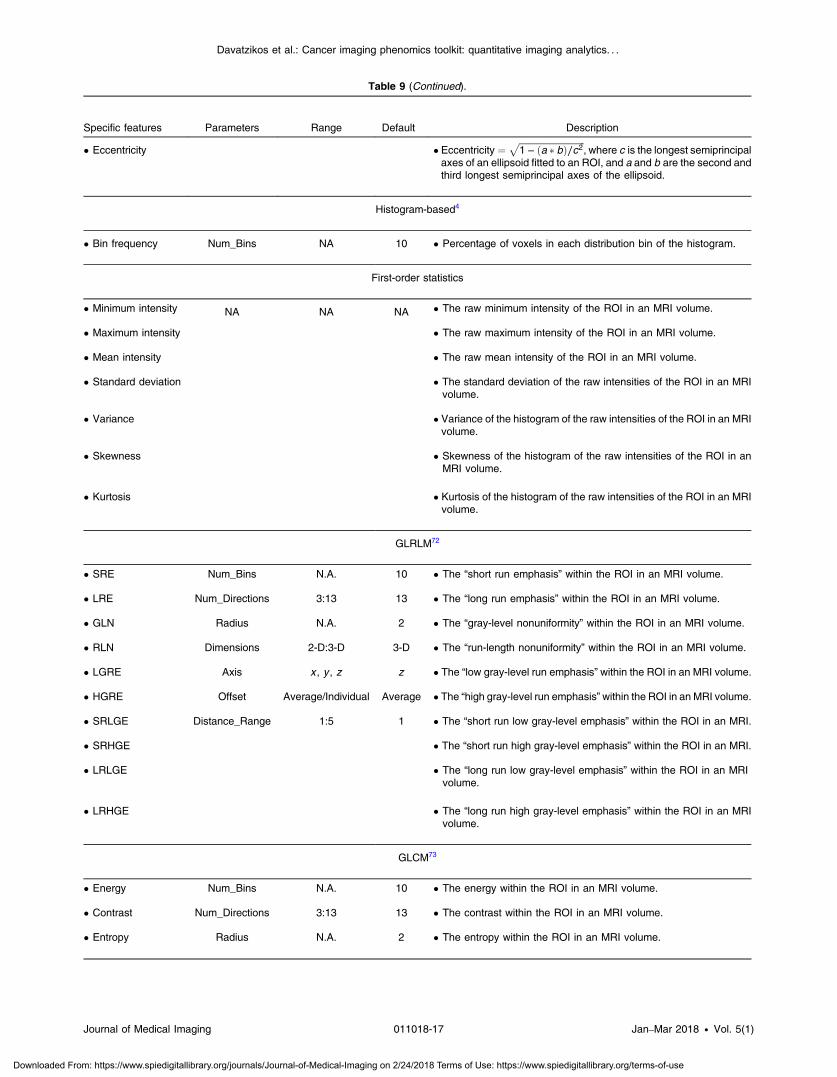
Table 9 (Continued).
Specific features Parameters Range Default Description
• Eccentricity • Eccentricity ¼ffiffiffiffiffiffiffiffiffiffiffiffiffiffiffiffiffiffiffiffiffiffiffiffiffiffiffiffiffiffi1 − ða � bÞ∕c2
p, where c is the longest semiprincipal
axes of an ellipsoid fitted to an ROI, and a and b are the second andthird longest semiprincipal axes of the ellipsoid.
Histogram-based4
• Bin frequency Num_Bins NA 10 • Percentage of voxels in each distribution bin of the histogram.
First-order statistics
• Minimum intensity NA NA NA • The raw minimum intensity of the ROI in an MRI volume.
• Maximum intensity • The raw maximum intensity of the ROI in an MRI volume.
• Mean intensity • The raw mean intensity of the ROI in an MRI volume.
• Standard deviation • The standard deviation of the raw intensities of the ROI in an MRIvolume.
• Variance • Variance of the histogram of the raw intensities of the ROI in an MRIvolume.
• Skewness • Skewness of the histogram of the raw intensities of the ROI in anMRI volume.
• Kurtosis • Kurtosis of the histogram of the raw intensities of the ROI in an MRIvolume.
GLRLM72
• SRE Num_Bins N.A. 10 • The “short run emphasis” within the ROI in an MRI volume.
• LRE Num_Directions 3:13 13 • The “long run emphasis” within the ROI in an MRI volume.
• GLN Radius N.A. 2 • The “gray-level nonuniformity” within the ROI in an MRI volume.
• RLN Dimensions 2-D:3-D 3-D • The “run-length nonuniformity” within the ROI in an MRI volume.
• LGRE Axis x , y , z z • The “low gray-level run emphasis” within the ROI in an MRI volume.
• HGRE Offset Average/Individual Average • The “high gray-level run emphasis”within the ROI in an MRI volume.
• SRLGE Distance_Range 1:5 1 • The “short run low gray-level emphasis” within the ROI in an MRI.
• SRHGE • The “short run high gray-level emphasis” within the ROI in an MRI.
• LRLGE • The “long run low gray-level emphasis” within the ROI in an MRIvolume.
• LRHGE • The “long run high gray-level emphasis” within the ROI in an MRIvolume.
GLCM73
• Energy Num_Bins N.A. 10 • The energy within the ROI in an MRI volume.
• Contrast Num_Directions 3:13 13 • The contrast within the ROI in an MRI volume.
• Entropy Radius N.A. 2 • The entropy within the ROI in an MRI volume.
Journal of Medical Imaging 011018-17 Jan–Mar 2018 • Vol. 5(1)
Davatzikos et al.: Cancer imaging phenomics toolkit: quantitative imaging analytics. . .
Downloaded From: https://www.spiedigitallibrary.org/journals/Journal-of-Medical-Imaging on 2/24/2018 Terms of Use: https://www.spiedigitallibrary.org/terms-of-use
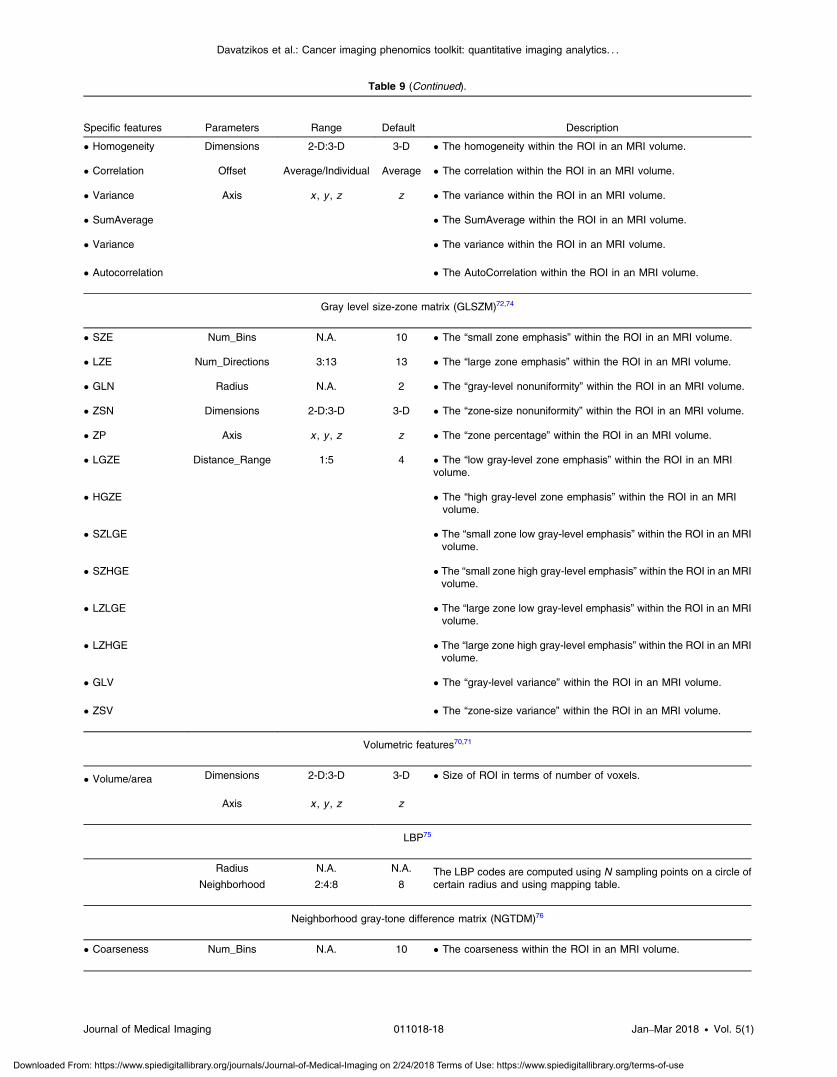
Table 9 (Continued).
Specific features Parameters Range Default Description
• Homogeneity Dimensions 2-D:3-D 3-D • The homogeneity within the ROI in an MRI volume.
• Correlation Offset Average/Individual Average • The correlation within the ROI in an MRI volume.
• Variance Axis x , y , z z • The variance within the ROI in an MRI volume.
• SumAverage • The SumAverage within the ROI in an MRI volume.
• Variance • The variance within the ROI in an MRI volume.
• Autocorrelation • The AutoCorrelation within the ROI in an MRI volume.
Gray level size-zone matrix (GLSZM)72,74
• SZE Num_Bins N.A. 10 • The “small zone emphasis” within the ROI in an MRI volume.
• LZE Num_Directions 3:13 13 • The “large zone emphasis” within the ROI in an MRI volume.
• GLN Radius N.A. 2 • The “gray-level nonuniformity” within the ROI in an MRI volume.
• ZSN Dimensions 2-D:3-D 3-D • The “zone-size nonuniformity” within the ROI in an MRI volume.
• ZP Axis x , y , z z • The “zone percentage” within the ROI in an MRI volume.
• LGZE Distance_Range 1:5 4 • The “low gray-level zone emphasis” within the ROI in an MRIvolume.
• HGZE • The “high gray-level zone emphasis” within the ROI in an MRIvolume.
• SZLGE • The “small zone low gray-level emphasis” within the ROI in an MRIvolume.
• SZHGE • The “small zone high gray-level emphasis” within the ROI in an MRIvolume.
• LZLGE • The “large zone low gray-level emphasis” within the ROI in an MRIvolume.
• LZHGE • The “large zone high gray-level emphasis” within the ROI in an MRIvolume.
• GLV • The “gray-level variance” within the ROI in an MRI volume.
• ZSV • The “zone-size variance” within the ROI in an MRI volume.
Volumetric features70,71
• Volume/area Dimensions 2-D:3-D 3-D • Size of ROI in terms of number of voxels.
Axis x , y , z z
LBP75
Radius N.A. N.A. The LBP codes are computed using N sampling points on a circle ofcertain radius and using mapping table.Neighborhood 2:4:8 8
Neighborhood gray-tone difference matrix (NGTDM)76
• Coarseness Num_Bins N.A. 10 • The coarseness within the ROI in an MRI volume.
Journal of Medical Imaging 011018-18 Jan–Mar 2018 • Vol. 5(1)
Davatzikos et al.: Cancer imaging phenomics toolkit: quantitative imaging analytics. . .
Downloaded From: https://www.spiedigitallibrary.org/journals/Journal-of-Medical-Imaging on 2/24/2018 Terms of Use: https://www.spiedigitallibrary.org/terms-of-use
The software tool is very well-structured, with different tabsfor preprocessing and applications, which allow the user to nav-igate easily and efficiently. Interactive tools are available toannotate anatomical regions or lesions, and images can besaved and shared.
The documentation that comes along with CaPTk package isdetailed and well-organized, and step by step instructions areavailable for all the applications. CaPTk also provides a linkto download sample data, so users can become familiar withthe different applications, as well as with the mechanics ofthe software to run those applications.
What I would suggest though that the tool could be runby technologists that do postprocessing for more routine imag-ing studies (e.g., CT angiography), then the results would bemade accessible to clinicians for making patient managementdecisions.
Appendix D: Authors’ Discussion about theClinician’s OpinionWe appreciate the valuable feedback provided by Dr. MichelBilello about CaPTk. Such positive feedback of our softwareby the clinicians is very encouraging and will help improvethe quality of the software and to seamlessly integrate it inthe clinical workflow. In fact, most of the modules of CaPTkwere developed in very close collaboration with various clini-cians at Penn (Neurosurgeons, Radiation Oncologists,Oncologists, and Radiologists), therefore can be readily usedin clinical settings. This makes CaPTk a unique software thathas significant clinical impact.
We appreciate the concern raised by Michel Bilello that thesoftware is not meant to be used by the clinician rather theresults generated by the software (such as glioblastoma recur-rence probability maps, survival prediction, and breast densityestimation) can be used. We strongly agree with Dr. Bilello thatthere should be a team of technologists that do preprocessingand acquire results, which would then be used by the clinicianin the decision-making process.
DisclosuresThe authors have no relevant conflicts of interest to disclose.
AcknowledgmentsCaPTk is supported by NCI/NIH ITCR program with awardnumber U24CA189523. Additional work has been supportedby NIH Grant Nos. R01NS042645, R01NS096606, andR01CA197000.
References1. H. J. Aerts, “The potential of radiomic-based phenotyping in precision
medicine: a review,” JAMA Oncol. 2(12), 1636–1642 (2016).2. J. P. O’Connor et al., “Imaging biomarker roadmap for cancer studies,”
Nat. Rev. Clin. Oncol. 14(3), 169–186 (2017).3. H. Akbari et al., “Imaging surrogates of infiltration obtained via
multiparametric imaging pattern analysis predict subsequent locationof recurrence of glioblastoma,” Neurosurgery 78(4), 572–580 (2016).
4. L. Macyszyn et al., “Imaging patterns predict patient survival andmolecular subtype in glioblastoma via machine learning techniques,”Neuro-Oncology 18(3), 417–425 (2016).
5. A. Gooya et al., “GLISTR: glioma image segmentation and registra-tion,” IEEE Trans. Med. Imaging 31(10), 1941–1954 (2012).
6. A. Gooya, G. Biros, and C. Davatzikos, “Deformable registration ofglioma images using EM algorithm and diffusion reaction modeling,”IEEE Trans. Med. Imaging 30(2), 375–390 (2011).
7. C. Hogea, C. Davatzikos, and G. Biros, “Brain-tumor interaction bio-physical models for medical image registration,” SIAM J. Sci. Comput.30(6), 3050–3072 (2008).
8. C. Hogea, C. Davatzikos, and G. Biros, “An image-driven parameterestimation problem for a reaction-diffusion glioma growth model withmass effects,” J. Math. Biol. 56(6), 793–825 (2008).
9. A. Gastounioti, E. F. Conant, and D. Kontos, “Beyond breast density:a review on the advancing role of parenchymal texture analysis in breastcancer risk assessment,” Breast Cancer Res. 18(1), 91 (2016).
10. S. Bakas et al., “In vivo detection of EGFRvIII in glioblastoma via per-fusion magnetic resonance imaging signature consistent with deep peri-tumoral infiltration: the φ index,” Clin. Cancer Res. 23(16), 4724–4734(2017).
11. S. Bakas et al., “Highly-expressed wild-type EGFR and EGFRvIIImutant glioblastomas have similar MRI signature, consistent with deepperitumoral infiltration,” Neuro-Oncology 18(6), vi125–vi126 (2016).
12. S. Bakas et al., “Identification of imaging signatures of the epidermalgrowth factor receptor variant III (EGFRvIII) in glioblastoma,” Neuro-Oncology 17(5), v154 (2015).
13. A. Ashraf et al., “Breast DCE-MRI kinetic heterogeneity tumor mark-ers: preliminary associations with neoadjuvant chemotherapy response,”Transl. Oncol. 8(3), 154–162 (2015).
14. C. Davatzikos, “cancer imaging phenomics toolkit (CaPTk) (01December 2017).
15. S. Bakas et al., “Segmentation of gliomas in multimodal magnetic res-onance imaging volumes based on a hybrid generative-discriminativeframework,” in Proc. of the Multimodal Brain Tumor ImageSegmentation Challenge (BRATS), pp. 5–12 (2015).
16. S. Bakas et al., “GLISTRboost: combining multimodal MRI segmen-tation, registration, and biophysical tumor growth modeling with gra-dient boosting machines for glioma segmentation,” Lect. Notes Comput.Sci. 9556, 144–155 (2016).
17. ITK-SNAP, http://www.itksnap.org/pmwiki/pmwiki.php (14 November2014).
18. S. Bakas et al., “Advancing the cancer genome atlas glioma MRI col-lections with expert segmentation labels and radiomic features,” Sci.Data 4, 170117 (2017).
19. K. Zeng et al., “Segmentation of gliomas in pre-operative and post-operative multimodal magnetic resonance imaging volumes based on
Table 9 (Continued).
Specific features Parameters Range Default Description
• Busyness Num_Directions 3:13 13 • The busyness within the ROI in an MRI volume.
• Contrast Dimensions 2-D:3-D 3-D • The contrast within the ROI in an MRI volume.
• Complexity Axis x , y , z N.A. • The complexity within the ROI in an MRI volume.
• Strength Distance_Range 1:5 1 • The strength within the ROI in an MRI volume.
Note: GLCM, GLRLM, and GLSZM are estimated within the ROI in an image, considering 26-connected neighboring voxels in the 3-D volume.
Journal of Medical Imaging 011018-19 Jan–Mar 2018 • Vol. 5(1)
Davatzikos et al.: Cancer imaging phenomics toolkit: quantitative imaging analytics. . .
Downloaded From: https://www.spiedigitallibrary.org/journals/Journal-of-Medical-Imaging on 2/24/2018 Terms of Use: https://www.spiedigitallibrary.org/terms-of-use
a hybrid generative-discriminative framework,” Lect. Notes Comput.Sci. 10154, 184–194 (2017).
20. M. Bergman, “CBICA Image processing portal,” (20 March 2017).21. J. H. Friedman, “Stochastic gradient boosting,” Comput. Stat. Data
Anal. 38(4), 367–378 (2002).22. J. H. Friedman, “Greedy function approximation: a gradient boosting
machine,” Ann. Stat. 29, 1189–1232 (2001).23. S. Bakas et al., “Fast semi-automatic segmentation of focal liver lesions
in contrast-enhanced ultrasound, based on a probabilistic model,”Comput. Meth. Biomech. Biomed. Eng. 5(5), 329–338 (2017).
24. M. Bilello et al., “Population-based MRI atlases of spatial distributionare specific to patient and tumor characteristics in glioblastoma,”Neuroimage Clin. 12, 34–40 (2016).
25. A. B. Ashraf et al., “Identification of intrinsic radio-phenotypes forbreast cancer tumors: preliminary associations with gene expressionprofiles,” Radiology 272(2), 374–384 (2014).
26. H. Akbari et al., “Pattern analysis of dynamic susceptibility contrastMRI reveals peritumoral tissue heterogeneity,” Radiology 273(2),502–510 (2014).
27. B. M. Ellingson et al., “Probabilistic radiographic atlas of glioblastomaphenotypes,” Am. J. Neuroradiol. 34(3), 533–540 (2013).
28. R. T. Shinohara et al., “Statistical normalization techniques for magneticresonance imaging,” Neuroimage 6, 9–19 (2014).
29. L. G. Nyul, J. K. Udupa, and X. Zhang, “New variants of a method ofMRI scale standardization,” IEEE Trans. Med. Imaging 19(2), 143–150(2000).
30. Y. Ou et al., “Deformable registration for quantifying longitudinal tumorchanges during neoadjuvant chemotherapy,” Magn. Reson. Med. 73(6),2343–2356 (2015).
31. Deformable Registration via Attribute Matching and Mutual-SaliencyWeighting (DRAMMS), http://www.med.upenn.edu/sbia/dramms.html(01 December 2017).
32. Y. Ou et al., “DRAMMS: deformable registration via attribute matchingand mutual-saliency weighting,” Med. Image Anal. 15(4), 622–639(2011).
33. S. Rathore et al., “Imaging pattern analysis reveals three distinct phe-notypic subtypes of GBM with different survival rates,” Neuro-Oncology 18(Suppl. 6), vi128 (2016).
34. Z. A. Binder et al., “Extracellular EGFR289 activating mutations conferpoorer survival and suggest enhanced motility in primary GBMs,”Neuro-Oncology 18(Suppl. 6), vi105–vi106 (2016).
35. S. Rathore et al., “Radiologic subtypes of glioblastoma calculated viamulti-parametric imaging signatures reveal complementary informationto current who classification,” Neuro-Oncology 19(Suppl. 6), vi155–vi156 (2017).
36. H. Itakura et al., “Magnetic resonance image features identify glioblas-toma phenotypic subtypes with distinct molecular pathway activities,”Sci. Transl. Med. 7(303), 303ra138 (2015).
37. B. M. Keller et al., “Preliminary evaluation of the publicly availableLaboratory for Breast Radiodensity Assessment (LIBRA) softwaretool: comparison of fully automated area and volumetric density mea-sures in a case-control study with digital mammography,” BreastCancer Res. 17(1), 117 (2015).
38. Y. Zheng et al., “Parenchymal texture analysis in digital mammography:a fully automated pipeline for breast cancer risk assessment,” Med.Phys. 42(7), 4149–4160 (2015).
39. H. Li et al., “Unsupervised machine learning of radiomic features forpredicting treatment response and survival of early-stage non-small celllung cancer patients treated with stereotactic body radiation therapy,” inAnnual Meeting of the American Society for Radiation Oncology(ASTRO), (Oral Presentation) (2017).
40. B. Tunc et al., “Individualized map of white matter pathways: connec-tivity-based paradigm for neurosurgical planning,” Neurosurgery 79(4),568–577 (2016).
41. J. Lecoeur et al., “Improving white matter tractography by resolving thechallenges of edema,” in MICCAI Workshop: DTI Challenge, Nagoya(2013).
42. J. Lecoeur et al., “Addressing the challenge of edema in fiber tracking,”in Medical Image Computing and Computer-Assisted Intervention(MICCAI), DTI Tractography Challenge, Boston, Massachusetts (2014).
43. B. Tunc et al., “Automated tract extraction via atlas based adaptive clus-tering,” Neuroimage 102, 596–607 (2014).
44. A. Brun et al., “Clustering fiber traces using normalized cuts,” Lect.Notes Comput. Sci. 3216, 368–375 (2004).
45. M. Liu, B. C. Vemuri, and R. Deriche, “Unsupervised automatic whitematter fiber clustering using a Gaussian mixture model,” in Proc. ofIEEE Int. Symp. on Biomedical Imaging, pp. 522–525 (2012).
46. M. Maddah et al., “A unified framework for clustering and quantitativeanalysis of white matter fiber tracts,” Med. Image Anal. 12, 191–202(2008).
47. L. J. O’Donnell et al., “A method for clustering white matter fibertracts,” Am. J. Neuroradiol. 27(5), 1032–1036 (2006).
48. Q. Wang et al., “Hierarchical fiber clustering based on multi-scaleneuroanatomical features,” in Proc. of the 5th Int. Conf. on MedicalImaging and Augmented Reality, pp. 448–456, Springer-Verlag (2010).
49. D. Wassermann et al., “Unsupervised white matter fiber clusteringand tract probability map generation: applications of a Gaussian processframework for white matter fibers,” Neuroimage 51(1), 228–241 (2010).
50. B. M. Keller et al., “Parenchymal texture analysis in digital mammog-raphy: robust texture feature identification and equivalence across devi-ces,” J. Med. Imaging 2(2), 024501 (2015).
51. B. M. Keller et al., “Estimation of breast percent density in raw andprocessed full field digital mammography images via adaptive fuzzyc-means clustering and support vector machine segmentation,” Med.Phys. 39(8), 4903–4917 (2012).
52. S. M. Smith and J. M. Brady, “SUSAN—a new approach to low levelimage processing,” Int. J. Comput. Vision 23(1), 45–78 (1997).
53. J. M. Bland and D. G. Altman, “The logrank test,” Br. Med. J.328(7447), 1073–1073 (2004).
54. N. M. Hylton et al., “Neoadjuvant chemotherapy for breast cancer: func-tional tumor volume by MR imaging predicts recurrence-free survival-results from the ACRIN 6657/CALGB 150007 I-SPY 1 TRIAL,”Radiology 279(1), 44–55 (2016).
55. H. Uno et al., “On the C-statistics for evaluating overall adequacy of riskprediction procedures with censored survival data,” Stat. Med. 30(10),1105–1117 (2011).
56. B. Solmaz et al., “Assessing connectivity related injury burden indiffuse traumatic brain injury,” Hum. Brain Mapp. 38(6), 2913–2922(2017).
57. R. G. Verhaak et al., “Integrated genomic analysis identifies clinicallyrelevant subtypes of glioblastoma characterized by abnormalities inPDGFRA, IDH1, EGFR, and NF1,” Cancer Cell 17(1), 98–110 (2010).
58. A. B. Ashraf et al., “A multichannel Markov random field approach forautomated segmentation of breast cancer tumor in DCE-MRI data usingkinetic observation model,” Lect. Notes Comput. Sci. 6893, 546–553(2011).
59. S. Paik et al., “Gene expression and benefit of chemotherapy in womenwith node-negative, estrogen receptor-positive breast cancer,” J. Clin.Oncol. 24(23), 3726–3734 (2006).
60. L. R. Arlinghaus et al., “Current and future trends in magnetic resonanceimaging assessments of the response of breast tumors to neoadjuvantchemotherapy,” J. Oncol. 2010, 1–17 (2010).
61. P. Cortazar et al., “Pathological complete response and long-term clini-cal benefit in breast cancer: the CTNeoBC pooled analysis,” Lancet384(9938), 164–172 (2014).
62. J. White and A. DeMichele, “Neoadjuvant therapy for breast cancer:controversies in clinical trial design and standard of care,” Am. Soc.Clin. Oncol. Educ. Book 35, e17–e23 (2015).
63. V. Dialani, T. Chadashvili, and P. J. Slanetz, “Role of imaging in neo-adjuvant therapy for breast cancer,” Ann. Surg. Oncol. 22(5), 1416–1424 (2015).
64. A. Esposito, C. Criscitiello, and G. Curigliano, “Highlights from the 14(th) St Gallen International Breast Cancer Conference 2015 in Vienna:dealing with classification, prognostication, and prediction refinementto personalize the treatment of patients with early breast cancer,”Ecancermedicalscience 9, 518 (2015).
65. N. M. Hylton et al., “Locally advanced breast cancer: MR imaging forprediction of response to neoadjuvant chemotherapy—results fromACRIN 6657/I-SPY TRIAL,” Radiology 263(3), 663–672 (2012).
66. G. von Minckwitz et al., “Response-guided neoadjuvant chemotherapyfor breast cancer,” J. Clin. Oncol. 31(29), 3623–3630 (2013).
67. G. Lee et al., “Radiomics and its emerging role in lung cancer research,imaging biomarkers and clinical management: state of the art,” Eur. J.Radiol. 86, 297–307 (2017).
Journal of Medical Imaging 011018-20 Jan–Mar 2018 • Vol. 5(1)
Davatzikos et al.: Cancer imaging phenomics toolkit: quantitative imaging analytics. . .
Downloaded From: https://www.spiedigitallibrary.org/journals/Journal-of-Medical-Imaging on 2/24/2018 Terms of Use: https://www.spiedigitallibrary.org/terms-of-use
68. M. Scrivener et al., “Radiomics applied to lung cancer: a review,”Transl. Cancer Res. 5(4), 398–409 (2016).
69. CBICA: Cancer Imaging Phenomics Toolkit (CaPTk), https://www.nitrc.org/docman/?group_id=1059 (01 December 2017).
70. G. Thibault et al., “Shape and texture indexes application to cell nucleiclassification,” Int. J. Pattern Recognit. Artif. Intell. 27, 1357002(2013).
71. M. Vallières et al., “A radiomics model from joint FDG-PET and MRItexture features for the prediction of lung metastases in soft-tissue sar-comas of the extremities,” Phys. Med. Biol. 60(14), 5471–5496 (2015).
72. M. M. Galloway, “Texture analysis using grey level run lengths,”Comput. Graphics Image Process. 4, 172–179 (1975).
73. R. M. Haralick, K. Shanmugam, and I. H. Dinstein, “Textural featuresfor image classification,” IEEE Trans. Syst. Man Cybern. 3(6), 610–621(1973).
74. X. Tang, “Texture information in run-length matrices,” IEEE Trans.Image Process. 7(11), 1602–1609 (1998).
75. T. Ojala, M. Pietikainen, and T. Maenpaa, “Multiresolution gray-scaleand rotation invariant texture classification with local binary patterns,”IEEE Trans. Pattern Anal. Mach. Intell. 24(7), 971–987 (2002).
76. M. Amadasun and R. King, “Textural features corresponding to texturalproperties,” IEEE Trans. Syst. Man Cybern. 19(5), 1264–1274 (1989).
Biographies for the authors are not available.
Journal of Medical Imaging 011018-21 Jan–Mar 2018 • Vol. 5(1)
Davatzikos et al.: Cancer imaging phenomics toolkit: quantitative imaging analytics. . .
Downloaded From: https://www.spiedigitallibrary.org/journals/Journal-of-Medical-Imaging on 2/24/2018 Terms of Use: https://www.spiedigitallibrary.org/terms-of-use