Caltrain Short‐Range Transit Plan: FY2018‐2027
107
Caltrain Short‐Range Transit Plan: FY2018‐2027 Adopted by Peninsula Corridor Joint Powers Board June 6, 2019
Transcript of Caltrain Short‐Range Transit Plan: FY2018‐2027
Caltrain Short‐Range Transit Plan: FY2018‐2027
Adopted by Peninsula Corridor Joint Powers Board
June 6, 2019

CALTRAIN SRTP FY2018‐2027 ii
Caltrain Short Range Transit Plan ‐ Fiscal Years 2018 to 2027 Draft Plan Submitted to the Metropolitan Transportation Commission March 2019. Final Plan adopted by the Peninsula Corridor Joint Powers Board and submitted to the Metropolitan Transportation Commission in June 2019. Federal transportation statutes require that the Metropolitan Transportation Commission (MTC), in partnership with state and local agencies, develop and periodically update a long‐range Regional Transportation Plan (RTP), and a Transportation Improvement Program (TIP) which implements the RTP by programming federal funds to transportation projects contained in the RTP. In order to effectively execute these planning and programming responsibilities, MTC requires that each transit operator in its region which receives federal funding through the TIP, prepare, adopt, and submit to MTC a Short Range Transit Plan (SRTP).
CALTRAIN SRTP FY2018‐2027 ii
ACKNOWLEDGEMENTS
Board of Directors 2019 Cheryl Brinkman Jeannie Bruins Cindy Chavez Ron Collins Devora Davis Gillian Gillett (Chair) Dave Pine Charles Stone Shamann Walton
Executive Director Jim Hartnett
Executive Team Michelle Bouchard, Chief Operating Officer, Rail April Chan, Chief Officer, Planning, Grants and Transportation Authority John Funghi, Chief Officer, Caltrain Modernization Program Derek Hansel, Chief Financial Officer Carter Mau, Deputy Executive Director Seamus Murphy, Chief Communications Officer David Olmeda, Chief Operating Officer, Bus
Technical Staff Melissa Jones, Principal Planner Josh Averill, Program Management Administrator Stacy Cocke, Deputy Director, Program Management & Environmental Compliance Catherine David, Principal Planner Yu Hanakura, Senior Planner Cannon Han, Title VI Officer Ryan Hinchman, Manager, Financial Planning and Analysis Sebastian Petty, Director, Policy Development Melissa Reggiardo, Acting Manager, Caltrain Planning Peter Skinner, Manager, Grant and Funding Programs Michael Stevenson, Associate Operations Contract Administrator Consultant Support Lindsey Kiner – Principal, LK Planning Shannon Gaffney – Northern California Operations Manager, HNTB Caltrain 1250 San Carlos Avenue San Carlos, California 94087 www.caltrain.com

CALTRAIN SRTP FY2018‐2027 iii
Table of Contents Executive Summary ................................................................................................................................. 1
Policy Context ............................................................................................................................................................ 1
Relationship to the Caltrain Business Plan ................................................................................................................ 1
Caltrain Modernization .............................................................................................................................................. 2
Operational Challenges ............................................................................................................................................. 2
Operating Plan and Budget ....................................................................................................................................... 3
Capital Improvement Plan ......................................................................................................................................... 3
1 Overview of the Transit System ............................................................................................................................ 4
1.1 Brief History ................................................................................................................................................. 4
1.2 Governance .................................................................................................................................................. 6
1.2.1 Board of Directors .................................................................................................................................... 6
1.2.2 Advisory Committees ............................................................................................................................... 7
1.3 The Organization .......................................................................................................................................... 8
1.3.1 Staffing ................................................................................................................................................... 10
1.4 Description of Services and Service Area ................................................................................................... 11
1.4.1 Rail Service ............................................................................................................................................. 11
1.4.2 Caltrain Shuttle Services ........................................................................................................................ 14
1.4.3 Other Shuttle Services ........................................................................................................................... 14
1.4.4 Demand Responsive Services ................................................................................................................ 14
1.4.5 Connecting Services ............................................................................................................................... 15
1.5 Fare Structure ............................................................................................................................................ 16
1.5.1 Inter‐Operator Fare Structures and Agreements .................................................................................. 19
1.6 Revenue Fleet ............................................................................................................................................. 20
1.7 Work Locomotives and Non‐Revenue Rolling Stock ................................................................................... 21
1.1.1 Equipment and Facility Deficiencies ...................................................................................................... 22
1.8 Description of Existing Facilities ................................................................................................................. 22
1.8.1 Administrative ....................................................................................................................................... 22
1.8.2 Maintenance and Fueling ...................................................................................................................... 23
1.8.3 Vehicle Storage ...................................................................................................................................... 23
1.8.4 Station Facilities ..................................................................................................................................... 23
1.8.5 Track and Rights‐of‐Way ........................................................................................................................ 24
1.8.6 Bicycle Facilities and Access ................................................................................................................... 24
2 Goals, Objectives and Standards ......................................................................................................................... 31
2.1 Description and Process ............................................................................................................................. 31

CALTRAIN SRTP FY2018‐2027 iv
2.2 The Caltrain Vision and Focus Areas .......................................................................................................... 31
2.3 Vision .......................................................................................................................................................... 32
2.4 Focus Areas ................................................................................................................................................ 32
3 Service and System Evaluation ............................................................................................................................ 41
3.1 Performance Standards .............................................................................................................................. 41
3.2 Transit Sustainability Project ...................................................................................................................... 41
3.2.1 Caltrain TSP Strategies ........................................................................................................................... 42
3.3 Performance Evaluation ............................................................................................................................. 43
3.3.1 Average Weekday Ridership .................................................................................................................. 47
3.3.2 On‐Time Performance and Customer Satisfaction ................................................................................ 48
3.3.3 Farebox Recovery Ratio ......................................................................................................................... 50
3.3.4 Operating Costs per Revenue Hour ....................................................................................................... 51
3.3.5 Operating Costs Per Passenger .............................................................................................................. 52
3.3.6 Operating Costs Per Passenger Mile ...................................................................................................... 53
3.4 Equipment and Facility Deficiencies........................................................................................................... 53
3.5 Community‐Based Transportation Plans.................................................................................................... 54
3.6 Paratransit Services .................................................................................................................................... 54
3.7 Title VI Report Summary ............................................................................................................................ 54
3.8 FTA’s Triennial Review Summary ............................................................................................................... 55
4 Operating Plan and Budget ................................................................................................................................. 59
4.1 Service Plan ................................................................................................................................................ 59
4.1.1 Weekday Service .................................................................................................................................... 59
4.1.2 Weekend Service and Special Event Service .......................................................................................... 62
4.2 Caltrain‐Sponsored Shuttle Service ............................................................................................................ 62
4.3 Caltrain Operating Budget ......................................................................................................................... 63
4.3.1 Operating Budget Assumptions ............................................................................................................. 64
5 Capital Improvement Program ............................................................................................................................ 70
5.1 Capital Projects .......................................................................................................................................... 70
5.1.1 State of Good Repair and Contingency Program ................................................................................... 71
5.1.2 Safety/Security and Legal Mandates Program....................................................................................... 72
5.1.3 Peninsula Corridor Electrification Project .............................................................................................. 73
5.1.4 Positive Train Control ............................................................................................................................ 73
5.1.5 Electrification Expansion Project ........................................................................................................... 73
5.1.6 South San Francisco Station Improvement Project ............................................................................... 74
5.1.7 25th Avenue Grade Separation ............................................................................................................. 74
5.2 CIP Funding Assumptions ........................................................................................................................... 74
CALTRAIN SRTP FY2018‐2027 v
5.2.1 State of Good Repair .............................................................................................................................. 75
5.2.2 Peninsula Corridor Electrification Project .............................................................................................. 75
5.2.3 Positive Train Control ............................................................................................................................ 75
5.3 Funding Sources ......................................................................................................................................... 76
5.3.1 Federal Funding ..................................................................................................................................... 76
5.3.2 State Funding ......................................................................................................................................... 77
5.3.3 Local Funding Sources ............................................................................................................................ 79
6 Other Improvements ........................................................................................................................................... 83
6.1 Resolution 3434 ......................................................................................................................................... 83
6.1.1 Peninsula Corridor Electrification Program ........................................................................................... 84
6.1.2 Title VI and Environmental Justice ......................................................................................................... 87
7 Appendix A: Caltrain Locomotive and Passenger Car Inventory ........................................................................ 88
CALTRAIN SRTP FY2018‐2027 i
List of Tables and Figures Table 1‐1: Caltrain Fare Structure, Effective October 1, 2017 ..................................................................................... 17 Table 1‐2: Caltrain Fleet Inventory .............................................................................................................................. 21 Table 1‐3: Overview of Amenities at Each Station Location ........................................................................................ 27 Table 3‐1: Caltrain Performance Standards and Goals ................................................................................................ 41 Table 3‐2: Caltrain TSP Performance (FY2015‐FY2017) ............................................................................................... 42 Table 3‐3: Five‐Year Caltrain Performance Trends (FY2013‐FY2017) .......................................................................... 45 Table 3‐4: FTA Triennial Review Summary of Deficiencies and Corrective Actions .................................................... 57 Table 4‐1: Caltrain 10‐Year Service Plan ...................................................................................................................... 61 Table 4‐2: Caltrain Shuttle 10‐year Service Plan .......................................................................................................... 63 Table 4‐3: Caltrain 10‐Year Operations Financial Plan with Past Actuals (YOE$, in Millions) ...................................... 68 Table 5‐1: Caltrain 10‐Year Capital Improvement Program (FY18‐2027) .................................................................... 81 Table 6‐1: Peninsula Corridor Electrification Program Schedule ................................................................................. 85 Table 6‐2: Peninsula Corridor Electrification Program Cost ........................................................................................ 86 Table 6‐3: Peninsula Corridor Electrification Program Estimate to Complete ............................................................ 86 Table 6‐4: Peninsula Corridor Electrification Program Funding by Source .................................................................. 87 Table 7‐1: Caltrain Fleet Configuration – Locomotives ................................................................................................ 89 Table 7‐2: Caltrain Fleet Configuration – Passenger Cars ............................................................................................ 91 Table 7‐3: Caltrain Fleet Configuration – Non‐Revenue Vehicles ............................................................................... 96
Figure 1‐1: Joint Power Board Organizational Chart ..................................................................................................... 9 Figure 1‐2: Caltrain System Map ................................................................................................................................. 12 Figure 3‐1: Average Weekday Ridership, 2013‐2017 .................................................................................................. 47 Figure 3‐2: On‐Time Performance (End‐to‐End), FY 2013‐2017 .................................................................................. 48 Figure 3‐3: Surveyed Overall Customer Satisfaction, FY2013‐2017 ............................................................................ 49 Figure 3‐4: Farebox Recovery Ratio, FY2013‐2017 ...................................................................................................... 50 Figure 3‐5: Operating Costs Per Revenue Hour, FY2013‐2017 (in 2011 dollars) ......................................................... 51 Figure 3‐6: Operating Costs Per Passenger, FY2013‐2017 (in 2011 dollars) ................................................................ 52 Figure 3‐7: Operating Costs Per Passenger Mile, FY2013‐2017 (in 2011 dollars) ........................................................ 53

CALTRAIN SRTP FY2018‐2027 ii
Abbreviations and Acronyms ACE Altamont Corridor Express
ADA Americans with Disabilities Act
BAAQMD Bay Area Air Quality Management District
BART Bay Area Rapid Transit
CalMod Caltrain Modernization Program
CARB California Air Resources Board
CBTP Community Based Transportation Plan
CCTV Closed‐circuit Television
CEMOF Central Equipment and Maintenance Facility
CHSRA California High Speed Rail Authority
CIP Capital Improvement Program
CMAQ Congestion Mitigation and Air Quality Improvement Program
CPUC California Public Utilities Commission
District Sam Mateo County Transit District
EMU Electric Multiple Unit
FEIR Final Environmental Impact Report
FFGA Full Funding Grant Agreement
FHWA Federal Highway Administration
FRA Federal Railroad Administration
FTA Federal Transit Administration
FY Fiscal
Hz Hertz
IBEW International Brotherhood of Electrical Workers
JPA Joint Powers Authority
JPB Peninsula Corridor Joint Powers Board
kV / KWh kilovolt / kilowatt‐hour
LAP Language Assistance Plan

CALTRAIN SRTP FY2018‐2027 iii
LCTOP Low Carbon Transportation Operations Funding
LEP Limited English Proficient
MAP‐21 Moving Ahead for Progress in the 21st Century Act
MOU Memorandum of Understanding
MTC Metropolitan Transportation Commission
Muni San Francisco Municipal Railway
NTD National Transit Database
NTSB National Transportation Safety Board
OCS Overhead Contact System
PCEP Peninsula Corridor Electrification Project
PLA Project Labor Agreement
PTC Positive Train Control
SB Senate Bill
SCCTD Santa Clara County Transit District
SFMTA San Francisco Municipal Railway
SMCTA San Mateo County Transportation Authority
SOGR State of Good Repair
SRA State Rail Assistance
SRTP Short Range Transit Plan
STP Surface Transportation Program
TASI TransitAmerica Services, Inc.
TIRCP Transit and Intercity Rail Capital Program
TPS Traction Power Substations
TSA Transportation Security Administration
TSP Transit Sustainability Project
TVM Ticket Vending Machine
VTA Santa Clara Valley Transportation Authority
YOE Year of Expenditure

Executive Summary
CALTRAIN SRTP FY2018‐2027 1
Executive Summary
The following document is a full update of the Caltrain 10‐Year Short Range Transit Plan (SRTP) for fiscal
years (FY) 2018‐2027 produced by the Peninsula Corridor Joint Powers Board (JPB), the entity that owns
and operates the Caltrain commuter rail service. The Executive Summary provides an introductory
summary of the SRTP, discussing Caltrain’s major programs and challenges and highlighting the 10‐year
operating plan and 10‐year capital improvement program (CIP).
Policy Context This SRTP follows a set of guidelines prescribed by the Metropolitan Transportation Commission (MTC).
SRTPs serve as a management and policy document for Caltrain, as well as a means of providing FTA and
MTC with the information necessary to meet regional fund programming and planning requirements. It
provides an overview of the transit system, goals and performance measures, information on service and
system evaluation, and the JPB’s operating and capital investment plan across a 10‐year planning horizon.
This document complies with SRTP requirements per MTC Resolution No. 4276, the Commission’s most
recently‐adopted (2017) resolution for SRTPs at the time of developing this document for Caltrain.
Relationship to the Caltrain Business Plan It is important to note that this is the first update to the SRTP that MTC has required Caltrain to produce
since 2015. In spring of 2019, the agency completed this updated SRTP while simultaneously proceeding
with development of the Caltrain Business Plan, an effort to establish a long‐range service vision for the
railroad. The extensive planning process for the Caltrain Business Plan commenced in 2018 and is
anticipated to be completed by the end of 2019. Once adopted by the Caltrain Board of Directors, the
Business Plan will largely supersede this SRTP and will serve as the record of Caltrain’s plans going forward.
The completed Caltrain Business Plan will identify a service vision for the railroad through 2040, including
train service patterns, infrastructure needs, and estimated costs and outcomes. Overall, it will identify a
broader range of choices, services, investments, and changes available to Caltrain. It will also include a
business case for the service vision and an implementation plan for achieving it.
Overall, this SRTP reflects a baseline, “stay the course” approach to Caltrain’s future – both in terms of
the services and projects described as well as the projections of revenues and costs. This update to the
SRTP was required to be completed before the process for developing the Caltrain Business Plan could be

Executive Summary
CALTRAIN SRTP FY2018‐2027 2
concluded. Therefore, this document serves to meet MTC’s requirements by providing an update to
Caltrain’s 2015 SRTP; it is consistent with existing Board‐adopted plans and policies as well as the agency’s
most recently published information on capital and operating plans as of spring 2019, including the JPB’s
FY2020 Operating Budget. This SRTP’s 10‐Year Capital Improvement Plan represents the unconstrained
needs of the railroad from FY2020 forward; however, each year, the JPB must adopt a fiscally constrained
capital budget, including a $45 million capital budget for FY2020.
Caltrain Modernization Both the SRTP and the Caltrain Strategic Plan are structured around the Caltrain Modernization Program
(CalMod). Collectively, CalMod encompasses the delivery of a $1.98 billion package of infrastructure
projects to the Caltrain system by FY2022. The CalMod program is codified and funded through a 9‐party
Memorandum of Understanding that was signed by the JPB, the California High Speed Rail Authority
(CHSRA), MTC, and other regional entities in 2012, as well as a 7‐party supplement signed in 2016. This
project is also included in the MTC Regional Transit Expansion Program (Resolution 3434) that was adopted
in 2001 and amended in 2008.
By FY2022, the Caltrain Modernization Program will electrify and upgrade the performance, operating
efficiency, capacity, safety, and reliability of Caltrain’s commuter rail service through the delivery of
several key projects. This project includes the electrification of the existing Caltrain corridor between San
Francisco and San Jose (also known as PCEP, the Peninsula Corridor Electrification Project) and the
replacement of a majority of Caltrain’s diesel trains with high‐performance electric trains called Electric
Multiple Units (EMUs).
Operational Challenges Today, Caltrain operates a total of 92 diesel locomotive‐hauled trains per day on the weekdays between
San Francisco and San Jose with limited service further south to Gilroy. Over the 10‐year timeframe
addressed in the SRTP, Caltrain will expand its service to 114 trains per weekday day using a mixed fleet
of diesel locomotive‐hauled rolling stock and new EMU trains. This shift poses both a tremendous
opportunity and challenge that underlies the agency’s operational planning across the coming 10 years.
Caltrain has experienced rapid ridership growth and many of its peak‐hour trains currently operate near,
at, or above their seated capacity. Meeting growing customer demand while maintaining a high standard
Executive Summary
CALTRAIN SRTP FY2018‐2027 3
of safe, reliable, and comfortable service is the preeminent operational challenge over the time horizon
of the SRTP. It is anticipated that this challenge will be especially acute during the primary electrification
construction period (through FY2021) when Caltrain will need to maintain reliable service in the midst of
a corridor‐wide construction project. Caltrain will also need to ensure its operational integrity by evolving
its organization to operate and maintain an expanded, electrified system.
Operating Plan and Budget The 10‐year Operating Plan assumes Caltrain will operate a 92‐train weekday schedule with its current
service pattern through FY2022 with only minor schedule modifications. In FY2022, following the
implementation of the Peninsula Corridor Electrification Project, Caltrain will significantly modify its
weekday service, adding 22 additional trains per day and increasing service frequencies during the
commute periods and the midday hours. This service plan is discussed in more detail in Chapter 4.
The 10‐year Financial Plan shows a deficit in FY2019 through FY2027, with operating and maintenance
costs exceeding revenues from fares, partner contributions, and other sources. This occurs because
Caltrain does not have a dedicated source of funding and has an on‐going structural deficit in its operating
budget. Caltrain is currently developing strategies to balance the annual budget through FY2027 and will
comprehensively evaluate a variety of factors that influence the system’s operating deficit. These factors
and strategies include: fare policy and pass programs, a potential three‐county sales tax ballot measure,
increased member agency contributions, increased state funding, and cost containment strategies.
Capital Improvement Plan Caltrain’s 10‐year CIP is a $3 billion program focused on maintaining the JPB’s assets in a state‐of‐good
repair (SOGR), enhancing the reliability of the system, and delivering electrified service from San Francisco
to San Jose by FY2022. Revenue sources included in the CIP reflect Caltrain’s reasonable expectation of
funding levels. Caltrain will, however, continue to work with its funding partners to solidify the Caltrain
10‐year CIP funding plan. Among other options, Caltrain will explore both traditional (e.g., grants) and
innovative funding strategies including the possibility of new public and private partnerships.

Chapter 1: Overview of the Transit System
CALTRAIN SRTP FY2018‐2027 4
1 Overview of the Transit System This chapter provides an overview of the Caltrain system, including: governance, staffing, fare structure,
the revenue fleet, and a description of existing services and station facilities.
1.1 Brief History Railroad service along the San Francisco Peninsula has a long history and has existed, in some form, since
1863. The railroad line, one of the oldest in California, was first proposed in 1851 to connect the booming
trade center of San Francisco and the first state capitol of California, San Jose. By October 1863, regular
service began between San Francisco and Mayfield (now the California Avenue Station in Palo Alto). The
construction of the line to San Jose was completed in January 1864, and two trains began operating daily
between San Francisco and San Jose.
Prior to the JPB’s current ownership, passenger rail ridership on the Peninsula was at its peak in the mid‐
1940s, when more than 9.54 million patrons rode the train annually. However, as the cost of operating
the Peninsula Commuter Rail Service increased and the number of riders began to decline, the former
Southern Pacific Railroad began to phase out its less patronized trains and, by the mid‐1970s sought to
discontinue passenger rail service. After extended negotiations, Southern Pacific, the California
Department of Transportation (Caltrans), and the three counties through which the Peninsula Commute
Service operated (San Francisco, San Mateo, and Santa Clara counties) reached an agreement to preserve
passenger rail service on the Peninsula. Beginning in 1980, Caltrans Rail Management and Rail Operation
branches administered a purchase‐of‐service agreement with Southern Pacific under which Southern
Pacific operated the service, but state and local government agencies subsidized and administered it.
Besides contract administration, Caltrans’ responsibilities included planning, marketing, customer service,
engineering and design, fare and schedule setting, and performance monitoring. The commuter service
was renamed Caltrain.
In 1987, representatives of the City and County of San Francisco, the San Mateo County Transit District
(“District”) and the Santa Clara County Transit District (SCCTD), now the Santa Clara Valley Transportation
Authority (VTA), began the effort to create the Peninsula Corridor Joint Powers Board (JPB) to transfer
administrative responsibility for Caltrain from the state to the local level. In July 1991, a Joint Powers

Chapter 1: Overview of the Transit System
CALTRAIN SRTP FY2018‐2027 5
Agreement, signed by the three parties, stipulated the JPB membership and powers, specified financial
commitments for each member agency, delegated the District as the managing agency, and detailed other
administrative procedures.
The JPB purchased the 51.4‐mile Caltrain right‐of‐way and perpetual trackage rights between San Jose
and Gilroy (known as the Gilroy Extension) from Southern Pacific in December 1991 for a cost of $212
million. In July 1992, District personnel assumed the management and administration of the JPB, and the
JPB assumed ownership of Caltrain, contracting with Amtrak as its operator. Commuter service from
Gilroy began in 1992. Gilroy Extension service is provided on UP‐owned track that is governed by a
trackage rights agreement between UP and the Joint Powers Authority (JPA). This service has a different
cost profile than JPA service between San Jose and San Francisco. The operating deficit for the Gilroy
extension is paid by VTA, since this segment is located wholly within Santa Clara County.
In the 28 years that the JPB has owned Caltrain, ridership has increased nearly 150 percent. In 2002,
Caltrain weekend service was suspended for two years to allow for construction of the CTX project. With
new rolling stock and upgraded infrastructure, the Baby Bullet express service was initiated in June 2004
through support of MTC with the project’s inclusion in the Regional Transit Enhancement Program
(Resolution 3434). Following the start of express service, ridership immediately began to increase.
However, within a year Caltrain was facing financial difficulties and decided to overhaul the entire
schedule and offer more express service to attract additional riders, particularly those making longer trips.
The re‐invention of Caltrain occurred in August 2005 with a decrease of local trains in the peak and a
doubling of express service to 22 Baby Bullet trains a day. Since that point, Caltrain has experienced a
sustained ridership increase and now realizes an average weekday ridership of over 64,000 passengers.
The Caltrain system’s evolution continues today as the corridor modernizes and prepares for future
modernization and blended operations with CHSRA. In 2009, following voter approval of $9 billion to plan
and construct the state’s high‐speed rail system, the Caltrain and the CHSRA began working in partnership
to advance specific improvements and identify design alternatives supporting both high speed rail and
modernized Caltrain service. Since then, plans for HSR service on the Peninsula Corridor have evolved to
reflect the concept of a “blended system” where Caltrain and HSR trains primarily share Caltrain’s existing
tracks on a system that remains substantially within the existing Caltrain corridor. In 2012, MTC, CHSRA,

Chapter 1: Overview of the Transit System
CALTRAIN SRTP FY2018‐2027 6
Caltrain, and six other San Francisco Bay Area funding partners established an agreement to support the
blended system and to move forward with an early investment in the Caltrain Modernization Program. It
is this early investment program that provides the funding for Caltrain’s efforts to deliver modernized,
electrified Caltrain service by FY2022.
1.2 Governance The JPB is a joint powers authority created by agreement pursuant to Government Code Sections 6500 et
seq. The three member agencies of this joint powers authority are: The City and County of San Francisco,
the San Mateo County Transit District (“the District”), and VTA.
1.2.1 Board of Directors The Peninsula Corridor Joint Powers Board includes representatives from San Francisco, San Mateo, and
Santa Clara counties. The JPB consists of nine members, three from each county. The San Francisco
representatives include an appointee from the Mayor’s office, an appointee from the San Francisco
County Board of Supervisors, and an appointee from the San Francisco Municipal Transportation Agency.
The three San Mateo County representatives are all members of the District’s Board of Directors, but
three different appointing authorities designate a representative from the District’s Board, as follows: the
District Board; the San Mateo County Board of Supervisors; and the Cities Selection Committee of the
Council of Mayors of San Mateo County. The Santa Clara County representatives include a member of the
VTA Board of Directors appointed by that Board representing the City of San Jose or the County of Santa
Clara; a member of the VTA Board of Directors appointed by that Board representing the County of Santa
Clara or a city in Santa Clara County other than the City of San Jose; and the County’s representative to
the MTC, or if this person declines to serve, then the MTC appointee of the Cities Selection Committee,
or if this person declines to serve, then a member of the VTA Board of Directors, as appointed by that
Board.
JPB Directors do not have any terms as prescribed by the JPB; they serve at the discretion of their
appointing authority. As of May 2019, the current members of the JPB board include:
Cheryl Brinkman, appointed by San Francisco Municipal Transportation Agency
Jeannie Bruins, representing MTC
Cindy Chavez, representing Santa Clara County Board of Supervisors

Chapter 1: Overview of the Transit System
CALTRAIN SRTP FY2018‐2027 7
Ron Collins, appointed by City Selection Committee
Devora "Dev" Davis, representing City of San Jose
Gillian Gillett, Chair, appointed by San Francisco County Board of Supervisors
Dave Pine, Vice Chair appointed by the San Mateo County Board of Supervisors
Charles Stone, appointed by San Mateo County Transit District
Shamann Walton, appointed by San Francisco County Board of Supervisors
1.2.2 Advisory Committees
There are four standing advisory committees that offer the JPB and Caltrain management input on a
regular basis. These are as follows:
The Citizens Advisory Committee (CAC) is composed of nine volunteer members who serve in an
advisory capacity to the tri‐county policy board, provide input on the needs of current and
potential rail customers, and review and comment on staff proposals and actions as requested by
the Board.
The Bicycle Advisory Committee (BAC) is a partnership composed of nine volunteer members and
Caltrain staff. The BAC serves as the primary venue for the interests and perspectives of bicyclists
to be integrated into the Caltrain planning processes. This group advises staff, bringing new ideas
for discussion and helping guide Caltrain’s future investments.
The Central Equipment Maintenance and Operations Facility (CEMOF) Monitoring Committee is
an advisory committee established by the San Jose City Council in cooperation with Caltrain. The
primary responsibility of the committee members is to provide ongoing communication with the
community regarding the operation of the maintenance facility located in San Jose.
The Caltrain Accessibility Advisory Committee (CAAC) meets annually to discuss and advise JPB
staff on policies, plans and procedures relating to the development, implementation and
operation of Caltrain accessible transit services, and on compliance with the requirements of the
American with Disabilities Act of 1990. The CAAC is organized by JPB’s Accessible Transit Services
staff. The JPB does not select members; all interested parties with accessibility interests are
welcomed, so membership fluctuates with representatives from San Francisco, San Mateo, Santa
Clara, and other Bay Area counties.
Chapter 1: Overview of the Transit System
CALTRAIN SRTP FY2018‐2027 8
1.3 The Organization The JPA creating the JPB designates the District as the Managing Agency of the JPB. The JPB has no direct
employees. Instead, employees of the Managing Agency (the District) serve as staff to the JPB. Under this
contractual arrangement, the CEO/General Manager of the District serves the JPB as its Executive
Director. The Executive Director is supported by Chief Officers who oversee individual departments within
the agency. See Figure 1‐1 for the JPB Organizational Chart.

Chapter 1: Overview of the Transit System
CALTRAIN SRTP FY2018‐2027 9
Figure 1‐1: Joint Power Board Organizational Chart
JPB
Chief Officer,Planning,Grants,
TransportationAuthority
Chief FinancialOfficer
ExecutiveOfficer, District
Secretary,Executive
Administration
Chief Operating Oficer, Rail
Deputy Chief, Rail Operations
TASI Management
Director, Rail Contracts and
Budget
TASI Management
Director, Engineering and Maintenence
TASI Management
Director, Capital Program Delivery
Director, Caltrain Planning
Director, Caltrain Integration
Senior Policy Advisor
Chief Communications
Officer
Chief Officer, CalMod
Chief Operating Officer, Bus
Deputy GM/CEO General Counsel
General Manager/CEO

Chapter 1: Overview of the Transit System
CALTRAIN SRTP FY2018‐2027 10
1.3.1 Staffing District staff provide administrative management for the Caltrain system, with departments providing
staff support in engineering, finance, capital project development, project monitoring, planning,
marketing, customer service, public and media relations, fare and schedule setting, human resources,
contracts and procurement, performance monitoring, budget and grant administration, and public
outreach. Most staff are based at administrative headquarters (Central Office) of the District located in
San Carlos. The Central Office houses 737 full‐time and part‐time employees, some of whom are dedicated
to Caltrain only. Several District employees perform part of their work for Caltrain from District bus
storage and maintenance bases or CEMOF in San Jose. The agency operates on a Fiscal Year (FY) calendar
from July 1 to June 30; for example, FY2019 encompasses July 1, 2018, to June 30, 2019.
The Rail Division is responsible for the day‐to‐day operation of Caltrain and provides direct oversight of
the contract operator, TransitAmerica Services, Inc. (TASI). TASI began Caltrain operations on
May 26, 2012, and the base portion of the contract expired on June 30, 2017. On February 2, 2017, the
JPB exercised all five of the available one‐year options, extending the term of the contract through June
30, 2022. TASI employees include both union and non‐union staff. Currently, 11 labor unions represent
workers associated with maintenance and operations of the rail service. These unions hold agreements
with TASI. The TASI contract provides for Railroad management, dispatch, safety, operations and
maintenance of track, signals, systems and vehicles. The contract also provides for construction support.
As of January 2019, the total number of TASI employees was 509. Of these employees, 72 are classified at
the management level and 455 are classified at the non‐management level.
The JPB does not hold direct labor agreements with any railroad workers. In July of 2015, however, the
JPB executed a project labor agreement (PLA) specifically for the Peninsula Corridor Electrification Project.
The PLA was reached with the Building Trades Councils of the City and County of San Francisco, San Mateo
County, Santa Clara and San Benito counties to govern the building and construction work to be
performed under the design build contract for PCEP. The Board also adopted a Memorandum of
Understanding (MOU) with the International Brotherhood of Electrical Workers (IBEW) Union, Local 1245,
to govern the overhead electrification systems work to be performed under the design‐build contract for
PCEP. The agreement expires upon the JPB’s filing of a Notice of Completion for PCEP.

Chapter 1: Overview of the Transit System
CALTRAIN SRTP FY2018‐2027 11
1.4 Description of Services and Service Area
1.4.1 Rail Service Caltrain provides inter‐ and intra‐county commuter rail service along the San Francisco Peninsula Corridor,
including San Francisco, San Mateo, and Santa Clara counties. The JPB operates Caltrain 365 days a year
with reduced schedules on major U.S. holidays. The current weekday Caltrain operating schedule
(effective April 1, 2019) is comprised of a mix of 92 express (Baby Bullet), limited, and local trains.
Scheduled headways, or the time between arrivals of vehicles moving in the same direction at a station,
vary by time of day, station, and service type. Overall, service is most frequent during the peak commute
periods and is provided every hour in both directions during midday periods. Weekday Northbound
service begins at 4:28 AM and ends at 12:05 AM. Weekday Southbound service begins at 4:55 AM and
ends at 1:38 AM. Caltrain operates 28 trains on Saturday and 24 on Sunday, with service primarily
composed of hourly local trains supplemented by two Baby Bullet trains in each direction per day.
Saturday Northbound service begins at 7:08 AM and ends at 12:14 AM, while Southbound service begins
at 8:07 AM and ends at 1:45 AM. Sunday’s service span is more constrained, with Northbound service
beginning at 8:11 AM and ending at 11:52 PM and Southbound service running from 8:07 AM to 11:22
PM.
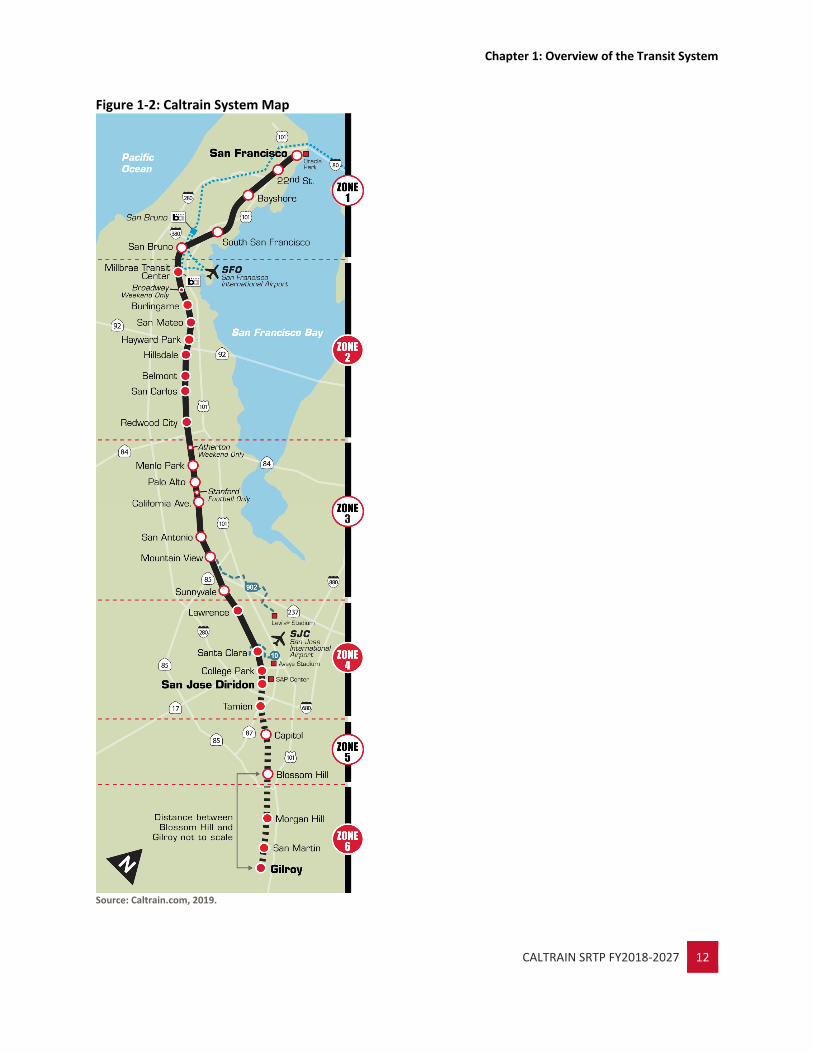
Caltrain serves 32 stations along the 77.2‐mile route between San Francisco and Gilroy, as illustrated in
the system map presented in Figure 1‐2. Gilroy Extension service is provided on UP‐owned track that is
governed by a trackage rights agreement between UP and JPA. This service has a different cost profile
than JPA service between San Jose and San Francisco. On weekdays and weekends, the majority of trains
operate between San Francisco and San Jose. On weekdays, three trains per weekday start in Gilroy during
the morning commute period, and three terminate in Gilroy during the evening commute period. On
weekends, trains operate exclusively between San Jose and San Francisco.
Twenty‐three stations are served full‐time. Weekend‐only service is provided to Broadway and Atherton
stations while the College Park Station is served by only four trains each weekday. The five stations on the
Gilroy extension in southern Santa Clara County are served by six weekday trains per weekday during peak
hours only. A shuttle bus serves passengers connecting between San Jose Diridon and Tamien on both
Saturdays and Sundays from 10:07 AM to 10:17 PM.
Chapter 1: Overview of the Transit System
CALTRAIN SRTP FY2018‐2027 12
Figure 1‐2: Caltrain System Map
Source: Caltrain.com, 2019.
Chapter 1: Overview of the Transit System
CALTRAIN SRTP FY2018‐2027 13
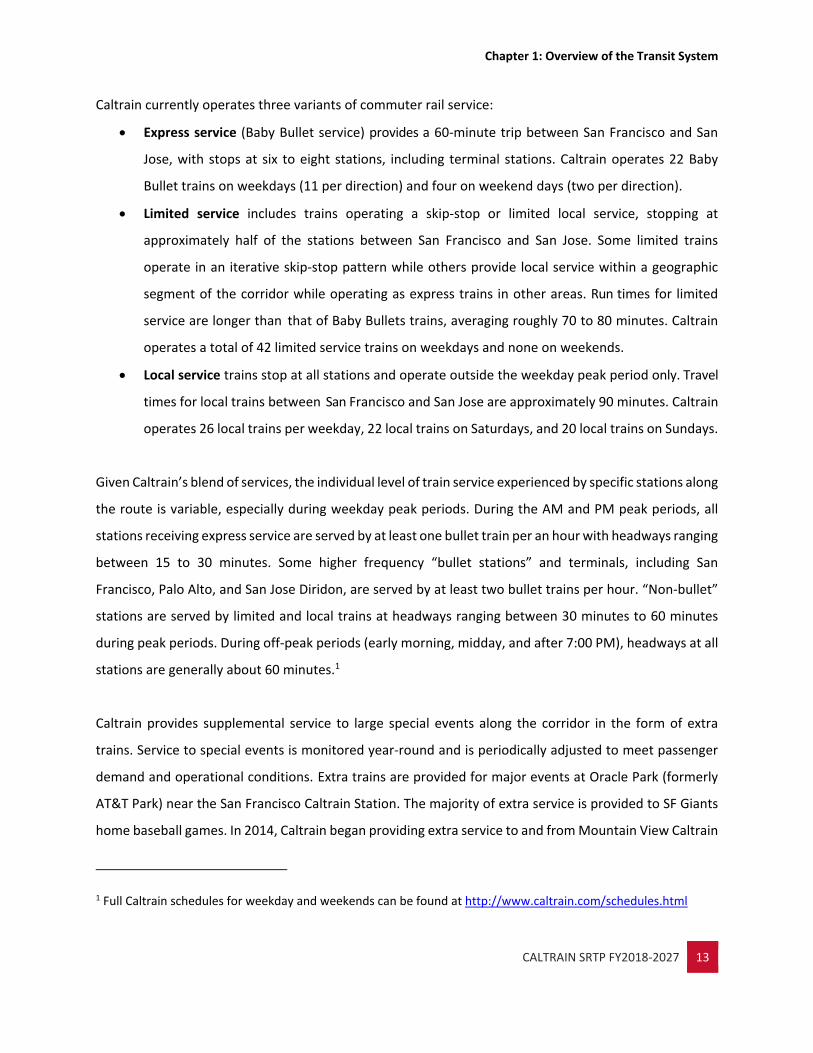
Caltrain currently operates three variants of commuter rail service:
Express service (Baby Bullet service) provides a 60‐minute trip between San Francisco and San
Jose, with stops at six to eight stations, including terminal stations. Caltrain operates 22 Baby
Bullet trains on weekdays (11 per direction) and four on weekend days (two per direction).
Limited service includes trains operating a skip‐stop or limited local service, stopping at
approximately half of the stations between San Francisco and San Jose. Some limited trains
operate in an iterative skip‐stop pattern while others provide local service within a geographic
segment of the corridor while operating as express trains in other areas. Run times for limited
service are longer than that of Baby Bullets trains, averaging roughly 70 to 80 minutes. Caltrain
operates a total of 42 limited service trains on weekdays and none on weekends.
Local service trains stop at all stations and operate outside the weekday peak period only. Travel
times for local trains between San Francisco and San Jose are approximately 90 minutes. Caltrain
operates 26 local trains per weekday, 22 local trains on Saturdays, and 20 local trains on Sundays.
Given Caltrain’s blend of services, the individual level of train service experienced by specific stations along
the route is variable, especially during weekday peak periods. During the AM and PM peak periods, all
stations receiving express service are served by at least one bullet train per an hour with headways ranging
between 15 to 30 minutes. Some higher frequency “bullet stations” and terminals, including San
Francisco, Palo Alto, and San Jose Diridon, are served by at least two bullet trains per hour. “Non‐bullet”
stations are served by limited and local trains at headways ranging between 30 minutes to 60 minutes
during peak periods. During off‐peak periods (early morning, midday, and after 7:00 PM), headways at all
stations are generally about 60 minutes.1
Caltrain provides supplemental service to large special events along the corridor in the form of extra
trains. Service to special events is monitored year‐round and is periodically adjusted to meet passenger
demand and operational conditions. Extra trains are provided for major events at Oracle Park (formerly
AT&T Park) near the San Francisco Caltrain Station. The majority of extra service is provided to SF Giants
home baseball games. In 2014, Caltrain began providing extra service to and from Mountain View Caltrain
1 Full Caltrain schedules for weekday and weekends can be found at http://www.caltrain.com/schedules.html
Chapter 1: Overview of the Transit System
CALTRAIN SRTP FY2018‐2027 14
Station before and after major events including SF 49ers football games at Levi’s Stadium in Santa Clara.
Extra trains also operate during annual events including Independence Day, New Year’s Eve, Bay to
Breakers, Gay Pride Weekend, and Fleet Weekend. Select regular local trains make stops at the Stanford
Station before and after Stanford weekend home football games and the annual San Jose Earthquakes
versus LA Galaxy Game at Stanford Stadium. San Jose Sharks Hockey post‐game ridership is monitored
departing from the San Jose Diridon Station. The last regular scheduled train may hold up to 15 minutes
after a Sharks game. Event ridership for San Jose Earthquakes Soccer home games has been periodically
monitored by Caltrain staff following the opening of Avaya Stadium near the Santa Clara Station in 2015.
Beginning in 2019 with the planned opening of the Chase Center located between the San Francisco and
22nd Street Stations, service for the Golden State Warriors home basketball games is not yet determined
and will be monitored.
1.4.2 Caltrain Shuttle Services Caltrain shuttles provide critical first‐ and last‐mile connections between Caltrain stations and major
activity centers including employment centers. Caltrain sponsors and is directly involved in the
administration of 26 shuttle routes serving 17 of its stations. These public shuttles operate fixed routes
between Caltrain stations and employment sites and are free for Caltrain passengers. Shuttle service is
adjusted periodically to account for changes in demand, job location, and train service patterns. Vehicles
are replaced by the shuttle operator.
1.4.3 Other Shuttle Services In the past decade, there has been substantial growth of private shuttle operations in the San Francisco
Bay Area, especially private employer‐provided regional shuttles that offer direct service to employment
sites either from residential neighborhood stops, or from major transit hubs, including Caltrain stations.
Major employers offering such services include several technology industry companies based throughout
the San Francisco Bay Area.
1.4.4 Demand Responsive Services
Caltrain does not provide any demand‐response services and paratransit service is not a direct
responsibility of the agency. Paratransit services in the Caltrain service area are provided by the local
transit agencies in each county — SFMTA, SamTrans, and VTA. The services for each county are as follows:

Chapter 1: Overview of the Transit System
CALTRAIN SRTP FY2018‐2027 15
San Francisco County: The San Francisco Municipal Railway (Muni) contracts with a paratransit
broker to manage their paratransit service. The paratransit broker contracts with van and taxi
companies to provide transportation.
San Mateo County: SamTrans contracts with Redi‐Wheels to provide paratransit service to
Americans with Disabilities Act (ADA)‐eligible patrons in San Mateo County. The service is
provided 365 days per year along the Caltrain service corridor.
Santa Clara County: VTA ACCESS Paratransit provides paratransit service in most of the urban areas
in Santa Clara County. The service operates in the VTA service area (3/4‐mile around bus and light‐
rail stops/station) seven days per week during the same hours of the day as VTA runs their light‐
rail trains and buses on regular, holiday, and Sunday routes.
Further details regarding the paratransit services provided by these agencies can be found in each
respective agency’s SRTPs.
1.4.5 Connecting Services Caltrain has direct rail connections with each of the major transit operators along its route, including Muni,
San Francisco Bay Area Rapid Transit (BART), VTA, Altamont Corridor Express (ACE), and Amtrak’s Capitol
Corridor and Coast Starlight. Caltrain connects with the Muni N‐Judah and T‐Third light rail lines at the
San Francisco terminal at 4th and King. Both lines operate on the surface along the Embarcadero, then
travel under Market Street in the upper level of the Muni/BART subway, providing connections to the
remaining Muni light rail lines as well as to the BART system. The N‐Judah continues into San Francisco’s
western neighborhoods, while the T‐Third serves the east and southeast waterfront of San Francisco.
Caltrain connects directly with BART at the Millbrae Station. This connection provides service to the San
Francisco International Airport as well as to other locations throughout the BART system. Caltrain
connects directly to the VTA light rail system at three locations: Mountain View Station (Mountain View‐
Winchester line), the San Jose Diridon Station (Mountain View‐Winchester line), and Tamien Station (Alum
Rock‐Santa Teresa line).
Caltrain also connects with regional and interstate rail systems at the Santa Clara and San Jose Diridon
Stations. ACE provides peak‐hour commuter rail service from San Joaquin and Alameda counties to
employment centers in the Santa Clara Valley. Amtrak’s Capitol Corridor provides intercity rail service

Chapter 1: Overview of the Transit System
CALTRAIN SRTP FY2018‐2027 16
between San Jose, Oakland, Sacramento, and Auburn, and Amtrak’s long‐distance Coast Starlight provides
rail service between Los Angeles and Seattle.
In addition to these rail connections, Caltrain connects with local bus service provided by Muni, SamTrans,
VTA, AC Transit, San Benito County Express, Monterey Salinas Transit, and Dumbarton Express (a
consortium of AC Transit, BART, SamTrans, Union City Transit and VTA). Primary connecting stations
include:
San Francisco: Several Muni bus routes connect to the 4th and King, 22nd Street, and Bayshore
Caltrain Stations. An Amtrak Thruway connecting bus service also serves the 4th and King Caltrain
Station.
Hillsdale, Belmont, San Carlos, Redwood City, Menlo Park, Palo Alto, Mountain View, Sunnyvale,
Santa Clara and Gilroy: Each has five or more connecting bus transit lines operated by various
public transit agencies serving that specific service area.
San Jose Diridon: Five VTA bus lines, a light rail station and free Downtown Area Shuttle (DASH)
shuttle, plus Monterey Salinas Transit to Monterey, Highway 17 Express bus service to Santa Cruz
and Amtrak Thruway bus service to Santa Barbara. Private operators MegaBus and Greyhound
also serve the San Jose Diridon Station.
Caltrain accommodates bicycles on‐board and most stations have bicycle storage facilities available. See
Section 1.8.6 for more information on the accommodation of bicycles.
1.5 Fare Structure Like many other commuter rail systems around the nation, the Caltrain fare structure is zone‐based. There
is a base fare (currently $3.20 for adults using Clipper or $3.75 for those paying cash at a ticket vending
machine) and a fee (currently $2.25 for adults) for each additional zone traveled. Table 1‐1 shows
Caltrain’s current six‐zone fare structure, in which trips of greater distances have higher fares. The last
Caltrain fare increase took effect on October 1, 2017, when various adjustments to Caltrain’s pass
programs were made, the discounted 8‐ride ticket was eliminated, and 25 cents was added to the base
fare. It was the ninth time Caltrain adjusted its fares since 2005. In December 2018, the Board of Directors

Chapter 1: Overview of the Transit System
CALTRAIN SRTP FY2018‐2027 17
adopted a Fare Policy for the first time in JPB history2.
Caltrain operates a barrier‐free proof‐of‐payment fare system, whereby riders must board trains with a
valid fare and show proof of their fare when requested to do so by conductors during random spot checks
on‐board the trains. Passengers have three options for purchasing tickets:
Paper tickets for day‐of‐travel can be purchased at ticket vending machines (TVMs) located at
stations and on platforms, and include one‐way tickets, day passes, and zone upgrades.
Mobile ticketing is provided through a smart phone application, and one‐way tickets, day passes,
and zone upgrades can be purchased. Tickets cannot be purchased through mobile ticketing in
advance for upcoming dates except for special events.
The Clipper card, a regional reloadable fare payment card, can be used to pay for one‐way travel
with e‐cash (cash value pre‐loaded onto the card) and monthly passes. Clipper cards are also
accepted on other Bay Area transit systems.
Table 1‐1: Caltrain Fare Structure, Effective October 1, 2017 Zone Stations Ticket Type Fare via Clipper
Card Fare via Ticket
Machine
1 San Francisco 22nd Street Bayshore So. San Francisco San Bruno
Full Fare: One‐way Day Pass Monthly Pass Eligible Discount: One‐way Day Pass Monthly Pass
$3.20
‐‐ $96.00
$1.60
‐‐ $48.00
$3.75 $7.50
‐‐
$1.75 $3.75
‐‐
2 Millbrae Broadway Burlingame San Mateo Hayward Park Hillsdale Belmont San Carlos Redwood City
Full Fare: One‐way Day Pass Monthly Pass Eligible Discount: One‐way Day Pass Monthly Pass
$5.45
‐‐ $163.50
$2.60
‐‐ $78.00
$6.00
$12.00 ‐‐
$2.75 $6.00
‐‐
2 More information on the Caltrain Fare Study can be found on the Caltrain Website: http://www.caltrain.com/projectsplans/Plans/FareStudy.html

Chapter 1: Overview of the Transit System
CALTRAIN SRTP FY2018‐2027 18
Zone Stations Ticket Type Fare via Clipper Card
Fare via Ticket Machine
3 Atherton Menlo Park Palo Alto Stanford California Ave. San Antonio Mountain View Sunnyvale
Full Fare: One‐way Day Pass Monthly Pass Eligible Discount: One‐way Day Pass Monthly Pass
$7.70
‐‐ $231.00
$3.60
‐‐ $108.00
$8.25
$16.50 ‐‐
$3.75 $8.25
‐‐
4 Lawrence Santa Clara College Park San Jose Diridon Tamien
Full Fare: One‐way Day Pass Monthly Pass Eligible Discount: One‐way Day Pass Monthly Pass
$9.95
‐‐ $298.50
$4.60
‐‐ $138.00
$10.50 $21.00
‐‐
$4.75 $10.50
‐‐
5 Capital Blossom Hill
Full Fare: One‐way Day Pass Monthly Pass Eligible Discount: One‐way Day Pass Monthly Pass
$12.20
‐‐ $366.00
$5.60
‐‐ $168.00
$12.75 $25.50
‐‐
$5.75 $12.25
‐‐
6 Morgan Hill San Martin Gilroy
Full Fare: One‐way Day Pass Monthly Pass Eligible Discount: One‐way Day Pass Monthly Pass
$14.45
‐‐ $433.50
$6.60
‐‐ $198.00
$15.00 $30.00
‐‐
$6.75 $15.00
‐‐ Source: Caltrain.com Notes: Zone upgrades are $2.25 per zone for adults; Eligible discount $1.00 per zone (only available at ticket vending machine).
With regards to regular fare products, Caltrain offers one‐way tickets, day passes (including the Caltrain +
VTA Day Pass for customers traveling to/from Levi’s Stadium or Great America in Santa Clara), monthly
passes, and zone upgrade tickets. Monthly passes are only available on Clipper. An eligible discount is
available for seniors, persons with disabilities, Medicare cardholders, and youth, offering 50 percent of
the standard rate for all regular fare products, including monthly passes.
The Go Pass is Caltrain’s deep discount pass program. The Caltrain Go Pass program allows companies,

Chapter 1: Overview of the Transit System
CALTRAIN SRTP FY2018‐2027 19
educational institutions, and residential complexes (“participants”) to purchase annual unlimited‐ride
passes for all eligible employees, residents, or students (“eligible users”). A Go Pass sticker is affixed to an
approved identification badge and the user presents it on the train as proof of payment. The Go Pass is
good for travel on Caltrain between all zones, seven days a week, for one low annual cost per user. The
Go Pass is not available for purchase by individuals and does not cover parking at Caltrain stations or travel
on other transit systems. The Go Pass is valid for a calendar year and expires on December 31 each year.
The 2019 total cost of participating in the Go Pass program is the greater of $285 per eligible user or
$23,940 each year. As of spring 2019, 125 businesses were actively participating in the program. Caltrain
is participating in a Go Pass on Clipper Pilot Program to help transition Go Pass from stickers to a digital
proof‐of payment on a passenger’s Clipper Card. Employees participating in the pilot must present their
Clipper Card with the Go Pass loaded onto it rather than their ID badge with a Go Pass sticker as proof‐of‐
payment on the train. Go Pass on Clipper Pilot Program began in January 2018 with three employer
participants. In 2019, the program was expanded to another two employers.
1.5.1 Inter‐Operator Fare Structures and Agreements
The concept behind Caltrain’s inter‐operator fare structures and agreements is to encourage ridership
and transit connectivity through discounted fares for trips requiring transfers between operators or
modes. The arrangements are as follows:
VTA allows adult customers presenting a two‐zone or greater Caltrain monthly pass and eligible
discount riders with a valid monthly pass to receive a local fare credit on its bus and light rail
services.
SamTrans allows customers presenting a two‐zone or greater Caltrain monthly pass to receive a
local fare credit on its fixed‐route buses.
The Dumbarton Express allows customers presenting a two‐zone or greater Caltrain monthly pass
to receive a transfer credit of a local fare on its buses if boarding within two hours of first tagging
on Caltrain.
SFMTA allows customers who transfer to Muni within an hour of tagging off on Caltrain (using
cash value or a monthly pass with a Zone 1 origin or destination), to automatically receive a 50‐
cent discount off the Muni adult cash value fare.

Chapter 1: Overview of the Transit System
CALTRAIN SRTP FY2018‐2027 20
1.6 Revenue Fleet The current Caltrain revenue fleet includes 29 diesel locomotives. At any given time, 20 of these are
required for daily revenue service. Caltrain’s fleet also includes 134 passenger cars. A summary of
Caltrain’s revenue fleet is presented in Table 1‐2. A detailed inventory of the revenue fleet is presented
in Appendix A.
Cars and locomotives operate in a bi‐directional “push‐pull” mode. Northbound trains are pushed by the
locomotive in the rear and controlled from the “cab” passenger car at the front. Southbound trains are
pulled by and controlled from the locomotive at the front. Within the passenger car fleet, there are two
sub‐fleets, bi‐level Gallery cars and the newer design, low‐floor Bombardier‐made cars (within this
category, there are three sub‐fleets of Bombardier Cars detailed in Appendix A). Both Bombardier and
Gallery cars are currently used for Baby Bullet trains and non‐Baby Bullet trains (limited and local trains).
Twenty‐six Caltrain stations are fully ADA accessible and all train sets are fully ADA‐accessible and can
accommodate at least two wheelchairs at a time. Caltrain’s Gallery train sets have on‐board wheelchair
lifts and each Gallery consist has at least one wheelchair accessible car that can accommodate three
wheelchairs. Caltrain’s Bombardier train sets have up to six wheelchair accessible cars and use the
accessible ramp (“Mini‐highs”) or a mobile platform wheelchair lift. Accessible stations also have a hand
powered, mobile wheelchair lift that provides back‐up to on‐board train powered lifts. Mini‐high
platforms have been installed at the majority of stations to facilitate boarding and alighting for disabled
patrons on and off of Bombardier train consists. The hand powered, mobile wheelchair lifts provide access
to Bombardier consists at stations not equipped with mini‐high platforms.

Chapter 1: Overview of the Transit System
CALTRAIN SRTP FY2018‐2027 21
Table 1‐2: Caltrain Fleet Inventory Series Quantity Number of Seats Year of
Manufacture Make
Locomotives
F40 PH‐2 5 N/A 1985 GM ‐ EMD
F40PH‐2‐CAT 15 N/A 1985‐1987 GM ‐ EMD
F40 PH‐2C 3 N/A 1998 Boise Locomotive
MP36PH‐3C 6 N/A 2003 Motive Power
Passenger Cars
Gallery Trailer 26 143 1985‐1987 Nippon Sharyo
Gallery Trailer 16 148 1985‐1987 Nippon Sharyo
Gallery Trailer 14 120 1999‐2000 Nippon Sharyo
Gallery Cab (Bike)
10 108 1985‐1987 Nippon Sharyo
Gallery Cab (Bike)
6 78 1999‐2000 Nippon Sharyo
Gallery Cab (Bike)
21 97 1985 Nippon Sharyo
Bi‐Level Trailer 5 137 1997 Bombardier
Bi‐Level Trailer (Bike)
11 116 1997 Bombardier
Bi‐Level Trailer 9 144 2002 Bombardier
Bi‐level Trailer (Bike)
2 117 2002 Bombardier
Bi‐level Trailer (Bike)
5 117 2001‐2002 Bombardier
Bi‐level Trailer (Bike)
2 118 2008 Bombardier
Bi‐level Trailer (Bike)
1 127 2002 Bombardier
Bi‐Level Trailer 6 140 2008 Bombardier Source: JPB, 2019. Note: Detailed fleet inventory included in Appendix A. Trains are assumed to retire 30 years past the manufacture date. Some trains have been overhauled to remain in service.
1.7 Work Locomotives and Non‐Revenue Rolling Stock The Caltrain non‐revenue rolling stock is located in several different areas along the Caltrain right‐of‐way.
Generally, cars are in serviceable condition but are necessarily free of defects. Caltrain’s fleet of non‐
revenue rolling stock includes the following:
8 Flat Cars
3 Side Dump Cars
21 Ballast Hoppers
1 Gondola

Chapter 1: Overview of the Transit System
CALTRAIN SRTP FY2018‐2027 22
2 Cabooses
1 Track Geometry Car
2 work locomotives
Detailed information on Caltrain’s non‐revenue fleet can be found in Appendix A.
1.1.1 Equipment and Facility Deficiencies
There are no equipment or facility deficiencies at this time. However, Caltrain’s diesel fleet is approaching
the end of its useful life and rolling stock rehabilitation is a major component of Caltrain’s State of Good
Repair Program (SOGR). The priority of Caltrain’s Rolling Stock SOGR Program for the next 10 years
includes the mid‐life overhauls and major capital maintenance required to keep Caltrain’s full diesel fleet
running through implementation of PCEP by FY2022, as well as to keep a portion of the diesel fleet
operating past FY2022 alongside the system’s new, EMU trains. In addition, several new equipment and
facility projects are planned for the upgrade to an electrified system, discussed in more detail in Chapters
5 and 6.
Caltrain’s Transit Asset Management (TAM) Plan was developed during FY2018‐2019.3 The overarching
goal of TAM is to ensure that a transit agency’s assets are maintained and operated in a consistent,
measurable SOGR. The TAM Plan is a document required by the Federal Transit Administration (FTA) per
MAP‐21 legislation for all agencies that receive federal funding, and it provides guideposts by which an
agency can track progress toward a establishing a data‐driven asset management program. TAM involves
all activities related to maintaining physical assets, such as rolling stock, maintenance facilities, and rail
infrastructure, in SOGR, in order to provide safer and more reliable public transit service. The current Plan
reflects Caltrain’s assets at the time of approval (September 2018). It is a living document and will continue
to be updated by Caltrain staff to be consistent with future regulations or requirements.
1.8 Description of Existing Facilities
1.8.1 Administrative
As previously mentioned, almost all District staff are based at the administrative headquarters (Central
3 Caltrain’s TAM Plan is available at: http://www.caltrain.com/Assets/planning/pdf/Transit+Asset+Management+Plan.pdf

Chapter 1: Overview of the Transit System
CALTRAIN SRTP FY2018‐2027 23
Office) of the District located in San Carlos. Several District employees perform part of their work for
Caltrain from District bus storage and maintenance bases and CEMOF in San Jose.
1.8.2 Maintenance and Fueling
Maintenance and inspection of the current fleet is done at CEMOF, located at the site of an old rail yard
at Lenzen Avenue in San Jose. CEMOF began operations in 2007. Most maintenance is performed by
contractor (TASI) employees. Daily inspections are also performed at the North Terminal (the railyard at
the Caltrain 4th & King Station in San Francisco) and at the Gilroy Station. Overnight storage is available at
North Terminal, CEMOF, Diridon, Tamien, and Gilroy.
CEMOF occupies a 20‐acre site and includes a three‐story maintenance shop, Central Control Facility, train
washer, storage tracks, inspection pits and fuel storage. The maintenance shop has a wheel‐truing
machine, drop table and overhead cranes. The train washer water is treated and recycled. Two 800‐foot
long service and inspection pits allow daily inspection and routine service of trains. Approximately 150
maintenance and operation contract employees (from TASI) are based at the facility. With interior
modifications, CEMOF will be able to accommodate the future electrified Caltrain fleet.
1.8.3 Vehicle Storage Most vehicles are stored at the multi‐track San Francisco north terminus platforms at 4th and King and in
the yard and platforms at the CEMOF. Three train sets (consists) are stored overnight and on weekends at
a small yard at the Gilroy Station. In addition, one or two trains are sometimes staged at the San Jose
Diridon Station. Based on Caltrain’s experience and analysis, the overnight storage capacity provided is
adequate for the current fleet.
1.8.4 Station Facilities Caltrain has 32 stations. Most stations and station buildings are owned by Caltrain. Exceptions are the
Millbrae Intermodal Station (which is owned by BART), the Palo Alto Station (which is owned by Stanford
University), and all stations including and south of Tamien Station (which are owned by VTA). Caltrain
manages and collects fees at parking facilities it owns. Caltrain‐provided parking is available at all stations
except San Francisco and 22nd Street; parking is provided by VTA at stations south of the Tamien Station.
Millbrae, Burlingame, San Carlos, Menlo Park, Palo Alto, Santa Clara, and San Jose Diridon are stations
listed on the National Register of Historic Places. Caltrain does not maintain any park‐and‐ride services

Chapter 1: Overview of the Transit System
CALTRAIN SRTP FY2018‐2027 24
aside from its on‐site station parking. Station facilities are shown in Table 1‐3.
1.8.5 Track and Rights‐of‐Way
Caltrain operates on a total of 77.2 miles of track from San Francisco to Gilroy. Caltrain owns 51.4 miles
of this track, from the San Francisco Station to Control Point Lick south of the Tamien Station.
The JPB has the perpetual right of access to and from and use of the Gilroy Joint Facilities. The agreement
between Union Pacific, which owns track from Tamien to Gilroy, and the JPB presently allows Caltrain to
run not more than a total of 10 scheduled commuter trains between San Jose and Gilroy (five in each
direction per day). Caltrain commuter trains are given priority and dispatched by UP on a mutually agreed
upon schedule.
The railroad crosses 40 roads at‐grade between San Francisco and the San Jose Diridon Station. There are
30 at‐grade road crossings between the San Jose Diridon Station and Gilroy Station. Within the Caltrain
right‐of‐way, there are approximately 108 track miles of rail used in revenue service, 93.5 miles of which
are main track 1 (northbound) and main track 2 (southbound). About 98 percent of all rail is continuously
welded. Almost 89 percent is Rail Weight 136 RE and more than 65 percent has been laid since 1991.
1.8.6 Bicycle Facilities and Access Caltrain provides more onboard bicycle storage capacity than any other commuter railroad in North
America. Caltrain’s “Bikes on Board” program began in 1992 and its scope and popularity have increased
steadily since that time. In 2011, Caltrain trains were modified to be equipped with two bicycles cars,
increasing overall bicycle carrying capacity by 30 percent. Since the last SRTP update in 2015, Caltrain
added a third bike car to all Bombardier‐manufactured train sets, increasing their capacity from 48 to 72
bikes. Each Caltrain train can now accommodate between 72 and 80 bicycles at a time depending on
equipment type.
Caltrain does not charge fees to bring bicycles on‐board, as it is legally precluded from doing so. Average
daily bicycle boardings reached a historical high in 2015 with 6,207 bicycles on board daily. These
boardings dipped slightly in the following years but began trending upwards again in 2017. Bicycle
boardings increased slightly 2018 with a total of 5,919 bicycles boarding daily (a six percent increase

Chapter 1: Overview of the Transit System
CALTRAIN SRTP FY2018‐2027 25
compared to the previous year). The popularity of Caltrain’s Bikes on Board program creates capacity
challenges when all the available slots on a bike car are filled and new cyclists are unable to board. When
trains reach capacity, passengers intending to bring a bike on‐board are asked by conductors to wait for
the next train.
Facilities at individual stations are shown in Table 1‐3. Cyclists who ride to Caltrain can also choose to
store their bicycles at Caltrain stations rather than bring them on board. Caltrain and its partners provide
a variety of racks, lockers, and shared access bicycle parking facilities at various stations, the majority of
which are owned and administered directly by Caltrain. At some stations, however, facilities may be owned
and operated by a local jurisdiction or other transit property. Bicycle racks and lockers at most Caltrain
Stations. Most lockers are owned and operated by Caltrain and operate mechanically (using individually
assigned keys). Newer, electronic lockers are available to Caltrain patrons at some stations, including
Millbrae, San Mateo, Hayward Park, Hillsdale, Sunnyvale, and Tamien stations. Individual keyed and
assigned bike lockers are owned and managed by Caltrain and are available at many stations for a fee of
$33 for six‐month reservations, plus a nominal key deposit charge.
In addition to racks and lockers, shared bicycle parking facilities are provided at 4th and King Station in San
Francisco, Palo Alto, Mountain View, and Menlo Park. The San Francisco facility is owned by Caltrain and
operated under contract by Bike Hub and opened in June 2007. The facility was constructed using a
combination of federal, state, and local funds. It provides free attended bike parking for up to 230 bikes,
relieving overcrowding of bikes onboard trains and a full‐service retail bike shop. The Palo Alto facility is
not owned by Caltrain but provides unattended, secure shared parking and is operated by Bike Hub.
Located in the old baggage room within the station, Bike Hub provides 24‐hour secure indoor bike parking
for 96 bikes and requires membership for access. The Mountain View shared bike parking facility is owned
by the City of Mountain View and provides unattended secure space for 52 bikes and requires registration
with the City. The Menlo Park shared bike facility is owned by Caltrain and provides parking for 50 bikes
and requires registration with the agency. Private companies permitted by individual cities offer bike
share bikes at some stations, as indicated in Table 1‐3.
In 2016, Caltrain began the planning process for the Caltrain Bike Parking Management Plan as part of the
Bicycle Access and Parking Plan Implementation Strategy, which identified several challenges related to

Chapter 1: Overview of the Transit System
CALTRAIN SRTP FY2018‐2027 26
bicycle parking and access in 2014. The objectives of the plan included identifying the mobility needs of
bicyclist using the Caltrain system; defining customer service and financial performance measures for the
Caltrain bike parking system; supporting capital planning activities related to current, planned and
potential bike parking facilities; analyzing different management strategies and administrative options to
improve the performance of Caltrain’s bike parking system; and recommending a set of management and
administrative reforms and strategies to optimize Caltrain’s bike parking system.
After an extensive outreach effort to gather feedback on findings and draft plan from staff, advisory
committees, and stakeholders, the Caltrain Bike Parking Management Plan was finalized and adopted by
the Peninsula Corridor Joint Powers Board on November 2, 2017.4 As part of the plan, a third‐party vendor
(yet‐to‐be selected) specializing in bike parking facilities and services will hold primary responsibilities for
Caltrain’s bike parking system.
4 The final plan is available at: http://www.caltrain.com/projectsplans/Plans/Bike_Parking_Management_Plan.html

Chapter 1: Overview of the Transit System
CALTRAIN SRTP FY2018‐2027 27
Table 1‐3: Overview of Amenities at Each Station Location Station Address Car Parking
Inventory (owner) Bike Rack
Spaces
Keyed Bike
Locker Spaces
Other Bike Parking Facilities (capacity)
Bike Share Operators Ticketing/Clipper Vending Machines
San Francisco
700 4th St., San Francisco
Street parking only (N/A)
0 0 Caltrain Bike Station operated by BikeHub (250)
FordGo Bike and Jump Bike 8 TVMs; 2 Clipper add‐value machines
22nd Street 1149 22nd St., San Francisco 9410
Street parking only (N/A)
27 0 20 e‐lockers managed by City of
San Francisco.
FordGo Bike and Jump Bike 2 TVMs
Bayshore 400 Tunnel Ave., San Francisco 9413
38 spaces 18 8 N/A None at this time. 3 TVMs
South San Francisco
590 Dubuque Ave., South San Francisco
32 spaces 18 40 N/A None at this time. 2 TVMs
San Bruno 833 San Mateo Ave., San Bruno
201 spaces 8 16 16 BART‐run on‐demand electric lockers also available.
None at this time. 4 TVMs
Millbrae Transit Center
100 California Drive, Millbrae
189 spaces 24 28 24 BikeLink e‐lockers owned by BART.
None at this time. 2 TVMs
Broadway 1190 California Drive, Burlingame
140 spaces 18 12 N/A None at this time. 2 TVMs
Burlingame 290 California Drive, Burlingame
69 spaces 13 18 N/A None at this time. 4 TVMs
San Mateo 385 First Ave., San Mateo
42 spaces 11 12 12 BikeLink e‐lockers owned by City of San Mateo.
None at this time. 4 TVMs

Chapter 1: Overview of the Transit System
CALTRAIN SRTP FY2018‐2027 28
Station Address Car Parking Inventory (owner)
Bike Rack
Spaces
Keyed Bike
Locker Spaces
Other Bike Parking Facilities (capacity)
Bike Share Operators Ticketing/Clipper Vending Machines
Hayward Park
401 Concar Drive, San Mateo
211 spaces 18 4 4 BikeLink e‐lockers owned by City of San Mateo.
None at this time. 4 TVMs
Hillsdale 3333 El Camino Real, San Mateo
462 spaces 18 12 12 BikeLink e‐lockers owned by City of San Mateo.
None at this time. 2 TVMs
Belmont 995 El Camino Real, Belmont
389 spaces 18 24 N/A None at this time. 4 TVMs
San Carlos 599 El Camino Real, San Carlos
250 spaces 48 36 N/A None at this time. 4 TVMs
Redwood City
1 James Ave., Redwood City
558 spaces across 3 lots
18 50 N/A None at this time. 4 TVMs
Atherton 1 Dinkelspiel Lane, Atherton
33 spaces 0 26 N/A None at this time. 1 TVMs
Menlo Park
1120 Merrill St., Menlo Park
155 spaces 8 0 Shared access bike storage shed and secure indoor bike parking managed by BikeHub
None at this time. 4 TVMs
Palo Alto 95 University Avenue., Palo Alto,
291 spaces 178 94 Shared access facility and indoor parking owned by Stanford University, managed by BikeHub.
None at this time. 8 TVMs
California Ave.
101 California Ave., Palo Alto
169 spaces 33 42 N/A None at this time. 3 TVMs
San Antonio
190 Showers Drive, Mountain View
199 spaces shared with housing development across the street
18 38 N/A None at this time. 4 TVMs

Chapter 1: Overview of the Transit System
CALTRAIN SRTP FY2018‐2027 29
Station Address Car Parking Inventory (owner)
Bike Rack
Spaces
Keyed Bike
Locker Spaces
Other Bike Parking Facilities (capacity)
Bike Share Operators Ticketing/Clipper Vending Machines
Mountain View
600 W. Evelyn Ave., Mountain View
337 spaces 23 116 Shared access facility operated by City of Mountain View
None at this time. 4 TVMs
Sunnyvale 121 W. Evelyn Ave., Sunnyvale
499 spaces 18 71 16 day‐use / bring your own lock lockers owned by Sunnyvale. Four BikeLink lockers owned by Caltrain.
None at this time. 4 TVMs
Lawrence 137 San Zeno Way, Sunnyvale
122 spaces 18 24 N/A None at this time. 4 TVMs
Santa Clara 1001 Railroad Ave., Santa Clara
251 spaces 18 54 None at this time. 4 TVMs
College Park
780 Stockton Ave., San Jose
No parking available 0 0 N/A None at this time. 1 ticket machine
San Jose Diridon
65 Cahill St., San Jose
669 spaces 16 48 N/A FordGo 5 ticket vending machines, 1 Clipper add‐value machine
Tamien 1355 Lick Ave., San Jose
302 spaces 18 18 10 On‐demand electronic lockers available at VTA Transit Center
FordGo 2 TVMs
Capitol 3400 Monterey Hwy., San Jose
379 spaces 12 24 N/A None at this time. 2 machines
Blossom Hill
5560 Monterey Hwy., San Jose
425 spaces 10 10 Bike lockers managed by VTA
None at this time. 1 ticket machine

Chapter 1: Overview of the Transit System
CALTRAIN SRTP FY2018‐2027 30
Station Address Car Parking Inventory (owner)
Bike Rack
Spaces
Keyed Bike
Locker Spaces
Other Bike Parking Facilities (capacity)
Bike Share Operators Ticketing/Clipper Vending Machines
Morgan Hill
17300 Depot St., Morgan Hill
551 spaces 12 30 Bike lockers managed by VTA
None at this time.
San Martin 13400 Monterey Hwy., San Martin
159 spaces N/A N/A N/A None at this time. 2 TVMs
Gilroy 7150 Monterey St., Gilroy
460 spaces 13 30 Bike lockers managed by VTA
None at this time. 2 TVMs
Source: Calrain.com, Caltrain Bike Management Plan, 2017. Bike Parking Options by Station: http://www.caltrain.com/riderinfo/Bicycles/Bike_Parking_Options_By_Station.html Note: This table reflects amenities in place at stations at the time of SRTP publication. Bike share and other micromobilty operators are privately operated and are not affiliated with JPB.

Chapter 2: Goals, Objectives and Standards
CALTRAIN SRTP FY2018‐2027 31
2 Goals, Objectives and Standards
2.1 Description and Process This chapter presents Caltrain’s goals, objectives, and standards. Caltrain’s vision and guiding principles
are articulated within the 2014 Caltrain Strategic Plan. Caltrain’s strategic planning effort spanned a year‐
long period from 2013 to 2014 and included extensive public outreach through dedicated public meetings
along the corridor as well as repeated presentations to advisory and governing bodies, which include the
JPB, the Caltrain Citizen’s Advisory Committee, Caltrain’s Bicycle Advisory Committee, and local policy
makers and interest groups. Caltrain also received and responded to numerous written comments during
the development of the plan. The plan was adopted by the JPB in September of 2014 and supersedes
Caltrain’s previous, 2004 Strategic Plan. The vision and focus areas discussed below are pulled directly
from Caltrain’s 2014 Strategic Plan. This is the most recent version of vision and goals adopted by the
Board of Directors. It has not changed since the last SRTP update in 2015. An updated Caltrain Strategic
Plan is anticipated to be developed following the anticipated adoption of the Caltrain Business Plan in
2019. The process for updating the Strategic Plan will involve public outreach and will ultimately be
presented to the Board of Directors for review and adoption.
Caltrain also monitors and reports on service performance as part of MTC’s Transit Sustainability Project
(TSP). The purpose of the TSP is to help improve transit performance and to attract more customers to
the transit systems. To achieve this, MTC adopted the TSP final recommendations in 2012 as MTC
Resolution 4060, establishing performance requirements for the seven largest transit operators in the
region, including Caltrain. Under the terms of the TSP, each operator must achieve a five percent
reduction in at least one of the following performance measures by 2017:
Cost per revenue hour
Cost per passenger
Cost per passenger‐mile
TSP metrics and outcomes are presented in Section 3.2.
2.2 The Caltrain Vision and Focus Areas The 2004 Caltrain Strategic Plan identified five focus areas for Caltrain: service, infrastructure, regional

Chapter 2: Goals, Objectives and Standards
CALTRAIN SRTP FY2018‐2027 32
connectivity, partnerships with stakeholders, and financial sustainability. The 2014 Caltrain Strategic Plan
identifies two additional focus areas for Caltrain: safety and social responsibility.
2.3 Vision Caltrain’s vision is to provide a safe, reliable, sustainable modern rail system that meets the growing
mobility needs of the San Francisco Bay Area region.
2.4 Focus Areas The Caltrain Strategic Plan identifies seven focus areas where Caltrain will make critical policy and business
choices over the coming decade. Caltrain’s overarching vision is supported by focus areas, goals and
objectives within each level.
Focus Area 1: Safety
Ensure the safety and security of customers, employees and the public.
Ensuring the safety of every person who uses or interacts with the Caltrain system is the agency’s top
priority. To fulfill this focus area, Caltrain must pursue a coordinated set of safety practices and
improvements which include coordinating with regulatory bodies, promoting a safety culture inside and
outside of the organization, and making targeted investments to improve the safety of Caltrain’s physical
systems. The safety of the Caltrain system also includes guaranteeing the personal security of Caltrain’s
customers and employees through the deployment of security personnel and the design of facilities.
Planning for and implementing a safe system is especially critical as Caltrain embarks on major changes
to its infrastructure that include the installation of a new train control and signal system and system
electrification by FY2022.
Goals & Objectives
A. Comply with safety and security regulations and best practices.
1. Update and implement Caltrain’s Safety and Security Program Plans.
2. Coordinate safety through a consolidated cross‐departmental group responsible for
implementation of and compliance with safety initiatives.
3. Maintain effective relations and interface with safety and security regulatory agencies (FRA,

Chapter 2: Goals, Objectives and Standards
CALTRAIN SRTP FY2018‐2027 33
FTA, CPUC, NTSB, TSA and Department of Homeland Security).
4. Support regulatory safety requirements of the new advanced signal system and electrified
system.
5. Maintain close collaboration with local emergency response and law enforcement agencies
and ensure continuity of rail safety training and emergency preparedness.
B. Promote a safety culture and awareness within and beyond the organization.
1. Create an agency vision for safety, promote it through the Board and integrate it throughout
the organization.
2. Ensure personal commitments to safety from Board members, employees to contractors.
3. Partner with local jurisdictions to protect the integrity of Caltrain’s safety program.
4. Continue to expand public safety outreach and raise awareness of safety considerations.
5. Foster public awareness of safety issues / regulations related to an electrified system
C. Invest in and maintain a safe system.
1. Integrate safety assessment and certification into capital project planning and design.
2. Implement Positive Train Control (PTC) as mandated by the FRA.
3. Make targeted infrastructure investments and conduct routine preventative maintenance to
improve public safety.
4. Actively partner with communities to plan and advance grade separations.
D. Safeguard the security of Caltrain customers, employees, and the public.
1. Expand security on trains, stations, and facilities.
2. Integrate crime prevention through environmental design principles into system design.
Focus Area 2: Service
Grow and manage customer demand with expanded and enhanced service. Caltrain attracts and retains customers by delivering a consistently high standard of service. In the near‐
term, Caltrain must address peak‐hour crowding, operate a punctual and reliable service, and maintain a
comfortable and clean environment on its trains. Looking forward, the electrification of the system and
procurement of new vehicles for service beginning in FY2022 will provide a tremendous opportunity for
Caltrain to update its services. Key challenges will include balancing rapidly growing ridership with
customer desires for expanded onboard amenities and new service patterns — all while ensuring a reliable

Chapter 2: Goals, Objectives and Standards
CALTRAIN SRTP FY2018‐2027 34
and convenient travel experience. Finally, Caltrain must look beyond electrification and begin planning for
customer needs and service improvements over the next few decades.
Goals & Objectives A. Meet current and future customer mobility needs.
1. Design service to maximize passenger throughput.
2. Develop short‐term strategies to increase peak‐hour capacity.
3. Manage peak‐hour demand and utilize off‐peak capacity.
4. Provide expanded and modernized electrified service.
B. Be competitive with auto travel and support different travel markets.
1. Maximize train capacity while addressing on‐board accommodation of bicycles, luggage and
passenger facilities.
2. Link service levels to ridership, intermodal connections and land use.
3. Balance demand for increased stops with overall end‐to‐end trip times.
4. Seek opportunities to increase demand / expand services during off‐peak times and at low
ridership stations.
C. Operate a dependable and punctual service.
1. Meet Caltrain’s on‐time performance standard.
2. Strive for user‐friendly / intuitive schedules.
3. Provide real‐time and user‐friendly system information.
4. Respond to service delays with prompt communications and contingency operations.
D. Provide a comfortable and convenient travel experience.
1. Maintain Caltrain’s cleanliness and comfort.
2. Explore technological amenities (i.e. Wi‐Fi, enhanced information, payment systems, and open
source data application).
E. Invest in staff dedicated to public service.
1. Attract and retain quality staff.
2. Provide resources and tools to encourage excellence and innovation.
3. Invest in professional development

Chapter 2: Goals, Objectives and Standards
CALTRAIN SRTP FY2018‐2027 35
Focus Area 3: Infrastructure and Rolling Stock
Maximize utilization of system infrastructure and rolling stock.
In order to deliver the services its customers need, Caltrain must plan for, build and maintain a complex
system of rolling stock, equipment, structures and facilities. Maintaining all of these assets in a SOGR is
one of the agency’s foremost responsibilities and is fundamental to Caltrain’s ongoing success. The
Agency must invest its resources to protect and expand the capacity and reliability of the system while
continuing to deliver capital upgrades. In addition to its own projects, Caltrain must also support the
region and local communities as it works with the CHSRA to plan for a Caltrain / High Speed Rail blended
system.
Goals & Objectives A. Maintain a SOGR.
1. Adhere to industry and government guidelines for SOGR and asset management.
2. Develop and implement a life‐cycle based preventative maintenance strategy.
3. Ensure timely implementation of the SOGR program with sufficient funding and resources.
4. Evolve organizational resources to maintain Caltrain’s future electrified system infrastructure.
B. Invest in system reliability.
1. Incorporate flexibility and reliability into the design of capital investments and fleet management.
2. Make targeted investments to safeguard reliability during construction.
3. Develop transitional and long‐term strategies to reduce station dwell time and achieve level
boarding.
C. Expand capacity through timely investments.
1. Make short‐term investments in rolling stock to address peak hour congestion.
2. Implement the advanced signal system (PTC) and PCEP.
3. Implement capital projects while maintaining revenue service.
4. Define post‐electrification core system capacity improvements.
5. Preserve the corridor for current and future rail uses.
D. Support a blended Caltrain/High Speed Rail system in PCEP.
1. Ensure Peninsula corridor improvements accommodate High Speed Rail’s use of the corridor.
2. Support CHSRA and the region in defining and implementing the blended system.
Chapter 2: Goals, Objectives and Standards
CALTRAIN SRTP FY2018‐2027 36
3. Address local community interests and concerns in the design and construction of the blended
system.
Focus Area 4: Finance
Establish financial stability, minimize operating subsidy and fund system improvements.
To consistently deliver excellent services and projects, Caltrain needs financial stability. To achieve this,
Caltrain strives to control its own costs and operate as efficiently as possible. The agency can also bolster
its finances by maximizing the revenues it generates through operations and by exploring new sources of
income. Ultimately, however, Caltrain is the only transit system in the Bay Area without a permanent,
dedicated source of funding. To achieve financial stability for both its operating and capital needs, Caltrain
must develop new, reliable sources of external funding.
Goals and Objectives
A. Efficiently deliver services and projects.
1. Monitor and meet MTC’s Transit Sustainability Program cost efficiency targets.
2. Monitor and set Caltrain performance targets to drive increased efficiencies and guide investment decisions.
3. Continue annual cost containment strategies.
B. Maximize revenues.
1. Develop strategies to increase returns from existing revenue streams (e.g. fares, parking, concessions,
advertising and leases).
2. Generate revenue through transit‐oriented development.
3. Explore new revenue streams.
C. Stabilize and expand external funding sources.
1. Obtain a dedicated funding source for operations and maintenance.
2. Maintain current funding streams while seeking new sources.
3. Stabilize partnership contributions.
4. Support third‐party funding strategies that align with Caltrain goals.
5. Develop funding strategy for long‐term system improvements.

Chapter 2: Goals, Objectives and Standards
CALTRAIN SRTP FY2018‐2027 37
Focus Area 5: Transportation and Land Use Serve as a critical element of the region’s transportation and land use system.
Caltrain is a key link within a local, regional and statewide network of transportation systems. As part of
this network, the agency must work with other transit operators and the region to ensure that is
customers can transfer easily between different systems. Similarly, Caltrain can enhance the experience
of its customers and the performance of its system by ensuring that riders have a wide variety of options
to access its stations. Caltrain can also add value to its corridor by helping local jurisdictions plan for land
uses that both support their community vision and contribute to ridership. Finally, Caltrain must plan for
and support the Peninsula Corridor’s role as part of a larger rail network, its ongoing accommodation of
freight, Amtrak, Capitol Corridor, and the Altamont Commuter Express and its future use by high speed
rail.
Goals and Objectives A. Improve connectivity to local and regional transportation systems.
1. Explore mutually beneficial ways to plan and coordinate services with local transit providers.
2. Prioritize partnerships and efforts related to key intermodal stations including the Transbay
Transit Center, Millbrae and San Jose Diridon.
3. Improve physical, electronic and web‐based intermodal wayfinding and transfer information.
4. Participate in and influence regional initiatives related to the integration of fares and payment,
information systems and marketing.
B. Improve multimodal station access.
1. Develop a station access plan based on the Caltrain Access Policy Statement.
2. Complement the Bikes on Board program by implementing the Caltrain Bicycle Access and Parking
Plan.
3. Pursue strategies that enhance first‐ and last‐mile connections to stations.
C. Encourage transit supportive development at and around stations.
1. Adopt a transit‐oriented development policy.
2. Participate in and influence local station area planning efforts along the corridor.
3. Develop JPB real estate assets in a way that supports the system financially and operationally with
local land use goals.
Chapter 2: Goals, Objectives and Standards
CALTRAIN SRTP FY2018‐2027 38
D. Integrate with California’s statewide rail network.
1. Support implementation of the Caltrain/HSR blended system in the Peninsula corridor with
consideration of local community interests and concerns.
2. Continue to accommodate freight and passenger tenants whose operations are compatible with
Caltrain and blended system service.
3. Partner with CHSRA, TJPA and the region, define roles and responsibilities, and implement the
blended system.
Focus Area 6: Partners and Stakeholders Build partnerships with government agencies, stakeholders, and the public. Caltrain operates in three counties and 19 cities, serving a diverse population of customers and engaging
with many different stakeholder groups. As Caltrain conducts its business it must always treat its
stakeholders and partners consistently and fairly, ensuring open communication and providing venues for
interaction and input. Encouraging participation from its partners, stakeholders and the public help
Caltrain deliver better projects and services and ensure the integrity of its process. Whether partnering
with cities to enhance stations or working with local employers to improve services, strengthening
partnerships can help Caltrain and the region achieve new goals.
Goals and Objectives A. Build relationships with openness and fairness.
1. Clearly and consistently articulate JPB goals and seek opportunities to pursue mutually beneficial
initiatives.
2. Seek and provide venues to facilitate discussions with government agencies, external groups and
the community.
3. Apply a consistent approach in time and resource management to support multiple stakeholder
initiatives.
B. Cultivate effective external participation.
1. Ensure timely public and external involvement through well‐defined planning processes.
2. Explore and utilize non‐traditional venues to maximize public participation.
3. Improve public access to agency data to encourage participation and inform stakeholder dialogue.
C. Strengthen partnerships by pursuing common goals.

Chapter 2: Goals, Objectives and Standards
CALTRAIN SRTP FY2018‐2027 39
1. Partner with cities to ensure that Caltrain stations are safe, clean, functional and active community
spaces.
2. Increase Board participation to explore new areas of common interest to build and strengthen
partnerships with employers, developers, grass roots and community groups.
3. Successfully implement joint projects through a clear understanding of roles and responsibilities.
Focus Area 7: Social Responsibility
Conduct business in a socially responsible way. Whether building a new facility, procuring energy for its trains or planning its services, Caltrain must hold
itself to a high standard of social responsibility. This means fulfilling all civil rights obligations and ensuring
that services are provided without regard for race, color or national origin and that the system is equally
accessible to persons of all abilities. More broadly, Caltrain must ensure that it serves a market that is
socially and economically representative of all the Peninsula Corridor’s communities and that the benefits
and impacts of its projects and services are distributed equitably. Social responsibility also means
minimizing Caltrain’s environmental footprint by implementing sustainable business practices and
planning for a system that has a positive environmental impact on the environment.
Goals and Objectives A. Fulfill civil rights regulations.
1. Comply with federal ADA requirements and Title VI (Civil Rights) requirements.
2. Work with FTA to facilitate the timely review and enactment of regulations.
B. Minimize Caltrain’s environmental footprint.
1. Implement and expand environmentally sustainable business practices (i.e. sustainable
procurement, construction policies, and facility and transportation operations).
2. Promote environmental stewardship through the development of Caltrain policies.
3. Improve regional air quality and reduce greenhouse gas emissions by electrifying and modernizing
the railroad.
C. Provide an inclusive and equitable system.
1. Pursue markets that are socially, geographically and economically representative of all Peninsula
corridor communities.

Chapter 2: Goals, Objectives and Standards
CALTRAIN SRTP FY2018‐2027 40
2. Strive for an equitable distribution of system benefits and project impacts throughout the corridor.
3. Evaluate geographic, social and economic equity in service planning and policy decisions (i.e. fare
structure).

Chapter 3: Service and System Evaluation
CALTRAIN SRTP FY2018‐2027 41
3 Service and System Evaluation
3.1 Performance Standards Caltrain monitors a range of performance metrics related to system performance. Table 3‐1 shows
Caltrain’s performance standards and goals for on‐time performance, customer satisfaction and farebox
recovery. These performance metrics and standards are sourced from Board adopted policies on overall
performance, customer satisfaction, and farebox recovery. Caltrain’s Strategic Plan identifies the
development and monitoring of additional performance measurements as a priority mechanism for
implementing the Strategic Plan’s policies.
Table 3‐1: Caltrain Performance Standards and Goals Performance Indicator Target
Overall Performance >95%
Overall Customer Satisfaction 4.0 on a scale of 5.0
Farebox Recovery Goal Range >65% Source: JPB, 2019.
3.2 Transit Sustainability Project Caltrain performance metrics related to a range of metrics, including on‐time performance, customer
satisfaction and farebox recovery are discussed in more detail in Chapter 3. In addition to these metrics,
Caltrain also monitors and reports on its performance as part of MTC’s Transit Sustainability Project (TSP).
MTC initiated the TSP in January 2010 to address operating and capital shortfalls experienced by transit
operators in the nine‐county San Francisco Bay Area. The purpose of the TSP is to help improve transit
performance and to attract more customers to the transit systems. To achieve this, MTC adopted the TSP
final recommendations in 2012 as MTC Resolution 4060, establishing performance requirements for the
seven largest transit operators in the region, including Caltrain. Under the terms of the TSP, each operator
must achieve a five percent reduction in at least one of the following performance measures by 2017:
Cost per revenue hour
Cost per passenger
Cost per passenger‐mile

Chapter 3: Service and System Evaluation
CALTRAIN SRTP FY2018‐2027 42
The five percent real reduction is measured against the highest reported costs between FY2008 and
FY2011 for one of the three performance measures listed above. These reductions must be maintained,
thereafter limiting any further growth to the Consumer Price Index. Caltrain adopted TSP targets in 2013
and reports annually on performance measure progress. Beginning in FY2019, MTC now links the
operating and capital funds it administers to the achievement of TSP targets. Table 3‐2 shows the five
percent reduction target for each measure compared to the baseline and highlights performance for
FY2015, FY2016, and FY2017. Note that all cost metrics are shown in 2011 dollars.
These metrics show that Caltrain fulfills its TSP obligations with strong ridership growth contributing
to substantial reductions in cost per passenger and cost per passenger mile. Caltrain will continue to
work to control costs and improve efficiency to achieve further reductions in all three of its TSP metric
categories.
Table 3‐2: Caltrain TSP Performance (FY2015‐FY2017)
Metric Baseline 5 percent Reduction
Target FY2015 FY2016 FY2017
Cost per service hour $496.40 $471.58 $535.38 $499.49 $497.12
Cost per passenger $8.18 $7.77 $5.48 $5.56 $5.79
Cost per passenger mile
$0.32 $0.30 $0.22 $0.21 $0.27
Source: JPB Transit Sustainability Program Reporting Update to MTC, 2018. Note: Costs displayed in FY2011 dollars. Costs shown are for Commuter Rail service only and do not include Caltrain shuttles services.
3.2.1 Caltrain TSP Strategies In addition to setting baseline targets, Caltrain adopted and submitted a TSP Strategic Plan in March 2013
that described how the targets would be achieved. Caltrain has implemented several strategies in the
past to improve financial performance which include the following:
Operating Costs
o Fuel Hedging program.
o Administrative cost control measures.
o Staffed ticket office closures.
Service Modifications
o Introduction of Baby Bullet in 2004.
o Reinvention of service in 2005.

Chapter 3: Service and System Evaluation
CALTRAIN SRTP FY2018‐2027 43
o Implementation of Weekend Baby Bullet service.
o Reduced service in the off‐peak.
o Addition of peak‐hour service in response to ridership growth.
As part of the TSP Strategic Plan, Caltrain will implement the following strategies to meet the TSP
reduction targets with a focus on efficiency and ridership:
Implement SOGR and reliability projects.
Support transit‐oriented development.
Support station access planning and implementation.
Provide real‐time information for customers.
Electrify Caltrain and improve service.
Explore increasing off‐peak ridership
3.3 Performance Evaluation Table 3‐3 shows six years of system performance data from FY2013 through FY2017. Metrics shown
include data reported by Caltrain to the National Transit Database (NTD) as well as key indicators tracked
internally by the agency. Figures on the subsequent page highlight trends within specific metrics for
further discussion. As discussed in the last SRTP update, Caltrain service levels fluctuated with service
reductions in FY2010 and FY2011 as prompted by the Great Recession and Caltrain’s associated financial
crisis. Changes to revenue miles and revenue hours shown in Table 3‐3 reflect this reduction and
subsequent restoration of service over the FY2010 to FY2013 period.
Caltrain’s performance over the past five years has been shaped by the system’s dramatic ridership
increase. Since the end of the Great Recession, Caltrain ridership has continued to increase without any
major net service changes on Caltrain’s part and has instead been driven by changing demographics and
economic conditions in the agency’s service area as well as the continued popularity of Caltrain’s core
commuter service. Between 2013 and 2017, Caltrain experienced a 14 percent increase in annual
ridership. A slight decrease in ridership occurred between FY2016 and FY2017. However, peak ridership
during this time period continued to increase. This overall five‐year increase was not as large as the
increase reported in the last SRTP from FY2009 to FY2014 (38 percent). Overall, the general trend of
increased ridership has led to increased revenues and improved Caltrain performance across a range of
financial and service metrics, including reduced costs per passenger and passenger mile as well as

Chapter 3: Service and System Evaluation
CALTRAIN SRTP FY2018‐2027 44
increases in the number of passengers carried per unit of service. Overall, Caltrain’s operating costs have
increased since FY2013. Increasing costs are driven by factors including the increased demands of a higher
ridership and increased labor costs, primarily from TASI contracts.

Chapter 3: Service and System Evaluation
CALTRAIN SRTP FY2018‐2027 45
Table 3‐3: Five‐Year Caltrain Performance Trends (FY2013‐FY2017)
Performance Measure Target /
Goal FY2013 FY2014 FY2015 FY2016 FY2017
2‐year change
5‐year change
Operating Costs and Fare Revenue (in 1000s)
Total Operating Costs (YOE$) (a) $101,992 $109,420 $115,404 $116,322 $127,310 9% 25%
Total Operating Costs (constant 2011 dollars) (b)
$96,017 $101,257 $104,057 $102,056 $108,038 6% 13%
Farebox Revenue $68,767 $74,846 $83,351 $86,959 $92,429 6% 34%
System Usage
Annual Ridership (c ) 16,427,450 17,759,504 18,995,161 18,355,641 18,648,850 2% 14%
Average Weekday Ridership (d) 54,934 59,340 63,852 62,444 64,248 4.2% 17%
On‐time Performance
On‐time Performance (end‐to‐end) (e ) >95% 95% 91.20% 92.20% 90.30% 89.50% ‐1% ‐6%
Customer Satisfaction
Customer Satisfaction (out of 5) (f) 4 4.04 4.05 3.93 4.01 4.05 1% 0.1%
Service Provision
Revenue Miles (passenger car) (c ) 6,694,842 6,775,525 6,841,557 7,215,731 7,336,383 2% 10%
Revenue Hours (passenger car) (c ) 191,019 192,572 194,362 204,318 217,327 6% 14%
Annual Passenger Miles (c ) 357,919,061 389,288,711 475,150,143 488,208,148 406,014,878 ‐17% 13%
Cost Effectiveness
Farebox Recovery Ratio >65
percent 67.4% 68.5% 72.2% 74.8% 72.6% 3% 8%
Operating Cost per Revenue Hour (YOE $) $471.58 $533.94 $567.68 $593.76 $569.32 $585.80 3% 10%
Operating Cost per Revenue Hour (constant 2011 dollars)
$502.66 $525.81 $535.38 $499.49 $497.12 0% ‐1%
Operating Cost per Passenger (YOE $) $6.21 $6.16 $6.08 $6.34 $6.83 8% 10%

Chapter 3: Service and System Evaluation
CALTRAIN SRTP FY2018‐2027 46
Performance Measure Target /
Goal FY2013 FY2014 FY2015 FY2016 FY2017
2‐year change
5‐year change
Operating Cost per Passenger (constant 2011 dollars)
$7.77 $5.84 $5.70 $5.48 $5.56 $5.79 4% ‐1%
Operating Cost per Passenger Mile (YOE $)
$0.28 $0.28 $0.24 $0.24 $0.31 32% 10%
Operating Cost per Passenger Mile (constant 2011 dollars)
$0.30 $0.27 $0.26 $0.22 $0.21 $0.27 27% ‐1%
Operating subsidy, per passenger $2.47 $1.72 $1.50 $1.41 $1.43 1% ‐42%
Operating subsidy, per passenger mile $0.11 $0.08 $0.06 $0.05 $0.07 23% ‐42%
Sources and Notes:
(a) Federal Transit Administration (FTA) National Transit Database (NTD). Shown in Year of Expenditure (YOE) dollars, 2013‐2017.
(b) Federal Transit Administration (FTA) National Transit Database (NTD). Shown in constant FY2011 dollars, 2013‐2017.
(c) Federal Transit Administration (FTA) National Transit Database (NTD). Fiscal Year End Submittal, 2013‐2017
(d) Federal Transit Administration (FTA) National Transit Database (NTD), 2013‐2017.
(e) Daily Operations Reports, 2013‐2017.
(f) Caltrain Customer Satisfaction Surveys, 2013‐2017. Available at http://www.caltrain.com/about/statsandreports/Surveys.html

Chapter 4: Operating Plan and Budget
CALTRAIN SRTP FY2018‐2027 47
3.3.1 Average Weekday Ridership
Caltrain’s average weekday ridership has increased steadily since FY2013 and the railroad now carries
nearly 14 percent more passengers annually. Increases in ridership are the combined result of economic
growth and demographic changes in the Caltrain service area as well as the continued success of Caltrain’s
core commuter rail service and ongoing marketing efforts to expand the railroad’s customer base.
Although a slight decrease in ridership occurred between FY2016 and FY2017, peak period ridership
continued to increase at about 2.5 percent (traditional peak riders are defined as northbound in the
morning and southbound in the afternoon). Average weekday ridership trends between FY2013 and
FY2017 are shown in Figure 3‐1.
Figure 3‐1: Average Weekday Ridership, 2013‐2017
Source: National Transit Database, 2013‐2017.
54,000
56,000
58,000
60,000
62,000
64,000
66,000
68,000
FY2013 FY2014 FY2015 FY2016 FY2017
Passengers
Fiscal Year
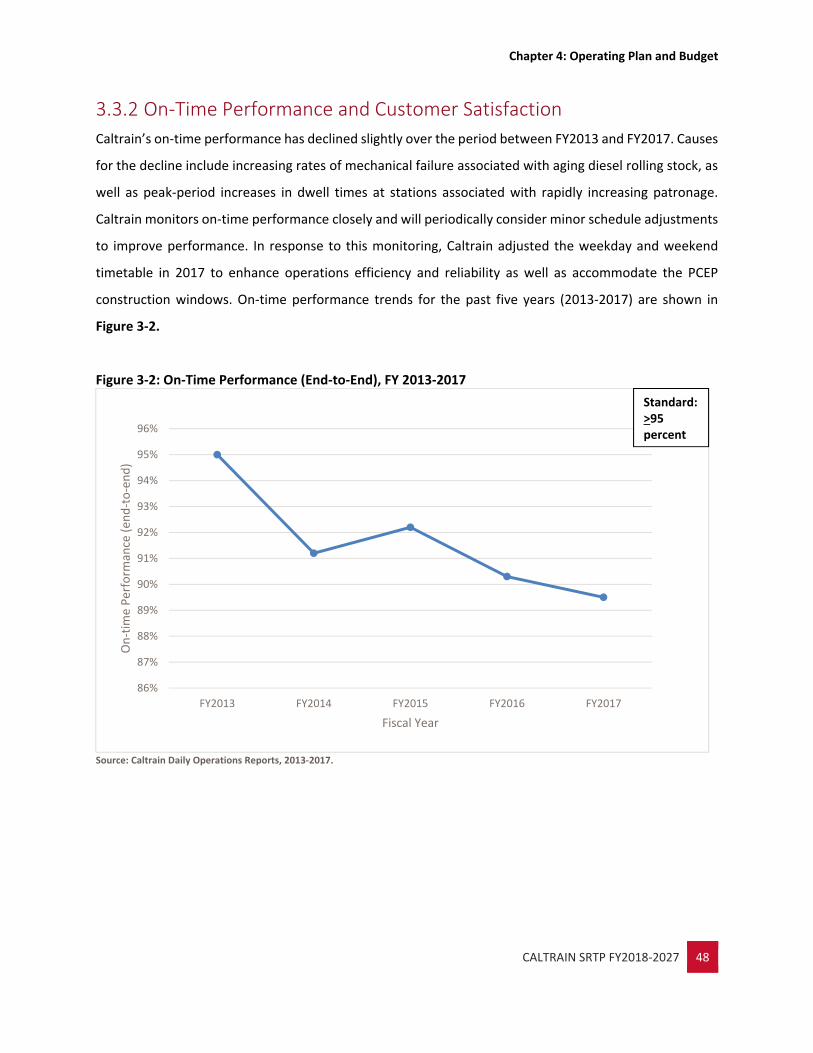
Chapter 4: Operating Plan and Budget
CALTRAIN SRTP FY2018‐2027 48
3.3.2 On‐Time Performance and Customer Satisfaction
Caltrain’s on‐time performance has declined slightly over the period between FY2013 and FY2017. Causes
for the decline include increasing rates of mechanical failure associated with aging diesel rolling stock, as
well as peak‐period increases in dwell times at stations associated with rapidly increasing patronage.
Caltrain monitors on‐time performance closely and will periodically consider minor schedule adjustments
to improve performance. In response to this monitoring, Caltrain adjusted the weekday and weekend
timetable in 2017 to enhance operations efficiency and reliability as well as accommodate the PCEP
construction windows. On‐time performance trends for the past five years (2013‐2017) are shown in
Figure 3‐2.
Figure 3‐2: On‐Time Performance (End‐to‐End), FY 2013‐2017
Source: Caltrain Daily Operations Reports, 2013‐2017.
86%
87%
88%
89%
90%
91%
92%
93%
94%
95%
96%
FY2013 FY2014 FY2015 FY2016 FY2017
On‐tim
e Perform
ance (en
d‐to‐end)
Fiscal Year
Standard: >95 percent

Chapter 4: Operating Plan and Budget
CALTRAIN SRTP FY2018‐2027 49
Caltrain conducts an annual customer satisfaction survey to assess how well the service and its contract
operator are meeting customer needs. Since 2013, overall customer satisfaction with the Caltrain system
has generally remained high, scoring at or above an average of “4” on a 1 to 5 scale in all years except for
2015. Results of the customer satisfaction survey from 2013‐2018 are shown in Figure 3‐3.
Figure 3‐3: Surveyed Overall Customer Satisfaction, FY2013‐2017
Source: Caltrain Customer Satisfaction Surveys, 2013‐2017.
3.86
3.88
3.9
3.92
3.94
3.96
3.98
4
4.02
4.04
4.06
FY2013 FY2014 FY2015 FY2016 FY2017
Customer Satisfication Rating
Fiscal Year
Standard4.0

Chapter 4: Operating Plan and Budget
CALTRAIN SRTP FY2018‐2027 50
3.3.3 Farebox Recovery Ratio Shaped by fare changes and increasing ridership, Caltrain’s farebox recovery ratio has increased
substantially since 2009. In December of 2018, the JPB adopted a farebox recovery rate goal of 65 percent
as part of the Caltrain Fare Policy (an increase from the previous 45 percent ‐ 65 percent goal). Farebox
recovery ratio trends for 2013‐2017 are shown in Figure 3‐4.
Figure 3‐4: Farebox Recovery Ratio, FY2013‐2017
Source: JPB, 2019
58.0%
60.0%
62.0%
64.0%
66.0%
68.0%
70.0%
72.0%
74.0%
76.0%
FY2013 FY2014 FY2015 FY2016 FY2017
Farebox Recovery Ratio
Fiscal Year

Chapter 4: Operating Plan and Budget
CALTRAIN SRTP FY2018‐2027 51
3.3.4 Operating Costs per Revenue Hour Caltrain’s operating cost per revenue hour increased between 2013 and 2015, but has steadily declined
starting in 2016. The initial increase can be attributed to the transition in Caltrain’s operator contract (from
Amtrak to TASI) as well as increasing costs as ridership grew sharply. Figure 3‐5 shows operating cost per
revenue hour in constant 2011 dollars to align with the target reduction goal established by Caltrain in
MTC’s Transit Sustainability Program. Caltrain seeks to control and reduce operating costs using the
strategies discussed in Chapter 4.
Figure 3‐5: Operating Costs Per Revenue Hour, FY2013‐2017 (in 2011 dollars)
Source: Federal Transit Administration (FTA) National Transit Database (NTD). Fiscal Year End Submittal, 2013‐2017.
$470.00
$480.00
$490.00
$500.00
$510.00
$520.00
$530.00
$540.00
FY2013 FY2014 FY2015 FY2016 FY2017
Fiscal Year
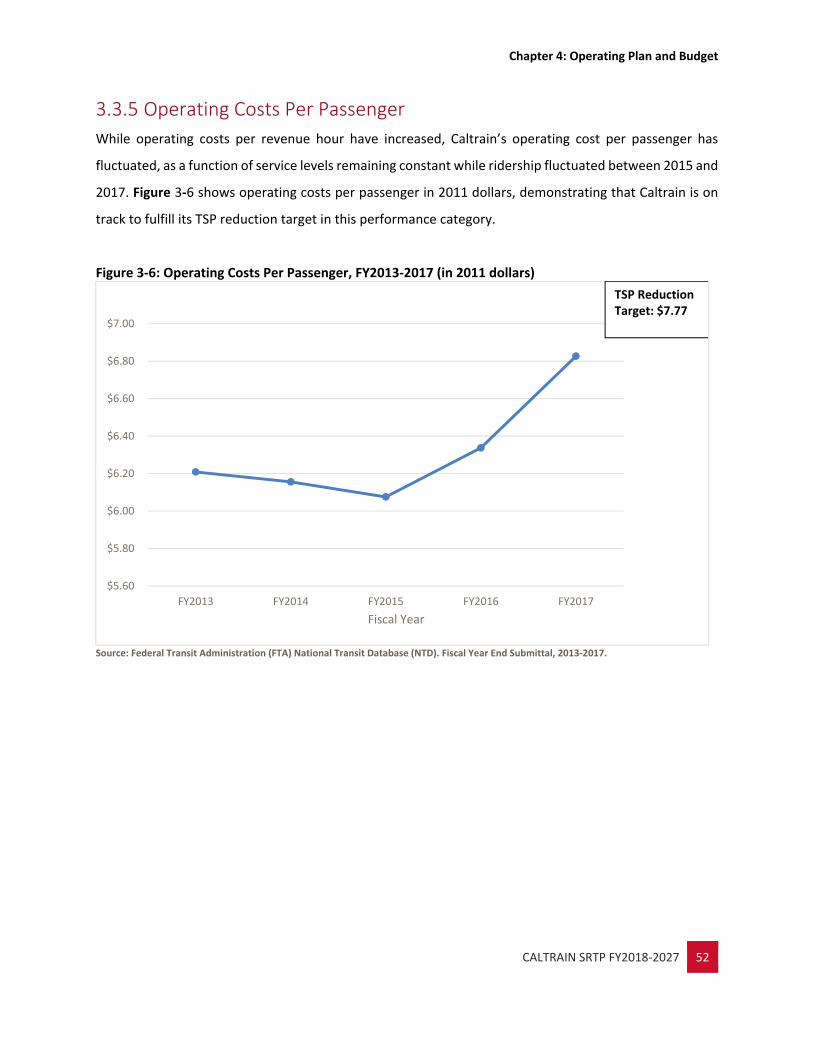
Chapter 4: Operating Plan and Budget
CALTRAIN SRTP FY2018‐2027 52
3.3.5 Operating Costs Per Passenger While operating costs per revenue hour have increased, Caltrain’s operating cost per passenger has
fluctuated, as a function of service levels remaining constant while ridership fluctuated between 2015 and
2017. Figure 3‐6 shows operating costs per passenger in 2011 dollars, demonstrating that Caltrain is on
track to fulfill its TSP reduction target in this performance category.
Figure 3‐6: Operating Costs Per Passenger, FY2013‐2017 (in 2011 dollars)
Source: Federal Transit Administration (FTA) National Transit Database (NTD). Fiscal Year End Submittal, 2013‐2017.
$5.60
$5.80
$6.00
$6.20
$6.40
$6.60
$6.80
$7.00
FY2013 FY2014 FY2015 FY2016 FY2017
Fiscal Year
TSP ReductionTarget: $7.77

Chapter 4: Operating Plan and Budget
CALTRAIN SRTP FY2018‐2027 53
3.3.6 Operating Costs Per Passenger Mile
Since 2013, passenger miles have steadily increased while ridership fluctuated slightly between 2015 and
2016. Similar to operating costs per passenger, this performance measure has also fluctuated in response
to ridership trends. Figure 3‐7 shows operating costs per passenger in 2011 dollars, demonstrating that
Caltrain is on track to fulfill its TSP reduction target in this performance category.
Figure 3‐7: Operating Costs Per Passenger Mile, FY2013‐2017 (in 2011 dollars)
Source: Federal Transit Administration (FTA) National Transit Database (NTD). Fiscal Year End Submittal, 2013‐2017.
3.4 Equipment and Facility Deficiencies There are no equipment or facility deficiencies at this time. However, several new equipment and facility
projects are planned for the upgrade to an electrified system.
$‐
$0.05
$0.10
$0.15
$0.20
$0.25
$0.30
FY2013 FY2014 FY2015 FY2016 FY2017
Fiscal Year
TSP ReductionTarget: $0.30

Chapter 4: Operating Plan and Budget
CALTRAIN SRTP FY2018‐2027 54
3.5 Community‐Based Transportation Plans Caltrain participates in the Community Based Transportation Plan (CBTP) process as requested by cities
and congestion management agencies within the Caltrain service area. While several cities along the
Caltrain corridor have recently developed CBTPs, no Caltrain projects were included in the plans. CBTPs
along the Caltrain corridor include:
San Francisco
Bayview Hunters Point
San Mateo
Bayshore
East Palo Alto
North Central San Mateo
San Bruno/South San Francisco
Santa Clara
Gilroy
3.6 Paratransit Services Paratransit services in the Caltrain service area are provided through the local transit agencies in each
county including SFMTA, SamTrans and VTA. Paratransit service is not a direct responsibility of Caltrain.
For more information, see Section 1.4.4.
3.7 Title VI Report Summary Caltrain’s Title VI Compliance Program was updated and approved by the JPB Board in November 2016.
The Title VI Program included a Language Assistance Plan (LAP) for Limited English Proficient (LEP)
populations, a Public Participation Plan aimed at engaging minority and low‐income riders, a Major Service
Change Policy, and the Service Standards and Policies. LEP efforts included new training materials for
front‐line employees assisting limited‐English proficient customers; an “I Speak” card which included
Caltrain’s 22 Safe Harbor Languages The program also included two Equity Analyses conducted on fare
changes performed in FY2015 and FY2016. The Title VI program also includes the public engagement
efforts on the Title VI elements that were undertaken prior to the program adoptions. The next update to
the Title VI Program will be submitted by November of 2019.

Chapter 4: Operating Plan and Budget
CALTRAIN SRTP FY2018‐2027 55
During the 2016 Triennial Review of PCJPB, a deficiency was found with USDOT requirements for Title VI.
The Caltrain’s Language Assistance Plan (LAP) indicates that staff will be trained in the Title VI program
and the implementation of language assistance measures identified in the LAP. At the time of the review,
Caltrain had not provided this training to agency or operating contractor staff that have direct access to
the public. The corrective action was to provide the FTA evidence that Caltrain and contractor staff were
provided LAP training as outlined in the LAP as well as evidence that LAP training would be conducted in
accordance with Caltrain’s Title VI program in the future within 90 days from the date of the final report.
3.8 FTA’s Triennial Review Summary The FTA Triennial Review site visit was conducted on March 22 through 24, 2016 with the final report
issued on May 27, 2016. The review concentrated primarily on procedures and practices employed by
Caltrain during the three years prior to the review. Based on the review, Caltrain was found to be deficient
in seven of the 17 Triennial Review areas, specifically: Financial Management and Capacity, Technical
Capacity, Maintenance, Title VI, Procurement, Disadvantaged Business Enterprise (DBE) and Drug Free
Workplace and Alcohol Program. All deficiencies have been addressed to the satisfaction of the FTA as
documented in their closeout letter to the JPB received on April 8. 2019. The deficiencies and corrective
actions implemented by Caltrain are shown in

Chapter 4: Operating Plan and Budget
CALTRAIN SRTP FY2018‐2027 56
Table 3‐4.

Chapter 4: Operating Plan and Budget
CALTRAIN SRTP FY2018‐2027 57
Table 3‐4: FTA Triennial Review Summary of Deficiencies and Corrective Actions
Review Area Deficiency Corrective Action Open Date Close Date
Financial Management and Capacity
Unresolved internal, state, or local audit findings.
The grantee must submit evidence to the FTA regional office of the resolution of the outstanding FMO review finding: Inadequate Monitoring and Self‐Assessment of Internal Controls.
5/27/16 6/24/16
Ineligible expenses charged to grant.
The grantee should document and work with the FTA Regional Office to reimburse FTA for ineligible indirect or overhead expenses charged to grants. The grantee must also submit to the FTA Regional Office procedures for ensuring that the proper indirect rates will be charged to grants.
5/27/16 2/14/18
Technical Capacity
Inadequate oversight of subrecipient/third‐party contractor/lessees.
The grantee must submit procedures and a staffing plan to the FTA regional office to monitor other entities with responsibility for meeting FTA requirements.
5/27/16 12/30/16
Maintenance Late vehicle preventive maintenance.
The grantee must submit to the FTA regional office procedures for completing preventive maintenance inspections on time. The grantee must submit to the FTA regional office a monthly report signed by the chief executive officer or other senior management designee on its preventive maintenance results until the data demonstrate it has conducted at least 80 percent of its preventive maintenance on time for three consecutive months.
5/27/16 10/13/16
Title VI Lacking a language assistance plan.
The grantee must provide the FTA RCRO with evidence of PCJPB and contractor staff training as outlined in the LAP as well as evidence that LAP training will be conducted in accordance with PCJPB’s Title VI program in the future.
5/27/16 9/28/16
Procurement No contract administration system.
The grantee must provide the FTA regional office with documentation of an adequate contract administration system. The grantee must submit revised contract administration procedures and evidence of staff training on the new procedures.
5/27/16 7/26/16
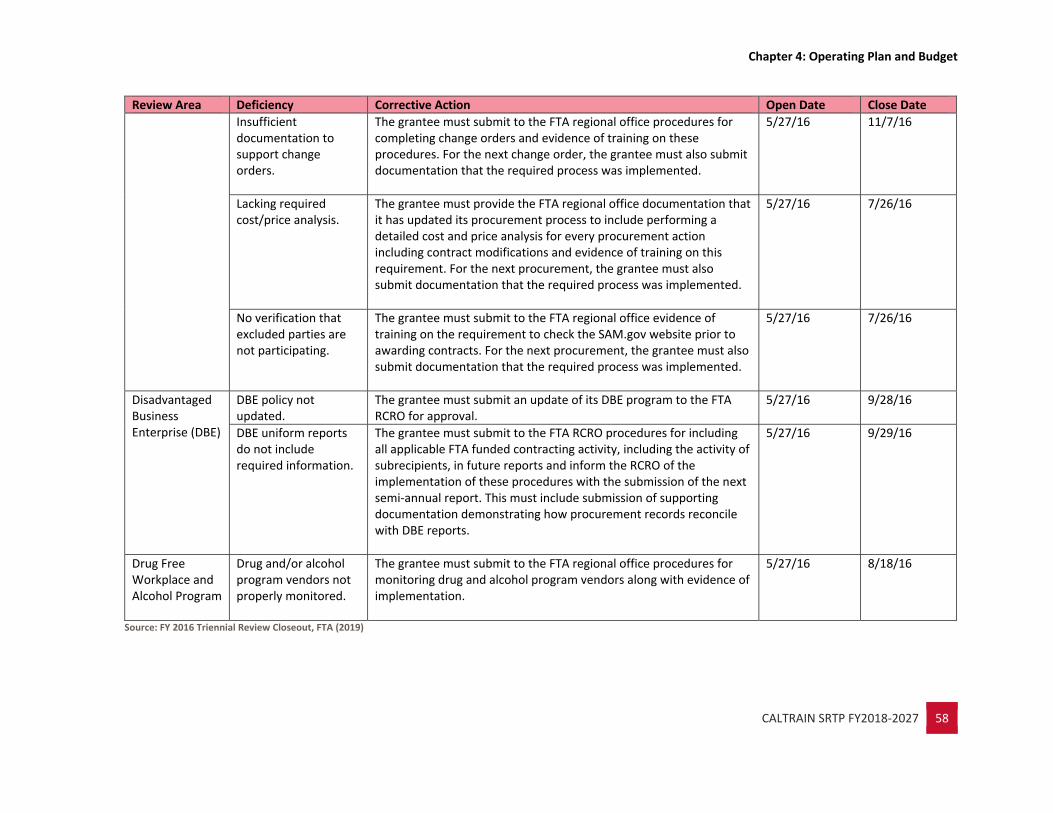
Chapter 4: Operating Plan and Budget
CALTRAIN SRTP FY2018‐2027 58
Review Area Deficiency Corrective Action Open Date Close Date
Insufficient documentation to support change orders.
The grantee must submit to the FTA regional office procedures for completing change orders and evidence of training on these procedures. For the next change order, the grantee must also submit documentation that the required process was implemented.
5/27/16 11/7/16
Lacking required cost/price analysis.
The grantee must provide the FTA regional office documentation that it has updated its procurement process to include performing a detailed cost and price analysis for every procurement action including contract modifications and evidence of training on this requirement. For the next procurement, the grantee must also submit documentation that the required process was implemented.
5/27/16 7/26/16
No verification that excluded parties are not participating.
The grantee must submit to the FTA regional office evidence of training on the requirement to check the SAM.gov website prior to awarding contracts. For the next procurement, the grantee must also submit documentation that the required process was implemented.
5/27/16 7/26/16
Disadvantaged Business Enterprise (DBE)
DBE policy not updated.
The grantee must submit an update of its DBE program to the FTA RCRO for approval.
5/27/16 9/28/16
DBE uniform reports do not include required information.
The grantee must submit to the FTA RCRO procedures for including all applicable FTA funded contracting activity, including the activity of subrecipients, in future reports and inform the RCRO of the implementation of these procedures with the submission of the next semi‐annual report. This must include submission of supporting documentation demonstrating how procurement records reconcile with DBE reports.
5/27/16 9/29/16
Drug Free Workplace and Alcohol Program
Drug and/or alcohol program vendors not properly monitored.
The grantee must submit to the FTA regional office procedures for monitoring drug and alcohol program vendors along with evidence of implementation.
5/27/16 8/18/16
Source: FY 2016 Triennial Review Closeout, FTA (2019)

Chapter 4: Operating Plan and Budget
CALTRAIN SRTP FY2018‐2027 59
4 Operating Plan and Budget This chapter presents Caltrain’s 10‐year operating plan (Table 4‐1) and the underlying assumptions behind
these projections. Since the last SRTP update in 2015, JPB now has a better understanding of capital and
operating needs associated with PCEP since key contracts have been since been awarded. These updates
are reflected in both Table 4‐3 (Operating Plan) and Table 5‐1 (CIP). It is important to note that the
Operating Budget presented in this SRTP reflects a baseline approach to Caltrain's future, in terms of
services and projects described as well as projections of revenues and expenses. It is consistent with the
JPB’s Operating Budget for FY2020. The Caltrain Business Plan, anticipated to be completed in 2019, will
identify a broader range of choices, services, investments, and changes available to Caltrain. Once
adopted, the Business Plan will largely supersede this SRTP and will serve as the record of Caltrain’s plans
going forward.
4.1 Service Plan Caltrain expects to operate a 92‐train weekday schedule with its current service pattern through FY2021
with only minor schedule modifications. In FY2022 following the implementation of PCEP, Caltrain will
significantly modify its weekday service. The discussion below and Table 4‐1 on the following page
describe how Caltrain’s service will change over the coming 10 years.
The service plan presented in Table 4‐1 assumes the implementation of PCEP and the start of mixed diesel
and electric operations in FY2022 (“mixed‐fleet service”). Within the time horizon of this SRTP (FY2022‐
FY2027) Caltrain will operate a mixture of electrified service using EMUs and diesel service using existing
diesel rolling stock. The service plan described here is based on the prototypical schedule for mixed‐fleet
service included in the Final PCEP Environmental Impact Review (FEIR) adopted in January 2015. At the
time of publishing this SRTP, the public outreach process for developing the final schedule for mixed‐fleet
service was still in process. The schedule will continue to be refined and finalized over the next few years
and will be detailed in future SRTP updates.
4.1.1 Weekday Service
Caltrain currently operates a weekday peak period maximum of five trains per hour per direction. As
shown in Table 4‐1, upon electrification of the Caltrain corridor in FY2022, weekday service will increase

Chapter 4: Operating Plan and Budget
CALTRAIN SRTP FY2018‐2027 60
from 92 train runs to 114 runs per day (six trains per hour per direction in the weekday peak period), using
a mixture of both EMU consists and diesel consists. Service south of Tamien Station (the southern limit of
the PCEP project area) will be provided using diesel equipment that will operate as through‐trains onto
the main Caltrain corridor between San Jose and San Francisco. During the weekday peak, Caltrain will
operate six trains per peak hour per direction, instead of five. The EIR’s prototypical schedule anticipates
that two of these six trains will continue to operate as Baby Bullet runs, while the remaining four will
provide limited‐stop service. During the midday period, the prototypical schedule includes all‐stop trains
at an increased frequency of every 30 minutes. Evening service is assumed to remain as an hourly all‐stop
service.
During the 10‐year timeframe of this SRTP, Caltrain will continue to operate Gilroy service much as it does
today. With the start of mixed‐fleet revenue service in FY2022, Caltrain will also continue to operate six
daily diesel trains serving the Gilroy Extension (three northbound trains during the AM peak and three
southbound trains during the PM peak). While a final service plan for mixed‐fleet operations will be
developed over the coming years, the prototypical schedule assumes that diesel trains serving Gilroy will
be operated as through‐trains north of San Jose.
Weekday ridership is anticipated to grow throughout the 10‐year period analyzed in the SRTP. Between
FY2019‐2022, a conservative ridership growth rate of 1 to 2 percent is projected based on recent trends
(discussed in more detail in Chapter 3). Ridership is expected to grow more rapidly at 4.5 percent in
FY2022, 7.5 percent in FY2023, and 6 percent in FY2024 as the introduction of increased service and
added train stops induces new ridership with the start of electrified service. Following this growth in
ridership, a return to a 1.4 percent ridership growth is projected between FY 2025 through FY2027.

Chapter 4: Operating Plan and Budget
CALTRAIN SRTP FY2018‐2027 61
Table 4‐1: Caltrain 10‐Year Service Plan
Metric FY2018 FY2019 FY2020 FY2021 FY2022* FY2023 FY2024 FY2025 FY2026 FY2027
Trains per Day 92 92 92 92 92 / 114 114 114 114 114 114
Trains per Hour 5 5 5 5 5 / 6 6 6 6 6 6
Diesel Trains (per peak direction per hour)
5 5 5 5 5 / 2 2 2 2 2 2
EMU Trains (per peak direction per hour)
0 0 0 0 0 / 4 4 4 4 4 4
Revenue Service Hours (by train)
38,570 38,570 38,570 38,570 38,570 / 41,770
41,770 41,770 41,770 41,770 41,770
Revenue Service Miles (by train)
1,356,758 1,356,758 1,356,758 1,356,758 1,356,758/ 1,707,200
1,707,200 1,707,200 1,707,200 1,707,200 1,707,200
Note: *Implementation of PCEP and the start of mixed electric and diesel fleet revenue service will begin in Q4 of FY2022. This is represented in the FY2022 column as follows: anticipated service level for Q1 – Q3 of FY2022 / anticipated service level for Q4 of FY2022 (e.g., 92 trains will operate in Q1‐Q3 / 114 trains will operate in Q4). Sources: PCEP Financial Plan to FTA for the Core Capacity Investment Grant Program, Appendix B. JPB, 2016.
Chapter 4: Operations Plan and Budget
CALTRAIN SRTP FY2018‐2027 62
4.1.2 Weekend Service and Special Event Service
Caltrain’s current weekend service includes 24 Saturday trains and 20 Sunday trains. Most of these trains
provide local, all‐stop service every 90 minutes. Caltrain also operates four Baby Bullet express trains per
direction on both Saturday and Sunday. Following the implementation of PCEP in FY2022, the prototypical
schedule assumes that Caltrain will continue to provide the same weekend service levels that it does
today; on weekends, 36 Saturday and 32 Sunday trains will be provided as hourly all‐stop service
supplemented by four express‐service trains per weekend day.
Special event service is not anticipated to change significantly between FY2018‐FY2027. From FY2018‐
FY2027, Caltrain anticipates that it will continue its practice of providing regular special event service for
baseball games at the Giant’s ballpark at China Basin as well as service to the Mountain View Station to
support select events at Levi’s Stadium in Santa Clara. Additionally, Caltrain will provide special service to
select events that generate sufficient ridership. With the planned opening in autumn 2019 of the Chase
Center, located between the San Francisco and 22nd Street Stations, service for the Golden State Warriors
home basketball games is still to be determined and will be monitored.
4.2 Caltrain‐Sponsored Shuttle Service Caltrain‐sponsored shuttle operations are largely constrained by grant funding availability. Typically, a
sponsor, such as a major private employer, underwrites at least 25 percent of the cost of the service, with
the Bay Area Air Quality Management District (BAAQMD) and/or the San Mateo County Transportation
Authority (SMCTA) providing limited year‐to‐year discretionary grant funds for some services. Caltrain
subsidizes the balance of costs. As shown in Table 4‐2, Caltrain shuttle ridership declined in FY2016 and
FY2017 due to reductions in routes subsidized. Caltrain‐sponsored shuttles carried an average of 2,289
riders per weekday in FY2018 – a decrease from the prior three years. Ridership was also impacted on a
number of Caltrain‐contracted routes during FY2018 due to an ongoing service provider operator
shortage, which continues to be a challenge in 2019.
The 10‐Year Shuttle Service Plan is shown in Table 4‐2. Shuttle ridership is projected to stabilize in FY2019
and FY2020 and grow steadily through FY2027. Basic assumptions for this service plan are:
Number of routes or vehicles held constant from FY2019 onwards.

Chapter 4: Operations Plan and Budget
CALTRAIN SRTP FY2018‐2027 63
Private sponsorship, BAAQMD, and TA funds will continue to be available at a constant rate
through FY2027.
Table 4‐2: Caltrain Shuttle 10‐year Service Plan
Fiscal Year Number of Routes (Peak
Vehicles) Revenue Miles Revenue Hours
2015 32 (36) 604,010 51,785
2016 28 (32) 566,542 50,513
2017 26 (33) 559,835 54,033
2018 26 (30) 562,506 53,130
2019 25 (29) 511,500 47,000
2020 25 (29) 511,500 47,000
2021 25 (29) 511,500 47,000
2022 25 (29) 511,500 47,000
2022 25 (29) 511,500 47,000
2024 25 (29) 511,500 47,000
2025 25 (29) 511,500 47,000
2026 25 (29) 511,500 47,000
2027 25 (29) 511,500 47,000
Source: Federal Transit Administration (FTA) National Transit Database (NTD), 2015‐2018. Notes: Totals exclude Stanford Marguerite ridership and expenses as the service is excluded from NTD reporting. Operating expenses from FY21 onward are subject to change due to new shuttle call for projects expected in FY2021 and increased vacancy due to lower commercial driver availability.
4.3 Caltrain Operating Budget Caltrain’s 10‐year Operations Financial Plan with past actuals (three‐year retrospective) is presented in
Table 4‐3. This 10‐year Operations Financial Plan is consistent with the JPB’s Operating Budget for FY2020.
The 10‐year Operations Financial Plan shows a deficit in FY2019 through FY2027 as the result of
expenditures exceeding revenues from fares, partner contributions, and other sources. This occurs
because Caltrain, unlike many other transit systems, does not have access to a dedicated source of funding
to pay for the portion of its operating costs not covered by fare revenue. Over the time horizon of the 10‐
year Operations Financial Plan, the absolute annual amount of this funding gap is projected to increase as
rail service increases in FY2022 with the start of electrified service.
Caltrain is currently developing strategies to balance the annual budget through FY2027. Over the next
several years, Caltrain will comprehensively evaluate a variety of factors that influence the system’s

Chapter 4: Operations Plan and Budget
CALTRAIN SRTP FY2018‐2027 64
operating deficit including:
Fare policy and pass programs
Additional state funding
JPB Member contributions
Cost containment strategies
The potential for securing dedicated operating funds through a three‐county sales tax ballot
measure.5
4.3.1 Operating Budget Assumptions
Caltrain’s 10‐Year Operations Financial Plan (FY2019‐FY2027) shown in Table 4‐1 is based on the major
assumptions summarized below for three main categories: service levels, revenue, and expenses.
4.3.1.1 Service Level Assumptions
See Table 4‐1 for a summary of Caltrain’s 10‐year service plan assumptions. Additional detail and
explanation on service level assumptions are below:
FY2019‐FY2022: Key service assumptions prior to PCEP implementation
No increases in service hours.
Slight changes to schedule, as needed, to accommodate PCEP construction windows.
FY2022 ‐ FY2027: Key service assumptions for after PCEP implementation
In FY2022, PCEP will begin revenue service with EMU vehicles and Caltrain will increase the level
of service it provides. Caltrain will add 22 additional trains per day with an overall increase in
service levels from 92 weekday trains to 114 weekday trains.
Caltrain’s operating budget will increase as a result of increased costs for PCEP in positive train
control and utilities due to increased electricity costs, partially offset by lower rail operator costs
and diesel fuel costs, discussed in more detail in Section 4.3.1.3.
5 In 2017, SB 797, authored by State Senator Jerry Hill, granted authority to present a ballot measure before the voters. A three‐county sales tax ballot measure could be a potential source of funds for Caltrain, but exact applications of these funds have not yet been determined nor has a ballot measure been placed before the voters of Santa Clara, San Mateo, and San Francisco counties.

Chapter 4: Operations Plan and Budget
CALTRAIN SRTP FY2018‐2027 65
4.3.1.2 Revenue/Sources of Funds
Below is a summary of revenue sources for the Operating Plan.
Operating Revenue:
Fare revenue grows annually as a function of increasing overall ridership as discussed in Section
4.1.1.
No fare increases are assumed between FY2019‐FY2027.
Fare elasticity is assumed to be ‐0.2 based on the Caltrain Fare Study (2017).6
Parking revenues are anticipated to increase in conjunction with ridership for electrification in
FY2022‐FY2024 as discussed in Section 4.1.1.
Other revenues including rental income, advertising, earned interest and other income are
anticipated to increase at 2.5 percent per year based on historical trends.
Contributions:
Operating grants primarily include State Transit Assistance Funds as shown. The State Transit
Assistance (STA) revenue is generated from the statewide sales tax on diesel fuel and is allocated
to the region’s transit operators by formula. The formula allocates funds on the basis of
population, amount of passenger fares and local support revenues collected by transit operators.
JPB Member Agency Contributions are shown to remain constant between FY2020 and FY2027.
Member agencies negotiate contributions each fiscal year, and it is subject to change. This is a
potential future opportunity to increase funding for the projected operating deficits.
Under the terms of the JPA, each JPB member contributes towards Caltrain operating expenses,
and each share is proportionate to the boardings at stations in each county. During the 2000s, JPB
member contributions to the operating budget consistently totaled over $35 million (in year of
expenditure dollars) peaking at nearly $40 million in FY 2010. Following the Great Recession,
contributions were constrained by the reduced budgets of individual member agencies. With the
Bay Area’s economy now fully recovered, updated analysis from the FFGA Financial Plan (2016)
indicates that there is financial capacity to restore member contributions to a level closer to their
6. More information on the Caltrain Fare Study can be found on the Caltrain Website: http://www.caltrain.com/projectsplans/Plans/FareStudy.html

Chapter 4: Operations Plan and Budget
CALTRAIN SRTP FY2018‐2027 66
historic norm.
4.3.1.3 Expenses/Uses of Funds
Below is a summary of expenses for the 10‐year Operating Plan.
Contracted Operating Expenses (Operating and Maintenance):
Underlying contractor operating costs are expected to increase 4 percent per year based on the
terms of Caltrain’s existing contract with TASI.
Significant anticipated additions and reductions to operating costs include:
Added costs related to maintenance of the PTC system starting in FY2019.
Added costs related to the maintenance of PCEP infrastructure including the wayside traction
power facilities and overhead catenary system starting in FY2022.
Added costs related to the maintenance of 133 EMU vehicles beginning in FY2022.
Added costs related to additional crews required to provide increased service level in FY2022.
Reduced maintenance costs realized through the retirement of a portion of the diesel fleet in
FY2022.
Other Operating Expenses
Underlying fuel prices are anticipated to increase an average of 3 percent per gallon per year after
FY2020.
Underlying electricity prices are anticipated to increase an average of 3.5 percent per kilowatt‐
hour (kWh) per year.
All other operating expenses listed in Table 4‐3 are anticipated to increase between 2 to 4 percent
per year.
Security services are anticipated to increase by about 5 percent per year. Caltrain’s Safety and
Security Program encompasses: security guard services along the Caltrain system (including
operating facilities and various train stations), transit police services (contracted through the San
Mateo County Sheriff’s Department), CFR 49 Part 273 Public Transportation Agency Safety
Program, Transit America Safety monitoring, First Responder services, OSHA/Cal OSHA
compliance, and Operation Life Saver programming and education.7
7 For more information on Operation Lifesaver, a national Rail Safety Education organization, visit https://oli.org/.

Chapter 4: Operations Plan and Budget
CALTRAIN SRTP FY2018‐2027 67
Administrative Expenses
Wages and benefits are projected to increase by 3.5 percent per year. All other administrative
expenses are projected to increase at 2.5 percent per year.
Pension and other post‐employment benefit (OPEB) costs are based on 2018 valuations and are
included in the administrative costs.
Long‐Term Debt Service
The 10‐year operating budget includes the current debt service schedule based on the 2019 debt
issuance and refinancing.

Chapter 4: Operations Plan and Budget
CALTRAIN SRTP FY2018‐2027 68
Table 4‐3: Caltrain 10‐Year Operations Financial Plan with Past Actuals (YOE$, in Millions)
Program/Project FY2016 Actual
FY2017 Actual
FY2018 Actual
FY2019* FY2020* FY2021* FY2022* FY2023* FY2024* FY2025* FY2026* FY2027*
REVENUES
Farebox Revenue 87.0 92.4 97.1 103.5 106.0 107.5 112.3 122.0 129.7 131.5 133.4 135.3
Parking Revenue 5.0 5.8 5.6 5.5 5.5 5.5 5.6 5.7 5.8 5.8 5.8 5.8
Shuttles 2.2 2.1 2.2 2.0 2.5 2.6 2.7 2.7 2.8 2.9 3.0 3.1
Rental Income 1.8 1.9 2.1 2.1 2.1 2.1 2.2 2.2 2.3 2.3 2.4 2.4
Other Income 0.7 3.1 2.2 2.2 1.6 1.6 1.7 1.7 1.8 1.8 1.8 1.9
Total Operating Revenue 96.7 105.3 109.1 115.3 117.7 119.3 124.4 134.4 142.4 144.4 146.4 148.5
Total Contributed Revenue 25.9 26.6 26.4 30.9 37.0 37.0 37.0 37.0 37.0 37.0 37.0 37.0
GRAND TOTAL REVENUE 122.6 132.0 135.6 146.2 154.6 156.3 161.4 171.4 179.4 181.4 183.4 185.5
EXPENDITURES
Contract Operating/Maintenance 78.8 86.1 89.2 94.1 99.8 108.1 116.5 122.7 127.7 132.9 138.3 143.9
Shuttles Services 4.9 4.6 4.7 4.3 5.3 5.4 5.6 5.8 6.0 6.1 6.3 6.5
Fuel and Lubricants 8.3 8.6 10.3 10.8 11.0 11.3 9.6 3.2 3.3 3.4 3.5 3.6
Timetables and Tickets 0.1 0.1 0.1 0.1 0.1 0.1 0.2 0.2 0.2 0.2 0.2 0.2
Insurance 0.0 7.1 1.2 5.8 4.5 4.7 4.9 5.4 5.8 6.1 6.4 6.7
Facilities/Equipment Maintenance 1.9 2.5 2.6 2.7 3.3 3.4 3.5 3.6 3.8 3.9 4.0 4.1
Utilities 2.0 2.0 1.9 1.9 2.1 2.2 4.5 11.2 11.6 12.0 12.5 12.9
Maint. Services: Building/Other 1.3 1.2 1.3 1.3 1.6 1.6 1.7 1.7 1.8 1.8 1.9 1.9
Total Operating Expense 97.4 112.2 111.4 120.9 128.7 137.0 146.4 153.9 160.1 166.4 173.0 179.8
Total Administrative Expense 20.5 20.4 21.6 24.6 24.4 25.2 26.1 27.1 28.0 28.9 29.8 30.7
Long Term Debt Expense 1.3 1.3 1.5 1.6 2.6 2.4 3.5 3.5 3.5 3.5 3.5 3.5
GRAND TOTAL EXPENSE 119.1 133.9 134.5 147.1 155.7 164.6 176.0 184.4 191.5 198.8 206.2 213.9
NET SURPLUS/ (DEFICIT) 3.5 (2.0) 1.1 (0.9) (1.1) (8.3) (14.7) (13.0) (12.2) (17.4) (22.7) (28.4)

Chapter 4: Operations Plan and Budget
CALTRAIN SRTP FY2018‐2027 69
Program/Project FY2016 Actual
FY2017 Actual
FY2018 Actual
FY2019* FY2020* FY2021* FY2022* FY2023* FY2024* FY2025* FY2026* FY2027*
REV. ENHANCEMENT/COST CONTAINMENT
‐ 2.0 ‐ 0.9 1.1 8.3 14.7 13.0 12.2 17.4 22.7 28.4
REVISED NET SURPLUS/(DEFICIT) 3.5 ‐ 1.1 ‐ ‐ ‐ ‐ ‐ ‐ ‐ ‐ ‐ Source: Comprehensive Annual Financial Reports (Audited Actuals, FY2016‐2018); Projections (FY2019‐2028), JPB, 2019. Notes: Asterisk (*) indicates figures are projections. The 10‐Year Operations Plan reflects a baseline approach to Caltrain's future. This 10‐Year Operations Plan aligns with the JPB’s FY2020 Operating Budget. The Caltrain Business Plan, anticipated to be completed in 2019, will identify a broader range of choices, services, investments and changes available to Caltrain.
Chapter 5: Capital Improvement Program
CALTRAIN SRTP FY2018‐2027 70
5 Capital Improvement Program This chapter presents Caltrain’s 10‐year CIP, which includes individual capital projects and the capitalized
maintenance of existing assets (tracks and related infrastructures, systems, facilities and equipment). The
CIP supports the operations and services set forth in the operating plan and budget described in Chapter
4 and provides the basis for requests for federal, state, and regional funding for capital replacement,
rehabilitation, and expansion projects. The 10‐year CIP is shown in Table 5‐1. It reflects a baseline
approach to Caltrain's next ten years, in terms of grant funds and applications to projects and other capital
needs. While the capital budget that the JPB Board adopts each year is constrained to available funding,
the 10‐year CIP represents the unconstrained capital needs for Caltrain from FY2020 forward. The Caltrain
Business Plan, anticipated to be completed in 2019, will identify a broader range of choices, services,
investments and changes available to Caltrain. Once adopted, the Business Plan will largely supersede this
SRTP and will serve as the record of Caltrain’s plans going forward.
The following section provides additional detail on specific projects and programs encompassed within
the CIP’s larger program areas. A full inventory of the current Caltrain revenue fleet as well as
replacement, rehabilitation, expansion, and non‐revenue vehicle details can be found in Appendix A.
5.1 Capital Projects The Caltrain 10‐year CIP presented in this SRTP is a $3 billion program that is focused on maintaining a
SOGR, implementing operational enhancements, and modernizing the Caltrain system. Major program
areas and key capital projects within the Caltrain 10‐year CIP are described below:
SOGR and Contingency: This capital program includes the set of ongoing and specific
rehabilitation and capitalized maintenance activities required to maintain Caltrain’s existing and
planned structures, facilities and rolling stock. It also includes costs associated with planning,
programming, and development activities related to capital projects as well as an annual set‐ aside
for unforeseen and emergency capital expenditures.
Safety/Security and Legal Mandates: This program area concerns projects related to safety and
security of Caltrain facilities and equipment, as well as legal mandates.
Peninsula Corridor Electrification Project: PCEP includes the electrification of the corridor from
San Francisco to San Jose and the procurement of new, electric‐powered rolling stock (EMUs).

Chapter 5: Capital Improvement Program
CALTRAIN SRTP FY2018‐2027 71
Caltrain Positive Train Control: PTC includes the introduction of a new train control and signal
system to comply with legal mandates.
Electrification Expansion Project: This project includes the procurement of additional EMUs,
improvements to Caltrain’s wayside bike parking facilities, and improvements to Caltrain’s
Broadband infrastructure.
South San Francisco Improvement Project: This project includes the reconstruction of the South
San Francisco Station and the introduction of a new bicycle and pedestrian undercrossing.
25th Avenue Grade Separation Project: This project in the City of San Mateo includes the
reconstruction of the Hillsdale Station, as well as three new crossings under the Caltrain corridor,
including 25th Avenue.
5.1.1 State of Good Repair and Contingency Program
Caltrain’s SOGR and Contingency Program includes two main types of projects. Caltrain’s support and
contingency program includes capital program development and management costs associated with
planning, programming, and development activities. These are needed to ensure development of
accurate project scopes, cost estimates and implementation schedules, as well as the management of
capital budget and programming processes, grant development, project and program controls, and capital
program management systems. The contingency program includes an annual set‐aside for unforeseen
and emergency capital expenditures. Caltrain recently adopted the Transit Asset Management (TAM)
Plan; see Section 1.7 for more information.
One of the primary goals of the CIP is to keep the railroad in a constant SOGR. As structures, facilities, and
vehicles progress through and exceed their useful lives, they require rehabilitation and replacement.
Caltrain’s 10‐year SOGR Program supports the safety, reliability, and performance of the system by
ensuring that the railroad’s assets function as intended and realize their full value. The SOGR Program is
subdivided into the categories below and include projects that address the rehabilitation and replacement
of specific systems.
Bridge and Civil Structure Replacement: This program identifies those bridges or other major
structures that have reached the end of their useful life or do not meet current seismic standards.
Projects are identified through the JPB’s annual bridge inspection program. The CIP includes
funding for the rehabilitation and replacement of major civil structures over the coming 10 years.
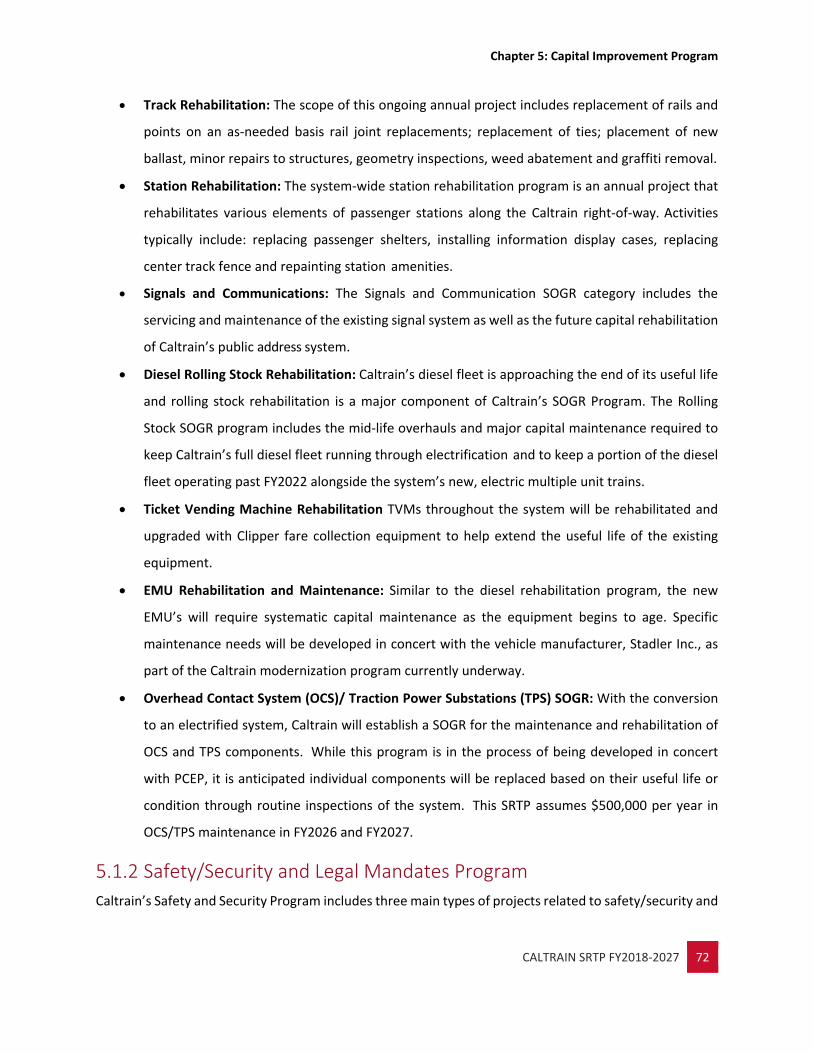
Chapter 5: Capital Improvement Program
CALTRAIN SRTP FY2018‐2027 72
Track Rehabilitation: The scope of this ongoing annual project includes replacement of rails and
points on an as‐needed basis rail joint replacements; replacement of ties; placement of new
ballast, minor repairs to structures, geometry inspections, weed abatement and graffiti removal.
Station Rehabilitation: The system‐wide station rehabilitation program is an annual project that
rehabilitates various elements of passenger stations along the Caltrain right‐of‐way. Activities
typically include: replacing passenger shelters, installing information display cases, replacing
center track fence and repainting station amenities.
Signals and Communications: The Signals and Communication SOGR category includes the
servicing and maintenance of the existing signal system as well as the future capital rehabilitation
of Caltrain’s public address system.
Diesel Rolling Stock Rehabilitation: Caltrain’s diesel fleet is approaching the end of its useful life
and rolling stock rehabilitation is a major component of Caltrain’s SOGR Program. The Rolling
Stock SOGR program includes the mid‐life overhauls and major capital maintenance required to
keep Caltrain’s full diesel fleet running through electrification and to keep a portion of the diesel
fleet operating past FY2022 alongside the system’s new, electric multiple unit trains.
Ticket Vending Machine Rehabilitation TVMs throughout the system will be rehabilitated and
upgraded with Clipper fare collection equipment to help extend the useful life of the existing
equipment.
EMU Rehabilitation and Maintenance: Similar to the diesel rehabilitation program, the new
EMU’s will require systematic capital maintenance as the equipment begins to age. Specific
maintenance needs will be developed in concert with the vehicle manufacturer, Stadler Inc., as
part of the Caltrain modernization program currently underway.
Overhead Contact System (OCS)/ Traction Power Substations (TPS) SOGR: With the conversion
to an electrified system, Caltrain will establish a SOGR for the maintenance and rehabilitation of
OCS and TPS components. While this program is in the process of being developed in concert
with PCEP, it is anticipated individual components will be replaced based on their useful life or
condition through routine inspections of the system. This SRTP assumes $500,000 per year in
OCS/TPS maintenance in FY2026 and FY2027.
5.1.2 Safety/Security and Legal Mandates Program
Caltrain’s Safety and Security Program includes three main types of projects related to safety/security and

Chapter 5: Capital Improvement Program
CALTRAIN SRTP FY2018‐2027 73
legal mandates. The Caltrain safety and security program includes but is not limited to the installation or
replacement of: right‐of‐way fencing, physical barriers at stations and key infrastructure, upgraded
closed‐circuit television systems (CCTV) at stations and Caltrain facilities, and camera systems on‐board
vehicles. With over 70 at‐grade crossings along the Caltrain line between Gilroy and San Francisco, Caltrain
has a robust program of annual grade crossing improvements to keep the crossings in a state of good
repair and to incorporate the newest safety features. The legal mandates annual project is for various
legal mandates that Caltrain must meet each year, ranging from storm water management to bridge load
rating calculations.
5.1.3 Peninsula Corridor Electrification Project PCEP includes a series of major capital investments in the Caltrain corridor that will electrify and upgrade
the performance, operating efficiency, capacity, safety and reliability of Caltrain’s commuter rail service.
Scheduled to be implemented by FY2022, PCEP is a $1.98 billion project that consists of replacing 75
percent of Caltrain’s diesel trains with EMUs for service between the 4th and King Street Station in San
Francisco and the Tamien Station in San Jose. The project includes the installation of a new 25‐kWh
overhead contact system between San Jose and San Francisco to power the new EMUs. PCEP also included
modifications to the Central Maintenance and Operations Facility (CEMOF) to provide for the
maintenance of the new EMUs.
5.1.4 Positive Train Control PTC is a complex signaling and communications technology to enhance the safety of the Caltrain system
to prevent train‐to‐train collisions, and over‐speed derailments. PTC is a federal mandate for railroads
across the country in response to a preventable train‐to‐train collision in Southern California. Caltrain’s
PTC system will be fully operational by 2020.
5.1.5 Electrification Expansion Project Caltrain’s electrification expansion project includes three components, described below:
EMU Increase to All Seven‐car Trains: This project will exercise options on the JPB’s existing
contract with Stadler Inc. for the procurement of 37 additional EMUs to increase capacity of the
electrified system and provide additional capacity Caltrain between San Jose and San Francisco.
This EMU order will provide Caltrain with three additional seven‐car EMU consists and will extend
the existing order of 16 six‐car consists to seven cars each by 2022.

Chapter 5: Capital Improvement Program
CALTRAIN SRTP FY2018‐2027 74
Broadband Communications: The project will install corridor wide broadband communications.
The system will have several public and railroad‐facing uses including “over the road” diagnostics
during failure and regular maintenance events, remote downloading of passenger count
information to enable tailoring of on‐board capacity needs; faster PTC initialization times; and Wi‐
Fi for passengers and dynamic display of on‐board information such as schedules, service
disruptions, and special event information.
Wayside Bike Parking Improvements: Caltrain will seek to enhance ridership and safeguard
capacity on the electrified system by implementing a robust wayside bike parking program as
defined through its recently adopted Bicycle Parking Management Plan (2017). It is essential that
the agency provide a viable system of bike parking amenities at its stations as an attractive
supplement and alternative to having passengers bring their bike on board the train.
5.1.6 South San Francisco Station Improvement Project
The purpose of the project is to rebuild a 1950s‐era station that is at the end of its useful life and is
deficient from an operational, passenger and ADA perspective. The new station will improve the Caltrain
customer experience and safety in the station area, as well as provide connectivity between the east side
and west side of the station for pedestrians and cyclists.
5.1.7 25th Avenue Grade Separation The overall project will construct a two‐track elevated structure, grade‐separating the existing at‐grade
crossing at 25th Avenue in San Mateo, and also create two new grade separated crossings at 28th and 31st
Avenues. The elevated structure will also necessitate the relocation of the existing Hillsdale Caltrain
Station northward between 28th and 31st Avenues.
5.2 CIP Funding Assumptions The CIP is assumed to be funded using sources expected to be available and/or committed over the 10‐
year period. These include federal, state and local funding that are reasonably expected to be
programmed based on existing fund programming policies. In general, these funds are available to
support rehabilitation and replacement projects to maintain the railroad in a SOGR and avoid a system of
deferred maintenance. Local sales tax and other earmarked funding are also available to finance capacity
expansion and other related improvements to the Caltrain system, as well as local access improvements.

Chapter 5: Capital Improvement Program
CALTRAIN SRTP FY2018‐2027 75
Federal, state, and local match funds for capital improvements are assumed to remain at historical levels.
It is assumed, per the JPA, that the three member agencies share equal thirds of local capital matching
funds for system‐wide improvement projects. Funds from San Mateo, Santa Clara, and San Francisco
County sales tax measures are available to fund system‐wide and county‐specific projects included in each
county’s sales tax expenditure plans.
The following section provides detailed information about the funding sources used within the capital
planning financial analysis. Changes in the financial assumptions, particularly regarding revenue growth
and eligible uses of funds, may change the findings of the capital program’s financial analysis. The
revenues identified in the CIP are subject to member agency allocations and agreements, and regional
and state programming policies.
5.2.1 State of Good Repair Caltrain’s near‐term SOGR needs are driven by the timing of mid‐life overhauls and engine rehabilitations
within its fleet. All of these SOGR activities are important, necessary and will be completed. Caltrain has
some ability, however, to prioritize and adjust the timing of individual SOGR activities within the FY2018‐
FY2027 time period based on the year‐to‐year availability of funds. Caltrain will prioritize immediately
available funding to those SOGR activities that most directly support the safe, reliable operation of the
system.
5.2.2 Peninsula Corridor Electrification Project In May 2017, Caltrain achieved the final milestone to fund the Caltrain electrification project – execution
of the Full Funding Grant Agreement (FFGA) with the Federal Transit Administration (FTA). With the
finalization of this $647 million grant, Caltrain secured the last of financial commitments necessary to
embark on this $1.98 billion project. The funding plan includes a mix of federal, state, regional and local
funding sources.
5.2.3 Positive Train Control The Caltrain PTC project will implement federally mandated rail safety technology that will help prevent
train to train collisions, over‐speed derailments, and movement of trains through improperly positioned
switches. The current project budget is $291 million and is fully funded through federal, state and local
sources.

Chapter 5: Capital Improvement Program
CALTRAIN SRTP FY2018‐2027 76
5.3 Funding Sources The following sources of funding are assumed as part of Caltrain’s CIP and are shown in Table 5‐1.
5.3.1 Federal Funding Federal Transit Administration Formula Funding
The Federal Transit Administration provides funding to support mass transportation services to the public.
The funding that Caltrain receives to finance capital projects includes Section 5307 urbanized area formula
funds and Section 5337 SOGR grants. MTC establishes the policy for programming Sections 5307 and 5337
funds, which are the two major sources that Caltrain receives for transit capital replacement and
rehabilitation projects. Sections 5307 and 5337 funds are allocated by formulas and MTC establishes the
criteria to distribute funding in these two programs to eligible transit operators to ensure, first and
foremost, that the existing system is replaced, rehabilitated, and maintained in good working order before
any capacity expansion projects would be funded.
Urbanized Area Formula Funds (5307)
This funding program provides for the acquisition, construction, improvement, and maintenance of transit
facilities and equipment. Resources are allocated to urban areas according to a formula and are usually
matched on an 80 percent federal, 20 percent local basis.
State of Good Repair Program (5337)
This funding program provides capital assistance for maintenance, replacement, and rehabilitation
projects of existing high‐intensity fixed guideway and high‐intensity motorbus systems to maintain a
SOGR. Additionally, SGR grants are eligible for developing and implementing Transit Asset Management
plans. Caltrain receives a portion of these funds annually.
Capital Investment Grant Program Core Capacity Funding
FTA’s Core Capacity program is part of its discretionary Capital Investment grant program. Eligible projects
must expand capacity by at least 10 percent in existing transit corridors that are already at or above
capacity or are expected to reach that point within five years. PCEP received a Full Funding Grant
Agreement for $647 million from the Core Capacity program in FY2017.
Chapter 5: Capital Improvement Program
CALTRAIN SRTP FY2018‐2027 77
Federal Highway Administration (FHWA) STP/ CMAQ
The Congestion Mitigation and Air Quality Improvement Program (CMAQ) provides funding for Clean Air
Act projects, State Implementation Plan Projects, and other projects that the Department of
Transportation and the federal Environmental Protection Agency determine will help attain mandated air
quality standards. Demonstration service projects are eligible for this funding source. MTC has used CMAQ
funds to fund bus retrofit projects to install clean air emission devices on urban coaches. Funds are
apportioned to every state based on the population in “non‐attainment” areas, adjusted in line with the
severity of the pollution. The Bay Area has been designated as one of these non‐attainment areas.
The Surface Transportation Program (STP) provides funding for highways, bridges, transit capital, bicycle
and car pool programs, and other multimodal uses. It provides flexible funding that may be used for transit
capital projects, and intra‐city and intercity bus terminals and facilities (MAP‐21). This plan assumes that
MTC will continue the current programming policy for STP and CMAQ funds as it is anticipated the funding
needs for transit capital projects will continue to grow and will likely exceed the growth in funding
availability.
Federal Railroad Administration
The Federal Railroad Administration (FRA) provides discretionary grants to develop safety improvements
and encourage the expansion and upgrade of passenger and freight rail infrastructure and services
throughout the nation. Caltrain has received grants to support PTC and the grade crossing improvements
along the Caltrain right‐of‐way.
5.3.2 State Funding Senate Bill 1
Senate Bill 1 (SB1), the Road Repair and Accountability Act of 2017, was signed into law on April 28, 2017.
This legislative package invests $54 billion over the next decade to fix roads, freeways and bridges in
communities across California and puts more dollars toward transit and safety. These funds will be split
equally between state and local investments. There are several funding programs contained in SB1,
including the SOGR: SB1’s funding program for transit is the SOGR Program. This program provides
funding of approximately $105 million annually to the State Transit Assistance (STA) Account. These funds
are to be made available for eligible transit maintenance, rehabilitation and capital projects.

Chapter 5: Capital Improvement Program
CALTRAIN SRTP FY2018‐2027 78
Transit and Intercity Rail Capital Program (TIRCP)
The TIRCP provides grants from the Greenhouse Gas Reduction Fund to fund transformative capital
improvements that will modernize California’s intercity, commuter, and urban rail systems, and bus and
ferry transit systems, to significantly reduce emissions of greenhouse gases, vehicle miles traveled, and
congestion. A project must demonstrate that it will achieve a reduction in greenhouse gas emissions using
the California Air Resources Board (CARB) quantification methodology.
State Rail Assistance (SRA)
State Rail Assistance provides the state’s commuter and intercity rail agencies with dependable, annual
revenue that can be invested in the most cost‐effective manner to improve rail service including both
operations and capital investments.
State Transit Assistance
State Transit Assistance, or STA, funds are generated by the sales tax on diesel fuel, and the amount of
money available for transit agencies varies from year to year based on the ups and downs of diesel prices.
The State allocates funds to transit operators based on their revenue and may be used by transit operators
for both capital projects and transit operations.
High Speed Rail Funding
In 2012, the State allocated over $700 million to CalMod projects including $600 million in High Speed
Passenger Train Bond Program funds (Proposition 1A) to the construction of the PCEP and $105 million in
Proposition 1A connectivity funds to the implementation of PTC. In 2016, the CHSRA committed an
additional $113 million to the PCEP, above and beyond the original $600 million commitment. In 2018,
the CHSRA authorized over $70 million to help fund the 25th Avenue Grade Separation Project in the City
of San Mateo.
Proposition 1B
This program provided both formula and competitive grant funds for several SOGR and enhancement
projects. The Proposition 1B programs sunset in FY2016 and no additional funding is assumed beyond the
funds that have already been programmed and shown in the CIP.

Chapter 5: Capital Improvement Program
CALTRAIN SRTP FY2018‐2027 79
Low Carbon Transportation Operations Funding (LCTOP)
The LCTOP Program provides cap and trade funds on a formula basis to transit agencies to help fund
transit projects and transit operations that reduce greenhouse gases. The JPB is allocating $9 million of its
formula share of LCTOP funds to PCEP through FY2027.
Public Utilities Commission Programs
PUC 130 is a funding program administered by the California Public Utilities Commission (CPUC) for at‐
grade crossing safety improvements while PUC 190 is a funding program for rail grade separation projects.
The JPB assumes funding from both of these state programs, based in part on historical grant amounts,
and the relative ranking priorities of Caltrain projects established by the CPUC.
5.3.3 Local Funding Sources The following sources of local revenues are assumed in the capital program. Most of the local sources
have already been earmarked for specific projects in the expenditure plan of the respective county’s sales
tax measures.
Regional Bridge Tolls
The MTC provides a portion of bridge toll revenues for transit projects on or near bridge corridors that
help to relieve bridge traffic and/or provide alternative public transit services. Bridge toll revenues
apportioned to transit operators serve as state and local match for Caltrain and other operators to
leverage federal capital funds. The first priority for matching funds is given to projects funded under the
federal Section 5307 and 5337 programs. The MTC also provided $39 million in bridge toll funds to PCEP.
Member Agency Funds
Each of the three JPB members contributes an equal share of capital funds to support Caltrain CIP on an
annual basis. The sources of funds per member varies based on the availability of local sales tax or bond
funds. Aside from specific funding contributions for PCEP or other significant capital projects, each
member contributed $7.5 million for the Caltrain annual capital program in FY2019. The amount of
funding provided by each agency is negotiated annually based on capital needs. For the purpose of this
SRTP, each member agency share is projected to remain at $7.5 million, adjusted annually for inflation.

Chapter 5: Capital Improvement Program
CALTRAIN SRTP FY2018‐2027 80
Carl Moyer Funding/Bay Area Air Quality Management District
The Carl Moyer Memorial Air Quality Standards Attainment Program (Carl Moyer Program) is a state‐
funded discretionary program offering grants to reduce air pollution emissions from heavy‐duty engines.
The program is administered by BAAQMD, which awarded $20 million in funding to PCEP in 2015.
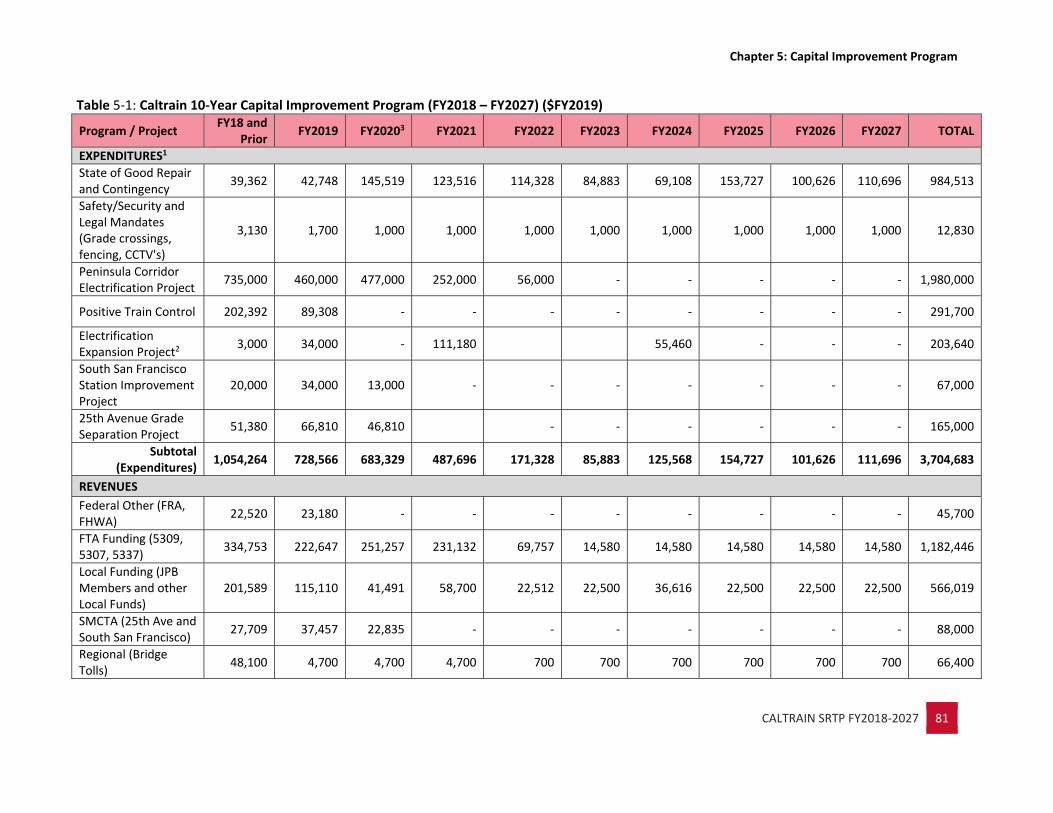
Chapter 5: Capital Improvement Program
CALTRAIN SRTP FY2018‐2027 81
Table 5‐1: Caltrain 10‐Year Capital Improvement Program (FY2018 – FY2027) ($FY2019)
Program / Project FY18 and
Prior FY2019 FY20203 FY2021 FY2022 FY2023 FY2024 FY2025 FY2026 FY2027 TOTAL
EXPENDITURES1
State of Good Repair and Contingency
39,362 42,748 145,519 123,516 114,328 84,883 69,108 153,727 100,626 110,696 984,513
Safety/Security and Legal Mandates (Grade crossings, fencing, CCTV's)
3,130 1,700 1,000 1,000 1,000 1,000 1,000 1,000 1,000 1,000 12,830
Peninsula Corridor Electrification Project
735,000 460,000 477,000 252,000 56,000 ‐ ‐ ‐ ‐ ‐ 1,980,000
Positive Train Control 202,392 89,308 ‐ ‐ ‐ ‐ ‐ ‐ ‐ ‐ 291,700
Electrification Expansion Project2
3,000 34,000 ‐ 111,180 55,460 ‐ ‐ ‐ 203,640
South San Francisco Station Improvement Project
20,000 34,000 13,000 ‐ ‐ ‐ ‐ ‐ ‐ ‐ 67,000
25th Avenue Grade Separation Project
51,380 66,810 46,810 ‐ ‐ ‐ ‐ ‐ ‐ 165,000
Subtotal (Expenditures)
1,054,264 728,566 683,329 487,696 171,328 85,883 125,568 154,727 101,626 111,696 3,704,683
REVENUES
Federal Other (FRA, FHWA)
22,520 23,180 ‐ ‐ ‐ ‐ ‐ ‐ ‐ ‐ 45,700
FTA Funding (5309, 5307, 5337)
334,753 222,647 251,257 231,132 69,757 14,580 14,580 14,580 14,580 14,580 1,182,446
Local Funding (JPB Members and other Local Funds)
201,589 115,110 41,491 58,700 22,512 22,500 36,616 22,500 22,500 22,500 566,019
SMCTA (25th Ave and South San Francisco)
27,709 37,457 22,835 ‐ ‐ ‐ ‐ ‐ ‐ ‐ 88,000
Regional (Bridge Tolls)
48,100 4,700 4,700 4,700 700 700 700 700 700 700 66,400
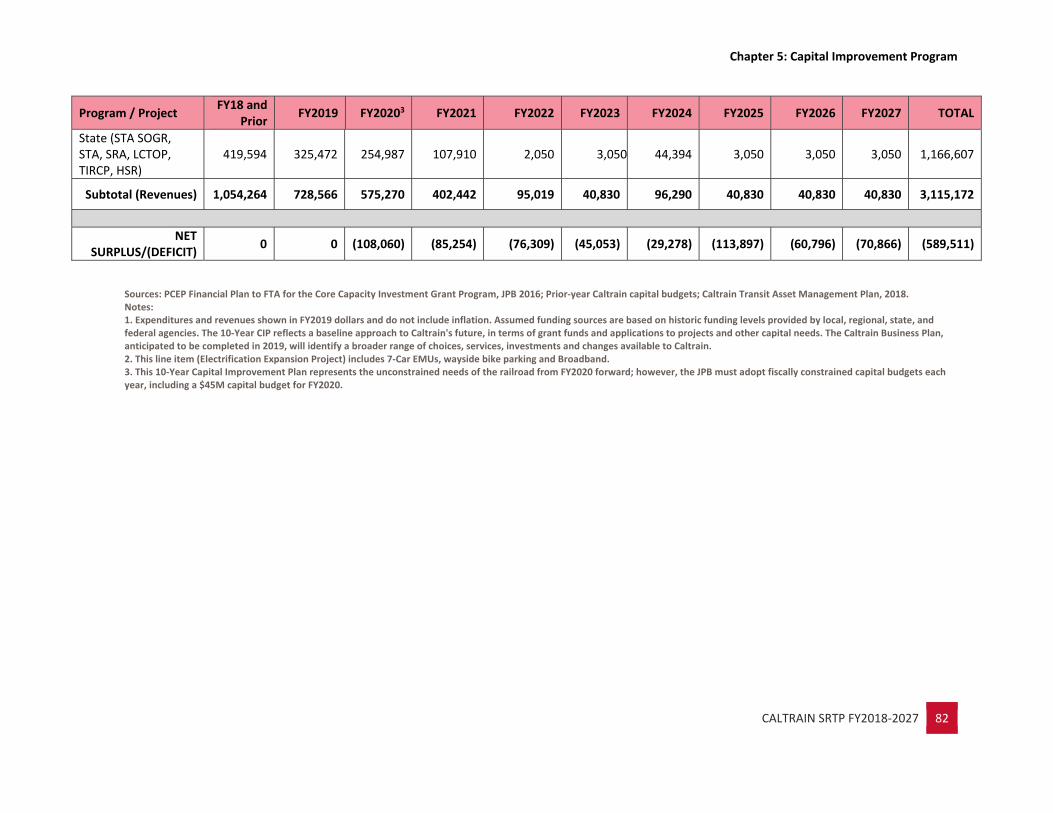
Chapter 5: Capital Improvement Program
CALTRAIN SRTP FY2018‐2027 82
Program / Project FY18 and
Prior FY2019 FY20203 FY2021 FY2022 FY2023 FY2024 FY2025 FY2026 FY2027 TOTAL
State (STA SOGR, STA, SRA, LCTOP, TIRCP, HSR)
419,594 325,472 254,987 107,910 2,050 3,050 44,394 3,050 3,050 3,050 1,166,607
Subtotal (Revenues) 1,054,264 728,566 575,270 402,442 95,019 40,830 96,290 40,830 40,830 40,830 3,115,172
NET SURPLUS/(DEFICIT)
0 0 (108,060) (85,254) (76,309) (45,053) (29,278) (113,897) (60,796) (70,866) (589,511)
Sources: PCEP Financial Plan to FTA for the Core Capacity Investment Grant Program, JPB 2016; Prior‐year Caltrain capital budgets; Caltrain Transit Asset Management Plan, 2018. Notes: 1. Expenditures and revenues shown in FY2019 dollars and do not include inflation. Assumed funding sources are based on historic funding levels provided by local, regional, state, and federal agencies. The 10‐Year CIP reflects a baseline approach to Caltrain's future, in terms of grant funds and applications to projects and other capital needs. The Caltrain Business Plan, anticipated to be completed in 2019, will identify a broader range of choices, services, investments and changes available to Caltrain. 2. This line item (Electrification Expansion Project) includes 7‐Car EMUs, wayside bike parking and Broadband. 3. This 10‐Year Capital Improvement Plan represents the unconstrained needs of the railroad from FY2020 forward; however, the JPB must adopt fiscally constrained capital budgets each year, including a $45M capital budget for FY2020.

Chapter 6: Other Improvements
CALTRAIN SRTP FY2018‐2027 83
6 Other Improvements
6.1 Resolution 3434 There is one active Caltrain expansion project that was originally included under MTC Resolution No. 3434
in 2001 and has been carried through the Resolution’s most recent update in 2008: The Caltrain
Modernization Program (CalMod).8 As noted in past SRTP updates, an additional JPB project, Caltrain
Express Phase I (also known as the Caltrain Baby Bullet) was included in the original Resolution 3434 list
of projects. This project has since been completed and was put into revenue service in June of 2004. Since
the last SRTP update in 2015, the project formerly known as Caltrain Express Phase II has been separated
into separate, smaller Capital projects included in the CIP presented in Chapter 4.
Since its inclusion in Resolution 3434, CalMod has achieved significant milestones and the project’s scope,
schedule and the funding needs have been redefined. The Electrification program now forms the
foundation of the broader CalMod Program, a group of projects that will modernize Caltrain’s
infrastructure and services to address growing mobility needs in the corridor that do not preclude future
High Speed Rail service.
CalMod includes projects that have funding plans in place and are moving actively towards
implementation. The Program is defined through a 9‐party Memorandum of Understanding (MOU)
adopted in 2012 and the subsequent 7‐party MOU in 2016 recognizing a specific, inter‐related program of
projects that support electrification of the Peninsula Corridor and facilitate implementation of high speed
rail service. The MOU also provided a framework to assist project partners in seeking funds necessary to
implement the electrification project and plan for the blended system with both Caltrain and High Speed
Rail operating on the corridor.
CalMod includes: the Peninsula Corridor Electrification Project (PCEP), which includes both the
electrification of the existing Caltrain corridor between San Francisco and San Jose, and the partial
replacement of Caltrain’s diesel trains with high‐performance EMUs. The installation of PTC to address
8 Referred to as “Caltrain Electrification” in MTC Resolution 3434, Attachment C.

Chapter 6: Other Improvements
CALTRAIN SRTP FY2018‐2027 84
federal mandates associated with the Rail Safety Improvement Act of 2008 has been separated from the
CalMod project. As a result of the work over the last several years, the definition of the Resolution 3434
project should be revised to include elements associated with PCEP, described in the next section.
6.1.1 Peninsula Corridor Electrification Program
6.1.1.1 Project Purpose
PCEP will improve Caltrain system performance and expand the capacity of the system to provide
enhanced service to a growing ridership. The project will also reduce noise and greenhouse gases and
improve regional air quality. In addition to allowing for an improved and expanded Caltrain service, the
infrastructure constructed through PCEP will not preclude future use of the Peninsula Corridor by
California’s High Speed Rail System.
PROJECT OVERVIEW
Project: Caltrain Electrification Program
Revenue Service Date: Calendar Year 2022 / FY2022
Miles of New/Enhanced Service: 51 miles
Mode: Electric passenger trains
Number of New Stations: None
Number of New Vehicles/Rolling Stock: Up to 96 EMUs
System Connectivity: Caltrain will continue to connect with Muni (San Francisco), BART
(Millbrae), VTA (Mountain View, San Jose) and ACE and Amtrak (Santa Clara and San Jose Diridon).
6.1.1.2 Project Description
PCEP includes the electrification of a 51‐mile stretch of JPB‐owned right of way between San Francisco
and San Jose. Specifically, the project includes the installation of 130 to 140 single‐track miles of OCS for
the distribution of electrical power to new electric rolling stock. The OCS will be powered from a 25 kilovolt
(kV), 60 Hertz (Hz), single‐phase, alternating current (AC) traction power system consisting of two TPSs,
one switching station and seven paralleling stations.
PCEP also includes the procurement of up to 96 new EMU vehicles that will utilize this new infrastructure
and replace a portion of Caltrain’s aging diesel fleet. PCEP and PTC are separate efforts within CalMod,
managed by different teams internally. Because PCEP only involves electrification of the Caltrain right of

Chapter 6: Other Improvements
CALTRAIN SRTP FY2018‐2027 85
way from San Francisco to a point approximately two miles south of Tamien Station, Caltrain’s diesel‐
powered locomotives will continue to provide service between Gilroy and the San Jose Diridon Station
with through service north to San Francisco.
6.1.1.3 Project Schedule
The JPB is pursuing an aggressive schedule to make PCEP a reality. The schedule below details the work
completed to‐date as well as upcoming major project milestones, including those associated with funding.
Table 6‐1: Peninsula Corridor Electrification Program Schedule
Milestone Milestone Description Calendar Year Completed / Estimated Year of Completion
1 Federal Environmental Review / 35 percent Design 2009
2 9 Party Regional Funding MOU 2012
3 Board Action Contracting Method (Design‐Build for electrification; Best Value for vehicles)
2013
4 Procurement of Owner’s Team 2014
5 RFQ for Electrification and RFI for Vehicles 2014
6 State Environmental Review 2015
7 Approval of Entry into Core Capacity Program/Project Development
2015
8 Procure / Select Contractor Teams
Vehicles and infrastructure 2016 SCADA 2017 Tunnels 2018 CEMOF 2019
9 Design/Manufacture/Build/Test
CEMOF design 2018 CEMOF construction 2019 Tunnels design 2018 Tunnels construction 2019 SCADA design 2018 SCADA test and cutover 2020 Design of electrification system 2020 Build electric system, 2021 Infrastructure testing, 2021 Design of electric cars 2020 Manufacture EMUs 2022 EMU testing, 2022
10 Open for Revenue Service (all EMUs in service) 2022 Source: JPB, 2019 Notes: CEMOF = Centralized Equipment & Maintenance Facility. SCADA = Supervisory Control and Data Acquisition. Calendar years shown, not fiscal years.

Chapter 6: Other Improvements
CALTRAIN SRTP FY2018‐2027 86
The latest cost estimate for PCEP is $1.98 billion. A cost breakdown of the two project components is
provided in Table 6‐2. Table 6‐3 provides a snapshot of the project estimate to complete from December
2018 to project completion. Project funding is broken down in Table 6‐4.
Table 6‐2: Peninsula Corridor Electrification Program Cost Component Scope Current Cost (Millions)
Electrification Infrastructure
Design and construction of the electrified infrastructure including the OCS, substations, switching stations, paralleling stations and management reserve
$1,316
Purchase of EMUs
Purchase of up to 96 EMUs to replace Caltrain’s fleet of aging fleet of rolling stock
$664
TOTAL $1,980 Source: JPB, 2019 Note: Costs shown in YOE$
Table 6‐3: Peninsula Corridor Electrification Program Estimate to Complete Project Expenditures and Estimate to Complete Amount (Millions)
Expended plus accrued through December 2018 $489
Estimate Through December 2019 $388
Planned Expenditures through December 2022 $1,103
TOTAL $1,980 Source: JPB, 2019.
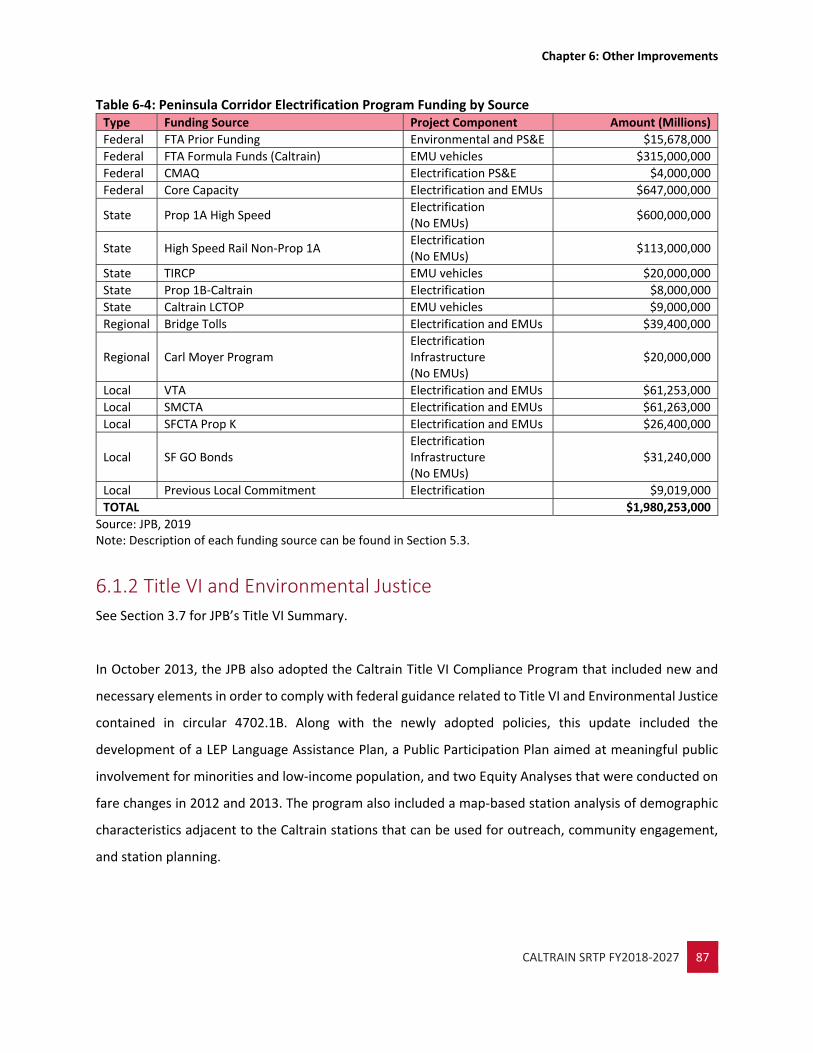
Chapter 6: Other Improvements
CALTRAIN SRTP FY2018‐2027 87
Table 6‐4: Peninsula Corridor Electrification Program Funding by Source
Source: JPB, 2019 Note: Description of each funding source can be found in Section 5.3.
6.1.2 Title VI and Environmental Justice
See Section 3.7 for JPB’s Title VI Summary.
In October 2013, the JPB also adopted the Caltrain Title VI Compliance Program that included new and
necessary elements in order to comply with federal guidance related to Title VI and Environmental Justice
contained in circular 4702.1B. Along with the newly adopted policies, this update included the
development of a LEP Language Assistance Plan, a Public Participation Plan aimed at meaningful public
involvement for minorities and low‐income population, and two Equity Analyses that were conducted on
fare changes in 2012 and 2013. The program also included a map‐based station analysis of demographic
characteristics adjacent to the Caltrain stations that can be used for outreach, community engagement,
and station planning.
Type Funding Source Project Component Amount (Millions)
Federal FTA Prior Funding Environmental and PS&E $15,678,000
Federal FTA Formula Funds (Caltrain) EMU vehicles $315,000,000
Federal CMAQ Electrification PS&E $4,000,000
Federal Core Capacity Electrification and EMUs $647,000,000
State Prop 1A High Speed Electrification (No EMUs)
$600,000,000
State High Speed Rail Non‐Prop 1A Electrification (No EMUs)
$113,000,000
State TIRCP EMU vehicles $20,000,000
State Prop 1B‐Caltrain Electrification $8,000,000
State Caltrain LCTOP EMU vehicles $9,000,000
Regional Bridge Tolls Electrification and EMUs $39,400,000
Regional Carl Moyer Program Electrification Infrastructure (No EMUs)
$20,000,000
Local VTA Electrification and EMUs $61,253,000
Local SMCTA Electrification and EMUs $61,263,000
Local SFCTA Prop K Electrification and EMUs $26,400,000
Local SF GO Bonds Electrification Infrastructure (No EMUs)
$31,240,000
Local Previous Local Commitment Electrification $9,019,000
TOTAL $1,980,253,000

Appendix A
CALTRAIN SRTP FY2018‐2027 88
7 Appendix A: Caltrain Locomotive and Passenger Car Inventory
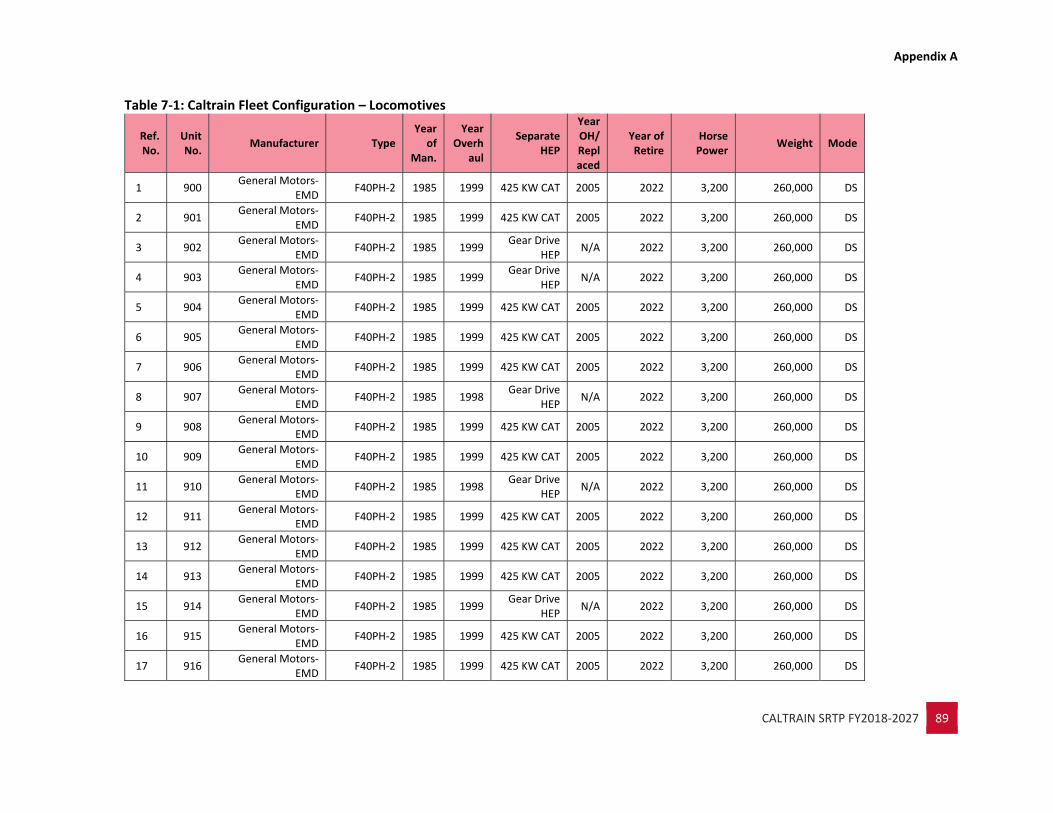
Appendix A
CALTRAIN SRTP FY2018‐2027 89
Table 7‐1: Caltrain Fleet Configuration – Locomotives
Ref. No.
Unit No.
Manufacturer Type Year
of Man.
Year Overh
aul
Separate HEP
Year OH/Replaced
Year of Retire
Horse Power
Weight Mode
1 900 General Motors‐
EMD F40PH‐2 1985 1999 425 KW CAT 2005 2022 3,200 260,000 DS
2 901 General Motors‐
EMD F40PH‐2 1985 1999 425 KW CAT 2005 2022 3,200 260,000 DS
3 902 General Motors‐
EMD F40PH‐2 1985 1999
Gear Drive HEP
N/A 2022 3,200 260,000 DS
4 903 General Motors‐
EMD F40PH‐2 1985 1999
Gear Drive HEP
N/A 2022 3,200 260,000 DS
5 904 General Motors‐
EMD F40PH‐2 1985 1999 425 KW CAT 2005 2022 3,200 260,000 DS
6 905 General Motors‐
EMD F40PH‐2 1985 1999 425 KW CAT 2005 2022 3,200 260,000 DS
7 906 General Motors‐
EMD F40PH‐2 1985 1999 425 KW CAT 2005 2022 3,200 260,000 DS
8 907 General Motors‐
EMD F40PH‐2 1985 1998
Gear Drive HEP
N/A 2022 3,200 260,000 DS
9 908 General Motors‐
EMD F40PH‐2 1985 1999 425 KW CAT 2005 2022 3,200 260,000 DS
10 909 General Motors‐
EMD F40PH‐2 1985 1999 425 KW CAT 2005 2022 3,200 260,000 DS
11 910 General Motors‐
EMD F40PH‐2 1985 1998
Gear Drive HEP
N/A 2022 3,200 260,000 DS
12 911 General Motors‐
EMD F40PH‐2 1985 1999 425 KW CAT 2005 2022 3,200 260,000 DS
13 912 General Motors‐
EMD F40PH‐2 1985 1999 425 KW CAT 2005 2022 3,200 260,000 DS
14 913 General Motors‐
EMD F40PH‐2 1985 1999 425 KW CAT 2005 2022 3,200 260,000 DS
15 914 General Motors‐
EMD F40PH‐2 1985 1999
Gear Drive HEP
N/A 2022 3,200 260,000 DS
16 915 General Motors‐
EMD F40PH‐2 1985 1999 425 KW CAT 2005 2022 3,200 260,000 DS
17 916 General Motors‐
EMD F40PH‐2 1985 1999 425 KW CAT 2005 2022 3,200 260,000 DS

Appendix A
CALTRAIN SRTP FY2018‐2027 90
Ref. No.
Unit No.
Manufacturer Type Year
of Man.
Year Overh
aul
Separate HEP
Year OH/Replaced
Year of Retire
Horse Power
Weight Mode
18 917 General Motors‐
EMD F40PH‐2 1985 1999 425 KW CAT 2005 2022 3,200 260,000 DS
19 918 General Motors‐
EMD F40PH‐2 1987 2000 425 KW CAT 2005 2022 3,200 260,000 DS
20 919 General Motors‐
EMD F40PH‐2 1987 2000 425 KW CAT 2005 2022 3,200 260,000 DS
21 920 Boise Locomotive
Inc. F40PH‐2C 1998 N/A 425 KW CAT 2005 2034 3200 282,000 DS
22 921 Boise Locomotive
Inc. F40PH‐2C 1998 N/A 425 KW CAT 2005 2034 3200 282,000 DS
23 922 Boise Locomotive
Inc. F40PH‐2C 1998 N/A 425 KW CAT 2005 2034 3200 282,000 DS
3
24
25 923 Motive Power Inc. MP36PH‐3C 2003 N/A 425KW CAT 2009 2035 3600 293,500 DS
26 924 Motive Power Inc. MP36PH‐3C 2003 N/A 425KW CAT 2009 2035 3600 293,500 DS
27 925 Motive Power Inc. MP36PH‐3C 2003 N/A 2035 2009 2035 3600 293,500 DS
28 926 Motive Power Inc. MP36PH‐3C 2003 N/A 2035 2009 2035 3600 293,500 DS
29 927 Motive Power Inc. MP36PH‐3C 2003 N/A 2035 2009 2035 3600 293,500 DS
30 928 Motive Power Inc. MP36PH‐3C 2003 N/A 2035 2009 2035 3600 293,500 DS
6 SUBTOTAL
29 TOTAL Source JPB, 2019 Notes: DS =diesel; OH=overhaul; HEP =head and power parts. All vehicles are in fixed‐route service and are heavy rail vehicles.

Appendix A
CALTRAIN SRTP FY2018‐2027 91
Table 7‐2: Caltrain Fleet Configuration – Passenger Cars
Car No. Manufacturer Type Year
Manufactured Year Overhauled
Seats (#)
Luggage Rack
ADA Lift
Toilet Bikes Weight Anticipated Retirement
Year Mode
3800 Nippon‐Sharryo Trailer Car 1985 2001 142 Yes No No 0 118,000 2022 UN
3801 Nippon‐Sharryo Trailer Car 1985 2001 142 Yes No No 0 118,000 2022 UN
3802 Nippon‐Sharryo Trailer Car 1985 2001 142 Yes No No 0 118,000 2022 UN
3803 Nippon‐Sharryo Trailer Car 1985 2001 142 Yes No No 0 118,000 2022 UN
3804 Nippon‐Sharryo Trailer Car 1985 2001 142 Yes No No 0 118,000 2022 UN
3805 Nippon‐Sharryo Trailer Car 1985 2001 142 Yes No No 0 118,000 2022 UN
3806 Nippon‐Sharryo Trailer Car 1985 2001 142 Yes No No 0 118,000 2022 UN
3807 Nippon‐Sharryo Trailer Car 1985 2001 142 Yes No No 0 118,000 2022 UN
3808 Nippon‐Sharryo Trailer Car 1985 2001 142 Yes No No 0 118,000 2022 UN
3809 Nippon‐Sharryo Trailer Car 1985 2001 142 Yes No No 0 118,000 2022 UN
3810 Nippon‐Sharryo Trailer Car 1985 2001 142 Yes No No 0 118,000 2022 UN
3811 Nippon‐Sharryo Trailer Car 1985 2001 142 Yes No No 0 118,000 2022 UN
3812 Nippon‐Sharryo Trailer Car 1985 2001 142 Yes No No 0 118,000 2022 UN
3813 Nippon‐Sharryo Trailer Car 1985 2001 142 Yes No No 0 118,000 2022 UN
3814 Nippon‐Sharryo Trailer Car 1985 2002 142 Yes No No 0 118,000 2022 UN
3815 Nippon‐Sharryo Trailer Car 1985 2001 142 Yes No No 0 118,000 2022 UN
3816 Nippon‐Sharryo Trailer Car 1985 2001 142 Yes No No 0 118,000 2022 UN
3817 Nippon‐Sharryo Trailer Car 1985 2002 142 Yes No No 0 118,000 2022 UN
3818 Nippon‐Sharryo Trailer Car 1985 2002 142 Yes No No 0 118,000 2022 UN
3819 Nippon‐Sharryo Trailer Car 1985 2001 142 Yes No No 0 118,000 2022 UN
3820 Nippon‐Sharryo Trailer Car 1985 2001 142 Yes No No 0 118,000 2022 UN
3821 Nippon‐Sharryo Trailer Car 1985 2001 142 Yes No No 0 118,000 2022 UN
3822 Nippon‐Sharryo Trailer Car 1985 2002 142 Yes No No 0 118,000 2022 UN
3823 Nippon‐Sharryo Trailer Car 1985 2001 142 Yes No No 0 118,000 2022 UN
3824 Nippon‐Sharryo Trailer Car 1985 2001 142 Yes No No 0 118,000 2022 UN
3825 Nippon‐Sharryo Trailer Car 1985 2001 142 Yes No No 0 118,000 2022 UN
3826 Nippon‐Sharryo Trailer Car 1985 2002 108 No No No 40 118,000 2022 UN
3827 Nippon‐Sharryo Trailer Car 1985 2002 108 No No No 40 118,000 2022 UN

Appendix A
CALTRAIN SRTP FY2018‐2027 92
Car No. Manufacturer Type Year
Manufactured Year Overhauled
Seats (#)
Luggage Rack
ADA Lift
Toilet Bikes Weight Anticipated Retirement
Year Mode
3828 Nippon‐Sharryo Trailer Car 1985 2002 108 No No No 40 118,000 2022 UN
3829 Nippon‐Sharryo Trailer Car 1985 2002 108 No No No 40 118,000 2022 UN
3830 Nippon‐Sharryo Trailer Car 1985 2002 108 No No No 40 118,000 2022 UN
3831 Nippon‐Sharryo Trailer Car 1985 2002 108 No No No 40 118,000 2022 UN
3832 Nippon‐Sharryo Trailer Car 1985 2001 108 No No No 40 118,000 2022 UN
3833 Nippon‐Sharryo Trailer Car 1985 2002 108 No No No 40 118,000 2022 UN
3834 Nippon‐Sharryo Trailer Car 1985 2002 108 No No No 40 118,000 2022 UN
3835 Nippon‐Sharryo Trailer Car 1985 2002 108 No No No 40 118,000 2022 UN
3836 Nippon‐Sharryo Trailer Car 1985 2002 148 No No No 0 118,000 2022 UN
3837 Nippon‐Sharryo Trailer Car 1985 2002 148 No No No 0 118,000 2022 UN
3838 Nippon‐Sharryo Trailer Car 1985 2002 148 No No No 0 118,000 2022 UN
3839 Nippon‐Sharryo Trailer Car 1985 2002 148 No No No 0 118,000 2022 UN
3840 Nippon‐Sharryo Trailer Car 1985 2002 148 No No No 0 118,000 2022 UN
3841 Nippon‐Sharryo Trailer Car 1985 2002 148 No No No 0 118,000 2022 UN
3842 Nippon‐Sharryo Trailer Car 1987 2002 148 No No No 0 118,000 2022 UN
3843 Nippon‐Sharryo Trailer Car 1986 2001 148 No No No 0 118,000 2022 UN
3844 Nippon‐Sharryo Trailer Car 1986 2002 148 No No No 0 118,000 2022 UN
3845 Nippon‐Sharryo Trailer Car 1986 2002 148 No No No 0 118,000 2022 UN
3846 Nippon‐Sharryo Trailer Car 1986 2002 148 No No No 0 118,000 2022 UN
3847 Nippon‐Sharryo Trailer Car 1986 2002 148 No No No 0 118,000 2022 UN
3848 Nippon‐Sharryo Trailer Car 1986 2002 148 No No No 0 118,000 2022 UN
3849 Nippon‐Sharryo Trailer Car 1986 2002 148 No No No 0 118,000 2022 UN
3850 Nippon‐Sharryo Trailer Car 1986 2002 148 No No No 0 118,000 2022 UN
3851 Nippon‐Sharryo Trailer Car 1986 2002 148 No No No 0 118,000 2022 UN
3852 ^ Nippon‐Sharryo Trailer Car 2000 N/A 120 No Yes Yes 0 122,000 2022 UN
3853 ^ Nippon‐Sharryo Trailer Car 2000 N/A 120 No Yes Yes 0 122,000 2022 UN
3854 ^ Nippon‐Sharryo Trailer Car 2000 N/A 120 No Yes Yes 0 122,000 2022 UN
3855 ^ Nippon‐Sharryo Trailer Car 2000 N/A 120 No Yes Yes 0 122,000 2022 UN
3856 ^ Nippon‐Sharryo Trailer Car 2000 N/A 120 No Yes Yes 0 122,000 2022 UN

Appendix A
CALTRAIN SRTP FY2018‐2027 93
Car No. Manufacturer Type Year
Manufactured Year Overhauled
Seats (#)
Luggage Rack
ADA Lift
Toilet Bikes Weight Anticipated Retirement
Year Mode
3857 ^ Nippon‐Sharryo Trailer Car 2000 N/A 120 No Yes Yes 0 122,000 2022 UN
3858 ^ Nippon‐Sharryo Trailer Car 2000 N/A 120 No Yes Yes 0 122,000 2022 UN
3859 ^ Nippon‐Sharryo Trailer Car 2000 N/A 120 No Yes Yes 0 122,000 2022 UN
3860 ^ Nippon‐Sharryo Trailer Car 2000 N/A 120 No Yes Yes 0 122,000 2022 UN
3861 ^ Nippon‐Sharryo Trailer Car 2000 N/A 120 No Yes Yes 0 122,000 2022 UN
3862 ^ Nippon‐Sharryo Trailer Car 2000 N/A 120 No Yes Yes 0 122,000 2022 UN
3863 ^ Nippon‐Sharryo Trailer Car 2000 N/A 120 No Yes Yes 0 122,000 2022 UN
3864 ^ Nippon‐Sharryo Trailer Car 2000 N/A 120 No Yes Yes 0 122,000 2022 UN
3865 ^ Nippon‐Sharryo Trailer Car 2000 N/A 120 No Yes Yes 0 122,000 2022 UN
66 SUBTOTAL
4000 Nippon‐Sharryo Cab Car 1985 2001 97 No No Yes 40 125,000 2022 UN
4001 Nippon‐Sharryo Cab Car 1985 2002 97 No No Yes 40 125,000 2022 UN
4002 Nippon‐Sharryo Cab Car 1985 2000 97 No No Yes 40 125,000 2022 UN
4003 Nippon‐Sharryo Cab Car 1985 2002 97 No No Yes 40 125,000 2022 UN
4004 Nippon‐Sharryo Cab Car 1985 2002 97 No No Yes 40 125,000 2022 UN
4005 Nippon‐Sharryo Cab Car 1985 2002 97 No No Yes 40 125,000 2022 UN
4006 Nippon‐Sharryo Cab Car 1985 2002 97 No No Yes 40 125,000 2022 UN
4007 Nippon‐Sharryo Cab Car 1985 2001 97 No No Yes 40 125,000 2022 UN
4008 Nippon‐Sharryo Cab Car 1985 2001 97 No No Yes 40 125,000 2022 UN
4009 Nippon‐Sharryo Cab Car 1985 2001 97 No No Yes 40 125,000 2022 UN
4010 Nippon‐Sharryo Cab Car 1985 2001 97 No No Yes 40 125,000 2022 UN
4011 Nippon‐Sharryo Cab Car 1985 2001 97 No No Yes 40 125,000 2022 UN
4012 Nippon‐Sharryo Cab Car 1985 2002 97 No No Yes 40 125,000 2022 UN
4013 Nippon‐Sharryo Cab Car 1985 2001 97 No No Yes 40 125,000 2022 UN
4014 Nippon‐Sharryo Cab Car 1985 2002 97 No No Yes 40 125,000 2022 UN
4015 Nippon‐Sharryo Cab Car 1985 2002 97 No No Yes 40 125,000 2022 UN
4016 Nippon‐Sharryo Cab Car 1985 2001 97 No No Yes 40 125,000 2022 UN
4017 Nippon‐Sharryo Cab Car 1985 2001 97 No No Yes 40 125,000 2022 UN

Appendix A
CALTRAIN SRTP FY2018‐2027 94
Car No. Manufacturer Type Year
Manufactured Year Overhauled
Seats (#)
Luggage Rack
ADA Lift
Toilet Bikes Weight Anticipated Retirement
Year Mode
4018 Nippon‐Sharryo Cab Car 1985 2001 97 No No Yes 40 125,000 2022 UN
4019 Nippon‐Sharryo Cab Car 1985 2001 97 No No Yes 40 125,000 2022 UN
4020 Nippon‐Sharryo Cab Car 1985 2002 97 No No Yes 40 125,000 2022 UN
4021 ^ Nippon‐Sharryo Cab Car 1999 N/A 78 No Yes Yes 40 127,000 2022 UN
4022 ^ Nippon‐Sharryo Cab Car 2000 N/A 78 No Yes Yes 40 127,000 2022 UN
4023 ^ Nippon‐Sharryo Cab Car 2000 N/A 78 No Yes Yes 40 127,000 2022 UN
4024 ^ Nippon‐Sharryo Cab Car 2000 N/A 78 No Yes Yes 40 127,000 2022 UN
4025 ^ Nippon‐Sharryo Cab Car 2000 N/A 78 No Yes Yes 40 127,000 2022 UN
4026 ^ Nippon‐Sharryo Cab Car 2000 N/A 78 No Yes Yes 40 127,000 2022 UN
27 SUBTOTAL
219 Bombardier Trailer Car 2003 N/A 127 No No Yes 40 119,000 2033 UN
220 Bombardier Trailer Car 2003 N/A 144 No No Yes 0 119,000 2033 UN
221 Bombardier Trailer Car 2002 N/A 144 No No Yes 0 119,000 2032 UN
222 Bombardier Trailer Car 2002 N/A 144 No No Yes 0 119,000 2032 UN
223 Bombardier Trailer Car 2002 N/A 144 No No Yes 0 119,000 2032 UN
224 Bombardier Trailer Car 2002 N/A 144 No No Yes 0 119,000 2032 UN
225 Bombardier Trailer Car 2002 N/A 144 No No Yes 0 119,000 2032 UN
226 Bombardier Trailer Car 2003 N/A 144 No No Yes 0 119,000 2033 UN
229 Bombardier Trailer Car 2002 N/A 144 No No Yes 0 119,000 2032 UN
230 Bombardier Trailer Car 2002 N/A 144 No No Yes 0 119,000 2032 UN
231 Bombardier Trailer Car 2008 N/A 140 No No Yes 0 119,000 2038 UN
232 Bombardier Trailer Car 2008 N/A 140 No No Yes 0 119,000 2038 UN
233 Bombardier Trailer Car 2008 N/A 140 No No Yes 0 119,000 2038 UN
234 Bombardier Trailer Car 2008 N/A 140 No No Yes 0 119,000 2038 UN
235 Bombardier Trailer Car 2008 N/A 140 No No Yes 0 119,000 2038 UN
236 Bombardier Trailer Car 2008 N/A 140 No No Yes 0 119,000 2038 UN
164 Bombardier Trailer Car 1997 N/A 149 No No Yes 40 119,000 2027 UN
165 Bombardier Trailer Car 1997 N/A 149 No No Yes 40 119,000 2027 UN

Appendix A
CALTRAIN SRTP FY2018‐2027 95
Car No. Manufacturer Type Year
Manufactured Year Overhauled
Seats (#)
Luggage Rack
ADA Lift
Toilet Bikes Weight Anticipated Retirement
Year Mode
167 Bombardier Trailer Car 1997 N/A 149 No No Yes 40 119,000 2027 UN
169 Bombardier Trailer Car 1997 N/A 149 No No Yes 40 119,000 2027 UN
170 Bombardier Trailer Car 1997 N/A 149 No No Yes 0 119,000 2027 UN
171 Bombardier Trailer Car 1997 N/A 149 No No Yes 40 119,000 2027 UN
172 Bombardier Trailer Car 1997 N/A 149 No No Yes 0 119,000 2027 UN
173 Bombardier Trailer Car 1997 N/A 149 No No Yes 0 119,000 2027 UN
175 Bombardier Trailer Car 1997 N/A 149 No No Yes 0 119,000 2027 UN
176 Bombardier Trailer Car 1997 N/A 149 No No Yes 40 119,000 2027 UN
177 Bombardier Trailer Car 1997 N/A 149 No No Yes 0 119,000 2027 UN
178 Bombardier Trailer Car 1997 N/A 149 No No Yes 40 119,000 2027 UN
179 Bombardier Trailer Car 1997 N/A 149 No No Yes 40 119,000 2027 UN
180 Bombardier Trailer Car 1997 N/A 149 No No Yes 40 119,000 2027 UN
181 Bombardier Trailer Car 1997 N/A 149 No No Yes 0 119,000 2027 UN
182 Bombardier Trailer Car 1997 N/A 149 No No Yes 0 119,000 2027 UN
32 SUBTOTAL
112 Bombardier Cab Car 2002 N/A 114 No No Yes 40 122,000 2032 UN
113 Bombardier Cab Car 2002 N/A 114 No No Yes Yes 122,000 2032 UN
114 Bombardier Cab Car 2002 N/A 114 No No Yes Yes 122,000 2032 UN
115 Bombardier Cab Car 2002 N/A 114 No No Yes Yes 122,000 2032 UN
116 Bombardier Cab Car 2002 N/A 114 No No Yes Yes 122,000 2032 UN
117 Bombardier Cab Car 2002 N/A 114 No No Yes Yes 122,000 2032 UN
118 Bombardier Cab Car 2002 N/A 114 No No Yes Yes 122,000 2032 UN
119 Bombardier Cab Car 2008 N/A 114 No No Yes Yes 122,000 2038 UN
120 Bombardier Cab Car 2008 N/A 114 No No Yes Yes 122,000 2038 UN
9 SUBTOTAL
134 Fleet Total Source: JPB, 2019 Notes: UN=unpowered; All vehicles are in fixed‐route service and are heavy rail vehicles.

Appendix A
CALTRAIN SRTP FY2018‐2027 96
Table 7‐3: Caltrain Fleet Configuration – Non‐Revenue Vehicles
Ref. No. Unit No. Vehicle Type Manufacturer Make/ Model
Year of Man. Year
Overhauled
Remaining Service Years
Year of Retire
Mode
1 500 Locomotive
— GP9 1959 1976 Currently out of service
N/A DS
2 501 Locomotive —
GP9 1959 1976 Currently out of service
N/A DS
3 503 Locomotive — MP15DC 1974 — — — DS
4 504 Locomotive — MP15DC 1974 — — — DS
4 SUBTOTAL
5 598 Caboose — — 1974 — — — DS
6 599 Caboose — — 1974 — — — DS
2 SUBTOTAL
7 301 Flat Car — — — — — — DS
8 302 Flat Car — — — — — — DS
9 303 Flat Car — — — — — — DS
10 304 Flat Car — — — — — — DS
11 701 Flat Car — — 1975 — — — DS
12 702 Flat Car — — 1975 — — — DS
13 703 Flat Car — — 1975 — — — DS
14 704 Flat Car — — 1975 — — — DS
8 SUBTOTAL
15 851 Gondola — E530 1976 — — — DS
1 SUBTOTAL
16 601 Ballast Hopper — — 1975 2000 — — DS
17 602 Ballast Hopper — — 1976 2000 — — DS
18 603 Ballast Hopper — — 1975 2000 — — DS
19 604 Ballast Hopper — — 1976 2000 — — DS
20 605 Ballast Hopper — — 1976 2000 — — DS
21 606 Ballast Hopper — — 1975 2000 — — DS
22 11309 Ballast Hopper — — 1957 — — — DS
23 11315 Ballast Hopper — — 1957 — — — DS
24 11341 Ballast Hopper — — 1957 — — — DS

Appendix A
CALTRAIN SRTP FY2018‐2027 97
Ref. No. Unit No. Vehicle Type Manufacturer Make/ Model
Year of Man. Year
Overhauled
Remaining Service Years
Year of Retire
Mode
25 11362 Ballast Hopper — — 1954 — — — DS
26 11369 Ballast Hopper — — 1954 — — — DS
27 11379 Ballast Hopper — — 1954 — — — DS
28 11542 Ballast Hopper — — 1971 — — — DS
29 11573 Ballast Hopper — — 1971 — — — DS
30 11579 Ballast Hopper — — 1971 — — — DS
31 11583 Ballast Hopper — — 1978 — — — DS
32 11604 Ballast Hopper — — 1978 — — — DS
33 11612 Ballast Hopper — — 1978 — — — DS
34 11654 Ballast Hopper — — 1978 — — — DS
35 11706 Ballast Hopper — — 1978 — — — DS
36 11723 Ballast Hopper — — 1978 — — — DS
21 SUBTOTAL — —
37 881 Side Dump Difco M110 1978 — — — DS
38 882 Side Dump Difco M110 1978 — — — DS
39 883 Side Dump Difco M110 1978 — — — DS
3 SUBTOTAL
40 — Track
Geometry Car — — — — — — DS
1 SUBTOTAL
38 TOTAL Source: JPB, 2019 Notes: DS=diesel powered. Em dash (—) indicates information not readily available. JPB has provided all the information available at this time and will strive to include more in the future SRTP drafts.

Appendix A
CALTRAIN SRTP FY2018‐2027 98
Vehicle Replacement/Expansion: EMUs for Electrified Service
Number of vehicle/vessels to be replaced/expanded: 133 EMU cars (96 replacement cars and 37 expansion cars)
Anticipated year of manufacture: 2019‐2022
Year vehicle will be placed in service: 2022
Mode of Power: Electric
Seating capacity: To be determined, as the EMUs are still being designed
ADA‐accessible: Yes
Fixed‐guideway service: Yes
Estimated cost of replacement (per train set): $44.6M per train set
Sources of Funding: See Table 6‐4 and Table 5.2


![[PRS] PROJET RÉGIONAL DE SANTÉ 2018-2027 2018 -2027 · 2017-05-23 · ⫻PRS 2018 -2027 – Etat de santé de la population et état de l’offre de la région Grand Est 7 ⫻1.2](https://static.fdocuments.fr/doc/165x107/5eda28bcb3745412b570deaf/prs-projet-rgional-de-sant-2018-2027-2018-2027-2017-05-23-aprs-2018-2027.jpg)