
Atomic Model and Micelle Dynamics of QS-21 Saponin
17
Molecules 2014, 19, 3744-3760; doi:10.3390/molecules19033744 molecules ISSN 1420-3049 www.mdpi.com/journal/molecules Article Atomic Model and Micelle Dynamics of QS-21 Saponin Conrado Pedebos 1 , Laércio Pol-Fachin 1,2 , Ramon Pons 3 , Cilâine V. Teixeira 4,5, * and Hugo Verli 1, * 1 Centro de Biotecnologia, Universidade Federal do Rio Grande do Sul, Av Bento Gonçalves 9500, CP 15005, Porto Alegre 91500-970, RS, Brazil; E-Mails: [email protected] (C.P.); [email protected] (L.P.-F.) 2 Departamento de Química Fundamental, Universidade Federal de Pernambuco, Av Prof. Luiz Freire s/n, Cidade Universitária, Recife 50740-540, PE, Brazil 3 Departament de Tecnologia Química i de Tensioactius, Institut de Química Avançada de Catalunya, IQAQ-CSIC, Jordi Girona, 18-26, Barcelona 08034, Spain; E-Mail: [email protected] 4 Instituto de Física, Universidade Federal do Rio Grande do Sul, CP15051, Porto Alegre 91501-970, RS, Brazil 5 Unitat de Biofísica, Facultad de Medicina, Universitat Autonoma de Barcelona, Cerdanyola del Vallès 08193, Spain * Authors to whom correspondence should be addressed; E-Mails: [email protected] (C.V.T.); [email protected] (H.V.); Tel.: +55-51-3308-6560 (C.V.T.); Fax: +55-51-93581-1907 (C.V.T.); Tel.: +55-51-3308-7770 (H.V.); Fax: +55-51-3308-7309 (H.V.). Received: 27 January 2014; in revised form: 28 February 2014 / Accepted: 5 March 2014 / Published: 24 March 2014 Abstract: QS-21 is a saponin extracted from Quillaja saponaria, widely investigated as a vaccine immunoadjuvant. However, QS-21 use is mainly limited by its chemical instability, significant variety in molecular composition and low tolerance dose in mammals. Also, this compound tends to form micelles in a concentration-dependent manner. Here, we aimed to characterize its conformation and the process of micelle formation, both experimentally and computationally. Therefore, molecular dynamics (MD) simulations were performed in systems containing different numbers of QS-21 molecules in aqueous solution, in order to evaluate the spontaneous micelle formation. The applied methodology allowed the generation of micelles whose sizes were shown to be in high agreement with small-angle X-ray scattering (SAXS). Furthermore, the ester linkage between fucose and acyl chain was less solvated in the micellar form, suggesting a reduction in hydrolysis. This is the first atomistic interpretation of previous experimental data, the OPEN ACCESS
Transcript of Atomic Model and Micelle Dynamics of QS-21 Saponin
Molecules 2014, 19, 3744-3760; doi:10.3390/molecules19033744
molecules ISSN 1420-3049
www.mdpi.com/journal/molecules
Article
Atomic Model and Micelle Dynamics of QS-21 Saponin
Conrado Pedebos 1, Laércio Pol-Fachin 1,2, Ramon Pons 3, Cilâine V. Teixeira 4,5,* and
Hugo Verli 1,*
1 Centro de Biotecnologia, Universidade Federal do Rio Grande do Sul, Av Bento Gonçalves 9500,
CP 15005, Porto Alegre 91500-970, RS, Brazil; E-Mails: [email protected] (C.P.);
[email protected] (L.P.-F.) 2 Departamento de Química Fundamental, Universidade Federal de Pernambuco,
Av Prof. Luiz Freire s/n, Cidade Universitária, Recife 50740-540, PE, Brazil 3 Departament de Tecnologia Química i de Tensioactius, Institut de Química Avançada de Catalunya,
IQAQ-CSIC, Jordi Girona, 18-26, Barcelona 08034, Spain; E-Mail: [email protected] 4 Instituto de Física, Universidade Federal do Rio Grande do Sul, CP15051, Porto Alegre 91501-970,
RS, Brazil 5 Unitat de Biofísica, Facultad de Medicina, Universitat Autonoma de Barcelona,
Cerdanyola del Vallès 08193, Spain
* Authors to whom correspondence should be addressed; E-Mails: [email protected] (C.V.T.);
[email protected] (H.V.); Tel.: +55-51-3308-6560 (C.V.T.); Fax: +55-51-93581-1907 (C.V.T.);
Tel.: +55-51-3308-7770 (H.V.); Fax: +55-51-3308-7309 (H.V.).
Received: 27 January 2014; in revised form: 28 February 2014 / Accepted: 5 March 2014 /
Published: 24 March 2014
Abstract: QS-21 is a saponin extracted from Quillaja saponaria, widely investigated as a
vaccine immunoadjuvant. However, QS-21 use is mainly limited by its chemical
instability, significant variety in molecular composition and low tolerance dose in
mammals. Also, this compound tends to form micelles in a concentration-dependent
manner. Here, we aimed to characterize its conformation and the process of micelle
formation, both experimentally and computationally. Therefore, molecular dynamics (MD)
simulations were performed in systems containing different numbers of QS-21 molecules
in aqueous solution, in order to evaluate the spontaneous micelle formation. The applied
methodology allowed the generation of micelles whose sizes were shown to be in high
agreement with small-angle X-ray scattering (SAXS). Furthermore, the ester linkage
between fucose and acyl chain was less solvated in the micellar form, suggesting a reduction
in hydrolysis. This is the first atomistic interpretation of previous experimental data, the
OPEN ACCESS

Molecules 2014, 19 3745
first micellar characterization of saponin micelles by SAXS and first tridimensional model
of a micelle constituted of saponins, contributing to the understanding of the molecular
basis of these compounds.
Keywords: QS-21; saponins; glycoconjugates; molecular dynamics; SAXS; micelle; adjuvant
1. Introduction
QS-21 is a saponin extracted from the bark of the Quillaja saponaria tree, well-known by its role as
an immunostimulating compound, being one of the main targets of a great number of clinical trials [1]
and synthesis of variants [2–4]. Its structure (Figure 1) is composed of two different carbohydrate
chains (one linear and one branched) with the addition of an acyl chain [5].
Figure 1. QS-21 molecular structure and its heterogeneity. The carbohydrates (blue) are
distributed as a branched portion and a linear portion. Quillaic acid (QuillA—red) and the
acyl chain (purple) make up the hydrophobic units of the compound.
This saponin presents two regioisomers in solution, QS-21 A and QS-21 B, in a proportion of 20:1,
respectively, with QS-21 A being more thermodynamically stable [5,6]. The sole difference between
these isomers is the position of the ester linkage that links the acyl chain moiety and the fucose residue
Molecules 2014, 19 3746
composing its structure [5]. Moreover, distributed among these regioisomers, there is sugar heterogeneity
(Figure 1) at the R3 fragment of the saponin’s structure, involving the presence of an apiose (65%) or a
xylose (35%) sugar residue. Consequently, in aqueous media four different compounds exist: QS-21
A-apio, QS-21 A-xylo, QS-21 B-apio and QS-21 B-xylo.
The acyl chain is believed to play an important role in a higher extent to Th1 response and in a
lesser extent to Th2 type responses [7] promoted by the use of QS-21 as an adjuvant. This portion of
the saponin’s structure is also a site of degradation by hydrolysis at the ester linkage, a feature that is
responsible for the decrease of the shelf life of this compound [6] and the action in Th1 activity and
cytotoxic T lymphocytes production [8]. Another property of these molecules involves their behavior
in water: as saponins are constituted by a hydrophobic (the triterpene ring) and a hydrophilic part
(sugar groups), they form micelles in aqueous solution at a critical micellar concentration (cmc) around
0.5 g/L. This concentration can vary, depending on the solution conditions (pH, temperature, salt
addition, presence of cholesterol), reaching a c.m.c of 51 μg/mL [9] in succinate buffered aqueous
solution. An additional important property of QS is its interaction with cholesterol, which, besides
making it promising for the food industry, is explored for the preparation of Immune Stimulating
Complexes (ISCOMs), which are used for delivery of vaccine antigens, targeting the immune
system [10]. Actually, the adjuvant properties of QS-21 have been observed even at concentrations as
low as 20 μg/mL [11], at which only monomers are found in solution. This indicates that the formation
of micelles is not essential to its immunopotentiator activity [9]. However, it is suggested that, when
aggregated in a micelle, the QS-21 saponins tend to bury their acyl chains due to its hydrophobic
nature, generating an apolar interior for the aggregates, which is thought to give stability to QS-21 [6].
Furthermore, both its immunoadjuvant activity and its toxic or non-toxic effects are directly related to
its interaction with membranes which, as well as its interaction with cholesterol, is directly related to
its amphiphilic properties. Therefore, a proper knowledge of dynamic micellar behaviour of the QS-21 in
aqueous solution is very important to elucidate its biological and toxic activities.
Structure-based investigations can help understand the molecular basis concerning these compounds’
dynamics [12], conformation [13], and function [14]. However, obtaining 3D atomic models remains a
challenge, since efficient approaches that accurately describe the biological conformational states of
saponins and glycoconjugates are still scarce. Considering that the understanding of the molecular
behavior of QS-21 may support further studies involving the development of immunopotentiators, we
aimed to characterize the conformational ensemble of the saponins QS-21 A and B (both as the -apio
major isomer), as well as examine the spontaneous formation of micelles composed by these
molecules, both experimentally and theoretically. For the theoretical characterization of the saponin we
used a previously applied approach [15] involving molecular dynamics (MD) simulations with
compounds of the same kind. The experimental study was carried out by small-angle X-ray scattering
(SAXS). The two methods were performed independently and we were able to compare the results and
further validate the models constructed. Thus, we characterized QS-21 micelles by SAXS for the first
time and provided an atomic 3D model for this saponin and the micelle aggregation of this compound,
constituting the first atomic level detailed evidence for the micelle formation.

Molecules 2014, 19 3747
2. Results and Discussion
2.1. Titration by Fluorescence
Due to the presence of the carboxyl group, which can be negatively charged or neutral depending
on the pH, we performed a titration in order to determine the pKa of QS. Figure 2 shows the emission
wavelength of QS as a function of pH, whose fitting of Henderson-Hasselbalch equation gives a pKa
value of 7.2 ± 0.1. Thus, the samples for SAXS measurements were prepared at pH 2, so that we are
sure that the micelles have no net charge.
Figure 2. Titration curve of QS-21 in aqueous solution.
2.2. Micellar Structure by SAXS
The scattering curves of the samples containing 3 wt% and 5 wt% of QS in solution are shown in
Figure 3a, from which the distance distribution function was calculated. Interference between micelles
shows up at small q-values. For this reason, points at the beginning of the curve were removed for the
calculation of p(r), so that obtained p(r) values were due only to the form factor of the micelles and
converged smoothly to zero as r reached Dmax (the biggest dimension of the particles). The p(r) curves
obtained for both concentrations, normalized with the QS volume fraction, are shown in Figure 3b.
The same Dmax value of 75 ± 3 Å was obtained for both concentrations, indicating that the micelles
size remains constant. Indeed, both p(r) curves are identical even at small-r values, which means that
they have the same scattering length profile and the same cross section radius [16]. The theoretical
scattering curves calculated from the obtained p(r) functions are plotted together with the experimental
curves, showing a good agreement. It can be noted that the p(r) curves are slightly asymmetric towards
higher r-values, which indicates that the particles are not perfectly spherical, but elongated. When the
length of the particles is much longer than their cross section, a linear decay appears at the p(r) curve,
and the point of inflection between the maximum of the function and the linear region of the curve
gives a rough estimation of the cross section size [17]. In the present case, the linear region is not
clearly defined, indicating that the axial ratio between the axis and the cross section is not high,
although we can identify the inflection point at around 42 Å. The equivalent axial ratio is 1.8 ± 0.2.

Molecules 2014, 19 3748
Figure 3. (a) SAXS curves; (b) Distance distribution function of QS in aqueous solution
at 3 and 5 wt%; Theoretical intensity, calculated from the p(r) functions, together with the
experimental curve for (c) 3 wt% and (d) 5 wt%.
2.3. QS-21 Conformational Characterization
To properly describe the conformational ensemble adopted by QS-21 saponin in solution, we
initially evaluated the glycosidic linkages that compose this molecule by employing energy contour
plots (Figure 4). The glycosidic linkages are identified as β-D-Xyl-(1→3)-GlcA, β-D-Gal-(1→2)-GlcA,
β-D-GlcA-(1→3)-QuillA, β-D-Fuc-(1→28)-QuillA, α-L-Rha-(1→2)-Fuc, β-D-Xyl-(1→4)-Rha and
β-D-Api-(1→3)-Xyl. Since the two linkages involving Fuc and the Acyl Chain, as well as between the
latter and Ara cannot be considered as glycosidic, we included the calculations of atomic charges
and the conformation of these structures in aqueous solution, as obtained by MD (described in the
Experimental Section).
We performed a comparison between the three states presented in the energy contour plots, that is,
vacuum, isolated disaccharide in solution and complete saponin in solution. Through these plots, the
minimum energy geometries of each bond, the co-existence of multiple conformations and its most
populated angles were evaluated. The disaccharidic units in solution populated in a similar manner to
the vacuum profile, reinforcing the role of the glycosidic linkage pattern over their conformation
determination, as previously reported [12]. The geometries populated when the saponin was fully
assembled presented only one conformational change: the ψ angle from the α-L-Rha-(1→2)-Fuc
linkage (Figure 4E), which shifted from a positive value of around 120° to a negative value of −120°.
A possible explanation for this shift is that the hydrophilic portions of the molecule enclose the
hydrophobic core, which contains the Acyl Chain and QuillA, reducing the solvent accessible area and
stabilizing this new conformation. Still, the mere presence of the Acyl Chain might be sufficient

Molecules 2014, 19 3749
to influence the adjacent monosaccharide units. Besides, the disaccharidic units presented a larger
number of populated conformational states when compared to the complete model angles, in agreement
with previous reports [12].
Figure 4. (Top) Representation of the whole molecule of QS-21 in its most prevalent
conformation: the brown and purple parts represent the hydrophobic region and the blue
part its hydrophilic portion. (Bottom) Energy contour plots for the glycosidic linkages that
compose the QS-21 saponin. The corresponding aqueous solution populated geometries are
superimposed as isolated units (gray dots) or as the complete saponin structure (dark red
dots). Contour levels are shown at every 10 kJ·mol−1, from 10 to 50 kJ·mol−1.
2.4. Micelle Formation and Dimensions
Subsequently to the MD simulations performed to obtain an initial model for QS-21, in its
glycosidic linkages optimal conformational states, we employed the fully assembled saponin in new μs
time scale MD simulations, aiming to observe spontaneous aggregation of these compounds. Systems
were composed by 1, 2, 3, 4, 10 and 20 molecules of QS-21 A and B, which were randomly inserted in
the simulation box. In all systems, the saponins have aggregated in a gradual manner, spontaneously
forming micelles in varying time frames. These micelles, however, are not assembled in a traditional
fashion, but rather in a disorganized one (Figure 5), where the multiple portions of the saponin are
freely interacting with each other.
Molecules 2014, 19 3750
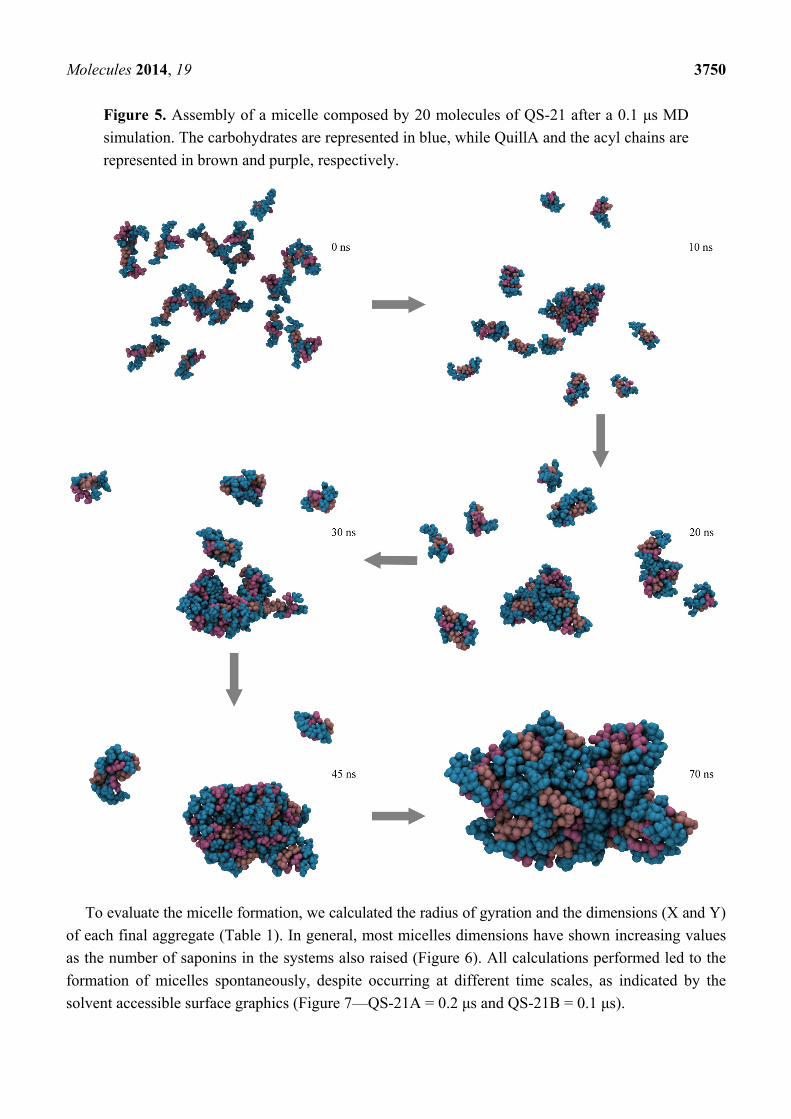
Figure 5. Assembly of a micelle composed by 20 molecules of QS-21 after a 0.1 μs MD
simulation. The carbohydrates are represented in blue, while QuillA and the acyl chains are
represented in brown and purple, respectively.
To evaluate the micelle formation, we calculated the radius of gyration and the dimensions (X and Y)
of each final aggregate (Table 1). In general, most micelles dimensions have shown increasing values
as the number of saponins in the systems also raised (Figure 6). All calculations performed led to the
formation of micelles spontaneously, despite occurring at different time scales, as indicated by the
solvent accessible surface graphics (Figure 7—QS-21A = 0.2 μs and QS-21B = 0.1 μs).

Molecules 2014, 19 3751
Table 1. Dimensions (radius of gyration, height and width) of the assembled micelles for
each MD simulation of QS-21A and QS-21B. All values are given in Å.
System
(QS-21
molecules)
Saponin
QS-21A QS-21B
Rg Height Width Axial
Ratio Rg Height Width Axial Ratio
2 8.8 ± 0.5 27.1 ± 2.1 14.0 ± 1.0 1.9 ± 0.2 9.0 ± 0.5 32.6 ± 0.5 13.5 ± 1.0 2.4 ± 0.2
3 10.0 ± 0.2 32.4 ± 1.4 16.9 ± 0.4 1.9 ± 0.1 11.6 ± 0.2 41.0 ± 0.2 18.1 ± 0.2 2.3 ± 0.1
4 10.8 ± 0.2 35.4 ± 1.9 17.8 ± 0.7 2.0 ± 0.1 11.6 ± 0.3 37.2 ± 0.3 19.0 ± 0.8 2.00 ± 0.03
10 15.7 ± 0.1 48.8 ± 1.6 25.7 ± 0.8 1.9 ± 0.1 17.8 ± 0.3 54.5 ± 0.3 25.7 ± 1.2 2.1 ± 0.1
20 22.0 ± 1.4 54.3 ± 1.1 36.8 ± 1.6 1.5 ± 0.1 22.0 ± 1.3 72.0 ± 1.2 39.2 ± 1.1 1.8 ± 0.1
Figure 6. Average dimensions for each micelle pertaining to the independent simulations
of QS-21 A and QS-21 B.

Molecules 2014, 19 3752
Figure 7. Solvent accessible surfaces for (QS-21A)20 and (QS-21B)20 micelles. When
equilibrated, (QS-21A)20 presents an average value of 131.8 ± 2.1 nm2, while (QS-21B)20
presents an average of 139.9 ± 2.0 nm2.
We applied logarithmic trend lines in every graphic of each property (Figure 6—height, width and
radius of gyration) and were able to obtain a high correlation R value for all the curves. This suggests
that this process occurs in a progressive manner until reaching a plateau, where new micelles would be
formed, instead of aggregating to the main one. Moreover, based on the obtained data and its high
correlation (Figure 6), we may attempt to predict the approximate dimensions for any size of micelles.
2.5. Ester Linkage Solvation
An aspect involving the micelles composed by saponin QS-21 is the diminished degradation of the
acyl chain when compared to the monomeric form, increasing its shelf life [6]. Accordingly, we
performed a Radial Distribution Function (Figure 8) searching for solvent molecules that were near the
atoms constituting the ester bond between Fuc and the acyl chain. In the comparison, we used the
monomeric QS-21 as a reference and all the systems simulated independently. System (QS-21)2
presents a slight decrease in one of the curves (QS-21 (I)), whereas in system (QS-21)3, the (QS-21 (III))
curve has almost no solvent molecules in the nearest hydration layers. In systems (QS-21)10 and
(QS-21)20, both simulations presented major decrease on more than one curve, containing groups of
saponins. The RDF analysis demonstrated a reduction in the accessibility of the aqueous solvent to the
ester linkage as the number of molecules increase, identifying that, when organized in micelles, QS-21
saponins may present an increased protection against degradation by spontaneous hydrolysis.
2.6. Comparison of Both Methods in the Micelle Structure Analysis
We compared the results obtained by SAXS to the final structure obtained in the 20 molecules
system, since its dimensions were the closest to the obtained experimentally. For such a comparison,
we fitted (Figure 9) the experimental curve (SAXS) to the theoretical curve (simulation) and observed
its superimposition. Additionally, the experimental SAXS dimensions data could be also compared to
the simulations (Table 2).

Molecules 2014, 19 3753
Figure 8. Radial distribution function of the ester linkage between Fuc and Acyl. (A) MD
simulation of two saponins (QS-21)2; (B) MD simulation of three saponins (QS-21)3;
(C) MD simulation of ten saponins (QS-21)10; (D) MD simulation of twenty saponins
(QS-21)20. A comparison with a monomeric QS-21 (black) was performed in all graphics.
In C e D, some lines represent an approximation between similar results, so that the roman
numerals indicate which saponins are included in the respective line.
Figure 9. Comparison between data obtained by computational simulations and SAXS.
The experimental curve (green symbols) is fitted to the theoretical curve (red line), using
CRYSOL server and the final micelle model obtained in the simulation.
Table 2. Comparison between the dimensions (radius of gyration, height and width)
obtained by MD simulations of (QS-21A)20 and (QS-21B)20 and by SAXS experiments. All
values are given in Å.
System Saponin SAXS
QS-21A QS-21B
Rg Height Width Rg Height Width Rg Height Width
20 22.0 ± 1.4 54.3 ± 1.1 36.8 ± 1.6 22.6 ± 2.1 73.8 ± 2.9 38.6 ± 1.7 25.0 ± 3.9 75.0 ± 3.0 42.0 ± 3.0

Molecules 2014, 19 3754
Data obtained by the CRYSOL server [18] for RGt (QS-21 A = 20.28 Å and QS-21 B = 21.23 Å)
are in close agreement with the RGe (QS-21 A = 22.00 Å and QS-21 B = 22.6 Å), as well as the
correlation of the curves as observed in the graphic. The Angular Units equation selected was
s = 4πsin(θ)/λ, 1/Å, and the remaining options were set to default. The chi values, which indicate the
discrepancy between the theoretical and experimental curves, are 10.0 for QS-21A data and 9.5 for
QS-21B data. The (QS-21A)20 system appears to be a more compact aggregate, since it has the same
number of saponins as (QS-21B)20, but lower dimensions. Hence, a greater number of molecules
would be required in order to achieve the experimental dimensions. The dimensions obtained for
(QS-21B)20 are in closer agreement to what has been found by SAXS, although the axial ratio obtained
by the simulations (Table 1) and the SAXS experiments (1.8 ± 0.2) is in good agreement for both
micelles (20 saponins). This may indicate that MD simulations can properly describe the aggregation
process involving QS-21 saponins which can be compared with experimental data, such as SAXS.
3. Experimental
3.1. Saponin Preparation
Saponin from Quillaja bark (S7900 from Sigma, Madrid, Spain) was dissolved in hot water and
extracted with butanol, which was then evaporated. The resulting paste was redissolved in methanol.
The methanol was evaporated and the sample was further lyophilized. The obtained powder was then
mixed in aqueous solution at the desired concentration.
3.2. Titration
The pKa of the QS in water was determined by fluorescence, for a concentration of 0.1 g/L, by
varying the pH from 2.4 to 11.1. The measurements were carried out in a SLM-Aminco 8000
spectrophotometer (SLM Instruments, Urbana, IL, USA), at room temperature. Excitation wavelength
was set to 298 nm and emission scans were performed from 330 to 550 nm.
3.3. Small-Angle X-ray Scattering (SAXS)
Water solution with HCl at pH 2 containing 3 wt% and 5 wt% of QS were prepared and measured
in a glass capillary of 1.0 mm inner diameter. The measurements were performed in a Kratky compact
camera (Hecus X-ray systems, Graz, Austria) coupled to a Siemens KF 760 (3 kW) generator, at room
temperature (298 K). A Ni-filter was used to obtain a CuKα radiation (1.542 Å). Slits were used for
collimation producing a line beam. A linear position sensitive detector (PSD-OED 50 M-Braun, Graz,
Austria) was used. The samples were measured for 1 h. The scattering curves were smoothed by fitting a
third-degree polynomial to adjacent points and then desmeared by Singh procedure [19]. Then they were
corrected for the solvent scattering and put in an absolute scale by using the transmission value obtained
with a moving slit device and the standard value of the scattering of water (1.68 × 10⁻² cm−2) [20,21].
The scattering intensity is given as a function of the scattering vector:
sin4q (1)
where λ is the wavelength and 2θ is the scattering angle. q ranged from 0.02 to 0.6 Å−1.

Molecules 2014, 19 3755
3.4. Analysis Method
As this is the first SAXS study of QS-21 micelles, there was no a priori information on the system.
For this reason we used a model-independent approach, which calculates the pair-distance-distribution
function, p(r), as the Fourier Transform of the measured intensity. This function gives an evaluation of
the overall symmetry and dimension of the particles. The p(r) function is related to the scattering
intensity by Glatter [17]:
4 (2)
As the scattering curve is measured only in a finite-q range, we cannot perform a traditional Fourier
Transformation. This problem is overcome by using the Indirect Fourier Transformation method,
developed by Glatter [22]. In this method, the integral can be performed up to a value Dmax, which is
the maximum dimension of the micelle. The pair-distance distribution function is given by a linear
combination of a finite number N of cubic -spline functions, ∅i r
∅ (3)
where ci is the coefficient of the ∅i function. Inserting (3) in (2) and using a least-squares method
together with a stabilization routine, the coefficients ci can be determined. When r ≥ Dmax,the p(r)
function is zero. The scattering length density of the particles can also be calculated by the square-root
deconvolution, using a similar method to the one described above [23]. The scattering length function
can be calculated either as a smooth spline curve or as a step function. This procedure was carried out
by using a package developed by Glatter.
3.5. Nomenclature, Topologies, and Software
The IUPAC recommendations and symbols of nomenclature [24] were adopted. Two contiguous
carbohydrate residues, or a monosaccharide and QuillA, had their orientation described appropriately
by evaluating their glycosidic linkage torsional angles. For a (1→X) linkage, where “X” is “2”, “3”,
“4” or “28” for the (1→2), (1→3), (1→4) or (1→28), respectively, the φ and ψ dihedral angles are
defined as shown in (4) and (5):
φ = O5–C1–O1–CX (4)
ψ = C1–O1–CX–C(X − 1) (5)
For a (1→28) linkage, Omega (ω) is defined as below:
ω= O28A–C28–C17–C16 (6)
The topologies for saccharides, quillaic acid (QuillA) and acyl chain have been generated by the
PRODRG server [25]. Structures were manipulated using PyMOL [26], VMD [27,28] and MOLDEN [29].
The MD simulations and analyses were performed using GROMACS simulation suite, version 4.0.5 [30],
and GROMOS96 43a1 force field [31].

Molecules 2014, 19 3756
3.6. Saponin Construction and Topologies Refinement
The building block methodology [32] was applied, aiming to obtain the starting structures for the
QS-21 conformational study. The compound was constructed using its most prevalent conformations
of its minimal components in solution (disaccharides and linkages between a monosaccharide and
QuillA or a monosaccharide and an acyl chain). Indeed, all of such units were constructed with the
MOLDEN software and submitted to PRODRG server to obtain their crude topologies and atomic
coordinates. Refinements were added on these topologies, including HF/6-31**-derived Löwdin atomic
charges, as obtained from previous works [15,33], or calculated with the GAMESS software [34], in
the case of the carboxyl group from GlcA (protonated) and acyl chain atomic charges. Improper
dihedrals were added to maintain the conformational states 1C4 for the α-L-rhamnose (α-L-Rha), 4C1 for β-D-xylose (β-D-Xyl), β-D-galactose (β-D-Gal), β-D-fucose (β-D-Fuc), and β-D-glucuronate
(β-D-GlcA), 4T3 for the α-L-arabinose (α-L-Ara), and E3 for β-D-apiose (β-D-Api) residues. Also,
proper dihedrals were included, as described in GROMOS96 force field. Aiming to obtain a starting
geometry for the Fuc—Acyl Chain—Ara unit, we performed a MD simulation of 0.1 μs of such
structure in aqueous solution. Subsequently, the entire trajectory was clusterized (employing the
g_cluster tool from GROMACS package) in order to collect the most prevalent structures.
3.7. Contour Plots
The disaccharidic or monosacharide-aglycone glycosydic linkages presented by QS-21 had their
torsion angles rotated between −180° and 150°, in steps of 30°, thus generating 144 conformers for
each torsion, allowing us to obtain a conformational description of the molecule. We used a constant
restriction force in the φ and ψ proper dihedrals in this energy minimization process, which permitted
the exploration of the conformational space by all of the unit’s linkages [13]. Thus, these minimized
conformations were submitted to MD simulations in vacuum for 20 ps at 10 K, with an integration step
of 0.5 fs, further improving the minimum-energy conformations investigation. The identified low
energy conformations in this procedure were employed as starting geometries for 0.1 μs MD
simulations in aqueous solution and 298 K. This procedure allowed an enhanced sampling of the
glycosydic linkages dihedral angles of the units.
3.8. MD Simulations
MD simulations were performed in 0.1 and 0.2 μs scale aqueous solutions (SPC water model) [35],
inside a solvated cubic box and making use of periodic boundary conditions. To best resemble the
experimental environment, we respected the 3 wt% concentration in each simulation, obtaining
systems that presented up to ~220,000 atoms (20 saponins in water). The covalent bond lengths were
constrained by the LINCS method [36], so that an integration step of 2 fs was applied after an energy
minimization with Steepest Descents algorithm. For the calculation of the electrostatic interactions, we
employed the Particle Mesh Ewald method [37]. The temperature (298 K) and pressure (1 atm) of the
saponins and solvent were also kept constant, by applying external temperature and pressure baths with
coupling constants of τ = 0.1 and 0.5 ps [38], respectively. The V-rescale thermostat and the Berendsen
barostat were employed in the simulations. Cutoff values were set to 0.9 nm for short-range interactions.

Molecules 2014, 19 3757
The van der Waals interactions were truncated at 0.9 nm. The GROMACS package analysis tools were
employed in many analyses: the g_gyrate tool was employed to calculate the radius of gyration of the
micelles, while the g_dist and g_mindist tool were used to calculate their dimensions and the g_rdf tool
was applied to obtain the Radial Distribution Function. We collected the last 15 ns of the (QS-21A)20
and (QS-21B)20 micelles simulation, since the full assembly of these structures occurred at 185 ns in
the (QS-21A)20 simulation and at 70 ns in the (QS-21B)20 simulation.
4. Conclusions
For the first time, the structure and conformation of QS-21 in micelles were determined. A 3D
atomic model was built by molecular dynamics, which showed that the higher the number of
QS-21 molecules in a micelle, the lower the accessibility of the aqueous solvent to ester bond between
Fuc and the acyl chain, feature that is related to the storage stability. The characterization of the
conformational ensemble of this glycoconjugates is not a simple task, due to its high flexibility and
difficulties regarding crystallization, and usually demands the use of other experimental methods, such
as NMR [39]. We have been employing MD simulations as a tool to successfully describe the
conformational profiles that occur in carbohydrates [12] and glycoconjugates [15].
The presence of so many groups in the QS-21 molecule makes the study of micelles by SAXS a
very difficult accomplishment. To the best of our knowledge, this is the first report on QS-21 micelles
by SAXS. The combination of SAXS and MD simulations allowed us to understand the molecular
conformation of QS-21 in the micelles, as well as the aggregation process. The present results and
methods can be employed in further studies to investigate mechanisms of immunostimulation in which
this compound is involved, that are so far unknown. Furthermore, we were able to observe the
protection of the acyl chains against solvent molecules by analyzing the ester linkage between acyl
moieties and the Fuc residue.
Acknowledgments
This work was supported by Conselho Nacional de Desenvolvimento Científico e Tecnológico
(CNPq), MCT, by Coordenação de Aperfeiçoamento de Pessoal de Nível Superior (CAPES), MEC,
Brasília, DF, Brazil, the Fundação de Amparo à Pesquisa do Estado do Rio Grande do Sul
(FAPERGS) and the Ministry of Science and Innovation of Spain (subprograma RYC-2005-001625
and Project MAT 2008-01080/MAT (C.V.T.). Research supported by the Centro Nacional de
Supercomputação of the Universidade Federal do Rio Grande do Sul (CESUP/UFRGS). Jaume Caelles
from the SAXS-WAXS service at IQAC is acknowledged for SAXS measurements.
Author Contributions
Hugo Verli conceived the computational study. Conrado Pedebos and Laércio Pol-Fachin developed
the atomic models of QS-21 and performed the MD simulations and analysis. Cilâine Verônica
Teixeira and Ramon Pons conceived and performed the SAXS experiments and analysis. Cilâine
Verônica Teixeira conceived the fluorescence measurements and the project idea. Conrado Pedebos
Molecules 2014, 19 3758
and Cilâine Verônica Teixeira wrote the paper. Hugo Verli, Laércio Pol-Fachin and Ramon Pons
reviewed and edited the manuscript. All authors read and approved the manuscript.
Conflicts of Interest
The authors declare no conflict of interest.
References
1. Ragupathi, G.; Gardner, J.R.; Livingston, P.O.; Gin, D.Y. Natural and synthetic saponin adjuvant
QS-21 for vaccines against cancer. Expert Rev. Vaccines 2011, 10, 463–470.
2. Marciani, D.J.; Press, J.B.; Reynolds, R.C.; Pathak, A.K.; Pathak, V.; Gundy, L.E.; Farmer, J.T.;
Koratich, M.S.; May, R.D. Development of semisynthetic triterpenoid saponin derivatives with
immune stimulating activity. Vaccine 2000, 18, 3141–3151.
3. Adams, M.M.; Damani, P.; Perl, N.R.; Won, A.; Hong, F.; Livingston, P.O.; Ragupathi, G.;
Gin, D.Y. Design and synthesis of potent Quillaja saponin vaccine adjuvants. J. Am. Chem. Soc.
2010, 132, 1939–1945.
4. Chea, E.K.; Fernández-Tejada, A.; Damani, P.; Adams, M.M.; Gardner, J.R.; Livingston, P.O.;
Ragupathi, G.; Gin, D.Y. Synthesis and Preclinical Evaluation of QS-21 Variants Leading
to Simplified Vaccine Adjuvants and Mechanistic Probes. J. Am. Chem. Soc. 2012, 134,
13448–13457.
5. Jacobsen, N.E.; Fairbrother, W.J.; Kensil, C.R.; Lim, A.; Wheeler, D.A.; Powell, M.F.
Structure of the saponin adjuvant QS-21 and its base-catalyzed isomerization product by 1H and
natural abundance 13C NMR spectroscopy. Carbohydr. Res. 1996, 280, 1–14.
6. Cleland, J.L.; Kensil, C.R.; Lim, A.; Jacobsen, N.E.; Basa, L.; Spellman, M.; Wheeler, D.A.;
Wu, J.-Y.; Powell, M.F. Isomerization and formulation stability of the vaccine adjuvant QS-21.
J. Pharm. Sci. 1996, 85, 22–28.
7. Liu, G.; Anderson, C.; Scaltreto, H.; Barbon, J.; Kensil, C.R. QS-21 structure/function studies:
Effect of acylation on adjuvant activity. Vaccine 2002, 20, 2808–2815.
8. Marciani, D.J.; Pathak, A.K.; Reynolds, R.C.; Seitz, L; May, R.D. Altered immunomodulating
and toxicological properties of degraded Quillaja saponaria Molina saponins. Int. Immunopharmacol.
2001, 1, 813–818.
9. Press, J.B.; Reynolds, R.C.; May, R.D.; Marciani, D.J. Structure/function relationships of
immunostimulating saponins. Stud. Nat. Prod. Chem. 2000, 24, 131–174.
10. Morein, B.; Sundqvist, B.; Hölund, S.; Dasgaard, K.; Osterhaus, A. Iscom, a novel structure for
antigenic presentation of membrane proteins from enveloped viruses. Nature 1984, 308, 457–460.
11. Marciani, D.J.; Kensil, C.R.; Beltz, G.A.; Hung, C.-H.; Cronier, J.; Aubert, A. Genetically-engineered
subunit vaccine against feline leukaemia virus: Protective immune response in cats. Vaccine 1991,
9, 89–96.
12. Fernandes, C.L.; Sachett, L.G.; Pol-Fachin, L.; Verli, H. GROMOS96 43a1 performance in
predicting oligosaccharide conformational ensembles within glycoproteins. Carbohydr. Res.
2010, 345, 663–671.

Molecules 2014, 19 3759
13. Pol-Fachin, L.; Serrato, R.V.; Verli, H. Solution conformation and dynamics of exopolysaccharides
from Burkholderia species. Carbohydr. Res. 2010, 13, 1922–1931.
14. Pol-Fachin, L.; Becker, C.F.; Guimarães, J.A.; Verli, H. Effects of glycosylation on heparin
binding and antithrombin activation by heparin. Proteins 2011, 79, 2735–2745.
15. Pedebos, C.; Pol-Fachin, L.; Verli, H. Unrestrained conformational characterization of Stenocereus
eruca saponins in aqueous and nonaqueous solvents. J. Nat. Prod. 2012, 75, 1196–1200.
16. Mortensen, K.; Pedersen, J.S. Structural study on the micelle formation of poly (ethylene
oxide)-poly (propylene oxide)-poly (ethylene oxide) triblock copolymer in aqueous solution.
Macromolecules 1993, 26, 805–812.
17. Glatter, O. Small-Angle X-ray Scattering; Glatter, O., Kratky, O., Eds.; Academic Press: London,
UK, 1982.
18. Svergun, D.I.; Barberato, C.; Koch, M.H.J. CRYSOL—A program to evaluate X-ray solution
scattering of biological macromolecules from atomic coordinates. J. Appl. Cryst. 1995, 28, 768–773.
19. Singh, M.A.; Ghosh, S.S.; Shannon, R.F. A direct method of beam-height correction in
small-angle X-ray scattering. J. Appl. Crystallogr. 1993, 26, 787–794.
20. Zemb, T.N.; Hyde, S.T.; Derian, P.J.; Barnes, I.S.; Ninham, B.W. Microstructure from X-ray
scattering: The disordered open connected model of microemulslons. J. Phys. Chem. 1987, 91,
3814–3820.
21. Orthaber, D.; Bergmann, A.; Glatter, O. SAXS experiments on absolute scale with Kratky
systems using water as a secondary standard. J. Appl. Crystallogr. 2000, 33, 218–225.
22. Glatter, O. A new method for the evaluation of small-angle scattering data. J. Appl. Cryst. 1977,
10, 415–421.
23. Glatter, O. Convolution square root of band-limited symmetrical functions and its application to
small-angle scattering data. J. Appl. Cryst. 1981, 14, 101–108.
24. IUPAC; IUB. Nomenclature of carbohydrates. Comm. Biochem. Nomencl. Pure Appl. Chem.
1996, 68, 1919–2008.
25. Schuettelkopf, A.W.; van Aalten, D.M.F. PRODRG: A tool for high-throughput crystallography
of protein-ligand complexes. Acta Crystallogr. Sect. D Biol. Crystallogr. 2004, 60, 1355–1363.
26. The PyMOL Molecular Graphics System. Available online: https://www.zotero.org/groups/
ncdirtrd3/items/itemKey/HJ2H2FHT (accessed on 10 March 2014).
27. Humphrey, W.; Dalke, A.; Schulten, K. VMD: Visual molecular dynamics. J. Mol. Graph. 1996,
14, 33–38.
28. Stone, J. An Efficient Library for Parallel Ray Tracing and Animation; Computer Science
Department, University of Missouri-Rolla: Rolla, MO, USA, 1998.
29. Schaftenaar, G.; Noordik, J.H. Molden: A pre- and post-processing program for molecular and
electronic structures. J. Comput. Aided Mol. Des. 2000, 14, 123–134.
30. Van der Spoel, D.; Lindahl, E.; Hess, B.; Groenhof, G.; Mark, A.E.; Berendsen, H.J.C.
GROMACS: Fast, flexible, and free. J. Comput. Chem. 2005, 26, 1701–1718.
31. Scott, W.R.P.; Hünenberger, P.H.; Tironi, I.G.; Mark, A.E.; Billeter, S.R.; Fennen, J.; Torda, A.E.;
Huber, T.; Krüger, P.; van Gunsteren, W.F. The GROMOS biomolecular simulation program
package. J. Phys. Chem. A 1999, 103, 3596–3607.

Molecules 2014, 19 3760
32. Pol-Fachin, L.; Fraga, C.A.M.; Barreiro, E.J.; Verli, H. Characterization of the conformational
ensemble from bioactive N-acylhydrazone derivatives. J. Mol. Graph. Model. 2010, 28, 446–454.
33. Verli, H.; Guimarães, J.A. Molecular dynamics simulation of a decasaccharide fragment of
heparin in aqueous solution. Carbohydr. Res. 2004, 339, 281–290.
34. Schmidt, M.W.; Baldridge, K.K.; Boatz, J.A.; Elbert, S.T.; Gordon, M.S.; Jensen, J.H.; Koseki, S.;
Matsunaga, N.; Nguyen, K.A.; Su, S.; et al. General atomic and molecular electronic structure
system. J. Comput. Chem. 1993, 14, 1347–1363.
35. Berendsen, H.J.C.; Grigera, J.R.; Straatsma, T.P. The missing term in effective pair potentials.
J. Phys. Chem. 1987, 91, 6269–6271.
36. Hess, B.; Bekker, H.; Berendsen, H.J.C.; Fraaije, J.G.E.M. LINCS: A linear constraint solver for
molecular simulations. J. Comput. Chem. 1997, 18, 1463–1472.
37. Darden, T.; York, D.; Pedersen, L. Particle mesh Ewald: An N·log(N) method for Ewald sums in
large systems. J. Chem. Phys. 1993, 98, 10089–10092.
38. Berendsen, H.J.C.; Postma, J.P.M.; DiNola, A.; Haak, J.R. Molecular dynamics with coupling to
an external bath. J. Chem. Phys. 1984, 81, 3684–3690.
39. Sahu, N.P.; Achari, B. Advances in Structural Determination of Saponins and Terpenoid
Glycosides. Curr. Org. Chem. 2001, 5, 315–334.
Sample Availability: Not available.
© 2014 by the authors; licensee MDPI, Basel, Switzerland. This article is an open access article
distributed under the terms and conditions of the Creative Commons Attribution license
(http://creativecommons.org/licenses/by/3.0/).