2015 PARGESA HOLDING SA - Power Corporation of Canada · Portfolio «Incubator» Portfolio *...
152
2015 Pargesa Holding SA ANNUAL REPORT
Transcript of 2015 PARGESA HOLDING SA - Power Corporation of Canada · Portfolio «Incubator» Portfolio *...

PARG
ESA
HOL
DING
SA
2015
E
PargesaHolding SA 2015
PargesaHolding SA
ANNUAL REPORT
PargesaHolding SA

Pargesa Holding SA
11, Grand-Rue
CH – 1204 Genève T +41 (0) 22 817 77 77
www.pargesa.ch
PargesaHolding SA
Annual Report 2015

Annual Report 2015Annual report 2014Pargesa Holding SA
2
Pargesa Holding SA Annual Report 2015
3
Contents
Structure and key data 4
Board of Directors, Committees, Auditor and Management 6
Letter from the Chairman 8
01 Business report 11
Introduction 12
Highlights 12
Main shareholdings 14
2015 consolidated results 18
Adjusted net asset value 22
Proposals at the Annual General Meeting of 3 May 2016 23
02 Group portfolio 25
GBL 26
Imerys 28
LafargeHolcim 30
Total 32
ENGIE 34
Pernod Ricard 36
SGS 38
Other GBL assets 40
03 Corporate Governance report 47
04 Compensation report 57
05 Consolidated financial statements 63
06 Parent company financial statements 137
3
Contents
3
Annual Report 2015
4
Structure and key data
4
Structure and key data
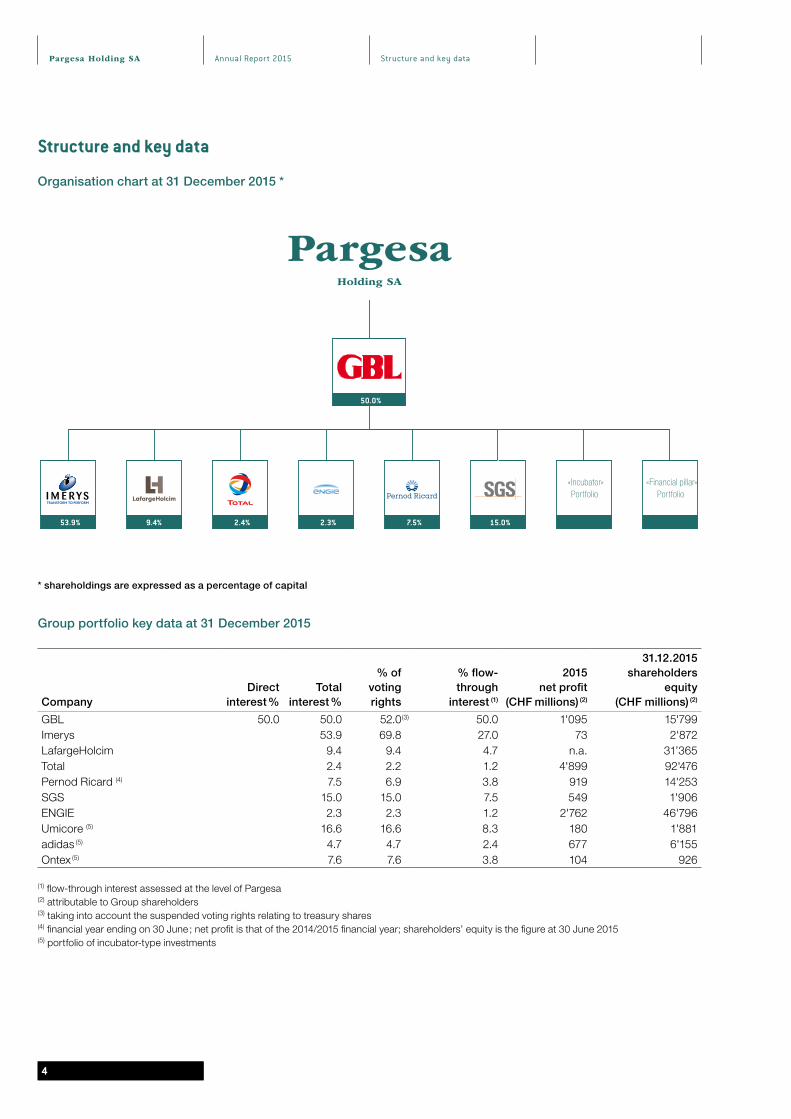
Organisation chart at 31 December 2015 *
50.0%
53.9% 9.4% 2.4% 2.3% 7.5% 15.0%
«Financial pillar»Portfolio
«Incubator»Portfolio
* shareholdings are expressed as a percentage of capital
Group portfolio key data at 31 December 2015
Company Direct
interest % Total
interest %
% of voting rights
% flow-through
interest (1)
2015 net profit
(CHF millions) (2)
31.12.2015 shareholders
equity (CHF millions) (2)
GBL 50.0 50.0 52.0 (3) 50.0 1'095 15'799Imerys 53.9 69.8 27.0 73 2'872LafargeHolcim 9.4 9.4 4.7 n.a. 31’365Total 2.4 2.2 1.2 4'899 92'476Pernod Ricard (4) 7.5 6.9 3.8 919 14'253SGS 15.0 15.0 7.5 549 1'906ENGIE 2.3 2.3 1.2 2'762 46'796Umicore (5) 16.6 16.6 8.3 180 1'881adidas (5) 4.7 4.7 2.4 677 6'155Ontex (5) 7.6 7.6 3.8 104 926
(1) flow-through interest assessed at the level of Pargesa(2) attributable to Group shareholders(3) taking into account the suspended voting rights relating to treasury shares(4) financial year ending on 30 June ; net profit is that of the 2014/2015 financial year; shareholders’ equity is the figure at 30 June 2015 (5) portfolio of incubator-type investments
PargesaHolding SA
Pargesa Holding SA

Pargesa Holding SA Annual Report 2015
5
Structure and key data
Global and per-share data
CHF millions 2011 2012 (1) 2013 2014 2015
Consolidated shareholders’ equity, Group share 7'482 7'230 7'545 7’725 7’011Operating income 342.5 346.0 250.5 339.5 308.4Non-operating income (407.4) 59.2 143.4 297.4 329.8Consolidated net profit, Group share (64.9) 405.2 393.9 636.9 638.2Gross dividend 217.5 217.5 223.5 192.2 201.5 (2)
Shares entitled to dividend 84’638’370 84'640'770 84'643'980 84’659’190 84’659’190Market capitalisation at year-end 5’205 5'303 6'086 6’523 5’376Adjusted net asset value at year-end 6’686 7'648 8'820 8’876 7’970
CHF per share 2011 2012 (1) 2013 2014 2015
Share price year-end 61.50 62.65 71.90 77.05 63.50high 90.70 68.20 72.25 82.90 76.95low 58.65 51.20 61.10 70.60 55.95average 74.37 61.66 67.07 76.55 65.11
Consolidated shareholders’ equity, Group share 88.40 85.42 89.14 91.25 82.81Adjusted net asset value at year-end 78.99 90.36 104.20 104.85 94.14Operating income (3) 4.05 4.09 2.96 4.01 3.64Non-operating income (3) (4.82) 0.70 1.69 3.51 3.90Consolidated net profit, Group share (3) (0.77) 4.79 4.65 7.52 7.54Total dividend 2.57 2.57 2.64 2.27 2.38 (2)
(Average) total return 3.5 % 4.2 % 3.9 % 3.0 % 3.7 %
(1) certain amounts have been adjusted to take account of the amendments to IAS 19 concerning the reporting of employee benefits and the correction of an error concerning the tax bases of Imerys tangible assets
(2) proposed to the Annual General Meeting
(3) calculated on the weighted average of the number of shares outstanding during the year
Market Data
Market price CHF Flow-through adjusted net asset value CHF SPI relative to market price (CHF)
5
20152011 2012 2013 2014
40
50
60
70
80
90
100
110
120
130
140
150
160

Annual Report 2015Pargesa Holding SA
66
Board of Directors
Board of Directors
Chairman
Paul DESMARAIS Jr Chairman of the Board and Co-Chief Executive Officer, Power Corporation of Canada
Vice-Chairmen
Gérald FRÈRE Executive Director, Frère-Bourgeois SA
André DESMARAIS Deputy Chairman, President and Co-Chief Executive Officer, Power Corporation of Canada
Directors
Marc-Henri CHAUDET* Attorney-at-Law
Bernard DANIEL Member of the International Committee of the Red Cross (ICRC) Assembly
Victor DELLOYE Director and Secretary General, Frère-Bourgeois SA and its subsidiary Compagnie Nationale a Portefeuille SA (CNP)
Paul DESMARAIS III Vice President, Power Corporation of Canada
Cedric FRÈRE Director, Frère-Bourgeois SA
Ségolène GALLIENNE Director, Frère-Bourgeois SA
Jean-Luc HERBEZ** Attorney-at-Law
Barbara KUX Company Director
Michel PÉBEREAU Honorary Chairman of the Board of Directors, BNP Paribas
Michel PLESSIS-BÉLAIR Vice-Chairman, Power Corporation of Canada
Gilles SAMYN Chairman of the Board, Compagnie Nationale a Portefeuille SA (CNP)
Amaury de SÈZE Vice-Chairman, Power Financial Corporation
Arnaud VIAL Senior Vice-President, Power Corporation of Canada
* not seeking another term of office
** appointment to be proposed at the Annual General Meeting on 3 May 2016
Pargesa Holding SA Annual Report 2015Pargesa Holding SA
77
Committees, Auditor,Management
Committees, Auditor, Management
Audit Committee
Chairman Marc-Henri CHAUDET*
Jean-Luc HERBEZ**
Members Barbara KUX
Michel PLESSIS-BÉLAIR
Gilles SAMYN
Amaury de SÈZE
Compensation Committee
Chairman Bernard DANIEL
Members Barbara KUX
Michel PLESSIS-BÉLAIR
Gilles SAMYN
Amaury de SÈZE
Auditor
Deloitte SA
Management
Paul DESMARAIS Jr Executive Director
Gérald FRÈRE Executive Director
Pierre HAAS Advisor to the Chairman
Arnaud VIAL Managing Director
Mark KELLER Chief Accountant
Fabienne RUDAZ BOVARD Treasurer
* up to the Annual General Meeting on 3 May 2016
** as of the Annual General Meeting on 3 May 2016, subject to his election as Director
Annual Report 2015Pargesa Holding SA
8
Letter from the Chairman
Letter from the Chairman
Dear Shareholders,
A series of important events took place around the world in 2015 and early 2016. In the area of global politics, numerous regions across the globe have been affected by escalating international tensions, new regional conflicts, a spreading terrorist threat, the on-going exodus of migrants and the rise to power of opposition parties. In economic terms, 2015 was a year of contrasts : the United States continued to recover, sharp disparities remained in Europe, and growth in a number of emerging countries, including China and Brazil, slowed down, to a greater or lesser extent, accompanied in some cases by major changes in the economic and social model. A decline of over 47 % in oil prices and abundant supply have had and continue to have an impact on oil-producing countries and on the entire industry. Major petroleum groups have been forced to slash their exploration and production budgets as well as their operating costs in an effort to lower their break-even point.
Financial markets do not thrive in this sort of environment. In the past few months, markets have been hit by high levels of volatility and periods of deep turmoil.
These events and their consequences have had no bearing on Pargesa Group's investment philosophy and long-term vision, however. Our decisions are made in the interest of long-term stability for the benefit of all our shareholders.
In 2015, we continued to reduce the exposure of our portfolio of strategic shareholdings to the energy and utilities sectors. This included GBL’s sale of a further 0.5 % of Total’s capital : at 31 December 2015, GBL held only 2.4 % of that company’s capital. This holding, with a market value of EUR 2.5 billion, was nevertheless the Group’s third largest. In February 2016, GBL sold another 1 % of Total’s capital, bringing its stake down to 1.4 %.
Last year saw the completion of the merger of Lafarge and Holcim, a project we have supported since negotiations between the two groups first began. GBL is the second largest shareholder in LafargeHolcim, with a 9.4 % stake. We are confident that the new group will meet investors’ expectations and deliver all the announced synergies.
As part of its growth strategy, GBL continued to diversify its investments in 2015 through :
• its portfolio of incubator-type investments in listed and unlisted companies in which GBL aims to become a major shareholder. This portfolio of investments, which are of smaller in size than the strategic holdings, currently includes Umicore, adidas and Ontex ;
• Sienna Capital, the goal of which is to develop a diversified portfolio of investment funds that perform well in their area (private equity funds, debt funds and theme-based funds).

Pargesa Holding SA Annual Report 2015
9
Our actions over the past three years contributed to restructuring the Group’s portfolio, which now has a more balanced risk profile. The combined market value of our six strategic holdings was EUR 13 billion at 31 December 2015, which represents 84 % of the total portfolio value ; the value of each of the five largest holdings – Imerys, LafargeHolcim, Total, Pernod Ricard and SGS – accounted for between 13 % and 18 % of this amount. GBL’s incubator-type holdings were worth a combined EUR 1.8 billion at the same date, which is nearly 12 % of the total portfolio value. The estimated value of the Sienna Capital investments was EUR 0.7 billion, or 4 % of the total portfolio.
The Swiss National Bank’s (SNB) decision in January 2015 to remove the floor exchange rate of 1.20 francs per euro had a negative impact on our adjusted net asset value, which declined by 10.2 % in 2015, which paralleled the 9.7 % decline in the euro/Swiss franc exchange rate during the same period. At the same time, GBL's adjusted net asset value, Pargesa’s only asset, which has the euro as its reference currency, remained practically unchanged.
The SNB’s decision also led the Pargesa Board of Directors to reduce the dividend paid in 2015, which was set at CHF 2.27 per bearer share. I am pleased to announce that at the Annual General Meeting on 3 May 2016, the Board will propose a 2015 dividend of CHF 2.38 per share, representing a 4.8 % increase on the previous year.
On behalf of the Board and the entire Pargesa team, I wish to express our deep sadness upon hearing of the death of Andrew Allender, Deputy Managing Director, Financial Director and Secretary to the Board of Directors. Mr Allender, who had worked for Pargesa for 26 years, passed away on 2 November 2015 at the age of 51. His professionalism and dedication to the Group’s values were widely recognised. We wish to offer our sincerest condolences to Mr Allender’s family.
I would like to close by paying tribute to Marc-Henri Chaudet, a member of the Pargesa Holding Board of Directors since 1996 and Chairman of the Audit Committee, who has announced his decision not to seek another term as director owing to his age. The Board of Directors is deeply grateful to Mr Chaudet for his invaluable contribution to the Board’s work over the past 20 years.
Geneva, March 2016
Paul Desmarais Jr
9
Letter from the Chairman


11
01BUSINESS
REPORT
Annual Report 2015Pargesa Holding SA
12
Business report
1. Introduction
Pargesa Holding SA, whose registered office is in Geneva, is the parent company of Pargesa Group, which is active in various industry and service sectors through its holdings in a number of operating companies.
Pargesa Group’s main business strategy is built around the following key principles :
• focus the portfolio primarily on a limited number of major strategic holdings, with a view to creating value over the long term ;
• seek to exercise control or influence over the companies in which the Group holds interests, enabling the Group to fulfil its role as a professional, long-term shareholder ;
• work continuously as a strategic shareholder in the companies in which the Group invests, through its representatives on the boards of directors and board committees, particularly with regard to :
– discussing and approving the business development strategies put forward by senior management ;
– regularly monitoring the course of business and taking part in important decision-making ;
– being involved in defining financial policy.
On the basis of these principles, the Group’s portfolio was focussed primarily on six key holdings at 31 December 2015 : Imerys, LafargeHolcim, Total, ENGIE, Pernod Ricard and SGS. Details of these companies’ operations and financial results are provided in chapter 02 “Group portfolio” of this Annual Report.
These investments are held through the subsidiary Groupe Bruxelles Lambert (GBL), which is listed on Euronext Brussels. At 31 December 2015, Pargesa held 50.0 % of the share capital and 52.0 % of the voting rights of GBL, taking into account the suspended voting rights relating to GBL treasury shares.
In addition to the large strategic holdings that make up the majority of its portfolio, GBL began to diversify into two areas in 2012 :
• “incubator” investments, made up of a limited selection of smaller listed and unlisted holdings that have the potential to become strategic assets over time. GBL aims to become a core shareholder and, for mid-sized companies, to possibly hold a majority stake ;
• fhe “financial pillar”, comprising major stakes in private equity funds, debt funds and theme-based funds, grouped under Sienna Capital.
These two investment arms, which could come to represent up to 15 % and 10 % of GBL’s adjusted net asset value respectively, are presented on pages 40 to 46 of this Annual Report.
The breakdown and analysis of Pargesa’s financial results are provided in section 4 of this Business Report, while information on the adjusted net asset value can be found in section 5.
2. Highlights of 2015 and early 2016
2.1 The Group's portfolio
During H1 2015, the Boards of Directors of Holcim and Lafarge announced that they had reached an agreement on revised terms for the merger of equals between the two groups, first announced in 2014. The parties agreed on a new exchange ratio of 9 Holcim shares for 10 Lafarge shares. Lafarge and Holcim also agreed that the new group would announce a post-closing scrip dividend of 1 new LafargeHolcim share for every 20 existing shares.
On 1 June 2015, Holcim launched its public exchange offer for all Lafarge shares, which closed on 3 July 2015 with 87.46 % of Lafarge shares having been tendered to the offer. At the end of the reopening period on 28 July 2015, the results of which were disclosed on 31 July 2015, Holcim held 96.4 % of the capital, representing more than 95 % of Lafarge’s voting rights. A squeeze-out was therefore launched and successfully completed on 23 October 2015. As announced, in September 2015 LafargeHolcim distributed a scrip dividend at a ratio of one new LafargeHolcim share for every 20 existing shares, which had no impact on the income statement. At 31 December 2015, GBL held 9.4 % of the capital of LafargeHolcim, the shares of which are listed on the SIX Swiss Exchange and Euronext Paris. GBL’s holding in Lafarge, which was previously accounted for using the equity method, was reclassified under “assets held for sale” at 30 June 2015 and then as an “available-for-sale finan-cial asset” as of 10 July 2015, the date on which the Lafarge shares were exchanged for LafargeHolcim shares. This generated a net accounting gain of EUR 442 million for GBL, with Pargesa’s share amounting to CHF 243.7 million.
In 2015, GBL sold 12.1 million Total shares, or 0.5 % of Total’s capital, for proceeds of EUR 556 million, generating a capital gain of EUR 282 million for GBL. Most of these shares were sold through forward contracts that expired in December 2015. These disposals generated a capital gain of CHF 225.2 million for Pargesa. At 31 December 2015, GBL held 2.4 % of the capital of Total, which was still the Group’s third largest holding at year-end. In February 2016, GBL sold a further 26.2 million Total shares, representing approximately 1 % of the company’s capital, both in the market and through a private placement by way of an accelerated bookbuilding process to institutional investors. These transactions represented a total amount of EUR 1 billion and generated a capital gain for GBL of approximately EUR 405 million, which will be booked in 2016. Following these transactions, GBL held 1.4 % of Total’s capital.
Pargesa Holding SA Annual Report 2015
13
Business report
Imerys’ acquisition of Greek group S&B was completed on 26 February 2015. As the acquisition was partially paid in Imerys shares, the Kyriacopoulos family, the founding shareholder of S&B, now holds approximately 4.7 % of Imerys’ capital. GBL’s holding was therefore slightly diluted, from 56.5 % at end-2014 to 53.9 % at 31 December 2015.
In 2015, GBL received additional requests for the early conversion of bonds exchangeable for Suez (formerly Suez Environnement) shares, which matured in September 2015. In total, GBL delivered 5.1 million Suez shares, representing EUR 59 million in bond par value. As previously announced, the conversions cancelled the debt and resulted in a reversal in the value adjustments previously recorded on the derivatives implicitly embedded in the bonds, as well as a gain on the Suez shares delivered. At 31 December 2015, GBL no longer held any shares in this company.
As part of the expansion of its “incubator-type” investments, GBL continued to increase its stake in Umicore and held 16.6 % of that company’s capital at 31 December 2015 (12.4 % at end-December 2014), worth EUR 720 million. GBL is now Umicore’s largest shareholder.
In July 2015, GBL announced that it had crossed the statutory threshold of 3 % in the capital of adidas, a world leader in the design and distribution of sportswear. GBL held 4.7 % of adidas’ capital, worth EUR 890 million, at 31 December 2015. In January 2016, GBL informed the company that it had passed the statutory threshold of 5 % of adidas’ capital.
Finally, in 2015 GBL acquired a stake in the capital of the listed Belgian company Ontex, a leading provider of disposable hygiene products. GBL also acquired some of the new Ontex shares issued in November 2015, in order to maintain its holding at the same level. GBL held 7.6 % of Ontex’ capital, worth EUR 181 million, at 31 December 2015. On 16 March 2016, GBL informed Ontex that it had passed the statutory threshold of 10 % of the company’s capital.
Within GBL’s “financial pillar” (Sienna Capital), Ergon Capital Partners III (ECP III) acquired in May 2015 a majority interest in Golden Goose, an Italian designer of contemporary shoes, clothes and accessories. In Q1 2015, Ergon Capital Partners II (ECP II) disposed of its majority holding in Joris Ide, a leader in insulating panels and steel envelope products. This transaction generated a net consolidated gain of EUR 14 million for GBL, with Pargesa’s share amounting to CHF 8 million. Sagard III also made new investments in 2015 – in Safic-Alcan, Délices des 7 Vallées and Alvest. In July 2015 the Sagard II fund, in which both GBL and Pargesa are investors, disposed of its stake in Cérélia, generating an overall capital gain of CHF 12.4 million for Pargesa. Finally, the Sagard III fund sold its interest in the Santiane Group in September 2015, generating a capital gain of CHF 3.7 million for Pargesa.
In February 2015, Sienna Capital announced that it was investing EUR 150 million in PrimeStone, a new fund whose strategy consists of making medium- to long-term investments in medium-sized listed companies in Europe.
In December 2015, Sienna Capital committed to investing EUR 113 million in BDT Capital Partners II, a private-equity fund that currently manages approximately USD 8 billion in commitments. The fund’s aim is to meet the long-term financial and strategic needs of family-owned and entrepreneurial businesses in the USA and Europe.
At 31 December 2015, debt fund Kartesia had made capital calls of EUR 386 million (representing approximately 76 % of the fund’s com-mitments) invested in primary and secondary financing transactions.
In Q1 2016, ECP III acquired a majority stake in Financière Looping SAS, a European theme-park operator.
At 31 December 2015, GBL’s commitments under its financial pillar amounted to EUR 413 million (EUR 520 million at 31 December 2014).
At the end of March 2015, Pargesa Holding SA issued a CHF 150 million Swiss domestic bond in order to increase its financial resourc-es and fund the refinancing of its 2.5 % bond of CHF 150 million maturing in November 2016. The nine-year bond pays an annual coupon of 0.875 % and is redeemable on 24 April 2024. The transaction took place under favourable market conditions and significantly increased Pargesa’s average debt maturity.

Annual Report 2015Pargesa Holding SA
14
Business report
2.2 Company organisation
Following the Annual General Meeting on 5 May 2015, Gérald Frère, Vice Chairman of the Board of Directors since 2002 and a member of the Board since 1992, replaced Albert Frère as Execu-tive Director. On 2 February 2015 Albert Frère, Vice Chairman of the Board of Directors and Executive Director, and a Board mem-ber since 1981, had informed the Board of Directors that he would not seek another term as Director at the Annual General Meeting on 5 May 2015.
It was with great sadness that all those at the Company learned of the death of Andrew Allender, Deputy Managing Director, Financial Director and Secretary to the Board of Directors of Pargesa Holding SA, who passed away on 2 November 2015 at the age of 51. He had joined the company in 1989. The Board of Directors and the entire Pargesa Holding SA team would like to express their sincerest condolences to Andrew Allender’s family.
Marc-Henri Chaudet, a member of the Board of Directors since 1996 and Chairman of the Audit Committee since it was created in 1997, informed the Chairman of the Board of Directors that, owing to his age, he would not seek another term as Director at the Annual General Meeting on 3 May 2016. The Board of Directors would like to thank Mr Chaudet for his loyalty and invaluable contribution over the last 20 years.
At the Annual General Meeting on 3 May 2016, the Board of Directors will submit a proposal to elect Jean-Luc Herbez as Director for a one-year term that will expire at the end of the 2017 Annual General Meeting.
3. Main Group shareholdingsFor Imerys, the world leader in mineral-based specialty solutions for industry, overall market conditions were difficult in 2015. Furthermore, demand for ceramic proppants for non-conventional oilfields dropped sharply following the continued decline in oil prices. Against this backdrop, the group continued to implement its action plans to protect and improve its operational performance and to invest in innovation and the extension of its portfolio of activities.
In February 2015, Imerys completed its acquisition of S&B, a global player and European leader in bentonite (binders for foundry, sealing solutions, additives for drilling and functional additives) and a world leader in continuous casting fluxes for the steel industry and in wollastonite (functional additives for polymers and paints). S&B also provides perlite-based solutions for building materials and horticulture. The integration of S&B, which started last March, is progressing in line with expectations. Imerys also continued its expansion, with the acquisition of the Precipitated Calcium Carbonate (PCC) division of Solvay, which operates four plants in Europe, of BASF’s paper hydrous kaolin (PHK) activities in the USA, and of Matisco, a specialised manufacturer of metal accessories for roofing.
Revenue stood at EUR 4’087 million, compared with EUR 3’688 million in 2014, a rise of 10.8 % on a current basis. This improvement reflects the positive impact of changes in scope (+9.5 %), mainly stemming from the consolidation of S&B since 1 March 2015, and a positive exchange rate effect (+5.9 %) reflecting the depreciation of the euro against the US dollar in particular. At constant scope and exchange rates, revenue was down 4.6 % year on year due to the persistent weakness of some markets and regions, as well as a particularly unfavourable basis of comparison in ceramic proppants (gradual ramp-up of production during the previous year). Excluding ceramic proppants, revenue was down 2.5 % at constant scope and exchange rates. In this difficult environment, the price/mix effect remained positive, reaching 1.3 % for the group as a whole.
Current operating income came in at EUR 538.1 million, compared with EUR 494.6 million in 2014, a rise of 8.8 %.
Current operating income was impacted by the decline in sales volumes, which was partly offset by a favourable exchange rate and scope effect, as well as by a positive trend in the mix of activities and effective management measures (improvement in variable costs and a decrease in fixed costs and general expenses). The group’s operating margin was 13.2 % (13.4 % in 2014).
Group share of net income from current operations came in at EUR 341.5 million, compared with EUR 316.3 million in 2014, a rise of 8.0 %.
Group share of net income stood at EUR 68.4 million, compared with EUR 271.6 million in 2014. It included other income and expenses net of tax of EUR −273.1 million in 2015 (EUR −44.7 million in 2014), made up of a non-cash impairment charge of EUR −209 million on assets in the Oilfield Solutions division (total impairment of goodwill and impairment of part of the assets) owing to the current oil market situation, together with restructuring costs amounting to EUR 64.1 million.
A dividend of EUR 1.75 per share, compared with EUR 1.65 for the year-earlier period (a rise of 6.1 %), will be submitted for approval at the Annual General Meeting.
At 31 December 2015, GBL held 53.9 % of Imerys’ share capital.

Pargesa Holding SA Annual Report 2015
15
Business report
Lafarge (H1 2015) − Lafarge recorded sales of EUR 6’319 million in H1 2015, a rise of 5 %. This reflects the divestments made, particularly those in Ecuador, Russia and Pakistan, while the appreciation of many currencies against the euro had a positive impact. On a like for like basis, sales in H1 2015 were stable compared with the previous year.
In H1 2015, EBITDA came in at EUR 1’223 million, up 6 % on a reported basis. On a like for like basis, it rose 2 % as a result of cost reduction and innovation measures, together with carbon credit sales.
Current operating income increased 8 % to EUR 813 million on a reported basis and 6 % on a like for like basis. However, Lafarge recorded a net loss of EUR 477 million in H1 2015, due to the impact of various one-off items, including EUR 450 million in impairments on some of the assets that were to be divested to CRH in Q3 2015, restructuring costs, and costs relating to the merger with Holcim.
LafargeHolcim (H2 2015 – N.B. full year 2015, as well as 2014 figures, are on a pro-forma basis – net income and free cash-flow for full year 2015 are not published, as the full year figures would include pre and post-merger items)
Q4 2015 results were impacted by challenges in selected markets, most notably Brazil, Switzerland, China, Indonesia, Zambia, Nigeria and Azerbaijan. Lower C02 revenues and adverse forex movements also affected results. However, positive developments in markets including the United States, Mexico, Argentina, the Philippines, Australia and the United Kingdom look promising.
Net sales were CHF 7’441 million in Q4 2015, down 5.9 % over Q4 2014, but up 1.7 % on a like for like basis.
In the Asia-Pacific region, numbers were driven by volume growth in countries including the Philippines, Vietnam, and Australia. Results were affected by the deceleration of economic growth in China and, to some extent, in India. In Indonesia, delays to infrastructure projects and pressure on pricing impacted performance.
In Europe, strong growth in some markets, including the United Kingdom and Romania, showed pockets of growth remain in this challenging region. However, performance in the region was influenced by uncertainty and depressed construction markets in several countries.
The group performed well in large parts of the Latin American market, but was significantly impacted by the deteriorating economic situation in Brazil. Mexican infrastructure projects had a positive effect, and Argentina experienced a stabilisation of economic activity over the course of 2015.
Middle East & Africa showed mixed growth. Some of the region’s markets were impacted by lower demand, resulting from lower oil and commodity prices, while other countries such as Kenya and Algeria recorded strong performances. Performance in Egypt was strong, with economic tailwinds at the start of the year and increased infrastructure activity, while Nigeria’s increased helped sales. Regional political instability affected markets in Jordan, Syria and Iraq.
LafargeHolcim posted solid results in North America as a result of both the continuing recovery in the United States as well as successful price management and cost optimisation. Cement and aggregate volumes increased as a whole across the United States and in Eastern Canada, offset partially in particular by reduced demand in some regions (such as Western Canada and Texas) where oil and commodity investments were under pressure. Financial performance increased markedly thanks mainly to the United States as well as an overachievement on synergy realisation.
Adjusted operating EBITDA in Q4 2015 stood at CHF 1.40 billion, down 15.3 % on Q4 2014 (−8.4 % like for like). Excluding CO2 sales, Q4 adjusted operating EBITDA was down 12.9 % (−5.8 % on a like for like basis). Adjusted operating EBITDA for full year 2015 stood at CHF 5.75 billion, −10.7 % on full year 2014 (−4.6 % like for like). Excluding CO2 sales, 2015 adjusted EBITDA was down 9.7 % (−3.6 % like for like).
In Q4 2015, LafargeHolcim recorded a net loss of CHF 2.86 billion. In the context of the deployment of the synergy action plans, the completion of the portfolio review and the progress on the purchase price allocation exercise, the group recorded a one-off non-cash charge of CHF 3.0 billion related to asset impairments and other charges in Q4. Q4 merger, restructuring and other one-off costs were at CHF 407 million, of which a total of CHF182 million was incurred to implement synergy action plans including restructuring activities.
Q4 2015 free cash flow stood at CHF 813 million after adjusting for one-off items of CHF 166 million.
Net debt stood at CHF 17.3 billion at the end of 2015.
Significant progress was made with respect to integration : merger synergies were ahead of plan, with CHF 130 million on operating EBITDA in H2 2015 (of which CHF 94 million in the fourth quarter) versus CHF 100 million targeted, and the portfolio review was completed (CHF 3.5 billion of divestments planned in 2016).
At the Annual General Meeting of shareholders, the Board of Directors will propose a dividend of CHF 1.50 per share.
At 31 December 2015, GBL held 9.4 % of LafargeHolcim’s share capital.

Annual Report 2015Pargesa Holding SA
16
Business report
Total is a global, integrated oil and gas group with also a presence in the chemical industry. In 2015, Total recorded a 9.4 % increase in hydrocarbon production to 2’347 boe/d, driven by the start-up of nine projects.
Despite the drop in oil prices (the average Brent price in 2015 was USD 52.4 per barrel, compared with USD 99.0 in 2014, a drop of 47 %) and in gas prices (−28 %), which had a significant impact on the Upstream segment, the group was able to take advantage of its integrated business model, with Refining & Chemicals in particular benefiting from favourable margin levels. Refinery throughput increased by 9 % year on year, while petroleum product sales were up 3 %. In addition, Total pressed ahead with its cost reduction programme, which led to savings of USD 1.5 billion.
Adjusted net operating income from business segments was USD 11’362 million in 2015, compared with USD 14’247 million in 2014, a drop of 20 %. Upstream adjusted net operating income was down 55 % to USD 4’774 million, while the same item for Refining & Chemicals rose 96 % to USD 4’889 million and that of Marketing & Services was up 35 % to USD 1’699 million.
Adjusted net income stood at USD 10’518 million in 2015, compared with USD 12’837 million in 2014, a decrease of 18 %. Group share of net income came in at USD 5’087 million, compared with USD 4’244 million in 2014, and included USD −5’431 million in adjustment items, comprising impairments on Fort Hills in Canada and Gladstone LNG in Australia as well as on exploration projects that will not be developed. In 2014, adjustment items amounted to USD −8’593 million and included one-off impairments concerning oil sands in Canada, unconventional gas, European refining and certain other assets in the Upstream segment.
Net investments stood at USD 20’360 million in 2015, compared with USD 24’140 million a year earlier.
The dividend to be submitted for approval at the Annual General Meeting of shareholders will be EUR 2.44 per share, unchanged from the previous year.
At 31 December 2015, GBL held 2.4 % of Total’s share capital.
ENGIE (formerly GDF Suez) is a leading international energy group operating in gas, electricity and energy-related services.
In a deteriorated market context, marked in particular by a very difficult market price environment, revenues came in at EUR 69.9 billion in 2015, compared with EUR 74.7 billion in 2014, a decrease of 6.4 % on a reported basis (−8.8 % in organic terms). This decrease reflects lower commodity prices, the decline in LNG activities and the unavailability of the Doel 3 and Tihange 2 nuclear plants (throughout almost the entire year) and Doel 1 being offline in Belgium. This was partially offset by the appreciation of the US dollar against the euro and by more favourable weather conditions in France, despite very mild temperatures towards the end of 2015 (2014 had been a particularly warm year).
Group EBITDA amounted to EUR 11.3 billion, compared with EUR 12.1 billion in 2014, down 7.2 % on a reported basis and down 9.1 % on an organic basis, mainly for the same reasons as indicated above.
Group share of net recurring income was EUR 2.6 billion, compared with EUR 2.7 billion a year earlier, and included lower tax expense and lower recurring financial expenses.
In 2015 ENGIE reported a net loss (group share) of EUR −4.6 billion (compared with net income of EUR 2.4 billion in 2014), which reflected EUR 6.8 billion in impairment losses. These impairments primarily relate to the exploration-production activity, which was heavily impacted by the major and prolonged drop in oil and gas prices, and to the LNG supply & sales activity, which was impacted by the turnaround in the LNG market. Impairments also related to power production activities in merchant markets, due to deteriorating fundamentals, and intangible assets in France.
At 31 December 2015, net debt stood at EUR 27.7 billion, a year-on-year increase of EUR 0.2 billion, mainly reflecting the unfavourable impact of changes in exchange rates. The net debt/EBITDA ratio was 2.46x at end-2015.
ENGIE confirmed that it would pay a dividend of EUR 1.00 per share for the 2015 and 2016 financial years and committed to paying a dividend of EUR 0.70 per share for the 2017 and 2018 financial years.
At 31 December 2015, GBL held 2.3 % of ENGIE’s capital, almost all of which corresponded to shares underlying the exchangeable bonds issued by GBL in early 2013 and maturing in 2017.
Pargesa Holding SA Annual Report 2015
17
Business report
Pernod Ricard, the world co-leader in wine and spirits, recorded net sales of EUR 8’558 million for the 2014-2015 financial year ending on 30 June 2015, a rise of 2 % at constant scope and exchange rates. This increase reflected a return to growth in Asia/Rest of the World (+4 %) following an improvement in China and strong momentum in India, growth of 2 % in the Americas and stability in Europe. On a reported basis, net sales were up 8 %, as a result of a very favourable exchange rate effect.
Profit from recurring operations was EUR 2’238 million, a rise of 2 % at constant scope and exchange rates. On a reported basis, it increased 9 %. The operating margin came in at 26.2 %, including a favourable exchange rate effect. At constant scope and exchange rates, the rise in profit from recurring operations reflects in particular the 105 bp decrease in the gross margin ratio, a 2 % rise in advertising and promotion expenses and a 3 % decrease in structure costs.
Group share of net profit from recurring operations came in at EUR 1’329 million, a year-on-year rise of 12 %. Group share of net profit declined by 15 % to EUR 861 million, mainly due to an impairment charge on the Absolut brand.
The dividend for the 2014-2015 financial year was set at EUR 1.80 per share, an increase of 10 %.
For the first half of the 2015-2016 financial year, i.e. the period ending on 31 December 2015, net sales were EUR 4’958 million, compared with EUR 4’621 million for the first half of the 2014-2015 financial year. This rise of 7 % included a favourable exchange-rate impact. Organic sales growth stood at 3 %, reflecting accelerated growth in the Americas (+4 %), primarily driven by the USA (+3 %), 5 % growth in Asia/Rest of World and a slight improvement in Europe (+1 %). The group reported sales growth across the Top 14, Priority Premium Wines and Key Local Brands. Market share gains were recorded in most key markets, while innovation contributed 1 % to organic sales growth, driven by sustained advertising and promotion investments. The group also benefited from a return to positive pricing.
H1 2015-2016 profit from recurring operations came in at EUR 1’438 million, compared with EUR 1’358 million a year earlier, reflecting organic growth of 3 % and reported growth of 6 %. Pressure on the gross margin eased (–25bp) versus full year 2014-2015 (–105bp).
Group share of net profit from recurring operations stood at EUR 909 million, compared with EUR 834 million a year earlier, a rise of 9 % on a reported basis. Group net profit was EUR 886 million, compared with EUR 788 million a year earlier, a rise of 12 %.
At 31 December 2015, GBL held 7.5 % of Pernod Ricard’s share capital.
SGS, the world’s leading inspection, verification, testing and certification company, recorded CHF 5.7 billion in revenues in 2015, a year-on-year rise of 3.6 % at constant exchange rates (–2.9 % on a reported basis), of which 2.0 % was organic and 1.6 % was contributed by recent acquisitions. The group initiated 14 acquisitions during 2015, 10 of which were completed.
Organic growth reflects the strong performance by certain divisions, which was partially offset by the impact that the drop in commodities prices had on the Oil, Gas & Chemicals, Minerals Services and Industrial Services divisions. Adjusted EBITDA reached CHF 1’191 million, up 3.4 % at constant currency rates versus the prior year (–2.9 % on a reported basis). Adjusted operating income was CHF 917 million, a rise of 3.2 % at constant currency rates (−3.2 % on a reported basis). The adjusted operating margin was stable at 16.1 %. Group share of net income for the period was CHF 549 million, down 6.9 % at constant currency rates (−12.7 % on a reported basis) versus the prior year, mainly due to restructuring expenses in 2015, while the group had recorded one-off income in 2014. Operating cash flow was CHF 1’062 million, compared with CHF 912 million in 2014.
At the Annual General Meeting of shareholders held on 14 March 2016, shareholders approved the payment of a dividend of CHF 68 per share for the 2015 financial year, unchanged from the previous year.
At 31 December 2015, GBL held 15.0 % of SGS’ share capital.

Annual Report 2015Pargesa Holding SA
18
Business report
4. 2015 consolidated financial results
4.1 Presentation of results in accordance with IFRS
The simplified income statement in accordance with IFRS is as follows :
CHF millions 2015 2014
Operating income 4'774.4 4'854.6 Operating expenses (4'478.8) (4'399.3)Other income and expenses 820.3 833.5 Operating profit 1'115.9 1'288.8 Dividends and interest from long-term investments 345.2 384.4 Other financial income and expenses (31.1) (229.1)Taxes (69.8) (147.5)Income from associates and joint ventures (77.6) 91.8 Consolidated net profit (before minority interests) 1'282.6 1'388.4 Attributable to minority interests (644.4) 751.5 Attributable to Pargesa shareholders (Group share) 638.2 636.9
Average number of shares in circulation (in thousands) 84'659 84'656
Basic earnings per share attributable to Pargesa shareholders (CHF) 7.54 7.52
Average EUR/CHF exchange rate 1.067 1.214
Operating income and expenses are primarily the revenues and operating expenses of Imerys, whose accounts are fully consolidated.
Other income and expenses includes net capital gains and losses as well as impairments or reversal of previous impairments on Group shareholdings and operations. At 31 December 2015, this figure included the net impact of the deconsolidation of Lafarge, for an amount of CHF +469.4 million. It also included the capital gain recorded on GBL’s sale of 0.5 % of Total’s share capital, together with the capital gain recorded by GBL following the delivery of Suez shares to holders of bonds exchangeable for Suez shares who had exercised their right to exchange the bonds either early or at maturity in September 2015. In 2014, this line item mainly represented the capital gain recorded on GBL’s sale of 0.6 % of Total’s share capital, and the capital gain recorded by GBL following the delivery of Suez shares to bondholders who had exercised their right to exchange the bonds early.
The dividends and interest from long-term investments item comprises the net dividends received by the Group from its non-consolidated investments, mainly dividends from Total, SGS, ENGIE and Pernod Ricard in 2015.
The other financial income and expenses and taxes items provide consolidated figures for Pargesa, GBL and Imerys. Other financial income
and expenses includes the non-cash impact of GBL’s derivative financial instruments (mainly those implicitly embedded in convertible and exchangeable bonds issued by GBL) being marked to market.
Income from associates and joint ventures represents the share of the consolidated net profit contributed by shareholdings accounted for in the Pargesa financial statements using the equity method. In 2015, this item included Pargesa’s CHF –107.1 million share of the loss recorded in H1 2015 by Lafarge, a holding that was accounted for using the equity method until 30 June 2015.
The item minority interests mainly relates to the share of income due to the minority shareholders of GBL and Imerys, these two companies being fully consolidated into the Pargesa Group financial statements.
Pargesa Holding SA Annual Report 2015
19
Business report
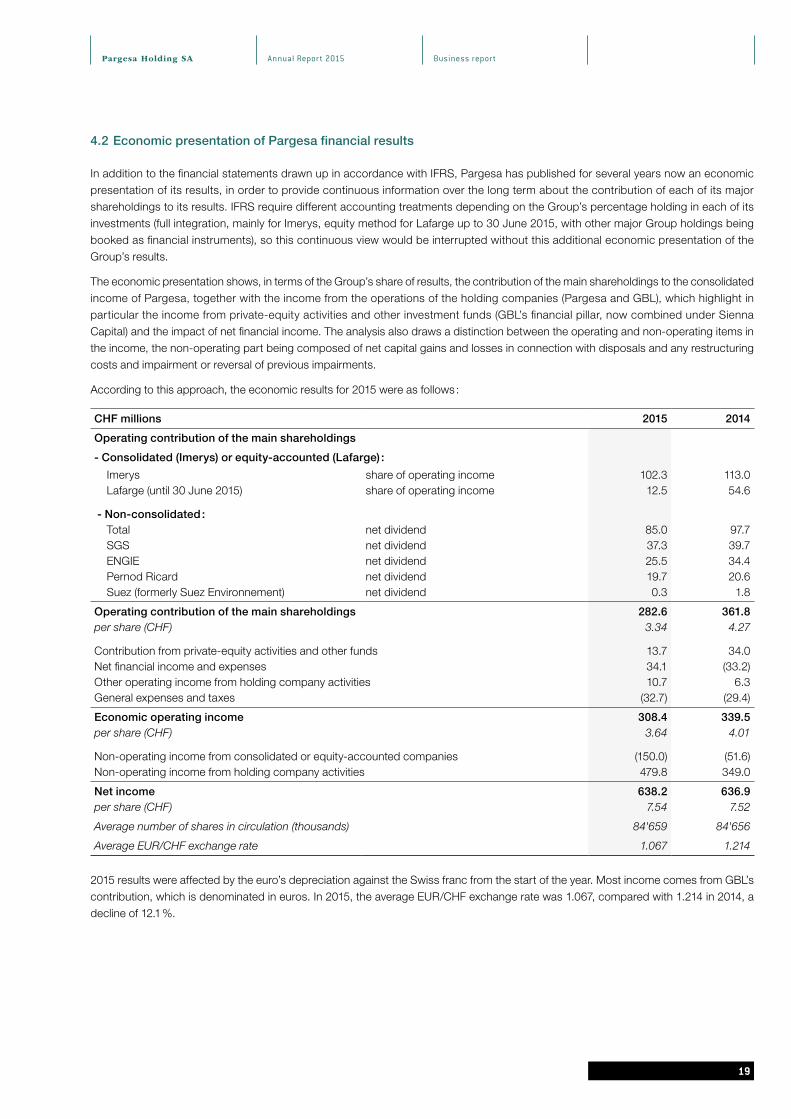
4.2 Economic presentation of Pargesa financial results
In addition to the financial statements drawn up in accordance with IFRS, Pargesa has published for several years now an economic presentation of its results, in order to provide continuous information over the long term about the contribution of each of its major shareholdings to its results. IFRS require different accounting treatments depending on the Group’s percentage holding in each of its investments (full integration, mainly for Imerys, equity method for Lafarge up to 30 June 2015, with other major Group holdings being booked as financial instruments), so this continuous view would be interrupted without this additional economic presentation of the Group’s results.
The economic presentation shows, in terms of the Group’s share of results, the contribution of the main shareholdings to the consolidated income of Pargesa, together with the income from the operations of the holding companies (Pargesa and GBL), which highlight in particular the income from private-equity activities and other investment funds (GBL’s financial pillar, now combined under Sienna Capital) and the impact of net financial income. The analysis also draws a distinction between the operating and non-operating items in the income, the non-operating part being composed of net capital gains and losses in connection with disposals and any restructuring costs and impairment or reversal of previous impairments.
According to this approach, the economic results for 2015 were as follows :
CHF millions 2015 2014
Operating contribution of the main shareholdings
- Consolidated (Imerys) or equity-accounted (Lafarge) :
Imerys share of operating income 102.3 113.0 Lafarge (until 30 June 2015) share of operating income 12.5 54.6
- Non-consolidated : Total net dividend 85.0 97.7 SGS net dividend 37.3 39.7 ENGIE net dividend 25.5 34.4 Pernod Ricard net dividend 19.7 20.6 Suez (formerly Suez Environnement) net dividend 0.3 1.8
Operating contribution of the main shareholdings 282.6 361.8 per share (CHF) 3.34 4.27
Contribution from private-equity activities and other funds 13.7 34.0 Net financial income and expenses 34.1 (33.2)Other operating income from holding company activities 10.7 6.3 General expenses and taxes (32.7) (29.4)
Economic operating income 308.4 339.5 per share (CHF) 3.64 4.01
Non-operating income from consolidated or equity-accounted companies (150.0) (51.6)Non-operating income from holding company activities 479.8 349.0
Net income 638.2 636.9 per share (CHF) 7.54 7.52
Average number of shares in circulation (thousands) 84'659 84'656
Average EUR/CHF exchange rate 1.067 1.214
2015 results were affected by the euro’s depreciation against the Swiss franc from the start of the year. Most income comes from GBL’s contribution, which is denominated in euros. In 2015, the average EUR/CHF exchange rate was 1.067, compared with 1.214 in 2014, a decline of 12.1 %.
Annual Report 2015Pargesa Holding SA
20
Business report
Consolidated and equity-accounted holdings :
Imerys recorded an 8.0 % rise in net income from current operations to EUR 341.5 million in 2015, compared with EUR 316.3 million in 2014. Net income stood at EUR 68.4 million (after non-recurring items of EUR −273.1 million net of taxes), versus EUR 271.6 million in 2014 (after non-recurring items of EUR –44.7 million net of taxes). Pargesa’s share of Imerys’ operating income, in Swiss francs, was down 9.5 % to CHF 102.3 million, mainly reflecting a decline in the average EUR/CHF exchange rate and, to a lesser extent, the dilution of GBL’s holding in Imerys, from 56.6 % in 2014 to 54.0 % in 2015, after new shares were issued as part of the acquisition of S&B group.
Lafarge’s contribution in 2015 represents Pargesa’s share of H1 2015 results ; this holding was deconsolidated in early July following the merger with Holcim, as described above. It is therefore not directly comparable to Lafarge’s contribution in 2014. In H1 2015, Lafarge recorded a 5 % rise in sales (stable at constant scope and exchange rates), and EBITDA was up 6 %. Lafarge’s net income, however, was EUR −477 million in H1 2015, as a result of various one-off items such as impairments on assets to be divested to CRH, costs related to the merger and other restructuring costs. Pargesa’s share of Lafarge’s H1 2015 operating income, in Swiss-franc terms, was CHF 12.5 million, compared with CHF 54.6 million in 2014.
Non-consolidated holdings :
The contributions from Total, SGS, ENGIE, Pernod Ricard and Suez represent Pargesa’s share of net dividends recorded by GBL from these companies.
Pargesa’s share of Total dividends amounted to CHF 85.0 million in 2015, consisting of the final 2014 dividend (EUR 0.61 per share) and the first three quarterly interim dividends for 2015, also each amounting to EUR 0.61 per share. The aggregate amount was therefore EUR 2.44 per share, the same as a year earlier. The decrease in Total’s contribution in 2015 (Pargesa’s share was CHF 97.7 million in 2014) was mainly a result of the depreciation of the euro.
As part of its new dividend policy, in Q2 2015 ENGIE paid a final 2014 dividend of EUR 0.50 per share, compared with EUR 0.67 per share a year earlier. In Q3 2015 it paid an interim dividend for 2015 also of EUR 0.50 per share (unchanged from 2014). ENGIE’s contribution to Pargesa in 2015 came to CHF 25.5 million, compared with CHF 34.4 million in 2014.
In Q2 2015, Pernod Ricard paid an interim dividend of EUR 0.82 per share, the same amount as a year earlier. The final 2014-2015 dividend was EUR 0.98 per share, compared with EUR 0.82 a year earlier. Pernod Ricard’s 2015 contribution, taking into account the impact of exchange rates, was CHF 19.7 million, compared with CHF 20.6 million in 2014.
SGS paid an annual dividend of CHF 68 per share, compared with CHF 65 per share in 2014. Pargesa’s share came to CHF 37.3 million. Even though SGS increased its dividend by 4.6 %, there was a slight year-on-year decrease in the contribution from SGS, mainly because GBL had hedged the Swiss-franc-denominated SGS dividend before the Swiss National Bank removed the EUR/CHF floor in January 2015.
Contributions from holding company activities :
Contributions from private-equity activities and other investment funds come primarily from investments held by GBL under its “financial pillar” (Sienna Capital), as well as from general expenses relating to these funds (including management fees). In 2015, the net contribution of CHF 13.7 million included : Pargesa’s CHF 7.8 million share of the gain realised by ECP II on the disposal of its majority holding in Joris Ide ; Pargesa’s CHF 12.4 million share of the gain realised by Sagard II on the disposal of Cérélia ; and its CHF 3.7 million share of the gain realised by Sagard III on the disposal of the Santiane Group. In 2014, the net contribution of CHF 34.0 million included : Pargesa’s CHF 51.1 million share of the capital gains on the disposals of the stakes in Zellbios, held by ECP II, and in Corialis, held by ECP II and by Sagard II fund, in which GBL and Pargesa are both investors.
Pargesa Holding SA Annual Report 2015
21
Business report
Net financial income and expenses includes interest income and expenses as well as other financial income and expenses, including the marking to market of derivative financial instruments. This item stood at CHF 34.1 million in 2015, compared with CHF −33.2 million in 2014.
It included the non-cash impacts at GBL relating to the derivative instruments implicitly embedded in the bonds exchangeable for Suez and ENGIE shares or convertible into existing GBL shares. In 2015, Pargesa’s share of these non-cash impacts was CHF +55.8 million (CHF −6.3 million in 2014) and comprised :
• CHF +48.6 million (CHF −61.0 million in 2014), relating to the marking to market of the derivative instruments implicitly embedded in outstanding exchangeable and convertible bonds, primarily as a result of changes in the stock market prices of the shares underlying the bonds still outstanding at 31 December 2015 ;
• CHF +7.2 million (CHF +54.7 million in 2014), representing the reversal of the cumulative negative value adjustments on the derivatives implicitly embedded in the bonds exchangeable for Suez shares redeemed in 2015 (early conversion or at maturity) and recorded since the corresponding bonds were issued. As a reminder, around 85 % of the bonds were converted early in 2014.
As mentioned since 2013, exchangeable and convertible bonds lead to accounting asymmetry and volatility in reported financial results throughout the bonds’ lifetime.
Other operating income from holding company activities mainly comprises Pargesa’s share of net dividends booked by GBL on its incubator-type investments.
The general expenses and taxes line item represents Pargesa’s general expenses and taxes as well as its share of those of GBL.
Non-operating income : Non-operating income from consolidated or equity-accounted companies comprises Pargesa’s share of the non-operating income of Imerys and Lafarge. In 2015, this item mainly reflects Pargesa’s share of the impairment in goodwill and other assets recorded by Imerys in its Oilfield Solutions division in addition to restructuring costs, together with impairments, restructuring costs and other costs related to the merger with Holcim booked by Lafarge in H1 2015, when this holding was still accounted for using the equity method.
The net amount of non-operating income from holding company activities was CHF 479.8 million, compared with CHF 349.0 million in 2014. 2015 non-operating income mainly consisted of :
• Pargesa’s CHF 243.7 million share of the net impact of the deconsolidation of Lafarge on 10 July;
• Pargesa’s CHF 225.2 million share of the gain from GBL’s sale of 0.5 % of the share capital of Total, including an historical exchange-rate gain of CHF 68.9 million for Pargesa;
• Pargesa’s CHF 14.3 million share of the net gain (including an historical exchange-rate gain of CHF 8.4 million for Pargesa) recorded on the delivery of 5.1 million Suez shares to holders of exchangeable bonds who exercised their exchange rights early or at maturity.
In 2014, non-operating income amounted to CHF 349.0 million and mainly consisted of :
• Pargesa’s CHF 274.7 million share of the gain from GBL’s sale of 0.6 % of the share capital of Total, including an historical exchange-rate gain of CHF 63.2 million for Pargesa;
• Pargesa’s CHF 74.7 million share of the net gain (including an historical exchange-rate gain of CHF 40.5 million for Pargesa) recorded on the delivery of Suez shares to bondholders who exercised their exchange rights early.
Please note : As mentioned on page 12, GBL’s holding in Lafarge, which was previously accounted for using the equity method, was reclassified under “assets held for sale” at 30 June 2015 and then as an “available-for-sale financial asset” as of 10 July 2015, the date on which the Lafarge shares were exchanged for LafargeHolcim shares. This generated a net accounting (i.e. non-cash) gain of EUR 442 million for GBL, with Pargesa’s share amounting to CHF 243.7 million. Following this reclassification, the cost for GBL of its holding in LafargeHolcim now corresponds to the share price in euros on 10 July 2015.
As the holding in LafargeHolcim is classified as an “available-for-sale financial asset”, accounting rules specific to this asset category must be applied from now on, particularly as regards the contribution to income (dividend) and the recognition of impairments, especially in the event of a “significant” or “prolonged” decline in the share price.

Annual Report 2015Pargesa Holding SA
22
Business report
LafargeHolcim’s share price is currently below its accounting cost. GBL did not recognise an impairment on its holding at 31 December 2015, as the corresponding accounting criteria had not been fulfilled at that date. However, the LafargeHolcim share price has continued to fall since the start of 2016 ; at 11 March 2016 it stood at EUR 38.8 per share. If the share price was still at this level at 31 March 2016, under IFRS and the Group’s accounting principles, GBL would have to recognise a non-cash impairment of EUR 1’584 million in its Q1 2016 accounts, with Pargesa’s share amounting to CHF 900 million based on current exchange rates. This recognition would not, however, have any impact on Pargesa’s adjusted net asset value.
5. Adjusted net asset valuePargesa’s flow-through adjusted net asset value was CHF 94.1 per share at 31 December 2015, compared with CHF 104.8 a year earlier. The adjusted net asset value is calculated based on the following principles :• listed shareholdings are valued based on current market prices and exchange rates ;• unlisted investments are valued on the basis of the book value of shareholders’ equity and current exchange rates, or based on their
fair value if this is used by GBL to calculate its adjusted net asset value ;• values per share are shown in relation to one bearer share with a par value of CHF 20, with one tenth of the CHF 2 registered shares
being retained.
Pargesa’s flow-through adjusted net asset value
31.12.13 31.12.14 31.12.15
Share price and currency
Amount in CHF
millions
Weight-ing
as a % of total
Share price and currency
Amount in CHF
millions
Weight-ing
as a % of total
Share price and currency
Amount in CHF
millions
Weight-ing
as a % of total
Imerys EUR 63.2 1'662 19 % EUR 61.0 1'572 18 % EUR 64.4 1’499 19 %
LafargeHolcim EUR 54.5 2'016 23 % EUR 58.1 2’115 24 % EUR 46.7 1’453 18 %Total EUR 44.5 2'343 27 % EUR 42.5 1’835 21 % EUR 41.3 1’338 17 %Pernod Ricard EUR 82.8 1'011 11 % EUR 92.3 1'104 12 % EUR 105.2 1’137 14 %SGS CHF 2'052 1'204 14 % CHF 2'045 1'200 14 % CHF 1’911 1’123 14 %ENGIE (formerly GDF Suez) EUR 17.1 574 6 % EUR 18.3 (1) 602 6 % EUR 16.3 485 6 %Suez (formerly Suez Env.) EUR 11.5 246 3 % EUR 11.5 (1) 35 1 % – –Other holdings 438 5 % – – – –
Incubator 331 4 % 974 12 %Financial pillar 295 3 % 412 6 %
Total portfolio 9'494 108 % 9'090 102 % 8’421 106 %GBL treasury shares 255 3 % 258 3 % 256 3 %Net cash (debt) (929) (11 %) (472) (5 %) (707) (9) %Adjusted net asset value 8'820 100 % 8'876 100 % 7’970 100 %per Pargesa share 71.9 104.2 77.1 104.8 94.1EUR/CHF 1.227 1.203 1.086
(1) At 31 December 2014, the value of the shareholdings in ENGIE and Suez was capped at the conversion prices for the exchangeable bonds (EUR 18.32 and EUR 11.45 respectively), which were lower than the share prices on that date. At 31 December 2015, GBL no longer held any Suez shares
The adjusted net asset value fell 10.2 % in 2015, in line with the nearly 10 % decline in the euro against the Swiss franc during the same period, while GBL’s adjusted net asset value, the company’s only asset and which is denominated in euros, was practically unchanged. Furthermore, the change in the composition of the portfolio compared with the previous year reflects, in particular, the disposal of part of Total’s share capital (0.6 % in 2014 and a further 0.5 % in 2015) and the disposal of the holding in Suez (conversions of exchangeable bonds, both early and at maturity), together with GBL’s expansion since 2012 of the two investment arms mentioned above, which have now been separated into “incubator” investments and the “financial pillar”. The total market capitalisation of the six strategic holdings was CHF 7.03 billion at 31 December 2015, which represents 84 % of the value of the entire portfolio. The largest five holdings – Imerys, LafargeHolcim, Total, Pernod Ricard and SGS – represent 82 %. GBL’s incubator-type investments totalled EUR 974 million at end-2015, which represents 12 % of the portfolio’s value, while the estimated value of the investments made by Sienna Capital came in at EUR 412 million, or 4 % of the portfolio.
The “net cash (debt)” shown in the net asset value at end-2015 is the flow-through amount of the available cash position of Pargesa and GBL and of their debt. The rise in net debt at end-2015 resulted mainly from transactions conducted by GBL during the year.

Pargesa Holding SA Annual Report 2015
23
Business report
6. Proposals at the Annual General Meeting of 3 May 2016
6.1 Appropriation of profit
At the Annual General Meeting, the Board of Directors will propose a 2015 dividend of CHF 2.38 per bearer share and CHF 0.238 per registered share, an increase of 4.8 % on the year-earlier dividend. If approved, a total of CHF 201.5 million will be paid out to shareholders on 10 May 2016.
6.2 Election of Board members, re-election of the Chairman of the Board of Directors and re-election of the members of the Compensation Committee
In accordance with the provisions of the Ordinance against excessive compensation in listed corporations (known as “ORAb”) and the company’s Articles of Association, at the Annual General Meeting shareholders must each year elect the members of the Board of Directors (including the Chairman) and the Compensation Committee individually. As a result, the Board of Directors of Pargesa Holding SA will recommend that the following individuals be re-elected to the Board for a one-year term that will expire at the end of the 2017 Annual General Meeting : Paul Desmarais Jr (also as Chairman of the Board), Bernard Daniel, Amaury de Sèze, Victor Delloye, André Desmarais, Paul Desmarais III, Cedric Frère, Gérald Frère, Ségolène Gallienne, Barbara Kux, Michel Pébereau, Michel Plessis-Bélair, Gilles Samyn and Arnaud Vial.
As mentioned previously, Marc-Henri Chaudet announced that he would not seek another term as Director at the Annual General Meeting on 3 May 2016.
The Board of Directors will recommend that shareholders elect Jean-Luc Herbez as a new member of the Board for a one-year term that will expire at the end of the 2017 Annual General Meeting. Jean-Luc Herbez, a Swiss citizen, obtained a degree in economics (1970) and his law degree (1976) from the University of Geneva, as well as an LLM from the University of Pennsylvania (1981). After professional stays in Frankfurt and Washington D.C., he joined the law firm Froriep in Geneva , where he has been a partner since 1987. He has an extensive experience in the regulatory, finance, audit and litigation aspects of commercial law. He is a member of the Geneva Bar Association and the Swiss Bar Association.
The Board of Directors will recommend that Bernard Daniel, Barbara Kux, Amaury de Sèze, Michel Plessis-Bélair and Gilles Samyn be re-elected to the Board’s Compensation Committee.
6.3 Renewal of authorised capital : amendment to Article 5bis of the Articles of Association – Other items
At the Annual General Meeting, the Board of Directors will recommend that shareholders renew the authorised capital for a period of two years and make the corresponding amendment to Article 5bis para. 1 of the Articles of Association, as follows (changes in bold) :
The Board of Directors is authorised to increase the share capital by a maximum of two hundred and fifty-three million Swiss francs (CHF 253’000’000), at any time until 3 May 2018, by issuing a maximum of 11’500’000 bearer shares with a par value of CHF 20 each and by issuing a maximum of 11’500’000 registered shares with a par value of CHF 2 each. The newly issued shares must be fully paid up. The Board of Directors can carry out the capital increase in one or several tranches.
Finally, in accordance with ORAb and Article 36 of the Articles of Association, the Board of Directors will recommend the total compensation awarded to the Board of Directors and to Management (to be voted on separately).


25
02GROUP PORTFOLIO
Annual Report 2015Pargesa Holding SA
26
Group portfolio GBL
Groupe Bruxelles Lambert (GBL) is a holding company that has been listed on the Brussels Stock Exchange since 1956
GBL owns the Pargesa Group holdings in Imerys, LafargeHolcim, Total, ENGIE, Pernod Ricard and SGS.
In addition to these large strategic holdings, which make up the majority of its portfolio, GBL began to gradually diversify into two areas in 2012 :
• "incubator" investments, made up of a limited selection of smaller listed and unlisted holdings that have the potential to become strategic assets over time. GBL aims to become a core shareholder and, for mid-sized companies, to possibly hold a majority stake ;
• the "financial pillar", comprising major stakes in private equity funds, debt funds and theme-based funds, grouped under Sienna Capital.
2013 2014 2015
Overall data (EUR millions)Shareholders' equity at 31 December 12'665 13'173 13'246Market capitalisation at 31 December 10'767 11'416 12'720Consolidated net income 621 875 1'026Per-share data (EUR)Consolidated net income 4.00 5.64 6.61Dividend 2.72 2.79 2.86Shares issued (in millions) 161.4 161.4 161.4Pargesa’s interest ( %) 50 50 50
In 2015, GBL sold 12.1 million Total shares, representing approximately 0.5 % of Total’s capital, for a total of EUR 556 million. This generated a consolidated capital gain of EUR 282 million. In February 2016, GBL sold a further 26.2 million Total shares, representing around 1 % of the company’s capital, on the market and through an accelerated bookbuilding process for institutional investors. These transactions represented a total amount of EUR 1 billion and generated a capital gain of EUR 405 million, which GBL will recognise in 2016.
In 2015, GBL received additional requests for the early conversion of bonds exchangeable for Suez (formerly Suez Environnement) shares maturing in September 2015. In total, GBL delivered 5.1 million Suez shares in 2015, representing EUR 59 million in bond par value. These conversions generated a net gain of EUR 24 million for GBL’s 2015 consolidated net profit. GBL no longer holds any shares in this company.
As part of the expansion of its “incubator-type” investments, GBL continued to increase its stake in Umicore and held 16.6 % of that company’s capital at 31 December 2015, worth EUR 720 million.
In addition, GBL gradually invested in adidas, a world leader in the design and distribution of sportswear. At 31 December 2015, GBL held 4.7 % of adidas’ capital, worth EUR 890 million. In January 2016, GBL informed adidas that it had passed the statutory threshold of 5 % of its capital.
Finally, in 2015 GBL acquired a stake in the capital of listed Belgian company Ontex, a leading global provider of disposable hygiene products. At 31 December 2015, GBL held 7.6 % of Ontex’ capital, representing a value of EUR 181 million. In March 2016, GBL informed Ontex that it had passed the statutory threshold of 10 % of its capital.

Pargesa Holding SA Annual Report 2015
2727
Group portfolio GBL
In February 2015, Sienna Capital invested EUR 150 million in PrimeStone, a new fund whose strategy consists of making medium- to long-term investments in mid-sized listed companies in Europe. In December 2015, Sienna Capital committed to investing EUR 113 million in BDT Capital Partners II, a private equity fund that currently manages approximately USD 8 billion in commitments. The fund’s aim is to meet the long-term financial needs of family-owned or founder-led businesses.
Group share of consolidated net profit stood at EUR 1’026 million, compared with EUR 875 million in 2014. In 2015, profit was mainly affected by :
- the net impact of the deconsolidation of the holding in Lafarge (EUR 442 million) following the LafargeHolcim merger ;
- GBL’s EUR 100 million share of Lafarge’s loss in H1 2015, when Lafarge was accounted for using the equity method. In 2014, Lafarge’s contribution came in at EUR +30 million ;
- the net capital gain of EUR 282 million on the sale of 0.5 % of Total’s capital (EUR 335 million in 2014) ;
- the net gain of EUR 24 million recorded on the conversion of bonds exchangeable for Suez shares (EUR 141 million in 2014) ;
- the positive impact of EUR 88 million of the derivatives embedded in exchangeable and convertible bonds being marked to market (EUR –96 million in 2014), excluding the reversal of the negative marking to market previously recorded on the conversion of Suez exchangeable bonds.
- a further impairment of EUR 32 million on the holding in ENGIE ;
- a smaller contribution from Imerys of EUR 37 million (EUR 154 million in 2014) and from Sienna Capital of EUR 17 million (EUR 40 million in 2014).
A proposal for a dividend of EUR 2.86 per share, representing an increase of 2.5 % on the year-earlier dividend, will be submitted for approval by GBL shareholders at the Annual General Meeting on 26 April 2016. If the proposal is accepted, the total payout will amount to EUR 461 million.
Annual Report 2015Pargesa Holding SA
2828
Main shareholdings Imerys
Imerys is the world leader in mineral specialties, with over 250 locations in 50 countries
The Imerys group holds leading positions in each of its four main business groups : Energy Solutions & Specialties, Filtration & Performance Additives, Ceramic Materials, and High Resistance Minerals. Imerys processes, enhances and combines a unique range of minerals, in many cases mined from its own deposits, to bring essential features to its customers’ products and production processes. Thanks to their properties, these specialty products have a wide range of applications and are gaining traction in many growth markets.
2013 2014 2015
Overall data (EUR millions)Shareholders' equity at 31 December 2'248 2'444 2'644Market capitalisation at 31 December 4'819 4'623 5'126Net income from current operations 304 316 342Consolidated net income 242 272 68Per-share data (EUR)Net income from current operations 4.03 4.15 4.31Dividend 1.60 1.65 1.75Shares issued (in millions) 76.2 75.9 79.6Pargesa Group's interest ( %) 56.2 56.5 53.9
In a global economic environment that was once again marked by sharp contrasts between regions and sectors, but also by falling oil prices, Imerys again achieved its target of growth in net income from current operations in 2015.
On 26 February 2015, Imerys also completed its acquisition of S&B. A global player and European leader in bentonite, S&B is also the world leader in continuous casting fluxes for steel, and in wollastonite. This acquisition, which was accretive on Imerys’ net income from current operations per share in 2015, should create value from 2018, with total annual synergies estimated at over EUR 25 million, half of which will be achieved in 2016.
Group revenue was up 10.8 % to EUR 4.1 billion, owing to a favourable exchange rate trend, the integration of S&B and the contribution from new products. At constant scope and exchange rates, group revenue was down 4.6 %, due to the persistent weakness of some markets, particularly ceramic proppants in the United States. In this difficult context, revenue from new products increased 8.5 % to EUR 490 million. The price/mix effect remained firm at 1.3 % for the whole group in 2015 (EUR 46 million).
2015 highlights by business group :
• Energy Solutions & Specialties’ revenue totalled EUR 1’253 million in 2015, a 2.0 % decrease on a reported basis, reflecting a sharp downturn in the Oilfield Solutions division. At constant scope and exchange rates and excluding ceramic proppants, sales in this business group were stable;
• Filtration & Performance Additives recorded revenue of EUR 1’081 million in 2015. This included the EUR +351 million impact of changes in scope, mainly relating to the consolidation of S&B over 10 months, and a positive exchange rate impact of EUR +58 million. S&B’s operational integration was completed in Q4, and synergies are being implemented in line with the Group’s expectations. At constant scope and exchange rates, this business group grew at a rate of 2.2 % for the year as a whole;
Pargesa Holding SA Annual Report 2015
2929
Group portfolio Imerys
• Ceramic Materials posted revenue of EUR 1’172 million in 2015. The 1.3 % increase on a reported basis includes a 4.9 % increase relating to exchange rate trends (EUR +57 million) and a 0.6 % increase relating to changes in scope (EUR +8 million), which in particular concerned the acquisitions of BASF’s paper hydrous kaolin operations in the United States and of Matisco’s metal accessories operations at year-end. The 4.2 % like for like decrease in revenue mainly results from slack construction markets in France and the slump in the paper sector;
• High Resistance Minerals, which mainly serves the high tempera-ture (steel, casting, glass, aluminium, etc.) and abrasive product industries, posted revenue of EUR 629 million in 2015, a 1.9 % decrease on a reported basis. At constant scope and exchange rates, the 8 % decrease in revenue mainly results from the down-turn in the refractories market and the refocusing on high value added products.
In this context, the group’s current operating income grew 8.8 % to EUR 538 million, and the operating margin remained firm at 13.2 %, thanks to cost reduction programmes and measures to adjust industrial assets to changes in demand.
Net income from current operations rose 8.0 % to EUR 342 million in 2015 (EUR 316 million in 2014).
Group net income fell to EUR 68 million (EUR 272 million in 2014) as a result of one-off restructuring costs of EUR 64 million relating to the integration of S&B and to the adjustment of industrial assets to market trends, together with a non-cash impairment charge of EUR 209 million on assets in the ceramic proppants business.
Imerys generated substantially higher current free operating cash flow in 2015, at EUR 342 million (EUR 244 million in 2014).
The group’s net financial debt grew EUR 611 million to EUR 1’480 million at 31 December 2015, mainly due to the acquisition of S&B. The group’s debt ratios remained solid, with a debt-to-equity ratio of 55 % and a debt-to-EBITDA multiple of 2.0x.
In 2016, Imerys can draw on its real strengths when faced with a highly uncertain macroeconomic environment. The group will not only benefit from S&B’s full-year contribution, but also from the continued momentum of innovation projects and new developments. In addition, Imerys will continue to take a disciplined approach to cost management and to adjust its industrial assets to market trends.
At the Annual General Meeting on 4 May 2016, the Imerys Board of Directors will propose a dividend of EUR 1.75 per share, a rise of 6.1 % on the year-earlier dividend.
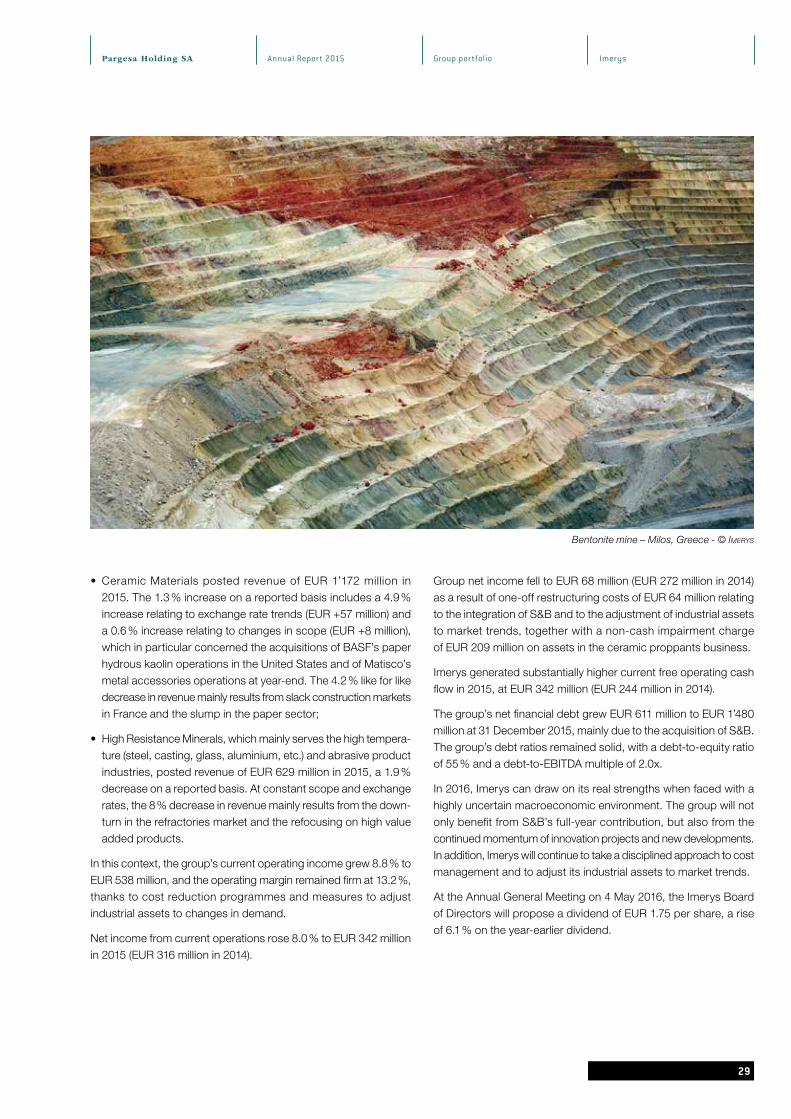
Bentonite mine – Milos, Greece - © Imerys

Annual Report 2015Pargesa Holding SA
3030
Group portfolio LafargeHolcim
LafargeHolcim is the world leader in building materials : cement, aggregates and concrete
LafargeHolcim – the product of the merger between Lafarge and Holcim finalised in July 2015 – is the world leader in building materials. It has a presence across 90 countries and operates in the cement, aggregates and concrete sectors. The group offers a wide range of value added products, innovative services and comprehensive building solutions, serving clients ranging from individual homebuilders up to the largest and most complex projects.
The group is committed to developing sustainable solutions for better building and infrastructure and to contributing to a higher quality of life and is extremely well positioned to meet the challenges of increasing urbanisation.
2014 2015
Overall data (CHF millions) (1)
Shareholders' equity at 31 December n.a. 31'365Market capitalisation at 31 December n.a. 30'528Adjusted EBITDA (2) (3) 6'438 5'751EBITDA(3) 5'986 4'645Per-share data (CHF)Dividend n.a. 1.50Shares issued (in millions) n.a. 606'909Pargesa Group's interest ( %) n.a. 9.4
(1) As the merger took place in July 2015, figures are pro-forma and limited to a few key indicators(2) Adjusted for merger costs, restructuring costs and other one-off costs(3) Pro forma
The year 2015 was marked by a deteriorating economic environment, with highly contrasting results across key regions.
In the Asia Pacific region, the group was hit by the declining real estate market in China, while delays to infrastructure projects and pressure on pricing impacted results in Indonesia. The group performed well in large parts of the Latin American market, but was significantly impacted by the deteriorating economic situation in Brazil. Middle East and Africa showed mixed growth. Some of the region’s markets were impacted by lower demand resulting from falling oil and commodity prices, while other countries, such as Kenya and Algeria, recorded strong performances. In Europe, results were dragged down by slowing construction sectors, but strong growth in some markets, including the United Kingdom and Romania, showed that pockets of growth still remain in this challenging region. LafargeHolcim posted solid results in North America, driven by the continuing recovery in the United States as well as by successful price management and cost optimisation.
On a like for like basis, sales of cement (225 million tonnes) and pro-forma turnover (CHF 29.48 billion) remained stable in 2015, up 0.2 % and 0.1 % respectively. However, EBITDA adjusted to take account of merger costs dropped by close to 5 % to CHF 5.75 billion on the back of rising costs.

Pargesa Holding SA Annual Report 2015
3131
Group portfolio LafargeHolcim
In a challenging global context, the group achieved its 2015 objec-tives in terms of synergies, and capex and net debt reduction. Synergies relating to the merger were achieved more quickly than expected, with CHF 130 million in operational synergies in H2, compared with a targeted CHF 100 million.
Capex in H2 was in line with the target of less than CHF 1.4 billion, representing a CHF 200 million reduction on the previous target of CHF 1.6 billion, achieved thanks to more effective capex management.
As a result, net debt was reduced to CHF 17.3 billion, below the CHF 17.5 billion target, supported in particular by capex control, solid operating cash flows and a focus on working capital.
The group also announced that it had made major progress in its portfolio review, with a CHF 3.5 billion programme of divestments underway and deals confirmed in South Korea and Saudi Arabia. In Morocco, an agreement was signed with partner SNI with a view to merging Lafarge Ciments Maroc and Holcim Maroc to create LafargeHolcim Maroc.
However, against the backdrop of the synergy action plans, the portfolio review and the progress made on purchase price allocation, the group recorded a one-off non-cash charge of CHF 3.0 billion related to asset impairments and other charges in Q4 2015. These charges were mainly due to changing market conditions in Brazil, Russia, Iraq and China, as well as assets that were closed or mothballed as a result of the post-merger portfolio review. This led to a net loss of CHF 2.9 billion being recorded in Q4 2015.
A dividend of CHF 1.50 per share will be submitted to shareholders for approval at the Annual Meeting on 12 May 2016.
Route des Tamarins – Island of La Réunion © Lafarge Photo LIbrary
Annual Report 2015Pargesa Holding SA
3232
Group portfolio Total
Total is a global integrated oil and gas group, with a presence in the chemical industry
Total was founded in 1920 and is one of the leading international oil and gas groups, standing at the forefront of innovation in its fields. The group’s operations are based in more than 130 countries and cover the entire oil industry chain, from Upstream – exploration, development and production of oil, natural gas and LNG – to Downstream – refining, distribution, transport and international trading of crude oil and refined products. Total is also a major player in chemicals and is committed to the development of renewable energy sources.
2013 2014 2015
Overall data (millions)Shareholders' equity at 31 December (USD) 100'241 90'330 92'494Market capitalisation at 31 December (EUR) 105'878 101'374 100'689Net adjusted income (USD) 14'292 12'837 10'518Consolidated net income (USD) 11'228 4'244 5'087Per-share dataNet adjusted income (USD) 6.29 5.63 4.51Dividend (EUR) 2.38 2.44 2.44Shares issued (in millions) 2'378 2'385 2'440Pargesa Group's interest ( %) 3.6 3.0 2.4
Total’s integrated business model leverages synergies among its various operations throughout the world. The group’s activities are divided into three segments, which were reorganised in 2012.
In the Upstream segment, the group has oil and natural gas exploration and production operations in more than 50 countries. The recent sharp drop in the price of crude oil was caused by a combination of the following three factors : (i) OPEC countries ramped up production substantially ; (ii) the supply of US shale gas resisted better than expected ; and (iii) demand did not recover enough to prevent over-capacity. The drop in crude oil prices led the segment to review its objectives in order to develop a more resilient, profitable and sustainable model for hydrocarbon production.
In the Refining & Chemicals segment, Total is one of the main global players in refining and petrochemicals, two highly complementary activities that the group develops in synergy. This segment also includes the Trading division, which buys and sells crude oil and oil products, and the Shipping division, which handles the transportation of oil and oil products. In order to meet the demands of changing markets in both western and emerging countries, the group is modernising and developing its industrial facilities in an on-going drive to improve safety and energy efficiency. The 20 % capacity reduction in European refining will be completed in 2016, a year ahead of the schedule announced in 2012. In 2015, the segment delivered record results, driven by its strict cost management policy in an environment that was favourable for refining, petrochemicals and distribution margins.
The Marketing & Services segment is the group’s sales and marketing arm. It provides associated services through service stations, and trades fuel and other products. In 2014, the segment’s products were available in more than 150 countries, in a network of more than 15’500 service stations serving around 4 million customers daily, with a leading presence in Africa, a network of 9’297 service stations in Europe and a presence in the Asia Pacific region and the Americas.
The group is also preparing the future of energy by supporting the development of new, complementary energy sources (i.e. solar, biomass, and CO2 capture and storage).

Pargesa Holding SA Annual Report 2015
3333
Group portfolio Total
Results in the Upstream segment were affected by the change in the average Brent price, despite a record 9.4 % rise in production. The Brent price dropped sharply throughout the year, going from USD 57 per barrel at end-2014 to less than USD 37 per barrel at end-2015. In the Downstream segment, however, the ERMI indicator of refining margins in Europe came in at USD 48.5 per tonne in 2015, versus USD 18.7 per tonne a year earlier, a rise of 159 %.
Adjusted net operating income from the business segments was USD 11.3 billion, a 20 % decrease compared with 2014. The decline is a result of the lower contribution from the Upstream segment even though the group ramped up production growth (2’347 kboe/d in 2015 compared with 2’146 kboe/d in 2014).
The average tax rate for the segments was 33.9 %, compared with 51.2 % in 2014.
Adjusted net income stood at USD 10.5 billion as against USD 12.8 billion in 2014, a decline of 18 %. Group share of net income after non-recurring items (i.e. asset impairment, provisions and taxes) amounted to USD 5.1 billion, compared with USD 4.2 billion in 2014, a rise of 20 %.
Net investments in 2015(1) came in at USD 20 billion, a 17 % decline on 2014. Group net organic cash flow was USD –4 billion, compared with USD –2 billion in 2014. The net-debt-to-equity ratio stood at 28 % at the end of 2015, as against 31 % at 31 December 2014.
At the Annual General Meeting in May 2016, a 2015 dividend of EUR 2.44, the same amount as a year earlier, will be put to share-holders for approval.
(1) Net investments = investments including acquisitions – asset sales – other transactions with non-controlling interests
Gas carrier - Ras Laffan Industrial City (RLIC) - Qatar - © gonzaLez thIerry - totaL

Annual Report 2015Pargesa Holding SA
3434
Group portfolio ENGIE
ENGIE is a world renowned energy group in electricity, gas and services
Formed through the merger of Suez and Gaz de France in 2008, ENGIE is present throughout the entire energy value chain, in electricity, natural gas – both upstream and downstream – and services. Its acquisition of International Power in 2011 consolidated its first-rate position in the European and global energy industry.
2013 2014( 1) 2015
Overall data (EUR millions)Shareholders' equity at 31 December 47'971 49'548 43'078Market capitalisation at 31 December 41'247 47'318 39'756Net recurring income 3'449 2'725 2'588Net income (9'646) 2'437 (4'617)Per-share data (EUR)Net income (3.91) 1.00 (1.99)Dividend 1.50 1.00 1.00Shares issued (in millions) 2'413 2'435 2'435Pargesa Group's interest (%) 2.4 2.4 2.3
(1) 2014 results are adjusted for the costs relating to the Belgian nuclear contribution and restated on account of the
retrospective application of the IFRIC 21 interpretation
ENGIE’s activities cover the purchase, generation and sale of natural gas and electricity, as well as the transportation, storage, distribution, development and operation of major natural gas infrastructures.
In 2015, ENGIE was composed of five divisions :
• Energy International : Energy International is one of the world’s leading independent power producers, with 74.9 GW capacity in operation and a significant portfolio of projects under development. Energy International also has interests in closely related businesses such as LNG terminals, natural gas distribution and retail sales.
• Energy Europe : The Energy Europe business line manages ENGIE’s activities in continental Europe in the following areas : electricity generation, energy management (delivery, trading and portfolio management) and marketing and sales for natural gas and electricity.
• Global Gas & LNG : the Global Gas & LNG business line pools the upstream activities of the natural gas value chain. Natural gas and oil exploration and extraction, natural gas liquefaction and transportation in the form of liquefied natural gas all position the group as a world player.
• Infrastructures : The Infrastructures business line manages the biggest networks and capacities in Europe. Its operations concern LNG terminals, storage sites, and transportation and distribution networks.
• Energy Services : via its Energy Services business line, ENGIE offers efficient and sustainable energy and environmental solutions to its customers, local authorities and companies within the industrial and tertiary sectors. It provides them with multi-technical services, from engineering to installation and operation.
A new, simplified organisational structure was put in place as of 1 January 2016. The group now has 24 business units and five business lines.
In 2015, at average weather conditions, ENGIE reached its financial and operational targets.
Revenues fell by 6.4 % on a reported basis to EUR 69.9 billion (down by 8.8 % on an organic basis). This decrease was mainly attributable to lower commodity prices, a decline in LNG activities, and outages and shutdowns at certain Belgian nuclear power plants.

Pargesa Holding SA Annual Report 2015
3535
Group portfolio ENGIE
EBITDA stood at EUR 11.3 billion, down 7.2 % on a reported basis (organic decline of 9.1 %). It was affected by the same factors as revenues, together with the positive impact of exchange rate trends, favourable weather conditions in France, the commissioning of new assets and continued cost control efforts.
Net recurring income was EUR 2.6 billion, a decline of EUR 0.1 billion on the year-earlier period. After impairments of EUR 6.8 billion, the group reported a net loss of EUR 4.6 billion.
Net debt stood at EUR 27.7 billion at 31 December 2015, up EUR 0.2 billion on the year-earlier figure, mainly owing to the EUR +0.5 billion impact of changes in exchange rates related to the depreciation of the euro against major currencies. Cash flow from operations was up EUR 1.9 billion to EUR 9.8 billion.
A proposal for a dividend of EUR 1.00 per share will be submitted for approval by ENGIE shareholders at the Annual General Meeting on 3 May 2016; the remaining dividend for fiscal year 2015 (EUR 0.50) will be paid on 9 May 2016. ENGIE has committed to paying a cash dividend of EUR 1.00 per share for 2016 and EUR 0.70 per share per year for 2017 and 2018, while at the same time maintaining its A rating (target net-debt-to-EBITDA multiple of below 2.5x).
Curbans solar power plant - © engIe / moIrenc camILLe
Annual Report 2015Pargesa Holding SA
3636
Group portfolio Pernod Ricard
The world’s co-leader in wines and spirits, Pernod Ricard holds a top position on every continent
Since it was created in 1975, Pernod Ricard has achieved significant organic growth and made numerous acquisitions – most notably Seagram in 2001, Allied Domecq in 2005 and Vin&Sprit in 2008 – and has become the world’s co-leader in the wines and spirits market.
With a strong presence on every continent and a sound position in the emerging markets of Asia, Eastern Europe and South America, the group produces and distributes a range of 14 strategic brands of spirits and champagne and five “Priority Premium Wines” brands, as well as 18 local brands that are leaders in their markets, and a large number of regional brands.
In spirits, the group’s main brands are : Absolut, Ballantine’s, Beefeater, Chivas Regal, Havana Club, Jameson, Kahlúa, Malibu, Martell, Ricard, Royal Salute and The Glenlivet ; in champagnes : Mumm and Perrier Jouët ; and in “Priority Premium Wines” : Brancott Estate, Campo Viejo, Graffigna, Kenwood and Jacob’s Creek.
30 June 2013 30 June 2014 30 June 2015
Overall data (EUR millions)Shareholders' equity 11'014 11'621 13'121Market capitalisation (1) 22'611 23'277 27'498Net profit from recurring operations 1'228 1'185 1'329Net consolidated income 1'172 1'016 861Per-share data (EUR)Diluted net current income 4.61 4.46 4.99Dividend 1.64 1.64 1.80Shares issued (in millions) 265.4 265.4 265.4Pargesa Group's interest ( %) (1) 7.5 7.5 7.5
(1) at year-end
For the 2014-2015 financial year ending on 30 June 2015, Pernod Ricard delivered solid results in a still-difficult macro environment. Net sales came in at EUR 8’558 million, a rise of 2 % in organic terms and 8 % on a reported basis, taking into account the favourable impact of exchange rates.
Sales of the Top 14 were up 2 % on an organic basis, due to growth in volumes (price/mix effect was stable). Sales of key local brands were up 5 % on an organic basis, spurred by sales of Indian whiskies in particular.
Profit from recurring operations was up 2 % in organic terms, to EUR 2’238 million. Strict control of advertising expenses (cost-to-sales ratio was stable) and a reduction in structure costs offset the decline in the gross margin (–90bps to 61.9 %). Taking into account the positive impact of exchange rate trends, the rise in profit from recurring operations was 9 %. As a result, the operating margin was 26.2 %, a record high.
Group share of net profit from recurring operations was up 12 % to EUR 1’329 million, pushed up by the drop in the average cost of debt and in the average tax rate. Group net profit, however, fell 15 % to EUR 861 million due to a write-down on the Absolut brand, which was hit hard by a difficult market.
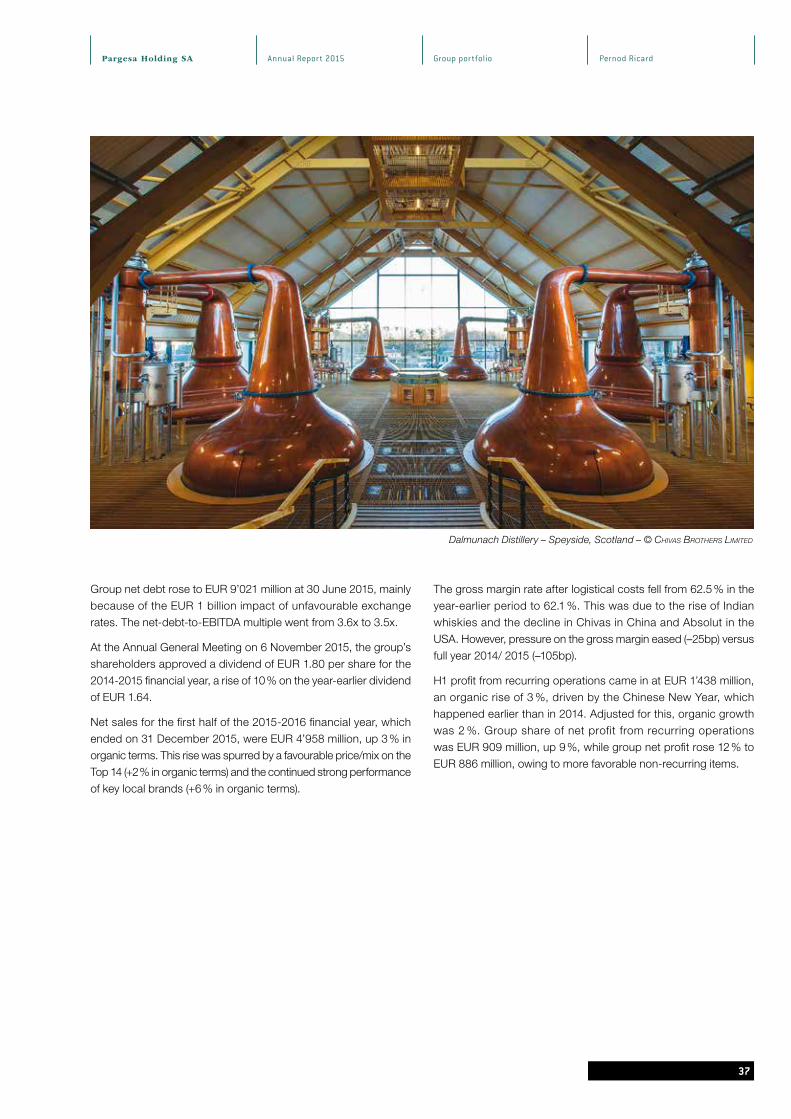
Pargesa Holding SA Annual Report 2015
3737
Group portfolio Pernod Ricard
Group net debt rose to EUR 9’021 million at 30 June 2015, mainly because of the EUR 1 billion impact of unfavourable exchange rates. The net-debt-to-EBITDA multiple went from 3.6x to 3.5x.
At the Annual General Meeting on 6 November 2015, the group’s shareholders approved a dividend of EUR 1.80 per share for the 2014-2015 financial year, a rise of 10 % on the year-earlier dividend of EUR 1.64.
Net sales for the first half of the 2015-2016 financial year, which ended on 31 December 2015, were EUR 4’958 million, up 3 % in organic terms. This rise was spurred by a favourable price/mix on the Top 14 (+2 % in organic terms) and the continued strong performance of key local brands (+6 % in organic terms).
The gross margin rate after logistical costs fell from 62.5 % in the year-earlier period to 62.1 %. This was due to the rise of Indian whiskies and the decline in Chivas in China and Absolut in the USA. However, pressure on the gross margin eased (–25bp) versus full year 2014/ 2015 (–105bp).
H1 profit from recurring operations came in at EUR 1’438 million, an organic rise of 3 %, driven by the Chinese New Year, which happened earlier than in 2014. Adjusted for this, organic growth was 2 %. Group share of net profit from recurring operations was EUR 909 million, up 9 %, while group net profit rose 12 % to EUR 886 million, owing to more favorable non-recurring items.
Dalmunach Distillery – Speyside, Scotland – © chIvas brothers LImIted
Annual Report 2015Pargesa Holding SA
3838
Group portfolio SGS
SGS is the world leader in inspection, verification, testing and certification
SGS was founded in 1878 and listed in 1981. The company provides innovative solutions for inspection, verification, testing and certification to help clients streamline their businesses and make them swifter and more efficient. SGS’s global network comprises more than 1’800 offices and laboratories staffed by 85’000 employees in over 150 countries. At 31 December 2015, the company’s organisational structure consisted of ten business lines and ten geographical regions. The ten business lines are : Agricultural Services, Minerals Services, Oil, Gas & Chemicals Services, Life Science Services, Consumer Testing Services, Systems & Services Certification, Industrial Services, Environmental Services, Automotive Services, and Governments & Institutions Services.
2013 2014 2015
Overall data (CHF millions)Shareholders' equity at 31 December 2'143 2'327 1'906Market capitalisation at 31 December 16'052 15'997 14'949Consolidated net income 600 629 549Per-share data (CHF)Diluted earnings per share 77.84 81.65 71.95Dividend 65 68 68Shares issued (in millions) 7'822 7'822 7'822Pargesa Group's interest ( %) 15.0 15.0 15.0
SGS has four types of activity :
• Inspection : Offers clients a comprehensive range of inspection services across the globe, including verifying the integrity and weight of goods exchanged during transshipment. SGS helps clients verify the quality and quantity of goods and comply with all regulatory requirements in the various markets and regions ;
• Testing : Offers clients a global network of product-testing facilities staffed by qualified, experienced personnel. This service enables clients to reduce risk, shorten time to market and demonstrate the quality, safety and effectiveness of their products with regard to applicable health, safety and other regulations ;
• Certification : Enables clients to demonstrate that their products, processes, systems and services are compliant with national and international regulations and standards or consumer norms, via certification ;
• Verification : Enables clients to verify compliance of products and services with international standards and local regulations. Underpinned by a powerful combination of global coverage and local knowledge across industries, SGS covers the entire value chain, from raw materials to end-users.
The SGS group turned in resilient results in 2015. It delivered revenue growth of 3.6 % over the prior year (constant currency basis) to CHF 5.7 billion, corresponding to organic growth of 2.0 %, with an additional 1.6 % contributed by recently acquired companies. However, due to the continued appreciation of the Swiss franc against most currencies in which SGS operates around the world, group revenue for the year was down 2.9 % on a reported basis.

Pargesa Holding SA Annual Report 2015
3939
Group portfolio SGS
Organic revenue growth was resilient during the year, with solid performances by Governments & Institutions Services, Automotive Services, Systems & Services Certif ication, Life Science Services, Environmental Services, Consumer Testing Services, and Agricultural Services. The slowdown in the oil and mining industries weighed on Oil, Gas & Chemicals Services, Industrial Services, and Minerals Services. Organic growth was achieved across all regions, despite difficult market conditions.
In 2015, the group pressed ahead with its external growth strategy. Ten companies were acquired – including seven outside Europe – in Consumer Testing Services, Industrial Services, Automotive Services, Environmental Services, and Life Science Services.
SGS’s adjusted EBITDA was down 2.9 % year on year to CHF 1’191 million, and adjusted operating income stood at CHF 917 million, resulting in a stable margin of 16.1 %.
Group share of consolidated net income after restructuring costs was CHF 549 million, down 12.7 %.
Operating cash flow remained very robust, at CHF 1’062 million, driven by solid management of working capital needs.
The group paid a total amount of CHF 104 million for acquisitions completed during the year.
After the payment of CHF 522 million in dividends, and share buybacks of CHF 147 million, the group’s net debt amounted to CHF 482 million at end-2015, as against CHF 340 million at end-2014.
At the Annual General Meeting on 14 March 2016, shareholders approved a 2015 dividend of CHF 68 per share (the same amount as a year earlier).
SGS Automotive Services - © sgs sa

Annual Report 2015Pargesa Holding SA
4040
Group portfolio Other GBL assets
INCUBATOR FINANCIAL PILLAR
In addition to the large strategic holdings that make up the majority of its portfolio, GBL began to gradually diversify into two areas in 2012 :
• “incubator” investments of a smaller size in companies that may or may not be listed and have the potential to become strategic assets over time ; these types of investments may eventually comprise 10-15 % of GBL’s adjusted net asset value ;
• significant stakes in investment or private equity funds, grouped within a “financial pillar” ; these investments may eventually comprise up to 10 % of GBL’s adjusted net asset value.
Incubator
Umicore
Umicore was GBL’s first investment in its “incubator” portfolio. At 31 December 2015, GBL held 16.6 % of Umicore’s capital and was the company’s largest shareholder. The market value of GBL’s stake stood at EUR 720 million on that date.
Umicore is a global group specialised in materials technology and recycling. The group focuses on areas where its expertise in materials science, chemistry and metallurgy stands out. Umicore has three business groups : Catalysis, Energy & Surface Technologies, and Recycling.
Umicore’s 2015 revenues (excluding metals) were EUR 2’629 million, significantly higher than the EUR 2’367 million recorded in 2014 (+11 %). Strong growth in Catalysis and Energy & Surface Technologies more than offset the impact of falling metal prices on the group’s recycling activities. Recycling was impacted by lower prices for metals and by softer demand on a number of end-markets. Revenue growth, which was driven in part by the ramp-up of recent growth investments, was the main factor behind the 20 % rise in recurring EBIT in 2015 (EUR 330 million, versus EUR 274 million in 2014). The recurring EBIT margin was 12.0 %, versus 10.4 % in 2014. Group share of recurring net profit was EUR 246 million, compared with EUR 193 million in 2014. Group share of net profit was EUR 169 million, compared with EUR 171 million in 2014. The balance sheet remained sound with net financial debt of EUR 321 million, or 0.6x recurring EBITDA (versus EUR 298 million and 0.5x respectively at the end of 2014).
The Board of Directors will propose a total annual dividend of EUR 1.20 per share, of which EUR 0.50 was paid out as an interim dividend in September 2015.
2013 2014 2015
Overall data (EUR millions)Shareholders’ equity at 31 December 1'677 1'705 1'732Market capitalisation at 31 December 4'075 3'730 4'331Consolidated net profit 179 171 169Per-share data (EUR)Net profit (diluted) 1.60 1.57 1.55Dividend 1.00 1.00 1.20Shares issued (in millions) 120 112 112Pargesa Group’s interest (%) 5.6 12.4 16.6

Pargesa Holding SA Annual Report 2015Pargesa Holding SA
4141
Group portfolio Other GBL assets
adidas
At 31 December 2015, GBL held 4.7 % of adidas’ capital, for a market value of EUR 890 million.
Adidas is a global group specialised in the design, development, production and distribution of sportswear. The group offers a wide range of products related to sport (footwear, clothing and equipment) and fashion in general, and its business is built around key brands : adidas, Reebok, TaylorMade and CCM Hockey.
Group revenues grew 16.4 % to EUR 16.9 billion in 2015, up from EUR 14.5 billion in 2014. On a constant currency basis, revenues were up 10 %, with adidas and Reebok sales rising by 12 % and 6 % respectively, and TaylorMade sales declining by 13 %. adidas and Reebok brand sales grew in all regions, on a constant currency basis, except Russia/CIS (–11 %). Excluding goodwill impairment, operating profit grew 14 % to EUR 1’094 million in 2015 from EUR 961 million in 2014, corresponding to an operating margin of 6.5 % (6.6 % in 2014). The slight decline in the operating margin was due in large part to a significant increase in brand-building investments.
Net income from continuing operations (before goodwill impairment) was up 12 % to EUR 720 million (EUR 642 million in 2014). Net income attributable to group shareholders (before goodwill impairment) was up 18 % to EUR 668 million (EUR 568 million in 2014). After goodwill impairment, net income attributable to group shareholders grew to EUR 634 million in 2015 from EUR 490 million in 2014.
Net borrowings at 31 December 2015 amounted to EUR 460 million, compared to EUR 185 million in 2014 ; the increase is due mainly to the use of cash for the share buyback programme (EUR 301 million).
At the Annual General Meeting, a proposed 2015 dividend of EUR 1.60 per share will be put to shareholders, compared with EUR 1.50 for the year-earlier period.
2013 2014 2015
Overall data (EUR millions)Shareholders’ equity at 31 December 5'489 5'624 5'666Market capitalisation at 31 December 19'382 12'055 18'811Adjusted net income 825 642 720Net income 787 490 634Per-share data (EUR)Adjusted net income (diluted) 3.68 2.67 3.37Dividend 1.50 1.50 1.60Shares issued (in thousands) 209.2 209.2 209.2Pargesa Group’s interest (%) 0.0 0.0 4.7

Annual Report 2015Pargesa Holding SA
42
Group portfolio Other GBL assets
Ontex
In 2015 GBL acquired a stake in the capital of listed Belgian company Ontex, a leading provider of disposable hygiene products. GBL held 7.6 % of Ontex’ capital, worth EUR 181 million, at 31 December 2015.
Ontex specialises in disposable hygiene products for babies, women and adults. Ontex products are distributed in more than 100 countries under the company’s own brands and distributors’ private labels. The group employs over 5’500 people and has operations in 23 countries.
2015 revenues were EUR 1.69 billion, a 4.5 % increase on the 2014 figure of EUR 1.62 billion. Organic revenue growth was 4.8 %. Most of the group’s key markets grew more slowly in 2015 than the previous year, while competition was stronger, particularly in Western Europe. But the group benefited from its increasing geographic reach, capturing more sales mainly in developing markets. On a like for like basis, sales of babycare products (53 % of the total), femcare products (12 %) and adult incontinence products (33 %) increased by +5.9 %, +0.9 % and +4.8 % respectively.
The gross margin rose from 27.6 % in 2014 to 28.2 % in 2015 ; the main positive drivers were the impact of top-line growth and solid efficiency gains, which more than offset the impact of adverse currency movements on the translation of raw-material costs into euros. Adjusted EBITDA was EUR 209.1 million in 2015, a 6.6 % increase on 2014 (EUR 196.1 million), largely for the same reasons. After non-recurring expenses of EUR 6.8 million (EUR 56.3 million in 2014), net profit for 2015 was EUR 98.6 million (EUR 8.6 million in 2014).
Adjusted free cash flow was EUR 127.8 million in 2015, versus EUR 105.5 million in 2014. Net debt at 31 December 2015 amounted to EUR 405.5 million (EUR 585.1 million in 2014), for a net-debt-to-adjusted-EBITDA ratio of 1.94x.
The Board of Directors will propose a 2015 dividend of EUR 0.46 per share at the next Annual General Meeting of Shareholders, compared with EUR 0.19 for the year-earlier period.
2014 2015
Overall data (EUR millions)Shareholders’ equity at 31 December 671 852Market capitalisation at 31 December 1'614 2'363Adjusted net profit 65 103Consolidated net profit 9 99Per-share data (EUR)Adjusted net profit 0.95 1.50Dividend 0.19 0.46Shares issued (in millions) 68.1 72.1Pargesa Group’s interest ( %) 0.0 7.6

Pargesa Holding SA Annual Report 2015
43
Group portfolio Other GBL assets
Sienna Capital (“financial pillar”)GBL intends to continue diversifying its portfolio and achieve its value creation objectives through alternative investments made via its subsidiary Sienna Capital.
Sienna Capital aims to generate attractive, risk-adjusted returns by constructing a diversified portfolio of investment managers performing well in their area of expertise (equity funds, debt funds and theme-based funds).
Sienna Capital is an active partner, working closely with the investment managers through which it invests. It provides support to managers, helping them to raise money, attract talent and identify investment opportunities. It also offers guidance on matters of good governance and best practice.
At the end of 2015, Sienna Capital’s portfolio comprised six managers investing in over 60 companies through 11 funds. The portfolio includes investments in private equity funds (Ergon, Sagard and BDT), a debt fund (Kartesia), a fund specialised in the healthcare sector (Mérieux Développement) and a fund whose strategy consists of acquiring long-term shareholdings in mid-sized European companies (PrimeStone).
Strategy
Sienna Capital offers a differentiated approach, providing fund managers with long-term capital in exchange for attractive financial terms. It is an active partner that aims to create value. Sienna Capital supports new funds but also looks to make direct investments with existing external managers. Sienna Capital generates revenue through capital gains, interest income, dividends and fees earned through revenue-sharing agreements with its underlying managers.
Sienna Capital – key figures since its creation (in EUR millions)
Ergon Sagard Kartesia
Mérieux
Développement PrimeStone
BDT Capital
Partners Total
Initial commitment 563 381 150 75 150 113 1'432
Called up capital 421 285 115 19 150 18 1'008
Residual commitment 141 96 36 56 – 95 424
Distributions 264 184 3 – – – 451
Value of holding
(Sienna Capital portfolio) 260 154 116 19 154 18 721
2015 performance
In 2015, Sienna Capital partnered with two new managers : PrimeStone, for an investment of EUR 150 million, and BDT Capital Partners, for a commitment of EUR 113 million. PrimeStone’s strategy consists of acquiring long-term shareholdings in mid-sized European companies. BDT provides family-owned and founder-led businesses with long-term capital.
In 2015 Sienna Capital invested EUR 363 million, which includes the funding of the acquisition of Golden Goose by Ergon Capital Partners III (“ECP III”), the acquisition of Délices des 7 Vallées, Safic-Alcan and Alvest by Sagard III, the acquisition of Ninox Medical and Origene Technologies by Mérieux Participations II as well as the new investments completed by PrimeStone, BDT and Kartesia.
Sienna Capital received EUR 140 million in proceeds, primarily from the sale of Joris Ide by Ergon Capital Partners II (“ECP II”), Cérélia by Sagard II and Santiane by Sagard III. In 2015, Sienna Capital’s contribution to GBL’s net dividends amounted to EUR 16 million.
Key figures of Sienna Capital in 2015 (in EUR millions)
Ergon Sagard Kartesia
Mérieux
Développement PrimeStone
BDT Capital
Partners Total
New commitments – – – – 150 113 263
Called up capital 43 85 62 5 150 18 363
Distributions 100 37 3 – – – 140
Contribution to GBL’s net dividends 16
Annual Report 2015Pargesa Holding SA
44
Group portfolio Other GBL assets
Ergon Capital Partners (“ECP”)
Profile
Ergon Capital Partners (ECP) was created in 2005 as a private equity fund operating in the mid-market segment. It invests between EUR 20 million and EUR 70 million in companies operating in niche markets in the Benelux, Italy, Spain, France, Germany and Switzerland, with positions that are dominant and sustainable over the long term and in industries with the potential for consolidation.
Sienna Capital & Ergon
ECP I was founded in 2005 with shareholders consisting of GBL and Parcom Capital, a subsidiary of ING. This first fund had EUR 150 million in commitments. In 2007, these same shareholders backed a second fund, ECP II, in the amount of EUR 275 million. In 2010, GBL supported a third fund of EUR 350 million, ECP III.
2015 financial year
During the year, ECP II finalised the sale of its investment in Joris Ide. In addition, ECP III acquired Golden Goose (Italy).
Sagard
Profile
Created in 2002 on the initiative of Power Corporation of Canada, Sagard invests in companies valued at more than EUR 100 million that are leaders in their markets, primarily in French-speaking European countries. Working with management teams, it supports them in their growth.
Sienna Capital & Sagard
GBL committed EUR 50 million to the first Sagard fund (Sagard I). GBL then committed EUR 150 million to the second fund, Sagard II, in 2006, this commitment being reduced to EUR 113 million in 2014. In 2013, Sienna Capital committed EUR 200 million to the launch of Sagard III.
2015 financial year
In 2015, Sagard II finalised the sale of its stake in Cérélia. In addition, Sagard III sold its stake in Santiane and acquired three companies : Délices des 7 Vallées, Safic-Alcan and Alvest.
Kartesia
Profile
Kartesia offers liquidity and credit solutions to mid-sized European companies, while providing a higher stable return to its investors. More generally, Kartesia aims to facilitate the participation of institutional and high net worth investors in the European LBO debt market by offering them exposure to highly rated, resilient and diversified credit through primary, secondary or rescue financing operations carried out with selected mid-sized companies.

Pargesa Holding SA Annual Report 2015
45
Group portfolio Other GBL assets
Sienna Capital & Kartesia
The final closing of the Kartesia fund took place in March 2015 at EUR 507.5 million, of which EUR 150 million came from Sienna Capital.
2015 financial year
At 31 December 2015, the fund had drawn down EUR 386 million, or 76 % of the total committed capital since inception.
In 2015, Kartesia distributed EUR 5 million to its investors along with a subscription premium of EUR 9 million.
Mérieux Développement
Profile
Mérieux Développement was created in 2009 and is an investment manager specialised in growth and venture capital investments in the healthcare sector. It works alongside entrepreneurs and companies whose products and services can bring genuine advances to the health of patients and consumers worldwide, offering them access to its industry expertise and global network. Mérieux Développement is a subsidiary of Institut Mérieux.
Sienna Capital & Mérieux Développement
In 2014, Sienna Capital committed to invest EUR 75 million in the two funds managed by Mérieux Développement : Mérieux Participations I and Mérieux Participations II.
2015 financial year
In 2015, Mérieux Participations I made additional investments in existing portfolio companies. Mérieux Participations II invested in two new companies : Ninox Medical and Origene Technologies. In addition, the Mérieux Développement team expanded, with new offices opening in California and London.
PrimeStone
Profile
PrimeStone was founded in 2014 by three former partners from The Carlyle Group. These buyout specialists had worked and invested together across Europe for more than 15 years. PrimeStone’s strategy is based on constructive and active management in mid-sized listed European companies that offer significant value creation potential through strategic, operational or financial improvements. PrimeStone creates value by taking a long-term perspective, adopting an active approach and exercising significant influence over its portfolio investments through a constructive dialogue with boards of directors and management teams.
Sienna Capital & PrimeStone
As part of a long-term agreement, Sienna Capital invested EUR 150 million in February 2015.
2015 financial year
In 2015, PrimeStone made four new investments.

Annual Report 2015Pargesa Holding SA
4646
Group portfolio Other GBL assets
BDT Capital Partners
Profile
BDT Capital Partners was created in 2009 by Byron Trott, a longstanding partner of Goldman Sachs, with the aim of meeting the strategic and financial needs of family-owned and/or founder-led businesses around the globe. BDT Capital Partners successfully raised USD 3 billion over two rounds of fund-raising in 2010 and 2012 and then created a second fund in 2014, BDT Capital Partners Fund II (“BDTCP II”), worth USD 5.2 billion. In 2015, BDTCP II was reopened to new investors in order to raise USD 1 billion in additional capital.
Sienna Capital & BDT Capital Partners
In 2015, Sienna Capital committed EUR 113 million to the additional fund-raising for BDTCP II.
2015 financial year
In 2015, BDTCP II completed three investments for a total of USD 1.35 billion.

Pargesa Holding SA Annual Report 2015
47
03CORPORATE
GOVERNANCE

Annual Report 2015Pargesa Holding SA
48
Corporate Governance
1. Group structure and shareholders
1.1 For the purposes of this Corporate Governance report, Pargesa Group companies include the Swiss parent company Pargesa Holding SA, and its subsidiaries and consolidated shareholdings.
Listed companies within the scope of consolidation :
Name and registered officePlace of listing
Market capitalisation at 31.12.2015 % of capital
% of voting rights ISIN
Pargesa Holding SA Grand-Rue 11 CH – 1204 Geneva
SIX Swiss Exchange Zurich CHF 5.4 billion
parent company CH0021783391
Groupe Bruxelles Lambert (GBL) Avenue Marnix 24 B – 1000 Brussels
Euronext Brussels EUR 12.7 billion 50.0 52.0(1) BE0003797140
Imerys Rue de l’Université 154 / 156 F – 75007 Paris
Euronext Paris EUR 5.1 billion 53.9(2) 69.8(2) FR0000120859
(1) taking into account the suspended voting rights relating to treasury shares
(2) owned through GBL
Unlisted companies controlled by the parent company :
Name and registered office Share capital % of capital
Pargesa Netherlands BV ; Herengracht 483 ; NL – 1017 BT Amsterdam CHF 109 million 100
1.2 Significant shareholders
Significant shareholders at 31 December 2015
% of
capital (1)
% of voting rights attributed to
shares (2)
% of voting rights conferred
on exchange rights (3)
Frère / Desmarais Group 55.5 75.4 –
BNP Paribas Group (F) 6.1 3.3 (2.6)
First Eagle Investment Management LLC (USA) 9.0 4.9 –
(1) capital percentages are calculated based on the total number of issued shares (bearer equivalent) making up the capital, less treasury shares, i.e. a denominator of 84’659’190 at 31 December 2015
(2) percentages of voting rights are calculated based on the total number of voting rights attached to the shares issued, i.e. a denominator of 154’429’400 at 31 December 2015
(3) these exchange rights relate primarily to bonds issued in March 2013 by BNP Paribas, maturing in 2016 and exchangeable for Pargesa Holding SA bearer shares
Announcements concerning purchase and sale positions were published during the financial year. Further details are available on the SIX Swiss Exchange website :www.six-exchange-regulation.com/en/home/publications/significant-shareholders.html
An updated version of the Group’s structure at 1 September 2015 showing the holdings of the members of the Frère and Desmarais families in the capital of Pargesa Holding SA through their joint control of Parjointco NV (Netherlands) was sent to the Disclosure Office (see next page).
1.3 There are no cross-shareholdings within the Group.

Pargesa Holding SA Annual Report 2015
49
Corporate Governance
Nordex Inc
PowerCorporationof Canada
Gelco Enterprises LTD
Pansolo HoldingInc
Power FinancialCorporation
Pargesa HoldingSA (CH)
Parjointco NV(NL) (7)
Power FinancialEurope BV (NL)
Frère-Bourgeois SA
Albert FRERE (1)
Chairman ofthe Board
Stichting AKFrère-Bourgeois
(NL)
Kermadec SA(L)
Loverval Finance SA (5)
Erbe SA
Jacqueline DESMARAIS (8)
Paul DESMARAIS Jr.André DESMARAIS
100%
94.9%
68%
1.26%
99.99%
4.51%
100%
65.59%
100%
32%
5.1%
53.43%
94.07%
11.13%
100% (2)5.93% (3)
50%
55.5% of the capital75.4% of the voting rights
44.95%
3876357Canada Inc
Pargesa Holding SAShareholder Structure
171263Canada Inc
Status at 1st September 2015
91.01%
88.87%
Financière de la
Sambre SA(4)
Filux SA(L)
67.20%
100% (6)
31.73%
5.05%
8.99%
NB: In the chain of control regarding Albert Frère, where the country of domicile is not mentioned the companies are Belgian and have their registered o�ce at rue de la Blanche Borne 12, 6280 Gerpinnes, Belgium.(1) pursuant to the Articles of Association of Stichting Administratiekantoor Frère-Bourgeois, Rotterdam, Netherlands(2) 100% less one share held by another company in the group(3) of which 0.20% is held by a Luxembourg subsidiary of FILUX SA(4) FINANCIERE DE LA SAMBRE SA holds 0.39% of LOVERVAL FINANCE SA(5) 0.68% of LOVERVAL FINANCE SA is held by two Belgian sub-subsidiaries of LOVERVAL FINANCE SA(6) LOVERVAL FINANCE SA holds 100% (less one share held by another company in the group) of the ordinary shares of KERMADEC SA; a Luxemburg sub-subsidiary of LOVERVAL FINANCE holds 100% of the preferred shares of KERMADEC SA(7) joint control(8) trustees of a trust set up upon the death of the late Paul G. Desmarais for certain members of the Desmarais family
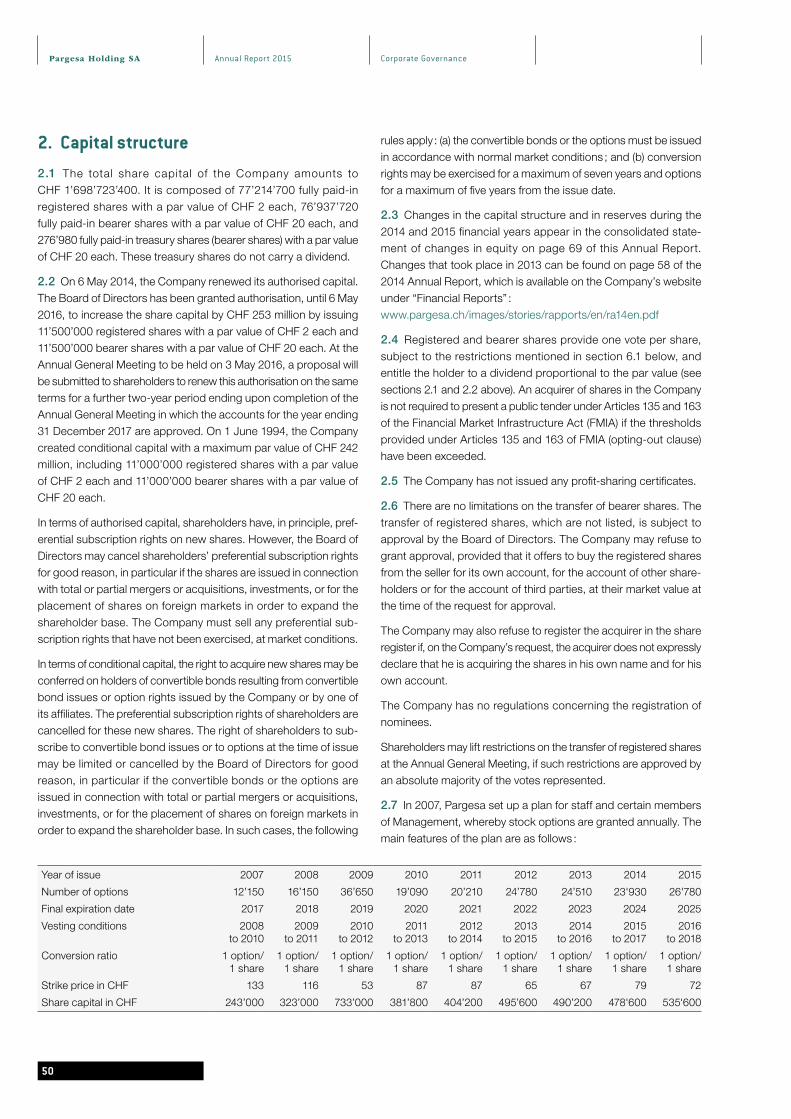
Annual Report 2015Pargesa Holding SA
50
Corporate Governance
2. Capital structure
2.1 The total share capital of the Company amounts to CHF 1’698’723’400. It is composed of 77’214’700 fully paid-in registered shares with a par value of CHF 2 each, 76’937’720 fully paid-in bearer shares with a par value of CHF 20 each, and 276’980 fully paid-in treasury shares (bearer shares) with a par value of CHF 20 each. These treasury shares do not carry a dividend.
2.2 On 6 May 2014, the Company renewed its authorised capital. The Board of Directors has been granted authorisation, until 6 May 2016, to increase the share capital by CHF 253 million by issuing 11’500’000 registered shares with a par value of CHF 2 each and 11’500’000 bearer shares with a par value of CHF 20 each. At the Annual General Meeting to be held on 3 May 2016, a proposal will be submitted to shareholders to renew this authorisation on the same terms for a further two-year period ending upon completion of the Annual General Meeting in which the accounts for the year ending 31 December 2017 are approved. On 1 June 1994, the Company created conditional capital with a maximum par value of CHF 242 million, including 11’000’000 registered shares with a par value of CHF 2 each and 11’000’000 bearer shares with a par value of CHF 20 each.
In terms of authorised capital, shareholders have, in principle, pref-erential subscription rights on new shares. However, the Board of Directors may cancel shareholders’ preferential subscription rights for good reason, in particular if the shares are issued in connection with total or partial mergers or acquisitions, investments, or for the placement of shares on foreign markets in order to expand the shareholder base. The Company must sell any preferential sub-scription rights that have not been exercised, at market conditions.
In terms of conditional capital, the right to acquire new shares may be conferred on holders of convertible bonds resulting from convertible bond issues or option rights issued by the Company or by one of its affiliates. The preferential subscription rights of shareholders are cancelled for these new shares. The right of shareholders to sub-scribe to convertible bond issues or to options at the time of issue may be limited or cancelled by the Board of Directors for good reason, in particular if the convertible bonds or the options are issued in connection with total or partial mergers or acquisitions, investments, or for the placement of shares on foreign markets in order to expand the shareholder base. In such cases, the following
rules apply : (a) the convertible bonds or the options must be issued in accordance with normal market conditions ; and (b) conversion rights may be exercised for a maximum of seven years and options for a maximum of five years from the issue date.
2.3 Changes in the capital structure and in reserves during the 2014 and 2015 financial years appear in the consolidated state-ment of changes in equity on page 69 of this Annual Report. Changes that took place in 2013 can be found on page 58 of the 2014 Annual Report, which is available on the Company’s website under “Financial Reports” :www.pargesa.ch/images/stories/rapports/en/ra14en.pdf
2.4 Registered and bearer shares provide one vote per share, subject to the restrictions mentioned in section 6.1 below, and entitle the holder to a dividend proportional to the par value (see sections 2.1 and 2.2 above). An acquirer of shares in the Company is not required to present a public tender under Articles 135 and 163 of the Financial Market Infrastructure Act (FMIA) if the thresholds provided under Articles 135 and 163 of FMIA (opting-out clause) have been exceeded.
2.5 The Company has not issued any profit-sharing certificates.
2.6 There are no limitations on the transfer of bearer shares. The transfer of registered shares, which are not listed, is subject to approval by the Board of Directors. The Company may refuse to grant approval, provided that it offers to buy the registered shares from the seller for its own account, for the account of other share-holders or for the account of third parties, at their market value at the time of the request for approval.
The Company may also refuse to register the acquirer in the share register if, on the Company’s request, the acquirer does not expressly declare that he is acquiring the shares in his own name and for his own account.
The Company has no regulations concerning the registration of nominees.
Shareholders may lift restrictions on the transfer of registered shares at the Annual General Meeting, if such restrictions are approved by an absolute majority of the votes represented.
2.7 In 2007, Pargesa set up a plan for staff and certain members of Management, whereby stock options are granted annually. The main features of the plan are as follows :
Year of issue 2007 2008 2009 2010 2011 2012 2013 2014 2015
Number of options 12’150 16’150 36’650 19’090 20’210 24’780 24’510 23'930 26'780
Final expiration date 2017 2018 2019 2020 2021 2022 2023 2024 2025
Vesting conditions 2008 to 2010
2009 to 2011
2010 to 2012
2011 to 2013
2012 to 2014
2013 to 2015
2014 to 2016
2015 to 2017
2016 to 2018
Conversion ratio 1 option/ 1 share
1 option/ 1 share
1 option/ 1 share
1 option/ 1 share
1 option/ 1 share
1 option/ 1 share
1 option/ 1 share
1 option/ 1 share
1 option/ 1 share
Strike price in CHF 133 116 53 87 87 65 67 79 72
Share capital in CHF 243’000 323’000 733’000 381’800 404’200 495’600 490’200 478'600 535'600
Pargesa Holding SA Annual Report 2015
51
Corporate Governance
3. Board of Directors
3.1 and 3.2 Members of the Board of Directors
Information on Board members is given in the following order :
Name, nationality
Education, professional career and present positions
Operational management functions within Pargesa or a Group
company
Other activities
Executive Directors :
Paul DESMARAIS Jr Canada
Bachelor of Commerce, McGill University – MBA, INSEAD – Power Corporation of Canada since 1981, appointed Chairman of the Board and Co-Chief Executive Officer of Power Corporation of Canada in 1996 – Became Vice President at Power Financial Corporation (Canada) in 1984 ; President and Chief Operating Officer from 1986 to 1989 ; Executive Vice Chairman from 1989 to 1990 ; Executive Chairman from 1990 to 2005 ; Chairman of the Executive Committee from 2006 to 2008 ; and Executive Co-Chairman since 2008 – Appointed to the Management Committee of Pargesa Holding SA in 1982, and made Executive Chairman in 1998 – Director of Pargesa Holding SA since 1992 ; appointed Vice Chairman of the Board in 2002 ; then Executive Director in 2003
Chairman of the Board of Directors of Pargesa Holding SA since
2013 – Vice Chairman of the Board, Director and Member of the
Standing Committee of GBL SA (Belgium)
Other activities : Director of several companies in the Power group in North America, including Great-West Lifeco Inc. and its subsidiaries, and IGM Financial Inc. and its subsidiaries (Canada) – Chairman of the Advisory Board of Sagard Private Equity Partners (France) – Director of Total SA (France), LafargeHolcim SA and SGS SA (Switzerland)
Gérald FRÈRE Belgium
Institut “Le Rosey” (Switzerland), Athénée Royal de Chimay (Belgium) – Career within the Frère-Bourgeois group (Belgium) – Executive Director of Frère-Bourgeois SA – Director of Erbe SA – Chairman of the Board of Directors of Loverval Finance SA (Belgium)
Vice Chairman of the Board of Directors and Executive Director of
Pargesa Holding SA – Chairman of the Board and Member of the
Standing Committee of GBL SA (Belgium)
Other activities : Director of Power Financial Corporation (Canada) – Regent of Banque Nationale de Belgique
Arnaud VIAL France / Canada
Ecole supérieure d’Electricité – 1977-1988 Banque Paribas (Paris) – 1988-1997 Director of accounting and financial services ; then Deputy Managing Director of Parfinance (France) – 1993-1997 Secretary General of Pargesa Holding SA – Since 1997 Senior Vice President of Power Corporation of Canada and Power Financial Corporation (Canada) – Managing Director of Pargesa Holding SA since June 2013
Managing Director and Director of Pargesa Holding SA – Director
and Member of the Standing Committee of GBL SA (Belgium) –
Member of the Supervisory Board of Pargesa Netherlands BV
(Netherlands) – Chairman of PGB SA and SFPG (France)
Non-executive Directors :
Marc-Henri CHAUDET Switzerland
Law doctorate, University of Lausanne – 1974-1982 Member of Vaud Legislature – 1968-2007 Attorney-at-Law (Vevey, Switzerland)
Director of Pargesa Holding SA
Bernard DANIEL Switzerland
Law degree and IMD Lausanne – 1987-2007 Secretary General and Secretary of the Board of Directors of Nestlé SA (Switzerland) – 1967-1972 International Committee of the Red Cross delegate – Since 2009 Member of the International Committee of the Red Cross Geneva (Switzerland)
Director of Pargesa Holding SA
Other activities : Member of the Board of Caisse d’épargne Riviera, Compagnie Industrielle et Commerciale du Gaz SA, Holdigaz SA – Co-founder and member of the Board of Riviera Finance SA (Switzerland)
Victor DELLOYE Belgium
Law degree, Université Catholique de Louvain, and Master of Fiscal Sciences degree (ESSF – Brussels, Belgium) – 1980-1987 Coopers & Lybrand – Joined the Frère-Bourgeois group in 1987 ; currently Director and Secretary General of Frère-Bourgeois SA and its subsidiary Compagnie Nationale a Portefeuille SA (Belgium)
Director of Pargesa Holding SA – Director and Member of the
Standing Committee of GBL SA (Belgium)
Other activities : Since the 1989-1990 academic year, Lecturer for the Executive Masters in Tax Management at the Solvay Brussels School of Economics & Management (ULB, Belgium) – Vice Chairman of the Association Belge des Sociétés Cotées, ASBL (Belgium)
Annual Report 2015Pargesa Holding SA
52
Corporate Governance
André DESMARAIS Canada
Concordia University (Canada) – 1979-1980 Campeau Corporation (Canada) – 1980 Ministry of Justice and Public Prosecution Service of Canada – Since 1981 Power Corporation of Canada, since 1988 Power Financial Corporation, since 1996 President and co-Chief Executive Officer of Power Corporation of Canada – Since 2008 Deputy Chairman of Power Corporation of Canada and Executive co-Chairman of Power Financial Corporation (Canada)
Vice Chairman of the Board of Directors of Pargesa Holding SA
Other activities : Director and Member of the Executive Board of Power Corporation of Canada and Power Financial Corporation (Canada) – Chairman of the Board of Square Victoria Communica-tions Group Inc., Gesca Ltée and La Presse Ltée (Canada) – Director of Great-West Lifeco Inc., IGM Financial Inc., Mackenzie Inc., Investors Group Inc., London Life Insurance Company, Canada Life (Canada) and Putnam Investments LLC (USA)
Paul DESMARAIS III Canada
Degree in economics, Harvard University – MBA, INSEAD (France) – 2004-2009 began career at Goldman Sachs (USA) – 2010-2012 worked in project management and strategy at Imerys (France) – 2012-2014 Deputy Vice President of Risk Management at Great- West Lifeco – Currently Vice President of Power Corporation of Canada and Power Financial Corporation (Canada)
Director of Pargesa Holding SA - Director and Member of the
Standing Committee of GBL SA (Belgium) and Imerys (France)
Other activities : Director of Great-West Life Inc., Investor’s Group, Mackenzie Inc., Sagard Capital Partners GP, Inc. (Canada) and Putnam Investments LLC (USA)
Cedric FRÈRE Belgium / France
BA, Vesalius College – Business and Economics (Belgium) – 2007 internship in “Investment Banking” division, Goldman Sachs Paris (France) – 2007-2008 “Corporate Finance” division, Royal Bank of Scotland, London (United Kingdom) – 2008-2010 “Private Deals” department, Banque Degroof, Brussels (Belgium) – Since 2010, Director of Compagnie Nationale a Portefeuille SA (Belgium)
Director of Pargesa Holding SA - Director and Member of the Standing
Committee of GBL SA (Belgium)
Other activities : Director of Frère-Bourgeois SA, Erbe SA and Compagnie Nationale a Portefeuille SA (Belgium) – Director of Cheval Blanc Finance SAS (France) – Tenured Director of Cheval des Andes (Argentina)
Ségolène GALLIENNE Belgium
BA, Vesalius College – Economics – Vrije Universiteit Brussels (VUB) – Since 1998 Director of Frère-Bourgeois SA (Belgium)
Director of Pargesa Holding SA and GBL SA (Belgium)
Other activities : Chair of the Board of Stichting Administratiekan-toor Peupleraie (Netherlands) and Diane SA (Switzerland) – Director of Stichting Administratiekantoor Frère-Bourgeois (Netherlands), Erbe SA, Fonds Charles-Albert Frère ASBL (Belgium), Christian Dior SA and Société Civile du Château Cheval Blanc (France)
Barbara KUX Switzerland
MBA with distinction, INSEAD – began career at McKinsey (Germany) – Held top management positions within multinational companies – 2008-2013 member of the Managing Board of Siemens AG (Germany)
Director of Pargesa Holding SA
Other activities : Member of the Board of Directors of Total, ENGIE (France), Henkel (Germany), Firmenich (Switzerland) and Umicore (Belgium)
Michel PÉBEREAU France
1961-1963 Ecole Polytechnique – 1965-1967 Ecole Nationale d’Administration (ENA) – 1967-1970 French General Finance Inspectorate – 1970-1974 Member of Cabinet of the French Minister for the Economy and Finance – 1971-1982 Treasury Division – 1978-1981 Cabinet Director and special assistant to the French Minister for the Economy – 1982-1986 Managing Director of Crédit Commercial de France – 1986-1993 Chairman and Managing Director of Crédit Commercial de France – 1993-2000 Chairman and CEO of Banque Nationale de Paris – 2000-2003 Chairman and CEO of BNP Paribas – 2003-2011 Chairman of the Board of Directors of BNP Paribas – Director of BNP Paribas until 13 May 2015 – Honorary Chairman of BNP Paribas since December 2011 (France)
Director of Pargesa Holding SA
Other activities : Director of Airbus (Netherlands) – Vice Chairman of the Supervisory Board of Banque Marocaine pour le Commerce et l’Industrie (BMCI) (Morocco) – Chairman of the Fondation BNP Paribas – Chairman of the Fondation ARC pour la Recherche sur le Cancer – Chairman of Centre des Professions Financières – Member of the Board of the Fondation Nationale des Sciences Politiques – Member of the Académie des Sciences Morales et Politiques (France) – Chairman of the Club des partenaires de TSE – Member of the Board of the Fondation JJ. Laffont-TSE –
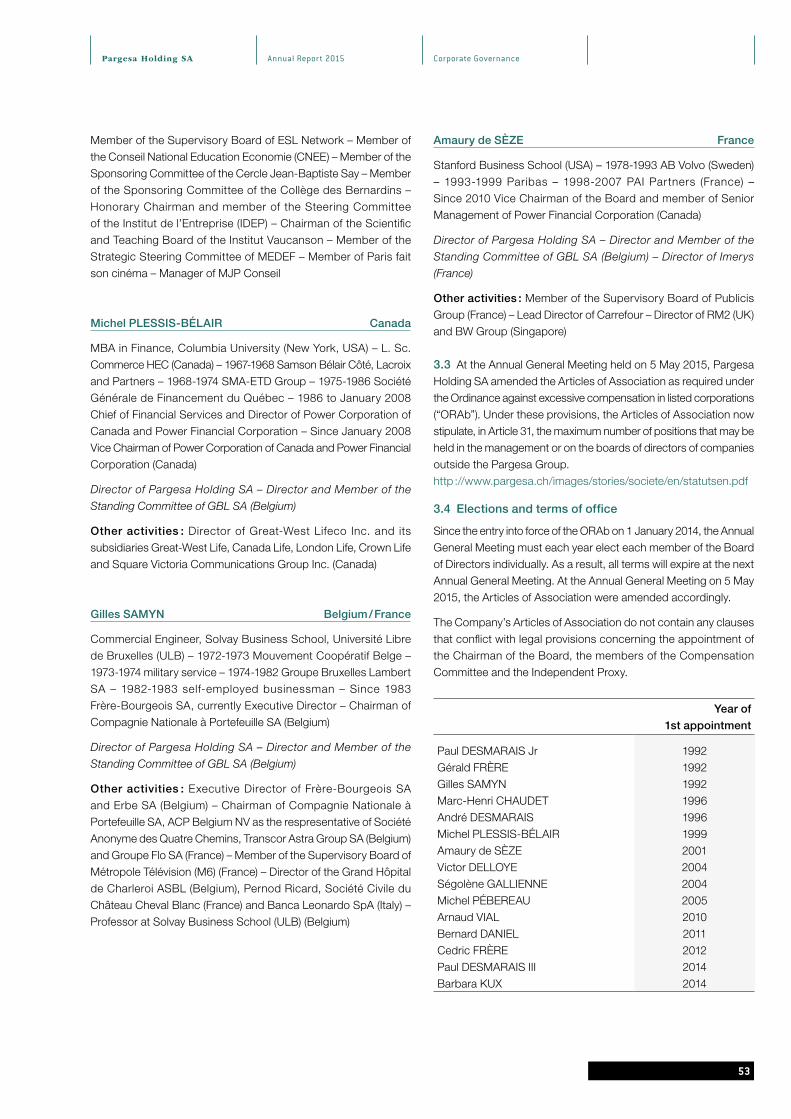
Pargesa Holding SA Annual Report 2015
53
Corporate Governance
Member of the Supervisory Board of ESL Network – Member of the Conseil National Education Economie (CNEE) – Member of the Sponsoring Committee of the Cercle Jean-Baptiste Say – Member of the Sponsoring Committee of the Collège des Bernardins – Honorary Chairman and member of the Steering Committee of the Institut de l’Entreprise (IDEP) – Chairman of the Scientific and Teaching Board of the Institut Vaucanson – Member of the Strategic Steering Committee of MEDEF – Member of Paris fait son cinéma – Manager of MJP Conseil
Michel PLESSIS-BÉLAIR Canada
MBA in Finance, Columbia University (New York, USA) – L. Sc. Commerce HEC (Canada) – 1967-1968 Samson Bélair Côté, Lacroix and Partners – 1968-1974 SMA-ETD Group – 1975-1986 Société Générale de Financement du Québec – 1986 to January 2008 Chief of Financial Services and Director of Power Corporation of Canada and Power Financial Corporation – Since January 2008 Vice Chairman of Power Corporation of Canada and Power Financial Corporation (Canada)
Director of Pargesa Holding SA – Director and Member of the
Standing Committee of GBL SA (Belgium)
Other activities : Director of Great-West Lifeco Inc. and its subsidiaries Great-West Life, Canada Life, London Life, Crown Life and Square Victoria Communications Group Inc. (Canada)
Gilles SAMYN Belgium / France
Commercial Engineer, Solvay Business School, Université Libre de Bruxelles (ULB) – 1972-1973 Mouvement Coopératif Belge – 1973-1974 military service – 1974-1982 Groupe Bruxelles Lambert SA – 1982-1983 self-employed businessman – Since 1983 Frère-Bourgeois SA, currently Executive Director – Chairman of Compagnie Nationale a Portefeuille SA (Belgium)
Director of Pargesa Holding SA – Director and Member of the
Standing Committee of GBL SA (Belgium)
Other activities : Executive Director of Frère-Bourgeois SA and Erbe SA (Belgium) – Chairman of Compagnie Nationale a Portefeuille SA, ACP Belgium NV as the respresentative of Société Anonyme des Quatre Chemins, Transcor Astra Group SA (Belgium) and Groupe Flo SA (France) – Member of the Supervisory Board of Métropole Télévision (M6) (France) – Director of the Grand Hôpital de Charleroi ASBL (Belgium), Pernod Ricard, Société Civile du Château Cheval Blanc (France) and Banca Leonardo SpA (Italy) – Professor at Solvay Business School (ULB) (Belgium)
Amaury de SÈZE France
Stanford Business School (USA) – 1978-1993 AB Volvo (Sweden) – 1993-1999 Paribas – 1998-2007 PAI Partners (France) – Since 2010 Vice Chairman of the Board and member of Senior Management of Power Financial Corporation (Canada)
Director of Pargesa Holding SA – Director and Member of the
Standing Committee of GBL SA (Belgium) – Director of Imerys
(France)
Other activities : Member of the Supervisory Board of Publicis Group (France) – Lead Director of Carrefour – Director of RM2 (UK) and BW Group (Singapore)
3.3 At the Annual General Meeting held on 5 May 2015, Pargesa Holding SA amended the Articles of Association as required under the Ordinance against excessive compensation in listed corporations (“ORAb”). Under these provisions, the Articles of Association now stipulate, in Article 31, the maximum number of positions that may be held in the management or on the boards of directors of companies outside the Pargesa Group.http ://www.pargesa.ch/images/stories/societe/en/statutsen.pdf
3.4 Elections and terms of office
Since the entry into force of the ORAb on 1 January 2014, the Annual General Meeting must each year elect each member of the Board of Directors individually. As a result, all terms will expire at the next Annual General Meeting. At the Annual General Meeting on 5 May 2015, the Articles of Association were amended accordingly.
The Company’s Articles of Association do not contain any clauses that conflict with legal provisions concerning the appointment of the Chairman of the Board, the members of the Compensation Committee and the Independent Proxy.
Year of
1st appointment
Paul DESMARAIS Jr 1992Gérald FRÈRE 1992Gilles SAMYN 1992Marc-Henri CHAUDET 1996André DESMARAIS 1996Michel PLESSIS-BÉLAIR 1999Amaury de SÈZE 2001Victor DELLOYE 2004Ségolène GALLIENNE 2004Michel PÉBEREAU 2005Arnaud VIAL 2010Bernard DANIEL 2011Cedric FRÈRE 2012Paul DESMARAIS III 2014Barbara KUX 2014
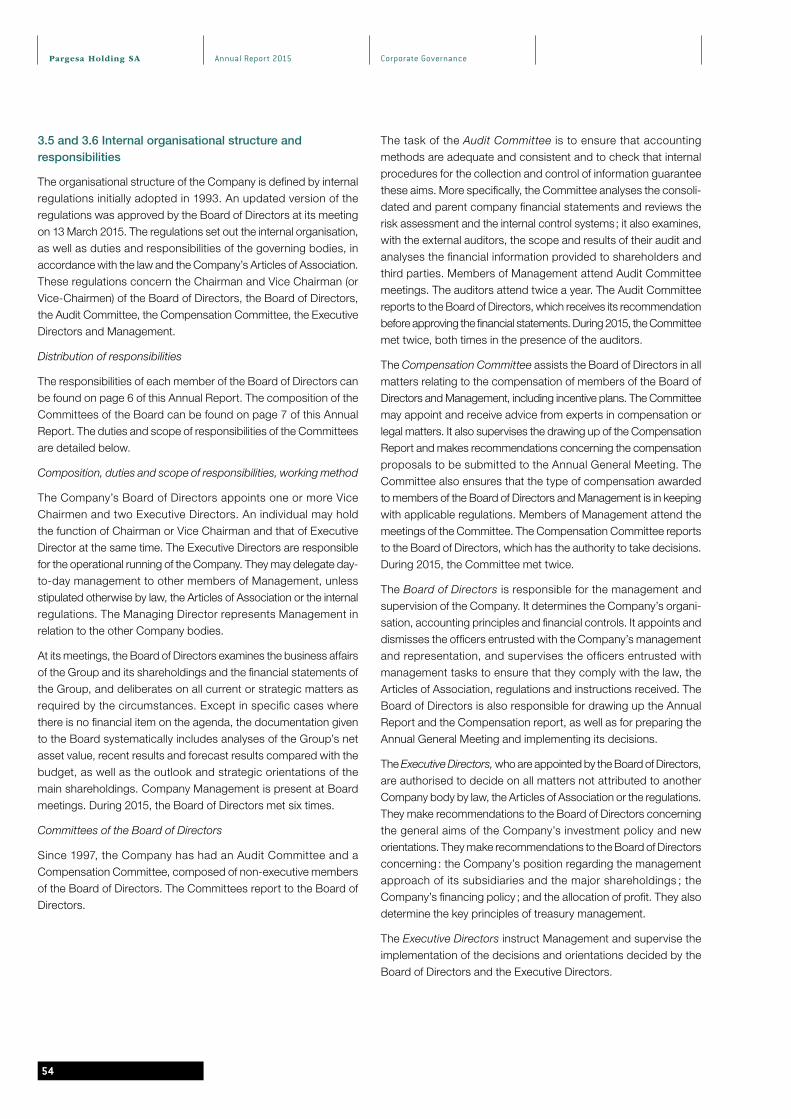
Annual Report 2015Pargesa Holding SA
54
Corporate Governance
3.5 and 3.6 Internal organisational structure andresponsibilities
The organisational structure of the Company is defined by internal regulations initially adopted in 1993. An updated version of the regulations was approved by the Board of Directors at its meeting on 13 March 2015. The regulations set out the internal organisation, as well as duties and responsibilities of the governing bodies, in accordance with the law and the Company’s Articles of Association. These regulations concern the Chairman and Vice Chairman (or Vice-Chairmen) of the Board of Directors, the Board of Directors, the Audit Committee, the Compensation Committee, the Executive Directors and Management.
Distribution of responsibilities
The responsibilities of each member of the Board of Directors can be found on page 6 of this Annual Report. The composition of the Committees of the Board can be found on page 7 of this Annual Report. The duties and scope of responsibilities of the Committees are detailed below.
Composition, duties and scope of responsibilities, working method
The Company’s Board of Directors appoints one or more Vice Chairmen and two Executive Directors. An individual may hold the function of Chairman or Vice Chairman and that of Executive Director at the same time. The Executive Directors are responsible for the operational running of the Company. They may delegate day-to-day management to other members of Management, unless stipulated otherwise by law, the Articles of Association or the internal regulations. The Managing Director represents Management in relation to the other Company bodies.
At its meetings, the Board of Directors examines the business affairs of the Group and its shareholdings and the financial statements of the Group, and deliberates on all current or strategic matters as required by the circumstances. Except in specific cases where there is no financial item on the agenda, the documentation given to the Board systematically includes analyses of the Group’s net asset value, recent results and forecast results compared with the budget, as well as the outlook and strategic orientations of the main shareholdings. Company Management is present at Board meetings. During 2015, the Board of Directors met six times.
Committees of the Board of Directors
Since 1997, the Company has had an Audit Committee and a Compensation Committee, composed of non-executive members of the Board of Directors. The Committees report to the Board of Directors.
The task of the Audit Committee is to ensure that accounting methods are adequate and consistent and to check that internal procedures for the collection and control of information guarantee these aims. More specifically, the Committee analyses the consoli-dated and parent company financial statements and reviews the risk assessment and the internal control systems ; it also examines, with the external auditors, the scope and results of their audit and analyses the financial information provided to shareholders and third parties. Members of Management attend Audit Committee meetings. The auditors attend twice a year. The Audit Committee reports to the Board of Directors, which receives its recommendation before approving the financial statements. During 2015, the Committee met twice, both times in the presence of the auditors.
The Compensation Committee assists the Board of Directors in all matters relating to the compensation of members of the Board of Directors and Management, including incentive plans. The Committee may appoint and receive advice from experts in compensation or legal matters. It also supervises the drawing up of the Compensation Report and makes recommendations concerning the compensation proposals to be submitted to the Annual General Meeting. The Committee also ensures that the type of compensation awarded to members of the Board of Directors and Management is in keeping with applicable regulations. Members of Management attend the meetings of the Committee. The Compensation Committee reports to the Board of Directors, which has the authority to take decisions. During 2015, the Committee met twice.
The Board of Directors is responsible for the management and supervision of the Company. It determines the Company’s organi-sation, accounting principles and financial controls. It appoints and dismisses the officers entrusted with the Company’s management and representation, and supervises the officers entrusted with management tasks to ensure that they comply with the law, the Articles of Association, regulations and instructions received. The Board of Directors is also responsible for drawing up the Annual Report and the Compensation report, as well as for preparing the Annual General Meeting and implementing its decisions.
The Executive Directors, who are appointed by the Board of Directors, are authorised to decide on all matters not attributed to another Company body by law, the Articles of Association or the regulations. They make recommendations to the Board of Directors concerning the general aims of the Company’s investment policy and new orientations. They make recommendations to the Board of Directors concerning : the Company’s position regarding the management approach of its subsidiaries and the major shareholdings ; the Company’s financing policy ; and the allocation of profit. They also determine the key principles of treasury management.
The Executive Directors instruct Management and supervise the implementation of the decisions and orientations decided by the Board of Directors and the Executive Directors.
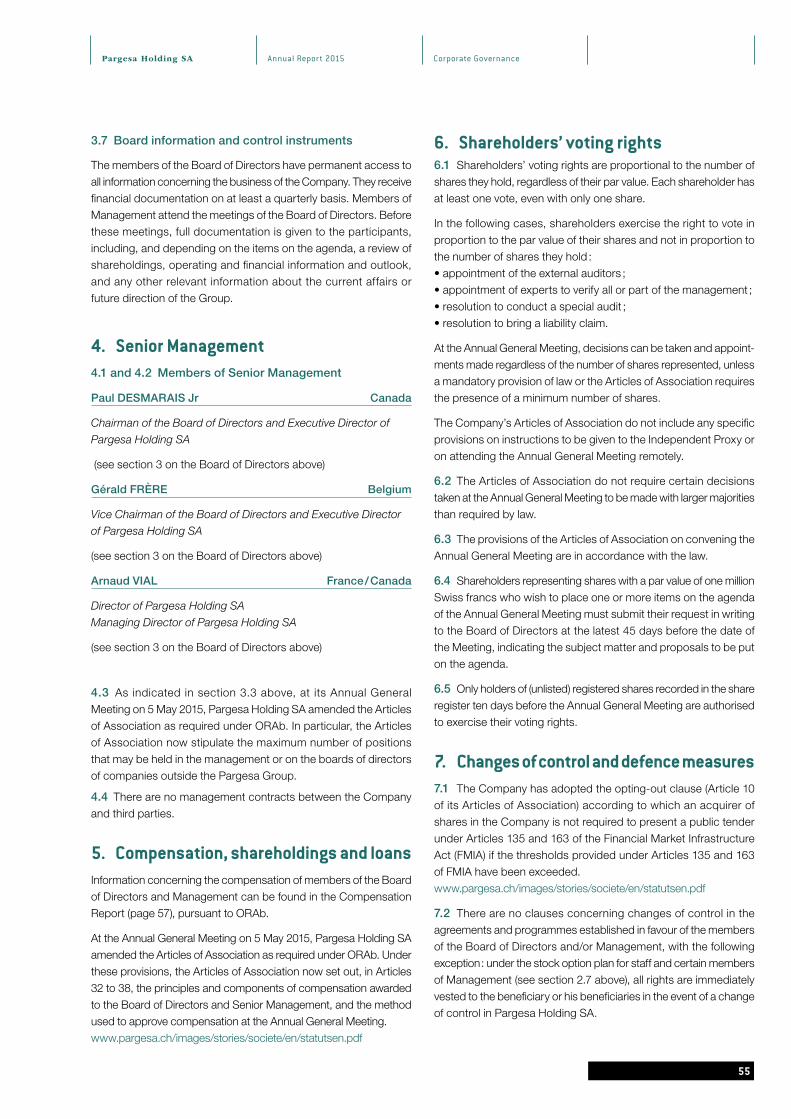
Pargesa Holding SA Annual Report 2015
55
Corporate Governance
3.7 Board information and control instruments
The members of the Board of Directors have permanent access to all information concerning the business of the Company. They receive financial documentation on at least a quarterly basis. Members of Management attend the meetings of the Board of Directors. Before these meetings, full documentation is given to the participants, including, and depending on the items on the agenda, a review of shareholdings, operating and financial information and outlook, and any other relevant information about the current affairs or future direction of the Group.
4. Senior Management4.1 and 4.2 Members of Senior Management
Paul DESMARAIS Jr Canada
Chairman of the Board of Directors and Executive Director of
Pargesa Holding SA
(see section 3 on the Board of Directors above)
Gérald FRÈRE Belgium
Vice Chairman of the Board of Directors and Executive Director
of Pargesa Holding SA
(see section 3 on the Board of Directors above)
Arnaud VIAL France / Canada
Director of Pargesa Holding SA
Managing Director of Pargesa Holding SA
(see section 3 on the Board of Directors above)
4.3 As indicated in section 3.3 above, at its Annual General Meeting on 5 May 2015, Pargesa Holding SA amended the Articles of Association as required under ORAb. In particular, the Articles of Association now stipulate the maximum number of positions that may be held in the management or on the boards of directors of companies outside the Pargesa Group.
4.4 There are no management contracts between the Company and third parties.
5. Compensation, shareholdings and loansInformation concerning the compensation of members of the Board of Directors and Management can be found in the Compensation Report (page 57), pursuant to ORAb.
At the Annual General Meeting on 5 May 2015, Pargesa Holding SA amended the Articles of Association as required under ORAb. Under these provisions, the Articles of Association now set out, in Articles 32 to 38, the principles and components of compensation awarded to the Board of Directors and Senior Management, and the method used to approve compensation at the Annual General Meeting.www.pargesa.ch/images/stories/societe/en/statutsen.pdf
6. Shareholders’ voting rights6.1 Shareholders’ voting rights are proportional to the number of shares they hold, regardless of their par value. Each shareholder has at least one vote, even with only one share.
In the following cases, shareholders exercise the right to vote in proportion to the par value of their shares and not in proportion to the number of shares they hold :• appointment of the external auditors ; • appointment of experts to verify all or part of the management ; • resolution to conduct a special audit ; • resolution to bring a liability claim.
At the Annual General Meeting, decisions can be taken and appoint-ments made regardless of the number of shares represented, unless a mandatory provision of law or the Articles of Association requires the presence of a minimum number of shares.
The Company’s Articles of Association do not include any specific provisions on instructions to be given to the Independent Proxy or on attending the Annual General Meeting remotely.
6.2 The Articles of Association do not require certain decisions taken at the Annual General Meeting to be made with larger majorities than required by law.
6.3 The provisions of the Articles of Association on convening the Annual General Meeting are in accordance with the law.
6.4 Shareholders representing shares with a par value of one million Swiss francs who wish to place one or more items on the agenda of the Annual General Meeting must submit their request in writing to the Board of Directors at the latest 45 days before the date of the Meeting, indicating the subject matter and proposals to be put on the agenda.
6.5 Only holders of (unlisted) registered shares recorded in the share register ten days before the Annual General Meeting are authorised to exercise their voting rights.
7. Changes of control and defence measures7.1 The Company has adopted the opting-out clause (Article 10 of its Articles of Association) according to which an acquirer of shares in the Company is not required to present a public tender under Articles 135 and 163 of the Financial Market Infrastructure Act (FMIA) if the thresholds provided under Articles 135 and 163 of FMIA have been exceeded.www.pargesa.ch/images/stories/societe/en/statutsen.pdf
7.2 There are no clauses concerning changes of control in the agreements and programmes established in favour of the members of the Board of Directors and/or Management, with the following exception : under the stock option plan for staff and certain members of Management (see section 2.7 above), all rights are immediately vested to the beneficiary or his beneficiaries in the event of a change of control in Pargesa Holding SA.

Annual Report 2015Pargesa Holding SA
56
Corporate Governance
8. Auditor8.1 The term of the auditor’s mandate is one year. The current auditor’s mandate was first approved at the 1997 Annual General Meeting.
Thierry Aubertin, auditor in charge of the current audit mandate, has held the position since 2013.
8.2 Fees invoiced by the audit firm during the year under review totalled CHF 207'510. This amount included the total fees invoiced by the auditors appointed at the Annual General Meeting of Pargesa in 2015.
Member companies of the Deloitte organisation invoiced audit fees of CHF 0.5 million to GBL and CHF 3.2 million to Imerys, which form part of the same Group (see section 1.1 above).
8.3 The audit firm or related third parties provided additional services to the Company for a total of CHF 4'000. Member companies of the Deloitte organisation provided additional services amounting to CHF 0.8 million to GBL and Imerys, which form part of the same Group (see section 1.1 above).
8.4 Information instruments with respect to the external auditor
As indicated in section 3.5 above, the Audit Committee examines, together with the auditors, the scope and results of their audits and analyses the financial information intended for shareholders and third parties.
The auditors attend the meetings of the Audit Committee in which the annual and half-year accounts are examined, as well as any other meeting at which their attendance is desired, based on the circumstances.
The Audit Committee examines a report, prepared by Management, assessing the execution of the assignment given to the auditors ; this report contains details enabling the Audit Committee to assess the quality of the services provided. Fees paid to the auditors for their work are negotiated annually and agreement is reached in particular about the scope of the auditing work. Any additional tasks are subject to separate negotiation. In 2015, the auditors provided additional services for the sum of CHF 4'000.
The Audit Committee met twice in the presence of the auditors in 2015. At the meeting of the Audit Committee in March 2016 during which the 2015 financial statements were examined, the auditors gave a documented report on the execution of their assignment and the results of their audits. They issued an unqualified audit opinion.
9. Information policyThe following information is provided to investors and other members of the public and is accessible at
www.pargesa.ch
• Press releases concerning quarterly, half-yearly and annual results : www.pargesa.ch/en/pressreleases/2016
• Graph of the trading price of the shares and the adjusted net asset value updated weekly on the website : www.pargesa.ch/en/listed-securities/pargesa-shares/netassetvalue/chart
• Presentations to the Annual General Meeting : www.pargesa.ch/en/presentations/library
• Half-yearly and annual reports : www.pargesa.ch/en/financialreports/library
• Financial calendar : www.pargesa.ch/en/shareholders/financialcalendar
The Company’s website also includes the e-mail address of the person in charge of investor relations : [email protected]
10. Corporate social and environmental responsibilityPargesa pays particular attention to social and environmental responsibility issues.
Owing to its investment in GBL, Pargesa deals with these matters through the strategic investments of GBL. Pargesa carefully follows major social and environmental issues in each of those shareholdings and encourages the application of best practice in these matters by the companies concerned.
Each company prepares a detailed social and environmental respon-sibility report each year ; these are available on each company’s website.
Pargesa’s corporate social responsibility statement is available at www.pargesa.ch/en/csr
57
04COMPENSATION
REPORT

Annual Report 2015Pargesa Holding SA
5858
Compensation report
Compensation Report
This report has been drawn up in accordance with the Ordinance against excessive compensation in listed corporations (known as “ORAb”), which came into force on 1 January 2014. This Report includes the information on compensation that, prior to the entry into force of ORAb, was found in section 5 of the Corporate Governance report and the figures that were available in the notes to the statutory accounts, pursuant to Article 663bbis of the Swiss Code of Obligations.
Compensation of the Board of Directors and Management
Members of the Board of Directors, the Board’s Committees and Management receive compensation directly from Pargesa. Total compensation also includes the compensation awarded to certain members of the Board of Directors and Management for positions and mandates they hold in other companies within the Pargesa Group at the Group’s request (particularly GBL and its shareholdings), as well as share options awarded under the incentive plans of these companies. In accordance with ORAb and Article 36 of the Articles of Association, at the Annual General Meeting shareholders must each year approve the Board of Directors’ proposal for each of the following :• the total compensation to be awarded to the Board of Directors
for the period up to the next Annual General Meeting ; and• the total compensation to be awarded to Management for the
coming financial year.
In accordance with these provisions, at the Annual General Meeting of 5 May 2015 shareholders approved the payment of :• total compensation of CHF 7’840’000 for the Board of Directors
for the period up to the Annual General Meeting of 3 May 2016 ; and
• total compensation of CHF 1’230’000 for Management for the 2016 financial year.
Principles
The compensation awarded directly by Pargesa to members of the Board of Directors and Management, which is included in the aforementioned total compensation, is set annually by the Board of Directors based on the recommendations of the Compensation Committee. In all but exceptional cases, the compensation awarded does not include any short-term variable cash component (i.e. no bonus). Compensation is determined based on market practices for equivalent positions in a selection of companies, backed by analyses carried out periodically by international independent consultants contracted specifically for this purpose.
The level of compensation awarded directly by Pargesa to members of the Board of Directors and Management was reviewed at the end of 2015 ; the previous review had taken place in 2010. Two sets of benchmarks were used in the most recent review. They were : a selection of Swiss listed companies and, to take account of the Company’s specific profile, a selection of listed European holding companies. The basis for comparison is the market median.
In addition, in order to determine the amount allocated to each individual, and the resulting total compensation, the Compensation Committee takes account of any compensation awarded by other companies in the Pargesa Group, as well as the level of operating responsibility exercised by the individual and whether he or she is a member of the Compensation Committee and/or the Audit Committee. In 2015, each member of the Board of Directors received the same compensation from Pargesa as the previous year, with the exception of the new Vice Chairman and Executive Director, whose compensation is higher than that of his predecessor, who did not seek another term as Director in 2015 and who was CEO at GBL until April 2015 and therefore received compensation for that position as well. Pargesa took account of this separate compensation when determining the level of compensation to be paid to him for his work as Vice Chairman and Executive Director. The total compensation awarded to the Board of Directors, as approved at the Annual General Meeting of 5 May 2015, for the period up to the Annual General Meeting of 3 May 2016 (i.e. CHF 7’840’000, see above) took account of this change in Company management. It therefore cannot be compared with the total amount of compensation paid directly and indirectly to members of the Board of Directors during the 2015 financial year as shown in the table on page 60. The compensation awarded by Pargesa to members of Management in 2015 was adjusted by around 2 %.
Following the 2015 compensation review (see above), the Board decided that it would increase the fees paid to Pargesa directors who are independent of the controlling shareholders by 10 % as of 2016. This increase will be included in the motion submitted to the Annual General Meeting on 3 May 2016 in which shareholders will be asked to vote on the total compensation of the Board of Directors for the period up to the 2017 Annual General Meeting.

Pargesa Holding SA Annual Report 2015Pargesa Holding SA
59
Pargesa Holding SA
59
Compensation report
Details
Compensation awarded directly by Pargesa includes fixed cash compensation. It also includes a share option plan, which Pargesa Holding set up for its staff and certain members of Management (not including Executive Directors) in 2007, following a decision by the Board of Directors. The main features of this plan are as follows : the options are granted annually ; the reference for determining the number of options to be awarded is calculated as a percentage of compensation, which is set annually based on Company performance (set for the year 2015 at a maximum of 125 % of compensation) ; the options have a term of ten years and a vesting period of three years ; the strike price is equal to the stock market price on the grant date. The aim of this long-term plan, which represents the variable component of compensation, is to maintain staff loyalty and involve members of staff in the creation of shareholder value.
In 2015, the total number of options granted to members of Manage-ment under this plan concerned 14’920 underlying Pargesa shares.
Members of the Board of Directors and Management are not entitled to any contractual payment for early departure. Option rights not yet fully vested on the date of retirement or dismissal are vested on that date, unless the case is one involving serious misconduct or voluntary departure. No compensation is paid to members of Management or directors who no longer have professional duties within the Group.
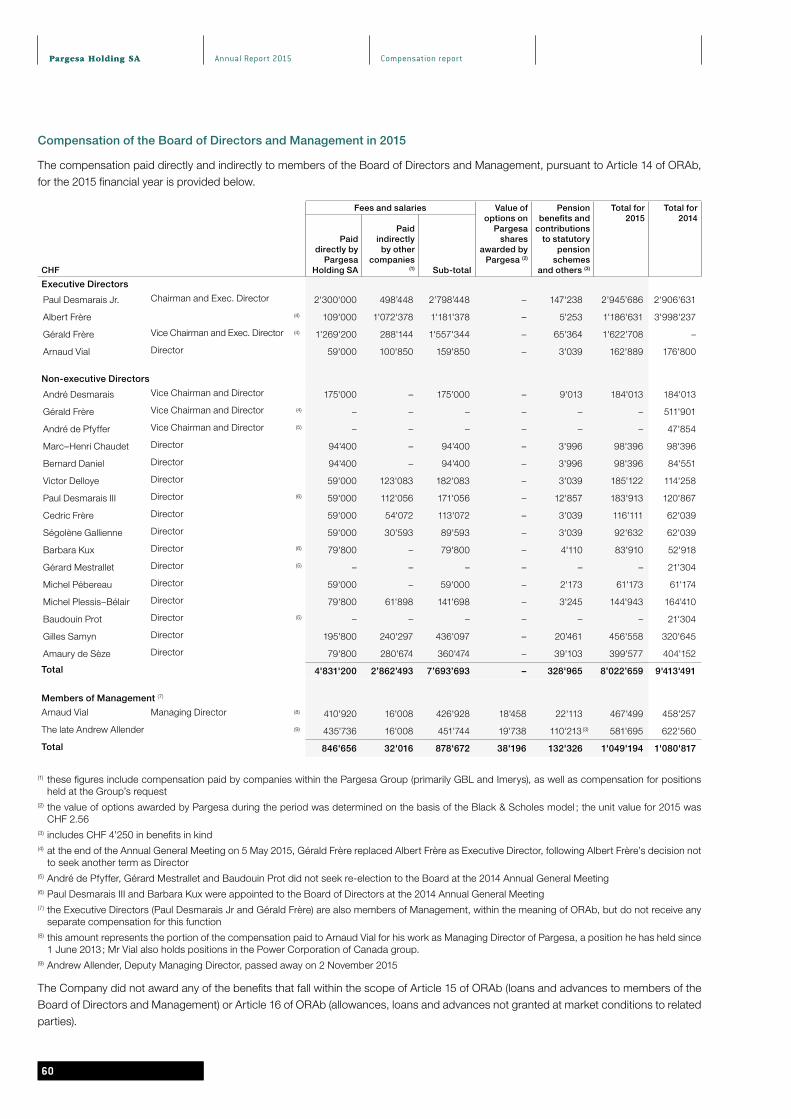
Annual Report 2015Pargesa Holding SA
60
Pargesa Holding SA
60
Compensation report
Compensation of the Board of Directors and Management in 2015
The compensation paid directly and indirectly to members of the Board of Directors and Management, pursuant to Article 14 of ORAb, for the 2015 financial year is provided below.
CHF
Fees and salaries Value of options on
Pargesa shares
awarded by Pargesa (2)
Pension benefits and
contributions to statutory
pension schemes
and others (3)
Total for 2015
Total for 2014
Paid directly by
Pargesa Holding SA
Paid indirectly by other
companies (1) Sub-total
Executive Directors
Paul Desmarais Jr. Chairman and Exec. Director 2'300'000 498’448 2’798’448 – 147'238 2’945’686 2'906'631
Albert Frère (4) 109'000 1'072'378 1'181'378 – 5'253 1'186'631 3'998'237
Gérald Frère Vice Chairman and Exec. Director (4) 1'269'200 288'144 1'557'344 – 65'364 1'622'708 –
Arnaud Vial Director 59'000 100'850 159'850 – 3'039 162'889 176'800
Non-executive Directors
André Desmarais Vice Chairman and Director 175'000 – 175'000 – 9'013 184'013 184'013
Gérald Frère Vice Chairman and Director (4) – – – – – – 511'901
André de Pfyffer Vice Chairman and Director (5) – – – – – – 47'854
Marc–Henri Chaudet Director 94'400 – 94'400 – 3'996 98'396 98'396
Bernard Daniel Director 94'400 – 94'400 – 3'996 98'396 84'551
Victor Delloye Director 59'000 123'083 182'083 – 3'039 185'122 114'258
Paul Desmarais III Director (6) 59'000 112'056 171'056 – 12'857 183'913 120'867
Cedric Frère Director 59'000 54'072 113'072 – 3'039 116'111 62'039
Ségolène Gallienne Director 59'000 30'593 89'593 – 3'039 92'632 62'039
Barbara Kux Director (6) 79'800 – 79'800 – 4'110 83'910 52'918
Gérard Mestrallet Director (5) – – – – – – 21'304
Michel Pébereau Director 59'000 – 59'000 – 2'173 61'173 61'174
Michel Plessis–Bélair Director 79'800 61'898 141'698 – 3'245 144'943 164'410
Baudouin Prot Director (5) – – – – – – 21'304
Gilles Samyn Director 195'800 240'297 436'097 – 20'461 456'558 320'645
Amaury de Sèze Director 79'800 280'674 360'474 – 39'103 399'577 404'152
Total 4'831'200 2’862’493 7’693’693 – 328'965 8’022’659 9'413'491
Members of Management (7)
Arnaud Vial Managing Director (8) 410'920 16'008 426'928 18'458 22'113 467'499 458'257
The late Andrew Allender (9) 435'736 16'008 451'744 19'738 110'213 (3) 581'695 622'560
Total 846'656 32'016 878'672 38'196 132'326 1'049'194 1'080'817
(1) these figures include compensation paid by companies within the Pargesa Group (primarily GBL and Imerys), as well as compensation for positions held at the Group’s request
(2) the value of options awarded by Pargesa during the period was determined on the basis of the Black & Scholes model ; the unit value for 2015 was CHF 2.56
(3) includes CHF 4’250 in benefits in kind(4) at the end of the Annual General Meeting on 5 May 2015, Gérald Frère replaced Albert Frère as Executive Director, following Albert Frère’s decision not
to seek another term as Director(5) André de Pfyffer, Gérard Mestrallet and Baudouin Prot did not seek re-election to the Board at the 2014 Annual General Meeting(6) Paul Desmarais III and Barbara Kux were appointed to the Board of Directors at the 2014 Annual General Meeting(7) the Executive Directors (Paul Desmarais Jr and Gérald Frère) are also members of Management, within the meaning of ORAb, but do not receive any
separate compensation for this function(8) this amount represents the portion of the compensation paid to Arnaud Vial for his work as Managing Director of Pargesa, a position he has held since
1 June 2013 ; Mr Vial also holds positions in the Power Corporation of Canada group.(9) Andrew Allender, Deputy Managing Director, passed away on 2 November 2015
The Company did not award any of the benefits that fall within the scope of Article 15 of ORAb (loans and advances to members of the Board of Directors and Management) or Article 16 of ORAb (allowances, loans and advances not granted at market conditions to related parties).
Pargesa Holding SA Annual Report 2015
6161
Compensation report
Report of the statutory auditor on the remuneration report to the General Meeting of Pargesa Holding SA, Geneva
Geneva, March 18, 2016
Report of the statutory auditor on the remuneration report
We have audited page 60 of the accompanying remuneration report of Pargesa Holding SA for the year ended December 31, 2015.
Responsibility of the Board of Directors
The Board of Directors is responsible for the preparation and overall fair presentation of the remuneration report in accordance with Swiss law and the Ordinance against Excessive compensation in Stock Exchange Listed Companies (Ordinance). The Board of Directors is also responsible for designing the remuneration system and defining individual remuneration packages.
Auditor’s Responsibility
Our responsibility is to express an opinion on the accompanying remuneration report. We conducted our audit in accordance with Swiss Auditing Standards. Those standards require that we comply with ethical requirements and plan and perform the audit to obtain reasonable assurance about whether the remuneration report complies with Swiss law and articles 14 – 16 of the Ordinance.
An audit involves performing procedures to obtain audit evidence on the disclosures made in the remuneration report with regard to compensation, loans and credits in accordance with articles 14 – 16 of the Ordinance. The procedures selected depend on the auditor’s judgment, including the assessment of the risks of material misstatements in the remuneration report, whether due to fraud or error. This audit also includes evaluating the reasonableness of the methods applied to value components of remuneration, as well as assessing the overall presentation of the remuneration report.
We believe that the audit evidence we have obtained is sufficient and appropriate to provide a basis for our opinion.
Opinion
In our opinion, the remuneration report for the year December 31, 2015 of Pargesa Holding SA comply with Swiss law and articles 14 – 16 of the Ordinance.
Deloitte SA
Thierry Aubertin Aurélie DarrigadeLicensed audit expert Licensed audit expertAuditor in charge


63
05CONSOLIDATED
FINANCIAL STATEMENTS

Annual Report 2015Pargesa Holding SA
64
Consolidated financial statements

Pargesa Holding SA
65
Consolidated financial statementsAnnual Report 2015
Contents
Consolidated income statement and consolidated statement of comprehensive incomeConsolidated balance sheetConsolidated cash flow statementConsolidated statement of changes in equity
Notes to the consolidated financial statements1 Accounting policies2 Segment reporting3 Changes in working capital and provisions4 Other operating income and expenses5 Financial instruments5.1 Nature and extent of risks arising from financial instruments5.2 Derivative financial instruments5.3 Net interest and dividends from available-for-sale financial assets5.4 Other financial income and expenses5.5 Available-for-sale financial assets5.6 Other long-term financial and non-financial assets5.7 Trade receivables5.8 Cash and cash equivalents5.9 Other short-term financial and non-financial assets5.10 Other long-term financial and non-financial liabilities5.11 Financial debt5.12 Other short-term financial and non-financial liabilities6 Staff costs7 Restructuring costs8 Impairment of assets9 Operating leases10 Income tax11 Intangible assets12 Goodwill13 Tangible assets14 List of main consolidated and equity-accounted companies15 Subsidiaries with material non-controlling interests 16 Acquisitions and disposals of subsidiaries17 Investments in associates and joint ventures18 Inventories19 Provisions20 Share capital, treasury shares, equity and other comprehensive income21 Dividend paid and proposed by Pargesa Holding SA22 Basic and diluted net earnings per share23 Pension liabilities and similar benefits24 Share-based payments25 Main off-balance-sheet rights and commitments26 Related party disclosures27 Important events taking place after the closing date
Report of the statutory auditor on the consolidated financial statements

66
Consolidated financial statementsAnnual Report 2015Pargesa Holding SA
Consolidated income statementNote 2015 2014
CHF millions CHF millions
Revenue 2 4'687.6 4'759.0Other operating income 69.8 64.9Changes in inventory 17.0 30.7Raw materials, goods intended for resale and consumables (1'528.2) (1'589.5)Staff costs 6 (1'049.5) (1'012.4)Depreciation of tangible assets and amortisation of intangible assets 11, 13 (276.0) (285.3)Other operating expenses (1'625.1) (1'512.1)Other operating income and expenses 4 820.3 833.5Operating profit 1'115.9 1'288.8
Net interest and dividends from available-for-sale financial assets 5.3 345.2 384.4Other financial income 5.4 133.3 30.0Other financial expenses 5.4 (164.4) (259.1)Financial profit 314.1 155.3
Operating and financial profit 1'430.0 1'444.1Income from associates and joint ventures 17 (77.6) 91.8Net profit before tax 1'352.4 1'535.9Income taxes 10 (69.8) (147.5)
Net profit for the period (including minority interests) 1'282.6 1'388.4- attributable to non-controlling interests 644.4 751.5- attributable to Pargesa shareholders (Group share) 638.2 636.9
Basic net earnings per share in CHF (Group share) 22 7.54 7.52Diluted net earnings per share in CHF (Group share) 22 7.45 7.33
Consolidated statement of comprehensive incomeNote 2015 2014
CHF millions CHF millions
Net profit for the period (including minority interests) 1'282.6 1 388.4
Other comprehensive income
Items not subsequently reclassified as incomeActuarial gains/losses 48.2 (97.4)Share of other comprehensive income of associates and joint ventures 3.7 (4.1)Total items not subsequently reclassified as income (1) 51.9 (101.5)
Items that are or may be subsequently reclassified as incomeChange in fair value of available-for-sale financial assets (1'175.5) (429.0)Change in hedging reserve (0.7) (9.7)Translation differences (1'652.7) (144.2)Share of other comprehensive income of associates and joint ventures 309.9 273.1Other items - (0.4)Total items that are or may be subsequently reclassified as income (2) (2'519.0) (310.2)
Total other comprehensive income (3) (2'467.1) (411.7)
Total comprehensive income for the period (including minority interests) (1'184.5) 976.7- attributable to non-controlling interests (627.4) 555.9- attributable to Pargesa shareholders (Group share) (557.1) 420.8
(1) including CHF –7.3 million in taxes in 2015 (CHF +25.0 million in 2014) ; see note 10.8(2) including CHF +9.4 million in taxes in 2015 (CHF +19.7 million in 2014) ; see note 10.8(3) details of the reclassification adjustments carried through the income statement are shown in note 20.4

Pargesa Holding SA
67
Consolidated financial statementsAnnual Report 2015
Consolidated balance sheet
ASSETS Note 31.12.2015 31.12.2014CHF millions CHF millions
Long-term assetsIntangible assets 11 368.1 243.5Goodwill 12 2'044.3 1'583.0Tangible assets 13 2'381.3 2'415.2Investments in associates and joint ventures 17 358.4 4'224.7Available-for-sale financial assets 5.5 13'403.6 10'452.1Deferred tax assets 10.3 119.7 50.0Other long-term financial assets 5.6 91.5 102.9Other long-term non-financial assets 5.6 10.3 10.8Total long-term assets 18'777.2 19'082.2
Short-term assetsInventories 18 843.1 839.2Trade receivables 5.7 700.0 713.1Financial assets held for trading 5 715.2 997.2Cash and cash equivalents 5.8 1'028.3 1'778.7Other short-term financial assets 5.9 256.6 272.0Other short-term non-financial assets 5.9 264.6 253.5Total short-term assets 3'807.8 4'853.7
TOTAL ASSETS 22'585.0 23'935.9
LIABILITIES AND EQUITY Note 31.12.2015 31.12.2014CHF millions CHF millions
EquityShare capital 20.1 1'698.7 1'698.7Capital reserve 256.6 256.6Treasury shares 20.2 (5.5) (5.5)Revaluation and hedging reserve 1'382.9 1'936.9Translation reserve (3'968.7) (3'317.5)Consolidated reserves 7'647.0 7'155.8Equity attributable to the Group 7'011.0 7'725.0Equity attributable to non-controlling interests 8'658.9 9'315.9Total equity (including minority interests) 15'669.9 17'040.9
Long-term liabilitiesProvisions 19 332.5 315.1Pension liabilities and similar benefits 23.3 358.0 396.9Deferred tax liabilities 10.3 129.7 92.7Financial debt 5.11 4'186.9 4'451.0Other long-term financial liabilities 5.10 104.0 223.6Other long-term non-financial liabilities 5.10 46.1 14.6Total long-term liabilities 5'157.2 5'493.9
Short-term liabilitiesProvisions 19 22.6 29.2Trade payables 538.8 540.8Income tax payable 77.0 76.2Financial debt due within the year 5.11 661.9 248.7Other short-term financial liabilities 5.12 85.1 102.6Other short-term non-financial liabilities 5.12 372.5 403.6Total short-term liabilities 1'757.9 1'401.1
TOTAL LIABILITIES AND EQUITY 22'585.0 23'935.9

Annual Report 2015Pargesa Holding SA
68
Consolidated financial statements
Consolidated cash flow statement
Note 2015 2014CHF millions CHF millions
OPERATING ACTIVITIESNet profit before tax 1'352.4 1'535.9
Adjusted for:Income from associates and joint ventures 77.6 (91.8)Dividends received from associates and joint ventures 107.3 108.4Dividends recognised on available-for-sale financial assets (345.2) (384.4)Dividends received on available-for-sale financial assets 304.2 391.8Profit/loss from the sale of tangible and intangible assets (3.7) (3.2)Profit/loss from the sale of available-for-sale financial assets (511.9) (824.4)Profit/loss from the sale of subsidiaries (6.5) (50.5)Reversal of revaluation and translation reserves 4 190.6 –Depreciation, amortisation, impairment, impairment reversals, provisions and negative good will (74.5) 369.1Miscellaneous items of income not involving cash movements (79.2) 104.7Interest income (22.7) (27.6)Interest expenses 137.5 169.5Operating cash flow before changes in working capital and provisions 1'125.9 1'297.5Changes in working capital and provisions 3 176.9 (167.8)Cash from operating activities 1'302.8 1'129.7Income taxes paid (107.1) (174.3)Cash flows from operations 1'195.7 955.4
INVESTMENT ACTIVITIESAcquisitions of subsidiaries, net of cash acquired 16 (475.5) (129.7)Disposals of subsidiaries, net of cash paid 16.1 87.3Acquisitions of associates and joint ventures (75.0) (107.6)Disposals of associates and joint ventures 43.2 43.8Acquisitions of tangible and intangible assets (316.5) (322.9)Disposals of tangible and intangible assets 7.9 10.2Long-term advances, repayments of long-term advances granted and other 2.7 0.2Acquisitions of available-for-sale financial assets (1'209.6) (424.6)Disposals of available-for-sale financial assets 643.4 884.8Cash flows from investments (1'363.3) 41.5
FINANCING ACTIVITIESReserve shares put into circulation by the parent company – 0.8Share issue/capital reduction by subsidiaries (share of non-controlling interests) 29.7 1.2Additional/partial acquisitions and disposals in existing subsidiaries 3.9 11.2Long-term financial debt taken out 293.5 776.4Interest received 16.1 25.8Interest paid (119.8) (140.0)Dividend paid by parent company to shareholders 21 (192.2) (223.5)Dividends paid by subsidiaries to minority shareholders (287.2) (314.5)Repayment of long-term debt and finance lease debt (419.1) (848.5)Short-term financial debt taken out 340.8 16.6Short-term financial debt repaid (44.9) (52.0)Cash flows from financing (379.2) (746.5)
Effect of exchange rate variation (203.6) (16.5)Effect of changes in the scope of consolidation – 1.2
Increase/decrease in cash and cash equivalents (750.4) 235.1
Cash and cash equivalents at 1 January 1'778.7 1'543.6Cash and cash equivalents at 31 December 5.8 1'028.3 1'778.7

Pargesa Holding SA Annual Report 2015
69
Consolidated financial statements
Consolidated statement of changes in equity
CHF millionsShare
capitalCapital reserve
Treasury shares
Revaluation and hedging
reserveTranslation
reserveConsolidated
reserve
Group share of
equity
Non-controlling
interestsTotal
equity
1 January 2014 1'698.7 256.1 (5.8) 2'145.9 (3'362.2) 6'812.3 7'545.0 9'094.6 16'639.6
2014 net profit – – – – – 636.9 636.9 751.5 1'388.4Change in fair value of available-for-sale financial assets – – – (204.1) – (16.7) (220.8) (208.2) (429.0)Change in hedging reserve – – – (2.9) – – (2.9) (6.8) (9.7)Translation differences – – – – (99.5) – (99.5) (44.7) (144.2)Actuarial gains/losses – – – – – (32.6) (32.6) (64.8) (97.4)Share of other comprehensive income of associates and joint ventures – – – (2.0) 144.2 (2.3) 139.9 129.1 269.0Other comprehensive income – – – (209.0) 44.7 (51.8) (216.1) (195.6) (411.7)2014 total comprehensive income – – – (209.0) 44.7 585.1 420.8 555.9 976.7Dividend paid by parent company – – – – – (223.5) (223.5) – (223.5)Dividends paid by subsidiaries – – – – – – – (314.5) (314.5)Reserve shares put into circulation – 0.5 0.3 – – – 0.8 – 0.8Other changes in equity (1) – – – – – (5.1) (5.1) 5.0 (0.1)Effects of changes in scope and capital increases on non-controlling interests – – – – – (13.0) (13.0) (25.1) (38.1)
Changes in items other than total comprehensive income – 0.5 0.3 – – (241.6) (240.8) (334.6) (575.4)
Total changes in 2014 – 0.5 0.3 (209.0) 44.7 343.5 180.0 221.3 401.3
31 December 2014 1'698.7 256.6 (5.5) 1'936.9 (3'317.5) 7'155.8 7'725.0 9'315.9 17'040.9
2015 net profit – – – – – 638.2 638.2 644.4 1'282.6Change in fair value of available-for-sale financial assets – – – (597.5) – (12.8) (610.3) (565.2) (1'175.5)Change in hedging reserve – – – (0.2) – – (0.2) (0.5) (0.7)Translation difference – – – – (766.2) – (766.2) (886.5) (1'652.7)Actuarial gains/losses – – – – – 18.5 18.5 29.7 48.2Share of other comprehensive income of associates and joint ventures – – – 46.0 115.0 1.9 162.9 150.7 313.6Other equity items recognised in other comprehensive income – – – (2.3) – 2.3 – – –
Other comprehensive income – – – (554.0) (651.2) 9.9 (1'195.3) (1'271.8) (2'467.1)
2015 total comprehensive income – – – (554.0) (651.2) 648.1 (557.1) (627.4) (1'184.5)Dividend paid by parent company – – – – – (192.2) (192.2) – (192.2)Dividends paid by subsidiaries – – – – – – – (287.2) (287.2)Other changes in equity (1) – – – – – 1.6 1.6 7.0 8.6Effects of changes in scope and capital increases on non-controlling interests (2) – – – – – 33.7 33.7 250.6 284.3
Changes in items other than total comprehensive income – – – – – (156.9) (156.9) (29.6) (186.5)
Total changes in 2015 – – – (554.0) (651.2) 491.2 (714.0) (657.0) (1'371.0)
31 December 2015 1'698.7 256.6 (5.5) 1'382.9 (3'968.7) 7'647.0 7'011.0 8'658.9 15'669.9
(1) these lines mainly comprise various changes originating in subsidiaries, especially the cost of share-based payments at GBL and Imerys, as well as changes originating in GBL’s equity-accounted shareholdings
(2) this line mainly comprises the impact of the decrease in GBL's % holding in Imerys, which went from 56.5 % at end-2014 to 53.9 % at end-2015, mainly
following the capital increase conducted by Imerys as part of the acquisition of S&B, i.e. CHF +33.3 million for the Group share and CHF +213.0 million
for non-controlling interests (see note 16) ; this line also includes the new minority interests, representing an amount of CHF 40.6 million, following the
acquisition of Golden Goose (see note 16)
The restatement adjustments carried through the income statement and details of changes in the revaluation and hedging reserve are provided in notes 20.4 and 20.5.

Annual Report 2015Pargesa Holding SA
70
Consolidated financial statements
Notes to the consolidated financial statements
Note 1 – Accounting policiesPARGESA HOLDING SA (“the Company”), 11 Grand-Rue, 1204 Geneva, Switzerland, is recorded in the Commercial Register of the Canton of Geneva. Its main purpose is the purchase, sale, administration and management, in Switzerland and abroad, of investments of a financial, commercial and industrial nature. The consolidated financial statements of the Company for the accounting periods ending 31 December 2015 and 31 December 2014 bring together the Company and the subsidiaries it controls (“the Group”) and the Group’s interests in associates and joint ventures. The Board of Directors authorised the publication of the consolidated accounts on 18 March 2016.Pargesa Holding SA is majority owned by Parjointco, a Dutch corporation. The ultimate shareholders are the Frère group (Albert Frère) in Belgium and the Power group (the Desmarais family) in Canada.
Accounting principlesThe consolidated annual accounts are prepared in accordance with “International Financial Reporting Standards” (IFRS) published by the “International Accounting Standards Board” (IASB) and in accordance with the interpretations published by the “International Financial Reporting Interpretations Committee” (IFRIC) of the IASB. The following amendments and annual improvements, which came into effect in 2015, apply to the accounting for, and the measurement and presentation of transactions, events and conditions existing in the Group, but were not applied in advance at 31 December 2014 :
Standard Application date
Amendments to IAS 19 Employee benefits – Employee contributions 1 July 2014Annual improvements 2010 – 2012 cycle 1 July 2014Annual improvements 2011 – 2013 cycle 1 July 2014
These amendments and annual improvements had no significant impact on the accounts at 31 December 2015.
The Group has not adopted in advance any standards, interpretations, amendments or annual improvements with an application date after the 2015 financial year ; no early adoption before the mandatory application date is currently planned. Standards, interpretations, amendments and improvements become mandatory in the year following the application date. Those in question are :
Standard Application date
Amendments to IAS 1 Presentation of financial statements 1 January 2016Amendments to IAS 7 Information to disclose 1 January 2017Amendments to IAS 12 Recognition of deferred tax assets for unrealised losses 1 January 2017Amendments to IAS 27 Use of the equity method in separate financial statements 1 January 2016Amendments to IAS 16 and IAS 38 Clarification of acceptable methods of depreciation and amortisation 1 January 2016Amendments to IAS 16 and IAS 41 Agriculture : bearer plants 1 January 2016Amendments to IFRS 11 Acquisition of an interest in a joint operation 1 January 2016Amendments to IFRS 9, IFRS 7 and IAS 39 Financial instruments – Hedge accounting 1 January 2018Amendments to IFRS 10 and IAS 28
Sale or contribution of assets between an investor and its associate or joint venture To be determined
Amendments to IFRS 10, IFRS 12 and IAS 28 Investment entities – Applying the consolidation exception 1 January 2016Amendments to IFRS 15 Date of entry into force of IFRS 15 1 January 2018IFRS 9 Financial instruments 1 January 2018IFRS 14 Regulatory deferral accounts 1 January 2016IFRS 15 Revenue from contracts with customers 1 January 2018IFRS 16 Lease contracts 1 January 2019Annual improvements 2012 – 2014 cycle 1 January 2016
The amendments to IAS 1, which become mandatory from 1 January 2016, are aimed at improving the relevance of the information provided, with a focus on the professional judgement of the preparer and materiality.

Pargesa Holding SA Annual Report 2015
71
Consolidated financial statements
IFRS 9, which becomes mandatory from 1 January 2018, should affect in particular the treatment of non-consolidated investments not held for trading. The Group will have to choose between recog-nition of the gains and losses on these shareholdings in the income statement or in equity. The potential impact on the accounts is being assessed.
IFRS 15 becomes mandatory as of 1 January 2018. The new standard replaces IAS 11 (construction contracts) and IAS 18 (revenue from ordinary operating activities) and is based on two principles : firstly, sales are recognised when control of the goods or service passes to the customer, and secondly, a measurement is used for the amount of the expected payment. Given the nature of the contracts between the Group (particularly Imerys) and its customers, the Group expects the impact of the new standard to be limited to sales conducted on certain specific incoterms and to certain services contracts.
IFRS 16 becomes mandatory as of 1 January 2019. This standard removes the current distinction between operating leases, which are charged to the income statement, and finance leases, which are recognised as tangible assets against a financial debt. Instead, a right-of-use asset must be recognised against a financial debt for all leases. Application of this standard will have an impact on the amount of capital invested, the depreciation expense recognised in operating profit, the interest expense recognised in financial income, and impairment tests. The potential impact on the accounts is being assessed.
The adoption of the other new standards in force for the financial years after 2015 should have no significant impact on the consolidated financial statements.
Framework for the preparation and presentation of the financial statements
The purpose of the annual financial statements is to present a true and fair view of the financial situation, financial performance and cash flows of the Group. They are prepared in accordance with the going-concern principle. The conventions for the presentation of the statements are exactly the same from one financial year to the next in order to ensure comparability, and are only altered if the change corresponds to the provisions of a standard, interpretation, amendment or annual improvement, or enables more reliable and/or more relevant information to be disclosed. When booked, assets and liabilities and income and expenses are only offset as a result of applying the provisions of a standard, interpretation, amendment or annual improvement. For assets and liabilities, a distinction is made between long-term and short-term items, depending on whether their realisation or due date is more or less than 12 months after the balance sheet date.
The consolidated financial statements, which concern a period of 12 months, are presented in millions of Swiss francs, which is the functional currency. Due to roundings, the sum of certain figures may not correspond exactly to the totals given in this report. The year-end financial statements are prepared on a historical cost basis, except for some non-current assets and financial instruments (derivatives,
instruments held for trading, available for sale financial assets, etc.), which are measured at fair value. Financial assets and liabilities hedged at fair value are stated at fair value based on the risk hedged.
The accounting policies are applied consistently within the Group at all times.
Basis of consolidation
The consolidated year-end financial statements include all the companies under Group control ; companies over which the Group exercises significant influence or joint control are accounted for using the equity method. In accordance with the materiality principle, certain non-significant companies are not included in the scope of consolidation. These companies are classified under “available-for-sale financial assets” and recorded at fair value at 31 December. Intercompany transactions, balances and gains and losses between Group companies are eliminated in order to reflect the economic reality of the Group’s transactions.
(1) Subsidiaries
Subsidiaries are companies under Group control. A company is under Group control when the Group :• has power over the subsidiary ; • is exposed to, or is entitled to, variable returns as a result of its
connection with the subsidiary ; • is able to exercise power over the subsidiary so as to influence
the amount of the returns obtained.
The Group controls a subsidiary when and only when all of the above three criteria are met. The Group reassesses its control over a subsidiary when the facts and circumstances indicate that one or more of the above three criteria have changed.
The consolidated financial statements of the subsidiaries are inte-grated into those of the Group as of the date on which control is first exercised and until the date when control ceases. When a subsidiary is held for sale, its assets, liabilities and income are presented in accordance with IFRS 5.A list of the main subsidiaries of the Group is given in note 14.
(2) Investments in associates and joint ventures
An associate is a company in which the Group exercises significant influence by participating in the financial and operating policy decisions of the investee, but which is neither a subsidiary nor a joint arrangement of the Group. Significant influence is presumed to exist when the Company owns, directly or indirectly through its subsidiaries, 20 % or more, but less than 50 %, of the voting power.
A joint venture is the result of a contractual arrangement whereby the Group and one or more parties agree to run a jointly controlled business operation and have rights to the net assets of that operation.Investments in associates and joint ventures are included in the consolidated financial statements using the equity accounting method as of the date on which significant influence is first exercised and until the date when significant influence ceases. According to
Annual Report 2015Pargesa Holding SA
72
Consolidated financial statements
the equity accounting method, a shareholding is accounted for at its original acquisition cost, which is then adjusted according to the changes that occur with regard to the Group’s share of the net assets of each associate or joint venture ; this value is, where neces-sary, reduced by any impairments, which are determined individually for each associate or joint venture.A list of the main associates of the Group is given in note 14.
Changes in the scope of consolidation
In H1 2015, Imerys acquired 100 % of the voting rights concerning the main industrial minerals businesses of Greek group S&B. As a result of this transaction, GBL's holding in Imerys was diluted, from 56.5 % at end-December 2014 to 53.9 % at end-December 2015.On 19 May 2015, Ergon Capital Partners III acquired an indirect majority stake in Golden Goose, an Italian designer of contemporary shoes, clothes and accessories. Lafarge, which had been accounted for using the equity method, was reclassified under assets held for sale at 30 June 2015. After the merger between Lafarge and Holcim was finalised in July 2015, the holding in LafargeHolcim was classified under available-for-sale financial assets. (See notes 16 and 17 for more details.)
Foreign currencies
In the financial statements of the Company and of each subsidiary, associate or joint venture, foreign currency transactions, when first recognised, are recorded in the functional currency of the company concerned using the exchange rate applicable on the transaction date.
On the balance sheet date, monetary items denominated in foreign currencies are translated using the rate on the last day of the financial year (closing rate of exchange). Gains or losses from the realisation or translation of foreign currency monetary items are recognised as gains or losses by the entity concerned in the period during which they occur.
On consolidation, the assets and liabilities of the Group’s foreign operations are translated using the closing rate of exchange. Income and expenses are translated using the average rate for the period. Resulting translation differences are recorded in equity under “translation reserve”. These translation differences are recognised as gains or losses when the company concerned is disposed of. Movements of funds in the consolidated cash flow statement are translated at the average rates of exchange.
The following rates of exchange were used in the translation of the consolidated financial statements :
Closing rate of exchange Average rate of exchange
2015 2014 2015 2014
EUR / CHF 1.0863 1.2026 1.0672 1.2144
Business combinations and goodwill
When the Group acquires an operation or a business, the identifi-able assets, liabilities and contingent liabilities of the investee are recognised at fair value. The excess cost of the business combination over the Group’s interest in the net fair value of the identifiable assets, liabilities and contingent liabilities is recognised as goodwill. When this difference, after remeasurement of the values of a subsidiary, associate or joint venture, is negative (i.e. negative goodwill), it is immediately recognised in the income statement. Negative goodwill represents the excess of the Group share in the net fair value of the identifiable assets, liabilities and contingent liabilities of a subsidiary, associate or joint venture at the acquisition date, compared with the acquisition cost.
Costs directly connected with an acquisition are recognised in the income statement as and when they are incurred. If there is incomplete information about the fair value of assets and liabilities at the end of the period during which the business combination is effective, its accounting is determined provisionally. Where necessary, the amounts provisionally recognised are adjusted during the following year, in order to reflect the new information obtained about facts or circumstances prevailing at the time of the combination which, had they been known at that date, would have affected the amounts recognised.
Goodwill is considered to be an asset and is not amortised but tested annually for impairment on the balance sheet date (or an earlier date if there are indications of a goodwill impairment). For the purposes of the impairment test, goodwill is allocated to the cost-generating unit (CGU) or CGU group likely to benefit from the business combi-nation synergies. If the recoverable amount of the CGU is less than the carrying amount of the unit, the impairment is first allocated to the goodwill of that unit, then to the other assets in the unit. Impairments are recognised immediately in the income statement and are not subsequently reversed.
Goodwill arising from the acquisition of an associate or joint venture is included in the carrying amount of the associate or joint venture. Goodwill arising from the acquisition of subsidiaries is presented separately in the balance sheet.
When a subsidiary, associate or joint venture is sold, the non-impaired part of the goodwill is taken into account in order to determine the profit or loss from the sale.
For a business combination, a non-controlling ownership interest may be measured, on a case-by-case basis and at the Group’s discretion, either at fair value or based on the proportionate share of the net identifiable asset of the acquiree. The increase or decrease in the percentage interest in a subsidiary, for transactions with third parties, constitutes a transaction with non-controlling interests and is recognised directly in equity without any adjustment to the carrying amount of the existing goodwill.
Pargesa Holding SA Annual Report 2015
73
Consolidated financial statements
Intangible assets
An intangible asset is recorded if, and only if, it is probable that the future economic benefit of the asset will accrue to the Group and if the cost of that asset can be estimated reliably. Intangible assets are recognised as assets over their useful life. They are recognised at acquisition cost less accumulated amortisation and any impairment. The amortisation of intangible assets with a defined useful life is calculated using the straight-line method on the basis of the estimated useful life of the intangible asset in question.
Costs incurred by the Group's research teams in order to improve the quality and properties of products generally address specific requirements made by customers and are therefore immediately recognised as expenses in the income statement. They are capi-talised only if they correspond to an industrial process that is new or improved, technically feasible and related to future economic benefits.
In the absence of an applicable standard or interpretation, Imerys considers greenhouse gas emission rights as intangible assets. Imerys holds these rights solely to justify its emissions volumes and performs no trading transactions, such as forward purchases or sales. Rights received free of charge are recognised for a value of zero, while rights acquired on the market are recognised at acquisition cost. If on the closing date the rights held are inferior to actual emissions, a provision is recognised in the income statement for the value of rights to be acquired, measured at market value. Disposals only relate to excess rights and are recognised in the income statement as asset disposals.
Estimated useful lives :
Software 1 – 5 yearsPatents, licences and concessions 5 – 40 yearsIndustrial procedures maximum of 10 years
Intangible assets with an indefinite useful life are not amortised but tested annually for impairment on the balance sheet date (or at an earlier date if there is an indication of impairment). When the recoverable value of an asset is lower than its carrying amount, the carrying amount is reduced in order to reflect the impairment.
Mining assets
Imerys group applies the following methods of recognition and measurement for mining assets. Prospection expenditures, i.e. the costs of seeking new knowledge about the mining potential, tech-nical feasibility and commercial viability of a geographical area, are expensed immediately under current operating income. Mineral reserves are tangible assets and are initially measured at acquisition cost excluding the subsoil, plus expenses incurred in establishing the tonnage of ore in the deposit. Overburden works, i.e. removal of the topsoil to access the deposit, also qualify as a component of the mineral reserve asset. Their initial measurement includes the production cost and the discounted value of restoration obligations resulting from the damage caused by the construction of these assets. Mineral reserves and overburden assets form the “mining assets” line item in note 13. Mining assets are subsequently valued at cost less depreciation and any accumulated impairment. The methods used for mining asset depreciation are estimates carried out by Imerys. A mineral reserve is depreciated based on a quantity equal to the geological inventory of the deposit less discounts relating to the uncertainty of resources. Overburden works, which form part of the mineral reserve asset, are depreciated based on the quantity of the reserve that they specifically give access to. The subsoil, which is the surface of the land outside the deposit, is not depreciated because it is not consumed by mineral operations. Mining assets are allocated to CGUs in the same way as other assets of the Imerys group and are subject to the same impairment tests.
Tangible assets
Tangible assets are capitalised if they are controlled under a title deed or a finance lease that transfers the inherent risks and benefits of ownership. Tangible assets are initially measured at acquisition or production cost. The initial cost of tangible assets held under a finance lease is the lower of the fair value of the asset and the discounted value of minimum future payments. The cost of tangible assets includes the cost of the loans funding their construction or production when they require a prolonged period of development. Where appropriate, the cost of tangible assets is reduced by the amount of public subsidies used to fund their acquisition or construc-tion. Maintenance and repair expenses are immediately charged to the income statement. The cost of tangible assets includes, in particular for satellite industrial plants built on customer land, the discounted value of the obligation to restore or decommission, when a current obligation exists. Tangible assets are subsequently measured at cost less depreciation and any accumulated impairment. The methods used for tangible asset depreciation are estimates carried out by the Group.

Annual Report 2015Pargesa Holding SA
74
Consolidated financial statements
Estimated useful lives :
Buildings 10 – 50 yearsIndustrial structures 10 – 30 yearsInstallations in and improvements to buildings and structures 5 – 15 yearsFacilities, machinery, plant and equipment 5 – 20 yearsVehicles 2 – 5 yearsOther tangible assets 10 – 20 years
Land is not depreciated.
Finance leases and operating leases
A finance lease is a contract with transfer to the lessee of practically all the inherent risks and benefits of the property (see the accounting principles relating to tangible assets as well). All other leases are defined as operating leases. Finance-leased assets are recognised as assets by the Group at the start of the lease at the lower of discounted value of future minimum payments or fair value. The debt owed to the lessor in connection with the asset is recorded in the balance sheet as a finance lease debt. Financial expenses are recorded in the income statement over the term of the lease and are allocated to the various periods covered by the lease so as to produce a constant periodic rate of interest on the remaining balance of the liability for each accounting period. Operating lease payments are recognised as expenses in the income statement on a straight-line basis throughout the term of the lease.
Impairment of assets (excluding goodwill and available-for-sale financial assets)
At each balance sheet date, the Group reviews the carrying amount of its investments in associates and joint ventures and of tangible and intangible assets with a definite useful life in order to determine whether there are any indications that the value of these assets is impaired.
For intangible and tangible assets, if there is any such indication, the recoverable amount of the asset is estimated in order to compare it with the carrying amount. The recoverable amount is the higher of the asset’s net selling price or its value in use. The value in use is the discounted value of estimated future cash flows expected from the continued use of an asset. When it is not possible to estimate the recoverable amount of an individual asset, the Group estimates the recoverable amount of the CGU to which the asset belongs. If the recoverable amount of the asset or CGU is considered to be less than its carrying amount, the carrying amount of the asset or CGU is reduced to its recoverable amount. This impairment is immediately recognised as an expense.
When an impairment recognised during prior periods no longer exists, the impairment recognised on the asset or CGU is immedi-ately recognised as income in order to adjust the value of the asset or CGU to an amount corresponding to the new measurement of its recoverable amount. However, after an impairment reversal, the carrying amount of an asset or CGU may not be greater than the carrying amount it would have had if no impairment had been recognised for that asset or CGU during prior periods.
When there is objective evidence that an associate or joint venture is impaired, it is subjected to an impairment test, in accordance with IAS 36 and IAS 28. The recoverable amount of the asset is estimated in order to compare it with the carrying amount and, where necessary, to recognise an impairment equal to the difference. The recoverable amount is the higher of its fair value less net selling price and its value in use. The value in use is the discounted value of estimated expected future cash flows. When an impairment recog-nised in a prior period ceases to exist, the carrying amount is partly or wholly restored and the impairment reversal is immediately recog-nised as income.
Financial assets
Financial assets are recorded on the transaction date and are initially recognised at fair value, which in most cases corresponds to their cost of acquisition.
• Available-for-sale financial assets : available-for-sale financial assets include holdings in companies in which the Group exercises no significant influence. The Group is deemed to have no significant influence if it does not directly or indirectly hold more than 20 % of the voting rights. These investments are recognised at fair value, based on the market price for listed shareholdings. Holdings in private equity funds are remeasured at fair value, which is deter-mined by the fund managers based on the investment portfolio. Available-for-sale financial assets are measured at fair value on each balance sheet date. Changes in fair value are recognised in the revaluation and hedging reserve in equity in “other comprehensive income”, with the exception of prolonged or significant impairment, which is recognised in the income statement. When there is objective evidence that an available-for-sale financial asset is impaired (i.e. a drop in fair value of more than 30 % or over more than one year), it is subjected to an impairment test. An impairment is recognised in the income statement for the period if the asset tested is considered to have been impaired. In that case, the impairment amount recog-nised is the difference between the acquisition cost of the asset and its fair value (i.e. share price) on the balance sheet date. Where an impairment was recognised in a prior period, any new decrease in fair value automatically leads to further impairment. Impairments recognised in the income statement are not reversed in the income statement during a subsequent period unless the asset is sold. The accumulated gain or loss in the revaluation and hedging reserve is recognised in the income statement when the asset is sold. Assets placed in this category are generally assets held over the medium and long term.
Pargesa Holding SA Annual Report 2015
75
Consolidated financial statements
• Held-to-maturity investments : on each balance sheet date, financial assets delivering fixed inflows, or flows determinable on fixed due dates, which the Group clearly intends, and is able, to keep to maturity (held-to-maturity investments) are measured at amortised cost, less any impairment recognised in order to reflect uncollectable amounts. Any rebate or premium for the acquisition of a security held to maturity is amortised over the life of the instrument, so that the profit recognised in each period represents a constant rate of return on the investment.
• Loans and receivables : loans, trade receivables and other unquoted receivables not classified as assets held to maturity are recorded under “loans and receivables”. These are revalued at amortised cost less any losses or impairment in the case of sums that cannot be recovered. Revenues are recognised according to the effective interest rate method except for short-term receivables and loans for which the effect is immaterial.
• Financial assets at fair value through profit or loss : financial assets in this category are either held for trading or qualified as such on initial recognition. A financial asset is held for trading if it is acquired with a view to being resold in the short term or if it is a derivative instrument that does not qualify as a hedging instrument. The financial assets in this category are subsequently measured at fair value and any change in value is recognised through profit or loss.
Other long-term financial and non-financial assets
This item includes long-term advances, loans and deposits (i.e. those with a term of more than 12 months), long-term derivative financial instruments and any other long-term non-financial assets.
Inventories
Inventories are capitalised on the date on which the risks, benefits and control are transferred to the Group. When sold, inventories are recognised as an expense in the income statement on the same date as the corresponding income. Inventories are measured at the lower of production cost or net realisable value. When the production rate is less than normal capacity, the fixed costs that can be included specifically exclude the proportion corresponding to the under-activity. Inventories with similar features are measured using the same method. The methods used in the Group are First In First Out (FIFO) and weighted average cost per unit. When the production cost cannot be recovered, it is calculated as the net realisable value in accordance with the conditions on the balance sheet date.
Trade receivables
A receivable is recognised as a sale of goods when the risks, benefits and control are transferred. A receivable is recognised for the rendering of a service based on the percentage of the service rendered on the balance sheet date. Moreover, both for the sale of goods and the rendering of services, a receivable is only recognised if it is recoverable and the amount of the transaction and the costs necessary to complete it can be measured reliably. The sale of goods and the rendering of services are measured at the fair value of the transaction, less trade and volume rebates, and discounts for early settlement. When a receivable proves to be wholly or partly uncollectable, it is individually reduced to its recoverable amount based on the conditions on the balance sheet date.
Cash and cash equivalents
This item comprises cash, demand deposits and short-term deposits with a maturity of three months or less, and highly liquid investments that are readily convertible into a known amount of cash and that are subject to an insignificant risk of changes in value.
Capital
(1) Costs of equity issues
Issuing costs directly attributable to an equity transaction are recognised as a deduction from equity.
(2) Treasury shares
Treasury shares are presented as a deduction from equity and recorded as a change in equity. No gain or loss is recognised in the income statement on the sale, issue or cancellation of treasury shares.
(3) Dividends
Dividends are recognised in the consolidated financial statements in the period in which they were approved by shareholders at the Annual General Meeting.
(4) Reserves
The reserves included in Group equity include the following :
• Capital reserve, which corresponds to the premium paid by the shareholders at the time of a Company share issue ;
• Revaluation and hedging reserve, which corresponds to the latent loss or gain on available-for-sale financial assets. The latent loss or gain is recognised in the income statement when the corresponding asset is sold or when an impairment of an asset is considered to be permanent. The hedging reserve represents unrealised gains and losses on hedging operations ;

Annual Report 2015Pargesa Holding SA
76
Consolidated financial statements
• Translation reserve, which corresponds to the translation differ-ences relating to subsidiaries, associates and joint ventures ;
• Consolidated reserves, retained earnings which represent accu-mulated net profit (mandatory retained earnings and any reserve for treasury shares, which are required reserves under the Swiss Code of Obligations).
Earnings per share
Basic earnings per share are calculated by dividing the Group’s net profit by the weighted average number of shares outstanding during the period, excluding treasury shares. Diluted earnings per share are calculated on the weighted average number of shares outstanding, adjusted assuming that the exercise of all share options which have a potentially dilutive effect, and taking into account the impact of the conversion of bonds convertible and exchangeable into treasury shares.
Financial liabilities
Financial liabilities include financial liabilities at fair value through profit or loss and other financial liabilities.
• Financial liabilities at fair value through profit or loss : financial liabilities in this category are those held for trading or qualified as such on initial recognition. A financial liability is held for trading if it is entered into with a view to being acquired or redeemed in the short term or if it is a derivative instrument that does not qualify as a hedging instrument. Financial liabilities in this category are subsequently measured at fair value and any change in value is recognised through profit or loss.
• Other financial liabilities : other financial liabilities, including borrowings, are initially measured at fair value, less transaction costs. They are subsequently recorded at amortised cost using the effective interest rate method. Trade payables and other financial liabilities are valued at amortised cost.
Hybrid instruments – convertible and exchangeable bonds
Convertible bonds (redeemable for the issuer’s shares) or exchange-able bonds (redeemable for shares other than the issuer’s shares) are considered to be hybrid instruments comprising a bond com-ponent and an option component. At issue, the fair value of the bond component is estimated on the basis of the prevailing market rates for similar non-convertible or non-exchangeable bonds. The interest expense on the bond component is calculated by applying the interest rate thus determined at issue. The difference between this expense and the interest effectively paid is added, during each period, to the carrying amount of the bond, so as to reconstitute, on maturity, the redemption value based on the amortised cost method. The difference between the proceeds from the convertible or exchangeable bond issue and the fair value attributed to the bond component is representative of the option to convert the debt into (or to exchange it for) other financial instruments.
If these other financial instruments are : • equity instruments of consolidated entities : the optional com-ponent, which is measured at fair value at issue, is recognised in equity and is not subject to further revaluation ; • other financial instruments : the option component, which is measured at fair value at issue, is remeasured at fair value at the end of each accounting period. The fluctuation in fair value is recorded in the income statement (for bonds that are convertible into the issuer's shares with the possibility of cash redemption, the option component is treated as an exchangeable bond and the option component's fluctuation in fair value is recorded in the income statement).
Derivative financial instruments
The Group uses derivative financial instruments and may conduct transactions on call and put options. The Group's operating companies use derivative financial instruments to reduce their exposure to various risks, in particular exchange rate, interest rate and energy price risks. Derivatives are recorded on the transaction date, i.e. when the hedging contract is entered into, and are booked as current or non-current assets or liabilities depending on their maturity and that of the underlying transactions. Derivatives are initially carried at fair value and then revalued at each balance sheet date with reference to market conditions. Fair value, which includes the derivative's accrued coupons, is determined through a model that uses observable data, i.e. closing date prices provided by third parties active in the financial markets (level 2 fair value).

Pargesa Holding SA Annual Report 2015
77
Consolidated financial statements
These valuations are adjusted for the credit risks of counterparties and the credit risk of the Group companies concerned. When the market value of the derivative is positive (derivative asset), its fair value includes the counterparty's probability of default (i.e. credit value adjustment, CVA). When the market value of the derivative is negative (derivative liability), its fair value takes account of the probability of default of the Group companies concerned (i.e. a debit value adjustment, DVA). These adjustments are determined using the spreads of bonds on the secondary market, such as those issued by the Group companies concerned and the counterparties (level 2 fair value). Only those instruments that satisfy hedge accounting criteria are subject to the accounting treatment described below.
Each transaction that qualifies as a hedge is documented with reference to the hedging strategy by identifying the risk hedged, the item hedged, the hedging instrument, the hedging relationship and the method used to assess the effectiveness of the hedging relationship. The effectiveness of the hedge is assessed at each balance sheet date. Recognition of derivatives used for hedging varies according to whether they qualify as fair value hedges, cash flow hedges or hedges of a net investment in foreign operations.Derivatives that do not qualify for hedge accounting are recognised in financial income and expenses.
(1) Fair value hedging
When variations in the fair value of a recognised asset or liability or in an unrecognised firm commitment are liable to affect the income statement, such variations may be hedged by a fair value hedge. The hedged item and the hedging instrument are remeasured symmetrically against income on each balance sheet date. The impact on the income statement is limited to the ineffective part of the hedge.
(2) Cash flow hedging
A cash flow hedge makes it possible to hedge the unfavourable variations in cash flow connected with a recognised asset or liability or a highly probably future transaction, when these variations are likely to affect the income statement. At each balance sheet date, the effective part of the hedge is recognised in equity and the ineffective part in the income statement. When the transaction is recognised, the effective part in equity is recorded in the income statement at the same time as the hedged item is recognised.
(3) Hedging of net investments in foreign operations
The exchange rate variations generated by the net assets held in foreign currencies by the Group may be hedged. At each balance sheet date, the effective part of the hedge is recognised in equity and the ineffective part in the income statement. The effective part in equity is recorded in the income statement only if control over a consolidated company is lost or the holding in a company under significant influence is reduced.
(4) Financial instruments not qualifying as hedging instruments
A derivative financial instrument that does not qualify as a hedging instrument is recognised as a trading instrument. Variations in fair value of financial instruments that do not qualify as hedging instruments are recognised immediately in the income statement.
The ineffective part of operational hedging instruments is booked as operating income or expense. The ineffective part of financial hedging instruments is booked as financial income or expense.
Fair value
Fair value is the price that would be obtained for the sale of an asset or would be paid for the transfer of a liability in an arm’s length transaction on the valuation date. When the Group records a financial instrument on the balance sheet for the first time, the instrument is measured at fair value. This value corresponds to the value at acquisition including transaction costs for the assets and liabilities that are not measured at fair value through profit and loss. After initial recognition, financial assets and liabilities (including derivatives) are measured at fair value, except for assets recorded at amortised cost.The fair value of listed-company equity instruments is measured on the basis of the stock market prices on the balance sheet date. When there is no active market for a financial instrument, the Group measures fair value using techniques involving existing market data.
Provisions
Provisions are recognised as soon as the Group has a current (legal or implicit) obligation resulting from past events that will probably cause an outflow of funds representing economic benefits, the amount of which can be reliably estimated.The amount provisioned corresponds to the best estimate of the amounts that must be spent in order to extinguish the current liability at the balance sheet date. Provisions are recognised as an expense in the income statement, with the exception of Imerys' provisions for the decommissioning of assets and certain provisions for the restoration of mining locations for which the offset is included in the cost of the related assets, notably for industrial building work and overburden work.Provisions that are expected to be settled within 12 months following the end of the period or that may be settled at any time are not discounted. Provisions that are expected to be settled more than 12 months after the end of the period are discounted. This treatment applies mainly to provisions at Imerys that are accrued with respect to environmental obligations to rectify pollution, obligations to dismantle plants, and obligations to restore mine sites once extraction is completed.Changes in discounted provisions due to a revision of the amount of the obligation, the timing of settlement or its discount rate are recognised in the income statement, or for provisions recognised against assets, as an adjustment of the cost of the latter. The unwinding is deducted from other financial income and expenses.Provisions for restructuring costs are recognised when the Group has established a detailed restructuring plan and as soon as this has been communicated to the parties concerned.
Annual Report 2015Pargesa Holding SA
78
Consolidated financial statements
Pension liabilities and similar benefits
(1) Defined contribution plans
In accordance with regulatory requirements and business practices in each country, the Group contributes to building up retirement benefits for its employees by paying, on either a compulsory or optional basis, contributions to external entities such as pensions funds, insurance companies or financial institutions. These plans are known as defined contribution plans and offer no guarantee to beneficiaries concerning the amount of future benefits they will receive. Charges incurred under defined contribution pension plans are recognised in the income statement under “staff costs” in the financial year during which they are due.
(2) Defined benefit plans
Some Group companies (mainly Imerys) guarantee that plan beneficiaries will receive a defined level of future benefits. Defined benefit liabilities and the annual cost booked to the income statement are measured using the projected unit credit method and demographic, financial and actuarial assumptions. These assumptions are used to establish the entitlements acquired by beneficiaries based on an estimated salary at the retirement date.The provisions (or assets) recognised correspond to the discounted value of the liability, less the fair value of plan assets, which if neces-sary may be capped. Pension costs and direct payments to beneficiaries are booked to the income statement as staff costs, with the exception of contri-butions and payments relating to restructurings, which are carried under other operating expenses, and contributions to under-funded closed plans with mandatory funding requirements, which are carried under other financial income and expenses.The impact of these contributions on the income statement is eliminated by releases of provisions, each carried under one of the three income statement items. Other items relating to changes in post-employment benefits are booked to the income statement as staff costs, with the exception of plan amendments, curtailments and settlements relating to a restructuring, which are carried under other operating expenses, and the unwinding of liabilities and the normalised return of assets, which are carried under other financial income and expenses. Administrative fees are carried under staff costs, with the exception of administrative fees relating to under-funded closed plans with mandatory funding requirements, which are booked under other financial income and expenses. Plan amendments, curtailments and settlements are recognised immediately in the income state-ment. The actuarial differences and asset limitations of post-employment plans are entirely recognised in equity, net of asset management fees, with no subsequent reclassification to income.
Share-based payments
The fair value of services rendered against the granting of share options and free shares is measured using a commonly accepted pricing model (Black & Scholes, Monte Carlo) with reference to the fair value of instruments at the grant date. This measurement takes into consideration the exercise price and the term of instruments, the underlying share price, the turnover rate of beneficiaries and the volatility of the underlying share. In most cases, the acquisition of rights is subject to terms relating to length of service, and the fair value of services rendered is recognised under “staff costs” over the vesting periods of rights, against an increase in equity, and on the basis of the best available estimate concerning the number of rights that will be acquired in the future. The turnover rates of beneficiaries are definitively adjusted as vesting periods are closed. The accounting treatment is the same if, in addition to terms relating to length of service, the acquisition of rights requires certain pre-determined economic performance conditions to be accomplished.When the transaction is settled in cash, the Group incurs a liability, which is measured at fair value. Until the liability is settled, the fair value is measured on every balance sheet date, and then on the settlement date. Changes in fair value are recognised in the income statement for the period.
Income recognition
Sales of assets are recorded when the risks and benefits of ownership have been transferred to the buyer. In the case of the delivery of goods, this is generally when the goods have been delivered and ownership title transferred.At Imerys, sales of goods represent the greater part of ordinary income. Their incoterms are multiple owing to the specificities of packaging (bulk, powder, paste, slurry, etc.) and freight (sea, rail, road, etc.), and incoterms represent the key indicator for the recog-nition of sales of goods. Reinvoicing the freight cost of the product represents the majority of services rendered, and its recognition generally derives from the sale of the transported product.Moreover, both for goods and the rendering of services, a receiv-able is only recognised if it is recoverable and the amount of the transaction and the costs necessary to complete it can be reliably measured. The sale of goods and the rendering of services are measured at the fair value of the transaction, less trade and volume rebates, and discounts for early settlement.Interest is recognised on a time proportion basis, taking into account the effective yield on the asset. Dividends are recognised as soon as the Group's right to receive them is established and it is probable that the Group will benefit from the resulting financial flows.

Pargesa Holding SA Annual Report 2015
79
Consolidated financial statements
Borrowing costs
Borrowing costs that are directly attributable to the acquisition, construction or production of a qualifying asset are capitalised and incorporated at the acquisition cost of the qualifying asset. A quali-fying asset is understood to be an asset that requires a substantial period of time (more than a year) to pass before it can be used or sold. Borrowing costs can include interest on sums due to banks at sight and on short-term or long-term borrowings, the amortisation of premiums or reimbursements relating to borrowings, amortisation of ancillary costs incurred in connection with the arrangement of borrowings, financial expenses in respect of finance leases and exchange differences arising from foreign currency borrowings to the extent that they are regarded as an adjustment to interest expense.
Income taxes
Taxes on profit for the financial year comprise current taxes and deferred taxes. They are recorded in the income statement except where they concern items recorded directly in equity, in which case they are also recognised in equity. Current taxes are the taxes payable on the taxable profit for the financial year, calculated according to the rates of taxation that were adopted at the balance sheet date, as well as adjustments for the previous financial years.Deferred taxes are calculated according to the variable deferral method applied to the timing differences between the carrying amount of the assets and liabilities recorded in the balance sheet and their tax base. The following differences are not taken into account : non-tax-deductible goodwill and initial recognition of assets and liabilities having no impact on the book and fiscal results. Deferred taxes are calculated as a function of how the asset and liability items are expected to be realised or settled, on the basis of the rates of taxation that were adopted or virtually adopted at the balance sheet date. Furthermore, deferred tax liabilities relating to shareholdings in subsidiaries are not recognised when the Group is able to control the date on which the timing difference will be reversed and when it does not expect the timing difference to be reversed in the foreseeable future. Deferred tax assets are recognised only to the extent that taxable earnings are likely to be generated that allow use to be made of the deductible timing differences, tax losses and tax credits.
Non-current assets held for sale and discontinued operations
When, at the balance sheet date, it is highly probable that non-current assets or directly connected groups of assets and liabilities will be disposed of, they are designated as non-current assets (or disposal groups) held for sale. Their disposal is considered highly probable if, at the balance sheet date, a plan for selling them at a reasonable price relative to their fair value has been made in order to find a buyer and complete the sale within a maximum period of one year. Non-current assets (or disposal groups) classed as being held for sale are valued at the lower of their carrying amount and their fair value less the cost of the sale. They are presented separately in the balance sheet.
A discontinued operation is a component of an operation that has been sold or is classified as held for sale. It represents a major and distinct line of business or geographical region, it is part of a single coordinated plan to dispose of a major and distinct line of business or geographical region, or it is a subsidiary exclusively acquired for the purposes of being resold. A component of an entity is understood to mean the operations and cash flows that, from an operating point of view and in terms of financial disclosure, can be clearly distinguished from the rest of the business operations. Discontinued operations are presented in a separate line item in the income statement and the cash flow statement.
Segment reporting
Pargesa and GBL are holding companies with investments in companies that have little in common from a commercial or indus-trial point of view. These investments are acquired, managed and sold with a view to maximising shareholder value. Therefore, with regard to segment reporting, the business segments are based on the segregation of the various shareholdings and the absence of connections between them, with each significant investment being regarded as a segment. The operations of the holding companies controlled by Pargesa are presented as a separate segment. Busi-ness segments are also shown by geographical location. The Group's segment reporting is consistent with the internal reports made to the Board of Directors. The segment reporting described above is presented in note 2.
Annual Report 2015Pargesa Holding SA
80
Consolidated financial statements
Risk management
(1) Exchange rate risk
Each entity is responsible for managing its own exchange rate risk. Exchange rate risk may be hedged by forward foreign exchange contracts, foreign currency swaps and foreign exchange options. These instruments are used to hedge receivables, debts, firm commitments in foreign currencies and net investments in foreign entities.
(2) Interest rate risk
Interest rate risk management involves fully or partially hedging the fluctuation in debt interest rates either by a fixed rate of interest, by interest rate swaps or by options, depending on the individual policy laid down by the board of directors of each entity based on the needs of that entity.
(3) Credit risk
Credit risk concerns the risk that third party contractors will not fulfil their commitments towards the Group when they enter into transactions with it. Each shareholding is responsible for managing credit risk, using the specific arrangements most suited to the situation.
(4) Liquidity risk
Liquidity risk is the risk that an entity cannot fulfil its commitments to repay debts. Liquidity risk is managed at each level of the Group.
(5) Energy price risk
Imerys’ energy price risk is hedged by forward contracts and by option instruments.
Accounting changes, errors, main accounting judgements and estimates
A change in accounting method is only made if required by the provisions of a standard, interpretation or amendment to a standard, or if the change will result in more relevant and reliable information being disclosed. Changes in accounting policy are applied retro-spectively, except in the case of transitional measures specific to the standard, or the interpretation or amendment to a standard. The financial statements affected by a change in accounting method are adjusted for all the accounting periods presented, as if the new accounting policy had always been in use. An error, when discovered, is also adjusted retrospectively.The inherent uncertainties of business operations require estimates to be used when preparing the financial statements. Estimates are based on judgements intended to give a reasonable assessment of the most recent reliable information available. An estimate is revised to reflect changes in circumstances, new information and the effect of experience.
Changes in estimates are accounted for on a forward-looking basis : they affect the accounting period during which they occurred, and possibly the following periods.
The main judgements and estimates used in the preparation of the financial statements relate in particular to the following assumptions :
(1) Tangible and intangible assets
Tangible and intangible assets with a definite useful life are depreciated or amortised using the straight-line method based on the estimated useful life of the fixed asset in question.
(2) Impairment
Impairment tests (see also the accounting policies concerning business combinations and goodwill, and the impairment of assets) are used to verify whether the carrying amount of assets will be recovered on the basis of the present value of future cash flows.
At Imerys, the definition of CGUs and impairment indications, as well as the allocation of assets and goodwill to CGUs, are matters of judgement for Imerys senior management. The term and amount of future cash flows and the discount rates used in the calculation of the CGUs' value in use are estimates determined by Imerys senior management. Events that trigger an impairment test are matters of judgement for Imerys senior management. Such events mainly include significant changes in business operations, interest rates, technology level, obsolescence and asset yield. An impairment test must be carried out immediately on a CGU or individual asset if there is an adverse change in one of these indicators.An analysis of the impairments test conducted for the CGUs is provided in note 12 and an analysis of the impairment recorded for the year is given in note 8.
(3) Employee benefits
At 31 December 2015, the net provisions established for employee benefits primarily concerned Imerys (see the accounting policies concerning “pension, liabilities and similar benefits)”.The actuarial assumptions used to measure the value of defined benefit plans are estimates determined by Imerys senior manage-ment. The rates used to discount commitments and calculate the normalised return of the assets on the income statement are set by reference to the rates of the bonds issued by AA-rated (i.e. high-quality) companies in the main iBoxx GBP Corporate AA and Citigroup Bond Yield USD indices. An analysis of employee benefits is given in note 23.
Pargesa Holding SA Annual Report 2015
81
Consolidated financial statements
(4) Provisions
The amount recognised for provisions corresponds to the best estimate of the expenditure required in order to extinguish the current (legal or implicit) liability at the balance sheet date. The environmental and rehabilitation provisions set aside by Imerys for its mining and manufacturing operations require an estimate of the amounts the group will have to pay and assumptions about the repayment schedule and discount rates. Litigation claims involving the Imerys group are assessed by the Imerys legal department with the help of lawyers. Finally, provisions relating to restructurings within the Imerys group also require estimates to be made (see accounting policies relating to “provisions” as well).
An analysis of the provisions is presented in note 19.
(5) Holdings
At 31 December 2015, shares in LafargeHolcim, Total, Pernod Ricard, SGS, ENGIE (formerly GDF Suez), adidas, Umicore and Ontex, which are available-for-sale financial assets measured at fair value on the basis of recently observed market prices (the measurement of which is not the result of assumptions or other sources of uncertainty), accounted for 58 % of total balance sheet assets.
In terms of judgement, GBL analysed the accounting treatment to be used for its holdings in SGS and Umicore and whether they should be booked (i) as an investment in an associate (IAS 28), with GBL's share of SGS and Umicore income and equity capital being recognised, or (ii) as an available-for-sale financial asset (IAS 39), with the fair value of the holdings being recognised and dividends being recorded as income.
Under IAS 28, a company is presumed to have a significant influence if it holds 20 % or more of the voting rights, or if such influence can be clearly demonstrated, even if the holding is less than 20 %. Under IAS 28, significant influence is clearly demonstrated if there is (i) representation on the Board of Directors ; (ii) participation in the policy-making process ; (iii) material transactions between the investor and the investee ; (iv) interchange of managerial personnel ; or (v) provision of essential technical information.
As GBL's stake is less than 20 %, and as GBL's representation on the SGS Board of Directors is not a longstanding right, GBL concluded that its holding in SGS should be recorded as an available-for-sale financial asset. GBL's representation on Umicore's Board of Directors is not sufficient to demonstrate a significant influence. As a result, GBL also concluded that its holding in Umicore should be recorded as an available-for-sale financial asset.
At 31 December 2015, the fair value of the holding in LafargeHolcim, which has been classed as an available-for-sale financial assets since Q3 2015, was lower than its cost. However, GBL did not consider there to be any objective indication of impairment at that date, as the drop in fair value was below 29.74 %. This does not constitute a significant (i.e. more than 30 %) or a prolonged (i.e. more than one year) decline in the fair value, as defined in the Group's measurement rules.
Events after the balance sheet date
Events occurring between the balance sheet date and the date on which the financial statements were approved for publication by the Board of Directors only result in an adjustment if they reveal, specify or confirm conditions already existing on the balance sheet date.
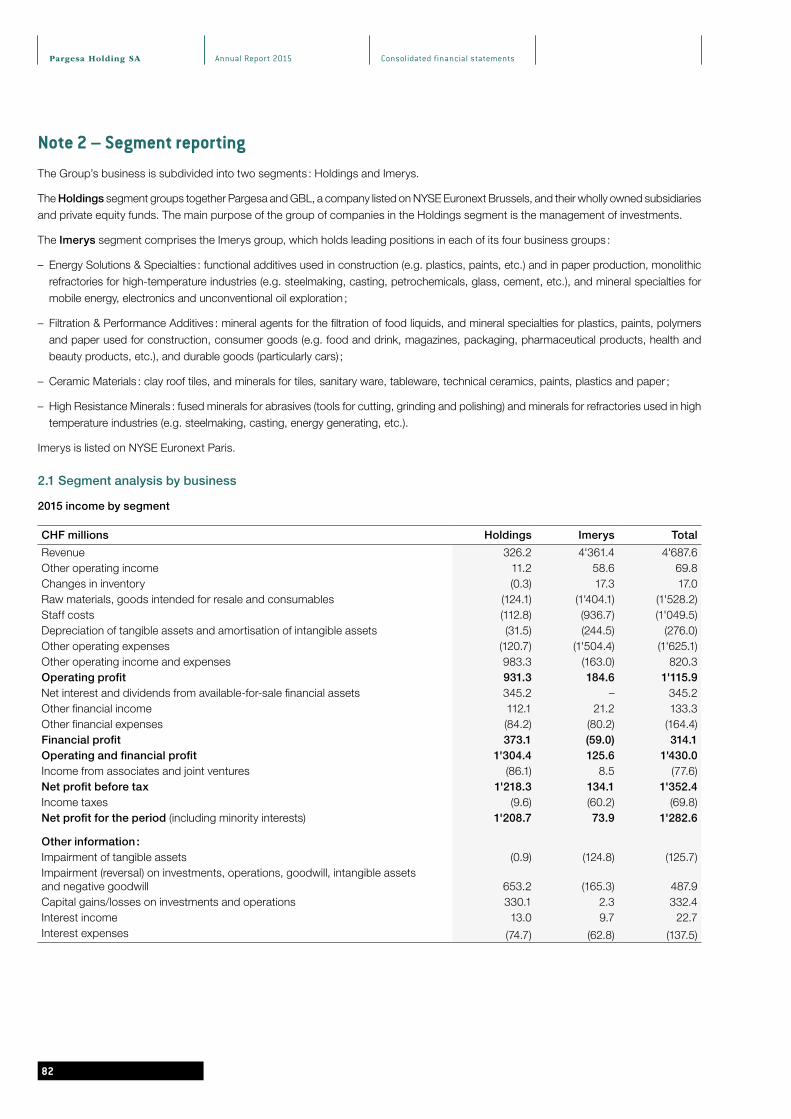
Note 2 – Segment reporting
The Group’s business is subdivided into two segments : Holdings and Imerys.
The Holdings segment groups together Pargesa and GBL, a company listed on NYSE Euronext Brussels, and their wholly owned subsidiaries and private equity funds. The main purpose of the group of companies in the Holdings segment is the management of investments.
The Imerys segment comprises the Imerys group, which holds leading positions in each of its four business groups :
– Energy Solutions & Specialties : functional additives used in construction (e.g. plastics, paints, etc.) and in paper production, monolithic refractories for high-temperature industries (e.g. steelmaking, casting, petrochemicals, glass, cement, etc.), and mineral specialties for mobile energy, electronics and unconventional oil exploration ;
– Filtration & Performance Additives : mineral agents for the filtration of food liquids, and mineral specialties for plastics, paints, polymers and paper used for construction, consumer goods (e.g. food and drink, magazines, packaging, pharmaceutical products, health and beauty products, etc.), and durable goods (particularly cars) ;
– Ceramic Materials : clay roof tiles, and minerals for tiles, sanitary ware, tableware, technical ceramics, paints, plastics and paper ;
– High Resistance Minerals : fused minerals for abrasives (tools for cutting, grinding and polishing) and minerals for refractories used in high temperature industries (e.g. steelmaking, casting, energy generating, etc.).
Imerys is listed on NYSE Euronext Paris.
2.1 Segment analysis by business
2015 income by segment
CHF millions Holdings Imerys Total
Revenue 326.2 4'361.4 4'687.6Other operating income 11.2 58.6 69.8Changes in inventory (0.3) 17.3 17.0Raw materials, goods intended for resale and consumables (124.1) (1'404.1) (1'528.2)Staff costs (112.8) (936.7) (1'049.5)Depreciation of tangible assets and amortisation of intangible assets (31.5) (244.5) (276.0)Other operating expenses (120.7) (1'504.4) (1'625.1)Other operating income and expenses 983.3 (163.0) 820.3Operating profit 931.3 184.6 1'115.9Net interest and dividends from available-for-sale financial assets 345.2 – 345.2Other financial income 112.1 21.2 133.3Other financial expenses (84.2) (80.2) (164.4)Financial profit 373.1 (59.0) 314.1Operating and financial profit 1'304.4 125.6 1'430.0Income from associates and joint ventures (86.1) 8.5 (77.6)Net profit before tax 1'218.3 134.1 1'352.4Income taxes (9.6) (60.2) (69.8)Net profit for the period (including minority interests) 1'208.7 73.9 1'282.6
Other information : Impairment of tangible assets (0.9) (124.8) (125.7)Impairment (reversal) on investments, operations, goodwill, intangible assets and negative goodwill 653.2 (165.3) 487.9Capital gains/losses on investments and operations 330.1 2.3 332.4Interest income 13.0 9.7 22.7Interest expenses (74.7) (62.8) (137.5)
Pargesa Holding SA Annual Report 2015
82
Consolidated financial statements

Pargesa Holding SA Annual Report 2015
8383
Consolidated financial statements
Balance sheet at 31 December 2015
CHF millions Holdings Imerys Total
Long-term assets 14'226.5 4'550.7 18'777.2- of which investments in associates and joint ventures 221.3 137.1 358.4Short-term assets 1'657.3 2'150.5 3'807.8Total assets 15'883.8 6'701.2 22'585.0Long-term liabilities 2'741.0 2'416.2 5'157.2Short-term liabilities 375.3 1'382.6 1'757.9Total liabilities 3'116.3 3'798.8 6'915.1
2014 income by segment
CHF millions Holdings Imerys Total
Revenue 280.0 4'479.0 4'759.0Other operating income 9.5 55.4 64.9Changes in inventory (0.2) 30.9 30.7Raw materials, goods intended for resale and consumables (102.0) (1'487.5) (1'589.5)Staff costs (106.0) (906.4) (1'012.4)Depreciation of tangible assets and amortisation of intangible assets (27.8) (257.5) (285.3)Other operating expenses (102.3) (1'409.8) (1'512.1)Other operating income and expenses 811.8 21.7 833.5Operating profit 763.0 525.8 1'288.8Net interest and dividends from available-for-sale financial assets 384.4 – 384.4Other financial income 18.6 11.4 30.0Other financial expenses (192.8) (66.3) (259.1)Financial profit 210.2 (54.9) 155.3Operating and financial profit 973.2 470.9 1'444.1Income from associates and joint ventures 88.6 3.2 91.8Net profit before tax 1'061.8 474.1 1'535.9Income taxes (5.1) (142.4) (147.5)Net profit for the period (including minority interests) 1'056.7 331.7 1'388.4
Other information :Impairment of tangible assets – (7.3) (7.3)Impairment/reversal on investments, operations, goodwill, intangible assets and negative goodwill (12.7) (37.1) (49.8)Capital gains/losses on investments and operations 824.5 58.8 883.3Interest income 20.1 7.8 27.9Interest expenses (112.4) (57.3) (169.7)
Balance sheet at 31 December 2014
CHF millions Holdings Imerys Total
Long-term assets 15'063.8 4'018.4 19'082.2- of which investments in associates and joint ventures 4'124.6 100.1 4'224.7Short-term assets 2'351.1 2'502.6 4'853.7Total assets 17'414.9 6'521.0 23'935.9Long-term liabilities 2'942.5 2'551.4 5'493.9Short-term liabilities 402.6 998.5 1'401.1
Total liabilities 3'345.1 3'549.9 6'895.0
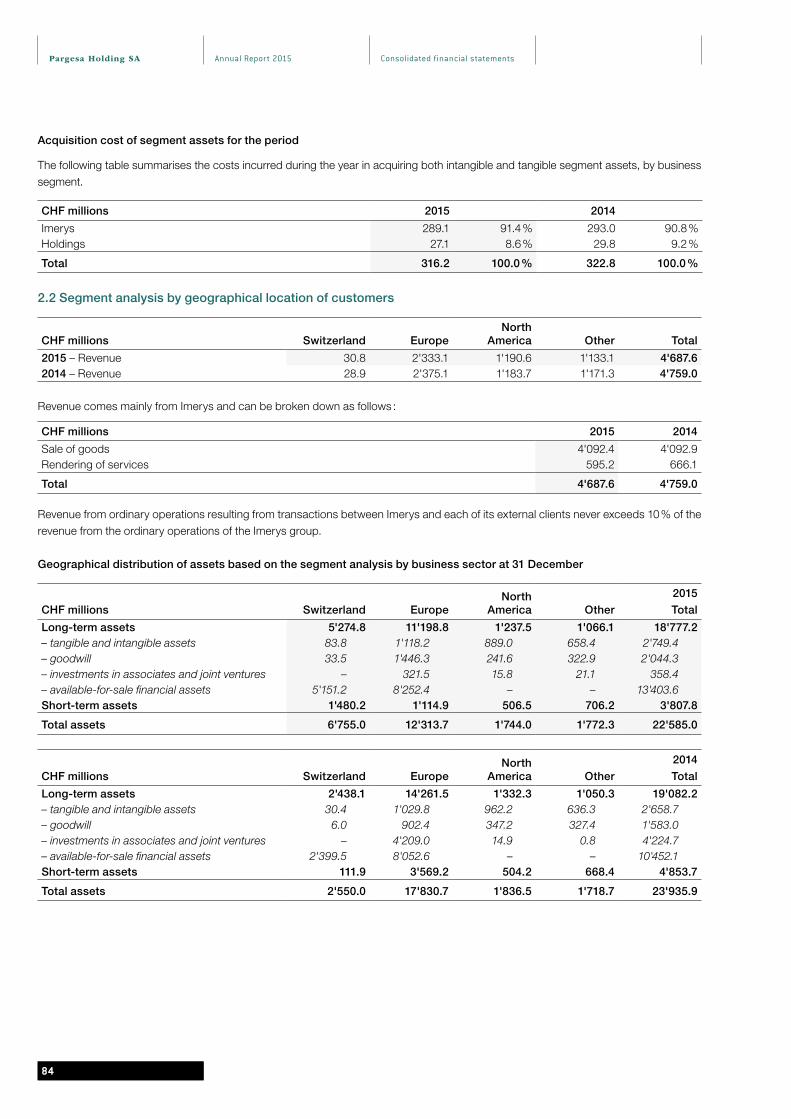
Annual Report 2015Pargesa Holding SA
8484
Consolidated financial statements
Acquisition cost of segment assets for the period
The following table summarises the costs incurred during the year in acquiring both intangible and tangible segment assets, by business segment.
CHF millions 2015 2014
Imerys 289.1 91.4 % 293.0 90.8 %Holdings 27.1 8.6 % 29.8 9.2 %
Total 316.2 100.0 % 322.8 100.0 %
2.2 Segment analysis by geographical location of customers
CHF millions Switzerland EuropeNorth
America Other Total
2015 – Revenue 30.8 2'333.1 1'190.6 1'133.1 4'687.62014 – Revenue 28.9 2'375.1 1'183.7 1'171.3 4'759.0
Revenue comes mainly from Imerys and can be broken down as follows :
CHF millions 2015 2014
Sale of goods 4'092.4 4'092.9Rendering of services 595.2 666.1
Total 4'687.6 4'759.0
Revenue from ordinary operations resulting from transactions between Imerys and each of its external clients never exceeds 10 % of the revenue from the ordinary operations of the Imerys group.
Geographical distribution of assets based on the segment analysis by business sector at 31 December
CHF millions Switzerland EuropeNorth
America Other
2015
Total
Long-term assets 5'274.8 11'198.8 1'237.5 1'066.1 18'777.2– tangible and intangible assets 83.8 1'118.2 889.0 658.4 2'749.4– goodwill 33.5 1'446.3 241.6 322.9 2'044.3– investments in associates and joint ventures – 321.5 15.8 21.1 358.4– available-for-sale financial assets 5'151.2 8'252.4 – – 13'403.6Short-term assets 1'480.2 1'114.9 506.5 706.2 3'807.8
Total assets 6'755.0 12'313.7 1'744.0 1'772.3 22'585.0
CHF millions Switzerland EuropeNorth
America Other
2014
Total
Long-term assets 2'438.1 14'261.5 1'332.3 1'050.3 19'082.2– tangible and intangible assets 30.4 1'029.8 962.2 636.3 2'658.7– goodwill 6.0 902.4 347.2 327.4 1'583.0– investments in associates and joint ventures – 4'209.0 14.9 0.8 4'224.7– available-for-sale financial assets 2'399.5 8'052.6 – – 10'452.1Short-term assets 111.9 3'569.2 504.2 668.4 4'853.7
Total assets 2'550.0 17'830.7 1'836.5 1'718.7 23'935.9

Pargesa Holding SA Annual Report 2015
8585
Consolidated financial statements
Note 3 – Changes in working capital and provisions
CHF millions 2015 2014
(Increase)/decrease in long-term assets 6.3 14.5(Increase)/decrease in inventories and trade receivables 62.6 (91.7)(Increase)/decrease in financial assets held for trading 158.7 (364.2)(Increase)/decrease in other short-term assets 21.0 213.2(Increase)/decrease in pension liabilities and similar benefits (0.2) 1.0(Increase)/decrease in provisions (2.3) 0.7(Increase)/decrease in trade payables and other short-term liabilities (69.2) 58.7
Total 176.9 (167.8)
Note 4 – Other operating income and expensesCapital gains/losses and impairments on investments and operations
CHF millions 2015 2014
Capital gain on disposal of Total shares at GBL 300.7 406.9Translation difference on the reversal of the Total revaluation reserve at Pargesa 133.6 122.8Capital gain on disposal of Suez (formerly Suez Environnement) shares at GBL (see note 5.11) 40.3 176.5Translation difference on the reversal of the Suez revaluation reserve at Pargesa 16.3 78.9Reversal of impairment on Lafarge at GBL (see note 17) 661.9 – Reversal of the Lafarge revaluation and hedging reserve and the translation reserve at GBL (see note 17) (190.6) – Translation difference on the reversal of the Lafarge revaluation and hedging reserve at Pargesa (1.9) – Impairment on ENGIE (formerly GDF Suez) (see notes 5.5 and 8) (33.8) – Translation difference on the impairment on ENGIE at Pargesa 30.8 – Capital gains realised by private equity funds 31.7 36.1Impairment on private equity funds at Pargesa and GBL (see notes 5.5 and 8) (1.6) (8.6)Goodwill impairment at Imerys (see notes 8 and 12) (126.8) (36.6)Miscellaneous (40.3) 57.5
Total 820.3 833.5
In 2015, in addition to the CHF 300.7 million capital gain on the disposal of Total shares at GBL, Pargesa recorded an historical exchange rate gain of CHF 133.6 million as a result of the reversal of the corresponding revaluation reserve related to Total at Pargesa. Pargesa also recorded an historical exchange rate gain of CHF 16.3 million as a result of the reversal of the Suez revaluation reserve at Pargesa, in addition to the CHF 40.3 million capital gain on the delivery of Suez shares following the partial redemption of the Suez exchangeable bond at GBL. The reversal of the impairment on Lafarge at GBL represents : the partial reversal at 30 June 2015 of the impairment previously recorded on Lafarge, which corresponded to the difference in the value of the Lafarge shares held by GBL at that date valued at (i) the market price on 30 June 2015 and (ii) the last equity-accounted value of the holding, i.e. EUR 403.1 million (CHF 430.2 million) ; and the additional reversal of the impairment previously recorded on Lafarge following the loss of influence in the new LafargeHolcim group since 10 July 2015 and its classification as an available-for-sale financial asset, corresponding to the change in market value of the holding between (i) 30 June 2015 and (ii) 10 July 2015, i.e. EUR 217.1 million (CHF 231.7 million). The total reversal amounted to CHF 661.9 million (see note 17).The reversal of the Lafarge revaluation and translation reserve followed the LafargeHolcim merger and the recognition in the income statement of the other comprehensive income/(expense) attributable to Lafarge and recorded in the equity of GBL since Lafarge was first accounted for using the equity method on 1 January 2008. This had a negative impact of CHF 192.5 million on GBL's net income.In 2015, the impairment of CHF 33.8 million on ENGIE at GBL was partly offset at Pargesa by an historical exchange rate gain of CHF 30.8 million following the reversal of the corresponding revaluation reserve related to ENGIE. In 2015, the line item “miscellaneous” included impairment on tangible assets at Imerys amounting to CHF 38.5 million.
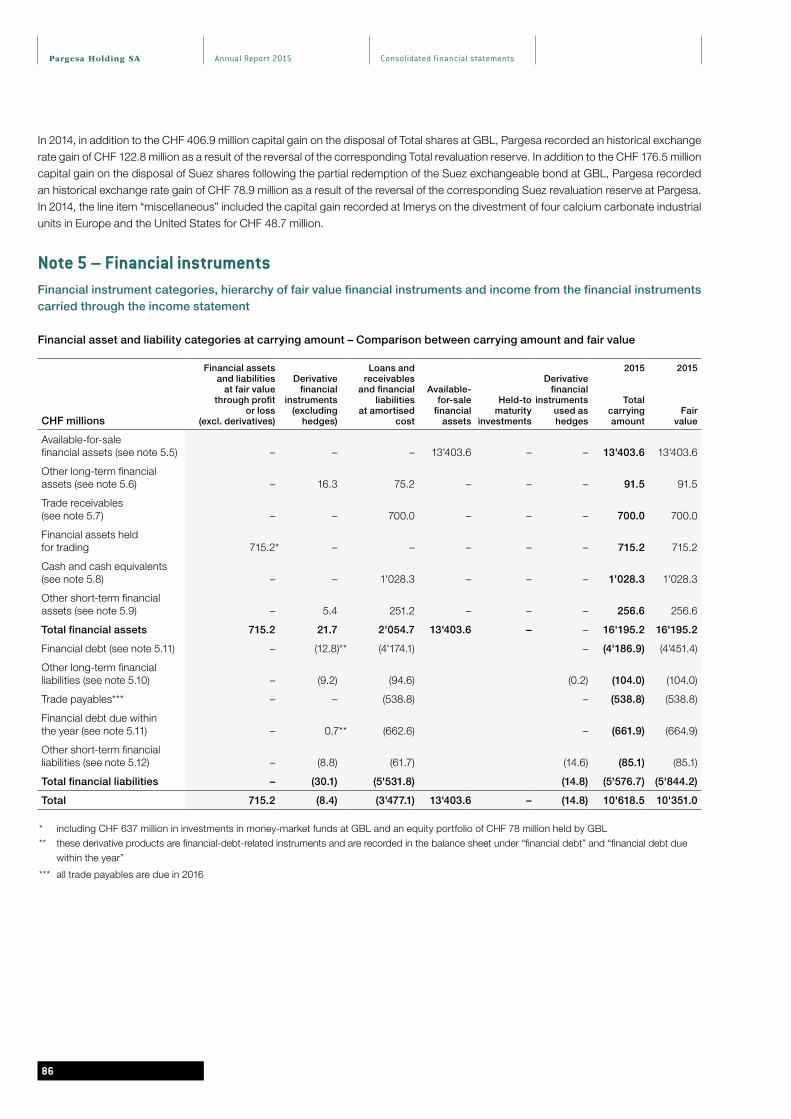
8686
In 2014, in addition to the CHF 406.9 million capital gain on the disposal of Total shares at GBL, Pargesa recorded an historical exchange rate gain of CHF 122.8 million as a result of the reversal of the corresponding Total revaluation reserve. In addition to the CHF 176.5 million capital gain on the disposal of Suez shares following the partial redemption of the Suez exchangeable bond at GBL, Pargesa recorded an historical exchange rate gain of CHF 78.9 million as a result of the reversal of the corresponding Suez revaluation reserve at Pargesa. In 2014, the line item “miscellaneous” included the capital gain recorded at Imerys on the divestment of four calcium carbonate industrial units in Europe and the United States for CHF 48.7 million.
Note 5 – Financial instrumentsFinancial instrument categories, hierarchy of fair value financial instruments and income from the financial instruments carried through the income statement
Financial asset and liability categories at carrying amount – Comparison between carrying amount and fair value
CHF millions
Financial assets and liabilities
at fair value through profit
or loss (excl. derivatives)
Derivative financial
instruments (excluding
hedges)
Loans and receivables
and financial liabilities
at amortised cost
Available- for-sale
financial assets
Held-to maturity
investments
Derivative financial
instruments used as hedges
2015
Total carrying amount
2015
Fair value
Available-for-sale financial assets (see note 5.5) – – – 13'403.6 – – 13'403.6 13'403.6
Other long-term financial assets (see note 5.6) – 16.3 75.2 – – – 91.5 91.5
Trade receivables (see note 5.7) – – 700.0 – – – 700.0 700.0
Financial assets held for trading 715.2* – – – – – 715.2 715.2
Cash and cash equivalents (see note 5.8) – – 1'028.3 – – – 1'028.3 1'028.3
Other short-term financial assets (see note 5.9) – 5.4 251.2 – – – 256.6 256.6
Total financial assets 715.2 21.7 2'054.7 13'403.6 – – 16'195.2 16'195.2
Financial debt (see note 5.11) – (12.8)** (4'174.1) – (4'186.9) (4'451.4)
Other long-term financial liabilities (see note 5.10) – (9.2) (94.6) (0.2) (104.0) (104.0)
Trade payables*** – – (538.8) – (538.8) (538.8)
Financial debt due within the year (see note 5.11) – 0.7** (662.6) – (661.9) (664.9)
Other short-term financial liabilities (see note 5.12) – (8.8) (61.7) (14.6) (85.1) (85.1)
Total financial liabilities – (30.1) (5'531.8) (14.8) (5'576.7) (5'844.2)
Total 715.2 (8.4) (3'477.1) 13'403.6 – (14.8) 10'618.5 10'351.0
* including CHF 637 million in investments in money-market funds at GBL and an equity portfolio of CHF 78 million held by GBL** these derivative products are financial-debt-related instruments and are recorded in the balance sheet under “financial debt” and “financial debt due
within the year”
*** all trade payables are due in 2016
Annual Report 2015Pargesa Holding SA Consolidated financial statements

8787
CHF millions
Financial assets and liabilities
at fair value through profit
or loss (excl. derivatives)
Derivative financial
instruments (excluding
hedges)
Loans and receivables
and financial liabilities
at amortised cost
Available- for-sale
financial assets
Held-to maturity
investments
Derivative financial
instruments used as hedges
2014
Total carrying amount
2014
Fair value
Available-for-sale financial assets (see note 5.5) – – – 10'452.1 – – 10'452.1 10'452.1
Other long-term financial assets (see note 5.6) – 14.1 88.8 – – – 102.9 102.9
Trade receivables (see note 5.7) – – 713.1 – – – 713.1 713.1
Financial assets held for trading 997.2* – – – – – 997.2 997.2
Cash and cash equivalents (see note 5.8) – – 1’788.7 – – – 1'778.7 1'778.7
Other short-term financial assets (see note 5.9) – 7.3 60.4 – 204.3 – 272.0 272.0
Total financial assets 997.2 21.4 2'641.0 10'452.1 204.3 – 14'316.0 14'316.0
Financial debt (see note 5.11) – (10.0)** (4'441.0) – (4'451.0) (4'872.1)
Other long-term financial liabilities (see note 5.10) – (215.3) (8.3) – (223.6) (223.6)
Trade payables – – (540.8) – (540.8) (540.8)
Financial debt due within the year (see note 5.11) – (4.3)** (244.4) – (248.7) (264.7)
Other short-term financial liabilities (see note 5.12) – (42.0) (46.2) (14.4) (102.6) (102.6)
Total financial liabilities – (271.6) (5'280.7) (14.4) (5'566.7) (6'003.8)
Total 997.2 (250.2) (2'639.7) 10'452.1 204.3 (14.4) 8'749.3 8'312.2
* including CHF 876 million in investments in money-market funds at GBL and an equity portfolio of CHF 121 million held by GBL
** these derivative products are financial-debt-related instruments and are recorded in the balance sheet under “financial debt” and “financial debt due within the year”
Pargesa Holding SA Annual Report 2015 Consolidated financial statements
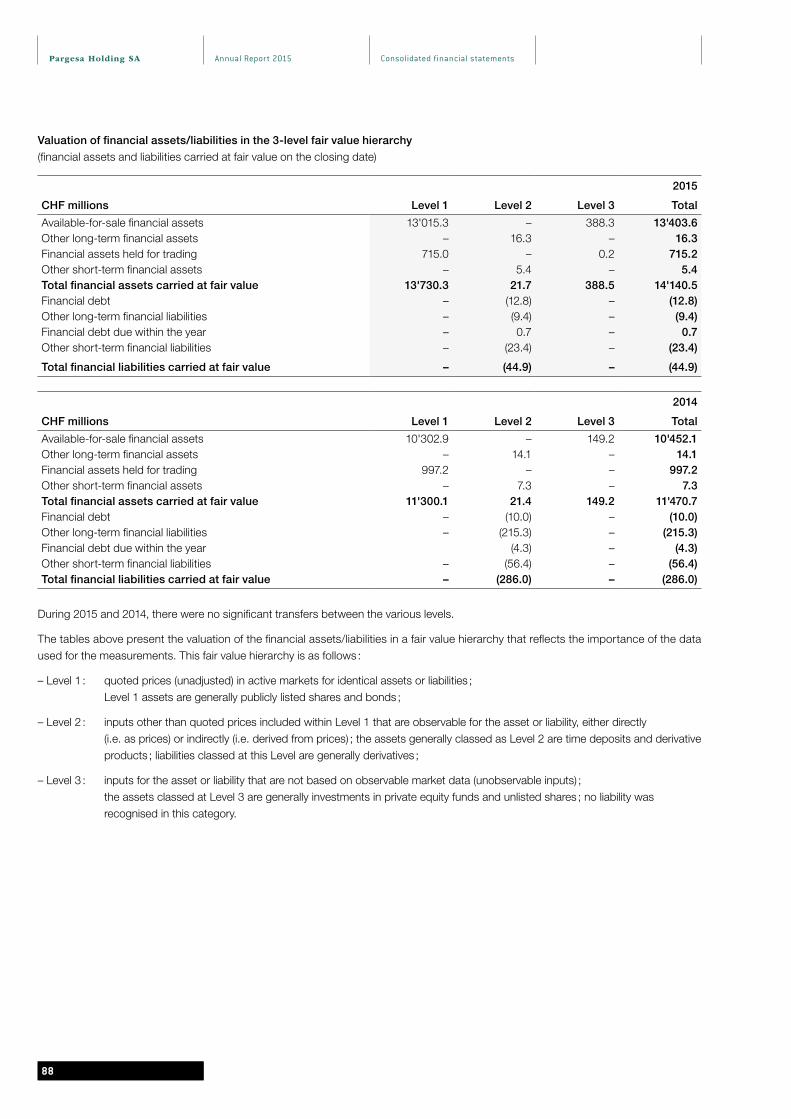
8888
Valuation of financial assets/liabilities in the 3-level fair value hierarchy
(financial assets and liabilities carried at fair value on the closing date)
2015
CHF millions Level 1 Level 2 Level 3 Total
Available-for-sale financial assets 13'015.3 – 388.3 13'403.6Other long-term financial assets – 16.3 – 16.3Financial assets held for trading 715.0 – 0.2 715.2Other short-term financial assets – 5.4 – 5.4Total financial assets carried at fair value 13'730.3 21.7 388.5 14'140.5Financial debt – (12.8) – (12.8)Other long-term financial liabilities – (9.4) – (9.4)Financial debt due within the year – 0.7 – 0.7Other short-term financial liabilities – (23.4) – (23.4)
Total financial liabilities carried at fair value – (44.9) – (44.9)
2014
CHF millions Level 1 Level 2 Level 3 Total
Available-for-sale financial assets 10'302.9 – 149.2 10'452.1Other long-term financial assets – 14.1 – 14.1Financial assets held for trading 997.2 – – 997.2Other short-term financial assets – 7.3 – 7.3Total financial assets carried at fair value 11'300.1 21.4 149.2 11'470.7Financial debt – (10.0) – (10.0)Other long-term financial liabilities – (215.3) – (215.3)Financial debt due within the year (4.3) – (4.3)Other short-term financial liabilities – (56.4) – (56.4)Total financial liabilities carried at fair value – (286.0) – (286.0)
During 2015 and 2014, there were no significant transfers between the various levels.
The tables above present the valuation of the financial assets/liabilities in a fair value hierarchy that reflects the importance of the data used for the measurements. This fair value hierarchy is as follows :
– Level 1 : quoted prices (unadjusted) in active markets for identical assets or liabilities ; Level 1 assets are generally publicly listed shares and bonds ;
– Level 2 : inputs other than quoted prices included within Level 1 that are observable for the asset or liability, either directly (i.e. as prices) or indirectly (i.e. derived from prices) ; the assets generally classed as Level 2 are time deposits and derivative products ; liabilities classed at this Level are generally derivatives ;
– Level 3 : inputs for the asset or liability that are not based on observable market data (unobservable inputs) ; the assets classed at Level 3 are generally investments in private equity funds and unlisted shares ; no liability was recognised in this category.
Annual Report 2015Pargesa Holding SA Consolidated financial statements
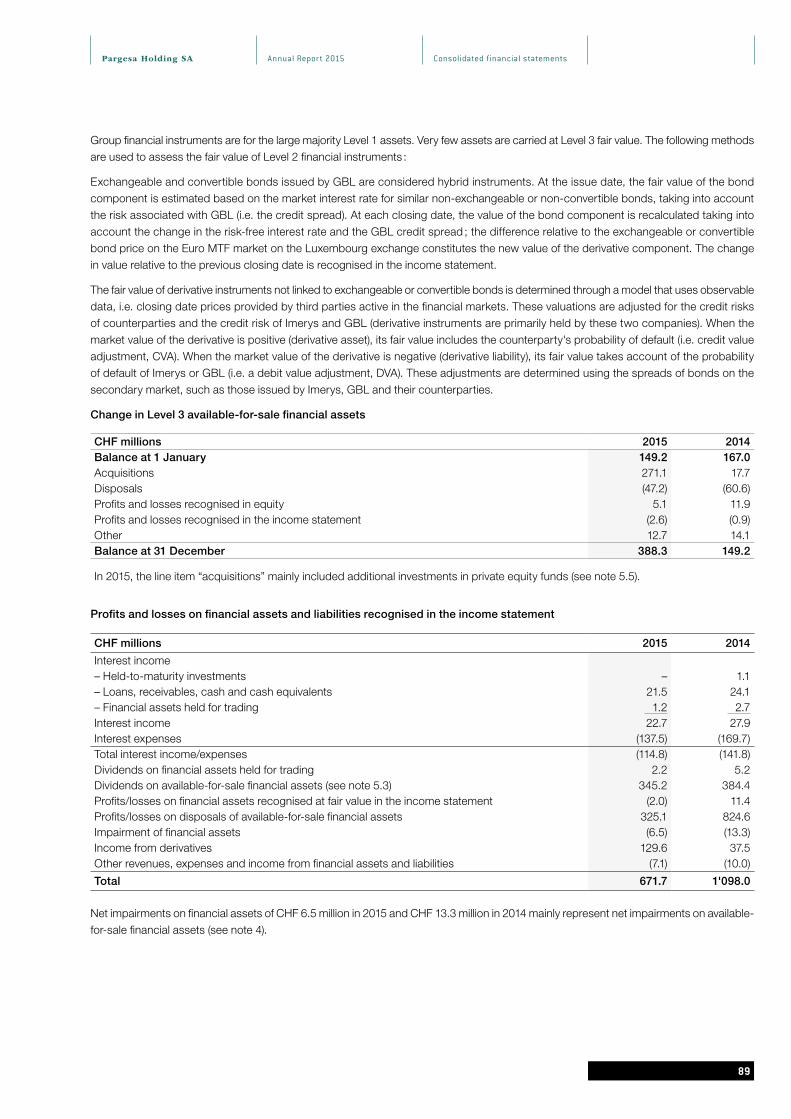
8989
Group financial instruments are for the large majority Level 1 assets. Very few assets are carried at Level 3 fair value. The following methods are used to assess the fair value of Level 2 financial instruments :
Exchangeable and convertible bonds issued by GBL are considered hybrid instruments. At the issue date, the fair value of the bond component is estimated based on the market interest rate for similar non-exchangeable or non-convertible bonds, taking into account the risk associated with GBL (i.e. the credit spread). At each closing date, the value of the bond component is recalculated taking into account the change in the risk-free interest rate and the GBL credit spread ; the difference relative to the exchangeable or convertible bond price on the Euro MTF market on the Luxembourg exchange constitutes the new value of the derivative component. The change in value relative to the previous closing date is recognised in the income statement.
The fair value of derivative instruments not linked to exchangeable or convertible bonds is determined through a model that uses observable data, i.e. closing date prices provided by third parties active in the financial markets. These valuations are adjusted for the credit risks of counterparties and the credit risk of Imerys and GBL (derivative instruments are primarily held by these two companies). When the market value of the derivative is positive (derivative asset), its fair value includes the counterparty's probability of default (i.e. credit value adjustment, CVA). When the market value of the derivative is negative (derivative liability), its fair value takes account of the probability of default of Imerys or GBL (i.e. a debit value adjustment, DVA). These adjustments are determined using the spreads of bonds on the secondary market, such as those issued by Imerys, GBL and their counterparties.
Change in Level 3 available-for-sale financial assets
CHF millions 2015 2014Balance at 1 January 149.2 167.0Acquisitions 271.1 17.7Disposals (47.2) (60.6)Profits and losses recognised in equity 5.1 11.9Profits and losses recognised in the income statement (2.6) (0.9)Other 12.7 14.1Balance at 31 December 388.3 149.2
In 2015, the line item “acquisitions” mainly included additional investments in private equity funds (see note 5.5).
Profits and losses on financial assets and liabilities recognised in the income statement
CHF millions 2015 2014
Interest income– Held-to-maturity investments – 1.1– Loans, receivables, cash and cash equivalents 21.5 24.1– Financial assets held for trading 1.2 2.7Interest income 22.7 27.9Interest expenses (137.5) (169.7)Total interest income/expenses (114.8) (141.8)Dividends on financial assets held for trading 2.2 5.2Dividends on available-for-sale financial assets (see note 5.3) 345.2 384.4Profits/losses on financial assets recognised at fair value in the income statement (2.0) 11.4Profits/losses on disposals of available-for-sale financial assets 325.1 824.6Impairment of financial assets (6.5) (13.3)Income from derivatives 129.6 37.5Other revenues, expenses and income from financial assets and liabilities (7.1) (10.0)
Total 671.7 1'098.0
Net impairments on financial assets of CHF 6.5 million in 2015 and CHF 13.3 million in 2014 mainly represent net impairments on available-for-sale financial assets (see note 4).
Pargesa Holding SA Annual Report 2015 Consolidated financial statements

9090
Note 5.1 – Nature and extent of risks arising from financial instruments
5.1.1 Credit risks
The Group has little exposure to credit risks because of the nature of its operations. Group credit risks are associated with its cash deposits and with risks incurred by Imerys, whose accounts are consolidated into Pargesa.
At Pargesa, cash is generally deposited over the short term with banking institutions that are very rigorously selected.
At GBL, the risk of default by a counterparty derives for the most part from its deposits, drawdowns on credit lines, hedging transactions, stock market transactions, derivative financial instruments and other transactions conducted with banks or financial intermediaries, including pledging of collateral. GBL seeks to mitigate this risk by diversifying the types of investment and the counterparties and by constantly monitoring their financial situation. At 31 December 2015, cash and cash equivalents were for the most part placed in current accounts at a limited number of top-rated banks, in money-market funds selected based on their size, volatility and liquidity, and in investment-grade short-term commercial paper. Financial contracts (including ISDAs) are reviewed in-house by the legal team.
At Imerys, credit risk relates to the risk that a debtor will not repay its debt on the due date. This risk, which mainly affects the loans and receivables category, is monitored within each business entity. This monitoring is primarily based on the analysis of receivables that are past due and may be supplemented by a more in-depth investigation of solvency. Imerys group entities may be led to hedge credit risk by taking out credit insurance policies or obtaining guarantees. At the balance sheet date, loans and receivables are reduced to their recoverable value through individually measured impairment. At 31 December 2015, the impairment on loans and receivables amounted to CHF 82.6 million (CHF 94.3 million at 31 December 2014). Imerys’ maximum exposure to credit risk before credit insurance and guarantees, i.e. the carrying amount of its receivables, was thus CHF 938.2 million at 31 December 2015 (CHF 936.7 million at 31 December 2014). Details of trade receivables and their terms are given in note 5.7.
5.1.2 Liquidity risks
The financial liability repayment schedule groups the financial liabilities at every level of the companies consolidated into the financial statements of the Group, i.e. Pargesa, GBL and Imerys. The repayment schedule for the Group’s financial debt is provided in note 5.11.
Liquidity risk is managed at each level of the Group.
At 31 December 2015, Pargesa had a positive cash position of CHF 52.8 million (CHF 70.1 million at 31 December 2014). At 31 December 2015, Pargesa also held short-term bank deposits of CHF 190.0 million, including CHF 145.0 million to repay the bond maturing in November 2016. Pargesa’s financial liabilities were made up of three bonds : a 2.5 % bond maturing in November 2016 for CHF 145 million (net of buy back of CHF 5 million in par value in 2015), a 1.5 % bond maturing in December 2018 for CHF 250 million, and a 0.875 % bond maturing in April 2024 for CHF 150 million (see note 5.11). Pargesa had no bank debt at 31 December 2015 (CHF 0 million at 31 December 2014). Redemption of the 1.5 % and 0.875 % bond issues could require refinancing in the market.
At 31 December 2015, GBL had a positive cash position of CHF 524.6 million (CHF 919.3 million at 31 December 2014). Its financial liabilities comprised : a bond exchangeable for ENGIE shares, issued in 2013 and maturing in 2017 (see note 5.11) for an amount of EUR 1 billion in par value ; a bond convertible into GBL shares, issued in 2013 and maturing in 2018 (see note 5.11) for an amount of EUR 428.4 million in par value and redeemable at 105.14 % of par value ; and a 4 % bond issued in June 2010 and amounting to EUR 350 million (see note 5.11). The conversion of the exchangeable and convertible bonds is secured by existing ENGIE shares held in the portfolio, as well as GBL treasury shares. If the exchangeable and convertible bonds have not been converted at maturity, or at the time of the redemption for the 4 % bond issue, this would create the need for refinancing on the markets. This could expose GBL to liquidity risk, which is mitigated by the possibility of using various internal and external sources of funding, in particular the possibility for GBL to remit ENGIE and GBL shares to the bondholders (see note 5.11). GBL (excluding private equity) had no bank debts (see note 5.11) at 31 December 2015 (CHF 0 million at 31 December 2014). Bank debts relating to private equity amounted to CHF 203.2 million at 31 December 2015 (CHF 105.0 million at 31 December 2014).
At 31 December 2015, Imerys had a commercial paper programme capped at CHF 869.0 million (CHF 962.1 million at 31 December 2014), rated P-2 by Moody’s (same rating at 31 December 2014). At year-end, commercial paper had been issued for a total of CHF 377.6 million (CHF 0 million at 31 December 2014). At 31 December 2015, Imerys had banking facilities at its disposal of CHF 1’548.0 million (CHF 1’629.5 million at 31 December 2014), part of which secured the CHF 377.6 million (CHF 0 million at 31 December 2014) in commercial paper issued. In 2015, Imerys updated its Euro Medium Term Notes (EMTN) programme. The programme represents a total of EUR 1 billion (CHF 1.1 billion) and authorises the issue of securities similar to ordinary bonds for terms of between one month and 30 years. At year-end, notes had been issued for a total of CHF 1’035.7 million (CHF 1’140.3 million at 31 December 2014).
Annual Report 2015Pargesa Holding SA Consolidated financial statements

9191
For part of its funding, Imerys is required to respect a number of financial ratios. The main restrictive terms and conditions attached to some of its bilateral bank credit facilities and to certain bonds issued in the form of private placements are as follows :
• Assigned objectives : general financial requirements of Imerys• Commitments in terms of financial ratios :
depending on the financing contracts concerned, the ratio of consolidated net financial debt to consolidated equity must be less than 1.50 or 1.60 at the end of each half-yearly or yearly consolidated reporting period. At 31 December 2015, the ratio was 0.55 (0.35 at 31 December 2014) ;depending on the financing contracts concerned, the ratio of consolidated net financial debt to consolidated EBITDA over the previous 12 months must be at or below 3.75 at the end of each half-yearly or yearly consolidated reporting period. At 31 December 2015, the ratio was 1.99 (1.29 at 31 December 2014).
• Absence of any collateral in favour of the lenders
Failure to comply with the above obligations in relation to any of the financing contracts concerned could lead to the cancellation of the available funds and a requirement, at the request of one or more of the lenders concerned, to repay the amount of the corresponding financial debt immediately. With the exception of two contracts, the Imerys financing contracts do not provide for cross default should a mandatory financial ratio applicable to one of these contracts not be complied with. At 31 December 2015, Imerys had a Moody's long-term rating of Baa2 with a stable outlook (same rating at 31 December 2014).
Financial resources are the main variable at Imerys’ disposal for the adjustment of its financing capacity. This capacity is either financial debt in the form of securities or financing commitments granted by top-rated banking institutions. The medium-term financial resources furnished by the bilateral bank credit facilities can be used during very brief drawdown periods (one to 12 months) while remaining available over longer terms (five years). Imerys’ financial resources stood at EUR 2.9 billion, or CHF 3.2 billion, at 31 December 2015 (EUR 2.8 billion, or CHF 3.4 billion, at 31 December 2014). Imerys manages its total financial resources by regularly calculating the difference between its total financial resources and the sums it has used in order to determine the available financial resources it has access to.
5.1.3 Market risks
Risk management and hedging activities are described in note 5.2.
Market price sensitivity
The following sensitivity analysis is based on the exposure to the risks of stock market price fluctuation of the main available-for-sale financial assets, i.e. LafargeHolcim, Total, SGS, Pernod Ricard, ENGIE, adidas, Umicore and Ontex shares, which, at 31 December 2015, accounted for 97 % of total available-for-sale financial assets (98 % at 31 December 2014), 80 % of total financial assets (71 % at 31 December 2014) and 58 % of total balance sheet assets (43 % at 31 December 2014).
CHF millions
2015 2014Impact of
a rise in stock market
prices
Impact of a fall in
stock market prices
Impact of a rise in
stock market prices
Impact of a fall in
stock market prices
5 % change in stock market pricesImpact on equity (including minority interests) +650.7 –650.7 +510.0 –510.0Impact on equity attributable to the Group +338.1 –338.1 +265.1 –265.1
The sensitivity analysis essentially covers equity because changes in the value of the main available-for-sale financial assets are recorded directly in equity, except for impairments, which are recognised in the income statement.The above sensitivity analysis should be viewed with caution, as in some cases a 5 % drop in the market price of certain available-for-sale financial assets could lead to an impairment being recognised in the income statement.
Pargesa Holding SA Annual Report 2015 Consolidated financial statements

9292
Interest rate sensitivity
The exposure of Pargesa's financial liabilities to interest rate fluctuations is not relevant because Pargesa mainly has long-term, fixed-rate debt. On 18 December 2014, the Swiss National Bank (SNB) introduced a negative interest rate of 0.25 % on sight deposit accounts, with the aim of taking the three-month Libor into negative territory. Starting on 22 January 2015, negative interest was levied on assets in sight deposit accounts exceeding a given exemption threshold. On 15 January 2015, the negative interest rate was increased to –0.75 %. As a result of the SNB's decision, a certain number of banks also introduced a negative interest rate on client assets held in Swiss francs. Pargesa's cash position (cash and cash equivalents, together with short-term bank deposits) amounted to CHF 242.8 million at 31 December 2015. Pargesa has not, for the moment, been majorly affected by the introduction of negative interest rates.
Owing to its financial situation, GBL is exposed to interest rate fluctuations, which impact both its debt and its cash flows. GBL's total debt is primarily at a fixed rate. GBL decided to place most of its cash at variable rates so that it would be readily available at all times, thereby contributing to the Group’s flexibility and protection in the event of investment or external risks. This cash is monitored closely based on changes in market parameters and in GBL’s own constraints. GBL continues to pay close attention to the trend in interest rates and to their significance in the overall economic environment. A change in interest rates would have a limited impact on income, as the vast majority of GBL's financial liabilities have a fixed rate.
For Imerys, a 0.5 % rise in the interest rates on net financial debt after interest-rate derivatives would increase the 2015 financial profit of the Pargesa Group by CHF 0.2 million (CHF 0.1 million in 2014) for the ineffective portion of derivative instruments qualified as cash flow hedges and derivative instruments not eligible for hedge accounting. A 0.5 % fall in interest rates would increase the 2015 financial profit of the Pargesa Group by CHF 0.2 million (CHF 0.1 million in 2014). A 0.5 % rise in interest rates would have no impact on shareholders’ equity (including minority interests) for the effective portion of derivative instruments qualified as cash flow hedges (no impact in 2014 either). A 0.5 % fall in interest rates would have no impact on shareholders’ equity (including minority interests) (no impact in 2014 either).
Energy price sensitivity
Imerys is exposed to risks relating to the price of the types of energy involved in the production cycle of its operations, mainly natural gas and electricity, and coal to a lesser extent. Energy price risk is hedged by forward contracts and by options-based instruments. These instruments qualify as cash flow hedges. According to Imerys’ estimates, a 10 % increase in the natural gas and Brent indices at 31 December 2015 would increase Pargesa Group shareholders’ equity (including minority interests) by CHF 12.2 million (CHF +3.1 million in 2014), while a 10 % decrease would increase equity by CHF 3.7 million (CHF –2.8 million in 2014), in line with the change in the effective portion of the derivative instruments qualified as cash flow hedges. The change in the ineffective part recognised in the income statement would not be significant.
Exchange rate sensitivity
At Group level, Pargesa has practically no operational exposure to transactional exchange rate risks impacting Group income, with the exception of those relating to the operations of Imerys.
GBL is exposed to exchange rate risks that could have an impact on the value of its portfolio, through its listed foreign currency holdings and changes in the dividends it receives. GBL hedges against the risk relating to announced dividends but remains exposed to exchange rate fluctuations directly affecting its portfolio. Nevertheless diversification across regions and sectors reduces the risk of exposure to one foreign currency in particular.
Imerys recommends that its operating entities carry out their transactions in their functional currencies as far as possible. A 10 % increase in the exchange rates for all the foreign currencies of the derivative instruments in the Imerys portfolio at 31 December 2015 would increase Pargesa Group shareholders’ equity (including minority interests) by CHF 7.9 million (CHF –8.4 million at 31 December 2014), while a 10 % decrease would increase equity by CHF 20.6 million (CHF +15.0 million at 31 December 2014), in line with the change in the effective part of the derivative instruments qualifying as cash flow hedges.
A 10 % increase in the exchange rates for all the foreign currencies of the derivative instruments in the Imerys portfolio at 31 December 2015 would decrease Pargesa Group income (including minority interests) by CHF 2.5 million in 2015 (CHF +2.2 million in 2014), while a 10 % decrease would reduce income by CHF 3.0 million (CHF +3.3 million in 2014), in line with the change in the ineffective part of the derivative instruments qualifying as cash flow hedges and in the fair value of the derivative instruments not eligible for hedge accounting.
GBL and Imerys' results are expressed in euros and consolidated in Swiss francs at the average conversion rate for the financial year, which produces a translation risk. A 1 % change in the EUR/CHF exchange rate would have an impact of CHF 11.3 million (CHF 12.1 million in 2014) on the 2015 consolidated income of Pargesa Group (including minority interests).
Annual Report 2015Pargesa Holding SA Consolidated financial statements
9393
As indicated in note 5.2, Pargesa is a company whose direct investments are essentially represented by its shareholdings in GBL, whose accounting currency is the euro, whereas the functional currency for the Pargesa financial statements is the Swiss franc. The impact on balance sheet items of fluctuations in the EUR/CHF exchange rate is recorded in the translation reserve in equity, and thus has no impact on earnings. A 1 % change in the EUR/CHF exchange rate would have an impact on equity (including minority interests) of approximately CHF 151 million in the 2015 financial statements of Pargesa Group (CHF 166 million in 2014).
The impact on Imerys of fluctuations between the euro and the currencies (such as the US dollar and pound sterling) involved in the translation of the financial statements of the subsidiaries of Imerys, is also recorded in the “translation reserve” in equity, in the Pargesa Group financial statements.
Note 5.2 – Derivative financial instruments
5.2.1 Risk management and hedging
In view of the specific nature of each of the companies consolidated in the Group’s financial statements, and their very different operations – Pargesa and GBL have financial businesses, while Imerys is industrial – risk is managed independently by each entity.
Pargesa is a company whose direct investments are essentially represented by its shareholding in GBL, a listed company whose accounting currency is the euro, whereas the functional currency for the Pargesa financial statements is the Swiss franc. Pargesa’s exposure to currency fluctuations between the euro and the Swiss franc is not hedged on the balance sheet or the income statement. Pargesa does not have substantial exposure to interest rate risks, as at 31 December 2015 its financial liabilities mainly comprised three bond issues for which the interest rates are fixed. In addition, Pargesa's cash position has not, for the moment, been majorly affected by the introduction of negative interest rates on the Swiss franc.
GBL is a holding company whose accounts are presented in euros, which is also the currency in which its assets and liabilities are denominated. 60 % of the assets on GBL’s balance sheet are shareholdings with the euro as the reference currency (excluding SGS, which is in Swiss francs), almost all of which are listed on the stock exchange, and the rest is cash invested in euros. 71 % of assets are financed by equity. GBL uses financial instruments and derivatives. These transactions are carried out within the framework of well-established documentation and pre-defined packages. They are subject to precise and appropriate prior analyses, systematic monitoring and active management when necessary. GBL has also put in place strict rules in terms of appropriate segregation of duties and internal approval processes. Every financial transaction requires two signatures and is systematically reviewed by the finance and legal departments.
Imerys manages its own risks relating to operational transactions (i.e. transactional exchange rate risks and energy price risks), foreign investments (i.e. risks relating to the translation of financial statements) and financing (i.e. transactional exchange rate risks and interest rate risks). Derivatives are only used to hedge certain risks. Imerys has no speculative positions. Derivatives are traded centrally by Imerys, on over-the-counter markets and with top-rated financial institutions. Imerys does not allow companies within the group to subscribe directly to derivative instruments outside the Imerys group.Imerys hedges part of its net investments in its foreign operations by borrowings specifically allocated to their long-term financing and through the proportion of its financial debt denominated in currencies other than the euro. The translation gains or losses generated on these loans and borrowings, which qualify as hedges of net investments in foreign operations, are recognised in equity in order to eliminate, to a certain extent, the translation gains or losses on the net investments hedged. On that basis, Imerys carried out currency exchange swaps for a notional amount revalued at 31 December 2015 at EUR 172.4 million (CHF 187.3 million) and EUR 97.4 million (CHF 117.1 million) at 31 December 2014.Where necessary, transactional exchange rate risk at Imerys may be hedged in isolated cases by forward foreign exchange contracts, foreign currency swaps and foreign exchange options. These instruments are used to hedge highly probable budgetary flows. The relevant hedges qualify as cash flow hedges.Interest rate risk is managed, in relation to the Imerys group’s consolidated net financial debt, with the aim of guaranteeing its cost in the medium term. Imerys group’s policy is to obtain financing mainly in euros, at fixed rates. Fixed-rate medium-term bonds are changed into variable-rate bonds through interest-rate swaps. At 31 December 2015, Imerys held a number of derivative instruments intended to hedge part of its variable-rate debt. Those instruments include interest rate swaps and options, including caps, floors, swaptions and forward contracts.In view of the trend in interest rates expected in 2015, Imerys established a fixed rate of interest for some of its future financial debt with a variety of maturities.
Pargesa Holding SA Annual Report 2015 Consolidated financial statements

9494
To deal with energy price risk, Imerys is diversified in terms of its geographical locations and sources of supply. Energy price risk is the risk that a payable cash flow for an energy purchase is likely to be decreased as a result of a rise in the market price. Imerys endeavours to pass on energy price rises in the selling prices of its products. In addition, management of natural gas price risk, both in Europe and in the United States, is centralised, with Imerys group's Treasury responsible for establishing the necessary framework and resources to apply a common management policy including, among other things, appropriate use of the financial instruments available on these markets. Energy price risk is hedged by forward contracts and options-based instruments. At 31 December 2015, Imerys had various hedging transactions for periods not exceeding one year in order to manage energy price risk.
Note 5.2.2 – Derivative financial instruments
Fair value of short-term and long-term derivative financial instruments
2015 2014 2015 2014 2015 2014CHF millions Asset positions Liability positions Net positions
Short-term instruments 5.5 (1) 7.3 (1) (23.4) (3) (56.4) (3) (17.9) (49.1)Long-term instruments 16.4 (2) 14.1 (2) (92.3) (4) (215.3) (4) (75.9) (201.2)
Total 21.9 21.4 (115.7) (271.7) (93.8) (250.3)
(1) see note 5.9(2) see note 5.6(3) see note 5.12(4) see note 5.10
Notional amounts of short-term and long-term derivative financial instruments
2015 2014 2015 2014CHF millions Asset positions Liability positions
469.9 300.3 2'294.2 2'317.5
Maturities of derivative financial instruments at 31 December 2015 by notional amount
CHF millions Less than
1 yearBetween
1 and 2 yearsBetween
3 and 5 years > 5 years
1'148.9 1'086.3 488.8 116.1
Change in net balance sheet position of derivative financial instruments
CHF millions 2015 2014
Net position at 1 January (250.3) (267.2)Increase/decrease recognised on the income statement 121.7 26.2Increase/decrease recognised as equity 8.7 (13.1)Purchases, business combinations, sales, transfers and other 26.1 3.8
Net position at 31 December (93.8) (250.3)
Maturity of derivative financial instruments
CHF millionsLess than
1 yearBetween
1 and 2 yearsBetween
3 and 5 years > 5 years Total
Maturities of derivative financial instruments associated with cash flow hedging at 31 December 2015 (14.6) – (0.2) – (14.8)
Maturities of other derivative financial instruments at 31 December 2015 (44.7) (34.3) – – (79.0)
Total (59.3) (34.3) (0.2) – (93.8)
Annual Report 2015Pargesa Holding SA Consolidated financial statements

9595
5.2.3 Hedging
Hedging operations are principally undertaken by the Imerys group.
Fair value hedging
At 31 December 2015, the Imerys group held interest rate swaps intended to hedge its exposure to changes in the fair value of its various borrowings. These instruments qualify as fair value hedges. They hedge the risk of changes in the risk-free rate of interest rather than the interest rate spread corresponding to the credit risk of the Imerys group. The hedged borrowings and derivative instruments have the same features.
Notional amount in millionsBorrowing currency in currency in CHF Fixed rate received Varibale rate paid
JPY 7’000 58.2 2.39 % 6-month JPY Libor
The fair value of asset hedging instruments amounted to CHF 0 million at 31 December 2015 (CHF 13.3 million at 31 December 2014) and that of liability hedging instruments was CHF –14.6 million (CHF –13.2 million at 31 December 2014). In 2015, the income recognised on the effective portion of hedging instruments amounted to CHF 0.0 million (CHF 0.0 million in 2014). The change in fair value of the items hedged was CHF 0.0 million in 2015 (CHF 0.0 million in 2014).
Cash flow hedging
As part of its policy for managing exchange rate, interest rate and energy price risks, Imerys holds derivative instruments to hedge certain future purchases and sales in foreign currencies, part of its floating-rate debt and part of its future energy consumption in the United States, the United Kingdom and France. The table below shows the Imerys cash flow hedges recognised as equity and those carried through the income statement (data indicates Pargesa Group’s share).
CHF millions Exchange rate, interest rate and energy price risks
Balance at 1 January 2014 (1.4)Income and expenses recognised in equity (3.3)Income and expenses carried through the income statement 0.4Balance at 31 December 2014 (4.3)Income and expenses recognised in equity (7.0)Income and expenses carried through the income statement 6.9
Total at 31 December 2015 (4.4)- carried through the income statement expected in 2016 (4.4)
In 2015, the ineffective portion of cash flow hedges recognised in the income statement amounted to CHF –1.1 million (CHF +0.2 million in 2014). The effective portion amounted to CHF –36.9 million in 2015 (CHF –2.3 million in 2014).
Hedging of net investments in foreign operations
Imerys hedges part of its net investments in its foreign operations by borrowings specifically allocated to their long-term financing and through the proportion of its financial debt denominated in foreign currencies. The translation gains or losses generated on these loans and borrowings, which qualify as hedges of net investments in foreign operations, are recognised in equity in order to eliminate, to a certain extent, the translation gains or losses on the net investments hedged.At 31 December 2015, the main borrowings and exchange rate swaps hedging net investments in foreign operations were as follows : USD 397.9 million (CHF 397.8 million), SGD 5.5 million (CHF 3.9 million), CHF 47.4 millions and GBP 20.0 million (CHF 29.5 million).At 31 December 2014, the main borrowings and exchange rate swaps hedging net investments in foreign operations were as follows : USD 386.4 million (CHF 384.0 million), SGD 5.5 million (CHF 4.1 million), CHF 47.4 millions and GBP 20.0 million (CHF 31.0 million).
Pargesa Holding SA Annual Report 2015 Consolidated financial statements

9696
Exchange rate swap sensitivity (used to hedge net investments in foreign operations) to interest rate variation
A 10 % increase in the exchange rates for the foreign currencies of the exchange rate swaps in the Imerys portfolio at 31 December 2015 would lead to a CHF 42.5 million increase (CHF +71.3 million in 2014) in Group equity (including minority interests), while a 10 % decrease would lead to a CHF 49.9 million decrease (CHF –17.4 million in 2014). A 10 % change would have no impact on Group income (including minority interests).The impact of these changes is measured on equity for the effective part of derivative instruments qualified as hedges of net investments in foreign operations and on income for the ineffective part of derivative instruments qualified as hedges of net investments in foreign operations and derivative instruments not eligible for hedge accounting.
Note 5.3 – Net interest and dividends from available-for-sale financial assets
CHF millions 2015 2014
Total dividend 164.7 187.5SGS dividend 71.6 75.7ENGIE dividend (formerly GDF Suez) 49.6 66.1Pernod Ricard dividend 38.2 39.6Suez dividend (formerly Suez Environnement) 0.5 3.5Umicore dividend 16.3 11.9Other dividends and interest 4.3 0.1
Total 345.2 384.4
In 2015, GDF Suez changed its name to ENGIE. Also in 2015, Suez Environnement changed its name to Suez. “Other dividends and interest” included the adidas and Ontex dividends in 2015.
Note 5.4 – Other financial income and expenses
Other financial income
CHF millions 2015 2014
Miscellaneous interest income 22.7 27.8Income from financial trading and derivatives 98.7 – Net translation differences 11.9 2.2
Total 133.3 30.0
Other financial expenses
CHF millions 2015 2014
Interest expenses (137.5) (169.6)Losses from financial trading and derivatives – (67.7)Other financial expenses (26.9) (21.8)
Total (164.4) (259.1)
The income statement line items “other financial income” and “other financial expenses” are mainly comprised of interest income and expenses on financial trading and derivatives.
At 31 December 2015, other financial income and expenses included the positive impact of CHF +93.5 million of GBL's marking to market of derivative instruments embedded in the bonds exchangeable for Suez and ENGIE shares or convertible into GBL shares (non-cash impact of CHF –117.3 million in 2014). This non-cash gain of CHF 93.5 million (non-cash charge of CHF –117.3 million in 2014) was a result of the change in value of the call options on the corresponding underlying shares, which are implicitly embedded in exchangeable and convertible bonds issued by GBL in 2012 and 2013. Under IFRS, changes in the fair value of these derivative instruments must be recorded in the income statement, while changes in the value of the corresponding Suez and ENGIE shares held by GBL to cover the exchangeable bonds are recorded directly in equity and do not appear in the income statement, except in the event of impairment or if the shares are sold. Treasury shares held by GBL to cover the convertible bonds are deducted from equity in the consolidated accounts.
Annual Report 2015Pargesa Holding SA Consolidated financial statements
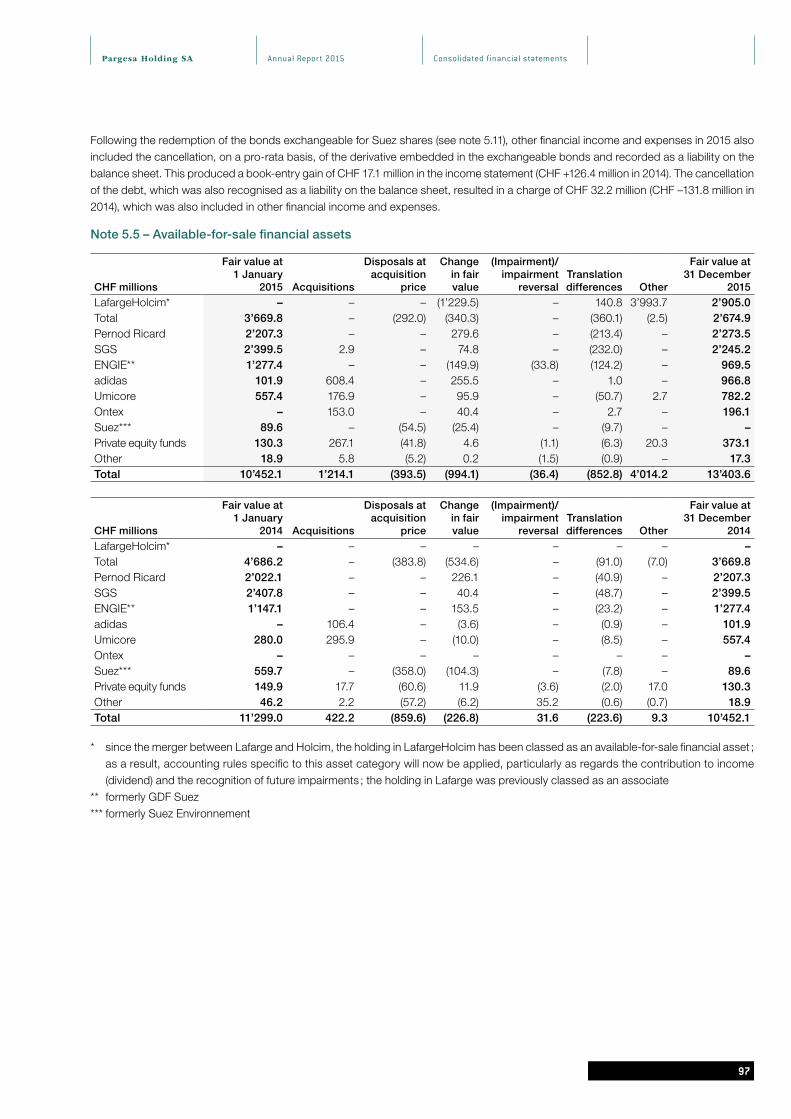
9797
Following the redemption of the bonds exchangeable for Suez shares (see note 5.11), other financial income and expenses in 2015 also included the cancellation, on a pro-rata basis, of the derivative embedded in the exchangeable bonds and recorded as a liability on the balance sheet. This produced a book-entry gain of CHF 17.1 million in the income statement (CHF +126.4 million in 2014). The cancellation of the debt, which was also recognised as a liability on the balance sheet, resulted in a charge of CHF 32.2 million (CHF –131.8 million in 2014), which was also included in other financial income and expenses.
Note 5.5 – Available-for-sale financial assets
CHF millions
Fair value at 1 January
2015 Acquisitions
Disposals at acquisition
price
Change in fair value
(Impairment)/ impairment
reversalTranslation differences Other
Fair value at 31 December
2015
LafargeHolcim* – – – (1’229.5) – 140.8 3’993.7 2’905.0Total 3’669.8 – (292.0) (340.3) – (360.1) (2.5) 2’674.9Pernod Ricard 2’207.3 – – 279.6 – (213.4) – 2’273.5SGS 2’399.5 2.9 – 74.8 – (232.0) – 2’245.2ENGIE** 1’277.4 – – (149.9) (33.8) (124.2) – 969.5adidas 101.9 608.4 – 255.5 – 1.0 – 966.8Umicore 557.4 176.9 – 95.9 – (50.7) 2.7 782.2Ontex – 153.0 – 40.4 – 2.7 – 196.1Suez*** 89.6 – (54.5) (25.4) – (9.7) – – Private equity funds 130.3 267.1 (41.8) 4.6 (1.1) (6.3) 20.3 373.1Other 18.9 5.8 (5.2) 0.2 (1.5) (0.9) – 17.3Total 10’452.1 1’214.1 (393.5) (994.1) (36.4) (852.8) 4’014.2 13’403.6
CHF millions
Fair value at 1 January
2014 Acquisitions
Disposals at acquisition
price
Change in fair value
(Impairment)/ impairment
reversalTranslation differences Other
Fair value at 31 December
2014
LafargeHolcim* – – – – – – – – Total 4’686.2 – (383.8) (534.6) – (91.0) (7.0) 3’669.8Pernod Ricard 2’022.1 – – 226.1 – (40.9) – 2’207.3SGS 2’407.8 – – 40.4 – (48.7) – 2’399.5ENGIE** 1’147.1 – – 153.5 – (23.2) – 1’277.4adidas – 106.4 – (3.6) – (0.9) – 101.9Umicore 280.0 295.9 – (10.0) – (8.5) – 557.4Ontex – – – – – – – – Suez*** 559.7 – (358.0) (104.3) – (7.8) – 89.6Private equity funds 149.9 17.7 (60.6) 11.9 (3.6) (2.0) 17.0 130.3Other 46.2 2.2 (57.2) (6.2) 35.2 (0.6) (0.7) 18.9Total 11’299.0 422.2 (859.6) (226.8) 31.6 (223.6) 9.3 10’452.1
* since the merger between Lafarge and Holcim, the holding in LafargeHolcim has been classed as an available-for-sale financial asset ; as a result, accounting rules specific to this asset category will now be applied, particularly as regards the contribution to income (dividend) and the recognition of future impairments ; the holding in Lafarge was previously classed as an associate
** formerly GDF Suez*** formerly Suez Environnement
Pargesa Holding SA Annual Report 2015 Consolidated financial statements

9898
LafargeHolcim, Total, Pernod Ricard, SGS, ENGIE, adidas, Umicore and Ontex are all held by GBL. These shares, which are all listed in euros (with the exception of SGS, which is listed in Swiss francs, and LafargeHolcim, which is listed in Swiss francs and euros), are shown in the financial statements at fair value, which corresponds to the value in Swiss francs of their market price on the reference date. For LafargeHolcim, the fair value is based on the market price in euros converted into Swiss francs.
The “private equity funds” line item includes the Group's holding in the funds PAI Europe III, Sagard, PrimeStone, BDT Capital Partners II and Mérieux Participations I. These funds are recorded at their fair value on the reference date.The amount of CHF 3’993.7 million in the LafargeHolcim line in 2015 represents the reclassification of Lafarge shares, which were classed as “investments in associates and joint ventures” until 30 June 2015, as “assets held for sale” from 30 June 2015 until 10 July 2015 and as “available-for-sale financial assets” from 10 July 2015, when the merger between Lafarge and Holcim was finalised.
Acquisitions in 2015 amounting to CHF 1'214.1 million included GBL's further purchases of Umicore shares (at 31 December 2015, GBL held 16.6 % of Umicore's capital and voting rights) and purchases of shares in adidas, Europe's largest sportswear manufacturer (GBL held 4.7 % of adidas at 31 December 2015). In 2015 GBL also acquired a 7.6 % stake in the capital of listed Belgian group Ontex, a leading global provider of disposable hygiene products. Acquisitions during the period also included an investment of EUR 150 million (CHF 160.1 million) in PrimeStone, a new fund whose strategy consists of making medium- to long-term investments in mid-sized listed companies in Europe. Disposals at acquisition price amounting to CHF 393.5 million in 2015 included GBL's disposal of 0.5 % of Total's share capital (GBL still held 2.4 % of Total's share capital at 31 December 2015) and the delivery of Suez shares by GBL following the redemption of the Suez exchangeable bond.In 2015, the column “(impairment)/impairment reversals” included the further impairment of EUR 31.7 million (CHF 33.8 million) recognised on the holding in ENGIE in order to adjust the carrying amount of these shares (EUR 15.02 per share at end-2014) to their market value at 30 September 2015 (EUR 14.44 per share).
The impairment reversal of CHF 35.2 million in the 2014 “(Impairment)/impairment reversal” column primarily relates to Iberdrola and represents the reversal of impairments recognised in prior financial years at the time of the disposal of the shareholding in 2014. Acquisitions in 2014 amounting to CHF 422.2 million included the purchases of further Umicore shares by GBL. Disposals at acquisition price amounting to CHF 859.6 million in 2014 included GBL's disposal of 0.6 % of Total's share capital and the delivery of Suez shares by GBL following the partial redemption of the Suez exchangeable bond.
Note 5.6 – Other long-term financial and non-financial assets
CHF millions2015
Carrying amount2014
Carrying amount
Other long-term financial assetsDerivative financial instruments 16.4 14.1Long-term advances, loans and deposits 23.5 19.0Other long-term financial assets 51.6 69.8Total other long-term financial assets 91.5 102.9Other long-term non-financial assetsOther long-term non-financial assets 10.3 10.8Total other long-term non-financial assets 10.3 10.8
Total other long-term assets 101.8 113.7
Other long-term assets are shown net of an impairment on Imerys assets of CHF 50.4 million at 31 December 2015 (CHF 68.4 million at 31 December 2014). The allocation for 2015 was CHF 0.6 million (CHF 5.0 million in 2014).
Repayment schedule of other long-term financial assets at the end of 2015
Less than 1 year
Between 1 and 2 years
Between 3 and 5 years > 5 years TotalCHF millions
Other long-term financial assets 0.2 58.4 0.2 32.7 91.5
Annual Report 2015Pargesa Holding SA Consolidated financial statements

9999
Note 5.7 – Trade receivables
CHF millions2015
Carrying amount2014
Carrying amount
Trade receivables 736.6 743.6Receivables 5.6 4.9Impairment on trade receivables (42.2) (35.4)
Total 700.0 713.1
Trade receivables essentially relate to Imerys.A non-recourse factoring agreement for an indeterminate period was signed by Imerys in 2009. Consequently, at 31 December 2015, CHF 47.9 million (CHF 55.0 million au 31 December 2014) of receivables had been sold and hived off, the risks and benefits associated with the receivables having been transferred to the factoring bank.
Details of impairment on trade receivables
CHF millions 2015 2014
Impairment at 1 January (35.4) (29.4)Impairment for the year (18.5) (9.5)Impairment reversals 9.1 4.0Translation and other differences 2.6 (0.5)
Impairment at 31 December (42.2) (35.4)
Trade receivables are not interest bearing and generally have a due date of between 30 and 90 days. On the balance sheet date, certain trade receivables (detailed below) may have reached the due date without having been depreciated, for example where they are hedged by a credit insurance agreement or by a guarantee.
Age of trade receivables due and not depreciated
CHF millions 2015 2014
Late by no more than 1 month 58.5 78.3Late by 1 to 3 months 26.7 28.1Late by more than 3 months 30.4 20.0
Total trade receivables due and not depreciated 115.6 126.4
Trade receivables not yet due and trade receivables due and depreciated 584.4 586.7Total trade receivables 700.0 713.1
Note 5.8 – Cash and cash equivalents
CHF millions2015
Carrying amount2014
Carrying amount
Cash in bank 847.5 1'174.8Short-term bank deposits and other cash equivalents with a term of less than 3 months 180.8 603.9
Total 1'028.3 1'778.7
Pargesa Holding SA Annual Report 2015 Consolidated financial statements
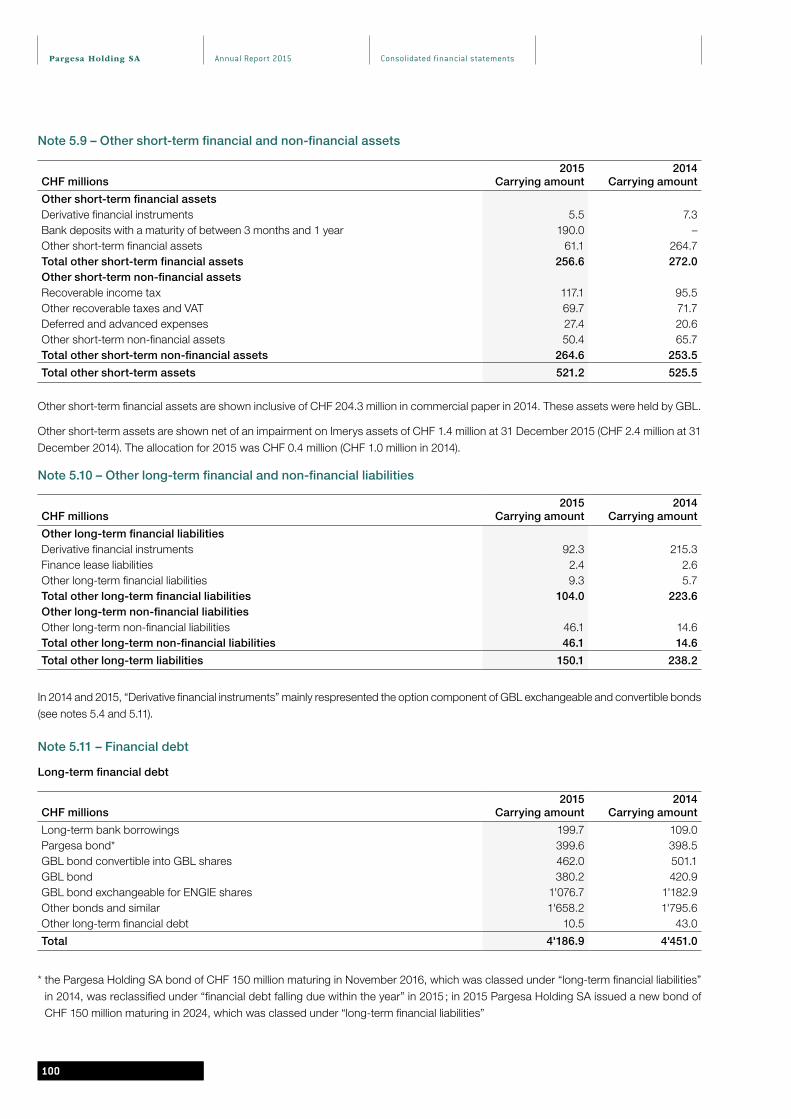
100100
Note 5.9 – Other short-term financial and non-financial assets
CHF millions2015
Carrying amount2014
Carrying amount
Other short-term financial assetsDerivative financial instruments 5.5 7.3Bank deposits with a maturity of between 3 months and 1 year 190.0 – Other short-term financial assets 61.1 264.7Total other short-term financial assets 256.6 272.0Other short-term non-financial assetsRecoverable income tax 117.1 95.5Other recoverable taxes and VAT 69.7 71.7Deferred and advanced expenses 27.4 20.6Other short-term non-financial assets 50.4 65.7Total other short-term non-financial assets 264.6 253.5
Total other short-term assets 521.2 525.5
Other short-term financial assets are shown inclusive of CHF 204.3 million in commercial paper in 2014. These assets were held by GBL.
Other short-term assets are shown net of an impairment on Imerys assets of CHF 1.4 million at 31 December 2015 (CHF 2.4 million at 31 December 2014). The allocation for 2015 was CHF 0.4 million (CHF 1.0 million in 2014).
Note 5.10 – Other long-term financial and non-financial liabilities
CHF millions2015
Carrying amount2014
Carrying amount
Other long-term financial liabilitiesDerivative financial instruments 92.3 215.3Finance lease liabilities 2.4 2.6Other long-term financial liabilities 9.3 5.7Total other long-term financial liabilities 104.0 223.6Other long-term non-financial liabilitiesOther long-term non-financial liabilities 46.1 14.6Total other long-term non-financial liabilities 46.1 14.6
Total other long-term liabilities 150.1 238.2
In 2014 and 2015, “Derivative financial instruments” mainly respresented the option component of GBL exchangeable and convertible bonds (see notes 5.4 and 5.11).
Note 5.11 – Financial debt
Long-term financial debt
CHF millions2015
Carrying amount2014
Carrying amount
Long-term bank borrowings 199.7 109.0Pargesa bond* 399.6 398.5GBL bond convertible into GBL shares 462.0 501.1GBL bond 380.2 420.9GBL bond exchangeable for ENGIE shares 1'076.7 1'182.9Other bonds and similar 1'658.2 1'795.6Other long-term financial debt 10.5 43.0
Total 4'186.9 4'451.0
* the Pargesa Holding SA bond of CHF 150 million maturing in November 2016, which was classed under “long-term financial liabilities” in 2014, was reclassified under “financial debt falling due within the year” in 2015 ; in 2015 Pargesa Holding SA issued a new bond of CHF 150 million maturing in 2024, which was classed under “long-term financial liabilities”
Annual Report 2015Pargesa Holding SA Consolidated financial statements

101101
Group debt is at fixed or variable rates depending on the individual case. With variable-rate debt, the various entities can hedge their interest rate risk by taking out interest rate swap contracts (see note 5.2).
In 2013, GBL set up bank deposits presenting the same characteristics as the bank drawdowns, with EUR 200 million (CHF 217.3 million) maturing in 2016 (EUR 200 million, or CHF 240.5 million, in 2014). Under the netting agreements entered into with the counterparty, these deposits are netted against the corresponding bank loans, in accordance with IFRS.
Pargesa bonds
CHF millions 2015 2014Par Interest rate Carrying Carrying
Issuer value nominal effective Term amount amount
Pargesa Holding SA 145.0 2.50 % 2.68 % 15/11/2010-15/11/2016 144.8 149.6Pargesa Holding SA 250.0 1.50 % 1.62 % 10/12/2013-10/12/2018 249.3 248.9Pargesa Holding SA 150.0 0.875 % 0.859 % 24/04/2015-24/04/2024 150.3 –
Total 545.0 544.4 398.5
In November 2010, Pargesa issued stock-exchange-listed, CHF-denominated bonds, with a six-year term and an interest rate of 2.5 %. The fair value of these bonds at 31 December 2015, net of repurchases in 2015, was CHF 147.9 million (level 1 fair value under IFRS 13) and CHF 155.8 million at 31 December 2014. In 2015, Pargesa Holding SA repurchased CHF 5.0 million in par value of these bonds at an average price of 103.9 %, generating a book-entry loss of CHF 0.2 million.In December 2013, Pargesa issued stock-exchange-listed, CHF-denominated bonds, with a five-year term and an interest rate of 1.5 %. The fair value of these bonds at 31 December 2015 was CHF 260.1 million (level 1 fair value under IFRS 13) and CHF 258.9 million at 31 December 2014.On 24 April 2015, Pargesa Holding SA issued a CHF-denominated bond for a total par value of CHF 150 million ; the bonds are listed, have a term of nine years and pay a coupon of 0.875 %. The issue price was 100.605 %. The fair value of these bonds at 31 December 2015 was CHF 152.2 million (level 1 fair value under IFRS 13).
GBL bond convertible into GBL shares
CHF millions 2015 2014Par Interest rate Carrying Carrying
Issuer
value
(millions)
nominal effective Term amount amount
Sagerpar EUR 428.4 0.375 % 2.46 % 09/10/2013-09/10/2018 462.0 501.1
In 2013, GBL issued EUR 428.4 million in bonds convertible into GBL shares. The bonds are convertible into 5 million existing GBL shares held as treasury stock. They have a maturity of five years and pay an annual coupon of 0.375 %. The bonds will be redeemed on 9 October 2018, either through a cash payment, delivery of shares or a combination of the two. The redemption price is set at 105.14 % of par value, representing an effective conversion price of EUR 90.08, compared with the reference price on the GBL share at issue of EUR 63.465. GBL reserves the right to redeem the bond early, as of 31 October 2016, if the value of the shares exceeds 130 % of the bond's par value over a certain period of time.The bonds are listed on the Euro MTF market of the Luxembourg stock exchange. The carrying amount of the bond (excluding the option component) was CHF 462.0 million at 31 December 2015 (CHF 501.1 million at 31 December 2014). The option component, which is carried at fair value (level 2 fair value under IFRS 13), amounted to CHF 34.3 million (carried under “Other long-term financial liabilities” on the balance sheet) at 31 December 2015 (CHF 23.3 million at 31 December 2014). The fair value of these bonds at 31 December 2015 was CHF 518.3 million (level 1 fair value under IFRS 13) and CHF 552.2 million at 31 December 2014. In terms of the derivative's sensitivity, the instrument's liquidity and the volatility and market price of the underlying shares are the main factors that would result in a change in the fair value of the derivative.
Pargesa Holding SA Annual Report 2015 Consolidated financial statements

102102
GBL bond
CHF millions
Issuer
Par value
(millions) Interest rate Term
2015 Carrying amount
2014 Carrying amount
GBL EUR 350.0 4.00 % 30/06/2010-29/12/2017 380.2 420.9
In 2010, GBL issued stock-exchange-listed, EUR-denominated bonds, with a 7.5-year term and a coupon of 4 %. The fair value of these bonds at 31 December 2015 was CHF 402.3 million (level 1 fair value under IFRS 13) and CHF 453.1 million at 31 December 2014.
GBL bond exchangeable for Suez shares
CHF millions Par value Interest rate
2015 Carrying
2014 Carrying
Issuer (millions) nominal effective Term amount amountGBL – 0.125 % 2.21 % 21/09/2012-21/09/2015 – 70.0
In September 2012, GBL issued EUR 400.8 million in bonds exchangeable for Suez shares. The bonds were listed on the Euro MTF market on the Luxembourg Exchange. The bond issue covered almost all of the Suez shares held by GBL, i.e. 35 million shares. The bond was redeemable at par on 21 September 2015, unless GBL exercised its option to remit Suez shares to the bondholders at a price of EUR 11.45 per share and to pay, if necessary, in cash the difference between the value of the shares to be delivered and the bond's par value.In 2014, GBL received early conversion requests for the GBL bonds exchangeable for Suez shares. GBL therefore delivered 29.9 million Suez shares for a total par value of EUR 342 million (CHF 411 million). The conversions generated a book-entry gain of EUR 145.3 million (CHF 176.5 million) on the Suez shares delivered, representing the difference between the average price of the Suez shares when the exchanges took place (EUR 14.75 per share) and the economic cost of EUR 9.9 per share. The cancellation, on a pro-rata basis of the bonds exchanged, of the derivative embedded in the exchangeable bonds and recorded as a liability in the balance sheet, resulted in a book-entry gain of EUR 104.1 million (CHF 126.4 million) recognised in 2014 income. The cancellation of the debt resulted in a charge of EUR 108.5 million (CHF 131.8 million), which was also recorded in the 2014 income statement.In 2015, GBL redeemed the remaining bonds and delivered 5.1 million Suez shares for a total par value of EUR 59 million (CHF 64 million). GBL's holding in Suez's share capital was thus reduced from 1.1 % at end-2014 to 0 % at 31 December 2015. The conversions generated a book-entry gain of EUR 37.8 million (CHF 40.3 million) on the Suez shares delivered, representing the difference between the average price of the Suez shares when the exchanges took place in 2015 (EUR 17.2 per share) and the economic cost of EUR 9.9 per share. The cancellation, on a pro-rata basis of the bonds exchanged, of the derivative embedded in the exchangeable bonds and recorded as a liability on the balance sheet, resulted in a book-entry gain of EUR 16.0 million (CHF 17.1 million) recognised in 2015 income. The cancellation of the debt resulted in a charge of EUR 30.2 million (CHF 32.2 million), which was also recorded in the 2015 income statement.The carrying amount of the remaining bonds (excluding the option component) was CHF 70.0 million at 31 December 2014. The option component was carried at fair value (level 2 fair value under IFRS 13), under “Other short-term financial liabilities” on the balance sheet date (CHF 18 million at 31 December 2014). The fair value of these bonds at 31 December 2014 was CHF 89 million (level 1 fair value under IFRS 13).
GBL bond exchangeable for ENGIE shares
CHF millions 2015 2014Par
value Interest rate Carrying CarryingIssuer (millions) nominal effective Term amount amountGBL Verwaltung EUR 1'000 1.25 % 2.05 % 07/02/2013-07/02/2017 1'076.7 1'182.9
In early 2013, GBL issued EUR 1 billion in bonds exchangeable for ENGIE shares. This issue covered approximately 55 million shares, or 2.3 % of ENGIE's capital and voting rights, representing just under half of the ENGIE shares held by GBL. They have a maturity of four years and pay an annual coupon of 1.25 %. GBL may redeem the bond at par on 22 February 2016 if the value of the ENGIE share remains above 130 % of the bond's par value for a certain period of time. The bond also contains a put option, which may be exercised at par by investors on 7 February 2016. The bond will be redeemed at par on 7 February 2017, unless GBL exercises its option to remit ENGIE shares to the bondholders at a price of EUR 18.32 per share and to pay, if necessary, in cash the difference between the value of the shares to be delivered and the bond's par value.
Annual Report 2015Pargesa Holding SA Consolidated financial statements
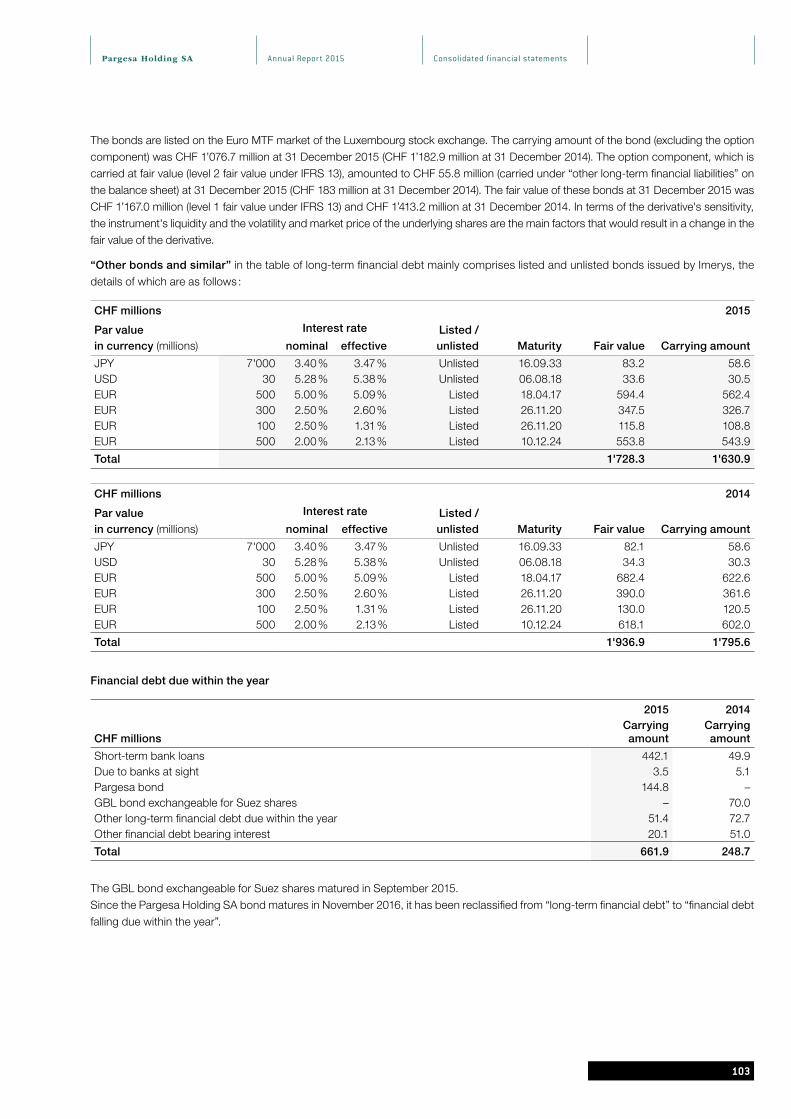
103103
The bonds are listed on the Euro MTF market of the Luxembourg stock exchange. The carrying amount of the bond (excluding the option component) was CHF 1’076.7 million at 31 December 2015 (CHF 1’182.9 million at 31 December 2014). The option component, which is carried at fair value (level 2 fair value under IFRS 13), amounted to CHF 55.8 million (carried under “other long-term financial liabilities” on the balance sheet) at 31 December 2015 (CHF 183 million at 31 December 2014). The fair value of these bonds at 31 December 2015 was CHF 1’167.0 million (level 1 fair value under IFRS 13) and CHF 1’413.2 million at 31 December 2014. In terms of the derivative's sensitivity, the instrument's liquidity and the volatility and market price of the underlying shares are the main factors that would result in a change in the fair value of the derivative.
“Other bonds and similar” in the table of long-term financial debt mainly comprises listed and unlisted bonds issued by Imerys, the details of which are as follows :
CHF millions 2015
Par value in currency (millions)
Interest rate Listed / unlisted Maturity Fair value Carrying amountnominal effective
JPY 7'000 3.40 % 3.47 % Unlisted 16.09.33 83.2 58.6USD 30 5.28 % 5.38 % Unlisted 06.08.18 33.6 30.5EUR 500 5.00 % 5.09 % Listed 18.04.17 594.4 562.4EUR 300 2.50 % 2.60 % Listed 26.11.20 347.5 326.7EUR 100 2.50 % 1.31 % Listed 26.11.20 115.8 108.8EUR 500 2.00 % 2.13 % Listed 10.12.24 553.8 543.9
Total 1'728.3 1'630.9
CHF millions 2014
Par value in currency (millions)
Interest rate Listed / unlisted Maturity Fair value Carrying amountnominal effective
JPY 7'000 3.40 % 3.47 % Unlisted 16.09.33 82.1 58.6USD 30 5.28 % 5.38 % Unlisted 06.08.18 34.3 30.3EUR 500 5.00 % 5.09 % Listed 18.04.17 682.4 622.6EUR 300 2.50 % 2.60 % Listed 26.11.20 390.0 361.6EUR 100 2.50 % 1.31 % Listed 26.11.20 130.0 120.5EUR 500 2.00 % 2.13 % Listed 10.12.24 618.1 602.0
Total 1'936.9 1'795.6
Financial debt due within the year
2015 2014
CHF millionsCarrying amount
Carrying amount
Short-term bank loans 442.1 49.9Due to banks at sight 3.5 5.1Pargesa bond 144.8 – GBL bond exchangeable for Suez shares – 70.0Other long-term financial debt due within the year 51.4 72.7Other financial debt bearing interest 20.1 51.0
Total 661.9 248.7
The GBL bond exchangeable for Suez shares matured in September 2015.Since the Pargesa Holding SA bond matures in November 2016, it has been reclassified from “long-term financial debt” to “financial debt falling due within the year”.
Pargesa Holding SA Annual Report 2015 Consolidated financial statements

104104
Repayment schedule of short and long-term financial debt (based on carrying amounts)
CHF millionsLess than
1 yearBetween
1 and 2 yearsBetween
3 and 5 years > 5 yearsTotal
> 1 year Total
2015 661.9 1'466.9 1'978.9 741.1 4'186.9 4'848.82014 248.7 8.3 3'255.6 1'187.1 4'451.0 4'699.7
Analysis of debt by currency
CHF millions CHF EUR USD Other Total
2015 544.3 4'132.2 55.3 117.0 4'848.82014 398.5 4'126.0 56.8 118.4 4'699.7
Residual contractual maturities of financial liabilities in 2015
2016 2017 - 2021 2022 and beyondCHF millions Capital Interest Capital Interest Capital Interest
Financial debt 150.0 100.6 3'321.7 175.1 828.2 98.5Other long-term financial liabilities – – 0.8 – 1.3 – Derivative financial instruments 115.4 – 0.3 – – – Trade payables 538.8 – – – – – Financial debt due within the year 517.1 0.3 – – – – Other short-term financial liabilities 60.2 – – – – –
Total 1'381.5 100.9 3'322.8 175.1 829.5 98.5
Residual contractual maturities of financial liabilities in 2014
2015 2016 - 2020 2021 and beyondCHF millions Capital Interest Capital Interest Capital Interest
Financial debt – 117.7 3'238.4 314.9 1'215.5 73.7Other long-term financial liabilities – – 7.0 – 1.4 – Derivative financial instruments 56.2 – 215.5 – – – Trade payables 540.8 – – – – – Financial debt due within the year 247.3 1.2 – – – – Other short-term financial liabilities 45.3 – – – – –
Total 889.6 118.9 3'460.9 314.9 1'216.9 73.7
Group companies each have credit lines in connection with their operating activities. Each consolidated subsidiary is responsible for its own credit management based on the requirements of its operating activities.
Unused credit lines available at 31 December 2015 and their due dates
Less than Between Between 2015 2014CHF millions 1 year 1 and 2 years 3 and 5 years > 5 years Total Total
Pargesa – – – 5.0 5.0 245.5GBL – – 2'121.0 – 2'121.0 1'864.0Imerys (355.9) – 1'439.3 – 1'083.4 1'535.9
Total (355.9) – 3'560.3 5.0 3'209.4 3'645.4
The negative amount for “Imerys” represents, among other things, the commercial paper issued and secured by credit lines, as well as bank loans.
Annual Report 2015Pargesa Holding SA Consolidated financial statements

105105
Note 5.12 – Other short-term financial and non-financial liabilities
CHF millions
2015 Carrying amount
2014 Carrying amount
Other short-term financial liabilitiesDerivative financial instruments 23.4 56.4Finance lease liabilities due within the year 0.5 0.7Other short-term financial liabilities 61.2 45.5Total other short-term financial liabilities 85.1 102.6Other short-term non-financial liabilitiesTax payable other than income tax 44.5 51.6Tax, social security debt and other short-term non-financial liabilities 328.0 352.0Total other short-term non-financial liabilities 372.5 403.6
Total other short-term liabilities 457.6 506.2
Note 6 – Staff costs
CHF millions 2015 2014
Remuneration, salaries and bonuses (829.1) (801.8)Social security contributions (163.0) (159.6)Defined contribution and defined benefit pension plans (38.5) (27.2)Stock option plan charges (see note 24) (12.5) (16.1)Other payroll expenses (6.4) (7.7)
Total (1'049.5) (1'012.4)
Note 7 – Restructuring costs
CHF millions 2015 2014
Restructuring expenditure during the year (67.9) (59.4)Impairment on assets in connection with restructuring (163.3) (7.9)Change in restructuring provisions (16.0) (41.9)
Total (247.2) (109.2)
Restructuring costs in 2015 related mainly to Imerys and originated in the areas in which Imerys operates. They related primarily to the adjustment of the Oilfield Solutions activity to a downturn in the ceramic proppants market and the integration of S&B.Restructuring costs in 2014 related mainly to Imerys and originated in the four areas in which Imerys operates. They consisted primarily of additional expenses relating to the programmes initiated in 2013 (end of operations in Venezuelan and the shutdown of the Ardoisières d’Angers) and to restructurings initiated in 2014 (reorganisation of kaolin activities relating to paper, of some activities in China and of Refractory Minerals in Europe).Restructuring costs are recognised in the income statement under “other operating expenses”.
Note 8 – Impairment of assetsThe net amount of impairments and impairment reversals recorded in 2015 was CHF +362.2 million and included the impairment reversal of CHF 661.9 million on Lafarge (see note 17). Impairments included the additional impairment recorded on ENGIE, a shareholding owned by GBL and recognised in “available-for-sale financial assets” in the Group financial statements (see also note 5.5). This impairment was recorded at 30 September 2015 and amounted to EUR 31.7 million at GBL (CHF –33.8 million). The impact of this impairment on Pargesa was largely offset by the historical exchange rate gain of CHF 30.8 million resulting from the reversal of the ENGIE revaluation reserve at Pargesa. Impairments of CHF 291.0 million at Imerys included goodwill impairments of CHF 126.8 million, impairments on intangible assets of CHF 38.5 million and impairments on tangible assets of CHF 125.7 million (see also note 12).
The net amount of asset impairments recorded in 2014 was CHF 57.1 million and comprised mainly a goodwill impairment of CHF 36.6 million on CGU Zircon in Imerys’ High-Resistance Minerals business group, together with net impairments on Imerys’ tangible assets amounting to CHF 7.3 million.The Group also recorded impairments amounting to CHF 8.6 million on private equity funds.
Pargesa Holding SA Annual Report 2015 Consolidated financial statements

106106
Note 9 – Operating leasesOperating lease liabilities come mainly from Imerys and correspond to commitments to pay future rent under leasing agreements for administrative premises, capital goods, wagons, trucks and other vehicles. They are not recognised in the balance sheet. Lease payments are recorded in the income statement, while commitments to pay future rent are off-balance-sheet commitments (see note 25). Their maturities are as follows :
CHF millions 2015 2014
During the 1st year 46.5 38.7Between the 2nd and 5th year 100.9 77.9Beyond the 5th year 122.1 65.5
Total future payments on operating leases 269.5 182.1
Expenses recognised in the income statement during the year in relation to operating leases
CHF millions 2015 2014
Total expenses for the year 98.0 91.0
Note 10 – Income tax
10.1 Income tax for the year
CHF millions 2015 2014
Current tax for the period (147.0) (139.6)Current tax for prior periods (1.8) 5.2Total current tax (148.8) (134.4)Origination and reversal of timing differences 78.4 (16.5)Other deferred tax 0.6 3.4Total deferred tax 79.0 (13.1)
Total tax expense on income for the period (69.8) (147.5)
10.2 Breakdown of deferred tax expenses and income
CHF millions 2015 2014
Intangible assets 37.2 2.7Tangible fixed assets 22.8 (4.3)Long-term financial assets 2.9 (2.2)Commitments relating to employee benefits (0.2) (6.9)Inventories, receivables, financial debts and other provisions 9.4 1.8Tax losses and unused tax credits 7.9 (3.4)Changes in tax rates (0.3) – Other (0.7) (0.8)
Total deferred tax expenses and income 79.0 (13.1)
Annual Report 2015Pargesa Holding SA Consolidated financial statements
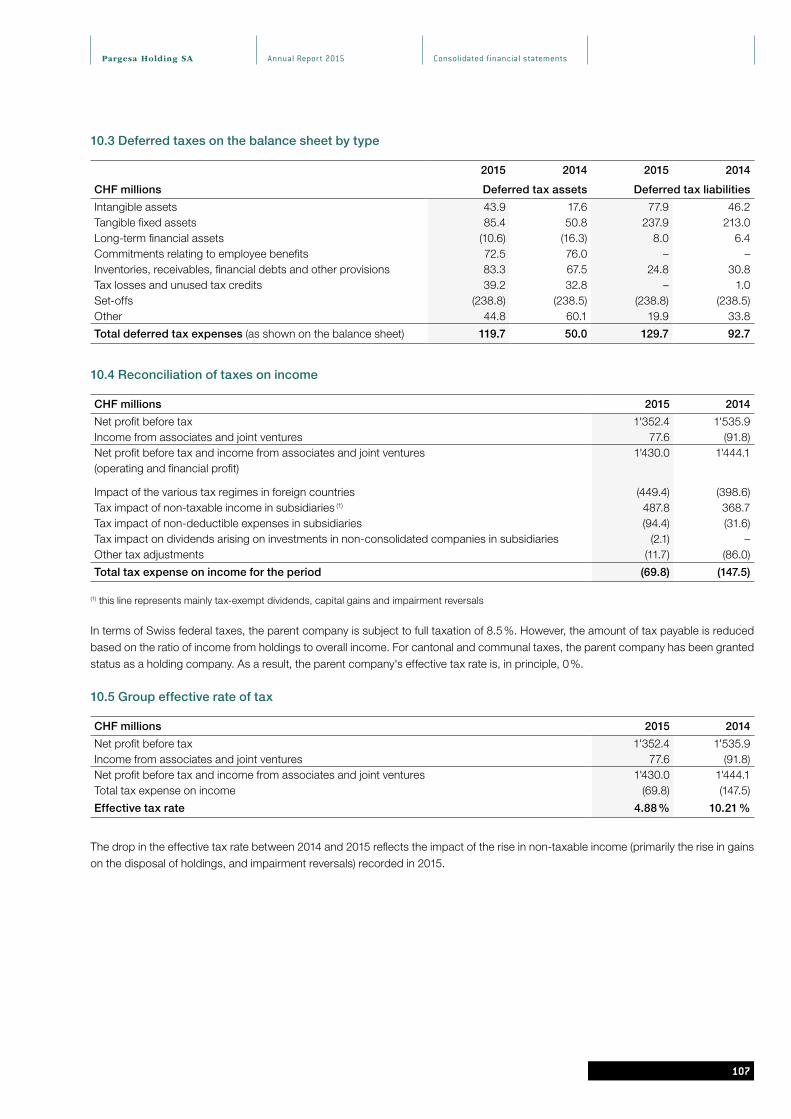
107107
10.3 Deferred taxes on the balance sheet by type
2015 2014 2015 2014
CHF millions Deferred tax assets Deferred tax liabilities
Intangible assets 43.9 17.6 77.9 46.2Tangible fixed assets 85.4 50.8 237.9 213.0Long-term financial assets (10.6) (16.3) 8.0 6.4Commitments relating to employee benefits 72.5 76.0 – – Inventories, receivables, financial debts and other provisions 83.3 67.5 24.8 30.8Tax losses and unused tax credits 39.2 32.8 – 1.0Set-offs (238.8) (238.5) (238.8) (238.5)Other 44.8 60.1 19.9 33.8
Total deferred tax expenses (as shown on the balance sheet) 119.7 50.0 129.7 92.7
10.4 Reconciliation of taxes on income
CHF millions 2015 2014
Net profit before tax 1'352.4 1'535.9Income from associates and joint ventures 77.6 (91.8)Net profit before tax and income from associates and joint ventures 1'430.0 1'444.1(operating and financial profit)
Impact of the various tax regimes in foreign countries (449.4) (398.6)Tax impact of non-taxable income in subsidiaries (1) 487.8 368.7Tax impact of non-deductible expenses in subsidiaries (94.4) (31.6)Tax impact on dividends arising on investments in non-consolidated companies in subsidiaries (2.1) – Other tax adjustments (11.7) (86.0)
Total tax expense on income for the period (69.8) (147.5)
(1) this line represents mainly tax-exempt dividends, capital gains and impairment reversals
In terms of Swiss federal taxes, the parent company is subject to full taxation of 8.5 %. However, the amount of tax payable is reduced based on the ratio of income from holdings to overall income. For cantonal and communal taxes, the parent company has been granted status as a holding company. As a result, the parent company's effective tax rate is, in principle, 0 %.
10.5 Group effective rate of tax
CHF millions 2015 2014
Net profit before tax 1'352.4 1'535.9Income from associates and joint ventures 77.6 (91.8)Net profit before tax and income from associates and joint ventures 1'430.0 1'444.1Total tax expense on income (69.8) (147.5)
Effective tax rate 4.88 % 10.21 %
The drop in the effective tax rate between 2014 and 2015 reflects the impact of the rise in non-taxable income (primarily the rise in gains on the disposal of holdings, and impairment reversals) recorded in 2015.
Pargesa Holding SA Annual Report 2015 Consolidated financial statements
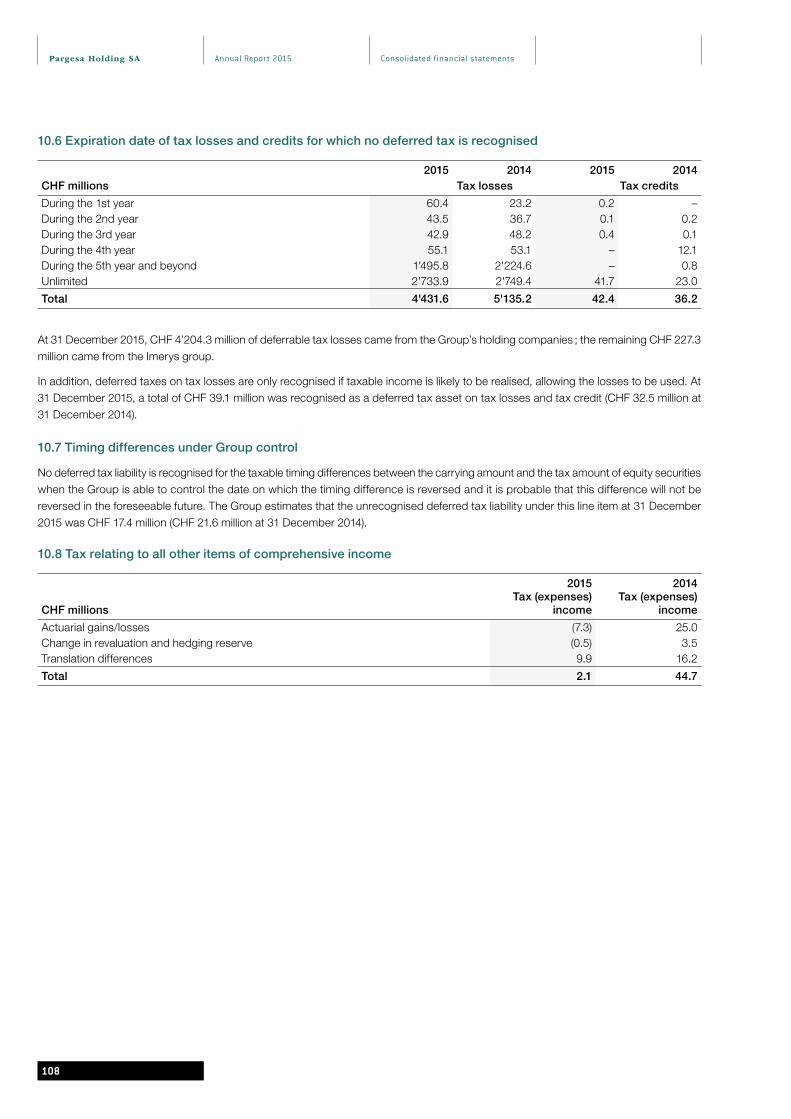
108108
10.6 Expiration date of tax losses and credits for which no deferred tax is recognised
2015 2014 2015 2014CHF millions Tax losses Tax credits
During the 1st year 60.4 23.2 0.2 – During the 2nd year 43.5 36.7 0.1 0.2During the 3rd year 42.9 48.2 0.4 0.1During the 4th year 55.1 53.1 – 12.1During the 5th year and beyond 1'495.8 2'224.6 – 0.8Unlimited 2'733.9 2'749.4 41.7 23.0
Total 4'431.6 5'135.2 42.4 36.2
At 31 December 2015, CHF 4’204.3 million of deferrable tax losses came from the Group’s holding companies ; the remaining CHF 227.3 million came from the Imerys group.
In addition, deferred taxes on tax losses are only recognised if taxable income is likely to be realised, allowing the losses to be used. At 31 December 2015, a total of CHF 39.1 million was recognised as a deferred tax asset on tax losses and tax credit (CHF 32.5 million at 31 December 2014).
10.7 Timing differences under Group control
No deferred tax liability is recognised for the taxable timing differences between the carrying amount and the tax amount of equity securities when the Group is able to control the date on which the timing difference is reversed and it is probable that this difference will not be reversed in the foreseeable future. The Group estimates that the unrecognised deferred tax liability under this line item at 31 December 2015 was CHF 17.4 million (CHF 21.6 million at 31 December 2014).
10.8 Tax relating to all other items of comprehensive income
CHF millions
2015 Tax (expenses)
income
2014 Tax (expenses)
income
Actuarial gains/losses (7.3) 25.0Change in revaluation and hedging reserve (0.5) 3.5Translation differences 9.9 16.2
Total 2.1 44.7
Annual Report 2015Pargesa Holding SA Consolidated financial statements
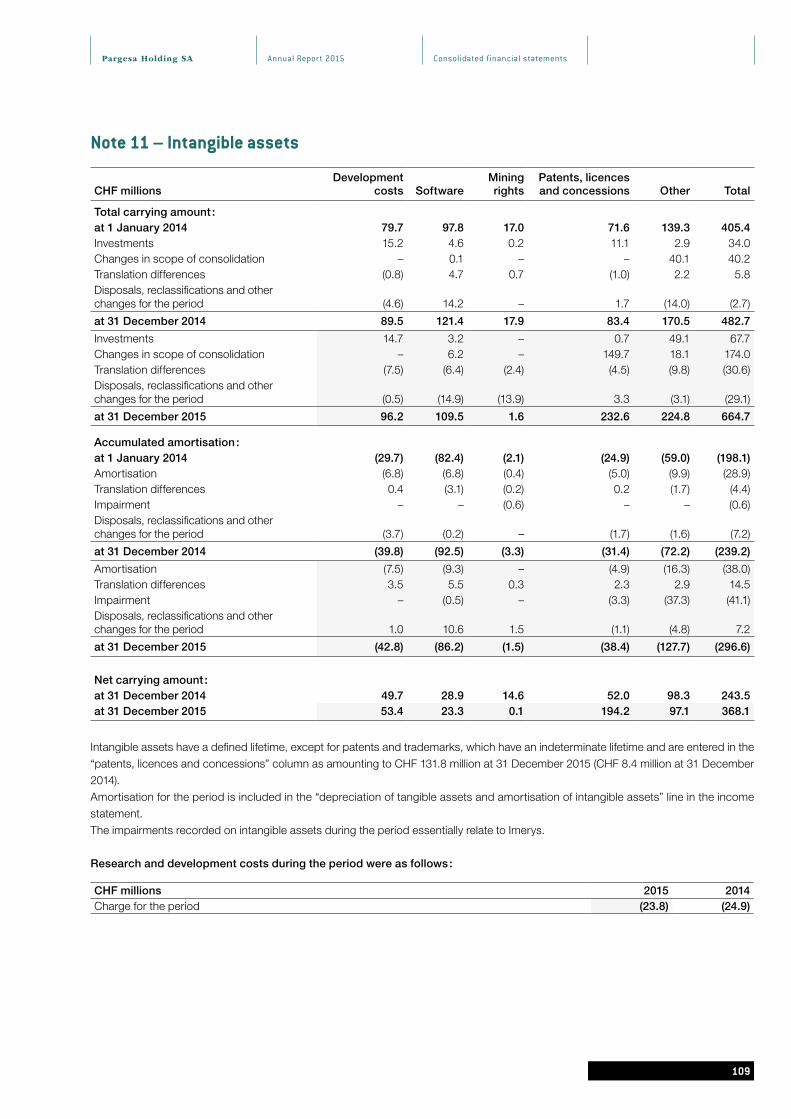
109109
Note 11 – Intangible assets
CHF millionsDevelopment
costs SoftwareMining rights
Patents, licences and concessions Other Total
Total carrying amount :at 1 January 2014 79.7 97.8 17.0 71.6 139.3 405.4Investments 15.2 4.6 0.2 11.1 2.9 34.0Changes in scope of consolidation – 0.1 – – 40.1 40.2Translation differences (0.8) 4.7 0.7 (1.0) 2.2 5.8Disposals, reclassifications and other changes for the period (4.6) 14.2 – 1.7 (14.0) (2.7)
at 31 December 2014 89.5 121.4 17.9 83.4 170.5 482.7
Investments 14.7 3.2 – 0.7 49.1 67.7Changes in scope of consolidation – 6.2 – 149.7 18.1 174.0Translation differences (7.5) (6.4) (2.4) (4.5) (9.8) (30.6)Disposals, reclassifications and other changes for the period (0.5) (14.9) (13.9) 3.3 (3.1) (29.1)
at 31 December 2015 96.2 109.5 1.6 232.6 224.8 664.7
Accumulated amortisation :at 1 January 2014 (29.7) (82.4) (2.1) (24.9) (59.0) (198.1)Amortisation (6.8) (6.8) (0.4) (5.0) (9.9) (28.9)Translation differences 0.4 (3.1) (0.2) 0.2 (1.7) (4.4)Impairment – – (0.6) – – (0.6)Disposals, reclassifications and other changes for the period (3.7) (0.2) – (1.7) (1.6) (7.2)
at 31 December 2014 (39.8) (92.5) (3.3) (31.4) (72.2) (239.2)
Amortisation (7.5) (9.3) – (4.9) (16.3) (38.0)Translation differences 3.5 5.5 0.3 2.3 2.9 14.5Impairment – (0.5) – (3.3) (37.3) (41.1)Disposals, reclassifications and other changes for the period 1.0 10.6 1.5 (1.1) (4.8) 7.2
at 31 December 2015 (42.8) (86.2) (1.5) (38.4) (127.7) (296.6)
Net carrying amount :at 31 December 2014 49.7 28.9 14.6 52.0 98.3 243.5at 31 December 2015 53.4 23.3 0.1 194.2 97.1 368.1
Intangible assets have a defined lifetime, except for patents and trademarks, which have an indeterminate lifetime and are entered in the “patents, licences and concessions” column as amounting to CHF 131.8 million at 31 December 2015 (CHF 8.4 million at 31 December 2014).Amortisation for the period is included in the “depreciation of tangible assets and amortisation of intangible assets” line in the income statement.The impairments recorded on intangible assets during the period essentially relate to Imerys.
Research and development costs during the period were as follows :
CHF millions 2015 2014Charge for the period (23.8) (24.9)
Pargesa Holding SA Annual Report 2015 Consolidated financial statements
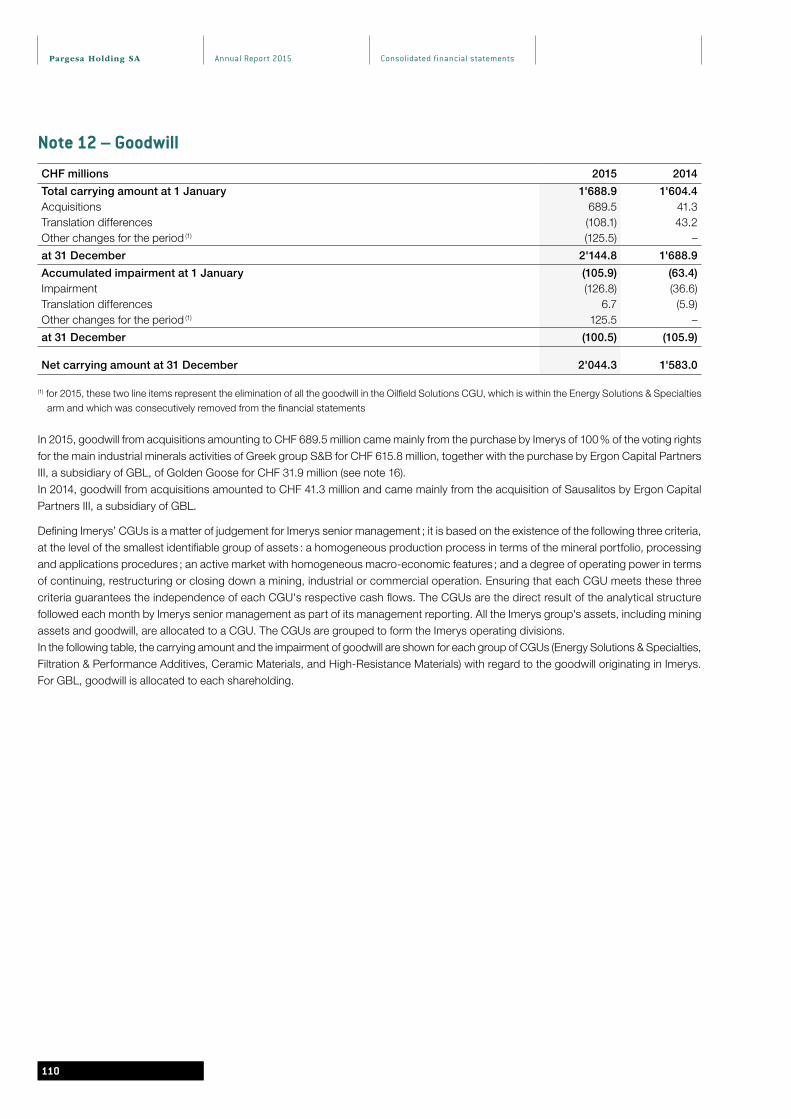
110110
Note 12 – Goodwill
CHF millions 2015 2014
Total carrying amount at 1 January 1'688.9 1'604.4Acquisitions 689.5 41.3Translation differences (108.1) 43.2Other changes for the period (1) (125.5) –
at 31 December 2'144.8 1'688.9
Accumulated impairment at 1 January (105.9) (63.4)Impairment (126.8) (36.6)Translation differences 6.7 (5.9)Other changes for the period (1) 125.5 –
at 31 December (100.5) (105.9)
Net carrying amount at 31 December 2'044.3 1'583.0
(1) for 2015, these two line items represent the elimination of all the goodwill in the Oilfield Solutions CGU, which is within the Energy Solutions & Specialties arm and which was consecutively removed from the financial statements
In 2015, goodwill from acquisitions amounting to CHF 689.5 million came mainly from the purchase by Imerys of 100 % of the voting rights for the main industrial minerals activities of Greek group S&B for CHF 615.8 million, together with the purchase by Ergon Capital Partners III, a subsidiary of GBL, of Golden Goose for CHF 31.9 million (see note 16).In 2014, goodwill from acquisitions amounted to CHF 41.3 million and came mainly from the acquisition of Sausalitos by Ergon Capital Partners III, a subsidiary of GBL.
Defining Imerys’ CGUs is a matter of judgement for Imerys senior management ; it is based on the existence of the following three criteria, at the level of the smallest identifiable group of assets : a homogeneous production process in terms of the mineral portfolio, processing and applications procedures ; an active market with homogeneous macro-economic features ; and a degree of operating power in terms of continuing, restructuring or closing down a mining, industrial or commercial operation. Ensuring that each CGU meets these three criteria guarantees the independence of each CGU's respective cash flows. The CGUs are the direct result of the analytical structure followed each month by Imerys senior management as part of its management reporting. All the Imerys group's assets, including mining assets and goodwill, are allocated to a CGU. The CGUs are grouped to form the Imerys operating divisions. In the following table, the carrying amount and the impairment of goodwill are shown for each group of CGUs (Energy Solutions & Specialties, Filtration & Performance Additives, Ceramic Materials, and High-Resistance Materials) with regard to the goodwill originating in Imerys. For GBL, goodwill is allocated to each shareholding.
Annual Report 2015Pargesa Holding SA Consolidated financial statements

111111
Goodwill at 31 December was allocated to the following CGUs :
CHF millionsTotal
amount
Accumu- lated
impairment
2015 Carrying amount
Total amount
Accumu- lated
impairment
2014 Carrying amount
Energy Solutions & Specialties 304.3 – 304.3 445.9 – 445.9Filtration & Performance Additives 859.0 – 859.0 249.5 – 249.5Ceramic Materials 304.8 (2.9) 301.9 308.1 (1.9) 306.2High-Resistance Materials 380.7 (74.7) 306.0 407.3 (78.7) 328.6De Boeck (GBL investment) 27.4 – 27.4 25.7 – 25.7Elitech (GBL investment) 42.1 – 42.1 42.8 – 42.8Benito (GBL investment) 27.5 (22.9) 4.6 30.5 (25.3) 5.2Sausalitos (GBL investment) 14.9 − 14.9 16.5 – 16.5Golden Goose (GBL investment) 32.5 – 32.5 – – – Holdings (Pargesa, GBL, Imerys) 151.6 – 151.6 162.6 – 162.6
Total 2'144.8 (100.5) 2'044.3 1'688.9 (105.9) 1'583.0
In accordance with IAS 36, Group companies test all their cash-generating units (CGUs) for impairment annually if there is goodwill in the unit in question.
At Imerys, systematic annual testing of every CGU is obligatory due to the presence of goodwill in almost every CGU. In 2015, this test resulted in an impairment of CHF 268.3 million being recognised on the Oilfield Solutions CGU of the Energy Solutions & Specialties (ESS) business, of which CHF 125.5 million corresponded to the entirety of goodwill and CHF 142.8 million to part of the production tools. Including inventory write-downs of CHF 23.6 million, the total losses recognised with respect to this business amounted to CHF 291.9 million. The prospects for recovery within this business, which were still considered possible at the beginning of the period, became more remote over the second half, for most observers of the oil industry. This impairment of CHF 268.3 million is recognised in “Other operating income and expenses” (see note 4). At 31 December 2015, the recoverable amount of the Oilfield Solutions CGU was EUR 157.7 million (CHF 168.3 million) based on its value in use.In 2014, the test resulted in the recognition of an impairment of CHF 36.6 million on the goodwill of the Zircon CGU of the High-Resistance Minerals arm.The recoverable amount is the higher of the fair value less net selling price and the value in use of a CGU or an individual asset. In practice, fair value can only be estimated reliably for individual assets, in which case it corresponds to prices for recent transactions concerning similar asset disposals. The value in use is the basis most often used for valuation, both for CGUs and individual assets. The forecast cash flows used by Imerys to estimate the value in use originated in their 2016 budget and an extrapolation for 2017 and 2018. The key hypotheses behind these forecasts are first and foremost the level of volumes and, to a lesser extent, the price level. For the terminal value, Imerys uses Gordon and Shapiro's perpetual growth model.The discount rate used to calculate the value in use is determined from the weighted average capital cost of groups comparable to Imerys in the industrial minerals sector. The rate – 6.75 % in 2015 (8.00 % in 2014) – is adjusted, depending on the CGU or individual assets tested, by a country/market risk premium of 0 to +200 basis points (–50 to +170 basis points in 2014). The discount rate after income tax averaged 6.96 % in 2015 (8.04 % in 2014). The results of the post-income tax calculation are the same as would be obtained using pre-tax flows and rates, as required by the applicable standards.
Pargesa Holding SA Annual Report 2015 Consolidated financial statements
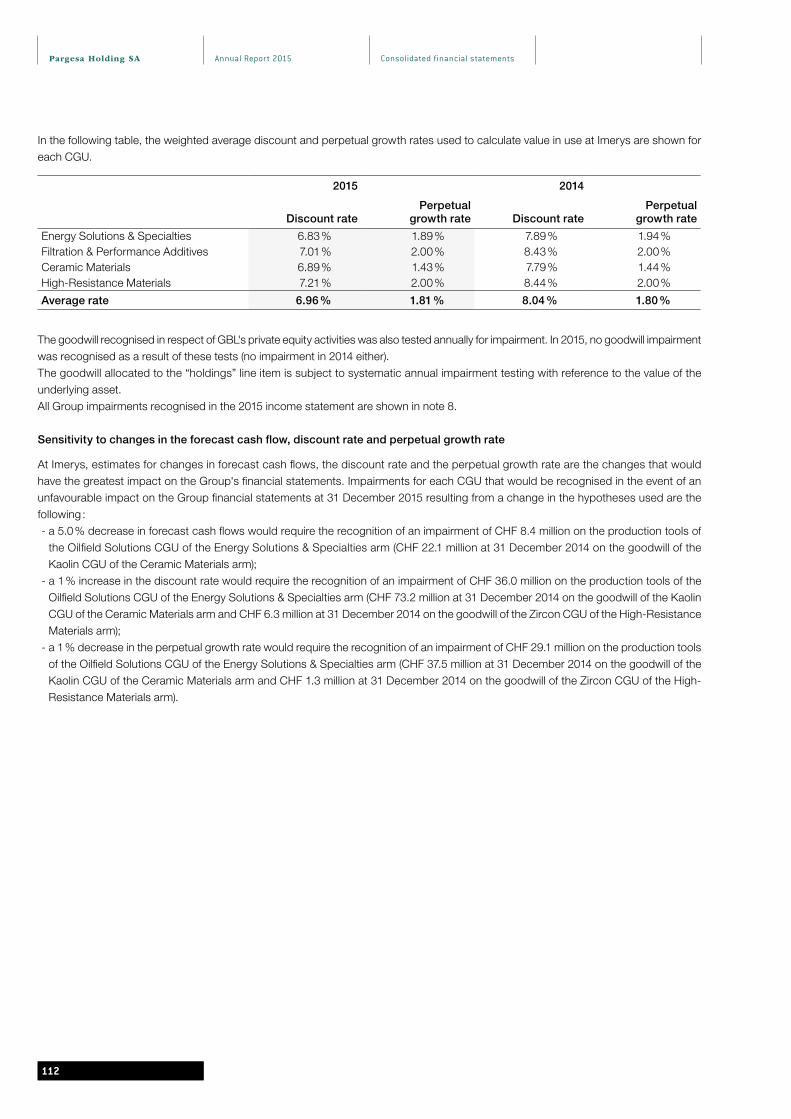
112112
In the following table, the weighted average discount and perpetual growth rates used to calculate value in use at Imerys are shown for each CGU.
2015 2014
Discount ratePerpetual
growth rate Discount ratePerpetual
growth rate
Energy Solutions & Specialties 6.83 % 1.89 % 7.89 % 1.94 %Filtration & Performance Additives 7.01 % 2.00 % 8.43 % 2.00 %Ceramic Materials 6.89 % 1.43 % 7.79 % 1.44 %High-Resistance Materials 7.21 % 2.00 % 8.44 % 2.00 %
Average rate 6.96 % 1.81 % 8.04 % 1.80 %
The goodwill recognised in respect of GBL's private equity activities was also tested annually for impairment. In 2015, no goodwill impairment was recognised as a result of these tests (no impairment in 2014 either).The goodwill allocated to the “holdings” line item is subject to systematic annual impairment testing with reference to the value of the underlying asset.All Group impairments recognised in the 2015 income statement are shown in note 8.
Sensitivity to changes in the forecast cash flow, discount rate and perpetual growth rate
At Imerys, estimates for changes in forecast cash flows, the discount rate and the perpetual growth rate are the changes that would have the greatest impact on the Group's financial statements. Impairments for each CGU that would be recognised in the event of an unfavourable impact on the Group financial statements at 31 December 2015 resulting from a change in the hypotheses used are the following :- a 5.0 % decrease in forecast cash flows would require the recognition of an impairment of CHF 8.4 million on the production tools of
the Oilfield Solutions CGU of the Energy Solutions & Specialties arm (CHF 22.1 million at 31 December 2014 on the goodwill of the Kaolin CGU of the Ceramic Materials arm);
- a 1 % increase in the discount rate would require the recognition of an impairment of CHF 36.0 million on the production tools of the Oilfield Solutions CGU of the Energy Solutions & Specialties arm (CHF 73.2 million at 31 December 2014 on the goodwill of the Kaolin CGU of the Ceramic Materials arm and CHF 6.3 million at 31 December 2014 on the goodwill of the Zircon CGU of the High-Resistance Materials arm);
- a 1 % decrease in the perpetual growth rate would require the recognition of an impairment of CHF 29.1 million on the production tools of the Oilfield Solutions CGU of the Energy Solutions & Specialties arm (CHF 37.5 million at 31 December 2014 on the goodwill of the Kaolin CGU of the Ceramic Materials arm and CHF 1.3 million at 31 December 2014 on the goodwill of the Zircon CGU of the High-Resistance Materials arm).
Annual Report 2015Pargesa Holding SA Consolidated financial statements

113113
Note 13 – Tangible assets
CHF millionsLand and buildings
Mining asssets
Facilities machinery,
plant and transport
equipment
Fixed assets under
construction
Other tangible
assets Total
Total carrying amount :at 1 January 2014 625.1 858.3 3'741.2 349.1 31.1 5'604.8Investments 8.4 55.1 71.2 150.0 4.3 289.0Acquisitions 6.2 (8.0) 32.2 5.8 0.4 36.6Disposals (2.9) (1.7) (48.3) (0.2) (0.6) (53.7)Translation differences 14.6 40.9 133.5 7.2 1.3 197.5Reclassifications and other changes for the period 16.4 (22.9) 330.0 (360.1) (2.9) (39.5)
at 31 December 2014 667.8 921.7 4'259.8 151.8 33.6 6'034.7
Investments 4.9 57.4 36.5 146.0 3.7 248.5Acquisitions 49.5 88.8 378.1 8.6 2.5 527.5Disposals (4.3) (0.9) (49.1) (1.0) (0.3) (55.6)Translation differences (62.3) (75.7) (303.3) (11.2) (1.5) (454.0)Reclassifications and other changes for the period 10.8 (23.2) (76.0) (91.1) (3.2) (182.7)
at 31 December 2015 666.4 968.1 4'246.0 203.1 34.8 6'118.4
Accumulated depreciation and impairment:at 1 January 2014 (270.5) (332.5) (2'697.8) (2.9) (12.2) (3'315.9)Depreciation (17.4) (58.9) (178.0) – (2.1) (256.4)Impairment (0.1) – (5.6) (1.6) – (7.3)Disposals 2.7 – 47.5 – 0.4 50.6Translation differences (5.5) (15.6) (87.5) 0.1 (0.2) (108.7)Reclassifications and other changes for the period – 38.1 (23.1) 2.1 1.1 18.2
for the period (290.8) (368.9) (2'944.5) (2.3) (13.0) (3'619.5)
Depreciation (17.8) (54.6) (162.8) – (2.8) (238.0)Impairment (20.3) (5.1) (99.4) (1.0) – (125.8)Disposals 3.4 0.9 50.2 – 0.2 54.7Translation differences 26.2 25.4 202.8 0.2 0.9 255.5Reclassifications and other changes for the period (8.4) 34.2 (90.5) – 0.7 (64.0)
at 31 December 2015 (307.7) (368.1) (3'044.2) (3.1) (14.0) (3'737.1)
Net carrying amount :at 31 December 2014 377.0 552.8 1'315.3 149.5 20.6 2'415.2at 31 December 2015 358.7 600.0 1'201.8 200.0 20.8 2'381.3
At 31 December 2015, Group tangible assets mainly comprised Imerys assets, including the mining reserves measured at cost less depreciation and any accumulated impairments.The impairments recorded on tangible assets during the period essentially relate to Imerys (see note 8).Depreciation for the period is included in the “depreciation of tangible assets and amortisation of intangible assets” line in the income statement.
Leased assets
Tangible assets controlled by a finance lease are shown on the balance sheet as amounting to CHF 2.6 million at 31 December 2015 (CHF 3.1 million at 31 December 2014). Leased assets are essentially Imerys' transport equipment. The discounted value of commitments in respect of future rent payments is CHF 0.4 million for 2016, CHF 0.8 million for the 2017-2020 period and CHF 1.4 million beyond that period.
Pargesa Holding SA Annual Report 2015 Consolidated financial statements

114114
Note 14 – List of main consolidated and equity-accounted companies
Organisation chart showing the main consolidated and equity-accounted companies
PargesaNetherlands
PargesaHolding
GBL
Imerys
GroupeDe Boeck
ELITechGroup
Benito
Sausalitos
Ergon CapitalPartners II
Ergon CapitalPartners
KartesiaManagement
KartesiaCredit Op.
I.P.E.GoldenGoose
MérieuxParticipations II
Annual Report 2015Pargesa Holding SA Consolidated financial statements
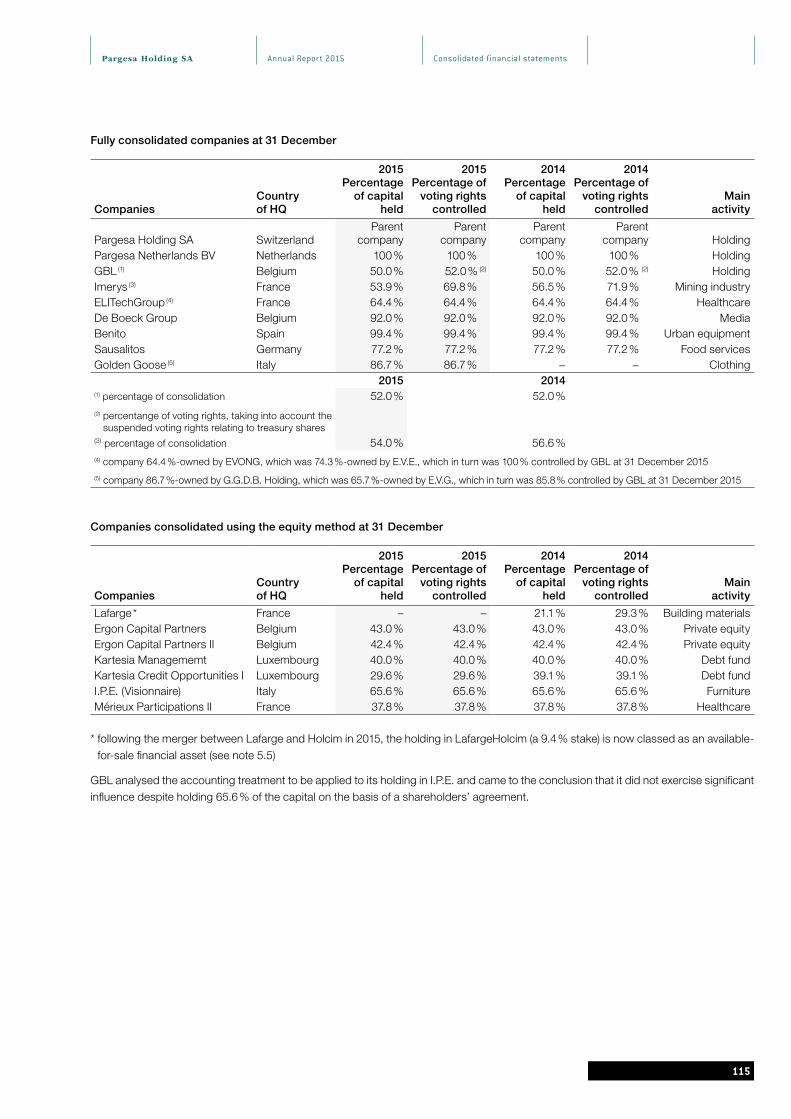
115115
Fully consolidated companies at 31 December
CompaniesCountry of HQ
2015 Percentage
of capital held
2015 Percentage of
voting rights controlled
2014 Percentage
of capital held
2014 Percentage of
voting rights controlled
Main activity
Pargesa Holding SA SwitzerlandParent
companyParent
companyParent
companyParent
company HoldingPargesa Netherlands BV Netherlands 100 % 100 % 100 % 100 % HoldingGBL (1) Belgium 50.0 % 52.0 % (2) 50.0 % 52.0 % (2) HoldingImerys (3) France 53.9 % 69.8 % 56.5 % 71.9 % Mining industryELITechGroup (4) France 64.4 % 64.4 % 64.4 % 64.4 % HealthcareDe Boeck Group Belgium 92.0 % 92.0 % 92.0 % 92.0 % MediaBenito Spain 99.4 % 99.4 % 99.4 % 99.4 % Urban equipmentSausalitos Germany 77.2 % 77.2 % 77.2 % 77.2 % Food servicesGolden Goose (5) Italy 86.7 % 86.7 % − − Clothing
2015 2014(1) percentage of consolidation 52.0 % 52.0 %(2) percentange of voting rights, taking into account the
suspended voting rights relating to treasury shares(3) percentage of consolidation 54.0 % 56.6 %(4) company 64.4 %-owned by EVONG, which was 74.3 %-owned by E.V.E., which in turn was 100 % controlled by GBL at 31 December 2015
(5) company 86.7 %-owned by G.G.D.B. Holding, which was 65.7 %-owned by E.V.G., which in turn was 85.8 % controlled by GBL at 31 December 2015
Companies consolidated using the equity method at 31 December
CompaniesCountry of HQ
2015 Percentage
of capital held
2015 Percentage of
voting rights controlled
2014 Percentage
of capital held
2014 Percentage of
voting rights controlled
Main activity
Lafarge * France – – 21.1 % 29.3 % Building materialsErgon Capital Partners Belgium 43.0 % 43.0 % 43.0 % 43.0 % Private equityErgon Capital Partners II Belgium 42.4 % 42.4 % 42.4 % 42.4 % Private equityKartesia Managememt Luxembourg 40.0 % 40.0 % 40.0 % 40.0 % Debt fundKartesia Credit Opportunities I Luxembourg 29.6 % 29.6 % 39.1 % 39.1 % Debt fundI.P.E. (Visionnaire) Italy 65.6 % 65.6 % 65.6 % 65.6 % FurnitureMérieux Participations II France 37.8 % 37.8 % 37.8 % 37.8 % Healthcare
* following the merger between Lafarge and Holcim in 2015, the holding in LafargeHolcim (a 9.4 % stake) is now classed as an available-for-sale financial asset (see note 5.5)
GBL analysed the accounting treatment to be applied to its holding in I.P.E. and came to the conclusion that it did not exercise significant influence despite holding 65.6 % of the capital on the basis of a shareholders’ agreement.
Pargesa Holding SA Annual Report 2015 Consolidated financial statements

116116
Note 15 – Subsidiaries with material non-controlling interestsThe tables below show details of each Group subsidiary with material non-controlling interests, before intragroup eliminations.
As Imerys is held by GBL, minority interests in Imerys are also found in the GBL column and are consequently eliminated in the “intragroup eliminations” column.
CHF millions GBL Imerys
Individual non-material subsidiaries
Intragroup eliminations
2015
Total
% of ownership interests held by non-controlling interests 50.0 % 46.1 %
% of voting rights held by non-controlling interests 48.0 % 30.2 %
Long-term assets 18'704.8 4'550.6
Short-term assets 3'564.7 2'150.5
Long-term liabilities (4'757.6) (2'416.1)
Short-term liabilities (1'610.4) (1'382.5)
Non-controlling interests (1'409.9) (30.2)
Equity attributable to the Group 14'491.6 2'872.3
Non-controlling interests 8'371.9 1'351.1 58.8 (1'122.9) 8'658.9
Revenue 4'687.6 4'361.3
Net profit attributable to Pargesa shareholders (Group share) 569.1 39.4
Net profit attributable to non-controlling interests 557.7 34.4 (2.9) 55.2 644.4
Net profit for the period (including minority interests) 1'126.8 73.8
Other comprehensive income attributable to Pargesa shareholders (Group share) (332.2) 17.2
Other comprehensive income attributable to non-controlling interests (288.8) 14.8 3.1 (1'000.9) (1'271.8)
Total other comprehensive income (including minority interests) (621.0) 32.0
Total comprehensive income attributable to Pargesa shareholders (Group share) 236.9 56.6
Total comprehensive income attributable to non-controlling interests 268.9 49.2 0.2 (945.7) (627.4)
Total comprehensive income for the period (including minority interests) 505.8 105.8
Dividends paid to non-controlling interests 222.1 65.1
Net cash flows from operations 1'401.6 635.3
Net cash flows from investments (1'370.4) (649.7)
Net cash flows from financing (565.1) (219.1)
Effect of exchange rate variation on funds held and of changes in the scope of consolidation (34.1) (24.0)
Increase/decrease in cash and cash equivalents (568.0) (257.5)
Annual Report 2015Pargesa Holding SA Consolidated financial statements

117117
CHF millions GBL Imerys
Individual non-material subsidiaries
Intragroup eliminations
2014
Total
% of ownership interests held by non-controlling interests 50.0 % 43.5 %
% of voting rights held by non-controlling interests 48.0 % 28.1 %
Long-term assets 19'003.7 4'018.5
Short-term assets 4'783.2 2'502.5
Long-term liabilities (5'095.3) (2'551.4)
Short-term liabilities (1'399.5) (998.5)
Non-controlling interests (1'336.7) (31.4)
Equity attributable to the Group 15'955.4 2'939.7
Non-controlling interests 8'998.3 1'307.1 29.6 (1'019.1) 9'315.9
Revenue 4'759.0 4'479.0
Net profit attributable to Pargesa shareholders (Group share) 552.5 186.7
Net profit attributable to non-controlling interests 653.5 145.2 (2.2) (45.0) 751.5
Net profit for the period (including minority interests) 1'206.0 331.9
Other comprehensive income attributable to Pargesa shareholders (Group share) 43.6 58.0
Other comprehensive income attributable to non-controlling interests 89.4 47.0 2.7 (334.7) (195.6)
Total other comprehensive income (including minority interests) 133.0 105.0
Total comprehensive income attributable to Pargesa shareholders (Group share) 596.1 244.7
Total comprehensive income attributable to non-controlling interests 742.9 192.2 0.5 (379.7) 555.9
Total comprehensive income for the period (including minority interests) 1'339.0 436.9
Dividends paid to non-controlling interests 245.8 68.7
Net cash flows from operations 691.6 593.1
Net cash flows from investments 27.8 (282.8)
Net cash flows from financing (312.6) 54.3
Effect of exchange rate variation on funds held and of changes in the scope of consolidation 8.5 12.5
Increase/decrease in cash and cash equivalents 415.3 377.1
Pargesa Holding SA Annual Report 2015 Consolidated financial statements

118118
Note 16 – Acquisitions and disposals of subsidiaries
The following key acquisitions were made in 2015 :
On 26 February 2015, Imerys acquired 100 % of the voting rights corresponding to the main industrial minerals activities of Greek group S&B, i.e. bentonite (binders for foundry, sealing solutions, and additives for drilling and for consumer products), continuous casting fluxes for the steel industry, wollastonite (functional additives for polymers and paints), and perlite-based solutions for building materials and horticulture. These businesses were acquired from the Kyriacopoulos family and the Rhône Capital investment fund for EUR 623.8 million (CHF 665.7 million), with EUR 339.8 million (CHF 362.6 million) paid in cash, EUR 263.0 million (CHF 280.7 million) in Imerys shares, and EUR 21.0 million (CHF 22.4 million) in the form of an additional performance-related amount. Upon the acquisition of the controlling interest, the cash remitted to the seller was funded out of the bonds issued by Imerys in December 2014 and the share consideration by the issuance of 3.7 million Imerys shares, as part of a reserved capital increase. When the transaction was finalised, the Kyriacopoulos family held approximately a 4.7 % interest in the capital of Imerys SA, and GBL’s holding was diluted slightly to 53.9 % at 31 December 2015 (56.5 % at 31 December 2014).Independent experts were appointed to assess the fair value of most of the assets and liabilities that could be identified on the date when the controlling interest was acquired. At 31 December 2015, mineral reserves, tangible and intangible assets, inventories, the high-yield bond issue (level 1 fair value), employee benefits, provisions, and income tax assets and liabilities were recorded on the basis of the valuation reports available. They may be subject to final adjustment in 2016. The goodwill resulting from the difference between these revalued net assets and the investment value thus came to a provisional amount of EUR 577.0 million (CHF 615.8 million) at 31 December 2015. From the date it was acquired, the S&B group contributed EUR 352.5 million (CHF 376.2 million) to revenue and EUR 19.6 million (CHF 20.9 million) to net income. If the acquisition had taken place on 1 January 2015, the group would have contributed EUR 416.5 million (CHF 444.5 million) to revenue and EUR 22.4 million (CHF 23.9 million) to net income.
Details of the S&B acquisition
CHF millions S&BLong-term assets 375.2Short-term assets 242.3Long-term liabilities (469.9)Short-term liabilities (96.7)Non-controlling interests (0.9)Net assets acquired 50.0Goodwill 615.8Total consideration 665.8
Paid- in cash (362.7)- in shares delivered (267.9)- in shares to be delivered (12.8)- in future installments (22.4)Net cash outflows and share payments relating to the acquisition- cash and share payments (665.8)- cash and bank balances acquired 85.5Total cash outflows and share payments relating to the acquisition (580.3)
On 30 October 2015, Imerys acquired 100 % of the voting rights of the Precipitated Calcium Carbonate (PCC) division of Belgian group Solvay, representing four plants in Europe (Austria, France, Germany and the United Kingdom). This activity is Europe’s leading producer of fine and ultra-fine PCC used as functional additives and mainly serves the automotive (polymers), construction (paints, coatings, sealants) and consumer goods (health & beauty) markets. The acquisition price was EUR 29.0 million (CHF 30.9 million), of which EUR 27.6 million (CHF 29.5 million) was paid in cash on the date the controlling interest was acquired. Independent experts were appointed to assess the fair value of most of the assets and liabilities that could be identified on the date when the controlling interest was acquired. The goodwill resulting from the difference between these partially revalued net assets and the investment value thus came to a provisional amount of EUR 14.4 million (CHF 15.4 million) at 31 December 2015. Following the acquisition, the PCC division of the Solvay group contributed of EUR 8.3 million (CHF 8.9 million) to revenue and EUR –0.2 million (CHF –0.2 million) to net income.
Annual Report 2015Pargesa Holding SA Consolidated financial statements

119119
If the acquisition had been completed at 1 January 2015, the contribution to revenue would have been EUR +51.6 million (CHF +55.1 million) and EUR 0 million (CHF 0 million) to net income.In 2015, Imerys also conducted other less significant acquisitions. These acquisitions, which were paid for in cash for a total amount of EUR 42.3 million (CHF 45.1 million) generated provisional goodwill of EUR 25.1 million (CHF 26.8 million).
On 19 May 2015, Ergon Capital Partners III acquired an indirect majority stake in Golden Goose S.r.l., an Italian designer of contemporary shoes, clothes and accessories. The purchase price was EUR 109 million (CHF 116 million), with EUR 87 million (CHF 93 million) paid in cash, EUR 4 million (CHF 4 million) in the form of a deferred payment due in April 2016, and EUR 18 million (CHF 19 million) in the form of an additional performance-related amount. The net cash impact of the acquisition was EUR 88 million (CHF 94 million). Goodwill after recognition of the acquisition was EUR 30 million (CHF 32 million). The acquisition made a CHF 0 million contribution to Group net income.
The following key acquisitions were made in 2014 :
On 15 July 2014, Ergon Capital Partners III, a subsidiary of GBL, acquired 77.2 % of Frisco Bay Holding GmbH (Sausalitos group), a fast-growing and novel restaurant chain in Germany. The group's balance sheet at 30 June 2014 was used as the opening balance sheet. Goodwill after recognition of the acquisition was EUR 14 million (CHF 17 million) and the net outflow of cash was EUR 35 million (CHF 42.5 million). The acquisition contributed EUR 19 million (CHF 23 million) to Group revenue and had an impact of EUR –1 million (CHF –1.2 million) on Group net income.
Disposals of subsidiaries
During the 2015 and 2014 financial years, no disposals had a material impact.
Other
On 7 March 2014, at the end of a friendly cash takeover bid announced one month earlier for Amcol, a global leader in bentonite listed on the New York Stock Exchange, Imerys decided not to raise its last bid. The agreements entered into with Amcol were terminated, giving right to the payment by Amcol of a termination penalty, which after deduction of the other costs of the transaction amounted to EUR 20.9 million (CHF 25.4 million).
Note 17 – Investments in associates and joint ventures
CHF millions 2015 2014
Carrying amount at 1 January 4'224.7 3'997.6Acquisitions 107.5 107.6Disposals and redemption (38.3) (43.8)Income (77.6) 91.8Dividend paid (110.1) (108.4)Translation and other differences (1) (425.8) 179.9Reclassifications (2) (3'322.0) –
Carrying amount at 31 December 358.4 4'224.7
(1) this line item includes translation differences relating to Lafarge
(2) this line item represents the reclassification in 2015 of Lafarge as an asset held for sale at 30 June 2015 ; in July 2015, the new LafargeHolcim shares were then classed as available-for-sale financial assets
Acquisitions in 2015 include GBL's additional investment in Kartesia (an investment fund) and Imerys' acquisitions.2014 acquisitions represent the investment by Ergon Capital Partners III, a subsidiary of GBL, in Visionnaire, Italy’s leading luxury furniture designer, and the investment by GBL in Kartesia (an investment fund).
Pargesa Holding SA Annual Report 2015 Consolidated financial statements

120120
Analysis of investments in associates and joint ventures
CHF millions 2015 2014
Lafarge – 3'915.5Ergon Capital Partners I and II 46.3 99.5Other GBL and Imerys equity associates 312.1 209.7
Carrying amount at 31 December 358.4 4'224.7
Following the merger in 2015 of Lafarge and Holcim, the new LafargeHolcim shares were classified as available-for-sale financial assets (see note 5.5).
Ergon Capital Partners I and II are unlisted companies and are part of the “holdings” sector in the segment reporting. At 31 December 2014, the market value (level 1 under IFRS 13) of the holding in Lafarge was EUR 3’518 million (CHF 4’231 million). At 31 December 2015, no listed companies were accounted for using the equity method.
“Other GBL and Imerys equity associates” is made up of various equity-accounted holdings at GBL and Imerys ; at 31 December 2015, the largest holdings in terms of equity-accounted value were : Kartesia (associate), for an amount of CHF 126.1 million (CHF 62.3 million at 31 December 2014) ; Visionnaire (associate), for an amount of CHF 39.5 million (CHF 41.1 million at 31 December 2014) ; Mérieux Participations II (associate), for an amount of CHF 9.3 million (CHF 6.1 million at 31 December 2014) ; MST Mineralien Schiffahrt (associate), for an amount of CHF 46.7 million (CHF 46.7 million at 31 December 2014) ; and The Quartz Corporation (joint venture), for an amount of CHF 28.1 million (CHF 30.1 million at 31 December 2014).
Holcim-Lafarge merger
In H1 2015, the Boards of Directors of Holcim and Lafarge announced that they had reached an agreement on revised terms for the merger of equals initiated between the two groups in 2014. The parties agreed on a new exchange ratio of 9 Holcim shares for 10 Lafarge shares. On 1 June 2015, Holcim launched its public exchange offer for all Lafarge shares. At the end of the reopening period, 96.4 % of Lafarge's shares had been tendered to the offer. A squeeze-out was then launched and successfully completed on 23 October 2015. In September 2015, the new entity, LafargeHolcim, distributed a scrip dividend at a ratio of one new LafargeHolcim share for every 20 existing shares (with no impact on the income statement, in accordance with IFRS).
At 30 June 2015, GBL considered that the merger was highly probable, given the progress made in the merger project in Q2 2015. As a result :• GBL recognised its holding in Lafarge using the equity method until 30 June 2015 ;• the holding was reclassified under “assets held for sale” and recognised at its fair value at 30 June 2015, which led to a partial reversal
of CHF 430.2 million of the impairment previously recorded. This reversal was the result of the holding in Lafarge being recognised at its fair value at 30 June 2015 (it had previously been accounted for using the equity method).
The following impacts were also recorded in Q3 2015 :• the impairment previously recorded on Lafarge was further partly reversed as a result of the loss of influence in the new LafargeHolcim
group since 10 July 2015 and the reclassification of the holding as an available-for-sale financial asset ; the partial reversal corresponded to the change in the market price of the holding between (i) 30 June 2015 and (ii) 10 July 2015, i.e. CHF 231.7 million ;
• the other comprehensive income attributable to Lafarge and recognised in Group equity since the holding was first accounted for using the equity method on 1 January 2008 was recognised in the income statement. This had a negative impact on Group net income of CHF 192.5 million.
The total impact of the merger amounted to CHF 469.4 million. At 31 December 2015, GBL held 9.4 % of the new entity.
As the holding in LafargeHolcim is classified as an “available-for-sale financial asset”, accounting rules specific to this asset category will now be applied, particularly as regards the contribution to income (dividend) and the recognition of impairments.
Annual Report 2015Pargesa Holding SA Consolidated financial statements

121121
Main judgements and accounting estimates
At 31 December 2015, the fair value of the holding in LafargeHolcim, which has been classed as an available-for-sale financial assest since Q3 2015, was lower than its cost. However, GBL did not consider there to be any objective indication of impairment at that date, as the drop in fair value was below 29.74 %. This does not constitute a significant (i.e. more than 30 %) or a prolonged (i.e. more than one year) decline in the fair value, as defined in the Group's measurement rules (see also note 27).
Analysis of income from associates and joint ventures
CHF millions 2015 2014Lafarge (H1 2015 contribution) (107.1) 36.6Ergon Capital Partners I and II 12.7 52.0Other GBL and Imerys equity associates 16.8 3.2
Income from associates and joint ventures (77.6) 91.8
In 2015, the contribution from Ergon Capital Partners I and II included a gain of EUR 14.2 million (CHF 15.2 million) on the disposal of the majority holding in Joris Ide, a leader in insulating sandwich panels and steel profiles.In 2014, the contribution from Ergon Capital Partners I and II included a gain of CHF 31.0 million on the disposal of its holding in Zellbios, a leader in the production of active pharmaceutical ingredients, and a gain of CHF 23.0 million on the disposal of Corialis, a leading European manufacturer of insulating and lacquered profiles in aluminium for doors, windows and verandas.
The table below provides a summary of the financial information for Lafarge, the Group's main associate until 30 June 2015, as well as the other equity-accounted companies. This summary shows the amounts recorded in the companies' financial statements, which are drawn up in accordance with IFRS.
CHF millions Lafarge Other
2015
Total Lafarge Other
2014
TotalLong-term assets – 783.0 783.0 34'794.8 746.1 35'540.9
Short-term assets – 303.3 303.3 7'060.5 335.6 7'396.1
Long-term liabilities – (211.8) (211.8) (14'550.3) (254.1) (14'804.4)
Short-term liabilities – (82.8) (82.8) (6'513.3) (191.8) (6'705.1)
Non-controlling interests – – – (2'208.0) – (2'208.0)
Equity attributable to the Group – 791.7 791.7 18'583.7 635.8 19'219.5
Percentage of capital held – – – 21.1 % – –
Share of equity – 352.8 352.8 3'915.5 302.9 4'218.4
Goodwill – 5.6 5.6 – 6.3 6.3
Carrying amount at 31 December – 358.4 358.4 3'915.5 309.2 4'224.7
Revenue 6'743.6 397.2 7'140.8 15'596.5 302.4 15'898.9
Income from continued operations (441.8) 70.9 (370.9) 332.7 130.7 463.4
Net profit for the period (including minority interests) (441.8) 70.9 (370.9) 332.7 130.7 463.4
Net profit attributable to Group shareholders (509.1) 70.9 (438.2) 173.7 130.7 304.4
Other comprehensive income 595.3 – 595.3 1'413.1 – 1'413.1
Total comprehensive income for the period 153.5 70.9 224.4 1'745.8 130.7 1'876.5
Dividends received over the period 82.3 27.8 110.1 73.5 34.9 108.4
Group share of income for the period (107.1) 29.5 (77.6) 36.6 55.2 91.8
Pargesa Holding SA Annual Report 2015 Consolidated financial statements

122122
Note 18 – Inventories
CHF millions 2015 2014
Raw materials, consumables and spare parts 366.0 366.4Work in progress 85.9 91.3Finished goods and products 455.8 434.7
Total before write-downs 907.7 892.4
Write-downs on inventoriesRaw materials, consumables and spare parts (38.2) (20.8)Work in progress (0.8) (1.2)Finished goods and products (38.6) (42.7)Total write-downs on inventories (77.6) (64.7)
Reversal of write-downs on inventoriesRaw materials, consumables and spare parts 6.7 4.1Work in progress 0.3 0.5Finished goods and products 6.0 6.9Total reversal of write-downs on inventories 13.0 11.5
Net total 843.1 839.2
Inventories expensed during the year
CHF millions 2015 2014
Income (charge) (12.6) 47.3
Note 19 – Provisions
CHF millions Environment Litigation
Legal, labour-related and
regulatory risks
2015 2014
Total Total
at 1 January 185.3 31.5 127.5 344.3 319.4Allocations 1.5 7.0 40.1 48.6 89.9Utilisations (9.2) (3.9) (26.5) (39.6) (30.4)Reversals (5.1) (1.5) (12.7) (19.3) (20.3)
Acquisitions 30.5 – 19.2 49.7 (7.9)Translation differences (8.0) (2.9) (11.7) (22.6) 8.2Other 4.2 (0.1) (10.1) (6.0) (14.6)
at 31 December 199.2 30.1 125.8 355.1 344.3
- short-term provisions 8.5 – 14.1 22.6 29.2- long-term provisions 190.7 30.1 111.7 332.5 315.1
The Group’s provisions amounted to CHF 351.3 million at 31 December 2015 and mainly originated in the Imerys group.Imerys has provisions to hedge the environmental risks resulting from the group’s industrial operations and provisions for the restoration of sites no longer mined. These provisions amounted to CHF 199.1 million at 31 December 2015 (CHF 185.1 million at 31 December 2014), including CHF 130.7 million for the restoration of mining sites. CHF 69.5 million of the corresponding liabilities have probable due dates between 2016 and 2020, CHF 78.0 million between 2021 and 2030 and CHF 51.6 million after 2031.Imerys’ litigation provisions (i.e. for product guarantees), which amounted to CHF 29.8 million (CHF 30.7 million at 31 December 2014), have a probable due date between 2016 and 2020.Imerys is also exposed to litigation and claims in the course of its ordinary operations. These risks concern allegations of personal or financial damage issued by third parties and involving the civil liability of group companies, and possible breaches of some of their contractual obligations or of legal or regulatory requirements relating to labour, property or environmental matters. Imerys group is also required to respect certain contractual obligations in relation to compensation for the past disposal of assets. The provision for Imerys’ legal, labour-related and regulatory risks amounted to CHF 122.4 million at 31 December 2015 (CHF 124.2 million at 31 December 2014). Most of these provisions are likely to mature between 2016 and 2020.
Annual Report 2015Pargesa Holding SA Consolidated financial statements

123123
Note 20 – Share capital, treasury shares, equity and other comprehensive income20.1 Share capital
Registered shares Bearer shares Total sharesCHF millions Number Par value (1) Number Par value (2) Number (3) Par value
Share capital at 1 January 2014 77'214'700 154.4 77'214'700 1'544.3 84'936'170 1'698.7Share capital at 31 December 2014 77'214'700 154.4 77'214'700 1'544.3 84'936'170 1'698.7Share capital at 31 December 2015 77'214'700 (4) 154.4 77'214'700 (4) 1'544.3 84'936'170 1'698.7
Share capital outstanding at 31 December 2015Share capital 77'214'700 154.4 77'214'700 1'544.3 84'936'170 1'698.7Treasury shares (5) (276'980) (5.5) (276'980) (5.5)Net share capital outstanding 77'214'700 154.4 76'937'720 1'538.8 84'659'190 1'693.2
(1) CHF 2 per share(2) CHF 20 per share(3) the number of registered shares is converted into the equivalent number of bearer shares by dividing by ten(4) each share carries one vote(5) these shares do not give entitlement to dividends or voting right
On 1 June 1994, the Company created conditional capital with a par value of up to CHF 242 million by issuing 11’000’000 registered shares with a par value of CHF 2 and 11’000’000 bearer shares with a par value of CHF 20.
On 6 May 2014, the Company renewed its authorised capital. Consequently, the Board of Directors is authorised to increase the share capital, up to 6 May 2016, by CHF 253 million by issuing 11’500’000 new registered shares with a par value of CHF 2 and 11’500’000 new bearer shares with a par value of CHF 20.
Bearer shares are listed on the SIX Swiss Exchange.
20.2 Treasury shares (1)
Not yet outstanding, reserved for Board
use
Not yet outstanding, reserved for the exercise
of options (2)
Total
Carrying Carrying CarryingCHF millions Number amount Number amount Number amount
1 January 2014 146'706 2.9 145'484 2.9 292'190 5.8Granting of options (23'930) (0.5) 23'930 0.5 – –Exercise of options – – (15'210) (0.3) (15'210) (0.3)31 December 2014 122'776 2.4 154'204 3.1 276'980 5.5
Granting of options (26'780) (0.5) 26'780 0.5 – –
31 December 2015 95'996 1.9 180'984 3.6 276'980 5.5
(1) treasury shares are all bearer shares
(2) shares, not yet outstanding, reserved for the exercise of options granted to the beneficiaries of share option schemes established by the Company (see note 24.1)
20.3 Capital managementManagement of the consolidated equity of Pargesa Group is aimed at maintaining a highly capitalised financial structure with a low debt-equity ratio. It is also aimed at generating stable or increasing dividends for its shareholders, through a regular and sustained increase in net profit. The Group manages its capital structure as a function of its financial needs, taking into account economic and financial conditions and opportunities, and also the risk characteristics of its main assets. With a view to maintaining or adjusting the structure of its capital, the Group may, at its various levels, issue new shares, hybrid instruments or buy its own shares. There was no change in the Group's capital management policy during the period. The Group is not subject to external regulatory requirements regarding its capital.
Pargesa Holding SA Annual Report 2015 Consolidated financial statements

124124
CHF millions 31.12.2015 31.12.2014
Total financial debt 4'848.8 4'699.7Cash and cash equivalents (1'028.3) (1'778.7)Net financial debt 3'820.5 2'921.0
Shareholders' equity (including minority interests) 15'669.9 17'040.9
20.4 Reclassification adjustments carried through the income statement
CHF millions 2015 2014
Change in fair value of available-for-sale financial assets :- recognised in other comprehensive income (801.7) 370.9- carried through the income statement (373.8) (1'175.5) (799.9) (429.0)
Change in hedging reserve :- recognised in other comprehensive income (25.3) (11.1)- carried through the income statement 24.6 (0.7) 1.4 (9.7)
Translation differences : - recognised in other comprehensive income (1'656.8) (143.3)- carried through the income statement 4.1 (1'652.7) (0.9) (144.2)
Actuarial gains/losses :- recognised in other comprehensive income 48.2 48.2 (97.4) (97.4)
Share of other comprehensive income of associates and joint ventures :- recognised in other comprehensive income 119.6 269.0- carried through the income statement 194.0 313.6 – 269.0
Other equity items : - recognised in other comprehensive income – (0.4)- carried through the income statement – – – (0.4)
Total other comprehensive income (2'467.1) (411.7)
20.5 Change in revaluation and hedging reserve (Pargesa Group share)
2015 2014Revaluation Hedging Revaluation Hedging
CHF millions reserve reserve Total reserve reserve Total
Balance at 1 January 1'942.3 (5.4) 1'936.9 2'146.4 (0.5) 2'145.9Change in fair value recognised in equity (404.0) – (404.0) 210.6 – 210.6Change in fair value carried through the income statement (148.7) – (148.7) (414.7) – (414.7)Total change in fair value (552.7) (204.1)Change in hedging reserverecognised in equity – (9.1) (9.1) – (5.3) (5.3)Change in hedging reservecarried through the income statement – 7.8 7.8 – 0.4 0.4Total change in hedging reserve (1.3) (4.9)
Balance at 31 December 1'389.6 (6.7) 1'382.9 1'942.3 (5.4) 1'936.9
20.6 Impact of a change in percentage interest in subsidiaries not resulting in a loss of control
During the period, the consolidated percentage of interests in GBL remained stable. It was 52.0 % at 31 December 2015 (52.0 % at 31 December 2014). GBL bought and sold treasury shares during 2015. Following these movements in 2015, a negative amount of CHF 1.2 million (Group share) was recognised in equity in the consolidated reserves (CHF –2.7 million in 2014).
Annual Report 2015Pargesa Holding SA Consolidated financial statements

125125
Note 21 – Dividend paid and proposed by Pargesa Holding SA
CHF millions 2015 2014
Dividend for the previous period paid during the year 192.2 223.5- CHF per bearer share 2.27 2.64- CHF per registered share 0.227 0.264
Dividend proposed for the period ending 31 December 2015 201.5- CHF per bearer share 2.38- CHF per registered share 0.238
The proposed dividend will be submitted for approval at the Annual General Meeting on 3 May 2016.
Note 22 – Basic and diluted net earnings per share
2015 2014
Average number of shares taken into consideration – basic 84'659'190 84'656'148Dilutive effect of ordinary shares :- Share options 2'984 12'396
Average number of shares taken into consideration – diluted 84'662'174 84'668'544
Non-dilutive potential shares excluded from the dilution calculation :- Share options 141'744 90'454
CHF millions 2015 2014
Net earnings (Group share) – basic 638.2 636.9Dilutive effect of ordinary shares (7.7) (16.6)
Net earnings (Group share) – diluted 630.5 620.3
CHF per share 2015 2014
Basic net earnings per share (Group share) 7.54 7.52
Diluted net earnings per share (Group share) 7.45 7.33
Note 23 – Pensions liabilities and similar benefitsThrough its subsidiaries (mainly Imerys), the Group contributes to building up retirement benefits for its staff in accordance with the regulations and company practices in each country concerned. The benefits take the form of either defined contribution plans, where the level of future benefits is not guaranteed by the Group, or defined benefit plans, where the level of future benefits is guaranteed by the Group through provisions.
23.1 Description of pension plans and post-employment benefits
A. Defined contribution plans :
Under defined contribution plans, Group companies pay contributions to an insurance company or to a fund and have no other obligations. These are the plans granted to the vast majority of Imerys staff. Amounts are charged to the income statement during the year in which they are due. Total contributions paid during the year under defined contribution plans were as follows :
CHF millions 2015 2014
Contributions paid during the year (25.3) (27.3)
Pargesa Holding SA Annual Report 2015 Consolidated financial statements
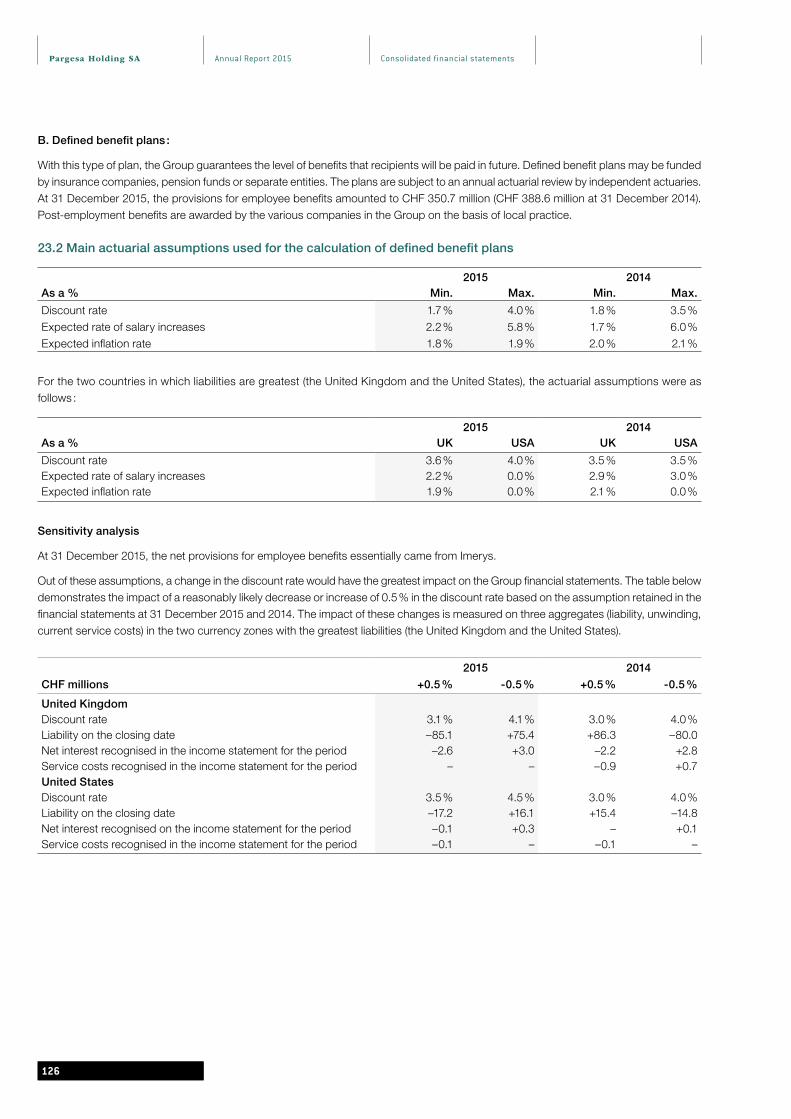
126126
B. Defined benefit plans :
With this type of plan, the Group guarantees the level of benefits that recipients will be paid in future. Defined benefit plans may be funded by insurance companies, pension funds or separate entities. The plans are subject to an annual actuarial review by independent actuaries. At 31 December 2015, the provisions for employee benefits amounted to CHF 350.7 million (CHF 388.6 million at 31 December 2014). Post-employment benefits are awarded by the various companies in the Group on the basis of local practice.
23.2 Main actuarial assumptions used for the calculation of defined benefit plans
2015 2014As a % Min. Max. Min. Max.
Discount rate 1.7 % 4.0 % 1.8 % 3.5 %Expected rate of salary increases 2.2 % 5.8 % 1.7 % 6.0 %Expected inflation rate 1.8 % 1.9 % 2.0 % 2.1 %
For the two countries in which liabilities are greatest (the United Kingdom and the United States), the actuarial assumptions were as follows :
2015 2014As a % UK USA UK USA
Discount rate 3.6 % 4.0 % 3.5 % 3.5 %Expected rate of salary increases 2.2 % 0.0 % 2.9 % 3.0 %Expected inflation rate 1.9 % 0.0 % 2.1 % 0.0 %
Sensitivity analysis
At 31 December 2015, the net provisions for employee benefits essentially came from Imerys.
Out of these assumptions, a change in the discount rate would have the greatest impact on the Group financial statements. The table below demonstrates the impact of a reasonably likely decrease or increase of 0.5 % in the discount rate based on the assumption retained in the financial statements at 31 December 2015 and 2014. The impact of these changes is measured on three aggregates (liability, unwinding, current service costs) in the two currency zones with the greatest liabilities (the United Kingdom and the United States).
2015 2014
CHF millions +0.5 % -0.5 % +0.5 % -0.5 %
United KingdomDiscount rate 3.1 % 4.1 % 3.0 % 4.0 %Liability on the closing date –85.1 +75.4 +86.3 –80.0Net interest recognised in the income statement for the period –2.6 +3.0 –2.2 +2.8Service costs recognised in the income statement for the period – – –0.9 +0.7United StatesDiscount rate 3.5 % 4.5 % 3.0 % 4.0 %Liability on the closing date –17.2 +16.1 +15.4 –14.8Net interest recognised on the income statement for the period –0.1 +0.3 – +0.1Service costs recognised in the income statement for the period –0.1 – –0.1 –
Annual Report 2015Pargesa Holding SA Consolidated financial statements

127127
23.3 Amounts recorded in the balance sheet for defined benefit plans
The Group finances the greater part of staff benefits through investments unavailable to third parties in trusts or through insurance contracts that are legally separate from the Group. These investments qualify as plan assets and amounted to CHF 1’374.6 million at 31 December 2015 (CHF 1’412.8 million at 31 December 2014). Imerys also holds reimbursement rights, which are investments held directly by the Group ; these amounted to CHF 6.7 million at 31 December 2015 (CHF 7.2 million at 31 December 2014). The funding rate for liabilities stood at 79.8 % at 31 December 2015 (78.5 % at 31 December 2014). Provisions for funded plan deficits and unfunded plans amounted to CHF 350.7 million at 31 December 2015 (CHF 388.6 million at 31 December 2014).
2015 2014
CHF millions UK USA Other Total UK USA Other Total
Present value of liabilities that are wholly or partially funded (1'066.6) (302.1) (184.6) (1'553.3) (1'135.6) (313.3) (190.7) (1'639.6)
Liabilities funded by reimbursement rights – – (28.8) (28.8) – – (36.3) (36.3)
Fair value of plan assets at year-end 1'016.6 231.9 126.1 1'374.6 1'055.8 230.1 126.9 1'412.8
Fair value of funded reimbursement rights – – 6.7 6.7 – – 7.2 7.2
Deficit of funded plans (50.0) (70.2) (80.6) (200.8) (79.8) (83.2) (92.9) (255.9)
Present value of unfunded liabilities – (15.5) (134.4) (149.9) – (14.3) (118.4) (132.7)
Net liabilities/net assets on the balance sheet (50.0) (85.7) (215.0) (350.7) (79.8) (97.5) (211.3) (388.6)
- long-term liabilities (358.0) (396.9)
- long-term assets 7.3 8.3
23.4 Amounts recognised in comprehensive income
CHF millions 2015 2014
Service costs :Current service costs (20.3) (27.2)Past service costs and gains/(losses) from settlement 3.6 24.0
Net interest (10.4) (9.5)Components of defined benefit costs recognised in the income statement (27.1) (12.7)Remeasurement on the net defined benefit liability :
Return on plan assets (excluding amounts included in net interest expense) 24.2 126.3Actuarial gains/losses arising from changes in demographic assumptions 0.7 (20.7)Actuarial gains/losses arising from changes in financial assumptions 24.8 (208.6)Actuarial gains/losses arising from experience adjustments 5.8 (19.4)
Components of defined benefit costs recognised in other comprehensive income 55.5 (122.4)
Total recognised in comprehensive income 28.4 (135.1)
Expenses are recorded under staff costs.
Pargesa Holding SA Annual Report 2015 Consolidated financial statements

128128
23.5 Actuarial gains and losses and cap on assets recognised in equity (excluding tax)
CHF millions 2015 2014
Balance at 1 January (331.3) (208.9)Changes recorded in equity* 55.5 (122.4)
Balance at 31 December (275.8) (331.3)
*of which tax (7.3) 25.0
Changes recorded in equity net of tax 48.2 (97.4)
23.6 Change in present value of liabilities
Fully and partially funded liabilities, and unfunded liabilities
CHF millions 2015 2014
Present value of liabilities at 1 January (1'808.6) (1'557.0)Current service costs (20.3) (27.2)Financial costs (55.5) (65.7)Remeasurement gain/(losses) :
Actuarial gains/losses arising from changes in demographic assumptions 0.7 (20.7)Actuarial gains/losses arising from changes in financial assumptions 24.8 (208.7)Actuarial gains/losses arising from experience adjustments 5.8 (19.5)
Liabilities assumed in a business combination (63.0) (3.7)Translation differences 72.5 (78.6)Benefits paid 115.0 151.8Other (3.4) 20.7
Present value of liabilities at 31 December (1'732.0) (1'808.6)
23.7 Change in fair value of defined benefit plan assets
Assets held by the Group to fund employee benefits generated an real return of CHF 70.2 million in 2014 (CHF 181.8 million in 2014), as shown in the table below. In accordance with applicable standards, only the normalised part of this return, which amounted to CHF 46.0 million in 2015 (CHF 55.7 million in 2014), was credited to the income statement ; this amount was calculated on the basis of the risk-free rate used to discount liabilities. The remaining real return was credited to equity, for an amount of CHF 24.2 million in 2015 (CHF 126.1 million in 2014).
2015 2014CHF millions UK USA Other Total UK USA Other Total
Fair value of plan assets at 1 January 1'055.7 230.1 127.0 1'412.8 914.5 225.5 129.1 1'269.1
Interest income 35.2 8.4 2.4 46.0 40.9 10.8 4.0 55.7
Remeasurement gain/(losses) :
Return on plan assets (excluding amounts included in the calculation of net interest) 13.6 4.1 6.5 24.2 112.3 10.1 3.7 126.1
Contributions 9.8 5.8 6.3 21.9 15.5 12.3 7.5 35.3
Assets distributed on settlements (54.0) (37.9) (8.8) (100.7) (75.3) (52.3) (17.1) (144.7)
Translation differences (43.9) 2.0 (9.7) (51.6) 47.8 23.7 (1.2) 70.3
Changes in scope / Business combinations – 19.4 2.6 22.0 – – – –
Other – – – – – – 1.0 1.0
Fair value of plan assets at 31 December 1'016.4 231.9 126.3 1'374.6 1'055.7 230.1 127.0 1'412.8
Annual Report 2015Pargesa Holding SA Consolidated financial statements

129129
23.8 Breakdown of plan assets
CHF millions 2015 2014
Cash and cash equivalents 82.6 6 % 127.1 9 %Listed equities 563.5 41 % 649.9 46 %Listed bonds 673.5 49 % 593.4 42 %Property 55.0 4 % 42.4 3 %
Fair value of plan assets at 31 December 1'374.6 100 % 1'412.8 100 %
23.9 Features of Imerys' defined benefit plans
Two plans represented 70.2 % of total Group liabilities at 31 December 2015 (72.5 % at 31 December 2014) and concerned Imerys. These two plans were the Imerys UK Pension Scheme (Imerys UK) and the Imerys USA Retirement Growth Account Plan (Imerys USA). The table below shows the main features of these plans.
2015 2014
Imerys UK Imerys USA Imerys UK Imerys USA
Liabilities by beneficiary category (CHF millions)Working beneficiaries (192.4) (49.2) (240.5) (63.1)Deferred beneficiaries (201.8) (40.3) (193.9) (50.4)Retired beneficiaries (672.4) (59.7) (701.2) (61.6)Total (1'066.6) (149.2) (1'135.6) (175.1)AgeAverage age of working beneficiaries 53 52 52 51Average age of deferred beneficiaries 54 53 53 53Average age of retired beneficiaries 75 69 74 69EligibilityLast hiring date 31.12.04 31.03.10 31.12.04 31.03.10Retirement age 65 65 65 65Benefit descriptionPayment method Annuity Lump sum Annuity Lump sumIncrease based on retail price index Yes No Yes NoRegulatory frameworkMinimum funding requirement for the employer Yes Yes Yes YesMinimum contribution requirement for the beneficiary Yes No Yes NoGovernanceTrustees representing employer Yes Yes Yes YesTrustees representing beneficiaries Yes No Yes NoIndependent trustees Yes No Yes NoResponsibility of trusteesDefine the investment strategy Yes Yes Yes YesNegotiate refunding of deficits with employer Yes - Yes -Administrative management of benefit payments Yes Yes Yes Yes
23.10 Management of risks relating to employee benefits at Imerys
Description of risks : The main issue relating to the financial management of employee benefits is controlling the funding ratio of liabilities, i.e. the ratio between the value of plan assets and the value of liabilities. The liability funding ratio is likely to be adversely affected if there is a decorrelation between the change (especially downwards) of plan assets and the change (especially upwards) in liabilities. The value of plan assets may be decreased by a fall in the fair value of investments. The value of liabilities may rise for all plans if the discount rate is decreased, or it may rise for benefits paid in the form of a life annuity if the inflation rate used to remeasure liabilities in certain plans rises, or if there is an increase in the life expectancy of beneficiaries.
Pargesa Holding SA Annual Report 2015 Consolidated financial statements

130130
Risk management : The strategy for managing the liability funding ratio consists first of all of optimising the value of plan assets. Investment policies therefore aim to deliver regular returns while taking advantage of opportunities with limited or moderate risk levels. Investment choices are specific to each plan and are determined based on the duration of the plan and regulatory constraints in terms of minimum funding. In the United Kingdom in particular, since 2011 Imerys has applied a strategy specifically aimed at managing the liability funding ratio, which consists of determining the investment of plan assets so that they match the liabilities. This qualifies as a liability driven investment (LDI), the aim of which is to manage the liability funding ratio by correlating cash inflows and outflows over the duration of the liability. In practice, this strategy consists of structuring the asset portfolio so that the cash inflows generated by investment returns match the cash outflows generated by the payment of benefits. Under this strategy, the risk of the liability increasing as a result of a fall in the discount rate or a rise in inflation was hedged at 79.0 % of the value of the liability at 31 December 2015 (79.0 % at 31 December 2014).
The Group estimates that it will have to pay CHF 19.7 million in contributions for defined benefit plans in 2016.
Note 24 – Share-based payments
24.1 Pargesa share options granted by Pargesa Holding SA
On 3 May 2007, the Company created an incentive plan for the Company’s employees, managers and executives involving the annual awarding of options on Pargesa Holding SA shares. The right to exercise the options is vested over time, i.e. one third after one year, two thirds after two years and in full after three years. The options have a maximum term of ten years. The options may be exercised at any time from the fourth year and until the plan expires. The shares needed to exercise options will be taken from the Company’s treasury shares. In 2015, the Company awarded 26’780 options, each option enabling the holder to acquire one share from Pargesa Holding SA, at a price of CHF 72, equal to the market price on the grant date.
At 31 December 2015, the total cost of this option plan was recognised in staff costs and amounted to CHF 0.1 million (CHF 0.1 million in 2014).
Changes in options granted
2015 2014
CHF per share Number of optionsWeighted average
exercise price Number of optionsWeighted average
exercise price
Options at 1 January 154'204 82.41 145'484 79.90Granted during the period 26'780 72.00 23'930 79.00Exercised during the period – – (15'210) 53.00
Options at 31 December 180'984 80.87 154'204 82.41
The options were valued using the Black & Scholes model. The fair value of the options on the grant date in 2015 was CHF 2.56 per option (CHF 3.34 per option in 2014).
Assumptions of the option valuation model
2015 2014
Rate of staff turnover 0.00 % 0.00 %Expected term 7 ans 7 ansExpected volatility 18.00 % 19.00 %Expected dividend growth 0.00 % 0.00 %Risk-free rate –0.10 % 0.75 %
Expected volatility is based on the historical volatility of the previous four years.
Annual Report 2015Pargesa Holding SA Consolidated financial statements

131131
Number of Pargesa share options at the end of 2015
Number Exercise price (CHF) Maturity Entitlement
12'150 133.00 2017 vested16'150 116.00 2018 vested15'830 53.00 2019 vested18'747 87.00 2020 vested19'477 87.00 2021 vested23'410 65.00 2022 vested7'910 67.00 2023 vested
16'600 67.00 2023 2/3 – vested 1/3 in 20166'840 79.00 2024 vested
17'090 79.00 2024 1/3 – vested 1/3 in 2016 1/3 in 20177'710 72.00 2025 vested
19'070 72.00 2025 1/3 in 2016 1/3 in 2017 1/3 in 2018
180'984
24.2 Share options granted by GBL
GBL share options
GBL has incentive plans involving GBL shares for its executive management and staff. These options have a lifetime of ten years and will be definitively vested to the beneficiaries three years after the offer date, at a rate of one third per year.
Changes in options granted
2015 2014
EUR per share Number of optionsWeighted average
exercise price Number of optionsWeighted average
exercise price
Options at 1 January 774'654 67.96 935'621 65.59Exercised during the period (67'197) 56.75 (160'967) 54.19
Options at 31 December 707'457 69.03 774'654 67.96
No such options were granted in 2015 and 2014.
The 707’457 GBL share options granted have exercise prices of between EUR 50.68 and EUR 91.90 per share. The maturity dates of the options are between 2017 and 2023. All of these options are vested. 590’514 options have already been exercised, and the remaining options may be exercised in 2016.
Other plans
On 29 April 2013, GBL issued an incentive plan covering the shares of its second-tier subsidiary LTI One SA. In total, 254’000 options were granted to GBL staff and executive management. These options give beneficiaries the right to buy a share at an exercise price of EUR 10 per share, which corresponds to the LTI One SA share value on the grant date. The options may be exercised or transferred from 29 April 2016 up to 28 April 2023. Options will be settled in cash or in securities. The plan is a cash-settled plan. The options were valued using a Monte Carlo model. The fair value per option was EUR 21.36 at 31 December 2015. A debt amounting to CHF 5.3 million was recorded as a liability on the balance sheet.
On 29 April 2014, GBL set up an incentive plan covering the shares of its second-tier subsidiary, LTI Two SA. In total, 223’256 options were granted to GBL staff and executive management. These options give beneficiaries the right to buy a share at an exercise price of EUR 10 per share, which corresponds to the LTI Two SA share value on the grant date. The options may be exercised or transferred from 29 April 2017 up to 28 April 2024. Options will be settled in cash or in securities. The plan is a cash-settled plan. The options were valued using a Monte Carlo model. The fair value per option was EUR 14.74 at 31 December 2015. A debt amounting to CHF 2.1 million was recorded as a liability on the balance sheet.
Pargesa Holding SA Annual Report 2015 Consolidated financial statements

132132
On 5 May 2015, GBL set up an incentive plan covering the shares of its second-tier subsidiary, Urdac SA. In total, 257’206 options were granted to GBL staff and executive management. These options give beneficiaries the right to buy a share at an exercise price of EUR 10 per share, which corresponds to the Urdac SA share value on the grant date. The options may be exercised or transferred from 5 May 2018 up to 4 May 2025. Options will be settled in cash or in securities. The plan is a cash-settled plan. The options were valued using a Monte Carlo model. The fair value per option was EUR 8.91 at 31 December 2015. A debt amounting to CHF 1.1 million was recorded as a liability on the balance sheet.
In 2015, the total cost relating to GBL incentive plans was recorded on the income statement under “staff costs” and amounted to CHF 4.3 million (CHF 4.9 million in 2014).
In addition, an incentive plan was granted to Ergon Capital Partners III management covering 16.7 % of Ergon Capital Partners III shares.
24.3 Imerys share options granted by Imerys
Imerys has an incentive plan for the group’s executives and certain managers and employees that involves awarding Imerys share options and free Imerys shares. Since 2013, only free shares have been awarded.Each option allows one share to be bought at a predetermined fixed price. The right to exercise the options is generally vested three years after the grant date, the options having a maximum term of ten years.Shares awarded free of charge are definitively vested at the end of a period that, in accordance with current legal requirements in France, may not be less than two years after the grant date ; they are vested subject, in principle, to the achievement of certain economic and financial performance objectives that cannot be assessed over one year only. The number of shares definitively vested is contingent upon, and proportionate to, the achievement of these objectives.
Changes in options granted
2015 2014
EUR per share Number of optionsWeighted average
exercise price Number of optionsWeighted average
exercise price
Options at 1 January 2'484'569 54.04 3'090'546 53.01Cancelled during the period (66'305) 48.61 (40'335) 54.27Exercised during the period (958'592) 54.47 (565'642) 48.40
Options at 31 December 1'459'672 54.00 2'484'569 54.04
The 1’459’672 Imerys share options granted have exercise prices of between EUR 34.54 and EUR 65.61 per share. The maturity dates of the options are between 2016 and 2022. All of these options are vested.
Changes in free shares awarded
2015 2014EUR per share Number of shares Number of shares
Shares at 1 January 790'559 720'007Granted during the period 337'400 282'475Cancelled during the period (96'489) (26'499)
Definitively vested during the period (136'817) (185'424)
Shares at 31 December 894'653 790'559
The fair values of the free shares awarded in 2015 was EUR 63.01 and EUR 61.17 per share (EUR 55.37 per share in 2014). The 894’653 free Imerys shares awarded have definitive vesting dates of between 2016 and 2019.
At 31 December 2015, the total charge recognised under staff expenses for the Imerys group in connection with the option and free share plans amounted to CHF 7.8 million (CHF 11.5 million in 2014).
Annual Report 2015Pargesa Holding SA Consolidated financial statements
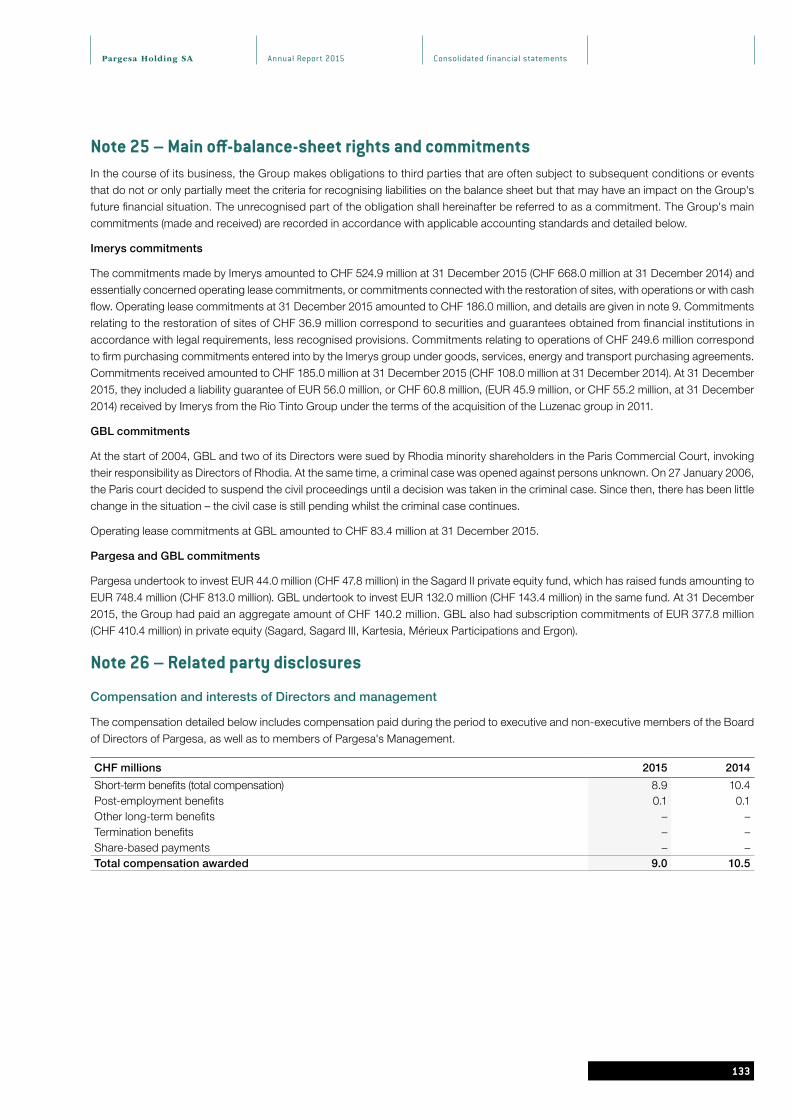
133133
Note 25 – Main off-balance-sheet rights and commitmentsIn the course of its business, the Group makes obligations to third parties that are often subject to subsequent conditions or events that do not or only partially meet the criteria for recognising liabilities on the balance sheet but that may have an impact on the Group's future financial situation. The unrecognised part of the obligation shall hereinafter be referred to as a commitment. The Group's main commitments (made and received) are recorded in accordance with applicable accounting standards and detailed below.
Imerys commitments
The commitments made by Imerys amounted to CHF 524.9 million at 31 December 2015 (CHF 668.0 million at 31 December 2014) and essentially concerned operating lease commitments, or commitments connected with the restoration of sites, with operations or with cash flow. Operating lease commitments at 31 December 2015 amounted to CHF 186.0 million, and details are given in note 9. Commitments relating to the restoration of sites of CHF 36.9 million correspond to securities and guarantees obtained from financial institutions in accordance with legal requirements, less recognised provisions. Commitments relating to operations of CHF 249.6 million correspond to firm purchasing commitments entered into by the Imerys group under goods, services, energy and transport purchasing agreements.Commitments received amounted to CHF 185.0 million at 31 December 2015 (CHF 108.0 million at 31 December 2014). At 31 December 2015, they included a liability guarantee of EUR 56.0 million, or CHF 60.8 million, (EUR 45.9 million, or CHF 55.2 million, at 31 December 2014) received by Imerys from the Rio Tinto Group under the terms of the acquisition of the Luzenac group in 2011.
GBL commitments
At the start of 2004, GBL and two of its Directors were sued by Rhodia minority shareholders in the Paris Commercial Court, invoking their responsibility as Directors of Rhodia. At the same time, a criminal case was opened against persons unknown. On 27 January 2006, the Paris court decided to suspend the civil proceedings until a decision was taken in the criminal case. Since then, there has been little change in the situation – the civil case is still pending whilst the criminal case continues.
Operating lease commitments at GBL amounted to CHF 83.4 million at 31 December 2015.
Pargesa and GBL commitments
Pargesa undertook to invest EUR 44.0 million (CHF 47.8 million) in the Sagard II private equity fund, which has raised funds amounting to EUR 748.4 million (CHF 813.0 million). GBL undertook to invest EUR 132.0 million (CHF 143.4 million) in the same fund. At 31 December 2015, the Group had paid an aggregate amount of CHF 140.2 million. GBL also had subscription commitments of EUR 377.8 million (CHF 410.4 million) in private equity (Sagard, Sagard III, Kartesia, Mérieux Participations and Ergon).
Note 26 – Related party disclosures
Compensation and interests of Directors and management
The compensation detailed below includes compensation paid during the period to executive and non-executive members of the Board of Directors of Pargesa, as well as to members of Pargesa's Management.
CHF millions 2015 2014
Short-term benefits (total compensation) 8.9 10.4Post-employment benefits 0.1 0.1Other long-term benefits – – Termination benefits – – Share-based payments – – Total compensation awarded 9.0 10.5
Pargesa Holding SA Annual Report 2015 Consolidated financial statements

134134
Note 27 – Important events taking place after the closing dateIn early 2016, GBL disposed of additional Total shares representing 1.1 % of Total's capital (26.2 million shares for a total amount of EUR 1 billion). The transactions took place both in the market (9.1 million shares) and through a private placement by way of an accelerated bookbuilding process for institutional investors (17.1 million shares). The net consolidated gain on this disposal will amount to approximately CHF 730 million for Pargesa. Following these transactions, GBL still holds 1.4 % of Total's capital.
Ergon Capital Partners III, a subsidiary of GBL, acquired on 1 March 2016 a majority indirect stake in Financière Looping S.A.S. (“Looping”), a European theme-park operator. Looping records sales of around EUR 60 million and is one of the European leaders in theme parks and has a regional focus, with 7 parks in France and 4 in other European countries.
On 14 January 2016, GBL informed adidas that it had passed the statutory threshold of 5 % of adidas’ capital.
Since the beginning of 2016, LafargeHolcim's share price has continued to fall and stood at EUR 38.8 per share on 11 March 2016. If the share price is still at this level at 31 March 2016, under IFRS and the Group's accounting principles, GBL will have to recognise an impairment of EUR 1’584 million in its Q1 2016 accounts, with Pargesa's share amounting to around CHF 1’725 million. According to the Group's accounting principles (see the accounting principles for “financial assets”), a significant (i.e. more than 30 %) or prolonged (i.e. more than one year) decline in the fair value of an available-for-sale financial asset is an objective indication of impairment.
On 16 March 2016, GBL informed Ontex that it had passed the statutory threshold of 10 % of its capital.
Annual Report 2015Pargesa Holding SA Consolidated financial statements

135
Report of the Statutory Auditor on the Consolidated Financial Statements to the Annual General Meeting of Pargesa Holding SA, Geneva
Geneva, March 18, 2016
Report of the Statutory Auditor on the Consolidated Financial Statements
As statutory auditor, we have audited the accompanying consolidated financial statements of Pargesa Holding SA, which comprise the consolidated balance sheet as at December 31, 2015 and the consolidated statement of income, consolidated statement of comprehensive report, consolidated statement of changes in equity, consolidated statement of cash flows and notes to the consolidated financial statements for the year then ended, presented on pages 63 to 134.
Board of Directors’ Responsibility
The Board of Directors is responsible for the preparation of these consolidated financial statements in accordance with International Financial Reporting Standards (IFRS) and the requirements of Swiss law. This responsibility includes designing, implementing and maintaining an internal control system relevant to the preparation of consolidated financial statements that are free from material misstatement, whether due to fraud or error. The Board of Directors is further responsible for selecting and applying appropriate accounting policies and making accounting estimates that are reasonable in the circumstances.
Auditor’s Responsibility
Our responsibility is to express an opinion on these consolidated financial statements based on our audit. We conducted our audit in accordance with Swiss law and Swiss Auditing Standards and International Standards on Auditing. Those standards require that we plan and perform the audit to obtain reasonable assurance whether the consolidated financial statements are free from material misstatement.
An audit involves performing procedures to obtain audit evidence about the amounts and disclosures in the consolidated financial statements. The procedures selected depend on the auditor’s judgment, including the assessment of the risks of material misstatement of the consolidated financial statements, whether due to fraud or error. In making those risk assessments, the auditor considers the internal control system relevant to the entity’s preparation of the consolidated financial statements in order to design audit procedures that are appropriate in the circumstances, but not for the purpose of expressing an opinion on the effectiveness of the entity’s internal control system. An audit also includes evaluating the appropriateness of the accounting policies used and the reasonableness of accounting estimates made, as well as evaluating the overall presentation of the consolidated financial statements. We believe that the audit evidence we have obtained is sufficient and appropriate to provide a basis for our audit opinion.
Opinion
In our opinion, the consolidated financial statements for the year ended December 31, 2015 give a true and fair view of the financial position, the results of operations and the cash flows in accordance with IFRS and comply with Swiss law.
Report on Other Legal Requirements
We confirm that we meet the legal requirements on licensing according to the Auditor Oversight Act (AOA) and independence (article 728 Code of Obligations (CO) and article 11 AOA) and that there are no circumstances incompatible with our independence.
In accordance with article 728a para. 1 item 3 CO and Swiss Auditing Standard 890, we confirm that an internal control system exists, which has been designed for the preparation of consolidated financial statements according to the instructions of the Board of Directors.
We recommend that the consolidated financial statements submitted to you be approved.
Deloitte SA
Thierry Aubertin Aurélie DarrigadeLicensed Audit Expert Licensed Audit ExpertAuditor in Charge
135
Pargesa Holding SA Annual Report 2015 Consolidated financial statements

Annual Report 2015

137
06PARENT COMPANY
FINANCIAL STATEMENTS
Annual Report 2015Pargesa Holding SA
138
Parent companyfinancial statements
138
Contents
Parent company income statement
Parent company balance sheet
Notes to the parent company financial statements
1 Accounting principles
2 Income on long-term investments
3 Other short-term assets
4 Accrued income and prepaid expenses
5 Loans to affiliated companies
6 Long-term investments
7 Bond issues
8 Share capital
9 Statutory capital reserve
10 Treasury shares
11 Other commitments
12 Significant shareholders
13 Full-time equivalents
14 Transparency information
15 Shares and options on shares
16 Risk assessment
17 Subsequent events
Proposal of the Board of Directors regarding the appropriation of profit
Report of the Statutory Auditor on the Financial Statements to the Annual General Meeting of Pargesa Holding SA

Pargesa Holding SA Annual Report 2015
139
Parent companyfinancial statements
139
Parent company income statement
Note 2015 2014CHF millions CHF millions
Operating incomeIncome on long-term investments 2 200.0 160.0 Commissions – 0.3 Total operating income 200.0 160.3
Operating expensesDirectors' fees and payroll expenses (7.8) (6.6)General and administrative expenses (2.1) (2.1)Total operating expenses (9.9) (8.7)
Operating income 190.1 151.6
Financial incomeInterest income 0.5 0.3 Total financial income 0.5 0.3
Financial expensesInterest expenses (8.6) (7.5)Commissions and bank charges (0.4) (2.5)Total financial expenses (9.0) (10.0)
Total financial income / (expenses) (8.5) (9.7)
Non-recurring income and expensesIncome on investments and financial assets 4.7 8.9 Premium on convertible bond conversion rights 11.2 – 93.7 Provisions (1.5) – Total non-recurring income 3.2 102.6
Net profit before tax 184.8 244.5 Taxes (1.6) (1.9)Net profit for the year 183.2 242.6
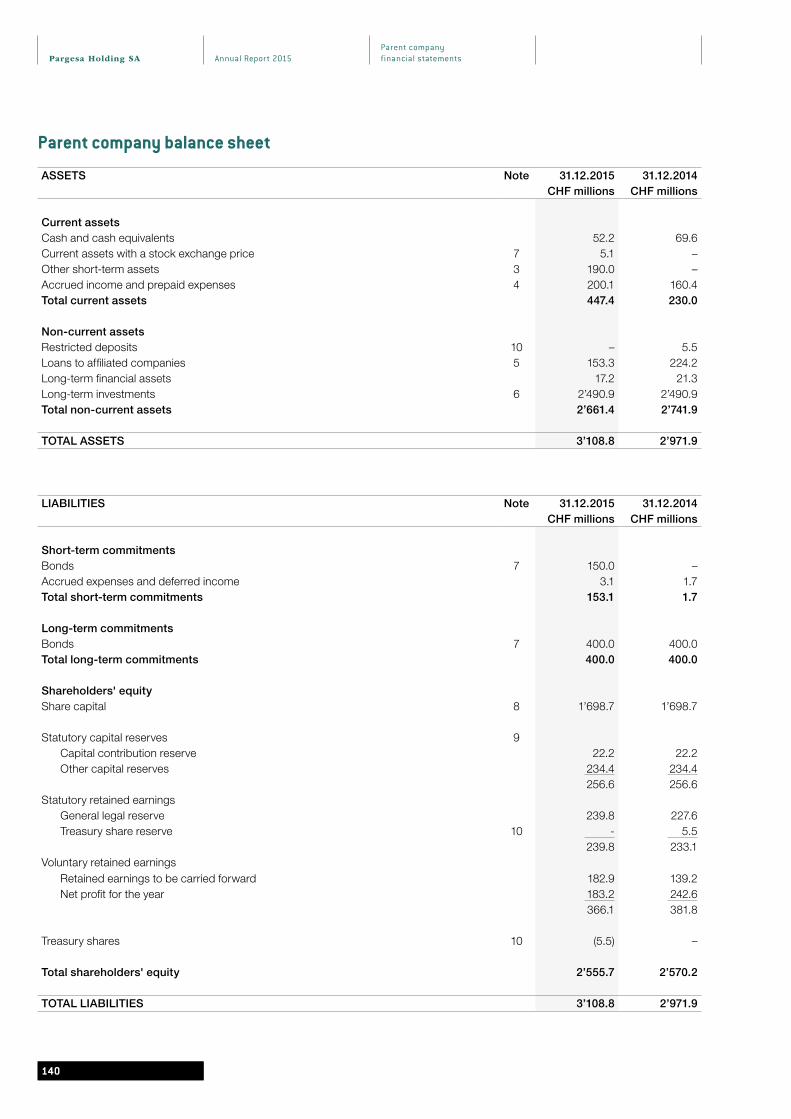
Annual Report 2015Pargesa Holding SA
140
Parent companyfinancial statements
140
Parent company balance sheet
ASSETS Note 31.12.2015 31.12.2014CHF millions CHF millions
Current assetsCash and cash equivalents 52.2 69.6 Current assets with a stock exchange price 7 5.1 – Other short-term assets 3 190.0 – Accrued income and prepaid expenses 4 200.1 160.4 Total current assets 447.4 230.0
Non-current assetsRestricted deposits 10 – 5.5 Loans to affiliated companies 5 153.3 224.2 Long-term financial assets 17.2 21.3 Long-term investments 6 2’490.9 2’490.9 Total non-current assets 2’661.4 2’741.9
TOTAL ASSETS 3’108.8 2’971.9
LIABILITIES Note 31.12.2015 31.12.2014CHF millions CHF millions
Short-term commitmentsBonds 7 150.0 – Accrued expenses and deferred income 3.1 1.7 Total short-term commitments 153.1 1.7
Long-term commitmentsBonds 7 400.0 400.0 Total long-term commitments 400.0 400.0
Shareholders' equityShare capital 8 1’698.7 1’698.7
Statutory capital reserves 9Capital contribution reserve 22.2 22.2 Other capital reserves 234.4 234.4
256.6 256.6 Statutory retained earnings
General legal reserve 239.8 227.6 Treasury share reserve 10 - 5.5
239.8 233.1 Voluntary retained earnings
Retained earnings to be carried forward 182.9 139.2 Net profit for the year 183.2 242.6
366.1 381.8
Treasury shares 10 (5.5) –
Total shareholders' equity 2’555.7 2’570.2
TOTAL LIABILITIES 3’108.8 2’971.9

Pargesa Holding SA Annual Report 2015
141
Parent companyfinancial statements
141
Notes to the parent company financial statements
Note 1 – Accounting principlesPargesa Holding SA (the “Company”) has its head office at 11 Grand-Rue, 1204 Geneva, Switzerland, and is recorded in the Commercial Register of the Canton of Geneva. Its main purpose is the purchase, sale, administration and management, in Switzerland and abroad, of investments of a financial, commercial and industrial nature. The financial statements are drawn up in accordance with the requirements of the Swiss Code of Obligations. They are prepared using the historical cost principle and presented in millions of Swiss francs. In 2015, the Company adopted the new Swiss accounting legislation rules that became mandatory for the financial year beginning 1 January 2015. Corresponding figures for the 2014 financial year have not been adjusted ; however, the presentation of the previous year’s account has been changed for purposes of comparison.
Foreign currenciesTransactions in foreign currencies are initially recorded at the exchange rate on the transaction date. At closing, monetary items in foreign currencies are converted at the year-end exchange rate. Gains or losses realised when recording or translating monetary items in a foreign currency are recognised as gains or losses in the period during which they occur. Non-monetary items are valued at their historical cost.
Cash and cash equivalentsThis item includes cash, sight deposits and deposits of less than three months.
Current assets with a stock exchange priceThese assets are stated at purchase price less any impairment.
Accrued/deferred income and accrued/prepaid expensesOn the assets side, this item includes prepaid expenses and accrued income. On the liabilities side, it includes accrued expenses and deferred income.
Financial assetsFinancial assets are each stated at their purchase price less any impairment.
Long-term investmentsDirectly held long-term investments are each stated at their purchase price less any impairment.
Bond issuesBond issues are recorded on the balance sheet at par value. Premiums and discounts are recorded on the balance sheet at issue and then in the income statement throughout the bond’s term. Issue fees are offset against any premium, and any remaining amount is recorded in the income statement.
Treasury sharesThe Company’s treasury shares are essentially fully paid-in shares that were issued at par value and are not yet outstanding. Treasury shares are deducted from the share capital. If the shares become outstanding, their par value is credited to the item “treasury shares”, and any amount exceeding the par value (i.e. any premium) is booked to the capital contribution reserve.
Interest and dividendsInterest is stated on a time proportion basis. Dividends are booked once the Company’s dividend rights have been established.
Share option planThe Company has an incentive plan for Company employees, managers and executives, under which annual Pargesa Holding SA share options are awarded. When beneficiaries exercise their options, the Company delivers treasury shares. The par value is credited to the item “treasury shares”, and any amount exceeding the par value (i.e. any premium) is booked to the capital contribution reserve.
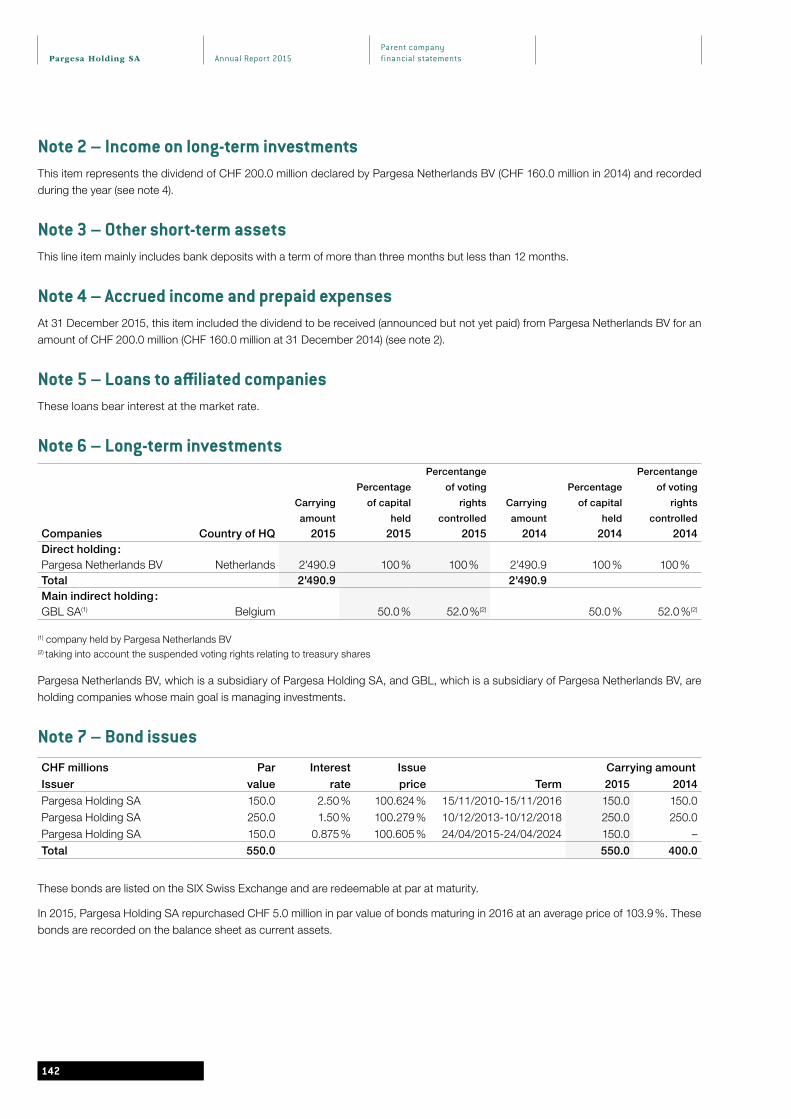
Annual Report 2015Pargesa Holding SA
142
Parent companyfinancial statements
142
Note 2 – Income on long-term investmentsThis item represents the dividend of CHF 200.0 million declared by Pargesa Netherlands BV (CHF 160.0 million in 2014) and recorded during the year (see note 4).
Note 3 – Other short-term assetsThis line item mainly includes bank deposits with a term of more than three months but less than 12 months.
Note 4 – Accrued income and prepaid expensesAt 31 December 2015, this item included the dividend to be received (announced but not yet paid) from Pargesa Netherlands BV for an amount of CHF 200.0 million (CHF 160.0 million at 31 December 2014) (see note 2).
Note 5 – Loans to affiliated companiesThese loans bear interest at the market rate.
Note 6 – Long-term investmentsPercentange Percentange
Percentage of voting Percentage of voting
Carrying of capital rights Carrying of capital rights
amount held controlled amount held controlled
Companies Country of HQ 2015 2015 2015 2014 2014 2014 Direct holding :Pargesa Netherlands BV Netherlands 2'490.9 100 % 100 % 2'490.9 100 % 100 %Total 2'490.9 2'490.9 Main indirect holding :GBL SA(1) Belgium 50.0 % 52.0 %(2) 50.0 % 52.0 %(2)
(1) company held by Pargesa Netherlands BV(2) taking into account the suspended voting rights relating to treasury shares
Pargesa Netherlands BV, which is a subsidiary of Pargesa Holding SA, and GBL, which is a subsidiary of Pargesa Netherlands BV, are holding companies whose main goal is managing investments.
Note 7 – Bond issues
CHF millions Par Interest Issue Carrying amount
Issuer value rate price Term 2015 2014
Pargesa Holding SA 150.0 2.50 % 100.624 % 15/11/2010-15/11/2016 150.0 150.0Pargesa Holding SA 250.0 1.50 % 100.279 % 10/12/2013-10/12/2018 250.0 250.0Pargesa Holding SA 150.0 0.875 % 100.605 % 24/04/2015-24/04/2024 150.0 – Total 550.0 550.0 400.0
These bonds are listed on the SIX Swiss Exchange and are redeemable at par at maturity.
In 2015, Pargesa Holding SA repurchased CHF 5.0 million in par value of bonds maturing in 2016 at an average price of 103.9 %. These bonds are recorded on the balance sheet as current assets.

Pargesa Holding SA Annual Report 2015
143
Parent companyfinancial statements
143
Note 8 – Share capitalThe Company’s share capital is composed of the following :
Number of shares Par value
CHF millions 2015 2014 2015 2014
Fully paid-in registered shares with a par value of CHF 2 each 77'214'700 77'214'700 154.4 154.4 Fully paid-in bearer shares with a par value of CHF 20 each 76'937'720 76'937'720 1'538.8 1'538.8 Fully paid-in, reserved bearer shares with a par value of CHF 20 each with no dividend rights (see note 10) 276'980 276'980 5.5 5.5
Total 84'936'170 (1) 84'936'170 (1) 1'698.7 1'698.7
(1) the number of registered shares is converted into the equivalent number of bearer shares by dividing by ten
On 1 June 1994, the Company created conditional capital with a maximum par value of CHF 242 million through the creation of 11’000’000 registered shares with a par value of CHF 2 and 11’000’000 bearer shares with a par value of CHF 20.
On 6 May 2014, the Company renewed its authorised capital. The Board of Directors has been granted authorisation, until 6 May 2016, to increase the share capital by CHF 253 million by issuing 11’500’000 registered shares with a par value of CHF 2 and 11’500’000 bearer shares with a par value of CHF 20.
Bearer shares are listed on the SIX Swiss Exchange.
Note 9 – Statutory capital reserve Pursuant to Swiss tax legislation, premiums on shares issued after 31 December 1996 must be disclosed separately on the balance sheet. As a result, share premiums are split between two items : the “other capital reserves” item, which represents premiums on shares issued prior to 1 January 1997, and the “capital contribution reserve”, which represents premiums on shares issued after that date.Funds from the capital contribution reserve may be distributed to shareholders without deducting the 35 % Swiss federal withholding tax.
Note 10 – Treasury sharesNot yet outstanding,
reserved for Board useNot yet outstanding, reserved
for the exercise of options (1)
Total
CHF millions Number Carrying amount Number Carrying amount Number Carrying amount
1 January 2014 146'706 2.9 145'484 2.9 292'190 5.8
Granting of options (23'930) (0.5) 23'930 0.5 – –Exercise of options – – (15'210) (0.3) (15'210) (0.3)31 December 2014 122'776 2.4 154'204 3.1 276'980 5.5
Granting of options (26'780) (0.5) 26'780 0.5 – –31 December 2015 95'996 1.9 180'984 3.6 276'980 5.5
(1) shares not yet outstanding and reserved for the exercise of options granted to the beneficiaries of share option plans set up by the Company (see notes
11.3, 14 and 15)
Treasury shares are all previously created, reserved bearer shares that are fully paid in and not yet outstanding. They are recorded at par value and give no right to a dividend or voting rights.
Following the introduction of the new accounting rules in 2015, treasury shares are now deducted from the share capital recorded on the balance sheet. At 31 December 2014, treasury shares were recorded as assets under “restricted deposits”. The treasury share reserve was fully released in 2015, in keeping with the new accounting rules.

Annual Report 2015Pargesa Holding SA
144
Parent companyfinancial statements
Note 11 – Other commitments
1. CHF millions 2015 2014
Guarantees issued for wholly owned subsidiaries(1) 5.0 269.5 Guarantees issued for third party 0.1 0.1
Total 5.1 269.6
(1) These guarantees are intended to cover credit lines available to a Pargesa Holding SA subsidiary. At 31 December 2015, the credit lines had not been drawn down (no drawdown at 31 December 2014)
2. The Company entered into a contract with its subsidiary Pargesa Netherlands BV, whereby it undertakes to issue Pargesa Holding SA shares, to be taken out of the Company’s conditional capital, to holders of convertible bonds issued by Pargesa Netherlands BV :
contract signed in 2007 and expiring in 2014 − Pargesa Holding SA undertook to issue a maximum of 4’906’588 bearer shares and 4’906’588 registered shares. Pargesa Netherlands BV paid the Company a premium of CHF 93.7 million as compensation for this commitment. The premium was booked as a deferred income liability on the balance sheet. When the convertible bonds expired on 15 June 2014, the premium of CHF 93.7 million received in 2007 was booked to the income statement under non-recurring income and expenses.
On 15 June 2014, Pargesa Netherlands BV redeemed the remaining 2007-2014 convertible bonds.
3. On 3 May 2007, the Company introduced an incentive plan for Company employees, managers and executives, under which annual Pargesa Holding SA share options are awarded. In 2015, the Company granted 26’780 options, with each option enabling the holder to purchase one Pargesa Holding SA share at a price of CHF 72, which corresponds to the market price on the grant date. The right to exercise the options is vested over time, i.e. one third after one year, two thirds after two years and in full after three years. The options have a maximum term of ten years. They may be exercised at any time from the fourth year and until the plan expires. Shares required to exercise options are taken from the Company’s stock of treasury shares (see notes 14 and 15).
4. At 31 December 2015, the Company had a subscription commitment to pay CHF 12.7 million into the Sagard II private equity fund (CHF 11.1 million at 31 December 2014).
Note 12 – Significant shareholdersShareholders with more than 5 % of the voting rights are indicated in the table below :
Capital Votes
as a % 2015 2014 2015 2014
Parjointco (Power group 50 % / Frère group 50 %) 55.5 55.5 75.4 75.4
BNP Paribas Group (1) 11.2 (1) 6.2
(1) in 2015, BNP Paribas Group’s holding fell below the threshold of 5 % of voting rights
The ultimate shareholders of Parjointco are Mr. Frère in Belgium and the Desmarais family in Canada.
Capital percentages are calculated based on the total number of issued shares (bearer equivalent) making up the capital, less treasury shares, i.e. a denominator of 84’659’190 at 31 December 2015.
Percentages of voting rights are calculated based on the total number of voting rights attached to the shares issued, i.e. a denominator of 154’429’400 at 31 December 2015.
Note 13 – Full-time equivalentsPargesa Holding SA’s annual average number of full-time equivalents is below ten.

Pargesa Holding SA Annual Report 2015
145
Parent companyfinancial statements
Note 14 – Transparency informationShareholdings and conversion and option rights in Pargesa Holding SA at 31 December 2015 of members of the Board of
Directors and Management or persons related to them
Shares Share option rights
Nombre de titres registered bearer bearer
Gérald Frère Vice Chairman and Executive Director – 161'154 –Marc-Henri Chaudet Director – 50 –Arnaud Vial Managing Director and Executive Director – – 18'030 (2)
Parjointco NV (1) 77'214'700 39'301'000 –
Total 77'214'700 39'462'204 18'030
(1) Parjointco NV, the controlling shareholder of Pargesa Holding SA, is a “closely-related person”, within the meaning of Article 678 of the Swiss Code of Obligations, of certain members of the Board of Directors (i.e. the Frère family in Belgium and the Desmarais family in Canada)
(2) the entity that issued these Pargesa Holding SA share option rights is Pargesa Holding SA, under a plan introduced in 2007 permitting the annual awarding of free options to Pargesa Holding SA shares at a price that corresponds to the market price on the grant date. The main features of this plan are as follows : term of ten years ; rights fully vested after three years ; conversion ratio of 1 option/1 share ; strike price of CHF 72 for options granted in 2015, CHF 79 for options granted in 2014, CHF 67 for options granted in 2013, CHF 65 for options granted in 2012, CHF 87 for options granted in 2011, CHF 87 for options granted in 2010, CHF 53 for options granted in 2009, CHF 116 for options granted in 2008, and CHF 133 for options granted in 2007 ; concerns share capital of CHF 360’600
Following the introduction of the Ordinance against excessive compensation in listed corporations (known as “ORAb”), which entered into force on 1 January 2014, information regarding the compensation of Board members and Management, as required by article 663bbis of the Swiss Code of Obligations, is now provided in the Compensation Report.
Note 15 – Shares and options on sharesOptions on Pargesa bearer shares awarded during the year :
Number Value Number Value
CHF 2015 2015 2014 2014
Members of Management 14'920 38'195 13'250 44'255Other employees 11'860 30'362 10'680 35'671Total 26'780 68'557 23'930 79'926
The value of Pargesa options awarded by Pargesa was determined on the basis of the Black & Scholes model on the grant date.
Note 16 – Risk assessmentThe Board of Directors carried out a risk assessment. The assessment involved identifying corporate risks relating to strategy, operations, compliance and finance. The Board of Directors examined the potential impact of the risks identified, their probability, and the measures and controls in place.
Note 17 – Subsequent eventsNo significant event took place after the closing of accounts on 31 December 2015.

Annual Report 2015Pargesa Holding SA
146
Parent companyfinancial statements
Proposal of the Board of Directors regarding the appropriation of profit
2015 2014
CHF millions CHF millions
Available income
Net profit for the year 183.2 242.6 Retained earnings 177.4 138.9 Draw on treasury share reserve 5.5 0.3 Available income 366.1 381.8
Allocation
Allocation to the general legal reserve 9.2 12.2 Dividend 201.5 192.2 Retained earnings to be carried forward 155.4 177.4 Profit allocated 366.1 381.8
If approved, the dividend for the financial year ending on 31 December 2015 will be paid on the following terms :
For each bearer share with a par value of CHF 20Total dividend CHF 2.38Less 35 % federal withholding tax CHF (0.83)Net dividend CHF 1.55
For each registered share with a par value of CHF 2Total dividend CHF 0.238Less 35 % federal withholding tax CHF (0.083)Net dividend CHF 0.155
The dividend will be paid on 10 May 2016.
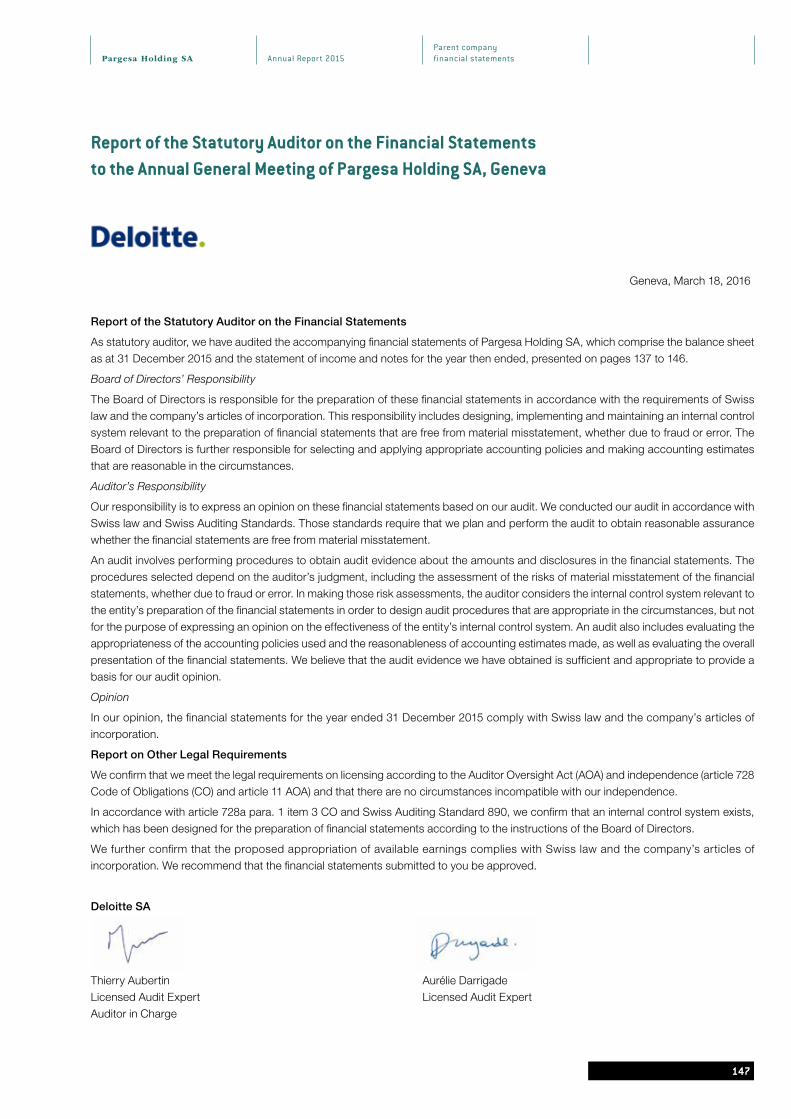
Annual Report 2015Pargesa Holding SAParent companyfinancial statements
Report of the Statutory Auditor on the Financial Statementsto the Annual General Meeting of Pargesa Holding SA, Geneva
Geneva, March 18, 2016
Report of the Statutory Auditor on the Financial Statements
As statutory auditor, we have audited the accompanying financial statements of Pargesa Holding SA, which comprise the balance sheet as at 31 December 2015 and the statement of income and notes for the year then ended, presented on pages 137 to 146.
Board of Directors’ Responsibility
The Board of Directors is responsible for the preparation of these financial statements in accordance with the requirements of Swiss law and the company’s articles of incorporation. This responsibility includes designing, implementing and maintaining an internal control system relevant to the preparation of financial statements that are free from material misstatement, whether due to fraud or error. The Board of Directors is further responsible for selecting and applying appropriate accounting policies and making accounting estimates that are reasonable in the circumstances.
Auditor’s Responsibility
Our responsibility is to express an opinion on these financial statements based on our audit. We conducted our audit in accordance with Swiss law and Swiss Auditing Standards. Those standards require that we plan and perform the audit to obtain reasonable assurance whether the financial statements are free from material misstatement.
An audit involves performing procedures to obtain audit evidence about the amounts and disclosures in the financial statements. The procedures selected depend on the auditor’s judgment, including the assessment of the risks of material misstatement of the financial statements, whether due to fraud or error. In making those risk assessments, the auditor considers the internal control system relevant to the entity’s preparation of the financial statements in order to design audit procedures that are appropriate in the circumstances, but not for the purpose of expressing an opinion on the effectiveness of the entity’s internal control system. An audit also includes evaluating the appropriateness of the accounting policies used and the reasonableness of accounting estimates made, as well as evaluating the overall presentation of the financial statements. We believe that the audit evidence we have obtained is sufficient and appropriate to provide a basis for our audit opinion.
Opinion
In our opinion, the financial statements for the year ended 31 December 2015 comply with Swiss law and the company’s articles of incorporation.
Report on Other Legal Requirements
We confirm that we meet the legal requirements on licensing according to the Auditor Oversight Act (AOA) and independence (article 728 Code of Obligations (CO) and article 11 AOA) and that there are no circumstances incompatible with our independence.
In accordance with article 728a para. 1 item 3 CO and Swiss Auditing Standard 890, we confirm that an internal control system exists, which has been designed for the preparation of financial statements according to the instructions of the Board of Directors.
We further confirm that the proposed appropriation of available earnings complies with Swiss law and the company’s articles of incorporation. We recommend that the financial statements submitted to you be approved.
Deloitte SA
Thierry Aubertin Aurélie DarrigadeLicensed Audit Expert Licensed Audit ExpertAuditor in Charge
147

Annual Report 2015Pargesa Holding SA
148
Addresses
Addresses
PARGESA HOLDING SA11, Grand-Rue – 1204 Geneva – SwitzerlandTel. : +41 22 817 77 77www.pargesa.ch
GROUPE BRUXELLES LAMBERT24, Avenue Marnix – 1000 Brussels – Belgiumwww.gbl.be
IMERYS154, Rue de l’Université – 75007 Paris – Francewww.imerys.com
LAFARGEHOLCIMZürcherstrasse 156 – 8645 Jona – Switzerlandwww.lafargeholcim.com
TOTAL2, Place Jean Millier – La Défense 6 – 92078 Paris La Défense Cedex – Francewww.total.com
ENGIE1, Place Samuel de Champlain – 92400 Courbevoie – Francewww.engie.com
PERNOD RICARD12, Place des Etats-Unis – 75116 Paris – Francewww.pernod-ricard.com
SGS1 Place des Alpes – 1201 Geneva – Switzerlandwww.sgs.com
This Annual Report is also available in French and German ; only the original French text is authoritative.
Production
Design and layout : JimB and web’n’paper. Printed in Switzerland by Atar Roto Presse SA, Geneva. FSC-certified paper
Translation
Doublespace Sarl, Lausanne

PargesaHolding SA
PARG
ESA
HOL
DING
SA
2015
E
PargesaHolding SA 2015
PargesaHolding SA
ANNUAL REPORT


![Portfolio [2013]](https://static.fdocuments.fr/doc/165x107/568c34901a28ab023590ede4/portfolio-2013-56eaa4453187b.jpg)