2015 ELECTION RESULTS AND VOTER TURNOUT … · election results and voter turnout statistics...
67
2015 ELECTION RESULTS AND VOTER TURNOUT STATISTICS 1987-2015 RÉSULTATS DES ÉLECTIONS DE 2015 ET STATISTIQUES SUR LA PARTICIPATION ÉLECTORALE 1987-2015
Transcript of 2015 ELECTION RESULTS AND VOTER TURNOUT … · election results and voter turnout statistics...
2015 ELECTION RESULTS
AND VOTER TURNOUT STATISTICS
1987-2015
RÉSULTATS DES ÉLECTIONS DE 2015
ET STATISTIQUES SUR LA
PARTICIPATION ÉLECTORALE 1987-2015

Table of Contents
Table des matières Part One - Results of 2015 Bencher Election TAB/ONGLET 1 Première Partie - Résultats des élections de 2015 Elected Benchers .................................................................................................................... 1 Conseillères et conseillers élus All Regions .............................................................................................................................. 2 Toutes les régions Central East ............................................................................................................................ 6 Région du Centre-Est Central South Region .............................................................................................................. 10 Région du Centre-Sud Central West Region ............................................................................................................... 14 Région du Centre-Ouest East Region ............................................................................................................................ 18 Région de l’Est Northeast Region .................................................................................................................... 22 Région du Nord-Est Northwest Region .................................................................................................................... 26 Région du Nord-Ouest Outside Ontario ....................................................................................................................... 30 Extérieur de l’Ontario Southwest Region ................................................................................................................... 34 Région du Sud-Ouest Toronto.................................................................................................................................... 38 Toronto Part Two - Voter Turnout Statistics, 1987 – 2015 TAB/ONGLET 2 Deuxième partie - Statistiques sur la participation électorale, 1987 - 2015 Overall Voter Turnout, 1987 – 2015 ........................................................................................ 42 Renseignements généraux sur les suffrages exprimés – Élections de 1987-2015
Voter Turnout by Sex .............................................................................................................. 43 Participation électorale selon le sexe Voter Turnout by Year of Birth ................................................................................................. 44 Participation électorale selon l’année de naissance Voter Turnout by Year of Call .................................................................................................. 45 Participation électorale selon l’année d’admission Voter Turnout by Size of Firm .................................................................................................. 46 Participation électorale selon la taille du cabinet Voter Turnout by Membership Status ...................................................................................... 47 Participation électorale selon la situation professionnelle Voter Turnout by Electoral Region ........................................................................................... 48 Participation électorale selon la région électorale Part Three – 2015 Voter Turnout Statistics TAB/ONGLET 3 Troisième partie – Statistiques sur la participation électorale, 2015 Voter Turnout by Sex .............................................................................................................. 49 Participation électorale selon le sexe Voter Turnout by Year of Birth ................................................................................................. 50 Participation électorale selon l’année de naissance Voter Turnout by Year of Call .................................................................................................. 51 Participation électorale selon l’année d’admission Voter Turnout by Membership Status ...................................................................................... 52 Participation électorale selon la situation professionnelle Voter Turnout by Size of Firm .................................................................................................. 54 Participation électorale selon la taille du cabinet Voter Turnout by Geographic Area .......................................................................................... 55 Participation électorale selon la région géographique Voter Turnout by Electoral Region ........................................................................................... 59 Participation électorale selon la région électorale
Foreword
2015 Election Results and Voter Turnout Statistics, 1987 – 2015
This book has three parts. Part One contains the detailed results of the 2015 bencher election.
Part Two contains statistical data on voter turnout for the years 1987 to 2015. Part Three sets
out detailed statistics on the voters who cast ballots in the 2015 election.
Part One
The information in Part One contains the total number of votes and the percentage of the total
votes cast for each candidate, by electoral region and the membership as a whole. Candidates
are listed in order of standing. Each region is arranged with the list of Outside Toronto
candidates first, followed by the list of Toronto candidates.
Part Two
Part Two provides statistical data on voter turnout by sex, year of birth, year of call, size of firm,
membership status, and electoral region for the years 1991 – 2015. Where available, data from
the 1987 bencher election is also included.
Part Three
Part Three is data specific to the 2015 bencher election and sets out statistical information on
voter turnout by year of birth, year of call, membership status, size of firm, geographic area and
electoral region.
James Varro
Elections Officer

Avant-propos
Résultats des élections 2015 et statistiques sur la participation au scrutin,
1987 – 2015
Ce manuel est divisé en trois parties. La première contient les résultats détaillés des élections
des membres du Conseil de 2015. La seconde contient des données statistiques sur la
participation électorale pour les années 1987 à 2015. La troisième partie présente des
statistiques détaillées sur la participation électorale en 2015.
Première partie
Les renseignements contenus dans la première partie donnent le nombre total de votes et le
pourcentage des votes déposés pour chaque candidat et candidate, par région électorale et par
l’ensemble des membres. Les noms des candidats sont donnés par ordre de classement. Pour
chaque région, la liste des candidats de l’extérieur de Toronto apparait en premier, suivie de la
liste des candidats de Toronto.
Seconde partie
Les renseignements de la seconde partie donnent des données statistiques sur la participation
au scrutin selon le sexe, l’année de naissance, l’année d’assermentation, la taille du cabinet,
l’état de membre de même que la région électorale et géographique. Les données pour les
élections des membres du Conseil de 1991 à 2015 sont incluses. Lorsque possible, des
données sur les élections de 1987 sont également incluses.
Troisième partie
La troisième partie traite spécifiquement des élections des membres du Conseil de 2015 et
présente des statistiques sur la participation électorale selon l’année de naissance, l’année
d’assermentation, la taille du cabinet, l’état de membre de même que la région électorale et
géographique.
James Varro
Responsable des élections
Tab/Onglet 1
RESULTS OF 2015 BENCHER ELECTION
RÉSULTATS DES ÉLECTIONS DE 2015
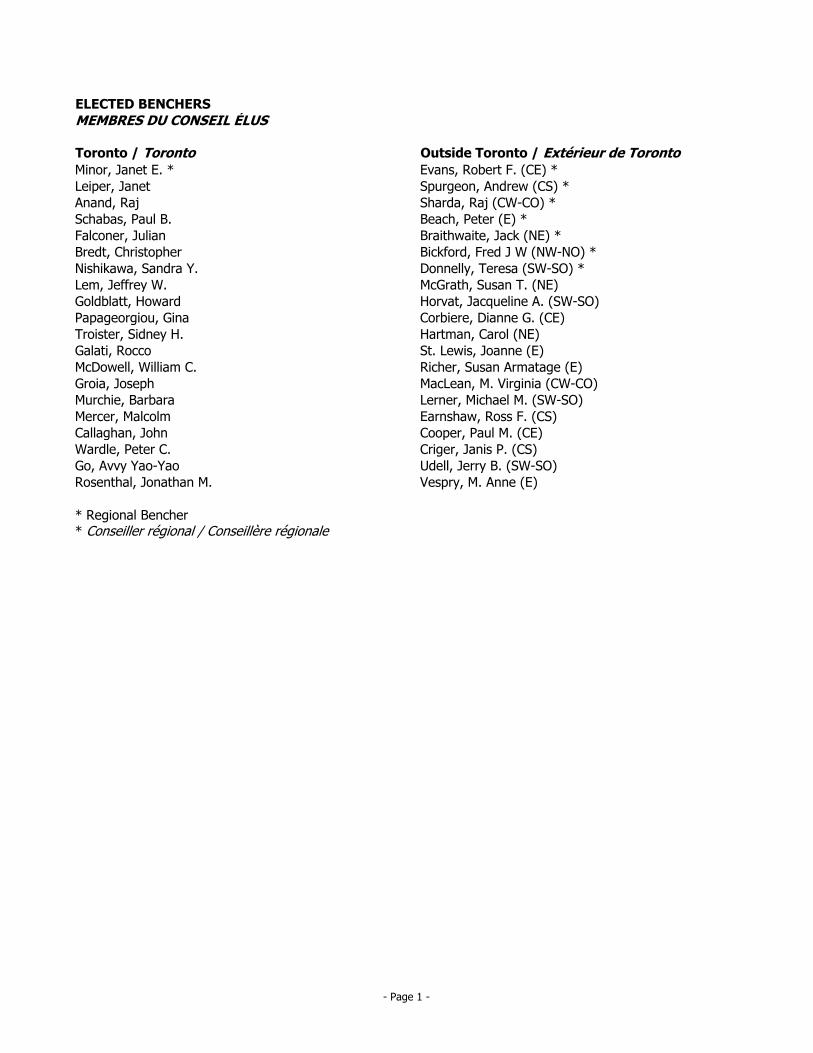
ELECTED BENCHERS
MEMBRES DU CONSEIL ÉLUS
Toronto / Toronto Outside Toronto / Extérieur de TorontoMinor, Janet E. * Evans, Robert F. (CE) *
Leiper, Janet Spurgeon, Andrew (CS) *
Anand, Raj Sharda, Raj (CW-CO) *
Schabas, Paul B. Beach, Peter (E) *
Falconer, Julian Braithwaite, Jack (NE) *
Bredt, Christopher Bickford, Fred J W (NW-NO) *
Nishikawa, Sandra Y. Donnelly, Teresa (SW-SO) *
Lem, Jeffrey W. McGrath, Susan T. (NE)
Goldblatt, Howard Horvat, Jacqueline A. (SW-SO)
Papageorgiou, Gina Corbiere, Dianne G. (CE)
Troister, Sidney H. Hartman, Carol (NE)
Galati, Rocco St. Lewis, Joanne (E)
McDowell, William C. Richer, Susan Armatage (E)
Groia, Joseph MacLean, M. Virginia (CW-CO)
Murchie, Barbara Lerner, Michael M. (SW-SO)
Mercer, Malcolm Earnshaw, Ross F. (CS)
Callaghan, John Cooper, Paul M. (CE)
Wardle, Peter C. Criger, Janis P. (CS)
Go, Avvy Yao-Yao Udell, Jerry B. (SW-SO)
Rosenthal, Jonathan M. Vespry, M. Anne (E)
* Regional Bencher* Conseiller régional / Conseillère régionale
- Page 1 -
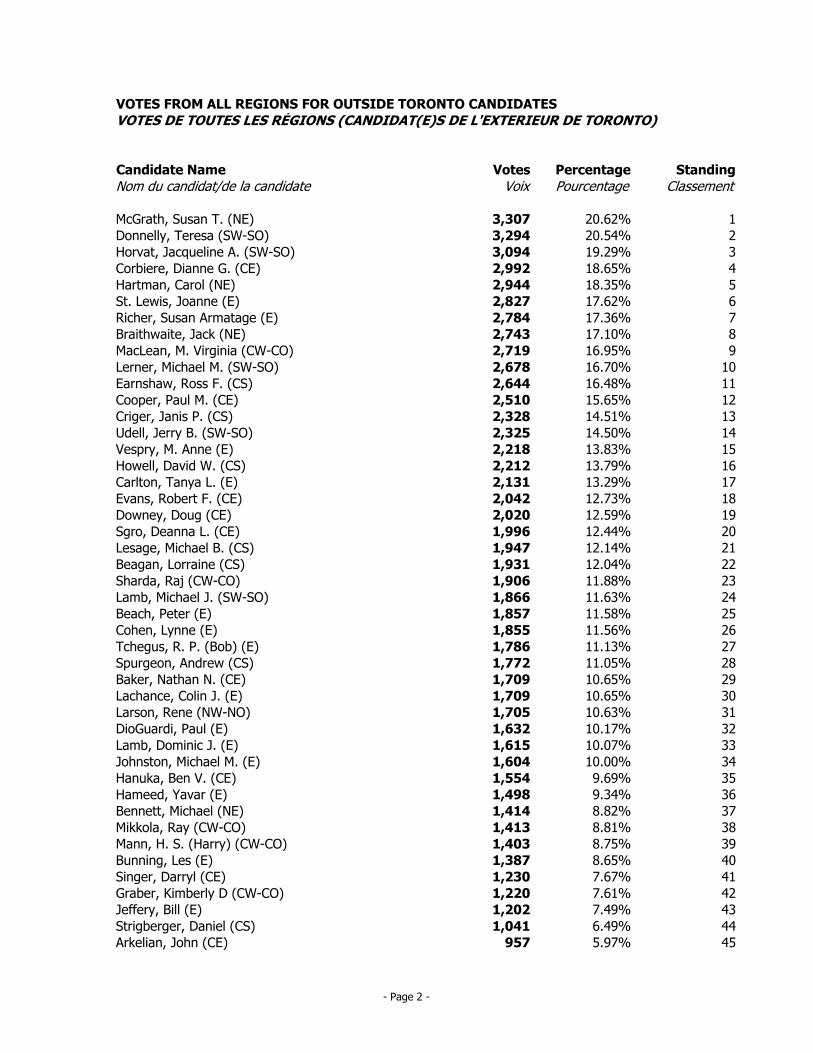
VOTES FROM ALL REGIONS FOR OUTSIDE TORONTO CANDIDATES
VOTES DE TOUTES LES RÉGIONS (CANDIDAT(E)S DE L'EXTERIEUR DE TORONTO)
Candidate Name Votes Percentage Standing
Nom du candidat/de la candidate Voix Pourcentage Classement
STM McGrath, Susan T. (NE) 3,307 20.62% 1
TED Donnelly, Teresa (SW-SO) 3,294 20.54% 2
JAH Horvat, Jacqueline A. (SW-SO) 3,094 19.29% 3
DGC Corbiere, Dianne G. (CE) 2,992 18.65% 4
CAH Hartman, Carol (NE) 2,944 18.35% 5
JOL St. Lewis, Joanne (E) 2,827 17.62% 6
SAR Richer, Susan Armatage (E) 2,784 17.36% 7
JAB Braithwaite, Jack (NE) 2,743 17.10% 8
MVM MacLean, M. Virginia (CW-CO) 2,719 16.95% 9
MML Lerner, Michael M. (SW-SO) 2,678 16.70% 10
ROE Earnshaw, Ross F. (CS) 2,644 16.48% 11
PAC Cooper, Paul M. (CE) 2,510 15.65% 12
JPC Criger, Janis P. (CS) 2,328 14.51% 13
JBU Udell, Jerry B. (SW-SO) 2,325 14.50% 14
MAV Vespry, M. Anne (E) 2,218 13.83% 15
DWH Howell, David W. (CS) 2,212 13.79% 16
TAC Carlton, Tanya L. (E) 2,131 13.29% 17
RFE Evans, Robert F. (CE) 2,042 12.73% 18
DOD Downey, Doug (CE) 2,020 12.59% 19
DES Sgro, Deanna L. (CE) 1,996 12.44% 20
MIL Lesage, Michael B. (CS) 1,947 12.14% 21
LOB Beagan, Lorraine (CS) 1,931 12.04% 22
RAJ Sharda, Raj (CW-CO) 1,906 11.88% 23
MJL Lamb, Michael J. (SW-SO) 1,866 11.63% 24
PEB Beach, Peter (E) 1,857 11.58% 25
LYC Cohen, Lynne (E) 1,855 11.56% 26
RPR Tchegus, R. P. (Bob) (E) 1,786 11.13% 27
ANS Spurgeon, Andrew (CS) 1,772 11.05% 28
NAB Baker, Nathan N. (CE) 1,709 10.65% 29
COL Lachance, Colin J. (E) 1,709 10.65% 30
REL Larson, Rene (NW-NO) 1,705 10.63% 31
PAD DioGuardi, Paul (E) 1,632 10.17% 32
DJL Lamb, Dominic J. (E) 1,615 10.07% 33
MMJ Johnston, Michael M. (E) 1,604 10.00% 34
BVH Hanuka, Ben V. (CE) 1,554 9.69% 35
YAH Hameed, Yavar (E) 1,498 9.34% 36
MIC Bennett, Michael (NE) 1,414 8.82% 37
RAM Mikkola, Ray (CW-CO) 1,413 8.81% 38
HSM Mann, H. S. (Harry) (CW-CO) 1,403 8.75% 39
LEB Bunning, Les (E) 1,387 8.65% 40
DAS Singer, Darryl (CE) 1,230 7.67% 41
KDC Graber, Kimberly D (CW-CO) 1,220 7.61% 42
BIJ Jeffery, Bill (E) 1,202 7.49% 43
DST Strigberger, Daniel (CS) 1,041 6.49% 44
JOA Arkelian, John (CE) 957 5.97% 45
- Page 2 -
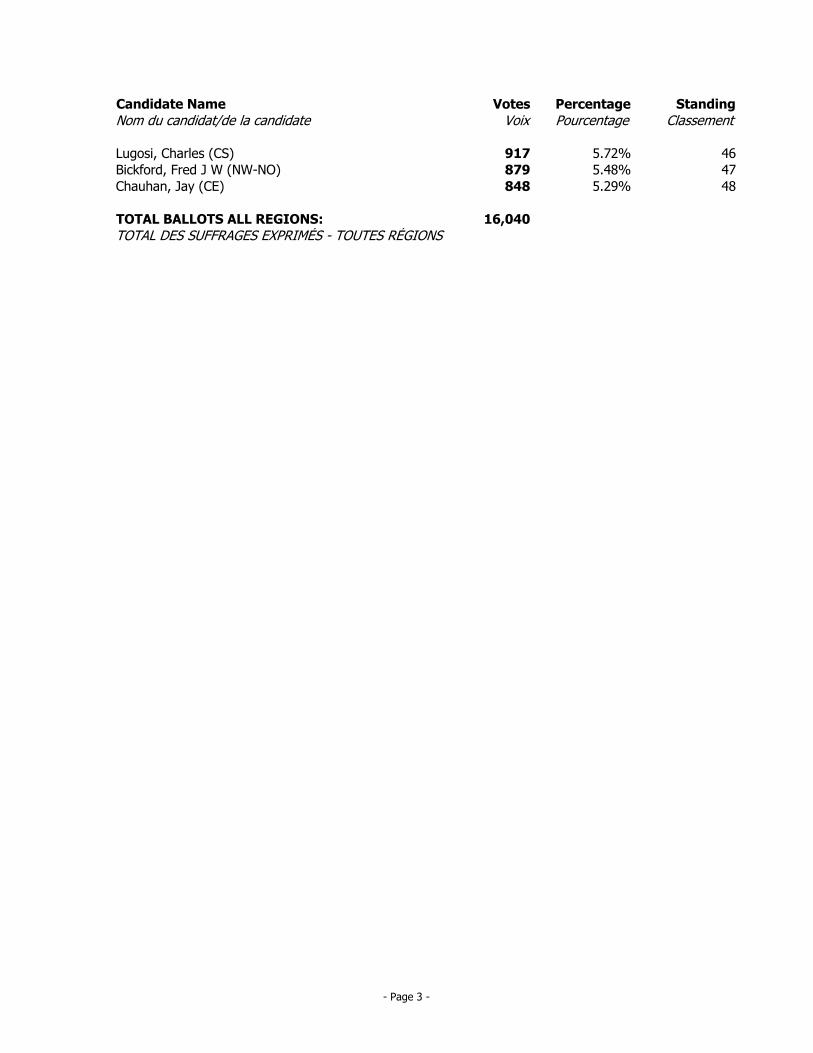
Candidate Name Votes Percentage Standing
Nom du candidat/de la candidate Voix Pourcentage Classement
CHL Lugosi, Charles (CS) 917 5.72% 46
FRB Bickford, Fred J W (NW-NO) 879 5.48% 47
JAC Chauhan, Jay (CE) 848 5.29% 48
TOTAL BALLOTS ALL REGIONS: 16,040
TOTAL DES SUFFRAGES EXPRIMÉS - TOUTES RÉGIONS
- Page 3 -
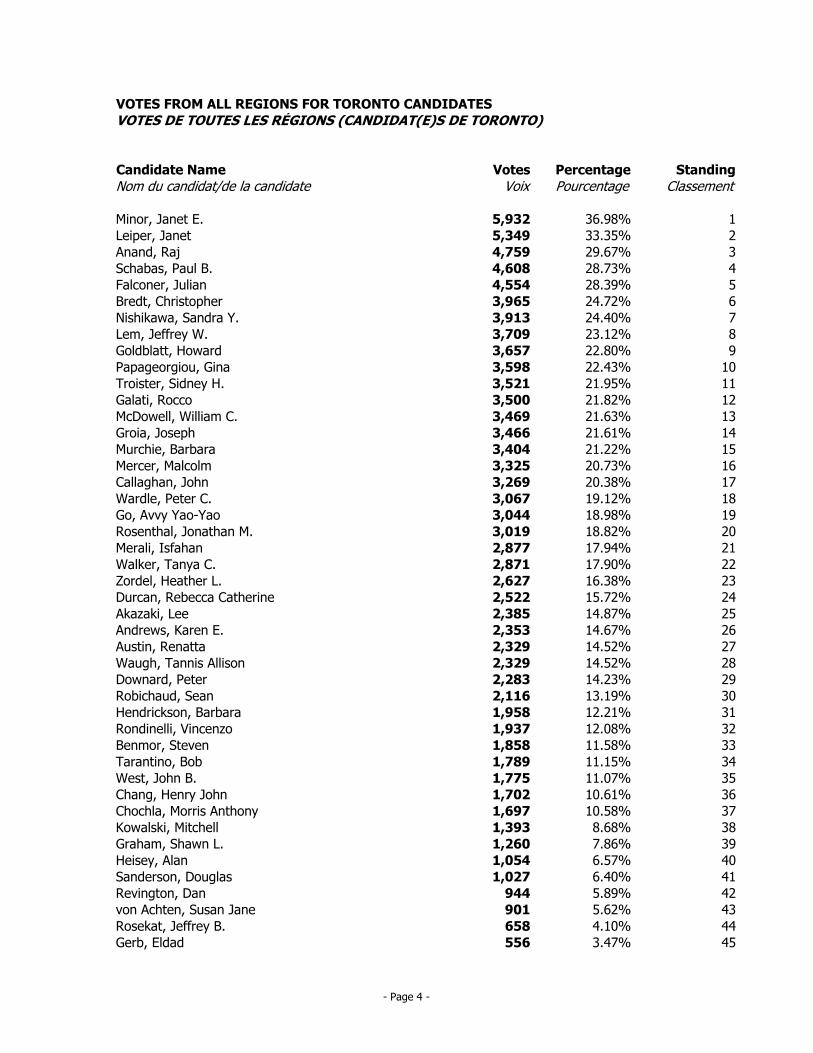
VOTES FROM ALL REGIONS FOR TORONTO CANDIDATES
VOTES DE TOUTES LES RÉGIONS (CANDIDAT(E)S DE TORONTO)
Candidate Name Votes Percentage Standing
Nom du candidat/de la candidate Voix Pourcentage Classement
JEM Minor, Janet E. 5,932 36.98% 1
JAL Leiper, Janet 5,349 33.35% 2
RAA Anand, Raj 4,759 29.67% 3
PBS Schabas, Paul B. 4,608 28.73% 4
JUF Falconer, Julian 4,554 28.39% 5
CHB Bredt, Christopher 3,965 24.72% 6
SAN Nishikawa, Sandra Y. 3,913 24.40% 7
JWL Lem, Jeffrey W. 3,709 23.12% 8
HOG Goldblatt, Howard 3,657 22.80% 9
GIP Papageorgiou, Gina 3,598 22.43% 10
SHT Troister, Sidney H. 3,521 21.95% 11
ROG Galati, Rocco 3,500 21.82% 12
WCW McDowell, William C. 3,469 21.63% 13
JOG Groia, Joseph 3,466 21.61% 14
BAM Murchie, Barbara 3,404 21.22% 15
MAM Mercer, Malcolm 3,325 20.73% 16
JOC Callaghan, John 3,269 20.38% 17
PCW Wardle, Peter C. 3,067 19.12% 18
AVV Go, Avvy Yao-Yao 3,044 18.98% 19
JMR Rosenthal, Jonathan M. 3,019 18.82% 20
ISM Merali, Isfahan 2,877 17.94% 21
TCW Walker, Tanya C. 2,871 17.90% 22
HLZ Zordel, Heather L. 2,627 16.38% 23
RCD Durcan, Rebecca Catherine 2,522 15.72% 24
LEA Akazaki, Lee 2,385 14.87% 25
KEA Andrews, Karen E. 2,353 14.67% 26
RAU Austin, Renatta 2,329 14.52% 27
TAW Waugh, Tannis Allison 2,329 14.52% 28
PED Downard, Peter 2,283 14.23% 29
SER Robichaud, Sean 2,116 13.19% 30
BAG Hendrickson, Barbara 1,958 12.21% 31
VIR Rondinelli, Vincenzo 1,937 12.08% 32
STB Benmor, Steven 1,858 11.58% 33
BTA Tarantino, Bob 1,789 11.15% 34
JBW West, John B. 1,775 11.07% 35
HJC Chang, Henry John 1,702 10.61% 36
MAC Chochla, Morris Anthony 1,697 10.58% 37
MIK Kowalski, Mitchell 1,393 8.68% 38
SLG Graham, Shawn L. 1,260 7.86% 39
ALF Heisey, Alan 1,054 6.57% 40
DOS Sanderson, Douglas 1,027 6.40% 41
DAR Revington, Dan 944 5.89% 42
SJA von Achten, Susan Jane 901 5.62% 43
JBR Rosekat, Jeffrey B. 658 4.10% 44
ELG Gerb, Eldad 556 3.47% 45
- Page 4 -
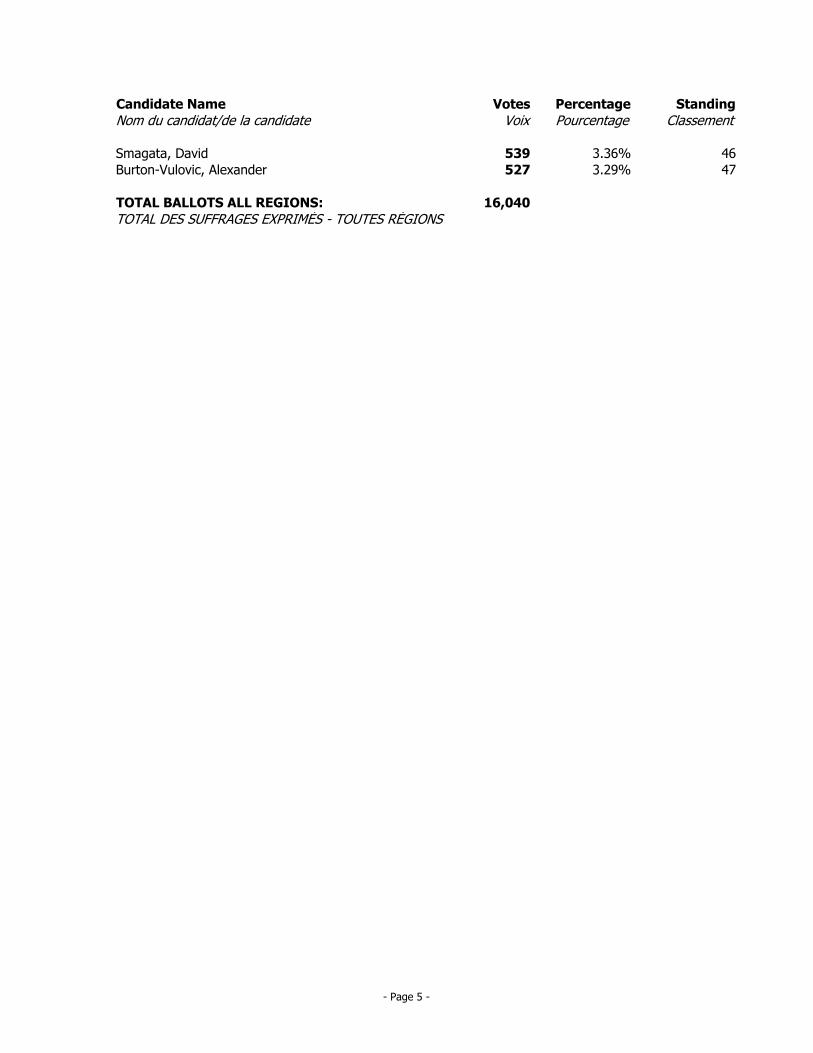
Candidate Name Votes Percentage Standing
Nom du candidat/de la candidate Voix Pourcentage Classement
DSM Smagata, David 539 3.36% 46
ABV Burton-Vulovic, Alexander 527 3.29% 47
TOTAL BALLOTS ALL REGIONS: 16,040
TOTAL DES SUFFRAGES EXPRIMÉS - TOUTES RÉGIONS
- Page 5 -
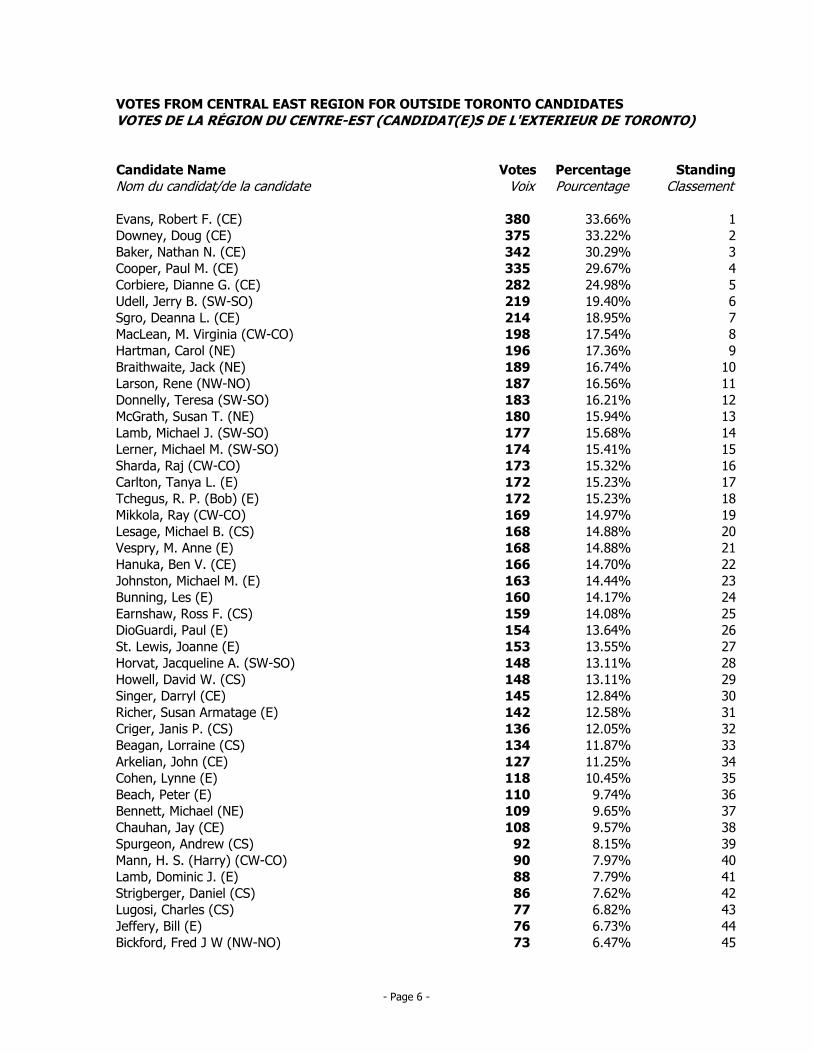
VOTES FROM CENTRAL EAST REGION FOR OUTSIDE TORONTO CANDIDATES
VOTES DE LA RÉGION DU CENTRE-EST (CANDIDAT(E)S DE L'EXTERIEUR DE TORONTO)
Candidate Name Votes Percentage Standing
Nom du candidat/de la candidate Voix Pourcentage Classement
RFE Evans, Robert F. (CE) 380 33.66% 1
DOD Downey, Doug (CE) 375 33.22% 2
NAB Baker, Nathan N. (CE) 342 30.29% 3
PAC Cooper, Paul M. (CE) 335 29.67% 4
DGC Corbiere, Dianne G. (CE) 282 24.98% 5
JBU Udell, Jerry B. (SW-SO) 219 19.40% 6
DES Sgro, Deanna L. (CE) 214 18.95% 7
MVM MacLean, M. Virginia (CW-CO) 198 17.54% 8
CAH Hartman, Carol (NE) 196 17.36% 9
JAB Braithwaite, Jack (NE) 189 16.74% 10
REL Larson, Rene (NW-NO) 187 16.56% 11
TED Donnelly, Teresa (SW-SO) 183 16.21% 12
STM McGrath, Susan T. (NE) 180 15.94% 13
MJL Lamb, Michael J. (SW-SO) 177 15.68% 14
MML Lerner, Michael M. (SW-SO) 174 15.41% 15
RAJ Sharda, Raj (CW-CO) 173 15.32% 16
TAC Carlton, Tanya L. (E) 172 15.23% 17
RPR Tchegus, R. P. (Bob) (E) 172 15.23% 18
RAM Mikkola, Ray (CW-CO) 169 14.97% 19
MIL Lesage, Michael B. (CS) 168 14.88% 20
MAV Vespry, M. Anne (E) 168 14.88% 21
BVH Hanuka, Ben V. (CE) 166 14.70% 22
MMJ Johnston, Michael M. (E) 163 14.44% 23
LEB Bunning, Les (E) 160 14.17% 24
ROE Earnshaw, Ross F. (CS) 159 14.08% 25
PAD DioGuardi, Paul (E) 154 13.64% 26
JOL St. Lewis, Joanne (E) 153 13.55% 27
JAH Horvat, Jacqueline A. (SW-SO) 148 13.11% 28
DWH Howell, David W. (CS) 148 13.11% 29
DAS Singer, Darryl (CE) 145 12.84% 30
SAR Richer, Susan Armatage (E) 142 12.58% 31
JPC Criger, Janis P. (CS) 136 12.05% 32
LOB Beagan, Lorraine (CS) 134 11.87% 33
JOA Arkelian, John (CE) 127 11.25% 34
LYC Cohen, Lynne (E) 118 10.45% 35
PEB Beach, Peter (E) 110 9.74% 36
MIC Bennett, Michael (NE) 109 9.65% 37
JAC Chauhan, Jay (CE) 108 9.57% 38
ANS Spurgeon, Andrew (CS) 92 8.15% 39
HSM Mann, H. S. (Harry) (CW-CO) 90 7.97% 40
DJL Lamb, Dominic J. (E) 88 7.79% 41
DST Strigberger, Daniel (CS) 86 7.62% 42
CHL Lugosi, Charles (CS) 77 6.82% 43
BIJ Jeffery, Bill (E) 76 6.73% 44
FRB Bickford, Fred J W (NW-NO) 73 6.47% 45
- Page 6 -

Candidate Name Votes Percentage Standing
Nom du candidat/de la candidate Voix Pourcentage Classement
KDC Graber, Kimberly D (CW-CO) 72 6.38% 46
COL Lachance, Colin J. (E) 70 6.20% 47
YAH Hameed, Yavar (E) 67 5.93% 48
TOTAL BALLOTS CENTRAL EAST REGION: 1129
TOTAL DES SUFFRAGES EXPRIMÉS - CENTRE-EST
- Page 7 -
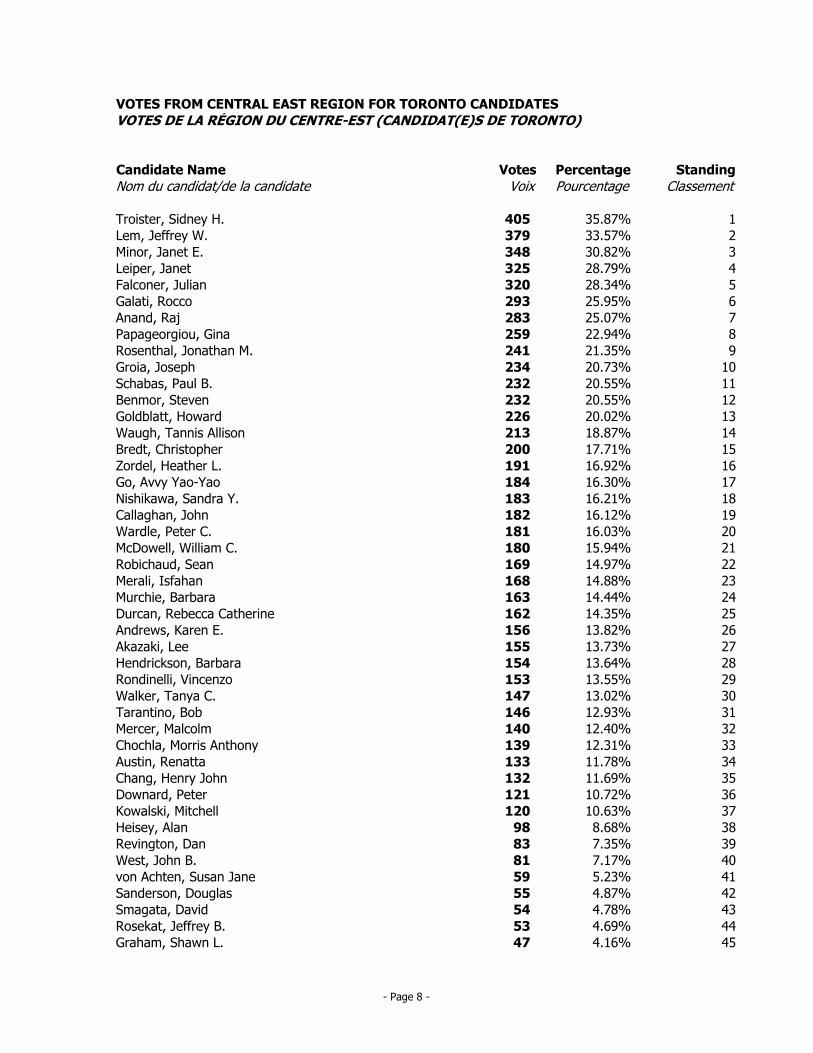
VOTES FROM CENTRAL EAST REGION FOR TORONTO CANDIDATES
VOTES DE LA RÉGION DU CENTRE-EST (CANDIDAT(E)S DE TORONTO)
Candidate Name Votes Percentage Standing
Nom du candidat/de la candidate Voix Pourcentage Classement
SHT Troister, Sidney H. 405 35.87% 1
JWL Lem, Jeffrey W. 379 33.57% 2
JEM Minor, Janet E. 348 30.82% 3
JAL Leiper, Janet 325 28.79% 4
JUF Falconer, Julian 320 28.34% 5
ROG Galati, Rocco 293 25.95% 6
RAA Anand, Raj 283 25.07% 7
GIP Papageorgiou, Gina 259 22.94% 8
JMR Rosenthal, Jonathan M. 241 21.35% 9
JOG Groia, Joseph 234 20.73% 10
PBS Schabas, Paul B. 232 20.55% 11
STB Benmor, Steven 232 20.55% 12
HOG Goldblatt, Howard 226 20.02% 13
TAW Waugh, Tannis Allison 213 18.87% 14
CHB Bredt, Christopher 200 17.71% 15
HLZ Zordel, Heather L. 191 16.92% 16
AVV Go, Avvy Yao-Yao 184 16.30% 17
SAN Nishikawa, Sandra Y. 183 16.21% 18
JOC Callaghan, John 182 16.12% 19
PCW Wardle, Peter C. 181 16.03% 20
WCW McDowell, William C. 180 15.94% 21
SER Robichaud, Sean 169 14.97% 22
ISM Merali, Isfahan 168 14.88% 23
BAM Murchie, Barbara 163 14.44% 24
RCD Durcan, Rebecca Catherine 162 14.35% 25
KEA Andrews, Karen E. 156 13.82% 26
LEA Akazaki, Lee 155 13.73% 27
BAG Hendrickson, Barbara 154 13.64% 28
VIR Rondinelli, Vincenzo 153 13.55% 29
TCW Walker, Tanya C. 147 13.02% 30
BTA Tarantino, Bob 146 12.93% 31
MAM Mercer, Malcolm 140 12.40% 32
MAC Chochla, Morris Anthony 139 12.31% 33
RAU Austin, Renatta 133 11.78% 34
HJC Chang, Henry John 132 11.69% 35
PED Downard, Peter 121 10.72% 36
MIK Kowalski, Mitchell 120 10.63% 37
ALF Heisey, Alan 98 8.68% 38
DAR Revington, Dan 83 7.35% 39
JBW West, John B. 81 7.17% 40
SJA von Achten, Susan Jane 59 5.23% 41
DOS Sanderson, Douglas 55 4.87% 42
DSM Smagata, David 54 4.78% 43
JBR Rosekat, Jeffrey B. 53 4.69% 44
SLG Graham, Shawn L. 47 4.16% 45
- Page 8 -

Candidate Name Votes Percentage Standing
Nom du candidat/de la candidate Voix Pourcentage Classement
ABV Burton-Vulovic, Alexander 44 3.90% 46
ELG Gerb, Eldad 39 3.45% 47
TOTAL BALLOTS CENTRAL EAST REGION: 1129
TOTAL DES SUFFRAGES EXPRIMÉS - CENTRE-EST
- Page 9 -

VOTES FROM CENTRAL SOUTH REGION FOR OUTSIDE TORONTO CANDIDATES
VOTES DE LA RÉGION DU CENTRE-SUD (CANDIDAT(E)S DE L'EXTERIEUR DE TORONTO)
Candidate Name Votes Percentage Standing
Nom du candidat/de la candidate Voix Pourcentage Classement
ANS Spurgeon, Andrew (CS) 513 49.57% 1
DWH Howell, David W. (CS) 482 46.57% 2
ROE Earnshaw, Ross F. (CS) 460 44.44% 3
JPC Criger, Janis P. (CS) 414 40.00% 4
LOB Beagan, Lorraine (CS) 275 26.57% 5
TED Donnelly, Teresa (SW-SO) 244 23.57% 6
MIL Lesage, Michael B. (CS) 203 19.61% 7
MML Lerner, Michael M. (SW-SO) 184 17.78% 8
JBU Udell, Jerry B. (SW-SO) 179 17.29% 9
MJL Lamb, Michael J. (SW-SO) 178 17.20% 10
STM McGrath, Susan T. (NE) 177 17.10% 11
MVM MacLean, M. Virginia (CW-CO) 171 16.52% 12
CAH Hartman, Carol (NE) 153 14.78% 13
JAB Braithwaite, Jack (NE) 143 13.82% 14
CHL Lugosi, Charles (CS) 142 13.72% 15
JAH Horvat, Jacqueline A. (SW-SO) 139 13.43% 16
DST Strigberger, Daniel (CS) 135 13.04% 17
REL Larson, Rene (NW-NO) 130 12.56% 18
RFE Evans, Robert F. (CE) 125 12.08% 19
MAV Vespry, M. Anne (E) 118 11.40% 20
DGC Corbiere, Dianne G. (CE) 114 11.01% 21
DOD Downey, Doug (CE) 108 10.43% 22
PAC Cooper, Paul M. (CE) 104 10.05% 23
DES Sgro, Deanna L. (CE) 101 9.76% 24
MIC Bennett, Michael (NE) 100 9.66% 25
SAR Richer, Susan Armatage (E) 100 9.66% 26
JOL St. Lewis, Joanne (E) 98 9.47% 27
RAJ Sharda, Raj (CW-CO) 97 9.37% 28
LEB Bunning, Les (E) 94 9.08% 29
RPR Tchegus, R. P. (Bob) (E) 93 8.99% 30
NAB Baker, Nathan N. (CE) 90 8.70% 31
TAC Carlton, Tanya L. (E) 88 8.50% 32
BVH Hanuka, Ben V. (CE) 88 8.50% 33
PAD DioGuardi, Paul (E) 87 8.41% 34
MMJ Johnston, Michael M. (E) 76 7.34% 35
RAM Mikkola, Ray (CW-CO) 76 7.34% 36
PEB Beach, Peter (E) 75 7.25% 37
DJL Lamb, Dominic J. (E) 74 7.15% 38
JOA Arkelian, John (CE) 73 7.05% 39
KDC Graber, Kimberly D (CW-CO) 71 6.86% 40
LYC Cohen, Lynne (E) 70 6.76% 41
HSM Mann, H. S. (Harry) (CW-CO) 69 6.67% 42
FRB Bickford, Fred J W (NW-NO) 62 5.99% 43
COL Lachance, Colin J. (E) 50 4.83% 44
BIJ Jeffery, Bill (E) 49 4.73% 45
- Page 10 -
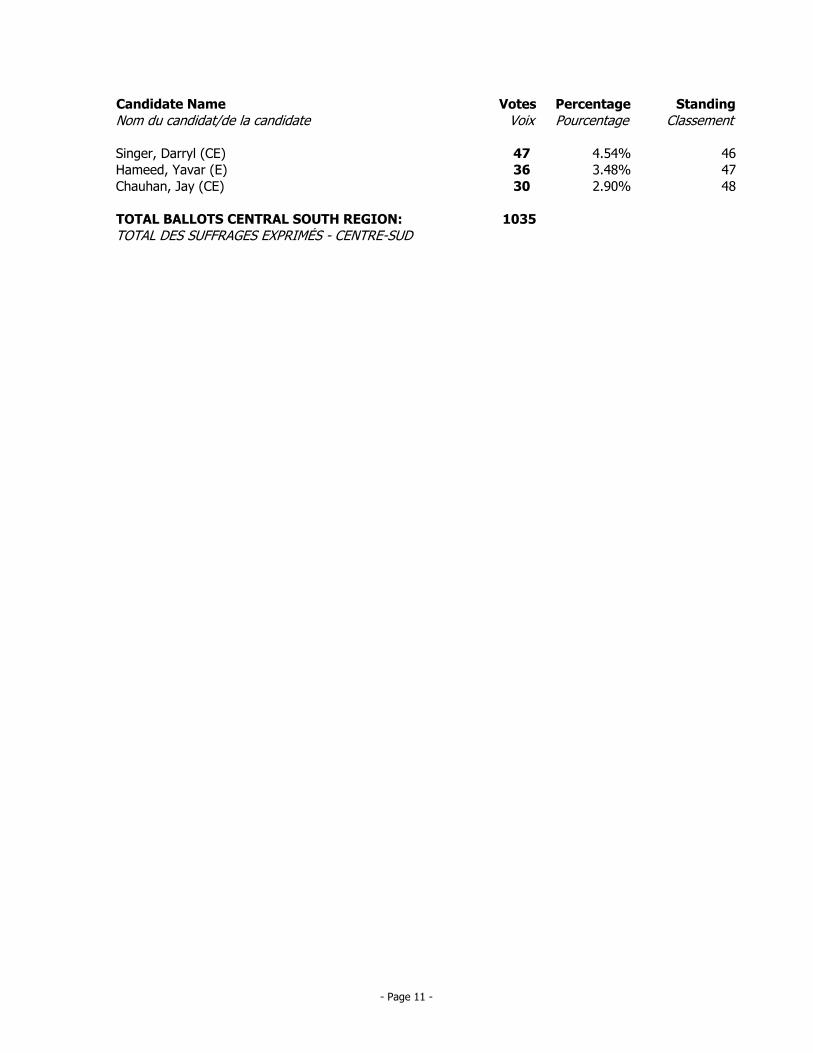
Candidate Name Votes Percentage Standing
Nom du candidat/de la candidate Voix Pourcentage Classement
DAS Singer, Darryl (CE) 47 4.54% 46
YAH Hameed, Yavar (E) 36 3.48% 47
JAC Chauhan, Jay (CE) 30 2.90% 48
TOTAL BALLOTS CENTRAL SOUTH REGION: 1035
TOTAL DES SUFFRAGES EXPRIMÉS - CENTRE-SUD
- Page 11 -
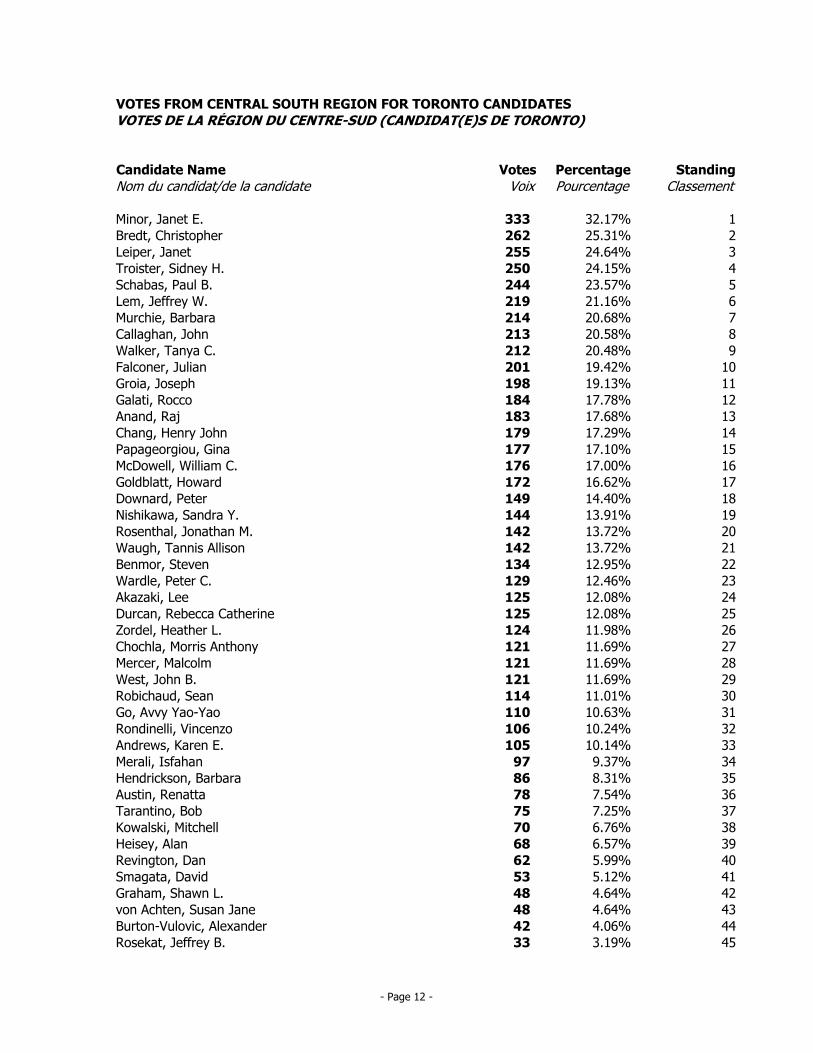
VOTES FROM CENTRAL SOUTH REGION FOR TORONTO CANDIDATES
VOTES DE LA RÉGION DU CENTRE-SUD (CANDIDAT(E)S DE TORONTO)
Candidate Name Votes Percentage Standing
Nom du candidat/de la candidate Voix Pourcentage Classement
JEM Minor, Janet E. 333 32.17% 1
CHB Bredt, Christopher 262 25.31% 2
JAL Leiper, Janet 255 24.64% 3
SHT Troister, Sidney H. 250 24.15% 4
PBS Schabas, Paul B. 244 23.57% 5
JWL Lem, Jeffrey W. 219 21.16% 6
BAM Murchie, Barbara 214 20.68% 7
JOC Callaghan, John 213 20.58% 8
TCW Walker, Tanya C. 212 20.48% 9
JUF Falconer, Julian 201 19.42% 10
JOG Groia, Joseph 198 19.13% 11
ROG Galati, Rocco 184 17.78% 12
RAA Anand, Raj 183 17.68% 13
HJC Chang, Henry John 179 17.29% 14
GIP Papageorgiou, Gina 177 17.10% 15
WCW McDowell, William C. 176 17.00% 16
HOG Goldblatt, Howard 172 16.62% 17
PED Downard, Peter 149 14.40% 18
SAN Nishikawa, Sandra Y. 144 13.91% 19
JMR Rosenthal, Jonathan M. 142 13.72% 20
TAW Waugh, Tannis Allison 142 13.72% 21
STB Benmor, Steven 134 12.95% 22
PCW Wardle, Peter C. 129 12.46% 23
LEA Akazaki, Lee 125 12.08% 24
RCD Durcan, Rebecca Catherine 125 12.08% 25
HLZ Zordel, Heather L. 124 11.98% 26
MAC Chochla, Morris Anthony 121 11.69% 27
MAM Mercer, Malcolm 121 11.69% 28
JBW West, John B. 121 11.69% 29
SER Robichaud, Sean 114 11.01% 30
AVV Go, Avvy Yao-Yao 110 10.63% 31
VIR Rondinelli, Vincenzo 106 10.24% 32
KEA Andrews, Karen E. 105 10.14% 33
ISM Merali, Isfahan 97 9.37% 34
BAG Hendrickson, Barbara 86 8.31% 35
RAU Austin, Renatta 78 7.54% 36
BTA Tarantino, Bob 75 7.25% 37
MIK Kowalski, Mitchell 70 6.76% 38
ALF Heisey, Alan 68 6.57% 39
DAR Revington, Dan 62 5.99% 40
DSM Smagata, David 53 5.12% 41
SLG Graham, Shawn L. 48 4.64% 42
SJA von Achten, Susan Jane 48 4.64% 43
ABV Burton-Vulovic, Alexander 42 4.06% 44
JBR Rosekat, Jeffrey B. 33 3.19% 45
- Page 12 -

Candidate Name Votes Percentage Standing
Nom du candidat/de la candidate Voix Pourcentage Classement
DOS Sanderson, Douglas 32 3.09% 46
ELG Gerb, Eldad 22 2.13% 47
TOTAL BALLOTS CENTRAL SOUTH REGION: 1035
TOTAL DES SUFFRAGES EXPRIMÉS - CENTRE-SUD
- Page 13 -
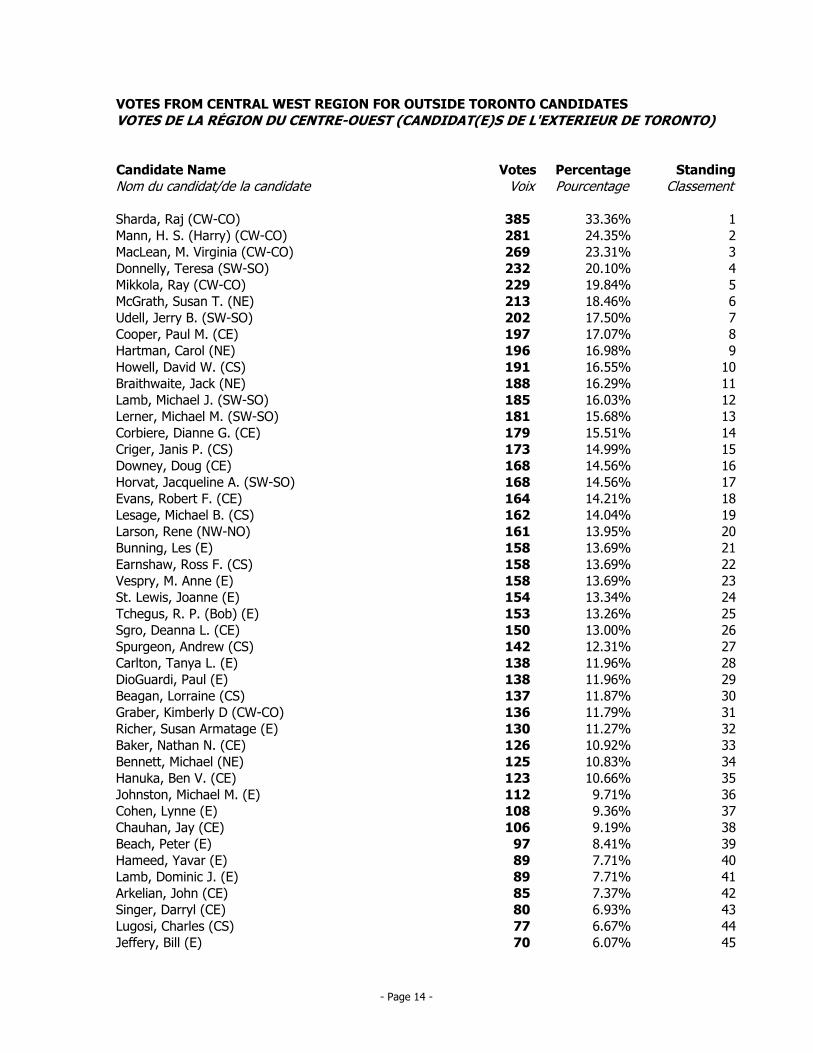
VOTES FROM CENTRAL WEST REGION FOR OUTSIDE TORONTO CANDIDATES
VOTES DE LA RÉGION DU CENTRE-OUEST (CANDIDAT(E)S DE L'EXTERIEUR DE TORONTO)
Candidate Name Votes Percentage Standing
Nom du candidat/de la candidate Voix Pourcentage Classement
RAJ Sharda, Raj (CW-CO) 385 33.36% 1
HSM Mann, H. S. (Harry) (CW-CO) 281 24.35% 2
MVM MacLean, M. Virginia (CW-CO) 269 23.31% 3
TED Donnelly, Teresa (SW-SO) 232 20.10% 4
RAM Mikkola, Ray (CW-CO) 229 19.84% 5
STM McGrath, Susan T. (NE) 213 18.46% 6
JBU Udell, Jerry B. (SW-SO) 202 17.50% 7
PAC Cooper, Paul M. (CE) 197 17.07% 8
CAH Hartman, Carol (NE) 196 16.98% 9
DWH Howell, David W. (CS) 191 16.55% 10
JAB Braithwaite, Jack (NE) 188 16.29% 11
MJL Lamb, Michael J. (SW-SO) 185 16.03% 12
MML Lerner, Michael M. (SW-SO) 181 15.68% 13
DGC Corbiere, Dianne G. (CE) 179 15.51% 14
JPC Criger, Janis P. (CS) 173 14.99% 15
DOD Downey, Doug (CE) 168 14.56% 16
JAH Horvat, Jacqueline A. (SW-SO) 168 14.56% 17
RFE Evans, Robert F. (CE) 164 14.21% 18
MIL Lesage, Michael B. (CS) 162 14.04% 19
REL Larson, Rene (NW-NO) 161 13.95% 20
LEB Bunning, Les (E) 158 13.69% 21
ROE Earnshaw, Ross F. (CS) 158 13.69% 22
MAV Vespry, M. Anne (E) 158 13.69% 23
JOL St. Lewis, Joanne (E) 154 13.34% 24
RPR Tchegus, R. P. (Bob) (E) 153 13.26% 25
DES Sgro, Deanna L. (CE) 150 13.00% 26
ANS Spurgeon, Andrew (CS) 142 12.31% 27
TAC Carlton, Tanya L. (E) 138 11.96% 28
PAD DioGuardi, Paul (E) 138 11.96% 29
LOB Beagan, Lorraine (CS) 137 11.87% 30
KDC Graber, Kimberly D (CW-CO) 136 11.79% 31
SAR Richer, Susan Armatage (E) 130 11.27% 32
NAB Baker, Nathan N. (CE) 126 10.92% 33
MIC Bennett, Michael (NE) 125 10.83% 34
BVH Hanuka, Ben V. (CE) 123 10.66% 35
MMJ Johnston, Michael M. (E) 112 9.71% 36
LYC Cohen, Lynne (E) 108 9.36% 37
JAC Chauhan, Jay (CE) 106 9.19% 38
PEB Beach, Peter (E) 97 8.41% 39
YAH Hameed, Yavar (E) 89 7.71% 40
DJL Lamb, Dominic J. (E) 89 7.71% 41
JOA Arkelian, John (CE) 85 7.37% 42
DAS Singer, Darryl (CE) 80 6.93% 43
CHL Lugosi, Charles (CS) 77 6.67% 44
BIJ Jeffery, Bill (E) 70 6.07% 45
- Page 14 -
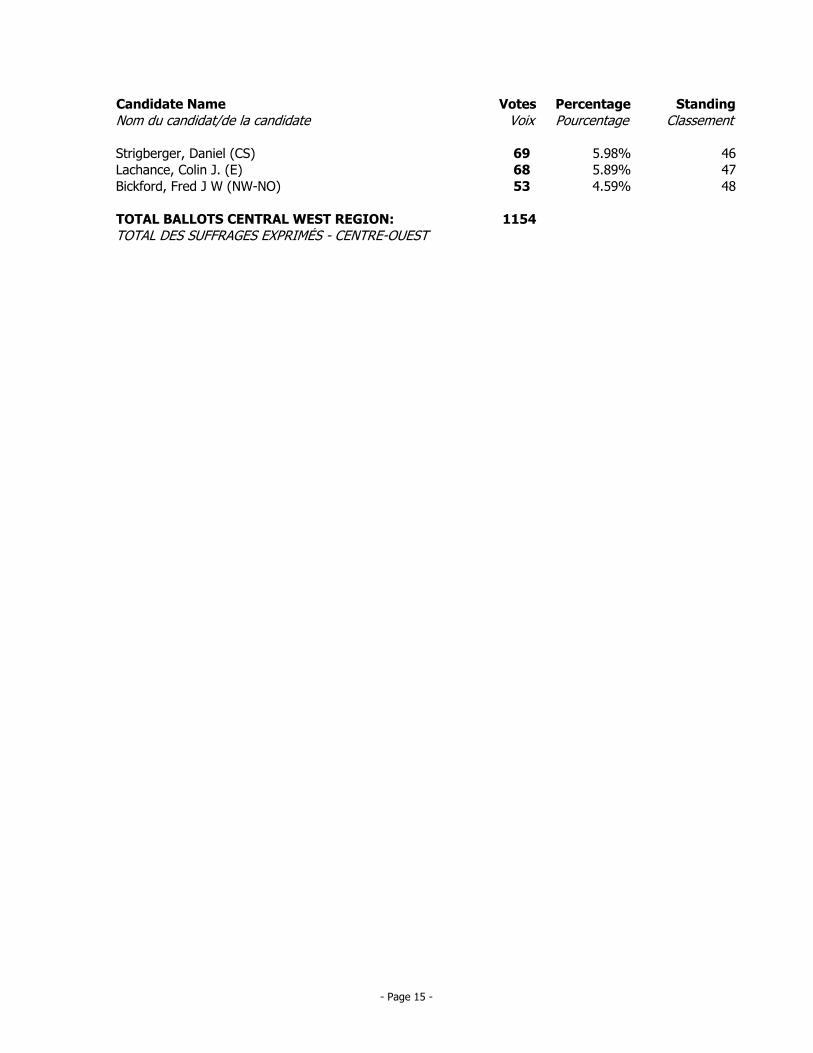
Candidate Name Votes Percentage Standing
Nom du candidat/de la candidate Voix Pourcentage Classement
DST Strigberger, Daniel (CS) 69 5.98% 46
COL Lachance, Colin J. (E) 68 5.89% 47
FRB Bickford, Fred J W (NW-NO) 53 4.59% 48
TOTAL BALLOTS CENTRAL WEST REGION: 1154
TOTAL DES SUFFRAGES EXPRIMÉS - CENTRE-OUEST
- Page 15 -
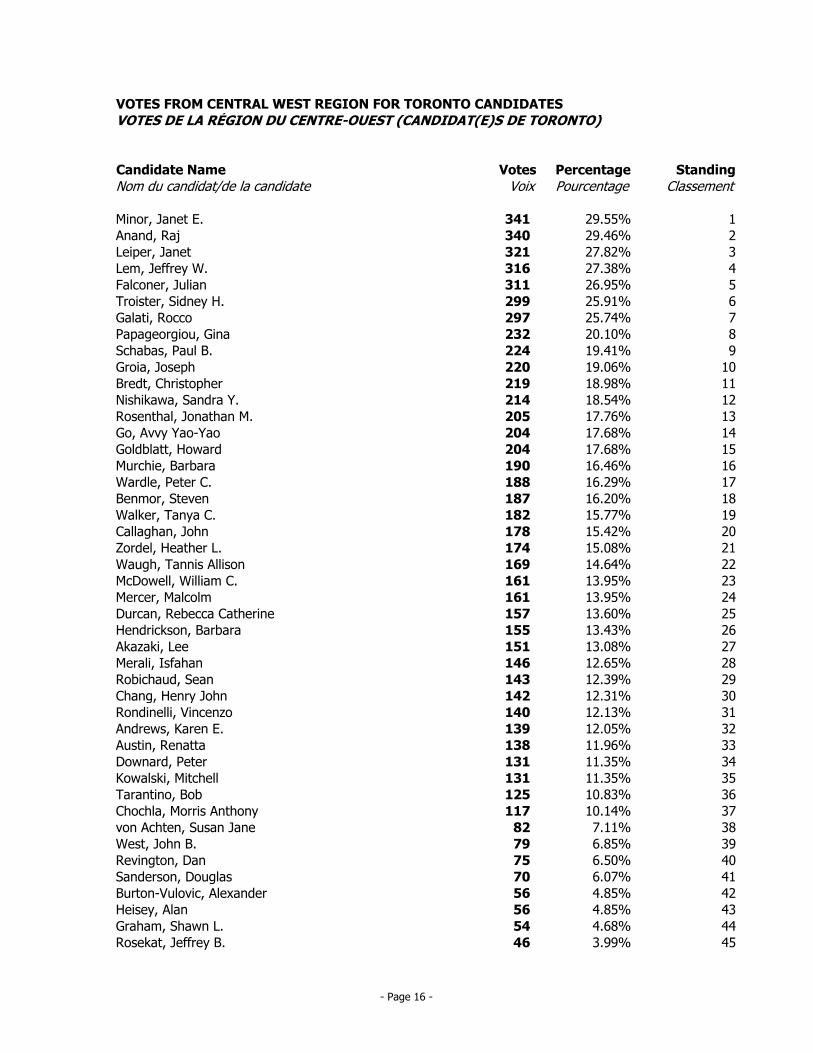
VOTES FROM CENTRAL WEST REGION FOR TORONTO CANDIDATES
VOTES DE LA RÉGION DU CENTRE-OUEST (CANDIDAT(E)S DE TORONTO)
Candidate Name Votes Percentage Standing
Nom du candidat/de la candidate Voix Pourcentage Classement
JEM Minor, Janet E. 341 29.55% 1
RAA Anand, Raj 340 29.46% 2
JAL Leiper, Janet 321 27.82% 3
JWL Lem, Jeffrey W. 316 27.38% 4
JUF Falconer, Julian 311 26.95% 5
SHT Troister, Sidney H. 299 25.91% 6
ROG Galati, Rocco 297 25.74% 7
GIP Papageorgiou, Gina 232 20.10% 8
PBS Schabas, Paul B. 224 19.41% 9
JOG Groia, Joseph 220 19.06% 10
CHB Bredt, Christopher 219 18.98% 11
SAN Nishikawa, Sandra Y. 214 18.54% 12
JMR Rosenthal, Jonathan M. 205 17.76% 13
AVV Go, Avvy Yao-Yao 204 17.68% 14
HOG Goldblatt, Howard 204 17.68% 15
BAM Murchie, Barbara 190 16.46% 16
PCW Wardle, Peter C. 188 16.29% 17
STB Benmor, Steven 187 16.20% 18
TCW Walker, Tanya C. 182 15.77% 19
JOC Callaghan, John 178 15.42% 20
HLZ Zordel, Heather L. 174 15.08% 21
TAW Waugh, Tannis Allison 169 14.64% 22
WCW McDowell, William C. 161 13.95% 23
MAM Mercer, Malcolm 161 13.95% 24
RCD Durcan, Rebecca Catherine 157 13.60% 25
BAG Hendrickson, Barbara 155 13.43% 26
LEA Akazaki, Lee 151 13.08% 27
ISM Merali, Isfahan 146 12.65% 28
SER Robichaud, Sean 143 12.39% 29
HJC Chang, Henry John 142 12.31% 30
VIR Rondinelli, Vincenzo 140 12.13% 31
KEA Andrews, Karen E. 139 12.05% 32
RAU Austin, Renatta 138 11.96% 33
PED Downard, Peter 131 11.35% 34
MIK Kowalski, Mitchell 131 11.35% 35
BTA Tarantino, Bob 125 10.83% 36
MAC Chochla, Morris Anthony 117 10.14% 37
SJA von Achten, Susan Jane 82 7.11% 38
JBW West, John B. 79 6.85% 39
DAR Revington, Dan 75 6.50% 40
DOS Sanderson, Douglas 70 6.07% 41
ABV Burton-Vulovic, Alexander 56 4.85% 42
ALF Heisey, Alan 56 4.85% 43
SLG Graham, Shawn L. 54 4.68% 44
JBR Rosekat, Jeffrey B. 46 3.99% 45
- Page 16 -

Candidate Name Votes Percentage Standing
Nom du candidat/de la candidate Voix Pourcentage Classement
DSM Smagata, David 46 3.99% 46
ELG Gerb, Eldad 35 3.03% 47
TOTAL BALLOTS CENTRAL WEST REGION: 1154
TOTAL DES SUFFRAGES EXPRIMÉS - CENTRE-OUEST
- Page 17 -
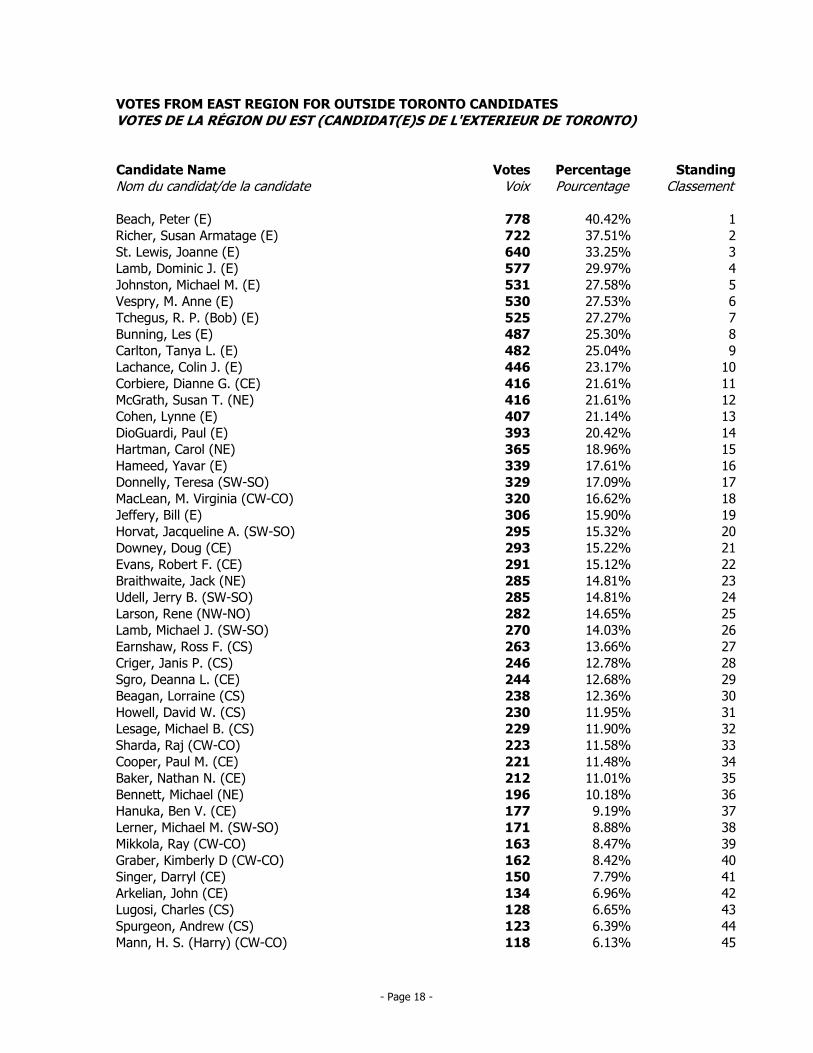
VOTES FROM EAST REGION FOR OUTSIDE TORONTO CANDIDATES
VOTES DE LA RÉGION DU EST (CANDIDAT(E)S DE L'EXTERIEUR DE TORONTO)
Candidate Name Votes Percentage Standing
Nom du candidat/de la candidate Voix Pourcentage Classement
PEB Beach, Peter (E) 778 40.42% 1
SAR Richer, Susan Armatage (E) 722 37.51% 2
JOL St. Lewis, Joanne (E) 640 33.25% 3
DJL Lamb, Dominic J. (E) 577 29.97% 4
MMJ Johnston, Michael M. (E) 531 27.58% 5
MAV Vespry, M. Anne (E) 530 27.53% 6
RPR Tchegus, R. P. (Bob) (E) 525 27.27% 7
LEB Bunning, Les (E) 487 25.30% 8
TAC Carlton, Tanya L. (E) 482 25.04% 9
COL Lachance, Colin J. (E) 446 23.17% 10
DGC Corbiere, Dianne G. (CE) 416 21.61% 11
STM McGrath, Susan T. (NE) 416 21.61% 12
LYC Cohen, Lynne (E) 407 21.14% 13
PAD DioGuardi, Paul (E) 393 20.42% 14
CAH Hartman, Carol (NE) 365 18.96% 15
YAH Hameed, Yavar (E) 339 17.61% 16
TED Donnelly, Teresa (SW-SO) 329 17.09% 17
MVM MacLean, M. Virginia (CW-CO) 320 16.62% 18
BIJ Jeffery, Bill (E) 306 15.90% 19
JAH Horvat, Jacqueline A. (SW-SO) 295 15.32% 20
DOD Downey, Doug (CE) 293 15.22% 21
RFE Evans, Robert F. (CE) 291 15.12% 22
JAB Braithwaite, Jack (NE) 285 14.81% 23
JBU Udell, Jerry B. (SW-SO) 285 14.81% 24
REL Larson, Rene (NW-NO) 282 14.65% 25
MJL Lamb, Michael J. (SW-SO) 270 14.03% 26
ROE Earnshaw, Ross F. (CS) 263 13.66% 27
JPC Criger, Janis P. (CS) 246 12.78% 28
DES Sgro, Deanna L. (CE) 244 12.68% 29
LOB Beagan, Lorraine (CS) 238 12.36% 30
DWH Howell, David W. (CS) 230 11.95% 31
MIL Lesage, Michael B. (CS) 229 11.90% 32
RAJ Sharda, Raj (CW-CO) 223 11.58% 33
PAC Cooper, Paul M. (CE) 221 11.48% 34
NAB Baker, Nathan N. (CE) 212 11.01% 35
MIC Bennett, Michael (NE) 196 10.18% 36
BVH Hanuka, Ben V. (CE) 177 9.19% 37
MML Lerner, Michael M. (SW-SO) 171 8.88% 38
RAM Mikkola, Ray (CW-CO) 163 8.47% 39
KDC Graber, Kimberly D (CW-CO) 162 8.42% 40
DAS Singer, Darryl (CE) 150 7.79% 41
JOA Arkelian, John (CE) 134 6.96% 42
CHL Lugosi, Charles (CS) 128 6.65% 43
ANS Spurgeon, Andrew (CS) 123 6.39% 44
HSM Mann, H. S. (Harry) (CW-CO) 118 6.13% 45
- Page 18 -
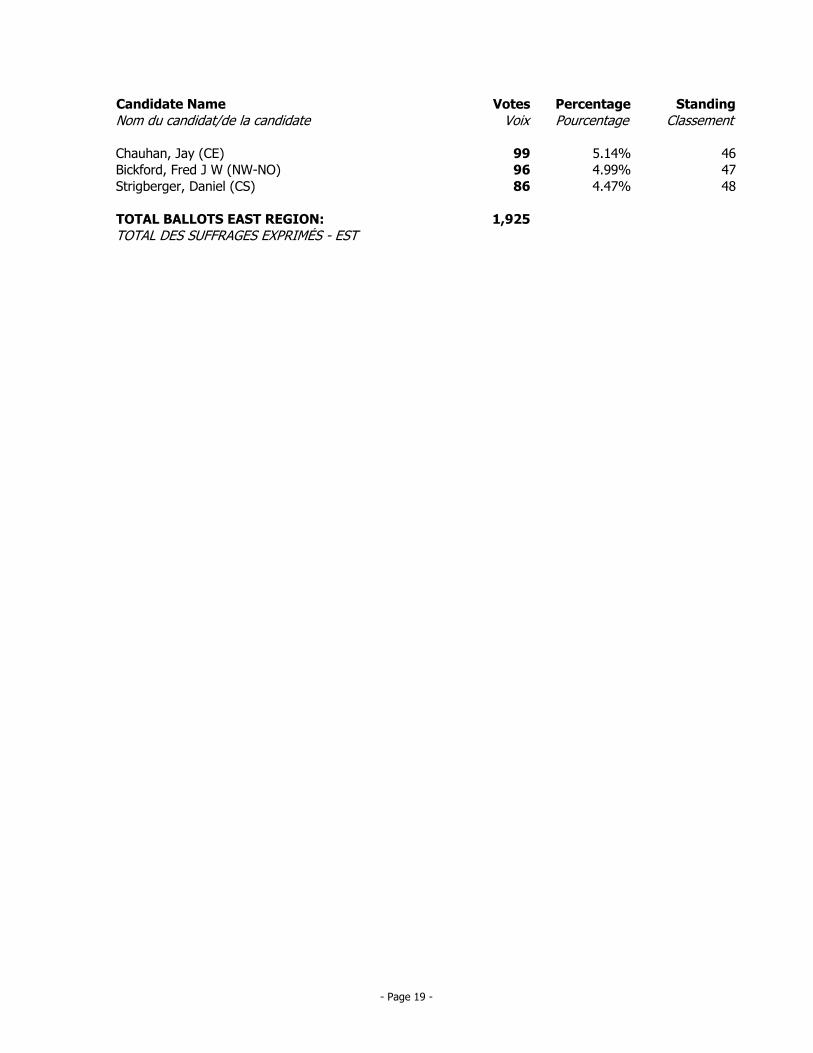
Candidate Name Votes Percentage Standing
Nom du candidat/de la candidate Voix Pourcentage Classement
JAC Chauhan, Jay (CE) 99 5.14% 46
FRB Bickford, Fred J W (NW-NO) 96 4.99% 47
DST Strigberger, Daniel (CS) 86 4.47% 48
TOTAL BALLOTS EAST REGION: 1,925
TOTAL DES SUFFRAGES EXPRIMÉS - EST
- Page 19 -

VOTES FROM EAST REGION FOR TORONTO CANDIDATES
VOTES DE LA RÉGION DU EST (CANDIDAT(E)S DE TORONTO)
Candidate Name Votes Percentage Standing
Nom du candidat/de la candidate Voix Pourcentage Classement
JEM Minor, Janet E. 699 36.31% 1
JAL Leiper, Janet 633 32.88% 2
RAA Anand, Raj 526 27.32% 3
JUF Falconer, Julian 508 26.39% 4
PBS Schabas, Paul B. 444 23.06% 5
ROG Galati, Rocco 442 22.96% 6
SAN Nishikawa, Sandra Y. 440 22.86% 7
SHT Troister, Sidney H. 422 21.92% 8
CHB Bredt, Christopher 415 21.56% 9
JWL Lem, Jeffrey W. 412 21.40% 10
GIP Papageorgiou, Gina 410 21.30% 11
HOG Goldblatt, Howard 392 20.36% 12
JOC Callaghan, John 391 20.31% 13
HLZ Zordel, Heather L. 390 20.26% 14
TAW Waugh, Tannis Allison 382 19.84% 15
WCW McDowell, William C. 364 18.91% 16
AVV Go, Avvy Yao-Yao 360 18.70% 17
ISM Merali, Isfahan 356 18.49% 18
BAM Murchie, Barbara 341 17.71% 19
TCW Walker, Tanya C. 323 16.78% 20
KEA Andrews, Karen E. 306 15.90% 21
JOG Groia, Joseph 305 15.84% 22
RCD Durcan, Rebecca Catherine 297 15.43% 23
JMR Rosenthal, Jonathan M. 297 15.43% 24
MAM Mercer, Malcolm 294 15.27% 25
BAG Hendrickson, Barbara 287 14.91% 26
RAU Austin, Renatta 286 14.86% 27
SER Robichaud, Sean 281 14.60% 28
LEA Akazaki, Lee 276 14.34% 29
BTA Tarantino, Bob 263 13.66% 30
PCW Wardle, Peter C. 262 13.61% 31
VIR Rondinelli, Vincenzo 251 13.04% 32
STB Benmor, Steven 223 11.58% 33
JBW West, John B. 207 10.75% 34
PED Downard, Peter 206 10.70% 35
HJC Chang, Henry John 198 10.29% 36
MIK Kowalski, Mitchell 165 8.57% 37
MAC Chochla, Morris Anthony 152 7.90% 38
SLG Graham, Shawn L. 125 6.49% 39
SJA von Achten, Susan Jane 124 6.44% 40
DAR Revington, Dan 112 5.82% 41
DOS Sanderson, Douglas 104 5.40% 42
ALF Heisey, Alan 98 5.09% 43
ABV Burton-Vulovic, Alexander 89 4.62% 44
ELG Gerb, Eldad 73 3.79% 45
- Page 20 -
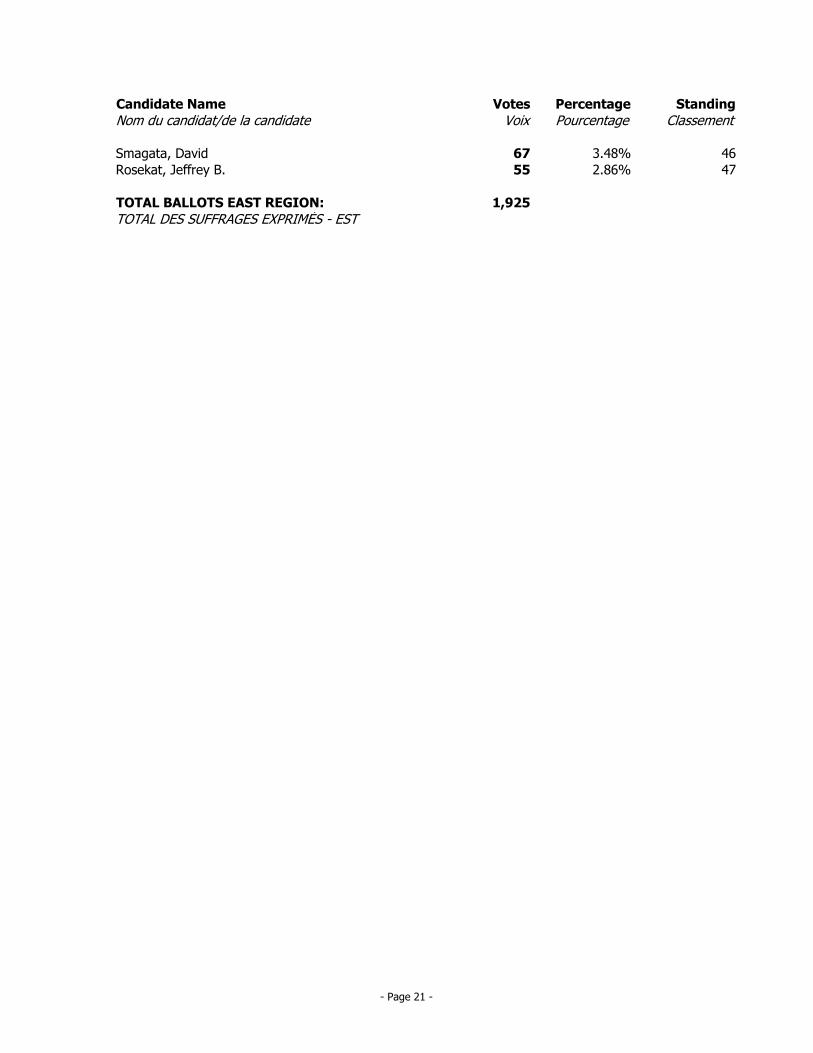
Candidate Name Votes Percentage Standing
Nom du candidat/de la candidate Voix Pourcentage Classement
DSM Smagata, David 67 3.48% 46
JBR Rosekat, Jeffrey B. 55 2.86% 47
TOTAL BALLOTS EAST REGION: 1,925
TOTAL DES SUFFRAGES EXPRIMÉS - EST
- Page 21 -
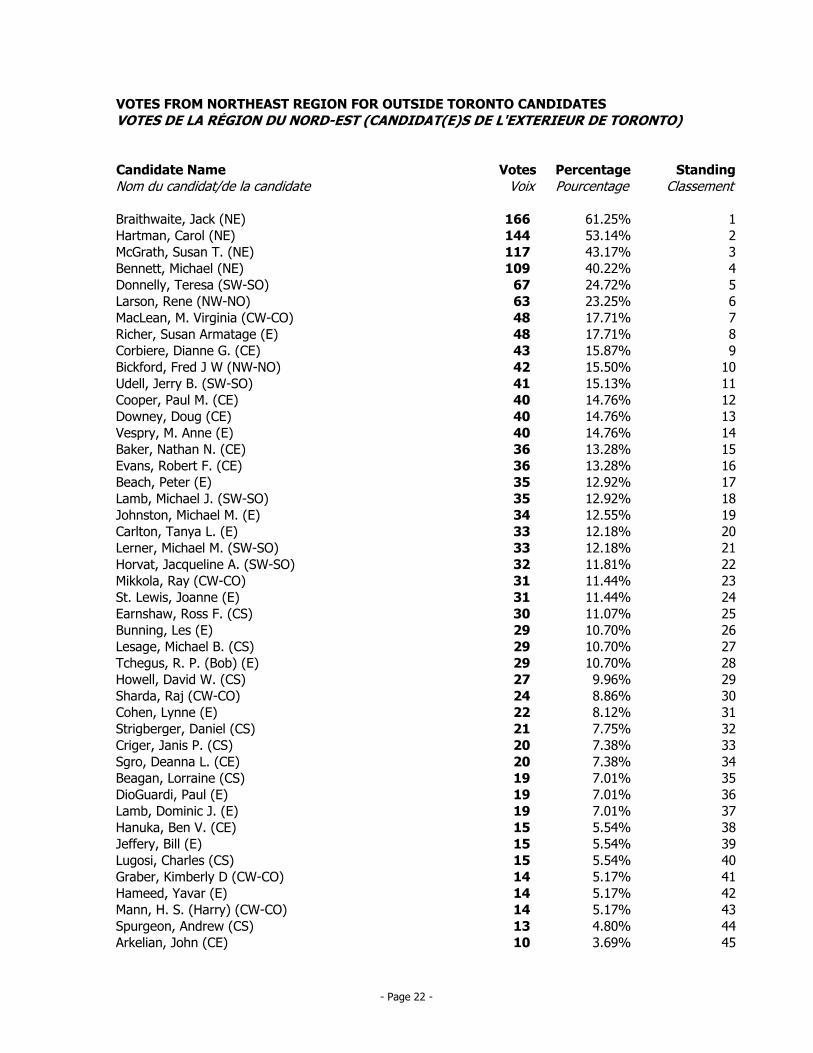
VOTES FROM NORTHEAST REGION FOR OUTSIDE TORONTO CANDIDATES
VOTES DE LA RÉGION DU NORD-EST (CANDIDAT(E)S DE L'EXTERIEUR DE TORONTO)
Candidate Name Votes Percentage Standing
Nom du candidat/de la candidate Voix Pourcentage Classement
JAB Braithwaite, Jack (NE) 166 61.25% 1
CAH Hartman, Carol (NE) 144 53.14% 2
STM McGrath, Susan T. (NE) 117 43.17% 3
MIC Bennett, Michael (NE) 109 40.22% 4
TED Donnelly, Teresa (SW-SO) 67 24.72% 5
REL Larson, Rene (NW-NO) 63 23.25% 6
MVM MacLean, M. Virginia (CW-CO) 48 17.71% 7
SAR Richer, Susan Armatage (E) 48 17.71% 8
DGC Corbiere, Dianne G. (CE) 43 15.87% 9
FRB Bickford, Fred J W (NW-NO) 42 15.50% 10
JBU Udell, Jerry B. (SW-SO) 41 15.13% 11
PAC Cooper, Paul M. (CE) 40 14.76% 12
DOD Downey, Doug (CE) 40 14.76% 13
MAV Vespry, M. Anne (E) 40 14.76% 14
NAB Baker, Nathan N. (CE) 36 13.28% 15
RFE Evans, Robert F. (CE) 36 13.28% 16
PEB Beach, Peter (E) 35 12.92% 17
MJL Lamb, Michael J. (SW-SO) 35 12.92% 18
MMJ Johnston, Michael M. (E) 34 12.55% 19
TAC Carlton, Tanya L. (E) 33 12.18% 20
MML Lerner, Michael M. (SW-SO) 33 12.18% 21
JAH Horvat, Jacqueline A. (SW-SO) 32 11.81% 22
RAM Mikkola, Ray (CW-CO) 31 11.44% 23
JOL St. Lewis, Joanne (E) 31 11.44% 24
ROE Earnshaw, Ross F. (CS) 30 11.07% 25
LEB Bunning, Les (E) 29 10.70% 26
MIL Lesage, Michael B. (CS) 29 10.70% 27
RPR Tchegus, R. P. (Bob) (E) 29 10.70% 28
DWH Howell, David W. (CS) 27 9.96% 29
RAJ Sharda, Raj (CW-CO) 24 8.86% 30
LYC Cohen, Lynne (E) 22 8.12% 31
DST Strigberger, Daniel (CS) 21 7.75% 32
JPC Criger, Janis P. (CS) 20 7.38% 33
DES Sgro, Deanna L. (CE) 20 7.38% 34
LOB Beagan, Lorraine (CS) 19 7.01% 35
PAD DioGuardi, Paul (E) 19 7.01% 36
DJL Lamb, Dominic J. (E) 19 7.01% 37
BVH Hanuka, Ben V. (CE) 15 5.54% 38
BIJ Jeffery, Bill (E) 15 5.54% 39
CHL Lugosi, Charles (CS) 15 5.54% 40
KDC Graber, Kimberly D (CW-CO) 14 5.17% 41
YAH Hameed, Yavar (E) 14 5.17% 42
HSM Mann, H. S. (Harry) (CW-CO) 14 5.17% 43
ANS Spurgeon, Andrew (CS) 13 4.80% 44
JOA Arkelian, John (CE) 10 3.69% 45
- Page 22 -

Candidate Name Votes Percentage Standing
Nom du candidat/de la candidate Voix Pourcentage Classement
DAS Singer, Darryl (CE) 10 3.69% 46
COL Lachance, Colin J. (E) 8 2.95% 47
JAC Chauhan, Jay (CE) 6 2.21% 48
TOTAL BALLOTS NORTHEAST REGION: 271
TOTAL DES SUFFRAGES EXPRIMÉS - NORD-EST
- Page 23 -
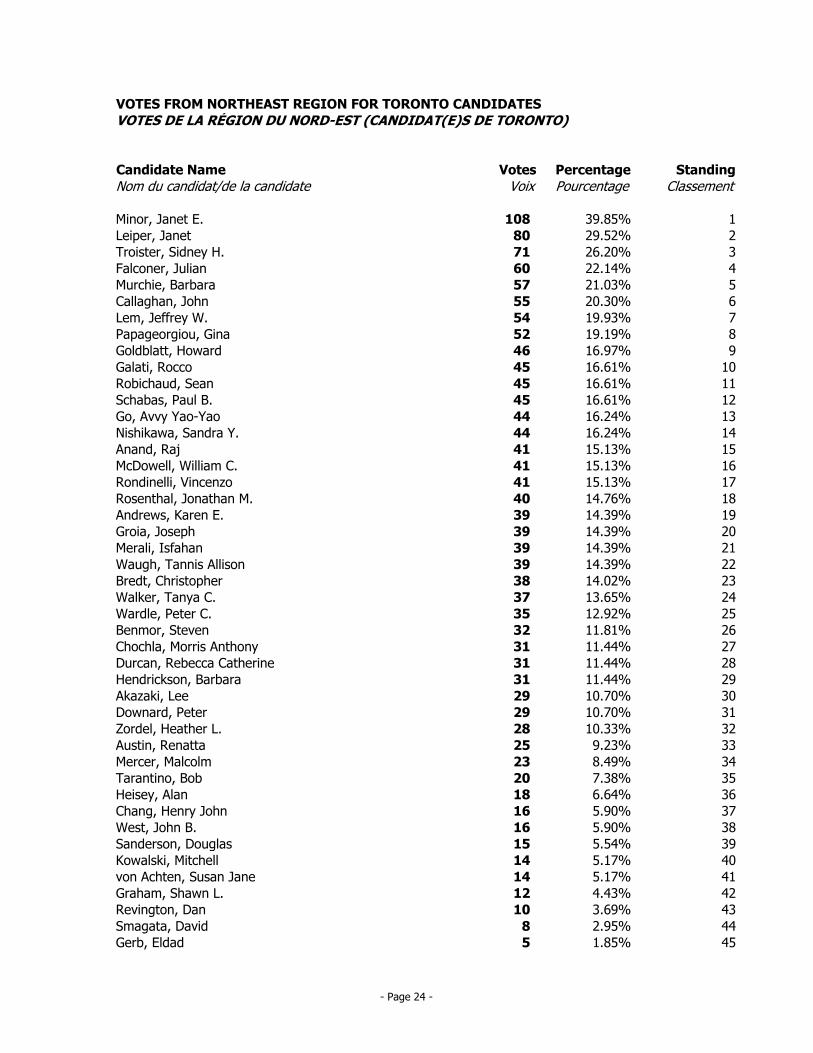
VOTES FROM NORTHEAST REGION FOR TORONTO CANDIDATES
VOTES DE LA RÉGION DU NORD-EST (CANDIDAT(E)S DE TORONTO)
Candidate Name Votes Percentage Standing
Nom du candidat/de la candidate Voix Pourcentage Classement
JEM Minor, Janet E. 108 39.85% 1
JAL Leiper, Janet 80 29.52% 2
SHT Troister, Sidney H. 71 26.20% 3
JUF Falconer, Julian 60 22.14% 4
BAM Murchie, Barbara 57 21.03% 5
JOC Callaghan, John 55 20.30% 6
JWL Lem, Jeffrey W. 54 19.93% 7
GIP Papageorgiou, Gina 52 19.19% 8
HOG Goldblatt, Howard 46 16.97% 9
ROG Galati, Rocco 45 16.61% 10
SER Robichaud, Sean 45 16.61% 11
PBS Schabas, Paul B. 45 16.61% 12
AVV Go, Avvy Yao-Yao 44 16.24% 13
SAN Nishikawa, Sandra Y. 44 16.24% 14
RAA Anand, Raj 41 15.13% 15
WCW McDowell, William C. 41 15.13% 16
VIR Rondinelli, Vincenzo 41 15.13% 17
JMR Rosenthal, Jonathan M. 40 14.76% 18
KEA Andrews, Karen E. 39 14.39% 19
JOG Groia, Joseph 39 14.39% 20
ISM Merali, Isfahan 39 14.39% 21
TAW Waugh, Tannis Allison 39 14.39% 22
CHB Bredt, Christopher 38 14.02% 23
TCW Walker, Tanya C. 37 13.65% 24
PCW Wardle, Peter C. 35 12.92% 25
STB Benmor, Steven 32 11.81% 26
MAC Chochla, Morris Anthony 31 11.44% 27
RCD Durcan, Rebecca Catherine 31 11.44% 28
BAG Hendrickson, Barbara 31 11.44% 29
LEA Akazaki, Lee 29 10.70% 30
PED Downard, Peter 29 10.70% 31
HLZ Zordel, Heather L. 28 10.33% 32
RAU Austin, Renatta 25 9.23% 33
MAM Mercer, Malcolm 23 8.49% 34
BTA Tarantino, Bob 20 7.38% 35
ALF Heisey, Alan 18 6.64% 36
HJC Chang, Henry John 16 5.90% 37
JBW West, John B. 16 5.90% 38
DOS Sanderson, Douglas 15 5.54% 39
MIK Kowalski, Mitchell 14 5.17% 40
SJA von Achten, Susan Jane 14 5.17% 41
SLG Graham, Shawn L. 12 4.43% 42
DAR Revington, Dan 10 3.69% 43
DSM Smagata, David 8 2.95% 44
ELG Gerb, Eldad 5 1.85% 45
- Page 24 -

Candidate Name Votes Percentage Standing
Nom du candidat/de la candidate Voix Pourcentage Classement
JBR Rosekat, Jeffrey B. 4 1.48% 46
ABV Burton-Vulovic, Alexander 2 0.74% 47
TOTAL BALLOTS NORTHEAST REGION: 271
TOTAL DES SUFFRAGES EXPRIMÉS - NORD-EST
- Page 25 -
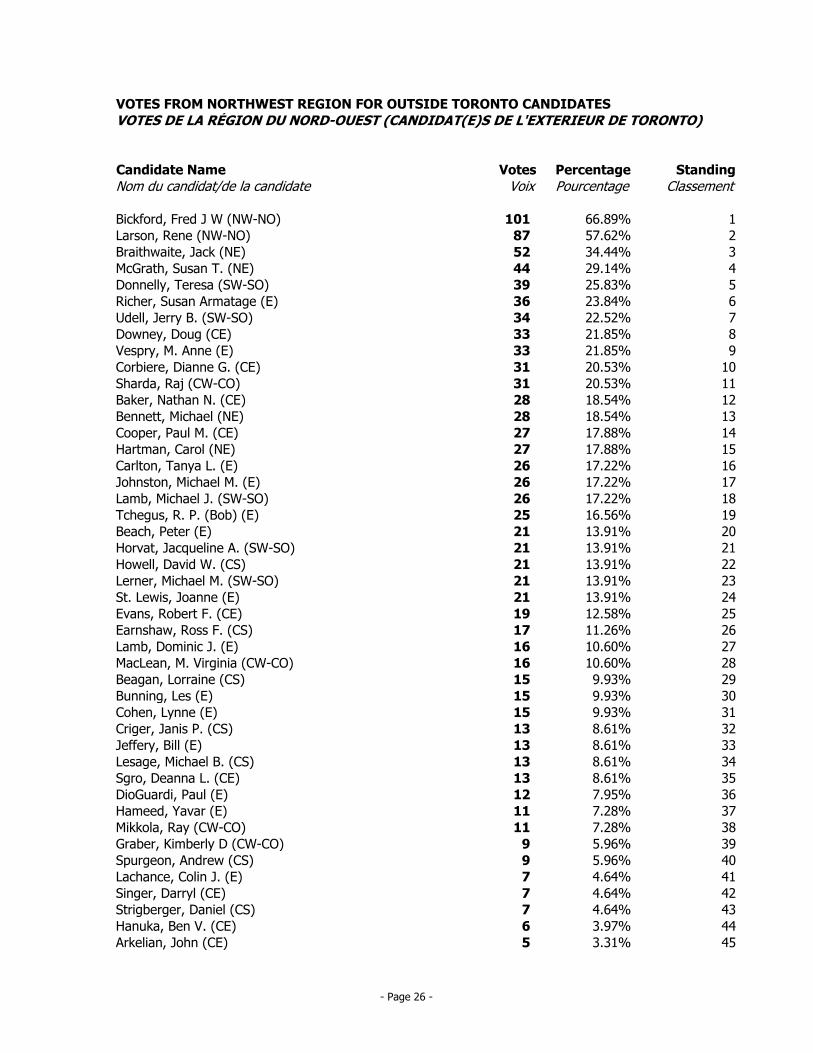
VOTES FROM NORTHWEST REGION FOR OUTSIDE TORONTO CANDIDATES
VOTES DE LA RÉGION DU NORD-OUEST (CANDIDAT(E)S DE L'EXTERIEUR DE TORONTO)
Candidate Name Votes Percentage Standing
Nom du candidat/de la candidate Voix Pourcentage Classement
FRB Bickford, Fred J W (NW-NO) 101 66.89% 1
REL Larson, Rene (NW-NO) 87 57.62% 2
JAB Braithwaite, Jack (NE) 52 34.44% 3
STM McGrath, Susan T. (NE) 44 29.14% 4
TED Donnelly, Teresa (SW-SO) 39 25.83% 5
SAR Richer, Susan Armatage (E) 36 23.84% 6
JBU Udell, Jerry B. (SW-SO) 34 22.52% 7
DOD Downey, Doug (CE) 33 21.85% 8
MAV Vespry, M. Anne (E) 33 21.85% 9
DGC Corbiere, Dianne G. (CE) 31 20.53% 10
RAJ Sharda, Raj (CW-CO) 31 20.53% 11
NAB Baker, Nathan N. (CE) 28 18.54% 12
MIC Bennett, Michael (NE) 28 18.54% 13
PAC Cooper, Paul M. (CE) 27 17.88% 14
CAH Hartman, Carol (NE) 27 17.88% 15
TAC Carlton, Tanya L. (E) 26 17.22% 16
MMJ Johnston, Michael M. (E) 26 17.22% 17
MJL Lamb, Michael J. (SW-SO) 26 17.22% 18
RPR Tchegus, R. P. (Bob) (E) 25 16.56% 19
PEB Beach, Peter (E) 21 13.91% 20
JAH Horvat, Jacqueline A. (SW-SO) 21 13.91% 21
DWH Howell, David W. (CS) 21 13.91% 22
MML Lerner, Michael M. (SW-SO) 21 13.91% 23
JOL St. Lewis, Joanne (E) 21 13.91% 24
RFE Evans, Robert F. (CE) 19 12.58% 25
ROE Earnshaw, Ross F. (CS) 17 11.26% 26
DJL Lamb, Dominic J. (E) 16 10.60% 27
MVM MacLean, M. Virginia (CW-CO) 16 10.60% 28
LOB Beagan, Lorraine (CS) 15 9.93% 29
LEB Bunning, Les (E) 15 9.93% 30
LYC Cohen, Lynne (E) 15 9.93% 31
JPC Criger, Janis P. (CS) 13 8.61% 32
BIJ Jeffery, Bill (E) 13 8.61% 33
MIL Lesage, Michael B. (CS) 13 8.61% 34
DES Sgro, Deanna L. (CE) 13 8.61% 35
PAD DioGuardi, Paul (E) 12 7.95% 36
YAH Hameed, Yavar (E) 11 7.28% 37
RAM Mikkola, Ray (CW-CO) 11 7.28% 38
KDC Graber, Kimberly D (CW-CO) 9 5.96% 39
ANS Spurgeon, Andrew (CS) 9 5.96% 40
COL Lachance, Colin J. (E) 7 4.64% 41
DAS Singer, Darryl (CE) 7 4.64% 42
DST Strigberger, Daniel (CS) 7 4.64% 43
BVH Hanuka, Ben V. (CE) 6 3.97% 44
JOA Arkelian, John (CE) 5 3.31% 45
- Page 26 -
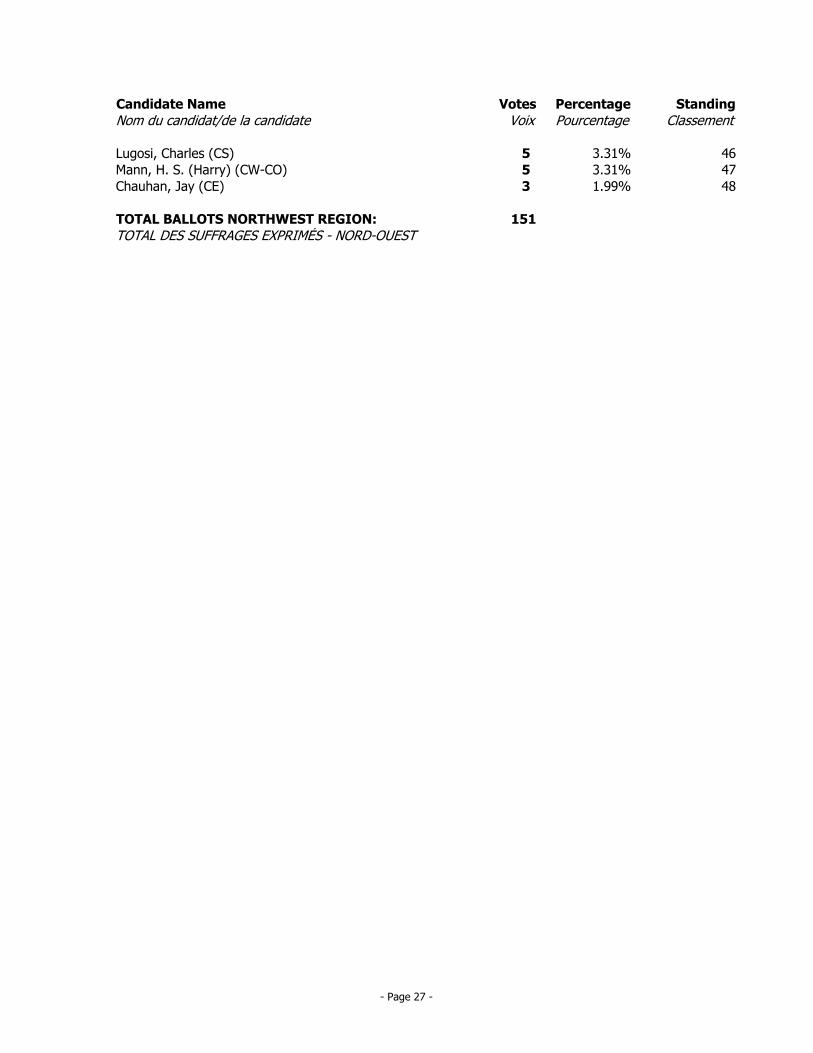
Candidate Name Votes Percentage Standing
Nom du candidat/de la candidate Voix Pourcentage Classement
CHL Lugosi, Charles (CS) 5 3.31% 46
HSM Mann, H. S. (Harry) (CW-CO) 5 3.31% 47
JAC Chauhan, Jay (CE) 3 1.99% 48
TOTAL BALLOTS NORTHWEST REGION: 151
TOTAL DES SUFFRAGES EXPRIMÉS - NORD-OUEST
- Page 27 -
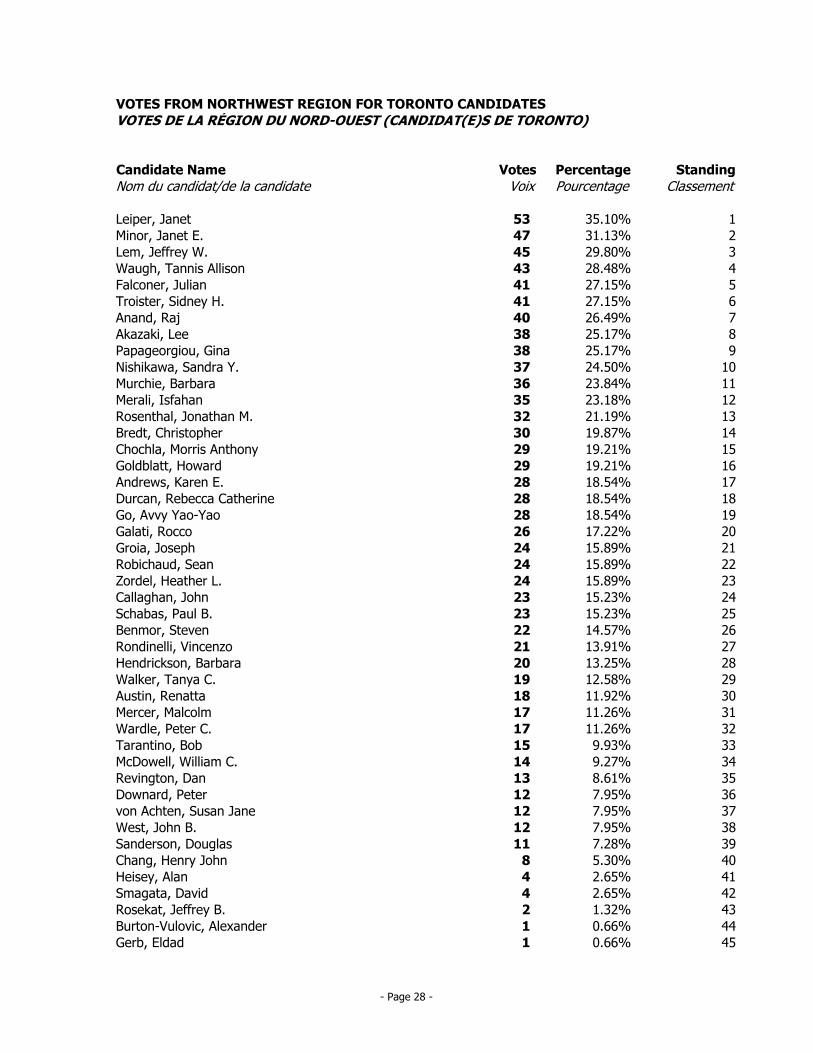
VOTES FROM NORTHWEST REGION FOR TORONTO CANDIDATES
VOTES DE LA RÉGION DU NORD-OUEST (CANDIDAT(E)S DE TORONTO)
Candidate Name Votes Percentage Standing
Nom du candidat/de la candidate Voix Pourcentage Classement
JAL Leiper, Janet 53 35.10% 1
JEM Minor, Janet E. 47 31.13% 2
JWL Lem, Jeffrey W. 45 29.80% 3
TAW Waugh, Tannis Allison 43 28.48% 4
JUF Falconer, Julian 41 27.15% 5
SHT Troister, Sidney H. 41 27.15% 6
RAA Anand, Raj 40 26.49% 7
LEA Akazaki, Lee 38 25.17% 8
GIP Papageorgiou, Gina 38 25.17% 9
SAN Nishikawa, Sandra Y. 37 24.50% 10
BAM Murchie, Barbara 36 23.84% 11
ISM Merali, Isfahan 35 23.18% 12
JMR Rosenthal, Jonathan M. 32 21.19% 13
CHB Bredt, Christopher 30 19.87% 14
MAC Chochla, Morris Anthony 29 19.21% 15
HOG Goldblatt, Howard 29 19.21% 16
KEA Andrews, Karen E. 28 18.54% 17
RCD Durcan, Rebecca Catherine 28 18.54% 18
AVV Go, Avvy Yao-Yao 28 18.54% 19
ROG Galati, Rocco 26 17.22% 20
JOG Groia, Joseph 24 15.89% 21
SER Robichaud, Sean 24 15.89% 22
HLZ Zordel, Heather L. 24 15.89% 23
JOC Callaghan, John 23 15.23% 24
PBS Schabas, Paul B. 23 15.23% 25
STB Benmor, Steven 22 14.57% 26
VIR Rondinelli, Vincenzo 21 13.91% 27
BAG Hendrickson, Barbara 20 13.25% 28
TCW Walker, Tanya C. 19 12.58% 29
RAU Austin, Renatta 18 11.92% 30
MAM Mercer, Malcolm 17 11.26% 31
PCW Wardle, Peter C. 17 11.26% 32
BTA Tarantino, Bob 15 9.93% 33
WCW McDowell, William C. 14 9.27% 34
DAR Revington, Dan 13 8.61% 35
PED Downard, Peter 12 7.95% 36
SJA von Achten, Susan Jane 12 7.95% 37
JBW West, John B. 12 7.95% 38
DOS Sanderson, Douglas 11 7.28% 39
HJC Chang, Henry John 8 5.30% 40
ALF Heisey, Alan 4 2.65% 41
DSM Smagata, David 4 2.65% 42
JBR Rosekat, Jeffrey B. 2 1.32% 43
ABV Burton-Vulovic, Alexander 1 0.66% 44
ELG Gerb, Eldad 1 0.66% 45
- Page 28 -
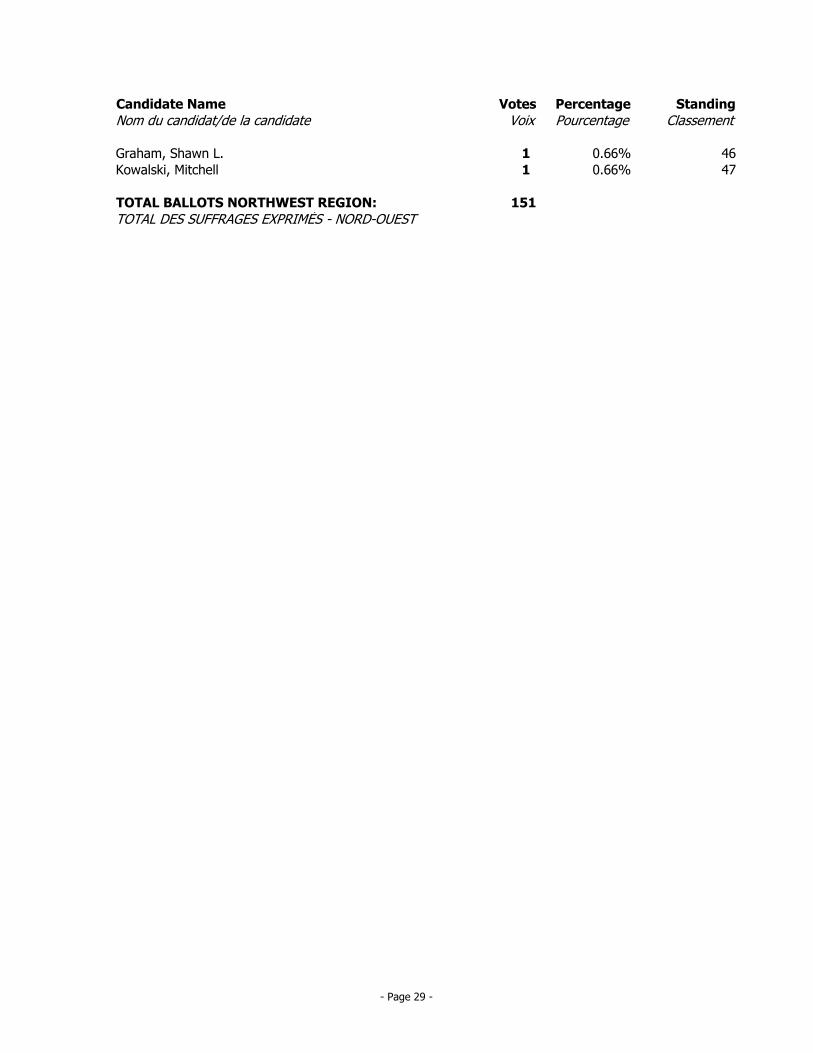
Candidate Name Votes Percentage Standing
Nom du candidat/de la candidate Voix Pourcentage Classement
SLG Graham, Shawn L. 1 0.66% 46
MIK Kowalski, Mitchell 1 0.66% 47
TOTAL BALLOTS NORTHWEST REGION: 151
TOTAL DES SUFFRAGES EXPRIMÉS - NORD-OUEST
- Page 29 -
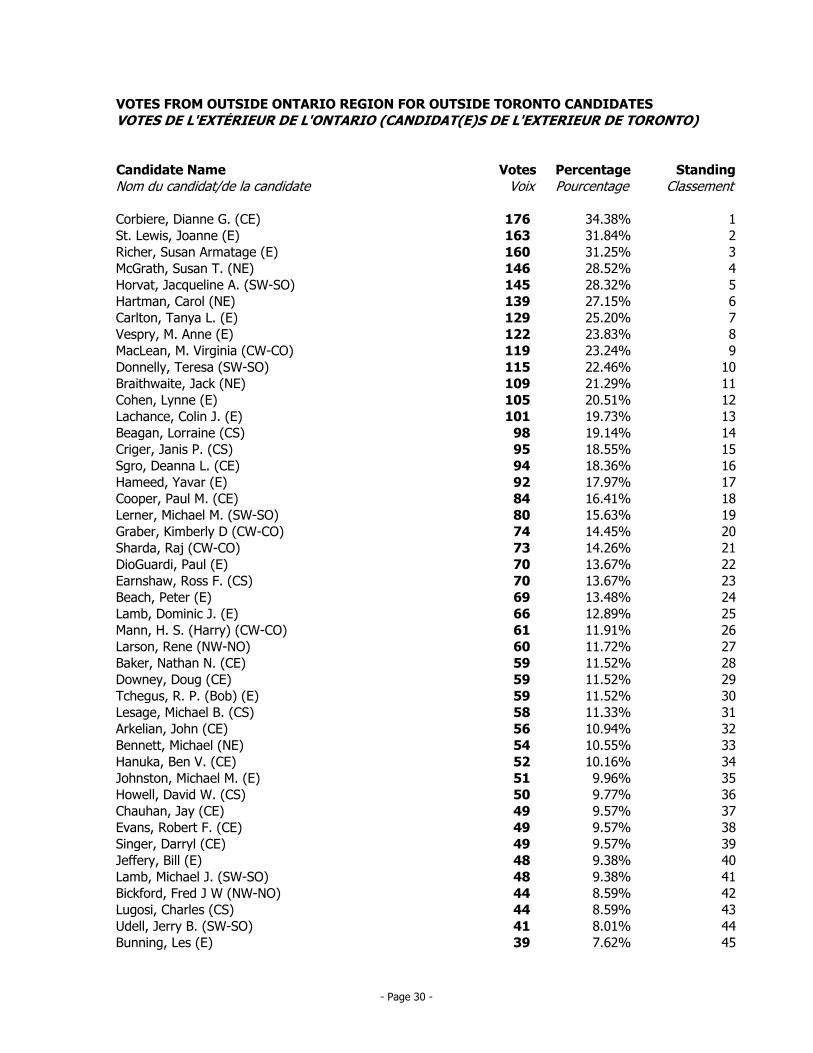
VOTES FROM OUTSIDE ONTARIO REGION FOR OUTSIDE TORONTO CANDIDATES
VOTES DE L'EXTÉRIEUR DE L'ONTARIO (CANDIDAT(E)S DE L'EXTERIEUR DE TORONTO)
Candidate Name Votes Percentage Standing
Nom du candidat/de la candidate Voix Pourcentage Classement
DGC Corbiere, Dianne G. (CE) 176 34.38% 1
JOL St. Lewis, Joanne (E) 163 31.84% 2
SAR Richer, Susan Armatage (E) 160 31.25% 3
STM McGrath, Susan T. (NE) 146 28.52% 4
JAH Horvat, Jacqueline A. (SW-SO) 145 28.32% 5
CAH Hartman, Carol (NE) 139 27.15% 6
TAC Carlton, Tanya L. (E) 129 25.20% 7
MAV Vespry, M. Anne (E) 122 23.83% 8
MVM MacLean, M. Virginia (CW-CO) 119 23.24% 9
TED Donnelly, Teresa (SW-SO) 115 22.46% 10
JAB Braithwaite, Jack (NE) 109 21.29% 11
LYC Cohen, Lynne (E) 105 20.51% 12
COL Lachance, Colin J. (E) 101 19.73% 13
LOB Beagan, Lorraine (CS) 98 19.14% 14
JPC Criger, Janis P. (CS) 95 18.55% 15
DES Sgro, Deanna L. (CE) 94 18.36% 16
YAH Hameed, Yavar (E) 92 17.97% 17
PAC Cooper, Paul M. (CE) 84 16.41% 18
MML Lerner, Michael M. (SW-SO) 80 15.63% 19
KDC Graber, Kimberly D (CW-CO) 74 14.45% 20
RAJ Sharda, Raj (CW-CO) 73 14.26% 21
PAD DioGuardi, Paul (E) 70 13.67% 22
ROE Earnshaw, Ross F. (CS) 70 13.67% 23
PEB Beach, Peter (E) 69 13.48% 24
DJL Lamb, Dominic J. (E) 66 12.89% 25
HSM Mann, H. S. (Harry) (CW-CO) 61 11.91% 26
REL Larson, Rene (NW-NO) 60 11.72% 27
NAB Baker, Nathan N. (CE) 59 11.52% 28
DOD Downey, Doug (CE) 59 11.52% 29
RPR Tchegus, R. P. (Bob) (E) 59 11.52% 30
MIL Lesage, Michael B. (CS) 58 11.33% 31
JOA Arkelian, John (CE) 56 10.94% 32
MIC Bennett, Michael (NE) 54 10.55% 33
BVH Hanuka, Ben V. (CE) 52 10.16% 34
MMJ Johnston, Michael M. (E) 51 9.96% 35
DWH Howell, David W. (CS) 50 9.77% 36
JAC Chauhan, Jay (CE) 49 9.57% 37
RFE Evans, Robert F. (CE) 49 9.57% 38
DAS Singer, Darryl (CE) 49 9.57% 39
BIJ Jeffery, Bill (E) 48 9.38% 40
MJL Lamb, Michael J. (SW-SO) 48 9.38% 41
FRB Bickford, Fred J W (NW-NO) 44 8.59% 42
CHL Lugosi, Charles (CS) 44 8.59% 43
JBU Udell, Jerry B. (SW-SO) 41 8.01% 44
LEB Bunning, Les (E) 39 7.62% 45
- Page 30 -
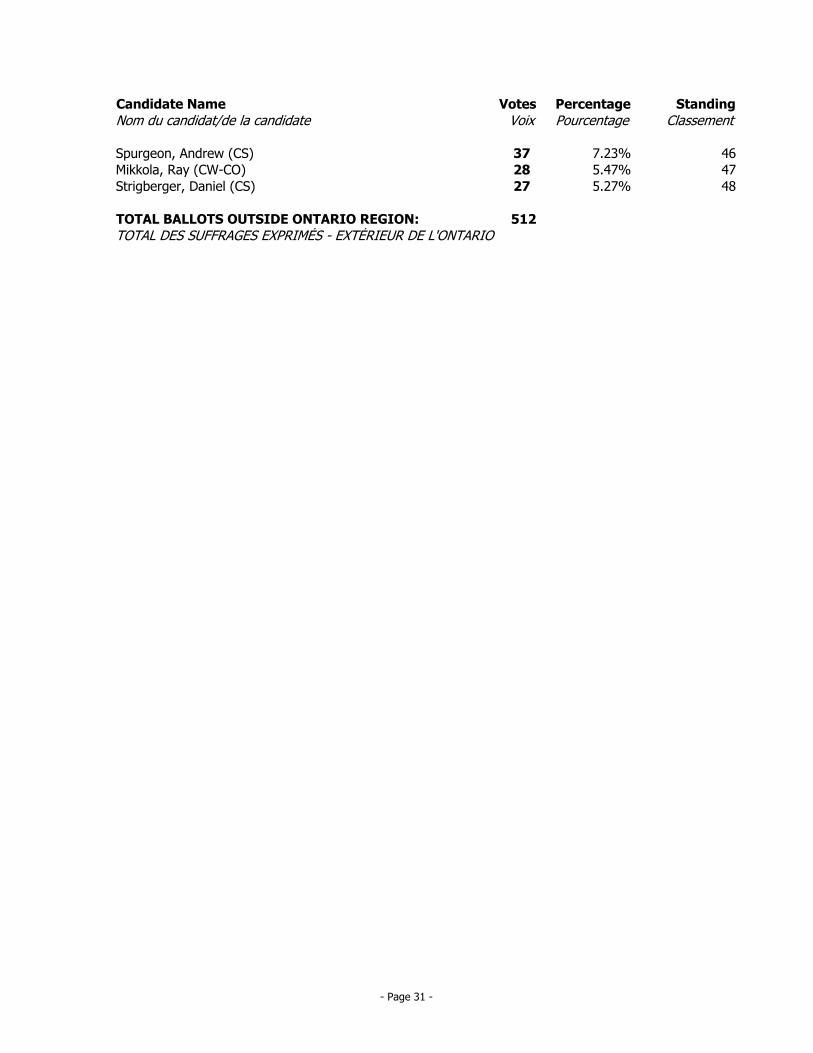
Candidate Name Votes Percentage Standing
Nom du candidat/de la candidate Voix Pourcentage Classement
ANS Spurgeon, Andrew (CS) 37 7.23% 46
RAM Mikkola, Ray (CW-CO) 28 5.47% 47
DST Strigberger, Daniel (CS) 27 5.27% 48
TOTAL BALLOTS OUTSIDE ONTARIO REGION: 512
TOTAL DES SUFFRAGES EXPRIMÉS - EXTÉRIEUR DE L'ONTARIO
- Page 31 -

VOTES FROM OUTSIDE ONTARIO REGION FOR TORONTO CANDIDATES
VOTES DE L'EXTÉRIEUR DE L'ONTARIO (CANDIDAT(E)S DE TORONTO)
Candidate Name Votes Percentage Standing
Nom du candidat/de la candidate Voix Pourcentage Classement
JAL Leiper, Janet 196 38.28% 1
JEM Minor, Janet E. 192 37.50% 2
RAA Anand, Raj 182 35.55% 3
SAN Nishikawa, Sandra Y. 182 35.55% 4
JUF Falconer, Julian 169 33.01% 5
PBS Schabas, Paul B. 160 31.25% 6
ROG Galati, Rocco 150 29.30% 7
ISM Merali, Isfahan 134 26.17% 8
GIP Papageorgiou, Gina 134 26.17% 9
TCW Walker, Tanya C. 131 25.59% 10
AVV Go, Avvy Yao-Yao 128 25.00% 11
RAU Austin, Renatta 127 24.80% 12
HOG Goldblatt, Howard 125 24.41% 13
BAM Murchie, Barbara 122 23.83% 14
CHB Bredt, Christopher 121 23.63% 15
KEA Andrews, Karen E. 120 23.44% 16
HLZ Zordel, Heather L. 117 22.85% 17
MAM Mercer, Malcolm 114 22.27% 18
RCD Durcan, Rebecca Catherine 111 21.68% 19
WCW McDowell, William C. 110 21.48% 20
JOG Groia, Joseph 108 21.09% 21
LEA Akazaki, Lee 107 20.90% 22
BAG Hendrickson, Barbara 106 20.70% 23
PCW Wardle, Peter C. 104 20.31% 24
JMR Rosenthal, Jonathan M. 103 20.12% 25
JOC Callaghan, John 101 19.73% 26
TAW Waugh, Tannis Allison 87 16.99% 27
SER Robichaud, Sean 85 16.60% 28
HJC Chang, Henry John 82 16.02% 29
PED Downard, Peter 82 16.02% 30
MIK Kowalski, Mitchell 70 13.67% 31
BTA Tarantino, Bob 70 13.67% 32
DOS Sanderson, Douglas 66 12.89% 33
JWL Lem, Jeffrey W. 65 12.70% 34
SJA von Achten, Susan Jane 62 12.11% 35
VIR Rondinelli, Vincenzo 61 11.91% 36
JBW West, John B. 58 11.33% 37
SLG Graham, Shawn L. 48 9.38% 38
SHT Troister, Sidney H. 41 8.01% 39
STB Benmor, Steven 39 7.62% 40
ELG Gerb, Eldad 37 7.23% 41
MAC Chochla, Morris Anthony 35 6.84% 42
ALF Heisey, Alan 34 6.64% 43
JBR Rosekat, Jeffrey B. 30 5.86% 44
DAR Revington, Dan 27 5.27% 45
- Page 32 -
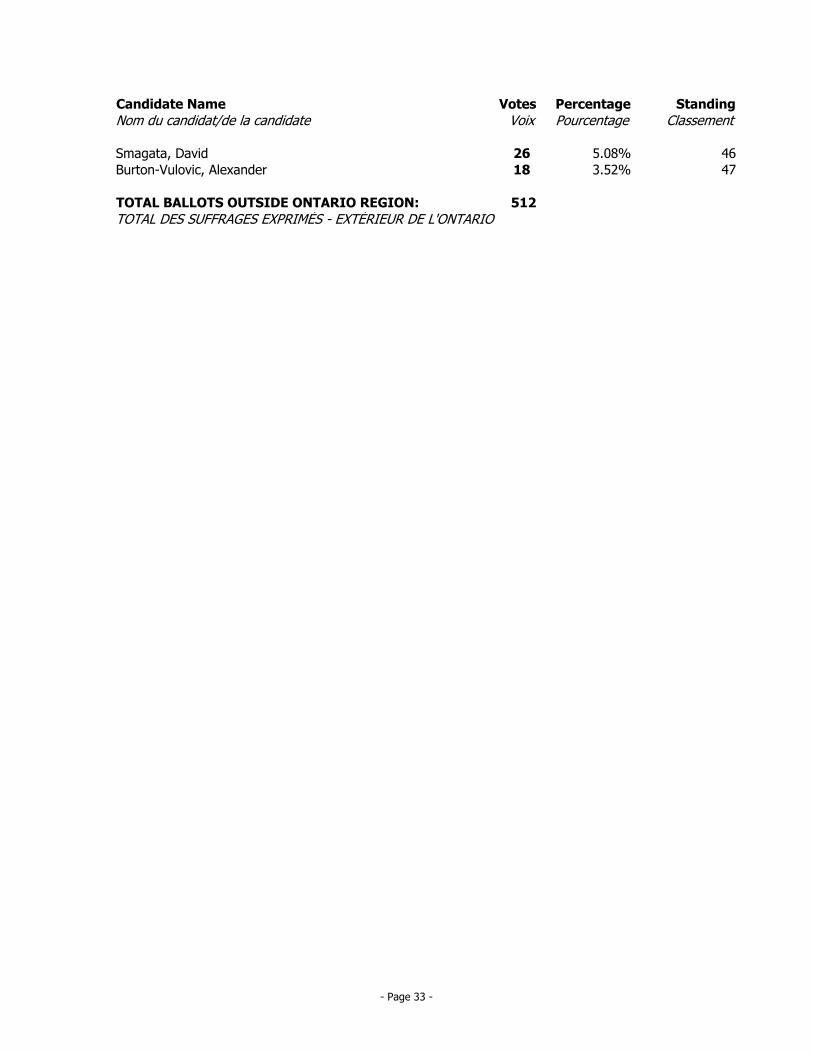
Candidate Name Votes Percentage Standing
Nom du candidat/de la candidate Voix Pourcentage Classement
DSM Smagata, David 26 5.08% 46
ABV Burton-Vulovic, Alexander 18 3.52% 47
TOTAL BALLOTS OUTSIDE ONTARIO REGION: 512
TOTAL DES SUFFRAGES EXPRIMÉS - EXTÉRIEUR DE L'ONTARIO
- Page 33 -
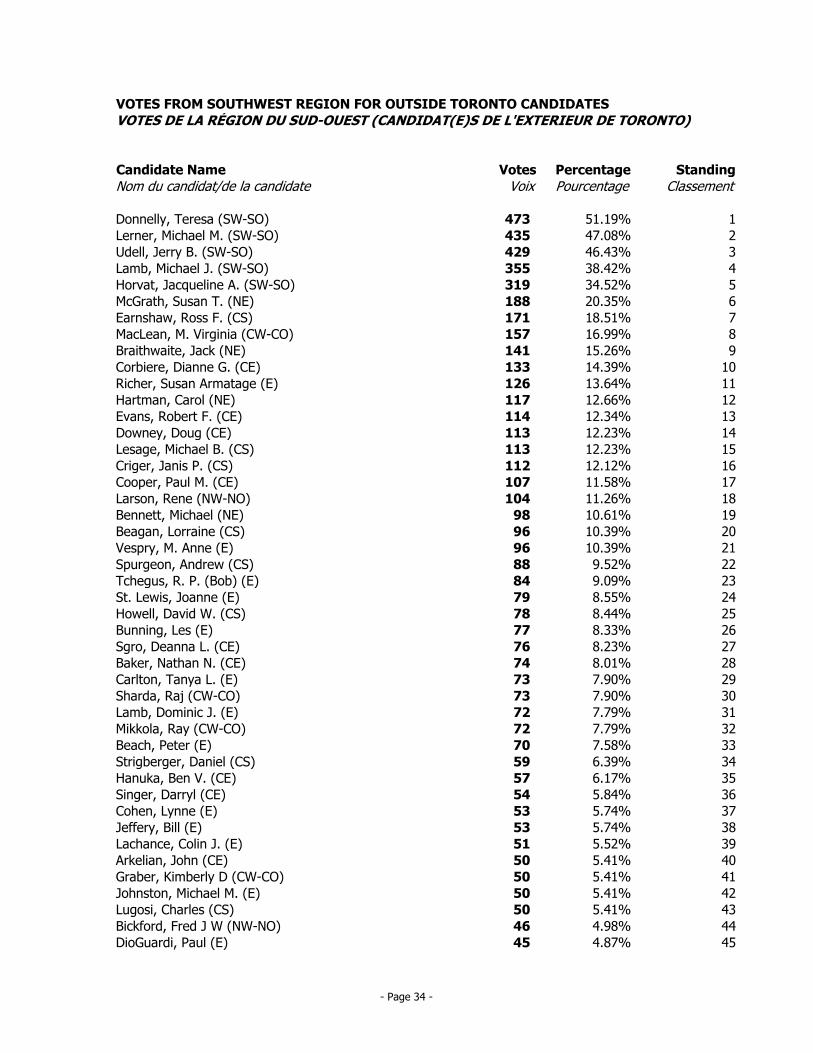
VOTES FROM SOUTHWEST REGION FOR OUTSIDE TORONTO CANDIDATES
VOTES DE LA RÉGION DU SUD-OUEST (CANDIDAT(E)S DE L'EXTERIEUR DE TORONTO)
Candidate Name Votes Percentage Standing
Nom du candidat/de la candidate Voix Pourcentage Classement
TED Donnelly, Teresa (SW-SO) 473 51.19% 1
MML Lerner, Michael M. (SW-SO) 435 47.08% 2
JBU Udell, Jerry B. (SW-SO) 429 46.43% 3
MJL Lamb, Michael J. (SW-SO) 355 38.42% 4
JAH Horvat, Jacqueline A. (SW-SO) 319 34.52% 5
STM McGrath, Susan T. (NE) 188 20.35% 6
ROE Earnshaw, Ross F. (CS) 171 18.51% 7
MVM MacLean, M. Virginia (CW-CO) 157 16.99% 8
JAB Braithwaite, Jack (NE) 141 15.26% 9
DGC Corbiere, Dianne G. (CE) 133 14.39% 10
SAR Richer, Susan Armatage (E) 126 13.64% 11
CAH Hartman, Carol (NE) 117 12.66% 12
RFE Evans, Robert F. (CE) 114 12.34% 13
DOD Downey, Doug (CE) 113 12.23% 14
MIL Lesage, Michael B. (CS) 113 12.23% 15
JPC Criger, Janis P. (CS) 112 12.12% 16
PAC Cooper, Paul M. (CE) 107 11.58% 17
REL Larson, Rene (NW-NO) 104 11.26% 18
MIC Bennett, Michael (NE) 98 10.61% 19
LOB Beagan, Lorraine (CS) 96 10.39% 20
MAV Vespry, M. Anne (E) 96 10.39% 21
ANS Spurgeon, Andrew (CS) 88 9.52% 22
RPR Tchegus, R. P. (Bob) (E) 84 9.09% 23
JOL St. Lewis, Joanne (E) 79 8.55% 24
DWH Howell, David W. (CS) 78 8.44% 25
LEB Bunning, Les (E) 77 8.33% 26
DES Sgro, Deanna L. (CE) 76 8.23% 27
NAB Baker, Nathan N. (CE) 74 8.01% 28
TAC Carlton, Tanya L. (E) 73 7.90% 29
RAJ Sharda, Raj (CW-CO) 73 7.90% 30
DJL Lamb, Dominic J. (E) 72 7.79% 31
RAM Mikkola, Ray (CW-CO) 72 7.79% 32
PEB Beach, Peter (E) 70 7.58% 33
DST Strigberger, Daniel (CS) 59 6.39% 34
BVH Hanuka, Ben V. (CE) 57 6.17% 35
DAS Singer, Darryl (CE) 54 5.84% 36
LYC Cohen, Lynne (E) 53 5.74% 37
BIJ Jeffery, Bill (E) 53 5.74% 38
COL Lachance, Colin J. (E) 51 5.52% 39
JOA Arkelian, John (CE) 50 5.41% 40
KDC Graber, Kimberly D (CW-CO) 50 5.41% 41
MMJ Johnston, Michael M. (E) 50 5.41% 42
CHL Lugosi, Charles (CS) 50 5.41% 43
FRB Bickford, Fred J W (NW-NO) 46 4.98% 44
PAD DioGuardi, Paul (E) 45 4.87% 45
- Page 34 -

Candidate Name Votes Percentage Standing
Nom du candidat/de la candidate Voix Pourcentage Classement
HSM Mann, H. S. (Harry) (CW-CO) 45 4.87% 46
YAH Hameed, Yavar (E) 39 4.22% 47
JAC Chauhan, Jay (CE) 31 3.35% 48
TOTAL BALLOTS SOUTHWEST REGION: 924
TOTAL DES SUFFRAGES EXPRIMÉS - SUD-OUEST
- Page 35 -

VOTES FROM SOUTHWEST REGION FOR TORONTO CANDIDATES
VOTES DE LA RÉGION DU SUD-OUEST (CANDIDAT(E)S DE TORONTO)
Candidate Name Votes Percentage Standing
Nom du candidat/de la candidate Voix Pourcentage Classement
JEM Minor, Janet E. 273 29.55% 1
JAL Leiper, Janet 242 26.19% 2
JUF Falconer, Julian 190 20.56% 3
SHT Troister, Sidney H. 189 20.45% 4
CHB Bredt, Christopher 178 19.26% 5
JOG Groia, Joseph 174 18.83% 6
JWL Lem, Jeffrey W. 174 18.83% 7
PBS Schabas, Paul B. 172 18.61% 8
JOC Callaghan, John 164 17.75% 9
RAA Anand, Raj 161 17.42% 10
BAM Murchie, Barbara 145 15.69% 11
HOG Goldblatt, Howard 144 15.58% 12
SAN Nishikawa, Sandra Y. 141 15.26% 13
RCD Durcan, Rebecca Catherine 140 15.15% 14
GIP Papageorgiou, Gina 138 14.94% 15
AVV Go, Avvy Yao-Yao 136 14.72% 16
WCW McDowell, William C. 135 14.61% 17
TAW Waugh, Tannis Allison 130 14.07% 18
STB Benmor, Steven 129 13.96% 19
ROG Galati, Rocco 126 13.64% 20
MAM Mercer, Malcolm 122 13.20% 21
LEA Akazaki, Lee 117 12.66% 22
KEA Andrews, Karen E. 111 12.01% 23
PCW Wardle, Peter C. 109 11.80% 24
TCW Walker, Tanya C. 107 11.58% 25
PED Downard, Peter 106 11.47% 26
JMR Rosenthal, Jonathan M. 101 10.93% 27
ISM Merali, Isfahan 96 10.39% 28
VIR Rondinelli, Vincenzo 90 9.74% 29
HLZ Zordel, Heather L. 90 9.74% 30
MAC Chochla, Morris Anthony 85 9.20% 31
RAU Austin, Renatta 84 9.09% 32
SER Robichaud, Sean 83 8.98% 33
SLG Graham, Shawn L. 78 8.44% 34
HJC Chang, Henry John 76 8.23% 35
BAG Hendrickson, Barbara 73 7.90% 36
BTA Tarantino, Bob 69 7.47% 37
ABV Burton-Vulovic, Alexander 55 5.95% 38
JBW West, John B. 55 5.95% 39
DAR Revington, Dan 54 5.84% 40
MIK Kowalski, Mitchell 52 5.63% 41
ALF Heisey, Alan 43 4.65% 42
DOS Sanderson, Douglas 37 4.00% 43
SJA von Achten, Susan Jane 32 3.46% 44
JBR Rosekat, Jeffrey B. 27 2.92% 45
- Page 36 -

Candidate Name Votes Percentage Standing
Nom du candidat/de la candidate Voix Pourcentage Classement
ELG Gerb, Eldad 23 2.49% 46
DSM Smagata, David 23 2.49% 47
TOTAL BALLOTS SOUTHWEST REGION: 924
TOTAL DES SUFFRAGES EXPRIMÉS - SUD-OUEST
- Page 37 -
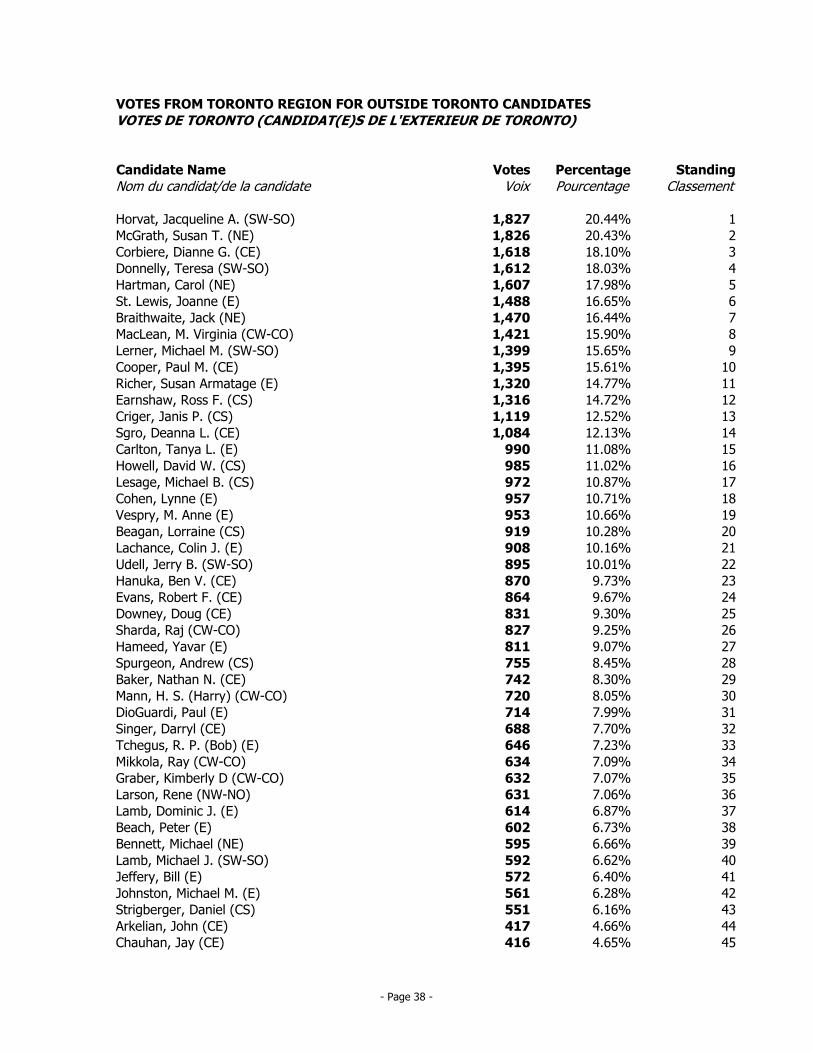
VOTES FROM TORONTO REGION FOR OUTSIDE TORONTO CANDIDATES
VOTES DE TORONTO (CANDIDAT(E)S DE L'EXTERIEUR DE TORONTO)
Candidate Name Votes Percentage Standing
Nom du candidat/de la candidate Voix Pourcentage Classement
JAH Horvat, Jacqueline A. (SW-SO) 1,827 20.44% 1
STM McGrath, Susan T. (NE) 1,826 20.43% 2
DGC Corbiere, Dianne G. (CE) 1,618 18.10% 3
TED Donnelly, Teresa (SW-SO) 1,612 18.03% 4
CAH Hartman, Carol (NE) 1,607 17.98% 5
JOL St. Lewis, Joanne (E) 1,488 16.65% 6
JAB Braithwaite, Jack (NE) 1,470 16.44% 7
MVM MacLean, M. Virginia (CW-CO) 1,421 15.90% 8
MML Lerner, Michael M. (SW-SO) 1,399 15.65% 9
PAC Cooper, Paul M. (CE) 1,395 15.61% 10
SAR Richer, Susan Armatage (E) 1,320 14.77% 11
ROE Earnshaw, Ross F. (CS) 1,316 14.72% 12
JPC Criger, Janis P. (CS) 1,119 12.52% 13
DES Sgro, Deanna L. (CE) 1,084 12.13% 14
TAC Carlton, Tanya L. (E) 990 11.08% 15
DWH Howell, David W. (CS) 985 11.02% 16
MIL Lesage, Michael B. (CS) 972 10.87% 17
LYC Cohen, Lynne (E) 957 10.71% 18
MAV Vespry, M. Anne (E) 953 10.66% 19
LOB Beagan, Lorraine (CS) 919 10.28% 20
COL Lachance, Colin J. (E) 908 10.16% 21
JBU Udell, Jerry B. (SW-SO) 895 10.01% 22
BVH Hanuka, Ben V. (CE) 870 9.73% 23
RFE Evans, Robert F. (CE) 864 9.67% 24
DOD Downey, Doug (CE) 831 9.30% 25
RAJ Sharda, Raj (CW-CO) 827 9.25% 26
YAH Hameed, Yavar (E) 811 9.07% 27
ANS Spurgeon, Andrew (CS) 755 8.45% 28
NAB Baker, Nathan N. (CE) 742 8.30% 29
HSM Mann, H. S. (Harry) (CW-CO) 720 8.05% 30
PAD DioGuardi, Paul (E) 714 7.99% 31
DAS Singer, Darryl (CE) 688 7.70% 32
RPR Tchegus, R. P. (Bob) (E) 646 7.23% 33
RAM Mikkola, Ray (CW-CO) 634 7.09% 34
KDC Graber, Kimberly D (CW-CO) 632 7.07% 35
REL Larson, Rene (NW-NO) 631 7.06% 36
DJL Lamb, Dominic J. (E) 614 6.87% 37
PEB Beach, Peter (E) 602 6.73% 38
MIC Bennett, Michael (NE) 595 6.66% 39
MJL Lamb, Michael J. (SW-SO) 592 6.62% 40
BIJ Jeffery, Bill (E) 572 6.40% 41
MMJ Johnston, Michael M. (E) 561 6.28% 42
DST Strigberger, Daniel (CS) 551 6.16% 43
JOA Arkelian, John (CE) 417 4.66% 44
JAC Chauhan, Jay (CE) 416 4.65% 45
- Page 38 -
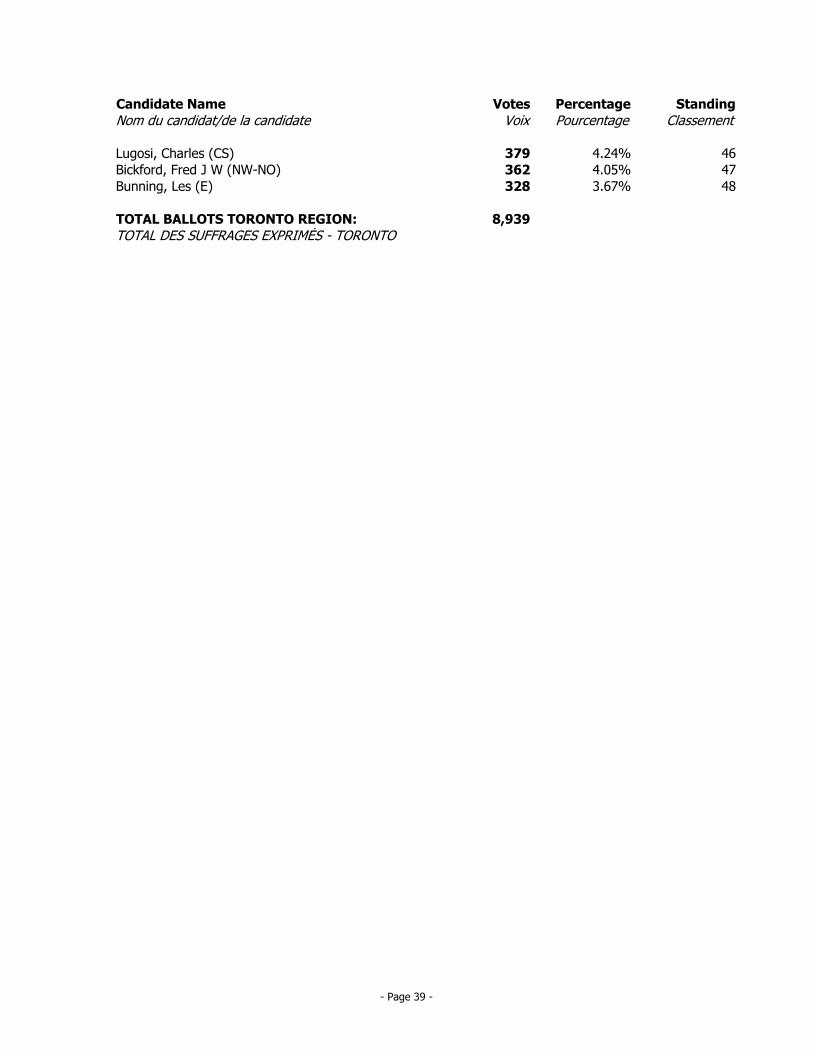
Candidate Name Votes Percentage Standing
Nom du candidat/de la candidate Voix Pourcentage Classement
CHL Lugosi, Charles (CS) 379 4.24% 46
FRB Bickford, Fred J W (NW-NO) 362 4.05% 47
LEB Bunning, Les (E) 328 3.67% 48
TOTAL BALLOTS TORONTO REGION: 8,939
TOTAL DES SUFFRAGES EXPRIMÉS - TORONTO
- Page 39 -
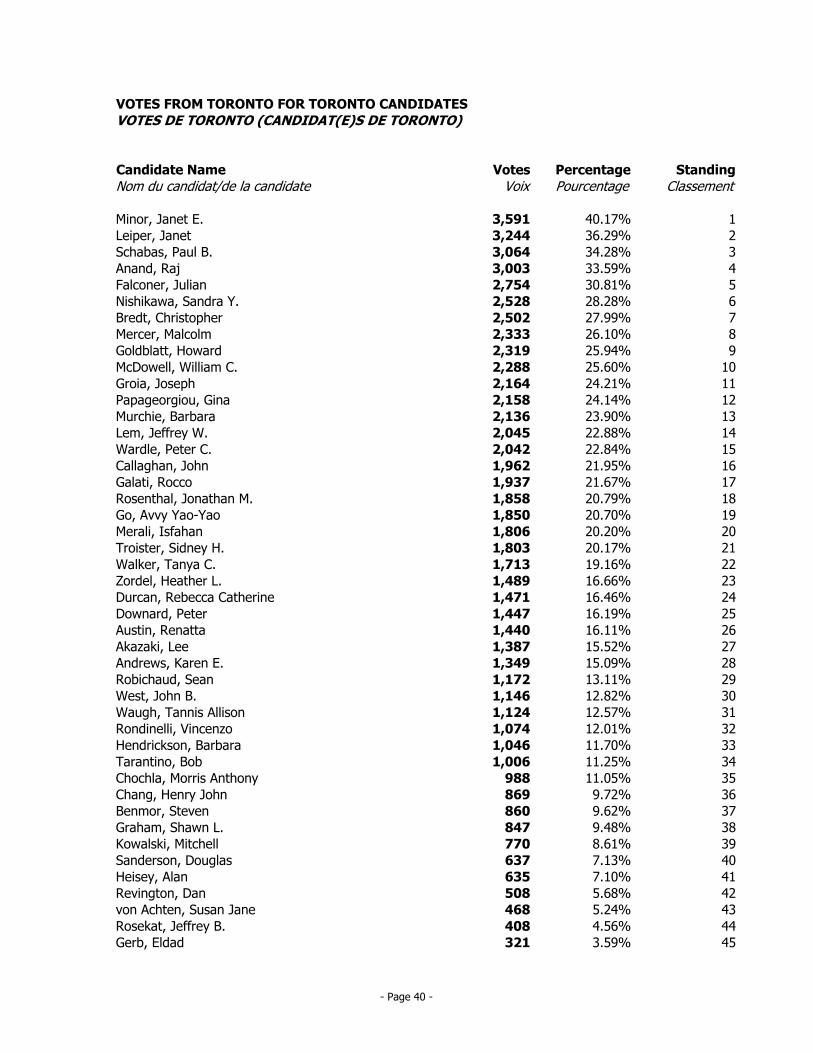
VOTES FROM TORONTO FOR TORONTO CANDIDATES
VOTES DE TORONTO (CANDIDAT(E)S DE TORONTO)
Candidate Name Votes Percentage Standing
Nom du candidat/de la candidate Voix Pourcentage Classement
JEM Minor, Janet E. 3,591 40.17% 1
JAL Leiper, Janet 3,244 36.29% 2
PBS Schabas, Paul B. 3,064 34.28% 3
RAA Anand, Raj 3,003 33.59% 4
JUF Falconer, Julian 2,754 30.81% 5
SAN Nishikawa, Sandra Y. 2,528 28.28% 6
CHB Bredt, Christopher 2,502 27.99% 7
MAM Mercer, Malcolm 2,333 26.10% 8
HOG Goldblatt, Howard 2,319 25.94% 9
WCW McDowell, William C. 2,288 25.60% 10
JOG Groia, Joseph 2,164 24.21% 11
GIP Papageorgiou, Gina 2,158 24.14% 12
BAM Murchie, Barbara 2,136 23.90% 13
JWL Lem, Jeffrey W. 2,045 22.88% 14
PCW Wardle, Peter C. 2,042 22.84% 15
JOC Callaghan, John 1,962 21.95% 16
ROG Galati, Rocco 1,937 21.67% 17
JMR Rosenthal, Jonathan M. 1,858 20.79% 18
AVV Go, Avvy Yao-Yao 1,850 20.70% 19
ISM Merali, Isfahan 1,806 20.20% 20
SHT Troister, Sidney H. 1,803 20.17% 21
TCW Walker, Tanya C. 1,713 19.16% 22
HLZ Zordel, Heather L. 1,489 16.66% 23
RCD Durcan, Rebecca Catherine 1,471 16.46% 24
PED Downard, Peter 1,447 16.19% 25
RAU Austin, Renatta 1,440 16.11% 26
LEA Akazaki, Lee 1,387 15.52% 27
KEA Andrews, Karen E. 1,349 15.09% 28
SER Robichaud, Sean 1,172 13.11% 29
JBW West, John B. 1,146 12.82% 30
TAW Waugh, Tannis Allison 1,124 12.57% 31
VIR Rondinelli, Vincenzo 1,074 12.01% 32
BAG Hendrickson, Barbara 1,046 11.70% 33
BTA Tarantino, Bob 1,006 11.25% 34
MAC Chochla, Morris Anthony 988 11.05% 35
HJC Chang, Henry John 869 9.72% 36
STB Benmor, Steven 860 9.62% 37
SLG Graham, Shawn L. 847 9.48% 38
MIK Kowalski, Mitchell 770 8.61% 39
DOS Sanderson, Douglas 637 7.13% 40
ALF Heisey, Alan 635 7.10% 41
DAR Revington, Dan 508 5.68% 42
SJA von Achten, Susan Jane 468 5.24% 43
JBR Rosekat, Jeffrey B. 408 4.56% 44
ELG Gerb, Eldad 321 3.59% 45
- Page 40 -
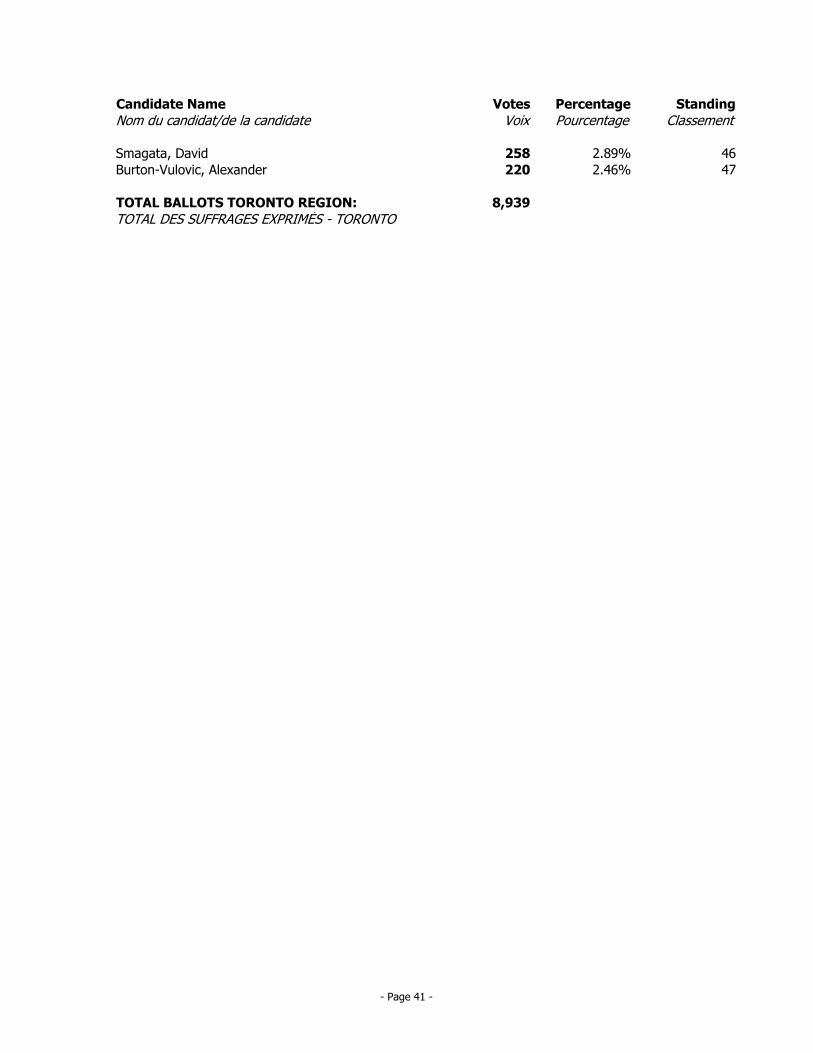
Candidate Name Votes Percentage Standing
Nom du candidat/de la candidate Voix Pourcentage Classement
DSM Smagata, David 258 2.89% 46
ABV Burton-Vulovic, Alexander 220 2.46% 47
TOTAL BALLOTS TORONTO REGION: 8,939
TOTAL DES SUFFRAGES EXPRIMÉS - TORONTO
- Page 41 -
Tab/Onglet 2
OVERVIEW OF
VOTER TURNOUT
STATISTICS
1987-2015
APERÇU DES
STATISTIQUES SUR LA
PARTICIPATION ÉLECTORALE
1987-2015
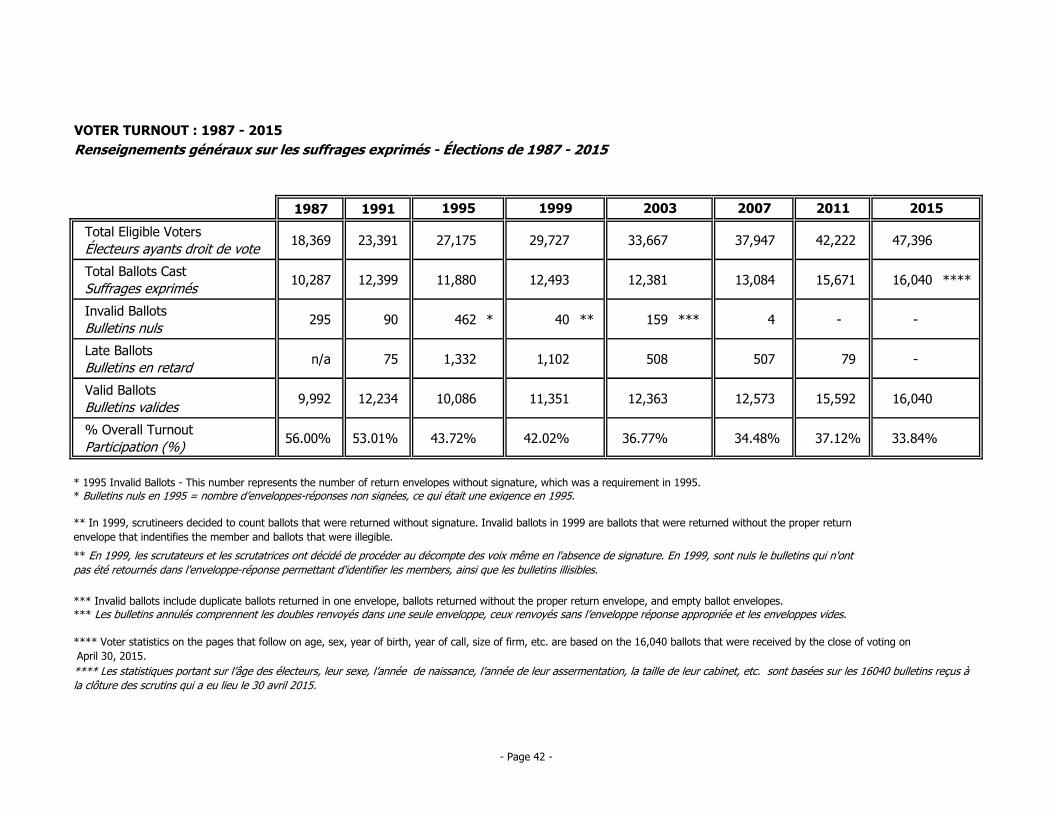
VOTER TURNOUT : 1987 - 2015
Renseignements généraux sur les suffrages exprimés - Élections de 1987 - 2015
1987 1991
Total Eligible Voters
Électeurs ayants droit de vote18,369 23,391 27,175 29,727 33,667 37,947 42,222 47,396
Total Ballots Cast
Suffrages exprimés10,287 12,399 11,880 12,493 12,381 13,084 15,671 16,040 ****
Invalid Ballots
Bulletins nuls295 90 462 * 40 ** 159 *** 4 - -
Late Ballots
Bulletins en retardn/a 75 1,332 1,102 508 507 79 -
Valid Ballots
Bulletins valides9,992 12,234 10,086 11,351 12,363 12,573 15,592 16,040
% Overall Turnout
Participation (%)56.00% 53.01% 43.72% 42.02% 36.77% 34.48% 37.12% 33.84%
**** Les statistiques portant sur l’âge des électeurs, leur sexe, l’année de naissance, l’année de leur assermentation, la taille de leur cabinet, etc. sont basées sur les 16040 bulletins reçus à
la clôture des scrutins qui a eu lieu le 30 avril 2015.
**** Voter statistics on the pages that follow on age, sex, year of birth, year of call, size of firm, etc. are based on the 16,040 ballots that were received by the close of voting on
April 30, 2015.
*** Invalid ballots include duplicate ballots returned in one envelope, ballots returned without the proper return envelope, and empty ballot envelopes.
*** Les bulletins annulés comprennent les doubles renvoyés dans une seule enveloppe, ceux renvoyés sans l’enveloppe réponse appropriée et les enveloppes vides.
** En 1999, les scrutateurs et les scrutatrices ont décidé de procéder au décompte des voix même en l'absence de signature. En 1999, sont nuls le bulletins qui n'ont
pas été retournés dans l'enveloppe-réponse permettant d'identifier les members, ainsi que les bulletins illisibles.
2015
** In 1999, scrutineers decided to count ballots that were returned without signature. Invalid ballots in 1999 are ballots that were returned without the proper return
envelope that indentifies the member and ballots that were illegible.
* 1995 Invalid Ballots - This number represents the number of return envelopes without signature, which was a requirement in 1995.
20111995 1999 2003 2007
* Bulletins nuls en 1995 = nombre d’enveloppes-réponses non signées, ce qui était une exigence en 1995.
- Page 42 -
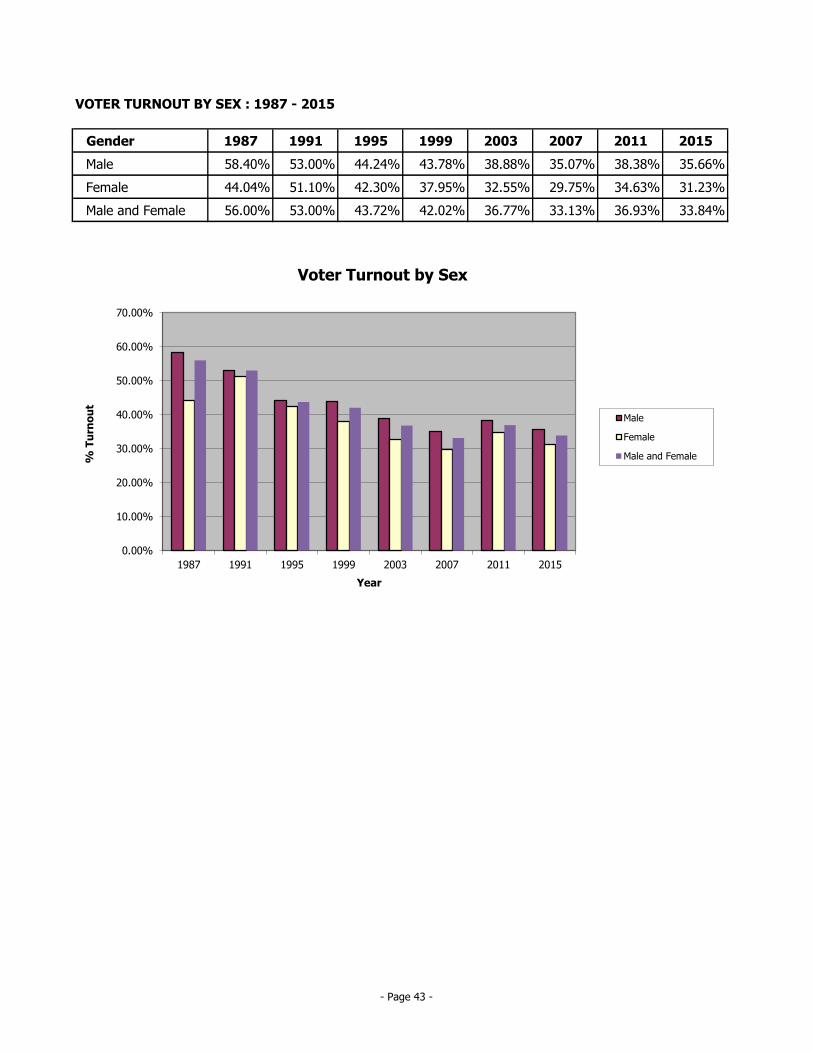
VOTER TURNOUT BY SEX : 1987 - 2015
Gender 1987 1991 1995 1999 2003 2007 2011 2015
Male 58.40% 53.00% 44.24% 43.78% 38.88% 35.07% 38.38% 35.66%
Female 44.04% 51.10% 42.30% 37.95% 32.55% 29.75% 34.63% 31.23%
Male and Female 56.00% 53.00% 43.72% 42.02% 36.77% 33.13% 36.93% 33.84%
0.00%
10.00%
20.00%
30.00%
40.00%
50.00%
60.00%
70.00%
1987 1991 1995 1999 2003 2007 2011 2015
% T
urn
ou
t
Year
Voter Turnout by Sex
Male
Female
Male and Female
- Page 43 -
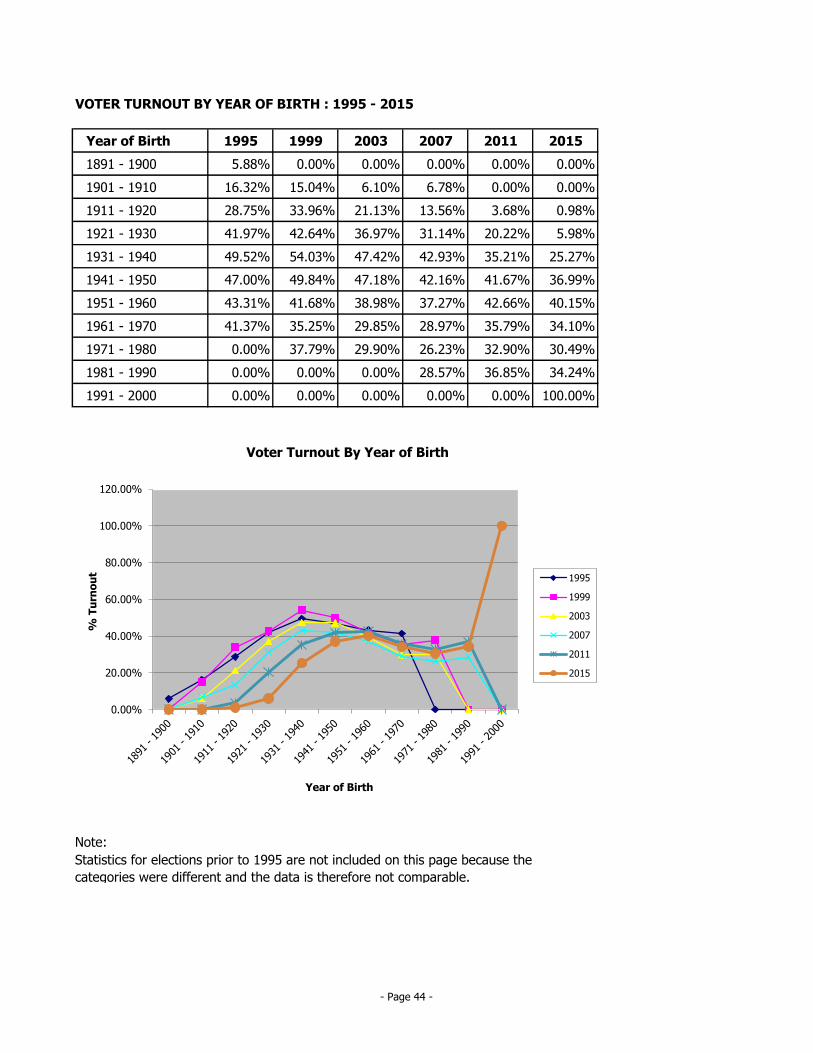
VOTER TURNOUT BY YEAR OF BIRTH : 1995 - 2015
Year of Birth 1995 1999 2003 2007 2011 2015
1891 - 1900 5.88% 0.00% 0.00% 0.00% 0.00% 0.00%
1901 - 1910 16.32% 15.04% 6.10% 6.78% 0.00% 0.00%
1911 - 1920 28.75% 33.96% 21.13% 13.56% 3.68% 0.98%
1921 - 1930 41.97% 42.64% 36.97% 31.14% 20.22% 5.98%
1931 - 1940 49.52% 54.03% 47.42% 42.93% 35.21% 25.27%
1941 - 1950 47.00% 49.84% 47.18% 42.16% 41.67% 36.99%
1951 - 1960 43.31% 41.68% 38.98% 37.27% 42.66% 40.15%
1961 - 1970 41.37% 35.25% 29.85% 28.97% 35.79% 34.10%
1971 - 1980 0.00% 37.79% 29.90% 26.23% 32.90% 30.49%
1981 - 1990 0.00% 0.00% 0.00% 28.57% 36.85% 34.24%
1991 - 2000 0.00% 0.00% 0.00% 0.00% 0.00% 100.00%
Note:
Statistics for elections prior to 1995 are not included on this page because the
categories were different and the data is therefore not comparable.
0.00%
20.00%
40.00%
60.00%
80.00%
100.00%
120.00%
% T
urn
ou
t
Year of Birth
Voter Turnout By Year of Birth
1995
1999
2003
2007
2011
2015
- Page 44 -
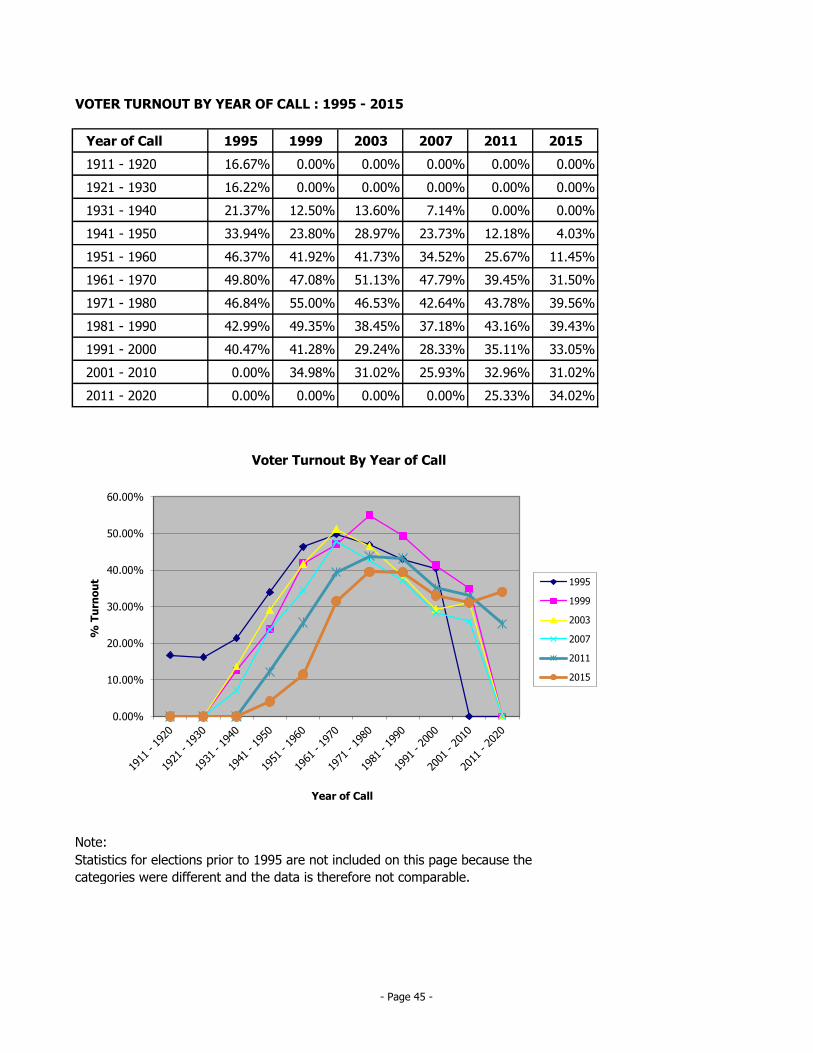
VOTER TURNOUT BY YEAR OF CALL : 1995 - 2015
Year of Call 1995 1999 2003 2007 2011 2015
1911 - 1920 16.67% 0.00% 0.00% 0.00% 0.00% 0.00%
1921 - 1930 16.22% 0.00% 0.00% 0.00% 0.00% 0.00%
1931 - 1940 21.37% 12.50% 13.60% 7.14% 0.00% 0.00%
1941 - 1950 33.94% 23.80% 28.97% 23.73% 12.18% 4.03%
1951 - 1960 46.37% 41.92% 41.73% 34.52% 25.67% 11.45%
1961 - 1970 49.80% 47.08% 51.13% 47.79% 39.45% 31.50%
1971 - 1980 46.84% 55.00% 46.53% 42.64% 43.78% 39.56%
1981 - 1990 42.99% 49.35% 38.45% 37.18% 43.16% 39.43%
1991 - 2000 40.47% 41.28% 29.24% 28.33% 35.11% 33.05%
2001 - 2010 0.00% 34.98% 31.02% 25.93% 32.96% 31.02%
2011 - 2020 0.00% 0.00% 0.00% 0.00% 25.33% 34.02%
Note:
Statistics for elections prior to 1995 are not included on this page because the
categories were different and the data is therefore not comparable.
0.00%
10.00%
20.00%
30.00%
40.00%
50.00%
60.00%
% T
urn
ou
t
Year of Call
Voter Turnout By Year of Call
1995
1999
2003
2007
2011
2015
- Page 45 -
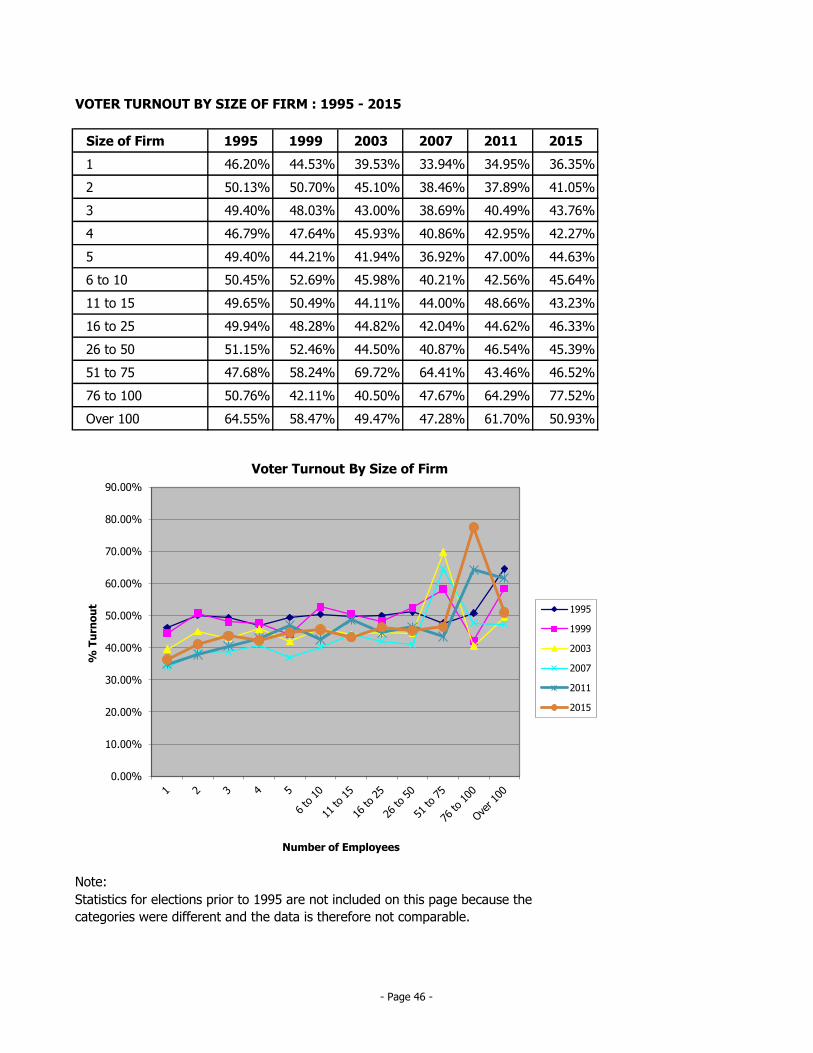
VOTER TURNOUT BY SIZE OF FIRM : 1995 - 2015
Size of Firm 1995 1999 2003 2007 2011 2015
1 46.20% 44.53% 39.53% 33.94% 34.95% 36.35%
2 50.13% 50.70% 45.10% 38.46% 37.89% 41.05%
3 49.40% 48.03% 43.00% 38.69% 40.49% 43.76%
4 46.79% 47.64% 45.93% 40.86% 42.95% 42.27%
5 49.40% 44.21% 41.94% 36.92% 47.00% 44.63%
6 to 10 50.45% 52.69% 45.98% 40.21% 42.56% 45.64%
11 to 15 49.65% 50.49% 44.11% 44.00% 48.66% 43.23%
16 to 25 49.94% 48.28% 44.82% 42.04% 44.62% 46.33%
26 to 50 51.15% 52.46% 44.50% 40.87% 46.54% 45.39%
51 to 75 47.68% 58.24% 69.72% 64.41% 43.46% 46.52%
76 to 100 50.76% 42.11% 40.50% 47.67% 64.29% 77.52%
Over 100 64.55% 58.47% 49.47% 47.28% 61.70% 50.93%
Note:
Statistics for elections prior to 1995 are not included on this page because the
categories were different and the data is therefore not comparable.
0.00%
10.00%
20.00%
30.00%
40.00%
50.00%
60.00%
70.00%
80.00%
90.00%
% T
urn
ou
t
Number of Employees
Voter Turnout By Size of Firm
1995
1999
2003
2007
2011
2015
- Page 46 -
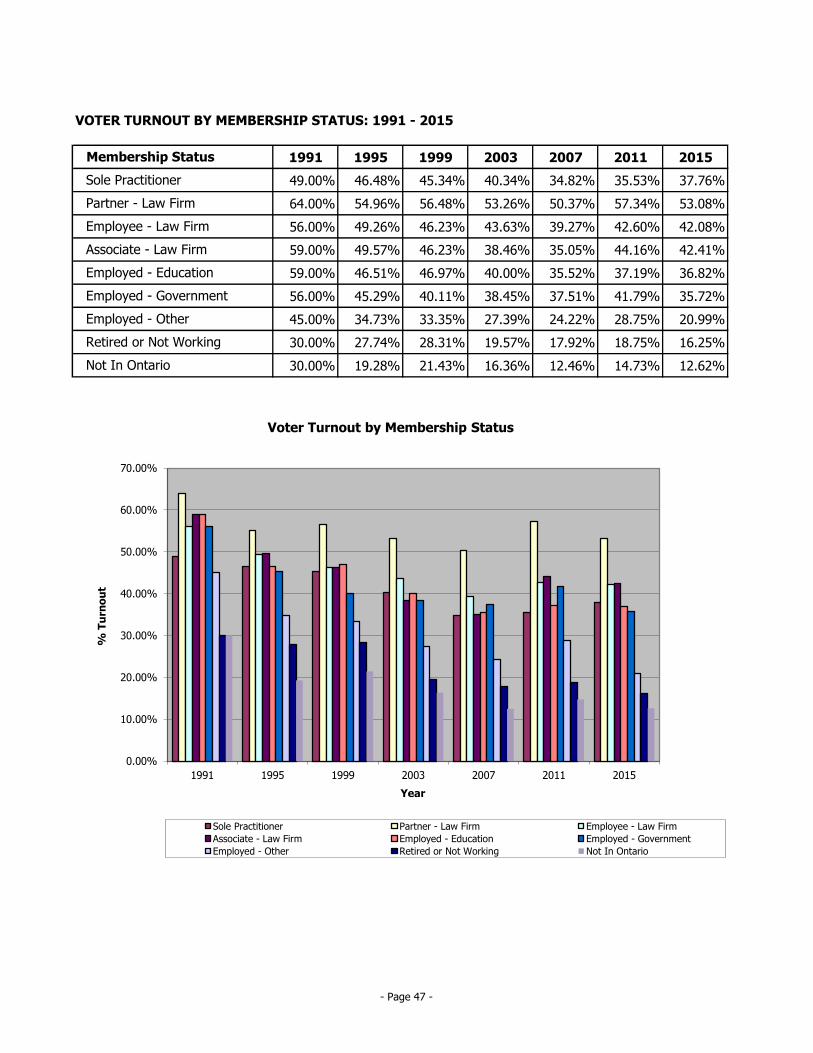
VOTER TURNOUT BY MEMBERSHIP STATUS: 1991 - 2015
1991 1995 1999 2003 2007 2011 2015
49.00% 46.48% 45.34% 40.34% 34.82% 35.53% 37.76%
64.00% 54.96% 56.48% 53.26% 50.37% 57.34% 53.08%
56.00% 49.26% 46.23% 43.63% 39.27% 42.60% 42.08%
59.00% 49.57% 46.23% 38.46% 35.05% 44.16% 42.41%
59.00% 46.51% 46.97% 40.00% 35.52% 37.19% 36.82%
56.00% 45.29% 40.11% 38.45% 37.51% 41.79% 35.72%
45.00% 34.73% 33.35% 27.39% 24.22% 28.75% 20.99%
30.00% 27.74% 28.31% 19.57% 17.92% 18.75% 16.25%
30.00% 19.28% 21.43% 16.36% 12.46% 14.73% 12.62%
Membership Status
Sole Practitioner
Partner - Law Firm
Employee - Law Firm
Associate - Law Firm
Employed - Education
Employed - Government
Employed - Other
Retired or Not Working
Not In Ontario
0.00%
10.00%
20.00%
30.00%
40.00%
50.00%
60.00%
70.00%
1991 1995 1999 2003 2007 2011 2015
% T
urn
ou
t
Year
Voter Turnout by Membership Status
Sole Practitioner Partner - Law Firm Employee - Law Firm
Associate - Law Firm Employed - Education Employed - Government
Employed - Other Retired or Not Working Not In Ontario
- Page 47 -
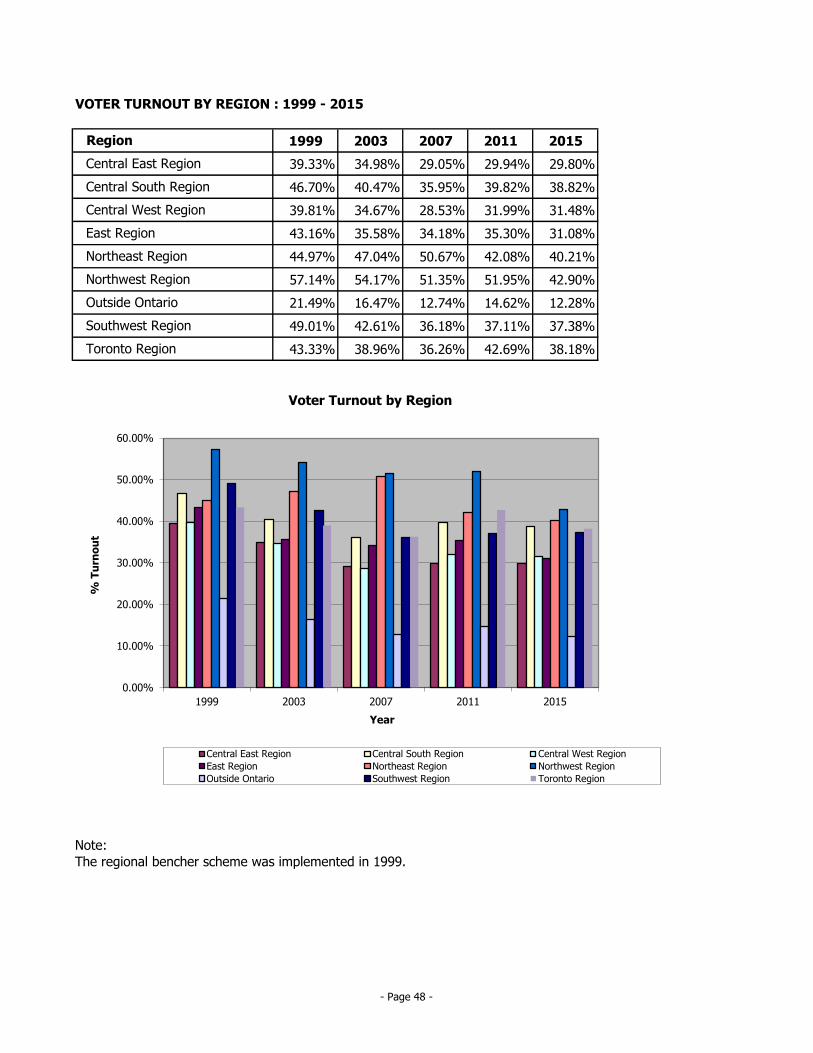
VOTER TURNOUT BY REGION : 1999 - 2015
1999 2003 2007 2011 2015
39.33% 34.98% 29.05% 29.94% 29.80%
46.70% 40.47% 35.95% 39.82% 38.82%
39.81% 34.67% 28.53% 31.99% 31.48%
43.16% 35.58% 34.18% 35.30% 31.08%
44.97% 47.04% 50.67% 42.08% 40.21%
57.14% 54.17% 51.35% 51.95% 42.90%
21.49% 16.47% 12.74% 14.62% 12.28%
49.01% 42.61% 36.18% 37.11% 37.38%
43.33% 38.96% 36.26% 42.69% 38.18%
Note:
The regional bencher scheme was implemented in 1999.
East Region
Region
Central East Region
Central South Region
Central West Region
Northeast Region
Northwest Region
Outside Ontario
Southwest Region
Toronto Region
0.00%
10.00%
20.00%
30.00%
40.00%
50.00%
60.00%
1999 2003 2007 2011 2015
% T
urn
ou
t
Year
Voter Turnout by Region
Central East Region Central South Region Central West Region
East Region Northeast Region Northwest Region
Outside Ontario Southwest Region Toronto Region
- Page 48 -

Tab/Onglet 3
2015 VOTER TURNOUT
STATISTICS
STATISTIQUES SUR LA
PARTICIPATION ÉLECTORALE
2015
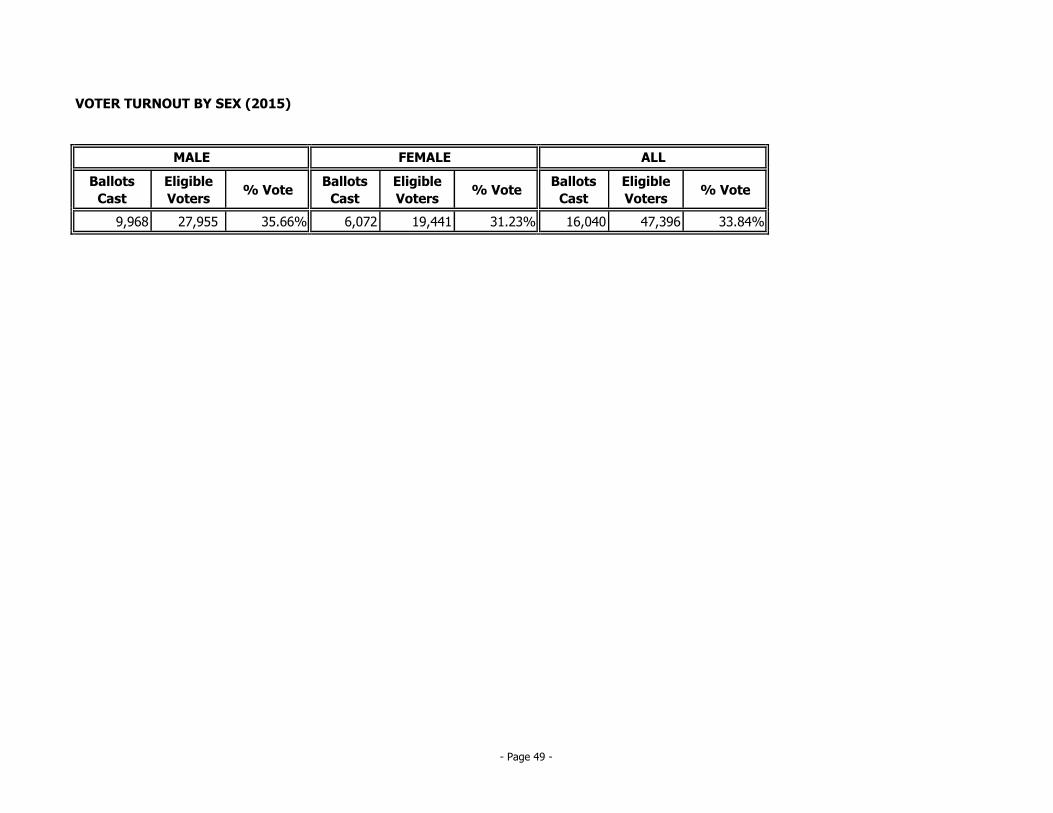
VOTER TURNOUT BY SEX (2015)
Ballots
Cast
Eligible
Voters% Vote
Ballots
Cast
Eligible
Voters% Vote
Ballots
Cast
Eligible
Voters% Vote
9,968 27,955 35.66% 6,072 19,441 31.23% 16,040 47,396 33.84%
MALE FEMALE ALL
- Page 49 -

VOTER TURNOUT BY YEAR OF BIRTH (2015)
Year of Birth
Range
Ballots
Cast
Eligible
Voters
%
Turnout
Ballots
Cast
Eligible
Voters
%
Turnout
Ballots
Cast
Eligible
Voters
%
Turnout
1891 - 1900 0 1 0.00% 0 0 0.00% 0 1 0.00%
1901 - 1910 0 24 0.00% 0 4 0.00% 0 28 0.00%
1911 - 1920 1 95 1.05% 0 7 0.00% 1 102 0.98%
1921 - 1930 42 673 6.24% 0 29 0.00% 42 702 5.98%
1931 - 1940 398 1,555 25.59% 23 111 20.72% 421 1,666 25.27%
1941 - 1950 1,696 4,458 38.04% 273 865 31.56% 1,969 5,323 36.99%
1951 - 1960 2,418 5,844 41.38% 1,122 2,973 37.74% 3,540 8,817 40.15%
1961 - 1970 2,112 5,876 35.94% 1,473 4,638 31.76% 3,585 10,514 34.10%
1971 - 1980 1,899 5,685 33.40% 1,758 6,310 27.86% 3,657 11,995 30.49%
1981 - 1990 1,402 3,744 37.45% 1,422 4,503 31.58% 2,824 8,247 34.24%
1991 - 2000 0 0 0.00% 1 1 100.00% 1 1 100.00%
TOTAL 9,968 27,955 35.66% 6,072 19,441 31.23% 16,040 47,396 33.84%
MALE FEMALE ALL
- Page 50 -
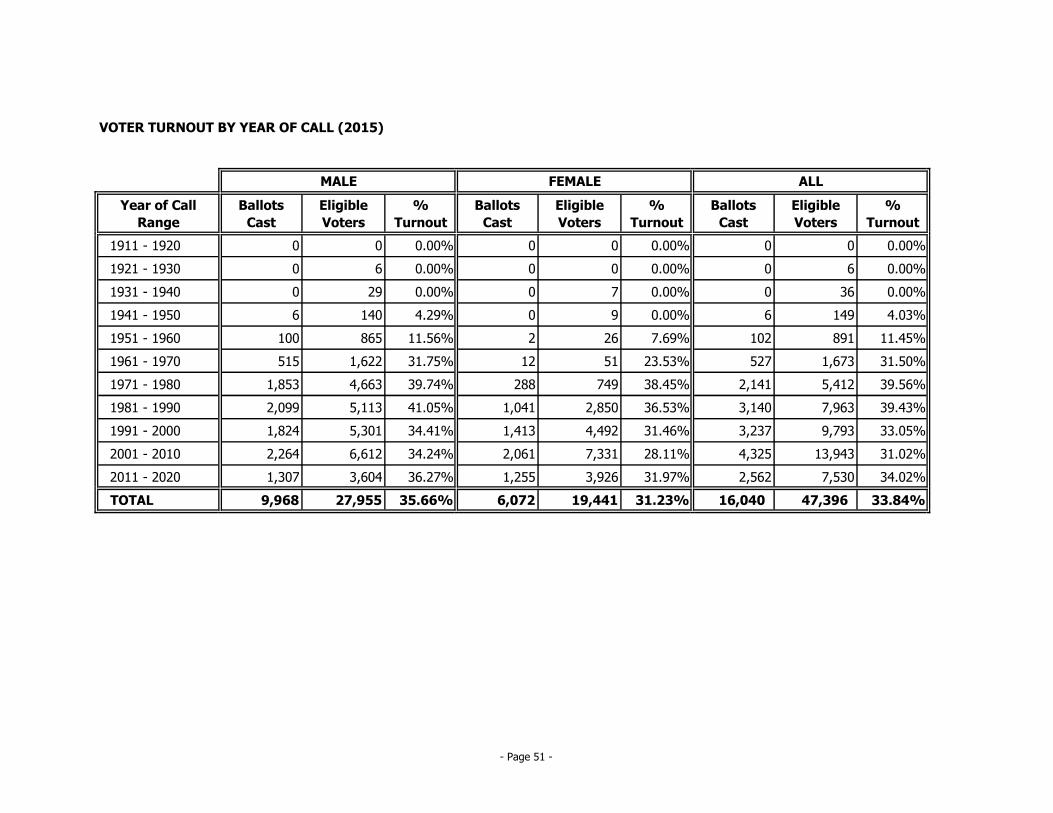
VOTER TURNOUT BY YEAR OF CALL (2015)
Year of Call
Range
Ballots
Cast
Eligible
Voters
%
Turnout
Ballots
Cast
Eligible
Voters
%
Turnout
Ballots
Cast
Eligible
Voters
%
Turnout
1911 - 1920 0 0 0.00% 0 0 0.00% 0 0 0.00%
1921 - 1930 0 6 0.00% 0 0 0.00% 0 6 0.00%
1931 - 1940 0 29 0.00% 0 7 0.00% 0 36 0.00%
1941 - 1950 6 140 4.29% 0 9 0.00% 6 149 4.03%
1951 - 1960 100 865 11.56% 2 26 7.69% 102 891 11.45%
1961 - 1970 515 1,622 31.75% 12 51 23.53% 527 1,673 31.50%
1971 - 1980 1,853 4,663 39.74% 288 749 38.45% 2,141 5,412 39.56%
1981 - 1990 2,099 5,113 41.05% 1,041 2,850 36.53% 3,140 7,963 39.43%
1991 - 2000 1,824 5,301 34.41% 1,413 4,492 31.46% 3,237 9,793 33.05%
2001 - 2010 2,264 6,612 34.24% 2,061 7,331 28.11% 4,325 13,943 31.02%
2011 - 2020 1,307 3,604 36.27% 1,255 3,926 31.97% 2,562 7,530 34.02%
TOTAL 9,968 27,955 35.66% 6,072 19,441 31.23% 16,040 47,396 33.84%
MALE FEMALE ALL
- Page 51 -

VOTER TURNOUT BY MEMBERSHIP STATUS (2015)
Membership StatusBallots
Cast
Eligible
Voters
%
Turnout
Ballots
Cast
Eligible
Voters
%
Turnout
Ballots
Cast
Eligible
Voters
%
Turnout
Sole Practitioner 2,228 5,767 38.63% 859 2,408 35.67% 3,087 8,175 37.76%
Partner - Law Firm 2,800 5,257 53.26% 841 1,603 52.46% 3,641 6,860 53.08%
Employee - Law Firm 240 563 42.63% 217 523 41.49% 457 1,086 42.08%
Associate - Law Firm 1,592 3,598 44.25% 1,279 3,171 40.33% 2,871 6,769 42.41%
Employed - Education 71 217 32.72% 126 318 39.62% 197 535 36.82%
Employed - Government 906 2,333 38.83% 1,073 3,207 33.46% 1,979 5,540 35.72%
Employed - Other 234 1,273 18.38% 273 1,143 23.88% 507 2,416 20.99%
Retired or Not Working 224 1,152 19.44% 310 2,135 14.52% 534 3,287 16.25%
Not In Ontario 274 1,854 14.78% 170 1,664 10.22% 444 3,518 12.62%
Corporate Counsel 739 2,302 32.10% 664 2,250 29.51% 1,403 4,552 30.82%
Legal Clinic Lawyer/Paralegal 79 145 54.48% 155 297 52.19% 234 442 52.94%
New Licensee 29 125 23.20% 24 114 21.05% 53 239 22.18%
Canadian Legal Advisor/Practising Law 4 21 19.05% 0 4 0.00% 4 25 16.00%
Canadian Legal Advisor/Not Practising Law 0 0 0.00% 1 1 100.00% 1 1 100.00%
Life Member Sole Practitioner 84 194 43.30% 2 2 100.00% 86 196 43.88%
Life Member Partner - Law Firm 59 88 67.05% 0 3 0.00% 59 91 64.84%
Life Member Employee - Law Firm 5 7 71.43% 0 0 0.00% 5 7 71.43%
Life Member Associate - Law Firm 12 27 44.44% 0 0 0.00% 12 27 44.44%
Life Member Employed - Education 2 2 100.00% 0 0 0.00% 2 2 100.00%
Life Member Employed - Government 2 5 40.00% 1 1 100.00% 3 6 50.00%
Life Member Employed - Other 8 29 27.59% 0 0 0.00% 8 29 27.59%
Life Member Retired or Not Working 20 235 8.51% 0 15 0.00% 20 250 8.00%
Life Member Not In Ontario 0 10 0.00% 0 1 0.00% 0 11 0.00%
Life Member Corporate Counsel 5 11 45.45% 0 0 0.00% 5 11 45.45%
MALE FEMALE ALL
- Page 52 -
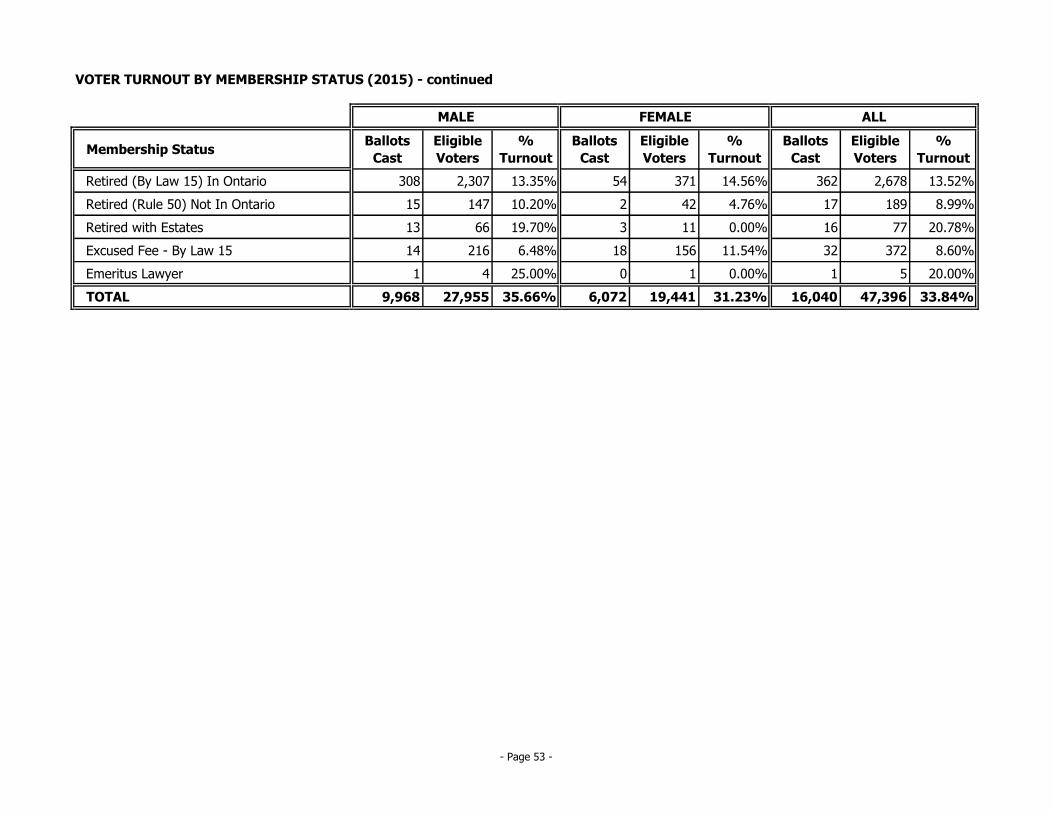
VOTER TURNOUT BY MEMBERSHIP STATUS (2015) - continued
Membership StatusBallots
Cast
Eligible
Voters
%
Turnout
Ballots
Cast
Eligible
Voters
%
Turnout
Ballots
Cast
Eligible
Voters
%
Turnout
Retired (By Law 15) In Ontario 308 2,307 13.35% 54 371 14.56% 362 2,678 13.52%
Retired (Rule 50) Not In Ontario 15 147 10.20% 2 42 4.76% 17 189 8.99%
Retired with Estates 13 66 19.70% 3 11 0.00% 16 77 20.78%
Excused Fee - By Law 15 14 216 6.48% 18 156 11.54% 32 372 8.60%
Emeritus Lawyer 1 4 25.00% 0 1 0.00% 1 5 20.00%
TOTAL 9,968 27,955 35.66% 6,072 19,441 31.23% 16,040 47,396 33.84%
MALE FEMALE ALL
- Page 53 -
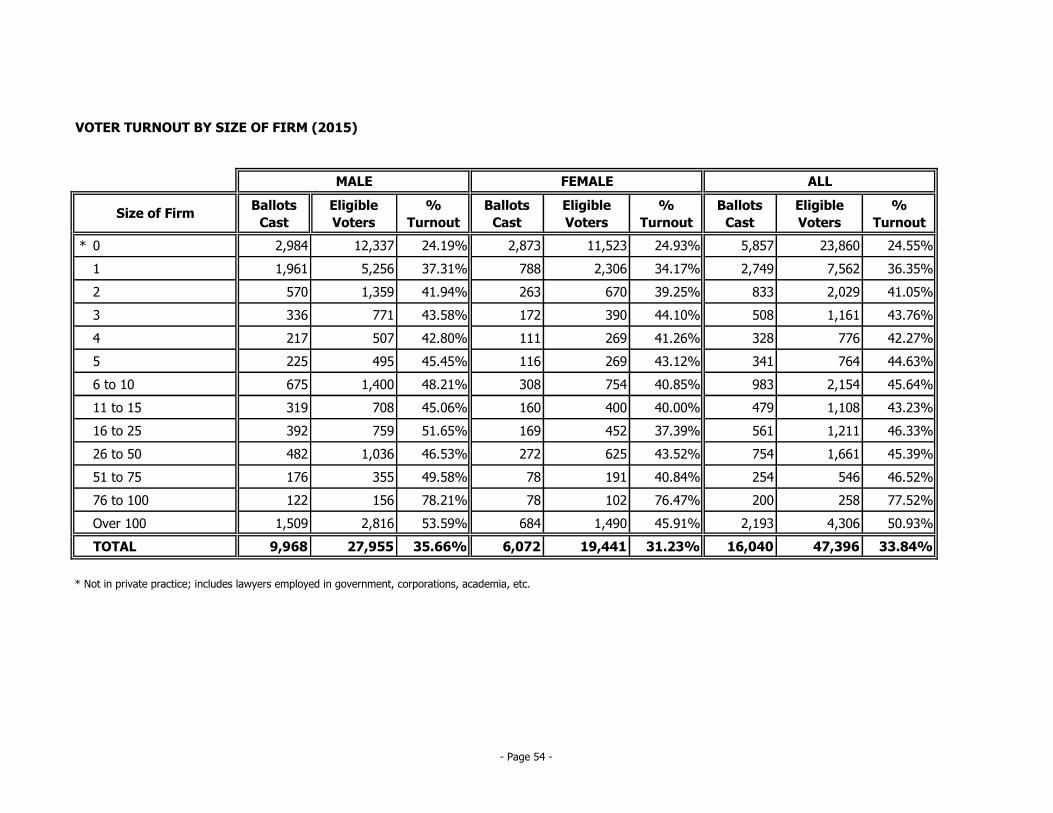
VOTER TURNOUT BY SIZE OF FIRM (2015)
Ballots
Cast
Eligible
Voters
%
Turnout
Ballots
Cast
Eligible
Voters
%
Turnout
Ballots
Cast
Eligible
Voters
%
Turnout
* 0 2,984 12,337 24.19% 2,873 11,523 24.93% 5,857 23,860 24.55%
1 1,961 5,256 37.31% 788 2,306 34.17% 2,749 7,562 36.35%
2 570 1,359 41.94% 263 670 39.25% 833 2,029 41.05%
3 336 771 43.58% 172 390 44.10% 508 1,161 43.76%
4 217 507 42.80% 111 269 41.26% 328 776 42.27%
5 225 495 45.45% 116 269 43.12% 341 764 44.63%
6 to 10 675 1,400 48.21% 308 754 40.85% 983 2,154 45.64%
11 to 15 319 708 45.06% 160 400 40.00% 479 1,108 43.23%
16 to 25 392 759 51.65% 169 452 37.39% 561 1,211 46.33%
26 to 50 482 1,036 46.53% 272 625 43.52% 754 1,661 45.39%
51 to 75 176 355 49.58% 78 191 40.84% 254 546 46.52%
76 to 100 122 156 78.21% 78 102 76.47% 200 258 77.52%
Over 100 1,509 2,816 53.59% 684 1,490 45.91% 2,193 4,306 50.93%
TOTAL 9,968 27,955 35.66% 6,072 19,441 31.23% 16,040 47,396 33.84%
* Not in private practice; includes lawyers employed in government, corporations, academia, etc.
MALE FEMALE ALL
Size of Firm
- Page 54 -
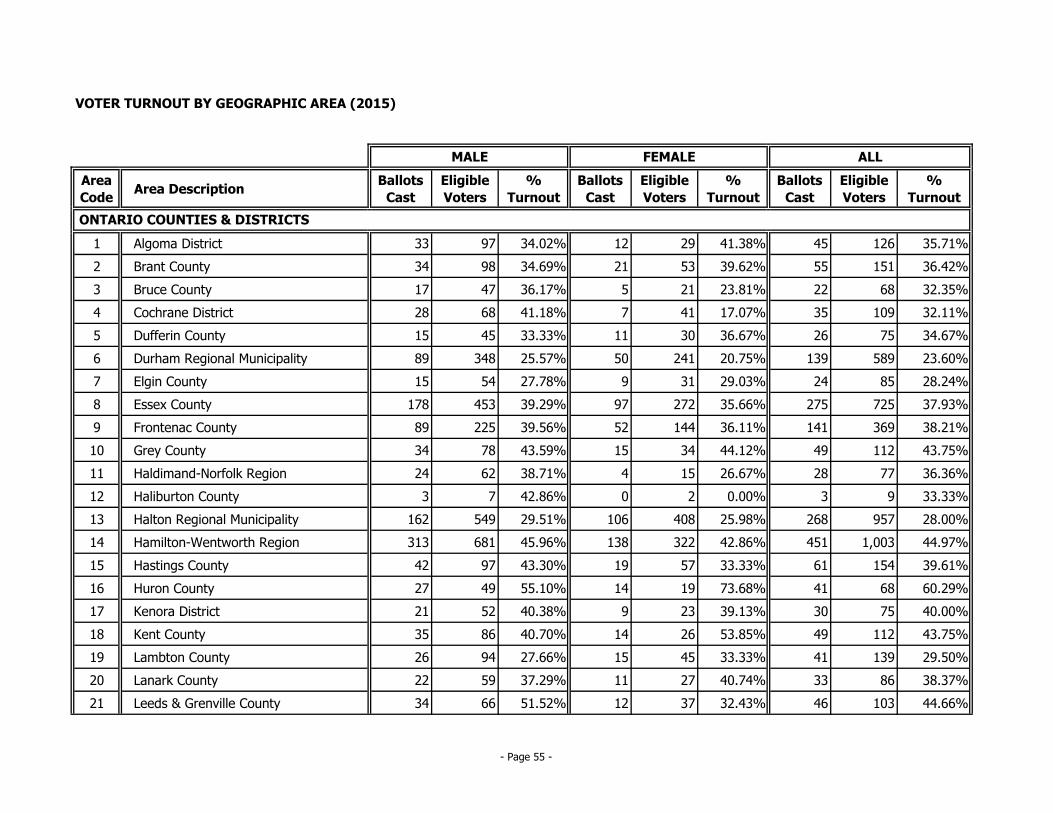
VOTER TURNOUT BY GEOGRAPHIC AREA (2015)
Area
CodeArea Description
Ballots
Cast
Eligible
Voters
%
Turnout
Ballots
Cast
Eligible
Voters
%
Turnout
Ballots
Cast
Eligible
Voters
%
Turnout
1 Algoma District 33 97 34.02% 12 29 41.38% 45 126 35.71%
2 Brant County 34 98 34.69% 21 53 39.62% 55 151 36.42%
3 Bruce County 17 47 36.17% 5 21 23.81% 22 68 32.35%
4 Cochrane District 28 68 41.18% 7 41 17.07% 35 109 32.11%
5 Dufferin County 15 45 33.33% 11 30 36.67% 26 75 34.67%
6 Durham Regional Municipality 89 348 25.57% 50 241 20.75% 139 589 23.60%
7 Elgin County 15 54 27.78% 9 31 29.03% 24 85 28.24%
8 Essex County 178 453 39.29% 97 272 35.66% 275 725 37.93%
9 Frontenac County 89 225 39.56% 52 144 36.11% 141 369 38.21%
10 Grey County 34 78 43.59% 15 34 44.12% 49 112 43.75%
11 Haldimand-Norfolk Region 24 62 38.71% 4 15 26.67% 28 77 36.36%
12 Haliburton County 3 7 42.86% 0 2 0.00% 3 9 33.33%
13 Halton Regional Municipality 162 549 29.51% 106 408 25.98% 268 957 28.00%
14 Hamilton-Wentworth Region 313 681 45.96% 138 322 42.86% 451 1,003 44.97%
15 Hastings County 42 97 43.30% 19 57 33.33% 61 154 39.61%
16 Huron County 27 49 55.10% 14 19 73.68% 41 68 60.29%
17 Kenora District 21 52 40.38% 9 23 39.13% 30 75 40.00%
18 Kent County 35 86 40.70% 14 26 53.85% 49 112 43.75%
19 Lambton County 26 94 27.66% 15 45 33.33% 41 139 29.50%
20 Lanark County 22 59 37.29% 11 27 40.74% 33 86 38.37%
21 Leeds & Grenville County 34 66 51.52% 12 37 32.43% 46 103 44.66%
MALE FEMALE ALL
ONTARIO COUNTIES & DISTRICTS
- Page 55 -
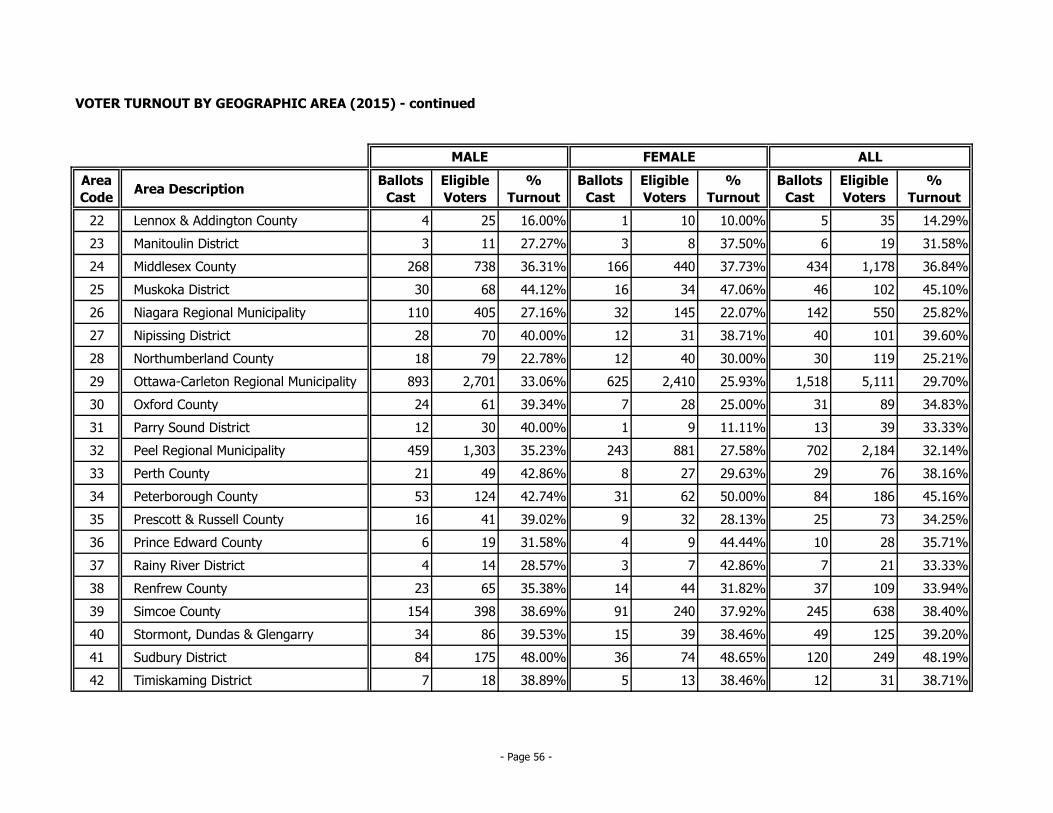
VOTER TURNOUT BY GEOGRAPHIC AREA (2015) - continued
Area
CodeArea Description
Ballots
Cast
Eligible
Voters
%
Turnout
Ballots
Cast
Eligible
Voters
%
Turnout
Ballots
Cast
Eligible
Voters
%
Turnout
22 Lennox & Addington County 4 25 16.00% 1 10 10.00% 5 35 14.29%
23 Manitoulin District 3 11 27.27% 3 8 37.50% 6 19 31.58%
24 Middlesex County 268 738 36.31% 166 440 37.73% 434 1,178 36.84%
25 Muskoka District 30 68 44.12% 16 34 47.06% 46 102 45.10%
26 Niagara Regional Municipality 110 405 27.16% 32 145 22.07% 142 550 25.82%
27 Nipissing District 28 70 40.00% 12 31 38.71% 40 101 39.60%
28 Northumberland County 18 79 22.78% 12 40 30.00% 30 119 25.21%
29 Ottawa-Carleton Regional Municipality 893 2,701 33.06% 625 2,410 25.93% 1,518 5,111 29.70%
30 Oxford County 24 61 39.34% 7 28 25.00% 31 89 34.83%
31 Parry Sound District 12 30 40.00% 1 9 11.11% 13 39 33.33%
32 Peel Regional Municipality 459 1,303 35.23% 243 881 27.58% 702 2,184 32.14%
33 Perth County 21 49 42.86% 8 27 29.63% 29 76 38.16%
34 Peterborough County 53 124 42.74% 31 62 50.00% 84 186 45.16%
35 Prescott & Russell County 16 41 39.02% 9 32 28.13% 25 73 34.25%
36 Prince Edward County 6 19 31.58% 4 9 44.44% 10 28 35.71%
37 Rainy River District 4 14 28.57% 3 7 42.86% 7 21 33.33%
38 Renfrew County 23 65 35.38% 14 44 31.82% 37 109 33.94%
39 Simcoe County 154 398 38.69% 91 240 37.92% 245 638 38.40%
40 Stormont, Dundas & Glengarry 34 86 39.53% 15 39 38.46% 49 125 39.20%
41 Sudbury District 84 175 48.00% 36 74 48.65% 120 249 48.19%
42 Timiskaming District 7 18 38.89% 5 13 38.46% 12 31 38.71%
MALE FEMALE ALL
- Page 56 -
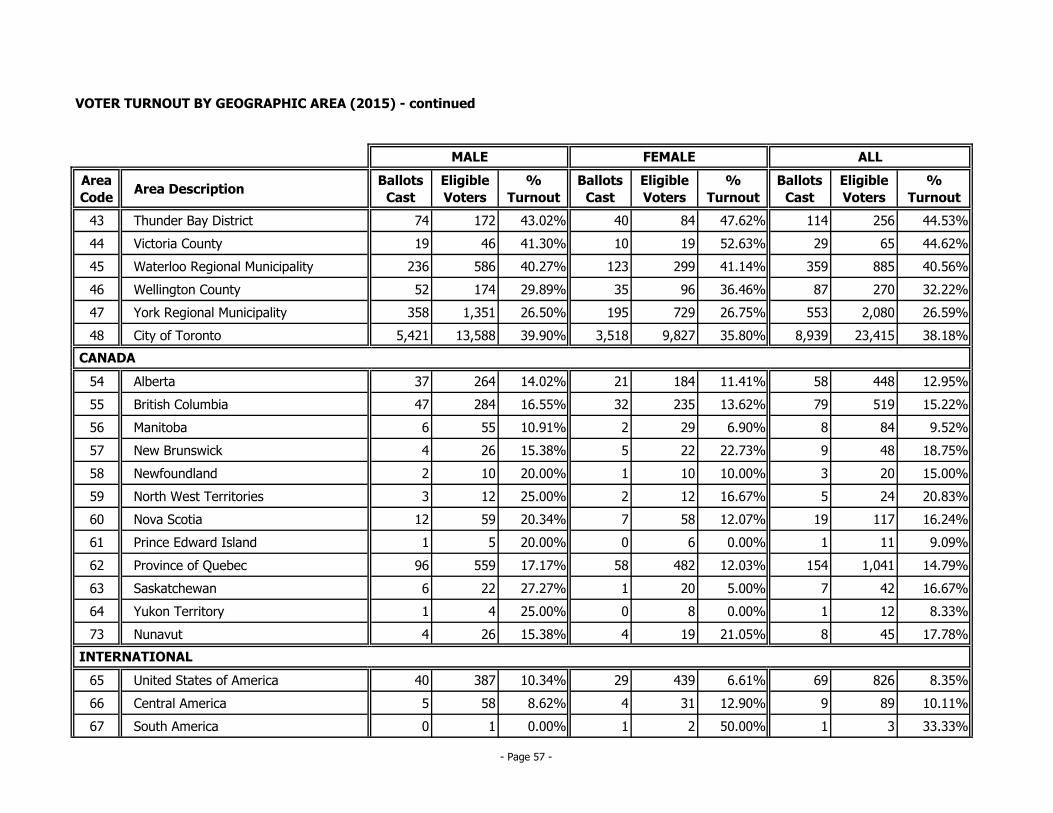
VOTER TURNOUT BY GEOGRAPHIC AREA (2015) - continued
Area
CodeArea Description
Ballots
Cast
Eligible
Voters
%
Turnout
Ballots
Cast
Eligible
Voters
%
Turnout
Ballots
Cast
Eligible
Voters
%
Turnout
43 Thunder Bay District 74 172 43.02% 40 84 47.62% 114 256 44.53%
44 Victoria County 19 46 41.30% 10 19 52.63% 29 65 44.62%
45 Waterloo Regional Municipality 236 586 40.27% 123 299 41.14% 359 885 40.56%
46 Wellington County 52 174 29.89% 35 96 36.46% 87 270 32.22%
47 York Regional Municipality 358 1,351 26.50% 195 729 26.75% 553 2,080 26.59%
48 City of Toronto 5,421 13,588 39.90% 3,518 9,827 35.80% 8,939 23,415 38.18%
54 Alberta 37 264 14.02% 21 184 11.41% 58 448 12.95%
55 British Columbia 47 284 16.55% 32 235 13.62% 79 519 15.22%
56 Manitoba 6 55 10.91% 2 29 6.90% 8 84 9.52%
57 New Brunswick 4 26 15.38% 5 22 22.73% 9 48 18.75%
58 Newfoundland 2 10 20.00% 1 10 10.00% 3 20 15.00%
59 North West Territories 3 12 25.00% 2 12 16.67% 5 24 20.83%
60 Nova Scotia 12 59 20.34% 7 58 12.07% 19 117 16.24%
61 Prince Edward Island 1 5 20.00% 0 6 0.00% 1 11 9.09%
62 Province of Quebec 96 559 17.17% 58 482 12.03% 154 1,041 14.79%
63 Saskatchewan 6 22 27.27% 1 20 5.00% 7 42 16.67%
64 Yukon Territory 1 4 25.00% 0 8 0.00% 1 12 8.33%
73 Nunavut 4 26 15.38% 4 19 21.05% 8 45 17.78%
65 United States of America 40 387 10.34% 29 439 6.61% 69 826 8.35%
66 Central America 5 58 8.62% 4 31 12.90% 9 89 10.11%
67 South America 0 1 0.00% 1 2 50.00% 1 3 33.33%
CANADA
INTERNATIONAL
MALE FEMALE ALL
- Page 57 -
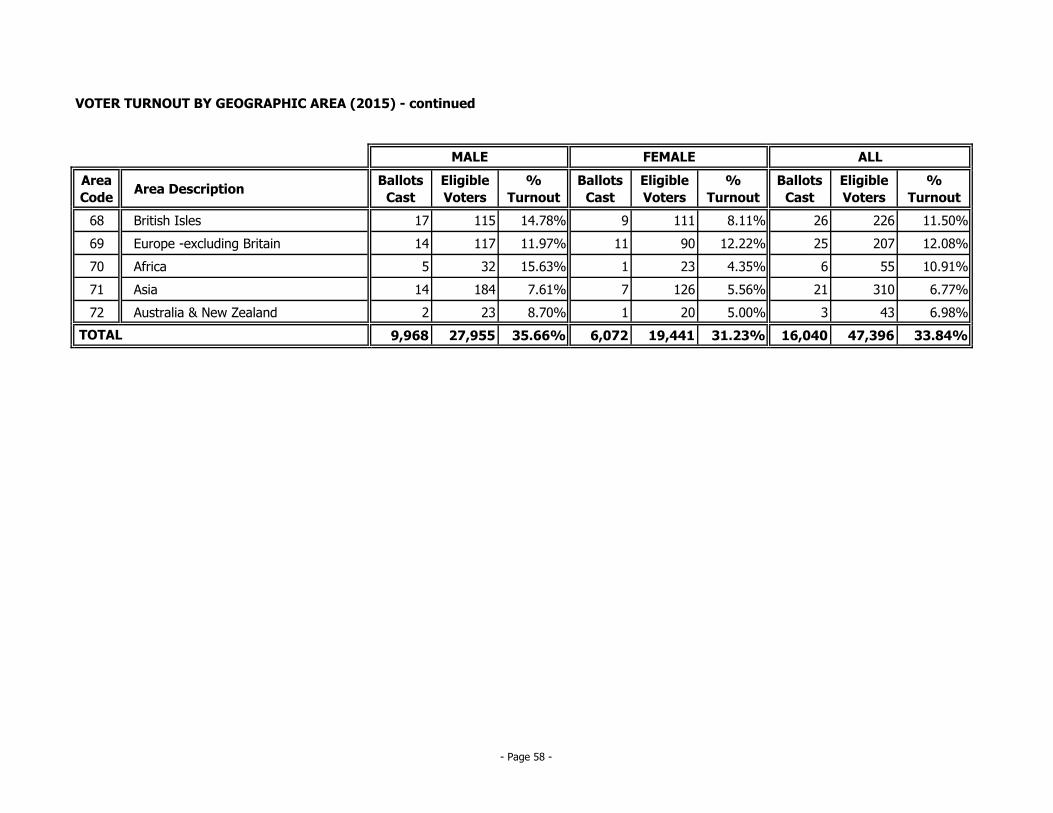
VOTER TURNOUT BY GEOGRAPHIC AREA (2015) - continued
Area
CodeArea Description
Ballots
Cast
Eligible
Voters
%
Turnout
Ballots
Cast
Eligible
Voters
%
Turnout
Ballots
Cast
Eligible
Voters
%
Turnout
68 British Isles 17 115 14.78% 9 111 8.11% 26 226 11.50%
69 Europe -excluding Britain 14 117 11.97% 11 90 12.22% 25 207 12.08%
70 Africa 5 32 15.63% 1 23 4.35% 6 55 10.91%
71 Asia 14 184 7.61% 7 126 5.56% 21 310 6.77%
72 Australia & New Zealand 2 23 8.70% 1 20 5.00% 3 43 6.98%
9,968 27,955 35.66% 6,072 19,441 31.23% 16,040 47,396 33.84% TOTAL
MALE FEMALE ALL
- Page 58 -

VOTER TURNOUT BY ELECTORAL REGION (2015)
RegionBallots
Cast
Eligible
Voters
%
Turnout
Ballots
Cast
Eligible
Voters
%
Turnout
Ballots
Cast
Eligible
Voters
%
Turnout
Central East Region 724 2,421 29.90% 405 1,367 29.63% 1,129 3,788 29.80%
Central South Region 717 1,832 39.14% 318 834 38.13% 1,035 2,666 38.82%
Central West Region 739 2,196 33.65% 415 1,470 28.23% 1,154 3,666 31.48%
East Region 1,163 3,384 34.37% 762 2,809 27.13% 1,925 6,193 31.08%
Northeast Region 195 469 41.58% 76 205 37.07% 271 674 40.21%
Northwest Region 99 238 41.60% 52 114 45.61% 151 352 42.90%
Outside Ontario 316 2,243 14.09% 196 1,927 10.17% 512 4,170 12.28%
Southwest Region 594 1,584 37.50% 330 888 37.16% 924 2,472 37.38%
Toronto Region 5,421 13,588 39.90% 3,518 9,827 35.80% 8,939 23,415 38.18%
TOTAL 9,968 27,955 35.66% 6,072 19,441 31.23% 16,040 47,396 33.84%
MALE FEMALE ALL
- Page 59 -