


Langages
Pages
Légal


UV Recherche – 4ème
Année Génie Mécanique INSA Toulouse – 18 Juin 2011
1
SIMULATION BASED DESIGN OF ROBOTIC ARM WITH
MODELICA
Thibault Ravily (1), Clément Mur (2), Marc Budinger (3) (1) INSA Toulouse département Génie Mécanique, 135 Avenue de Rangueil 31400 Toulouse, +33613291222,
(2) INSA Toulouse département Génie Mécanique, 135 Avenue de Rangueil 31400 Toulouse, +33684057228,
(3) Université de Toulouse, INSA/UPS, Institut Clément Ader, Toulouse, 31077, France.
ABSTRACT
This paper presents a numerical model of a robotic arm, using standard servomotors HSR-8498HB.
The model was created with Modelica [3], the architecture grants the user the ability to easily change
dimensions of the arm and the servomotor components. The aim of this model is to quickly analyse the operating
range and compare it with the mission profile. It is also possible to define the mission profile and check if the
component is well sized, and see how it reacts
Keywords: Robotic arm, servomotor HSR-8498HB, sizing, model based design, electromechanical
actuator.
1 Context
Our activity lead us to use Hitec HSR-8498HB servomotors, but the datasheet of this component
give only little information about its operating range: maximum torque and speed. A major challenge
for the Robotic teams which participate to the Eurobot contest is to use these servomotors (or
equivalent) and with the little information given try to design systems. But servomotors are often used
under or over their performance level, generally leading to failure. However, when we design a robotic
arm, it is important to know how it will react according to the mission profile, to avoid physical
interference with other parts of the robot or the environment. This Dymola [3] model will help for
robotic arm design.
UV Recherche – 4ème
Année Génie Mécanique INSA Toulouse – 18 Juin 2011
2
Figure 1: Theoretical and real trajectories of a robotic arm. Modelica [3] model.
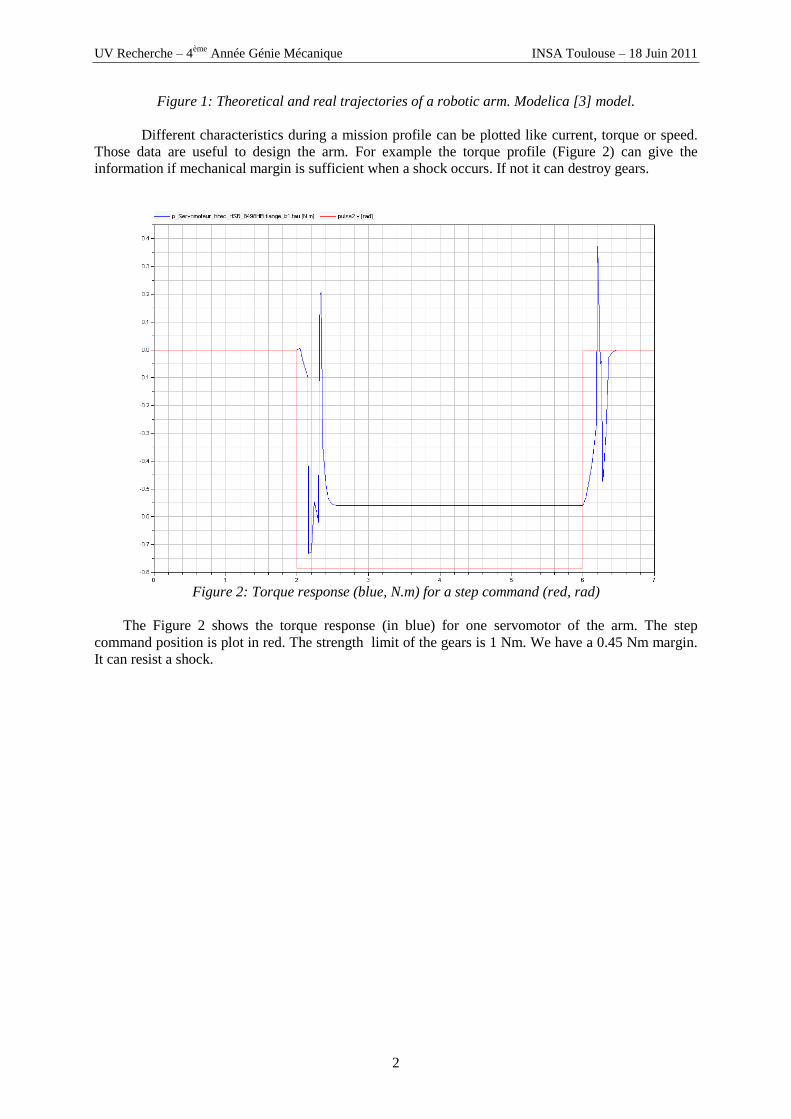
Different characteristics during a mission profile can be plotted like current, torque or speed.
Those data are useful to design the arm. For example the torque profile (Figure 2) can give the
information if mechanical margin is sufficient when a shock occurs. If not it can destroy gears.
Figure 2: Torque response (blue, N.m) for a step command (red, rad)
The Figure 2 shows the torque response (in blue) for one servomotor of the arm. The step
command position is plot in red. The strength limit of the gears is 1 Nm. We have a 0.45 Nm margin.
It can resist a shock.
UV Recherche – 4ème
Année Génie Mécanique INSA Toulouse – 18 Juin 2011
3
2 Design and sizing method
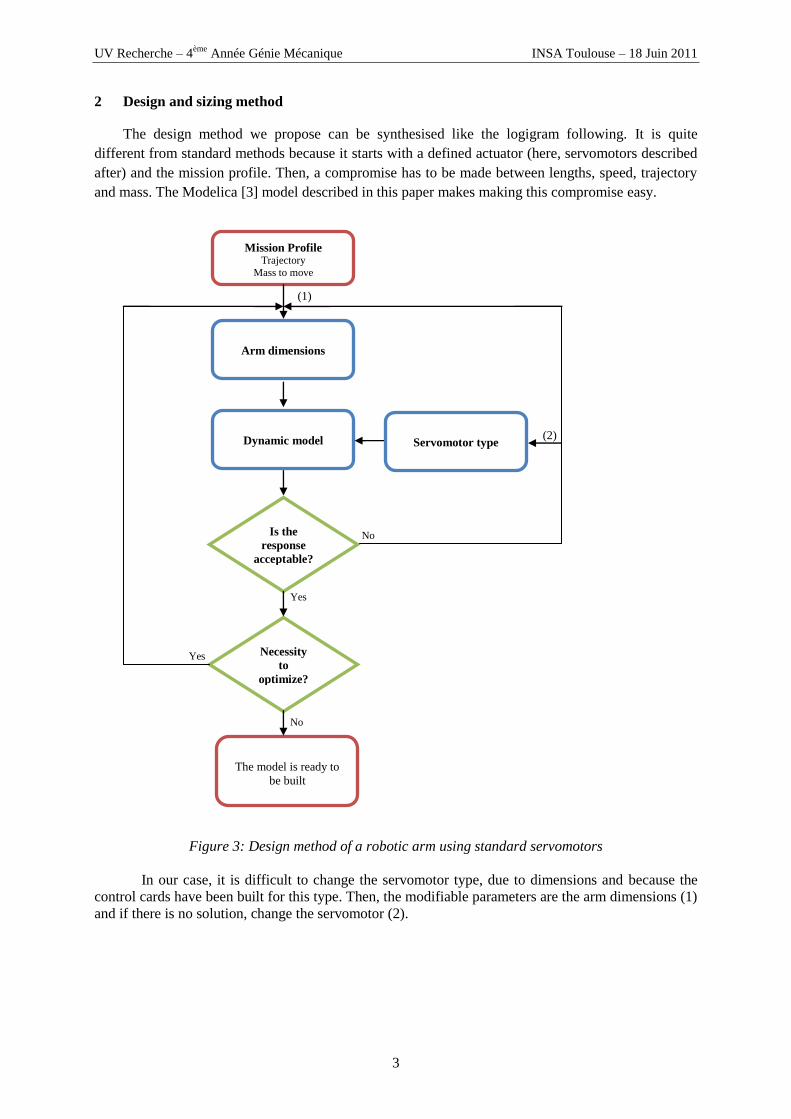
The design method we propose can be synthesised like the logigram following. It is quite
different from standard methods because it starts with a defined actuator (here, servomotors described
after) and the mission profile. Then, a compromise has to be made between lengths, speed, trajectory
and mass. The Modelica [3] model described in this paper makes making this compromise easy.
Figure 3: Design method of a robotic arm using standard servomotors
In our case, it is difficult to change the servomotor type, due to dimensions and because the
control cards have been built for this type. Then, the modifiable parameters are the arm dimensions (1)
and if there is no solution, change the servomotor (2).
Servomotor type
(1)
(2)
No
No
Yes
Yes
Mission Profile Trajectory
Mass to move
Arm dimensions
Dynamic model
The model is ready to
be built
Necessity
to
optimize?
Is the
response
acceptable?
UV Recherche – 4ème
Année Génie Mécanique INSA Toulouse – 18 Juin 2011
4
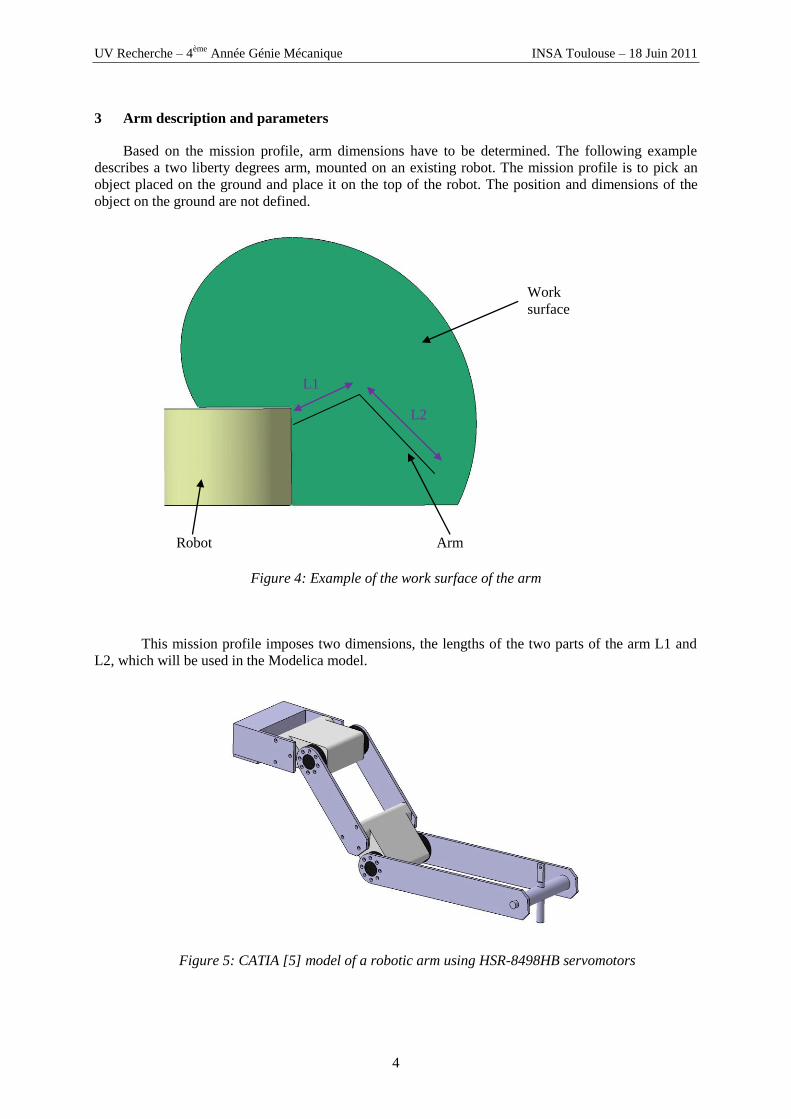
3 Arm description and parameters
Based on the mission profile, arm dimensions have to be determined. The following example
describes a two liberty degrees arm, mounted on an existing robot. The mission profile is to pick an
object placed on the ground and place it on the top of the robot. The position and dimensions of the
object on the ground are not defined.
Figure 4: Example of the work surface of the arm
This mission profile imposes two dimensions, the lengths of the two parts of the arm L1 and
L2, which will be used in the Modelica model.
Figure 5: CATIA [5] model of a robotic arm using HSR-8498HB servomotors
Robot Arm
Work
surface
L2
L1

UV Recherche – 4ème
Année Génie Mécanique INSA Toulouse – 18 Juin 2011
5
4 Dynamic model
Servomotor type
Arm dimensions and material
Figure 6: General model
4.1 Servomotor architecture
With the little information about the components of the servomotor there is in the datasheets,
the model was created.
Figure 7: general bloc diagram of the servomotor
Figure 8: Dymola model of the HSR-8498HB servomotor
+
-
Pulsewidth
Rp
Ωg
Cg
Position
Ωg
Cg
Position
Ωm
Cm
Trajectory input
Digital input Ɛ
Actual position
DC motor Gearbox
1 : 351,8 PD Control
Converter Potentiometer
P gain
Dgain
Dead band
Robotic arm model Mission profile Arm trajectory
UV Recherche – 4ème
Année Génie Mécanique INSA Toulouse – 18 Juin 2011
6
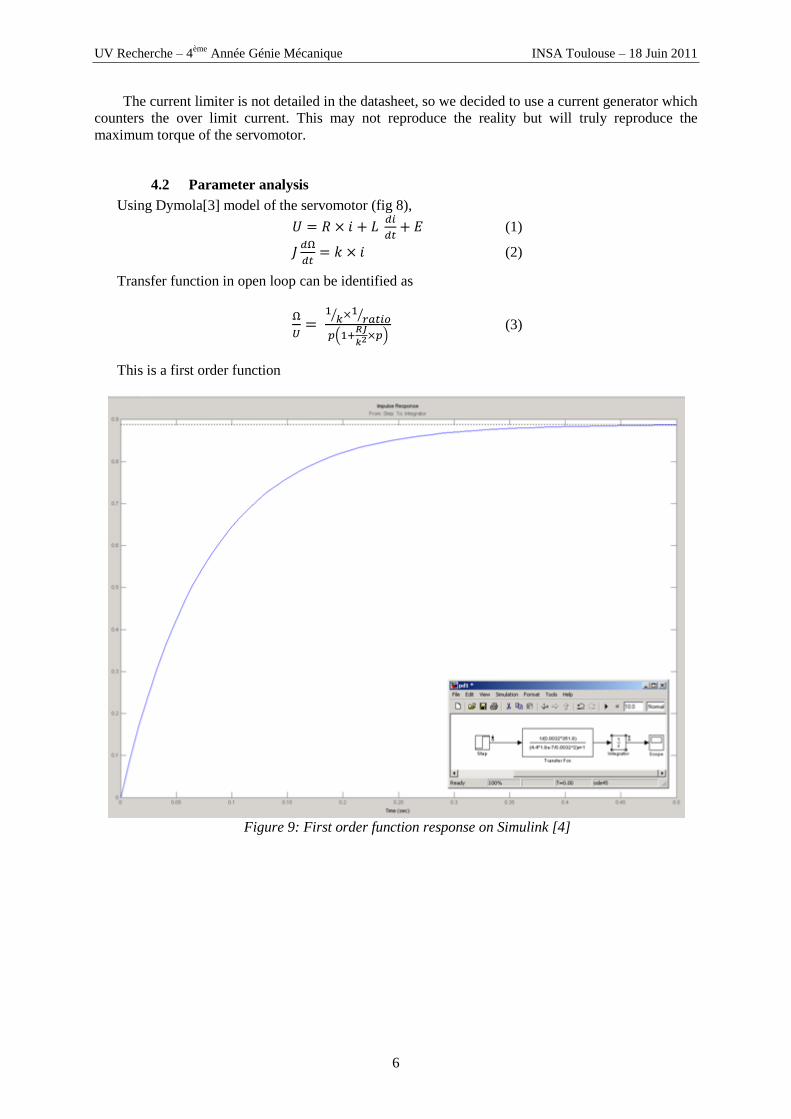
The current limiter is not detailed in the datasheet, so we decided to use a current generator which
counters the over limit current. This may not reproduce the reality but will truly reproduce the
maximum torque of the servomotor.
4.2 Parameter analysis
Using Dymola[3] model of the servomotor (fig 8),
(1)
(2)
Transfer function in open loop can be identified as
(3)
This is a first order function
Figure 9: First order function response on Simulink [4]
UV Recherche – 4ème
Année Génie Mécanique INSA Toulouse – 18 Juin 2011
7
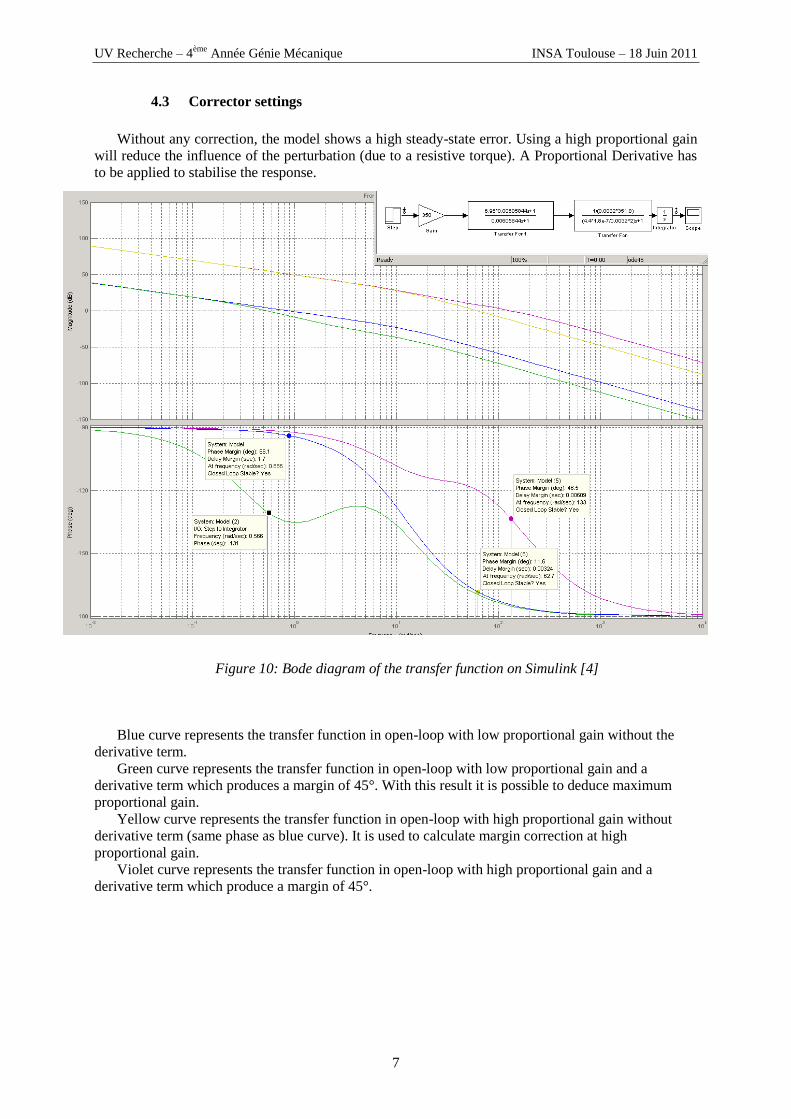
4.3 Corrector settings
Without any correction, the model shows a high steady-state error. Using a high proportional gain
will reduce the influence of the perturbation (due to a resistive torque). A Proportional Derivative has
to be applied to stabilise the response.
Figure 10: Bode diagram of the transfer function on Simulink [4]
Blue curve represents the transfer function in open-loop with low proportional gain without the
derivative term.
Green curve represents the transfer function in open-loop with low proportional gain and a
derivative term which produces a margin of 45°. With this result it is possible to deduce maximum
proportional gain.
Yellow curve represents the transfer function in open-loop with high proportional gain without
derivative term (same phase as blue curve). It is used to calculate margin correction at high
proportional gain.
Violet curve represents the transfer function in open-loop with high proportional gain and a
derivative term which produce a margin of 45°.
UV Recherche – 4ème
Année Génie Mécanique INSA Toulouse – 18 Juin 2011
8
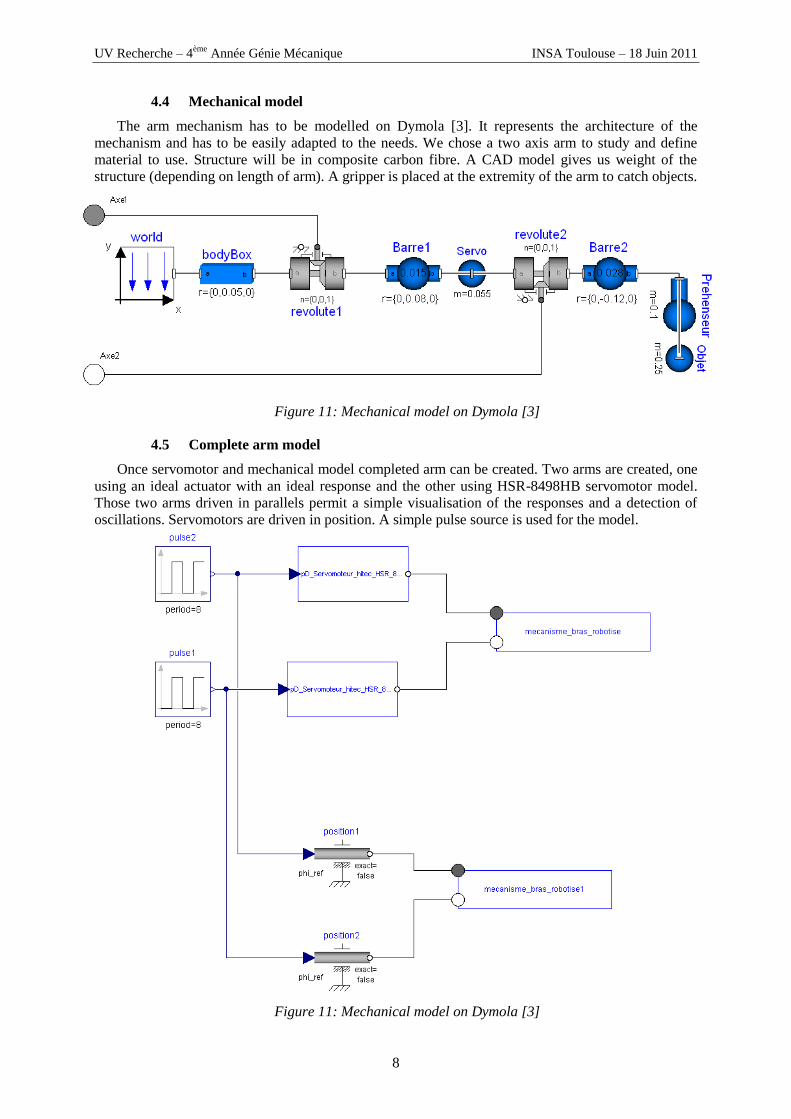
4.4 Mechanical model
The arm mechanism has to be modelled on Dymola [3]. It represents the architecture of the
mechanism and has to be easily adapted to the needs. We chose a two axis arm to study and define
material to use. Structure will be in composite carbon fibre. A CAD model gives us weight of the
structure (depending on length of arm). A gripper is placed at the extremity of the arm to catch objects.
Figure 11: Mechanical model on Dymola [3]
4.5 Complete arm model
Once servomotor and mechanical model completed arm can be created. Two arms are created, one
using an ideal actuator with an ideal response and the other using HSR-8498HB servomotor model.
Those two arms driven in parallels permit a simple visualisation of the responses and a detection of
oscillations. Servomotors are driven in position. A simple pulse source is used for the model.
Figure 11: Mechanical model on Dymola [3]
UV Recherche – 4ème
Année Génie Mécanique INSA Toulouse – 18 Juin 2011
9
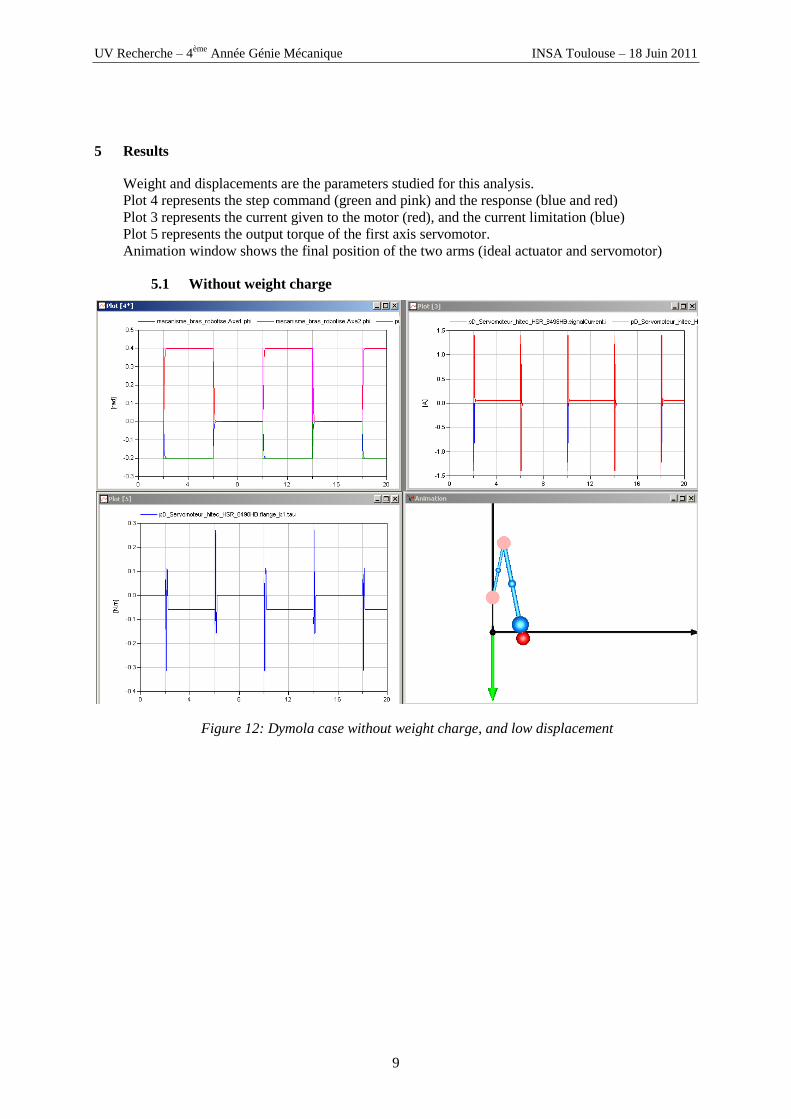
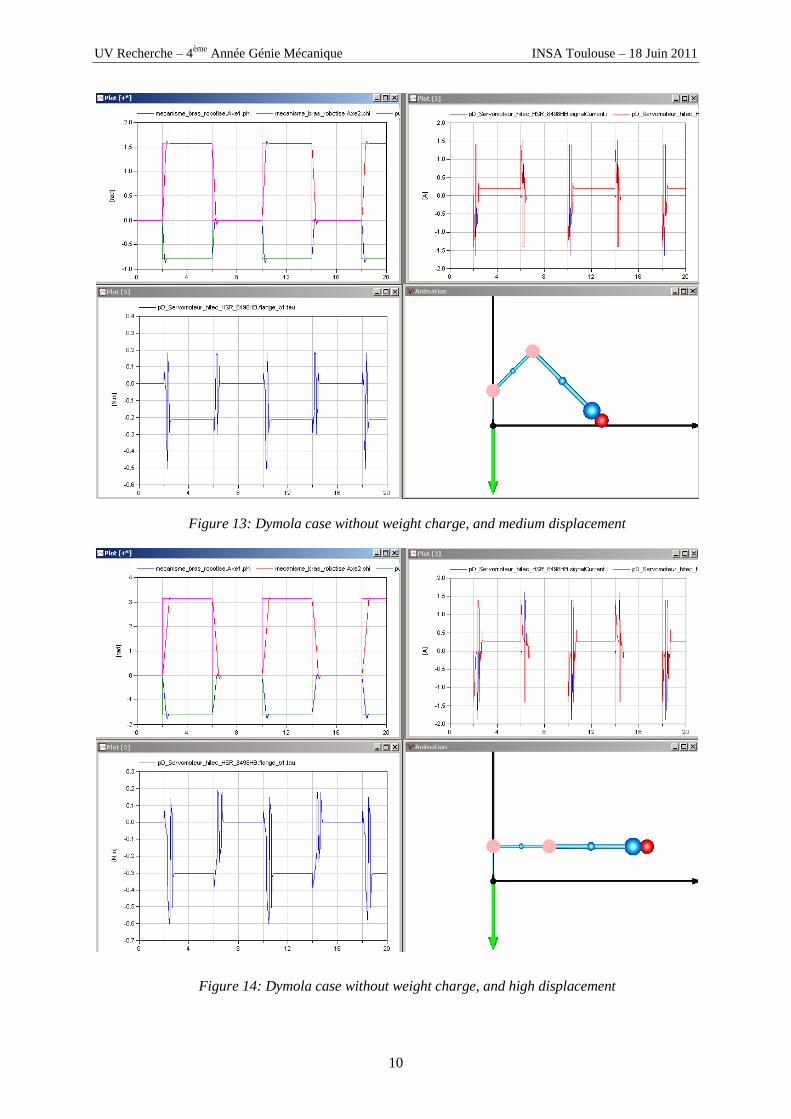
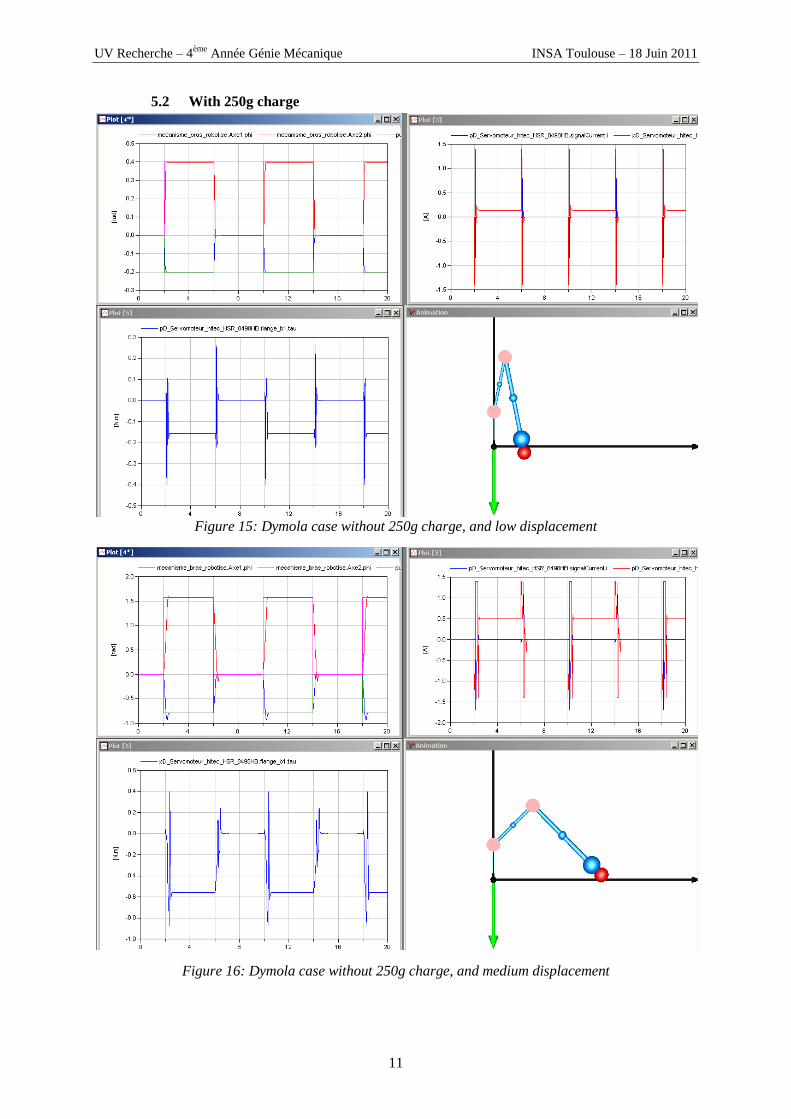
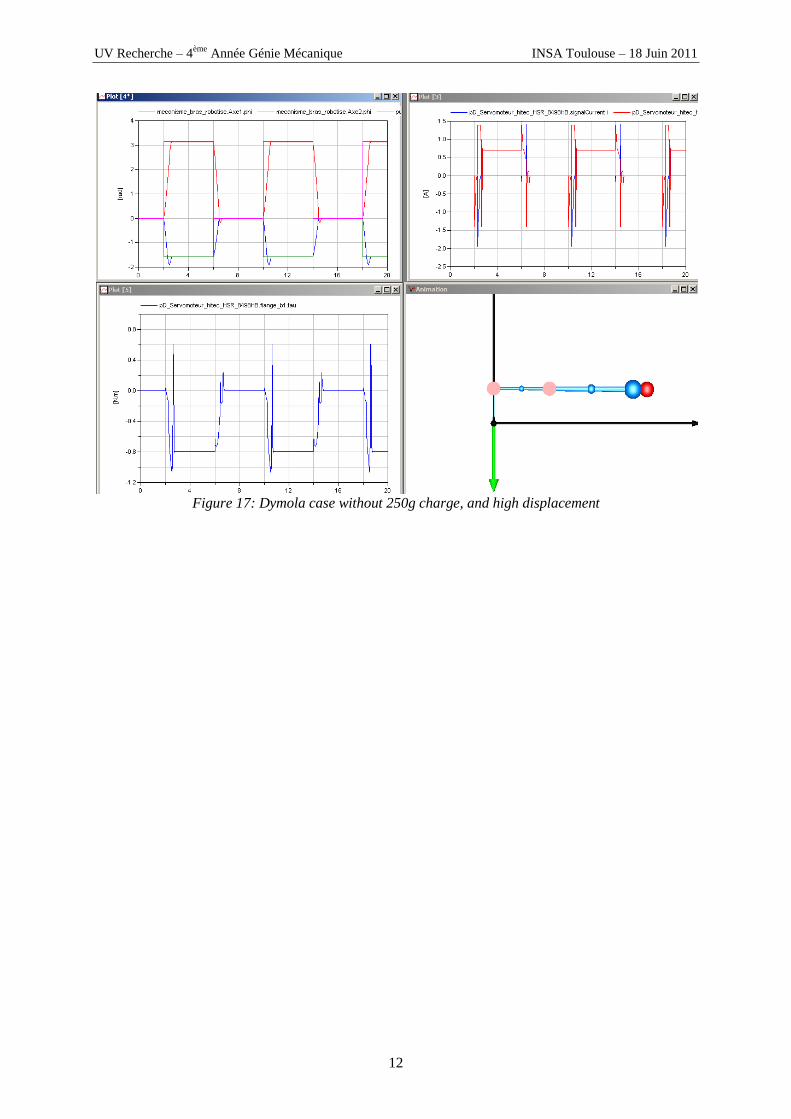
5 Results
Weight and displacements are the parameters studied for this analysis.
Plot 4 represents the step command (green and pink) and the response (blue and red)
Plot 3 represents the current given to the motor (red), and the current limitation (blue)
Plot 5 represents the output torque of the first axis servomotor.
Animation window shows the final position of the two arms (ideal actuator and servomotor)
5.1 Without weight charge
Figure 12: Dymola case without weight charge, and low displacement
UV Recherche – 4ème
Année Génie Mécanique INSA Toulouse – 18 Juin 2011
10
Figure 13: Dymola case without weight charge, and medium displacement
Figure 14: Dymola case without weight charge, and high displacement
UV Recherche – 4ème
Année Génie Mécanique INSA Toulouse – 18 Juin 2011
11
5.2 With 250g charge
Figure 15: Dymola case without 250g charge, and low displacement
Figure 16: Dymola case without 250g charge, and medium displacement
UV Recherche – 4ème
Année Génie Mécanique INSA Toulouse – 18 Juin 2011
12
Figure 17: Dymola case without 250g charge, and high displacement

UV Recherche – 4ème
Année Génie Mécanique INSA Toulouse – 18 Juin 2011
13
5.3 With 500g charge
Figure 18: Dymola case without 500g charge, and low displacement
Figure 19: Dymola case without 500g charge, and medium displacement

UV Recherche – 4ème
Année Génie Mécanique INSA Toulouse – 18 Juin 2011
14
Figure 20: Dymola case without 500g charge, and high displacement
6 Analysis
Model seems to fit with the reality but there is an overshoot on medium and high displacements.
Experiments have to be made on real servomotors to confirm this behaviour and by the way confirm
the use of a Proportional Derivative.
For 500g charge torque created by the charge is high and Proportional gain is not sufficient to
reduce steady-state error.
7 Improvement ways
This work is the first approach: it has to be improved to determine parameters more precisely and
to make the model more representative of the real components.
7.1 Servomotor parameters
- To determine the corrector type of the servomotor, tests have to be made. The first point is
measuring steady-state error for different weight charges. This test would determine if the
corrector is driven with an integrator.
- The second test is to determine the bandwidth. This analysis consists in commanding the
servomotor with a sinusoidal signal, and plotting the response.
- In this model, the motor parameter k was set by identification with another standard motor. It
has to be determined more precisely. This determination can be made by measuring the
voltage of the motor when the output is set at a constant speed that is to say use the motor as
generator.
- Like the parameter k, the inductance L was identified with a similar motor, but for more
precision it has to be measured directly.
UV Recherche – 4ème
Année Génie Mécanique INSA Toulouse – 18 Juin 2011
15
- The resistance is given in the servomotor datasheet, but it can be easily measured too.
7.2 To make the determination of the arm dimension easier
The design method proposed (Figure 3) imposes to determine the arm dimensions according to the
mission profile. For this task, a method can be prepared: there are relations between torques, lengths
and speed. For example, the two lengths of the arm affect the torque of the first servomotor, and the
length of the second part of the arm affects only the second actuator.
It can be useful to determine the law between lengths and torque, and plot the necessary torque of
the servomotors for different lengths. With the obtained graph, it can be easy to optimize the torque
repartition of the two servomotors. It would also be easy to design a system to discharge one of the
servomotors for example with spring.
7.3 Model
For now, the model is direct (the trajectory is calculated using the input command), and it would
be interesting to create inversed-model (the input is calculated using the needed trajectory). This
improvement will make easier the command or the arm, particularly if there is more than two liberty
degrees(DOF). One of the problems with the inversed-model is the non-bijection: for one position of
the arm end, there are multiple solutions.
ACKNOWLEDGEMENTS
We would like to thanks Marc Budinger for his help on this work. The Modelica model was created
for the members of INSA Toulouse Robotics Club, and may help other teams in robotic design and
sizing.
REFERENCES
Papers
[1] F.HOSPITAL, M.BUDINGER, J.LISCOUET, J-C MARE "Model Based Methodologies for
the Assessment of More Electric Flight Control Actuators", American Institute of
Aeronautics and Astronautics.
[2] M.BUDINGER, J.LISCOUET, Y.CONG, J-C MARE "Simulation based design of
electromechanical actuators with Modelica", Acts of: Proceedings of the ASME 2009
International Design Engineering Technical Conferences & Computers and Information in
Engineering Conference. IDETC/CIE 2009. August 30 – September 2, 2009, San Diego,
California, USA.
Software tools
[3] Dymola (Dynamic Modeling Laboratory), Dassault Systèmes. Simulation software for multi-
domain problems.
[4] Matlab Simulink, The MathWorks. Simulation software for mathematic simulation.
[5] CATIA (Computer-Aided Threedimensional Interactive Application) V5 R19, Dassault
Systèmes. CAD Software.
Top Related