


Langages
Pages
Légal


L’évolution récente
Guy WöppelmannUniversité de La Rochelle, LIENSs, France
du niveau de la mer :apports de
Plan: Introduction (Rappels, Contexte)Observations, causes et variabilitéTravaux récents avec le LAREGQuestions et perspectives
PPMD Forums ENSG, 9 Février 2010, Marne-la-Vallée
la géodésie spatiale

La Géodésie Décrire la forme et les dimensions de la planète Terre et de son
champ de pesanteur…
Crédits CLS

Le passé plus lointain… récent, contemporain

Les côtes européennesaujourd’hui
120 m plus bas
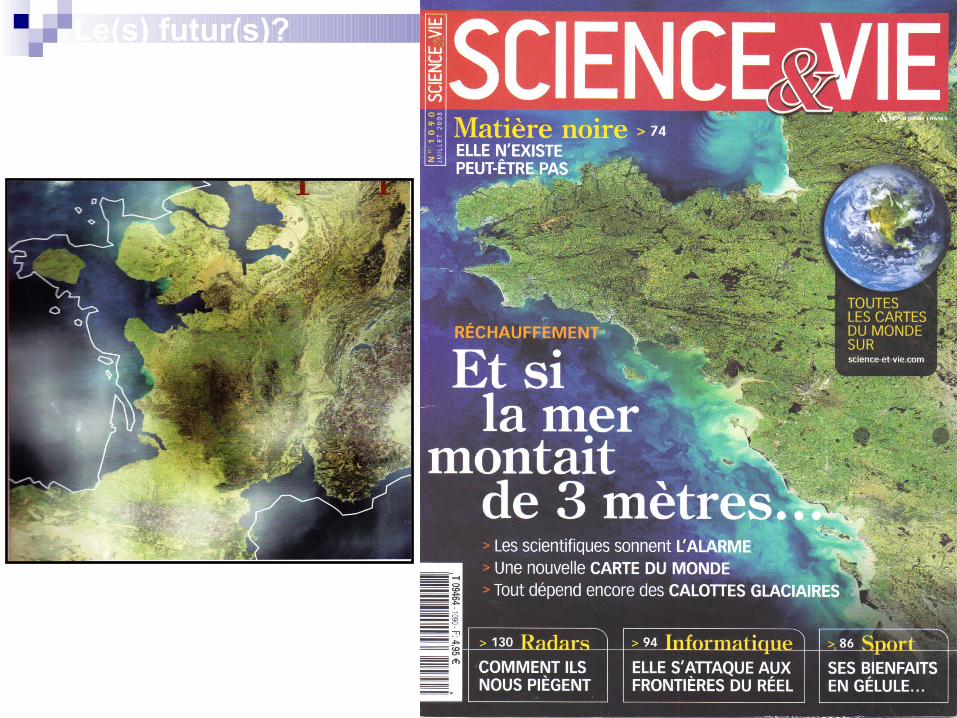
Le(s) futur(s)?

Prédictions de l’IPCC AR4 (2007) d’élévation du niveau moyen global de la mer pour la dernière décennie du 21e siècle / 1980-1999.
Scénarios d’émissions de gaz à effet de serre, de croissance de la population mondiale, de croissance économique…
Le futur proche: prédictions
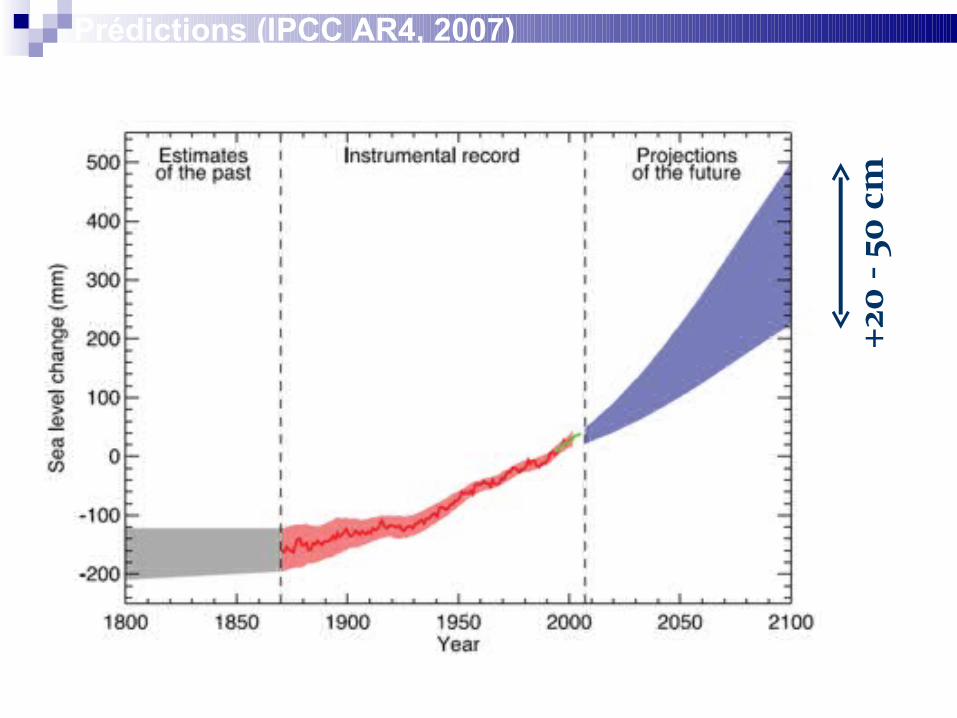
+20
- 50
cm
Prédictions (IPCC AR4, 2007)

Le futur plus lointain…

Observations et causesEffet stérique, 0.5+/-0.2mm/an
0.3+/-0.1mm/an
0.2+/-0.4mm/an
Effet eustatique glaciaire, 0.5+/-0.4mm/an
Effet eustatique humain, -0.35+/-0.75mm/an
0.7 +/- 1.5mm/an
Effet stérique, 0.5 ± 0.2 mm/an
0.3 ± 0.1 mm/an
0.2 ± 0.4 mm/an
Effet eustatique glaciaire, 0.5 ± 0.4 mm/an
Effet eustatique humain, -0.35 ± 0.75mm/an
- 0.7 ± 1.5 mm/an
1.5 ± 0.5 mm/an
“Sea level enigma” (Munk 2002)→ D’où viendrait l’élévation observée manquante?→ Comment prétendre prédire le futur si l’on n’explique pas le passé récent? (MWP 1a…)
Glacier Pasterze, Autriche

IPCC (2007)
IPCC (2001)
1.1 mm/yr1.8 mm/yr
Sum of climatic contributions to sea level rise: ~0.7mm/yr
“Sea-level enigma” (Munk 2002)
Analyses of tide gauge records ~1.5mm/yr
“Sea level enigma” (Munk 2002)
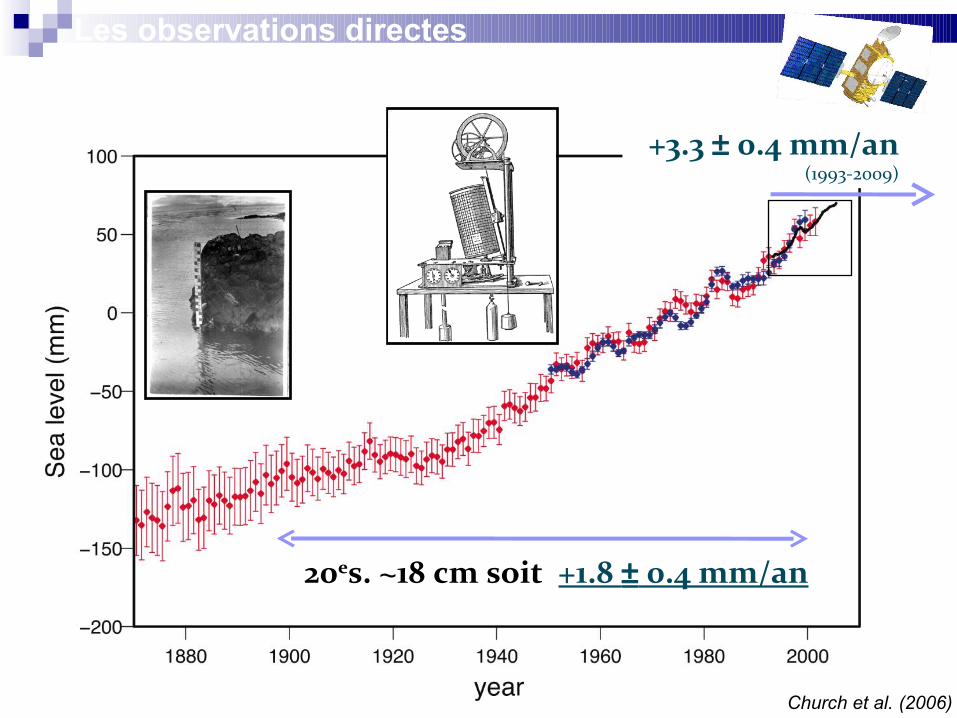
20es. ~18 cm soit +1.8 ± 0.4 mm/an
+3.3 ± 0.4 mm/an(1993-2009)
Les observations directes
Church et al. (2006)
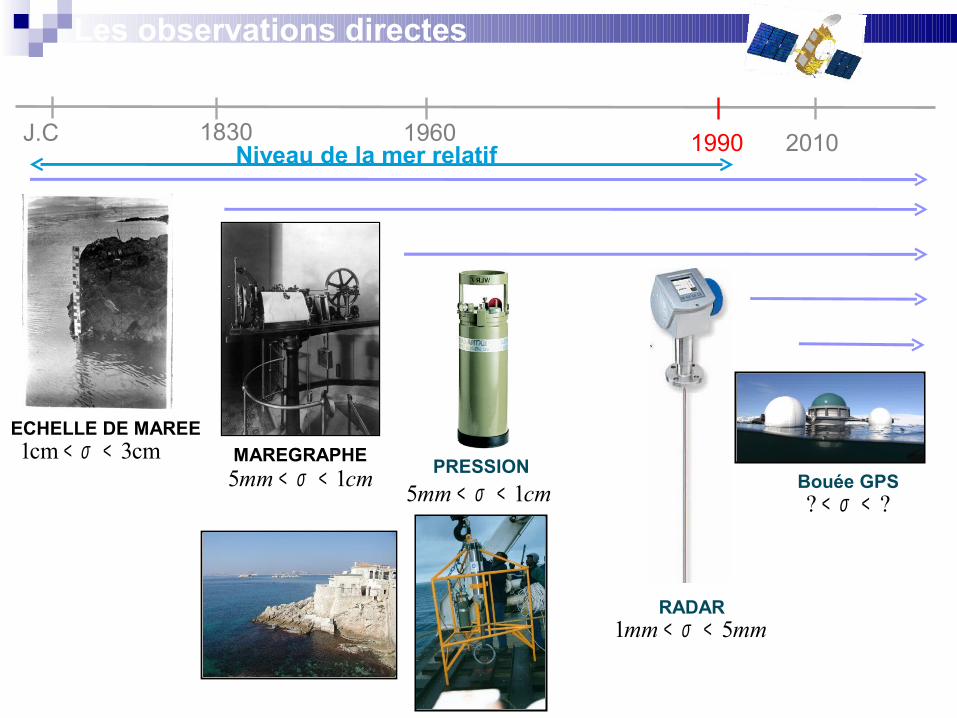
1830J.C 1960 1990
MAREGRAPHE
2010
ECHELLE DE MAREE
PRESSION
RADAR
Bouée GPScm3cm1 << σ
cmmm 15 << σ cmmm 15 << σ
mmmm 51 << σ
?? << σ
Niveau de la mer relatif
Les observations directes

heau = hsat. – (Rmes. – ∆Ratmos.)

Satellites PériodeSkylab (navette) 1973
GEOS 3 1975 – 1978SeaSat 1978 (3 mois)
GEOSAT 1985 – 1989ERS-1 1991 – 1996
TOPEX-POSEIDON 1992 – 2005ERS-2 1995 – 2003…GFO 1998 – 2008
JASON-1 Déc. 2001 – …ENVISAT Mars 2002 – …JASON-2 Juin 2008 – …
Altimétrie radar embarquée sur satellite
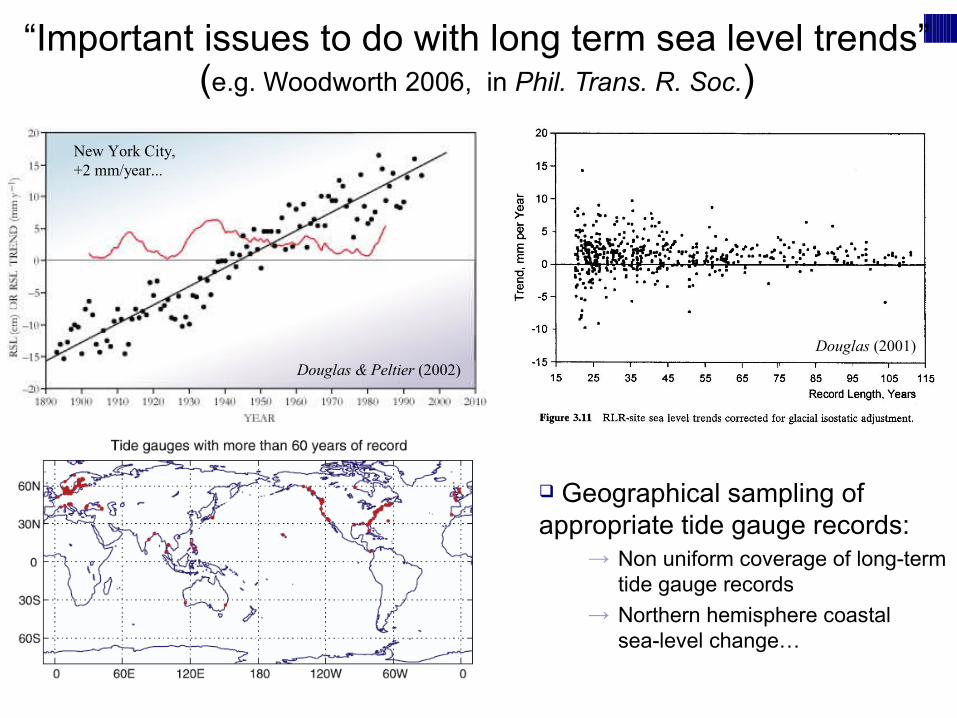
“Important issues to do with long term sea level trends” (e.g. Woodworth 2006, in Phil. Trans. R. Soc.)
Geographical sampling of appropriate tide gauge records:
→ Non uniform coverage of long-term tide gauge records
→ Northern hemisphere coastal sea-level change…
Douglas & Peltier (2002)
New York City,+2 mm/year...
Douglas (2001)

Variabilité temporelle

Variabilité spatiale
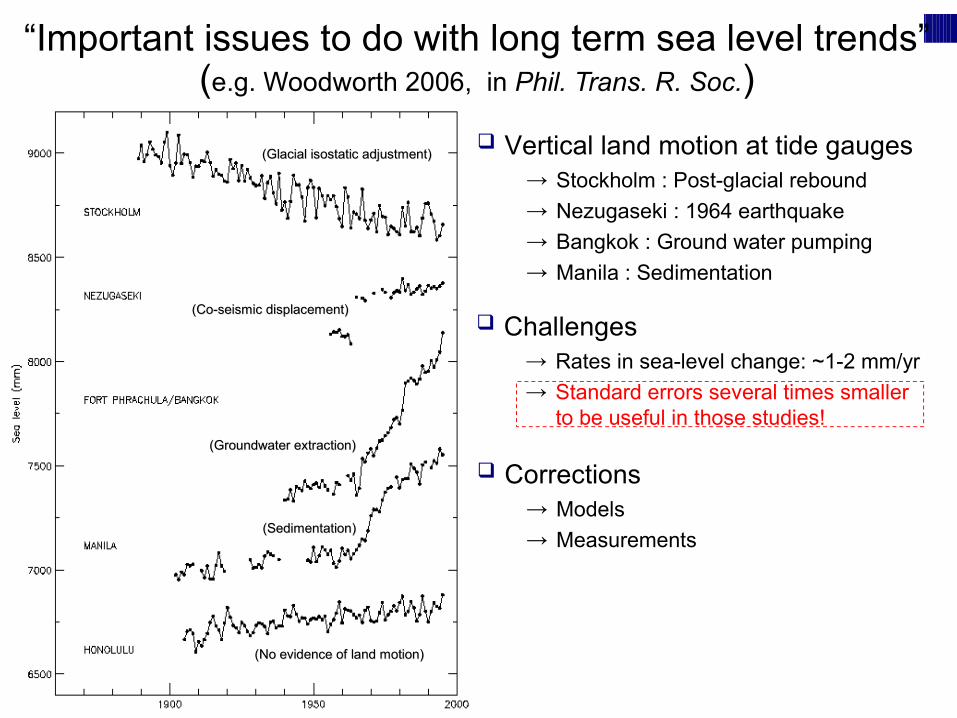
Vertical land motion at tide gauges→ Stockholm : Post-glacial rebound→ Nezugaseki : 1964 earthquake→ Bangkok : Ground water pumping→ Manila : Sedimentation
“Important issues to do with long term sea level trends” (e.g. Woodworth 2006, in Phil. Trans. R. Soc.)
Challenges→ Rates in sea-level change: ~1-2 mm/yr→ Standard errors several times smaller
to be useful in those studies!
(Glacial isostatic adjustment)(Glacial isostatic adjustment)
(Co-seismic displacement)(Co-seismic displacement)
(Groundwater extraction)(Groundwater extraction)
(Sedimentation)(Sedimentation)
(No evidence of land motion)(No evidence of land motion)
Corrections→ Models→ Measurements

Model corrections (GIA) Uncertainties in the main geophysical
parameters (lithospheric thickness, mantle viscosity…)
Imprecise knowledge of Earth’s ice history
What about other movements?
Corrections for vertical land motions at TGs
Measure (if one can…) Introduction of GPS in continuous
mode: CGPS@TG Need for a stable and accurate
reference frame

“Tide Gauge Benchmark Monitoring” 103 TOS, 2 TDC, 6 TAC, TAAC (?)
Goals Establish, maintain and expand a global
cGPS@TG network Compute precise station parameters for the
cGPS@TG stations with a high latency Reprocess all previously collected GPS data,
if possible back to 1993 Promote the establishment of links to other
geodetic sites (DORIS, SLR, VLBI,… AG)
(Initiated in 2001, on a best-effort basis)http://adsc.gfz-potsdam.de/tiga/index_TIGA.html
The TIGA pilot project (IGS)
ETG
AUT
DGF
GFTCTA ULR

Total # of GPS stations: 225 IGS05 stations: 91 Time span: 1997.0 - 2006.9 205 time series > 3.5 years 160 are co-located with TG 90 CGPS@TG are not IGS
Participation ULR: Centre d’analyses IGS (TIGA)
Motivation for global GPS reprocessing→ To use the best available data and most accurate
models to reduce errors in the estimates of coord.→ To use them all over the data span (models,
parameterization…) in order to derive consistent sets of station coordinates and to limit spurious signals in their time series
4ème génération de solution Thèse A. SantamariaPériode 1996-2008 (13 ans)310 stations GPS dont216 CGPS@TG

Working hypotheses1. Land movements are linear over the tide gauge records length 2. GPS antenna vertical movement ↔ Tide gauge land movement
Geological evidence tectonically active zones…
Indirect evidence (Douglas, 2001):
Additional issues to do with cGPS@TG

Working hypotheses1. Land movements are linear over the tide gauge records length 2. GPS antenna vertical movement ↔ Tide gauge land movement
Some examples…
Additional issues to do with cGPS@TG
Local land motion monitoring (stability) geodetic link between GPS antenna and TGBM ancillary local information (equipment changes, topography…)
specially, if the GPS was not installed for sea level studies! Douglas (2001) criteria…

GPS velocities at TG... How well do they work?
For details: Wöppelmann et al. (2009) in Geophys. Res. Lett. Also, paper published in Global and Planetary Change (2007)
ICE5Gv1.2 + VM4 models(Peltier 2004)
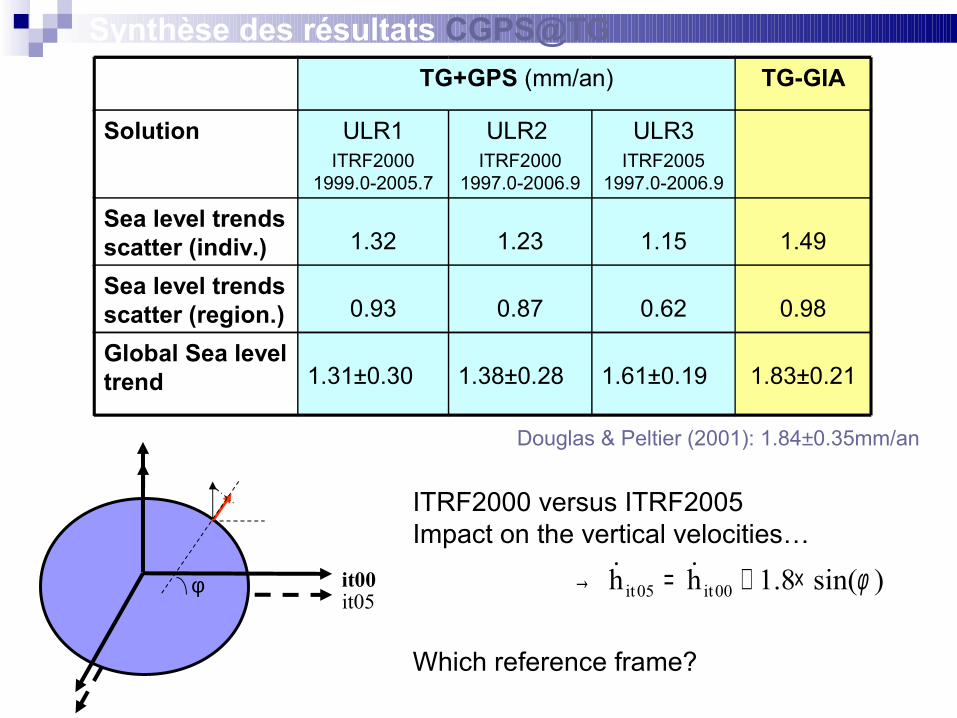
ITRF2000 versus ITRF2005Impact on the vertical velocities…
Which reference frame?
Synthèse des résultats CGPS@TGTG+GPS (mm/an) TG-GIA
Solution ULR1ITRF2000
1999.0-2005.7
ULR2 ITRF2000
1997.0-2006.9
ULR3ITRF2005
1997.0-2006.9
Sea level trends scatter (indiv.) 1.32 1.23 1.15 1.49
Sea level trends scatter (region.) 0.93 0.87 0.62 0.98
Global Sea level trend 1.31±0.30 1.38±0.28 1.61±0.19 1.83±0.21
Douglas & Peltier (2001): 1.84±0.35mm/an
it05it00φ )sin(8.1hh 00it05it φ×+=→
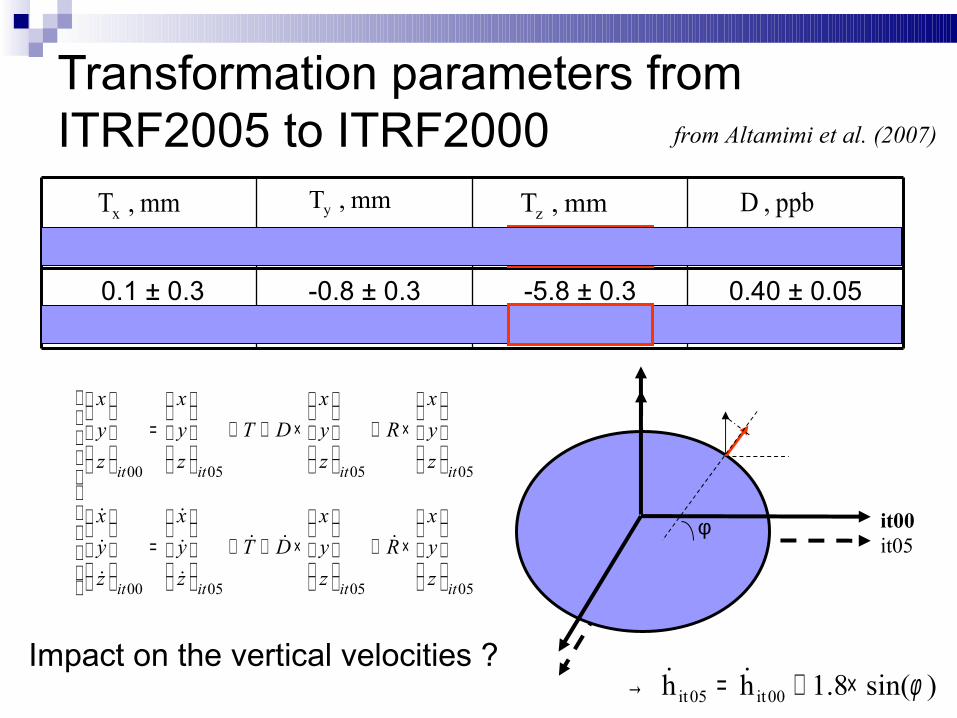
0.40 ± 0.050.08 ± 0.05
-5.8 ± 0.3-1.8 ± 0.3
-0.8 ± 0.3 0.1 ± 0.3
0.1 ± 0.3-0.2 ± 0.3
Transformation parameters from ITRF2005 to ITRF2000 from Altamimi et al. (2007)
×+
×++
=
×+
×++
=
05050500
05050500
itititit
itititit
zyx
Rzyx
DTzyx
zyx
zyx
Rzyx
DTzyx
zyx
yr/mm,Tmm,T
x
x
yr/mm,T
mm,T
y
y
yr/ppb,Dppb,D
yr/mm,T
mm,T
z
z
)sin(8.1hh 00it05it φ×+=→
it05it00φ
Impact on the vertical velocities ?

Impact sur les vitesses verticales
)sin(8.1hh 00it05it φ×+=→
ITRF2000 versus ITRF2005 datum

-0.1 ± 0.2-0.3 ± 0.2-0.8 ± 0.2 0.5 ± 0.2-8.1 ± 0.2-1.7 ± 0.2
0.89 ± 0.030.13 ± 0.03
-0.041±0.007-0.004±0.007
0.023±0.007-0.003±0.007-0.052±0.008-0.010±0.008
yr/mm,Tmm,T
x
x
yr/mm,T
mm,T
y
y
yr/mm,Tmm,T
z
z
yr/ppb,Dppb,D
yr/mas,Rmas,R
x
x
yr/mas,R
mas,R
y
y
yr/mas,Rmas,R
z
z
Transformation parametersestimated from our GPS solutions (ITRF2005 → ITRF2000)
~ 0.83 mm/yr
ITRF2000 versus ITRF2005 datum

ITRF2000 versus ITRF2005Impact on the vertical velocities…
Which reference frame?
Synthèse des résultats CGPS@TGTG+GPS (mm/an) TG-GIA
Solution ULR1ITRF2000
1999.0-2005.7
ULR2 ITRF2000
1997.0-2006.9
ULR3ITRF2005
1997.0-2006.9
Sea level trends scatter (indiv.) 1.32 1.23 1.15 1.49
Sea level trends scatter (region.) 0.93 0.87 0.62 0.98
Global Sea level trend 1.31±0.30 1.38±0.28 1.61±0.19 1.83±0.21
Douglas & Peltier (2001): 1.84±0.35mm/an
it05it00φ )sin(8.1hh 00it05it φ×+=→

Quel repère ? (Collilieux & Wöppelmann, soumis)
Critères de Douglas (2001)- Séries marégraphiques > 60 ans- 85% de données valides- Groupement régionaux- Prédictions GIA (Peltier 2001)
Wöppelmann et al. (2009)- Marégraphes (80 ± 17 ans)- Corrections GPS (8 ± 2 ans)- 27 stations dans 10 régions (idem pour Douglas, 2001)
ITRF2005
1.59 ± 0.09 mm/an
0.51 mm/an
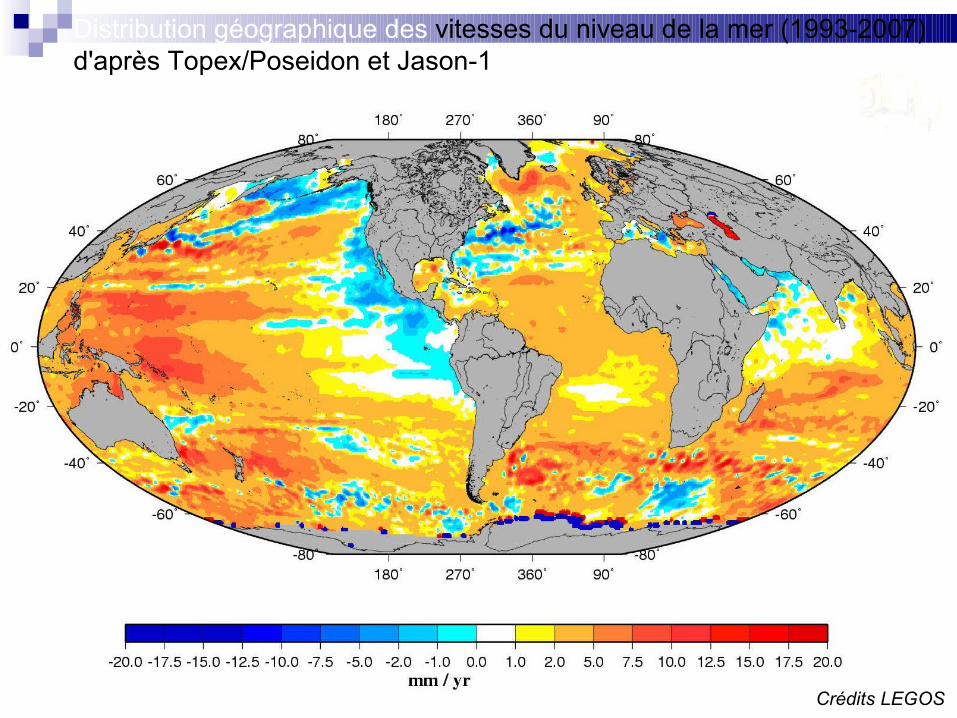
Distribution géographique des vitesses du niveau de la mer (1993-2007)d'après Topex/Poseidon et Jason-1
Crédits LEGOS
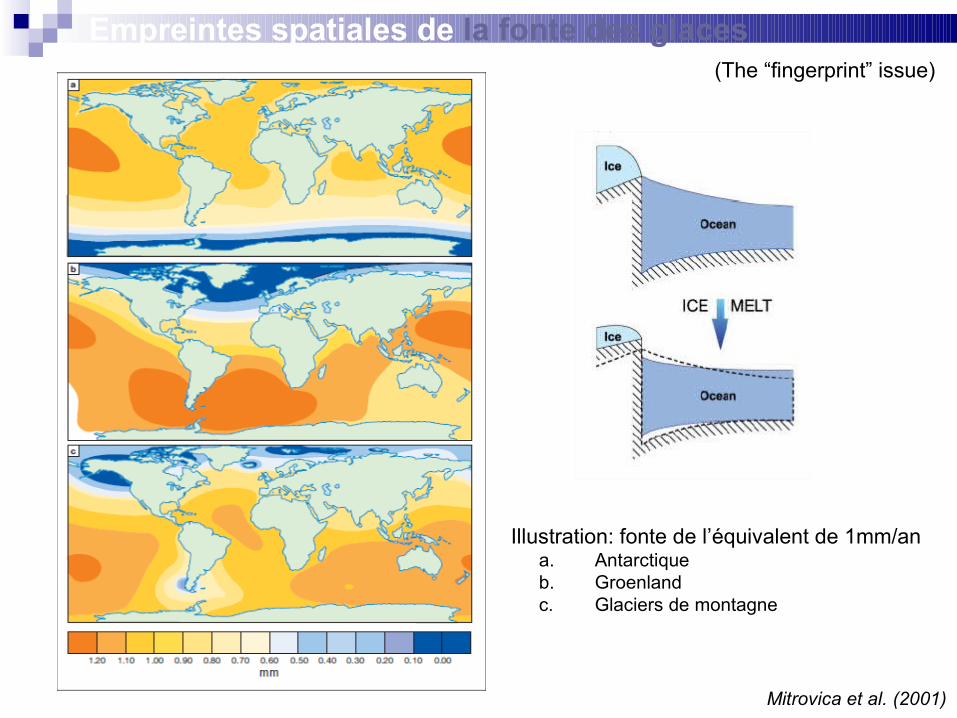
Empreintes spatiales de la fonte des glaces(The “fingerprint” issue)
Mitrovica et al. (2001)
Illustration: fonte de l’équivalent de 1mm/ana. Antarctiqueb. Groenlandc. Glaciers de montagne

Empreintes spatiales: évidence observationnelle?
From Ishii et al., 2006
Motivation:• Observational evidence of glacial melting fingerprints (theoretical predictions)?Douglas 2008 in JCR.
Projet CECILE (ANR):• Extended dataset (WP1, WP2, WP3, WP4)• Reduced noise (WP1, WP2, WP5)• Robust trends and errors (WP1, WP2, WP5)
Une complexité accrue…
Mitrovica et al. (2001)

From Haigh et al. 2009
Projet ANR/CEP « CECILE »

Thèse A. Santamaria et Centre d’analyses ULR
Griffiths et al. AGU 2009

+0.4 (1.6) mm/yr
+0.7 (1.2) mm/yr
+1.1 (2.8) mm/yr +1.8 (3.1) mm/yr
IPCC report (2007)
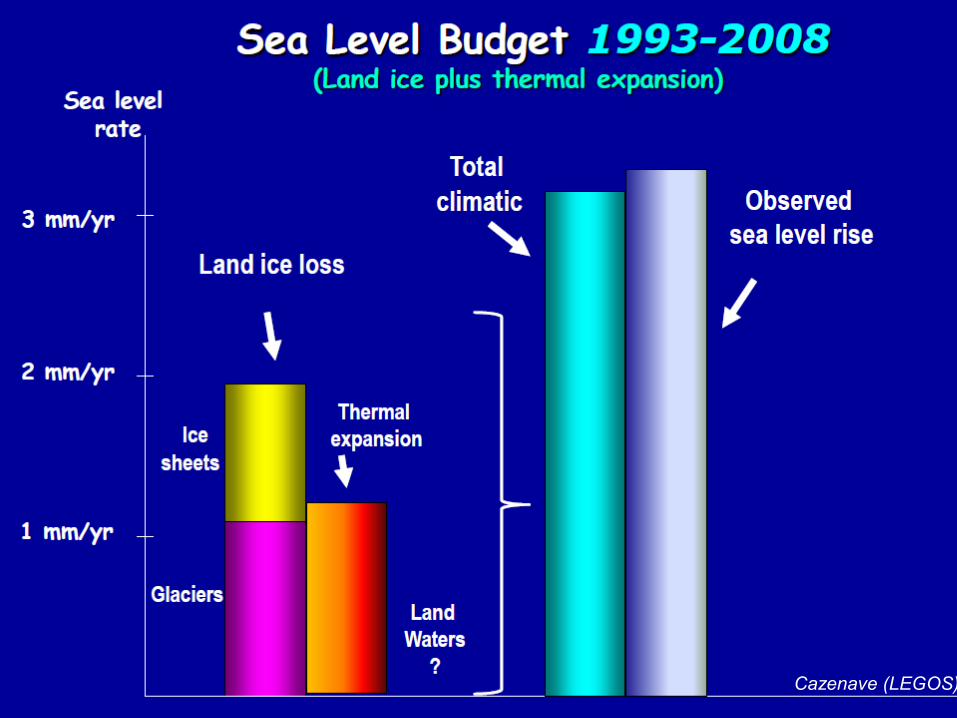
“Sea-level enigma” (Munk 2002):→ Contributions climatiques: 0.7 mm/yr→ Observations: 1.5 mm/yr Cazenave et al. (2008) ?
→ 1993-2008: +3.1±0.4 mm/yr (altimétrie radar, 15 ans)♦ +1.5±0.3 mm/yr (1993-2003): effet stérique♦ +0.80±0.17 mm/yr (1993-2003): glaciers alpins ♦ +0.20±0.04 mm/yr (1993-2003): Groënland♦ +0.21±0.17 mm/yr (1993-2003): Antarctique♦ +0.20±0.10 mm/yr (2003-2006): Land waters
→ 1955-2003: +1.7±0.4 mm/yr (marégraphes, 50 ans)♦ +0.2-0.4 mm/yr: effet stérique♦ +0.5 mm/yr: glaciers alpins
+2.9±0.5 mm/yr(3.0 ±0.5 mm/yr)
+0.4±0.2 mm/yr
+3.4±0.4 mm/yr (GIA corrected)
Retour sur le paradoxe de Munk (2002)
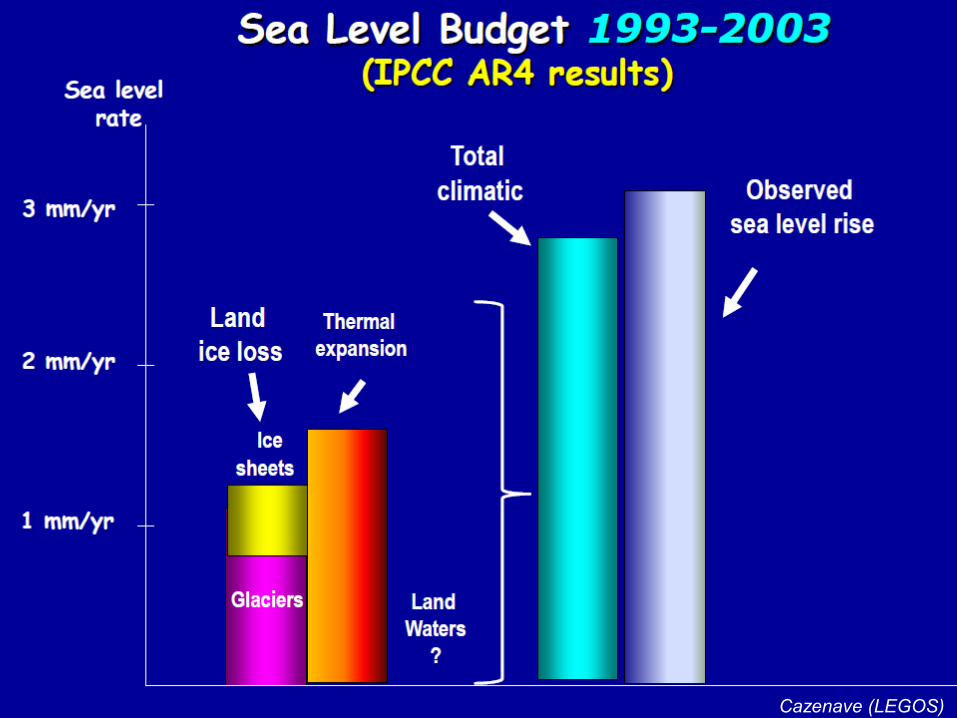
Cazenave (LEGOS)
Cazenave (LEGOS)
Merci…
Top Related