


Langages
Pages
Légal

Süleyman Demirel Üniversitesi İktisadi ve İdari Bilimler Fakültesi Dergisi Y.2015, C.20, S.4, s.179-196.
Suleyman Demirel University The Journal of Faculty of Economics
and Administrative Sciences Y.2015, Vol.20, No.4, pp.179-196.
179
COMPARISON IN TRADE OUTCOME PERFORMANCE BETWEEN THE
EUROPEAN UNION MEMBERSHIP CANDIDATE COUNTRY - TURKEY
AND EUROPEAN UNION MEMBER COUNTRIES
AVRUPA BİRLİĞİNE ADAY ÜLKE TÜRKİYE VE AVRUPA BİRLİĞİNE
ÜYE ÜLKELER ARASINDAKİ TİCARET GELİR PERFORMANSININ
KARŞILAŞTIRILMASI
Phd. Stud. Kokou ADALESSOSSI 1
Phd. Stud. Neylan KAYA 2
ABSTRACT
Turkey, as a membership candidate country to the European Union(EU) and as a developing
country, has a significant effect in European trade-related trade’s policies. In this regard, Turkey's
trade performance in term of outcome compared to other European Union member’s countries has
also a remarkable importance. The purpose of this study is to compare Turkey’s trade performance
with the 28 member countries of the European Union, to find out which of them are similar or
different (remote) from Turkey’s. The data set for this study was taken from the World Bank’s web
site. To perform this paper Multidimensional scaling analysis(MDS) was used to reveal similarities
or differencies between countires. The empirical results from this study reveals that Turkey is closer
to some European Union member’s countries such as Germany (the biggest economy country in EU),
Romania, and Latvia and far from the United Kingdom, Ireland and Belgium.
Key Words: EU, Turkey, Trade outcome performance, World Bank, Multidimensional Scaling
Jel Codes: F10, F11, F14.
ÖZET
Türkiye, Avrupa Birliği(AB)’ne aday olan ve gelişmekte olan bir ülke olarak Avrupa Birliği’nin
ticaretle ilgili politikalarında önemli bir etkiye sahiptir. Bu bakımdan Türkiye’nin diğer Avrupa
Birliği ülkelerine oranla ticaret performansının da kayda değer bir öneme sahip olduğu
görülmektedir. Bu çalışmanın amacı, Avrupa Birliği’ne üye olan 28 ülke ile aday olan Türkiye’nin
ticaret performansları bakımından hangi ülkelerle benzer, hangi ülkelerden farklı olduğunu
belirlemektir. Avrupa Birliği’ne üye olan ülkelerle Türkiye’nin ticaret performansını
karşılaştırabilmek için gerekli veriler dünya bankasından alınmıştır. Çalışmanın analizinde; sosyal
bilimlerde yaygın olarak kullanılan, çok boyutlu uzayda verilerin ilişki yapısını grafiksel olarak
ortaya koyarken birimler arasındaki benzerlikleri ya da farklılıkları dikkate alan çok boyutlu
ölçekleme analizi kullanılmıştır. Bu çalışmanın sonucunda Türkiye’nin ticaret gelir performansı
bakımından Avrupa Birliği üyesi Almanya, Romanya ve Litvanya ile benzer iken İngiltere, İrlanda ve
Belçika’dan uzak olduğu sonucuna ulaşılmıştır.
Anahtar Kelimeler: AB, Türkiye, Ticaret performansı, Dünya Bankası, Çok boyutlu ölçekleme analizi
Jel Kodları: F10, F11, F14.
1 Akdeniz University, Faculty of Economics and Administrative Sciences, Department of Business
Administration, [email protected]. 2 Süleyman Demirel Üniversitesi, Faculty of Economics and Administrative Sciences, Department of Business
Administration, [email protected]
ADALESSOSSI – KAYA
180
2015
1. INTRODUCTION
This study aims to determine which of the 28 EU member countries have similar trade
performances with Turkey and which of them do not.While comparing the trade
performance of EU member countries and Turkey,it is beneficial to examine ;trade with in
EU,trade with in Turkey,trade relations between Turkey and EU and the status of the
international trade in world market.
1.1. European Union’s Trade
The Union is one of the world’s most outward-oriented economies and intends to remain
so. Trade with the restof the world doubled from 1999 to 2010, and currently almost three
quarters of imports into the EU pay no, or reduced, duties. Where duties are still payable,
the average rate in 2012 was just 1.6 % for industrial products and 4 % for all goods
overall. The EU is the biggest trading partner for 80 countries including Turkey. EU’s trade
key figures13 in these last times were as follows: EU share of world exports and imports:
17.2 % in 2011, Foreign direct investment in EU accounted for €3 807 billion in 2011, EU
outbound foreign direct investment accounted for €4 983 billion in 2011, Manufacturing
trade surplus, oil excluded: accounted for almost €300 billion in 2012; Services trade
surplus accounted for €120 billion in 2011 and EU development aid accounted for €53
billion in 2012
1.2. Turkey’s Trade
At the beginning of 1980s, a more liberal trade regime has been taken in Turkey. The main
objective of this regime was to promote export and to encourage private sector attending
the regime. Together with Turkey, many Middle East and North African (MENA) countries
have experienced a considerable progress in liberalization. On the other hand, Central and
East European Countries (CEECs), Russian Federation and Turkic Republics have
transformed from planned economy to capitalist and more liberal economy. They are still
on the way of this severe transformation progress. Turkey is a candidate country and a
strategic partner for the European Union. Turkey, with its large, dynamic economy, is an
important trading partner for the EU and a valuable component of EU competitiveness
through the Customs Union. Turkey has a strategic location, including energy security, and
plays an important regional role.
On the other hand Turkey will progressively adjust any state monopoly of a commercial
character so as to ensure that no discrimination exists in the conditions under which goods
are produced or marketed between nationals of EU member countries and Turkey. Turkey
has harmonised its laws with EU legislation eliminating technical barriers to trade. There is
now effective co-operation between Turkey and the EU in the fields of standardisation,
calibration, quality, accreditation, testing and certification. Turkey has also harmonised its
legislation on intellectual, industrial and commercial property to EU standards and has
implemented laws covering consumer protection, and the protection of competition. Both
sides are banned from using internal taxes as indirect protection mechanisms and from
using tax rebates as export subsidies:
1.3. EU and Turkey trade relation fields
The Positive Agenda launched in 2012 continued to support and complement the accession
negotiations through enhanced cooperation (EU 2013 Progress Report on Turkey) in a
number of areas of joint interest: political reforms, alignment with the acquis, dialogue on
foreign policy, visas, mobility and migration, trade, energy, counter-terrorism and
3 EU trade: http://ec.europa.eu/trade
Comparison In Trade Outcome Performance Between The European Union
181
C.20, S.4
participation in EU programs. The Commission assessed progress made in the framework
of the working groups and informed Turkey and the Member States which benchmarks it
considers to be met. The Commission also acknowledged progress achieved on important
requirements as regards the judiciary and fundamental rights. It is clear that the Customs
Union had a certain impact on the increase in imports. Turkey’s export to the EU totalled
$11.5 million; an increase of 3.7%, below the 7.4% increase in total exports. This is due to
the economic stagnation in continental Europe, especially in Germany, because Germany
has the biggest share of Turkey‘s exports in the EU. Meanwhile, export of textile Turkey’s
most competitive sector, also increased by only 4.2%. EU countries have always played an
important role in the foreign trade of Turkey, having a share of over 45-50% in the overall
trade. Especially the adoption of Turkish economy to EU’s competition affects an increase
in Turkish production quality and it improves the trade between Turkey and EU. Bilateral
trade between the EU and Turkey totaled €123 billion in 2012. Turkey continues to be the
EU’s sixth biggest trading partner, while the EU is Turkey’s biggest. 38% of Turkey’s total
trade is with the EU and almost 71% of foreign direct investment in Turkey.
1.4 World trade
The pace of global trade integration over the past two decades has been nothing short of
extraordinary. Developing countries have been the biggest beneficiaries of trade expansion
and the pursuit of“export-led” growth. But leveraging trade for broad-based economic
growth is no simple matter—some paths may be better than others, and different countries
have had varying degrees of success in achieving this. While the rapid expansion of trade in
recent decades was supported by trade policy reforms across the globe, improved market
access has not translated into sustainable export growth and diversification for many
developing countries. At the same time, in high-income countries (World Bank,2010) that
have benefited greatly from an open trading system, trade with developing nations is often
viewed more as a threat than as an opportunity. Clearly, openness to trade and low levels of
trade protection, although necessary and important, is not sufficient to ensure sustained
export growth and greater diversification. The recent global crises and associated policy
responses have shown that most countries remain strongly committed to trade integration,
but complementary policies are critical to manage adjustment costs and the effects of
volatility. Reflecting this, in recent years the focus of governments has turned toward a
broader “trade competitiveness” agenda, aimed at addressing supply-side constraints to
investment and trade expansion as well as ensuring an open trade regime. Trade
competitiveness is a core pillar of the World Bank’s new Trade Strategy, and is also an
important dimension of its approach to private sector development(World Bank,2010).
Foreign trade is considered as an essential factor for accelerating the path of economic
growth. Most countries are involved in foreign trade to create employment, raise propensity
to save, increase foreign exchange earnings, and raise the productivity of investment
moving from less productive use to high productive use. Foreign trade has been regarded as
an engine of growth, lead to steady improvement in human status by expanding the range of
people’s standard and preference. Since no country has grown without trade, foreign trade
plays a vital role in restructuring economic and social attributes of countries around the
world. Experience of economies suggesting that countries which are active at the
international exchanges tend to be more productive compared to the countries that produce
only for the domestic market. Hence, considering the above, a study on comparing
Turkey’s trade performance to that of the European Union member countries, especially on
the trade outcome performance, will show the similarities between them.

ADALESSOSSI – KAYA
182
2015
The aim of this study is to compare the trade outcome performance of the 28 European
Union member countries with that of its membership candidate country, Turkey, in order to
determine differences among countries. To reach the goals of this study, we would ask the
following questions: What is the position of Turkey, in trade outcome performance
compared to European Union countries? In other words, which European Union member
countries are in the same group with Turkey? Which variables are considered? Which
countries are most remote or far away? To reach this objective, we will use
Multidimensional Scaling analysis to find out the position of EU membership candidate
country, Turkey, with the twenty height member countries of EU in term of trade outcome
performance.
The paper consists of five sections. The second section presents the literature review, the
third section presents the data and methods and the fourth section the empirical Results and
Discusion before to conclude in the fith section.
2. THE LITERATURE REVIEW
The effect of foreign trade on economic growth, empirically, has been an important and
controversial subject for several decades. A number of studies, using different approaches,
have found growth to be enhanced by trade openness, or liberalization (Krueger, 1978;
Feder, 1983; Ram, 1985 and 1987; Balassa, 1978 and 1985; Dollar, 1992; Edwards, 1998;
Ben-David et al., 2000; among others). On the other hand, some studies like Singer (1950),
Prehisch (1962), Kavoussi (1985), Singer and Gray (1988), Sachs (1987 and 1989) and
Taylor (1991) have argued that trade or trade expansion may not be beneficial for the
economic growth of all countries at all times. Goldberg and Pavcnik (2007) investigate the
relationship between trade and income growth in developing countries and conclude that
globalization benefits are country, time, and case specific. Rodriguez and Rodrik (2001)
analyze the relationship between trade policies, trade volume, and output growth and find
no substantial evidence to suggest trade increases economic growth. In fact, the conclusions
in past literature regarding empirical benefits from international trade are mixed. Some of
empirical studies on the relationship between export and economic growths have found
export growth to be associated with increase in output or GDP (Michaely, 1977; Tyler,
1981 and Balassa (1985). Michaely (1977) used simple regression and correlation analysis
to investigate the relationship between exports and growth. They found that in less
developed countries, there was a weak correlation. They, however, raised an important
issue to determine the minimum level of development a country has to attain in order to
benefit from trade. Jiles and Williams (2000) noted that not all authors support export-led
growth theory because of the vast empirical differences between the growth in the East and
Southeast Asian countries and Latin America. Panas and Vamvoukas (2002) showed that
the export led growth is not valid in the case of Greece and findings suggest a strong and
consistent causation from output growth to export performance in long run. Frankel and
Romer (1999) found significant impact of trade openness on level of per capita income.
They argued that trade possibilities enhance growth through greater capital stock, stock of
education and higher total factor productivity. They, however, warned explicitly against
drawing inferences for trade policies based on their results as it brings different factors into
play. However, the empirical analysis of the relationship between trade openness and
economic growth has generated mixed results.
Some studies also argued that foreign trade impacts the economic growth of countries
through the attraction of foreign direct investment (FDI). According to Lall (2000) and Te
Velde (2001), the main channels through which FDI contributes to economic growth are

Comparison In Trade Outcome Performance Between The European Union
183
C.20, S.4
technology transfer, capital accumulation, access to international market, job creation and
managerial and marketing practices; and Blomstrom and Kokko (2003) added that trade
and FDI can only facilitate growth after the minimum level of human capital, infrastructure
and technology have been met. Kruger (1983) states that decrease in imports of capital
goods declines the GDP growth rate and in contrast, decrease in import of raw materials
and intermediate goods, has positive impact on production and employment. Coe and
Helpman (1995) using time-series data show that trade affect economic growth positively
through technological transfer. Levine and Renelt (1992) and Wacziarg (2001) showed that
international trade influences growth through investment (factor accumulation).Frankel and
Romer (1999) specifically found trade to influence growth through human capital
accumulation.
3. DATA AND METHODS
3.1 Data
The original data was taken from the World Bank data base published in 2010, concerning
trade outcome performance of 148 different countries from 2006 to 2009. According to
World Bank, there were five indicators of trade performance such as: Trade Policy,
External Environment, Institutional Environment, Trade Facilitation and Trade Outcome.
For this paper, we choose outcome indicator that constitutes the final palpable result of the
four first indicators and that can judge countries in term of returns of their trade activities
that constitutes the bedrock of their economic growth.
3.2 Methods
Multidimensional Scaling (MDS) method was used to perform this paper.
Multidimensional scaling (MDS) is a means of visualizing the level of similarity of
individual cases of a dataset. It refers to a set of related ordination techniques used in
information visualization, in particular to display the information contained in a distance
matrix. An MDS algorithm aims to place each object in N-dimensional space such that the
distances between the objects are preserved as well as possible. Each object is then assigned
coordinates in each of the N dimensions. The number of dimensions of an MDS plot N can
exceed 2 and is specified a priority. Choosing N=2 or 3 optimizes the object locations for a
two- or three dimensional scatter plot .
The usage of MDS in data analyses has several advantages. Namely, MDS is an extremely
flexible technique, one that can model non‐linear relationships and is not bound by the
numerous assumptions associated with general linear models or even with factor analyses.
MDS also known as perceptual mapping is a procedure that allows a researcher to
determine the perceived relative image of a set of objects (firms, products, ideas, or other
items associated with commonly held perceptions).
The multidimensional scaling solvable general purpose with minimum size must reveal that
objects structure (using the distance values) is closed to its original shape. The MDS,
Clusters and discriminant analysis are like one of Q analysis techniques, also due to the size
reduction feature; R is located between analysis techniques (Tatlidil, 2002:353).
To perform a MDS analysis of data within SPSS there are a three main options; the
ALSCAL, the PROXSCAL and PREFSCAL procedures. As Leydesdorff and Vaughan
(2006) state, ‘the ALSCAL procedure assumes that the input is a dissimilarity matrix,
PROXSCAL allows one to specify whether the proximities are similarity or dissimilarity
measures’, while PREFSCAL minimizes penalized Stress, an approach that successfully

ADALESSOSSI – KAYA
184
2015
avoids degenerate solutions in most circumstances(Frank M.T.A. Busing, Leiden
University). PREFSCAL aims at the same functionality as PROXSCAL.
Multidimensional scaling is often used in marketing practice, but it has been used less
frequently in academic research (Azabagaoglu et al., 2002; Oraman and Inan 2005; Huber,
2008; Gurcaylilar, 2008). However there are several important research papers that used
MDS as a research technique (Gallivan and Jgarkava,2008). Most of them use a MDS as a
technique to measure the perceptions of customers about different subjects.
The aim of this study is to compare dissimilarities between the 28 European Union member
countries with the European Union membership candidate, Turkey, in term of the trade
outcome performance.
Prefscal is used in this study. The solution was derived using MDS analysis involving
distance matrices. Therefore, appropriate distance matrices should be calculated according
to the type of data(Doğan, 2003). Euclidean distance (d) is used in this study, as seen on
Equation 1.
2
1
n
i i
i
d x y
(Equation. 1)
Stress dimension (Equation 2 has a common use in MDS analysis and it is as a criterion for
correlation or positive correlation and used in determining whether the dimension number
is appropriate that was used in graphical organizing gathered at the end of the analysis.
(Filiz ve Çemrek, 2005).
2
^2/ij ij ijstress d d d
(Equation. 2)
i. and j. data distance between individuals,= i. and j. are shown as configuration distance
between individuals (Doğan, 2003). Stress ratio is used as a criterion in determining
suitability of MDS analysis. A low stress value shows the correlation of the analysis; a
good stress value shows a poor correlation. Kruskal provided a guide indicating
correlation of analysis to interpret of stress value in 1964 (Table 1; Wickelmaier, 2003).
The data to be analyzed is a collection of objects (colors, faces, stocks, . . .) on which a
distance function is defined, δi,j := distance between i th and j th objects. These distances
are the entries of the dissimilarity matrix.
1,1 1,2 1,
2,1 2,2 2,
,1 ,2 ,
:
The goal of MDS is, given Δ, to find vectors 1 2, ,..., Nx x x R such that
,i j i jx x for all ,i j

Comparison In Trade Outcome Performance Between The European Union
185
C.20, S.4
where . is a vector norm. In classical MDS, this norm is the Euclidean distance, but, in a
broader sense, it may be a metric or arbitrary distance function. In other words, MDS
attempts to find an embedding from the objects into RN such that distances are preserved.
If the dimension N is chosen to be 2 or 3, we may plot the vectors xi to obtain a
visualization of the similarities between the objects. Note that the vectors xi are not
unique: With the Euclidean distance, they may be arbitrarily translated, rotated, and
reflected, since these transformations do not change the pair wise distances i jx x
(Note: The symbol indicates the set of real numbers, and the notation N
refers to the
Cartesian product of n copies of , which is an n-dimensional vector space over the field
of the real numbers.) There are various approaches to determining the vectors xi. Usually,
MDS is formulated as an optimization problem, where 1 2, ,...,x x x is found as a
minimizer of some cost function, for example:
1
2
,,...,
min i j i jx x
i j
x x
.
A solution may then be found by numerical optimization techniques. For some particularly
chosen cost functions, minimizes can be stated analytically in terms of matrix Eigen
decompositions . Stress ratio is used as a criterion in determining suitability of MDS
analysis. A low stress value shows the correlation of the analysis; a good stress value shows
a poor correlation. Kruskal provided a guide indicating correlation of analysis to interpret
of stress value in 1964.
Table 1: Stress Value
Stress-Value Goodness Of Fit
0.10 -0.20 Poor
0.05 - 0.10 Fair
0.025-0.05 Good
0 -0.025 Excellent
Source: (Wickelmaier, 2003)
3.3. Definition Of Variables
The World Trade Indicators (WTI) database contains about 450 trade‐related policy and
outcome indicators for 211 countries. It is organized around five thematic categories or
pillars, namely (i) Trade Policy, (ii) External Environment, (iii) Institutional Environment,
(iv) Trade Facilitation and (v) Trade Outcome. In this study, we used the d of the variables
from one the five trade indicators namely ‘’ World trade indicators 2009/10 ‘’ as Trade
Outcome published in 2010 by the World Bank. This data is founded on World Bank
internet web site on www.worldbank.org. Trade outcomes indicators is a tool developed by
the International Trade Unit of the World Bank that reviews the country-level performance
of exports along various dimensions which together give a fairly comprehensive picture of
trade competitiveness(World Bank.) .

ADALESSOSSI – KAYA
186
2015
Table 2: Description Of Variables
Symbol Variables Definitions
X1 Real
growth in
trade (%)
Nominal Growth in Total Trade (g+s, %) is the average annual growth rate
of the total exports and imports of goods and services at current U.S.
dollars. It is noted that goods are concerning agricultural and
non‐agricultural sectors while services are transport, travel, other
commercial services, and government services
X2 Nominal
growth in
trade (%)
Goods Trade Share of Total Trade (g+s, %) represents the share of goods
exports and imports as a percent of total exports and imports of goods and
services. It is noted that goods are concerning agricultural and
non‐agricultural sectors while services are transport, travel, other
commercial services, and government services.
Source: (World Bank Development Economics Prospects Group
(DECPG))
X3 Trade
Compositio
n (share of
goods and
services)
Agricultural Exports/Imports Share of Goods Exports/Imports (%)
represents the share of agricultural exports/imports as a percent of goods
exports/imports (food) A subcategory of this
• Non-Agricultural Exports/Imports Share of Goods Exports/Imports (%)
represents the share of non‐agricultural exports/imports as a percent of
goods exports/imports. (: This concerns manufactures, fuels, ores and
metals).
• Transport Exports/Imports Share of Services Exports (%) represents the
share of transport exports/imports as a percent of services exports/imports.
• Travel Exports/Imports Share of Services Exports/Imports (%) represents
the share of travel exports/imports as a percent of services exports/imports.
• Other Commercial Services Exports / Imports Share of Services Exports /
Imports (%)
represents the share of other commercial services exports/imports as a
percent of services exports/imports. This concerns financial services,
computer and information services, and “other business” services.
X4 Trade
Integration
(% GDP)
Trade Integration (% of GDP) is the sum of exports and imports in goods
and services expressed as a percent of GDP in current U.S. dollars. It is
noted that goods are concerning agricultural and non‐agricultural sectors
while services are transport, travel, other commercial services, and
government services
X5 Trade
Balances
(%)
• Current Account Balance (% of GDP) is the sum of the goods and
services balance, income balance and current transfers balance, expressed
as a percent of GDP.
• Trade Balance (% of GDP) represents the difference between exports and
imports of goods and services, expressed as a percent of GDP.This
indicator have included into goods and services balance.• Food Balance
(g+s, % of GDP) and• International Reserves (% of Imports of Goods and
Services) represents international reserves excluding gold, expressed as a
percent of imports of goods and services.
X6 Shares of
World
Trade (%)
• Total Trade Share of World Total Trade (g+s, %) represents total exports
and imports of goods and services of a country, expressed as a share of
world total exports and imports. It is noted that goods are concerning
agricultural and non‐agricultural sectors while services are transport,
travel, other commercial services, and government services
X7 Growth in
Shares of
World
Trade(%)
Growth in Trade Share of World Total Trade (g+s, %) represents the
average annual growth rate of trade share of world total trade in nominal
terms. This indicator is also disaggregated into goods trade and services. It
is noted that goods are concerning agricultural and non‐agricultural sectors
while services are transport, travel, other commercial services, and
government services

Comparison In Trade Outcome Performance Between The European Union
187
C.20, S.4
Symbol Variables Definitions
X8 Product
and Market
Diversificat
ion (%)
• Number of Products Exported / Imported is calculated at the 3‐digit
SITC, Revision 3 level, and includes only those products whose value
exceeds $ 100,000 or 0.3 percent of the country's total exports/imports,
whichever one is smaller.
• Share of Top 5 Exports/Imports Products of Total Goods Exports/
Imports measures the total value of the largest (by value) five major export
products of a country divided by the value oftotal goods exports at SITC
3‐digit level, Revision 3.Available years
Source U.N. COMTRADE database as calculated by the World Bank
Institute using WITS.
• Export/Import Product Concentration Index (0100, most concentrated)
represents the Herfindahl‐Hirschmann index measure of the degree of
export/import product concentration within a country. Calculated at the
SITC 3 digit level,
• Share of Top 5 Exports/Imports Markets of Total Goods Exports/Imports
measures the total value of the top five (by value) major exports/imports
markets of a country divided by the totalgoods exports/imports at SITC
3‐digit level, Revision 3.
U.N. COMTRADE database as calculated by the World Bank Institute
using WITS.
• Export Market /Import Source Concentration Index (0100, most
concentrated) represents the Herfindahl‐Hirschmann index measure of the
degree of concentration of exports markets and import sources of a
country. Calculation of the concentration indices is based on SITC revision
3, at the 3 digit level and includes products whose national export or
import value is higher than 100.000 or represents more than 0.3% of total
national exports or imports.
X9 Tourism,
FDI, and
Remittance
s (%)
• Growth in Tourist Arrivals/Departures (%) represents the average annual
growth rate of the number of tourist arrivals/departures in a country.
(World Bank WDI – World Tourism Organization)
• FDI Inflows (% of GDP) represents net foreign direct investment (FDI)
inflows divided by the value of GDP in the reporting country. FDI is the
sum of equity capital, reinvestment of earnings, and other short and
long‐term capital.
FDI Outflows (% of GDP) represents net outflows of investment from the
reporting country to the rest of the world, as a percent of GDP of the
reporting country. FDI inflows are also reported as a share of exports of
goods and services, as well as a share of world FDI Inflows.
World Bank WDI for FDI Inflows (% of World FDI Inflows)
• Total Remittances Inflows/Outflows (% of GDP) represents a country’s
receipts/payments of worker remittances, compensation of employees, and
migrant capital transfers expressed as a percent of GDP. Inflows are also
expressed as a share of exports of goods and services, share of world total
remittances inflows, and share of FDI inflows.
1995‐2009; 1995‐2008 for Total Remittances Inflows as a share of exports
of goods and services
• Worker Remittances Inflows/Outflows (% of GDP) represents a
country’s receipts/payments of worker remittances, defined as current
transfers by migrants who are employed or intend to remain employed for
more than a year in another country in which they are considered residents.

ADALESSOSSI – KAYA
188
2015
Symbol Variables Definitions
X10 Other
Variables
(%)
•Real GDP Growth (%) is the average annual growth rate of a country's
GDP at constant 2000 U.S.
•Real GDP per Capita Growth (%) is the average annual growth rate of a
country's GDP per capita at constant 2000 U.S. dollars. •Nominal Trade
(g+s) per Capita represents the exports and imports of goods and services
per capita, in current U.S. dollars.
Source: (World Bank Development Economics Prospects Group (DECPG))
4. EMPIRICAL RESULTS AND DISCUSSION
Results Obtaıned From Multi-Dimensional Scaling Analysıs
Stress measure indicates the proportion of the variance of the disparities not accounted for
by the MDS model. This measurement varies according to the type of program and the data
being analyzed. Kruskal’s stress is the most commonly used measure for determining a
model’s goodness of fit, and is provided in SPSS. Stress is minimized when the objects are
placed in a configuration so that the distances between the objects best match the original
distances. R2 measure as an index of fit, indicating the proportion of variance of the
disparities accounted for by the MDS procedure.
Multidimensional scaling analysis: due to the presence of a fully closed compliance graph,
3 dimensions were made. In the 3 dimensions of multidimensional scaling analysis,
Young's S-Stress 1 and Kruskal's Stress 1 value = 0 A-7 and Speerman's Rho value of
0.9673915 were found. As a result, multi-dimensional scaling analysis coming out of the
stress values close to 0 and rate Spearman’s Rho values close to 1 based on the three
dimension data indicates that three-dimensional scaling is appropriate for this study. In
other words, the analysis of the MDS results determines the appropriated dimensionality
and portrays the results in a perceptual map.
Table 3: Dimensions Coordinate Values in each country.
Country’s name
Dimension Dimension
1 2 3 Country’s name 1 2 3
Belgium 1,101 ,910 -1,501 Slovenia ,424 ,046 -,908
Spain ,077 -,397 -,605
Czeck Republic 1,389 ,596 ,214 Sweden 1,290 ,131 1,274
Danemark 1,044 ,197 ,395 United Kingdom -1,271 -2,118 ,576
Estonia 1,433 ,322 -,905 Germany 1,186 -,001 1,363
Finland 1,385 -,289 ,385 Italy ,915 -,097 ,882
France 1,576 -,565 -,094 Turkey 1,121 -,056 1,342
Greece 1,175 -1,124 -1,109 Austria 1,232 ,189 ,943
Hungary 1,390 ,596 ,214 Bulgaria 1,363 ,302 -,905
Lithuania ,424 ,046 -,908 Croatia ,399 ,014 -,886
Luxemburg 1,105 ,236 1,165 Cyprus ,406 ,023 -,892
Malta 1,332 ,298 1,313 Ireland 1,614 3,294 -,137
Netherlands ,425 ,047 -,909 Latvia 1,186 -,001 1,363
Poland ,335 -,284 -,641 Slovakia ,800 ,526 -1,238
Portugal ,077 -,397 -,605 Romania ,746 -,092 ,392
Source: SPSS 20.0

Comparison In Trade Outcome Performance Between The European Union
189
C.20, S.4
According to the Table 3, due to the non marked positive or negative sign coordinates
andmagnitudes of the countries, comments about their relative positions could be done.
Therefore, examining the axis’ coordinates will facilitate this interpretation.
Base on Figure 1, the coordinate points of the axis has been examined.
Figure 1: The Tree Dimensional MDS graphics coordinate points of the axis
Source: SPSS 20
When illustrating the trade performance of the countries, ten variables coordinates in three
dimensions are given in the table 4. With the help of these coordinates in this table, the
relative positions of the variable of the all countries can be determined.
Table 4: Variables For Coordinates In The Three Dimensional MDS
Variables Dimension
1 2 3
Real growth in trade 1,566 -1,362 ,299
Nominal growth in trade -1,731 ,199 -1,189
Trade Composition (share of goods and services) -8,976 3,296 -,404
Trade integration (% GDP) -6,761 -7,303 ,481
Trade Balances ,296 -1,883 -1,912
Shares of World Trade ,654 -,072 -,323
Growth in Shares of World Trade -,411 ,670 1,005
Product and Market Diversification -9,492 2,760 ,458
Tourism, FDI, and Remittances -,411 ,670 1,005
Other Variables -,411 ,670 1,005
Source: SPSS 20

ADALESSOSSI – KAYA
190
2015
As seen from Table 4, Tourism, FDI and Remittances, Other Variables, and Growth in
Shares of World Trade are the variables that show similarities in characteristic to each
other.
The first dimension is defined by the Product and Market Diversification variables, the
second dimension is defined by Trade integration (%GDP) and the third is defined by Trade
Balances variable.
In the Figure 1, when we examined the impact or effect of countries, it shows these results
as follows:
According to 1st and 3rd dimension, the United Kingdom is located in different positions.
According to the 1st and 2nd dimension, the United Kingdom and Ireland are located in the
different positions when compared to the other countries.
According to the 2nde and 3rde dimension, it is markedly shown again that the United
Kingdom and Ireland were in different positions when compared with the other 27
countries.
Base on the coordinate values, we will find out the position of Turkey in the different
dimensions; which countries are the most remote to it and which countries are the closest to
it. In this light, countries’ coordinates in each dimension are separately taken into account.
After which the role played by each variable will be examined one by one.
The countries rank in the first dimension is shown in the Table 4.
Table 4: Countries Ranking Based On The Coordinates Values In The First Dimension
Country Coordinate
Values Country
Coordinate
Values Country
Coordinate
Values
United Kingdom -1,271 Slovakia 0,800 Sweden 1,290
Spain 0,077 Italy 0,915 Malta 1,332
Portugal 0,077 Danemark 1,044 Bulgaria 1,363
Poland 0,335 Belgium 1,101 Finland 1,385
Croatia 0,399 Luxemburg 1,105 Czeck Republic 1,389
Cyprus 0,406 Greece 1,105 Hungary 1,390
Slovenia 0,424 Latvia 1,186 Estonia 1,433
Lithuania 0,424 Germany 1,186 France 1,576
Netherlands 0,425 Turkey 1,121 Ireland 1,614
Romania 0,746 Austria 1,232
Source: SPSS 20
Ranking countries basing on the first dimension, indicates that the most distant country to
Turkey is United Kingdom and the closest countries are Germany and Latvia.
Table 5: Data for Turkey, United Kingdom, Germany and Latvia
Country X1 X2 X3 X4 X5 X6 X7 X8 X9 X10
Turkey -13,40 16,34 49,992 34,873 12,830 1,003 -3,997 69,747 5,126 -6,000
Unıted
Kıngdom
-9,30 14,36 49,997 41,316 ,431 4,250 -7,780 71,426 2,916 -3,450
Germany -10,40 15,94 50,005 56,033 5,470 8,456 -2,200 71,601 5,115 -5,00
Latvıa -6,10 26,20 50,090 66,643 4,226 ,083 -3,406 73,188 7,053 -12,70
Source: (World Bank Data 2010 (Authors compilation))
Comparison In Trade Outcome Performance Between The European Union
191
C.20, S.4
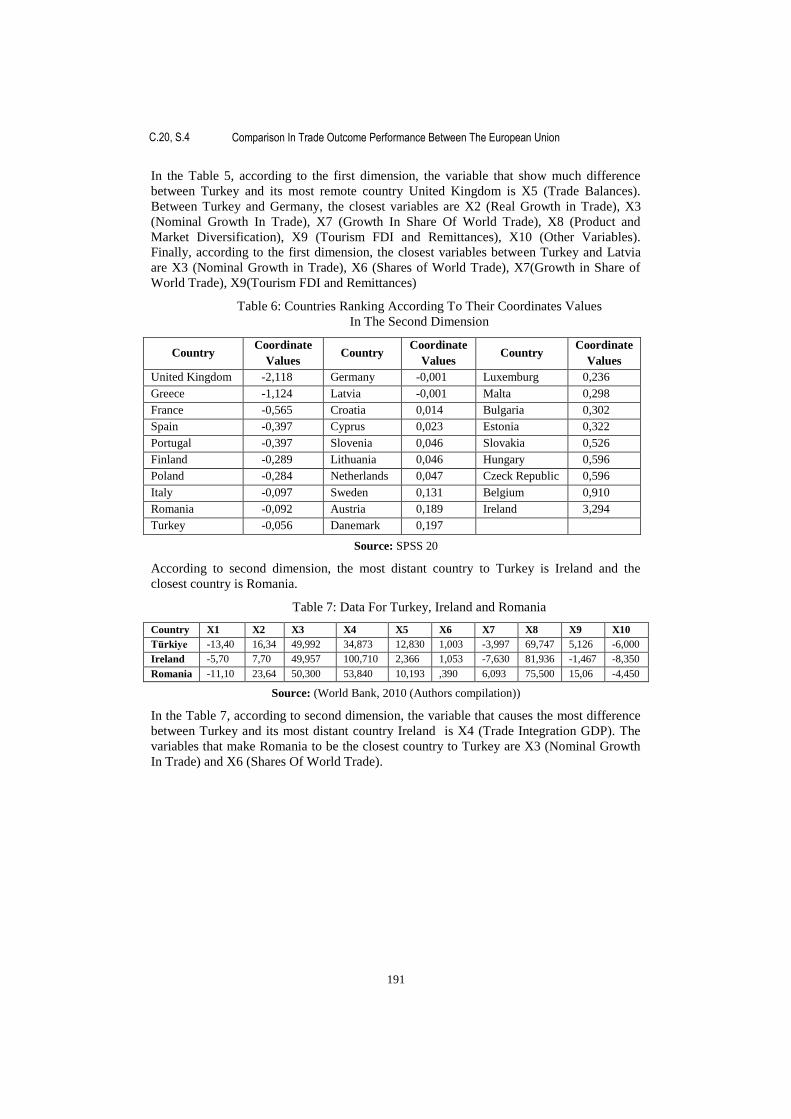
In the Table 5, according to the first dimension, the variable that show much difference
between Turkey and its most remote country United Kingdom is X5 (Trade Balances).
Between Turkey and Germany, the closest variables are X2 (Real Growth in Trade), X3
(Nominal Growth In Trade), X7 (Growth In Share Of World Trade), X8 (Product and
Market Diversification), X9 (Tourism FDI and Remittances), X10 (Other Variables).
Finally, according to the first dimension, the closest variables between Turkey and Latvia
are X3 (Nominal Growth in Trade), X6 (Shares of World Trade), X7(Growth in Share of
World Trade), X9(Tourism FDI and Remittances)
Table 6: Countries Ranking According To Their Coordinates Values
In The Second Dimension
Country Coordinate
Values Country
Coordinate
Values Country
Coordinate
Values
United Kingdom -2,118 Germany -0,001 Luxemburg 0,236
Greece -1,124 Latvia -0,001 Malta 0,298
France -0,565 Croatia 0,014 Bulgaria 0,302
Spain -0,397 Cyprus 0,023 Estonia 0,322
Portugal -0,397 Slovenia 0,046 Slovakia 0,526
Finland -0,289 Lithuania 0,046 Hungary 0,596
Poland -0,284 Netherlands 0,047 Czeck Republic 0,596
Italy -0,097 Sweden 0,131 Belgium 0,910
Romania -0,092 Austria 0,189 Ireland 3,294
Turkey -0,056 Danemark 0,197
Source: SPSS 20
According to second dimension, the most distant country to Turkey is Ireland and the
closest country is Romania.
Table 7: Data For Turkey, Ireland and Romania
Country X1 X2 X3 X4 X5 X6 X7 X8 X9 X10
Türkiye -13,40 16,34 49,992 34,873 12,830 1,003 -3,997 69,747 5,126 -6,000
Ireland -5,70 7,70 49,957 100,710 2,366 1,053 -7,630 81,936 -1,467 -8,350
Romania -11,10 23,64 50,300 53,840 10,193 ,390 6,093 75,500 15,06 -4,450
Source: (World Bank, 2010 (Authors compilation))
In the Table 7, according to second dimension, the variable that causes the most difference
between Turkey and its most distant country Ireland is X4 (Trade Integration GDP). The
variables that make Romania to be the closest country to Turkey are X3 (Nominal Growth
In Trade) and X6 (Shares Of World Trade).

ADALESSOSSI – KAYA
192
2015
Table 8: The Rank Of The Countries Coordinates Value According To The Dimension 3.
Country Coordinate
Values Country
Coordinate
Values Country
Coordinate
Values
Belgium -1,501 Poland -0,641 United Kingdom 0,576
Slovakia -1,238 Portugal -0,605 Italy 0,882
Greece -1,109 Spain -0,605 Austria 0,943
Netherlands -0,909 Ireland -0,137 Luxemburg 1,165
Lithuania -0,908 France -0,094 Sweden 1,274
Slovenia -0,908 Hungary 0,214 Malta 1,313
Estonia -0,905 Cezck Republic 0,214 Turkey 1,342
Bulgaria -0,905 Finland 0,385 Germany 1,363
Cyprus -0,892 Romania 0,392 Latvia 1,363
Croatia -0,886 Danemark 0,395
Source: SPSS 20
The Table 8 shows that according to the third dimension, the most remote country to
Turkey is Belgium and the closest country are Germany and Latvia.
Table 9: Data for Belgium, Germany and Latvia
Country X1 X2 X3 X4 X5 X6 X7 X8 X9 X10
Turkey -13,40 16,34 49,992 34,873 12,830 1,003 -3,997 69,747 5,126 -6,000
Belgium -5,50 7,04 49,985 113,83 ,093 2,416 3,766 76,584 2,971 -3,700
Germany -10,40 15,94 50,005 56,03 5,470 8,456 -2,200 71,601 5,115 -5,000
Latvia -6,10 26,20 50,090 66,64 4,226 ,083 -3,406 73,188 7,053 -12,70
Source: (World Bank, 2010)
In the Table 9, according to the third dimension, the variable that shows the greater
difference between Turkey and its most remote country Belgium is X4 (Trade Integration
GDP). According to the dimension 3, the variables that enable Germany to be one of the
closest countries to Turkey are variable such as X2 (Real Growth in Trade), X3 (Nominal
Growth in Trade), X7 (Growth in Share of World Trade), X8 (Product and Market
Diversification), X9 (Tourism FDI and Remittances) and X10 (Other Variables). Moreover,
of the other remaining country, Latvia is close to Turkey with variables such as X3
(Nominal Growth in Trade), X6 (Shares of World Trade), X7 (Growth in Share of World
Trade) and X9 (Tourism FDI and Remittances).
In the last phase of the multi-dimensional scaling analysis, the relationship between the
Euclidean distance and the estimated distance values can be examined with the values of
the actual distances. Concerning the fit of the solution in a Scatterplot of actual distances
(scaled similarity values) versus fitted distance from the perceptual map, it is shown below
that this plot identifies true outliers that are well represented by the current solution.
Therefore the initial impression of this particular scatterplot is very good; the density
indicated by the plotting symbols reveals that the scatter is not dense along the diagonal.

Comparison In Trade Outcome Performance Between The European Union
193
C.20, S.4
Figure 2: Euclidean Distance Point Clouds Model Diagram
Source: SPSS 20
5. CONCLUSION
The European Union is one of the world’s most outward-oriented economies and intends to
remain so. Trade with the rest of the world doubled from 1999 to 2010, and currently
almost three quarters of imports into the EU pay no, or reduced, dutiest the performance of
EU share of world exports and imports was 17.2 % in 2011, the foreign direct investment
in EU account for €3 807 billion in 2011, the EU outbound foreign direct investment
account for €4 983 billion in 2011, its Manufacturing trade surplus, oil excluded: account
almost for €300 billion in 2012;Its Services trade surplus accounted for €120 billion 2011
and EU development aid accounted for €53 billion in 2012.
In other hand Turkey trade performance was remarkable in this last year, Turkey’s export to
the EU totalled $11.5 million; an increase of 3.7%, below the 7.4% increase in total
exports. This is due to the economic stagnation in continental Europe, especially in
Germany, because Germany has the biggest share Turkey‘s exports in the EU. Meanwhile,
export of textile Turkey’s most competitive sector, also increased by only 4.2%. EU
countries have always played an important role in the foreign trade of Turkey, having a
share of over 45-50% in the overall trade. Especially the adoption of Turkish economy to
EU’s competition affects an increase in Turkish production quality and it improves the
trade between Turkey and EU.
Elsewhere, Turkey and EU are doing trade in many fields such textile, technology, services,
machines, agriculture and others. Furthermore, it is noted that the bilateral trade between
the EU and Turkey totaled €123 billion in 2012. Turkey continues to be the EU’s sixth
biggest trading partner, while the EU is Turkey’s biggest. 38% of Turkey’s total trade is
with the EU and almost 71% of the foreign direct investment in Turkey comes from EU.
ADALESSOSSI – KAYA
194
2015
Trade outflow performance variables were taken from the World Bank web site
using Multidimensional Scaling Analysis (MDS) to compare EU 28 countries members
with EU candidate country Turkey in the trade outcome performance in regard to find out
with which countries turkey has similarities, with which countries Turkey has differences
.As a result of the multidimensional scaling analysis, Turkey’s trade performance outcome
compared with that of the EU countries using the variables taking into account above, the
positions of these countries was illustrated on a graph of three dimensional.
The three dimensions analysis indicates that the most distant countries to Turkey according
to the first dimension is United Kingdom; according to the second dimension Ireland, and
according the third dimension Belgium. Elsewhere, the closest countries to Turkey are
Latvia and Germany according to the first dimension, Romania according to the second
dimensions and Lativia and Germany according to the third dimension.
Taking into all sectors, any comparative analysis had not been done in the past on the
Turkish’s trade performance outcome compared with the EU member countries. Indeed,
this study, taking into all sectors, stating which countries are closest to Turkey, which
countries are most remote, permit to contribute to the literature review for the future
reseachers.
REFERENCES
BALASSA, B. (1965). Trade liberalization and revealed comparative advantage. The
Manchester School, 33(2), 99–123. www.hrmars.com/journals
BALASSA, B. (1978), “Exports and Economic Growth: Further Evidence”, Journal of
Development Economics, Vol. 5, pp. 181-189.
BALASSA, B. (1985), “Exports, Policy Choices, and Economic Growth in Developing
Countries after the 1973 Oil Shock”, Journal of Development Economics,
Vol.18, pp. 23-35.
BAYOUMI, T., COE, D.T. and Helpman, E. (1999), “Research and Development and
Global Growth”,Journal of International Economics, Vol. 47, pp. 399-428.
BEN-David, D., NORDSTROM, H. and WINTERS, L.A. (2000), “Trade, Income
Disparity, and Poverty”, World Trade Organization, Geneva.
BLOMSTROM, M. and Kokko, A. (2003), “The Economics of Foreign Direct Investment
Incentives”, NBER Working Paper, No. 9489, National Bureau of Economic
Research, Cambridge.
COE, D.T. and HELPMAN, E. (1995), “International Research and Development
Spillovers”, European Economic Review, Vol. 39, pp. 859-887.
DOĞAN, İ. 2003. Kuzularda büyümenin çok boyutlu ölçekleme yöntemi ile
değerlendirilmesi, Uludağ Üniversitesi Dergisi. 22
DOLLAR, D. (1992), “Outward-oriented Developing Economies Really do Grow More
Rapidly”, Economic Development and Cultural Change, Vol. 40 No. 3, pp. 523-544.
EDWARDS, S. (1998), “Openness, Productivity and Growth: What do We Really know?”
Economic Journal, Vol. 108, pp. 383-398.

Comparison In Trade Outcome Performance Between The European Union
195
C.20, S.4
FİLİZ, Z. and ÇEMREK,F., 2005. Avrupa Birliği’ne Üye Ülkeler ile Türkiye’nin
Karşılaştırılması. 7. Ulusal Ekonometri ve İstatistik Sempozyumu, İstanbul
GALLIVAN M. and E. JGARKAVA, 2008. Multi dimensional scaling (MDS) –method
review, BA9280. http://www.cu.edu.ge/data/file_db/Presentations/
_Kqe8HBiWqa.pd
FRANKEL, J.A., ROMER, D., (1999) Does trade cause growth? American Economic
Review 89, 379–399.
FEDER, G. (1983), “On Exports and Economic Growth”, Journal of Development
Economics, Vol. 12, pp. 59-73.
GOLDBERG, P. and PAVNIK, N. (2007), “Distributional Effects of Globalization in
Developing Countries.” Journal of Economic Literature 45: 39-82.
JILES, J. A. and WILLIAMS, C. L. (2000a), “Export-Led Growth: A Survey of the
Empirical Literature and Some Non Causality Results: Part 1.” Journal of
International Trade and Economic Development 9, 261–337.
KHAN, M. and REINHART, C. (1990). “Private Investment and Economic Growth in
Developing Countries”, World Development, Vol.18, No.1.
KHATAIE, M. and GHARBALI MOGHADDAM, Y. (2004), “The Dynamic Relationship
between Exchange rate and Gross Domestic Product in Economy of Iran”, Journal
of Budget and Planning, No. 84, 3-25.
KAVOUSSI, R. M. (1985), “International Trade and Economic Development: The Recent
Experience of Developing Countries”, Journal of Developing Areas, Vol. 19, pp.
379-392.
KRUEGER, A. (1978), “Foreign Trade Regimes and Economic Development:
Liberalization Attempts and Consequences”, Ballinger, Cambridge, Massachusetts.
LALL, S. (2000), “Foreign Direct Investment, Technology Development and
Competitiveness: Issues and Evidence”, Monograph.
LEVINE R., Renelt, D., (1992), “A sensitivity analysis of cross-country growth”, American
Economic Review 82, 942–963.
MAHDAVI, A and FATEMI, M. (2007), “An Investigation on the Impact of Non- Oil
Exports on Economic Growth– Case of Iran”, Iranian Economic Review, Vol.12,
No.19.
MAHDAVI, A and JAVADI, SH. (2006), “Testing the causal Relationship between Trade
and Economic.
MICHAELY, M. (1977), “Exports and Growth: An Empirical Investigation”, Journal of
Development Economics, Vol. 4, pp. 49-53.
PANAS, E. and VAMVOUKAS, G. (2002), “Further evidence on the Export-led Growth
Hypothesis” , Applied Economic Letters, 9, 731–5.
RAM, R. (1985), “Exports and Economic Growth: Some Additional Evidence”, Economic
Development and Cultural Change, Vol. 33, pp. 415-425.
TAGHAVI, M. GOUDARZI, M. MASOUDI, E. PARHIZI, GASHTI, H. (2012),“Study on
the Impact of Export and Import on Economic Growth in Iran”, Journal of Basic
and Applied Scientific Research, 2(12)12787-12794.

ADALESSOSSI – KAYA
196
2015
SACHS, J. D. (1987), “Trade and Exchange Rate Policies in Growth Oriented Adjustment
Programs”, in Corbo, V., Goldstein, M. and Khan, M. (Eds.), Growth Oriented
Adjustment Programs, IMF, Washington, DC.
SINGER, H.W. (1950), “The Distribution of Gains between Investing and Borrowing
Countries, American Economic Review, Vol. 40, pp. 473-485.
UE: progress report on Turkey 2013 (extract from the Communication from the
Commission to the European Parliament and the Council ‘Enlargement Strategy
and Main Challenges 2013-2014’, COM
WICKENMAIER, F. 2003. An introduction to MDS, Sound Quality Research Unit,
Aalborg University Denmark, (http://homepages.uni-tuebingen.de/florian.
wickelmaier/pubs/Wickelmaier2003SQRU.pdf, 30.06.2014
WORLD BANK,(2010).http:/ /www.worldbank.org,24.04.2014
Top Related