thesis GARCIA cristina - SupAgro the upper gastrointestinal (GI) tract, they undergo sequential...
143
SupAgro Ecole doctorale Sciences des Procédés – Sciences des Aliments Unité Mixte de recherche (UMR) Spécialité : Biotechnologie, microbiologie Présentée par M A CRISTINA GARCIA MUÑOZ Soutenue le 12 Décembre 2013 devant le jury composé de M. Olivier DANGLES, Université d'Avignon, INRA Professeur Président du jury M. Lars Ove, DRAGSTED Université de Copenhagen Professeur Rapporteur M me Joëlle QUETIN-LECLERCQ, Université Catholique de Louvain Professeur Rapporteur M me Christèle HUMBLOT, Institut de recherche pour le développement, IRD Chercheur Examinateur M. Jean-Christophe MEILE, La recherche agronomique pour le développement, CIRAD Chercheur Examinateur M. Fabrice VAILANT Chercheur Directeur de Thèse La recherche agronomique pour le développement, CIRAD-CITA BIOCONVERSION DES ELLAGITANNINS DE LA MURE TROPICALE DE MONTAGNE (Rubus Adenotrichos) ET RELATION AVEC L’ÉCOLOGIE DU MICROBIOME INTESTINAL
Transcript of thesis GARCIA cristina - SupAgro the upper gastrointestinal (GI) tract, they undergo sequential...

SupAgro
Ecole doctorale Sciences des Procédés – Sciences des Aliments
Unité Mixte de recherche (UMR)
Spécialité : Biotechnologie, microbiologie
Présentée par MA CRISTINA GARCIA MUÑOZ
Soutenue le 12 Décembre 2013 devant le jury composé de
M. Olivier DANGLES,
Université d'Avignon, INRA
Professeur Président du jury
M. Lars Ove, DRAGSTED
Université de Copenhagen
Professeur Rapporteur
Mme Joëlle QUETIN-LECLERCQ,
Université Catholique de Louvain
Professeur Rapporteur
Mme Christèle HUMBLOT,
Institut de recherche pour le développement, IRD
Chercheur Examinateur
M. Jean-Christophe MEILE,
La recherche agronomique pour le
développement, CIRAD
Chercheur Examinateur
M. Fabrice VAILANT Chercheur Directeur de Thèse La recherche agronomique pour le
développement, CIRAD-CITA
BIOCONVERSION DES ELLAGITANNINS DE LA MURE TROPICALE DE MONTAGNE (Rubus Adenotrichos) ET RELATION AVEC L’ÉCOLOGIE DU MICROBIOME
INTESTINAL

2
SupAgro
Ecole doctorale Sciences des Procédés – Sciences des Aliments
Unité Mixte de Recherche (UMR)
Spécialité : Biotechnologie, microbiologie
Présentée par MA CRISTINA GARCIA MUÑOZ
Soutenue le 12 Décembre 2013 devant le jury composé de
M. Olivier DANGLES,
Université d'Avignon, INRA
Professeur Président du jury
Mme Joëlle QUETIN-LECLERCQ,
Université Catholique de Louvain
Professeur Rapporteur
M. Lars Ove, DRAGSTED
Université de Copenhagen
Professeur Rapporteur
Mme Christèle HUMBLOT,
Institut de recherche pour le développement, IRD
Chercheur Examinateur
M. Jean-Christophe MEILE,
La recherche agronomique pour le
développement, CIRAD
Chercheur Examinateur
M. Fabrice VAILANT Chercheur Directeur de Thèse La recherche agronomique pour le
développement, CIRAD-CITA
BIOCONVERSION DES ELLAGITANNINS DE LA MURE TROPICALE DE MONTAGNE (Rubus Adenotrichos) ET RELATION AVEC L’ÉCOLOGIE DU MICROBIOME
INTESTINAL

3
DEDICATION
I dedicate this thesis to my mother Maria Yolanda Muñoz who taught me the moral values based on honesty, compassion, courage, and forgiveness, to become an integral person in both personal and professional life.

4
ACKNOWLEDGEMENTS
The project has been conducted at the Research Centre in Natural Products CIPRONA and
at the National Centre of Food technology CITA belong to University of Costa Rica, and
also at the Centre of Agricultural Research for Development, CIRAD. The project has been
sponsored by the Centre of Agricultural Research for Development and Colombian
Corporation of Agricultural Research, CORPOICA. I am deeply appreciative of their
efforts and I sincerely acknowledge their wholehearted cooperation.
I am grateful to The Almighty God for giving me the strength, perseverance, courage and
patience to achieve this goal.
I would like to thanks first and foremost to my thesis advisor Dr. Fabrice Vaillant
researcher from CIRAD and teacher at the University of Costa Rica for this opportunity to
explore and learn about new fields of the science and emerging technologies. Fabrice’s
enthusiasm for research and his great interest in my work was encouraging.
My immense gratitude is due to the dissertation committee for their advices, comments,
thoughtful questions and comments. They were valued greatly.
I am greatly indebted to CIPRONA in head of Dr. Rosaura Romero, not only for open the
doors of her latest technology laboratories when all others were closed, but also for the
warm atmosphere I experienced.
I also enjoyed the very pleasant work environment offered by the CITA, in head of Dr.
Carmela Velazquez and the professional and multivariate work environment proper of the
CIRAD, in the unit of QUALISUD in head of Dr Max Reynes where is possible to count
with the support of researchers from diverse scientific areas.
My deepest and immense gratitude is due to Lic. Lorena Hernández. Her broad expertise
and her patience in introducing me to the exciting and complex world of LC-MS are
warmly remembered. Her friendliness made my work and life more pleasant. I will never
forgot her invaluable help when I was sick and especially when for a week I was not able to
walk, she picked me up and took me to the lab and back home; no matter the difficulties
this could bring her. I will always remember her strength, energy, enthusiasm and

5
compromise with her work; but even more remarkable, her altruism, an example of life that
deserve to be followed.
I also express my gratitude to Dr Ana Mercedes Pérez for her constant encouragement,
advice and suggestions. This project would not have been possible without her invaluable
support especially in logistics topics.
I was also privileged to be supervised by Dr. Jean Christophe Meile. His expertise, support,
encouragement, sincere and valuable guidance introducing me into the wonderful field of
molecular biology will be always remembered.
My sincere thanks to Dr. Max Reynes, Pierre Brat, Didier Montet and Gerard Loiseau, their
interests in my progress and their insightful comments throughout the process have been
invaluable.
I am sincere grateful to Dr. Christian Mertz for his advice, friendly conversation and
insightful comments throughout the project
This thesis would have remained a dream had it not been for my superiors at CORPOICA,
especially Dr. Hugo García, Gustavo García and Diego Aristizabal; who giving me the
opportunity, means, and time to come true this dream.
I also must thank to laboratory assistants Henry Velasquez from School of Food
Technology and Dennis Camareno from School of Microbiology from University of Costa
Rica for their invaluable and unconditional help just when I need it.
Special thanks to Mr. Miguel Urruela who tirelessly signed the entry permits for all the
weekends and holidays at CITA facilities, during my stay in Costa Rica.
My warmest thanks are owed to Dr Jean Michel Roger and Dr. Nathalie Gorretta, whose
contribution in the final stages of this work was invaluable and for their patience and
enthusiasm introducing me to the interesting world of chemometrics.
My deepest gratitude is due to all the technician and administrative staff Marcy González,
Vanny Mora, Alejandra Aguero, Marvin Soto, Randall Cordero, Marielos Torres, Mariela
Boniche, Martin Loira, Marta Avila, Deisylia Alpizar from CITA, for their skillful technical
assistance, enthusiasm and friendliness made my work much more pleasant.

6
I owe my deepest gratitude to technician Juan Carlos Brenes and Diego Zuñiga for their
invaluable help, friendless and constant encouragement.
I am grateful to technicians who shared their memories and experiences, especially to
Bernard Lyan, Adrian Servant, Pascalin Alter, Gill Moran and Isabell Metayer.
I also express my appreciation to Dr. Alice Perez, Dr. Guiselle Tamayo, Alicia Hernández,
and fellow student Sebastian de la Osa for their friendly conversation and encouragement
throughout my study and research.
I also thanks to Mrs Marie Pierre Obede, Mrs Chantal Canales, Miss Karla Salazar, and
Mrs Guisselle Casante for their help in administrative issues.
I wish to thank to Mrs Martine Barraud, for her valuable and kind assistance in all the
issues concerning to the Ecole doctorale.
My gratitude is due to Mrs Katia Gómez, and Seidy Vargas who provided me with a
delicious and enough coffee to keep me awake and active along the 12200 hours of work.
I am sincerely grateful also to my friends Carolina Castro, Ana Maria Garavito, Mónica
Espíndola, Miguel Sabogal, Miguel Llaín, Rodrigo Buitrago, Angela López, Jose María
Martínez, Teruya Satokichi, Elazar Fallik for their permanent encouragement.
My heartfelt thanks go to my parents, for their unceasing encouragement and support for
their unconditional love and support and for teaching me how work without rest. I take this
opportunity to record my sincere and warm thanks to my brothers Guillermo, Juan, German,
Fernando and their partners and children for their constant support and friendship. They have
given me the drive and discipline to tackle any task with enthusiasm and determination.
My gratitude is also due to all who, directly or indirectly, helped me to achieve this
important goal.

7
ABSTRACT
Consumption of dietary ellagitannins (ETs) could be associated mainly with prevention of
cardiovascular diseases and regulation of hormone-dependent cancers. Nonetheless, ETs
are not bioavailable as such; therefore, after being partially converted into ellagic acid (EA)
in the upper gastrointestinal (GI) tract, they undergo sequential bioconversion in the colon
by gut microbiota into urolithins, a more bioavailable and bioactive group of molecules that
persist up to 4 days at relatively high concentrations in urine. Variability of urolithin
excretion in urine is high and three main groups, “no or low urolithin excreters,”
“predominantly UA derivatives excreters” and “predominantly UB derivatives excreters,”
were observed on a cohort of 26 healthy volunteers. These categories were also
unambiguously observed following the total excretion of main ETs’ metabolites over a 4
day period after ingesting one shot of juice, and at different periods of time along one year.
Although relatively high inter- and intra-individual variabilities were observed, individuals
preserved their status during various intervention periods with different amounts of ETs
ingested. UPLC-PDA and ESI-Q-TOF/MS1 and MS2 allowed the tentative assignment of an
identity to 15 other ETs metabolites in urine, but this profiling did not allow the
discrimination of any other compounds aside from UA or UB derivatives. In-vitro
fermentation of ETs and EA with fecal stools showed a specific metabolic pathway ending
in the production of UA. Nonetheless, metabolites excreted in-vivo are much more
complex, highlighting strong interactions between host excretory system and composition
of gut microbiota. Hepatic recirculation and additional bioconversion of Phase II
metabolites in the colon may explain predominant excretion of UB in some volunteers.
Microbiota ecology assessed by PCR-Denaturing Gradient Gel Electrophoresis (DGGE)
fingerprint method allowed the association of some microorganism species to higher
capacity of bioconversion of dietary ETs into urolithins.
Keywords: Ellagitannins, blackberry, urolithin, colonic metabolites, ETs degradation
patterns, gut microbiota, gastrointestinal tract,

8
RESUME
La consommation d’aliments riches en ellagitannins (ETs) pourrait être associée
principalement à la prévention des maladies cardiovasculaires et la régulation des cancers
hormono-dépendants. Néanmoins, les ETs ne sont pas biodisponibles en tant que tel et,
après avoir été partiellement transformés en acide ellagique (EA) dans le tractus gastro-
intestinal (GI) supérieur, ils sont métabolisés dans le côlon par la flore intestinale en
urolithines, un groupe de molécules plus biodisponibles et bioactives qui peuvent persister
jusqu'à 4 jours à des concentrations relativement élevées dans le plasma et l'urine. La
variabilité de l'excrétion des urolithines dans l'urine est importante et à partir d’un
échantillon de population de 26 volontaires sains, trois groupes principaux d’individus ont
pu être distingués : "faible ou non-excréteur d’urolithin », « Excréteur prédominant d’UA et
dérivés» et « Excréteur prédominant d’UB et dérivés»". Ces groupes ont également été
observés en considérant la cinétique totale d’excrétion sur une période de 4 jours après
ingestion du jus et à des périodes différentes tout au long d'une année. Bien que les
variabilités inter-et intra-individuelles soient relativement élevées, les individus conservent
leur statut au cours des différentes périodes d'intervention même en modifiant les quantités
d'ETs ingérées. L’analyse par UPLC-PDA/ESI-Q-TOF/MS2 a permis d’attribuer
hypothétiquement une identité à 15 autres métabolites d’ETs dans l'urine, mais le profilage
métabolomique n’a pas permis de discriminer d’autres composés exceptés les dérivés d’UA
ou d’UB. La fermentation in-vitro des ETs et EA, par les matières fécales a montré une
voie métabolique spécifique qui débouche sur la production d’UA. Néanmoins, les
métabolites excrétés in vivo sont beaucoup plus complexes ce qui met en évidence de fortes
interactions entre le système excréteur de l'hôte et la composition du microbiote intestinal.
La recirculation hépatique suivie par une re-conversion des métabolites de phase II dans le
côlon permettrait d’expliquer l’excrétion d’UB chez certains volontaires. L’écologie
spécifique de la flore intestinale évaluée par la méthode des empreintes PCR-DGGE a
permis d’identifier quelques microorganismes associés à une plus grande capacité de
bioconversion des ETs en urolithins

9
TABLE OF CONTENTS
DEDICATION ...................................................................................................................... 3
ACKNOWLEDGEMENTS ................................................................................................... 4
ABSTRACT ........................................................................................................................... 7
RESUME ................................................................................................................................ 8
LIST OF PUBLICATIONS .................................................................................................. 12
LIST OF TABLES ............................................................................................................... 13
LIST OF FIGURES .............................................................................................................. 15
LIST OF ABBREVIATIONS .............................................................................................. 19
1 INTRODUCTION ......................................................................................................... 21
2 LITERATURE REVIEW .............................................................................................. 24
2.1 ELLAGITANNINS ............................................................................................... 24
2.1.1 STRUCTURE ................................................................................................. 24
2.1.2 OCCURRENCE ............................................................................................. 25
2.1.3 ELLAGITANNINS BIOAVAILABILITY .................................................... 27
2.1.4 POTENTIAL IMPACT ON HEALTH .......................................................... 31
2.1.5 TOXICITY OF DIETARY ELLAGITANNINS ............................................ 38
2.2 GUT MICROBIOTA AND BIOCONVERSION OF DIETARY COMPOUNDS ...
............................................................................................................................... 38
3 MATERIALS AND METHODS .................................................................................. 44
3.1 REAGENTS AND MATERIALS ......................................................................... 44
3.1.1 CHEMICALS ................................................................................................. 44
3.1.2 GROWTH MEDIUM ..................................................................................... 44

10
3.1.3 BLACKBERRY JUICE, BBJ ........................................................................ 44
3.2 ANALYTICAL METHODS ................................................................................. 45
3.2.1 SAMPLE PREPARATION ............................................................................ 45
3.2.2 ANALYSIS PERFORMED FOR THE IDENTIFICATION AND
QUANTIFICATION OF ETs AND THEIR METABOLITES .................................... 46
3.2.3 CLINICAL STUDIES WITH HEALTHY VOLUNTEERS.......................... 60
3.2.4 IN-VITRO FERMENTATION WITH STOOLS ........................................... 62
3.2.5 PROFILING OF INTESTINAL MICROBIOTA........................................... 65
3.2.6 MULTIVARIATE ANALYSIS OF DGGE PROFILES ............................... 76
4 METABOLIC FATE OF ELLAGITANNIN’S COLONIC DERIVATIVES .............. 79
4.1 Identification and quantification of Ellagitannins in blackberry juice................... 79
4.2 IDENTIFICATION OR ANNOTATION OF ETs METABOLITES PRESENT IN
URINE AFTER INGESTION OF BBJ ............................................................................ 79
4.2.1 IDENTIFICATION OF UAG AND UBG IN URINES ................................. 80
4.2.2 ANNOTATION OF OTHER ETS METABOLITES FOUND IN URINE ... 82
4.3 DIVERSITY OF URINARY EXCRETION PATTERNS IN HUMANS ............. 85
4.3.1 INTER-INDIVIDUAL VARIABILITY OF URINARY EXCRETION OF
UROLITHIN OVER A 4-DAY PERIOD ..................................................................... 86
4.3.2 KINETIC EXCRETION OF UROLITHIN A AND UROLITHIN B ............ 89
4.3.3 INTRA-INDIVIDUAL VARIABILITY OF URINARY EXCRETION OF
UROLITHINS ............................................................................................................... 92
4.4 IN-VITRO SIMULATION OF COLONIC FERMENTATION ........................... 94
4.4.1 IDENTIFICATION OF ETs METABOLITES PRESENT IN
FERMENTATION BROTH ......................................................................................... 94
4.5 VARIABILITY OF STOOLS' ABILITY TO PRODUCE ETs METABOLITES 98

11
4.5.1 EFFECT OF SUBSTRATE IN THE PRODUCTION OF UROLITHINS .... 99
4.5.2 SUGGESTED BIOCONVERSION PATHWAY OF ETs TO UROLITHIN
IN-VITRO ................................................................................................................... 101
4.6 POTENTIAL INTERACTION BETWEEN MICROBIOTA AND HOST ........ 102
5 MICROBIOTA ECOLOGY AND ABILITY TO PRODUCE UROLITHINS .......... 105
5.1 RESEARCH OF CORRELATION BETWEEN GUT ECOLOGY AND IN-VIVO
ABILITY TO EXCRETE UROLITHINS ...................................................................... 105
5.1.1 PCR-DGGE PROFILING OF THE 26 VOLUNTEERS ............................. 105
5.1.2 RELATION WITH UROLITHIN EXCRETERS STATUS DETERMINED
ON A URINE SPOT ................................................................................................... 109
5.2 RELATION BETWEEN MICROBIOTA AND IN-VITRO BIOCONVERSION
OF UROLITHIN ............................................................................................................. 115
5.3 IDENTIFICATION OF FECAL BACTERIA INVOLVED IN UROLITHIN
METABOLISM .............................................................................................................. 118
5.4 EFFECTS OF ETs INGESTION ON MICROFLORA PROFILE ...................... 120
6 CONCLUSIONS ......................................................................................................... 124
7 BIBLIOGRAPHY ....................................................................................................... 128
12
LIST OF PUBLICATIONS
Results from this study have been published or will be published like scientific papers:
Garcia-Muñoz, Cristina and Vaillant Fabrice. Metabolic Fate of Ellagitannins: Implications for Health, and Research Perspectives for Innovative Functional Foods. Critical Reviews in Food Science and Nutrition
Garcia-Muñoz, Cristina; Hernandez Lorena, Pérez, Ana M, Vaillant Fabrice. Diversity of urinary excretion patterns of primary ellagitannin colonic metabolites after ingestion of tropical highland blackberry (Rubus adenotrichos) juice, submitted and accepted by Food Research International.
Garcia-Muñoz, Cristina, Meile Jean Christophe, Hernandez, Lorena, Vaillant, Fabrice Microbiota ecology affects urolithin production during in-vitro simulation of colonic fermentation of blackberry juice.
Garcia-Muñoz, Cristina; Hernandez Lorena, Pérez, Ana M., Vaillant Fabrice Colonic microflora and the bioconversion of ellagitannins from tropical highland blackberries in to bioactive molecules. International Conference on Nutrigenomics - INCON 2012 “Gene-Diet Interaction for Personalized Health and Disease Prevention" San José, Costa Rica. October, 1fst to 4th, 2012
Garcia-Muñoz, Cristina; Hernandez Lorena, Mertz, Christian, Vaillant Fabrice Approaching to metabolic pathway of urolithin production from blackberry juice. International Conference on Nutrigenomics - INCON 2012 “Gene-Diet Interaction for Personalized Health and Disease Prevention" San José, Costa Rica. October, 1fst to 4th, 2012.

13
LIST OF TABLES
Table 2.1 Major ellagitannins food sources.......................................................................... 26
Table 2.2 Content of main phenolic compounds in blackberries (R. adenotrichos) at three
maturity stages. [31] ............................................................................................................. 27
Table 2.3 Contents of main phenolic compounds in blackberries (R. adenotrichos) at three
maturity stages.[35] .............................................................................................................. 28
Table 2.4 Recent prospective clinical studies of consumption of food rich in ellagitannins 33
Table 2.5 Summary of intervention studies with animals to evidence health benefits of
dietary ETs ............................................................................................................................ 34
Table 2.6 Summary of some recent results obtained on cell-models by ETs, EA and
urolithins ............................................................................................................................... 35
Table 2.7 Main studies on bioconversion of dietary compounds into bioactive colonic
metabolites [130] .................................................................................................................. 41
Table 3.1 Relative efficiency of electrospray ionization of common chemical functional
groups (Fiehn Laboratory, UC Davis) .................................................................................. 53
Table 3.2 PCR primers targeted for 16S rRNA gene, without GCClamp [197] .................. 67
Table 3.3 Encoding for the four bases and for ambiguous positions in DNA sequences .... 75
Table 4.1 Contents of ellagitannins in blackberry (Rubus adenotrichos) juice.................... 79
Table 4.2 UPLC-DAD/ESI(+)-Q-TOF/MS and MS2 analyses of ellagitannins colonic
metabolites found in urines of volunteers ............................................................................ 83
Table 4.3 UPLC /ESI(+)-Q-TOF/MS profiling of the main ETs metabolites excreted in
urine during the 4 days after ingestion of blackberry juice for nine individuals (letters) and
for different intervention periods (numbered in chronological order) ................................. 89
Table 4.4 Total excretion of urolithins UA and UB and percentage of conversion in relation
to ingested ETs ..................................................................................................................... 91
Table 4.5 Chromatographic and mass spectra characteristic of ellagitannins metabolites
found in broth culture incubation of EA and BBJ inoculated with fecal stools from urolithin
excreters ................................................................................................................................ 95

14
Table 4.6 Main ETs metabolites released along the degradation of ETs.a) EA, b) UM5, c)
Iso UD1, d) Iso UD2, e) Iso UD3. ........................................................................................ 96
Table 4.7 Main ETs metabolites released along the degradation of ETs. a)Iso UC1, b) Iso
UC2, c) Iso UC3 d) UA ........................................................................................................ 97
Table 5.1 Concentration of urolithin A and B derivatives in a urine spot collected at 51±5 h,
after ingestion of one shot of 250 ml of blackberry juice. .................................................. 109
Table 5.2 EA and UR Index of stools from 9 individuals .................................................. 116
Table 5.3 Recapitulation of retardation factors (Rf) of the bands found as discriminative in
the different trials ............................................................................................................... 118
Table 5.4 Results of the sequence similarities of the excised bacterial bands from different
DGGE gels .......................................................................................................................... 119

15
LIST OF FIGURES
Figure 2.1: A. Puncalagin; B. Lambertianin C10, and the HHDP group. [3] ...................... 25
Figure 2.2 Phylogenetic tree of the microbial diversity in the human gastrointestinal tract,
based on the 16S rDNA bacterial sequence data [2] ............................................................ 39
Figure 3.1 HPLC-MS and B) UPLC-MS analysis of mouse urine in a 3-dimensional map to
observe the differences on the information generated [1] .................................................... 47
Figure 3.2 Comparing speed, sensitivity and resolution in HPLC and UPLC analysis [2, 3]
.............................................................................................................................................. 47
Figure 3.3 Calibration curve of EA, for quantification of ellagitannins by HPLC, following
the method proposed by Mertz, 2007. .................................................................................. 50
Figure 3.4 UV chromatogram of blackberry (Rubus adenotrichos) juice. ........................... 50
Figure 3.5 Calibration curve of EA, UA and UB for quantification of ellagitannins in BBJ,
and ETs metabolites in urine and broth culture incubation. ................................................. 51
Figure 3.6 Basic information provided by UPLC: UV chromatogram-Area under the curve
and the UV spectra for m/z+ 213.0552 ion is illustrated ...................................................... 51
Figure 3.7 Electrospray ionization principles[190] .............................................................. 53
Figure 3.8 Illustration of a mass spectrometer MS V-Mode and each one of their parts,
along with UPLC that become a powerful tool for metabolite analysis ............................... 56
Figure 3.9 Basic information obtained from MS: A. Total ion chromatogram (TIC) B.
extracted ion chromatogram m/z and C. Exact mass measured spectrum and elemental
composition report ................................................................................................................ 58
Figure 3.10 Scheme of the clinical test followed to approach ETs metabolism. ................ 61
Figure 3.11 Layout of study design, different steps followed .............................................. 62
Figure 3.12 Scheme of in vitro test followed to identify microbial metabolites and potential
microbial species involved in ETs degradation .................................................................... 64
Figure 3.13 PCR process. 1. Denaturing, 2. Annealing, 3. Extension, 4. Cycles [202] ....... 66
Figure 3.14 DGGE principles: voltage, gradient, and direction of moving ......................... 68
Figure 3.15 Spatial distribution of microbes at a selected site in the gastrointestinal tract [1]
.............................................................................................................................................. 69

16
Figure 3.16 Example of the calibration of the retardation factor (Rf) between lanes and two
different gels ......................................................................................................................... 73
Figure 3.17 Process followed by Phoretix 1D® to obtain aligned bands between lanes and
gels and Excel file with band % corresponding to each retardation time. ............................ 74
Figure 3.18 Example of DNA sequences provided by GATC BIOTECH ........................... 76
Figure 4.1 Example of UV chromatogram (at 278 nm) of a urine sample from a volunteer
collected 3 days after ingestion of blackberry juice, including peaks and UV spectra of
glucuronide forms of urolithin A (UAG) and B (UBG). ...................................................... 80
Figure 4.2 MS2 Fragmentation of urolithin A and urolithin B ............................................. 81
Figure 4.3 MS2 fragmentation of urolithin A glucuronide ................................................... 81
Figure 4.4 Example of MS2 fragmentation pattern of Ellagic Acid, urolithins: UM5, UD
UC, dimethyl elagic acid glucuronide (DMEAG), methyl urolithin A (MUA) and dimethyl-
urolithin C (DMUC), and tentative prediction of some fragment ions ................................ 84
Figure 4.5 Concentration of primary urolithin A and B derivatives (aglycone and
glucuronides forms) in a urine spot, from 26 volunteers, collected at 51±5 h after ingestion
of 250 mL of blackberry juice diluted (50:50) with water. .................................................. 85
Figure 4.6 Total conversion of ETs to UA and UB derivatives (aglycone and glucuronide
determined by UPLC/DAD) excreted in urine over 4 days after ingestion of 250-mL of
tropical blackberry juice for 9 individuals (C,D,F,G,H,I,O,R,W) at different interventions.
.............................................................................................................................................. 87
Figure 4.7 Urolithin UA and UB detected in every one of the samples of urine excreted for
5 individuals up to seven days after they ingested a 250-ml of BBJ. ................................... 90
Figure 4.8 Excretion kinetics of UA(on the right) and UB(on the left) derivatives for four
individuals (C,G,H, and I numbered in chronological order) performed at different periods
of time around one year ........................................................................................................ 93
Figure 4.9 Example of UV chromatogram (at 278 nm) from a fermentation broth (EA as
substrate, 120 h fermentation, stool 96 h inoculate from individual G ................................ 95
Figure 4.10 Primary ellagitannins metabolites assessed after 24, 72 and 120 h of batch
anaerobic incubations of blackberry juice (A) and ellagic acid (B) with fecal stools donated
by nine volunteers (A, B,C,D,E,F,G,H,I), previously qualified as urinary .......................... 99
17
Figure 4.11 Suggested metabolite pathway occurring during incubation of pure ellagic acid
with active fecal stool from urolithin excreter.................................................................... 102
Figure 4.12 Schematic representation of proposed metabolic pathways of the excretion of
the main metabolites identified in human urine after ingestion of tropical highland
blackberry juice .................................................................................................................. 104
Figure 5.1 Hierarchical cluster analysis of the 26 PCR-DGGE profile PCR-DGGE
fingerprint corresponding to amplicons of the V3 region of 16S rDNA of faecal bacteria
from stool (Letter and number of lane corresponds respectively to volunteers identity and
number of repetition; Ctrl is a control lane with lactobacillus plantarum and E.Coli) ...... 107
Figure 5.2 Complete linkage cluster analyses of 1-r (1 minus the Pearson coefficient
between lanes) (Letter and number of lane corresponds respectively to volunteers identity
and number of repetition; Ctrl is a control lane with L. plantarum and E.Coli) ................ 108
Figure 5.3 Principal Component Analysis (PCA) of PCR-DGGE profile for 26 volunteers
and “urolithin excreters status” (N for “No urolithin excreters”, UA for “Predominant UA
excreters” and UB for “Predominant UB excreters”. ......................................................... 110
Figure 5.4 Score scatter plot of 26 individuals (plus some repetition) for PLS-DA
regression of PCR-DGGE bands “X” taking as response (“Y”) the urolithin excreters status
(R2Xcum=0.146, R2Ycum=0.68, Q2cum=0.49, CV-ANOVA<0.05). ............................. 111
Figure 5.5: Loading plot of the different bands from PCR-DGGE analysis “X” for PLS-DA
regression of PCR-DGGE bands “X” taking as response (“Y”) the urolithin excreters status
(R2Xcum=0.146, R2Ycum=0.68, Q2cum=0.49, CV-ANOVA p-Value =0.003) (Size of
“X” variable ........................................................................................................................ 112
Figure 5.6 PLS-DA regression coefficients with confidence intervals for the three different
groups, for each bands of the PCR-DGGE ......................................................................... 113
Figure 5.7 PLS variable importance for projection for each bands of the PCR-DGGE with
confidence intervals (R2Xcum=0.0525, R2Ycum=0.6, Q2cum=0.39, CV-ANOVA for UA
P-value =0.12, for UB 0.038 and for total urolithin 0.048 ) ............................................... 114
Figure 5.8 PLS regression coefficients for the “UB predominant excreters” group. ......... 115
Figure 5.9 Scatter plot (A) and Loading plot (B) of PCR-DGGE bands “X” (I) and
regression coefficients with confidence interval (C) obtained by OPLS taking as response
(“Y”), bioconversion ability index of ellagitannins into ellagic acid (EA index) (C1) and

18
into urolithin (UR index) (C2) (R2Xcum=0.232, R2Ycum=0.93, Q2
cum=0.60, CV-ANOVA p-
value for EA index and UR index P-value 0.07 and 0.04 respectively) (In graph I, size of
loading plot is proportional to “X” variable importance for projection of the model) ....... 117
Figure 5.10 Percentage of molar conversion of EA or ETs (EA equ.) into primary ET-
metabolites, when blackberry or ellagic acid (EA) are fermented 120 h with stools from one
individual (individual G) collected at 48h and 96h after consumption of 250 ml of
blackberry ........................................................................................................................... 122
Figure 5.11 DGGE gel of PCR products of variable V3 region from 16S rDNA of fecal
samples from 3 individuals (I , F and C) that donated fecal stool samples at 0, 48, 96 or
120 hours after ingesting one shot of 250-ml of BBJ. ........................................................ 123

19
LIST OF ABBREVIATIONS
BBJ: Blackberry juice BEH. Ethylene bridged hybrid DAD: Diode Array Detector DGGE: Denaturing Gel Gradient Electrophoresis DMEA: Dimethyl ellagic acid DMSO: Dimethyl sulfoxide DMUC: Dimethyl Urolithin C EA: Ellagic Acid EAME: Ellagic acid Methyl Ether ELSD Evaporative light scattering detector (ELSD), ESI. Electro Spray Ionization ET: Ellagitannins HPLC High pressure liquid chromatography kPa Kilo Pascal LC Liquid Chromatography LCMS Liquid Chromatography Mass spectrometry M.A.S.L Meters above sea level MeOH Methanol MS: Mass Spectrometer MUA: Methyl Urolithin A PCA: Principal Component Analysis PCR: Polymerase chain reaction PDA. Photo Diode Array PLS DA. Principal Least Square Discriminant Analysis Q-TOF. Quadrupole Time Of Flight Si-OH Silanols group SPE Solid phase extraction SPEC Solid phase extraction chromatography UA: Urolithin A

20
UAG: Urolithin A Glucuronide UAS: Urolithin A Sulfate UB: Urolithin B UBG: Urolithin B Glucuronide UBS: Urolithin B sulfate UC: Urolithin C UCG: Urolithin C Glucuronide UCM: Urolithin C methyl ether UD: Urolithin D UDM: Methyl urolithin D UM5: Urolithin M5 UPLC : Ultra Performance Liquid Chromatography

21
1 INTRODUCTION
Fruits, vegetables, and nuts are important components of a healthy diet, as they are rich
sources of vitamins, minerals, dietary fiber, and many other phytochemicals that are
important to prevent diseases and ensure health. Numerous epidemiological studies have
shown that regular consumption of these food groups help prevent major chronic
degenerative diseases such as cardiovascular diseases and certain types of cancer [4]. Most
of them show biological activity, following different mechanisms of action such as
antioxidant activity, modulation of detoxification enzymes, stimulation of the immune
system, reduction of platelet aggregation, alteration of cholesterol metabolism, modulation
of steroid hormone concentrations and hormone metabolism, blood pressure reduction, and
antibacterial and antiviral activity [5]. According to the World Health Organization (WHO)
[6], about 14% of gastrointestinal cancer deaths, 11% of ischemic heart deaths, and 9% of
stroke deaths are caused by low intake of fruits and vegetables. Ellagitannins (ETs), a type
of plant polyphenol found in berries, pomegranates, pecans, walnuts, wood-aged wine and
derived processed foodstuffs [7-13] could be an active protagonist in some chronic disease
prevention and in their nutritional management. Nonetheless, this class of polyphenols with
very high antioxidant capacity in-vitro has been largely neglected, from the nutritional
point of view due to their large and complex chemical structure, and their ability to bind
protein that limits their bioavailability. However, they have recently attracted particular
interest among scientists because of the high potential of biological activity of their colonic
derivatives. Actually, as ETs are not absorbed as such, they could be partially hydrolyzed
into ellagic acid (EA), either in the stomach or in the jejunum; and both ETs and EA can
reach the colon where they can also exert local benefits within the gastrointestinal tract
[14]. However ETs and ellagic acid can also be used as substrates by gut bacteria and be
converted into smaller and more bioavailable compounds called urolithins [15, 16] that
have important bioactivity and are able to exert systemic effects, given the time they remain
in the circulation system and the possibility to reach target organs and tissues. It has been
22
stated that urolithins may exert chemopreventive, anti inflammatory effects on the
gastrointestinal tract, prostate, and breast cancer and they can also prevent cardiovascular
diseases. However, variability in their ability to transform ellagitannins into urolithins has
been found in human beings. This has led to classify some volunteers as high or low
urolithin producers [17]. Accordingly, some consumers may not be able to obtain all the
health benefits from the consumption ETs rich food as the urolithins may not reach
sufficient physiological concentrations. To date, there are still many gaps to understand the
metabolic fate of ellagitannins. Studies about the inter and intra- individual variability of
urolithin production are scarce. The role of microbiota is not completely elucidated and
even less the interaction between host and colonic bacteria. The current knowledge on gut
bacteria and their role in metabolic pathways involved in polyphenol bio-conversions is still
limited. Today, the identification of bacteria species responsible of the transformation of
ellagitannins into urolithins is still unknown.
The aim of this study is to tackle these main challenges and, with the help of a
multidisciplinary approach, unravel the metabolic fate of ETs and the interaction with gut
microbiota.
First we are going to evidence the inter- and intra-variability of urolithin excretion pattern
on a cohort of 26 healthy volunteers. This research includes the identification, and in some
cases the annotation, of different urolithin compounds excreted in urine. Diversity of
excretion pattern will be studied, not only on urine spot, but also for longer periods of up to
7 days after blackberry juice ingestion. Afterwards, the bio-conversion of ETs into urolithin
will be simulated in-vitro to try to evidence the ability of gut microbiota to perform this
task. From the analysis of these results, we will suggest a bioconversion pathway and
discuss the possible interaction between microbiota and the host to explain the excretion
patterns observed. In the second chapter, we will try to evidence how gut microbiota
composition could influence the ability of the host to produce urolithins. With the help of
recently developed culture-independent techniques, we will profile the intestinal microbiota
of the volunteers to find common patterns according to the ability to produce urolithin, both
in-vivo and in-vitro. This method will create for the first time a tentative identification of
the species involved in the bioconversion of ellagitannins.
23
To achieve these objectives, the study required the articulation of different analytical tools,
from different scientific areas, such as biochemistry, microbiology, molecular biology,
nutrition and multivariate statistics. Multiple experimental approaches were also tested,
with in-vivo studies and in-vitro simulation. Additionally, this research was held in
different geographic sites, within the framework of a strong collaboration between the
Colombian Corporation of Agricultural Research, CORPOICA, the National Center for
Food Science and Technology, CITA, the Center for Natural Products Research, CIPRONA
from University of Costa Rica and the International Centre in Agricultural Research for
Development (CIRAD) in France. Tropical highland blackberry is a very important local
crop in mountain areas with depressions, in Latin-America from south Mexico to the
Andean “altiplano”, where large communities depend on this crop for survival [18]. This
work pays a tribute to these isolated and quiet peasant families that grow a food product
that could contribute to a healthier diet for the stressed urban population in developed and
developing countries.

24
2 LITERATURE REVIEW
2.1 ELLAGITANNINS
Plant polyphenols (PP), are secondary metabolites found in fruits, vegetables and derived
products composed of aromatic rings with hydroxyl groups bonded. They have several
functions in the prevention of degenerative diseases, and are one of the major antioxidants
in our diet. [19]. PP are divided in three groups: hydrolysable tannins, condensed tannins,
and floratannins, the smallest group [20]. Tannins in higher plants are classified as
hydrolysable or condensed. The former are readily hydrolyzed by acids, bases, hot water, or
certain enzymes (tannase) [7]. Hydrolysable tannins are divided in two subgroups,
gallotannins and ellagitannins, which form the largest group of tannins. Both of them are
synthesized from galloyl glucoses, and pentagalloyl glucose [21]. Different aspects of
ellagitannins have been studied, such as synthesis, chemical composition and structure,
bioavailability, metabolic pathways and their effects on health.
2.1.1 STRUCTURE
Ellagitannins, ET contain two or more neighboring galloyl groups that by oxidation form
hexahydroxydiphenoyl (HHDP) units [22]. These HHDP groups are esterified to a sugar,
usually glucose (Lei et al., 2001; Lee et al., 2005), and form the largest group of tannins
due to diverse possibilities of bonding HHDP residues with the glucose moiety, and their
ability to form dimeric and oligomeric derivatives [7]. Depending on the food source
ellagitannins exhibit important structural diversity. Punicalagins (C48H28O30) and punicalins
(C34H22O22) are the main ETs found in pomegranates [23] and are the most studied ETs so
far. Sanguiin H6 (C82H54O52), sanguiin H10 (C68H48O44), and lambertianin C (C123H80O78)
are the major ETs found in berries [7, 8, 24, 25]. Pedunculagin (C34H24O22) is the major
ellagitanin found in walnuts, while the isomers vescalagin (C41H26O26) and castalagin
(C41H26O26) predominate in oak-aged wine [26, 27]. According to the glucose core, ETs can

25
be classified into acyclic and cyclic glucose. Vescalagin, castalagin, castavaloninic acid are
examples of the first group, while casuarictin, pedunculagin, lambertianin C, Sanguiin H6
are representative ETs of cyclic glucose group [28]. Figure 2.1
Whatever the structural complexity of ETs, they all share a common core—the HHDP—
even if the number of monomer residues varies according to ET structure. Furthermore,
ellagic acid (EA) and direct derivatives are also found in free form in most ET-rich food
products [12, 29, 30], especially berries and nuts [7]. When ETs are exposed to acids or
strong bases, ester bonds are hydrolyzed and the HHDP acid spontaneously rearranged into
the water-insoluble dilactone, EA [7], as a consequence, the units of ellagic acid that can be
released per mol of each ET, can be estimated. For instance, each mol of punicalagins
Figure 2,1 A, has only one HHDP group and then releases only one mol EA. Sanguiin H6
that comprises four HHDP groups, renders four mol of EA; while Lambertianin C, Figure
2.1 B that contains six HHDP groups for each mol, can liberates six EA-mol.
2.1.2 OCCURRENCE
The content of ETs in plants is expressed usually as EA equivalents, which include ETs
such as, free EA, and EA derivatives which can be found in free form in most ET-rich food
products [12, 29, 30]. Among the major sources of ETs are trees and fruits, such as oak
(Quercus sp.) sweetgum (Liquidambar styraciXua), linden (Tilia sp.), aile (Alnus sp.),
eucalyptus species, chestnut (Castanea dentata), pomegranate, guava, strawberry,
Figure 2.1: A. Puncalagin; B. Lambertianin C10, and the HHDP group. [3]
HHDP group

26
raspberry, blackberry, pistachio, mango, hazelnut, walnut, pepper, plum, apricot, peach,
black raisin, red raisin, currant, tea, grape, wines, and aged brandies in oak casks [31-33]
but the most important dietary ellagitannins sources are berries and pomegranate, Table
2.1. [34]
Table 2.1 Major ellagitannins food sources
Source Total ellagitannins
Pomegranate juice 1500-1900 mg/L
Raspberry 2630 – 3300 mg /kg fresh weight
Raspberry jam 760 mg/kg fresh weight
Strawberry 770-850 mg/kg fresh weight
Strawberry jam 240 mg/1 kg fresh weight
Cloudberry 3150 mg/kg fresh weight
Blackberry 1500-2000 mg/kg fresh weight
Muscadine grape juice 8 – 84 mg/L
Muscadine grape wine 2 – 65 mg/L
Oak aged red wine 9.4 mg/L
Whiskey 1-2 mg / L
Cognac 31-55 mg/L
BERRIES
From the botanical point of view berry is a fruit produced from a single ovary, such as
grapes and blueberries, however commercially some aggregate fruits such as blackberries
and raspberries are consider as berries and they are amply known and consumed fruits, in
fresh and processed forms, such as jams and yogurts [7]. They are also known for their high
amount of polyphenols, [35, 36]. However ETs content is affected by internal factors such
as variety and ripeness, and external factors, especially those related to climate
(temperature, rain), cultural practice (molding, mulching, irrigation, fertilizing), among
others. [7, 32, 35-39].
27
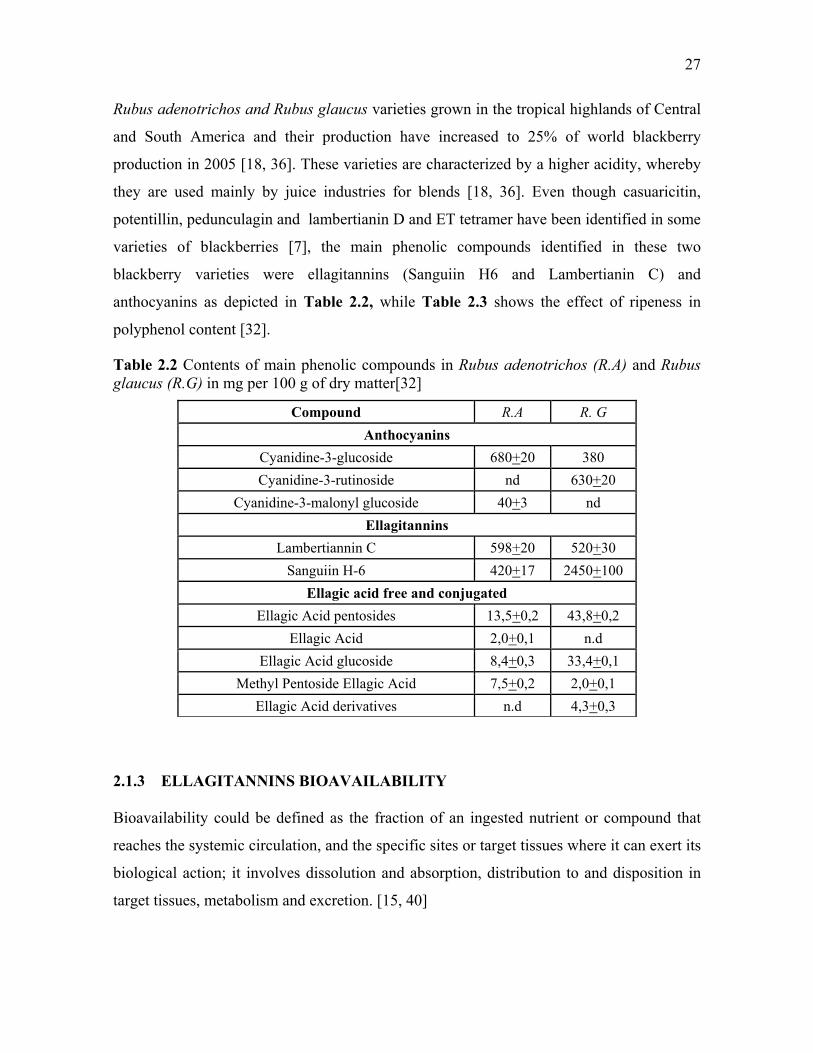
Rubus adenotrichos and Rubus glaucus varieties grown in the tropical highlands of Central
and South America and their production have increased to 25% of world blackberry
production in 2005 [18, 36]. These varieties are characterized by a higher acidity, whereby
they are used mainly by juice industries for blends [18, 36]. Even though casuaricitin,
potentillin, pedunculagin and lambertianin D and ET tetramer have been identified in some
varieties of blackberries [7], the main phenolic compounds identified in these two
blackberry varieties were ellagitannins (Sanguiin H6 and Lambertianin C) and
anthocyanins as depicted in Table 2.2, while Table 2.3 shows the effect of ripeness in
polyphenol content [32].
Table 2.2 Contents of main phenolic compounds in Rubus adenotrichos (R.A) and Rubus glaucus (R.G) in mg per 100 g of dry matter[32]
Compound R.A R. G Anthocyanins
Cyanidine-3-glucoside 680+20 380 Cyanidine-3-rutinoside nd 630+20
Cyanidine-3-malonyl glucoside 40+3 nd Ellagitannins
Lambertiannin C 598+20 520+30 Sanguiin H-6 420+17 2450+100
Ellagic acid free and conjugatedEllagic Acid pentosides 13,5+0,2 43,8+0,2
Ellagic Acid 2,0+0,1 n.d Ellagic Acid glucoside 8,4+0,3 33,4+0,1
Methyl Pentoside Ellagic Acid 7,5+0,2 2,0+0,1 Ellagic Acid derivatives n.d 4,3+0,3
2.1.3 ELLAGITANNINS BIOAVAILABILITY
Bioavailability could be defined as the fraction of an ingested nutrient or compound that
reaches the systemic circulation, and the specific sites or target tissues where it can exert its
biological action; it involves dissolution and absorption, distribution to and disposition in
target tissues, metabolism and excretion. [15, 40]

28
Table 2.3 Contents of main phenolic compounds by HPLC in blackberries (R. adenotrichos) at different maturity stages [36].
Grade 1 Grade 2 Grade 3
Ellagitannins (mg EA equivalents /g)
Lambertianin C 12.0 ± 1.0 11.0 ± 1.0 8.0 ± 0.4
Sanguiin H-6 10.0 ± 0.5 9.0 ± 0.4 6.6 ± 0.3
Anthocyanins (mg Cy-3-glc equivalents /g)
Cyanidin 3-glucoside 1.03 ± 0.03 3.10 ± 0.20 8.30 ± 0.30
Cyanidin 3-(6’malonyl) glucoside 0.111 ± 0.002 0.391 ± 0.005 0.660 ± 0.040
Flavonols (mg quercetin equivalents /g)
0.298 ± 0.002 0.231 ± 0.004 0.137 ± 0.002
Ellagic acid derivatives (mg EA equivalents /g)
0.300 ± 0.003 0.216 ± 0.004 0.202 ± 0.004
Total (mmol /g) 77.0 ± 5.0 74.0 ± 2.0 69.5 ± 0.3
There are many factors affecting the bioavailability of dietary polyphenols in humans:
external factors such as environmental aspects, food processing related factors, (i.e thermal
treatments; homogenization), food matrix factors, interaction with other compounds such as
proteins, chemical structure of polyphenols, concentration, and host factors like intestinal
transit or colonic microbiota [41]. Increasing evidence proposes that gut microbiota is one
of the most important factors contributing to the host response towards nutrients [42].
The large and complex chemical structure characteristic of ETs limits their bioavailability,
[43-48]. ETs have never been reported in the human systemic circulation system or in urine,
even after consumption of high amounts of dietary ETs [14, 24, 46, 47]. Ellagitannins have
been detected in plasma in only one case study of laboratory rats subjected to a prolonged
diet of ET-containing foods [49]. Despite dietary ETs are not bioavailable, they have been
found in relatively low concentrations in the gastrointestinal (GI) tract, including feces [17,
50, 51]. In human subjects who have undergone ileostomy, only 23% of the ellagitannin
sanguiin H6, ingested by consuming raspberries reaches the ileum (final section of the small
intestine), whereas recovery of free EA in ileum fluids increased 2.5 times [52]. This has
demonstrated that ETs are partially degraded into EA before reaching this region of the GI

29
tract. Many studies [14, 43, 44, 49, 50, 52-54] have shown that ETs are partially hydrolyzed
in the upper GI tract to EA. However EA, is poorly absorbed due to its low water solubility,
its tendency to form insoluble complexes with calcium and magnesium, and to bind to
intestinal epithelium [31, 47, 55]. In addition, in the colon and in fecal matter, ETs and EA
are found only at relatively low concentrations, which suggest they can be degraded by
intestinal microbials during intestinal transit [48, 49, 52, 56].
Other studies show ETs can be hydrolyzed by brush border membrane-bound
β−glucosidases, by gut bacterial β-glucosidases in the lower small intestine and colon, or
by the physiological conditions of the small intestine (mild alkaline pH, 7.0–7.3) to release
free EA, which is absorbed and further delactonized. EA is absorbed and rapidly methyl
conjugated by the action of the enzyme COMT (catechol O-methyl transferase) producing
EA monomethyl ether and dimethyl ethers. In a second step, conjugation with glucuronic
acid yielded the corresponding dimethyl-EA glucuronide which was the most abundant
metabolite detected in vitro test. [53, 57]. On the other hand, residual ellagitannins that
reach the colon are metabolized first into EA by microbial enzymes—tannin-hydrolase and
lactonase—which, respectively, cleave the galloyl-glucose residue from the HHDP group
and induce enzyme-catalyzed lactonization. Afterwards, farther down the GI tract, other
microbial derivatives—the polyhydroxylated dibenzopyranones—are synthesized from EA.
Microbial enzymes catalyze the opening of the lactone ring of EA and progressive
dehydroxylation to yield urolithins. Dehydroxylation of the polyhydroxylated
dibenzopyranones by microbial hydrolases first produces urolithin D (3,4,8,9-tetrahydroxy-
dibenzopyranone), then, urolithin C (3,8,9-trihydroxy-dibenzopyranone), urolithin A (3,8-
dihydroxy-dibenzopyranone) and finally, the smallest, the more lipophilic and more
available dibenzopyranone metabolite urolithin B (3-monohydroxy-dibenzopyranone), is
released [9]. Other microbial derivatives may also be metabolized such as 3,8,9,10-
tetrahydroxy-dibenzopyranone, isourolithins, and methyl derivatives.
The extent of hydroxyl removal from urolithins and the variety of metabolites produced
depend on the time of exposure to gut microbiota; the composition of microbiota; and,
eventually, the type of dehydroxylase enzyme involved [58]. The progressive
dehydroxylation from penta- to mono-hydroxy-dibenzopyranone are linked to an increase

30
in lipophilicity and adsorption ability [9, 59]. These metabolites are absorbed passively
through the epithelium where they can be conjugated in gut epithelium or undergo a phase
II metabolism (methylation, glucuronidation and sulphation) in the liver to render
metabolites more soluble that may to facilitate their excretion by urine or secretion in bile.
Glucuronidation utilizes a glucuronil group, a very common metabolite supplied by glucose
contain in foods, for which urolithins are preferably excreted through conjugation with
glucuronic acid under action of UGTs UDP-glucuronosyltransferases. Glucuronides are
often eliminated in the bile, to undergo enterohepatic circulation remaining more time in
the body, up to 56 hours, which increases the possibility to exert any systemic effect. The
easy absorption, the long residence time, and the concentrations reached for those colonic
metabolites in the plasma are the main features that support the possible bioactivity related
to ingestion of ellagitannins.
In slaughtered Iberian pigs fed with acorns, urolithins start to appear in the jejunum [9], and
31 microbial ET-derived metabolites were identified in the plasma, urine, and bile,
corresponding mostly to glycosylated and sulfated methyl glucuronides, glucuronidated
conjugates of urolithins, and EA methyl ether glucuronides. In the case of humans,
urolithins are probably synthesized in the large intestine, as healthy volunteers with
ileostomies do not produce urolithins [60, 61]. In healthy humans, the maximum
concentration of ETs metabolites is reached between 48 and 72 h, after ingestion of dietary
ETs, but the persistence of urolithin derivatives in plasma and urine lasts until the fifth day
[43], due to the enterohepatic recirculation [9, 54]. However, urolithin concentration in
both plasma and urine after ingestion of dietary ETs varies considerably between
individuals and depends on the assay conditions (i.e., amount of ET-rich food ingested,
concentration and type of ETs, and composition of food matrix) [62]. In some healthy
humans, urolithin A was found in plasma at concentrations as high as 18,6 µmol/L after the
third and fourth day of pomegranate juice consumption [43], others reported an average of
1 µmol/L whereas other healthy human subjects were not able to release urolithins. In
another study performed with 10 volunteers, urine was collected between 7 and 48 h after
ET ingestion. 50% of the subjects excreted relatively high concentrations of urolithins,
whereas others excreted very low amounts. In fact, one subject did not produce any
urolithins during the study period [60]. These observations led to the concept of “high-

31
urolithin producer” and “low-urolithin producer”. More than genetic factors, the high
variability of physiological responses to dietary ETs was attributed to differences in gut
microbiota ecology [17, 63, 64]. In vitro anaerobic incubations of EA with fecal
suspensions showed that, depending on the case, 80% of EA could be converted into
urolithins, while others either did not produce urolithins or only traces after 72-h
incubations [61]. In addition, variations between fecal suspensions were not only
quantitative but also qualitative, as the profiles of conversion of EA to urolithins D, C, A,
and B and other derivatives were markedly different [56, 61].
2.1.4 POTENTIAL IMPACT ON HEALTH
2.1.4.1 Reported Effect of Ellagitannins and EA.
Ellagitannins have been largely neglected in relation to their health benefits due to the high
protein precipitation capacity associated to proanthocyanidins and gallotannins, in in vitro
studies, but ETs have only a moderate one (e.g., Haslam et al., 1992; Kilkowski & Gross,
1999[65]. Regarding antioxidant activity ETs show the highest activity comparing to
galloylglucoses, gallotannins and proanthocyanidins (condensed tannins) [21].
Despite their high antioxidant capacity [29, 66-69] ETs health benefits have been
associated to other important biological properties, such as anticancer [70-72], anti-
atherogenic, anti-thrombotic, anti-inflammatory, anti-angiogenic effects, [73],
antihepatoxic, antibacterial and anti-HIV replication activities as mentioned in previous
reviews [7].
Furthermore the hydrolytic derivatives of EA has also been extensively studied and
associated to health benefits such as antioxidative, anti-inflammatory, anti-hyperlipidaemic
and anticarcinogenic activities in a wide range of assays, both in vitro and in vivo [37, 53,
74-88], among other biological activities. However, given the metabolic studies that have
shown the poor bioavailability of ETs and EA, it has been proposed that these compounds
are able to exert only local health benefits in the colon, whereas the urolithins are the
compounds that exert the most import health benefits such as prevention of cardiovascular
diseases, anti inflammatory effects, chemoprevention of colorectal cancer, prostate and
breast cancer under different mechanism of action. Tables 2.4, 2.5, 2.6, show the most
32
important results from intervention trials at clinical, animal and cell level, in which the
health benefits attributed to ETs, EA and urolithins were evaluated.
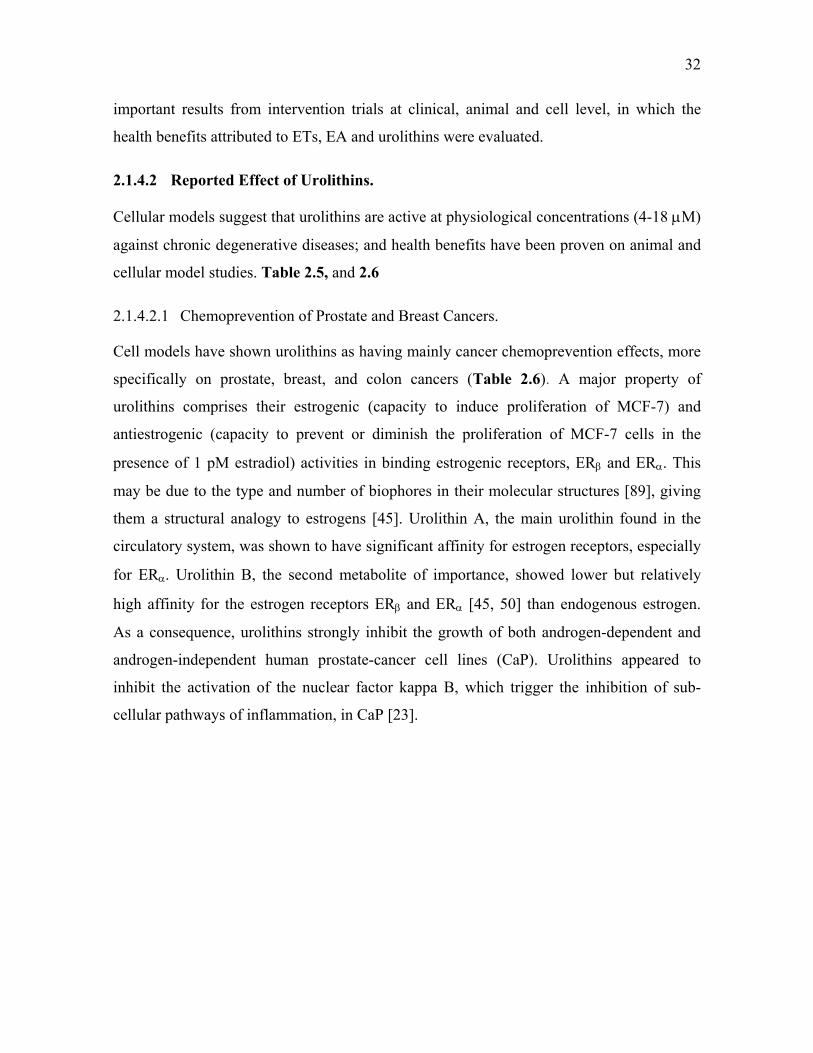
2.1.4.2 Reported Effect of Urolithins.
Cellular models suggest that urolithins are active at physiological concentrations (4-18 μM)
against chronic degenerative diseases; and health benefits have been proven on animal and
cellular model studies. Table 2.5, and 2.6
2.1.4.2.1 Chemoprevention of Prostate and Breast Cancers.
Cell models have shown urolithins as having mainly cancer chemoprevention effects, more
specifically on prostate, breast, and colon cancers (Table 2.6). A major property of
urolithins comprises their estrogenic (capacity to induce proliferation of MCF-7) and
antiestrogenic (capacity to prevent or diminish the proliferation of MCF-7 cells in the
presence of 1 pM estradiol) activities in binding estrogenic receptors, ERβ and ERα. This
may be due to the type and number of biophores in their molecular structures [89], giving
them a structural analogy to estrogens [45]. Urolithin A, the main urolithin found in the
circulatory system, was shown to have significant affinity for estrogen receptors, especially
for ERα. Urolithin B, the second metabolite of importance, showed lower but relatively
high affinity for the estrogen receptors ERβ and ERα [45, 50] than endogenous estrogen.
As a consequence, urolithins strongly inhibit the growth of both androgen-dependent and
androgen-independent human prostate-cancer cell lines (CaP). Urolithins appeared to
inhibit the activation of the nuclear factor kappa B, which trigger the inhibition of sub-
cellular pathways of inflammation, in CaP [23].

33
33
Table 2.4 Recent prospective clinical studies of consumption of food rich in ellagitannins
Ets Source ETs intake Status
(Subjects number) Duration
intervention Biomarker affected Mains biomarker not affected Ref
Pomegranate juice Daily juice supplementation Healthy(10) 1 and 3 years Decrease in arotid intima-media
thickness (IMT) [90]
Pomegranate juice 50 ml daily Healthy (10) non-insulin dependent diabetes mellitus (10)
3 month
Reduction of cellular peroxides (by 71%), and increased glutathion levels (by 141%). Decreased the extent of Ox-LDL cellular uptake (by 39%)
[91]
POMx capsules 1 capsule/days (410-850 mg GAE)
Overweight (64/32)
4 weeks Increase in plasma antioxidant status
Glucose, BUN, creatinine, lipids, insulin, c-peptide, paraoxonase-1, or electrolytes or liver enzymes (AST or ALT)
[69]
Pomegranate juice 230 ml daily patients with prostate cancer (24) 54 months Significant reduction of prostate
specific antigen [92]
Commercial pomegranate extract in capsule
2*400mg in a single administration
Healthy (11) 24 h + 32% ORAC plasma antioxidant activity at 30 min
Generation of reactive oxygen species (ROS), inflammation marker interleukin-6 (IL-6)
[46]
Pomegranate juice 400 ml juice Healthy 5 weeks No benefit
Serobiochemical and haematological, urinary 8-iso-PGF(2 alpha), respiratory function variables and clinical symptoms of chronic obstructive pulmonary disease
[93]
Pomegranate juice 240 ml/day patients with CHD and myocardial ischemia
3 month Stress-induced ischemia decreased No changes in cardiac medications, blood sugar, hemoglobin A1c, weight, or blood pressure
[94]
Pomegranate juice 50 ml/day hypertensive patients 2 weeks
36% decrement in serum angiotensin converting enzyme (ACE) activity and a 5% reduction in systolic blood pressure
[95]
Mixed nuts 30g/day subjects with metabolic syndrome 12 weeks Increased excretion of serotonin
metabolites [96]
Strawberry 250 g daily healthy 3 weeks Lipid peroxidation lag time increased by 20%
DNA strand breaks in lymphocytes, and activity of phase II enzymes. [97]

34
34
Table 2.5 Summary of intervention studies with animals to evidence health benefits of dietary ETs Product ingested Objective Dose used Results Ref
Pomegranate extract
DU145, LNCaP, 22Rv1 LNCAP-AR cells Human prostate cancer cells (LNCaP) injected subcutaneously into mice
0.3 mg equ. punicalagin/mice
-Urolithins inhibited the growth of both androgen-dependent and androgen-independent prostate cancer cell lines, with IC50 values lower than EA. -EA and UA decreased prostate cancer xenograft size, tumor vessel density in 4 weeks
[98]
Raspberry juice Heart health Equ. 275 ml by a 70 kg human
Inhibited cardiac and aortic production of superoxide anion and increased hepatic glutathione peroxidase. lower plasma triglyceride level.
[99]
Blackberry extract Antioxidant 2.68mg EA eq kg−1 body weight Wistar rat
Reduced thiobarbituric acid reactive substance levels and increased glutathione levels in the liver, kidney and brain [100]
Berry juice and tea berry
atherosclerosis in hamsters
Equivalent to 275 ml by a 70 kg human
Inhibited aortic lipid deposition by 79–96% and triggered reduced activity of hepatic anti- oxidant enzymes after 12 weeks
[101]
Black raspberries extract Anti-cancer 45 g per day Inhibit esophageal tumorigenesis [102]
freeze-dried berries
Esophagus and colon cancer 0.25-0.5 mg/kg body weight
Inhibition of rodent esophagus cancer by 30-60% and of the colon by up- to 80% Reduction of levels of carcinogen-induced DNA damage.
[103]
Purified Geranniin from Geranuuim thunbergii
Plasma antioxidant level 20 mg/rat Increase plasma ORAC antioxidant value after 6 hours of ingestion [104]
Lyophylized black raspberries, LBRs
Inhibition of N- NMBA-induced esophageal tumorigenesis in the rat during initiation and post initiation of carcinogenesis
0.25 mg/kg, weekly for 15 weeks and throughout a 30-week bioassay,
Reduced tumor multiplicity (39 and 49%, respectively). Inhibit adduct formation (64%) after NMBA administration at 0.50 mg/kg
[105]
0.25 mg/kg, three times per week for 5 weeks
At 25 weeks, both 5 and 10% LBRs significantly reduced tumor incidence (54 and 46%, respectively), tumor multiplicity (62 and 43%, respectively), proliferation rates, and preneoplastic lesion development
EA
mitochondrial damage in beta adrenergic agonist induced myocardial infarction
EA (7.5-15 mg/kg)/ 10 days Protective effect of EA against mitochondrial damage in myocardial infarction [85]
EA Apoptosis 60 mg/kg body weight p.o. every day Prevention of P13K-AKT activation in 15 weeks [106]
EA Anti-inflammatory properties 4 mg/kg rat Significantly reduce paw edema [77]
EA, robinetin, myricetin
Inhibitory effect on tumorigenecity of B[a]P 7,8-diol-9,10-epoxide-2 on mouse skin in the newborn mouse.
300 nmol 59- 66% Reduction in the number of skin tumors; after 15 and 20 weeks of promotion with 12-0-tetradecanoylphorbol-13-acetate
[76] 45, 90, 180 nmol EA
200, 400, 800 nmol robinetin, myricetin
Avoid the formation of tumors in animals killed at 9-11 months later 44 — 75% inhibition in the- number of diol-epoxide-induced pulmonary tumors per mouse
Pomegranate extract and urolithin A
Colon inflammation 250 mg PE/Kg day 50 mg UA/Kg day
Both PE and UROA decreased inflammation markers (iNOS, cycloxygenase-2, PTGES and PGE2 in colonic mucosa) and modulated favorably the gut microbiota, (increase in lactobacilli and bifidobacteria).
[107]
Pomegranate extract Urolithin A
Inhibition of tumor xenograft (LAPC-4) grow in immune compromised SCID mice
Orally / intraperitoneal PG: 0.8 mg/mouse/dose 5days / week UA: 0.3 mg/mouse/dose
Inhibition of 50% of tumor volume 2 weeks after
[108]
Urolithin A Anti-inflammatory effect carrageenan-induced paw edema in mice
5 mg/mice Reduction of paw edema after one hour of oral administration, increase of ORAC plasma level [109]

35
35
Table 2.6 Summary of some recent results obtained on cell-models by ETs, EA and urolithins Product tested Cell-lines Dose Results Ref Punicalagin, EA
Colon cancer cell lines (HT-29 and HCT116) 100 μg/ml Potent anti-proliferative activity [68]
Pomegranate juice (PJ) total pomegranate tannins TPN Punicalagin (P)
Colon cancer cell line (HT-29)
50 mg/L punicalagin
Suppressed COX-2 expression by 97% (PJ); 55 % (TPN). 48% (P) respectively. TPT and P at 100 mg/L suppressed TNkF binding 10-fold and 3,6 fold respectively
[71]
Pomegranate juice extract Prostate cancer Regulation of androgen-
independent prostate cancer cells [110]
Raspberry extracts
Human cervical cancer (HeLa) EC50= 17.5 μg/ml GAE Inhibition of the proliferation of
cancer cells [111]
Berry extracts
Human oral (KB, CAL-27), breast (MCF-7), colon (HT-29,HCT116), and prostate (LNCaP), Caco-2
25 to 200 µg/ml Dose dependant inhibition in all cell lines [39]
Crude strawberry extract EA
Human oral (CAL-27, KB), colon (HT29, HCT-116), prostate (LNCaP, DU145)
100 μg/ml Cell growth inhibition [112]
ETs , EA Caco-2 cells colon cancer 1-30 μM 1-100 μM
Apoptosis of cancer cells, Mitochondrial pathway, release of cytochrome C
[53]
EA Colon, breast, and prostatic cancer 1-100 μM Induce dose dependant apoptosis [83]
EA Colon cancer cells (SW480) 10M Induce dose dependant apoptosis [113]
EA Human neuroblastoma (SH-SY5Y)
1-100 μM ; 96 h
growth inhibition, cell detachment and apoptosis [114]
Punicalagin EA UA UB UC
PMA- cells (normal cells)
Punicalagin (IC50 =1.4 μM) EA(IC50 =1.1 μM) UA (IC50 =13.6 μM) UB(IC50= 0.33 μM) UC (IC50 =0.16 μM)
Cellular antioxidant capacity [14]
EA ETs UA
Colon cancer (293T) ETs (IC50 =30.0 μg/ml) EA (IC50= 63 μM) UA (IC50 =39 μM)
Inhibited Wnt signaling Reduce colon carcinogenesis [54]
UA UB UC
Prostate cancer
After 24 h UA (IC50 =13 μM) UB(IC50= 17 μM) UC (IC50 =27 μM)
Inhibition of CYP1B1protein expression
[115]
EA,UA,UB Breast Cancer Significant inhibition when UB=5 μM
Chemoprevention of breast cancer. Inhibition aromatase activity
[72]
EA Pre-B acute lymphoblastic leukemia (ALL) cell lines 100 μg/ml Induce apoptosis in high-risk
leukemia cells [116]
EA, UA UB Colon cancer Caco-2 40 μM
Chemopreventive effects, modulate phase I and phase II detoxifying enzymes
[75, 117]
UA, UB Breast cancer (MCF-7)
IC50 ERα and ERβ binding assays were: 0.4 and 0.75 μM for UA; 20 and 11 μM for UB
Estrogenic antiestrogenic activity [45]
UA; UB, MUA, MUB; UBS; acetylated-UB
Breast cancer UB highest at 2;35 :4,7 μmol/L
UB Inhibit significantly aromatase activity and testosterone-induced MCF-7aro cell proliferation
[72]
EA Cervical cancer 10 μmol/L Inhibit cell growth and induce apoptosis [79]

36
36
Urolithins were also found to inhibit activity of the enzyme CYP1B1. This inhibition
may affect the three stages of prostate cancer development. Urolithins therefore, appear
to display a dual mode of action—inhibiting the activity and/or expression of the
enzyme. Urolithin A and B inhibit CYP1 E ROD activity by inhibiting both the protein
expression and the activity of CYP1B1; and thus decreasing the incidence of prostate
cancer [118]. In addition, if used as an adjuvant during chemotherapy, these microbial
metabolites appear to decrease the resistance to the drug mediated by CYP1B1.
Urolithin A glucuronide and, in a much lesser amount, dimethyl ellagic acid were
reported as accumulating in human prostate tissues after subjects had consumed
pomegranate juice [50]. Subjects who had received the primary treatment of surgery or
radiation also demonstrated significant decrease in prostate-specific antigens (PSA)
after consuming pomegranate juice [23, 92]
All these findings, along with animal studies [98, 108] (Table 2.5), justify the high interest
in ET-rich diets as preventing prostate cancer. Less information has been published so far
on the urolithins’ role in reducing risks of breast cancer, although they have been shown in
vitro to significantly enhance the apoptosis of breast-cancer cell lines [45, 71, 72] (Table
2.6).
2.1.4.2.2 Chemoprevention of Colorectal Cancer.
Cell models have shown that urolithins induce dose-dependent apoptosis of colon-cancer
cells [54, 75, 117]. Urolithins A and B appeared to modulate phases I and II detoxifying
enzymes in Caco-2 cells [117]. Both phase enzymes enhance the detoxification of
carcinogenic compounds. Another study proposes an additional pathway by modulating
the expression levels of multiple genes in the epithelial cells lining the colon. This
pathway might be used by EA and urolithins A and B, thereby exerting an effect towards
reducing risks of colon cancer [75]. This study suggested the urolithins’ antiproliferative
activity may be due to the modulation of gene expression, including the MAPK/ERK
pathway signaling. Urolithin A can induce cell cycle arrest, and modulate key cellular
processes associated with colon cancer development, such as MAPK signaling in vitro.
Additionally, urolithin A was shown to inhibit Wnt signaling with IC50 at even lower
concentrations than for EA [54].

37
37
2.1.4.2.3 Anti-Inflammatory Effect
The inhibition effect of urolithins on cancer may also be due to the anti-inflammatory
activity, as urolithin A was also found to decrease inflammatory biomarkers in a colitis
rat model, including nitric oxide synthase, cyclooxygenase-2 (COX-2), prostaglandin E
synthase, and prostaglandin E2 [107]. Oral ingestion of EA and urolithin A has also
been shown to quickly and significantly decrease inflammation in the rat’s-paw edema
model [77, 109]. This anti-inflammatory effect was also observed in a clinical study on
both healthy and non-insulin-dependent diabetic patients consuming pomegranate juice,
which greatly reduced cellular peroxides and increased glutathione levels [91] after 4
weeks of daily intake. However, another study using a much shorter period (24 h) found
that inflammation biomarkers such as interleukin-6 remained unchanged [46].
2.1.4.2.4 Prevention of cardiovascular disease (CVD)
Consumption of ET-rich food has also been associated with cardiovascular health.
Clinical studies have demonstrated inhibited lipid peroxidation [91, 97]; antiatherogenic
activity [119]; reduced stress-induced ischemia [94]; reduced systolic blood pressure
[95]; reduced platelet aggregation [120]; and decreased carotid intima-media thickness
and angiotensin-converting enzyme, which are linked to artery distensibility [90, 95].
2.1.4.2.5 Antioxidant activity of urolithins
Contrary to what was previously shown by strictly chemical antioxidant assays [43,
121], cell-based assays showed that the urolithins’ antioxidant activity correlated with
the number of hydroxyl groups and molecule lipophilicity. The most potent antioxidant
urolithins were C and D, with IC50 values, respectively, at 0.16 and 0.33 μM, followed
by urolithin A with an IC50 value of 13.6 μM. Urolithins C and D presented lower
activity than their parent molecules—respectively, EA and punicalagin—which had IC50
at 1.1 and 1.4 μM, respectively [14]. The monohydroxylated urolithin B and the derived
methylated compounds did not show antioxidant activity.
Although urolithin A presented the weakest antioxidant activity, its IC50 remained at
physiological concentration, at least for high-urolithin producers, and thus may
potentially contribute to in vitro antioxidant capacity. However, antioxidant capacity is
apparently not a major property of the most bioavailable ET metabolites (urolithins A
and B), at least, not in chemical or in vitro cell-based tests. Clinical studies showed a

38
38
slight increase in the antioxidant capacity of plasma after long-term consumption of ET-
rich food [46, 69, 97], whereas another study failed to show this [93]. Again, the high
variability of physiological responses in human subjects during clinical studies is not
conclusive. Their nature as a “low-urolithin producer” or “high-urolithin producer”
should be taken into account to better demonstrate the in-vivo antioxidant potential of
urolithins.
2.1.5 TOXICITY OF DIETARY ELLAGITANNINS
Various pharmacokinetics and toxicity studies have proven that ET-rich foods are not
toxic even when consumed in large amounts [122, 123]. For example, a daily diet of
30% oak-flavored milk powder, containing large quantities of ellagitannins, was not
toxic to rats for almost 100 days. Urolithin A and its glucuronide were detected in feces
and urine, but no accumulations were found in the liver or kidneys, as corroborated by
histopathological analyses. Nor were accumulations found in the uterus. Neither did the
diet change common biomarkers in the blood [124]. Another study, using high doses of
pomegranate in the rats’ diet, had similar results, except for urea and triglycerides,
which remained low throughout the experiment, because the diet was of lower
nutritional value than standard rat food [49]. Clinical trials on overweight human
subjects indicated that ETs as a dietary supplement are safe for human, with up to 870
mg of gallic acid equivalents per day (i.e., equivalent to about 8 liters of pomegranate
juice per day) over 1 month [69].
2.2 GUT MICROBIOTA AND BIOCONVERSION OF DIETARY
COMPOUNDS
Human colon harbors complex microbial ecosystems distributed along the entire GI tract
and integrated by more than 800 different bacterial species [125, 126], that include
species of resident microflora and transient microbes from food- and water-borne sources
[127]. Density and diversity of gut microbiota increase from the stomach to the colon
[126, 128]; and this is strongly affected by intestinal transit time [129]. Microbiota
composition is claimed to be individual-specific and influenced by genotype, diet and
lifestyle among others, [1, 62, 130]. Colonic microbiota is dominated by strict
anaerobes, which are present in 1000-fold higher than facultative anaerobes [16, 131].

39
39
The restricted access to the different compartments of the GI tract and the difficulty to
grow gut bacteria by classical means has limited their study, while the knowledge about
microbiota composition and functionality is quite scarce in scientific literature. For
many years, only faecal culture methods were used to study gut microbiota composition,
consequently the studies were biased as they quantified only culturable bacterial
species; and besides faecal samples are not representative of bacterial communities
inhabiting the caecum and ascending colon [131].
Fortunately, recent advances in independent culture methods based on the sequence
variability of the 16S rDNA genes have led to identify the most common bacterial phyla
inhabiting the gastrointestinal tract [132]. From culture studies, it has been pointed out
that the Firmicutes phylum is the most common bacterial species present in the gut,
with 208 members identified, followed by Gamma proteobacteria with 67 members
[133]. However from the subunit ribosomal RNA (SSU rRNA) study, 301 members of
Firmicutes phylum were identified, while from the clostridium phylum 174 members
were identified [126, 134]. Figure 2.2 shows a proposed phylogenetic tree of the human
gastrointestinal microbiota composition.
A recent study based on molecular methods and conducted on a large population in
different European countries suggested that all humanity could be clustered in three
main enterotypes according to the predominant bacterial flora in their gut,
Ruminococcus, Bacteroides and Prevotella [135]. In this study, it was shown that on
Figure 2.2 Phylogenetic tree of the microbial diversity in the human gastrointestinal tract,based on the 16S rDNA bacterial sequence data [2]

40
40
average 50% of Europeans belong to the group where Ruminococcus prevail in
microbiota, 30% to Bacteroides and 20 % to Prevotella. Additionally, these specific
groups were apparently associated with specific diet, Bacteroides species being more
common in people consuming more meat proteins, and Prevotella associated to
vegetarian diets.
Further advances in the characterization of taxonomic composition, metabolic activity,
and immunomodulatory capacity of the human gut microbiota, has led to assess its role
in human health and disease [136]. The gut microbiome (microbial genome) represents
therefore a gene number that is 150 times greater than the human genome [42]; and thus
encode a spectrum of metabolic capabilities beyond that of the host genome, whereby
the microbiota can be considered as a relevant component of human physiology [136].
The human-microbial ecosystem comprises a considerable metabolic versatility, using
biological pathways that humans are not able to do [15]. Growing evidence suggests that
gut microbiota is one of the most important factors contributing to the host response
towards nutrients [42]. The gut microbiota interacts symbiotically with the host with an
unlimited metabolic potential [129, 133, 137]. The host-microbiota relation is a
homeostatic symbiosis, in which the host provides the microbiota with nutrients and a
stable environment, while microbiota may modify epithelial expression of genes
involved in many different functions concerning immune or neuroendocrine system,
metabolism, or general cellular functions among others [1, 62]. The gut microbiota
exhibit strong metabolic activity at different extension, as it is involved in the
catabolism of a vast range of dietary and endogenously secreted compounds,
participating in the control of energy regulation, nutrients metabolism and
transformation of xenobiotics. [125].
The gut microbiota is able to convert dietary compounds that are not bioavailable as
such into lower-weight metabolites that can be absorbed. Microbial enzymes can
hydrolyze glycosides, glucuronides, sulfates, esters, and lactones and operate ring-
cleavage, reduction, decarboxylation, demethylation, and dehydroxylation
reactions[137]. Although information is still scarce in this thriving research field, Table
2.7 summarized the main studies on known dietary compounds metabolized by gut
microflora into more bioactive compounds.

41
41
Butyrate was the first colonic metabolite observed that comes from the ingestion of
dietary fibers. A wide variety of butyrate-producing bacteria belonging to the
Firmicutes phylum have been identified. Butyrate is the main source of energy of
colonocytes, and its bioactivity is specially related to the health state of the colon [131,
138].
Conjugated linoleic acids (CLAs) are other colonic metabolites that have been studied.
CLAs represent a group of isomers of linoleic acid released by a combination of
lactobacilli and bifidobacteria using linoleic acid as substrate [131]. The bioactivity of
these metabolites is high, and includes anti-inflammatory and cancer-preventive
properties, decreasing cancer cell viability and inducing apoptosis [139].
Table 2.7 Main studies on bioconversion of dietary compounds into bioactive colonic metabolites [131]
Dietary component Food Source Colonic microbiota metabolite References Dietary Fibers Grains or derivatives Butyrate [138-146] Linoleic acid Vegetable oils Conjugated Linoleic Acid, CLA [147-149] Daidzein Soy Equol [150-160] Secoisolariciresinol Flaxseed, sesame Enterolactone, enterodiol [161-167] Isoxanthoumol Hops/hop-derived
products 8-PN [168-171]
Ellagic acid berries, walnuts, pomegranate
Urolithins A and B [14, 45, 50, 54, 75, 107, 115, 117, 172-176]
Equol is another colonic metabolite produced during the metabolism of daidzein, the
main isoflavones in soy beans. However, it was shown that only 30% of humans are
able to transform dietary isoflavone daidzeine into equol [152]. Equol is a bioactive
compound with anti-androgenic activity [177] and strong estrogenic activity which
means that equol producers have a lower risk of developing prostate and breast cancer
[178].
These equol studies revealed for the first time the importance of gut microbiota in
human health, as japanese women were able to take more advantages of the hormone
substitutive therapy treatment by ingesting soy derived food while it was mostly
ineffective in their European counterparts. In fact, japanese women were more able to
convert soy isoflavone into equol, the bioactive colonic metabolite. Intensive research
led to the identification of some gut microorganisms able to perform such

42
42
bioconversion. More recently, it was shown that equol production was positively
correlated with the abundance of sulfate-reducing bacteria, and negatively correlated
with Clostridium coccoides–Eubacterium rectale counts [168]. Other studies have been
carried out but were unsuccessful in identifying the microorganisms responsible for
daidzein bioconversion [152, 178-180]. Finally, a NATTS strain, a Gram-positive, non-
sporulated rod bacteria, belonging to genus Slackia (Actinobacteria) was found to
convert daidzein into equol [181]. Additionally, anaerobic incubation mixture of two
bacterial strains Eggherthella sp Julong 732 and Lactobacillus sp. Niu-O16 were also
able to release equol in vitro [180]. Other investigation reported that strains FJC-A10
and FJC-A161 could metabolize dihydrodaidzein to equol along with Julong 732 [179].
Plant lignans such as secoisolariciresinol ingested with beer, for example, are also a
substrate for gut microbiota, which is able to metabolize them into enterodiol and
enterolactone. Conversely to daidzein the bio-conversion of secoisolariciresinol to
enterodiol and enterolactone is common in most studied human subjects. Eleven
bacterial species involved in the metabolism of secoisolariciresinol diglucoside have
been isolated so far from human feces. The bioconversion of the dietary lignan
secoisolariciresinol diglucoside (SDG) via secoisolariciresinol (SECO) to the
enterolignans enterodiol (ED) and enterolactone (EL) is carried out by phylogenetically
diverse bacteria. Strains of Bacteroides distasonis, Bacteroides fragilis, Bacteroides
ovatus, Clostridium cocleatum, an isolated strain Clostridium sp. SDG-Mt85-3Db, are
as well as strains of Butyribacterium methylotrophicum, Eubacterium callanderi,
Eubacterium limosum, Peptostreptococcus productus, Clostridium scindens and
Eggerthella lenta strains are involved. The dehydrogenation of ED to EL is carried out
by strain ED-Mt61/PYG-s6. [162]. Lignans have showed estrogenic,
hypocholesterolemic, antiatherogenic and antioxidant activities, which can be
considered as protective against breast and prostate cancer, coronary and heart disease
[161, 163, 164].
Prenylfavonoids, (xanthohumol, isoxanthohumol) and 8-prenylnaringenin (8-PN) are
other groups of compounds present in hops and derived products that were shown to be
bioconverted by gut bacteria. 8-PN is a bacterial metabolite resulted from
isoxanthohumol biodegradation [171]. Like equol, 8-PN apparently occurs in only one
third of humans. In this case Eubacterium limosum appeared to be involved in the

43
43
conversion [182]. In contrast, 8-PN is one of the most potent phytoestrogens but is less
effective than xanthohumol in inhibiting growth of colon cancer cell lines [170].
Nonetheless, the current knowledge on the interaction between dietary compounds and
gut microbiome, enzymes and metabolic pathways involved is still scarce and limited to
food products with huge commercial interests such as soybean and beer. Studies on the
bioconversion of ellagitannins and ellagic acid have only emerged very recently and no
information is available yet about the species of colonic microorganisms that could be
involved in this bioconversion process.
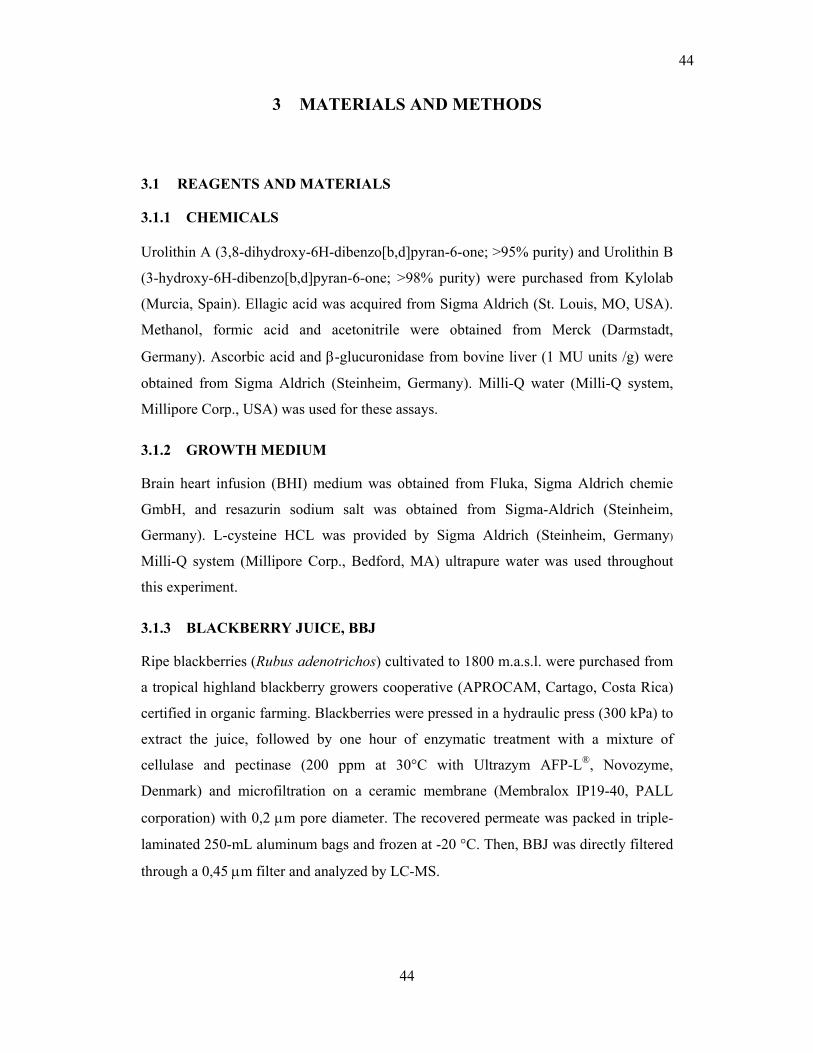
44
44
3 MATERIALS AND METHODS
3.1 REAGENTS AND MATERIALS
3.1.1 CHEMICALS
Urolithin A (3,8-dihydroxy-6H-dibenzo[b,d]pyran-6-one; >95% purity) and Urolithin B
(3-hydroxy-6H-dibenzo[b,d]pyran-6-one; >98% purity) were purchased from Kylolab
(Murcia, Spain). Ellagic acid was acquired from Sigma Aldrich (St. Louis, MO, USA).
Methanol, formic acid and acetonitrile were obtained from Merck (Darmstadt,
Germany). Ascorbic acid and β-glucuronidase from bovine liver (1 MU units /g) were
obtained from Sigma Aldrich (Steinheim, Germany). Milli-Q water (Milli-Q system,
Millipore Corp., USA) was used for these assays.
3.1.2 GROWTH MEDIUM
Brain heart infusion (BHI) medium was obtained from Fluka, Sigma Aldrich chemie
GmbH, and resazurin sodium salt was obtained from Sigma-Aldrich (Steinheim,
Germany). L-cysteine HCL was provided by Sigma Aldrich (Steinheim, Germany)
Milli-Q system (Millipore Corp., Bedford, MA) ultrapure water was used throughout
this experiment.
3.1.3 BLACKBERRY JUICE, BBJ
Ripe blackberries (Rubus adenotrichos) cultivated to 1800 m.a.s.l. were purchased from
a tropical highland blackberry growers cooperative (APROCAM, Cartago, Costa Rica)
certified in organic farming. Blackberries were pressed in a hydraulic press (300 kPa) to
extract the juice, followed by one hour of enzymatic treatment with a mixture of
cellulase and pectinase (200 ppm at 30°C with Ultrazym AFP-L®, Novozyme,
Denmark) and microfiltration on a ceramic membrane (Membralox IP19-40, PALL
corporation) with 0,2 μm pore diameter. The recovered permeate was packed in triple-
laminated 250-mL aluminum bags and frozen at -20 °C. Then, BBJ was directly filtered
through a 0,45 μm filter and analyzed by LC-MS.
45
45
3.2 ANALYTICAL METHODS
Liquid chromatography and mass spectrometry were the methods chosen to analyze
urine and broth cultures looking for ETs metabolites that shed lights on the metabolic
pathway followed by blackberry ellagitannins once BBJ is ingested.
3.2.1 SAMPLE PREPARATION
3.2.1.1 Urine preparation
For LC-MS urine analyses, the sample preparation can be limited to centrifugation in
order to remove particulates, and subsequently dilution with water (1:1 to 1:3 vol/vol) in
global metabolites analysis to minimize potential analyte losses [183]. However in a
target metabolic profile, metabolites can be isolated by simple methods such as solid
phase extraction (SPE), solid phase extraction chromatography (SPEC) or preparative
HPLC. SPE is an efficient selective isolation multistage separation technique, and even
though is a time-consuming multi-step process, it was the method chosen to prepare the
urine for further analysis. Therefore, a SupelcleanTM LC-18 extraction cartridges
(reverse phase Supelco Analytical USA) were activated with 3 mL of MeOH and 10 ml
of water, and subsequently a 10-mL urine sample was carefully added. After the total
sample had passed through the cartridge, Milli Q water (3x3 mL) was added to wash the
cartridge and remove all the water soluble components. Then MeOH was added (3x1
mL) to remove the target compounds. Each methanolic fraction was recovered and
filtered through a 0.45 μm membrane filter (Waters Millipore) and then analyzed
independently for ET-metabolites.
Enzymatic treatment. Some urine samples were treated with 40 units/mL of β-
glucuronidase as described previously [9] to evidence conjugation of UA and UB to
glucuronides moieties. One ml of urine was added with 144 μL of acetate buffer (0,1 M,
pH 5) and the enzyme was incubated overnight. Then, the samples were extracted with
diethyl ether three times. The organic phases were pooled and evaporated under reduced
pressure until dry and re-dissolved in methanol, it was then filtered through a 0,45μm
membrane filter to be further analyzed. All methanolic fractions were analyzed by
UPLC-DAD/ESI+-Q-TOF/MS for 21 compounds previously reported as ETs
metabolites.

46
46
3.2.2 ANALYSIS PERFORMED FOR THE IDENTIFICATION AND
QUANTIFICATION OF ETs AND THEIR METABOLITES
Despite important recent advances in analytical science, the detection of all types of
molecules using a single technical principle is not possible. Hyphenation of different
techniques allows exploiting the advantage of different analytical principles. Hence, we
combined chromatographic and spectral methods for the identification and
quantification of ETs and their metabolites. Chromatography allows the separation of
nearly pure fractions of chemical components in a mixture; and, mass spectroscopy
produces selective information for their identification using commercial standards or
library spectra.
3.2.2.1 Principle of chromatographic separation
Liquid chromatographic separation is defined as the separation of the components in a
mixture, based upon the rates at which they elute from a stationary phase over a mobile
phase gradient. Molecules dissolved in the mobile phase are separated depending on
their distribution coefficient in the two phases, while the mobile phase passes through
the stationary phase [184]. There are two different phases: the Normal phase in which
the stationary bed is strongly polar and the mobile phase is largely non-polar; and
Reverse phase where the stationary phase is non-polar and the mobile phase is polar.
Their typical surface coatings are -Si-OH, -NH2 for normal phase and C8, C18, Phenyl
for Reverse phase, -NH4 for anion exchange and –COO- for cation exchange. Elution
can be carried out at isocratic (fix concentration) or gradient (eluent concentration and
strength are changing). Most LC instruments are equipped with an optical detector:
universal such as refractive index RI, evaporative light scattering detector (ELSD), or
selective such as UV/VIS light, Fluorescence and Electrochemical, photo diode array
detector (PAD) and finally, Mass spectrometer MS.
Ultra performance liquid Chromatography (UPLC)
Recent advances in instrumentation and column technology [185] have led to an
important increase of separation efficiency, resolution, speed and sensitivity. These
important improvements gave origin to Ultra performance liquid Chromatography which
used shorter columns with superior mechanical strength, high pH stability, smaller

particl
colum
compo
in a 3
numbe
the dif
analys
Figurto obs
Figu[2, 3
le size (<1,7
mns overcom
ounds, colum
3D map the
ers and inten
fferences co
sis of the sam
re 3.1 HPLCserve the dif
ure 3.2 Com3]
7 μm) and
me peak sh
mn bleed, and
differences
nsity of peak
oncerning sp
me sample.
C-MS and B)fferences on
mparing speed
high pressu
hape asymm
d rapid mobi
between HP
k when analy
eed, sensitiv
) UPLC-MSthe informa
d, sensitivity
47
ures (>1500
metry and p
ile-phase re-e
PLC-MS an
yzing mouse
vity and reso
S analysis of ation generat
y and resolut
00 psi). The
poor loadin
equilibration
nd UPLC-M
urine sampl
olution betw
f mouse urineted [1]
tion in HPLC
e ultra-effici
ng capacity
n. Figure 3.1
S analysis i
les. Figure 3
ween HPLC
e in a 3-dim
C and UPLC
ient UPLC
for basic
1, illustrates
in terms of
3.2, depicts
and UPLC
ensional ma
C analysis
47
ap

48
48
Thus, as UPLC/MS results in a well-suited tool to approach efficiently metabolite
detection and eventually identification [186], it was the method selected to carry out the
separation and identification of ETs metabolites in the present study; whereas for ETs
content in BBJ, HPLC was the method followed as it is the most common method in the
characterization of ETs in foods [7, 25, 29, 31, 47].
3.2.2.1.1 Chromatographic Separations of Ellagitannins in Blackberry Juice
Microfiltered blackberry juice was analyzed on a HPLC-DAD. The HPLC system
consists of a Shimadzu SPD M20 diode array detector, a Shimadzu LC 20 AT pump, a
Shimadzu DGU 20A5 degasser and a Shimadzu oven for the CTO 6A column. The BBJ
analysis was performed on a reversed-phase C18 column (Phenomenex prodigy, 5 µm
ODS C18, 150 mm x 2.00 mm, 100 A), at 30 °C. Solvents A and B were H2O/HCO2H
(98/2; v/v) and CH3CN/ H2O/HCO2H (80/18/2; v/v/v), respectively. The gradient
started with 5% B in A to reach 25% B in A at 20 min, 100% B in A at 25 min, 10% B
in A at 30 min, and 5%B in A at 35 min. The most representative ETs from blackberry
juice were identified according to their retention time and their UV spectra.
3.2.2.1.2 Chromatographic separation of ETs metabolites
Although there are many factors that affect performance of the analysis, the gradient and
the stability of the column play a leading role. In chromatographic separations the
gradient is sample dependent, but in general UPLC gradients for urine samples it can vary
from 5 to 30 min. Nevertheless, short runs will detect fewer ions than long ones. A good
balance between speed of analysis and more exhaustive coverage of urine metabolome
was set between 10–12 min. The gradient started with aqueous solutions (99–100%
water), and change until reaching 95–100% acetonitrile or methanol. The column was
washed to remove the salts and unwanted contaminants to prevent deterioration of the
column. After the wash period, start conditions are resumed to ensure the column re-
equilibration. Five column volumes of initial solvent were used before injecting the
following sample. To ensure repeatable results concerning retention time RT, the column
signal intensity was stabilized by injecting 5 to 10 times the matrix (urine or extracts).
This reduces the variability along of the run. Consequently, running at least 5 pooled
quality control QC samples at the beginning and at the end of the pool samples analysis
allows the gathering of information about the stability and suitability of the system.
49
49
Afterwards, each run column was washed with a strong eluotropic solvent to avoid the
accumulation of contaminants and guarantee continuing good performance. [183]
• Specific conditions for urine analysis
The components of interest in urine are predominantly of low molecular mass and are
generally hydrophilic, thus reverse phase columns, typically C18-bonded silicas,
provide a good general system for the metabolite profiling of urine. Chromatographic
separations of ET-metabolites were carried out in a Waters Acquity Ultra Performance
Liquid Chromatography system UPLC equipped with a Photo diode Array Detector
PDA, a binary solvent manager, autosampler, and degasser controlled by software from
Waters (MassLynx V4.1) (Waters Corp., Milford, MA, USA). The column eluent was
directed to the mass spectrometer.
Metabolite separations from urine were carried out in a reversed-phase ACQUITY
UPLC C-18 CSH (Ireland) 100* 2.1 mm with a 1.7μm particle size and a precolumn
(2.1 mm, 0.2-μm particle size) that was maintained at 30 °C. Solvent A consisted on
Water/formic acid (99.9:0.1, v:v) while Solvent B consisted on Acetonitrile/formic acid
(99.9/0.1 v/v). The flow rate was 0.400 mL/min, and the injection volume was 6 μl. The
gradient for urine samples started with 100% A to reach 10% B in A at 7 min, 95% B in
A at 22 min and 100% A at 22.1 min. The gradient was stabilized at 100% A at 26 min.
The ACQ-PDA was operated at a sampling rate of 20 points/s, and ranged from 190 to
600 nm. The column eluent was directed to the mass spectrometer.
• Specific conditions for analysis of extract from colonic fermentation broth
Metabolite chromatographic separations from a broth of batch culture incubation were
performed on a reversed phase C-18 column ACQUITY UPLC BEH 1.7 μm * 2.1* 50
mm (Ireland) maintained at 30 °C., using water/formic acid (99:1, v:v) as solvent A; and
MeOH as solvent B. The flow rate was 0.208 mL/min, and the injection volume was 1.0
μ. The gradient for elute ET-metabolites started with 20% B in A to reach 70% B in A
at 5 min, 90% B in A at 6 min and 95% B in A at 7.2 min, then return to 20% B in A at
7.4 min and was stabilized in that condition until it reached 9 min. The ACQ-PDA was
operated at a sampling rate of 20 points/s and ranged from 200 to 400 nm.

50
50
3.2.2.1.3 Quantification of Ellagitannins (ETs) and their Main Metabolites
Quantification of ellagitannins and their metabolites was done using chromatographic
analysis with a photo diode array detector (PDA). ETs were quantified as free EA
equivalent and expressed in μmol/L of EA equivalent. The UV spectrum was recorded
at 280 nm and the ETs concentration was determined from the peak area by using the
equation for linear regression obtained from the calibration curve of EA, Figure 3.3,
obtained from authentic standards of ellagic acid (EA)
Figure 3.3 Calibration curve of EA, for quantification of ellagitannins by HPLC, following the method proposed by Mertz, 2007.
The limits of detection and quantification were 1.6 and 5.5 mg/L of EA respectively.
Figure 3.4, illustrates chromatograms from the BBJ, where the main anthocyanins and
ellagitannins of blackberry (Rubus adenotrichos) can be observed.
Figure 3.4 UV chromatogram of blackberry (Rubus adenotrichos) juice.
y = 128429x - 5677.6R² = 0.9996
02468
101214
0 50 100 150
Are
aM
illio
n
Concentration EA, mg/L

51
51
UA, UB, UC, UD, metabolites including glucuronide forms were quantified recording
the area under the curve of UV spectra at 278 nm and concentration was always
reported in UA or UB equivalent. A calibration curve with UA and UB standards,
Figure 3.5 was done before each analysis always with R2>0.97. In the absence of
standards for glucuronide UA and UB they were always expressed as μmol UA and UB
equivalent. An example of the data provide by the UPLC analysis is depicted in the
Figure 3.6.
3.2.2.2 Mass spectrometry analysis.
High resolution mass spectrometry aim at measuring the accurate mass of ions produced
after ionization of compounds. Therefore, there are at least three main components of a
mass spectrometer: an ionization source, a mass analyzer and a detector.
Figure 3.6 Basic information provided by UPLC: UV chromatogram-Area under the curve and the UV spectra for m/z+ 213.0552 ion is illustrated
Figure 3.5 Calibration curve of EA, UA and UB for quantification of ellagitanninsin BBJ, and ETs metabolites in urine and broth culture incubation.
y = 67004x + 380.82R² = 0.997
0
20
40
60
80
100
0 0.25 0.5 0.75 1 1.25 1.5
AR
EAM
illio
n
UA concentration, μmol/mL
UAy = 62157x - 90.238
R² = 1
0
20
40
60
80
100
0 0.25 0.5 0.75 1 1.25 1.5 1.75A
REA
Mill
ion
UB concentration, μmol/mL
UB

52
52
3.2.2.2.1 Ionization Source
The aim of ionization is to convert molecular compounds into ions volatilized in a gas
phase. Different ionization techniques are used, such as elestrospray ionization (ESI),
Atmospheric-pressure chemical ionization (APCI), Electron ionization (EI) and matrix
assisted laser desorption/ionization (MALDI), allows the conversion of most large, non-
volatile and thermally labile compound into a gas-phase ion.
The electrospray ionization (ESI) is a soft technique often preferred in hyphenated LC-
MS techniques since it produces larger numbers of ions [187]. The development of ESI
has been an important advance as it allows desorption and ionization of a wide range of
molecules directly from the mobile phase proceeding from LC [188].
ESI process is depicted in Figure 3.7, in which ions are generated at atmospheric
pressure after passing through a capillary with and inner diameter >250μm and being
sprayed in a ionization chamber where there are voltage differences between 500 and
4500 V. The inner diameter of the needle and the solvent used define the voltage
required. At the end of the capillary, an aerosol of charged droplets is generated.
Depending on the polarity of the voltage applied, the droplets of solvent and analyte can
be negatively or positively charged [189]. The solvent evaporates and the droplets
shrink until the charge density of the surface prevails over collusion forces, giving rise
to repulsive forces between charges that lead to drop fission and expulsion of the
formed ions.
ESI works best with solutions that have a high percentage of organic solvents, such as
acetonitrile or methanol, even though the solution should remain partially aqueous with
some ions such as hydronium, hydroxyl and sodium ions. Positive electrospray ions are
produced by adding of a positive molecule, called adduct which nature depends of the
salts present in the medium (generally H+, NH4+, Na+). Negative electrospray ions are
generally produced by the removal of a proton H, but other adducts with Na-2H and Cl,
can also be produced.

53
53
Some analytes are ionized more efficiently in one ionization mode rather than in another
mode (Table 3.1), for different and often complex reasons. Usually metabolites
containing only C, H and O can be detected in negative ion mode, but if they also
contain N, ionization in positive-ion mode is recommended [183]. Therefore, during
metabolomic studies, usually, ionization is carried out in both positive and negative
mode, enabling the detection of two sets of analytes which may differ significantly.
Concerning our targeted analysis, ESI in positive mode (ESI+) was the method applied
for the analysis of ETs metabolites in urine and fermentation broth. ESI+ showed higher
signals than ESI in negative (ESI-) mode in preliminary studies. Additionally, formic
acid was added to the mobile phase to obtain a stronger signal.
Table 3.1 Relative efficiency of electrospray ionization of common chemical functional groups (Fiehn Laboratory, UC Davis)
Positive ionization Negative Ionization
Dec
reas
ing
effic
ienc
y Quaternary ammonium Amines Sulphates and phosphates
Amino acids Sulphonates, phosphonates Ketones, aldehydes Carboxylates Esters Peroxide Carboxylates alcohols Amino acids Thiols, alcohols
The main concern with ESI is its tendency to ion suppression or enhancement
phenomenon, which can lead to adverse effects during quantification. Matrix effects can
cause ion suppression and a compound may be much more efficiently ionized than
others being quantitatively over estimated whereas others are under estimated [184]. For
example, salts and non-volatile solutes can change the efficiency of droplet formation
and evaporation which changes the amount of charged ion in the gas phase that reaches
Figure 3.7 Electrospray ionization principles[190]

54
54
the detector [191] yielding a mass spectrum with peak intensities not proportional to the
real concentrations found in the sample. Hopefully, targeted analyzed compounds
showed a significant trace in UV spectra, which allowed a more reliable quantification
by these means. A semi-quantitative analysis was performed, referring to any relative
changes of the same ion peak intensity in the same urine matrix, supposing that ion
suppression or enhancement was similar in the different sample. Actually, this is the
main principle that prevails during untargeted metabolomic analysis where changes of
the same ion peak intensity are observed in samples from very similar matrixes.
The other existing ionization techniques are more severe. For instance, EI which ionized
molecules by a beam of high energy electrons creates ions by collisions which often
cause fragmentation of parent molecules. In most cases, fragments produced in standard
conditions (at 70 V) can be used to identify metabolites, as extensive libraries exist.
Generally, EI is limited to the analysis of small volatile compounds. In APCI, the
compound is heated by a ceramic tip up to 500°C, with cross flow of nitrogen, in order to
reduce the droplet size. One of the most important advantages of APCI over ESI is that it
is less susceptible to matrix interferences. In addition, APCI can ionize weak polar
compounds, but one major disadvantage is the ionization of labile compounds, which can
be decomposing because of the high temperatures reached during nebulization (400-
500°C) [189]. The last technique, MALDI is also more appropriate for thermolabile,
non-volatile, organic compounds with high molecular mass. In this case, the sample is
bombarded with a pulsed laser light, then, the sample is co-cristallized with a solid
matrix that absorbs the light emitted by the laser. Analytes are fixed in a chemical
matrix that absorbs energy from an ultraviolet laser, resulting in an analyte desorption
and ionization. [192]. MALDI is widely used in proteomics and for oligosaccharides,
and oligonucleotides among others.
3.2.2.2.2 Mass Analyzers and Detector
In the market, a large number of mass analyzers are currently available, but almost all of
them use at least one or a combination of the following principles: quadrupoles, time-of-
flight (TOF), and Fourier transform Mass spectrometer.
• Quadrupole. A quadrupole mass analyzer consists of four metal rods arranged in
parallel, linked electrically by a radio frequency (RF) voltage supply, which generates
an alternating electrical field between the rods. Ions inside the quadrupole move

55
55
perpendicular to the field, in the z direction and start spinning within an imaginary
cylinder created by the RF voltages. The diameter of the imaginary cylinder depends on
the mass-to-charge ratio (m/z) of the ion and the RF voltage. Only ions within a certain
m/z range are allowed to pass through the quadrupole. Mass analysis depends on the RF
voltages and direct current (DC) applied. Mass accuracy in a quadrupole is in the order
of hundreds of ppm., mass resolution depend on the ratio of the RF and DC voltage And
the range of m/z can vary between 300 and 4000 [189].
• Quadrupole ion trap is a variant of quadrupole, but quadrupole-ion-trap has an
electric field in three dimensions and deals with m/z range, mass accuracy and mass
resolution similar to those showed by quadrupoles, but they can be increased by
modifying the voltage scan rated [189]. A remarkable feature of the quadrupole ion-trap
is the ability to carry out MSn experiments, where multiple collision-induced
dissociation can be executed consecutively.
• Time of flight (TOF). This technique separates the ions according to the velocity
reached, in a TOF drift tube where a potential is fixed to accelerate the ions until they
get to the detector. The TOF theory basically builds on the following equation that
allows relating the mass of a ion over its charge (m/z) to the applied voltage (V), its
time of flight (t) and the length of field free drift region (L):
m/z=2V(t/L)2 Eq. 1
According to equation X, the ions with lower m/z achieve higher velocities (around 100
km/s for a 100 m/z ion to 40 km/s for a 1000 m/z ion) and reach the detector first than
those ions with higher m/z ratios. Then, knowing the time t that the ion takes to reach
the detector, the applied voltage V and length of the TOF drift, m/z is deduced. Mass
accuracy in TOF instruments is generally in the order of 5 to 25 ppm.
• Fourier-transform ion cyclotron resonance, FT-ICR or Fourier-transform Mass
spectrophotometer FTMS uses a magnetic field to determine m/z of ions, but unlike
sector instruments, the kinetic energy of the ions is about tens of electron volts, eV. Ions
are trapped at the magnetic field and their cyclotron frequencies are measured and then
converted to m/z values. This allows achieving very high resolutions and high mass
accuracy inclusively below 1 ppm.[189]

56
56
Commercial instruments usually combined different principles. This is the case for
tandem mass spectrometry, such as Quadrupole-Time Of Flight (Q-TOF). There are two
stages of MS carried out. In the first, ions of a target m/z are isolated from the ion flow
leaving the ionization source. The isolated ions can increase their internal energy,
provoking fragmentation which can be analyzed in a second phase by TOF [189]. This
process, usually called MS/MS or MS2, can be re-produced several times (MSn) to help
in the elucidation of the atomic structure the parent ions. Given the combination of the
selectivity of Quadrupole and the high mass resolution, sensitivity and mass accuracy
proper of TOF [193], this mass analyzer is suited for mass spectrometry targeted and
untargeted analysis. In addition Q-TOF offers almost unlimited mass ranges, and fast
scanning speeds. Consequently Q-TOF analyzers were the technique under which mass
urine and broth cultures were analyzed in the present study.
3.2.2.2.3 Spectrometry Analysis Applied in this study.
For this study, the instrument used was a UPLC-PDA, coupled with Electrospray
Ionization in tandem with a Quadrupole and Time-Of-Flight Mass analyzer (ESI-Q-
TOF) (Waters Synapt G1, Waters Corp., Milford, MA, USA) (Figure 3.8).
Mass spectrometry data were collected within the range of 50 to 1000 m/z. Because
chromatographic separation was hyphenated with mass spectrometry, the retention time
and the time at which the ion reached the detector are relevant information that could be
used for the elucidation of molecular compounds. To ensure repeatable results
concerning retention time RT, signal intensity and mass accuracy, the instruments were
calibrated at constant periods of time; and, strict cleaning procedures of the source and
Figure 3.8 Illustration of a mass spectrometer MS V-Mode and each one of theirparts, along with UPLC that become a powerful tool for metabolite analysis
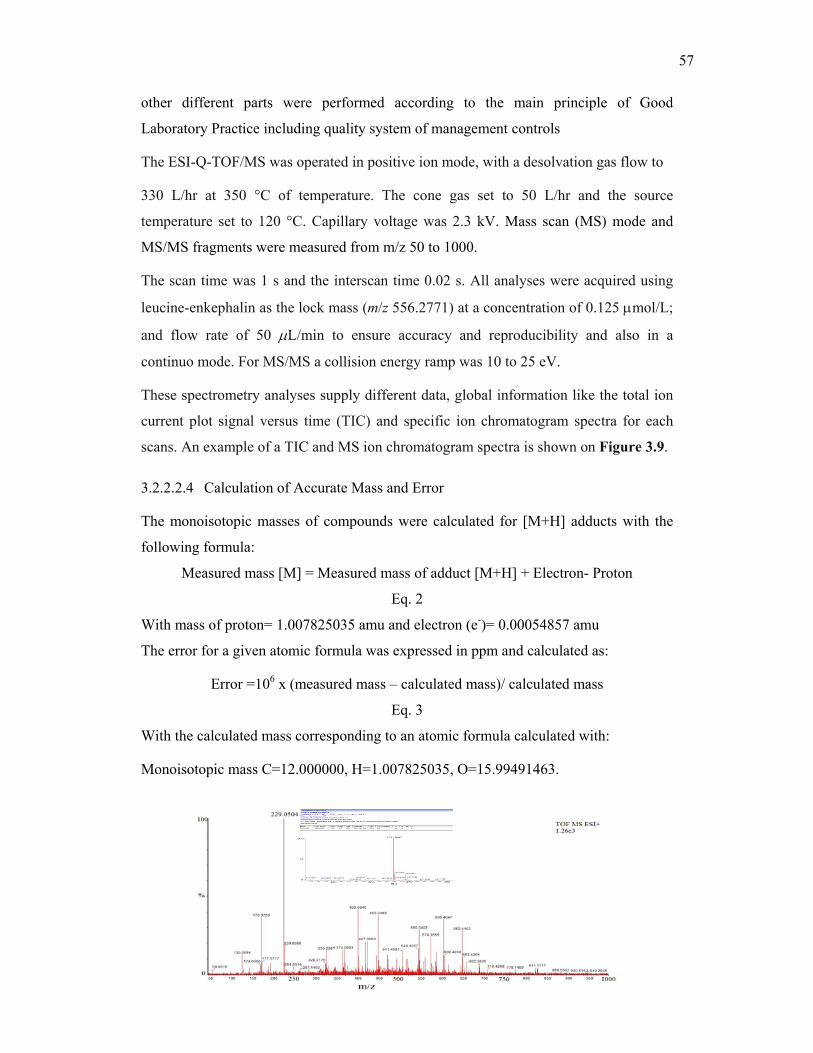
57
57
other different parts were performed according to the main principle of Good
Laboratory Practice including quality system of management controls
The ESI-Q-TOF/MS was operated in positive ion mode, with a desolvation gas flow to
330 L/hr at 350 °C of temperature. The cone gas set to 50 L/hr and the source
temperature set to 120 °C. Capillary voltage was 2.3 kV. Mass scan (MS) mode and
MS/MS fragments were measured from m/z 50 to 1000.
The scan time was 1 s and the interscan time 0.02 s. All analyses were acquired using
leucine-enkephalin as the lock mass (m/z 556.2771) at a concentration of 0.125 μmol/L;
and flow rate of 50 μL/min to ensure accuracy and reproducibility and also in a
continuo mode. For MS/MS a collision energy ramp was 10 to 25 eV.
These spectrometry analyses supply different data, global information like the total ion
current plot signal versus time (TIC) and specific ion chromatogram spectra for each
scans. An example of a TIC and MS ion chromatogram spectra is shown on Figure 3.9.
3.2.2.2.4 Calculation of Accurate Mass and Error
The monoisotopic masses of compounds were calculated for [M+H] adducts with the
following formula:
Measured mass [M] = Measured mass of adduct [M+H] + Electron- Proton
Eq. 2
With mass of proton= 1.007825035 amu and electron (e-)= 0.00054857 amu
The error for a given atomic formula was expressed in ppm and calculated as:
Error =106 x (measured mass – calculated mass)/ calculated mass
Eq. 3
With the calculated mass corresponding to an atomic formula calculated with:
Monoisotopic mass C=12.000000, H=1.007825035, O=15.99491463.
C.

58
58
3.2.2.2.5 Identification and Annotation of Major ET-Metabolites by ESI-QTOF/MS
Except for the UA, UB and EA previously identified with the help of pure commercial
standards, the other targeted metabolites were annotated according to various methods.
Although we were able to determinate the exact mass of compounds with mass accuracy
always below 5 ppm and often below 3 ppm, this result does not permit unambiguous
identification. A single exact mass may correspond to various molecular formulas,
which at their turn could correspond to thousands of isomers and tautomers. Some well-
known rules [194] in spectrometric analysis allow reducing the number of formulas
taking into account the isotopic abundance and patterns along with element number
restrictions. Nonetheless, the reduction of candidates is not enough to allow
identification based only on these results. Other clues must be added, such as retention
time, UV spectra, MSn pattern fragmentation to annotate the identity of ions in a more
reliable way.
Glucuronide forms of UA and UB, corresponding to UAG and UBG, were
unequivocally identified (1) by matching their UV spectra with the ones already
Figure 3.9 Basic information obtained from MS: A. Total ion chromatogram (TIC) B.extracted ion chromatogram m/z and C. Exact mass measured spectrum and elementalcomposition report
B.
A.

59
59
published in literature [58], (2) by matching their exact molecular weight (UAG (M-H+)
m/z 405.0822 and UBG (M-H+) m/z 389.0873 respectively), (3) by matching UV
spectra of UA and UB after treating urine samples with β-glucuronidase to remove the
glucuronide moiety, (5) by matching the exact mass of UA and UB and observing a
neutral loss of 176 Da corresponding to the loss of a glucuronide moiety when
performing MS2 at 15 V.
The urolithin UC, UD and their isomers, and UM5 were only annotated taking into
account both, the important similarity of their UV spectra with those reported in
literature [58], and to their observed exact mass. MS2 fragmentation was also performed
and similar patterns were observed, but as the fragmentation patterns were not available
in data bases, structure elucidation was only tentative. In some cases also, the
correspondence between order of elution and hydrophobicity estimated by Log D (Log
P at physiological 7.4 pH) of proposed structure was taken into account.
Other ions, methylated and glucuronide conjugate of UA, UB, UC and UD, as well as
precursors as HHDP were annotated with a lower probability considering only their
exact mass and fragmentation pattern by MS 2.
The fragmentation pattern, neutral loss and molecular weight of fragments were
analyzed and compared with similar compounds found in literature data and on-line
libraries (ReSpect (http://spectra.psc.riken.jp/), Metlin: Scripps center for metabolomic
(http://metlin.scripps.edu/index.php)), thus allowing a tentative assignment of the
predicted structure with relatively high probability.
3.2.2.2.6 Specific handling of mass spectrometry data
A list of 25 targeted ETs metabolites was established and the search for finding the
exact mass of adduct [M+H] was done in two ways.
First, manually by screening the MS spectra from all in vivo and in vitro samples
making use of the MS ion extracted chromatogram (Figure 3.9B, 3.9C), accepting
differences no larger than 3 ppm respect to the exact mass m/z+. Secondly, by
converting the raw data provided by the MassLynx software into a more manageable
dataset, using the embedded software Databridge (MassLynx software). MS data
acquired in continuous mode was first centered on the lock mass of leucine-enkephalin
by using the MassLynx tools. This new data file was transformed by Databridge into

60
60
another file NetCDF to facilitate their treatment by MZmine [195]. After mass
detection, chromatogram construction, deconvolution and alignments by MZmine
software, a new file reporting the retention time, m/z+ of ions and base peak intensity
was generated and read in Excel. This file was used to profile the different samples with
MS data. For reported compounds, mass of ions (m/z+) were matched to exact mass
reported considering a molecular weight tolerance inferior to 5 ppm in all cases.
3.2.3 CLINICAL STUDIES WITH HEALTHY VOLUNTEERS
For the clinical studies with healthy volunteers, it was decided to follow up the
excretion of ETs metabolites in urine. Urine is a key biological matrix in which has
been identified more than 2651 metabolites species [196]. Urine, reflects metabolic
disregulation, providing information about system-wide changes in response to
physiological or disease processes [183]. Its collection is noninvasive and can be easily
sampled in a serial manner, allowing temporal metabolic changes to be studied.
3.2.3.1 Study Design
The study complied with the Helsinki Declaration, and the University of Costa Rica
Ethical Committee approved the protocol proposed, and the participants gave their
written consent prior to participation. In vivo trials were divided in two steps, Figure
3.10: first at all, a preliminary step carried out to select urolithins excreters within a
cohort of 26 volunteers chosen previously according to survey applied; and the second
one, a kinetic study to approach to the metabolic pathway followed by ETs after
volunteers drank a single dose of BBJ
3.2.3.1.1 Selection of volunteers
Ten men and sixteen women (non pregnant nor lactating), in good health were selected
based on their medical history, (no gastrointestinal illness or chronic disease, nor
participating in a special diet regimen, and had not been prescribed with antibiotics for
at least 6 months before the study)

61
61
Once the volunteers were selected, and after they gave the consent to participate in the
trial, they were asked to follow a free-polyphenol diet. Certain products, such as berries,
pomegranate, nuts, grapes, chocolates wines were prohibited for seven days. After this
polyphenols washout period, juice bags were thawed diluted 50:50 with water and
added with sucrose until reach 12°Brix, and then each one of the 26 volunteers ingested
a 250-mL of this diluted juice. About 46 to 56 hours after juice ingestion one single
urine spot was taken and analyzed for urolithins A or B or their corresponding
glucuronides. The diet restriction was kept until the day they provided the urine
samples. Figure 3.11 illustrates the time-steps of the study followed.
3.2.3.1.2 Kinetic studies
From the 26-volunteer group, nine volunteers were selected to follow the kinetic of ET-
metabolism. The study was carried out applying the aforementioned methodology, but
with some small modifications. After a 7 day washout period they were invited to
provide a urine sample and then drink a 250-mL of the diluted BBJ. From this time and
up to seven days, all the urine excreted was collected, homogenized, the time and
volume were registered, and then a 10-ml aliquot was added with 0.1% (w:v) of
Figure 3.10 Scheme of the clinical test followed to approach ETsmetabolism.

62
62
ascorbic acid and kept frozen at – 40°C for further analysis. For some volunteers, the
kinetic study was repeated at different periods of the year. Between each intervention
period, volunteers did not follow any type of diet restriction.
3.2.4 IN-VITRO FERMENTATION WITH STOOLS
To disentangle the intricate metabolic pathway of polyphenols, first, we must understand
how colonic microbiota converts these complex compounds into bioactive molecules, as
well as to reveal how polyphenols may modify microbiota composition. In vivo human
or animal intervention result appropriate physiological models to get a better
understanding on the metabolism of polyphenols, since these type of models consider the
interaction of colonic microbiota with the host system functionality such as immune or
neuroendocrine system, gut absorptive process, or digestive tract secretions [16, 129].
However, practical and ethical reasons limit its applications [129]. In vitro models are
low cost, easy to set up, they have no ethical restrictions, facilitate use of hazardous
substances; and their major inconvenience is related to their limited interaction with the
host system functionality [129]. In vitro models range from simple batch systems using
fecal stools or defined mixed populations of bacteria until complex multistage
continuous cultures that permit to carry out dynamic fermentation that simulates the
different large intestine compartments and their functions. Fecal batch incubations have
10 days Diet restricted in ETs
rich food
Intake 250 ml blackbery juice
One month
10 days Diet restricted in ETs
rich food )
Intake 250 ml blackbery juice
Kinetic study
26 volunteers
Collection of a urine spot
47 h-55 h 9 volunteers
7 days (urine collection period)
Step 1 Step 2
Figure 3.11 Layout of study design, different steps followed

63
63
been widely used to approach the gut microbial polyphenol metabolism, to characterize
microbial fermentation products of dietary polyphenols, and also to confirm the high
human interindividual variability in colonic microbiota composition that has been related
to polyphenol bioconversion capacity [16].
3.2.4.1 Subjects
All 26 participants in the in vivo cohort donated a fecal sample between 0 and 48 hours
after the ingestion of blackberry juice. These samples were divided in two parts; one to
be used as starters in batch culture incubations to approach ETs metabolism by in vitro
trials, and the other one to describe the bacteria involved in the ETs metabolism by
independent culture techniques, Figure 2.12. Individuals that donated samples before
24 hours were asked to donate other fecal samples at 48 (FS48), 72(FS72), 96(FS96)
and 120(FS120) hours after drinking the juice, in order to evaluate the effect of BBJ on
the microbiota profile, and also to evaluate the influence on the urolithins production.
All fecal samples were collected in sterile bottles and frozen immediately at -80°C until
their use.
3.2.4.2 Starter preparation
An homogeneous suspension 1:9 (w:v) of thawed fecal samples in a 0.8% NaCl solution
previously sterilized, was prepared in the Interscience stomacher (400ml Bagmixer-
400W). Subsequently the suspension was filtered with a sterilized muslin cloth.
3.2.4.3 Growth medium
The growth medium consisted of brain heart infusion (BHI) medium (37 g/L), L-
cysteine (0.5 g/L), and resazurin (1 mg/L), prepared in distilled water and adjusted to
pH 7.4 with NaOH. Then it was sterilized at 121 °C for 20 min.[17].
3.2.4.4 Batch-culture incubation
All batch-culture vessels containing 10-mL of growth medium, 1 mL of starter and EA
or BBJ dissolved in DMSO, were incubated at 37 °C in sealed jars (Oxoid Ltd,
Basingstoke, Hampshire, England) under anaerobic conditions by using AnaeroGen
sachets (Oxoid Ltd, Basingstoke, Hampshire, England). Only two controls were carried

64
64
out, flora in the basal medium without polyphenols and polyphenols in the basal
medium but without starters.
Test 1. Degradation of ETs and EA by Colonic Microbiota
Eight fecal stools donated in the first 24 h after drinking the juice were used as starter
for the batch culture vessels containing 0.14 μmol/ml EA equivalents from BBJ (diluted
1:1 with DMSO) or 0,05 μmoL of EA solution (0.3 mg/ml DMSO). All these batch
culture vessels were incubated for 120 hours and their progress was followed by taking
samples at 24, 72 and 120 h to be analyzed by LC-MS for ET-metabolites.
3.2.4.4.1 Test 2. Effect of BBJ ETs on the Colonic Microbiota Performance
Fecal stools donated at 48(FS48) and 96(FS96) hours, from one individual were used as
starter to ferment EA and BBJ. ETs concentration for BBJ vessels was 0,18 μmol/mL
EA equivalents and for EA vessels was 0,13 μmol/mL. Batch-culture vessels were
incubated, as aforementioned, in sealed jars at 37 °C, for 120 hours. Batch-culture
vessels contained 38-mL of growth medium and 10 mL BBJ (1:1 v/v DMSO) or 43 mL
Figure 3.12 Scheme of in vitro test followed to identify microbial metabolites andpotential microbial species involved in ETs degradation

65
65
of growth medium and 5 mL EA (0.4 mg/mL DMSO), inoculated with 2 mL of FS48 or
F96 prepared as was described 3.2.4.4.
3.2.4.5 Metabolite recovery from fermentation broth
All samples were extracted based in the method previously described by Cerda, [17].
Briefly, each fermentation broth was extracted with diethyl ether (1:2 v/v mL x 3). The
organic phases were pooled and evaporated under reduced pressure until dry, and
redissolved in 1 mL of MeOH. All these methanolic fractions were filtrated through
0.45 µm filter and analyzed by LC-MS for ET-metabolites, and they were triplicated.
3.2.4.6 Metabolite Extraction from Feces
Fecal stools were extracted according to the method described by Cerda [17] and
analyzed for ETs metabolites content. One gram of stool feces with 15 mL of
MeOH:H2O:HCOOH (80:19.9:0.1, v:v) was homogenized with an Ultraturrax T25
(Henkel, Germany) 24000 rpm for 1 min and then filtered through sterilized
cheesecloth. The filtrate was centrifuged for 7 min at 14000g (MiniSpin plus Eppendorf,
Hamburg, Germany). The supernatant was filtered through a 0.45 μm filter, and
analyzed by UPLC-DAD/ ESI-Q-TOF/MS.
3.2.4.7 Determination of Bioconversion Ability Index of Stools
An ability index for the bioconversion of ETs from blackberry juice to EA and
Urolithins was computed. EA index was the percentage of bioconversion of ETs to EA
after 72 h of anaerobic fermentation of blackberry juice with the different stool
inoculums. Urolithin index was the sum of percentage of bioconversion of ETs into
UM5, UD, UC and UA at 120 h of anaerobic fermentation of blackberry juice with the
different stool inoculums.
3.2.5 PROFILING OF INTESTINAL MICROBIOTA
3.2.5.1 Culture Independent Techniques for Studying Anaerobic Microflora
Culture-dependant microbiological techniques are not well adapted for the identification
of anaerobic flora from the gut; fortunately important advances in molecular techniques
based on the study of DNA extracted directly from complex ecosystem have been
achieved. Molecular techniques for rapid screening of complex microbial communities

66
66
have been developed on the last two decades, based on specific analysis (separation and
/or sequencing) of ribosomal DNA (rDNA). Polymerase Chain Reaction amplification
coupled to Denaturing gradient Gel Electrophoresis (PCR-DGGE) is a powerful
molecular fingerprinting method that allows the screening of multiple samples and the
study of the microbial communities dynamics in ecosystem, such as the intestinal
microbial community[197-201].
3.2.5.1.1 Polymerase chain reaction (PCR) amplification.
Polymerase chain reaction amplification is probably the most simple, powerful
(sensitive, specific, reliable) and fast method to duplicate DNA molecules. PCR is an in
vitro cloning of specific DNA fragments by cycles of enzymatic DNA synthesis. PCR is
carried out in some steps, as illustrated by Figure 3.13. 1) Denaturation of DNA
template. 2) Annealing of primers; and 3) Extension of new DNA strands by a DNA
polymerase and deoxyribunocleoside triphosphates (dNTPs). This process is repeated
for 25 to 35 cycles to get sufficient material. Table 3.2., depicts the most common
primer used in analyzing microbial communities.
Figure 3.13 PCR process. 1. Denaturing, 2. Annealing, 3. Extension, 4. Cycles [202]

67
67
To maintain partial denaturation of the DNA fragment amplicons during DGGE
migration, a GC Clamp (GC rich sequence of guanines G and cytosines C, 30-40 bp) is
attached to the 5’ end of one of the PCR primers. [198]
Table 3.2 PCR primers targeted for 16S rRNA gene, without GCClamp [198]
Primer set Sequence (5’→3’) Amplicons length (bp)
Targeted hypervariable
region 357fGC
-518r CCTACGGGAGGCAGCAG ATTACCGCGGCTGCTGG
194 V3
63fGC -518r
GCCTAACACATGCAAGTC ATTACCGCGGCTGCTGG
489 V1-V3
357fGC -907r
CCTACGGGAGGCAGCAG CCGTCAATTCCTTTGAGTTT
586 V3 -V5
F968GC -R1401
ATGGCTGTCGTCAGCT ACGGGCGGTGTGTAC
352 V8
3.2.5.1.2 Denaturing Gradient Gel Electrophoresis (DGGE).
PCR-DGGE. It is fingerprinting approach is a rapid and efficient method widely used in
microbial ecology to explore microbial diversity and dynamics in complex ecosystems
such as gastrointestinal tracts. Its visual form to show results, allow a rapid approach to
compare and monitoring changes in microbial communities [203].
DGGE is based on the separation of DNA fragments according to their sequence. It is
used to separate DNA fragments of the same size but with different sequences in a
polyacrylamide gel containing a linear gradient of denaturing agents (a mixture of urea
and formamide); due to the decreased electrophoretic mobility of a partially melted
DNA molecule compared to double stranded DNA molecule, Figure 3.14., depicts the
basis of DGGE. Molecules with different sequences stop migrating at different positions
in the gel.
Segments of DNA for all species of bacteria or fungi in the source sample are amplified
by PCR (polymerase chain reaction). Despite the fact that these genes are highly
conserved, variations within regions of these genes and between species are used to
identify the different organisms. The amplified segments of DNA can be separated into
individual species bands by using DGGE; then by sequence analysis of excised bands
different organisms in the sample can be identified. In DGGE analysis, the generated
banding profile is seen as an image of all major microorganisms in the population. An

68
68
individual discrete band refers to a unique ‘sequence type’ or phylotype since co-
migrating bands generally corresponded to identical sequences [204]. PCR-DGGE
electrophoresis is carried out at constant temperatures, typically between 55°C and 65°C
[197, 198, 205]
Some of the drawbacks of using PCR-DGGE are related to PCR amplification. DNA
may not be recovered from all genotypes or PCR amplification may be inaccurate.
Amplification errors in PCR, can lead to formation of chimeric and heteroduplex
molecules; and preferential amplification.
In DGGE electrophoresis the main limitation is the use of small DNA fragments (lower
than 500pb) that could lead to low resolution of complex samples, and the use of
specific or universal PCR primers for a particular group [197, 206]. In addition, the
same specie could show diverse migration patterns due to the heterogeneity of its rRNA
genes [207]. In general PCR-DGGE results are strongly influenced by the primer
system and the gradient of the DGGE gel and the DNA staining method employed
[199].
3.2.5.2 Fecal microflora profiling
DNA profiling of the V2-V3 region of the bacterial 16S rDNA by PCR-DGGE provides
a snapshot of the dominant species present in the fecal microflora, excepting the
detection of sulphate reducing bacteria [208]. Intestinal microbiota is specific in each
Figure 3.14 DGGE principles: voltage, gradient, and direction of moving

69
69
gastrointestinal compartment [1, 62, 132]. Although most of the knowledge about
intestinal microbiota is derived from fecal samples, the dominant community in those
samples represent barely the composition of parts of the sigmoid colon lumen [1, 126].
Nonetheless, the gut lumen of the ileum, is the only host site where relatively high
concentrations of native polyphenols can be expected [15]. Also as dietary constituents
are first encountered by the luminal microbiota in vivo, it is appropriate and convenient
to use the faecal microbiota in the in vitro colon model [63]. In addition, obtaining
colonic microbiota from fecal samples is a non-invasive method, which appears as
pertinent from the ethical and practical point of view [63].
On the other hand besides bacteria, fecal samples contain fats, inorganic matter, protein
and undigested foods, in sufficient amounts to provide nutrients for the microbiological
population. Obligatory anaerobic bacteria Bacteroides spp., Eubacterium spp.,
Bifidobacterium spp., clostridia, lactobacilli, anaerobic cocci and Fusobacterium spp.,
and also facultative anaerobic such as Escherichia coli, Enterococci and Streptococci
have been the most common bacterial species found in feces after batch culture
incubations [1].
3.2.5.3 Experimental Approach to Identify Bacterial species Involved in ETs
Metabolism
To describe the bacterial species involved in ETs metabolism, a molecular approach of
colonic microbiota from the 26 individual previously chosen was performed based on
the sequence of the 16S rDNA gene. In addition, to evaluate whether ellagitannins from
BBJ could exert any effect on the colonic microflora, fecal samples 48(FS48),
Figure 3.15 Spatial distribution of microbes at a selected site in the gastrointestinal tract [1]

70
70
72(FS72), 96(FS96) and 120(FS120) were donated by four individuals, and were also
analyzed by PCR-DGGE, for changes in microbiota composition and amount. DNA
extracted from each sample was used as a template for amplification by PCR of a
portion of the 16S rDNA gene, (the part of the DNA most commonly used for
taxonomic purposes for bacteria), using universal primers. PCR DGGE profiles were
then analyzed by multivariate analysis, PCA and PLSA in order to identify possible
relationships between individual microflora diversity and the ability to release urolithins
from blackberry ellagitannins. DNA bands of interest (corresponding to unique species)
were cut from DGGE gels and sent to sequencing facilities for identification.
3.2.5.4 DNA Extraction
DNA was extracted following the protocol for isolation and DNA purification from
stool samples, with the QIAamp DNA Stool Mini Kit” de QIAGEN (Venlo,
Netherlands), according to the manufacturer manual. A frozen aliquot (180-200 mg) of
each stool sample was utilized. The purity and concentration of the extracted DNA were
measured using a Biospec-Nano spectrophotometer (Shimadzu Scientific Instruments,
Japan). The integrity of genomic DNA was also visualized following electrophoresis
migration through a 0.8% agarose gel.
3.2.5.5 PCR Amplification
PCR amplification of 16S rRNA genes. PCR amplification was carried out with the
TopTaq polymerase kit from Qiagen (Venlo, Netherlands). The variable V3 region from
bacterial 16S rDNA was amplified by PCR with 338F (5’-CGCCCGCCGCGC
GCGGCGGGCGGGGCGGGGGCACGGGGGGACTCCTACGGGAGGCAGCAG-3’)
and 518R (5′-ATTACCGCGGCTGCTGG-3′) primers (Sigma). The reaction mixture
(50μl) was prepared according to the manufacturer and 5 μl of the above extracted DNA
solutions was added. PCR amplifications were performed on a Biorad PTC100 thermal
cycler. Reactions sequence were as follows: 3 min at 94 °C, 30 cycles of 30 s at 94°C,
30 s at 55°C, and 1 min at 72 °C, then 10 min at 72°C of final extension. PCR
amplification products were checked by electrophoresis at 100 V for 30 min by running
5 μl of the PCR reaction on a 2% of agarose gel in TAE buffer. DNA was visualized
after ethidium bromide staining on a UV transilluminator and photographs acquired
with a coupled CCD camera and Gel Smart 7.3 software (Clara Vision, France).

71
71
3.2.5.6 Denaturing Gradient Gel Electrophoresis (DGGE)
PCR fragments were analyzed with Denaturing Gradient Gel Electrophoresis (DGGE)
by using D-Code universal mutation detection system (Bio-Rad, USA), using the
procedure first described by Muyzer [209] and improved by Leesing [210]. Samples
containing similar amounts of PCR amplicons were loaded into 8% (w/v)
polyacrylamide gels (acrylamide/N,N-methylene bisacrylamide, 37,5/1, Promega,
France) in 1× TAE buffer (40 mM Tris–HCl, pH 7.4, 20 mM sodium acetate, 1.0 mM
Na2-EDTA). Electrophoreses were performed at 60°C, with denaturing gradient in the
30–60% range (100% corresponding to 7M urea and 40% v/v formamide, Promega,
France). The gels were electrophoresed at 20 V for 10 min and then at 80 V for 12 h.
After electrophoresis, the gels were stained for 30 min in ethidium bromide then rinsed
with water for 15 minutes, visualized with a UV transilluminator and photographs
acquired with a coupled CCD camera and Gel Smart 7.3 software (Clara Vision, France).
3.2.5.7 Analysis of PCR-DGGE gel profiles
The digitalized image of DGGE gels were analyzed using the Phoretix 1D software
(v10.4, toollab, Ltd, Newcastle upon Tyne, UK). Briefly, the software analysis
procedure consisted of 6 stages, 1) Lane detection, 2) Background noise subtraction, 3)
Detection of the bands (spots) in each lane, 4) Calibration of the retardation factor (Rf),
5) Creation of a reference synthetic lane with all bands detected, and finally 6) matching
the bands between the lanes. The Rf number records the position of the band in the lane,
which is relative to the total length of the lane and is included between 0 and 1, with the
start of the lane (inoculation spot) defined as 0 and the end of the lane defined as 1.
Calibration of Rf was done considering the same reference lanes present in different
gels, Figure 3.16. Then, for each corresponding Rf band, the relative band percentage
for each lane was calculated by dividing the Gaussian volume of a band by the total
volume of all the bands in the lane as:
% band = 100 x (Gaussian volume of the band/ total volume of all bands in the lane)
Eq. 4

72
72
The volume considers the combined area of pixels with color intensity above the noise
threshold along with the grey scale intensity of each pixel. This measure was found
useful to compare across lanes and gels where the loading or light exposition may have
varied slightly. Deconvolution is also particularly useful in cases where two or more
bands overlap. Profile deconvolution uses a curve-fitting algorithm of Gaussian curves.
In order to facilitate the comparison between lanes from the same DGGE gel and band
profile in different DGGE gels, two reference patterns (Lactobacillus Plantarum and
E.Coli), and also common lanes in different DGGEs were used to homogenize the
DGGE images.

Figure 3.16
Rf
6 Example of thee calibration of tthe retardation f
73
factor (Rf) betw
73
ween lanes and twwo different gells
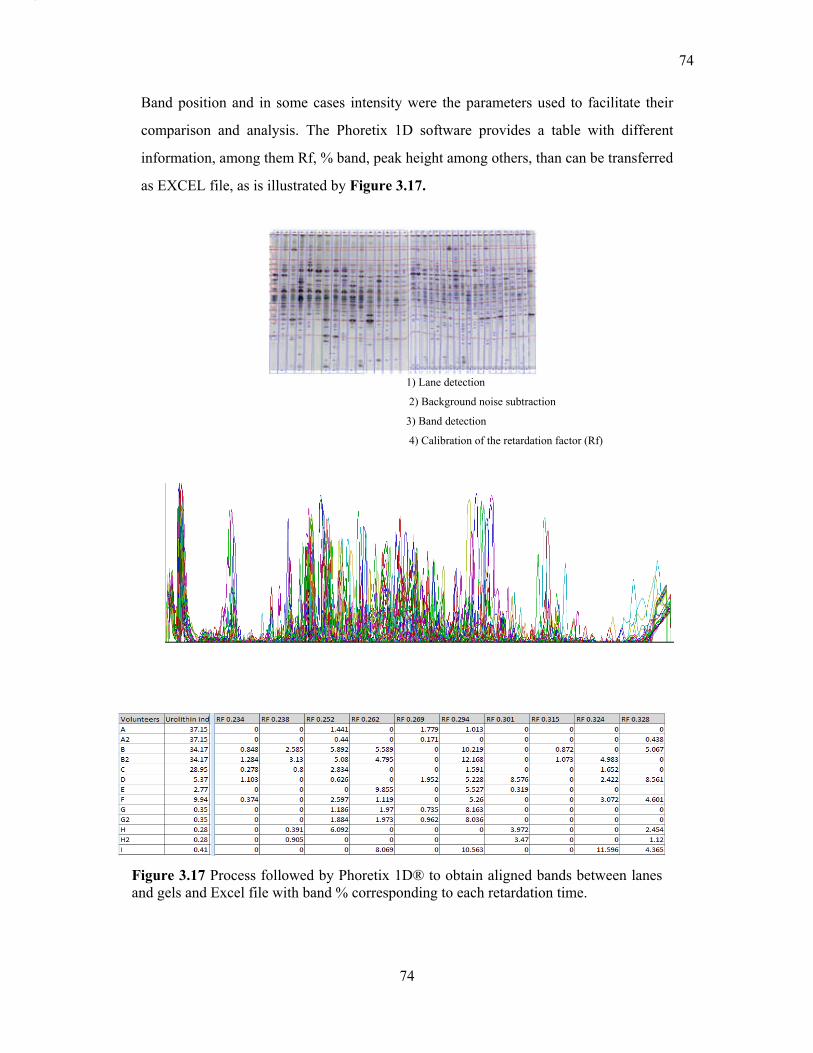
74
74
Band position and in some cases intensity were the parameters used to facilitate their
comparison and analysis. The Phoretix 1D software provides a table with different
information, among them Rf, % band, peak height among others, than can be transferred
as EXCEL file, as is illustrated by Figure 3.17.
Figure 3.17 Process followed by Phoretix 1D® to obtain aligned bands between lanes and gels and Excel file with band % corresponding to each retardation time.
1) Lane detection
2) Background noise subtraction
3) Band detection
4) Calibration of the retardation factor (Rf)
5) Creation of a reference synthetic lane
5) Matching the bands between the lanes.

75
75
3.2.5.8 Recovery of bands from DGGE gels and sequence analysis
DNA bands were excised with a sterile surgical blade and transferred to a 1.5 ml
microcentrifuge tube containing 100μl TE buffer and incubated at 4°C overnight.
Subsequent purification steps were performed with Wizard® PCR Preps DNA
Purification System (Promega), following the methodology described in this
purification system kit.
3.2.5.9 Sequencing of excised bands
Sequencing is the process of determining the nucleotide order of a DNA fragment.
Sequencing of purified DNA from DGGE bands was performed by GATC Biotech
company (Germany) on ABI capillary sequencer system. DNA sequence analyses were
processed using Sequence Scanner 1.0 (ABI) and resulting DNA sequences were
compared with database sequences of the National Centre for Biotechnology
Information (NCBI) as well as RDP (Ribosomal Database project). Briefly, the different
steps followed are explained below:
Step 1: Interpretation of sequencing. GATC BIOTECH provides the nucleotide
sequence of each one of the DNA fragments from each of the two DNA strands, so-
called forward (F) and reverse (R). The encoding Table 3.3 from IUPAC (International
Union of Pure Applied Chemistry) shows the letter assigned to each base and also
letters when ambiguities are present.
Table 3.3 Encoding for the four bases and for ambiguous positions in DNA sequences Code Meaning Etymology Complement
A A Adenosine T T/U T Thyamidine/Uridine A G G Guanine C C C Cytidine G K G or T Keto M M A or C Amino K R A or G Purine Y Y C or T Pyrimidine R S C or G Strong S W A or T Weak W B C or G or T Not A (B comes after A) V V A or C or G Not G (H comes after G) B H A or C or T Not C (D comes after C) D D A or G or T any H
X/N G or A or T or C N . Not G or A or T or C - Gap of intermediate length

76
76
According with these reported codes, the quality of the sequence is analyzed, looking
for ambiguities to correct them. Figure 3.18 depicts an example of a sequence fragment
in which there are two ambiguities in position 131 and 138. This process is carried out
with both forward and reverse sequences.
Step 2: Building of “Enter Query Sequence”. When both DNA forward and reverse
sequences are workable, the common sequence is identified and the complete sequences
is reformed (using 5’ and 3’ end portions) "Enter Query Sequence".
Step 3. Query of databases. The “Enter Query Sequence” is sent on-line to a database
(BLAST from National Center for Biotechnology information (NCBI)) to determine the
homology with sequences already registered. A “Nucleotide collection” and the 16S
ribosomal_RNA_Bacteria_and_Archaea database were used.
Step 4. Analysis of matching results. The BLAST results are analyzed considering the
best match score with known sequences. Parameters such as maximum score, total
score, query cover, E value and % of identity provided by the software are analyzed in
order to annotate with the highest probability possible the identity of the bacterial
species.
3.2.6 MULTIVARIATE ANALYSIS OF DGGE PROFILES
In order to compress the data obtained and try to evidence how microbiota profile may
influence bioconversion ability into urolithins, multivariate analyses were performed.
Figure 3.18 Example of DNA sequences provided by GATC BIOTECH

77
77
Data matrixes were processed by Principal Component Analysis (PCA), Hierarchical
Analysis (HA) and Partial Least Squares Analysis (PLS).
3.2.6.1 Principal Component Analysis (PCA)
Principal Component Analysis, PCA is a method usually applied to display data in a
more simple way, and for exploratory analysis purposes. PCA reveals the internal
structure of a data set in a way which best explains the variance in the data [211]. PCA
is used to project multivariate data to a low-dimensional plot that assembles the major
variations in the data into few axes, thus systematic variation is captured in a model that
can cluster the samples as similar or dissimilar to each other [211, 212]. PCA can
identify gross variability and find a direction of “maximum gross variability” that is
usually consistent with group separation but does not discern between “among-groups”
and “within groups” variability. Although PCA has an ample application in several
fields, concerning analysis of DGGE gels, PCA treat the intensity of each band in
DGGE gels as independent from the other bands; which can lead to wrong interpretation
of the DGGE gel [207]. PCA analysis was performed using SIMCA software Version
13.0.2 (Umetrics, Sweden).
3.2.6.2 Hierarchical Cluster analysis (HCA)
Hierarchical Cluster Analysis (HA) of gels was performed with Phoretix 1D.
Similarities between the band patterns from the different PCR-DGGE gels were
computed using the Pearson correlation coefficient. Similarities or dissimilarities were
displayed graphically as a dendogram. The clustering algorithms used to calculate the
dendrograms was an unweighted pair group method with arithmetic averages (UPGMA)
[213].
3.2.6.3 Partial Least Squares Analysis (PLS) and variants PLS-DA and OPLS
PLS is a statistical tool applied when trying to establish relations between clusters of
observed variables X and responses Y. Similar to PCA, PLS methods projects original
data onto a reduced space called latent variables [214]. PLS try to relate two data
matrixes, X and Y, to each other by a linear multivariate model. A variant of PLS for
discrete response data is the Partial Least Square Discriminant Analysis (PLS-DA)
which focuses on class separation.

78
78
The orthogonal PLS (OPLS) model is another extension of the PLS model. It separates
the systematic variation of variable matrixes into two parts, one that is linearly related
(and therefore predictive) to response matrix Y and one that is orthogonal to Y. The
X/Y predictive variation is modeled by the predictive components. The variation in X,
which is orthogonal to Y, is modeled by the orthogonal components. OPLS is
convenient for the treatment of noisy data. For both PLS-DA and OPLS, the
interpretation of scores and loadings and other model parameters is analogous to that of
a PLS model. PLS, PLS-DA and OPLS were performed also with SIMCA software.
To assess the validity of models, multivariate modeling was implemented using leave-
sample-out cross-validation throughout. Parametric statistical tests such as the
cumulative percent of the variation of Y explained by the model R2Ycum, predicted
variation Q2 and P-value of the ANOVA of the cross validated residuals of Y-variable
were calculated by the same software. Variable importance for the projection (VIP) was
calculated to reflect the importance of terms in the model both with respect to Y, i.e.
correlation to all the responses, and with respect to X (the projection). The VIP plot is
normalized, the average squared VIP value is 1.Thus, terms in the model with a VIP > 1
are the most important. Regression coefficients were also calculated and displayed with
a confidence interval computed by jack-knifing.

79
79
4 METABOLIC FATE OF ELLAGITANNIN’S COLONIC
DERIVATIVES
4.1 IDENTIFICATION AND QUANTIFICATION OF ELLAGITANNINS IN
BLACKBERRY JUICE
ETs form blackberry juice were previously studied by our team and the two main ETs
Lambertianin C and Sanguiin H-6 were identified by UV spectra, exact mass (2804.23
and 1870.16 respectively) and MS2 fragmentation pattern [36]. The same procedure as
previously published was followed for the identification and quantification of
ellagitannins. Table 4.1 shows the content of ETs and free EA derivatives of the juice
that was used in the different trials. The ETs content is in accordance with previous
studies on tropical highland blackberry (Rubus adenotrichos). The Lambertianin C and
Sanguiin H-6 are the most important ellagitannins present in the juice that was given to
the volunteers.
Table 4.1 Contents of ellagitannins in blackberry (Rubus adenotrichos) juice
Ellagitannins (mg EA equ/L.) Lambertianin C 298 ± 5a Sanguiin H-6 246 ± 5 a
Ellagic acid derivatives (mg EA equ/L) 8± 1 a
Total (mg EA equ. L-1) 552± 10
Total (μmol EA equ. L-1) 1822 ± 20
4.2 IDENTIFICATION OR ANNOTATION OF ETS METABOLITES
PRESENT IN URINE AFTER INGESTION OF BBJ
A total of 26 healthy volunteers were chosen to perform a study on urinary excretion of
ETs metabolites. In this case, a spot of urine was collected 51±5 h after ingestion of the
juice. The UPLC-MS analysis of urine from volunteers allowed the identification of
different ETs metabolites, principally conjugated forms of urolithins.

80
80
4.2.1 IDENTIFICATION OF UAG AND UBG IN URINES
After ingestion of tropical highland blackberry juice, the main ellagitannins derivatives
found in human urine were urolithin A glucuronide (UAG) and urolithin B glucuronide
(UBG). Both metabolites were identified by their UV spectra (Figure 4.1), and by their
molecular weight (UAG (M-H+) m/z 405.0822 and UBG (M-H+) m/z 389.0873
respectively). They were confirmed by enzymatic treatment of urine samples with β-
glucuronidase and also after running the MS2. In both cases their respective aglycones,
UA and UB, were identified, Figure 4.1.
Figure 4.1 Example of UV chromatogram (at 278 nm) of a urine sample from avolunteer collected 3 days after ingestion of blackberry juice, including peaks and UVspectra of glucuronide forms of urolithin A (UAG) and B (UBG).
UAG UBG
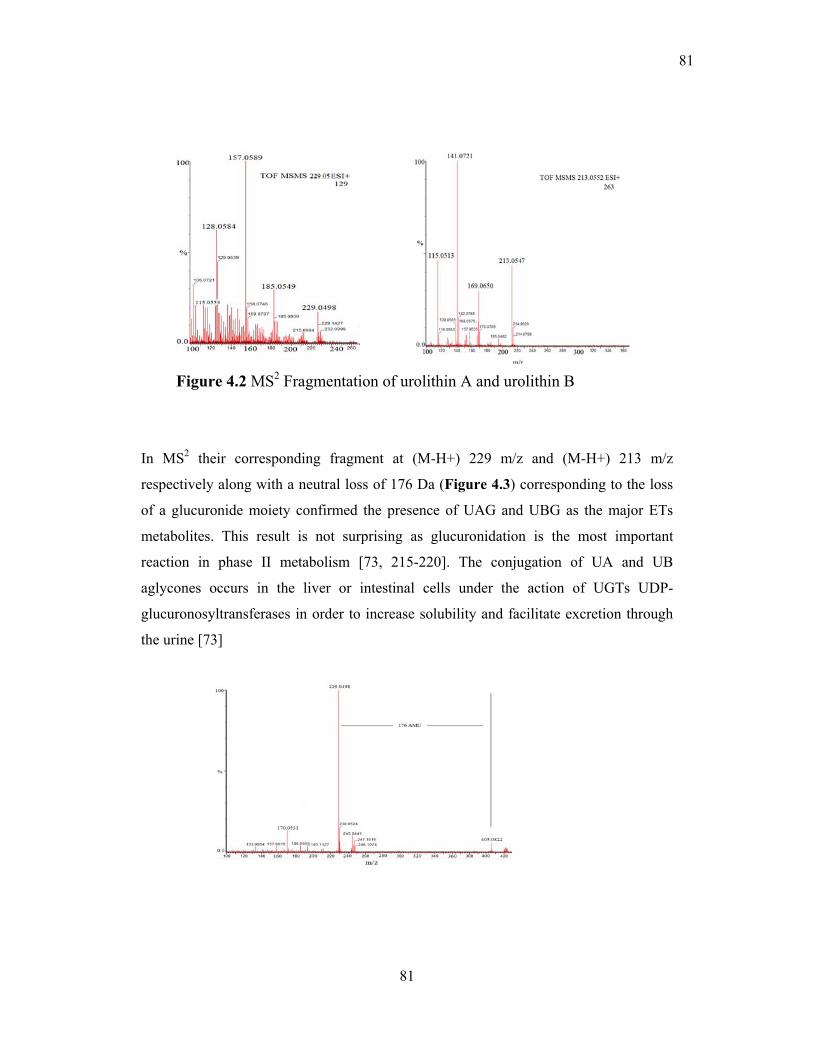
81
81
In MS2 their corresponding fragment at (M-H+) 229 m/z and (M-H+) 213 m/z
respectively along with a neutral loss of 176 Da (Figure 4.3) corresponding to the loss
of a glucuronide moiety confirmed the presence of UAG and UBG as the major ETs
metabolites. This result is not surprising as glucuronidation is the most important
reaction in phase II metabolism [73, 215-220]. The conjugation of UA and UB
aglycones occurs in the liver or intestinal cells under the action of UGTs UDP-
glucuronosyltransferases in order to increase solubility and facilitate excretion through
the urine [73]
Figure 4.3 MS2 fragmentation of urolithin A glucuronide
Figure 4.2 MS2 Fragmentation of urolithin A and urolithin B

82
82
4.2.2 ANNOTATION OF OTHER ETS METABOLITES FOUND IN URINE
High-resolution mass spectrometry analysis of urine was performed to annotate other
compounds. The UPLC / ESI(+)-Q-TOF/MS and MS2 allowed the tentative assignment
of peaks to 14 other ET metabolites. In Table 4.2, these compounds are presented with
their respective retention time, theoretical molecular mass (M-H)+ for the ion, MS2
spectral fragments in the positive mode (ESI(+)), assignment and the acronym used in
this paper. Table 4.2 shows that the small fragment (m/z 115.05) is common to almost
all urolithins, except for UD and UM5 (m/z 114.05). This MS2 fragment ion could be
characteristic of urolithin compounds in a positive mode (ESI+), although this fragment
is also reported in the MS2 patterns of some flavonoids. Figure 4.4., shows an example
of a fragmentation pattern for UC and DMUC, as well as a tentative prediction of some
of the fragment’s structures.

83
83
Table 4.2 UPLC-DAD/ESI(+)-Q-TOF/MS and MS2 analyses of ellagitannins colonic metabolites found in urines of volunteers
Rt (min) UV spectra λmax (nm)
MS (M+H)+ MS2
m/z (% base peak) Assignment Acronym
11,4 248,280,305,366 229,0501 185(30),157(100), 128(65),115(20) Urolithin A UA 13,3 249,276,301,333 213,0552 169(32),141(100),115(47) Urolithin B UB 10.1 255,304,349 245,045 170(100),142(15),115(22) Urolithin C UC 9,09 259,sh291,380 261,0399 218(65),172(85) , 120(87),114(100) Urolithin D UD 8.3 281,sh292,352 277,0348 260(60),232(32)188(45),114(12) Urolithin M5 UM5
12.9 243,0657 229(43),203(65),170(33)151(100), 115(20) Methyl urolithin A MUA
9.3 273,0763 229(30),203(100),189(85),169(35), 137(45),115(70)
Dimethyl-urolithin C DMUC
9,9 240,278,303,347 405,0822 229(100) 170(10) Urolithin A glucuronide UAG
11.3 237,273,297,325, 287,297,326 389,0873 213(100) Urolithin B glucuronide UBG
8.7 421,0771 245(100) Urolithin C glucuronide UCG 14.5 437,0772 261(100) Urolithin D glucuronide UDG 10,4 253, 365 303,0141 177(90),153(100),145(35)131(17) Ellagic acid EA
13,4 507,0775 331(100) Dimethyl ellagic acid glucurionide DMEAG
10.6 331,0454 165(25), 147(100),132(50),115(32) Ellagic acid dimethyl ether DMEA
9,1 305,0297 229(20),180(35),177(55),153(42), 131(100),103(35)
Hexahydroxydiphenyl HHDP

84
84
Figure 4.4 Example of MS2 fragmentation pattern of Ellagic Acid, urolithins: UM5, UDUC, dimethyl elagic acid glucuronide (DMEAG), methyl urolithin A (MUA) anddimethyl-urolithin C (DMUC), and tentative prediction of some fragment ions
UC DMEAG
EA
UM5 UD
MUA
DMUC
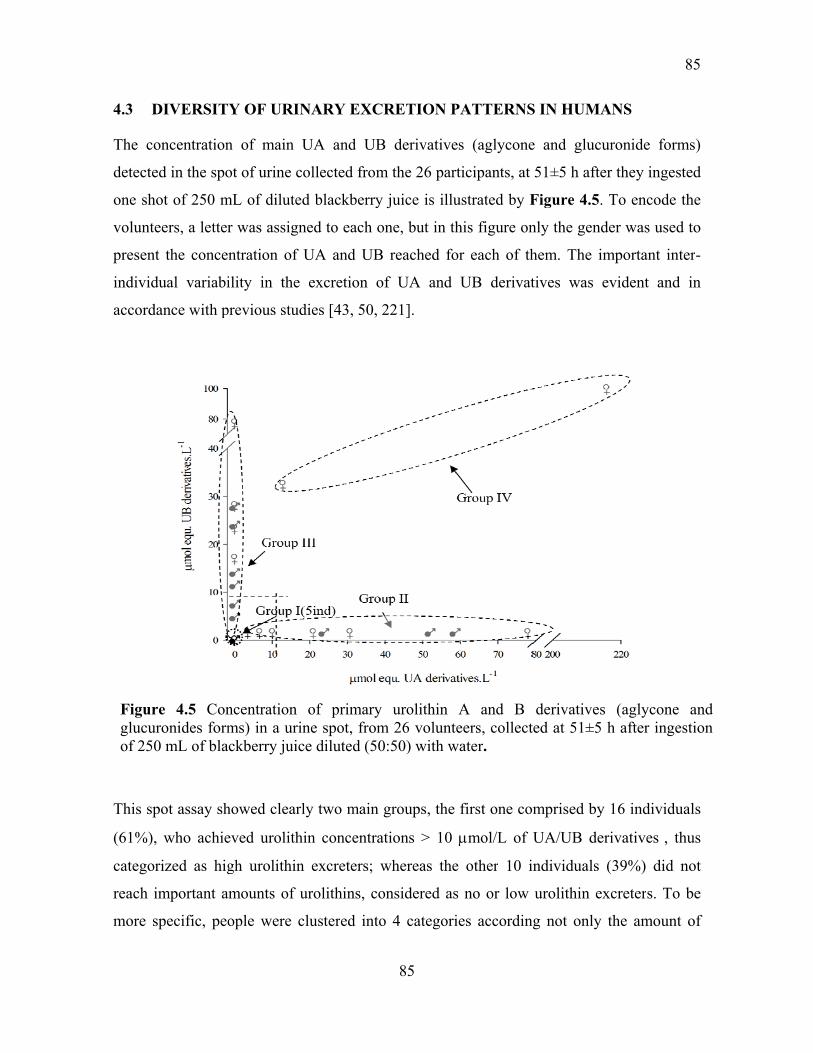
4.3 D
The c
detecte
one sh
volunt
presen
individ
accord
This s
(61%)
catego
reach
more
Figurglucuof 25
DIVERSIT
concentration
ed in the spo
hot of 250 m
teers, a letter
nt the conce
dual variabi
dance with p
pot assay sh
), who achie
orized as hig
important a
specific, peo
re 4.5 Conuronides form50 mL of bla
Y OF URIN
n of main U
ot of urine co
mL of diluted
r was assign
ntration of U
ility in the
previous stud
howed clearl
eved urolithi
gh urolithin
amounts of u
ople were c
ncentration ms) in a urin
ackberry juic
NARY EXC
UA and UB
ollected from
d blackberry
ned to each o
UA and UB
excretion o
dies [43, 50,
ly two main
in concentra
excreters;
urolithins, co
clustered into
of primaryne spot, from
ce diluted (50
85
CRETION P
B derivative
m the 26 par
y juice is illu
one, but in th
B reached fo
of UA and
221].
groups, the
ations > 10
whereas the
onsidered as
o 4 categori
y urolithin m 26 volunte0:50) with w
PATTERNS
es (aglycone
rticipants, at
ustrated by F
his figure on
or each of th
UB derivat
first one co
μmol/L of
e other 10 i
s no or low
ies accordin
A and B eers, collect
water.
S IN HUMA
e and glucu
51±5 h after
Figure 4.5.
nly the gend
hem. The im
tives was e
mprised by
UA/UB der
individuals (
urolithin ex
ng not only t
derivatives ted at 51±5 h
ANS
uronide form
r they ingest
To encode t
der was used
mportant inte
evident and
16 individua
rivatives , th
(39%) did n
xcreters. To
the amount
(aglycone h after inges
85
ms)
ted
the
to
er-
in
als
hus
not
be
of
andstion
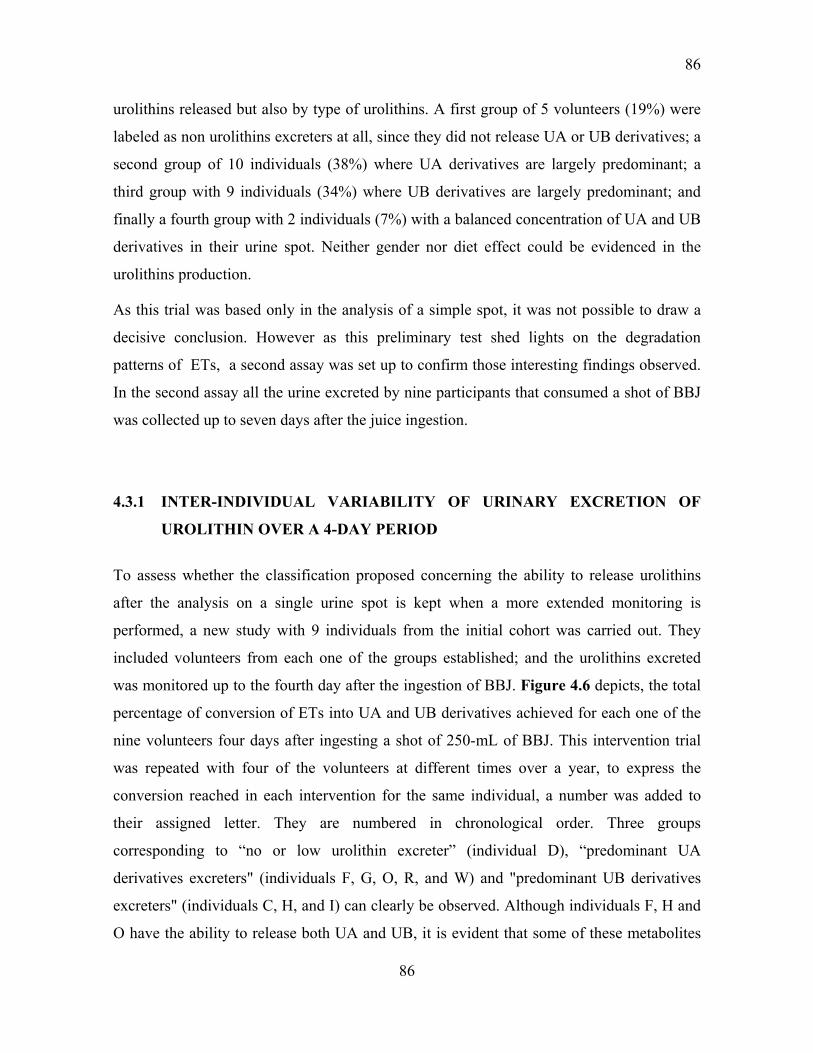
86
86
urolithins released but also by type of urolithins. A first group of 5 volunteers (19%) were
labeled as non urolithins excreters at all, since they did not release UA or UB derivatives; a
second group of 10 individuals (38%) where UA derivatives are largely predominant; a
third group with 9 individuals (34%) where UB derivatives are largely predominant; and
finally a fourth group with 2 individuals (7%) with a balanced concentration of UA and UB
derivatives in their urine spot. Neither gender nor diet effect could be evidenced in the
urolithins production.
As this trial was based only in the analysis of a simple spot, it was not possible to draw a
decisive conclusion. However as this preliminary test shed lights on the degradation
patterns of ETs, a second assay was set up to confirm those interesting findings observed.
In the second assay all the urine excreted by nine participants that consumed a shot of BBJ
was collected up to seven days after the juice ingestion.
4.3.1 INTER-INDIVIDUAL VARIABILITY OF URINARY EXCRETION OF
UROLITHIN OVER A 4-DAY PERIOD
To assess whether the classification proposed concerning the ability to release urolithins
after the analysis on a single urine spot is kept when a more extended monitoring is
performed, a new study with 9 individuals from the initial cohort was carried out. They
included volunteers from each one of the groups established; and the urolithins excreted
was monitored up to the fourth day after the ingestion of BBJ. Figure 4.6 depicts, the total
percentage of conversion of ETs into UA and UB derivatives achieved for each one of the
nine volunteers four days after ingesting a shot of 250-mL of BBJ. This intervention trial
was repeated with four of the volunteers at different times over a year, to express the
conversion reached in each intervention for the same individual, a number was added to
their assigned letter. They are numbered in chronological order. Three groups
corresponding to “no or low urolithin excreter” (individual D), “predominant UA
derivatives excreters" (individuals F, G, O, R, and W) and "predominant UB derivatives
excreters" (individuals C, H, and I) can clearly be observed. Although individuals F, H and
O have the ability to release both UA and UB, it is evident that some of these metabolites

prevai
conver
up to
even l
other E
CO2 [4
Figudete
tropic
This a
assay,
in com
excret
Accor
ET me
non qu
that ex
il over othe
rsion of ETs
37%, which
ow, and ther
ETs could s
49].
re 4.6 Total ermined by Ucal blackberr
assay confirm
where only
mplete accor
ted in urine.
rding to thes
etabolites ar
uantifiable a
xcrete predo
rs, for whic
s into prima
h could be c
re is no expl
uffer an ext
conversion UPLC/DADry juice for 9
ms the patte
a urine spot
dance with t
e results, at
e observed i
amounts and
ominantly U
ch they wer
ary UA or U
onsidered as
lanation for t
tensive degra
of ETs to UD) excreted in
9 individuals
ern discrimi
t analysis w
those achiev
least three d
in the popula
then can be
UA derivativ
87
re classified
UB derivative
s an ample v
the fate of th
adations tha
UA and UB dn urine over s (C,D,F,G,H
ination of th
as carried ou
ved after fou
different patt
ation sample
e considered
es and the t
d into the g
es excreted v
variation. H
he other ETs
at produce sm
derivatives (a4 days after
H,I,O,R,W)
he ETs carri
ut. Results o
ur days of mo
terns for the
e: individual
as non uroli
third group
roup preval
varies betwe
However, the
s. It has been
maller comp
aglycone andingestion ofat different i
ied out from
obtained from
onitoring all
urinary exc
ls that releas
ithin excrete
those who r
lent. The to
een almost 0
e conversion
n proposed th
pounds such
d glucuronidf 250-mL ofintervention
m the previo
m that trial a
l the urolithi
cretion of ma
se urolithins
ers; individua
release most
87
tal
0%
n is
hat
as
de f s.
ous
are
ins
ain
in
als
tly

88
88
UB derivatives. This status appeared to be constant over time. According to the conversion
achieved for individuals that participated several times in this assay, (C,G,H, I,) it can be
suggested that global excretion of urolithin could eventually increase with periodically
ingestion of BBJ.
The UPLC /ESI(+)-Q-TOF/MS profiling of tentatively assigned ETs metabolites in the
urine collected during four day periods are reported in Table 4.3. The relatively lower
presence of UC, UD, UM5, HHDP and EA derivatives could indicate that they are
intermediate substrates with lower hydrophobicity than UA and UB, and therefore were
poorly absorbed and excreted, remaining as a substrate for the microbiome in the intestinal
lumen.
Despite ellagic acid (EA) being the first ET-derivative that appears during the digestion
process in the stomach and duodenum [9], it was hardly detected in urine. Only as dimethyl
ellagic acid (DMEA) or in its glucuronide form (DMEAG), it was found. This suggests that
EA goes into the enterohepatic circulation where it is conjugated. EA can be methylated in
the liver by catechol O-methyl transferase (COMT) and glucuronide [73] to facilitate
urinary excretion. Urolithin C (aglycone and glucuronide forms) as well as other derivative
forms (DMUC and UCMEDG) could be detected in all individuals. UD was also detected
in all individuals (aglycone and glucuronide forms), even though it was at a lower level.
Methyl urolithin A (MUA) was also detected in all individuals, but its base peak intensity
was correlated mostly with UA derivatives (aglycone and glucuronide forms). Based on the
UPLC /ESI(+)-Q-TOF/MS profiling, no other discriminating ETs metabolites could be
evidenced between predominant UA and UB derivatives excreters.
Although the low presence of these metabolites and the lack of standards impede their
quantification, it could be proposed that they are not able to reach the physiological
concentration in plasma or target tissues to exert any protective health effects.
The urinary excretion profile appears to be consistent with previous studies [9, 14] that
report the presence of EA, UM5 (3,4,8,9, 10-pentahydroxy-urolithin), urolithin D
(tetrahydroxy-urolithin), urolithin C (trihydroxy-urolithin), urolithin A (dihydroxy-
urolithin) and urolithin B (monohydroxy-urolithin) as metabolites resulting from the ETs
degradation, nonetheless from this assay it was not possible to confirm the suggested

89
89
sequential dehydroxylation of EA by gut microbiota. As the inter individual variability had
been already confirmed and also a discrimination between UA and UB excreters had been
established, the next step consisted on finding out whether the inter-individual variability
was also present in the kinetic of ETs degradation; and if so, look for the controlling step
in the metabolic pathways. Consequently a more precise and frequent monitoring urine
analysis was proposed, to approach to kinetic metabolism of ETs.
Table 4.3 UPLC /ESI(+)-Q-TOF/MS profiling of the main ETs metabolites excreted in urine during the 4 days after ingestion of blackberry juice for nine individuals (letters) and for different intervention periods (numbered in chronological order)
UA+ UAG
UB+ UBG
UC+ UCG
UD+ UDG UM5 HHDP EA DMEA DMEAG MUA UCME DMUC UCMEDG UDMEG
G1 + - - - nd - - - - - nd - - - G2 +++ - + + nd nd - ++ ++ + nd +++ + ++ G3 ++ + - - +++ + + ++ +++ +++ ++ + + nd G4 +++ - - - nd nd nd - nd + +++ - +++ nd R +++ + - - nd nd - + +++ +++ - - nd B +++ + - - ++ nd + - +++ - ++ ++ + nd D + - - - nd nd nd - nd + - - - nd W +++ - - - - nd nd ++ nd ++ +++ + + nd O +++ + + - - - nd - - - + ++ - - I1 - + + - - nd nd - - - - - - - I2 + ++ - + nd nd +++ ++ + - +++ +++ +++ H1 - + - - - nd nd - - - nd - - - H2 +++ +++ +++ +++ nd +++ ++ ++ ++ nd + + nd H3 ++ +++ - - nd nd + nd +++ + - + nd C1 - + - + - nd - nd - nd - - - C2 +++ +++ + + nd nd +++ +++ ++ +++ nd + + ++ +++ The highest excretion for each metabolite; ++ average excretion; +low excretion;- traces; nd Not detected.
4.3.2 KINETIC EXCRETION OF UROLITHIN A AND UROLITHIN B
To assess the kinetic excretion of ETs metabolism a more exhaustive urine analysis was
performed since every urine excretion of each individual along the seven day after juice
ingestion was analyzed independently. Figure 4.7 depicts the kinetic excretion for the 5
individuals of these UA and UB derivatives in micromole equivalent UA and UB. The
kinetic excretion in urine during the 7 days depicted clear inter-individual variability, with
some individuals (H and F) reaching the highest peaks of urolithin excretion during the first
12 hours after juice ingestion, and others individuals (G, C) reaching maximum urinary
excretion after at least two days. Additionally, it can be observed that the kinetic excretion
of urolithin follows a wave-like trend, with high and low levels probably corresponding to

90
90
digestive cycles. In fact, glucuronide conjugates, such as UAG, have been found to be
preferentially excreted in the bile of Iberian pigs [9].
Figure 4.7 Urolithin UA and UB detected in every one of the samples of urine excreted for 5 individuals up to seven days after they ingested a 250-ml of BBJ.

91
91
The conjugates can then return to the small intestine and eventually undergo new
bioconversion to aglycones before returning to the liver. This enterohepatic recirculation
system, could explain the fluctuations observed and the relatively long residence time of
UA and UB derivatives in the body.
The total excretion of UA and UB derivatives over the 7-day period is presented in Table
4.4. Total excretion of varied from 4 to 68 μmol equ UA/UB, after the ingestion of 250 ml
of blackberry juice that contained 69 mg (228 μmol) of EA equivalents. Consequently,
according to total urinary excretion, ETs’ bioconversion into urolithins ranged from 1.9 to
almost 30%. This relatively low global excretion in the urine can be explained by
accumulation in some tissues, excretion in the feces and body fluids, degradation to other
metabolites and degradation to lower mass compounds that were not identified in this
study.
Table 4.4 Total excretion of urolithins UA and UB and percentage of conversion in relation to ETs ingested after seven days of BBJ ingestion.
Individuals Total amount excreted
% Eq. UA
% Eq. UB
% Conversion UA derivatives
(μmol Equ. UA) UB derivatives (μmol Equ. UB)
TOTAL UA/UB (μmol Equ. UA/UB )
G 15,15 8,35 23,50 64,47 35,53 10,29 H 1,74 26,93 28,68 6,09 93,91 12,55 C 1,81 2,52 4,34 41,77 58,23 1,90 I 0,83 9,55 10,376 7,98 92,02 4,54 F 55,03 13,05 68,08 80,83 19,17 29,80
The total excretion of UA and UB derivatives (Table 4.4) confirms that the individuals
maintained their status as urolithins A (G, F) or as urolithins B (H and I) excreters.
Individual C showed a low production of urolithins but maintain its status as UB excreter,
since the total amount of UB derivatives excreted after the seven days was higher than
those released of UA.

92
92
4.3.3 INTRA-INDIVIDUAL VARIABILITY OF URINARY EXCRETION OF
UROLITHINS
To evaluate the intra individual variability of urolithins excretion, similar kinetics studies
were carried out with four of these participants, analyzing all the urine excreted up to 4
days after volunteers ingested 250 mL of pure BBJ. This kinetic study was repeated several
times along the year, with at least two month intervals of free living between interventions.
Figure 4.8 shows the total amount of urolithins released by day along the four days of the
test.
First intervention trial (G1, H1, I1 and C1) correspond to results from the previous kinetic
study in order to compare with the results with these new trials. Although the inter-
individual variability in kinetic excretion was confirmed, the result that deserves mention is
the high intra-individual variability found on the kinetics excretion of UA and UB
derivatives, as the amount released of these metabolites by the same individual in the
different assays varied significantly. Conversion rates tended to increase (except in the case
of G4) after repeated intervention studies, although they were separated by at least two
months of free living period for volunteers. This result could indicate a possible
enhancement of an individual’s response after repeated ingestion of ETs. Nonetheless, the
status of “predominant UA or UB derivatives excreters” appears to remain constant,
although UB predominance is less pronounced compared to previous results obtained on a
single urine spot. This high intra individual variability could suggest that the categorization
as high or low urolithins excreters should not be generalized, since the ability to release
urolithins for a same individual is not constant, but it can change for different factors still
unknown. Conversely to the clustering into UA or UB excreters that remain constant in the
different trials carried out. In addition, this clustering could result interesting from the
health point of view, since it seems that UA and UB exert potential benefits in different
modes of action [14]

93
93
020406080
100
0 1 2 3 4
Tota
l μm
ol o
f U
A
deriv
ativ
es
Time, dH1 H2 H3
0
20
40
60
80
100
0 1 2 3 4
Tota
l μm
ol o
f UB
de
rivat
ives
Time, dH1 H2 H3
0369
1215
0 1 2 3 4
Tota
l μm
ol o
f UA
de
rivat
ives
Time, dC1 C2
0
3
6
9
12
15
0 1 2 3 4
Tota
l μm
ol o
f UB
de
rivat
ives
Time, dC1 C2
0
3
6
9
12
15
0 1 2 3 4
Tota
l μm
ol o
f UA
de
rivat
ives
Time, dI1 I2
0
3
6
9
12
15
0 1 2 3 4
Tota
l μm
ol o
f UB
de
rivat
ives
Time, dI1 I2
020406080
100
0 1 2 3 4
Tota
l μm
ol U
A
deriv
ativ
es
Time, dG1 G2 G3 G4
Figure 4.8 Excretion kinetics of UA(on the right) and UB(on the left) derivatives for fourindividuals (C,G,H, and I numbered in chronological order) performed at different periods oftime around one year

94
94
4.4 IN-VITRO SIMULATION OF COLONIC FERMENTATION
In vitro models were carried out with the objective of corroborating and complementing the
information obtained from in vivo trials regarding the ETs bioconversion patterns, the
metabolic pathway of urolithins production and their relation with the kinetics of ETs
degradation, the effect the substrate on the ability of microbiota to release urolithins and
also the influence of BBJ on the ability to degrade ETs by microbiota intestinal.
First of all, batch culture incubations of BBJ inoculated with fecal stool from the same
individuals that participated in clinical trials were carried out to evaluate if the results
obtained from those models are maintained also in vitro trials, regarding the categorization
in UA and UB excreters. Moreover incubations of EA and BBJ were also performed to find
out the incidence of the substrate on the ability of microbiota to release urolithins and to
approach to microbial route under which urolithins are released.
4.4.1 IDENTIFICATION OF ETs METABOLITES PRESENT IN FERMENTATION BROTH
UPLC-PDA/ ESI-Q-TOF/MS analysis of batch anaerobic incubation of blackberry juice
(BBJ) and EA dissolved in DMSO lead to envisage eight metabolites according to their
molecular weight (m/z+) and UV spectra. The most important metabolites found in BBJ
incubation was the EA ( 2,3,7,8- tetrahydroxy-chromeno[5,4,3-cde]chromene-5,10-dione)
that was converted mostly into UA; whereas for EA incubations several metabolites were
found, they were 3,4,8,9,10-pentahydroxy-urolithin (UM5), 2 isomers of urolithin D
(tetrahydroxy-urolithin), 3 isomers of urolithin C (trihydroxy-urolithin) and urolithin A (3,8
dihydroxy-urolithin). Most of these metabolites can be observed in the UV chromatogram
illustrated by Figure 4.9. The UPLC-PDA/ ESI-Q-TOF/MS analysis lead to identify these
metabolites according to their chromatographic and MS spectra characteristics summarized
in Table 4.5, and 4.6. This figure depicts their UV spectra and their molecular structure.
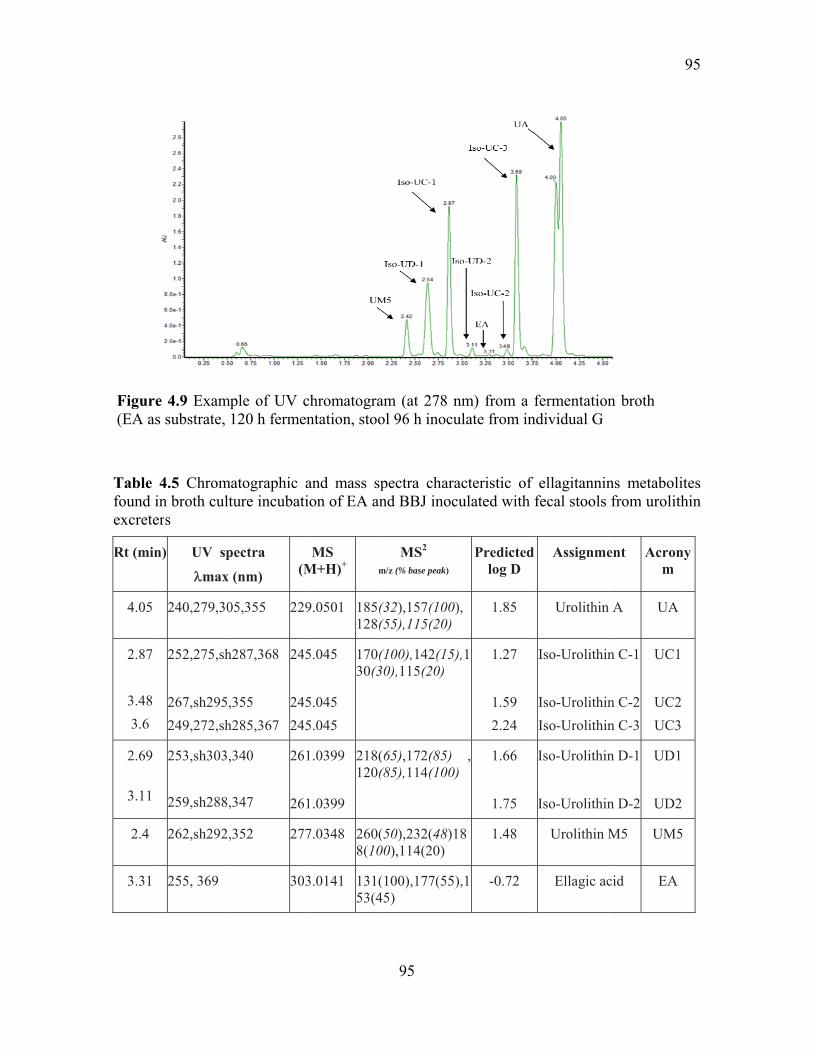
Tablefound excret
Rt (mi
4.05
2.87
3.483.6
2.69
3.11
2.4
3.31
Figur(EA a
4.5 Chromin broth cul
ters
in) UV sp
λmax
240,279,30
7
252,275,sh
267,sh295249,272,sh
9
253,sh303 259,sh288
262,sh292
255, 369
re 4.9 Examas substrate,
matographic lture incubat
pectra
x (nm) (M
05,355 22
h287,368
,355 h285,367
24
2424
,340
,347
26
26
,352 27
30
mple of UV c120 h ferme
and mass sption of EA an
MS M+H)+ m
9.0501 185(128(
5.045
5.045 5.045
170(30(3
1.0399
1.0399
218(120(
7.0348 260(8(10
3.0141 131(53(4
chromatograentation, stoo
95
pectra charand BBJ inoc
MS2
m/z (% base peak)
(32),157(100)(55),115(20)
(100),142(15)30),115(20)
(65),172(85)(85),114(100)
(50),232(48)100),114(20)
(100),177(55)45)
am (at 278 nol 96 h inocu
acteristic of culated with
Predictedlog D
), 1.85
),1 1.27
1.59 2.24
, )
1.66
1.75
18 1.48
),1 -0.72
nm) from a ulate from in
f ellagitanninfecal stools
d Assignme
Urolithin
Iso-Urolithin
Iso-UrolithinIso-Urolithin
Iso-Urolithin
Iso-Urolithin
Urolithin M
Ellagic ac
fermentationndividual G
ns metabolitfrom urolith
ent Acronym
n A UA
n C-1
n C-2 n C-3
UC1
UC2UC3
n D-1
n D-2
UD1
UD2
M5 UM5
cid EA
n broth
95
tes hin
y

96
96
Table 4.6 Main ETs metabolites released along the degradation of ETs.a) EA, b) UM5, c) Iso UD1, d) Iso UD2, e) Iso UD3.
a)Ellagic acid. C14H6O8. MW: 302.0062
b)UM5: C13H8O7.3,4,8,9,10-tetrahydroxy-6H-benzo[c]chromen-6-one)
c) ISO UD 1 :C13H8O6 MW: 260.0321 Iso-urolithin D (3,4,8,10-tetrahydroxy-6H-benzo[c]chromen-6-one)
d) ISO-D 2: C13H8O6 MW: 260.0321. Iso-urolithin D (3,8,9,10-tetrahydroxy-6H-benzo[c]chromen-6-one)
NOT OBSERVED
e) ISO UD 3. C13H8O6 MW: 260.0321: Iso-urolithin D (3,4,8,9-tetrahydroxy-6H-benzo[c]chromen-6-one
O
O
HO OH
HO OH

97
97
Table 4.7 Main ETs metabolites released along the degradation of ETs. a)Iso UC1, b) Iso UC2, c) Iso UC3 d) UA
a) UC 1: C13H8O5 MW: 244.061 Iso-urolithin C(3,8,10-hydroxy-6H-benzo[c]chromen-6-one)
b)UC 2: C13H8O5 MW: 244.06. Iso-urolithin C (3,8,9-hydroxy-6H-benzo[c]chromen-6-one
c) UC 3 : C13H8O5 MW: 244.06 Iso-urolithin C (3,7,8-hydroxy-6H-benzo[c]chromen-6-one
d)Urolithin A C13H8O4 MW: 228.0423 (3,8-hydroxy-6H-benzo[c]chromen-6-one
The characteristic UV spectrum of ETs metabolites and exact mass obtained by UPLC-ESI-
Q-TOF/MS is in accordance with those previously published [58].
In vitro trials helped identify more ET metabolites than those found in clinical tests but in
their aglycones forms; as is expected since conjugation reactions occur in liver or intestinal
O
O
HO OH
HO
O
O
HO
HO
OH

98
98
cells. However one of the most interesting differences between these two models was the
absence of UB aglycone from in vitro trials. It was surprising as UB had come out in
clinical studies under its conjugated form of UB glucuronide and in such important
amounts. These assays confirm the microbial origin of most of the urolithins.
The other point that can be highlighted is the differences in the number of metabolites
released by incubation of EA and BBJ. For unknown reasons, EA can be degraded easily
by fecal stool microbiota into diverse type of urolithins that finally lead to UA. However
from BBJ the biodegradation route was not evident, since it was not possible to find any
ETs metabolite different to EA in the broth culture until UA came out in the broth.
Although there are no certainties in this finding, this could be explained in the fact that
juice is rich in other compounds and intestinal microbiota has the ability to perform
different types of reactions. Consequently different EA derivatives could be released and
subsequently converted into other metabolites that could react with other compounds
present in the juice that by further degradation release UA. However since no other EA
derivatives were searched into the broth culture incubations it could be suggested that
urolithins from BBJ also have microbial origins, but their metabolic pathways differ from
those followed by EA and remain undefined.
4.5 VARIABILITY OF STOOLS' ABILITY TO PRODUCE ETS METABOLITES
The percentages of molar conversions of ETs or EA into urolithin metabolites, after 24h, 72
and 120 h of an anaerobic incubation of juice or EA with fecal stool of nine volunteers are
depicted in Figure 4.10. At first glance, it can be observed the important variability
between the ability of the different stools to produce ETs metabolites, which can also
explain the high inter-individual variability observed in-vivo for the urinary excretion of
urolithins derivatives.

99
99
Figure 4.10 Primary ellagitannins metabolites assessed after 24, 72 and 120 h of batch anaerobic incubations of blackberry juice (A) and ellagic acid (B) with fecal stools donated by nine volunteers (A, B,C,D,E,F,G,H,I), previously qualified as urinary
4.5.1 EFFECT OF SUBSTRATE IN THE PRODUCTION OF UROLITHINS
From the same Figure 4.10, it is also possible to observe the effect of the substrate on the
microbial ability to release urolithins. Comparing the two plots is evident the different
pathway followed by fecal stool microbiota to convert EA and BBJ into urolithins and also
the major activity showed by microbial community when EA is the substrate.
24 h
EA UM5 UD UC UA
% c
onve
rsio
n of
ETs
( μm
ol E
A e
qu.)
0
2
4
6
8
10
12
14 72 h
EA UM5 UD UC UA0
2
4
6
8
10
12
14
A B C D E F G H I
EA UM5 UD UC UA0
2
4
6
8
10
12
14
30
40
120 h
24 h
UM5 UD UC UA
% c
onve
rsio
n of
ETs
( μm
ol E
A e
qu.)
0
10
20
30
4072 h
UM5 UD UC UA0
10
20
30
40A B C D E F G H I
UM5 UD UC UA
Y D
ata
0
10
20
30
40
50
120 h
A) Blackberry juice
B) EA
100
100
4.5.1.1 Urolithin production from BBJ
Figure 4.10A. shows that EA is easily released from BBJ, since at first 24 hours EA comes
into the broth and at 72 hours reaches important amounts. Consequently, it can be stated
that EA release is not a controlling step in BBJ conversion into urolithins. On the other
hand all other metabolites hardly emerged in important quantities during the study. Only
after 120 hours UA came out and became the most important microbial metabolite released
by the ETs degradation. This means that EA is probably transformed into UA, following a
metabolic pathway different to that proposed so far by some authors [9, 14, 121] or maybe
the transformation of EA into other intermediate metabolites from these into UA is too fast
to be followed in this trial.
Whatever the cause for the low presence of these metabolites, it is evident that they could
hardly exert any systemic health benefits on the consumer, since in clinical studies they
were not found in measurable quantities.
4.5.1.2 Urolithins production from EA
Figure 4.10B shows how the route to release urolithins depends on the substrate used.
From this figure it can be said that degradation of EA is in accordance with the metabolic
pathway proposed for some authors [9, 14] since the presence of UM5, UD, UC is evident
until it reaches UA; whereas from BBJ only UA achieved high concentrations. This leads to
think that bioconversion of EA into urolithins follows a different route to that pursued by
ETs from BBJ. In addition, the same figure also shows UM5 is the predominant urolithin
released from EA degradation even after 120 h of fermentation, which could lead to think
that conversion of UM5 into other metabolites such as UD or UC could be the controlling
step in the degradation of EA; whereas for ETs from BBJ, the conversion of EA into other
metabolites could be the controlling step. According with this it could be suggested that EA
is not released as free EA from BBJ, but as EA derivatives that are broken down in the cone
of the MS releasing EA. Those EA derivatives can be also converted into urolithin A by
colonic microbiota, and although their degradation takes longer time than free EA, the
conversion into UA is also high.

101
101
Under conditions followed in the trials, it can be suggested that BBJ results a better
substrate than EA for degradation by stool microflora, according to the UA conversion
reached, despite the fact that no other ETs metabolites were found. The BBJ is a more
suitable substrate for releasing UA than EA, as only the inoculums from one of the
individuals had the ability to degrade the EA into UA, while the BBJ was degraded into UA
by most of the stool. The fact that no other ETs metabolites were found from the BBJ
degradation is not important as biological effects of ETs metabolites are due to UA and
UB[14, 45, 54, 72, 75, 115, 117].
4.5.2 SUGGESTED BIOCONVERSION PATHWAY OF ETs TO UROLITHIN IN-
VITRO
Fecal stools from 9 donors, previously selected for their ability to excrete urolithins in their
urines, were used as inoculums during batch anaerobic fermentation of sterile blackberry
juice and a solution of ellagic acid (EA). After 24, 48 and 120 hours of fermentation, broth
cultures were analyzed by UPLC-DAD/ ESI-Q-TOF/MS for quantification of primary
ellagitannins (ETs) metabolites. Eight metabolites were quantified by UV detector, ellagic
acid (EA), 3,4,8,9,10-pentahydroxy-urolithin (UM5), 2 isomers of urolithin D
(tetrahydroxy-urolithin), 3 isomers of urolithin C (trihydroxy-urolithin) and urolithin A (3,8
dihydroxy-urolithin). These results are in complete accordance with previous studies of ETs
metabolism that pointed out these metabolites as the result of the ETs degradation.
However, the metabolic pathway to transform ETs from BBJ into urolithins was not
corroborated because none of these metabolites came out into the broth in quantifiable
concentrations. From the results achieved by EA degradation by fecal stool a bioconversion
pathway of EA into urolithins was proposed and presented in Figure 4.11. This metabolic
pathway is in accordance with that suggested in previous articles [9, 14], although with
some modifications concerning the inclusion of UC and UD isomers. Nevertheless, a gap
concerning to metabolic route of ETs remains unsolved. Although it was evident that ETs is
converted easily into EA, there are no certainties about the fate of this compound. A
possible explanation proposed in clinical assays could be also valid in this in vitro model.

102
102
Probably also EA derivatives were released and their further degradation gave origin to
UA. Unfortunately EA derivatives were not looking for in the UPLC-MS/MS analysis and
then there are no proves for this hypothesis.
One the most remarkable results from the first in vitro assay is the absence of UB in all the
batch cultures carried out, even more in those inoculated with FS from individuals
previously clustered as UB excreters in in vivo assays. This fact leads to discuss the
potential importance of the interactions between microbiota and host.
Figure 4.11 Suggested metabolite pathway occurring during incubation of pure ellagic acid with active fecal stool from urolithin excreter
4.6 POTENTIAL INTERACTION BETWEEN MICROBIOTA AND HOST
The urolithin UB that prevails during urinary excretion in some individuals was not
produced in-vitro during batch culture with stools, even from UB derivative excreters. It
could be possible that UB production require the participation of enzymes or physiological
EA
UM5
UD-3 UD-1
UC-1 UC-3 UC-2
UA
UD-2

103
103
conditions of the digestive system or maybe the microorganisms that participated in the UB
production needs more appropriate conditions to grow than those used in the in vitro test. In
addition, simulation of colonic fermentation in-vitro showed a slower bioconversion
process of ETs and even EA into urolithin, than in-vivo. Actually, in-vivo urolithin
production peak was reached between 40 and 60 hours after ingestion of juice. The
gastrointestinal tract conditions, with constant mixtures and malaxations may facilitate the
biodegradation of ETs by microbiota intestinal. However, we should have at least detected
with fecal stool of UB excreters, (according to in vivo test) traces of urolithins UB. These
stools were able to produce UA even more than in vivo which confirms unambiguously the
microbial origin of UA, but not for UB. These results were observed for incubations with
both substrate EA and ETs.
Comparing the results found in-vivo and in vitro, it can be proposed that ETs undergo both
bioconversion by intestinal microbiota but also additional bioconversion by the metabolic
system of host. The in-vivo trials where BBJ was ingested helped identify UB in important
biological quantities, as well as other ETs metabolites in their conjugated forms, whereas in
vitro trials from BBJ incubations results were different, since only UA came out in high
concentrations. A hypothesis to explain these results should consider the possibility of an
efficient recycling of UAG, which is excreted preferentially in the bile [9] and in the gut,
where under microbiome action, simultaneous deconjugation and hydroxylation could be
facilitated to yield UB in some individual.
This hypothesis is illustrated in Figure 4.12. In this case, UAG should be excreted first.
However, according to our results, no evidence of lag time between the excretion of UAG
and UBG was observed. Nonetheless, this time lag should be difficult to evidence in-vivo.
Additionally, the human liver cytochrome CYP450 enzymes could be involved in the
pathway as this enzyme has been previously shown to catalyze the hydroxylation of UB
into UA to facilitate glucuronidation [73]. Actually, the excretion of UA derivatives should
be facilitated over UB because of the presence of two hydroxyl groups that can be more
easily glucuronided in the liver, compared to only one available hydroxyl group for UB.
The same work [73] shows that the presence of UB enhances the expression of CYP450
genes 15- to 20-fold times in intestinal Caco-2 cells. As the polymorphism of cytochrome

104
104
CYP450 is relatively high between individuals [222], predominant excretion of UB
derivatives could be due to lower activity of this enzyme.
COMT
UAG
Lactonisation
EA
UM5
UD
UA
UAG
Dehydroxylases
Dehydroxylatses
Dehydroxylases
DDeconjugation (β-glucuronidase)
Bile (enterohepatic recirculation)
COMT: catechol O-methyl transferase CYP450: Cytochrome P450
UGTs P-glucuronosyltransferases
MEA, DMEA,DMEAG
ET
UB
UA
EA
HHDP
Hydrolases(tannases)
UC
Dehydroxylases
DMUC,UCME
UB UBG
UGTs
CYP450
UGTs UBG
UAG
MUA
methylase
UGTs
Conjugation (Phase I and II metabolism)
UGTs UDG
UGTs UCG
Colon Intestinal cells liver Systemic circulation Urinary excretion
Figure 4.12 Schematic representation of proposed metabolic pathways of the excretionof the main metabolites identified in human urine after ingestion of tropical highlandblackberry juice
105
105
5 MICROBIOTA ECOLOGY AND ABILITY TO PRODUCE
UROLITHINS
5.1 RESEARCH OF CORRELATION BETWEEN GUT ECOLOGY AND IN-
VIVO ABILITY TO EXCRETE UROLITHINS
A major challenge to study human gut microbiota ecology is the assessment of the bacterial
diversity or community structure present in the gastrointestinal environment. Most of the
species present in gut microbiota cannot be cultured by classical method and culture
independent techniques are required. Recent advances in molecular biology techniques are
now becoming available and can be used to profile the microbial ecology of different
environments and to try to evidence differences or changes in diversity, composition and
structure. A case in point is the present study, which proposes to investigate if a
relationship between gut microbiota ecology and the status of urolithin excreters of human
volunteers studied previously can be evidenced. For this, we have chosen to use PCR-
DGGE profiling, a molecular technique based on DNA analysis that has been widely
applied to assess microbial ecology in different environments although it has been used
rarely and only very recently for profiling gut microbiota [223]. The advantages of using
DGGE are well established, as it provides a more accurate means of visualizing whole
microbial communities. As it is based on DNA and multiplication by PCR, bias in the
detection of unculturable species is reduced. Additionally, it is relatively easy to implement
and much less labor-intensive than the more-conventional culture-independent techniques
of PCR cloning and sequencing.
5.1.1 PCR-DGGE PROFILING OF THE 26 VOLUNTEERS
This first study aims at establishing the baseline for microbiota ecology fingerprinting of 26
volunteers who donated fecal stool before ingesting blackberry juice. The collection of
stools was performed the same day of the ingestion of blackberry juice. The DGGE
fingerprint of bacterial gut microbiota of the 26 volunteers is presented on Figure 5.1 and

106
106
5.2, as an unweighted pair group method with arithmetic averages (UPGMA) dendogram.
First, it can be observed a good repeatability between gels as DGEE profile of a same
individual but obtained in different gels (Latin letter + number) clustered in the exact same
sub-groups with very high similarities. In fact, one of the main drawbacks of gel
electrophoresis techniques is the difficulty of comparing lanes between gels and taking all
the precautions to perform the analysis in the same conditions, since important differences
can appear. Nonetheless, thanks to the correction of background noise, alignment of the
retardation factor (Rf), deconvolution of overlaid peaks and the calculation of band %
which allows for correction of the loading and light exposure, it was possible to obtain
reproducible results.
In Figure 5.1, we can observe that the banding patterns generated are quite complex, as 53
different bands could be detected. Even though this number is not representative of all the
diversity of gut microbiota, DGGE fingerprinting should be considered representative of
the most common bacteria in the human intestinal microbial community. Each gel lane
corresponds to the DGGE separation of the amplicons of bacterial 16S rRNA genes and
bands or “grey/black spots” corresponds to specific amplicons characteristics of a microbial
species. Comparing by eye the 26 patterns in the bands proved difficult at first, and only a
hierarchical cluster analysis allowed to distinguish 6 distinct groups (excepting control), at
60% dissimilarity threshold. We can also observe a large group that includes more than 50
% of individuals. Nonetheless, dissimilarity remains high among groups (Figure 5.2) and
these results confirm the important variability in the composition and ecology of gut
bacteria among humans.
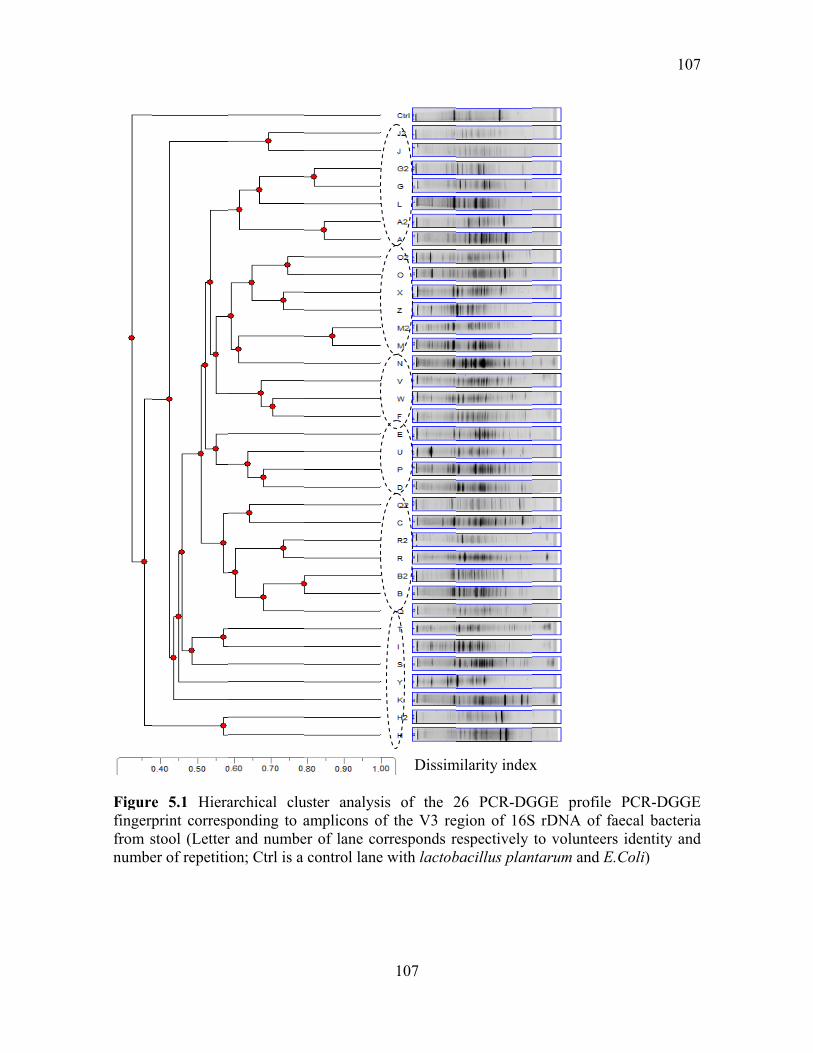
Figurefingerpfrom snumbe
e 5.1 Hieraprint correspstool (Letterer of repetiti
archical cluponding to ar and numbeon; Ctrl is a
uster analysamplicons oer of lane cocontrol lane
107
is of the 2of the V3 reorresponds re with lactob
Dissim
26 PCR-DGegion of 16Srespectively bacillus plan
milarity index
GGE profileS rDNA of fto volunteer
ntarum and E
x
1
e PCR-DGGfaecal bacterrs identity aE.Coli)
07
GE ria
and

Figurebetweeand nu
e 5.2 Compen lanes) (Lumber of rep
plete linkagLetter and nupetition; Ctrl
e cluster anumber of lanl is a control
108
nalyses of 1ne corresponlane with L.
1-r (1 minunds respectiv. plantarum
us the Pearsvely to voluand E.Coli)
1
on coefficieunteers identi
08
ent ity

109
109
5.1.2 RELATION WITH UROLITHIN EXCRETERS STATUS DETERMINED ON A URINE SPOT
In Table 5.1, is presented the concentration of primary urolithin A and B derivatives
(aglycone and glucuronides forms) detected in a urine spot, from 26 volunteers, collected at
51±5 h after ingestion of 250 mL of blackberry juice diluted (50:50) with water. The
objective of this study is to try to relate previous microbiota profiling to the ability to
excrete urolithin in urine.
Table 5.1 Concentration of urolithin A and B derivatives in a urine spot collected at 51±5 h, after ingestion of one shot of 250 ml of blackberry juice. Individual Gender Urolitin excreter status μmol equ.UA.l-1 μmol equ. UB.l-1 TOTAL, μmol.l-1
A Female UA 30.7 1.5 32.2B Female UA 10.1 1.5 11.6C Female UB nd 77.2 77.2D Male N nd nd -- E Male UB nd 23.9 23.9F Male UA 58.6 1.5 60.1G Female UA 215.9 99.7 315.6H Female UB nd 28.0 28.0I Male UB nd 27.7 27.7J Female UA 6.7 1.5 8.2K Female UB nd 23.3 23.3L Female N nd nd -- M Female N nd nd -- N Female UA 20.9 1.5 22.4O Female UB 12.9 32.4 45.3P Female UA 78.0 1.5 79.5Q Female UA 3.5 1.5 5.0R Female UA 8.9 nd 8.9S Female UB nd 17.0 17.0T Male UB nd 4.7 4.7U Male N nd nd -- V Male UB nd 11.4 11.4W Male UA 52.0 1.5 53.4X Male UB nd 14.0 14.0Y Male UB nd 7.4 7.4Z Male UA 23.7 1.5 25.1
nd* means “not detected”
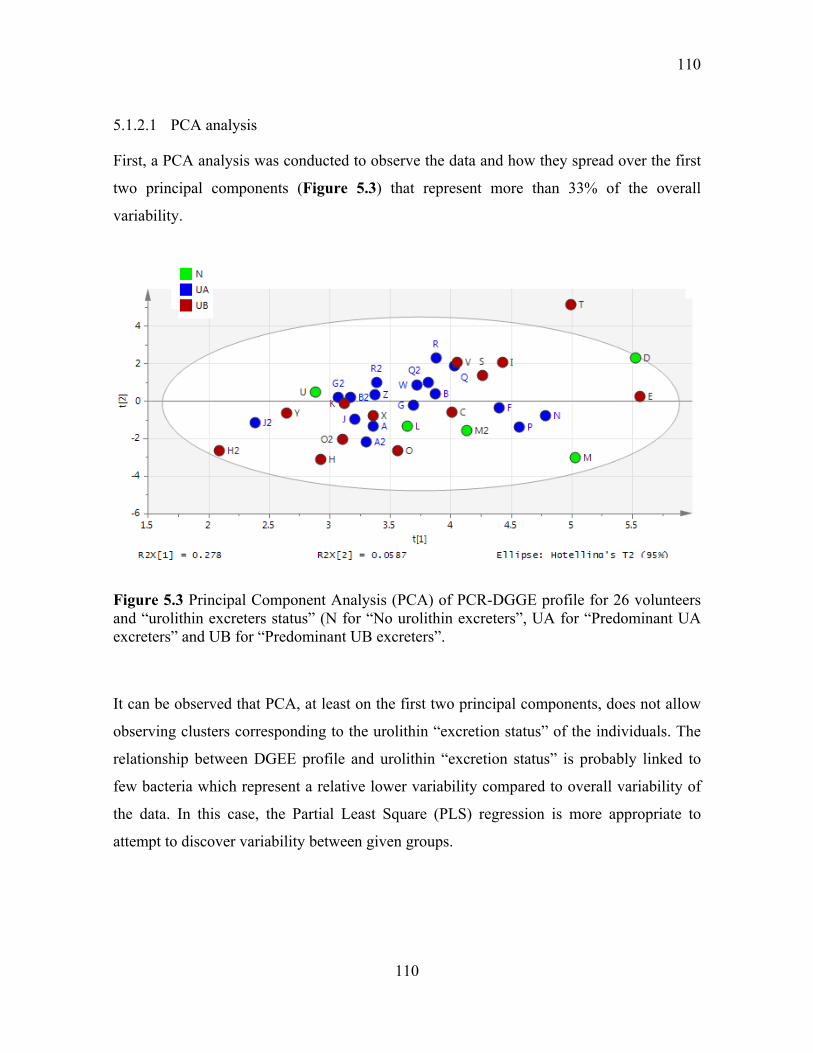
110
110
5.1.2.1 PCA analysis
First, a PCA analysis was conducted to observe the data and how they spread over the first
two principal components (Figure 5.3) that represent more than 33% of the overall
variability.
Figure 5.3 Principal Component Analysis (PCA) of PCR-DGGE profile for 26 volunteers and “urolithin excreters status” (N for “No urolithin excreters”, UA for “Predominant UA excreters” and UB for “Predominant UB excreters”.
It can be observed that PCA, at least on the first two principal components, does not allow
observing clusters corresponding to the urolithin “excretion status” of the individuals. The
relationship between DGEE profile and urolithin “excretion status” is probably linked to
few bacteria which represent a relative lower variability compared to overall variability of
the data. In this case, the Partial Least Square (PLS) regression is more appropriate to
attempt to discover variability between given groups.
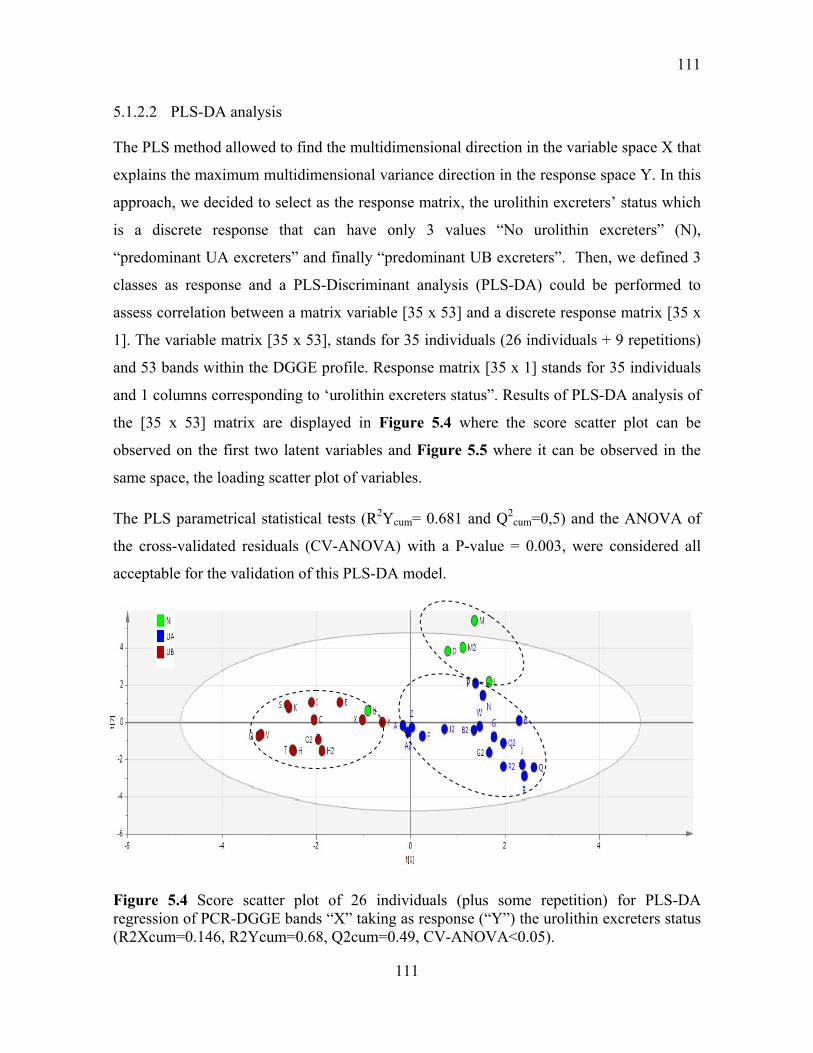
111
111
5.1.2.2 PLS-DA analysis
The PLS method allowed to find the multidimensional direction in the variable space X that
explains the maximum multidimensional variance direction in the response space Y. In this
approach, we decided to select as the response matrix, the urolithin excreters’ status which
is a discrete response that can have only 3 values “No urolithin excreters” (N),
“predominant UA excreters” and finally “predominant UB excreters”. Then, we defined 3
classes as response and a PLS-Discriminant analysis (PLS-DA) could be performed to
assess correlation between a matrix variable [35 x 53] and a discrete response matrix [35 x
1]. The variable matrix [35 x 53], stands for 35 individuals (26 individuals + 9 repetitions)
and 53 bands within the DGGE profile. Response matrix [35 x 1] stands for 35 individuals
and 1 columns corresponding to ‘urolithin excreters status”. Results of PLS-DA analysis of
the [35 x 53] matrix are displayed in Figure 5.4 where the score scatter plot can be
observed on the first two latent variables and Figure 5.5 where it can be observed in the
same space, the loading scatter plot of variables.
The PLS parametrical statistical tests (R2Ycum= 0.681 and Q2cum=0,5) and the ANOVA of
the cross-validated residuals (CV-ANOVA) with a P-value = 0.003, were considered all
acceptable for the validation of this PLS-DA model.
Figure 5.4 Score scatter plot of 26 individuals (plus some repetition) for PLS-DA regression of PCR-DGGE bands “X” taking as response (“Y”) the urolithin excreters status (R2Xcum=0.146, R2Ycum=0.68, Q2cum=0.49, CV-ANOVA<0.05).

112
112
It can be observed that the PLS-DA analysis allows discrimination, except for individual
U, between urolithin excreters status only basing discrimination on 14,6 % of the overall
variability of variables (R2Xcum=0.146). In the case, of individual U, it should be useful to
reconsider his urolithin excretory status, as this determination on a single urine spot could
be misleading but unfortunately, reassessment was not possible.
The loading plot of the band of the PCR-DGGE lanes presented in Figure 5.5 shows the
importance of some bands in the discrimination of the 3 different groups, “No urolithin
excretors” (N), “predominant UA excretors” and finally “predominant UB excretors”.
Figure 5.5: Loading plot of the different bands from PCR-DGGE analysis “X” for PLS-DA regression of PCR-DGGE bands “X” taking as response (“Y”) the urolithin excreters status (R2Xcum=0.146, R2Ycum=0.68, Q2cum=0.49, CV-ANOVA p-Value =0.003) (Size of “X” variable
For the “No urolithin excreters” (N) group it appears that bands at Rf 0.194, 0.642 and
0.213 are the most important terms in the model with respect to the discrimination of this
group. Nonetheless, the PLS-DA regression coefficients for each band displayed in Figure
5.6 showed a too high confidence interval including zero value. For the group
corresponding to “predominant UA excretors”, results appear to be more reliable with
lower confidence intervals of the regression coefficients of the most important terms in the
model. For this group, we can observe 5 bands that appear to be related with UA excretion

113
113
patterns (Rf 0.501; 0.335; 0.252, 0.556 and 0.47). In the case of the third group
corresponding to “predominant UB excretors”, there are also 5 bands correlated to this
group ( Rf 0.672; 0.438; 0.173; 0.805 and 0.623). All these bands should correspond to the
sequence of some microorganisms that we will try to tentatively identify later.
Figure 5.6 PLS-DA regression coefficients with confidence intervals for the three different groups, for each bands of the PCR-DGGE
Group N
Group A
Group UB

114
114
Also, it should be mentioned that some bands were also negatively correlated with groups
such as Rf 0.482 for UA group.
5.1.2.3 PLS analysis
This first part of this study was performed taking into account only the urolithin excreters’
status, and PLS-DA method was used to discriminate the three groups. Nonetheless, the
relative intensity of urolithin excretion could also be taken into account. Some individuals
excrete more or less urolithin in their urine after blackberry juice consumption (Table 5.1)
and this intensity may also be related to a specific composition of gut microbiota. For this
task, a PLS analysis was performed to try and relate two data matrixes, the same [35 x 53]
variable matrix as before and a response matrix [35 x 3], 3 standing for the concentration
value of UA, UB and total urolithin in the spot of urine of the 26 individuals +9
repetitions.
Figure 5.7 PLS variable importance for projection for each bands of the PCR-DGGE with confidence intervals (R2Xcum=0.0525, R2Ycum=0.6, Q2cum=0.39, CV-ANOVA for UA P-value =0.12, for UB 0.038 and for total urolithin 0.048 )
The model was validated for UB, and total urolithin, but not for UA for which the P-Value
of the ANOVA of cross-validated residuals was higher than the 0.05 threshold chosen for
statistical significance. As it can be observed in this PLS model, Figure 5.8., the most
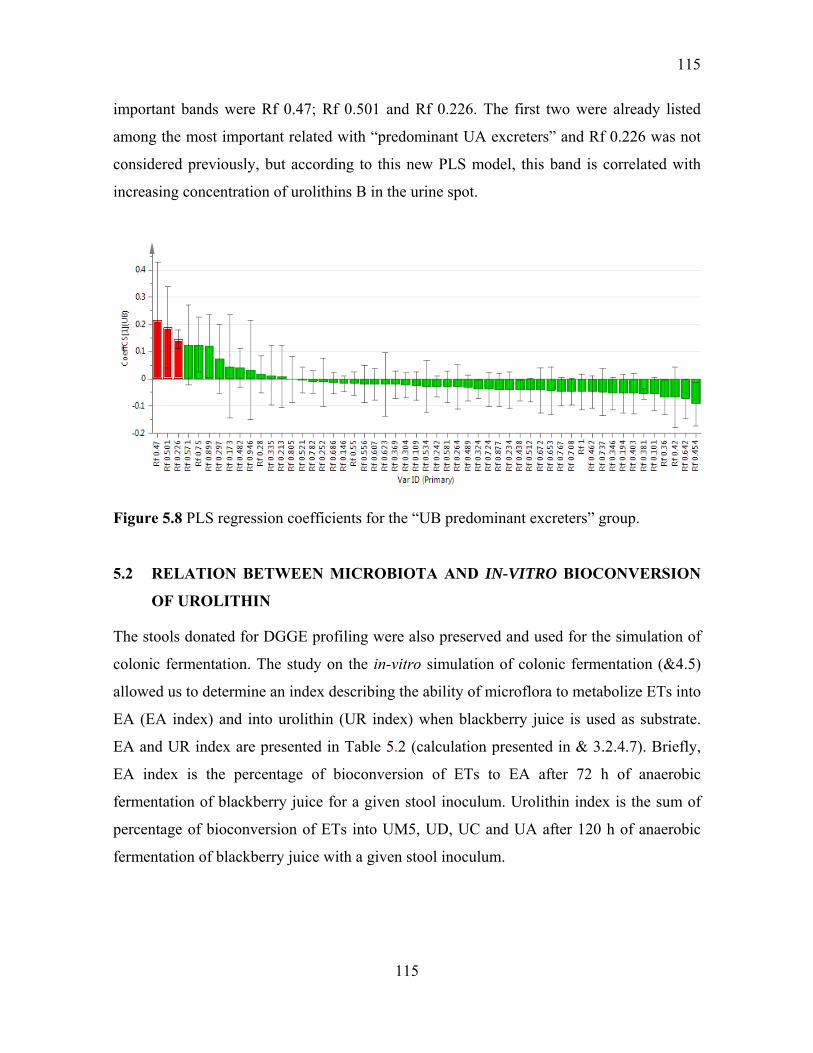
115
115
important bands were Rf 0.47; Rf 0.501 and Rf 0.226. The first two were already listed
among the most important related with “predominant UA excreters” and Rf 0.226 was not
considered previously, but according to this new PLS model, this band is correlated with
increasing concentration of urolithins B in the urine spot.
Figure 5.8 PLS regression coefficients for the “UB predominant excreters” group.
5.2 RELATION BETWEEN MICROBIOTA AND IN-VITRO BIOCONVERSION
OF UROLITHIN
The stools donated for DGGE profiling were also preserved and used for the simulation of
colonic fermentation. The study on the in-vitro simulation of colonic fermentation (&4.5)
allowed us to determine an index describing the ability of microflora to metabolize ETs into
EA (EA index) and into urolithin (UR index) when blackberry juice is used as substrate.
EA and UR index are presented in Table 5.2 (calculation presented in & 3.2.4.7). Briefly,
EA index is the percentage of bioconversion of ETs to EA after 72 h of anaerobic
fermentation of blackberry juice for a given stool inoculum. Urolithin index is the sum of
percentage of bioconversion of ETs into UM5, UD, UC and UA after 120 h of anaerobic
fermentation of blackberry juice with a given stool inoculum.

116
116
Table 5.2 EA and UR Index of stools from 9 individuals
Individual Genre Sp. Status* EA index UR Index
A Female UA 9,39 37,15 B Female UA 12,33 34,17 C Female UB 9,12 28,95 D Male N 8,36 5,38 E Male UB 3,75 2,77 F Male UA 2,23 9,94 G Female UA 1,95 0,35 H Female UB 1,58 0,28 I Male UB 0,74 0,42
*Previous status in vivo on one urine spot (UA “predominant UA excreters”, UB “Predominant UB excreters”, N “no urolithin excreters”)
An orthogonal partial least square (OPLS) regression was performed to assess correlation
between the variable matrix [13 x 53] and the response [13 x 2] matrix, comprising the two
bioconversion ability indexes, EA index and urolithin index. Results of OPLS analysis of
the [9 x 82] matrix are displayed in Figure 5.8. The OPLS parametrical statistical tests
were considered acceptable to use this model, even though for EA the P-value for the
ANOVA of the cross-validated residuals model was slightly higher than the 0.05 threshold.
The scatter plot of individuals and the loading plot of the PCR-DGGE bands referenced by
their retardation factor on the lanes (Rf) are presented, as well as their regression
coefficient within the model, including respective confidence intervals.
On Figure 5.9, at least 4 bands were identified with the highest variable importance for
projection of the model (VIP) superior to 1 and with relatively reduced confidence
intervals. Two bands (Rf 0.346; 0,252) were more positively correlated with urolithin
indexes, while the same bands plus two other bands (Rf 0,724 and 0.556) were more
correlated to EA index. It is also worthy to mention that Rf 0.899 and Rf 0.304 were
negatively correlated with both index.
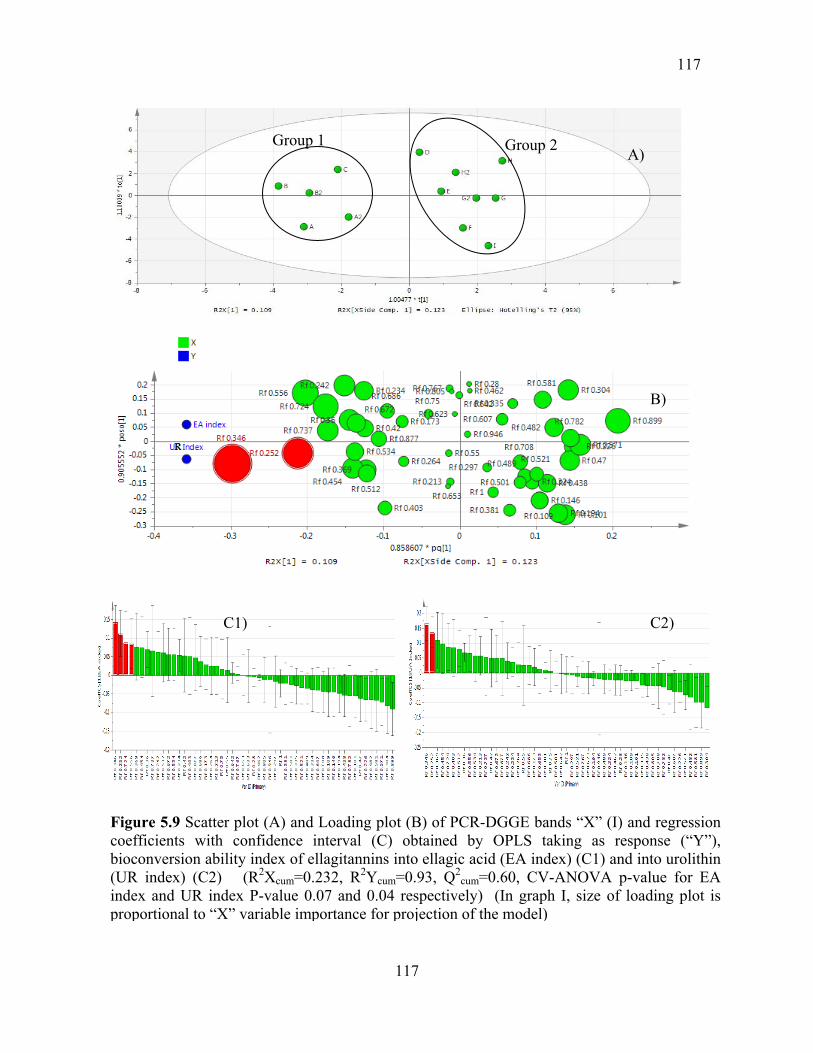
117
117
Figure 5.9 Scatter plot (A) and Loading plot (B) of PCR-DGGE bands “X” (I) and regressioncoefficients with confidence interval (C) obtained by OPLS taking as response (“Y”),bioconversion ability index of ellagitannins into ellagic acid (EA index) (C1) and into urolithin(UR index) (C2) (R2Xcum=0.232, R2Ycum=0.93, Q2
cum=0.60, CV-ANOVA p-value for EAindex and UR index P-value 0.07 and 0.04 respectively) (In graph I, size of loading plot isproportional to “X” variable importance for projection of the model)
Group 1 Group 2 A)
B)
C2) C1)

118
118
5.3 IDENTIFICATION OF FECAL BACTERIA INVOLVED IN UROLITHIN
METABOLISM
The results of the different statistical analyses performed are summarized in Table 5.3,
taking into account the urinary excretion status of individuals and the ability of their stools
to produce urolithin. These analyses have highlighted different bands that are correlated to
the observed responses.
Table 5.3 Recapitulation of retardation factors (Rf) of the bands found as discriminative in the different trials
PLS-DA (urine spot/ 26 individuals) PLS
(urine spot/ 26 individuals)
OPLS (Fecal stools)
Group N Group UA Group UB UB Ea index UA index
+ - + - + - + - + - + -
Rf 0.1940.6420.213
Rf 0.6530.5010.946
Rf 0.501 0.335 0.252 0.556
Rf 0.482 0.438 0.173
Rf 0.1730.4380.672
Rf 0.2520.5010.335
Rf 0.47 0.5010.226
Rf 0.4540.642
Rf 0.3460.2520.724
Rf 0.899 0.304 0.571
Rf 0.346 0.252 0.369
Rf 0.304 0.899 0.581
A band (Rf 0.252) appears to be relevant both in in-vivo and in vitro trials. Another band Rf
0.501 is repeated in more than one test. Nonetheless, all the relevant bands were excised
and sequenced to annotate their identity after querying the BLAST database for sequence
similarities matching. Some bands could not be identified because of the lack of purity of
the excised material. Nonetheless, most of them were identified. Results of the database
query are presented in Table 5.4 with respective scores.

119
119
Table 5.4 Results of the sequence similarities of the excised bacterial bands from different DGGE gels
Accession Annotation Rf Max Score
Total score
Query coverage E-value Identity
NR_043317.1 Parabacteroides goldsteiinii 0,173 313 313 100% 9,00E-86 99% DMS 17855 Bacteroides dorei 0,252 316 316 100% 7e-87 100% ATCC 29863 DSM 6740
Flavonifractor plautii / Clostridium orbiscindes 0,335 279 279 95% 9e-76 95%
ATCC29799 Bacteroides capillosus 0,335 279 279 95% 9e-76 95%
NR_025421 Limnobacter thiooxidans CS-K2 0,369 209 209 97% 9e-55 94%
ATCCA BAA835 Arkkemansia muciniphila 0,454 322 322 91% 2e-88 99% DSM9787 Pseudobutyrivibrio ruminis 0,470 220 220 100% 3,00E-58 100%
ATCC 27768 Faecalibacterium prausnitzii 0,501 313 313 100% 8e-86 100%
YIT 11860 Barnesiella intestinihominis 0,556 307 307 99% 5e-84 95%
The Bands Rf 0.252 and Rf 0.501 which appeared as the most relevant ones correspond
respectively to Bacteroides dorei and Faecalibacterium prausnitzii with 100 % similarity
of the amplicons of the V3 region of 16S rDNA. Both bacterial species seem highly
correlated with in-vivo urinary excretion of urolithin and in-vitro degradation of
ellagitannins from blackberry into ellagic acid (EA) and urolithins.
The genus Bacteroides dorei are commensal bacteria quite abundant in human microbiota,
and they seem to be linked to healthy bowels as they benefit the host by excluding potential
pathogens from colonizing the gut. They are bile-resistant [224] and consequently they
could possibly use substrate of host origin or dietary origin but absorbed by host and
redirected to gut by enteropathic recirculation system, as in the case of urolithin A
glucuronide (UAG) which could be converted by this microorganism in UB.
Faecalibacterium prausnitzii (Rf 0,501) is one of the most abundant commensal bacteria in
the healthy human large intestine as its concentration is reduced in certain forms of
inflammatory bowel disease [225]. Additionally, it has been shown recently to be involved
in the degradation of pectin and uronic acids, an ability previously thought to be confined to
Bacteroides spp among human colonic anaerobes [226]. The function of F. prausnitzii in
intestinal health could explain its relation to the higher ability for metabolizing ETs. It does

120
120
not mean necessarily that this micro-organism is directly involved in the metabolism, but it
remains a potential candidate as it appears to be relatively versatile in the use of dietary and
host origin substrate [226].
Other species highlighted are the Flavonifractor plautii/clostridium orbiscindes and
Bacteroides capillosus (Rf 0,335) all three identified with the same 95% similarity of
amplicons. Flavonifractor plautii synonym clostridium orbiscindes has been shown to
degrade most flavonoids [227] by cleaving the flavonoid C-ring. Nonetheless, it could not
utilize genestein or daidzein as substrates. Bacteroides Capillosus is a member of the
division Firmicutes but no information on their substrate is available. Unfortunately very
little is known on gut bacteria and this is the same for the bacteria Parabacteroides
goldsteiin (Rf 0.173), Barnesiella intestinihominis (Rf 0,556) Pseudobutyrivibrio ruminis
(Rf 0,470) and Limnobacter thiooxidans (Rf 0,369) that apparently play a role in
ellagitannins bioconversion to urolithin as highlighted by our analysis.
On the other hand, Akkremansia muciniphila (Rf 0,454) was correlated with lower
production of UB derivatives. Akkremansia M., is a strictly anaerobic mucin-degrading
bacterium. Resides in the mucus layer and comprises about 3% to 5% of the ileum and
colon microflora. A. muciniphila has showed normalize appetite and metabolism, and also
improve insulin resistance and fasting blood-glucose [228, 229]
5.4 EFFECTS OF ETS INGESTION ON MICROFLORA PROFILE
To explore the effect of blackberry ETs on the activity of intestinal microbiota to degraded
ETs, a short test was performed. Volunteer G, who belongs to group 2 characterized by a
low EA and Urolithin index was chosen to evaluate whether consumption of blackberry
juice could enhance bioconversion ability and observe if this could be reflected on the
PCR-DGGE fingerprint of stools. Fecal stools donated by individual G at 48h and 96h after
ingesting a single shot 250-ml of BBJ were used as starter in the incubation of EA or BBJ
in anaerobic conditions. Urolithin index (% conversion of EA or ETs into urolithins) was
assessed after 120 h of incubation. Results of percentage bioconversion are shown on
Figure 5.10, where it can be observed that stools collected at 96 hours after BBJ

121
121
consumption is much more active (urolithin index=8,4%) than the stools collected after 48
hours (urolithin index =1,4%), and much more than previous experiments (urolithin index
0,5%), in which the stools were collected after 7 days of washout period and just before
juice ingestion. Bioconversion of EA to urolithins was also considerably enhanced reaching
up to 50% using stools collected after 96 hours after juice ingestion. It is important to
highlight that in controls cultures inoculated with these stools it was not found urolithins
Figure 5.10 also reports the PCR-DGGE fingerprints of the different stools. Visual
examination of bands previously identified as discriminative, lead to the observation of
increasing intensity and size in some bands, specifically for band Rf 0.252, Rf 0.470 and Rf
501 indicating a relatively higher concentration of amplicons corresponding to these
microorganisms. They are Bacteroides dorei (Rf 0.252), Faecalibacterium prausnitzii (Rf
0.501) and Pseudobutyrivibrio ruminis (Rf 0,470).
The PCR-DGGE fingerprints of stools, collected at different times after juice ingestion of
three more individuals (individual F, I and C) are presented on Figure 5.11. From this
figure, it is possible to observe changes in the intestinal microbial profile and especially and
according to individual, for band Rf 0.173 (individual F and I for 72 h stool), for band Rf
0.252 (Individual F and C), band Rf 0,335 (individual I), band Rf 0,470 (Individual I and
C), band Rf 0,501 (Individual C) and finally band Rf 0,556 (individual F and C). The
activation of some of the bands highlighted previously is remarkable and confirms previous
results despite the large variability between individual, which could be also caused by the
small differences in the diet followed by the participants. For example proportion of
Bacteroides dorei (Rf 0.252) seems to be enhanced for individual F and C, but not for
individual I. Individual I belongs to the “No urolithin excreters” group. Probably because of
the low proportion of this bacteria in the gut of individual C., the ingestion of blackberry
juice not …… be activated sufficiently after On the other hand, it appears that
Flavonifractor plautii/clostridium orbiscindes or Bacteroides capillosus (Rf 0,335)
increases considerably instead, proving that microbiota adapt to substrate in different ways.
Similar conclusions can be drawn with Pseudobutyrivibrio ruminis (Rf 0,470) and
Barnesiella intestinihominis (Rf 0,556).
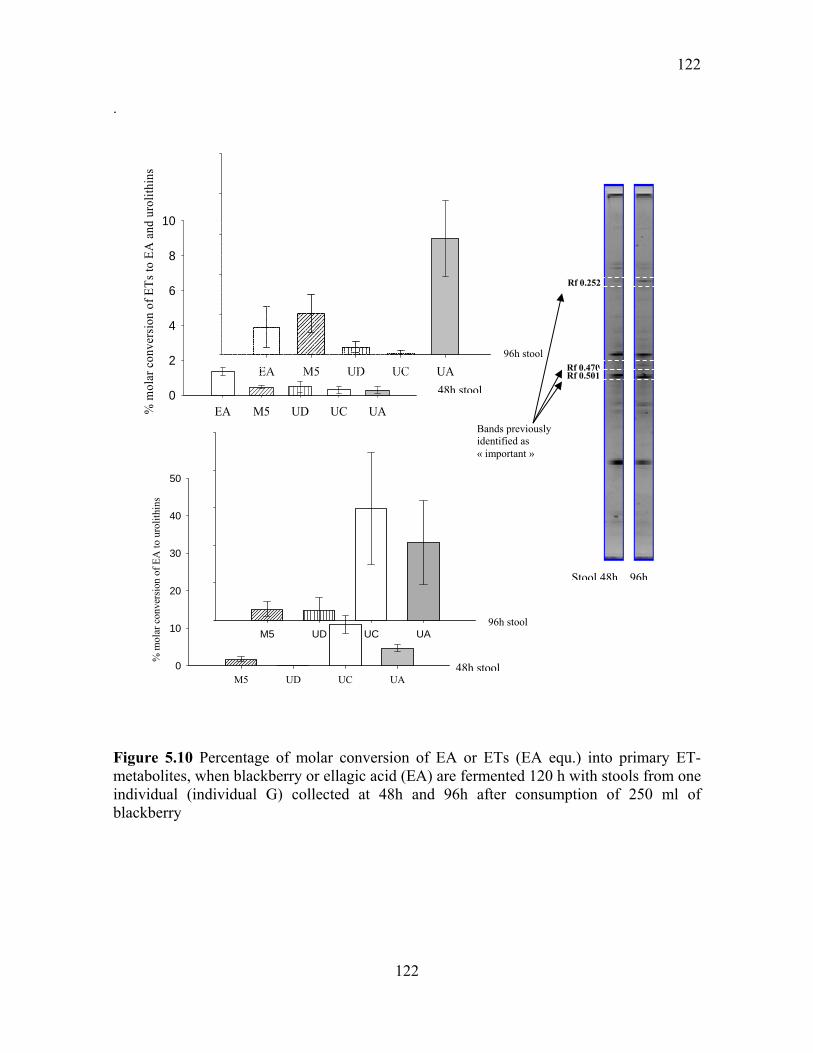
122
122
M5 UD UC UA
% m
olar
con
vers
ion
of E
A to
uro
lithi
ns
M5 UD UC UA0
10
20
30
40
50
.
Figure 5.10 Percentage of molar conversion of EA or ETs (EA equ.) into primary ET-metabolites, when blackberry or ellagic acid (EA) are fermented 120 h with stools from one individual (individual G) collected at 48h and 96h after consumption of 250 ml of blackberry
EA M5 UD UC UA
EA M5 UD UC UA% m
olar
con
vers
ion
of E
Ts to
EA
and
uro
lithi
ns
0
2
4
6
8
10
48h stool
96h stool
48h stool
96h stool
Stool 48h 96h
Bands previously identified as « important »
Rf 0.470
Rf 0.252
Rf 0.501

123
123
Individual F Individual I Individual C
0h 120h 48h 72 h 96 h 0h 96 h
Figure 5.11 DGGE gel of PCR products of variable V3 region from 16S rDNA offecal samples from 3 individuals (I , F and C) that donated fecal stool samples at 0,48, 96 or 120 hours after ingesting one shot of 250-ml of BBJ.
RF 0.252
RF 0.173
RF 0.335
RF 0.501
RF 0.556
RF 0.470

124
124
6 CONCLUSIONS
According to these results, it was corroborated that the most important metabolite released
from degradation of blackberry ellagitannins are UA and UB glucuronide derivatives.
Nonetheless, a wide inter individual variability in the excretion of urolithins was observed
while intra-variability along time was less pronounced. This work allows classifying for the
first time volunteers into 3 classes. The first group comprises individuals that release
urolithins at low concentrations, and then unlikely possibilities to obtaining any systemic
health benefits from them. The second group corresponds to urolithins excreters that can
be clustered in two subgroups: predominantly UA derivatives excreters and predominantly
UB derivatives excreters. This status was found to be constant over time.
In vitro models of EA degradation by intestinal microflora under anaerobic conditions
clearly showed the presence of ETs metabolites from the family dibenzopyranones, such as
UA, three isomers of UC, two isomers of UD and UM5 confirmed the microbial origin of
UM5, UD, UC and UA. This in vitro model of EA degradation is in accordance with the
metabolic pathway that proposes the opening of lactone ring and subsequent
dehydroxylation of UM5 to UD, UC and then to UA. However from clinical and in vitro
models of bioconversion of ellagitannins from BBJ, the metabolic route appears to be
different since intermediate metabolites such as UM5, UD, UC were hardly found.
Although EA was easily released from blackberry ellagitannins, it was not clear how this
EA released from the juice is converted into UA and UB.
From in vitro test urolithin B, UB was not found even using stools from predominant UB
excreters. This leads to propose that UB could be the product of an interaction between gut
microbiota and host. UA derivatives could be re-circulated in the bile facilitating the
dehydroxylation of UA derivative to UB by enzymes or other inherent host factors that
could play an important role in the UB production. However it is also possible that bacteria
involved in UB production requires stricter conditions regarding total oxygen absence,
redox potential, among others. Thus, probably under the conditions set up in the in vitro
trials those bacteria were not able to grow. It can be state that UB require more complex
conditions than UA, as UA can be released by most of urolithins excreters, and also from in
125
125
vitro test, conversely to UB which was found only from clinical test. Interactions between
host excretory system and composition of gut microbiota were discussed as possible cause
of presence of UB. Hepatic recirculation and additional deconjugation of UAG into UA and
the further hydroxylation by cytochrome CYP450 could explain the predominant excretion
of UB in some volunteers. Finally, thanks to molecular fingerprinting methods, such as
PCR-DGGE, the screening of the gut microbiota ecology was carried out and by further
multivariate statistical analysis, it was possible to observe a link between microbiota
composition profile and ability to excrete urolithins. A group of microorganisms was
correlated with the different cluster of urolithins excreters. Unfortunately, very little is
known on gut bacteria, but most bacteria selected are linked to a healthy bowels confirming
additional positive impact of ellagitannins in the gastro-intestinal tract.
Nonetheless, more works remain to do, and other research issues are now open. On the
basis of our results, main research perspectives should focus on obtaining an innovative
functional food from tropical highland blackberry. The significant role played by gut
microbiota in the ETs’ metabolic fate and the potentially important contributions of ET-
microbial derivatives to health benefits are issues that must be taken into account. The high
variability of gut bacteria ecosystems among humans (which results in different abilities to
produce microbial derivatives) transposes into equally enormous inter-individual variability
of physiological responses to dietary ETs. Therefore, in terms of dietary ETs, we
demonstrated that we are not all equal. Some people can expect quick and effective
systemic health benefits, but others will—eventually—receive only limited health benefits
that would probably be confined to the GI tract. What, therefore, should be the
recommended dietary strategy? How can the functional food industry tackle this challenge
to provide a food that will better benefit all consumers?
At least four strategies can be considered: (1) provide consumers with the
exogenous and appropriate microorganisms they lack, that is, with a new generation of
probiotic bacteria that will establish themselves, at least temporarily, in the large intestine
and convert dietary ETs and EA as they pass through the GI tract; (2) modify gut
microflora ecosystems by promoting endogenous beneficial microorganisms that can
metabolize dietary ETs and EA into urolithins; (3) design a food matrix that more

126
126
efficiently enhances urolithin production by providing microbiota with optimal substrates
for sufficient time; and (4) execute in vitro what some people cannot do efficiently in vivo,
for example, provide food that already contains urolithins.
In all cases, the first step is to confirm if the identified microorganisms, once
isolated, are able to perform in vitro the bioconversion of ellagitannins into urolithin.
Nonetheless, the bacteria we have identified in this work are not recognized as safe out of
the gut where they can be involved in contamination. Consequently, these bacteria cannot
be used as probiotic bacteria in dietary strategies to enhance the release of urolithins from
ETs in the colon.
The second strategy is to promote endogenous gut-microbial ecosystems that more
efficiently convert ETs. It raises the question of possibly transforming low-urolithin
producers into high-urolithin producers by changing dietary habits or including prebiotics
in the diet. As the notion of urolithin-producer status is relatively new, little information is
available on how a human can change status by these means. We need to confirm if long
exposure to ET-rich food could modify gut-microbiota ecology and induce the growth of
urolithin-producing bacteria in human GI tracts. Our preliminary results on this subject tend
to show that blackberry intake change gut ecology and enhance ability of stools to produce
urolithins. Up to now, we don’t know if some classical prebiotics could enhance the growth
of the microorganisms that we have identified. Actually, they are apparently linked to
healthy bowels, which could be eventually related to healthier diet. However, promoting
transitory change of gut ecology could constitute a promising research topic for enhancing
urolithin production, not only by affecting microbiota ecosystems but also by modulating
metabolic pathways.
The third approach is to formulate a food matrix that improves the bioavailability of
urolithins. Nothing is known about the dietary ingredients that would act synergistically
with ETs and enhance urolithin excretion, but a variety of food ingredient could be tested.
The interaction of ETs with other polyphenols, fats, sugars, proteins, should be investigated
to get insights to design process and food products that enhance the formation of urolithins
For example, it appears that pectin, a soluble fiber is substrate to at least two of the micro-

127
127
organisms highlighted, the bacteroides spp and Faecalibacterium prausnitzii. Therefore,
enrichment with pectin of blackberry juice should be tested.
Modulation of intestinal transit time may also be an additional factor that could
influences urolithin production. Transit time commands the period of interaction between
substrate and microflora. Actually, the influence of food matrix and ET structure on
urolithin excretion deserves more attention from researchers as better understanding of the
mechanisms involved would be immediately useful for the food industry.
The fourth research approach concerns the in vitro production of urolithins, which
could then be directly incorporated into food. This subject raises other issues such as the
innocuity, pharmacokinetics, and stability of urolithins within the food matrix.
Additionally, this strategy is more adapted to the development of dietary supplements and
even drugs.
This description of research perspectives to better exploit dietary ETs highlights the
main gaps to be addressed in the future. Indeed, research on ellagitannins is unbalanced,
with emphasis being given more to the biological activities of ETs and their metabolites
than to their bioavailability and or to the possibilities of modulating it in the design of
relevant dietary strategies. Such emphasis has even been counterproductive to the better
understanding of the potential health benefits of ETs in clinical studies.
We expect that results achieved in this project will contribute to the better understanding of
ellagitannins metabolism and provide insights for future projects that must integrate diverse
fields of the science, such as nutrition and biochemistry, microbiology, genetics; and, the
food industry that ultimately could bring to consumers health prevention benefits associated
to tropical highland blackberry juice and other ellagitannins ‘rich source.

128
128
7 BIBLIOGRAPHY
1. Tiihonen, K., A.C. Ouwehand, and N. Rautonen, Review. Human intestinal microbiota and healthy ageing. Ageing Research Reviews 2010. 9: p. 9.
2. Turroni, F., et al., Human gut microbiota and bifidobacteria: from composition to functionality. Antonie van Leeuwenhoek, 2008. 94: p. 35‐50.
3. Okuda, T., et al., Ellagitannins renewed the concept of Tannins, in Chemistry and Biology of Ellagitannins, S. Quideau, Editor. 2009, World Scientific Publishing Company: Bordeaux. p. 395.
4. FAO/WHO, Fruit and vegetables for health in Report of a Joint FAO/WHO Workshop. 2004, FAO: Kobe, Japan.
5. Tanaka, T. and S. Sugie, Inhibition of Colon Carcinogenesis by Dietary Non‐Nutritive Compounds. Journal of Toxicologic Pathology, 2007. 20(4): p. 215‐235.
6. WHO, Fruit and Vegetable Promotion Initiative ‐ report of the meeting. 2003: Geneva, Switzerland.
7. Bakkalbai, E., Ö. Mente, and N. Artik, Food Ellagitannins‐Occurrence, Effects of Processing and Storage. Critical Review Food Science and Nutrition, 2009. 49: p. 283‐298.
8. Gasperotti, M., et al., Profiling and Accurate Quantification of Rubus Ellagitannins and Ellagic Acid Conjugates Using Direct UPLC‐Q‐TOF HDMS and HPLC‐DAD Analysis. Journal of Agricultural and Food Chemistry, 2010. 58: p. 14.
9. Espín, J.C., et al., Iberian Pig as a Model To Clarify Obscure Points in the Bioavailability and Metabolism of Ellagitannins in Humans. Journal of Agricultural and Food Chemistry, 2007. 55(25): p. 10476‐10485.
10. Hager, T., et al., Ellagitannin Composition of Blackberry As Determined by HPLC‐ESI‐MS and MALDI‐TOF‐MS. Journal of Agricultural and Food Chemistry, 2008. 56: p. 8.
11. Lee, J.‐H., J. Johnson, and S. Talcott, Identification of Ellagic Acid Conjugates and Other Polyphenolics in Muscadine Grapes by HPLC‐ESI‐MS. Journal of Agricultural and Food Chemistry, 2005. 53: p. 7.
12. Zafrilla, P., F. Ferreres, and F.A. Tomas‐Barberan, Effect of processing and storage on the antioxidant ellagic acid derivatives and flavonoids of red raspberry (Rubus idaeus) jams. . J. Agric. Food Chem, 2001. 49: p. 6.
13. Gancel, A.‐L., et al., Impact of industrial processing and storage on major polyphenols and the antioxidant capacity of tropical highland blackberry (Rubus adenotrichus). Food Research international, 2010.
14. Bialonska, D., et al., Urolithins, Intestinal Microbial Metabolites of Pomegranate Ellagitannins, Exhibit Potent Antioxidant Activity in a Cell‐Based Assay. Journal of Agricultural and Food Chemistry, 2009. 57(21): p. 10181‐10186.
129
129
15. Kemperman RA, et al., Novel approaches for analysing gut microbes and dietary polyphenols: challenges and opportunities. Microbiology., 2010. Nov(156 pt 11): p. 3224‐3232.
16. van Duynhoven J, et al., Metabolic fate of polyphenols in the human superorganism. Procedure National Academic Science U S A, 2011. 108(108 supp).
17. Cerda, B., et al., Identification of urolithin A as a metabolite produced by human colon microflora from ellagic acid and related compounds. Journal of Agricultural and Food Chemistry, 2005. 53(14): p. 5571‐5576.
18. Garcia M., M.C., ed. Manejo cosecha y poscosecha de Mora, lulo y tomate de árbol., ed. Produmedios. 2001, CORPOICA: Bogotá. 107.
19. Landete, J., Ellagitannins, ellagic acid and their derived metabolites: A review about source, metabolism, functions and health. Food Research International 2011. 44: p. 10.
20. Isaza, J.H., Taninos o polifenoles Vegetales. Scientia Et technica, 2007. XIII(033): p. 6.
21. Barbehenn, R.V., et al., Ellagitannins have greater oxidative activities than gallotannins and condensed tannins at high pH: potential impact on caterpillars. . J. Chem. Ecol., 2006. 32: p. 14.
22. Okuda, T., T. Yoshida, and T. Hatano, Correlation of oxidative transformations of hydrolyzable tannins and plant evolution. Phytochemistry, 2000. 55(6): p. 513‐529.
23. Heber, D., Multitargeted therapy of cancer by ellagitannins. Cancer Letters, 2008. 269(2): p. 262‐268.
24. Borges, G., et al., Identification of Flavonoid and Phenolic Antioxidants in Black Currants, Blueberries, Raspberries, Red Currants, and Cranberries. Journal of Agricultural and Food Chemistry, 2010. 58: p. 8.
25. Mullen William , et al., Analysis of ellagitannins and conjugates of ellagic acid and quercetin in raspberry fruits by LC–MSn. Phyrochemistry, 2003. 64: p. 7.
26. Torronen, Sources and health effects of dietary ellagitannins, in Chemistry and Biology of ellagitannins: An underestimated class of bioactive plant polyphenols, S. Quideau, Editor. 2009, World Scientific Publishing Co: Bordeaux (France). p. 298‐319.
27. Hourdes, M., D. Lefeuvre, and S. Quideau, C‐Glycosidic ellagitannins and their influence on wine chemistry, in Chemistry and Biology of ellagitannins: An underestimated class of bioactive plant polyphenols, S. Quideau, Editor. 2009, World Scientific Publishing Co: Bordeaux (France). p. 320‐365.
28. Moilanen, J. and J.P. Salminen, Ecologically neglected tannins and their biologically relevant activity: chemical structures of plant ellagitannins reveal their in vitro oxidative activity at high pH. Chemoecology, 2008. 18: p. 73_83.
29. Mullen, W., et al., Effect of Freezing and Storage on the Phenolics, Ellagitannins, Flavonoids, and Antioxidant Capacity of Red Raspberries. Journal of Agricultural and Food Chemistry, 2002. 50: p. 5197‐5201.
30. Venketeshwer, R. and D. Snyder, Raspberries and Human Health: A Review. Journal of Agricultural and Food Chemistry, 2010. 58: p. 12.
130
130
31. Clifford, M. and A. Scalbert, Review Ellagitannins – nature, occurrence and dietary burden. Journal of the Food Science and Agricultural, 2000. 80: p. 7.
32. Mertz, C., et al., Analysis of Phenolic Compounds in Two Blackberry Species (Rubus glaucus and Rubus adenotrichus) byHigh‐Performance Liquid Chromatography with Diode Array Detection and Electrospray Ion Trap Mass Spectrometry. Journal of Agricultural and Food Chemistry, 2007. 55: p. 8616‐8624.
33. Robledo, A., et al., Ellagic acid production by Aspergillus niger in solid state fermentation of pomegranate residues. J Ind Microbiol Biotechnol, 2008(35): p. 507–513.
34. Quideau, S., ed. Chemistry and Biology of Ellagitannins: An Underestimated Class of Bioactive Plant Polyphenols. ed. W. Scientific. 2009. 374.
35. Siriwoharn, T. and R.E. Wrolstad, Polyphenolic composition of marion and evergreen blackberries. Journal of Food Science, 2004. 69(4): p. C233‐C240.
36. Acosta, Ó., et al., Phenolic content and antioxidant capacity of tropical highland blackberry (Rubus adenotrichus Schltdl.) during three edible maturity stages. Food Chemistry, 2010. 119: p. 1497 ‐ 1501.
37. de Ancos, B., E.M. Gonzalez, and M.P. Cano, Ellagic Acid, Vitamin C, and Total Phenolic Contents and Radical Scavenging Capacity Affected by Freezing and Frozen Storage in Raspberry Fruit. Journal of Agricultural and Food Chemistry, 2000. 48(10): p. 4565‐4570.
38. Hakkinen, S., et al., Ellagic acid content in berries: Influence of domestic processing and storage. Eur Food Res Tecnology, 2000. 212: p. 5.
39. Seeram, N.P., et al., Blackberry, black raspberry, blueberry, cranberry, red raspberry, and strawberry extracts inhibit growth and stimulate apoptosis of human cancer cells in vitro. Journal of Agricultural and Food Chemistry, 2006. 54(25): p. 9329‐9339.
40. D’Archivio, M., et al., Bioavailability of the Polyphenols: Status and Controversies. International Journal of Molecular Sciences, 2010. 11.
41. D’Archivio, M., et al., Review: Bioavailability of the Polyphenols: Status and Controversies. International Journal of Molecular Sciences, 2010. 11: p. 21.
42. Delzenne, N., A. Neyrinck, and P. D Cani, Modulation of the gut microbiota by nutrients with prebiotic properties: consequences for host health in the context of obesity and metabolic syndrome. Microbial Cell Factories 2011. 10(Suppl).
43. Cerda, B., et al., The potent in vitro antioxidant ellagitannins from pomegranate juice are metabolised into bioavailable but poor antioxidant hydroxy‐6H‐dibenzopyran‐6‐ one derivatives by the colonic microflora of healthy humans. European Journal Nutrition, 2004(43): p. 205 ‐220.
44. Cerda, B., F.A. Tomas‐Barberan, and J.C. Espin, Metabolism of antioxidant and chemopreventive ellagitannins from strawberries, raspberries, walnuts, and oak‐aged wine in humans: Identification of biomarkers and individual variability. Journal of Agricultural and Food Chemistry, 2005. 53(2): p. 227‐235.
45. Larrosa, M., et al., Urolithins, Ellagic Acid‐Derived Metabolites Produced by Human Colonic Microflora, Exhibit Estrogenic and Antiestrogenic Activities. Journal of Agricultural and Food Chemistry, 2006. 54(5): p. 1611‐1620.

131
131
46. Mertens‐Talcott, S.U., et al., Absorption, metabolism, and antioxidant effects of pomegranate (Punica granatum L.) polyphenols after ingestion of a standardized extract in healthy human volunteers. Journal of Agricultural and Food Chemistry, 2006. 54(23): p. 8956‐8961.
47. Seeram, N.P., et al., Pomegranate Juice Ellagitannin Metabolites Are Present in Human Plasma and Some Persist in Urine for Up to 48 Hours. The Journal of Nutrition. Nutrient Physiology, Metabolism, and Nutrient‐Nutrient Interactions, 2006. 136: p. 2481:2485.
48. Seeram, N.P., R. Lee, and D. Heber, Bioavailability of ellagic acid in human plasma after consumption of ellagitannins from pomegranate (Punica granatum L.) juice. Clinica Chimica Acta, 2004. 348(1‐2): p. 63‐68.
49. Cerda, B., et al., Evaluation of the bioavailability and metabolism in the rat of punicalagin, an antioxidant polyphenol from pomegranate juice. European Journal of Nutrition, 2003(42): p. 18 ‐ 28.
50. Gonzalez‐Sarrias, A., et al., Occurrence of urolithins, gut microbiota ellagic acid metabolites and proliferation markers expression response in the human prostate gland upon consumption of walnuts and pomegranate juice. Molecular Nutrition & Food Research, 2010. 54(3): p. 311‐322.
51. Seeram, N.P., et al., Pharmacokinetics and ex‐vivo bioactivties of pomegranate polyphenols in humans. Faseb Journal, 2006. 20(5): p. A1019‐A1019.
52. González, B.R., et al., Bioavailability of Anthocyanins and Ellagitannins Following Consumption of Raspberries by Healthy Humans and Subjects with an Ileostomy. Journal of Agricultural and Food Chemistry, 2010. 58(7): p. 3933‐3939.
53. Larrosa, M., F.A. Tomás‐Barberán, and J.C. Espín, The dietary hydrolysable tannin punicalagin releases ellagic acid that induces apoptosis in human colon adenocarcinoma Caco‐2 cells by using the mitochondrial pathway. The Journal of Nutritional Biochemistry, 2006. 17(9): p. 611‐625.
54. Sharma, M., et al., Effects of Fruit Ellagitannin Extracts, Ellagic Acid, and Their Colonic Metabolite, Urolithin A, on Wnt Signaling. Journal of Agricultural and Food Chemistry, 2010. 58(7): p. 3965‐3969.
55. Whitley, A.C., et al., Intestinal epithelial cell accumulation of the cancer preventive polyphenol ellagic acid‐‐extensive binding to protein and DNA. Biochemical Pharmacology, 2003. 66(6): p. 907‐915.
56. Bialonska, D., et al., The influence of pomegranate by‐product and punicalagins on selected groups of human intestinal microbiota. International Journal of Food Microbiology, 2010. 140(2‐3): p. 175‐182.
57. Larrosa, M., et al., Review. Ellagitannins, ellagic acid and vascular health. Molecular Aspects of Medicine 2010. 31: p. 513‐539.
58. González‐Barrio, R.o., et al., UV and MS Identification of Urolithins and Nasutins, the Bioavailable Metabolites of Ellagitannins and Ellagic Acid in Different Mammals. Journal of Agricultural and Food Chemistry, 2011. 59(4): p. 1152‐1162.
59. Del Rio, D., et al., Polyphenols and health: what compounds are involved? Nutrition, metabolism, and cardiovascular diseases : NMCD, 2010. 20(1): p. 1‐6.

132
132
60. González‐Barrio, R., et al., Bioavailability of Anthocyanins and Ellagitannins Following Consumption of Raspberries by Healthy Humans and Subjects with an Ileostomy. Journal of Agricultural and Food Chemistry, 2010. 58(7): p. 3933‐3939.
61. Gonzalez‐Barrio, R., E. Christine, and A. Crozier, Colonic Catabolism of Ellagitannins, Ellagic acid and Raspberry Anthocyanins: In Vivo and In Vitro Studies. Drug Metabolism and Disposition, 2011.
62. Leser, T.D. and L. Mølbak, Better living through microbial action: the benefits of the mammalian gastrointestinal microbiota on the host. Environmental Microbiology, 2009. 11(9): p. 2194‐2205.
63. Aura, A.M., In vitro digestion models for dietary phenolic compounds. VTT Publications, 2005. 575.
64. Selma, M.V., J.C. Espin, and F.A. Tomas‐Barberan, Interaction between Phenolics and Gut Microbiota: Role in Human Health. Journal of Agricultural and Food Chemistry, 2009. 57(15): p. 6485‐6501.
65. Moilanen, J. and J.‐P. Salminen, Ecologically neglected tannins and their biologically relevant activity: chemical structures of plant ellagitannins reveal their in vitro oxidative activity at high pH. Chemoecology 2008. 18: p. 10.
66. Gil, M.I., et al., Antioxidant activity of pomegranate juice and its relationship with phenolic composition and processing. Journal of Agricultural and Food Chemistry, 2000. 48(10): p. 4581‐4589.
67. Zafrilla, P., F. Ferreres, and F.A. Tomás‐Barberán, Effect of Processing and Storage on the Antioxidant Ellagic Acid Derivatives and Flavonoids of Red Raspberry (Rubus idaeus) Jams. Journal of Agricultural and Food Chemistry, 2001. 49(8): p. 3651‐3655.
68. Seeram, N.P., et al., In vitro antiproliferative, apoptotic and antioxidant activities of punicalagin, ellagic acid and a total pomegranate tannin extract are enhanced in combination with other polyphenols as found in pomegranate juice. Journal of Nutritional Biochemistry, 2005. 16(6): p. 360‐367.
69. Heber, D., et al., Safety and antioxidant activity of a pomegranate ellagitannin‐enriched polyphenol dietary supplement in overweight individuals with increased waist size. Journal of Agricultural and Food Chemistry, 2007. 55(24): p. 10050‐10054.
70. Rettig, M.B., et al., Pomegranate extract inhibits androgen‐independent prostate cancer growth through a nuclear factor‐kappa B‐dependent mechanism. Molecular Cancer Therapeutics, 2008. 7(9): p. 2662‐2671.
71. Adams, L.S., et al., Pomegranate juice, total pomegranate ellagitannins, and punicalagin suppress inflammatory cell signaling in colon cancer cells. Journal of Agricultural and Food Chemistry, 2006. 54(3): p. 980‐985.
72. Adams, L., et al., Pomegranate Ellagitannin–Derived Compounds Exhibit Antiproliferative and Antiaromatase Activity in Breast Cancer Cells In vitro. Cancer Prev Res, 2010. 1(3): p. 108 ‐ 113.
73. Larrosa, M., et al., Ellagitannins, ellagic acid and vascular health. Molecular Aspects of Medicine, 2010. 31(6): p. 513‐539.

133
133
74. Barch, D., et al., Structure‐function relationships of the dietary anticarcinogen ellagic acid. Carcinogenesis, 1996. 17(2): p. 265‐269.
75. Gonzalez‐Sarrias, A., et al., Gene expression, cell cycle arrest and MAPK signalling regulation in Caco‐2 cells exposed to ellagic acid and its metabolites, urolithins. Molecular Nutrition & Food Research, 2009. 53(6): p. 686‐698.
76. Chang, R.L., et al., Effect of ellagic acid and hydroxylated flavonoids on the tumorigenidty of benzo[a]pyrene and (±)‐7b,8a‐dihydroxy‐9a,10a epoxy‐ 7,8,9,10‐tetrahydrobenzo[a]pyrene on mouse skin and in the newborn mouse. Carcinogenesis, 1985. 6(8): p. 6.
77. Corbett, S., et al., Evaluation of the Anti‐inflammatory Effects of Ellagic Acid. Journal of PeriAnesthesia Nursing, 2010. 25(4): p. 6.
78. Devipriya, N., S.A. Ram, and M.V. P., Dose‐response effect of ellagic acid on circulatory antioxidants and lipids during alcohol‐induced toxicity in experimental rats. Fundamental & Clinical Pharmacology, 2007. 21: p. 9.
79. Narayanana, B.A., et al., p53/p21(WAF1/CIP1) expression and its possible role in G1 arrest and apoptosis in ellagic acid treated cancer cells. Cancer letters, 1998. 136: p. 5.
80. Fjaeraa, C. and E. Nånberg, Effect of ellagic acid on proliferation, cell adhesion and apoptosis in SH‐SY5Y human neuroblastoma cells. Biomedicine & Pharmacotherapy, 2009. 63(4): p. 254‐261.
81. Hseu, Y.‐C., et al., Ellagic acid protects human keratinocyte (HaCaT) cells against UVA‐induced oxidative stress and apoptosis through the upregulation of the HO‐1 and Nrf‐2 antioxidant genes. Food and Chemical Toxicology, 2012. 50(5): p. 1245‐1255.
82. Loarca‐Piña, G., et al., Inhibitory effects of ellagic acid on the direct‐acting mutagenicity of aflatoxin B1 in the Salmonella microsuspension assay. Mutation Research/Fundamental and Molecular Mechanisms of Mutagenesis, 1998. 398(1‐2): p. 183‐187.
83. Losso, J., et al., In vitro anti‐proliferative activities of ellagic acid. Journal of Nutritional Biochemistry, 2004. 15: p. 6.
84. Mari Kannan, M. and S. Darlin Quine, Pharmacodynamics of ellagic acid on cardiac troponin‐T, lyosomal enzymes and membrane bound ATPases: Mechanistic clues from biochemical, cytokine and in vitro studies. Chemico‐Biological Interactions, 2011. 193(2): p. 154‐161.
85. Mari Kannan, M. and S. Darlin Quine, Ellagic acid protects mitochondria from β‐adrenergic agonist induced myocardial damage in rats; evidence from in vivo, in vitro and ultra structural study. Food Research international, 2012. 45(1): p. 1‐8.
86. Mertens‐Talcott SU, Talcott ST, and P. SS., Low concentrations of quercetin and ellagic acid synergistically influence proliferation, cytotoxicity and apoptosis in MOLT‐4 human leukemia cells. Journal of Nutrition, 2003. 133(8): p. 2669‐2674.
87. Priyadarsin, K.I., et al., Free Radical Studies of Ellagic Acid, a Natural Phenolic Antioxidant. Journal of Agricultural and Food Chemistry, 2002. 50: p. 2200‐2205.
134
134
88. Bialonska, D., et al., The Effect of Pomegranate (Punica granatum L.) Byproducts and Ellagitannins on the Growth of Human Gut Bacteria. Journal of Agricultural and Food Chemistry, 2009. 57: p. 8344‐8348.
89. Zhang, J., et al., Density functional study on the bioactivity of ellagic acid, its derivatives and metabolite. Computational and Theoretical Chemistry, 2011. 963(1): p. 148‐153.
90. Aviram, M., et al., Pomegranate juice consumption for 3 years by patients with carotid artery stenosis reduces common carotid intima‐media thickness, blood pressure and LDL oxidation. Clin Nutr, 2004. 23(3): p. 423‐433.
91. Rosenblat, M., T. Hayek, and M. Aviram, Anti‐oxidative effects of pomegranate juice (PJ) consumption by diabetic patients on serum and on macrophages. Vol. 187. 2006, Amsterdam (Netherland): Elsevier. 9.
92. Pantuck, A.J., et al., Phase II study of pomegranate juice for men with rising prostate‐specific antigen following surgery or radiation for prostate cancer. Clinical Cancer Research, 2006. 12(13): p. 4018‐4026.
93. Cerda, B., et al., Pomegranate juice supplementation in chronic obstructive pulmonary disease: a 5‐week randomized, double‐blind, placebo‐controlled trial. European Journal of Clinical Nutrition, 2006. 60(2): p. 245‐253.
94. Sumner, M.D., et al., Effects of Pomegranate Juice Consumption on Myocardial Perfusion in Patients With Coronary Heart Disease. The American Journal of Cardiology, 2005. 96(6): p. 810‐814.
95. Aviram, M. and L. Dornfeld, Pomegranate juice consumption inhibits serum angiotensin converting enzyme activity and reduces systolic blood pressure. Atherosclerosis, 2001. 158(1): p. 195‐198.
96. Tulipani, S., et al., Metabolomics Unveils Urinary Changes in Subjects with Metabolic Syndrome following 12‐Week Nut Consumption. Journal of Proteome Research, 2011.
97. Henning, S.M., et al., Strawberry Consumption Is Associated with Increased Antioxidant Capacity in Serum. Journal of Medicinal Food, 2010. 13(1): p. 116‐122.
98. Sartippour, M.R., et al., Ellagitannin‐rich pomegranate extract inhibits angiogenesis in prostate cancer in vitro and in vivo. International Journal of Oncology, 2008. 32(2): p. 475‐480.
99. Suh, J.R., C; González‐Barrio, R; Cristol, JP; Teissèdre, PL; Crozier, A; Rouanet, JM, Raspberry juice consumption, oxidative stress and reduction of atherosclerosis risk factors in hypercholesterolemic golden Syrian hamsters. Food & function 2011. 2(7): p. 400‐405.
100. Hassimotto, N.M.A. and F.M. Lajolo, Antioxidant status in rats after long‐term intake of anthocyanins and ellagitannins from blackberries. Journal of the Science of Food and Agriculture, 2011. 91(3): p. 523‐531.
101. Rouanet, J.M., et al., Berry juices, teas, antioxidants and the prevention of atherosclerosis in hamsters. Food Chemistry, 2010. 118(2): p. 266‐271.
102. Seguin, C.M., L.S. Wang, and G.D. Stoner, Chemopreventive Effects of Berries and Berry Components in the Rodent Esophagus. Berries and Cancer Prevention, ed. G.D. Stoner and N.P. Seeram. 2011, New York: Springer. 143‐161.

135
135
103. Stoner, G.D., et al., Cancer Prevention with Freeze‐dried Berries and Berry Components. National Institute of Health, 2007. 17(5): p. 7.
104. Hideyuki, I., Metabolites of the ellagitannins geraniin and their antioxidant activities. Planta Med. 2011 Jul;77(11):1110, 2011. 77(11): p. 1110.
105. Kresty, L., et al., Chemoprevention of Esophageal Tumorigenesis by Dietary Administration of Lyophilized Black Raspberries. Cancer research, 2001. 61: p. 7.
106. Sudhandiran, G. and S. Umesalma, Ellagic acid prevents rat colon carcinogenesis induced by 1, 2 dimethyl hydrazine through inhibition of AKT‐phosphoinositide‐3 kinase pathway. European Journal of Pharmacology, 2011. 660(2‐3): p. 249‐258.
107. Larrosa, M., et al., Anti‐inflammatory properties of a pomegranate extract and its metabolite urolithin‐A in a colitis rat model and the effect of colon inflammation on phenolic metabolism. Journal of Nutritional Biochemistry, 2009. 21(8): p. 717‐725.
108. Seeram, N.P., et al., Pomegranate ellagitannin‐derived metabolites inhibit prostate cancer growth and localize to the mouse prostate gland. Journal of Agricultural and Food Chemistry, 2007. 55(19): p. 7732‐7737.
109. Ishimoto, H., et al., In vivo anti‐inflammatory and antioxidant properties of ellagitannin metabolite urolithin A. Bioorganic & Medicinal Chemistry Letters, 2011. 21(19): p. 5901‐5904.
110. Hong, M.Y., N.P. Seeram, and D. Heber, Pomegranate polyphenols down‐regulate expression of androgen‐synthesizing genes in human prostate cancer cells overexpressing the androgen receptor. Journal of Nutritional Biochemistry, 2008. 19(12): p. 848‐855.
111. Ross, H.A., G.J. McDougall, and D. Stewart, Antiproliferative activity is predominantly associated with ellagitannins in raspberry extracts. Phytochemistry, 2007. 68(2): p. 218‐228.
112. Zhang, Y., et al., Isolation and Identification of Strawberry Phenolics with Antioxidant and Human Cancer Cell Antiproliferative Properties. Journal of Agricultural and Food Chemistry, 2008. 56: p. 5.
113. Narayanan, B.A. and G.G. Re, IGF‐II down regulation associated cell cycle arrest in colon cancer cells exposed to phenolic antioxidant ellagic acid. Anticancer Research, 2001. 21(1A): p. 359‐364.
114. Nanberg, E. and C. Fjaeraa, Effect of ellagic acid on proliferation, cell adhesion and apoptosis in SH‐SY5Y human neuroblastoma cells. Biomedicine & Pharmacotherapy, 2009. 63(4): p. 254‐261.
115. Kasimsetty, S.G., et al., Colon Cancer Chemopreventive Activities of Pomegranate Ellagitannins and Urolithins. Journal of Agricultural and Food Chemistry, 2010. 58(4): p. 2180‐2187.
116. Zuninoa, S.J., et al., Growth arrest and induction of apoptosis in high‐risk leukemia cells by strawberry components in vitro. Journal of Functional foods, 2009. I: p. 7.
117. Gonzalez‐Sarrias, A., et al., Dissimilar In Vitro and In Vivo Effects of Ellagic Acid and Its Microbiota‐Derived Metabolites, Urolithins, on the Cytochrome P450 1A1. Journal of Agricultural and Food Chemistry, 2009. 57(12): p. 5623‐5632.

136
136
118. Kasimsetty, S.G., et al., Effects of Pomegranate Chemical Constituents/Intestinal Microbial Metabolites on CYP1B1 in 22Rv1 Prostate Cancer Cells. Journal of Agricultural and Food Chemistry, 2009. 57(22): p. 10636‐10644.
119. Aviram, M., et al., Pomegranate Phenolics from the Peels, Arils, and Flowers Are Antiatherogenic: Studies in Vivo in Atherosclerotic Apolipoprotein E‐Deficient (E0) Mice and in Vitro in Cultured Macrophages and Lipoproteins. Journal of Agricultural and Food Chemistry, 2008. 56(3): p. 1148‐1157.
120. Mattiello, T., et al., Effects of Pomegranate Juice and Extract Polyphenols on Platelet Function. journal of medicinal food, 2009. 12(2): p. 7.
121. Ito, H., A. Iguchi, and T. Hatano, Identification of Urinary and Intestinal Bacterial Metabolites of Ellagitannin Geraniin in Rats. Agricultural and Food Chemistry, 2008. 56: p. 7.
122. Viuda‐Martos, J., Fernández‐López, and J.A. Pérez‐Alvarez, Pomegranate and its Many Functional Components as Related to Human Health: A Review. Comprehensive reviews in food science and food safety, 2010. 10: p. 20.
123. Cerda B., et al., Repeated Oral Administration of High Doses of the Pomegranate Ellagitannin Punicalagin to Rats for 37 Days Is Not Toxic. Journal of Agricultural and Food Chemistry, 2003. 51: p. 8.
124. Azorin‐Ortuno, M., et al., Safety evaluation of an oak‐flavored milk powder containing ellagitannins upon oral administration in the rat. Journal of Agricultural and Food Chemistry, 2008. 56(8): p. 2857‐2865.
125. Laparra, J.M. and Y. Sanz, Review. Interactions of gut microbiota with functional food components and nutraceuticals Pharmacological Research, 2010. 61: p. 219‐225.
126. Zoetendal, E.G., M. Rajilic‐Stojanovic, and W. de Vos, High‐throughput diversity and functionality analysis of the gastrointestinal tract microbiota. GUT, 2008. 57: p. 1605‐1615.
127. Almeida, M., et al., Intestinal Mucosa‐Associated Microflora in Ulcerative Colitis Patients Before and After Restorative Proctocolectomy with an Ileoanal Pouch. Diseases of the Colon & Rectum, 2008. 51(7): p. 1113‐1119.
128. Huijsdens, X.W., et al., Quantification of Bacteria Adherent to Gastrointestinal Mucosa by Real‐Time PCR. American Society for Microbiology, 2002. 40(12): p. 4223 ‐4427.
129. Macfarlane, G. and S. Macfarlane, Models for intestinal fermentation: association between food components, delivery systems, bioavailability and functional interactions in the gut. Current Opinion in Biotechnology 2007. 18: p. 156‐161.
130. Claesson, M.J., et al., Gut microbiota composition correlates with diet and health in the elderly. NATURE, 2012. 488: p. 178‐184.
131. Davis, C.D. and J.A. Milner, Gastrointestinal microflora, food components and colon cancer prevention. Journal of Nutritional Biochemistry, 2009. 20(10): p. 743‐752.
132. Zoetendal, E.G., et al., Mucosa‐Associated Bacteria in the Human Gastrointestinal Tract Are Uniformly Distributed along the Colon and Differ from the Community Recovered from Feces. Applied and environmental microbiology, 2002. 68(7): p. 3401‐3407.

137
137
133. Rajilic‐Stojanovic´, M., H. Smidt, and W. M. de Vos, Minireview. Diversity of the human gastrointestinal tract microbiota revisited. Environmental Microbiology, 2007. 9(9): p. 2125‐2136.
134. Eckburg, P., et al., Diversity of the human intestinal microbial flora. Science, 2005. 308: p. 1635–1638.
135. Arumugam, M., et al., Enterotypes of the human gut microbiome. NATURE, 2011. 473: p. 174‐180.
136. Neish, A.S., Microbes in Gastrointestinal Health and Disease. Gastroenterology, 2009. 136(1): p. 65‐80.
137. Dall'Asta, M., et al., Identification of microbial metabolites derived from in vitro fecal fermentation of different polyphenolic food sources. Nutrition, 2012. 28(2): p. 197‐203.
138. Klampfer L, et al., Inhibition of interferon gamma signaling by the short chain fatty acid butyrate. . Mol Cancer Res, 2003. 1: p. 855‐862.
139. Wong CS, et al., The influence of specific luminal factors on the colonic epithelium: high‐dose butyrate and physical changes suppress early carcinogenesis events in rats. . Dis Colon Rectum, 2005. 48: p. 549‐559.
140. Basson MD, et al., Identification and comparative analysis of human colonocyte short‐chain fatty acid response genes. . J Gastrintest Surg, 2000. 4: p. 501:512.
141. Ebert MN, et al., Expression of glutathione S‐transferases (GSTs) inhuman colon cells and inducibility of GSTMs by butyrate. Carcinogenesis, 2003. 10: p. 1637‐1644.
142. Myzak MC and D. RH., Histone deacetylases as targets for dietary cancer preventive agents: lessons learned with butyrate, diallyl sulfide and sulforaphane. 2006;7:443–52. Curr Drug Targets, 2006. 7: p. 443‐452.
143. Pryde SE, et al., The microbiology of butyrate formation in the human colon. . FEMS Microbiol Lett, 2002. 17: p. 133‐139.
144. Wachtershauser A and S. J., Rationale for the luminal provision of butyrate in intestinal diseases. Eur Journal Nutrition, 2000. 39: p. 164‐171.
145. Zoran DL, et al., Diet and carcinogen alter luminal butyrate concentrations and intracellular pH in isolated rat colonocytes. Nutr Cancer 1997;27:222–30. Nutr Cancer, 1997. 27: p. 222‐230.
146. Sengupta S, Muir JG, and G. PR., Does butyrate protect from colorectal cancer? . J Gastroenterol Hepatol, 2006. 21: p. 209‐218.
147. Ewaschuk JB, et al., Bioproduction of conjugated linoleic acid by probiotic bacteria occurs in vitro and in vivo in mice. Journal of Nutrition, 2006. 136: p. 1483‐1487.
148. Mandir N and G. RA., Conjugated linoleic acids differentially alter polyp number and diameter in the Apc(min+) mouse model of intestinal cancer. . Cell Prolif, 2008. 41: p. 279‐291.
149. Yasui Y, et al., 9trans, 11trans conjugated linoleic acid inhibits the development of azoxymethane‐induced colonic aberrant crypt foci in rats. Nutr Cancer, 2007. 59: p. 82‐91.

138
138
150. Atkinson C, Frankenfeld CL, and L.J. G, Gut bacterial metabolism of the soy isoflavone daidzein: exploring the relevance to human health. Exp Biol Med, 2005. 230: p. 155‐170.
151. Bolca S, et al., Microbial and dietary factors are associated with the equol producer phenotype in healthy postmenopausal women. J Nutr 2007;137:2242–6. J Nutr, 2007. 137: p. 2242‐2246.
152. Decroos, K., et al., Isolation and characterisation of an equol‐producing mixed microbial culture from a human faecal sample and its activity under gastrointestinal conditions. Arch Microbiol, 2005. 183: p. 45‐55.
153. Kinjo J, et al., Interactions of phytoestrogens with estrogen receptors alpha and beta (III). Estrogenic activities of soy isoflavones aglycones and their metabolites isolated from human urine. Biol Pharm Bull, 2004. 27: p. 185‐188.
154. Maubach J, et al., Quantitation of soy‐derived phytoestrogens in human breast tissue and biological fluids by high performance liquid chromatography. J Chromatogr B Analyt Technol Biomed Life Sci, 2003. 784: p. 137‐144.
155. Muthyala RS, et al., Equol, a natural estrogenic metabolite from soy isoflavones: convenient preparation and resolution R‐ and S‐equols and their differing binding and biological activity through estrogen receptors alpha and beta. . Bioorg Med Chem, 2004. 12: p. 1559‐1567.
156. Yuan, J.‐P., J.‐H. Wang, and L. Xin, Review: Metabolism of dietary soy isoflavones to equol by human intestinal microflora – implications for health. Mol. Nutr. Food Res., 2007. 51: p. 16.
157. Bonorden MJ, et al., Consumption of Lactobacillus acidophilus and Bifidobacterium longum do not alter urinary equol excretion and plasma reproductive hormones in premenopausal women. . Eur J Clin Nutr Cancer, 2004. 58: p. 1635‐1642.
158. McMullen MH, et al., Consumption of Lactobacillus acidophilus and Bifidobacterium longum does not alter phytoestrogen metabolism and plasma hormones in men: a pilot study. . J Altern Complement Med, 2006. 12(9): p. 887‐894.
159. Lampe JW, et al., Urinary equol excretion with a soy challenge: influence of habitual diet. Proc Soc Exp Biol Med, 1998. 217(3): p. 335‐339.
160. Nettleton JA, et al., Plasma phytoestrogens are not altered by probiotic consumption in postmenopausal women with and without a history of breast cancer. J Nutr, 2004. 134(8): p. 1998‐2003.
161. Blaut M and C. T., Metabolic diversity of the intestinal microbiota: implications for health and disease. . J Nutr, 2007. 137: p. 751s‐755s.
162. Clavel T, et al., Phylogeny of human intestinal bacteria that activate the dietary lignan secoisolariciresinol diglucoside. . FEMS Microbiol Ecol 2006. 55: p. 471‐478.
163. Danbara N, et al., Enterolactone induces apoptosis and inhibits growth of Colo 201 human colon cancer cells both in vitro and in vivo. Anticancer Research, 2005. 25: p. 2269‐2276.
164. Kuijsten A, et al., Plasma enterolignans are associated with lower colorectal adenoma risk. Cancer Epidemiol Biomarkers Prev, 2006. 15: p. 1132‐1136.
139
139
165. Liu Z, et al., Sesamin is one of the major precursors of mammalian lignans in same seed (Sesamum indicum) as observed in vitro in rats. . J Nutr, 2006. 136: p. 906‐912.
166. Qu H, et al., Lignans are involved in the antitumor activity of wheat bran in colon cancer SW480 cells. J Nutr, 2005. 135: p. 598‐602.
167. Pajari AM, et al., The plant lignans matairesinol and secoisolariciresinol administered to Min mice do not protect against intestinal tumor formation. Cancer Lett, 2006. 233(2): p. 309‐314.
168. Bolca S, et al., Microbial and dietary factors associated with the 8‐prenylnaringenin producer phenotype: a dietary intervention trial with fifty healthy post‐menopausal Caucasian women. . British Journal of Nutrition, 2007. 98: p. 950‐959.
169. Brunelli E, et al., 8‐Prenylnaringenin inhibits epidermal growth factor‐induced MCF‐7 breast cancer cell proliferation by targeting phosphatidylinositol‐3‐ OH kinase activity. . J Steroid Biochem Mol Biol, 2008. 113: p. 163‐170.
170. Lee SH, et al., Inhibition of topoisomerase I activity and efflux drug transporters' expression by xanthohumol from hops. Arch Pharm Res, 2007. 30(11): p. 1435‐1439.
171. Possemiers S, et al., Metabolism of isoflavones, lignans and prenylflavonoids by intestinal bacteria: producer phenotyping and relation with intestinal communit. FEMS Microbiol Ecol, 2007. 6(2): p. 372_383.
172. Vicinanza, R., et al., Pomegranate juice metabolites, ellagic acid and urolithin a, synergistically inhibit androgen‐independent prostate cancer cell growth via distinct effects on cell cycle control and apoptosis Evidence‐based Complementary and Alternative Medicine, 2013. 2013.
173. Giménez‐Bastida, J., et al., Urolithins, ellagitannins metabolites produced by colon microbiota, inhibit Quorum sensing in Yersinia enterocolitica: Phenotypic response and associated molecular changes. Food Chemistry 2012. 132: p. 1465‐1474.
174. Pandya, D., et al., Induction of CXCR4 expression by NF‐kappaB in prostate cancer cells is inhibited by pomegranate urolithin A. Journal of Investigative Medicine, 2008. 56(1): p. 131‐131.
175. Seeram, N.P., et al., Pharmacokinetics and tissue disposition of urolithin A, an ellagitannin‐derived metabolite, in mice. Faseb Journal, 2007. 21(6): p. A1081‐A1081.
176. Tulipani, S., et al., Urolithins Are the Main Urinary Microbial‐Derived Phenolic Metabolites Discriminating a Moderate Consumption of Nuts in Free‐Living Subjects with Diagnosed Metabolic Syndrome. Agricultural and Food Chemistry, 2012: p. 8930‐8940.
177. Park, H.‐Y., M. Kim, and J. Han, Stereospecific microbial production of isoflavanones from isoflavones and isoflavone glucosides. Applied Microbiol Biotechnol, 2011. 91.
178. Minamida, K., et al., Production of Equol from Daidzein by Gram‐Positive Rod‐Shaped Bacterium Isolated from Rat Intestine. Journal of Bioscience and bioengineering, 2006. 102(3): p. 247‐250.
179. Toshinari, M., et al., Adlercreutzia equolifaciens gen. nov., sp. nov., an equol‐producing bacterium isolated from human faeces, and emended description of the genus Eggerthella Int J Syst Evol Microbiol 2008. 58(May ): p. 1221‐1227.

140
140
180. Wang, X.‐L., et al., Production of phytoestrogen S‐equol from daidzein in mixed culture of two anaerobic bacteria. Arch Microbiol, 2007. 187.
181. Tsuji, H., et al., Isolation and characterization of the equol‐producing bacterium Slackia sp. strain NATTS. Arch Microbiol, 2010. 192: p. 279‐287.
182. Possemiers S, et al., Activation of proestrogens from hops (Humulus lupulus L.) by intestinal microbiota; conversion of isoxanthohumol into 8‐prenylnaringenin. J Agric Food Chem. , 2005. 53(16): p. 6281‐6288.
183. Want, E., et al., Global metabolic profiling procedures for urine using UPLC–MS. Nature Protocols, 2010. 5(6): p. 13.
184. Kristensen, M., Potential disease prevention from apple intake, in Department of Human Nutrition/Preventive Nutrition 2010, University of Copenhagen: Copenhagen. p. 62.
185. Kumar, A., et al., UPLC: a preeminent technique in pharmaceutical analysis Acta Poloniae Pharmaceutica ñ Drug Research, 2012. 69(3): p. 371‐380.
186. Wilson ID, et al., High resolution ‘‘ultra performance’’ liquid chromatography coupled to OA‐TOF mass spectrometry as a tool for differential metabolic pathway profiling in functional genomic studies. . J Proteome Res, 2005. 4: p. 591:598.
187. Theodoridis, G., H.G. Gika, and I.D. Wilson, Mass spectrometry‐based holistic analytical approaches for metabolite profiling in systems biology studies. Mass spectrometry, 2011. 30: p. 884‐906.
188. Do Yup, L., B.P. Bowen, and T.R. Northen, Mass spectrometry–based metabolomics, analysis of metabolite‐protein interactions, and imaging. Biotechniques, 2010. 49(2): p. 557‐565.
189. Glish, G.L. and R.W. Vachet, The basics of mass spectrometry in the twenty first century. Nature Reviews., 2002. 2: p. 140‐150.
190. Bristol, U.o., MASS SPECTROMETRY RESOURCE, E. ELECTROSPRAY IONISATION, Editor.
191. King R, et al., Mechanistic investigation of ionization suppression in electrospray ionization. J Am Soc Mass Spectrom, 2000. 11: p. 942‐950.
192. Patti, G.J., O. Yanes, and G. Siuzdak, Metabolomics: the apogee of the omics trilogy. Nature Reviews. Molecular Cell Biology, 2012. 13: p. 263‐269.
193. Chernushevich, I.V., A.V. Loboda, and B.A. Thomson, An introduction to quadrupole–time‐of‐flight mass spectrometry. Journal of Mass Spectrometry, 2001. 36: p. 849‐865.
194. Kind, T. and O. Fiehn, Kind,T. and Fiehn,O. (2007) Seven golden rules for heuristic filtering of molecular formulas obtained by accurate mass spectrometry. BMC. Bioinformatics, 2007. 8: p. 105.
195. Pluskal, T., et al., MZmine 2: Modular framework for processing, visualizing, and analyzing mass spectrometry‐based molecular profile data BMC Bioinformatics 2010. 11: p. 395.
196. Bouatra, S., et al., The Human Urine Metabolome. PLOS ONE, 2013. 8(9): p. e73076.
197. Lyautey, E., et al., Analysis of bacterial diversity in river biofilms using16 S rDNA PCR‐DGGE: methodological settings and fingerprints interpretation. Water research, 2005. 39: p. 380‐388.

141
141
198. Muyzer, G. and K. Smalla, Application of denaturing gradient gel electrophoresis (DGGE) and temperature gradient gel electrophoresis (TGGE) in microbial ecology. Antonie van Leeuwenhoek, 1998. 73: p. 127:141.
199. Fuka, M.M., et al., Evaluation of denaturing gradient gel electrophoresis (DGGE) used to describe structure of bacterial communities in Istrian cheese African Journal of Biotechnology, 2012. 11(101): p. 16650‐16654.
200. Waters, S., C.F. Duffy, and R.F.G. Power, PCR‐DGGE Analysis of Caecal Microflora of NatustatTM‐Supplemented Turkeys
Challenged with Histomonas meleagridis. International Journal of Poultry Science, 2005. 4(9): p. 620‐627.
201. Muyzer, G.E.C. de Waal, and A.G. Uitterlinden, Profiling of complex microbial populations by denaturing gradient gel electrophoresis .
analysis of polymerase chain reaction‐amplified genes coding for 16S rRNA. Appl Environ Microbiol., 1993. 59(3): p. 695:700.
202. Kilpatrick, R., Illustration of the PCR process, in PDF. 2013, University of Leicester: Leicester.
203. Muyzer, G. Genetic fingerprinting of microbial communities – present status and future perspectives. in Proceedings of the 8th International Symposium on Microbial Ecology. 1998. Halifax, Canada: Bell CR, Brylinsky M, Johnson‐Green P
204. Farag El Sheikha, A., et al., Determination of fruit origin by using 26S rDNA fingerprinting of yeast communities by PCR–DGGE: preliminary application to Physalis fruits from Egypt. Yeast, 2009. 26: p. 567‐573.
205. Jany, J.‐L. and G. Barbier, Culture‐Independent Methods for Identifying Microbial Communities in Cheese. Food Microbiology, 2008. 25(7): p. 839‐845.
206. Sakai, K. Denaturing Gradiente Gel Electrophoresis its applications, limitations, and perspectives in microbial ecological studies. 2008; Available from: http://www.lsse.kyutech.ac.jp/~asiacore/japanese/log/2008/data/0707/sakai_02.pdf.
207. Illian, J.B., et al., Functional principal component data analysis: A new method for analysing microbial community fingerprints. Journal of Microbiological Methods, 2009. 79: p. 89‐95.
208. Stebbings, S., et al., Comparison of the faecal microflora of patients with ankylosing spondylitis and controls using molecular methods of analysis. Rheumatology, 2002. 41: p. 1395‐1401.
209. Muyzer, G., E.C.L. De Waal, and A.G. Uitierlinden, Profiling of Complex Microbial Populations by Denaturing Gradient Gel Electrophoresis Analysis of Polymerase Chain Reaction‐Amplified Genes Coding for 16S rRNA. Appl Environ Microbiol., 1993. 59(3): p. 6.
210. Leesing, R., Identification and Validation of Specific Markers for Traceability of Aquaculture Fish for Import/Export. 2005, University of Montpellier 2: Montpellier p. 183.
211. Kristensen, M., S.B. Engelsen, and L.O. Dragsted, LC‐MS metabolomics top‐down approach reveals new exposure and effect biomarkers of apple and apple‐pectin intake. . Journal of Proteome Research., 2010.

142
142
212. Wolfender, J.‐L., et al., MS‐based Plant Metabolomic Approaches for Biomarker Discovery. NPC Natural Product Communications, 2009. 4(10).
213. Fromin, N., . , et al., Statistical analysis of denaturing gel electrophoresis (DGE) fingerprinting patterns. Environ. Microbiol, 2002. 4: p. 634:643.
214. Rosipal, R. and N. Kramer, eds. Overview and Recent Advances in Partial Least Squares. ed. S.e. al. 2006: Berlin. 3940.
215. Kilford, P.J., et al., Prediction of Drug Clearance by Glucuronidation from in Vitro Data: Use of Combined Cytochrome P450 and UDP‐Glucuronosyltransferase Cofactors in Alamethicin‐Activated Human Liver Microsomes. Drug metabolism and disposition, 2009. 37(1): p. 82‐89.
216. Sanna, K., N‐Glucuronidation of Drugs and Other Xenobiotics, in Division of Pharmaceutical Chemistry Faculty of Pharmacy, . 2010, University of Helsinki: Helsinki, Finland. p. 86.
217. Kiang, T.K.L., M.H.H. Ensoma, and T.K.H. Chang, UDP‐glucuronosyltransferases and clinical drug‐drug interactions. Pharmacology and Therapeutics, 2005. 106: p. 97‐132.
218. Lampe, J.W., Interindividual differences in response to plant‐based diets:i mplications for cancer risk. American Journal Clinical Nutrition, 2009. 89(suppl): p. 1553‐1557.
219. Balram, P., Texbook of toxicology, in Fate of Toxins. 2010, I. K. International Publishing House Pvt Ltd: New Delhi, India. p. 420.
220. Klaassen, C.D. and J.W. Boles, The importance of 3’‐phosphoadenosine 5’‐phosphosulfate (PAPS) in the regulation of sulfation. Faseb Journal, 1997. 11: p. 404‐418.
221. Espín, J.C., M. García‐conesa, and F. Tomas‐Barberán, Nutraceuticals: Facts and fiction. Phyrochemistry, 2007. 68: p. 2986‐2308.
222. Lynch, T., A. PharmD, and M. Price, The Effect of Cytochrome P450 Metabolism on Drug Response, Interactions, and Adverse Effects. American Fam Physician, 2007. 76(3): p. 391‐396.
223. Puupponen‐Pimia, R., et al., Effects of ellagitannin‐rich berries on blood lipids, gut microbiota, and urolithin production in human subjects with symptoms of metabolic syndrome. Mol. Nutr. Food Res., 20013. 00: p. 1‐6.
224. Wexler, H.M., Bacteroides: the Good, the Bad, and the Nitty‐Gritty Clin. Microbiol. Rev. , 2007. 20(4): p. 593‐621
225. Sokol H, et al., Faecalibacterium prausnitzii is an anti‐inflammatory commensal bacterium identified by gut microbiota analysis of Crohn disease patients. . Proc Natl Acad Sci U S A, 2008. 105: p. 16731‐16736.
226. Lopez‐Siles, M., et al., Cultured representatives of two major phylogroups of human colonic Faecalibacterium prausnitzii can utilize pectin, uronic acids, and host‐derived substrates for growth. Appl Environ Microbiol, 2012. 78(2): p. 420‐8.
227. Lilian Schoefer, et al., Anaerobic Degradation of Flavonoids by Clostridium orbiscindens. Appl. Environ. Microbiol, 20003. 69(10): p. 5849‐5854.

143
143
228. Derrien, M., et al., Akkermansia muciniphila gen. nov., sp. nov., a human intestinal mucin‐degrading bacterium. International Journal of Systematic and Evolutionary Microbiology, 2004. 54: p. 1469‐1476.
229. Everard, A., et al., Cross‐talk between Akkermansia muciniphila and intestinal epithelium controls diet‐induced obesity. Proceedings of the National Academy of Sciences fo the United Tates of America, 2013. 110(22): p. 9066‐9071.


![WATERLOGGE WOODAND WET LEM E · (Drawings by O.N. Chistyakova) [17]. The type of deterioration shown in fig. 1 and 2 leads to very fragile objects which on drying undergo considerable](https://static.fdocuments.fr/doc/165x107/5fd6b196a5fb6078fc187f6a/waterlogge-woodand-wet-lem-e-drawings-by-on-chistyakova-17-the-type-of-deterioration.jpg)