
The international surface temperature initiative global ...
28
The international surface temperature initiative global land surface databank: monthly temperature data release description and methods J. J. Rennie 1 *, J. H. Lawrimore 2 , B. E. Gleason 2 , P. W. Thorne 1,3 , C. P. Morice 4 , M. J. Menne 2 , C. N. Williams 2 , W. Gambi de Almeida 5 , J.R. Christy 6 , M. Flannery 7 , M. Ishihara 8 , K. Kamiguchi 8 , A. M. G. Klein-Tank 9 , A. Mhanda 10 , D. H. Lister 11 , V. Razuvaev 12 , M. Renom 13 , M. Rusticucci 14 , J. Tandy 4 , S. J. Worley 15 , V. Venema 16 , W. Angel 3 , M. Brunet 11,17 , B. Dattore 15 , H. Diamond 3 , M. A. Lazzara 18 , F. Le Blancq 19 , J. Luterbacher 20 , H. M € achel 21 , J. Revadekar 22 , R. S. Vose 3 and X. Yin 23 1 Cooperative Institute for Climate and Satellites – NC, North Carolina State University and NOAA’s National Climatic Data Center, Asheville, NC, USA 2 NOAA’s National Climatic Data Center, Asheville, NC, USA 3 Nansen Environmental and Remote Sensing Center, Bergen, Norway 4 Met Office Hadley Centre, Exeter, UK 5 Instituto Nacional de Pesquisas Espaciais, Centro de Previs~ ao de Tempo e Estudos Clim aticos, Cachoeira Paulista/SP, Brazil 6 University of Alabama-Huntsville, Huntsville, AL, USA 7 Bureau of Meteorology, Melbourne, Australia 8 Japan Meteorological Agency, Tokyo, Japan 9 Royal Netherlands Meteorological Institute (KNMI), De Bilt, the Netherlands 10 African Centre of Meteorological Applications for Development, Niamey, Niger 11 Climatic Research Unit, University of East Anglia, Norwich, UK 12 Russian Research Institute of Hydrometeorological Information, Obninsk, Russia 13 Universidad de la Republica, Montevideo, Uruguay 14 University of Buenos Aires, Buenos Aires, Argentina 15 National Center for Atmospheric Research, Boulder, CO, USA 16 Meteorologisches Institut Universitaet Bonn, Bonn, Germany 17 Centre for Climate Change, University Rovira i Virgill, Tarragona, Spain 18 Antarctic Meteorological Research Center, Space Science and Engineering Center, University of Wisconsin-Madison, Madison, WI, USA 19 States of Jersey Meteorological Department, Jersey, UK 20 Department of Geography, Justus-Liebig University, Giessen, Germany 21 Deutscher Wetterdiest (DWD), Offenbach am Main, Germany 22 Centre for Climate Change Research, Indian Institute of Tropical Meteorology, Pune, India 23 ERT, Inc., Asheville, NC, USA *Correspondence: J. J. Rennie, Cooperative Institute for Climate and Satellites – NC, North Carolina State University and NOAA’s National Climatic Data Center, Asheville, NC, USA, E-mail: [email protected] Described herein is the first version release of monthly temperature holdings of a new Global Land Surface Meteorological Data- bank. Organized under the auspices of the International Surface Temperature Initiative (ISTI), an international group of scientists have spent three years collating and merging data from numerous sources to create a merged holding. This release in its recom- mended form consists of over 30 000 individual station records, some of which extend over the past 300 years. This article describes the sources, the chosen merge methodology, and the resulting databank characteristics. Several variants of the data- bank have also been released that reflect the structural uncertainty in merging datasets. Variants differ in, for example, the order in which sources are considered and the degree of congruence required in station geolocation for consideration as a merged or unique record. Also described is a version control protocol that will be applied in the event of updates. Future updates are envis- aged with the addition of new data sources, and with changes in processing, where public feedback is always welcomed. Major updates, when necessary, will always be accompanied by a new journal paper. This databank release forms the foundation for the construction of new global land surface air temperature analyses by the global research community and their assessment by the ISTI’ s benchmarking and assessment working group. Geosci. Data J. (2014), doi: 10.1002/gdj3.8 Received: 16 April 2013, revised: 26 September 2013, accepted: 3 October 2013 ª 2014 The Authors. Geoscience Data Journal published by Royal Meteorological Society and John Wiley & Sons Ltd. This is an open access article under the terms of the Creative Commons Attribution License, which permits use, distribution and reproduction in any medium, provided the original work is properly cited.
Transcript of The international surface temperature initiative global ...
The international surface temperature initiative global landsurface databank: monthly temperature data releasedescription and methods
J. J. Rennie1*, J. H. Lawrimore2, B. E. Gleason2, P. W. Thorne1,3, C. P. Morice4, M. J. Menne2,C. N. Williams2, W. Gambi de Almeida5, J.R. Christy6, M. Flannery7, M. Ishihara8, K. Kamiguchi8,A. M. G. Klein-Tank9, A. Mhanda10, D. H. Lister11, V. Razuvaev12, M. Renom13, M. Rusticucci14,J. Tandy4, S. J. Worley15, V. Venema16, W. Angel3, M. Brunet11,17, B. Dattore15, H. Diamond3,M. A. Lazzara18, F. Le Blancq19, J. Luterbacher20, H. M€achel21, J. Revadekar22, R. S. Vose3 andX. Yin231Cooperative Institute for Climate and Satellites – NC, North Carolina State University and NOAA’s National Climatic DataCenter, Asheville, NC, USA2NOAA’s National Climatic Data Center, Asheville, NC, USA3Nansen Environmental and Remote Sensing Center, Bergen, Norway4Met Office Hadley Centre, Exeter, UK5Instituto Nacional de Pesquisas Espaciais, Centro de Previs~ao de Tempo e Estudos Clim�aticos, Cachoeira Paulista/SP, Brazil6University of Alabama-Huntsville, Huntsville, AL, USA7Bureau of Meteorology, Melbourne, Australia8Japan Meteorological Agency, Tokyo, Japan9Royal Netherlands Meteorological Institute (KNMI), De Bilt, the Netherlands10African Centre of Meteorological Applications for Development, Niamey, Niger11Climatic Research Unit, University of East Anglia, Norwich, UK12Russian Research Institute of Hydrometeorological Information, Obninsk, Russia13Universidad de la Republica, Montevideo, Uruguay14University of Buenos Aires, Buenos Aires, Argentina15National Center for Atmospheric Research, Boulder, CO, USA16Meteorologisches Institut Universitaet Bonn, Bonn, Germany17Centre for Climate Change, University Rovira i Virgill, Tarragona, Spain18Antarctic Meteorological Research Center, Space Science and Engineering Center, University of Wisconsin-Madison,Madison, WI, USA19States of Jersey Meteorological Department, Jersey, UK20Department of Geography, Justus-Liebig University, Giessen, Germany21Deutscher Wetterdiest (DWD), Offenbach am Main, Germany22Centre for Climate Change Research, Indian Institute of Tropical Meteorology, Pune, India23ERT, Inc., Asheville, NC, USA
*Correspondence: J. J. Rennie, Cooperative Institute for Climate and Satellites – NC, North Carolina State University andNOAA’s National Climatic Data Center, Asheville, NC, USA, E-mail: [email protected]
Described herein is the first version release of monthly temperature holdings of a new Global Land Surface Meteorological Data-bank. Organized under the auspices of the International Surface Temperature Initiative (ISTI), an international group of scientistshave spent three years collating and merging data from numerous sources to create a merged holding. This release in its recom-mended form consists of over 30 000 individual station records, some of which extend over the past 300 years. This articledescribes the sources, the chosen merge methodology, and the resulting databank characteristics. Several variants of the data-bank have also been released that reflect the structural uncertainty in merging datasets. Variants differ in, for example, the orderin which sources are considered and the degree of congruence required in station geolocation for consideration as a merged orunique record. Also described is a version control protocol that will be applied in the event of updates. Future updates are envis-aged with the addition of new data sources, and with changes in processing, where public feedback is always welcomed. Majorupdates, when necessary, will always be accompanied by a new journal paper. This databank release forms the foundation forthe construction of new global land surface air temperature analyses by the global research community and their assessment bythe ISTI’s benchmarking and assessment working group.
Geosci. Data J. (2014), doi: 10.1002/gdj3.8
Received: 16 April 2013, revised: 26 September 2013, accepted: 3 October 2013
ª 2014 The Authors. Geoscience Data Journal published by Royal Meteorological Society and John Wiley & Sons Ltd.This is an open access article under the terms of the Creative Commons Attribution License, which permits use, distribution andreproduction in any medium, provided the original work is properly cited.
Key words: global climate, surface land temperature, statistical analysis
Dataset
Identifier: doi:10.7289/V5PK0D3GCreator: International Surface Temperature Initiative (ISTI)Title: Global Land Surface Meteorological DatabankPublisher: Global Observing Systems Information Center (GOSIC)Publication year: 2014
Introduction and rationale
Since the 17th century, starting with a few sites in Eur-ope (Camuffo & Bertolin, 2012 and references therein),efforts have been established to continuously and sys-tematically measure land surface air temperaturethrough instrumental means. These long-term recordsprovide an insight into the temperature variations ofthe Earth. Major efforts were made in the 1980s and1990s to collect these observations from around theworld and create a consolidated monthly-timescaledatabase on a global scale. Climatologists from theNational Oceanic and Atmospheric Administration’s(NOAA’s) National Climatic Data Center (NCDC) and theCarbon Dioxide Information Analysis Center (CDIAC)produced the Global Historical Climatology Network –Monthly (GHCN-M) dataset in 1992, which containedmore than 6000 stations (Vose et al., 1992). A secondversion of GHCN-M, containing 7280 stations withmonthly mean, maximum and minimum temperature(TAVG, TMAX, and TMIN respectively), was released in1997 (Peterson & Vose, 1997). More recently in 2011, athird version of GHCN-M updated the quality control(QC) procedures, as well as the algorithm used to iden-tify and account for inhomogeneities (Lawrimore et al.,2011). Routine updates for about 2000 stations aremade on a daily basis. Since version 2, GHCN-M hasbeen a major component in the development of NASA’sGISS dataset (Hansen et al., 1999, 2010), which con-tains 6000 stations. An independent effort in the UnitedKingdom produced a first release of its CRUTEM prod-uct in the late 1980s. Today, a global dataset of over6000 stations is still maintained in its fourth iteration(Jones et al., 2012). Although methodologies for allthree datasets differ, they all exhibit close agreementwith respect to large scale changes in global land sur-face air temperatures. Such series can be reasonablycalculated from a point in the mid-to-late 19th centurywhen there is sufficient global station coverage.
Land surface air temperature products have beenessential for monitoring the evolution of the climatesystem, and are included in reports such as annualState of the Climate (Blunden & Arndt, 2013), nationalassessments (USGCRP, 2014), and the Intergovern-mental Panel on Climate Change (IPCC, 2013). Takentogether with sea surface temperatures, they repre-sent the longest continuous direct measurement
record by which to monitor and understand climatevariability and change.
More recently attention has turned to the construc-tion of global daily land surface temperature datasets.This was in recognition of the need to characterizesub-monthly variability, and in particular climaticextremes. The Global Historical Climatology Network –Daily (GHCN-D) dataset was a result of these efforts(Menne et al., 2012). Today, GHCN-D provides dailymaximum and minimum temperature for nearly30 000 stations. Although more stations exist on thedaily scale, records are generally shorter in lengththan the monthly mean temperature records in GHCN-M. GHCN-D data for most stations outside the UnitedStates do not begin until the middle of the 20th Cen-tury. Nevertheless this provides the world’s most com-plete record of daily variations and extremes notavailable in the monthly climate record. There alsoexist numerous other national and regional daily hold-ings as well as more complete indices datasets wherethe station data have not been shared, but derivedindices are (Caesar et al., 2006; Allan et al., 2011;Compo et al., 2011; Skansi et al., 2012). This reflectssome of the real challenges over data sharing and pro-vision between rights holders.
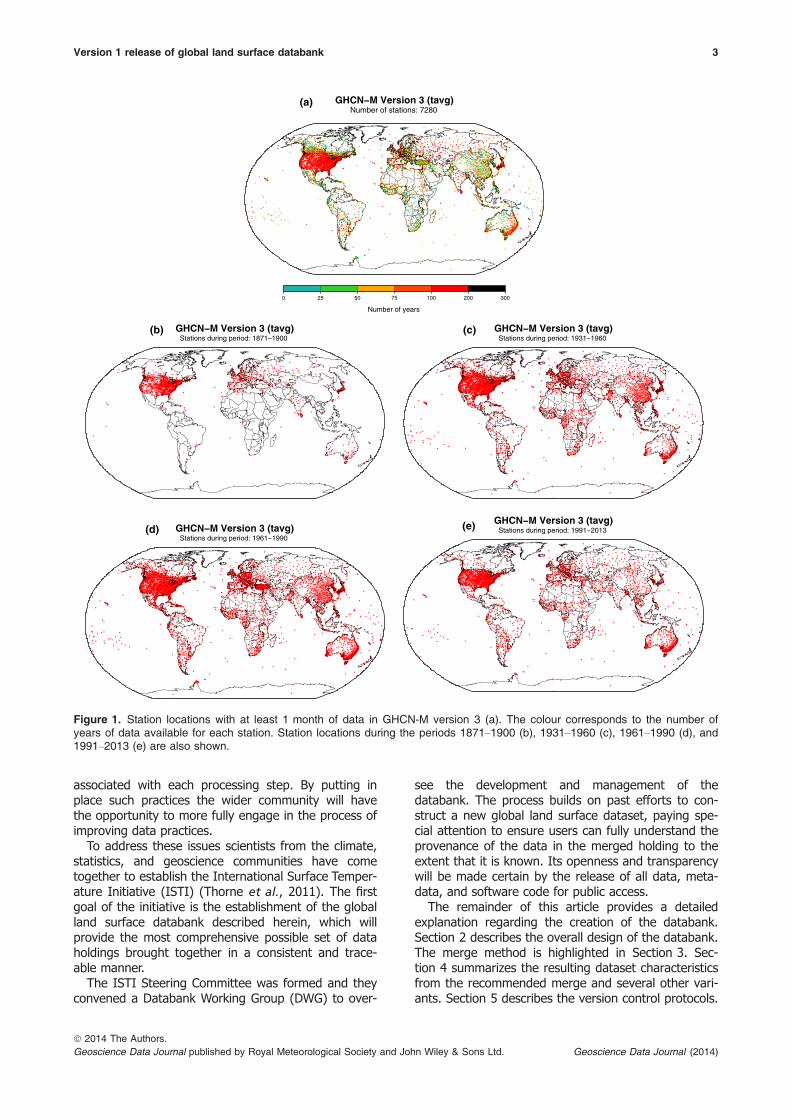
Although there have been tremendous advances inthe understanding of climate change provided bythese data collection efforts, analyses, and resultingdatasets, there remain substantive spatial and tempo-ral gaps due to deficiencies in global collections ofdata. These deficiencies have deleterious impacts onour collective ability to monitor and characterizeclimate (Figure 1). There is limited spatial coverage inmany parts of the world, especially in the 1800s andearlier. Additional sources of data exist, often in origi-nal manuscript form or scanned images. These formsare often housed in designated data centres such asNCDC, however lack of resources and funding haveprevented efforts to convert the data into digital for-mats for use in modern datasets.
In addition there has been limited success at com-pletely documenting the provenance and implement-ing version control from the point measurementthrough dissemination and data sharing pathways,QC, bias correction, and archive and access. More canbe done to improve practices to ensure full openness,transparency, and availability of data and the details
2 J. J. Rennie et al.
ª 2014 The Authors.Geoscience Data Journal published by Royal Meteorological Society and John Wiley & Sons Ltd.Geoscience Data Journal (2014)
associated with each processing step. By putting inplace such practices the wider community will havethe opportunity to more fully engage in the process ofimproving data practices.
To address these issues scientists from the climate,statistics, and geoscience communities have cometogether to establish the International Surface Temper-ature Initiative (ISTI) (Thorne et al., 2011). The firstgoal of the initiative is the establishment of the globalland surface databank described herein, which willprovide the most comprehensive possible set of dataholdings brought together in a consistent and trace-able manner.
The ISTI Steering Committee was formed and theyconvened a Databank Working Group (DWG) to over-
see the development and management of thedatabank. The process builds on past efforts to con-struct a new global land surface dataset, paying spe-cial attention to ensure users can fully understand theprovenance of the data in the merged holding to theextent that it is known. Its openness and transparencywill be made certain by the release of all data, meta-data, and software code for public access.
The remainder of this article provides a detailedexplanation regarding the creation of the databank.Section 2 describes the overall design of the databank.The merge method is highlighted in Section 3. Sec-tion 4 summarizes the resulting dataset characteristicsfrom the recommended merge and several other vari-ants. Section 5 describes the version control protocols.
0 25 50 75 100 200 300
GHCN−M Version 3 (tavg)(a)
(b) (c)
(e)(d)
Number of stations: 7280
Number of years
GHCN−M Version 3 (tavg)Stations during period: 1871–1900
GHCN−M Version 3 (tavg)Stations during period: 1931−1960
GHCN−M Version 3 (tavg)Stations during period: 1961−1990
GHCN−M Version 3 (tavg)Stations during period: 1991−2013
Figure 1. Station locations with at least 1 month of data in GHCN-M version 3 (a). The colour corresponds to the number ofyears of data available for each station. Station locations during the periods 1871–1900 (b), 1931–1960 (c), 1961–1990 (d), and1991–2013 (e) are also shown.
Version 1 release of global land surface databank 3
ª 2014 The Authors.Geoscience Data Journal published by Royal Meteorological Society and John Wiley & Sons Ltd. Geoscience Data Journal (2014)
Conclusions are presented in Section 6, along withavenues for increased expert participation.
1. Databank architecture
This section provides information about the design ofthe global databank and includes a description of allthe stages, as well as the implementation of prove-nance tracking flags.
1.1. Databank stages
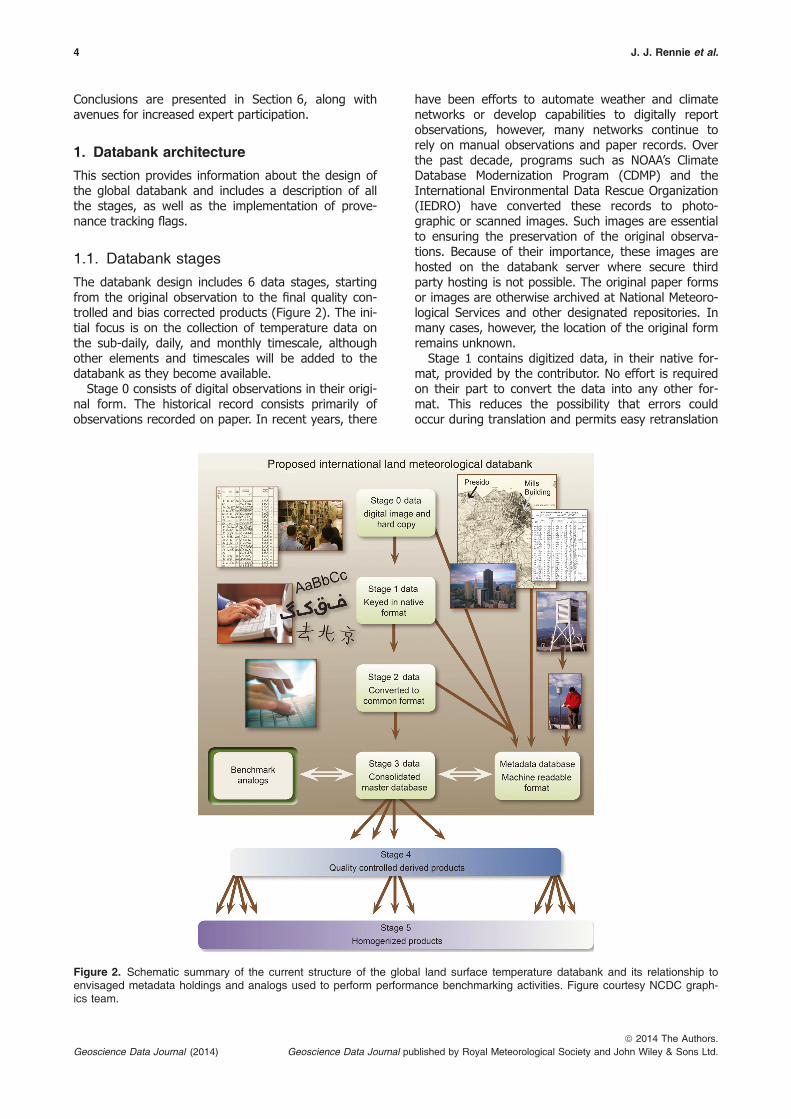
The databank design includes 6 data stages, startingfrom the original observation to the final quality con-trolled and bias corrected products (Figure 2). The ini-tial focus is on the collection of temperature data onthe sub-daily, daily, and monthly timescale, althoughother elements and timescales will be added to thedatabank as they become available.
Stage 0 consists of digital observations in their origi-nal form. The historical record consists primarily ofobservations recorded on paper. In recent years, there
have been efforts to automate weather and climatenetworks or develop capabilities to digitally reportobservations, however, many networks continue torely on manual observations and paper records. Overthe past decade, programs such as NOAA’s ClimateDatabase Modernization Program (CDMP) and theInternational Environmental Data Rescue Organization(IEDRO) have converted these records to photo-graphic or scanned images. Such images are essentialto ensuring the preservation of the original observa-tions. Because of their importance, these images arehosted on the databank server where secure thirdparty hosting is not possible. The original paper formsor images are otherwise archived at National Meteoro-logical Services and other designated repositories. Inmany cases, however, the location of the original formremains unknown.
Stage 1 contains digitized data, in their native for-mat, provided by the contributor. No effort is requiredon their part to convert the data into any other for-mat. This reduces the possibility that errors couldoccur during translation and permits easy retranslation
Figure 2. Schematic summary of the current structure of the global land surface temperature databank and its relationship toenvisaged metadata holdings and analogs used to perform performance benchmarking activities. Figure courtesy NCDC graph-ics team.
4 J. J. Rennie et al.
ª 2014 The Authors.Geoscience Data Journal published by Royal Meteorological Society and John Wiley & Sons Ltd.Geoscience Data Journal (2014)
in the event such issues occur. Because a large per-centage of stage 0 data are missing or unknown,stage 1 data will be the first data level for manysources.
Once the data are submitted as stage 1, all dataare converted into a common stage 2 format. In addi-tion, data provenance flags are added to every obser-vation to provide a history of that particular value.stage 2 files are maintained in ASCII format and eachdata source is held in a separate subdirectory. Aninventory file is produced for each source dataset con-taining available metadata. At a minimum this typicallyconsists of a station id, name, latitude, longitude, ele-vation, and beginning and ending year of data. Thecode to convert all the sources to stage 2 is written inthe Perl scripting language, and is made available onthe databank server. This provision documents thedata translation and provides a means for otherresearchers to evaluate the process and if errors aredetected later they can easily be addressed.
At the time of writing, there are 58 sources thathave been collected and converted to stage 2. Table 1summarizes all the sources currently in the databank.Some sources only provide data on monthly time-scales, while others have daily or even sub-daily data.Most station records include maximum and minimumtemperature, but in some cases only average tempera-tures are available. The databank policy recommendsdata to be submitted in stage 0 and stage 1 form,prior to any QC or bias correction. If no other formsexist, then quality controlled and bias corrected dataare accepted. The status of the original source data isdocumented with provenance fields on each recordand they have an important role in setting the hierar-chy for inclusion during the data merging process.
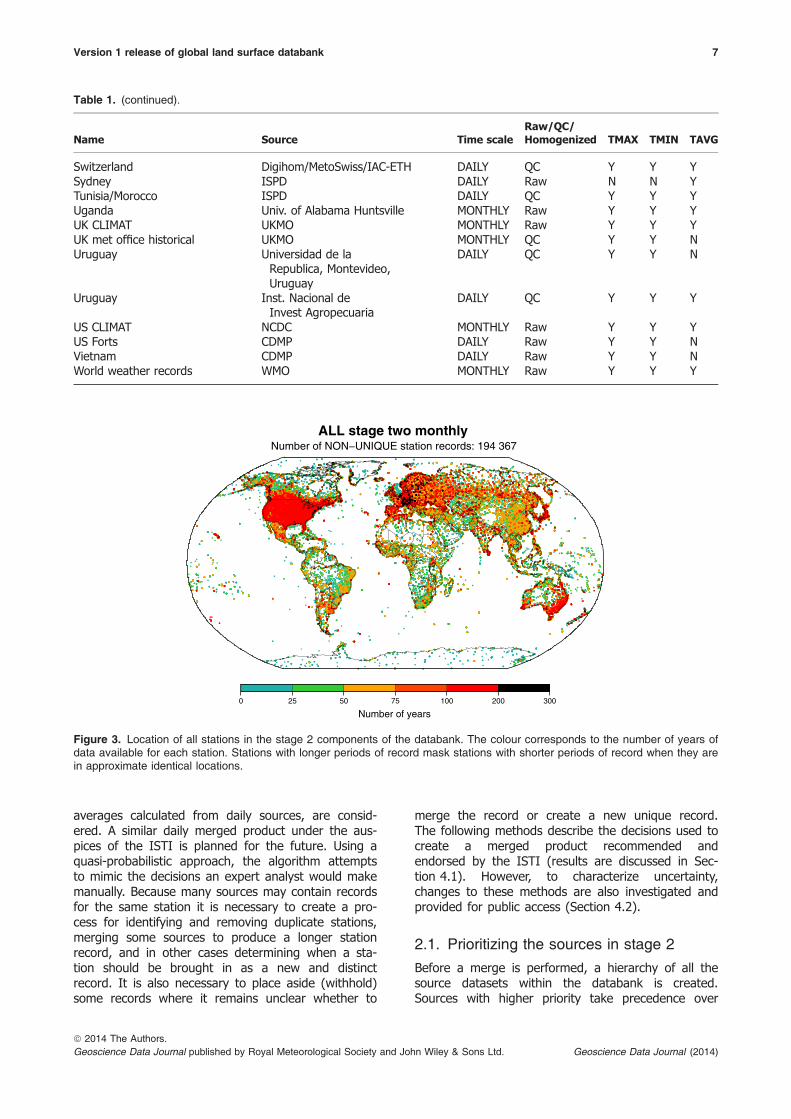
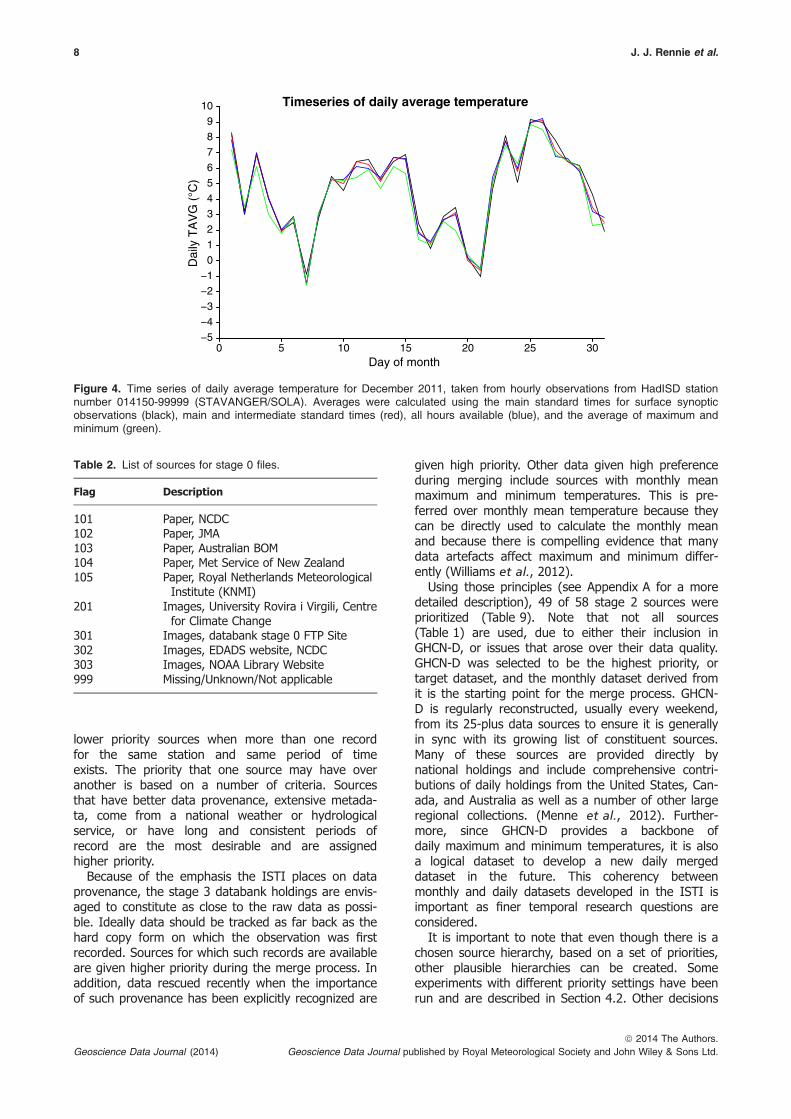
Given the historical nature of data creation, sharing,and rescue, there are many cases where a single sta-tion exists in multiple data sources. Figure 3 summa-rizes the current geographical distribution and recordlength of all the stations in stage 2. Because of thepossibility of duplicate station records, these stationsare considered non-unique. In addition, due to differ-ent collection and reprocessing techniques, theduplicate records do not necessarily have identicaltemperature values for the same station even thoughthey are based upon the same fundamental measure-ments. Figure 4 provides different values of daily aver-age temperature for the same station using multiplecalculating methods.
Sources with daily data have been converted tomonthly averages and added as additional sources inthe monthly holding. The methodology for creating amonthly average follows that of the World Meteorolog-ical Organization (WMO). For any given month, theremust be no more than five missing days, and theremust be no more than three consecutive days missing(WMO, 2011). If one or both of the criteria fail, themonthly value is set to missing.
Once all the sources have been collected and for-matted, the data are then merged into a single,
comprehensive stage 3 dataset. The algorithm thatperforms the merging is described in Section 3. Devel-opment of the merged dataset is followed by QC andhomogeneity adjustments (stage 4 and 5 respec-tively). Development of these last two stages is notthe responsibility of the DWG, and is not discussedhere beyond to say that it is hoped and stronglyencouraged that multiple independent groups willundertake such efforts (Thorne et al., 2011).
1.2. Data provenance
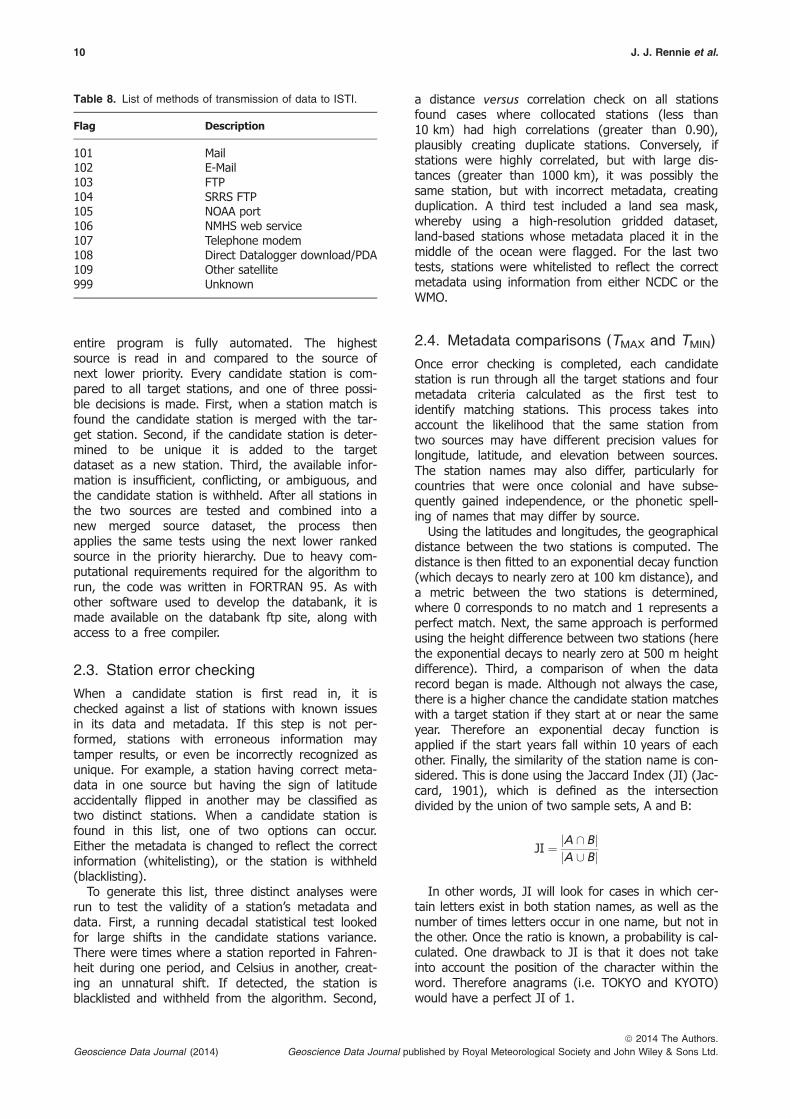
To provide a traceable record that documents as muchof the histories of each observation as possible, dataprovenance tracking flags are added to each observa-tion, beginning with stage 2. Flags are a three digitnumeric value that represents unique informationregarding each observation. Currently there are sevendata provenance tracking flags (Tables 2–8), with theopportunity to add additional flags as needed. All flagsare extendable for future situations using additionalthree digit numbers not previously assigned.
The first two flags (Tables 2 and 3) describe thesource of stage 0 and stage 1 data respectively. Thestage 1 source may differ from the stage 0 providers,or it may provide additional formation such as thename of the host’s dataset from which the data origi-nated. The next flag (Table 4) indicates if the dataprovided by the host were in its raw form or whetherit had been previously quality controlled or bias cor-rected. Although the preference is to have data as rawas possible, there are times where such data do notexist, or have not been provided to the databank.Therefore pre-processed data are accepted and theappropriate flag is assigned to the observations.Table 5 describes the method and location of data dig-itization, if available. Two flags describe the calculationof data on the daily and monthly timescale (Tables 6and 7 respectively). The daily calculation flag (Table 6)depicts how the observation was generated if thesource contains sub-daily values. Depending on thetype of station, observations can be made andreported on an hourly basis. However some sta-tions, such as many of those providing synopticobservations, only report observations four times aday. Within the databank, a daily value is calculatedduring the conversion to stage 2, and a flag is addedto inform the user how many observations were avail-able prior to the conversion. Similarly, a monthly calcu-lation flag (Table 7) informs the user how many daysin a month were used to create a monthly average.The final flag (Table 8) describes the process used totransfer the data to the databank servers.
2. Merging methodology
This section covers, at a high level, the process inwhich individual stage 2 sources are combined toform a comprehensive stage 3 dataset. At the timeof writing, only monthly sources, as well as monthly
Version 1 release of global land surface databank 5
ª 2014 The Authors.Geoscience Data Journal published by Royal Meteorological Society and John Wiley & Sons Ltd. Geoscience Data Journal (2014)
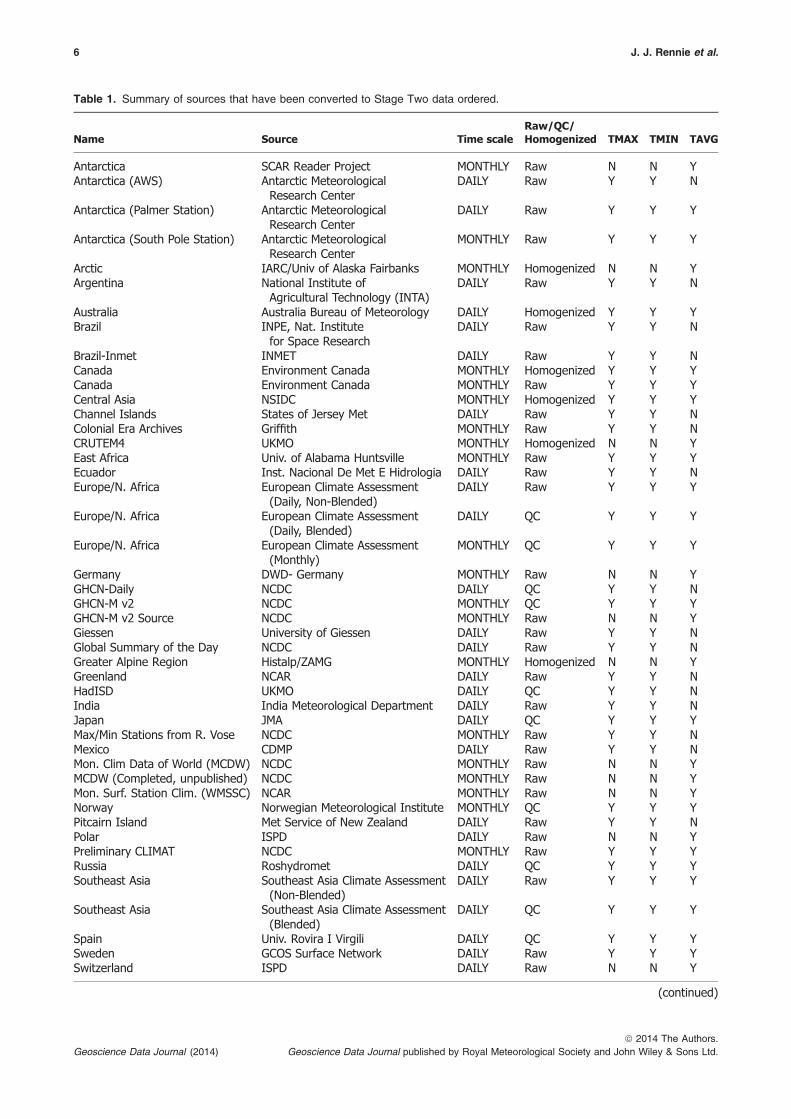
Table 1. Summary of sources that have been converted to Stage Two data ordered.
Name Source Time scaleRaw/QC/Homogenized TMAX TMIN TAVG
Antarctica SCAR Reader Project MONTHLY Raw N N YAntarctica (AWS) Antarctic Meteorological
Research CenterDAILY Raw Y Y N
Antarctica (Palmer Station) Antarctic MeteorologicalResearch Center
DAILY Raw Y Y Y
Antarctica (South Pole Station) Antarctic MeteorologicalResearch Center
MONTHLY Raw Y Y Y
Arctic IARC/Univ of Alaska Fairbanks MONTHLY Homogenized N N YArgentina National Institute of
Agricultural Technology (INTA)DAILY Raw Y Y N
Australia Australia Bureau of Meteorology DAILY Homogenized Y Y YBrazil INPE, Nat. Institute
for Space ResearchDAILY Raw Y Y N
Brazil-Inmet INMET DAILY Raw Y Y NCanada Environment Canada MONTHLY Homogenized Y Y YCanada Environment Canada MONTHLY Raw Y Y YCentral Asia NSIDC MONTHLY Homogenized Y Y YChannel Islands States of Jersey Met DAILY Raw Y Y NColonial Era Archives Griffith MONTHLY Raw Y Y NCRUTEM4 UKMO MONTHLY Homogenized N N YEast Africa Univ. of Alabama Huntsville MONTHLY Raw Y Y YEcuador Inst. Nacional De Met E Hidrologia DAILY Raw Y Y NEurope/N. Africa European Climate Assessment
(Daily, Non-Blended)DAILY Raw Y Y Y
Europe/N. Africa European Climate Assessment(Daily, Blended)
DAILY QC Y Y Y
Europe/N. Africa European Climate Assessment(Monthly)
MONTHLY QC Y Y Y
Germany DWD- Germany MONTHLY Raw N N YGHCN-Daily NCDC DAILY QC Y Y NGHCN-M v2 NCDC MONTHLY QC Y Y YGHCN-M v2 Source NCDC MONTHLY Raw N N YGiessen University of Giessen DAILY Raw Y Y NGlobal Summary of the Day NCDC DAILY Raw Y Y NGreater Alpine Region Histalp/ZAMG MONTHLY Homogenized N N YGreenland NCAR DAILY Raw Y Y NHadISD UKMO DAILY QC Y Y NIndia India Meteorological Department DAILY Raw Y Y NJapan JMA DAILY QC Y Y YMax/Min Stations from R. Vose NCDC MONTHLY Raw Y Y NMexico CDMP DAILY Raw Y Y NMon. Clim Data of World (MCDW) NCDC MONTHLY Raw N N YMCDW (Completed, unpublished) NCDC MONTHLY Raw N N YMon. Surf. Station Clim. (WMSSC) NCAR MONTHLY Raw N N YNorway Norwegian Meteorological Institute MONTHLY QC Y Y YPitcairn Island Met Service of New Zealand DAILY Raw Y Y NPolar ISPD DAILY Raw N N YPreliminary CLIMAT NCDC MONTHLY Raw Y Y YRussia Roshydromet DAILY QC Y Y YSoutheast Asia Southeast Asia Climate Assessment
(Non-Blended)DAILY Raw Y Y Y
Southeast Asia Southeast Asia Climate Assessment(Blended)
DAILY QC Y Y Y
Spain Univ. Rovira I Virgili DAILY QC Y Y YSweden GCOS Surface Network DAILY Raw Y Y YSwitzerland ISPD DAILY Raw N N Y
(continued)
6 J. J. Rennie et al.
ª 2014 The Authors.Geoscience Data Journal published by Royal Meteorological Society and John Wiley & Sons Ltd.Geoscience Data Journal (2014)
averages calculated from daily sources, are consid-ered. A similar daily merged product under the aus-pices of the ISTI is planned for the future. Using aquasi-probabilistic approach, the algorithm attemptsto mimic the decisions an expert analyst would makemanually. Because many sources may contain recordsfor the same station it is necessary to create a pro-cess for identifying and removing duplicate stations,merging some sources to produce a longer stationrecord, and in other cases determining when a sta-tion should be brought in as a new and distinctrecord. It is also necessary to place aside (withhold)some records where it remains unclear whether to
merge the record or create a new unique record.The following methods describe the decisions used tocreate a merged product recommended andendorsed by the ISTI (results are discussed in Sec-tion 4.1). However, to characterize uncertainty,changes to these methods are also investigated andprovided for public access (Section 4.2).
2.1. Prioritizing the sources in stage 2
Before a merge is performed, a hierarchy of all thesource datasets within the databank is created.Sources with higher priority take precedence over
Table 1. (continued).
Name Source Time scaleRaw/QC/Homogenized TMAX TMIN TAVG
Switzerland Digihom/MetoSwiss/IAC-ETH DAILY QC Y Y YSydney ISPD DAILY Raw N N YTunisia/Morocco ISPD DAILY QC Y Y YUganda Univ. of Alabama Huntsville MONTHLY Raw Y Y YUK CLIMAT UKMO MONTHLY Raw Y Y YUK met office historical UKMO MONTHLY QC Y Y NUruguay Universidad de la
Republica, Montevideo,Uruguay
DAILY QC Y Y N
Uruguay Inst. Nacional deInvest Agropecuaria
DAILY QC Y Y Y
US CLIMAT NCDC MONTHLY Raw Y Y YUS Forts CDMP DAILY Raw Y Y NVietnam CDMP DAILY Raw Y Y NWorld weather records WMO MONTHLY Raw Y Y Y
0 25 50 75 100 200 300
ALL stage two monthlyNumber of NON−UNIQUE station records: 194 367
Number of years
Figure 3. Location of all stations in the stage 2 components of the databank. The colour corresponds to the number of years ofdata available for each station. Stations with longer periods of record mask stations with shorter periods of record when they arein approximate identical locations.
Version 1 release of global land surface databank 7
ª 2014 The Authors.Geoscience Data Journal published by Royal Meteorological Society and John Wiley & Sons Ltd. Geoscience Data Journal (2014)
lower priority sources when more than one recordfor the same station and same period of timeexists. The priority that one source may have overanother is based on a number of criteria. Sourcesthat have better data provenance, extensive metada-ta, come from a national weather or hydrologicalservice, or have long and consistent periods ofrecord are the most desirable and are assignedhigher priority.
Because of the emphasis the ISTI places on dataprovenance, the stage 3 databank holdings are envis-aged to constitute as close to the raw data as possi-ble. Ideally data should be tracked as far back as thehard copy form on which the observation was firstrecorded. Sources for which such records are availableare given higher priority during the merge process. Inaddition, data rescued recently when the importanceof such provenance has been explicitly recognized are
given high priority. Other data given high preferenceduring merging include sources with monthly meanmaximum and minimum temperatures. This is pre-ferred over monthly mean temperature because theycan be directly used to calculate the monthly meanand because there is compelling evidence that manydata artefacts affect maximum and minimum differ-ently (Williams et al., 2012).
Using those principles (see Appendix A for a moredetailed description), 49 of 58 stage 2 sources wereprioritized (Table 9). Note that not all sources(Table 1) are used, due to either their inclusion inGHCN-D, or issues that arose over their data quality.GHCN-D was selected to be the highest priority, ortarget dataset, and the monthly dataset derived fromit is the starting point for the merge process. GHCN-D is regularly reconstructed, usually every weekend,from its 25-plus data sources to ensure it is generallyin sync with its growing list of constituent sources.Many of these sources are provided directly bynational holdings and include comprehensive contri-butions of daily holdings from the United States, Can-ada, and Australia as well as a number of other largeregional collections. (Menne et al., 2012). Further-more, since GHCN-D provides a backbone ofdaily maximum and minimum temperatures, it is alsoa logical dataset to develop a new daily mergeddataset in the future. This coherency betweenmonthly and daily datasets developed in the ISTI isimportant as finer temporal research questions areconsidered.
It is important to note that even though there is achosen source hierarchy, based on a set of priorities,other plausible hierarchies can be created. Someexperiments with different priority settings have beenrun and are described in Section 4.2. Other decisions
−5−4
−3
−2
−1
0
1
2
3
4
56
78
9
10
Dai
ly T
AV
G (
°C)
10 15 20 25 30Day of month
0 5
Timeseries of daily average temperature
Figure 4. Time series of daily average temperature for December 2011, taken from hourly observations from HadISD stationnumber 014150-99999 (STAVANGER/SOLA). Averages were calculated using the main standard times for surface synopticobservations (black), main and intermediate standard times (red), all hours available (blue), and the average of maximum andminimum (green).
Table 2. List of sources for stage 0 files.
Flag Description
101 Paper, NCDC102 Paper, JMA103 Paper, Australian BOM104 Paper, Met Service of New Zealand105 Paper, Royal Netherlands Meteorological
Institute (KNMI)201 Images, University Rovira i Virgili, Centre
for Climate Change301 Images, databank stage 0 FTP Site302 Images, EDADS website, NCDC303 Images, NOAA Library Website999 Missing/Unknown/Not applicable
8 J. J. Rennie et al.
ª 2014 The Authors.Geoscience Data Journal published by Royal Meteorological Society and John Wiley & Sons Ltd.Geoscience Data Journal (2014)

may lead to a different hierarchy and can alterthe result. Since the databank aims to be openand transparent, others are encouraged to evaluatethe hierarchies we have tried, establish their ownlist of preferred sources, run the source codeavailable online, and to make results available forcomparison.
2.2. Overall description of merge program
The merge process is accomplished in an iterativefashion, starting from the highest priority datasource (target) and running progressively throughthe other sources (candidates). The merge processis designed to be based upon metadata matchingand data equivalence criteria. A general overviewwork flow chart of the algorithm can be found inFigure 5. The algorithm was written so that the
Table 3. List of sources for stage 1 files.
Flag Description
100 NCDC International Collection101 High Plains Regional Climate Center, USA102 NCDC DSI-3200103 NCDC DSI-3206104 University Rovira i Virgili, Centre for Climate
Change, Spain105 NCDC CDMP Digital Archive106 Japan Meteorological Agency107 Met Service of New Zealand108 European Climate Assessment & Data Project109 University of Alabama: Huntsville110 Antarctic Meteorological Research Center111 Meteo France112 National Institute for Space Research (INPE), Brazil113 MeteoSwiss, Switzerland114 Nicholas Copernicus University IPY Collection,
Poland115 University of Melbourne, Australia116 Met Office, United Kingdon117 INIA (Instituto Nacional de Investigacion
Agropecuaria), Uruguay118 Australian BOM119 Environment Canada120 International Arctic Research Center: University of
Alaska, Fairbanks121 Central Institute for Meteorology and Geodynamics
(ZAMG), Austria122 National Snow and Ice Data Center (NSIDC), USA123 Instituto Nacional de Meteorologia e Hidrologia,
Ecuador124 Scientific Committee on Atmospheric Research125 Databank stage 2 Daily source (converted to
monthlies)126 Databank stage 3 Daily source (converted to
monthlies)127 Databank stage 4 Daily source (converted to
monthlies)128 States of Jersey Meteorological Department129 Meteo Russia (RIHMI–WDC)130 University of Giessen, Department of Geography,
Germany131 CISL Research Data Archive, USA132 INTA (National Institute of Agricultural
Technology), Argentina133 India Meteorological Department134 DWD (Deutscher Wetterdienst): Germany135 Universidad de la Republica, Montevideo, Uruguay136 Norwegian Meteorological Institute999 Missing/Unknown/Not applicable
Table 4. List of type of data sent by source.
Flag Description
101 Raw102 Quality controlled by originator103 Homogenized by originator999 Missing/Unknown/Not applicable
Table 5. List of methods of digitization of data.
Flag Description
101 Keyed, Source Corp102 Keyed, CDMP103 Keyed, CDMP Forts Project104 Keyed, Local originator000 Auto collect999 Missing/Unknown
Table 6. List of methods of calculating hourly data intodaily.
Flag Description
101 Data values original102 Daily value calculated from main standard synoptic
observations (00,06,12,18 UTC)103 Daily value calculated from main and intermediate
synoptic observations (00,03,06,09,12,15,18,21UTC)
104 Daily value calculated from other sub-dailyobservations (at least 3 obs available)
105 Daily value calculated from other sub-dailyobservations (at least 20 obs available)
999 Missing/Unknown/Not applicable
Table 7. List of methods for calculating daily data intomonthly.
Flag Description
000 Data values original001–031 Monthly value calculated from daily average
(number indicates number of days available)999 Missing/Unknown/Not Applicable
Version 1 release of global land surface databank 9
ª 2014 The Authors.Geoscience Data Journal published by Royal Meteorological Society and John Wiley & Sons Ltd. Geoscience Data Journal (2014)
entire program is fully automated. The highestsource is read in and compared to the source ofnext lower priority. Every candidate station is com-pared to all target stations, and one of three possi-ble decisions is made. First, when a station match isfound the candidate station is merged with the tar-get station. Second, if the candidate station is deter-mined to be unique it is added to the targetdataset as a new station. Third, the available infor-mation is insufficient, conflicting, or ambiguous, andthe candidate station is withheld. After all stations inthe two sources are tested and combined into anew merged source dataset, the process thenapplies the same tests using the next lower rankedsource in the priority hierarchy. Due to heavy com-putational requirements required for the algorithm torun, the code was written in FORTRAN 95. As withother software used to develop the databank, it ismade available on the databank ftp site, along withaccess to a free compiler.
2.3. Station error checking
When a candidate station is first read in, it ischecked against a list of stations with known issuesin its data and metadata. If this step is not per-formed, stations with erroneous information maytamper results, or even be incorrectly recognized asunique. For example, a station having correct meta-data in one source but having the sign of latitudeaccidentally flipped in another may be classified astwo distinct stations. When a candidate station isfound in this list, one of two options can occur.Either the metadata is changed to reflect the correctinformation (whitelisting), or the station is withheld(blacklisting).
To generate this list, three distinct analyses wererun to test the validity of a station’s metadata anddata. First, a running decadal statistical test lookedfor large shifts in the candidate stations variance.There were times where a station reported in Fahren-heit during one period, and Celsius in another, creat-ing an unnatural shift. If detected, the station isblacklisted and withheld from the algorithm. Second,
a distance versus correlation check on all stationsfound cases where collocated stations (less than10 km) had high correlations (greater than 0.90),plausibly creating duplicate stations. Conversely, ifstations were highly correlated, but with large dis-tances (greater than 1000 km), it was possibly thesame station, but with incorrect metadata, creatingduplication. A third test included a land sea mask,whereby using a high-resolution gridded dataset,land-based stations whose metadata placed it in themiddle of the ocean were flagged. For the last twotests, stations were whitelisted to reflect the correctmetadata using information from either NCDC or theWMO.
2.4. Metadata comparisons (TMAX and TMIN)
Once error checking is completed, each candidatestation is run through all the target stations and fourmetadata criteria calculated as the first test toidentify matching stations. This process takes intoaccount the likelihood that the same station fromtwo sources may have different precision values forlongitude, latitude, and elevation between sources.The station names may also differ, particularly forcountries that were once colonial and have subse-quently gained independence, or the phonetic spell-ing of names that may differ by source.
Using the latitudes and longitudes, the geographicaldistance between the two stations is computed. Thedistance is then fitted to an exponential decay function(which decays to nearly zero at 100 km distance), anda metric between the two stations is determined,where 0 corresponds to no match and 1 represents aperfect match. Next, the same approach is performedusing the height difference between two stations (herethe exponential decays to nearly zero at 500 m heightdifference). Third, a comparison of when the datarecord began is made. Although not always the case,there is a higher chance the candidate station matcheswith a target station if they start at or near the sameyear. Therefore an exponential decay function isapplied if the start years fall within 10 years of eachother. Finally, the similarity of the station name is con-sidered. This is done using the Jaccard Index (JI) (Jac-card, 1901), which is defined as the intersectiondivided by the union of two sample sets, A and B:
JI ¼ jA \ BjjA [ Bj
In other words, JI will look for cases in which cer-tain letters exist in both station names, as well as thenumber of times letters occur in one name, but not inthe other. Once the ratio is known, a probability is cal-culated. One drawback to JI is that it does not takeinto account the position of the character within theword. Therefore anagrams (i.e. TOKYO and KYOTO)would have a perfect JI of 1.
Table 8. List of methods of transmission of data to ISTI.
Flag Description
101 Mail102 E-Mail103 FTP104 SRRS FTP105 NOAA port106 NMHS web service107 Telephone modem108 Direct Datalogger download/PDA109 Other satellite999 Unknown
10 J. J. Rennie et al.
ª 2014 The Authors.Geoscience Data Journal published by Royal Meteorological Society and John Wiley & Sons Ltd.Geoscience Data Journal (2014)
Each individual metadata criteria has a value from 0to 1, which are then combined to form a posterior
metric of possible station match, known as the meta-data metric.
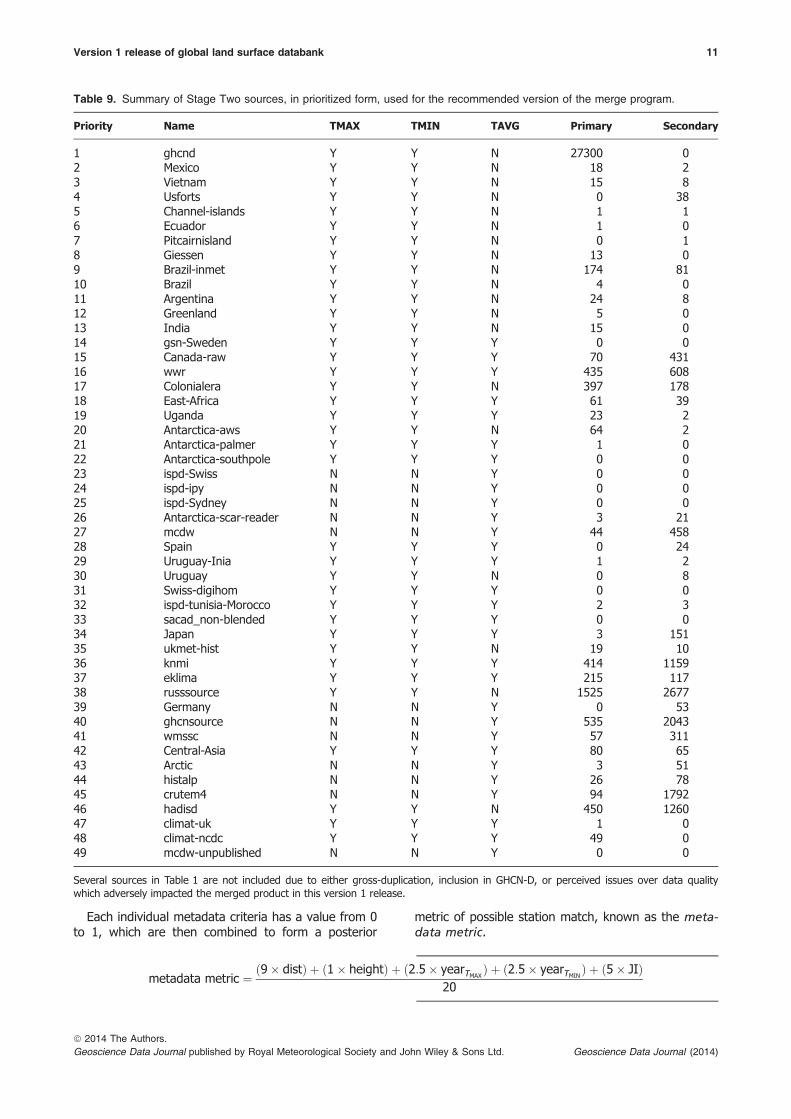
Table 9. Summary of Stage Two sources, in prioritized form, used for the recommended version of the merge program.
Priority Name TMAX TMIN TAVG Primary Secondary
1 ghcnd Y Y N 27300 02 Mexico Y Y N 18 23 Vietnam Y Y N 15 84 Usforts Y Y N 0 385 Channel-islands Y Y N 1 16 Ecuador Y Y N 1 07 Pitcairnisland Y Y N 0 18 Giessen Y Y N 13 09 Brazil-inmet Y Y N 174 8110 Brazil Y Y N 4 011 Argentina Y Y N 24 812 Greenland Y Y N 5 013 India Y Y N 15 014 gsn-Sweden Y Y Y 0 015 Canada-raw Y Y Y 70 43116 wwr Y Y Y 435 60817 Colonialera Y Y N 397 17818 East-Africa Y Y Y 61 3919 Uganda Y Y Y 23 220 Antarctica-aws Y Y N 64 221 Antarctica-palmer Y Y Y 1 022 Antarctica-southpole Y Y Y 0 023 ispd-Swiss N N Y 0 024 ispd-ipy N N Y 0 025 ispd-Sydney N N Y 0 026 Antarctica-scar-reader N N Y 3 2127 mcdw N N Y 44 45828 Spain Y Y Y 0 2429 Uruguay-Inia Y Y Y 1 230 Uruguay Y Y N 0 831 Swiss-digihom Y Y Y 0 032 ispd-tunisia-Morocco Y Y Y 2 333 sacad_non-blended Y Y Y 0 034 Japan Y Y Y 3 15135 ukmet-hist Y Y N 19 1036 knmi Y Y Y 414 115937 eklima Y Y Y 215 11738 russsource Y Y N 1525 267739 Germany N N Y 0 5340 ghcnsource N N Y 535 204341 wmssc N N Y 57 31142 Central-Asia Y Y Y 80 6543 Arctic N N Y 3 5144 histalp N N Y 26 7845 crutem4 N N Y 94 179246 hadisd Y Y N 450 126047 climat-uk Y Y Y 1 048 climat-ncdc Y Y Y 49 049 mcdw-unpublished N N Y 0 0
Several sources in Table 1 are not included due to either gross-duplication, inclusion in GHCN-D, or perceived issues over data qualitywhich adversely impacted the merged product in this version 1 release.
metadata metric ¼ ð9� distÞ þ ð1� heightÞ þ ð2:5� yearTMAXÞ þ ð2:5� yearTMIN
Þ þ ð5� JIÞ20
Version 1 release of global land surface databank 11
ª 2014 The Authors.Geoscience Data Journal published by Royal Meteorological Society and John Wiley & Sons Ltd. Geoscience Data Journal (2014)
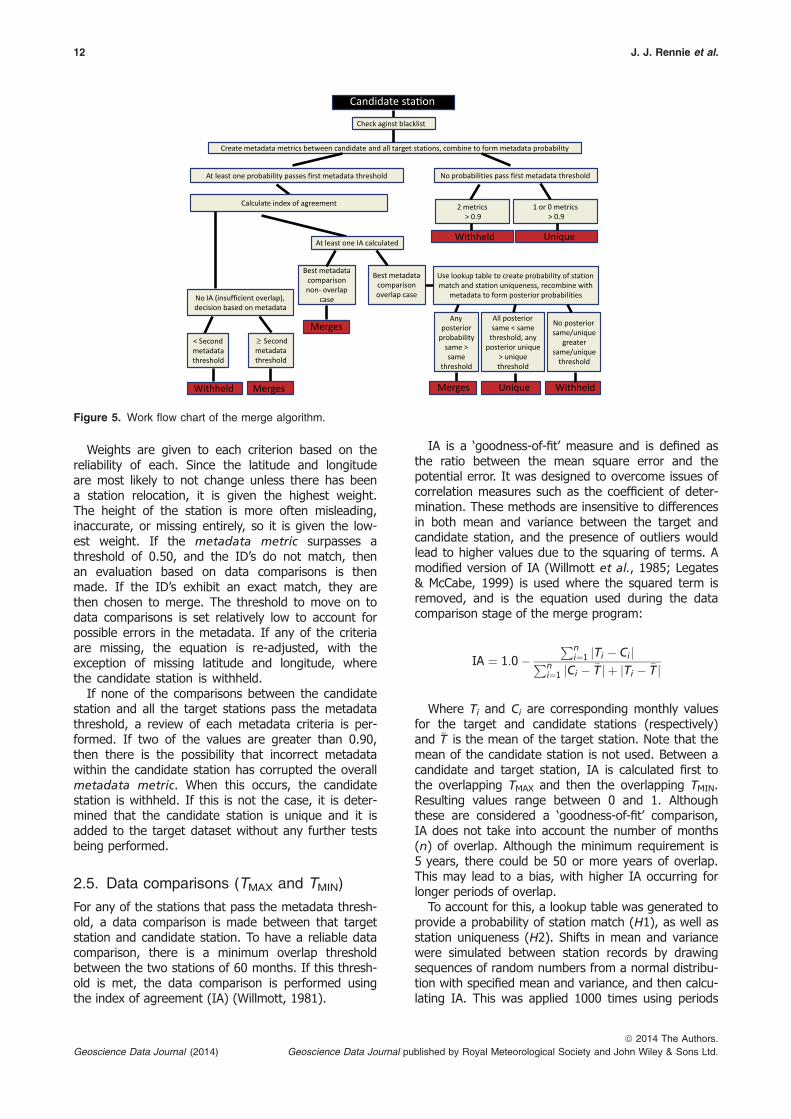
Weights are given to each criterion based on thereliability of each. Since the latitude and longitudeare most likely to not change unless there has beena station relocation, it is given the highest weight.The height of the station is more often misleading,inaccurate, or missing entirely, so it is given the low-est weight. If the metadata metric surpasses athreshold of 0.50, and the ID’s do not match, thenan evaluation based on data comparisons is thenmade. If the ID’s exhibit an exact match, they arethen chosen to merge. The threshold to move on todata comparisons is set relatively low to account forpossible errors in the metadata. If any of the criteriaare missing, the equation is re-adjusted, with theexception of missing latitude and longitude, wherethe candidate station is withheld.
If none of the comparisons between the candidatestation and all the target stations pass the metadatathreshold, a review of each metadata criteria is per-formed. If two of the values are greater than 0.90,then there is the possibility that incorrect metadatawithin the candidate station has corrupted the overallmetadata metric. When this occurs, the candidatestation is withheld. If this is not the case, it is deter-mined that the candidate station is unique and it isadded to the target dataset without any further testsbeing performed.
2.5. Data comparisons (TMAX and TMIN)
For any of the stations that pass the metadata thresh-old, a data comparison is made between that targetstation and candidate station. To have a reliable datacomparison, there is a minimum overlap thresholdbetween the two stations of 60 months. If this thresh-old is met, the data comparison is performed usingthe index of agreement (IA) (Willmott, 1981).
IA is a ‘goodness-of-fit’ measure and is defined asthe ratio between the mean square error and thepotential error. It was designed to overcome issues ofcorrelation measures such as the coefficient of deter-mination. These methods are insensitive to differencesin both mean and variance between the target andcandidate station, and the presence of outliers wouldlead to higher values due to the squaring of terms. Amodified version of IA (Willmott et al., 1985; Legates& McCabe, 1999) is used where the squared term isremoved, and is the equation used during the datacomparison stage of the merge program:
IA ¼ 1:0�Pn
i¼1 jTi � CijPn
i¼1 jCi � �T j þ jTi � �T j
Where Ti and Ci are corresponding monthly valuesfor the target and candidate stations (respectively)and �T is the mean of the target station. Note that themean of the candidate station is not used. Between acandidate and target station, IA is calculated first tothe overlapping TMAX and then the overlapping TMIN.Resulting values range between 0 and 1. Althoughthese are considered a ‘goodness-of-fit’ comparison,IA does not take into account the number of months(n) of overlap. Although the minimum requirement is5 years, there could be 50 or more years of overlap.This may lead to a bias, with higher IA occurring forlonger periods of overlap.
To account for this, a lookup table was generated toprovide a probability of station match (H1), as well asstation uniqueness (H2). Shifts in mean and variancewere simulated between station records by drawingsequences of random numbers from a normal distribu-tion with specified mean and variance, and then calcu-lating IA. This was applied 1000 times using periods
Candidate sta on
Withheld Unique
Unique
Check aginst blacklist
Create
At
At
Be Be
Any All No
Use
Calculate
No
No
< S
Withheld WithheldMerges
Merges
Merges
Figure 5. Work flow chart of the merge algorithm.
12 J. J. Rennie et al.
ª 2014 The Authors.Geoscience Data Journal published by Royal Meteorological Society and John Wiley & Sons Ltd.Geoscience Data Journal (2014)
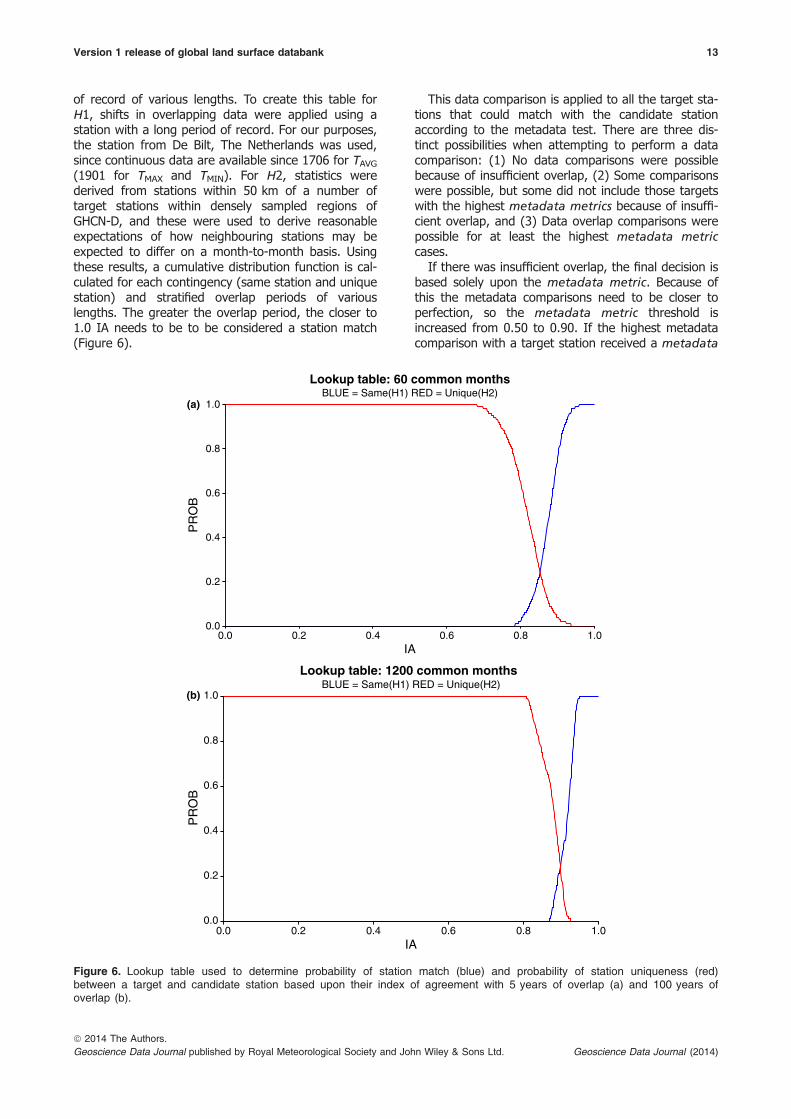
of record of various lengths. To create this table forH1, shifts in overlapping data were applied using astation with a long period of record. For our purposes,the station from De Bilt, The Netherlands was used,since continuous data are available since 1706 for TAVG(1901 for TMAX and TMIN). For H2, statistics werederived from stations within 50 km of a number oftarget stations within densely sampled regions ofGHCN-D, and these were used to derive reasonableexpectations of how neighbouring stations may beexpected to differ on a month-to-month basis. Usingthese results, a cumulative distribution function is cal-culated for each contingency (same station and uniquestation) and stratified overlap periods of variouslengths. The greater the overlap period, the closer to1.0 IA needs to be to be considered a station match(Figure 6).
This data comparison is applied to all the target sta-tions that could match with the candidate stationaccording to the metadata test. There are three dis-tinct possibilities when attempting to perform a datacomparison: (1) No data comparisons were possiblebecause of insufficient overlap, (2) Some comparisonswere possible, but some did not include those targetswith the highest metadata metrics because of insuffi-cient overlap, and (3) Data overlap comparisons werepossible for at least the highest metadata metriccases.
If there was insufficient overlap, the final decision isbased solely upon the metadata metric. Because ofthis the metadata comparisons need to be closer toperfection, so the metadata metric threshold isincreased from 0.50 to 0.90. If the highest metadatacomparison with a target station received a metadata
0.0
0.2
0.4
0.6
0.8
1.0
PR
OB
0.0 0.2 0.4 0.6 0.8 1.0IA
Lookup table: 1200 common monthsBLUE = Same(H1) RED = Unique(H2)
0.0
0.2
0.4
0.6
0.8
1.0
PR
OB
0.0 0.2 0.4 0.6 0.8 1.0IA
Lookup table: 60 common monthsBLUE = Same(H1) RED = Unique(H2)
(a)
(b)
Figure 6. Lookup table used to determine probability of station match (blue) and probability of station uniqueness (red)between a target and candidate station based upon their index of agreement with 5 years of overlap (a) and 100 years ofoverlap (b).
Version 1 release of global land surface databank 13
ª 2014 The Authors.Geoscience Data Journal published by Royal Meteorological Society and John Wiley & Sons Ltd. Geoscience Data Journal (2014)
metric larger than this new threshold, then the candi-date station merges with that station. Otherwise it iswithheld.
There are also cases where data comparisons weremade, but the metadata metric of a non-overlappingstation was higher than for any of the stations thathad a data overlap. This can occur in areas with adense network of stations. If this is found to be true,then that candidate station is merged with the non-overlapping target station.
Otherwise there are five resulting metrics, onemetadata metric, and four data metrics (tests for sta-tion match and uniqueness, for both TMAX and TMIN).These prior metrics are then recombined to form twonew posterior metrics, one of station match, and oneof station uniqueness. The unique equation was struc-tured so it favours a lower metadata metric (near0.50), and because it is not weighted, this value canrange between 0 and 2.50.
Once these posterior metrics are made for all possi-ble comparisons between a candidate station and itstarget stations, thresholds are set for station matchand uniqueness (0.50 and 1.30 respectively) to deter-mine the final fate of the candidate station. If any ofthe values returned for posterior metric same exceedthe same threshold of 0.50, then the candidate stationis merged with the target station with the highest pos-
terior metric same. If none of the stations exceedthat threshold, but one of the posterior metricunique values exceeds the unique threshold, then thecandidate station becomes unique and is added to thetarget dataset. If no metrics pass either threshold,then the station is withheld.
If merging of data is performed, only data from thecandidate station not already in the target stationrecord are added to create the new merged record. Ifdata occur for both the candidate station and the tar-get station, preference is always given to the target,since it contains data that were higher in the priori-tized list. The merging appends data from the candi-date to the target to create a single, extended,record. No candidate data are inserted into the middleof the target series unless they could fill a string of atleast five consecutive years of missing data. This isdone to better ensure sufficient record length fordetecting inhomogeneities that may result from com-
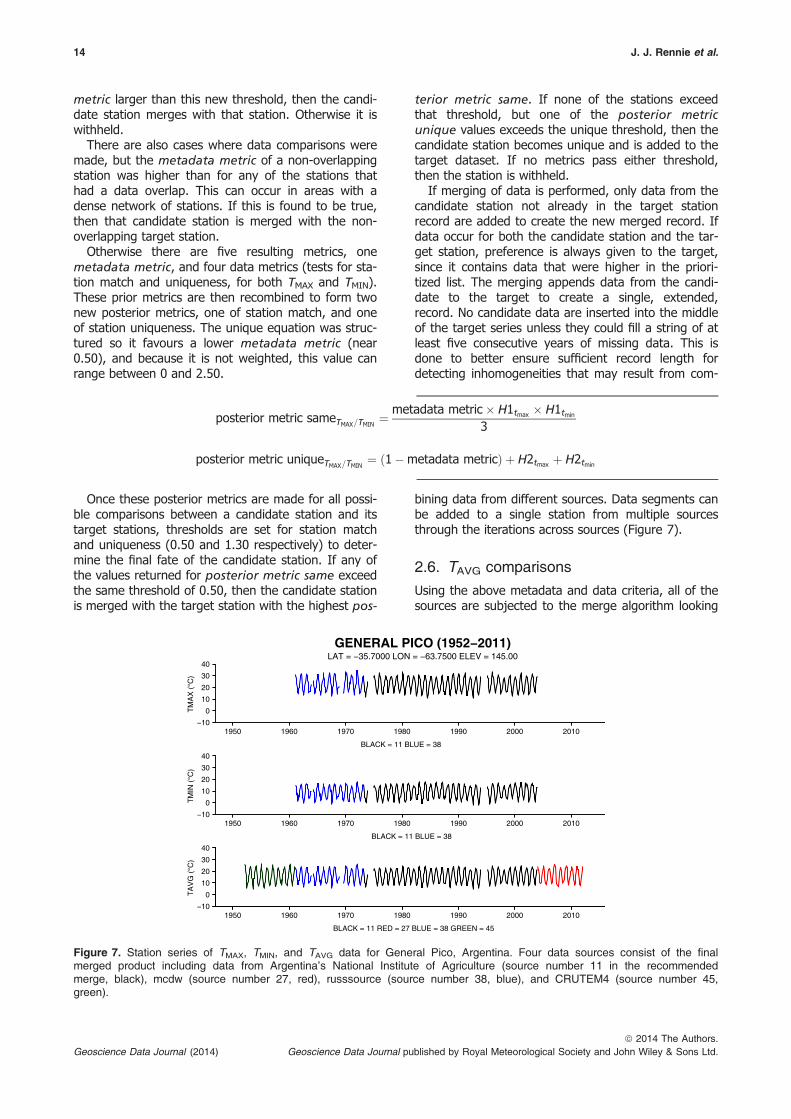
bining data from different sources. Data segments canbe added to a single station from multiple sourcesthrough the iterations across sources (Figure 7).
2.6. TAVG comparisons
Using the above metadata and data criteria, all of thesources are subjected to the merge algorithm looking
posterior metric sameTMAX=TMIN¼ metadata metric� H1tmax � H1tmin
3
posterior metric uniqueTMAX=TMIN¼ ð1�metadata metricÞ þ H2tmax þ H2tmin
−10
0
10
20
30
40
TA
VG
(°C
)
1950 1960 1970 1980 1990 2000 2010
BLACK = 11 RED = 27 BLUE = 38 GREEN = 45
−10
0
10
20
30
40
TM
IN (
°C)
1950 1960 1970 1980 1990 2000 2010
BLACK = 11 BLUE = 38
−10
0
10
20
30
40
TM
AX
(°C
)
1950 1960 1970 1980 1990 2000 2010
BLACK = 11 BLUE = 38
GENERAL PICO (1952−2011)LAT = −35.7000 LON = −63.7500 ELEV = 145.00
Figure 7. Station series of TMAX, TMIN, and TAVG data for General Pico, Argentina. Four data sources consist of the finalmerged product including data from Argentina’s National Institute of Agriculture (source number 11 in the recommendedmerge, black), mcdw (source number 27, red), russsource (source number 38, blue), and CRUTEM4 (source number 45,green).
14 J. J. Rennie et al.
ª 2014 The Authors.Geoscience Data Journal published by Royal Meteorological Society and John Wiley & Sons Ltd.Geoscience Data Journal (2014)
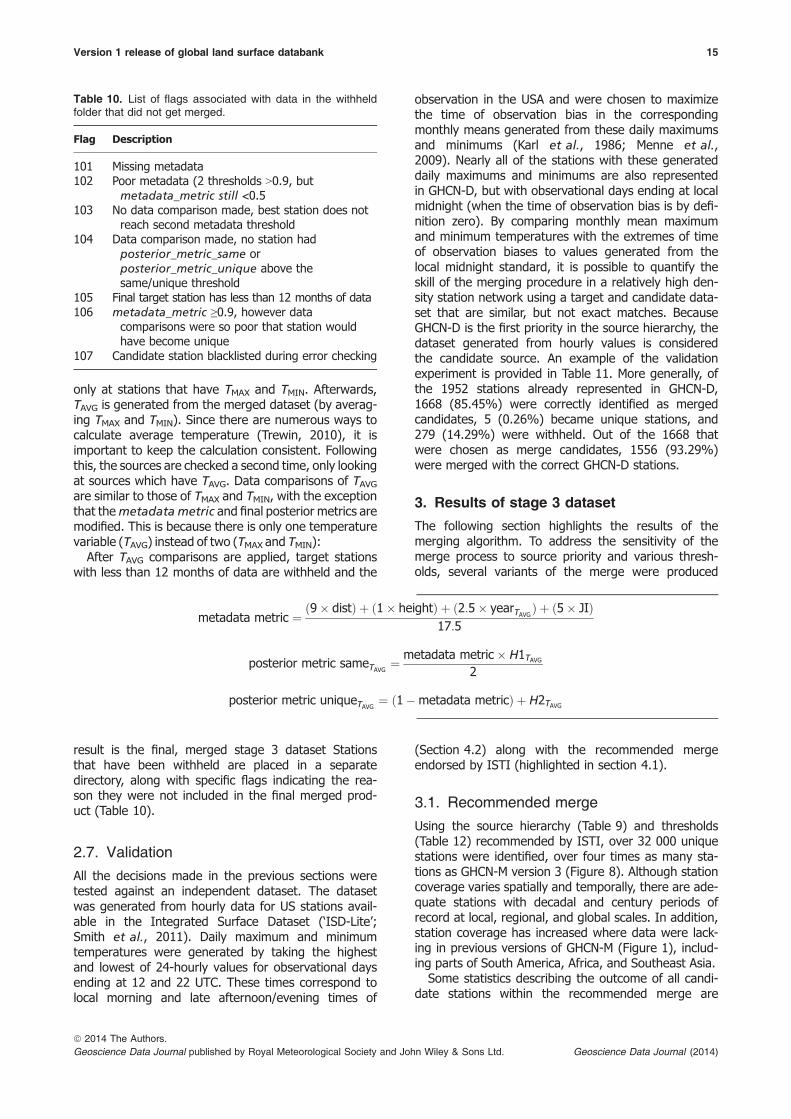
only at stations that have TMAX and TMIN. Afterwards,TAVG is generated from the merged dataset (by averag-ing TMAX and TMIN). Since there are numerous ways tocalculate average temperature (Trewin, 2010), it isimportant to keep the calculation consistent. Followingthis, the sources are checked a second time, only lookingat sources which have TAVG. Data comparisons of TAVGare similar to those of TMAX and TMIN, with the exceptionthat themetadata metric and final posterior metrics aremodified. This is because there is only one temperaturevariable (TAVG) instead of two (TMAX and TMIN):
After TAVG comparisons are applied, target stationswith less than 12 months of data are withheld and the
result is the final, merged stage 3 dataset Stationsthat have been withheld are placed in a separatedirectory, along with specific flags indicating the rea-son they were not included in the final merged prod-uct (Table 10).
2.7. Validation
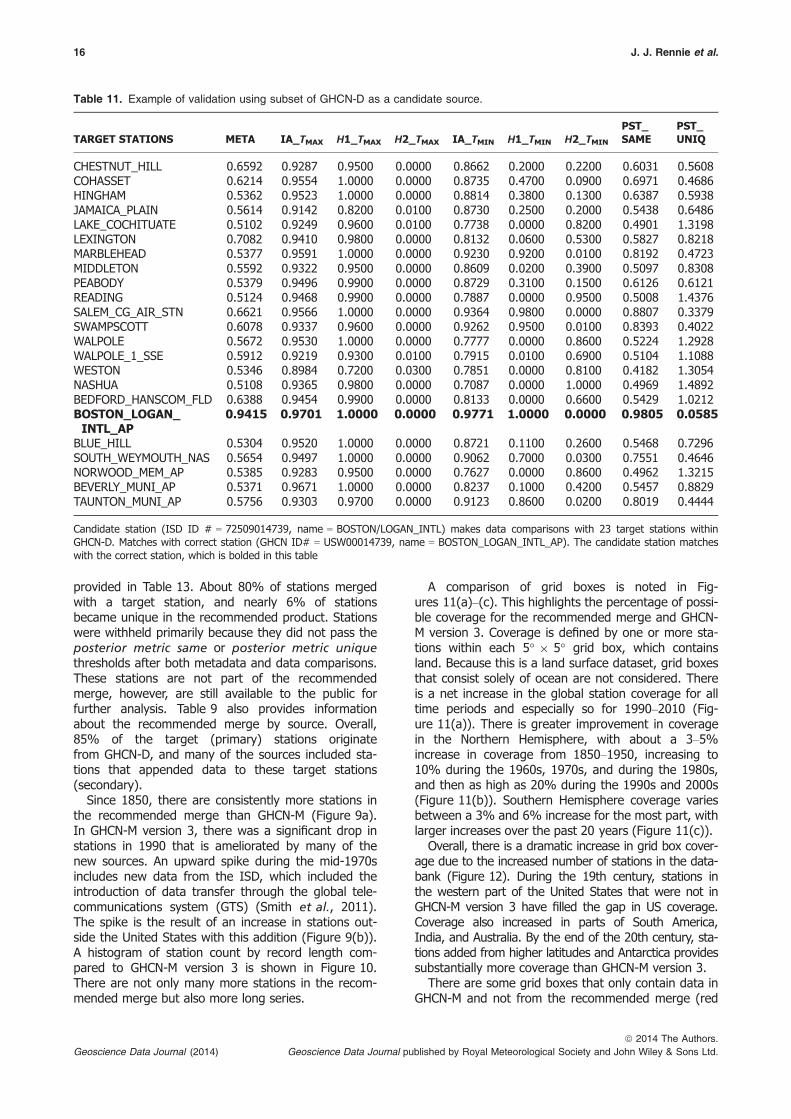
All the decisions made in the previous sections weretested against an independent dataset. The datasetwas generated from hourly data for US stations avail-able in the Integrated Surface Dataset (‘ISD-Lite’;Smith et al., 2011). Daily maximum and minimumtemperatures were generated by taking the highestand lowest of 24-hourly values for observational daysending at 12 and 22 UTC. These times correspond tolocal morning and late afternoon/evening times of
observation in the USA and were chosen to maximizethe time of observation bias in the correspondingmonthly means generated from these daily maximumsand minimums (Karl et al., 1986; Menne et al.,2009). Nearly all of the stations with these generateddaily maximums and minimums are also representedin GHCN-D, but with observational days ending at localmidnight (when the time of observation bias is by defi-nition zero). By comparing monthly mean maximumand minimum temperatures with the extremes of timeof observation biases to values generated from thelocal midnight standard, it is possible to quantify theskill of the merging procedure in a relatively high den-sity station network using a target and candidate data-set that are similar, but not exact matches. BecauseGHCN-D is the first priority in the source hierarchy, thedataset generated from hourly values is consideredthe candidate source. An example of the validationexperiment is provided in Table 11. More generally, ofthe 1952 stations already represented in GHCN-D,1668 (85.45%) were correctly identified as mergedcandidates, 5 (0.26%) became unique stations, and279 (14.29%) were withheld. Out of the 1668 thatwere chosen as merge candidates, 1556 (93.29%)were merged with the correct GHCN-D stations.
3. Results of stage 3 dataset
The following section highlights the results of themerging algorithm. To address the sensitivity of themerge process to source priority and various thresh-olds, several variants of the merge were produced
(Section 4.2) along with the recommended mergeendorsed by ISTI (highlighted in section 4.1).
3.1. Recommended merge
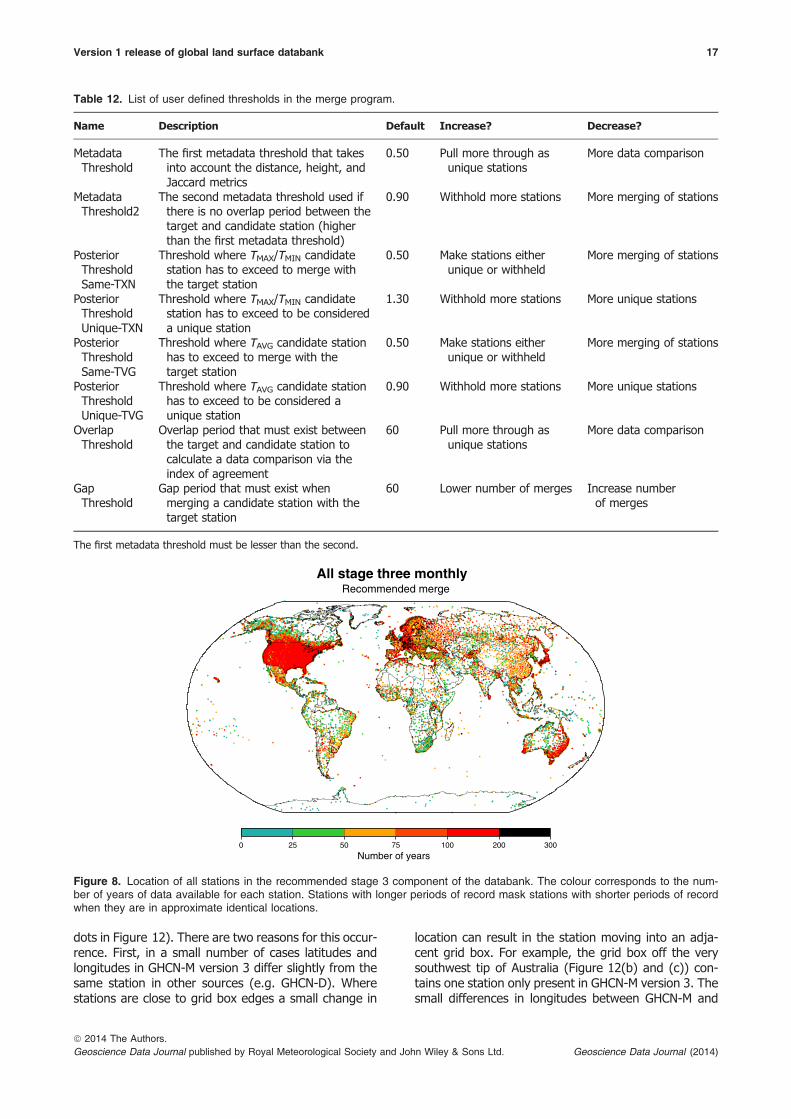
Using the source hierarchy (Table 9) and thresholds(Table 12) recommended by ISTI, over 32 000 uniquestations were identified, over four times as many sta-tions as GHCN-M version 3 (Figure 8). Although stationcoverage varies spatially and temporally, there are ade-quate stations with decadal and century periods ofrecord at local, regional, and global scales. In addition,station coverage has increased where data were lack-ing in previous versions of GHCN-M (Figure 1), includ-ing parts of South America, Africa, and Southeast Asia.
Some statistics describing the outcome of all candi-date stations within the recommended merge are
metadata metric ¼ ð9� distÞ þ ð1� heightÞ þ ð2:5� yearTAVGÞ þ ð5� JIÞ17:5
posterior metric sameTAVG ¼ metadata metric� H1TAVG2
posterior metric uniqueTAVG ¼ ð1�metadata metricÞ þ H2TAVG
Table 10. List of flags associated with data in the withheldfolder that did not get merged.
Flag Description
101 Missing metadata102 Poor metadata (2 thresholds >0.9, but
metadata_metric still <0.5103 No data comparison made, best station does not
reach second metadata threshold104 Data comparison made, no station had
posterior_metric_same orposterior_metric_unique above thesame/unique threshold
105 Final target station has less than 12 months of data106 metadata_metric ≥0.9, however data
comparisons were so poor that station wouldhave become unique
107 Candidate station blacklisted during error checking
Version 1 release of global land surface databank 15
ª 2014 The Authors.Geoscience Data Journal published by Royal Meteorological Society and John Wiley & Sons Ltd. Geoscience Data Journal (2014)
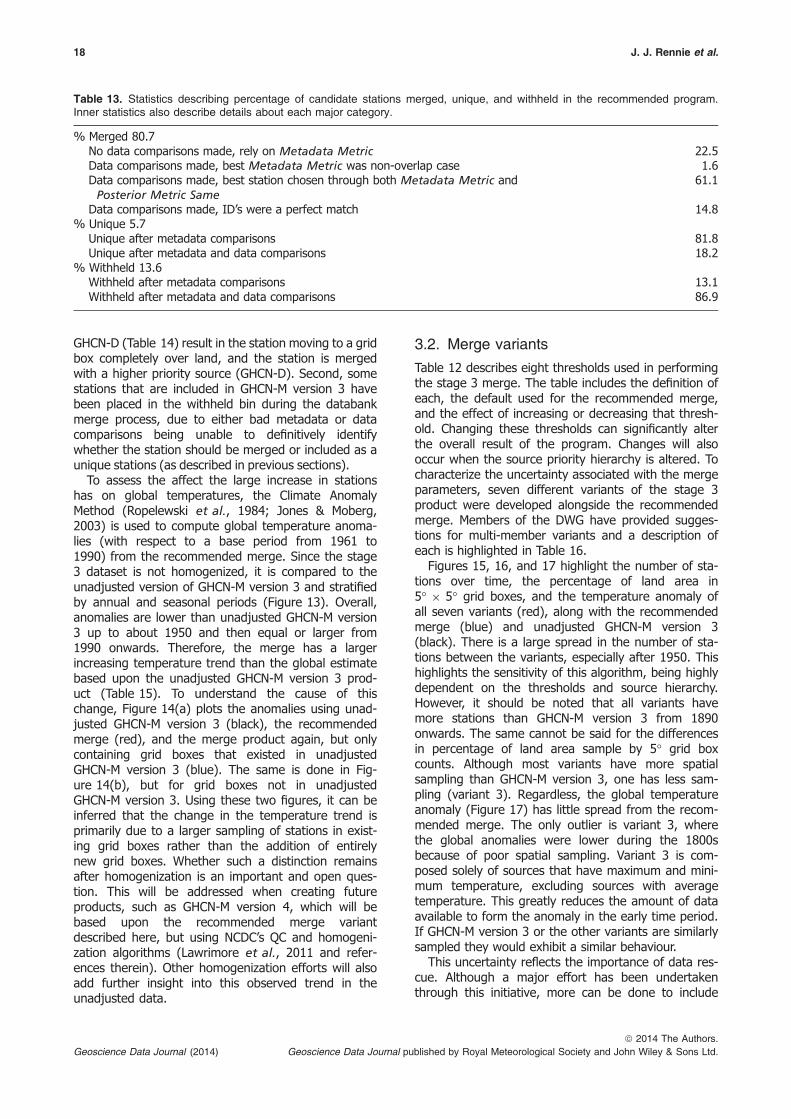
provided in Table 13. About 80% of stations mergedwith a target station, and nearly 6% of stationsbecame unique in the recommended product. Stationswere withheld primarily because they did not pass theposterior metric same or posterior metric uniquethresholds after both metadata and data comparisons.These stations are not part of the recommendedmerge, however, are still available to the public forfurther analysis. Table 9 also provides informationabout the recommended merge by source. Overall,85% of the target (primary) stations originatefrom GHCN-D, and many of the sources included sta-tions that appended data to these target stations(secondary).
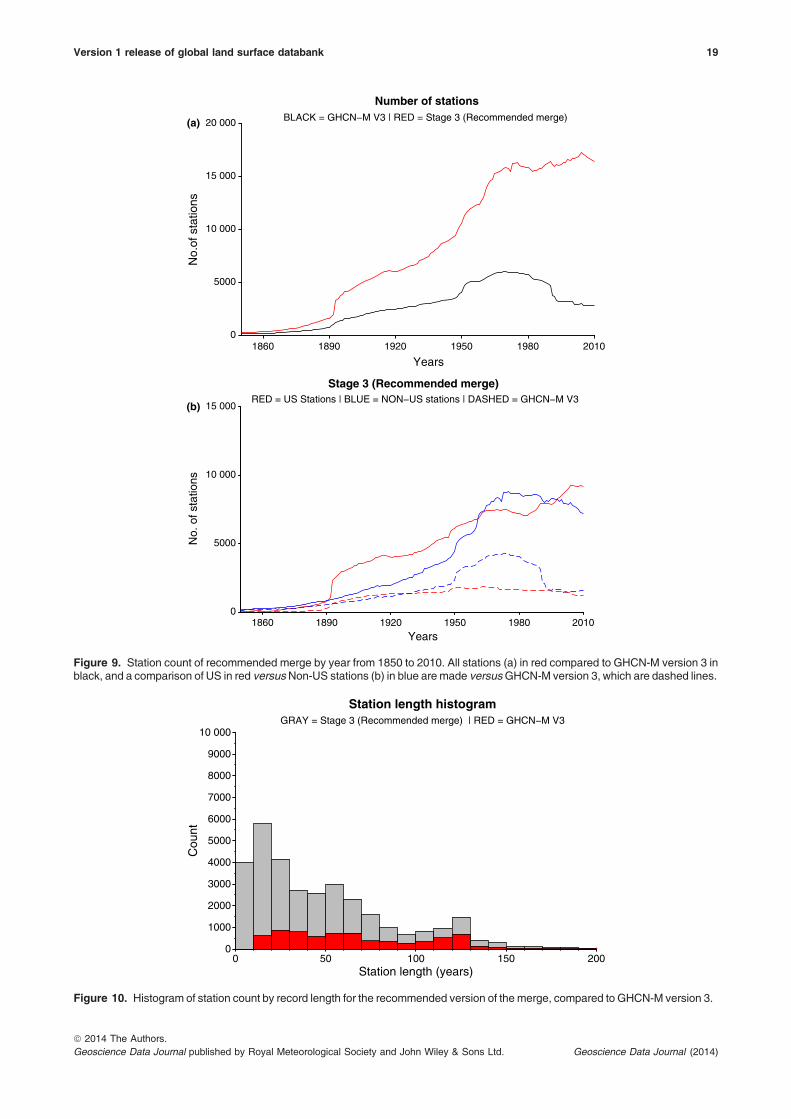
Since 1850, there are consistently more stations inthe recommended merge than GHCN-M (Figure 9a).In GHCN-M version 3, there was a significant drop instations in 1990 that is ameliorated by many of thenew sources. An upward spike during the mid-1970sincludes new data from the ISD, which included theintroduction of data transfer through the global tele-communications system (GTS) (Smith et al., 2011).The spike is the result of an increase in stations out-side the United States with this addition (Figure 9(b)).A histogram of station count by record length com-pared to GHCN-M version 3 is shown in Figure 10.There are not only many more stations in the recom-mended merge but also more long series.
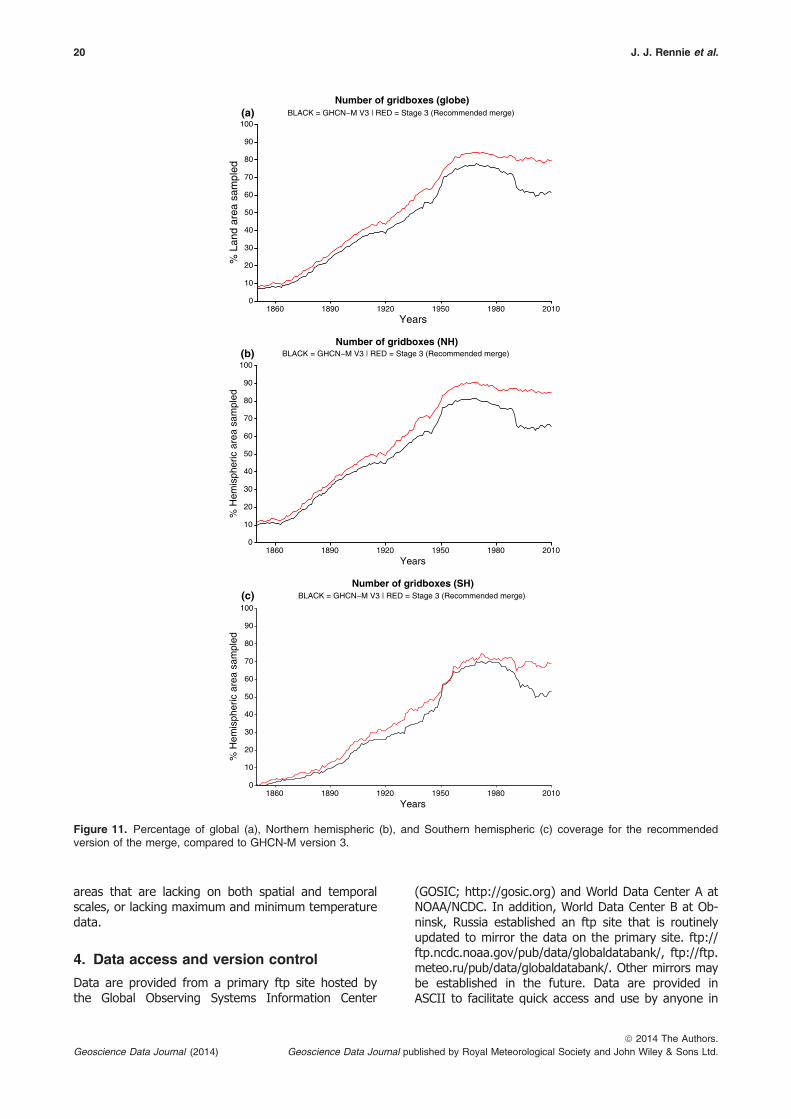
A comparison of grid boxes is noted in Fig-ures 11(a)–(c). This highlights the percentage of possi-ble coverage for the recommended merge and GHCN-M version 3. Coverage is defined by one or more sta-tions within each 5° 9 5° grid box, which containsland. Because this is a land surface dataset, grid boxesthat consist solely of ocean are not considered. Thereis a net increase in the global station coverage for alltime periods and especially so for 1990–2010 (Fig-ure 11(a)). There is greater improvement in coveragein the Northern Hemisphere, with about a 3–5%increase in coverage from 1850–1950, increasing to10% during the 1960s, 1970s, and during the 1980s,and then as high as 20% during the 1990s and 2000s(Figure 11(b)). Southern Hemisphere coverage variesbetween a 3% and 6% increase for the most part, withlarger increases over the past 20 years (Figure 11(c)).
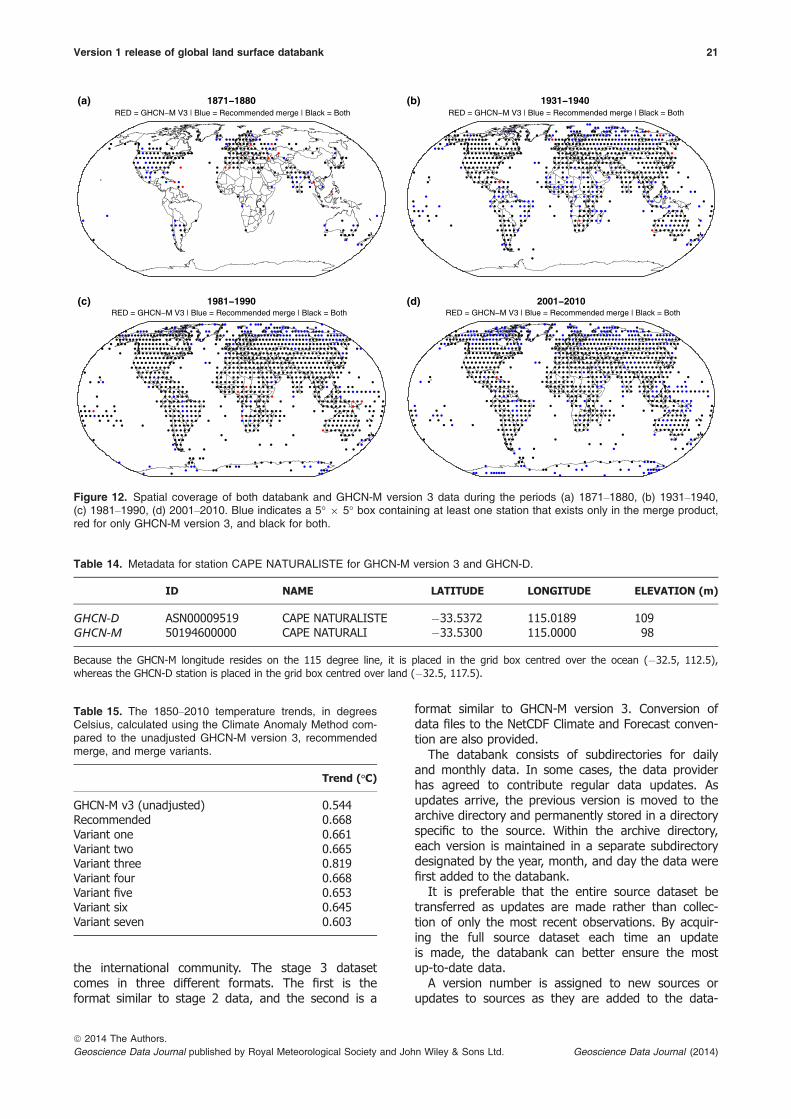
Overall, there is a dramatic increase in grid box cover-age due to the increased number of stations in the data-bank (Figure 12). During the 19th century, stations inthe western part of the United States that were not inGHCN-M version 3 have filled the gap in US coverage.Coverage also increased in parts of South America,India, and Australia. By the end of the 20th century, sta-tions added from higher latitudes and Antarctica providessubstantially more coverage than GHCN-M version 3.
There are some grid boxes that only contain data inGHCN-M and not from the recommended merge (red
Table 11. Example of validation using subset of GHCN-D as a candidate source.
TARGET STATIONS META IA_TMAX H1_TMAX H2_TMAX IA_TMIN H1_TMIN H2_TMIN
PST_SAME
PST_UNIQ
CHESTNUT_HILL 0.6592 0.9287 0.9500 0.0000 0.8662 0.2000 0.2200 0.6031 0.5608COHASSET 0.6214 0.9554 1.0000 0.0000 0.8735 0.4700 0.0900 0.6971 0.4686HINGHAM 0.5362 0.9523 1.0000 0.0000 0.8814 0.3800 0.1300 0.6387 0.5938JAMAICA_PLAIN 0.5614 0.9142 0.8200 0.0100 0.8730 0.2500 0.2000 0.5438 0.6486LAKE_COCHITUATE 0.5102 0.9249 0.9600 0.0100 0.7738 0.0000 0.8200 0.4901 1.3198LEXINGTON 0.7082 0.9410 0.9800 0.0000 0.8132 0.0600 0.5300 0.5827 0.8218MARBLEHEAD 0.5377 0.9591 1.0000 0.0000 0.9230 0.9200 0.0100 0.8192 0.4723MIDDLETON 0.5592 0.9322 0.9500 0.0000 0.8609 0.0200 0.3900 0.5097 0.8308PEABODY 0.5379 0.9496 0.9900 0.0000 0.8729 0.3100 0.1500 0.6126 0.6121READING 0.5124 0.9468 0.9900 0.0000 0.7887 0.0000 0.9500 0.5008 1.4376SALEM_CG_AIR_STN 0.6621 0.9566 1.0000 0.0000 0.9364 0.9800 0.0000 0.8807 0.3379SWAMPSCOTT 0.6078 0.9337 0.9600 0.0000 0.9262 0.9500 0.0100 0.8393 0.4022WALPOLE 0.5672 0.9530 1.0000 0.0000 0.7777 0.0000 0.8600 0.5224 1.2928WALPOLE_1_SSE 0.5912 0.9219 0.9300 0.0100 0.7915 0.0100 0.6900 0.5104 1.1088WESTON 0.5346 0.8984 0.7200 0.0300 0.7851 0.0000 0.8100 0.4182 1.3054NASHUA 0.5108 0.9365 0.9800 0.0000 0.7087 0.0000 1.0000 0.4969 1.4892BEDFORD_HANSCOM_FLD 0.6388 0.9454 0.9900 0.0000 0.8133 0.0000 0.6600 0.5429 1.0212BOSTON_LOGAN_INTL_AP
0.9415 0.9701 1.0000 0.0000 0.9771 1.0000 0.0000 0.9805 0.0585
BLUE_HILL 0.5304 0.9520 1.0000 0.0000 0.8721 0.1100 0.2600 0.5468 0.7296SOUTH_WEYMOUTH_NAS 0.5654 0.9497 1.0000 0.0000 0.9062 0.7000 0.0300 0.7551 0.4646NORWOOD_MEM_AP 0.5385 0.9283 0.9500 0.0000 0.7627 0.0000 0.8600 0.4962 1.3215BEVERLY_MUNI_AP 0.5371 0.9671 1.0000 0.0000 0.8237 0.1000 0.4200 0.5457 0.8829TAUNTON_MUNI_AP 0.5756 0.9303 0.9700 0.0000 0.9123 0.8600 0.0200 0.8019 0.4444
Candidate station (ISD ID # = 72509014739, name = BOSTON/LOGAN_INTL) makes data comparisons with 23 target stations withinGHCN-D. Matches with correct station (GHCN ID# = USW00014739, name = BOSTON_LOGAN_INTL_AP). The candidate station matcheswith the correct station, which is bolded in this table
16 J. J. Rennie et al.
ª 2014 The Authors.Geoscience Data Journal published by Royal Meteorological Society and John Wiley & Sons Ltd.Geoscience Data Journal (2014)
dots in Figure 12). There are two reasons for this occur-rence. First, in a small number of cases latitudes andlongitudes in GHCN-M version 3 differ slightly from thesame station in other sources (e.g. GHCN-D). Wherestations are close to grid box edges a small change in
location can result in the station moving into an adja-cent grid box. For example, the grid box off the verysouthwest tip of Australia (Figure 12(b) and (c)) con-tains one station only present in GHCN-M version 3. Thesmall differences in longitudes between GHCN-M and
Table 12. List of user defined thresholds in the merge program.
Name Description Default Increase? Decrease?
MetadataThreshold
The first metadata threshold that takesinto account the distance, height, andJaccard metrics
0.50 Pull more through asunique stations
More data comparison
MetadataThreshold2
The second metadata threshold used ifthere is no overlap period between thetarget and candidate station (higherthan the first metadata threshold)
0.90 Withhold more stations More merging of stations
PosteriorThresholdSame-TXN
Threshold where TMAX/TMIN candidatestation has to exceed to merge withthe target station
0.50 Make stations eitherunique or withheld
More merging of stations
PosteriorThresholdUnique-TXN
Threshold where TMAX/TMIN candidatestation has to exceed to be considereda unique station
1.30 Withhold more stations More unique stations
PosteriorThresholdSame-TVG
Threshold where TAVG candidate stationhas to exceed to merge with thetarget station
0.50 Make stations eitherunique or withheld
More merging of stations
PosteriorThresholdUnique-TVG
Threshold where TAVG candidate stationhas to exceed to be considered aunique station
0.90 Withhold more stations More unique stations
OverlapThreshold
Overlap period that must exist betweenthe target and candidate station tocalculate a data comparison via theindex of agreement
60 Pull more through asunique stations
More data comparison
GapThreshold
Gap period that must exist whenmerging a candidate station with thetarget station
60 Lower number of merges Increase numberof merges
The first metadata threshold must be lesser than the second.
0 25 50 75 100 200 300
All stage three monthly Recommended merge
Number of years
Figure 8. Location of all stations in the recommended stage 3 component of the databank. The colour corresponds to the num-ber of years of data available for each station. Stations with longer periods of record mask stations with shorter periods of recordwhen they are in approximate identical locations.
Version 1 release of global land surface databank 17
ª 2014 The Authors.Geoscience Data Journal published by Royal Meteorological Society and John Wiley & Sons Ltd. Geoscience Data Journal (2014)
GHCN-D (Table 14) result in the station moving to a gridbox completely over land, and the station is mergedwith a higher priority source (GHCN-D). Second, somestations that are included in GHCN-M version 3 havebeen placed in the withheld bin during the databankmerge process, due to either bad metadata or datacomparisons being unable to definitively identifywhether the station should be merged or included as aunique stations (as described in previous sections).
To assess the affect the large increase in stationshas on global temperatures, the Climate AnomalyMethod (Ropelewski et al., 1984; Jones & Moberg,2003) is used to compute global temperature anoma-lies (with respect to a base period from 1961 to1990) from the recommended merge. Since the stage3 dataset is not homogenized, it is compared to theunadjusted version of GHCN-M version 3 and stratifiedby annual and seasonal periods (Figure 13). Overall,anomalies are lower than unadjusted GHCN-M version3 up to about 1950 and then equal or larger from1990 onwards. Therefore, the merge has a largerincreasing temperature trend than the global estimatebased upon the unadjusted GHCN-M version 3 prod-uct (Table 15). To understand the cause of thischange, Figure 14(a) plots the anomalies using unad-justed GHCN-M version 3 (black), the recommendedmerge (red), and the merge product again, but onlycontaining grid boxes that existed in unadjustedGHCN-M version 3 (blue). The same is done in Fig-ure 14(b), but for grid boxes not in unadjustedGHCN-M version 3. Using these two figures, it can beinferred that the change in the temperature trend isprimarily due to a larger sampling of stations in exist-ing grid boxes rather than the addition of entirelynew grid boxes. Whether such a distinction remainsafter homogenization is an important and open ques-tion. This will be addressed when creating futureproducts, such as GHCN-M version 4, which will bebased upon the recommended merge variantdescribed here, but using NCDC’s QC and homogeni-zation algorithms (Lawrimore et al., 2011 and refer-ences therein). Other homogenization efforts will alsoadd further insight into this observed trend in theunadjusted data.
3.2. Merge variants
Table 12 describes eight thresholds used in performingthe stage 3 merge. The table includes the definition ofeach, the default used for the recommended merge,and the effect of increasing or decreasing that thresh-old. Changing these thresholds can significantly alterthe overall result of the program. Changes will alsooccur when the source priority hierarchy is altered. Tocharacterize the uncertainty associated with the mergeparameters, seven different variants of the stage 3product were developed alongside the recommendedmerge. Members of the DWG have provided sugges-tions for multi-member variants and a description ofeach is highlighted in Table 16.
Figures 15, 16, and 17 highlight the number of sta-tions over time, the percentage of land area in5° 9 5° grid boxes, and the temperature anomaly ofall seven variants (red), along with the recommendedmerge (blue) and unadjusted GHCN-M version 3(black). There is a large spread in the number of sta-tions between the variants, especially after 1950. Thishighlights the sensitivity of this algorithm, being highlydependent on the thresholds and source hierarchy.However, it should be noted that all variants havemore stations than GHCN-M version 3 from 1890onwards. The same cannot be said for the differencesin percentage of land area sample by 5° grid boxcounts. Although most variants have more spatialsampling than GHCN-M version 3, one has less sam-pling (variant 3). Regardless, the global temperatureanomaly (Figure 17) has little spread from the recom-mended merge. The only outlier is variant 3, wherethe global anomalies were lower during the 1800sbecause of poor spatial sampling. Variant 3 is com-posed solely of sources that have maximum and mini-mum temperature, excluding sources with averagetemperature. This greatly reduces the amount of dataavailable to form the anomaly in the early time period.If GHCN-M version 3 or the other variants are similarlysampled they would exhibit a similar behaviour.
This uncertainty reflects the importance of data res-cue. Although a major effort has been undertakenthrough this initiative, more can be done to include
Table 13. Statistics describing percentage of candidate stations merged, unique, and withheld in the recommended program.Inner statistics also describe details about each major category.
% Merged 80.7No data comparisons made, rely on Metadata Metric 22.5Data comparisons made, best Metadata Metric was non-overlap case 1.6Data comparisons made, best station chosen through both Metadata Metric andPosterior Metric Same
61.1
Data comparisons made, ID’s were a perfect match 14.8% Unique 5.7
Unique after metadata comparisons 81.8Unique after metadata and data comparisons 18.2
% Withheld 13.6Withheld after metadata comparisons 13.1Withheld after metadata and data comparisons 86.9
18 J. J. Rennie et al.
ª 2014 The Authors.Geoscience Data Journal published by Royal Meteorological Society and John Wiley & Sons Ltd.Geoscience Data Journal (2014)
0
5000
10 000
15 000
No.
of s
tatio
ns
1860 1890 1920 1950 1980 2010
Years
Stage 3 (Recommended merge) RED = US Stations | BLUE = NON−US stations | DASHED = GHCN−M V3
0
5000
10 000
15 000
20 000
No.
of s
tatio
ns
1860 1890 1920 1950 1980 2010
Years
Number of stationsBLACK = GHCN−M V3 | RED = Stage 3 (Recommended merge)
(b)
(a)
Figure 9. Station count of recommended merge by year from 1850 to 2010. All stations (a) in red compared to GHCN-M version 3 inblack, and a comparison of US in red versusNon-US stations (b) in blue are made versusGHCN-M version 3, which are dashed lines.
Cou
nt
500 100 150 200Station length (years)
0
1000
2000
3000
4000
5000
6000
7000
8000
9000
10 000
Station length histogramGRAY = Stage 3 (Recommended merge) | RED = GHCN−M V3
Figure 10. Histogram of station count by record length for the recommended version of the merge, compared to GHCN-M version 3.
Version 1 release of global land surface databank 19
ª 2014 The Authors.Geoscience Data Journal published by Royal Meteorological Society and John Wiley & Sons Ltd. Geoscience Data Journal (2014)
areas that are lacking on both spatial and temporalscales, or lacking maximum and minimum temperaturedata.
4. Data access and version control
Data are provided from a primary ftp site hosted bythe Global Observing Systems Information Center
(GOSIC; http://gosic.org) and World Data Center A atNOAA/NCDC. In addition, World Data Center B at Ob-ninsk, Russia established an ftp site that is routinelyupdated to mirror the data on the primary site. ftp://ftp.ncdc.noaa.gov/pub/data/globaldatabank/, ftp://ftp.meteo.ru/pub/data/globaldatabank/. Other mirrors maybe established in the future. Data are provided inASCII to facilitate quick access and use by anyone in
0
10
20
30
40
50
60
70
80
90
100
% H
emis
pher
ic a
rea
sam
pled
1860 1890 1920 1950 1980 2010Years
Number of gridboxes (NH)BLACK = GHCN−M V3 | RED = Stage 3 (Recommended merge)
0
10
20
30
40
50
60
70
80
90
100
% L
and
area
sam
pled
1860 1890 1920 1950 1980 2010Years
Number of gridboxes (globe)BLACK = GHCN−M V3 | RED = Stage 3 (Recommended merge)
0
10
20
30
40
50
60
70
80
90
100
% H
emis
pher
ic a
rea
sam
pled
1860 1890 1920 1950 1980 2010Years
Number of gridboxes (SH)BLACK = GHCN−M V3 | RED = Stage 3 (Recommended merge)
(b)
(a)
(c)
Figure 11. Percentage of global (a), Northern hemispheric (b), and Southern hemispheric (c) coverage for the recommendedversion of the merge, compared to GHCN-M version 3.
20 J. J. Rennie et al.
ª 2014 The Authors.Geoscience Data Journal published by Royal Meteorological Society and John Wiley & Sons Ltd.Geoscience Data Journal (2014)
the international community. The stage 3 datasetcomes in three different formats. The first is theformat similar to stage 2 data, and the second is a
format similar to GHCN-M version 3. Conversion ofdata files to the NetCDF Climate and Forecast conven-tion are also provided.
The databank consists of subdirectories for dailyand monthly data. In some cases, the data providerhas agreed to contribute regular data updates. Asupdates arrive, the previous version is moved to thearchive directory and permanently stored in a directoryspecific to the source. Within the archive directory,each version is maintained in a separate subdirectorydesignated by the year, month, and day the data werefirst added to the databank.
It is preferable that the entire source dataset betransferred as updates are made rather than collec-tion of only the most recent observations. By acquir-ing the full source dataset each time an updateis made, the databank can better ensure the mostup-to-date data.
A version number is assigned to new sources orupdates to sources as they are added to the data-
1871−1880RED = GHCN−M V3 | Blue = Recommended merge | Black = Both
1931−1940RED = GHCN−M V3 | Blue = Recommended merge | Black = Both
1981−1990RED = GHCN−M V3 | Blue = Recommended merge | Black = Both
2001−2010RED = GHCN−M V3 | Blue = Recommended merge | Black = Both
(a) (b)
(c) (d)
Figure 12. Spatial coverage of both databank and GHCN-M version 3 data during the periods (a) 1871–1880, (b) 1931–1940,(c) 1981–1990, (d) 2001–2010. Blue indicates a 5° 9 5° box containing at least one station that exists only in the merge product,red for only GHCN-M version 3, and black for both.
Table 14. Metadata for station CAPE NATURALISTE for GHCN-M version 3 and GHCN-D.
ID NAME LATITUDE LONGITUDE ELEVATION (m)
GHCN-D ASN00009519 CAPE NATURALISTE �33.5372 115.0189 109GHCN-M 50194600000 CAPE NATURALI �33.5300 115.0000 98
Because the GHCN-M longitude resides on the 115 degree line, it is placed in the grid box centred over the ocean (�32.5, 112.5),whereas the GHCN-D station is placed in the grid box centred over land (�32.5, 117.5).
Table 15. The 1850–2010 temperature trends, in degreesCelsius, calculated using the Climate Anomaly Method com-pared to the unadjusted GHCN-M version 3, recommendedmerge, and merge variants.
Trend (°C)
GHCN-M v3 (unadjusted) 0.544Recommended 0.668Variant one 0.661Variant two 0.665Variant three 0.819Variant four 0.668Variant five 0.653Variant six 0.645Variant seven 0.603
Version 1 release of global land surface databank 21
ª 2014 The Authors.Geoscience Data Journal published by Royal Meteorological Society and John Wiley & Sons Ltd. Geoscience Data Journal (2014)
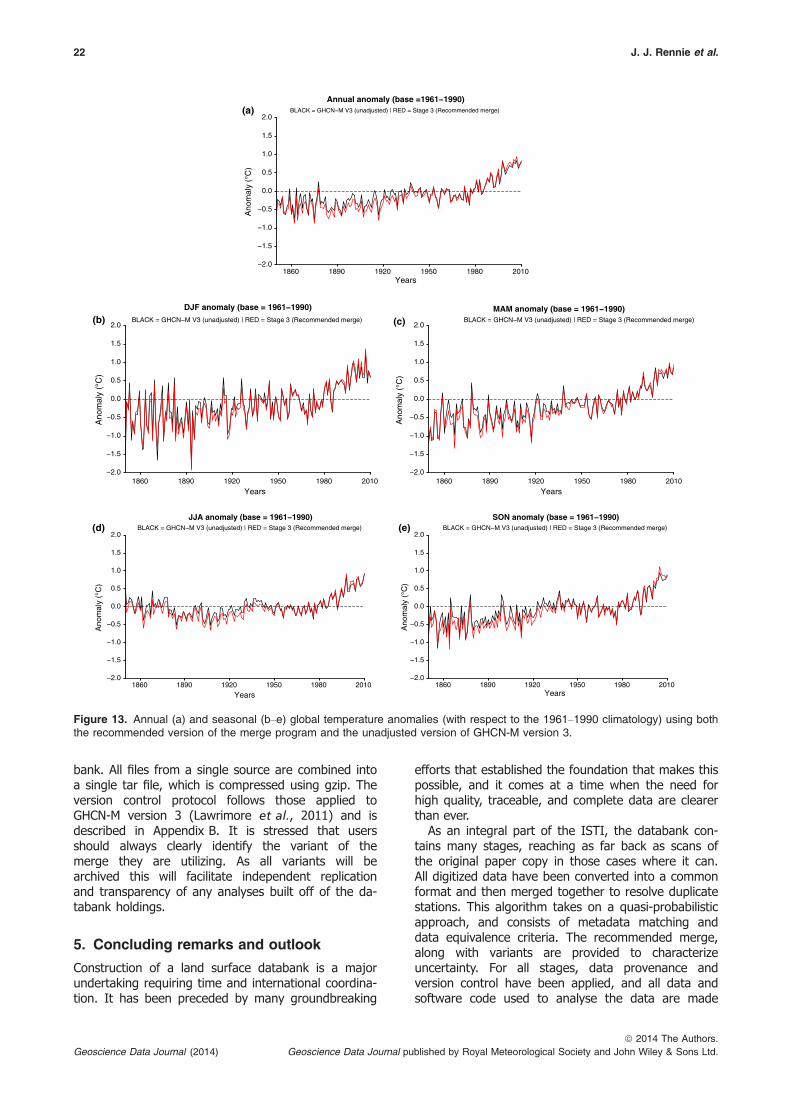
bank. All files from a single source are combined intoa single tar file, which is compressed using gzip. Theversion control protocol follows those applied toGHCN-M version 3 (Lawrimore et al., 2011) and isdescribed in Appendix B. It is stressed that usersshould always clearly identify the variant of themerge they are utilizing. As all variants will bearchived this will facilitate independent replicationand transparency of any analyses built off of the da-tabank holdings.
5. Concluding remarks and outlook
Construction of a land surface databank is a majorundertaking requiring time and international coordina-tion. It has been preceded by many groundbreaking
efforts that established the foundation that makes thispossible, and it comes at a time when the need forhigh quality, traceable, and complete data are clearerthan ever.
As an integral part of the ISTI, the databank con-tains many stages, reaching as far back as scans ofthe original paper copy in those cases where it can.All digitized data have been converted into a commonformat and then merged together to resolve duplicatestations. This algorithm takes on a quasi-probabilisticapproach, and consists of metadata matching anddata equivalence criteria. The recommended merge,along with variants are provided to characterizeuncertainty. For all stages, data provenance andversion control have been applied, and all data andsoftware code used to analyse the data are made
−2.0
−1.5
−1.0
−0.5
0.0
0.5
1.0
1.5
2.0
Ano
mal
y (°
C)
1860 1890 1920 1950 1980 2010Years
Annual anomaly (base =1961−1990)BLACK = GHCN−M V3 (unadjusted) | RED = Stage 3 (Recommended merge)
−2.0
−1.5
−1.0
−0.5
0.0
0.5
1.0
1.5
2.0
Ano
mal
y (°
C)
1860 1890 1920 1950 1980 2010
Years
JJA anomaly (base = 1961−1990)BLACK = GHCN−M V3 (unadjusted) | RED = Stage 3 (Recommended merge)
−2.0
−1.5
−1.0
−0.5
0.0
0.5
1.0
1.5
2.0
Ano
mal
y (°
C)
1860 1890 1920 1950 1980 2010
Years
MAM anomaly (base = 1961−1990)BLACK = GHCN−M V3 (unadjusted) | RED = Stage 3 (Recommended merge)
−2.0
−1.5
−1.0
−0.5
0.0
0.5
1.0
1.5
2.0
Ano
mal
y (°
C)
1860 1890 1920 1950 1980 2010
Years
DJF anomaly (base = 1961−1990)BLACK = GHCN−M V3 (unadjusted) | RED = Stage 3 (Recommended merge)
−2.0
−1.5
−1.0
−0.5
0.0
0.5
1.0
1.5
2.0
Ano
mal
y (°
C)
1860 1890 1920 1950 1980 2010Years
SON anomaly (base = 1961−1990)BLACK = GHCN−M V3 (unadjusted) | RED = Stage 3 (Recommended merge)
(b)
(a)
(c)
(d) (e)
Figure 13. Annual (a) and seasonal (b–e) global temperature anomalies (with respect to the 1961–1990 climatology) using boththe recommended version of the merge program and the unadjusted version of GHCN-M version 3.
22 J. J. Rennie et al.
ª 2014 The Authors.Geoscience Data Journal published by Royal Meteorological Society and John Wiley & Sons Ltd.Geoscience Data Journal (2014)
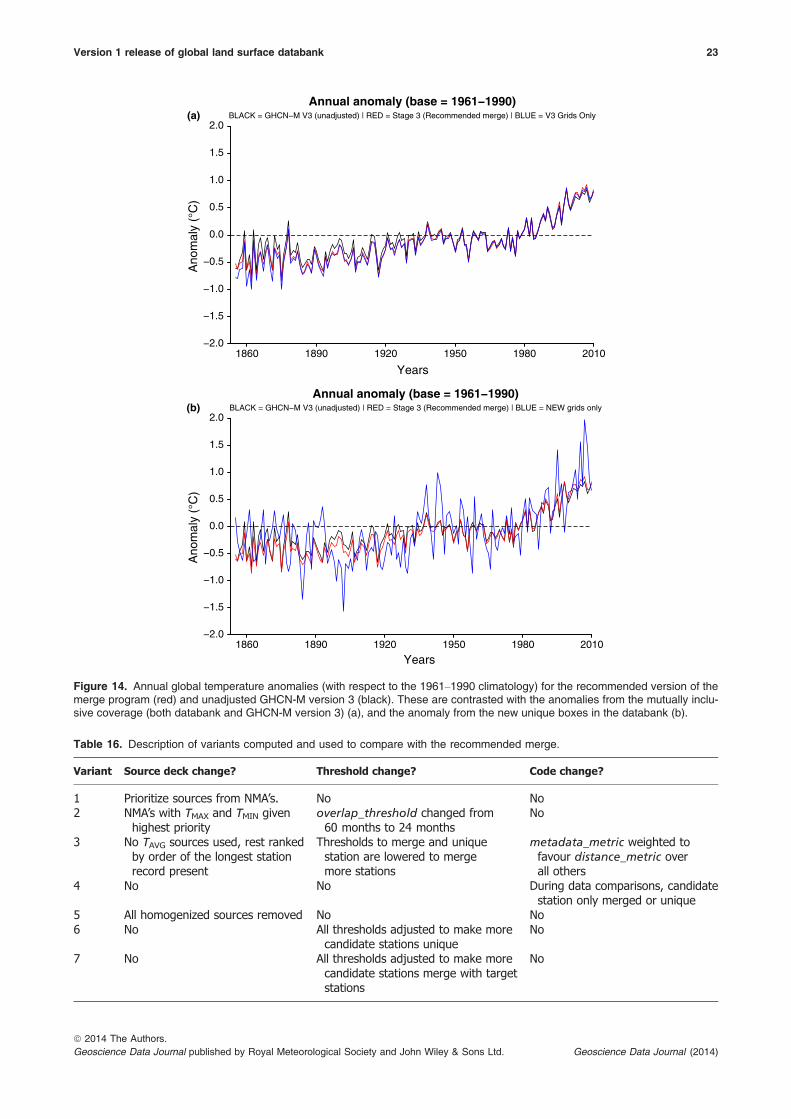
−2.0
−1.5
−1.0
−0.5
0.0
0.5
1.0
1.5
2.0
Ano
mal
y (°
C)
Annual anomaly (base = 1961−1990)BLACK = GHCN−M V3 (unadjusted) | RED = Stage 3 (Recommended merge) | BLUE = NEW grids only
1860 1890 1920 1950 1980 2010
Years
−2.0
−1.5
−1.0
−0.5
0.0
0.5
1.0
1.5
2.0
Ano
mal
y (°
C)
1860 1890 1920 1950 1980 2010
Years
Annual anomaly (base = 1961−1990)BLACK = GHCN−M V3 (unadjusted) | RED = Stage 3 (Recommended merge) | BLUE = V3 Grids Only
(b)
(a)
Figure 14. Annual global temperature anomalies (with respect to the 1961–1990 climatology) for the recommended version of themerge program (red) and unadjusted GHCN-M version 3 (black). These are contrasted with the anomalies from the mutually inclu-sive coverage (both databank and GHCN-M version 3) (a), and the anomaly from the new unique boxes in the databank (b).
Table 16. Description of variants computed and used to compare with the recommended merge.
Variant Source deck change? Threshold change? Code change?
1 Prioritize sources from NMA’s. No No2 NMA’s with TMAX and TMIN given
highest priorityoverlap_threshold changed from60 months to 24 months
No
3 No TAVG sources used, rest rankedby order of the longest stationrecord present
Thresholds to merge and uniquestation are lowered to mergemore stations
metadata_metric weighted tofavour distance_metric overall others
4 No No During data comparisons, candidatestation only merged or unique
5 All homogenized sources removed No No6 No All thresholds adjusted to make more
candidate stations uniqueNo
7 No All thresholds adjusted to make morecandidate stations merge with targetstations
No
Version 1 release of global land surface databank 23
ª 2014 The Authors.Geoscience Data Journal published by Royal Meteorological Society and John Wiley & Sons Ltd. Geoscience Data Journal (2014)
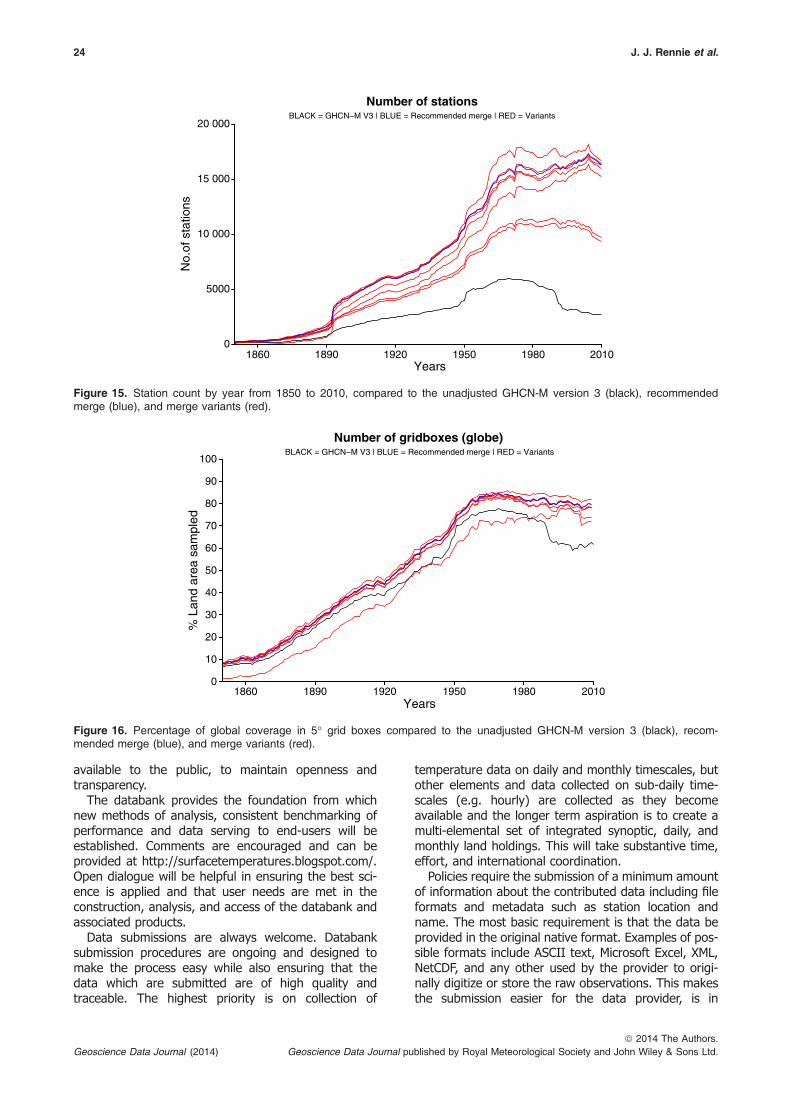
available to the public, to maintain openness andtransparency.
The databank provides the foundation from whichnew methods of analysis, consistent benchmarking ofperformance and data serving to end-users will beestablished. Comments are encouraged and can beprovided at http://surfacetemperatures.blogspot.com/.Open dialogue will be helpful in ensuring the best sci-ence is applied and that user needs are met in theconstruction, analysis, and access of the databank andassociated products.
Data submissions are always welcome. Databanksubmission procedures are ongoing and designed tomake the process easy while also ensuring that thedata which are submitted are of high quality andtraceable. The highest priority is on collection of
temperature data on daily and monthly timescales, butother elements and data collected on sub-daily time-scales (e.g. hourly) are collected as they becomeavailable and the longer term aspiration is to create amulti-elemental set of integrated synoptic, daily, andmonthly land holdings. This will take substantive time,effort, and international coordination.
Policies require the submission of a minimum amountof information about the contributed data including fileformats and metadata such as station location andname. The most basic requirement is that the data beprovided in the original native format. Examples of pos-sible formats include ASCII text, Microsoft Excel, XML,NetCDF, and any other used by the provider to origi-nally digitize or store the raw observations. This makesthe submission easier for the data provider, is in
0
5000
10 000
15 000
20 000
No.
of s
tatio
ns
1860 1890 1920 1950 1980 2010Years
Number of stationsBLACK = GHCN−M V3 | BLUE = Recommended merge | RED = Variants
Figure 15. Station count by year from 1850 to 2010, compared to the unadjusted GHCN-M version 3 (black), recommendedmerge (blue), and merge variants (red).
0
10
20
30
40
50
60
70
80
90
100
% L
and
area
sam
pled
1860 1890 1920 1950 1980 2010Years
Number of gridboxes (globe)BLACK = GHCN−M V3 | BLUE = Recommended merge | RED = Variants
Figure 16. Percentage of global coverage in 5° grid boxes compared to the unadjusted GHCN-M version 3 (black), recom-mended merge (blue), and merge variants (red).
24 J. J. Rennie et al.
ª 2014 The Authors.Geoscience Data Journal published by Royal Meteorological Society and John Wiley & Sons Ltd.Geoscience Data Journal (2014)
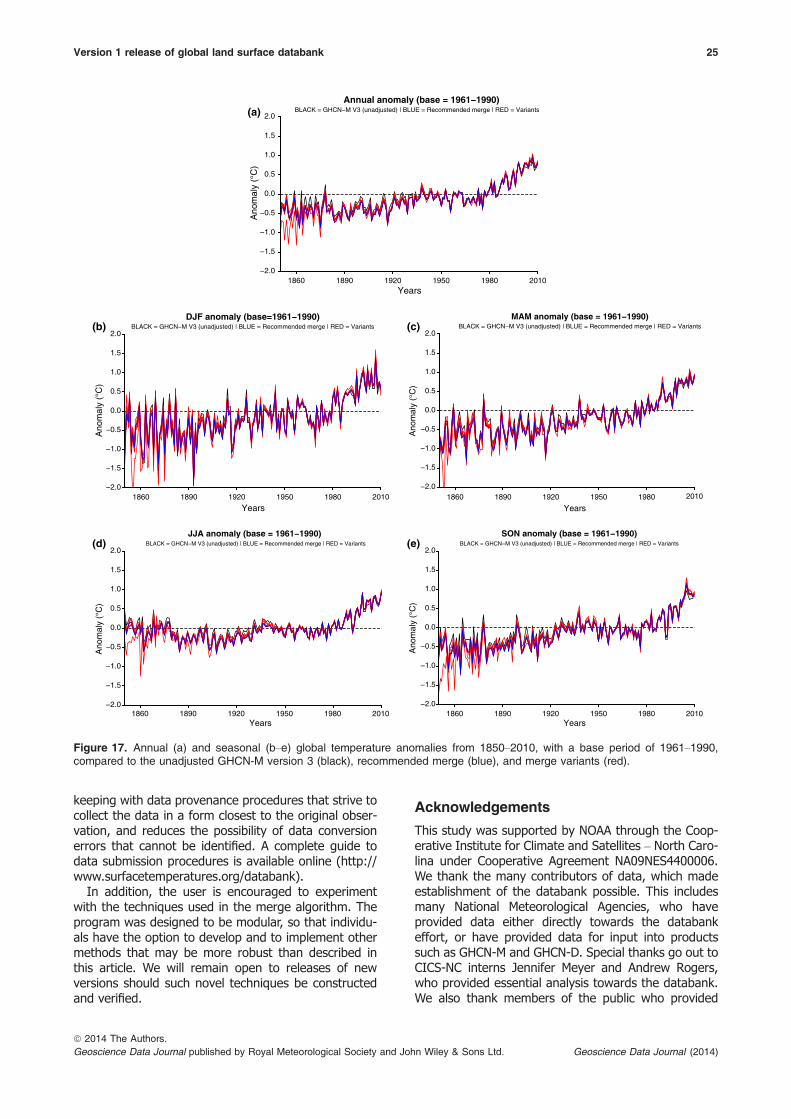
keeping with data provenance procedures that strive tocollect the data in a form closest to the original obser-vation, and reduces the possibility of data conversionerrors that cannot be identified. A complete guide todata submission procedures is available online (http://www.surfacetemperatures.org/databank).
In addition, the user is encouraged to experimentwith the techniques used in the merge algorithm. Theprogram was designed to be modular, so that individu-als have the option to develop and to implement othermethods that may be more robust than described inthis article. We will remain open to releases of newversions should such novel techniques be constructedand verified.
Acknowledgements
This study was supported by NOAA through the Coop-erative Institute for Climate and Satellites – North Caro-lina under Cooperative Agreement NA09NES4400006.We thank the many contributors of data, which madeestablishment of the databank possible. This includesmany National Meteorological Agencies, who haveprovided data either directly towards the databankeffort, or have provided data for input into productssuch as GHCN-M and GHCN-D. Special thanks go out toCICS-NC interns Jennifer Meyer and Andrew Rogers,who provided essential analysis towards the databank.We also thank members of the public who provided
−2.0
−1.5
−1.0
−0.5
0.0
0.5
1.0
1.5
2.0
Ano
mal
y (°
C)
1860 1890 1920 1950 1980 2010Years
Annual anomaly (base = 1961−1990)BLACK = GHCN−M V3 (unadjusted) | BLUE = Recommended merge | RED = Variants
−2.0
−1.5
−1.0
−0.5
0.0
0.5
1.0
1.5
2.0
Ano
mal
y (°
C)
1860 1890 1920 1950 1980 2010
Years
DJF anomaly (base=1961−1990)BLACK = GHCN−M V3 (unadjusted) | BLUE = Recommended merge | RED = Variants
−2.0
−1.5
−1.0
−0.5
0.0
0.5
1.0
1.5
2.0
Ano
mal
y (°
C)
1860 1890 1920 1950 1980 2010
Years
MAM anomaly (base = 1961−1990)BLACK = GHCN−M V3 (unadjusted) | BLUE = Recommended merge | RED = Variants
−2.0
−1.5
−1.0
−0.5
0.0
0.5
1.0
1.5
2.0
Ano
mal
y (°
C)
1860 1890 1920 1950 1980 2010Years
JJA anomaly (base = 1961−1990)BLACK = GHCN−M V3 (unadjusted) | BLUE = Recommended merge | RED = Variants
−2.0
−1.5
−1.0
−0.5
0.0
0.5
1.0
1.5
2.0
Ano
mal
y (°
C)
1860 1890 1920 1950 1980 2010Years
SON anomaly (base = 1961−1990)BLACK = GHCN−M V3 (unadjusted) | BLUE = Recommended merge | RED = Variants
(a)
(b) (c)
(d) (e)
Figure 17. Annual (a) and seasonal (b–e) global temperature anomalies from 1850–2010, with a base period of 1961–1990,compared to the unadjusted GHCN-M version 3 (black), recommended merge (blue), and merge variants (red).
Version 1 release of global land surface databank 25
ª 2014 The Authors.Geoscience Data Journal published by Royal Meteorological Society and John Wiley & Sons Ltd. Geoscience Data Journal (2014)
feedback during the beta release of the databank,including Nick Stokes (http://moyhu.blogspot.com/).We would like to thank NCDC’s graphics team for pro-viding Figures 2 and 5. Thanks to Richard Chandler,Scott Stevens, Blair Trewin, Jesse Bell, Scott Applequistand anonymous reviewers for providing comments onthe paper. A portion of the Antarctic observations(Turner et al., 2004; Lazzara et al., 2012) is partiallybased on work support by the National Science Foun-dation, Office of Polar Programs under Grant ANT-0944018 and ANT-1141908. The work of Colin Moriceis supported by the Joint DECC/Defra Met Office HadleyCentre Climate Programme (GA01101).
References
Allan RJ, Brohan P, Compo GP, Stone R, Luterbacher J,Br€onnimann S. 2011. The International AtmosphericCirculation Reconstructions over the Earth (ACRE)initiative. Bulletin of the American MeteorologicalSociety 92: 1421–1425, doi: 10.1175/2011BAMS3218.1.
Blunden J, Arndt DS. 2013. State of the Climate in 2012.Bulletin of the American Meteorological Society 94:S1–S238, doi: 10.1175/2013BAMSStateoftheClimate.1.
Caesar J, Alexander L, Vose R. 2006. Large-scale changesin observed daily maximum and minimum temperatures:creation and analysis of a new gridded data set. Jour-nal of Geophysical Research 111: D05101, doi: 10.1029/2005JD006280.
Camuffo D, Bertolin C. 2012. The earliest temperatureobservations in the world: the Medici Network (1654–1670). Climatic Change 111: 335–363, doi: 10.1007/s10584-011-0142-5.
Compo GP, Whitaker JS, Sardeshmukh PD, Matsui N,Allan RJ, Yin X, Gleason BE, Vose RS, Rutledge G, Bes-semoulin P, Br€onnimann S, Brunet M, Crouthamel RI,Grant AN, Groisman PY, Jones PD, Kruk MC, Kruger AC,Marshall GJ, Maugeri M, Mok HY, Nordli Ø, Ross TF,Trigo RM, Wang XL, Woodruff SD, Worley SJ. 2011. TheTwentieth Century Reanalysis Project. Quarterly Jour-nal of the Royal Meteorological Society 137: 1–28,doi: 10.1002/qj.776.
Hansen J, Ruedy R, Glascoe J, Sato M. 1999. GISS analy-sis of surface temperature change. Journal of Geo-physical Research 104: 30997–31022, doi: 10.1029/1999JD900835.
Hansen J, Ruedy R, Sato M, Lo K. 2010. Global surfacetemperature change. Reviews of Geophysics 48:RG4004, doi:10.1029/2010RG000345.
International Surface Temperature Initiative (ISTI). 2014.Global Land Surface Meteorological Databank. GlobalObserving Systems Information Center (GOSIC). doi: 10.7289/V5PK0D3G.
IPCC. 2013. Climate Change 2013: the physical sciencebasis. In Contribution of Working Group I to the FifthAssessment Report of the Intergovernmental Panel onClimate Change. Stocker TF, Qin D, Plattner GK, TignorM, Allen SK, Boschung J, Nauels A, Xia Y, Bex V, MidgleyPM (eds). Cambridge University Press: Cambridge, UK,New York, NY; 187–194.
Jaccard P. 1901. �Etude comparative de la distributionflorale dans une portion des Alpes et des Jura. Bulle-tin de la Soci�et�e Vaudoise des Sciences Naturelles37: 547–579.
Jones PD, Moberg A. 2003. Hemispheric and large-scalesurface air temperature variations: an extensive revisionand an update to 2001. Journal of Climate 16: 206–223, doi: 10.1175/1520-0442(2003)016<0206:HAL-SSA>2.0.CO;2.
Jones PD, Lister DH, Osborn TJ, Harpham C, Salmon M,Morice CP. 2012. Hemispheric and large-scale land sur-face air temperature variations: an extensive revisionand an update to 2010. Journal of GeophysicalResearch 117: D05127, doi: 10.1029/2011JD017139.
Karl TR, Williams CN, Young PJ, Wendland WM. 1986. Amodel to estimate the time of observation bias associatedwith monthly mean maximum, minimum, and mean tem-perature for the United States. Journal of AppliedMeteorology and Climatology 25: 145–160, doi: 10.1175/1520-0450(1986)025<0145:AMTETT>2.0.CO;2.
Lawrimore JH, Menne MJ, Gleason BE, Williams CN, WuertzDB, Vose RS, Rennie J. 2011. An overview of the GlobalHistorical Climatology Network monthly mean tempera-ture data set, version 3. Journal of GeophysicalResearch 116: D19121, doi: 10.1029/2011JD016187.
Lazzara MA, Weidner GA, Keller LM, Thom JE, CassanoJJ. 2012. Antarctic Automatic Weather Station Program:30 years of polar observations. Bulletin of the Ameri-can Meteorological Society 93: 1519–1537, doi: 10.1175/BAMS-D-11-00015.1.
Legates DR, McCabe GJ. 1999. Evaluating the use of‘goodness-of-fit’ measures in hydrologic and hydrocli-matic model evaluation. Water Resources Research35: 233–241, doi: 10.1029/1998WR900018.
Menne MJ, Williams CN, Vose RS. 2009. The UnitedStates Historical Climatology Network Monthly Tempera-ture Data – Version 2. Bulletin of the American Mete-orological Society 90: 993–1007, doi: 10.1175/2008BAMS2613.1.
Menne MJ, Durre I, Vose RS, Gleason BE, Houston TG.2012. An Overview of the Global Historical ClimatologyNetwork-Daily Database. Journal of Atmospheric andOceanic Technology 29: 897–910, doi: 10.1175/JTECH-D-11-00103.1.
Peterson TC, Vose RS. 1997. An overview of the GlobalHistorical Climatology Network temperature database.Bulletin of the American Meteorological Society 78:2837–2849, doi: 10.1175/15200477(1997)078<2837:AOOTGH>2.0.CO;2.
Ropelewski CF, Janowiak JE, Halpert MS. 1984. TheClimate Anomaly Monitoring System (CAMS). Report, Cli-mate Analysis Center, NWS, NOAA: Washington, DC; 39pp.
Skansi M, Brunet M, Sigr�o J, Aguilar E, Arevalo GroeningJ, Bentancur O, Castellon Geier Y, Correa Amaya R, Ja-come H, Malheiros Ramos A, Oria Rojas C, Pasten AM,Sallons Mitro S, Villaroel Jim�enez C, Mart�ınez R, Alexan-der L, Jones PD. 2012. Warming and wetting signalsemerging from analysis of changes in climate extremeindices over South America. Global and PlanetaryChange 100: 295–307, doi: 10.1016/j.gloplacha.2012.11.004.
26 J. J. Rennie et al.
ª 2014 The Authors.Geoscience Data Journal published by Royal Meteorological Society and John Wiley & Sons Ltd.Geoscience Data Journal (2014)
Smith A, Lott N, Vose RS. 2011. The Integrated SurfaceDatabase: recent developments and partnerships. Bul-letin of the American Meteorological Society 92:704–708, doi: 10.1175/2011BAMS3015.1
Thorne PW, Willett KM, Allan RJ, Bojinski S, Christy JR,Fox N, Gilbert S, Jolliffe I, Kennedy JJ, Kent E, KleinTank A, Lawrimore J, Parker DE, Rayner N, Simmons A,Song L, Stott PA, Trewin B. 2011. Guiding the creationof a comprehensive surface temperature resource fortwenty-first century climate science. Bulletin of theAmerican Meteorological Society 92: ES40–ES47,doi: 10.1175/2011BAMS3124.1.
Trewin BC. 2010. Exposure, instrumentation and observ-ing practice effects on land temperature measurements.Wiley Interdisciplinary Reviews: Climate Change, 1:490–506, doi: 10.1002/wcc.46.
Turner J, Colwell SR, Marshall GJ, Lachlan-Cope TA, Carl-eton AM, Jones PD, Lagun V, Reid PA, Iagovkina S. 2004.The SCAR READER Project: Toward a High-QualityDatabase of Mean Antarctic Meteorological Observations.Journal of Climate 17: 2890–2898, doi: 10.1175/1520-0442(2004)017<2890:TSRPTA>2.0.CO;2.
USGCRP. 2014. Climate Change Impacts in the UnitedStates: The Third National Climate Assessment,Melillo JM, Richmond TC, Yohe GW (eds). U.S. Govern-ment Printing Office: Washington, DC.
Vose RS, Schmoyer RL, Steurer PM, Peterson TC, Heim R,Karl TR, Eischeid J. 1992. The Global Historical Climato-logy Network: Long-term monthly temperature, precipi-tation, sea level pressure, and station pressure data.Report ORNL/CDIAC-53, CDIAC: Oak Ridge, TN; 325 pp.
Williams CN, Menne MJ, Thorne PW. 2012. Benchmarkingthe performance of pairwise homogenization of surfacetemperatures in the United States. Journal of Geo-physical Research 117: D05116, doi: 10.1029/2011JD016761.
Willmott CJ. 1981. On the validation of models. PhysicalGeography 2: 184–194.
Willmott CJ, Ackleson SG, Davis RE, Feddema JJ, KlinkKM, Legates DR, O’Donnell J, Rowe CM. 1985. Statisticsfor the evaluation and comparisons of models. Journalof Geophysical Research 90: 8995–9005, doi: 10.1029/JC090iC05p08995.
WMO. 2011. Guide to Climatological Pratices. WMO-No.100. WMO: Geneva, Switzerland.
Appendix A
Source prioritization associated with therecommended merge
The priority in Table 9 follows the nine overarchingclasses given below. The information necessary toassign each source to a given classification (1–9)should be readily available from the stage 2 data prov-enance flags:
1. Daily databank stage 3 (GHCN-D) – this pro-vides a backbone of maximum and minimumvalues that is analyzed regularly and curatedcarefully on an ongoing basis with regularupdates and stable resource support.
2. Data sources which contain maximum and mini-mum temperature data, have had no qualitycontrol or homogenization applied and haveknown provenance.
3. Data sources which contain maximum and mini-mum data, have had no quality control orhomogenization applied with poorly knownprovenance.
4. Data sources that have no quality control orhomogenization applied but only available asaverage and have known provenance.
5. Data sources that have no quality control orhomogenization applied but only available asaverage and with poorly known provenance.
6. Data sources with quality control applied thathave maximum and minimum data.
7. Data sources with quality control applied thathave average data only.
8. Data sources with homogenization that havemaximum and minimum data.
9. Data sources with homogenization that haveaverage data only.
Within classes 2–9 the following set of criteria wouldbe used to differentiate between the sources in thepriority order with which they should be merged:
1. Whether the monthly data were calculated fromdailies held in the databank.
2. Whether the data arise from World WeatherRecords or national holdings.
3. Average length of station record in the source.4. Oldest station record start date or average sta-
tion record start date with priority given tothose with earlier start dates.
5. Number of stations in the source.
Appendix B
Versioning control procedure for thedatabank data sources
The version number for stage 2 data uses the follow-ing naming structure:
source.timescale.stage2.X.Y.yyyymmdd.tar.gzwhere
1. source identifies the data provider.2. timescale is monthly or daily.3. X is incremented when there is a major change
to the source dataset such as replacement oraddition of a large percentage of data.
4. Y is incremented when there are small updatesto the source dataset such as real-time updatesto existing stations.
5. yyyymmdd is the year, month, and day thedata source was provided or updated.
Stage 3 uses a slightly different naming structure,namely:
Version 1 release of global land surface databank 27
ª 2014 The Authors.Geoscience Data Journal published by Royal Meteorological Society and John Wiley & Sons Ltd. Geoscience Data Journal (2014)

variant.timescale.stage3.vX.Y.Z.yyyymmdd.tar.gzwhere
1. variant identifies the name of the merge vari-ant.
2. timescale is monthly or daily.3. X is incremented during major upgrades of
unspecified nature and is always accompaniedby a peer-reviewed manuscript.
4. Y is incremented during substantial modifica-tions to the databank, including a new set
of stations or substantive changes to themerging algorithm. This is accompanied by atechnical note published to the FTP site.
5. Z is incremented during minor revisions to bothdata and processing software that are trackedvia a change log file on the FTP site.
6. yyyymmdd is the year, month, and day thedata source was provided or updated.
28 J. J. Rennie et al.
ª 2014 The Authors.Geoscience Data Journal published by Royal Meteorological Society and John Wiley & Sons Ltd.Geoscience Data Journal (2014)