The impact of radiative forcing on the equatorial ...
12
The impact of radiative forcing on the equatorial stratospheric circulation Author: Aleksander Lacima Nadolnik * Facultad de F´ ısica, Universidad de Barcelona, Av. Diagonal 647, 08028 Barcelona, Espa˜ na. Supervisors: Froila Palmeiro N´ u˜ nez and Javier Garc´ ıa Serrano † Abstract: The aim of this work is to evaluate how the Quasi-Biennial Oscillation (QBO), which dominates interannual variability in the tropical stratosphere, responds to different radiative forcings in the EC-EARTH climate model version 3.3. Two sets of simulations have been used, consisting in three atmosphere-only and three atmosphere-ocean coupled experiments, which are based on past, present and future conditions. The QBO influence on the extratropical circulation, formally known as the Holton-Tan effect, has also been assessed during boreal winter (DJF). Results show a notorious shortening of the QBO period and a clear weakening of the QBO amplitude under a warming climate in the coupled simulations; which do not show a significant impact on the Holton-Tan effect in the polar vortex. I. INTRODUCTION The Quasi-Biennial Oscillation (QBO) is the dominant mode of climate variability in the equatorial strato- sphere, roughly extending between 5 and 100 hPa. The QBO can be visualized as a shifting pattern of easterly and westerly winds that propagate downward with a period ranging from 22 to 34 months, hence the name quasi-biennial, and a mean period of 28 months. On average, this downward propagation takes place without loss of amplitude in the upper stratosphere, though it rapidly dampens below 20 hPa (23 km). A complete QBO cycle is then composed of an easterly (EQBO) and a westerly phase (WQBO), with the former usually having a greater amplitude, in absolute terms, and the latter usually propagating downward at a higher rate. The QBO extends symmetrically across the equator, approximately between 6 ◦ N and 6 ◦ S, and around the entire equatorial belt (Baldwin 2001). From a dynamical perspective, the QBO is driven by upward propagating equatorial waves that arise in the troposphere at tropical latitudes. In general terms, atmospheric waves can only propagate vertically when their frequency, ν , satisfies the condition f<ν<N , where f is the Coriolis parameter and N is the buoyancy frequency. This constraint implies that in mid-latitudes most waves with periods in the order of days (low- frequency waves) are vertically trapped, thus only being capable of propagating horizontally. But at equatorial latitudes, where f tends to 0, low-frequency waves can propagate vertically. Thus, equatorial waves, which in- clude gravity, inertia-gravity, Kelvin and Rossby-gravity (R-g) waves (also known as Yanai waves), interact with the mean flow by depositing energy, mainly in the form of heat, and momentum, u 0 w 0 , in the upper stratosphere, where they develop an alternating pattern * [email protected] † [email protected]; [email protected] of wind regimes that propagates downward at a rate of approximately 1 km per month, until it dissipates in the tropical tropopause (TPP). This deposition of energy and momentum occurs due to wavebreaking, a process through which waves dissipate when their phase speed reaches a critical value (i.e. the zonal wind speed). Both Kelvin (eastward propagating) and R-g (westward propagating) waves originate due to oscillations in the large-scale convective heating pattern present around the equatorial belt and are also equatorially trapped, meaning that they rapidly decay away from the equator (Holton and Hakim 2012). FIG. 1. Schematic representation of the wave-driven develop- ment of a QBO cycle. Source: An Introduction to Dynamic Meteorology, Holton, 2012. The wave-driven development of a QBO cycle is schemat- ically depicted in Figure 1b. Initially (1), the zonal wind is weak and westerly, with a small amplitude maximum located at mid-altitude. Kelvin waves propagate upward until they reach this maximum, where they dissipate and force a westerly acceleration on the mean flow. As the westerlies intensify due to this forcing they advance downward in time, thus lowering the altitude at which Kelvin waves break (2). At the same time, R-g waves propagate to higher altitudes as they are not trapped by the westerly maximum at middle levels. Therefore, they force an easterly acceleration on the mean flow right
Transcript of The impact of radiative forcing on the equatorial ...
The impact of radiative forcing on the equatorial stratospheric circulation
Author: Aleksander Lacima Nadolnik∗
Facultad de Fısica, Universidad de Barcelona, Av. Diagonal 647, 08028 Barcelona, Espana.
Supervisors: Froila Palmeiro Nunez and Javier Garcıa Serrano†
Abstract: The aim of this work is to evaluate how the Quasi-Biennial Oscillation (QBO), whichdominates interannual variability in the tropical stratosphere, responds to different radiative forcingsin the EC-EARTH climate model version 3.3. Two sets of simulations have been used, consisting inthree atmosphere-only and three atmosphere-ocean coupled experiments, which are based on past,present and future conditions. The QBO influence on the extratropical circulation, formally knownas the Holton-Tan effect, has also been assessed during boreal winter (DJF). Results show a notoriousshortening of the QBO period and a clear weakening of the QBO amplitude under a warming climatein the coupled simulations; which do not show a significant impact on the Holton-Tan effect in thepolar vortex.
I. INTRODUCTION
The Quasi-Biennial Oscillation (QBO) is the dominantmode of climate variability in the equatorial strato-sphere, roughly extending between 5 and 100 hPa. TheQBO can be visualized as a shifting pattern of easterlyand westerly winds that propagate downward with aperiod ranging from 22 to 34 months, hence the namequasi-biennial, and a mean period of 28 months. Onaverage, this downward propagation takes place withoutloss of amplitude in the upper stratosphere, though itrapidly dampens below 20 hPa (23 km). A completeQBO cycle is then composed of an easterly (EQBO)and a westerly phase (WQBO), with the former usuallyhaving a greater amplitude, in absolute terms, and thelatter usually propagating downward at a higher rate.The QBO extends symmetrically across the equator,approximately between 6◦N and 6◦S, and around theentire equatorial belt (Baldwin 2001).
From a dynamical perspective, the QBO is drivenby upward propagating equatorial waves that arise inthe troposphere at tropical latitudes. In general terms,atmospheric waves can only propagate vertically whentheir frequency, ν, satisfies the condition f < ν < N ,where f is the Coriolis parameter and N is the buoyancyfrequency. This constraint implies that in mid-latitudesmost waves with periods in the order of days (low-frequency waves) are vertically trapped, thus only beingcapable of propagating horizontally. But at equatoriallatitudes, where f tends to 0, low-frequency waves canpropagate vertically. Thus, equatorial waves, which in-clude gravity, inertia-gravity, Kelvin and Rossby-gravity(R-g) waves (also known as Yanai waves), interactwith the mean flow by depositing energy, mainly inthe form of heat, and momentum, u′w′, in the upperstratosphere, where they develop an alternating pattern
∗ [email protected]† [email protected]; [email protected]
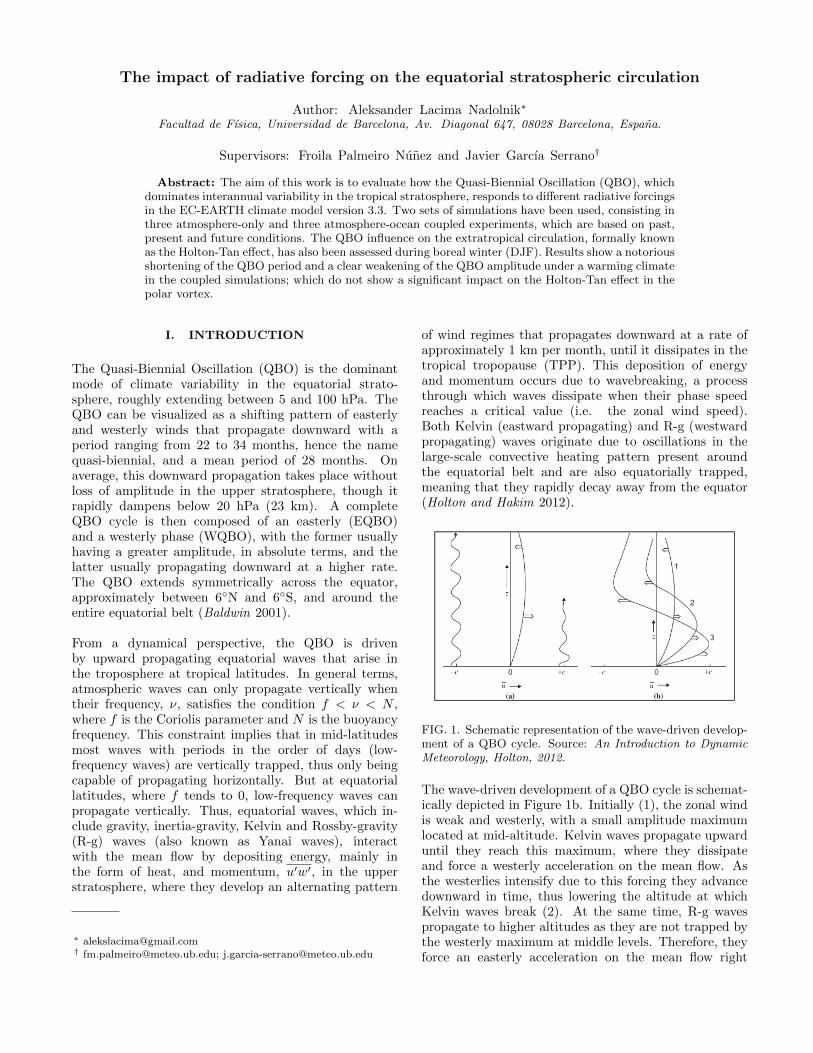
of wind regimes that propagates downward at a rate ofapproximately 1 km per month, until it dissipates in thetropical tropopause (TPP). This deposition of energyand momentum occurs due to wavebreaking, a processthrough which waves dissipate when their phase speedreaches a critical value (i.e. the zonal wind speed).Both Kelvin (eastward propagating) and R-g (westwardpropagating) waves originate due to oscillations in thelarge-scale convective heating pattern present aroundthe equatorial belt and are also equatorially trapped,meaning that they rapidly decay away from the equator(Holton and Hakim 2012).
FIG. 1. Schematic representation of the wave-driven develop-ment of a QBO cycle. Source: An Introduction to DynamicMeteorology, Holton, 2012.
The wave-driven development of a QBO cycle is schemat-ically depicted in Figure 1b. Initially (1), the zonal windis weak and westerly, with a small amplitude maximumlocated at mid-altitude. Kelvin waves propagate upwarduntil they reach this maximum, where they dissipateand force a westerly acceleration on the mean flow. Asthe westerlies intensify due to this forcing they advancedownward in time, thus lowering the altitude at whichKelvin waves break (2). At the same time, R-g wavespropagate to higher altitudes as they are not trapped bythe westerly maximum at middle levels. Therefore, theyforce an easterly acceleration on the mean flow right
The impact of radiative forcing on the equatorial stratospheric circulation Aleks Lacima
above the westerly region, developing easterly winds thatalso progress downward in time. This process continuesuntil the lower phase reaches the TPP and dissipates,leaving the lower and mid stratosphere dominated byeasterlies (3). At this point the cycle restarts again, butthis time with the westerly phase aloft.
It has been observed that equatorial waves providea significant fraction of the vertical momentum fluxneeded to drive the QBO. More specifically, Kelvinwaves (which have no meridional component, v′ = 0)transport westerly momentum, u′w′ > 0, into thestratosphere, thus providing a zonal momentum sourcefor the QBO to develop its westerly phase. On the otherhand, R-g waves also present a positive vertical westerlymomentum flux, u′w′ > 0, but their total impact onthe mean flow cannot be solely determined by thisvertical flux, as a strong meridional component, v′, isalso present. R-g waves thus present a strong polewardheat flux, v′T ′ > 0, which implies that the verticalcomponent of the Eliassen-Palm flux is non-zero:
Fz = ρ0f0Rv′T ′/(N2H) (1)
Where ρ0 is the reference air density, f0 is the referenceCoriolis parameter, N is the buoyancy frequency, H isthe scale height and R is the gas constant for dry air.Fz dominates over u′w′ resulting in a net transport ofeasterly momentum flux by R-g waves into the strato-sphere, thus providing a zonal momentum source for theQBO to develop its easterly phase. Even so, measuredmomentum fluxes due to Kelvin and R-g waves are notenough to account for the observed zonal accelerationsof the QBO. The rest of the required momentum flux isprovided by smaller scale waves generated by convectivestorms, such as gravity and inertia-gravity waves (Holtonand Hakim 2012).
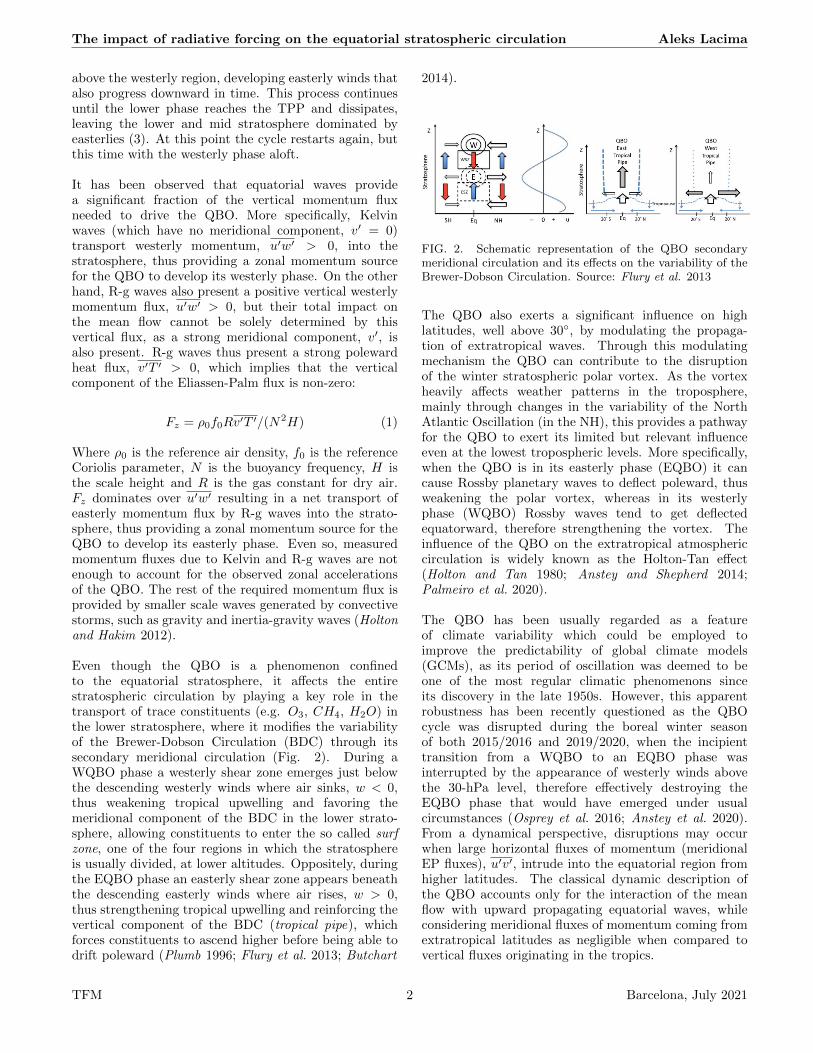
Even though the QBO is a phenomenon confinedto the equatorial stratosphere, it affects the entirestratospheric circulation by playing a key role in thetransport of trace constituents (e.g. O3, CH4, H2O) inthe lower stratosphere, where it modifies the variabilityof the Brewer-Dobson Circulation (BDC) through itssecondary meridional circulation (Fig. 2). During aWQBO phase a westerly shear zone emerges just belowthe descending westerly winds where air sinks, w < 0,thus weakening tropical upwelling and favoring themeridional component of the BDC in the lower strato-sphere, allowing constituents to enter the so called surfzone, one of the four regions in which the stratosphereis usually divided, at lower altitudes. Oppositely, duringthe EQBO phase an easterly shear zone appears beneaththe descending easterly winds where air rises, w > 0,thus strengthening tropical upwelling and reinforcing thevertical component of the BDC (tropical pipe), whichforces constituents to ascend higher before being able todrift poleward (Plumb 1996; Flury et al. 2013; Butchart
2014).
FIG. 2. Schematic representation of the QBO secondarymeridional circulation and its effects on the variability of theBrewer-Dobson Circulation. Source: Flury et al. 2013
The QBO also exerts a significant influence on highlatitudes, well above 30◦, by modulating the propaga-tion of extratropical waves. Through this modulatingmechanism the QBO can contribute to the disruptionof the winter stratospheric polar vortex. As the vortexheavily affects weather patterns in the troposphere,mainly through changes in the variability of the NorthAtlantic Oscillation (in the NH), this provides a pathwayfor the QBO to exert its limited but relevant influenceeven at the lowest tropospheric levels. More specifically,when the QBO is in its easterly phase (EQBO) it cancause Rossby planetary waves to deflect poleward, thusweakening the polar vortex, whereas in its westerlyphase (WQBO) Rossby waves tend to get deflectedequatorward, therefore strengthening the vortex. Theinfluence of the QBO on the extratropical atmosphericcirculation is widely known as the Holton-Tan effect(Holton and Tan 1980; Anstey and Shepherd 2014;Palmeiro et al. 2020).
The QBO has been usually regarded as a featureof climate variability which could be employed toimprove the predictability of global climate models(GCMs), as its period of oscillation was deemed to beone of the most regular climatic phenomenons sinceits discovery in the late 1950s. However, this apparentrobustness has been recently questioned as the QBOcycle was disrupted during the boreal winter seasonof both 2015/2016 and 2019/2020, when the incipienttransition from a WQBO to an EQBO phase wasinterrupted by the appearance of westerly winds abovethe 30-hPa level, therefore effectively destroying theEQBO phase that would have emerged under usualcircumstances (Osprey et al. 2016; Anstey et al. 2020).From a dynamical perspective, disruptions may occurwhen large horizontal fluxes of momentum (meridionalEP fluxes), u′v′, intrude into the equatorial region fromhigher latitudes. The classical dynamic description ofthe QBO accounts only for the interaction of the meanflow with upward propagating equatorial waves, whileconsidering meridional fluxes of momentum coming fromextratropical latitudes as negligible when compared tovertical fluxes originating in the tropics.
TFM 2 Barcelona, July 2021
The impact of radiative forcing on the equatorial stratospheric circulation Aleks Lacima
Anstey et al. (2021) suggest that the 15/16 wintertimedisruption occurred due to an usually large horizontalflux of momentum coming from higher latitudes in theNH, which arose from a very strong ENSO event. Onthe contrary, in the 19/20 disruption the meridionalEP flux originated in the SH, due to a change inthe meridional circulation caused by a minor suddenstratospheric warming (SSW). Futhermore, under awarming climate scenario these meridional EP fluxes areexpected to intensify, so that equatorward propagatingwaves would be theoretically capable of affecting theQBO and therefore lead to an increase in the numberof disruptions. If climate change causes the QBO tobe more easily and frequently disrupted this will havea direct impact on the predictive capabilities of GCMs(Anstey et al. 2021).
This work aims to investigate how variations inthe radiative forcing affect the simulated equatorialstratospheric circulation in a global climate modeland to explore how these changes may modify theQBO influence on the extratropical circulation. Thedifferent outcomes of using atmosphere-only and coupledsimulations are also considered.
II. DATA & METHODOLOGY
In this section we briefly describe the climate model andthe analyzed fields (Subsect. A), and also provide de-tails on the different methodologies employed for the dataanalysis (Subsect. B).
A. DATA
The data used in this work come from simulationsperformed with the EC-EARTH climate model version3.3. EC-EARTH is a global coupled model that includesseveral components of the climate system. It is basedon the Integrated Forecast System (IFS) atmospheremodel, cycle 36r4 in EC-EARTH3.3, developed at theEuropean Centre for Medium-Range Weather Fore-casts (ECMWF), coupled to the Nucleus for EuropeanModelling of the Ocean (NEMO) ocean model, version3.6 in EC-EARTH3.3. Details about the model andits components can be found in Doscher et al. (2021).The standard configuration of IFS in EC-EARTH3.3(hereafter, EC-EARTH) is at horizontal spectral resolu-tion T255 (triangular truncation at wavenumber 255),corresponding to 0.7◦ in longitude-latitude (∼80 km),with 91 vertical levels up to 0.01 hPa (L91). Two typesof simulations (hereafter, ’families’) have been analyzed:atmosphere-only simulations (ATM), where sea surfacetemperature (SST) and sea ice concentration (SIC) areprescribed according to the observed climatology over1988-2007, following the setup in QBOi from SPARC(Stratosphere-troposphere Processes And their Role inClimate; Butchart et al. 2018), using SST/SIC provided
by CMIP6 - Coupled Model Intercomparison Projectphase 6; and atmosphere-ocean coupled simulations(CPL), where the ocean is allowed to vary according toits interaction with the atmosphere. Three experimentshave been analyzed for each family of simulations, wherethe radiative forcing is kept fixed along the integration,including: well-mixed greenhouse gases (e.g. CO2, CH4,CFCs, N2O), aerosols, stratospheric ozone and solarinsolation. The three experiments are representativeof ’past’ (fixed at 1950), ’present’ (fixed at 2000) and’future’ (fixed at 2050) climate conditions, with theradiative forcing provided by CMIP6 according to ob-servational estimates for the historical scenarios (1950,2000) and projected values of the Shared SocioeconomicPathway (SSP) 2-4.5 for the future scenario (2050). Itis important to remark that the differences betweenradiative forcings are not linear, thus when evaluatingthe differences between ’past’, ’present’ and ’future’linear responses should not be expected as a result. Thesix simulations, three experiments per family, consistof 250 years after spin-up, namely a period of timeneeded for the simulation to stabilize and approximatelyreach a steady state. Note that this stationary state,not following transient, time-evolving conditions, doesnot necessarily apply to the deep ocean which wouldprobably drift for thousand of years.
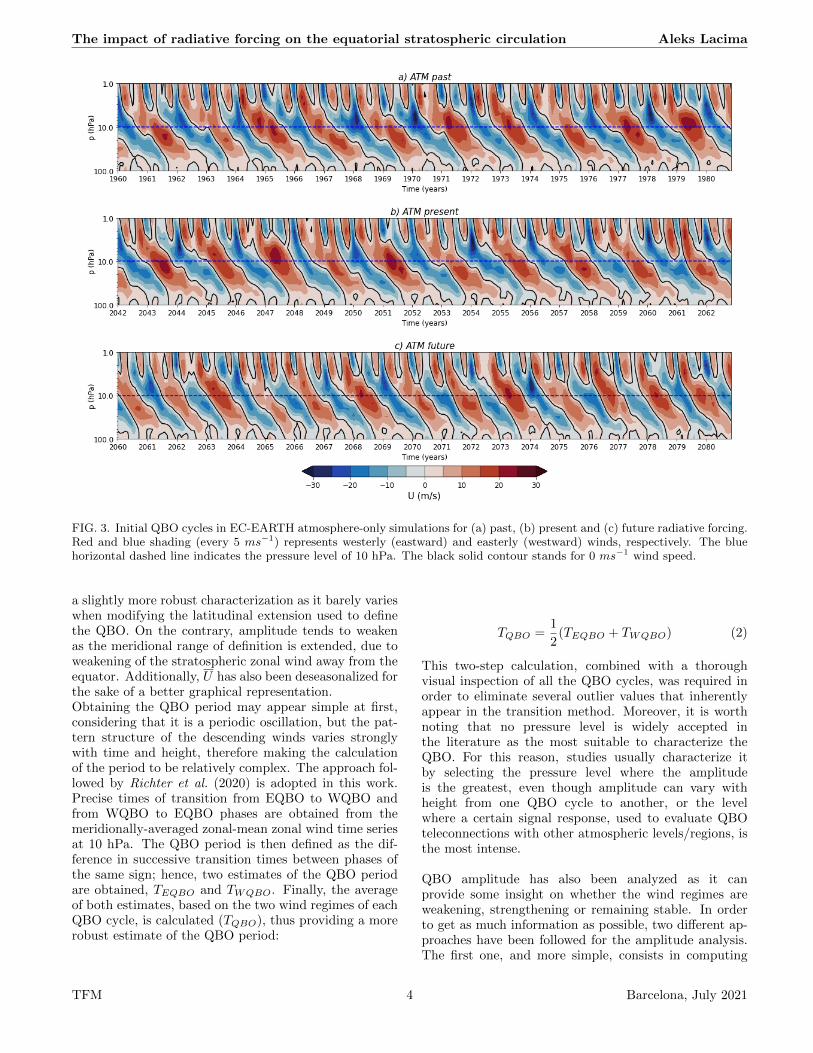
The QBO has been characterized using monthly-mean values of zonal-mean wind, U , meridionallyaveraged over 5◦S and 5◦N, for 28 vertical pressure levelsranging from 1000 hPa, at the surface, to 1 hPa, at thestratopause (STP). As the QBO is a purely stratosphericphenomenon it is entirely encompassed between 100 and1 hPa, which at equatorial latitudes equates roughlyto an altitude spanning from 16 to 50 km. Figures 3and 4 display the initial QBO cycles for each familyof experiments. Complete figures containing all thecycles for the 250-year period are not shown, thoughthey behave similarly to the initial ones shown in theaforementioned figures. U data, as a function of latitude,has also been employed to assess the Holton-Tan effecton the extratropical stratosphere.
Other fields have been extracted and analyzed, in-cluding: total precipitation (TP), air temperature(T), and geopotential height (Z), for both families ofexperiments, ATM and CPL; while SST has only beendiagnosed for CPL, as this field is prescribed in ATM.
B. METHODOLOGY
The QBO can be characterized in different ways, being itsamplitude (maximum/minimum wind speed) at a certainpressure level and its period of oscillation, (complete cy-cle of EQBO and WQBO phases) the key metrics. In thiswork we have mainly focused on the latter, as it allowsfor a more robust characterization of the QBO, thoughamplitudes have also been examined. The period offers
TFM 3 Barcelona, July 2021
The impact of radiative forcing on the equatorial stratospheric circulation Aleks Lacima
FIG. 3. Initial QBO cycles in EC-EARTH atmosphere-only simulations for (a) past, (b) present and (c) future radiative forcing.Red and blue shading (every 5 ms−1) represents westerly (eastward) and easterly (westward) winds, respectively. The bluehorizontal dashed line indicates the pressure level of 10 hPa. The black solid contour stands for 0 ms−1 wind speed.
a slightly more robust characterization as it barely varieswhen modifying the latitudinal extension used to definethe QBO. On the contrary, amplitude tends to weakenas the meridional range of definition is extended, due toweakening of the stratospheric zonal wind away from theequator. Additionally, U has also been deseasonalized forthe sake of a better graphical representation.Obtaining the QBO period may appear simple at first,considering that it is a periodic oscillation, but the pat-tern structure of the descending winds varies stronglywith time and height, therefore making the calculationof the period to be relatively complex. The approach fol-lowed by Richter et al. (2020) is adopted in this work.Precise times of transition from EQBO to WQBO andfrom WQBO to EQBO phases are obtained from themeridionally-averaged zonal-mean zonal wind time seriesat 10 hPa. The QBO period is then defined as the dif-ference in successive transition times between phases ofthe same sign; hence, two estimates of the QBO periodare obtained, TEQBO and TWQBO. Finally, the averageof both estimates, based on the two wind regimes of eachQBO cycle, is calculated (TQBO), thus providing a morerobust estimate of the QBO period:
TQBO =1
2(TEQBO + TWQBO) (2)
This two-step calculation, combined with a thoroughvisual inspection of all the QBO cycles, was required inorder to eliminate several outlier values that inherentlyappear in the transition method. Moreover, it is worthnoting that no pressure level is widely accepted inthe literature as the most suitable to characterize theQBO. For this reason, studies usually characterize itby selecting the pressure level where the amplitudeis the greatest, even though amplitude can vary withheight from one QBO cycle to another, or the levelwhere a certain signal response, used to evaluate QBOteleconnections with other atmospheric levels/regions, isthe most intense.
QBO amplitude has also been analyzed as it canprovide some insight on whether the wind regimes areweakening, strengthening or remaining stable. In orderto get as much information as possible, two different ap-proaches have been followed for the amplitude analysis.The first one, and more simple, consists in computing
TFM 4 Barcelona, July 2021

The impact of radiative forcing on the equatorial stratospheric circulation Aleks Lacima
FIG. 4. Initial QBO cycles in EC-EARTH atmosphere-ocean coupled simulations for (a) past, (b) present and (c) future radiativeforcing. Red and blue shading (every 5 ms−1) represents westerly (eastward) and easterly (westward) winds, respectively. Theblue horizontal dashed line indicates the pressure level of 10 hPa. The black solid contour stands for 0 ms−1 wind speed.
the mean amplitude for EQBO and WQBO phases atthe 10- and 50-hPa levels. The second approach, slightlymore complex, is based on identifying the maximumamplitude for each time instant at any pressure levelbetween 50 and 5 hPa. Two amplitude series arethus obtained, one for each QBO phase, allowing tocalculate the mean pressure level at which the maximumamplitude occurs. Variations in amplitude and in thepressure level at which this maximum amplitude occursprovide information on whether the QBO is changingunder different radiative forcings.
The analysis of TP, T and SST has been verysimilar, i.e. comparing differences in the climatologicalfield between experiments. This approach allows tostudy the effect of increasing radiative forcing, byanalysing the differences between experiments of thesame family, as well as the effect of ocean coupling,by examining the differences between experiments ofdifferent families. In this work we have mainly focusedon the former, as assessing the impact of air-sea interac-tion is out of the scope of this study, and it is left forfuture analyses. U data has also been used to evaluatethe Holton-Tan effect on the extratropical stratosphere.
Finally, in order to assess if the obtained results arestatistically significant, a t-test for difference of meansis used. A two-tailed Welch t-test is performed betweenpairs of data series. Similarly to Student’s t-test, Welch’st-test assumes that the sample’s underlying distributionadopts a Gaussian form, but it differs from the formerin considering unequal variances between populations.A significance level of α = 0.01 has been used.
III. RESULTS & DISCUSSION
A. QBO Period & Amplitude
Performed analyses clearly show that under a warmingclimate the QBO cycle suffers a marked acceleration(Fig. 5), a behaviour that is more notorious in the CPLfamily, where the increase in temporal variability is alsoimportant, as it can be seen from the increasing spreadin the probability density functions (PDFs).It can be therefore inferred that the coupling with theocean is the main reason behind the observed increase ofvariability in the QBO period. In the CPL simulationsthe number of cycles increases by approximately a 50%
TFM 5 Barcelona, July 2021

The impact of radiative forcing on the equatorial stratospheric circulation Aleks Lacima
TABLE I. QBO amplitude in m/s.
Experiment WQBO10 EQBO10 WQBO50 EQBO50 WQBOm EQBOm pWlev(hPa) pElev(hPa)
ATM past 7.6 -17.0 4.9 -5.7 8.3 -26.3 24.6 9.7ATM present 6.5 -17.5 4.9 -4.8 7.9 -26.3 25.8 9.7ATM future 6.8 -15.4 4.3 -5.6 7.6 -24.8 24.7 9.6
CPL past 6.7 -17.7 5.1 -5.6 7.8 -25.2 25.9 10.7CPL present 6.7 -17.3 4.8 -4.9 7.9 -25.2 24.8 10.1CPL future 8.5 -12.6 2.5 -2.4 9.4 -23.3 15.7 6.6
between the past and future experiments, whereas themean period decreases by 7 months.
FIG. 5. Probability density functions of the QBO period forthree atmosphere-only (ATM) and atmosphere-ocean coupled(CPL) simulations.
On contrast, in the ATM family one can notice that theeffect of increased forcing is to moderately accelerate theQBO, while having a negligible impact on its variability.In this case the number of cycles rises roughly a 25%,while the mean period decreases approximately by 4months. Thus, the coupling with the ocean can also beaccounted for further accelerating the QBO with respectto the atmosphere-only simulations.The differences in mean period that appear in Fig. 5were found to be statistically significant at the 99% con-fidence level for all the experiments, with the exceptionof the differences between present and past, which werefound to not be statistically significant for both familiesof simulations.
The performed analysis on QBO amplitude is con-densed in Table I. For the ATM family the meanmaximum amplitudes, WQBOm and EQBOm, and thepressure levels where these amplitudes occur, pWlev andpElev, remain generally stable, without showing anysignificant variations and therefore no signs of weakeningor strengthening. As for the CPL family, there are im-portant variations both in amplitude and pressure levelbetween CPL future and the other two experiments. Theamplitude of the WQBO phase increases by almost 2
ms−1 and the pressure level moves upward from around25 (31 km) to 16 hPa (35 km). On the other hand, theamplitude of the EQBO phase decreases between 2 and5 ms−1, depending on the levels considered, whereas thepressure level moves upward from around 10 (39 km)to 7 hPa (42 km), with an increase in height similarto the one observed for the WQBO phase. The riseof the pressure level occurs due to severe weakening ofthe amplitude at lower levels (around 50 hPa) in CPLfuture, as both WQBO50 and EQBO50 suffer a decreaseof roughly a 50 %.
Considering the established literature, the mostplausible explanation for the observed weakening isincreased tropical upwelling, associated to the BDC,in the lower stratosphere. Current climate projectionsimply that rising sea surface and air temperatures inthe tropical troposphere will lead to an increase in deeptropical convection. Under such conditions, equatorialwaves would be capable of carrying more energy andmomentum upward, thus exerting a more intense wavedrag at high (low) tropospheric (stratospheric) levelswhen breaking. Stronger wave drag leads to enhancedtropical upwelling, which directly opposes the QBOdownward progression by effectively dampening itsamplitude in the lower stratosphere (Kawatani andHamilton 2013; Butchart 2014; Anstey and Shepherd2014).The amplitude and pressure level differences betweenATM experiments were found to not be statisticallysignificant, except for the EQBO amplitude betweenATM future and the other two ATM experiments (TableI). On contrast, the difference between CPL futureand the other two CPL experiments was found to bestatistically significant at the 99 % confidence level forall values.
B. Deep tropical convection
The simplest explanation for an accelerated QBO isincreased wave-activity in the equatorial tropospheredue to a marked increase in convection. Being so, weexpect changes in the TP, SST and T fields at tropicallatitudes to give us an explanation for the observedbehaviour. There are no remarkable differences in theTP field between present and past simulations (Fig.6a-b), but there is an important rise in precipitation
TFM 6 Barcelona, July 2021
The impact of radiative forcing on the equatorial stratospheric circulation Aleks Lacima
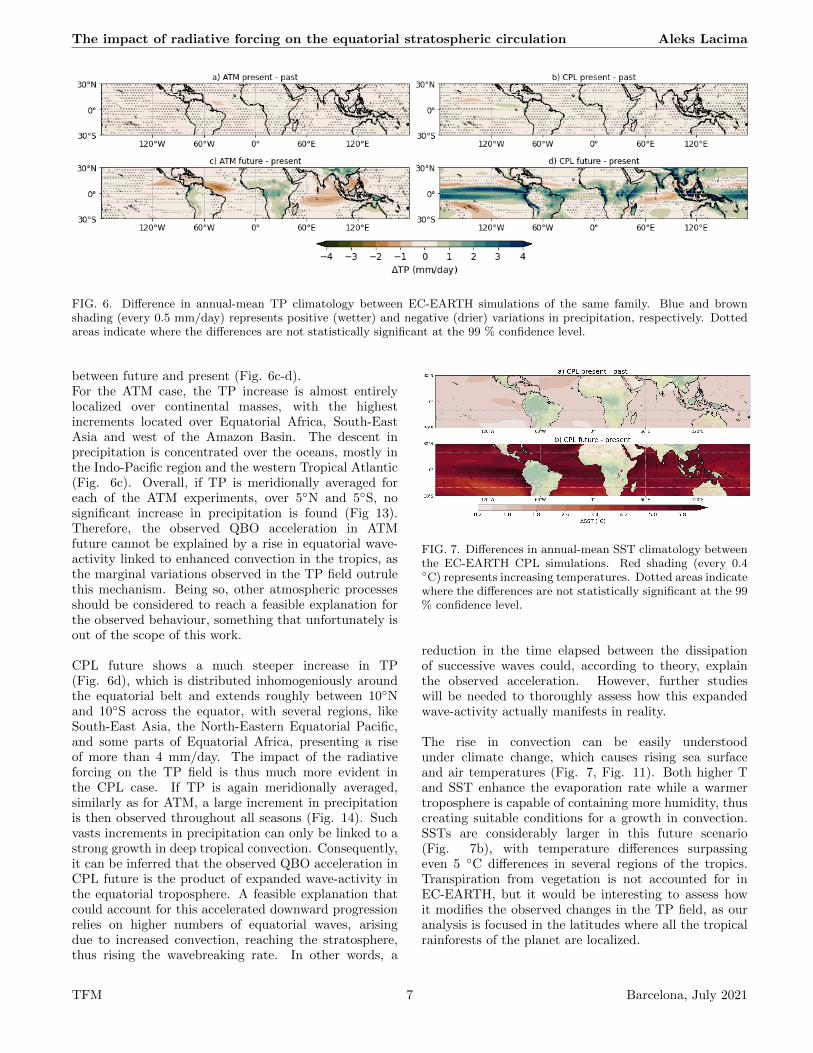
FIG. 6. Difference in annual-mean TP climatology between EC-EARTH simulations of the same family. Blue and brownshading (every 0.5 mm/day) represents positive (wetter) and negative (drier) variations in precipitation, respectively. Dottedareas indicate where the differences are not statistically significant at the 99 % confidence level.
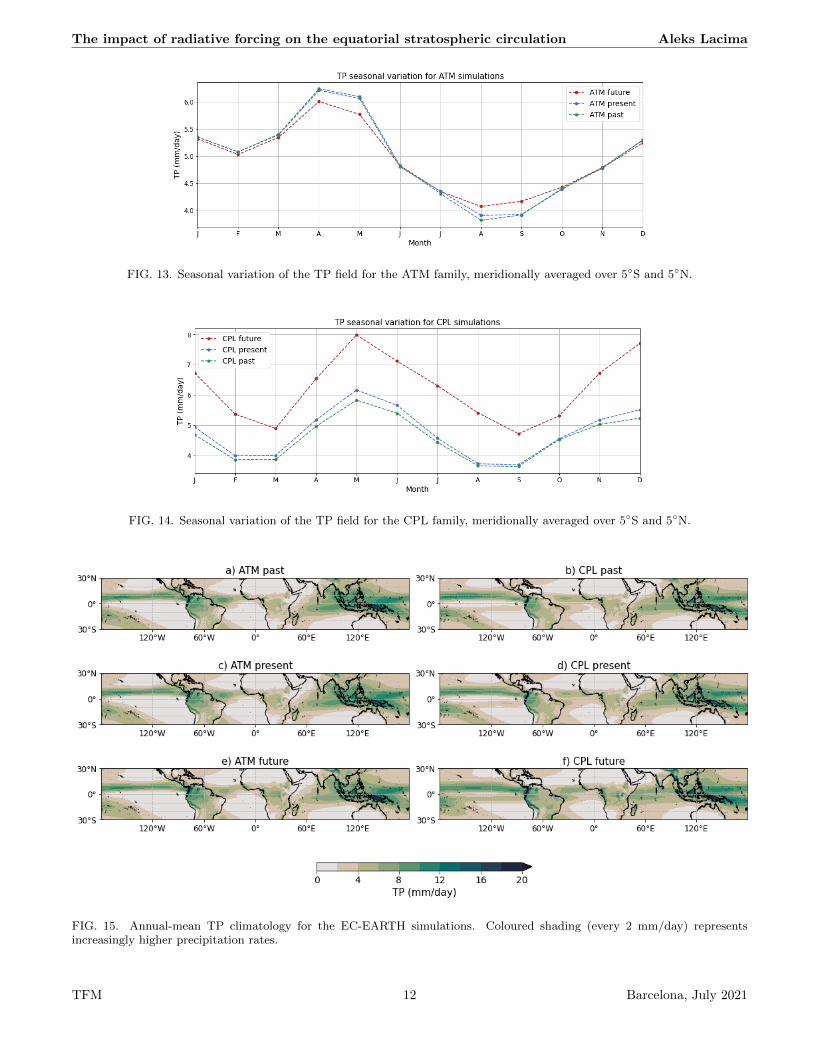
between future and present (Fig. 6c-d).For the ATM case, the TP increase is almost entirelylocalized over continental masses, with the highestincrements located over Equatorial Africa, South-EastAsia and west of the Amazon Basin. The descent inprecipitation is concentrated over the oceans, mostly inthe Indo-Pacific region and the western Tropical Atlantic(Fig. 6c). Overall, if TP is meridionally averaged foreach of the ATM experiments, over 5◦N and 5◦S, nosignificant increase in precipitation is found (Fig 13).Therefore, the observed QBO acceleration in ATMfuture cannot be explained by a rise in equatorial wave-activity linked to enhanced convection in the tropics, asthe marginal variations observed in the TP field outrulethis mechanism. Being so, other atmospheric processesshould be considered to reach a feasible explanation forthe observed behaviour, something that unfortunately isout of the scope of this work.
CPL future shows a much steeper increase in TP(Fig. 6d), which is distributed inhomogeniously aroundthe equatorial belt and extends roughly between 10◦Nand 10◦S across the equator, with several regions, likeSouth-East Asia, the North-Eastern Equatorial Pacific,and some parts of Equatorial Africa, presenting a riseof more than 4 mm/day. The impact of the radiativeforcing on the TP field is thus much more evident inthe CPL case. If TP is again meridionally averaged,similarly as for ATM, a large increment in precipitationis then observed throughout all seasons (Fig. 14). Suchvasts increments in precipitation can only be linked to astrong growth in deep tropical convection. Consequently,it can be inferred that the observed QBO acceleration inCPL future is the product of expanded wave-activity inthe equatorial troposphere. A feasible explanation thatcould account for this accelerated downward progressionrelies on higher numbers of equatorial waves, arisingdue to increased convection, reaching the stratosphere,thus rising the wavebreaking rate. In other words, a
FIG. 7. Differences in annual-mean SST climatology betweenthe EC-EARTH CPL simulations. Red shading (every 0.4◦C) represents increasing temperatures. Dotted areas indicatewhere the differences are not statistically significant at the 99% confidence level.
reduction in the time elapsed between the dissipationof successive waves could, according to theory, explainthe observed acceleration. However, further studieswill be needed to thoroughly assess how this expandedwave-activity actually manifests in reality.
The rise in convection can be easily understoodunder climate change, which causes rising sea surfaceand air temperatures (Fig. 7, Fig. 11). Both higher Tand SST enhance the evaporation rate while a warmertroposphere is capable of containing more humidity, thuscreating suitable conditions for a growth in convection.SSTs are considerably larger in this future scenario(Fig. 7b), with temperature differences surpassingeven 5 ◦C differences in several regions of the tropics.Transpiration from vegetation is not accounted for inEC-EARTH, but it would be interesting to assess howit modifies the observed changes in the TP field, as ouranalysis is focused in the latitudes where all the tropicalrainforests of the planet are localized.
TFM 7 Barcelona, July 2021
The impact of radiative forcing on the equatorial stratospheric circulation Aleks Lacima
Atmosphere-only simulations in EC-EARTH cor-rectly reproduce the QBO and even partially displaythe effects caused by a greater radiative forcing, butfail to consistently capture the expected impacts onother fields that would, according to theory, accountfor the observed acceleration. Thus, it appears thatatmosphere-ocean coupling cannot be neglected whentrying to understand how the stratospheric circulationchanges under a warming climate, as it provides a morerealistic workframe. For this reason, the last sectionof this work focuses only on the CPL experiments, asthey have proven to be more reliable in providing anexplanation for the obtained results.
C. The future QBO
Considering the established literature, CPL future isprobably the experiment that best captures the effectsof a warming climate on the QBO (Fig. 4c). It showsa steep acceleration in the QBO cycle that is expectedunder increased convection and expanded wave-activity,and presents a severely weakened amplitude in the lowerstratosphere that is also expected due to intensified tropi-cal upwelling under climate change. Additionally, thoughit is hard to evaluate thoroughly, CPL future does notoutrule the occurrence of QBO disruptions (Taguchi2010; Kawatani and Hamilton 2013).
FIG. 8. Two disrupted QBO cycles found in CPL present.
For the EC-EARTH simulations analyzed in this work,disruptions are observed in CPL present and for only 2QBO cycles from a total of 128 (Fig. 8). These twowesterly disruptions occur after nearly 150 years havepassed from the start in 2042, and with only two com-plete QBO cycles between them. Perhaps the most re-markable feature is their mere appearance, as it impliesthat EC-EARTH (and potentially other GCMs too) is ca-pable of reproducing the occurrence of disruptions, butonly in atmosphere-ocean coupled simulations, as disrup-tions were not observed in the ATM experiments.The main conclusion to be extracted here is that the in-teraction between ocean and atmosphere is somehow re-sponsible of either increasing the flux of westerly momen-tum or reducing the easterly one. A combination of botheffects could also be possible, but either way there needsto be at least a relative increase in the westerly momen-tum flux, as both the real observed disruptions and theEC-EARTH ones are composed of westerly winds. Thisanomalous increment in u′v′ is only possible through in-trusions of large horizontal fluxes of momentum coming
from extratropical latitudes, as Kelvin or other eastwardpropagating waves would be vertically trapped by thedescending WQBO phase (Anstey et al. 2021).
D. Holton-Tan effect
Due to the limited nature of this work the assessmentof the Holton-Tan effect has only been conducted forthe NH, as the results were found to be clearer thanin the SH. Composites of zonal-mean zonal wind andgeopotential height have been constructed to evaluatehow the different radiative forcings affect the QBOinfluence on the extratropical circulation.
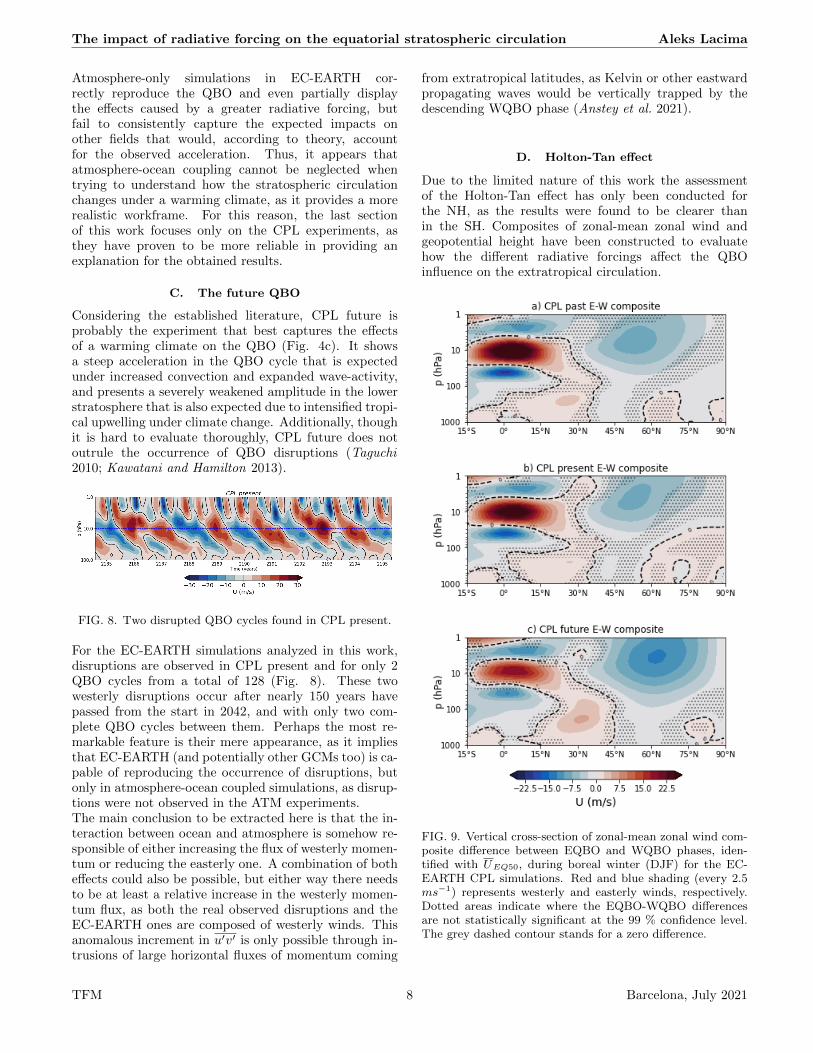
FIG. 9. Vertical cross-section of zonal-mean zonal wind com-posite difference between EQBO and WQBO phases, iden-tified with UEQ50, during boreal winter (DJF) for the EC-EARTH CPL simulations. Red and blue shading (every 2.5ms−1) represents westerly and easterly winds, respectively.Dotted areas indicate where the EQBO-WQBO differencesare not statistically significant at the 99 % confidence level.The grey dashed contour stands for a zero difference.
TFM 8 Barcelona, July 2021
The impact of radiative forcing on the equatorial stratospheric circulation Aleks Lacima
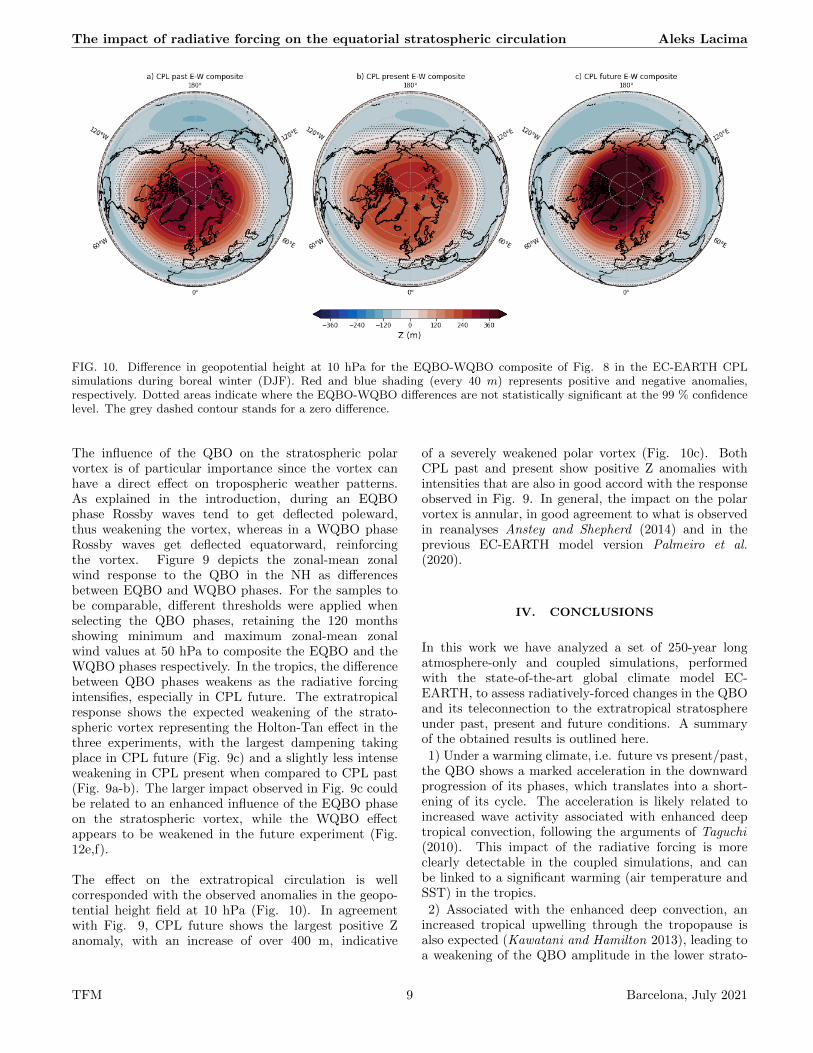
FIG. 10. Difference in geopotential height at 10 hPa for the EQBO-WQBO composite of Fig. 8 in the EC-EARTH CPLsimulations during boreal winter (DJF). Red and blue shading (every 40 m) represents positive and negative anomalies,respectively. Dotted areas indicate where the EQBO-WQBO differences are not statistically significant at the 99 % confidencelevel. The grey dashed contour stands for a zero difference.
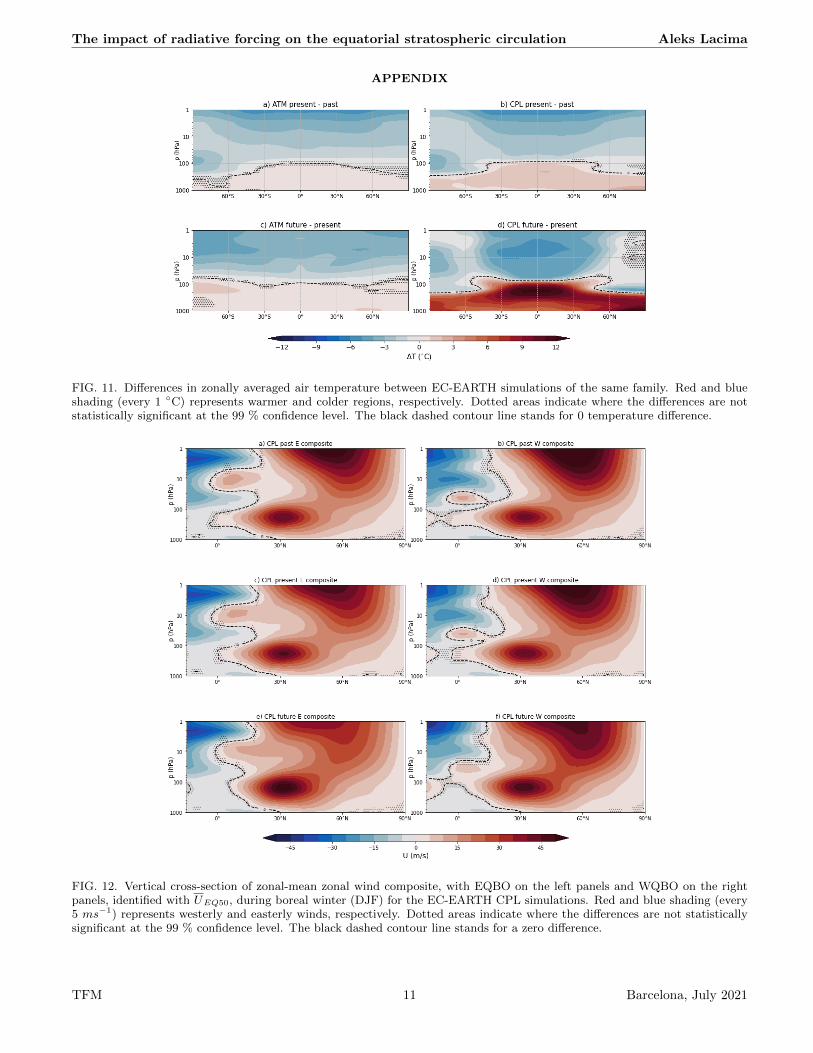
The influence of the QBO on the stratospheric polarvortex is of particular importance since the vortex canhave a direct effect on tropospheric weather patterns.As explained in the introduction, during an EQBOphase Rossby waves tend to get deflected poleward,thus weakening the vortex, whereas in a WQBO phaseRossby waves get deflected equatorward, reinforcingthe vortex. Figure 9 depicts the zonal-mean zonalwind response to the QBO in the NH as differencesbetween EQBO and WQBO phases. For the samples tobe comparable, different thresholds were applied whenselecting the QBO phases, retaining the 120 monthsshowing minimum and maximum zonal-mean zonalwind values at 50 hPa to composite the EQBO and theWQBO phases respectively. In the tropics, the differencebetween QBO phases weakens as the radiative forcingintensifies, especially in CPL future. The extratropicalresponse shows the expected weakening of the strato-spheric vortex representing the Holton-Tan effect in thethree experiments, with the largest dampening takingplace in CPL future (Fig. 9c) and a slightly less intenseweakening in CPL present when compared to CPL past(Fig. 9a-b). The larger impact observed in Fig. 9c couldbe related to an enhanced influence of the EQBO phaseon the stratospheric vortex, while the WQBO effectappears to be weakened in the future experiment (Fig.12e,f).
The effect on the extratropical circulation is wellcorresponded with the observed anomalies in the geopo-tential height field at 10 hPa (Fig. 10). In agreementwith Fig. 9, CPL future shows the largest positive Zanomaly, with an increase of over 400 m, indicative
of a severely weakened polar vortex (Fig. 10c). BothCPL past and present show positive Z anomalies withintensities that are also in good accord with the responseobserved in Fig. 9. In general, the impact on the polarvortex is annular, in good agreement to what is observedin reanalyses Anstey and Shepherd (2014) and in theprevious EC-EARTH model version Palmeiro et al.(2020).
IV. CONCLUSIONS
In this work we have analyzed a set of 250-year longatmosphere-only and coupled simulations, performedwith the state-of-the-art global climate model EC-EARTH, to assess radiatively-forced changes in the QBOand its teleconnection to the extratropical stratosphereunder past, present and future conditions. A summaryof the obtained results is outlined here.
1) Under a warming climate, i.e. future vs present/past,the QBO shows a marked acceleration in the downwardprogression of its phases, which translates into a short-ening of its cycle. The acceleration is likely related toincreased wave activity associated with enhanced deeptropical convection, following the arguments of Taguchi(2010). This impact of the radiative forcing is moreclearly detectable in the coupled simulations, and canbe linked to a significant warming (air temperature andSST) in the tropics.
2) Associated with the enhanced deep convection, anincreased tropical upwelling through the tropopause isalso expected (Kawatani and Hamilton 2013), leading toa weakening of the QBO amplitude in the lower strato-
TFM 9 Barcelona, July 2021
The impact of radiative forcing on the equatorial stratospheric circulation Aleks Lacima
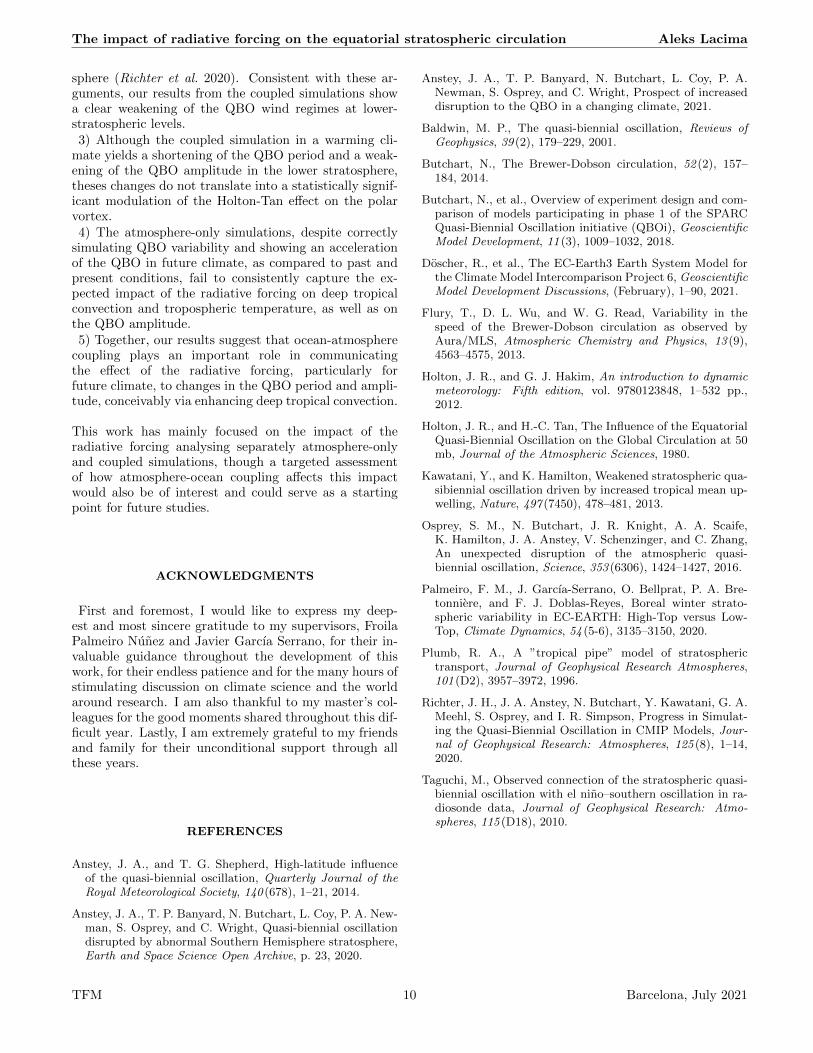
sphere (Richter et al. 2020). Consistent with these ar-guments, our results from the coupled simulations showa clear weakening of the QBO wind regimes at lower-stratospheric levels.3) Although the coupled simulation in a warming cli-
mate yields a shortening of the QBO period and a weak-ening of the QBO amplitude in the lower stratosphere,theses changes do not translate into a statistically signif-icant modulation of the Holton-Tan effect on the polarvortex.4) The atmosphere-only simulations, despite correctly
simulating QBO variability and showing an accelerationof the QBO in future climate, as compared to past andpresent conditions, fail to consistently capture the ex-pected impact of the radiative forcing on deep tropicalconvection and tropospheric temperature, as well as onthe QBO amplitude.5) Together, our results suggest that ocean-atmosphere
coupling plays an important role in communicatingthe effect of the radiative forcing, particularly forfuture climate, to changes in the QBO period and ampli-tude, conceivably via enhancing deep tropical convection.
This work has mainly focused on the impact of theradiative forcing analysing separately atmosphere-onlyand coupled simulations, though a targeted assessmentof how atmosphere-ocean coupling affects this impactwould also be of interest and could serve as a startingpoint for future studies.
ACKNOWLEDGMENTS
First and foremost, I would like to express my deep-est and most sincere gratitude to my supervisors, FroilaPalmeiro Nunez and Javier Garcıa Serrano, for their in-valuable guidance throughout the development of thiswork, for their endless patience and for the many hours ofstimulating discussion on climate science and the worldaround research. I am also thankful to my master’s col-leagues for the good moments shared throughout this dif-ficult year. Lastly, I am extremely grateful to my friendsand family for their unconditional support through allthese years.
REFERENCES
Anstey, J. A., and T. G. Shepherd, High-latitude influenceof the quasi-biennial oscillation, Quarterly Journal of theRoyal Meteorological Society, 140 (678), 1–21, 2014.
Anstey, J. A., T. P. Banyard, N. Butchart, L. Coy, P. A. New-man, S. Osprey, and C. Wright, Quasi-biennial oscillationdisrupted by abnormal Southern Hemisphere stratosphere,Earth and Space Science Open Archive, p. 23, 2020.
Anstey, J. A., T. P. Banyard, N. Butchart, L. Coy, P. A.Newman, S. Osprey, and C. Wright, Prospect of increaseddisruption to the QBO in a changing climate, 2021.
Baldwin, M. P., The quasi-biennial oscillation, Reviews ofGeophysics, 39 (2), 179–229, 2001.
Butchart, N., The Brewer-Dobson circulation, 52 (2), 157–184, 2014.
Butchart, N., et al., Overview of experiment design and com-parison of models participating in phase 1 of the SPARCQuasi-Biennial Oscillation initiative (QBOi), GeoscientificModel Development, 11 (3), 1009–1032, 2018.
Doscher, R., et al., The EC-Earth3 Earth System Model forthe Climate Model Intercomparison Project 6, GeoscientificModel Development Discussions, (February), 1–90, 2021.
Flury, T., D. L. Wu, and W. G. Read, Variability in thespeed of the Brewer-Dobson circulation as observed byAura/MLS, Atmospheric Chemistry and Physics, 13 (9),4563–4575, 2013.
Holton, J. R., and G. J. Hakim, An introduction to dynamicmeteorology: Fifth edition, vol. 9780123848, 1–532 pp.,2012.
Holton, J. R., and H.-C. Tan, The Influence of the EquatorialQuasi-Biennial Oscillation on the Global Circulation at 50mb, Journal of the Atmospheric Sciences, 1980.
Kawatani, Y., and K. Hamilton, Weakened stratospheric qua-sibiennial oscillation driven by increased tropical mean up-welling, Nature, 497 (7450), 478–481, 2013.
Osprey, S. M., N. Butchart, J. R. Knight, A. A. Scaife,K. Hamilton, J. A. Anstey, V. Schenzinger, and C. Zhang,An unexpected disruption of the atmospheric quasi-biennial oscillation, Science, 353 (6306), 1424–1427, 2016.
Palmeiro, F. M., J. Garcıa-Serrano, O. Bellprat, P. A. Bre-tonniere, and F. J. Doblas-Reyes, Boreal winter strato-spheric variability in EC-EARTH: High-Top versus Low-Top, Climate Dynamics, 54 (5-6), 3135–3150, 2020.
Plumb, R. A., A ”tropical pipe” model of stratospherictransport, Journal of Geophysical Research Atmospheres,101 (D2), 3957–3972, 1996.
Richter, J. H., J. A. Anstey, N. Butchart, Y. Kawatani, G. A.Meehl, S. Osprey, and I. R. Simpson, Progress in Simulat-ing the Quasi-Biennial Oscillation in CMIP Models, Jour-nal of Geophysical Research: Atmospheres, 125 (8), 1–14,2020.
Taguchi, M., Observed connection of the stratospheric quasi-biennial oscillation with el nino–southern oscillation in ra-diosonde data, Journal of Geophysical Research: Atmo-spheres, 115 (D18), 2010.
TFM 10 Barcelona, July 2021
The impact of radiative forcing on the equatorial stratospheric circulation Aleks Lacima
APPENDIX
FIG. 11. Differences in zonally averaged air temperature between EC-EARTH simulations of the same family. Red and blueshading (every 1 ◦C) represents warmer and colder regions, respectively. Dotted areas indicate where the differences are notstatistically significant at the 99 % confidence level. The black dashed contour line stands for 0 temperature difference.
FIG. 12. Vertical cross-section of zonal-mean zonal wind composite, with EQBO on the left panels and WQBO on the rightpanels, identified with UEQ50, during boreal winter (DJF) for the EC-EARTH CPL simulations. Red and blue shading (every5 ms−1) represents westerly and easterly winds, respectively. Dotted areas indicate where the differences are not statisticallysignificant at the 99 % confidence level. The black dashed contour line stands for a zero difference.
TFM 11 Barcelona, July 2021
The impact of radiative forcing on the equatorial stratospheric circulation Aleks Lacima
FIG. 13. Seasonal variation of the TP field for the ATM family, meridionally averaged over 5◦S and 5◦N.
FIG. 14. Seasonal variation of the TP field for the CPL family, meridionally averaged over 5◦S and 5◦N.
FIG. 15. Annual-mean TP climatology for the EC-EARTH simulations. Coloured shading (every 2 mm/day) representsincreasingly higher precipitation rates.
TFM 12 Barcelona, July 2021