
Technical Note - Phase-II WP2000 & WP2100 SMOS Report on ...
47
European Centre for Medium-Range Weather Forecasts Europäisches Zentrum für mittelfristige Wettervorhersage Centre européen pour les prévisions météorologiques à moyen terme ESA CONTRACT REPORT Contract Report to the European Space Agency Technical Note - Phase-II WP2000 & WP2100 SMOS Report on Level 3 root zone soil moisture & DA Impact Joaqu´ ın Mu˜ noz Sabater, Patricia de Rosnay, Cl´ ement Albergel, Lars Isaksen ESA/ESRIN Contract 4000101703/10/NL/FF/fk
Transcript of Technical Note - Phase-II WP2000 & WP2100 SMOS Report on ...
European Centre for Medium-Range Weather Forecasts
Europäisches Zentrum für mittelfristige Wettervorhersage
Centre européen pour les prévisions météorologiques à moyen terme
ESA CONTRACT REPORT
Contract Report to the European Space Agency
Technical Note - Phase-IIWP2000 & WP2100SMOS Report on Level 3 root zonesoil moisture & DA Impact
Joaquın Munoz Sabater,Patricia de Rosnay, ClementAlbergel, Lars Isaksen
ESA/ESRIN Contract 4000101703/10/NL/FF/fk

Series: ECMWF ESA Project Report Series
A full list of ECMWF Publications can be found on our web site under:http://www.ecmwf.int/publications/
Contact: [email protected]
c©Copyright 2014
European Centre for Medium Range Weather ForecastsShinfield Park, Reading, RG2 9AX, England
Literary and scientific copyrights belong to ECMWF and are reserved in all countries. This publication is notto be reprinted or translated in whole or in part without the written permission of the Director-General. Appro-priate non-commercial use will normally be granted under the condition that reference is made to ECMWF.
The information within this publication is given in good faith and considered to be true, but ECMWF acceptsno liability for error, omission and for loss or damage arising from its use.

Contract Report to the European Space Agency
Technical Note - Phase-IIWP2000 & WP2100
SMOS Report on Level 3 root zone soil moisture & DAImpact
Authors: Joaquın Munoz Sabater,Patricia de Rosnay,Clement Albergel,
Lars IsaksenESA/ESRIN Contract 4000101703/10/NL/FF/fk
European Centre for Medium-Range Weather Forecasts
Shinfield Park, Reading, Berkshire, UK
February 2014

Name Company
First version prepared by ECMWF(April 2013)
Quality Visa ECMWF
Application Authorized by ESA/ESRIN
Distribution list:ESA/ESRINSusanne MecklenburgESA ESRIN Documentation Desk
SERCORaffaele Crapolicchio
ESA/ESTECMatthias Drusch
ECMWFHRDivision & Section Heads

ESA report on Level 3 root-zone soil moisture & DA impact
Contents
1 Introduction 2
2 Root-zone soil moisture algorithm and production chain 5
2.1 H-TESSEL . . . . . . . . . . . . . . . . . . . . . . . . . . . . . . . . . . . . . . . . . . . . 5
2.2 CMEM . . . . . . . . . . . . . . . . . . . . . . . . . . . . . . . . . . . . . . . . . . . . . . 6
2.3 EKF . . . . . . . . . . . . . . . . . . . . . . . . . . . . . . . . . . . . . . . . . . . . . . . . 7
2.3.1 Product specifications. . . . . . . . . . . . . . . . . . . . . . . . . . . . . . . . . . 8
2.3.2 Observations configuration. . . . . . . . . . . . . . . . . . . . . . . . . . . . . . . . 8
2.3.3 SEKF setup. . . . . . . . . . . . . . . . . . . . . . . . . . . . . . . . . . . . . . . . 9
2.3.4 Experiments . . . . . . . . . . . . . . . . . . . . . . . . . . . . . . . . . . . . . . . 10
3 Data Assimilation Impact 11
3.1 Soil Moisture . . . . . . . . . . . . . . . . . . . . . . . . . . . . . . . . . . . . . . . . . . . 11
3.1.1 Description of the in-situ networks. . . . . . . . . . . . . . . . . . . . . . . . . . . . 11
3.1.2 Validation results. . . . . . . . . . . . . . . . . . . . . . . . . . . . . . . . . . . . . 14
3.2 Soil and 2 metre temperature. . . . . . . . . . . . . . . . . . . . . . . . . . . . . . . . . . . 15
3.3 Atmospheric impact. . . . . . . . . . . . . . . . . . . . . . . . . . . . . . . . . . . . . . . . 17
3.3.1 Precipitation . . . . . . . . . . . . . . . . . . . . . . . . . . . . . . . . . . . . . . . 17
3.3.2 Mean change in the forecast field. . . . . . . . . . . . . . . . . . . . . . . . . . . . 17
3.3.3 Verification . . . . . . . . . . . . . . . . . . . . . . . . . . . . . . . . . . . . . . . . 19
4 Discussion 32
5 Conclusions 33
6 Appendix 35
6.1 Score cards for Autumn 2010 (September, October and November). . . . . . . . . . . . . . . 35
6.2 Normalized RMS forecast error for vector wind speed (VW) and geopotential (Z).. . . . . . . 37
6.3 Normalized RMS forecast error as a function of the atmospheric level, for VW and Z. . . . . . 39
7 References 41
Contract Report to ESA 1
ESA report on Level 3 root-zone soil moisture & DA impact
1 Introduction
The European Space Agency (ESA) Soil Moisture and Ocean Salinity (SMOS) mission was successfullylaunched in November 2009. SMOS measures the surface emissivity at L-Band (1.4 GHz), providing direct in-formation on surface soil moisture (∼ top 5cm of the soil) over land and salinity over oceans (Kerr et al. 2010).However, for most hydrological and climate applications, knowledge of root zone soil moisture (defined as thetop 1 metre of soil moisture) is required, which it is not directly available from SMOS measurements. Currentspace sensors do not have the capabilities to sense soil moisture beyond 5cm, frequently less than that. Dataassimilation systems are, however, an already tested alternative to propagate the shallow information containedin the remote sensed signal to deeper layers.
The main objective of the SMOS level 3 root-zone soil moisture product, described in this report, is to provideroot-zone soil moisture analysis which benefit from the assimilation of SMOS measurements. To achieve thisobjective, the root-zone soil moisture retrieval algorithm developed by theEuropean Centre for Medium-RangeWeather Forecasts (ECMWF) optimally combines SMOS level 1 Near Real Time (NRT) brightness temper-atures observations with ECMWF forward modelled brightness temperaturesinto an Extended Kalman Filter(EKF) based data assimilation system (Drusch et al. 2009a; de Rosnay et al. 2013; Munoz-Sabater et al. 2012;Munoz-Sabater et al. 2013b). Simulated brightness temperatures provide information on the model soil mois-ture and surface parameters. The model soil moisture accuracy benefitsfrom the global data assimilation systemthat leads to accurate atmospheric and precipitation estimates. Observed SMOS brightness temperatures are di-rectly related to surface soil moisture and surface characteristics (vegetation, soil texture, soil type, etc.). Inthe data assimilation system the information in large parts of the globe is assimilated and propagated in timeand space by the model, having the potential to modify the vertical soil moisture profile. The EKF algorithmaccounts for the model and SMOS observations uncertainties, so that the analysed soil moisture, i.e., the level3 soil moisture, in a perfect system, constitutes an optimal combination of both SMOS and the model soilmoisture estimates.
The assimilation of SMOS data influence the state of the soil, which in turn affectsthe exchange of energy andwater fluxes between the soil and the near surface atmosphere, with potential implications in the time evolutionof atmospheric variables. The impact of assimilating SMOS data in the ECMWF based EKF, from which thelevel 3 root-zone soil moisture product is constructed, is assessed through the impact on complementary landsurface and atmospheric variables. To this end, quality controlled in-situ soil moisture observations belongingto the International Soil Moisture Network (ISMN) were compared to the soilmoisture analyses at analysistime. The comparison was undertaken for the summer of 2010, a period of theyear when the evaporatranspi-ration fluxes are stronger, and therefore it is expected that the assimilationof SMOS data provides the largestimpact on the atmosphere. Additionally, surface temperature and 2 m temperature observations available inUSA were compared to the analyses. The impact on atmospheric variables was evaluated through computationof the forecast skill at different forecast lead times, and compared to acontrol experiment which did not useSMOS data assimilation.
This report presents a first version of a data assimilation system which, for the first time, is able to use directsatellite radiances to constraint soil moisture. This is an important step towardsthe future operational use ofremote sensed data to extract useful information on soil moisture. The results presented in this report shouldbe considered as a further step towards a well refined system which makes the best possible use of SMOS data.Every optimal system at ECMWF benefits of many years of research and fine tuning. Concerning SMOS, lot oftechnical work has been dedicated to make the assimilation of raw brightness temperatures in the ECMWF EKF
2 Contract Report to ESA
ESA report on Level 3 root-zone soil moisture & DA impact
feasible, and to solve many of the issues arising in a complex system as is ECMWF’s Integrated ForecastingSystem (IFS). The assimilation system is not yet optimal and it will take advantage of deeper investigations ofeach component of the assimilation system. Conclusions based on the surface and atmospheric impact showedin this report, should then be taken with some caution.
In this document we report on both, the SMOS level 3 root zone soil moisture product developed and generatedby ECMWF, and the impact on the new state of the soil in surface and atmospheric variables. The reportincludes the following components:
• A description of the production algorithm and the architecture of the production chain, based on the landsurface model Hydrology Tiled ECMWF Scheme for Surface Exchangesover Land (Balsamo et al. 2009,H-TESSEL), the Community Microwave Emission Modelling platform (CMEM,Drusch et al. 2009b)(de Rosnay et al. 2009a; de Rosnay et al. 2009b; Munoz-Sabater et al. 2011c), and the ECMWF EKFland surface data assimilation system (de Rosnay et al. 2013; Munoz-Sabater et al. 2013b),
• A presentation of the product characteristics, including resolutions, time sampling, timeliness and format,
• Results of root zone soil moisture product verification and accuracy estimates based on validation resultsagainst data from in-situ soil moisture networks, following the approach proposed by (Albergel et al. 2012a),
• An assessment of the gain/degradation in the forecast skill on several key atmospheric variables.
This work has been conducted as part of the ESA/ESRIN Contract number 4000101703/10/NL/FF/fk whichsupports the ECMWF SMOS data assimilaton study. Although the report is reasonably self-contained, it relieson the following other documents produced in the framework of the SMOS dataassimilation study. Theyare refered in this report for further details on SMOS data implementation at ECMWF, monitoring and dataassimilation developments:
• MS1TN-P1: SMOS Global Surface Emission Model, November 2009 (de Rosnay et al. 2009b),http://www.ecmwf.int/publications/library/do/references/show?id=89525
• MS1TN-P2:IFS Interface, November 2009 (Munoz-Sabater et al. 2009)http://www.ecmwf.int/publications/library/do/references/show?id=89524
• MS2TN-P1/2/3 Operational Pre-processing chain, Collocation softwaredevelopment and Offline moni-toring suite, December 2010 (Munoz-Sabater et al. 2010)http://www.ecmwf.int/publications/library/do/references/show?id=89972
• TN-PII-WP1100 SMOS Continuous Monitoring Report - Part 1, February 2011 (Munoz-Sabater et al. 2011b)http://www.ecmwf.int/publications/library/do/references/show?id=90041
• TN-PII-WP1200 SMOS Report on data thinning, August 2011 (Munoz-Sabater et al. 2011d)http://www.ecmwf.int/publications/library/do/references/show?id=90042
• TN-PII-WP1300 SMOS Report on noise filtering, November 2011 (Munoz-Sabater and de Rosnay 2011)http://www.ecmwf.int/publications/library/do/references/show?id=90361
• TN-PII-WP1100 SMOS Continuous Monitoring Report - Part 2, December 2011 (Munoz-Sabater et al. 2011a)http://www.ecmwf.int/publications/library/do/references/show?id=90375
• FR-PI-PI: SMOS Data Assimilation Study, Phase I, Final Report, January2013 (Munoz-Sabater et al. 2013b)
Contract Report to ESA 3

ESA report on Level 3 root-zone soil moisture & DA impact
• TN-PII-WP1100 SMOS Continuous Monitoring Report - Part 3, April 2013 (Munoz-Sabater et al. 2013a)
• TN-PII-WP2300 SMOS report on Hot-Spots, December 2013 (Munoz-Sabater et al. 2013c)
• TN-PII-WP1100 SMOS Continuous Monitoring Report - Part 4, January 2014 (Munoz-Sabater et al. 2014)
• TN-PII-WP1400: SMOS report on Bias correction, in preparation (de Rosnay et al. 2014)
• ECMWF-SMOS web page for further informationhttp://www.ecmwf.int/publications/library/do/references/show?id=90041
4 Contract Report to ESA

ESA report on Level 3 root-zone soil moisture & DA impact
2 Root-zone soil moisture algorithm and production chain
The ECMWF SMOS level 3 root-zone soil moisture algorithm relies on an Extended Kalman Filter (EKF)soil moisture data assimilation system, which is part of the ECMWF Integrated Forecasting System (IFS)(Drusch et al. 2009a; de Rosnay et al. 2013; Munoz-Sabater et al. 2013b). The EKF system merges SMOSlevel 1 NRT brightness temperature observations with the H-TESSEL-CMEMsimulated brightness tempera-tures. H-TESSEL describes the soil moisture vertical transfer as a result of land surface processes interactionswith the atmosphere. For the soil heat budget, the Fourier diffusion law is used (Balsamo et al. 2009). H-TESSEL constitutes the surface module of the IFS and it benefits from the global 4D-VAR data assimilationsystem used for the upper air analysis, which provides high quality atmospheric conditions for land surfacemodel integrations. In particular, good quality precipitation is highly relevantto simulate soil moisture dy-namics. CMEM is interfaced to H-TESSEL in the IFS and used in the EKF as forward observation operatorto simulate L-band brightness temperature, as seen from SMOS (Drusch et al. 2009b; de Rosnay et al. 2009a;Munoz-Sabater et al. 2011c). CMEM has been used for NRT SMOS brightness temperatures monitoring since2010 (Munoz-Sabater et al. 2010; Munoz-Sabater et al. 2011b; Munoz-Sabater et al. 2011a; Munoz-Sabater et al. 2013a;Munoz-Sabater et al. 2014) and it is a key component of the SMOS data assimilation system (Munoz-Sabater et al. 2013b).In this section we describe the different components of the data assimilation system which constitute the SMOSlevel 3 root-zone soil moisture product algorithm, H-TESSEL, CMEM and the EKF, along with a descriptionof the main characteristics and setup of the Level 3 product. The IFS cycle38r2 is used for these investigations.
2.1 H-TESSEL
H-TESSEL is the ECMWF land surface model, used for operational weather forecasting (Balsamo et al. 2009).H-TESSEL is a point-wise model that describes soil moisture vertical diffusion using the Richards equation.On each grid point the vertical soil column is discretised on four layers (thicknesses 7 cm, 21 cm, 72 cm and1.89 m). H-TESSEL uses the dominant soil texture class for each gridpoint.This information is collectedfrom the FAO (Food and Agriculture Organization). Soil types are derived from the FAO/UNESCO DigitalSoil Map of the World, DSMW, which exists at a resolution of 5’x5’ (about10 km). FAO DSMW provides theinformation on two levels of soil depth namely 0-30 cm and 30-100 cm. Since theroot zone is most importantfor the water holding, the 30-100 cm layer is selected for H-TESSEL. To interpolate to model target resolution,the dominant soil type is selected. This procedure has the advantage of preserving hydraulic properties whenmoving across various model resolutions. The climate field used by the model has an index from 1 to 7corresponding to the soil textures as shown in Figure1: ’coarse’ (1),’medium’ (2), ’medium fine’ (3), ’fine’ (4),’very fine’ (5), ’organic’ (6), and ’tropical organic’ (7).
Each grid box in the model is divided in up to 8 vegetation tiles (bare ground, low and high vegetation withoutsnow, exposed snow, snow under high vegetation, interception reservoir, ocean/lakes, and sea ice). In each gridbox two vegetation classes (high and low) are present. Twenty vegetation types, including deserts, ice caps,inland water and ocean, have been defined from an external data base(USGS 1999). Each vegetation type ischaracterized by a set of fixed parameters for the minimum canopy resistance, spatial coverage, and leaf areaindex, a sensitivity coefficient describing the dependence of the canopy resistance on water vapour deficit, andthe root distribution over the soil layers. The fraction of a grid box covered by each of the tiles depends on thetype and relative area of low and high vegetation, and the presence of snow and intercepted water.An extensive description of the H-TESSEL land surface model is availablein the IFS online documentation(IFS documentation 2012).
Contract Report to ESA 5

ESA report on Level 3 root-zone soil moisture & DA impact
Figure 1: Soil type classes as used in H-TESSEL (from the online IFS documentationIFS documentation 2012)
2.2 CMEM
A crucial component of the SMOS brightness temperature data assimilation system is the forward model op-erator, which is able to bring the observations and a model equivalent of the observation to the same space forcomparison purposes.
CMEM is the ECMWF forward operator for low-frequency passive microwave brightness temperatures from1 to 20 GHz. It is a highly modular code, written in Fortran language, all this making it specially suitable forimplementation within the IFS (Fig.2). Four different modules for the soil, vegetation, snow and atmosphericmicrowave emission are used in CMEM. All possible combination of parameterisations implemented in CMEMare presented inhttps://software.ecmwf.int/wiki/display/LDAS/CMEM+Documentation.
In (de Rosnay et al. 2009b) a wide overview of the CMEM main physical parameterisations and other relatedtechnical documentation is provided. Relevant results compiled from three different intercomparison studies areincluded too, using L-band observations from the NASA Skylab mission in 1973-1974 (Drusch et al. 2009b), insitu L-band observations of the SMOSREX (Soil Monitoring Of the Soil Reservoir Experiment) site in South-West France (Munoz-Sabater et al. 2011c), and C-band observations provided by the Advance MicrowaveScanning Radiometer on Earth Observing System (AMSR-E) on the NASAs AQUA satellite over the AMMAarea in West Africa (de Rosnay et al. 2009a). These studies validate the skill of CMEM to accurately representthe soil emission under different conditions. They also propose the most adequate parameterisations to be usedfor each component of the soil contributing to low frequencies microwave emission.
CMEM was recently introduced and interfaced to the IFS (Munoz-Sabater et al. 2009). CMEM input data isprovided by H-TESSEL integrations, and a monthly value of LAI per type ofvegetation, based on a MODISclimatology (Boussetta et al. 2013), along with other auxiliary data, is used to provide the first-guess for com-parison to SMOS observations, at the time of the observations and at the model grid.
ECMWF has also developed a website with lot of information about the CMEM model. The code is freelyavailable to the entire scientific community at the following website:
6 Contract Report to ESA

ESA report on Level 3 root-zone soil moisture & DA impact
https://software.ecmwf.int/wiki/display/LDAS/CMEM
Figure 2: CMEM modular structure. For each module, the different parameterisations available are shown.
2.3 EKF
The ECMWF soil moisture analysis is based on a point-wise EKF which combinesa background state andscreen level variables (2 m temperature and relative humidity) and satellite observations to obtain a soil moistureproduct of better quality than the pure model based estimation. The analysedsoil moisture state vectorxa iscomputed at timeti for each grid point as:
xa(ti) = xb(ti)+Ki [yo(ti)−Hi(xb)]
with superscripts a, b, o standing for background, analysis and observations, respectively,x the model statevector, y the observation vector andH the non-linear observation operator. The Kalman gain matrixKi iscomputed at timeti as:
Ki = [P−1 +HTi R−1Hi ]
−1HTi R−1
whereHi is the linearised observation operator,P is the error covariance matrix associated withx andR is theobservation errors covariance matrix. SMOS data were incorporated to this scheme, allowing observed bright-ness temperatures being part of the observation vector, along with the specificiation of its uncertainty in theRcovariance matrix of observation errors, and influence the soil moisture analysis (Munoz-Sabater et al. 2013b).
In this section, the main characteristics of the Level-3 SMOS root zone soil moisture product, along with theconfiguration of the SMOS observations and the set up of the EKF used are specified.
Contract Report to ESA 7

ESA report on Level 3 root-zone soil moisture & DA impact
2.3.1 Product specifications
The spatial resolution of SMOS observations ranges from 35 to 50 km (43km on average over the field ofview), depending on the incidence angle and the geographical location ofthe observation. Nonetheless, theNRT product, as received at ECMWF, is processed onto a fixed hexagonal grid with approximately 15 km nodeseparation. Although this resolution is very close to match the ECMWF T1279 spectral resolution, in this con-figuration two observed brightness temperatures in consecutive nodes of the SMOS grid are found to be verycorrelated horizontally. These correlations are not desirable in a data assimilation system if they do not accountfor correlated observations. Consequently, the ECMWF spectral T511reduced Gaussian grid (approximatelyequivalent to 40 km horizontal grid) was selected to process the root zone soil moisture product, because itmatches better the original resolution of the SMOS observations. This does not mean that SMOS observationswill be free from horizontal correlations, but in this case they will be small. Therefore, the soil moisture productwill be produced and delivered at global scale in a T511 ECMWF reduced Gaussian grid.
The production period spans from the post-comissioning phase until the end of the satellite nominal life, i.e.,from 1 May 2010 to 31 October 2012. The analysis are produced routinely daily at synoptic times; 0000, 0600,1200 and 1800UTC, and it is available at the three first layers of the land surface model, i.e., from 0-7 cm, 7-28cm and 28-100 cm. The L3 root zone soil moisture product will be delivered as an integrated value over the first100 cm, but it is also flexible in the way it will be processed for delivery to ESA (integrated over the first metreof soil, separated for each layer, etc.). Concerning the format of the soil moisture product, it will be producedin grib format.
2.3.2 Observations configuration
The configuration in which the observations are assimilated in the EKF to produce the L3 root zone soil mois-ture product is based on previous reports findings (see links in section1).
Prior to assimilation, SMOS observations were bias corrected by using a point-wise CDF matching, wherethe observations monthly mean and standard deviation were linearly rescaledto match that of the reference,which in this case was the model simulating brightness temperatures at the top of the atmosphere. The CDFmatching technique was applied using data from the years 2010, 2011 and half of the year 2012. Then, a set oftwo monthly correction coefficients (one correcting for the mean value and another one for the standard devia-tion) were obtained individually for each month and used to eliminate systematic bias between observations andmodel equivalent. Although the CDF matching period may seem very short to obtain CDF monthly coefficients,a sliding window of [-2.5, +2.5] months around the middle value of each month was used, increasing the min-imum number of observations necessary to obtain statistically significant values. This approach demonstratedto be superior than using single coefficients for the whole year (see more details in (de Rosnay et al. 2014)).
Only three incidence angles are being assimilated; 30, 40, and 50 degrees. Although there is no technicallimitation preventing the assimilation of more incidence angles, the CDF monthly linear coefficients were op-timized only for these three angles. Future versions of the L3 product, described in this report, may includelarger number of incidence angles. Furthermore, the use of only three incidence angles assures a volume ofobservations per 12h cycle worth of data acceptable for the current computing capabilities and structure of theIFS. These angles are also less affected by angular noise (Munoz-Sabater and de Rosnay 2011) and more datais available at intermediate incidence angles than at low incidence angles. Thecombined use of these threeangles also guarantees the radiative transfer model to account and discrimate for the vegetation effect.
8 Contract Report to ESA

ESA report on Level 3 root-zone soil moisture & DA impact
The margin around each incidence angle was fixed to 1 degree, i.e., observations in the bins [29-31], [39-41]and [49-51] are considered. For each node of the SMOS grid (the ISEA grid of the NRT product deliveredto ECMWF) and angular bin, the observations were averaged which the objective of reducing angular noise.Then, all the observations belonging to a node, which is the closest to a gridpoint of the ECMWF T511 reducedGaussian grid, were only considered.
The pure XX and YY polarisations are used and assimilated in the antenna reference frame, for which themodel equivalents are rotated to be in the same reference than the observations. Only observations of highestquality should be assimilated, hence, in this product, only observations located in the alias free field of view areconsidered. The RFI flag contained in the BUFR product is also used to discard nodes affected by RFI. Thisfiltering method based on flags does not guarantee to use observations free of RFI, but at least some of the mostcontaminant sources will be filtered out. Finally, it is worth mentioning that the observations are extracted fromthe NRT product of the reprocessed campaign, covering the whole of theyears 2010 and 2011. To fill the gapuntil October 2012, the NRT v5.05 is used too, and this will not affect the quality of the retrievals because isthe same version in which the reprocessed product was created.
2.3.3 SEKF setup
In any assimilation system, the observations and the model equivalents are compared. The latter (for L-bandbrightness temperatures) is obtained through interface of CMEM with the IFS(Munoz-Sabater et al. 2009).The parameterisations of CMEM to simulate brightness temperatures were selected as those matching best thereprocessed SMOS NRT product, in terms of minimum Root Mean Squared Difference (RMSD), minimummean bias (MB) and best correlation (R) values (de Rosnay et al. 2014). The key CMEM parameterisationsmeeting these requirements were (Wang and Schmugge 1980) for the dielectric model, (Wigneron et al. 2007)for the vegetation emissivity and (Wigneron et al. 2001) for the soil roughness. The effect of the soil tem-perature and the atmospheric contributions in the simulated brightness temperatures were also accounted forusing the parameterisations of (Wigneron et al. 2001) and (Pellarin et al. 2003), respectively. These combi-nations of parameterisations are also used operationally since 19 November2013 for monitoring purposes(Munoz-Sabater et al. 2014).
The SMOS components of the Jacobian matrix were also calibrated and made it compatible with the secreenlevel variables. It was found that a soil moisture perturbation value between 0.005m3m−3 and 0.01m3m−3 wasthe most suited to compute the sensitivity of brightness temperatures to soil moisture perturbations. To make itcompatible with the operational values used for 2 m temperature and relative humidity, this value was set up to0.01m3m−3. Furthermore, the maximum sensitivity allowed of model brightness temperatures to a soil mois-ture perturbation of 0.01m3m−3 was set up to 250K/m3m−3 in absolute value. Most grid points show negativejacobian values, reflecting the fact that, in general, an increased amountof water in the soil decrease the soilemissivity. Larger negative values than 250K/m3m−3 were found in the interface between snow and snow freeareas, whereas large positive values where also found in some deserticregions.
The covariance matrix of the observations errors was simplified and considered to be diagonal, with the squaredpure radiometric accuracy of the observations as the variance of the diagonal elements. In this case, the corre-lation between different incidence angles was considered zero, whereas in reality it is expected some degree ofcorrelation.
Contract Report to ESA 9

ESA report on Level 3 root-zone soil moisture & DA impact
In this study, the full observational system for the upper air analysis, asset in operations, was used aiming atproviding the best possible quality atmospheric and related land surface conditions for surface integrations.
2.3.4 Experiments
Based on the above configurations, two 2.5 years experiments were launched. The first one has as objective toproduce the SMOS L3 root zone soil moisture product. It assimilates 2m temperatures and relative humidityfrom synoptic stations at synoptic times (00, 06, 12 and 18UTC), along with SMOS observations in 12h win-dows, without doing any distinction between ascending and descending orbits. Hereafter, the analysis of thisexperiment will be referenced as SMOS-DA.The second experiment has exactly the same configuration than SMOS-DA.The only difference is that SMOSobservations were not used in the EKF. It has the same configuration thanthe ECMWF operational suite but atdifferent horizontal and vertical resolution. The latter will be, for the rest of this document our control experi-ment, and it is used as a reference to analyse the atmospheric impact of assimilating SMOS observations in theIFS. Hereafter, it will be named as CTRL-DA.
10 Contract Report to ESA
ESA report on Level 3 root-zone soil moisture & DA impact
3 Data Assimilation Impact
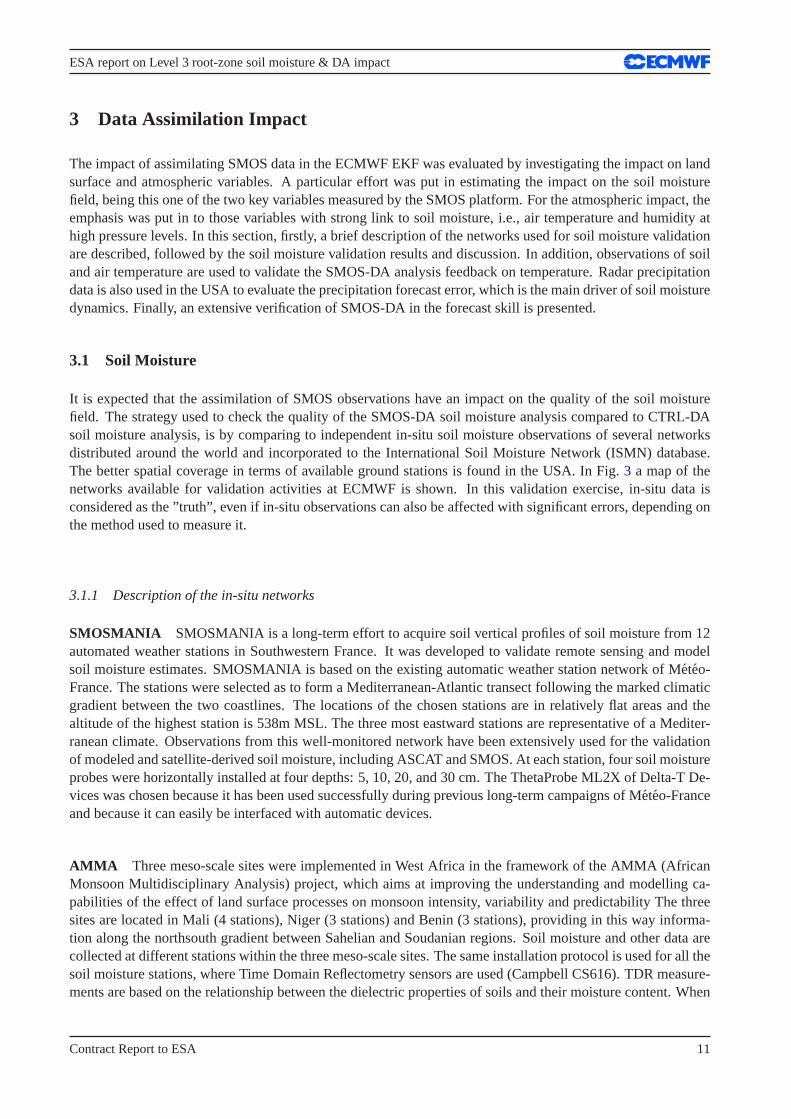
The impact of assimilating SMOS data in the ECMWF EKF was evaluated by investigating the impact on landsurface and atmospheric variables. A particular effort was put in estimating the impact on the soil moisturefield, being this one of the two key variables measured by the SMOS platform. For the atmospheric impact, theemphasis was put in to those variables with strong link to soil moisture, i.e., air temperature and humidity athigh pressure levels. In this section, firstly, a brief description of the networks used for soil moisture validationare described, followed by the soil moisture validation results and discussion. In addition, observations of soiland air temperature are used to validate the SMOS-DA analysis feedback ontemperature. Radar precipitationdata is also used in the USA to evaluate the precipitation forecast error, which is the main driver of soil moisturedynamics. Finally, an extensive verification of SMOS-DA in the forecast skill is presented.
3.1 Soil Moisture
It is expected that the assimilation of SMOS observations have an impact on thequality of the soil moisturefield. The strategy used to check the quality of the SMOS-DA soil moisture analysis compared to CTRL-DAsoil moisture analysis, is by comparing to independent in-situ soil moisture observations of several networksdistributed around the world and incorporated to the International Soil Moisture Network (ISMN) database.The better spatial coverage in terms of available ground stations is found in the USA. In Fig.3 a map of thenetworks available for validation activities at ECMWF is shown. In this validation exercise, in-situ data isconsidered as the ”truth”, even if in-situ observations can also be affected with significant errors, depending onthe method used to measure it.
3.1.1 Description of the in-situ networks
SMOSMANIA SMOSMANIA is a long-term effort to acquire soil vertical profiles of soilmoisture from 12automated weather stations in Southwestern France. It was developed to validate remote sensing and modelsoil moisture estimates. SMOSMANIA is based on the existing automatic weather station network of Meteo-France. The stations were selected as to form a Mediterranean-Atlantic transect following the marked climaticgradient between the two coastlines. The locations of the chosen stations are in relatively flat areas and thealtitude of the highest station is 538m MSL. The three most eastward stations are representative of a Mediter-ranean climate. Observations from this well-monitored network have been extensively used for the validationof modeled and satellite-derived soil moisture, including ASCAT and SMOS. At each station, four soil moistureprobes were horizontally installed at four depths: 5, 10, 20, and 30 cm. The ThetaProbe ML2X of Delta-T De-vices was chosen because it has been used successfully during previous long-term campaigns of Meteo-Franceand because it can easily be interfaced with automatic devices.
AMMA Three meso-scale sites were implemented in West Africa in the framework of theAMMA (AfricanMonsoon Multidisciplinary Analysis) project, which aims at improving the understanding and modelling ca-pabilities of the effect of land surface processes on monsoon intensity, variability and predictability The threesites are located in Mali (4 stations), Niger (3 stations) and Benin (3 stations), providing in this way informa-tion along the northsouth gradient between Sahelian and Soudanian regions. Soil moisture and other data arecollected at different stations within the three meso-scale sites. The same installation protocol is used for all thesoil moisture stations, where Time Domain Reflectometry sensors are used (Campbell CS616). TDR measure-ments are based on the relationship between the dielectric properties of soils and their moisture content. When
Contract Report to ESA 11

ESA report on Level 3 root-zone soil moisture & DA impact
they were not suitable (e.g. due to soil texture), Delta-T ThetaProbes were used. Data were collected at a depthof 5 cm.
NRCS-SCAN A total of 177 stations from NRCS-SCAN network were used in this study. This network(http://www.wcc.nrcs.usda.gov/scan/) spans over all US, and provides comprehensive informa-tion of soil moisture and climate, designed to support natural resource assessments and conservation activitieswith a focus on agricultural areas in the United States. Climate modeling and agricultural studies have benefitedfrom this network. Long data records of soil temperature, soil moisture atseveral depths, soil water level, airtemperature, relative humidity, solar radiation, wind, precipitation, and barometric pressure, among others, areavailable for this network. The vegetation cover at those sites consists of either natural fallow or short grass.Concerning soil moisture, data are collected by a dielectric constant measuring device, and measurements aretypically made at 5, 10, 20, 50, and 100cm. For this study, observations upto 1 m depth were used to build aweighted average proxy of root zone soil moisture, and used to evaluatethe SMOS-DA soil moisture analysis.
USCRN The U.S. Climate Reference Network National from the Oceanic and Atmospheric Administration’sNational Climatic Data Center (USCRN NOAA’s NCDC) consists of 114 stations developed, deployed, man-aged, and maintained by the National Oceanic and Atmospheric Administration (NOAA). This network wasbuild with the purpose of detecting the national signal of climate change. Soil moisture probes were installedat five standards depths; 5, 10, 20, 50 and 100 cm.
Maqu The Maqu soil moisture and soil temperature monitoring network was established in July 2008 inthe source region of the Yellow River to the south of Maqu County in Gansu province, China. The network,consisting of 20 stations, monitors the soil moisture and soil temperature at various depths (from 5 to 80 cmbelow the surface) at 15-min intervals. In this study, soil moisture observations at 5 cm were used.
SWATMEX In 2008, the SMOSMANIA network was extended Eastwards, with nine newstations, all ofthem located in an area of Mediterranean climate. The new stations are in a relatively flat terrain and atdifferent altitudes, being the ”Mazan-Abbaye” station that located at a maximum altitude of 1240 m. Duringthe installation of soil moisture probes, soil samples were collected at the fourdepths (5, 10, 20 and 30 cm), ofthe soil moisture profile in order to calibrate the probe.
VAS The Valencia Anchor Station is located towards the North-West part of the Valencia region, in the Utiel-Requena Plateau, at about 80 km from the city of Valencia. The main objective is to define and characterise alarge, reasonably homogeneous and flat area, mainly dedicated to vineyards, as reference for Cal/Val activitiesin low-resolution large-scale pixel size satellite sensors. Soil moisture is measured through Delta-T probes atdifferent depths. In this study, the measurements at 5 cm were used.
OzNet The OzNet network (http://www.oznet.org.au) is composed of 38 stations, located within the Mur-rumbidgee experimental catchment in southern New South Wales, Australia. Climate variations in this catch-ment are primarily associated with elevation, varying from semiarid in the West (altitude from 50m MSL) totemperate in the East (altitude up to 2000m MSL). The highest station is located at 937m MSL. Land use in thecatchment is predominantly agricultural with some forested areas in the steeper parts of the catchment. Eachsoil moisture site of the Murrumbidgee network measures the soil moisture at 0-5 cm with a soil dielectricsensor (Stevens Hydraprobe) or at [0-8], [0-30], [30-60], and [60-90] cm with water content reflectometers(Campbell Scientific). As the sensor response to soil moisture may vary with soil characteristics (e.g., salinity,
12 Contract Report to ESA

ESA report on Level 3 root-zone soil moisture & DA impact
density, soil type, and temperature), the sensor calibration was undertaken using both laboratory and field mea-surements. Reflectometer measurements were compared with both field gravimetric samples and time-domainreflectometry (TDR) measurements.
REMEDHUS REMDHUS is a Spanish network located in a central sector of the Duero basin, which benefitsof a semiarid continental Mediterranean climate. In total, twenty stations from theREMEDHUS network areavailable through the ISMN website. This area is mainly flat, ranging from 700to 900m MSL, and the land useis predominantly agricultural with some patchy forest. This network provideshourly measurements of surfacesoil moisture. Each station was equipped with capacitance probes installed horizontally at a depth of 5 cm. Ithas already been used for the evaluation of both remotely sensed and modeled soil moisture estimates
UMBRIA This in-situ soil moisture network was set up in central Italy using portable TDR (Time DomainReflectometry) sensors to observe soil moisture. The catchment is characterized by a Mediterranean climatewith average annual precipitation of about 930 mm. Soil moisture data are recorded every 30 minutes
HOBE This is a network of 30 stations located within the Skjern River Catchment in Denmark, chosen tofind representative locations for the individual network stations land cover. The stations were aligned along thelong-term precipitation gradient, and placed to cover the HOBE agriculture (Voulund) and forest (Gludsted)field sites, as well as the more loamy area in the east of the catchment. For the stations in agriculture fields, themost frequent crop types, namely barley, grass, wheat, maize, and potatoes, were considered. At each stationDecagon 5TE sensors were installed at 0-5, 20-25 and 50-55cm depth. These sensors simultaneously measuresoil moisture, temperature and electrical conductivity. The data is logged at30 minutes interval.
Figure 3: Soil moisture database available at ECMWF for validation activities.
Contract Report to ESA 13
ESA report on Level 3 root-zone soil moisture & DA impact
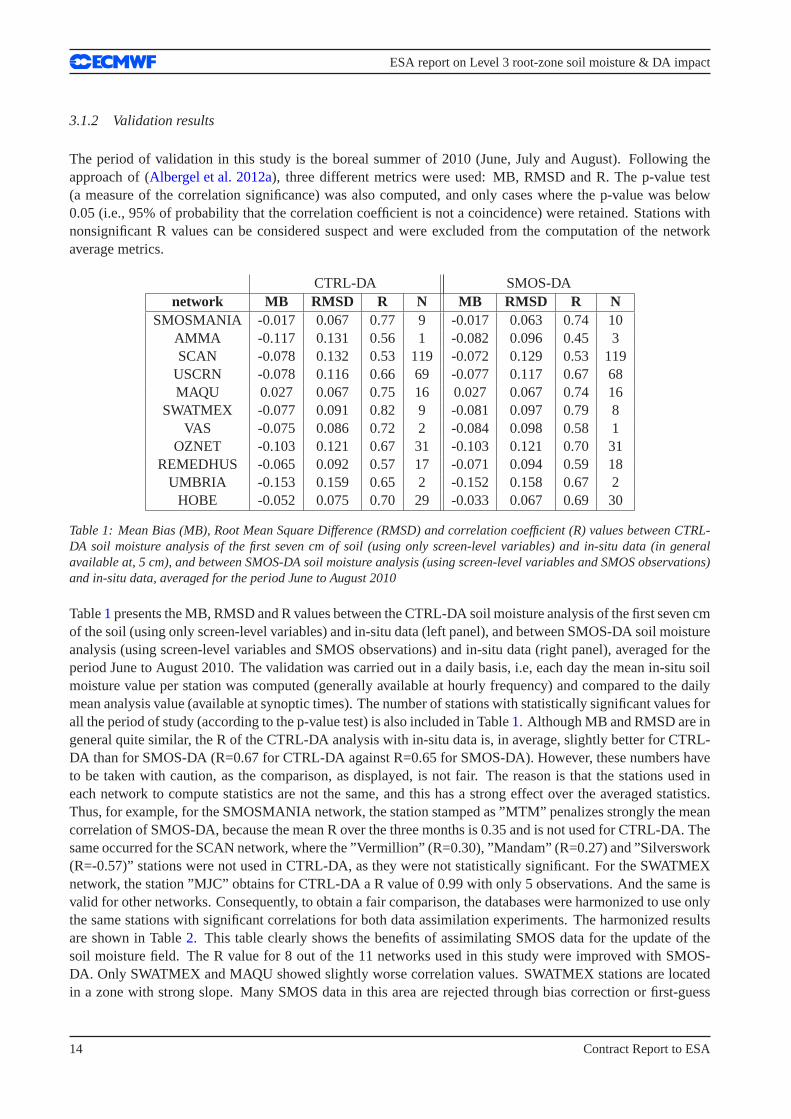
3.1.2 Validation results
The period of validation in this study is the boreal summer of 2010 (June, Julyand August). Following theapproach of (Albergel et al. 2012a), three different metrics were used: MB, RMSD and R. The p-value test(a measure of the correlation significance) was also computed, and only cases where the p-value was below0.05 (i.e., 95% of probability that the correlation coefficient is not a coincidence) were retained. Stations withnonsignificant R values can be considered suspect and were excluded from the computation of the networkaverage metrics.
CTRL-DA SMOS-DAnetwork MB RMSD R N MB RMSD R N
SMOSMANIA -0.017 0.067 0.77 9 -0.017 0.063 0.74 10AMMA -0.117 0.131 0.56 1 -0.082 0.096 0.45 3SCAN -0.078 0.132 0.53 119 -0.072 0.129 0.53 119
USCRN -0.078 0.116 0.66 69 -0.077 0.117 0.67 68MAQU 0.027 0.067 0.75 16 0.027 0.067 0.74 16
SWATMEX -0.077 0.091 0.82 9 -0.081 0.097 0.79 8VAS -0.075 0.086 0.72 2 -0.084 0.098 0.58 1
OZNET -0.103 0.121 0.67 31 -0.103 0.121 0.70 31REMEDHUS -0.065 0.092 0.57 17 -0.071 0.094 0.59 18
UMBRIA -0.153 0.159 0.65 2 -0.152 0.158 0.67 2HOBE -0.052 0.075 0.70 29 -0.033 0.067 0.69 30
Table 1: Mean Bias (MB), Root Mean Square Difference (RMSD) and correlation coefficient (R) values between CTRL-DA soil moisture analysis of the first seven cm of soil (using only screen-level variables) and in-situ data (in generalavailable at, 5 cm), and between SMOS-DA soil moisture analysis (using screen-level variables and SMOS observations)and in-situ data, averaged for the period June to August 2010
Table1presents the MB, RMSD and R values between the CTRL-DA soil moisture analysis of the first seven cmof the soil (using only screen-level variables) and in-situ data (left panel), and between SMOS-DA soil moistureanalysis (using screen-level variables and SMOS observations) and in-situ data (right panel), averaged for theperiod June to August 2010. The validation was carried out in a daily basis, i.e, each day the mean in-situ soilmoisture value per station was computed (generally available at hourly frequency) and compared to the dailymean analysis value (available at synoptic times). The number of stations with statistically significant values forall the period of study (according to the p-value test) is also included in Table1. Although MB and RMSD are ingeneral quite similar, the R of the CTRL-DA analysis with in-situ data is, in average, slightly better for CTRL-DA than for SMOS-DA (R=0.67 for CTRL-DA against R=0.65 for SMOS-DA). However, these numbers haveto be taken with caution, as the comparison, as displayed, is not fair. The reason is that the stations used ineach network to compute statistics are not the same, and this has a strong effect over the averaged statistics.Thus, for example, for the SMOSMANIA network, the station stamped as ”MTM” penalizes strongly the meancorrelation of SMOS-DA, because the mean R over the three months is 0.35 and is not used for CTRL-DA. Thesame occurred for the SCAN network, where the ”Vermillion” (R=0.30), ”Mandam” (R=0.27) and ”Silverswork(R=-0.57)” stations were not used in CTRL-DA, as they were not statistically significant. For the SWATMEXnetwork, the station ”MJC” obtains for CTRL-DA a R value of 0.99 with only 5 observations. And the same isvalid for other networks. Consequently, to obtain a fair comparison, the databases were harmonized to use onlythe same stations with significant correlations for both data assimilation experiments. The harmonized resultsare shown in Table2. This table clearly shows the benefits of assimilating SMOS data for the update of thesoil moisture field. The R value for 8 out of the 11 networks used in this studywere improved with SMOS-DA. Only SWATMEX and MAQU showed slightly worse correlation values. SWATMEX stations are locatedin a zone with strong slope. Many SMOS data in this area are rejected throughbias correction or first-guess
14 Contract Report to ESA

ESA report on Level 3 root-zone soil moisture & DA impact
check, and the impact is rather indirect. Thus, this result is not surprising. In average over the 11 networksof this study, with 284 stations with statistically significant values, the R (MB and RMSD) of SMOS-DA isimproved from 0.65 (0.078m3m−3 and 0.106m3m−3) for CTRL-DA to 0.68 (0.060m3m−3 and 0.101m3m−3)for SMOS-DA. The analysis of SMOS-DA are chiefly overestimating the observations (except for the MAQUnetwork), but they are closer to the observations than CTRL-DA. The largest improvements are produced instations of REMEDHUS, OzNet, VAS and AMMA networks, all of them havingthe common feature of beinglocated in semiarid climates, with long dry periods, where soil moisture retrievalfrom space is known to bemore efficient.In order to have an estimation of the statistically significance of these results, confidence interval estimates ofthe R values were computed for each network and experiment. In Fig.4 the averaged R value (for the periodJune-August 2011) between analysis of SMOS-DA and in-situ data, andbetween CTRL-DA analysis and in-situ observations, for each network, is shown. Overlapped are the 95%confidence intervals computed by usingthe Fisher Z transform as in (Albergel et al. 2012a). This figure shows that, for all networks, the confidenceintervals overlap for both data assimilation experiments. This means that, despitea general better representationof soil moisture by SMOS-DA, the difference of correlation is statistically non-significant. Longer evaluationperiods will likely decrease the size of the confidence bars and increasethe significance of these results.
CTRL-DA SMOS-DAnetwork MB RMSD R N MB RMSD R N
SMOSMANIA -0.017 0.067 0.77 9 -0.015 0.064 0.78 9AMMA -0.118 0.131 0.56 1 -0.093 0.102 0.59 1SCAN -0.079 0.133 0.54 115 -0.074 0.130 0.55 115
USCRN -0.080 0.116 0.67 66 -0.074 0.115 0.68 66MAQU 0.027 0.067 0.75 16 0.027 0.067 0.74 16
SWATMEX -0.080 0.095 0.80 8 -0.081 0.097 0.79 8VAS -0.082 0.105 0.47 1 -0.084 0.098 0.59 1
OZNET -0.104 0.121 0.67 31 -0.103 0.121 0.70 31REMEDHUS -0.065 0.093 0.57 17 -0.067 0.091 0.61 17
UMBRIA -0.153 0.159 0.65 2 -0.152 0.158 0.67 2HOBE -0.054 0.078 0.73 28 -0.032 0.068 0.73 28
Table 2: As Table1 but each network database was harmonized to compare exactlythe same stations. Bold numbersindicates that the metric is better for this experiment.
As explained in section1, for most hydrological and climate applications, the variable of interest is therootzone soil moisture, which controls processes such as the evapotranspiration. In this study, soil measurementsat 5, 10, 20, 30, 50 and 100 cm over the SCAN and USCRN networks in USA were available too during theperiod of study. The averaged vertical value of in-situ observations was compared to the averaged soil moistureanalysis of the three first soil layers of the soil (0-100 cm), weighted by itsown thickness. The results arepresented in Table3. For both networks, the R values were improved when SMOS data was assimilated. Thisproves the ability of the assimilation approach to propagate information on deeper layers. However, it shouldbear in mind that this validation exercise is not trivial, as in-situ observations at only 5 different depths areconsidered to sample the first meter of soil.
3.2 Soil and 2 metre temperature
Soil temperature is also an important land surface variable, with close link to many geophysical processes suchas the representation of surface heat and evaporation fluxes, soil water phase change or the parameterisationof the ecosystem respiration and gross primary production, which have direct impact on the carbon pools
Contract Report to ESA 15

ESA report on Level 3 root-zone soil moisture & DA impact
0
0.2
0.4
0.6
0.8
1
VASOzNet
Rhemedus
Umbria
HOBE
SWATM
EX
SMOSM
ANIA
AMM
A
USCRN
SCAN
MAQU
R
networks
CTRLSMOS
0
0.2
0.4
0.6
0.8
1
VASOzNet
Rhemedus
Umbria
HOBE
SWATM
EX
SMOSM
ANIA
AMM
A
USCRN
SCAN
MAQU
R
networks
CTRLSMOS
Figure 4: Averaged R value (for the period June-August 2011)between analysis of SMOS-DA and in-situ observations,and between CTRL-DA analysis and in-situ observations, forall networks used in this study. Overlapped are the 95%confidence intervals.
CTRL-DA SMOS-DAnetwork MB RMSD R N MB RMSD R NSCAN -0.044 0.113 0.71 80 -0.044 0.116 0.72 80
USCRN -0.022 0.097 0.69 54 -0.023 0.097 0.72 54
Table 3: Mean Bias (MB), Root Mean Square Difference (RMSD) and correlation coefficient (R) values between CTRL-DA soil moisture analysis averaged over the three first soil layers of soil (0-100 cm) and averaged in-situ data over thefirst metre of soil (left panel). Right panel shows the same for SMOS-DA soil moisture analysis.
estimation. The ECMWF CMEM Platform, simulating L-band brightness temperatures, uses also as input filethe profile of soil temperature. Although SMOS observations reflect primarely the signal of soil moisture andvegetation state, it also contains information about soil temperature. Updatingthe state of soil moisture alsofeedbacks the soil temperature state; Hourly soil temperature observations for the summer months of 2010 arealso available over the SCAN network (see3.1.1). The ground team installed soil temperature probes at fivedifferent depths: 5, 10, 20, 50 and 100 cm. These data can be used asindependent dataset for soil temperaturevalidation. Hence, soil temperature analysis of CTRL-DA and SMOS-DA experiments were compared to soiltemperature observations at 5 cm. In total 136 stations distributed from all USwere used, with correlationvalues at 95% significant level (p-value test) for both experiments. The results showed very small impact: R=0.803, RMSD= 4.20 K and MB= -1.01 K for CTRL-DA and in-situ data, and R=0.804, RMSD= 4.21 K andMB=-1.05 K for SMOS-DA and in-situ data.The same exercise that in the previous section was done for 2 m temperature, with observations belonging tothe USCRN network. A weak impact was also found (not shown).
16 Contract Report to ESA
ESA report on Level 3 root-zone soil moisture & DA impact
3.3 Atmospheric impact
3.3.1 Precipitation
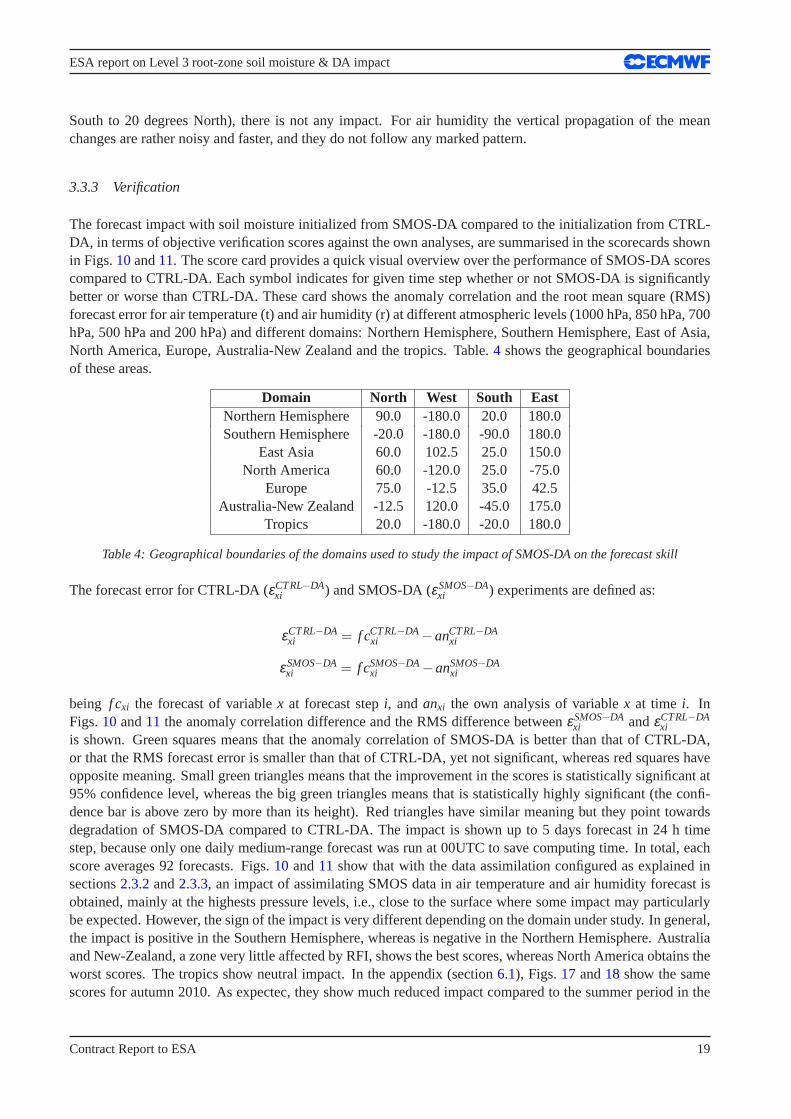
As it was showed in (Munoz-Sabater et al. 2013c), several zones around the world have the potential to im-prove the forecast of precipitation using information provided by SMOS. These zones are characterized by astrong seasonal dynamic of brightness temperatures and a good sensitivity of the model brightness tempera-tures to perturbations of soil moisture. Among them, the US where used in this study, as radar observationswere available during the period of this study; the high-resolution NEXRAD (Next-Generation Radar) networkof Doppler weather radars distributed across all US was used to verify apossible impact on precipitation. Inparticular, observations of precipitation data were accumulated for 6h periods. Each model forecast was initial-ized at 00UTC and only 24h forecasts were considered. The model prognostic precipitation was accumulatedfor slots of 6h, from 00 to 06UTC, 06 to 12UTC, 12 to 18UTC and 18 to 00UTC. Then the forecast error ofSMOS-DA compared to CTRL-DA was computed as:
RMSD[PPOBS−PPSMOS−DA]−RMSD[PPOBS−PPCTRL−DA]
where PP accounts for the total accumulated precipitation (large scale and convective) in the forecast slot fromt1 to t2. Negative values means that the RMSD of CTRL-DA is greater than SMOS-DA, and in consequencean improvement by assimilating SMOS data. Positive values are a sign of precipitation forecast degradation.Fig.5 shows the 6-hour accumulated precipitation forecast error differencebetween SMOS-DA and CTRL-DA,averaged for June 2010. The strongest impact is observed during thefirst 12 hours of forecast, in the Centerof the USA, in an area where the accumulated increments of soil moisture werelarger (not shown). However,there is not a clear pattern where precipitation forecast is improved or degraded. Beyond 12 h forecast, little orno impact is observed in precipitation, which suggests a very quick response of surface fluxes to the assimila-tion of satellite data.
3.3.2 Mean change in the forecast field
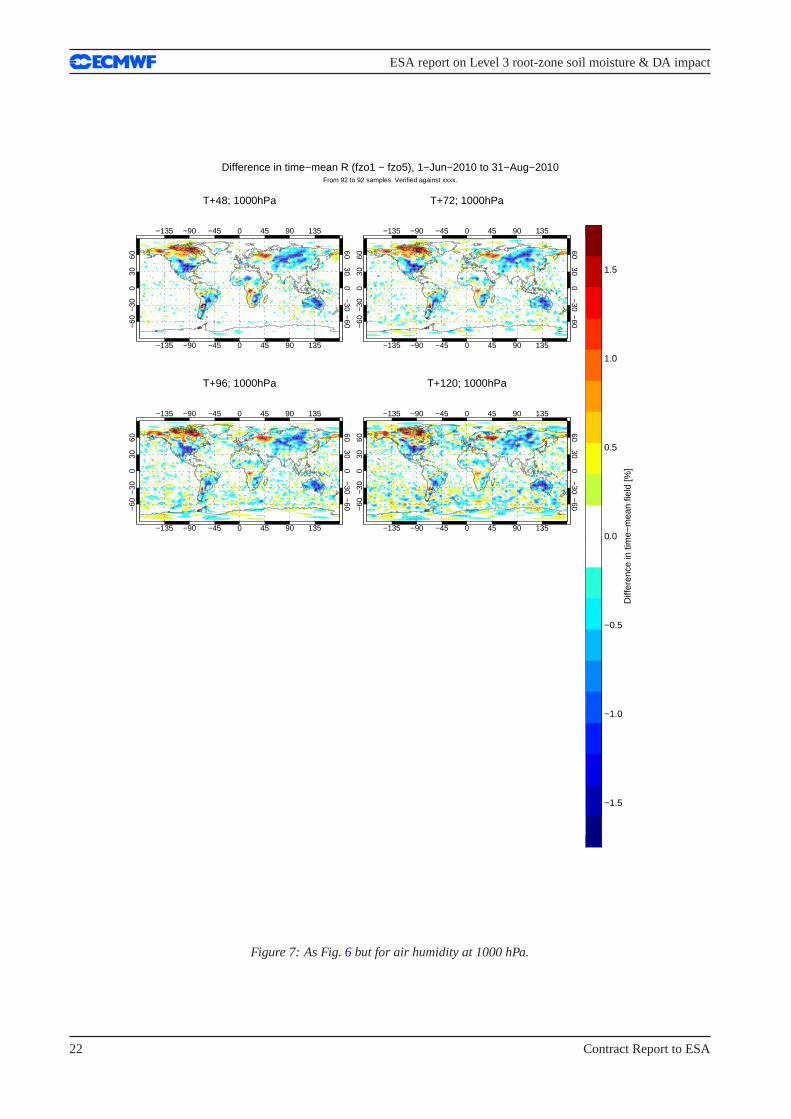
Fig 6 shows the absolute mean impact of assimilating SMOS data, on the forecast of air temperature from 2to 5 days forecast. It is observed that up to forecast day 3, the impact ismostly concentrated into continentalsurfaces. This is expected because the assmilation of SMOS data is only carried out over land. After day 3, theimpact starts extending to other domains, notably close to the poles. In general it can be observed a warming ofthe atmosphere in the USA, East of South America, North of Asia and East ofAustralia. On the contrary, somecooling is produced in Canada, Eurasia and some areas of Africa and South America. These patterns matchwell and are consistent with the mean assimilation increments (not shown). Although the values showed in thisFigure are relatively low, in general, those areas where the soil is dried up due to the assimilation of SMOSdata, the atmosphere is warmed up, whereas the contrary is observed when water is added to the soil. This firstassessment needs however further investigation, as to understand the origin of possible systematic incrementsin certain areas.Fig. 7 shows the same but for air humidity. The patterns are very similar to those of Fig. 6, but showing aclear anticorrelation with air temperature, i.e., drying of the atmosphere when the temperature is increased, andmaking it more humid where is cooled down.The propagation of the mean change in the forecast into the vertical dimension is shown, for both variables, inFigs.8 and9, up to 5 days forecast. For air temperature, only after forecast day 4 some mean changes reachhigh atmospheric levels, but non of them was statistically significant. For the tropical domain (from 20 degrees
Contract Report to ESA 17

ESA report on Level 3 root-zone soil moisture & DA impact
20°N
30°N
40°N
50°N
60°N
20°N
30°N
40°N
50°N
60°N
60°W80°W100°W120°W140°W
60°W80°W100°W120°W140°W
-35 -15 -10 -8 -6 -4 -2 0 2 4 6 8 10 15 35
20°N
30°N
40°N
50°N
60°N
20°N
30°N
40°N
50°N
60°N
60°W80°W100°W120°W140°W
60°W80°W100°W120°W140°W
-35 -15 -10 -8 -6 -4 -2 0 2 4 6 8 10 15 35
(a) 00-06UTC (c) 06-12UTC
20°N
30°N
40°N
50°N
60°N
20°N
30°N
40°N
50°N
60°N
60°W80°W100°W120°W140°W
60°W80°W100°W120°W140°W
-35 -15 -10 -8 -6 -4 -2 0 2 4 6 8 10 15 35
20°N
30°N
40°N
50°N
60°N
20°N
30°N
40°N
50°N
60°N
60°W80°W100°W120°W140°W
60°W80°W100°W120°W140°W
-35 -15 -10 -8 -6 -4 -2 0 2 4 6 8 10 15 35
(b) 12-18UTC (d) 18-00UTC
Figure 5: 6 hour accumulated precipitation forecast error difference between SMOS-DA and CTRL-DA (in mm), averagedfor June 2010, for 4 different forecast times. Negative values means that the RMSD of CTRL-DA is greater than SMOS-DA,and in consequence an improvement by assimilating SMOS data. Positive values are the opposite.
18 Contract Report to ESA
ESA report on Level 3 root-zone soil moisture & DA impact
South to 20 degrees North), there is not any impact. For air humidity the vertical propagation of the meanchanges are rather noisy and faster, and they do not follow any markedpattern.
3.3.3 Verification
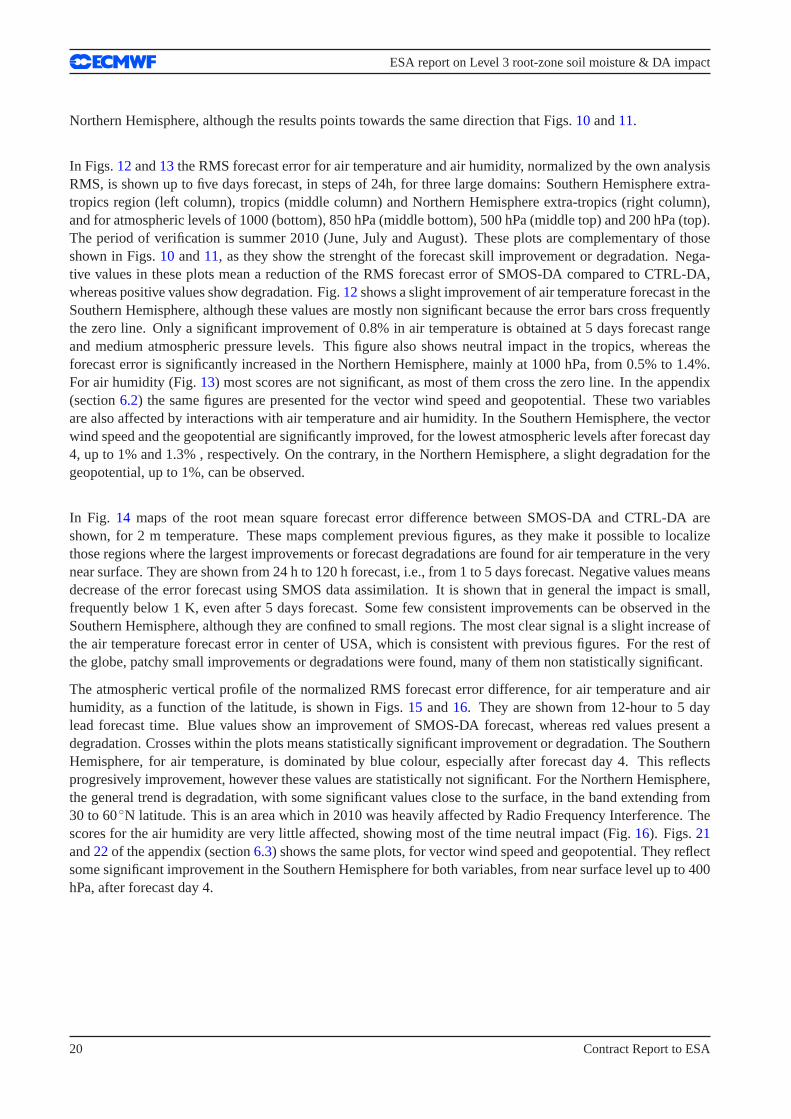
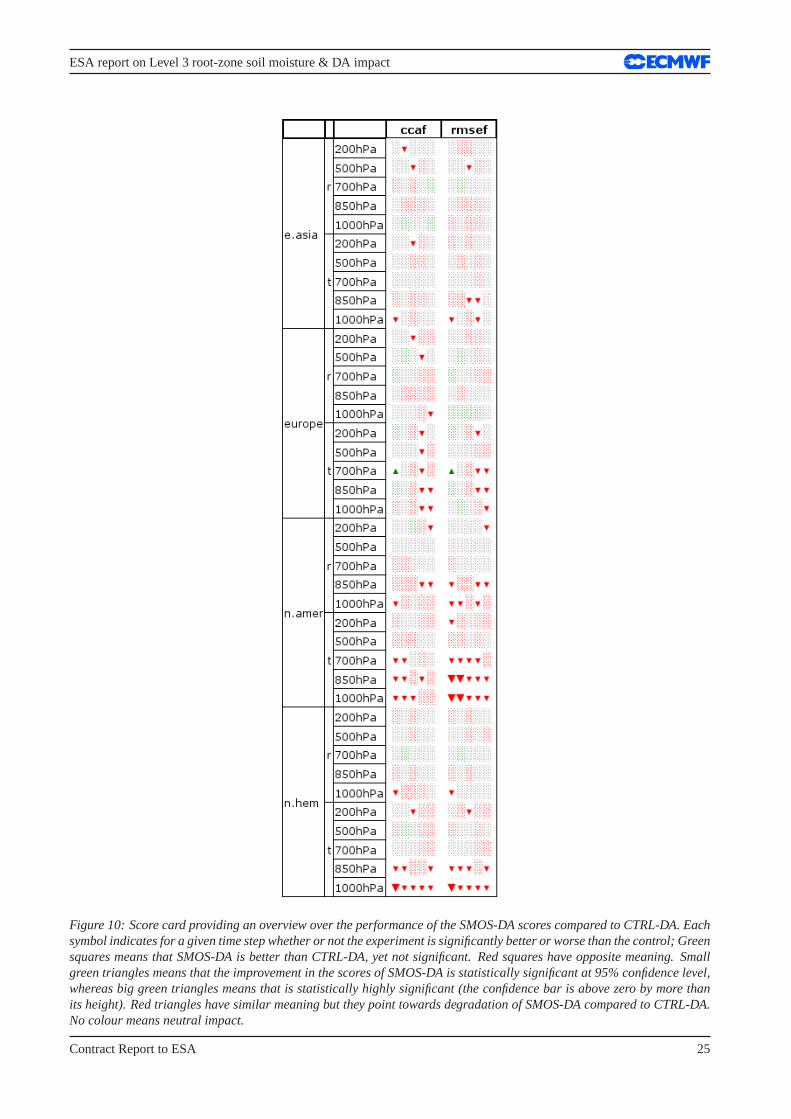
The forecast impact with soil moisture initialized from SMOS-DA compared to theinitialization from CTRL-DA, in terms of objective verification scores against the own analyses, are summarised in the scorecards shownin Figs.10and11. The score card provides a quick visual overview over the performance of SMOS-DA scorescompared to CTRL-DA. Each symbol indicates for given time step whether ornot SMOS-DA is significantlybetter or worse than CTRL-DA. These card shows the anomaly correlationand the root mean square (RMS)forecast error for air temperature (t) and air humidity (r) at different atmospheric levels (1000 hPa, 850 hPa, 700hPa, 500 hPa and 200 hPa) and different domains: Northern Hemisphere, Southern Hemisphere, East of Asia,North America, Europe, Australia-New Zealand and the tropics. Table.4 shows the geographical boundariesof these areas.
Domain North West South EastNorthern Hemisphere 90.0 -180.0 20.0 180.0Southern Hemisphere -20.0 -180.0 -90.0 180.0
East Asia 60.0 102.5 25.0 150.0North America 60.0 -120.0 25.0 -75.0
Europe 75.0 -12.5 35.0 42.5Australia-New Zealand -12.5 120.0 -45.0 175.0
Tropics 20.0 -180.0 -20.0 180.0
Table 4: Geographical boundaries of the domains used to study the impact of SMOS-DA on the forecast skill
The forecast error for CTRL-DA (εCTRL−DAxi ) and SMOS-DA (εSMOS−DA
xi ) experiments are defined as:
εCTRL−DAxi = f cCTRL−DA
xi −anCTRL−DAxi
εSMOS−DAxi = f cSMOS−DA
xi −anSMOS−DAxi
being f cxi the forecast of variablex at forecast stepi, andanxi the own analysis of variablex at time i. InFigs.10 and11 the anomaly correlation difference and the RMS difference betweenεSMOS−DA
xi andεCTRL−DAxi
is shown. Green squares means that the anomaly correlation of SMOS-DA isbetter than that of CTRL-DA,or that the RMS forecast error is smaller than that of CTRL-DA, yet not significant, whereas red squares haveopposite meaning. Small green triangles means that the improvement in the scores is statistically significant at95% confidence level, whereas the big green triangles means that is statistically highly significant (the confi-dence bar is above zero by more than its height). Red triangles have similar meaning but they point towardsdegradation of SMOS-DA compared to CTRL-DA. The impact is shown up to 5days forecast in 24 h timestep, because only one daily medium-range forecast was run at 00UTC tosave computing time. In total, eachscore averages 92 forecasts. Figs.10 and11 show that with the data assimilation configured as explained insections2.3.2and2.3.3, an impact of assimilating SMOS data in air temperature and air humidity forecast isobtained, mainly at the highests pressure levels, i.e., close to the surface where some impact may particularlybe expected. However, the sign of the impact is very different depending on the domain under study. In general,the impact is positive in the Southern Hemisphere, whereas is negative in the Northern Hemisphere. Australiaand New-Zealand, a zone very little affected by RFI, shows the best scores, whereas North America obtains theworst scores. The tropics show neutral impact. In the appendix (section6.1), Figs.17 and18 show the samescores for autumn 2010. As expectec, they show much reduced impact compared to the summer period in the
Contract Report to ESA 19
ESA report on Level 3 root-zone soil moisture & DA impact
Northern Hemisphere, although the results points towards the same direction that Figs.10and11.
In Figs.12and13 the RMS forecast error for air temperature and air humidity, normalized by the own analysisRMS, is shown up to five days forecast, in steps of 24h, for three large domains: Southern Hemisphere extra-tropics region (left column), tropics (middle column) and Northern Hemisphere extra-tropics (right column),and for atmospheric levels of 1000 (bottom), 850 hPa (middle bottom), 500 hPa(middle top) and 200 hPa (top).The period of verification is summer 2010 (June, July and August). Theseplots are complementary of thoseshown in Figs.10 and11, as they show the strenght of the forecast skill improvement or degradation. Nega-tive values in these plots mean a reduction of the RMS forecast error of SMOS-DA compared to CTRL-DA,whereas positive values show degradation. Fig.12shows a slight improvement of air temperature forecast in theSouthern Hemisphere, although these values are mostly non significant because the error bars cross frequentlythe zero line. Only a significant improvement of 0.8% in air temperature is obtained at 5 days forecast rangeand medium atmospheric pressure levels. This figure also shows neutral impact in the tropics, whereas theforecast error is significantly increased in the Northern Hemisphere, mainly at 1000 hPa, from 0.5% to 1.4%.For air humidity (Fig.13) most scores are not significant, as most of them cross the zero line. In the appendix(section6.2) the same figures are presented for the vector wind speed and geopotential. These two variablesare also affected by interactions with air temperature and air humidity. In the Southern Hemisphere, the vectorwind speed and the geopotential are significantly improved, for the lowest atmospheric levels after forecast day4, up to 1% and 1.3% , respectively. On the contrary, in the Northern Hemisphere, a slight degradation for thegeopotential, up to 1%, can be observed.
In Fig. 14 maps of the root mean square forecast error difference between SMOS-DA and CTRL-DA areshown, for 2 m temperature. These maps complement previous figures, asthey make it possible to localizethose regions where the largest improvements or forecast degradationsare found for air temperature in the verynear surface. They are shown from 24 h to 120 h forecast, i.e., from 1to 5 days forecast. Negative values meansdecrease of the error forecast using SMOS data assimilation. It is shownthat in general the impact is small,frequently below 1 K, even after 5 days forecast. Some few consistent improvements can be observed in theSouthern Hemisphere, although they are confined to small regions. The most clear signal is a slight increase ofthe air temperature forecast error in center of USA, which is consistent with previous figures. For the rest ofthe globe, patchy small improvements or degradations were found, many of them non statistically significant.
The atmospheric vertical profile of the normalized RMS forecast error difference, for air temperature and airhumidity, as a function of the latitude, is shown in Figs.15 and16. They are shown from 12-hour to 5 daylead forecast time. Blue values show an improvement of SMOS-DA forecast, whereas red values present adegradation. Crosses within the plots means statistically significant improvementor degradation. The SouthernHemisphere, for air temperature, is dominated by blue colour, especially after forecast day 4. This reflectsprogresively improvement, however these values are statistically not significant. For the Northern Hemisphere,the general trend is degradation, with some significant values close to the surface, in the band extending from30 to 60◦N latitude. This is an area which in 2010 was heavily affected by Radio Frequency Interference. Thescores for the air humidity are very little affected, showing most of the time neutral impact (Fig.16). Figs.21and22of the appendix (section6.3) shows the same plots, for vector wind speed and geopotential. They reflectsome significant improvement in the Southern Hemisphere for both variables,from near surface level up to 400hPa, after forecast day 4.
20 Contract Report to ESA

ESA report on Level 3 root-zone soil moisture & DA impact
−0.2
−0.1
0.0
0.1
0.2
Diff
eren
ce in
tim
e−m
ean
field
[K]
Difference in time−mean T (fzo1 − fzo5), 1−Jun−2010 to 31−Aug−2010From 92 to 92 samples. Verified against xxxx.
T+48; 1000hPa
−135 −90 −45 0 45 90 135
−135 −90 −45 0 45 90 135
−60
−30
030
60
−60
−30
030
60
T+72; 1000hPa
−135 −90 −45 0 45 90 135
−135 −90 −45 0 45 90 135
−60
−30
030
60
−60
−30
030
60
T+96; 1000hPa
−135 −90 −45 0 45 90 135
−135 −90 −45 0 45 90 135
−60
−30
030
60
−60
−30
030
60
T+120; 1000hPa
−135 −90 −45 0 45 90 135
−135 −90 −45 0 45 90 135
−60
−30
030
60
−60
−30
030
60
Figure 6: Absolute mean change difference in the forecast ofair temperature between SMOS-DA and CTRL-DA, at 1000hPa, averaged for the period June to August 2010. ”fzo1” makes reference to SMOS-DA, whereas ”fzo5” makes referenceto CTRL-DA. Positive values means that SMOS-DA is warming upcompared to CTRL-DA, whereas negative values pointstowards SMOS-DA cooling down compared to CTRL-DA.
Contract Report to ESA 21
ESA report on Level 3 root-zone soil moisture & DA impact
−1.5
−1.0
−0.5
0.0
0.5
1.0
1.5
Diff
eren
ce in
tim
e−m
ean
field
[%]
Difference in time−mean R (fzo1 − fzo5), 1−Jun−2010 to 31−Aug−2010From 92 to 92 samples. Verified against xxxx.
T+48; 1000hPa
−135 −90 −45 0 45 90 135
−135 −90 −45 0 45 90 135
−60
−30
030
60
−60
−30
030
60
T+72; 1000hPa
−135 −90 −45 0 45 90 135
−135 −90 −45 0 45 90 135
−60
−30
030
60
−60
−30
030
60
T+96; 1000hPa
−135 −90 −45 0 45 90 135
−135 −90 −45 0 45 90 135
−60
−30
030
60
−60
−30
030
60
T+120; 1000hPa
−135 −90 −45 0 45 90 135
−135 −90 −45 0 45 90 135
−60
−30
030
60
−60
−30
030
60
Figure 7: As Fig.6 but for air humidity at 1000 hPa.
22 Contract Report to ESA

ESA report on Level 3 root-zone soil moisture & DA impact
−0.10
−0.05
0.00
0.05
0.10
Diff
eren
ce in
tim
e−m
ean
field
[K]
Difference in time−mean T (fzo1−fzo5), 1−Jun−2010 to 31−Aug−2010From 92 to 92 analyses.
T+0
−90 −60 −30 0 30 60 90Latitude
1000
800
600
400
200
Pre
ssur
e, h
Pa
T+12
−90 −60 −30 0 30 60 90Latitude
1000
800
600
400
200
Pre
ssur
e, h
Pa
T+24
−90 −60 −30 0 30 60 90Latitude
1000
800
600
400
200
Pre
ssur
e, h
Pa
T+48
−90 −60 −30 0 30 60 90Latitude
1000
800
600
400
200
Pre
ssur
e, h
Pa
T+72
−90 −60 −30 0 30 60 90Latitude
1000
800
600
400
200
Pre
ssur
e, h
Pa
T+96
−90 −60 −30 0 30 60 90Latitude
1000
800
600
400
200
Pre
ssur
e, h
Pa
T+120
−90 −60 −30 0 30 60 90Latitude
1000
800
600
400
200
Pre
ssur
e, h
Pa
Figure 8: Absolute mean change difference in the forecast ofair temperature between SMOS-DA and CTRL-DA, as afunction of the atmospheric pressure level, averaged for the period June to August 2010. ”fzo1” makes reference toSMOS-DA, whereas ”fzo5” makes reference to CTRL-DA. Positive values means that SMOS-DA is warming up comparedto CTRL-DA, whereas negative values points towards SMOS-DAcooling down compared to CTRL-DA.
Contract Report to ESA 23

ESA report on Level 3 root-zone soil moisture & DA impact
−0.3
−0.2
−0.1
0.0
0.1
0.2
0.3
Diff
eren
ce in
tim
e−m
ean
field
[%]
Difference in time−mean R (fzo1−fzo5), 1−Jun−2010 to 31−Aug−2010From 92 to 92 analyses.
T+0
−90 −60 −30 0 30 60 90Latitude
1000
800
600
400
200
Pre
ssur
e, h
Pa
T+12
−90 −60 −30 0 30 60 90Latitude
1000
800
600
400
200
Pre
ssur
e, h
Pa
T+24
−90 −60 −30 0 30 60 90Latitude
1000
800
600
400
200
Pre
ssur
e, h
Pa
T+48
−90 −60 −30 0 30 60 90Latitude
1000
800
600
400
200P
ress
ure,
hP
a
T+72
−90 −60 −30 0 30 60 90Latitude
1000
800
600
400
200
Pre
ssur
e, h
Pa
T+96
−90 −60 −30 0 30 60 90Latitude
1000
800
600
400
200
Pre
ssur
e, h
Pa
T+120
−90 −60 −30 0 30 60 90Latitude
1000
800
600
400
200
Pre
ssur
e, h
Pa
Figure 9: As Fig.8 but for air humidity.
24 Contract Report to ESA
ESA report on Level 3 root-zone soil moisture & DA impact
Figure 10: Score card providing an overview over the performance of the SMOS-DA scores compared to CTRL-DA. Eachsymbol indicates for a given time step whether or not the experiment is significantly better or worse than the control; Greensquares means that SMOS-DA is better than CTRL-DA, yet not significant. Red squares have opposite meaning. Smallgreen triangles means that the improvement in the scores of SMOS-DA is statistically significant at 95% confidence level,whereas big green triangles means that is statistically highly significant (the confidence bar is above zero by more thanits height). Red triangles have similar meaning but they point towards degradation of SMOS-DA compared to CTRL-DA.No colour means neutral impact.
Contract Report to ESA 25

ESA report on Level 3 root-zone soil moisture & DA impact
Figure 11: As Fig.10but for tropics and Southern Hemisphere domains.
26 Contract Report to ESA

ESA report on Level 3 root-zone soil moisture & DA impact
1−Jun−2010 to 30−Aug−2010 from 87 to 91 samples. Confidence range 95%. Verified against own−analysis.
fzo1 − fzo5
T: −90° to −20°, 200hPa
0 1 2 3 4 5−0.015
−0.010
−0.005
0.000
0.005
Nor
mal
ised
diff
eren
ce
T: −20° to 20°, 200hPa
0 1 2 3 4 5−0.015
−0.010
−0.005
0.000
0.005
0.010T: 20° to 90°, 200hPa
0 1 2 3 4 5−0.005
0.000
0.005
0.010
0.015
0.020
T: −90° to −20°, 500hPa
0 1 2 3 4 5−0.020
−0.015
−0.010
−0.005
0.000
0.005
Nor
mal
ised
diff
eren
ce
T: −20° to 20°, 500hPa
0 1 2 3 4 5−0.010
−0.005
0.000
0.005
0.010T: 20° to 90°, 500hPa
0 1 2 3 4 5−0.010
−0.005
0.000
0.005
0.010
0.015
T: −90° to −20°, 850hPa
0 1 2 3 4 5−0.015
−0.010
−0.005
0.000
0.005
Nor
mal
ised
diff
eren
ce
T: −20° to 20°, 850hPa
0 1 2 3 4 5−0.010
−0.005
0.000
0.005
0.010T: 20° to 90°, 850hPa
0 1 2 3 4 5−0.005
0.000
0.005
0.010
0.015
0.020
T: −90° to −20°, 1000hPa
0 1 2 3 4 5Forecast day
−0.020
−0.015
−0.010
−0.005
0.000
0.005
Nor
mal
ised
diff
eren
ce
T: −20° to 20°, 1000hPa
0 1 2 3 4 5Forecast day
−0.010
−0.005
0.000
0.005
0.010T: 20° to 90°, 1000hPa
0 1 2 3 4 5Forecast day
0.000
0.005
0.010
0.015
0.020
Figure 12: Normalized root mean square air temperature forecast error difference between SMOS-DA and CTRL-DA,averaged for the period June to August 2010. Forecast errorsare computed against the own experiment analyses. Verticalbars show 95% confidence intervals. Left column is for the Southern Hemisphere extra tropical region, middle columnfor tropics and right column for Northern Hemisphere extra tropical region. Top row is for 200 hPa, middle top is for 500hPa, middle bottom is for 850 hPa and bottom row is for 1000 hPa.
Contract Report to ESA 27

ESA report on Level 3 root-zone soil moisture & DA impact
1−Jun−2010 to 30−Aug−2010 from 87 to 91 samples. Confidence range 95%. Verified against own−analysis.
fzo1 − fzo5
R: −90° to −20°, 200hPa
0 1 2 3 4 5−0.015
−0.010
−0.005
0.000
0.005
0.010
0.015
Nor
mal
ised
diff
eren
ce
R: −20° to 20°, 200hPa
0 1 2 3 4 5−0.010
−0.005
0.000
0.005
0.010
0.015R: 20° to 90°, 200hPa
0 1 2 3 4 5−0.010
−0.005
0.000
0.005
0.010
0.015
R: −90° to −20°, 500hPa
0 1 2 3 4 5−0.010
−0.005
0.000
0.005
0.010
Nor
mal
ised
diff
eren
ce
R: −20° to 20°, 500hPa
0 1 2 3 4 5−0.005
0.000
0.005
0.010
0.015R: 20° to 90°, 500hPa
0 1 2 3 4 5−0.005
0.000
0.005
0.010
R: −90° to −20°, 850hPa
0 1 2 3 4 5−0.015
−0.010
−0.005
0.000
0.005
0.010
Nor
mal
ised
diff
eren
ce
R: −20° to 20°, 850hPa
0 1 2 3 4 5−0.010
−0.005
0.000
0.005
0.010R: 20° to 90°, 850hPa
0 1 2 3 4 5−0.004
−0.002
0.000
0.002
0.004
0.006
0.008
R: −90° to −20°, 1000hPa
0 1 2 3 4 5Forecast day
−0.010
−0.005
0.000
0.005
0.010
Nor
mal
ised
diff
eren
ce
R: −20° to 20°, 1000hPa
0 1 2 3 4 5Forecast day
−0.008
−0.006
−0.004
−0.002
0.000
0.002
0.004
0.006R: 20° to 90°, 1000hPa
0 1 2 3 4 5Forecast day
−0.010
−0.005
0.000
0.005
0.010
0.015
Figure 13: As Fig.12but for air humidity.
28 Contract Report to ESA

ESA report on Level 3 root-zone soil moisture & DA impact
-5 -3 -2 -1 -0.5 -0.2 -0.1 0.1 0.2 0.5 1 2 3 5
-5 -3 -2 -1 -0.5 -0.2 -0.1 0.1 0.2 0.5 1 2 3 5 -5 -3 -2 -1 -0.5 -0.2 -0.1 0.1 0.2 0.5 1 2 3 5
-5 -3 -2 -1 -0.5 -0.2 -0.1 0.1 0.2 0.5 1 2 3 5 -5 -3 -2 -1 -0.5 -0.2 -0.1 0.1 0.2 0.5 1 2 3 5
-5 -3 -2 -1 -0.5 -0.2 -0.1 0.1 0.2 0.5 1 2 3 5
Figure 14: Root Mean Square 2 m temperature forecast error diference between SMOS-DA and CTRL-DA at 24h (topleft), 36h (top right), 48h (middle left), 72h (middle right), 96h (bottom left) and 120 (bottom right) forecast lead time.Forecast errors are computed against the own experiment analysis. Values are averaged over the period June to August2010.
Contract Report to ESA 29

ESA report on Level 3 root-zone soil moisture & DA impact
−0.04
−0.02
0.00
0.02
0.04
Diff
eren
ce in
RM
S e
rror
nor
mal
ised
by
RM
S e
rror
of c
ontr
ol
Change in error in T (fzo1−fzo5), 1−Jun−2010 to 30−Aug−2010From 87 to 91 samples. Cross−hatching indicates 95% confidence. Verified against own−analysis.
T+12
−90 −60 −30 0 30 60 90Latitude
1000
800
600
400
200
Pre
ssur
e, h
Pa
T+24
−90 −60 −30 0 30 60 90Latitude
1000
800
600
400
200
Pre
ssur
e, h
Pa
T+48
−90 −60 −30 0 30 60 90Latitude
1000
800
600
400
200
Pre
ssur
e, h
Pa
T+72
−90 −60 −30 0 30 60 90Latitude
1000
800
600
400
200
Pre
ssur
e, h
Pa
T+96
−90 −60 −30 0 30 60 90Latitude
1000
800
600
400
200
Pre
ssur
e, h
Pa
T+120
−90 −60 −30 0 30 60 90Latitude
1000
800
600
400
200
Pre
ssur
e, h
Pa
Figure 15: Normalized Root Mean Square (RMS) air temperature forecast error difference between SMOS-DA and CTRL-DA, as a function of the pressure level. Forecast errors are computed against the own experiment analyses. Values areaveraged between June and August 2010. Negative values means that the RMS forecast error is smaller for SMOS-DA,whereas positive values means increase of RMS forecast error. Hatched values are significant at 95% confidence level.
30 Contract Report to ESA

ESA report on Level 3 root-zone soil moisture & DA impact
−0.04
−0.02
0.00
0.02
0.04
Diff
eren
ce in
RM
S e
rror
nor
mal
ised
by
RM
S e
rror
of c
ontr
ol
Change in error in R (fzo1−fzo5), 1−Jun−2010 to 30−Aug−2010From 87 to 91 samples. Cross−hatching indicates 95% confidence. Verified against own−analysis.
T+12
−90 −60 −30 0 30 60 90Latitude
1000
800
600
400
200
Pre
ssur
e, h
Pa
T+24
−90 −60 −30 0 30 60 90Latitude
1000
800
600
400
200
Pre
ssur
e, h
Pa
T+48
−90 −60 −30 0 30 60 90Latitude
1000
800
600
400
200
Pre
ssur
e, h
Pa
T+72
−90 −60 −30 0 30 60 90Latitude
1000
800
600
400
200P
ress
ure,
hP
a
T+96
−90 −60 −30 0 30 60 90Latitude
1000
800
600
400
200
Pre
ssur
e, h
Pa
T+120
−90 −60 −30 0 30 60 90Latitude
1000
800
600
400
200
Pre
ssur
e, h
Pa
Figure 16: As Fig.15but for air humidity.
Contract Report to ESA 31

ESA report on Level 3 root-zone soil moisture & DA impact
4 Discussion
This report describes the system that is used to generate a new root zone soil moisture product, based on theassimilation of screen level variables and SMOS data. The new product willbe delivered as a 2.5 years product,covering the nominal life of the SMOS mission. SMOS data is only sensitive to soilmoisture variations of thefirst few cms of soil, however, advanced data assimilation systems, as the EKF used in this study, makes itpossible to propagate SMOS information into deeper layers through the Jacobian matrix and data assimilationcycling. In this way, not only the most shallow surface benefits from remotesensing data, but also the root-zonelayer.
This is the first time that a long assimilation experiment using SMOS data has been run at ECMWF. It is alsothe first time that satellite radiances, at global scale, are integrated in the surface analysis. The quality ofthe product described in this study depends on the ability to separate the observations of only highest quality,but it is also very sensitive to the configuration of the assimilation system. The latter involves an accurateknowledge of the uncertainty assigned to the observations and the state vector, as well as knowledge of theacceptable quality control limits of the difference between the observed SMOS brightness temperature and itsmodel equivalent simulated by CMEM. The EKF configuration used in this study benefits from previous in-vestigations which optimize several components of the EKF, as the SMOS components of the Jacobian matrixand a dedicated monthly CDF matching removing systematic bias and variability between SMOS observationsand model equivalents. It also makes better use of SMOS observations, for example, by averaging observationsin angular bins of 2 degrees prior to be assimilated. However, the system is not fully optimized yet. Furtherrefinement and deeper investigation of each of the EKF components affecting the analysis will very likely leadto improved results. Therefore, the quality of the soil moisture product presented here, as well as the atmo-spheric impact on several atmospheric variables presented in the above figures, should be interpreted with somecaution, as they are obtained with a first version of the data assimation system.Future investigations will targetto make better use of SMOS data in the EKF, through a better quality control andthrough optimization of eachcomponent of the assimilation system.
The atmospheric impact shown in this study presents some positive and significant results for the SouthernHemisphere, whereas some are negative in the Northern Hemisphere. In particular, some statistically signifi-cant degradation was found close to the surface in the latitudinal band extending from 30 to 60◦N North. Thisis the band of latitude most affected by RFI, and it might partly explain the bad scores presented in some ofthe figures. However, this problem cannot fully explain the negative scores obtained in some domains, in par-ticular in the USA. Here, model aspects or non optimized components of the assimilation system might affectnegatively the influence of the new state of the soil on the forecast of atmospheric variables. It should also betaken into account, that the period of verification uses SMOS observationsof the reprocessed dataset. Whilethe reprocessed dataset in 2010 removes much of the strongest RFI sources encountered during this early stageof the SMOS mission, it does certainly not remove all of it, and significant contamination could be found in thedata.
Finally, it is important to understand how the atmospheric scores are verified. In this study, an analysis validat the same time of the forecast is considered to represent the ”truth”, andwe use each experiment’s ”ownanalysis” as the reference to compare against. In this way we avoid making aprior assumption about whichanalysis (SMOS-DA or CTRL-DA) is best. However, this way of verifyingatmospheric scores has to be takenwith caution, as they are in no way independent of the system being tested (Geer et al. 2010) and may changethe level of variability which unfairly can be interpreted as negative impact. While, in this study, this choicedoes not seem to affect the computed scores, it does certainly need to beaccounted for in the interpretation of
32 Contract Report to ESA

ESA report on Level 3 root-zone soil moisture & DA impact
the results.
5 Conclusions
This document reports on 1) the system used to produce a new root zonesoil moisture product assimilatingscreen level variables and SMOS data and 2) the impact of SMOS-DA on surface and atmospheric variables.The system benefits from the coupled HTESSEL-IFS and the CMEM interface structure, which makes it possi-ble to compare SMOS observations and the model equivalents at the time of the observations. Previous works(see references section1), permitted to solve some issues and make the use of SMOS data in the IFS moreoptimal.An extensive validation of the impact of assimilating SMOS data in the ECMWF EKF on soil moisture, wasdone. To this end, independent in-situ soil moisture observations from several networks around the world wereused. The period of validation was June, July and August of the year 2010. During this period, a strongerimpact of the new state of the soil on atmospheric variables may be expected in the Northern Hemisphere. Thesoil moisture validation exercise showed that, over the eleven networks with available soil moisture observa-tions used in this study, eight obtained better averaged R values when SMOSdata was assimilated than withoutthem. Besides, the three networks where R was not improved present particular difficult conditions, as being inareas of extreme climate of strongly contaminated by RFI. Consistenly, RMSD and MB were also decreased inthe experiment using SMOS data, but RMSD values remains in many cases high. This might be a consequenceof representativeness issues (for example using a different soil texture in the analysis than the in-situ station),topography, vegetation, pedotransfer functions, which reflects the time integration of the meteorological forc-ing or the hydrological state of the soil, as well as the analysis. They are in agreement with previous validationstudies conducted at ECMWF. It also emphasizes the fact that the true information content in modelled soilmoisture not necessarily relies in their absolute magnitudes but in their time variation (Albergel et al. 2012b).The general trend of the soil moisture analysis increments during summer 2010 was drying the soil up. Thismay be an indication of the usefulness of SMOS information, as previous studies found systematic errors in theECMWF land surface model, resulting in too wet soil conditions. However, further investigation is needed tounderstand a possible systematic sign of the increments in certain areas, as after bias correction, the assimila-tion increments are deemed to correct only for random errors and not thesystematic biases.In this study, some observations up to 100 cm deep were available over the USA too. The averaged in-situobservations were compared to the averaged soil moisture analysis over the first metre of soil, and either for theSCAN or USCRN networks, the R was improved too. The impact on soil temperature and 2 m temperature didnot show significant differences.
The impact of SMOS-DA on the forecast skill of several atmospheric variables was evaluated too. It was foundthat the mean change in air temperature and humidity fields was mostly limited to the nearsurface atmosphereover continental surfaces. This result was expected as the assimilation ofSMOS data is made only over land.A warming of the near surface atmospheric level was observed in areas where, in general, the soil was driedup. Similarly, a cooling of the lowest atmospheric levels was produced if moisture was added to the soil.Nonetheless, the absolute mean changes values remained low. For air humidity, the opposite sign was found,as air temperature and air humidity are anticorrelated. These results showeda clear link of the soil moisturestate with air temperature and air humidity. Indeed, this has been the reason for many years (given the lack ofreliable remote sensing data sensitive to soil mositure) to operationally assimilate 2m temperature and relativehumidity to constrain soil moisture. It was also found that the propagation of the mean changes in air temper-ature were slow in higher atmospheric levels, with almost no changes in the tropics domain. Tropical regionsare dominated by high dense vegetated canopies, where SMOS has very littleimpact.
Contract Report to ESA 33

ESA report on Level 3 root-zone soil moisture & DA impact
Although the scores here presented suggested a decrease of the forecast error for air temperature and air humid-ity in the Southern Hemisphere, and an increase in the Northern Hemisphere,most of these scores were shownnot to be statistically significant. Just in a few cases an improvement/degradation of up to 1% was found forair temperature, but also for the vector wind speed and the geopotential. These latter variables are also affectedfor changes in temperature and humidity. It may be necessary to run longerexperiments to ensure statisticallysignificant results.
This report showed that ECMWF has developed a functioning data assimilation system able to produce a newsoil moisture product, that is based on assimilating SMOS data. It showed interesting and preliminary results,with a clear impact of SMOS data on land surface and near surface atmospheric variables. However, deeperinvestigations are needed, which will permit to optimize the use of these data in theIFS, in synergy with otherconventional and remote sensing data.
Acknowledgements
This work is funded under the ESA-ESRIN contract number 4000101703/10/NL/FF/fk. We would to thankMatthias Drusch and Susanne Mecklenburg (both ESA staff) for their involvement in this project. Also thanksto P. Lopez (ECMWF staff) for preparing the radar observations.
34 Contract Report to ESA

ESA report on Level 3 root-zone soil moisture & DA impact
6 Appendix
6.1 Score cards for Autumn 2010 (September, October and November)
Figure 17: As Fig.10but for the period 1 September to 30 November 2010..
Contract Report to ESA 35

ESA report on Level 3 root-zone soil moisture & DA impact
Figure 18: As Fig.17but the tropics and Southern Hemisphere domains.
36 Contract Report to ESA

ESA report on Level 3 root-zone soil moisture & DA impact
6.2 Normalized RMS forecast error for vector wind speed (VW) and geopotential (Z).
1−Jun−2010 to 30−Aug−2010 from 87 to 91 samples. Confidence range 95%. Verified against own−analysis.
fzo1 − fzo5
VW: −90° to −20°, 200hPa
0 1 2 3 4 5−0.020
−0.015
−0.010
−0.005
0.000
0.005
0.010
Nor
mal
ised
diff
eren
ce
VW: −20° to 20°, 200hPa
0 1 2 3 4 5−0.010
−0.005
0.000
0.005
0.010VW: 20° to 90°, 200hPa
0 1 2 3 4 5−0.005
0.000
0.005
0.010
0.015
0.020
VW: −90° to −20°, 500hPa
0 1 2 3 4 5−0.020
−0.015
−0.010
−0.005
0.000
0.005
Nor
mal
ised
diff
eren
ce
VW: −20° to 20°, 500hPa
0 1 2 3 4 5−0.010
−0.005
0.000
0.005
0.010VW: 20° to 90°, 500hPa
0 1 2 3 4 5−0.005
0.000
0.005
0.010
0.015
VW: −90° to −20°, 850hPa
0 1 2 3 4 5−0.020
−0.015
−0.010
−0.005
0.000
0.005
Nor
mal
ised
diff
eren
ce
VW: −20° to 20°, 850hPa
0 1 2 3 4 5−0.006
−0.004
−0.002
0.000
0.002
0.004
0.006
0.008VW: 20° to 90°, 850hPa
0 1 2 3 4 5−0.010
−0.005
0.000
0.005
0.010
0.015
VW: −90° to −20°, 1000hPa
0 1 2 3 4 5Forecast day
−0.020
−0.015
−0.010
−0.005
0.000
0.005
Nor
mal
ised
diff
eren
ce
VW: −20° to 20°, 1000hPa
0 1 2 3 4 5Forecast day
−0.006
−0.004
−0.002
0.000
0.002
0.004
0.006
0.008VW: 20° to 90°, 1000hPa
0 1 2 3 4 5Forecast day
−0.010
−0.005
0.000
0.005
0.010
0.015
0.020
Figure 19: As Fig.12but for the vector wind speed.
Contract Report to ESA 37

ESA report on Level 3 root-zone soil moisture & DA impact
1−Jun−2010 to 30−Aug−2010 from 87 to 91 samples. Confidence range 95%. Verified against own−analysis.
fzo1 − fzo5
Z: −90° to −20°, 200hPa
0 1 2 3 4 5−0.03
−0.02
−0.01
0.00
0.01
Nor
mal
ised
diff
eren
ce
Z: −20° to 20°, 200hPa
0 1 2 3 4 5−0.015
−0.010
−0.005
0.000
0.005
0.010Z: 20° to 90°, 200hPa
0 1 2 3 4 5−0.01
0.00
0.01
0.02
0.03
Z: −90° to −20°, 500hPa
0 1 2 3 4 5−0.03
−0.02
−0.01
0.00
0.01
Nor
mal
ised
diff
eren
ce
Z: −20° to 20°, 500hPa
0 1 2 3 4 5−0.015
−0.010
−0.005
0.000
0.005
0.010Z: 20° to 90°, 500hPa
0 1 2 3 4 5−0.01
0.00
0.01
0.02
0.03
Z: −90° to −20°, 850hPa
0 1 2 3 4 5−0.025
−0.020
−0.015
−0.010
−0.005
0.000
0.005
0.010
Nor
mal
ised
diff
eren
ce
Z: −20° to 20°, 850hPa
0 1 2 3 4 5−0.015
−0.010
−0.005
0.000
0.005
0.010
0.015Z: 20° to 90°, 850hPa
0 1 2 3 4 5−0.01
0.00
0.01
0.02
0.03
Z: −90° to −20°, 1000hPa
0 1 2 3 4 5Forecast day
−0.025
−0.020
−0.015
−0.010
−0.005
0.000
0.005
Nor
mal
ised
diff
eren
ce
Z: −20° to 20°, 1000hPa
0 1 2 3 4 5Forecast day
−0.015
−0.010
−0.005
0.000
0.005
0.010Z: 20° to 90°, 1000hPa
0 1 2 3 4 5Forecast day
−0.01
0.00
0.01
0.02
0.03
Figure 20: As Fig.12but for geopotential.
38 Contract Report to ESA

ESA report on Level 3 root-zone soil moisture & DA impact
6.3 Normalized RMS forecast error as a function of the atmospheric level, for VW and Z.
−0.04
−0.02
0.00
0.02
0.04
Diff
eren
ce in
RM
S e
rror
nor
mal
ised
by
RM
S e
rror
of c
ontr
ol
Change in error in VW (fzo1−fzo5), 1−Jun−2010 to 30−Aug−2010From 87 to 91 samples. Cross−hatching indicates 95% confidence. Verified against own−analysis.
T+12
−90 −60 −30 0 30 60 90Latitude
1000
800
600
400
200
Pre
ssur
e, h
Pa
T+24
−90 −60 −30 0 30 60 90Latitude
1000
800
600
400
200
Pre
ssur
e, h
Pa
T+48
−90 −60 −30 0 30 60 90Latitude
1000
800
600
400
200
Pre
ssur
e, h
Pa
T+72
−90 −60 −30 0 30 60 90Latitude
1000
800
600
400
200P
ress
ure,
hP
a
T+96
−90 −60 −30 0 30 60 90Latitude
1000
800
600
400
200
Pre
ssur
e, h
Pa
T+120
−90 −60 −30 0 30 60 90Latitude
1000
800
600
400
200
Pre
ssur
e, h
Pa
Figure 21: As Fig.15but for the vector wind speed.
Contract Report to ESA 39

ESA report on Level 3 root-zone soil moisture & DA impact
−0.04
−0.02
0.00
0.02
0.04
Diff
eren
ce in
RM
S e
rror
nor
mal
ised
by
RM
S e
rror
of c
ontr
ol
Change in error in Z (fzo1−fzo5), 1−Jun−2010 to 30−Aug−2010From 87 to 91 samples. Cross−hatching indicates 95% confidence. Verified against own−analysis.
T+12
−90 −60 −30 0 30 60 90Latitude
1000
800
600
400
200
Pre
ssur
e, h
Pa
T+24
−90 −60 −30 0 30 60 90Latitude
1000
800
600
400
200
Pre
ssur
e, h
Pa
T+48
−90 −60 −30 0 30 60 90Latitude
1000
800
600
400
200
Pre
ssur
e, h
Pa
T+72
−90 −60 −30 0 30 60 90Latitude
1000
800
600
400
200P
ress
ure,
hP
a
T+96
−90 −60 −30 0 30 60 90Latitude
1000
800
600
400
200
Pre
ssur
e, h
Pa
T+120
−90 −60 −30 0 30 60 90Latitude
1000
800
600
400
200
Pre
ssur
e, h
Pa
Figure 22: As Fig.15but for geopotential.
40 Contract Report to ESA

ESA report on Level 3 root-zone soil moisture & DA impact
7 References
References
[Albergel et al. 2012a] Albergel, C., P. de Rosnay, C. Gruhier, J. M.noz Sabater, S. Hasenauer, L. Isak-sen, Y. Kerr, and W. Wagner, 2012a : Evaluation of remotely sensed and modelled soil moistureproducts using global ground-based in-situ observations.Remote Sensing of Environment, 18,215–226.doi:10.1016/j.rse.2011.11.017.
[Albergel et al. 2012b] Albergel, C., P. de Rosnay, C. Gruhier, J. M.noz Sabater, S. Hasenauer, L. Isaksen,Y. Kerr, and W. Wagner, 2012b : Soil moisture analyses at ECMWF: Evaluation using global ground-basedin situ observations.J. Hydrometeor., 13,1442–1460. doi:10.1175/JHM-D-11-0107.1.
[Balsamo et al. 2009] Balsamo, G., P. Viterbo, A. Beljaars, B. van den Hurk, M. Hirschi, A. Betts, and K. Sci-pal, 2009 : A revised hydrology for the ECMWF model: Verification from field site to terrestrial waterstorage and impact in the integrated forecast system.Journal of Hydrometeorology, 10,623–643. doi:10.1175/2008JHM1068.1.
[Boussetta et al. 2013] Boussetta, S., G. Balsamo, A. Beljaars, and J. Jarlan, 2013 : Impact of a satellite-derived leaf area index monthly climatology in a global numerical weather prediction model.InternationalJournal of Remote Sensing.
[de Rosnay et al. 2009a] de Rosnay, P., M. Drusch, A. Boone, G. Balsamo, B. Decharme, P. Harris, Y. Kerr,T. Pellarin, J. Polcher, and J.-P. Wigneron, 2009a : AMMA Land Surface Model Intercomparison Exper-iment coupled to the Community Microwave Emission Model: ALMIP-MEM.J. Geophys. Res., 114.D05108, doi:10.1029/2008JD010724.
[de Rosnay et al. 2009b] de Rosnay, P., M. Drusch, and J.Munoz-Sabater, 2009b : Milestone 1 Technical NotePart I: SMOS global surface emission model. Technical report, European Centre for Medium-Range WeatherForecast, Reading, United Kingdom.
[de Rosnay et al. 2013] de Rosnay, P., M. Drusch, D. Vasiljevic, G. Balsamo, C. Albergel, and L. Isaksen, 2013: A Simplified Extended Kalman Filter for the global operational soil moisture analysis at ECMWF.QuartJ. Roy. Meteor. Soc., 139,1199–1213. doi: 10.1002/qj.2023.
[de Rosnay et al. 2014] de Rosnay et al., P., 2014 : SMOS Report on bias correction. Technical report, Euro-pean Centre for Medium-Range Weather Forecasts, Reading, United Kingdom. in preparation.
[Drusch et al. 2009a] Drusch, M., P. de Rosnay, G. Balsamo, E. Andersson, P. Bougeault, and P. Viterbo,2009a : Towards a Kalman filter based soil moisture analysis system for the operational ECMWF IntegratedForecast System.Geophys. Res. Lett., 36. doi:10.1029/2009GL037716, 2009.
[Drusch et al. 2009b] Drusch, M., T. Holmes, P. de Rosnay, and G. Balsamo, 2009b : Comparing ERA-40based L-band brightness temperatures with Skylab observations: A calibration / validation study using theCommunity Microwave Emission Model.J. Hydrometeor., 10,213–226. doi: 10.1175/2008JHM964.1.
[Geer et al. 2010] Geer, A., P. Bauer, and P. Lopez, 2010 : Direct 4D-Var assimilation of all-sky radiances.Part II: Assessment.Quart J. Roy. Meteor. Soc., 136,1886–1905.
[IFS documentation 2012] IFS documentation, 2012 :IFS Documentation Cycle 38R2. ECMWF, ShinfieldRoad, RG2 9AX, Reading, UK. photocopy.
Contract Report to ESA 41

ESA report on Level 3 root-zone soil moisture & DA impact
[Kerr et al. 2010] Kerr, Y., P. Waldteufel, J.-P. Wigneron, S. Delwart, F. Cabot, J. Boutin, M. Escorihuela,J. Font, N. Reul, C. Gruhier, S. Juglea, M. Drinkwater, A. Hahne, M. Martin-Neira, and S. Mecklenburg,2010 : The SMOS mission: New tool for monitoring key elements of the Global Water Cycle.Proc. IEEE,98,666–687.
[Munoz-Sabater et al. 2011a] Munoz-Sabater, J., M. Dahoui, P. de Rosnay, and L. Isaksen, 2011a :SMOSMonitoring Report; Part II. Technical report, European Centre for Medium-Range Weather Forecasts, Read-ing, United Kingdom.
[Munoz-Sabater et al. 2013a] Munoz-Sabater, J., M. Dahoui, P. de Rosnay, and L. Isaksen, 2013a :SMOSMonitoring Report; Number III: Dec. 2011 - Dec. 2012. Technical report, European Centre for Medium-Range Weather Forecasts, Reading, United Kingdom.
[Munoz-Sabater et al. 2014] Munoz-Sabater, J., M. Dahoui, P. de Rosnay, and L. Isaksen, 2014 : SMOS Mon-itoring Report; Number IV: Jan. 2013 - Dec. 2013. Technical report, European Centre for Medium-RangeWeather Forecasts, Reading, United Kingdom.
[Munoz-Sabater and de Rosnay 2011] Munoz-Sabater, J., and P. de Rosnay, 2011 : Tech note- Part III-WP1300: SMOS Report on Noise Filtering. Technical report, EuropeanCentre for Medium-Range WeatherForecasts, Reading, United Kingdom.
[Munoz-Sabater et al. 2011b] Munoz-Sabater, J., P. de Rosnay, and M. Dahoui, 2011b : SMOS ContinuousMonitoring Reports; Part I. Technical report, European Centre for Medium-Range Weather Forecasts, Read-ing, United Kingdom.
[Munoz-Sabater et al. 2010] Munoz-Sabater, J., P. de Rosnay, and A. Fouilloux, 2010 : Milestone 2 TechnicalNote, Part I:operational pre-processing chain, Part II:collocation software development, Part III: Offlinemonitoring suite. Technical report, European Centre for Medium-Range Weather Forecasts, Reading, UnitedKingdom.
[Munoz-Sabater et al. 2013b] Munoz-Sabater, J., P. de Rosnay, A. Fouilloux, M. Dahoui, L. Isaksen,C. Al-bergel, I. Mallas, and T. Wilhelmsson, 2013b : Phase I, Final Report. Technical report, European Centre forMedium-Range Weather Forecasts, Reading, United Kingdom.
[Munoz-Sabater et al. 2009] Munoz-Sabater, J., P. de Rosnay, A. Fouilloux, M. Dragosavac, and A.Hofstadler,2009 : Milestone 1 Technical Note 1 Part II: IFS interface. Technical report, European Centre for Medium-Range Weather Forecasts, Reading, United Kingdom.
[Munoz-Sabater et al. 2011c] Munoz-Sabater, J., P. de Rosnay, and G.Balsamo, 2011c : Sensitivity of L-band NWP forward modelling to soil roughness.Int. J. Remote Sens., 32,5607–5620. iFirst 2011., doi:10.1080/01431161.2010.507260.
[Munoz-Sabater et al. 2013c] Munoz-Sabater, J., P. de Rosnay, and L. Isaksen, 2013c : SMOS report on hot-spots. Technical report, European Centre for Medium-Range WeatherForecasts, Reading, United Kingdom.
[Munoz-Sabater et al. 2012] Munoz-Sabater, J., A. Fouilloux, and P. de Rosnay, 2012 : Technical implementa-tion of SMOS data in the ECMWF Integrated Forecasting System.Geosc. Remote Sens. Letters, 9,252–256.
[Munoz-Sabater et al. 2011d] Munoz-Sabater, J., T. Wilhemsson, and P. de Rosnay, 2011d : Tech note-Part II-WP1200: SMOS report on Data Thinning. Technical report, EuropeanCentre for Medium-Range WeatherForecasts, Reading, United Kingdom.
[Pellarin et al. 2003] Pellarin, T., J.-P. Wigneron, J.-C. Calvet, and P. Waldteufel, 2003 : Global soil moistureretrieval from a synthetic l-band brightness temperature data set.Journal of Geophysical Research, 108.
42 Contract Report to ESA

ESA report on Level 3 root-zone soil moisture & DA impact
[Wang and Schmugge 1980] Wang, J. R., and T. Schmugge, 1980 : An empirical model for the complex di-electric permittivity of soils as a function of water content.IEEE Transactions on Geoscience and RemoteSensing, 18,288–295.
[Wigneron et al. 2007] Wigneron, J.-P., Y. Kerr, P. Waldteufel, K. Saleh, M.-J. Escorihuela, P. Richaume,P. Ferrazzoli, P. de Rosnay, R. Gurneye, J.-C. Calvet, J. Grant, M. Guglielmetti, B. Hornbuckle, C. Mt-zler, T. Pellarin, and M. Schwank, 2007 : L-band microwave emission of the biosphere (L-MEB) model:Description and calibration against experimental data sets over crop fields. Remote Sensing of Environment,107,639–655.
[Wigneron et al. 2001] Wigneron, J. P., L. Laguerre, and Y. Kerr, 2001 : A simple parameterization of theL-band microwave emission from rough agricultural soils.IEEE Transactions on Geoscience and RemoteSensing, 39,1697–1707.
Contract Report to ESA 43