
SICODYN : benchmark pour l’évaluation du calcul … : benchmark pour l’évaluation du calcul...
22
SICODYN : benchmark pour l’évaluation du calcul dynamique et du recalage sur une structure industrielle Sylvie AUDEBERT, Charles BODEL EDF R&D Acoustics and Mechanical Analyses Department
-
Upload
hoangtuyen -
Category
Documents
-
view
217 -
download
3
Transcript of SICODYN : benchmark pour l’évaluation du calcul … : benchmark pour l’évaluation du calcul...

SICODYN : benchmark pour l’évaluation du calcul dynamique et du recalage sur une structure
industrielle
Sylvie AUDEBERT, Charles BODEL
EDF R&D
Acoustics and Mechanical AnalysesDepartment

2 - congrès NAFEMS France, 12-13 octobre 2010, Paris -
Outline
1. SICODYN benchmark definitionObjectivesWhat type of demonstrator ?Methodology
2. Total variability of numerical predictions in blind conditionsModal characteristics on pump components
3. Parametrical study on boundary conditions4. Measurement uncertainty
2 identical modal analyses on a pump componentModal analyses on the pump assembly with different boundary conditions
5. Numerical-experimental correlationModal characteristics on a pump componentModal characteristics on pump assemblyExample of updating results
6. Conclusion – Further works

3 - congrès NAFEMS France, 12-13 octobre 2010, Paris -
1. SICODYN benchmark definition
Benchmark objectives
Quantify the credibility of numerical predictions in structure dynamics
Observe the total variability of numerical predictions in blind conditionsMeasure the robustness to variability, uncertainty and lack of knowledge
Quantify the measurement uncertainty
Measure the fidelity of numerical predictions to test dataMeasure the improvement of numerical models using experimental data
Duration: years 2008 to 2010

4 - congrès NAFEMS France, 12-13 octobre 2010, Paris -
1. SICODYN benchmark definition
What sort of demonstrator ?
Academical test � NONo experimental measurements, but a validation environment represented by the variation of input parameters
Ex: The Validation Challenge Workshop, 22-23 May 2006, Albuquerque, New Mexico
Organised by Sandia National Laboratories
Laboratory device � NOSimplification of an industrial structure regarding the geometry, the physical and the environmental complexity
Ex: SMART CEA-EDF benchmark
Industrial structure with fixed common parameters � NOCommon material characteristics, boundary conditions,…
Industrial structure in real simulation contextA typical industrial study with some unknown input data
Basic asumption: linear behaviour

5 - congrès NAFEMS France, 12-13 octobre 2010, Paris -
1. SICODYN benchmark definition
Target structure
Characteristics
Industrial (or quasi) complex structureAssembly of several sub-structures (bolted, riveted…)Considered in its environmentExcitation possibly unknown
Constraints
Availibility of plans or computer-aided designed, autorisation to disclose them to participantsPossibility to measure in stationary or in operating conditionsPossibility to partially dismount and reassembly the structureLimited time to elaborate the finite element model

6 - congrès NAFEMS France, 12-13 octobre 2010, Paris -
1. SICODYN benchmark definition
The chosen demonstrator
The SULZER one-stage horizontal Booster pump
The CAD model pump assembly

7 - congrès NAFEMS France, 12-13 octobre 2010, Paris -
1. SICODYN benchmark definition
EDF’s interest
Until now: EDF demanded pump manufacturers to ensure that shaft critical speeds are not near the nominal rotating speed �simulations only relative to the shaft dynamic behaviourNew item in EDF technical specifications for pumps:For certain types of pumps, statoric part resonances too must not be near the rotating frequency � simulations not usualConsequence: EDF and manufacturers must get confident pump models

8 - congrès NAFEMS France, 12-13 octobre 2010, Paris -
1. SICODYN benchmark definition
List of partners (16)
INSA Lyon
FEMTO Besançon
CETIM Senlis
PHIMECA Engineering
SAMTECH
VIBRATEC
EDF R&D
(SULZER Pumps France)
ILM Technology
Ecole Polytechnique de Lausanne (Switzerland)
Bristol University (United Kingdom)
Politecnico di Milano (Italy)
Gologanu (Roumania)
MSO Industrial (Colombia)
PIKITAN (Spain)
CAEnable (USA)
Delft University (The Netherlands)

9 - congrès NAFEMS France, 12-13 octobre 2010, Paris -
1. SICODYN benchmark definition
Hierarchical process
Geometrical / Physical complexity
Environ-mental com-plexity
Free-free separate component
Free-free pair of components
Free-free assembled pump
Non-connected pump fixed in concrete
Pump fixed and connected to pipes and other pump
Modal and response analyses
Pump in operating conditions

10 - congrès NAFEMS France, 12-13 octobre 2010, Paris -
The 8 main pump components
1-shaft
3-bearing support2-bearing casing 4-cooling flange
frame5-pump casing
7-elbow
6-Suction flange
11 - congrès NAFEMS France, 12-13 octobre 2010, Paris -
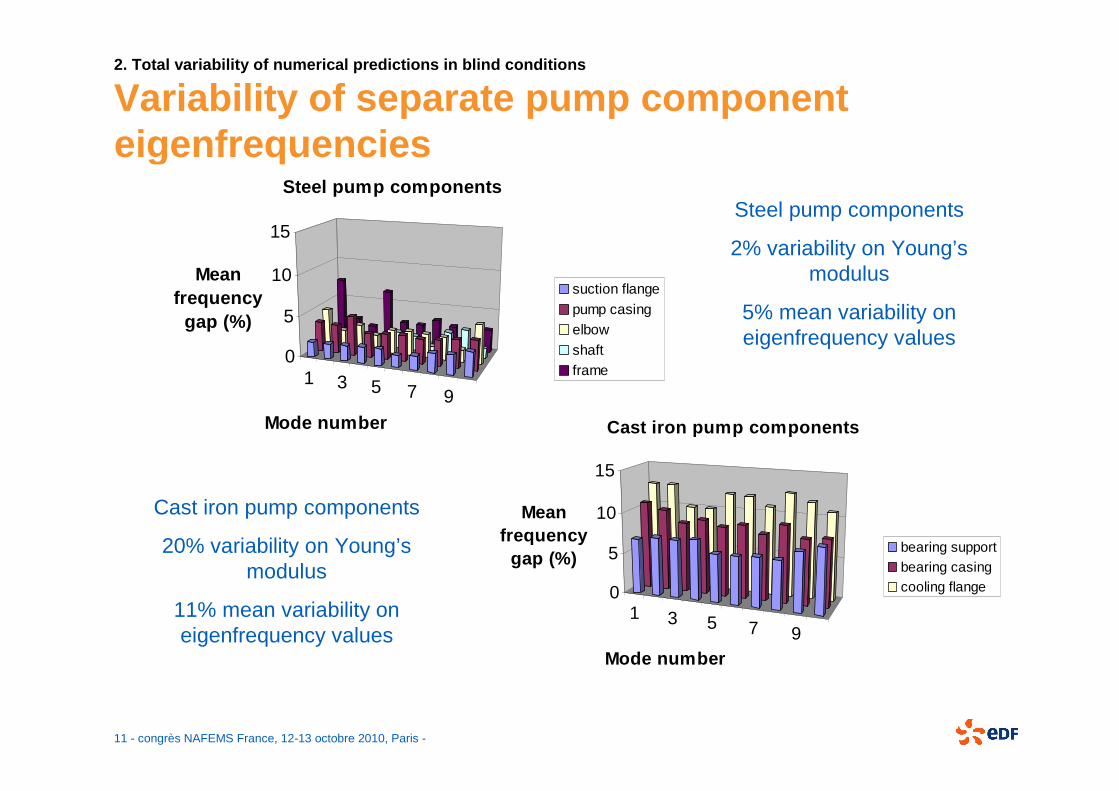
2. Total variability of numerical predictions in bl ind conditions
Variability of separate pump component eigenfrequencies
1 3 5 7 9
0
5
10
15
Mean frequency
gap (%)
Mode number
Steel pump components
suction flangepump casingelbowshaftframe
1 3 5 7 9
0
5
10
15
Mean frequency
gap (%)
Mode number
Cast iron pump components
bearing supportbearing casingcooling flange
Steel pump components
2% variability on Young’s modulus
5% mean variability on eigenfrequency values
Cast iron pump components
20% variability on Young’s modulus
11% mean variability oneigenfrequency values

12 - congrès NAFEMS France, 12-13 octobre 2010, Paris -
3. Parametrical study on boundary conditions
Parametrical analysis on the clamped boundary condition
Configuration 1: frame completly fixed in concrete
Configuration 2: frame partially fixed in concrete
deux rangés de nœuds où les condd’encastrement ont été appliquées

13 - congrès NAFEMS France, 12-13 octobre 2010, Paris -
Representation of connections between pump components
Bolted assembly: rigid connections via rigid relationships, elements or sticked surfaces
Ball and hydrodynamic bearings: estimated radial and axial stiffnesses

14 - congrès NAFEMS France, 12-13 octobre 2010, Paris -
4. Measurement uncertainty
Focus on: variability between two measurementsExample : pump casing
One modal analysis in 2009, the other one in 2010 at Sulzer Service in Velaux (Marseille)
Same methods and means of measurementsTwo operators and two different structures
Outstanding conclusionsAbility to pair modes from each experiment
Frequency shift: max 3%
BUT: maximum MAC between pairs is lower than 60%
Ecart frequentiel relatif
0
0,5
1
1,5
2
2,5
3
3,5
452 508 728 787 912 961
Fréquences des modes (2009)
Eca
rt fré
quen
tiel (
%)
15 - congrès NAFEMS France, 12-13 octobre 2010, Paris -
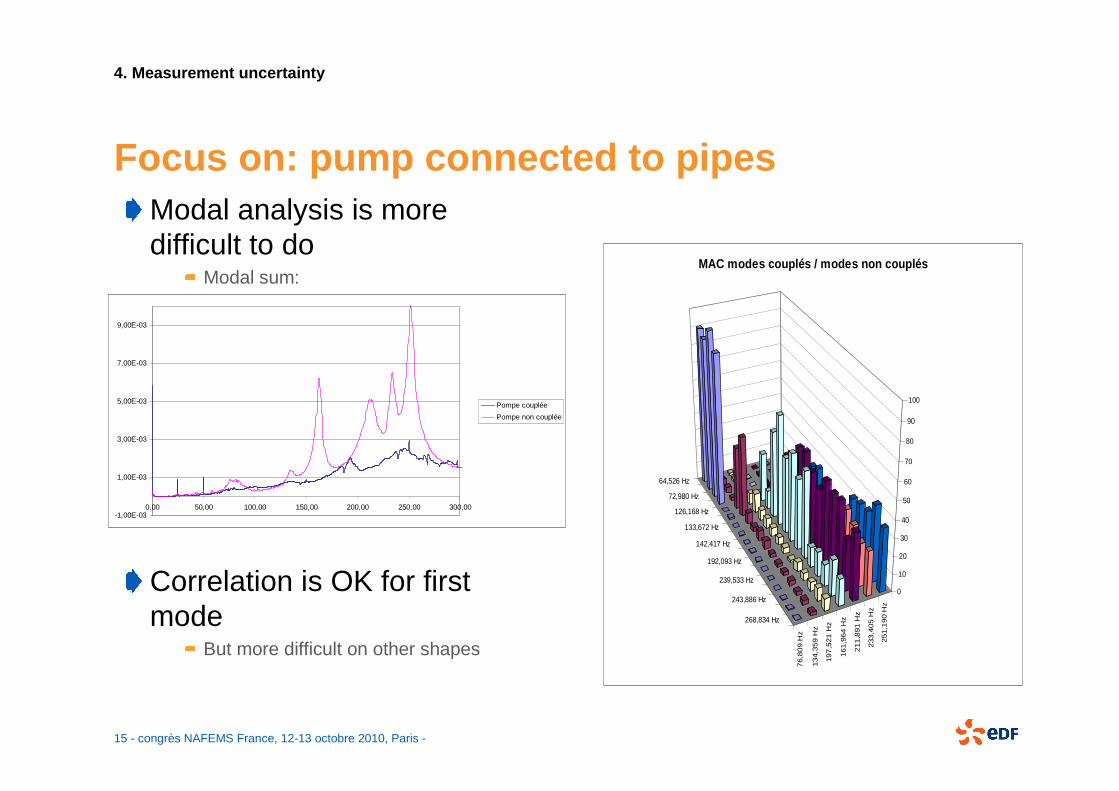
4. Measurement uncertainty
Focus on: pump connected to pipesModal analysis is more difficult to do
Modal sum:
Correlation is OK for first mode
But more difficult on other shapes
-1,00E-03
1,00E-03
3,00E-03
5,00E-03
7,00E-03
9,00E-03
0,00 50,00 100,00 150,00 200,00 250,00 300,00
Pompe couplée
Pompe non couplée
64,526 Hz
72,980 Hz
126,168 Hz
133,672 Hz
142,417 Hz
192,093 Hz
239,533 Hz
243,886 Hz
268,834 Hz
76,8
09 H
z
134,3
59 H
z
197
,521
Hz
161,9
64 H
z
211,8
91 H
z
233,4
05 H
z
25
1,1
90 H
z
0
10
20
30
40
50
60
70
80
90
100
MAC modes couplés / modes non couplés

16 - congrès NAFEMS France, 12-13 octobre 2010, Paris -
5. Numerical-experimental correlation
Experimental-numerical comparison of separate compo nent modal analyses:
the pump casing example
1 3 5 7 9
-0,3
-0,2
-0,1
0
0,1
0,2
Frequency error
Mode number
Partner 1Partner 2Partner 3Partner 4Partner 5Partner 6Partner 7Partner 8
0200400600800
1000120014001600
1 2 3 4 5 6 7 8 9 10
Mode number
Min
., M
ax.,
Exp
. F
requ
ency
(H
z)
00,10,20,30,40,50,60,70,8
1 2 3 4
Mode number
MA
C

17 - congrès NAFEMS France, 12-13 octobre 2010, Paris -
5. Numerical-experimental correlation
Bearing support
0
200
400
600
800
1000
1200
1 2 3 4 5 6 7 8 9 10
Mode number
Min
., M
ax.,
Exp
. F
requ
ency
(H
z)
1 3 5 7 9 11S1
S6-0,3
-0,2
-0,1
0
0,1
0,2
Frequency error
Mode number
Participant
3rd experimental mode missing
Experimental values between min-max numerical values
0
200
400
600
800
1000
1200
1 2 3 4 5 6 7 8 9 10 11 12
Mode number
Fre
quen
cy (
Hz)
Série1Série2Série3Série4Série5Série6Série7Série8

18 - congrès NAFEMS France, 12-13 octobre 2010, Paris -
5. Numerical-experimental correlation
Pump assembly: numerical-experimental correlation
Torsion around x axis
162 Hz194 Hz208 Hz62 Hz170 Hz
Flexion along x transversal axis
134 Hz178 Hz146 Hz92 Hz
Flexion along z longitudinalaxis
77 Hz103 Hz111 Hz45 Hz90 Hz
Flexion of the pump casing
Non identified
mode
91 Hz109 Hz
19 - congrès NAFEMS France, 12-13 octobre 2010, Paris -
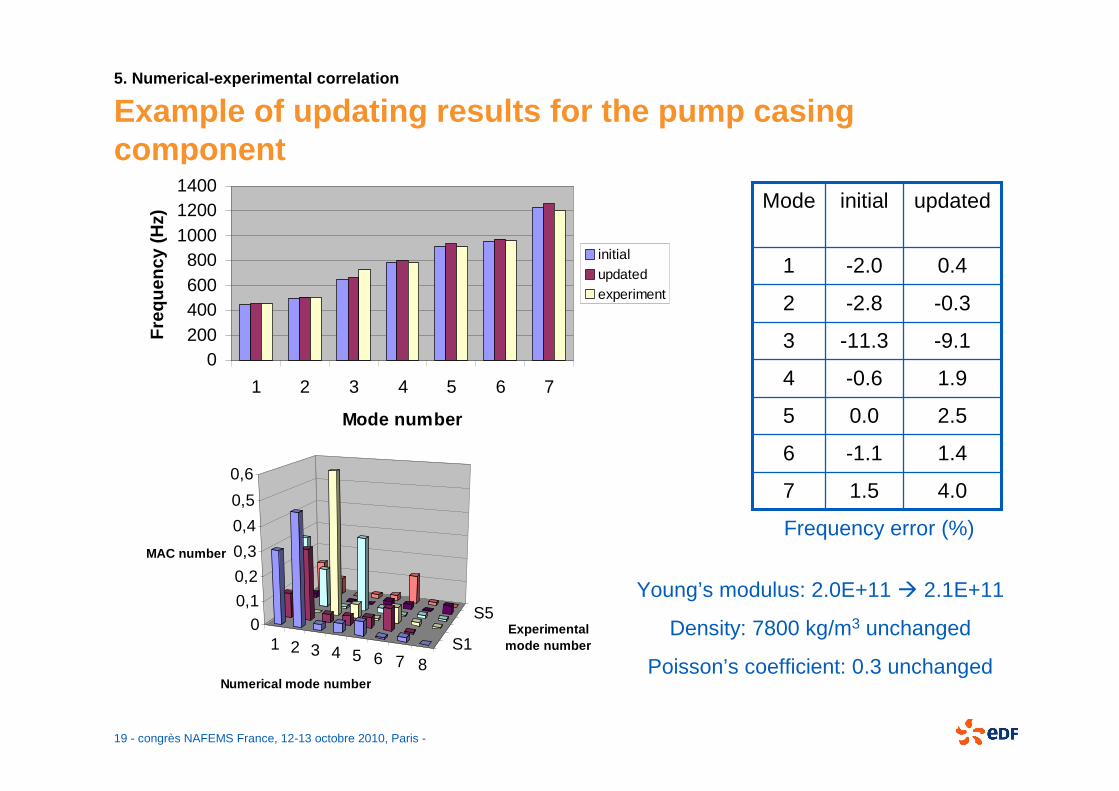
5. Numerical-experimental correlation
Example of updating results for the pump casing component
0200400600800
100012001400
1 2 3 4 5 6 7
Mode number
Fre
quen
cy (
Hz)
initialupdatedexperiment
4.01.57
1.4-1.16
2.50.05
1.9-0.64
-9.1-11.33
-0.3-2.82
0.4-2.01
updatedinitialMode
Frequency error (%)
1 2 3 4 5 6 7 8S1
S50
0,1
0,2
0,3
0,4
0,5
0,6
MAC number
Numerical mode number
Experimental mode number
Young’s modulus: 2.0E+11 � 2.1E+11
Density: 7800 kg/m3 unchanged
Poisson’s coefficient: 0.3 unchanged

20 - congrès NAFEMS France, 12-13 octobre 2010, Paris -
Purpose for a comparative and updating process
Compare numerical results Compare experimental results
Participant 1 Participant 2 Participant n
Numerical variability
•Conceptual modeling
•Mathematical modeling
•Model parameters, input data
•Discretisation
•Software, numerical methods
Measurement 1 Measurement 2
Experimental variability
•Measurement system
•Identification process
•Realisation (identicalstructures, systems modified after a partial dismount/reassembly)
Compare numerical-experimental results
Fidelity to test data

21 - congrès NAFEMS France, 12-13 octobre 2010, Paris -
6. Conclusion
Conclusion on reliability on modal models of sub-structures
Numerical aspectsNarrow numerical variability on eigenmodes
Numerical-experimental correlationBlind simulations
– Experimental eigenfrequency values are within the min.-max. numerical eigenfrequencyvalue interval
– Modeshape correlation not quite satisfactory (based on MAC criterion)
Updated simulationsImprovement of the eigenfrequency values, but MAC inchanged
Ability of numerical models to accuratly predict the global modal behaviour of a complex structureIs the updating of the sub-structure model parameters necessary to increase the reliability of the built-up structure ?

22 - congrès NAFEMS France, 12-13 octobre 2010, Paris -
6. Conclusion
Questions to be pointed out
Can a purely blind numerical model accuratly represent the dynamical behaviour of a built-up structure in its environment ?
What are the relative parts of the modeling error and the parametrical error ?Can a parameter updating compensate the modeling error ?
What parameter variations are acceptable, in order to obtain an admissible numerical model (i.e. which intercepts the experimental set of output data) ?
What are the minimal adequate experimental measurements necessary to obtain a confident model ?
What necessary measurements, function of the final use of the numerical model ?
What modelisation points to first improve (connectionrepresentations, boundary conditions, sub-structure models)?


![Benchmark marketing [abstract]](https://static.fdocuments.fr/doc/165x107/549fa99bac79597d328b459c/benchmark-marketing-abstract.jpg)