RÉPONSE DE L’EXPERT PAUL CHERNICK
14
Le 19 mars 2015 N o de dossier: R-3867-2013 Réponses de Paul Chernick à la DDR n o 1 de la Régie au ROEÉ 1 R-3867-2013 - DOSSIER GÉNÉRIQUE PORTANT SUR L’ALLOCATION DES COÛTS ET LA STRUCTURE TARIFAIRE DE GAZ MÉTRO RÉPONSE DE L’EXPERT PAUL CHERNICK À LA DEMANDE DE RENSEIGNEMENTS N o 1 DE LA RÉGIE DE L’ÉNERGIE __________________________________________________________________________ Veuillez noter que dans une volonté d’économiser temps et argents, l’équipe du ROEÉ s’est permis de traduire du français à l’anglais les DDR provenant du document A-0027. Bien que nous considérions que notre traduction est fidèle, nous avons intégré dans ce document les DDR originales et les DDR traduites afin que la Régie soit à même de s’assurer que les réponses de monsieur Chernick conviennent à l’esprit des demandes de la Régie. __________________________________________________________________________ 1. Référence : (i) C-ACIG-0028, p. 7 et 8. Préambule : « The zero-intercept method is one of the generally accepted methods for mains classification and is used by various utilities and regulators. However, from a strict theoretical standpoint, the zero-intercept method is at best a rough approximation to cost causation. The zero-intercept method relies on the assumption that the customer-related portion of mains cost is equivalent to the cost of a replacing the existing distribution system with a theoretical system based on pipe with zero load-carrying capability. However, this approach is not theoretically perfect. As I demonstrate algebraically in Exhibit IEc-3, the customer component as defined in zero-intercept method implicitly includes a demand- related component, and the demand component of costs implicitly includes a customer-related component. While these effects tend to directionally offset, there is no guarantee that the zero-intercept method produces an unbiased classification factor. » Demande : 1.1 Veuillez commenter la position de l’expert de l’ACIG quant au fait que la méthode de l’intercepte zéro pourrait inclure une portion capacité (« demande related ») dans la composante accès.
Transcript of RÉPONSE DE L’EXPERT PAUL CHERNICK
Le 19 mars 2015
No de dossier: R-3867-2013
Réponses de Paul Chernick à la DDR no 1 de la Régie au ROEÉ
1
R-3867-2013 - DOSSIER GÉNÉRIQUE PORTANT SUR L’ALLOCATION DES COÛTS
ET LA STRUCTURE TARIFAIRE DE GAZ MÉTRO
RÉPONSE DE L’EXPERT PAUL CHERNICK
À LA DEMANDE DE RENSEIGNEMENTS No1 DE LA RÉGIE DE L’ÉNERGIE
__________________________________________________________________________
Veuillez noter que dans une volonté d’économiser temps et argents, l’équipe du ROEÉ s’est
permis de traduire du français à l’anglais les DDR provenant du document A-0027. Bien que
nous considérions que notre traduction est fidèle, nous avons intégré dans ce document les
DDR originales et les DDR traduites afin que la Régie soit à même de s’assurer que les
réponses de monsieur Chernick conviennent à l’esprit des demandes de la Régie.
__________________________________________________________________________
1. Référence : (i) C-ACIG-0028, p. 7 et 8.
Préambule :
« The zero-intercept method is one of the generally accepted methods for mains classification and is
used by various utilities and regulators. However, from a strict theoretical standpoint, the zero-intercept
method is at best a rough approximation to cost causation. The zero-intercept method relies on the
assumption that the customer-related portion of mains cost is equivalent to the cost of a replacing the
existing distribution system with a theoretical system based on pipe with zero load-carrying capability.
However, this approach is not theoretically perfect. As I demonstrate algebraically in Exhibit IEc-3,
the customer component as defined in zero-intercept method implicitly includes a demand- related
component, and the demand component of costs implicitly includes a customer-related component. While
these effects tend to directionally offset, there is no guarantee that the zero-intercept method produces an
unbiased classification factor. »
Demande :
1.1 Veuillez commenter la position de l’expert de l’ACIG quant au fait que la méthode
de l’intercepte zéro pourrait inclure une portion capacité (« demande related ») dans la
composante accès.
Le 19 mars 2015
No de dossier: R-3867-2013
Réponses de Paul Chernick à la DDR no 1 de la Régie au ROEÉ
2
1.1 Please comment on the position of the expert from IGUA that the method of zero
intercept could include a capacity portion (“demand related”) in the access
component.
A: The zero-intercept methodology lacks any relevance or connection to the core issue
of cost causation, since it makes a number of counter-factual and illogical
assumptions. If zero gas is to be delivered to customers, no distribution system is
necessary. If a very tiny amount of gas is to be delivered to customers, the delivery
system would be similar to what it is now for gas-fired outdoor cooking: customers
would purchase small tanks of propane at retail outlets. No zero-capacity main
would be built for a system of zero-demand customers.
2. Référence : (i) C-ACIG-0028, p. 16.
Préambule :
« IS THE COMPANY’S PROPOSAL TO REPLACE THE IPC WITH THE HANDY
WHITMAN (“H-W”) INDEXES FOR COSTDEFLATING REASONABLE?
It is common practice for utilities in the U.S to use the H-W indices for deflating costs.
However, it is not clear that the indexes proposed by Gaz Métro are reasonable. By
definition, these indexes do not apply to Québec costs denominated in Canadian dollars, as
they were developed for the northeastern U.S. and are denominated in U.S. dollars.
Second, the H-W indexes appear to overstate cost inflation, particularly for Gaz Métro’s
steel mains. To evaluate this, I compiled the cost information presented in Exhibit B-0033
and totaled mains costs and footage by type of main, diameter of main, and by year. I
then adjusted the yearly average cost per meter of main by main type for each year using
the H-W index proposed by the Company. (I also eliminated observations where less
than 1,000 meters of a particular type and size main were constructed in a particular
year, to reduce the impact of relatively small cost items.) I then reviewed the annual unit
costs for each diameter and type of pipe for any observable trends. For both plastic and
steel pipe, the inflation-adjusted mains costs generally decline over time, although the effect
is much more pronounced for steel pipe. While there is considerable scatter in the results,
the inflation-adjusted cost of steel pipe exhibits a noticeable and statistically significant
Le 19 mars 2015
No de dossier: R-3867-2013
Réponses de Paul Chernick à la DDR no 1 de la Régie au ROEÉ
3
downward trend for the major pipe diameter categories. A sample of the results is shown in
Figure IEc-1 below, for the three major steel pipe diameter categories. »
Demandes :
2.1 Veuillez commenter sur le choix de l’indice H-W et sur l’impact de ce choix sur
les composantes accès et capacité.
2.1 Please comment on the choice of the HW index and its impact on the access and
capacity components.
A: The Handy-Whitman indices are usually used to normalize capital costs over time
for cost-allocation, rate-design, and related analyses. Handy-Whitman indices are
appropriate for the purposes for which Gaz Métro applied them.
It is unfortunate that no similar index is published for Canada. However, since a
large portion of the cost of mains is locally sourced (engineering, labour, equipment
rental, permitting, overheads), especially for small mains, the changes in US-Canada
exchange rates probably have relatively small effects on the relative costs of
installing mains in the northeast US and Québec.
2.2 Veuillez développer sur l’impact qu’a le choix de cet indice sur les conduites d’acier et
sur les conduites de plastique.
2.2 Please describe the impact of this index on steel pipe costs and plastic piping costs.
A: The Handy-Whitman index for steel mains shows higher escalation than the Handy-
Whitman index for plastic mains.
3. Références: (i) C-ROEÉ-0039, p.17;
(ii) C-ROEÉ-0039, p.19;
(iii) C-ROEÉ-0039, p.18;
(iv) C-ROEÉ-0039, p.20;
(v) C-ROEÉ-0039, p.18 et 20;
Le 19 mars 2015
No de dossier: R-3867-2013
Réponses de Paul Chernick à la DDR no 1 de la Régie au ROEÉ
4
Préambule :
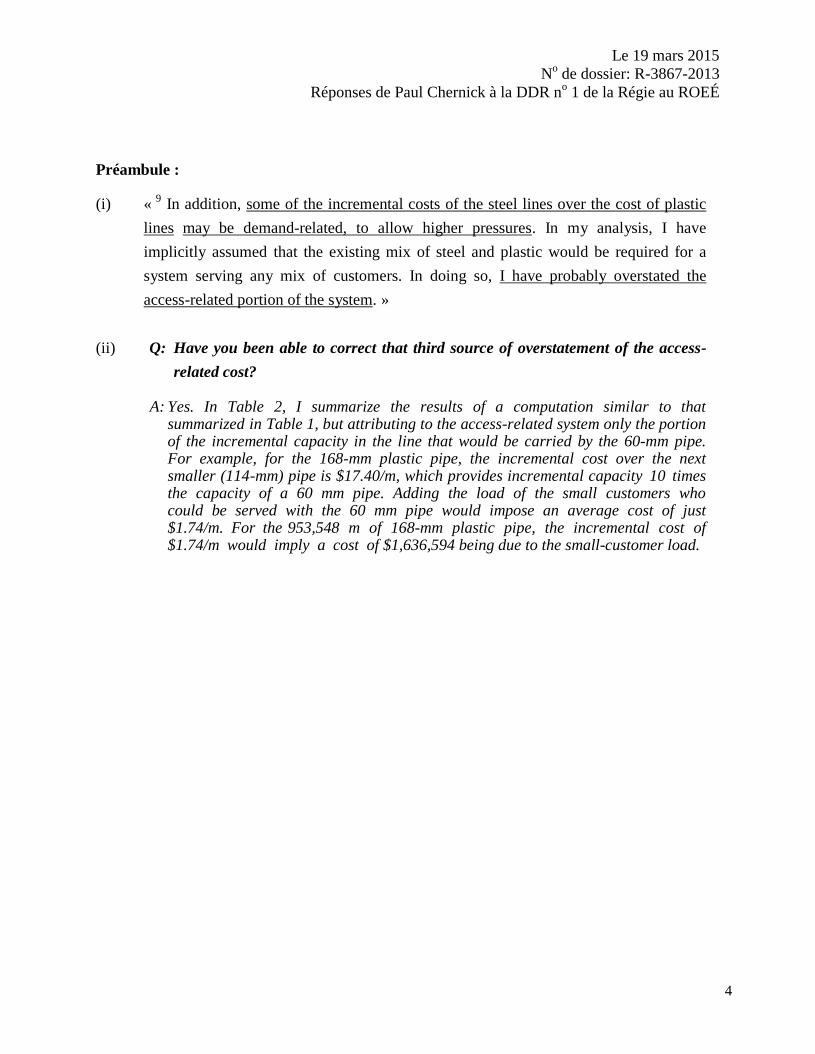
(i) « 9
In addition, some of the incremental costs of the steel lines over the cost of plastic
lines may be demand-related, to allow higher pressures. In my analysis, I have
implicitly assumed that the existing mix of steel and plastic would be required for a
system serving any mix of customers. In doing so, I have probably overstated the
access-related portion of the system. »
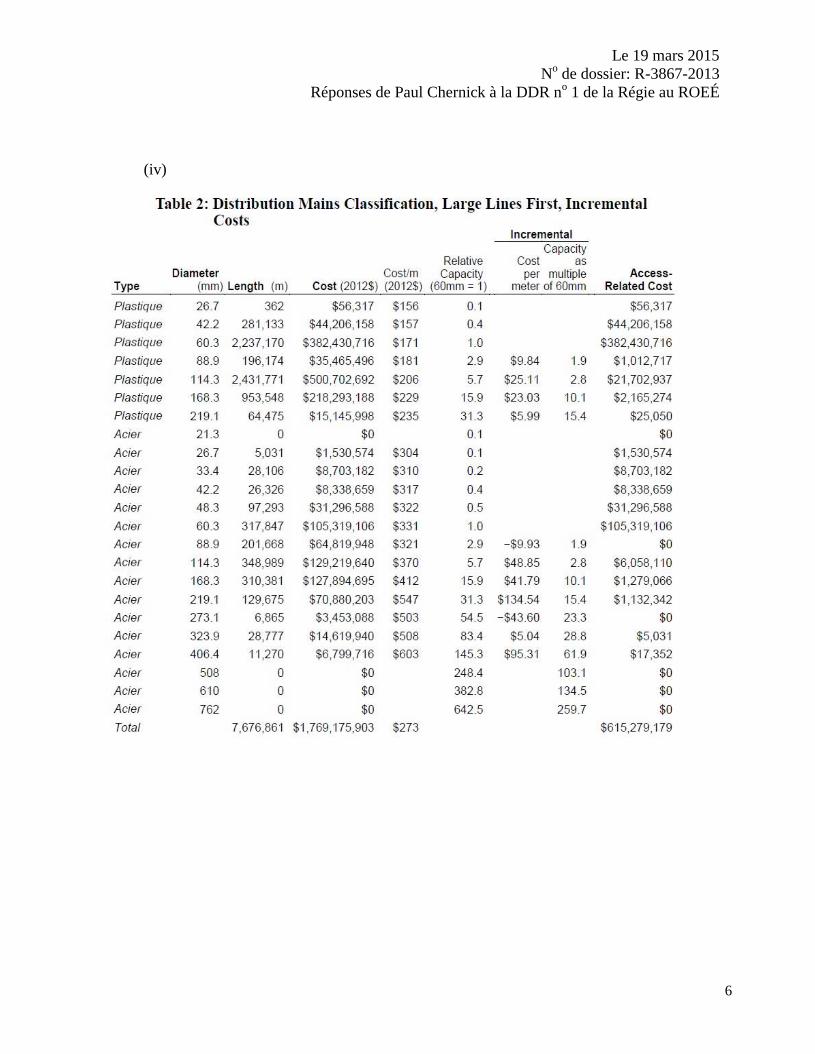
(ii) Q: Have you been able to correct that third source of overstatement of the access-
related cost? A: Yes. In Table 2, I summarize the results of a computation similar to that
summarized in Table 1, but attributing to the access-related system only the portion of the incremental capacity in the line that would be carried by the 60-mm pipe. For example, for the 168-mm plastic pipe, the incremental cost over the next smaller (114-mm) pipe is $17.40/m, which provides incremental capacity 10 times the capacity of a 60 mm pipe. Adding the load of the small customers who could be served with the 60 mm pipe would impose an average cost of just $1.74/m. For the 953,548 m of 168-mm plastic pipe, the incremental cost of $1.74/m would imply a cost of $1,636,594 being due to the small-customer load.
Le 19 mars 2015
No de dossier: R-3867-2013
Réponses de Paul Chernick à la DDR no 1 de la Régie au ROEÉ
5
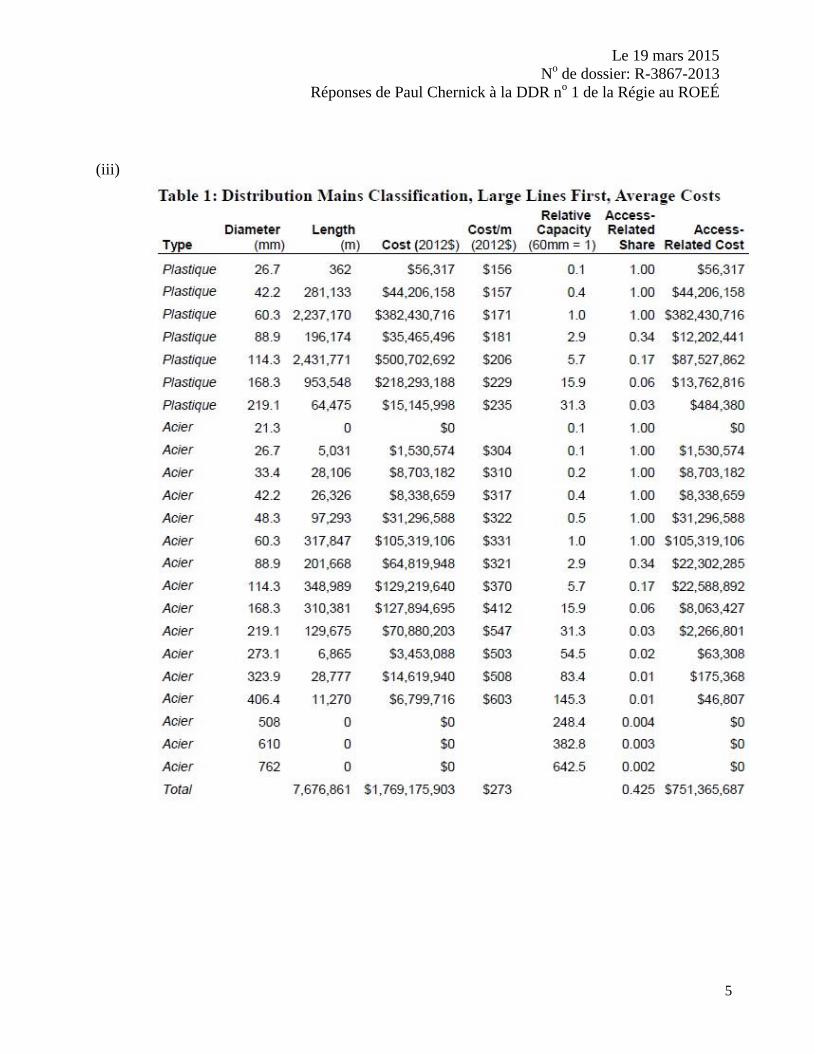
(iii)
Le 19 mars 2015
No de dossier: R-3867-2013
Réponses de Paul Chernick à la DDR no 1 de la Régie au ROEÉ
6
(iv)
Le 19 mars 2015
No de dossier: R-3867-2013
Réponses de Paul Chernick à la DDR no 1 de la Régie au ROEÉ
7
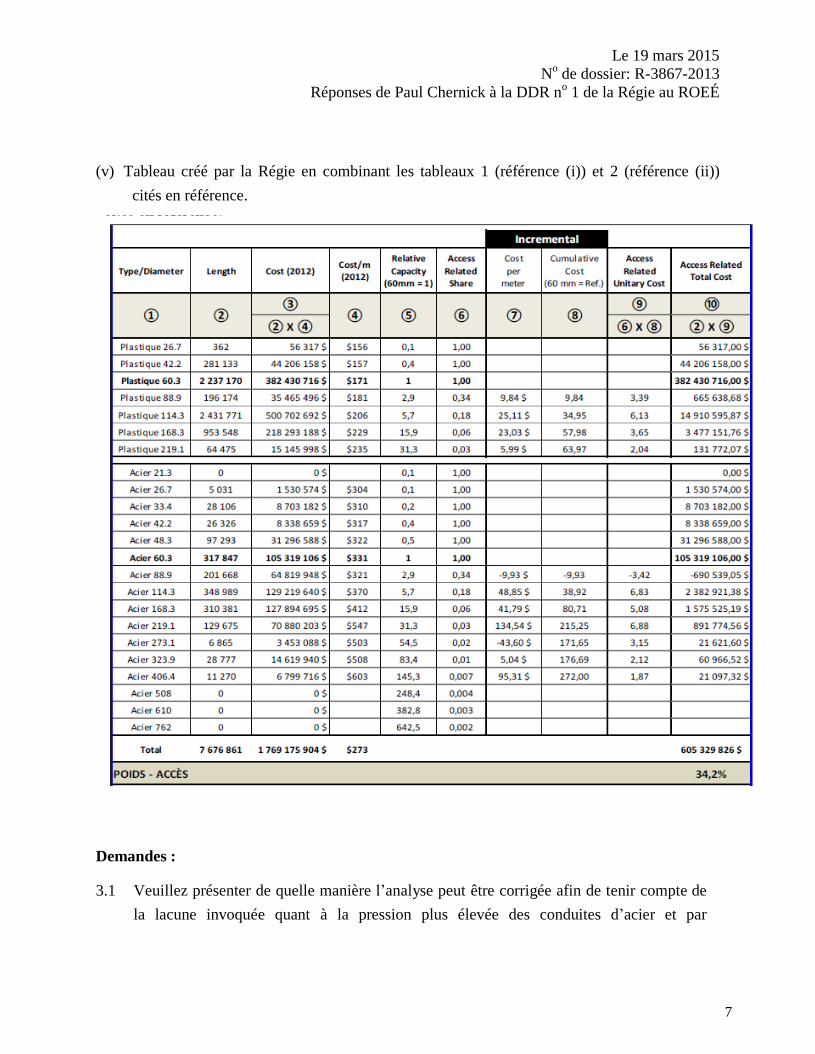
(v) Tableau créé par la Régie en combinant les tableaux 1 (référence (i)) et 2 (référence (ii))
cités en référence.
Demandes :
3.1 Veuillez présenter de quelle manière l’analyse peut être corrigée afin de tenir compte de
la lacune invoquée quant à la pression plus élevée des conduites d’acier et par
Le 19 mars 2015
No de dossier: R-3867-2013
Réponses de Paul Chernick à la DDR no 1 de la Régie au ROEÉ
8
conséquent de leur capacité supérieure lorsque comparée aux conduites de plastique de
même diamètre (référence (i)).
3.1 Please show how the analysis can be corrected to take account of the overstatement
of the access-related cost of the higher pressure of the steel lines and therefore their
higher capacity when compared to the same diameter of plastic pipe (reference (i)).
A: In Tables 1 and 3 of my written expert testimony (C-ROEÉ-040), I multiplied the
fraction of the cost of each type of main (by size and material) by the ratio of a 60
mm main’s capacity to the capacity of the specific type of main, to estimate the
access-related cost. For the percentage of mains that are steel only because of the
pressure at which they must operate (and hence the load level), the access-related
cost could be further decreased by the ratio of the cost of plastic mains to steel
mains, for that size category. For example, in Table 3, the cost of the 45% of 114
mm mains that are supply mains (operated at more than 1,000 kPa, from Document
B-0034) could be reduced by about 44% (the plastic 114 mm mains cost $206/m,
while steel cost $370/m), for a multiplier of 0.45 × 0.56 = 0.2, or about 20%. In
addition, it is not clear whether some of the steel pipe operated at distribution
pressures is required to be steel due to pressure considerations.
In Tables 2 and 4, I computed the incremental cost of steel pipes starting with the
costs of the 60 mm steel pipe, rather than the less-expensive plastic pipe. Some
small adjustments may be appropriate for this method as well, such as for the 2% of
60 mm steel pipes that are operated at supply pressure.
This problem is much more serious in Mr. Knecht’s proposed approach, as a result
of Mr. Knecht’s proposal to reject Gaz Métro’s use of the Handy-Whitman index.
Mr. Knecht’s position appears to be based entirely on the “sample” of cost data that
he displays in his Figure IEc-1 (Document C-ACIG-0028, at 16–17), and
specifically the indication in Figure Iec-1 that inflating the pre-1987 mains at the
Handy-Whitman index results in higher prices in 2012 dollars for those mains than
for the post-1987 mains. (Even in Mr. Knecht’s figure, the costs in 2012$ appear to
be stable after about 1987.)
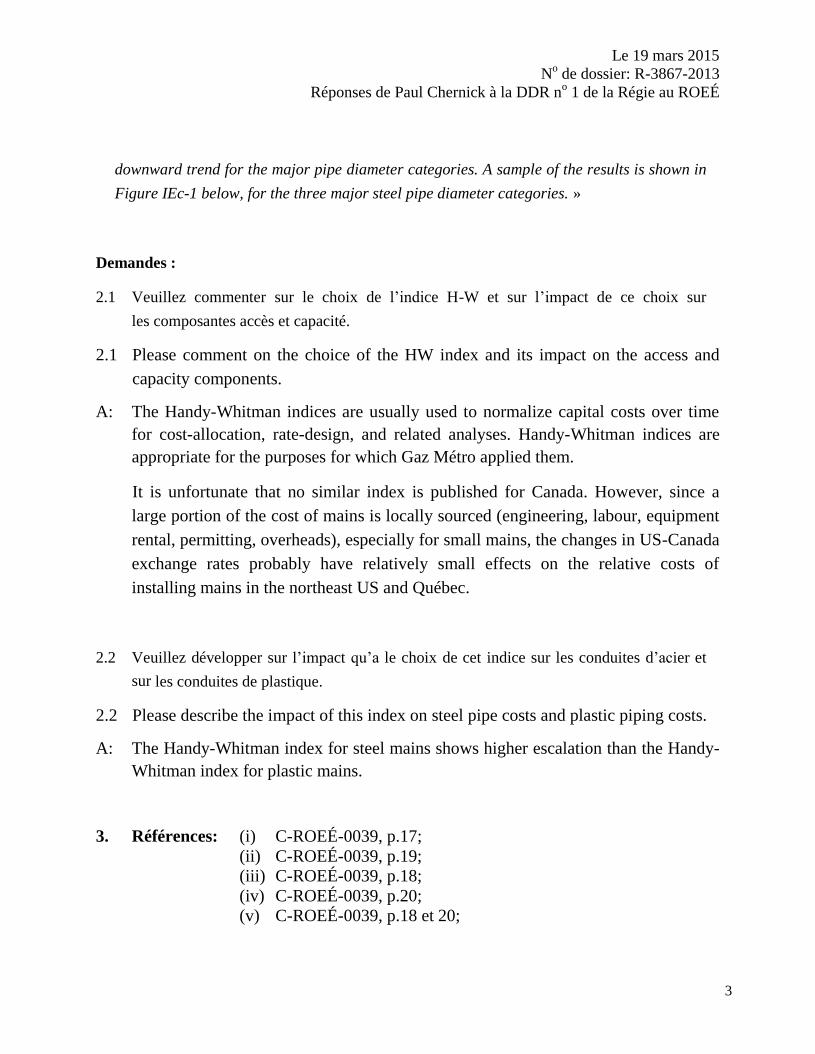
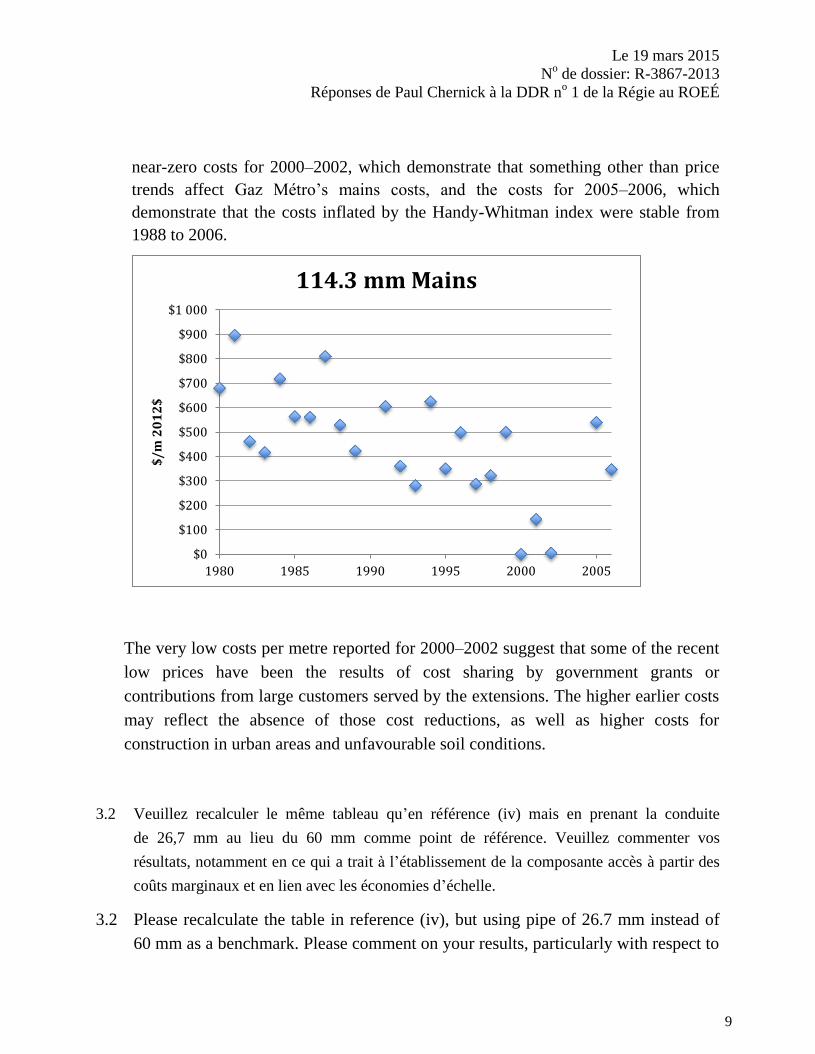
The figure below shows the full set of data for the 114.3 mm mains, which Mr.
Knecht labels as 168.3 mm (the 168.3 mm mains are labeled as 219.1 mm in Figure
IEc-1). By ignoring data after 1999, and costs under $200/m, Mr. Knecht hides the
Le 19 mars 2015
No de dossier: R-3867-2013
Réponses de Paul Chernick à la DDR no 1 de la Régie au ROEÉ
9
near-zero costs for 2000–2002, which demonstrate that something other than price
trends affect Gaz Métro’s mains costs, and the costs for 2005–2006, which
demonstrate that the costs inflated by the Handy-Whitman index were stable from
1988 to 2006.
The very low costs per metre reported for 2000–2002 suggest that some of the recent
low prices have been the results of cost sharing by government grants or
contributions from large customers served by the extensions. The higher earlier costs
may reflect the absence of those cost reductions, as well as higher costs for
construction in urban areas and unfavourable soil conditions.
3.2 Veuillez recalculer le même tableau qu’en référence (iv) mais en prenant la conduite
de 26,7 mm au lieu du 60 mm comme point de référence. Veuillez commenter vos
résultats, notamment en ce qui a trait à l’établissement de la composante accès à partir des
coûts marginaux et en lien avec les économies d’échelle.
3.2 Please recalculate the table in reference (iv), but using pipe of 26.7 mm instead of
60 mm as a benchmark. Please comment on your results, particularly with respect to
$0
$100
$200
$300
$400
$500
$600
$700
$800
$900
$1 000
1980 1985 1990 1995 2000 2005
$/m
20
12
$
114.3 mm Mains
Le 19 mars 2015
No de dossier: R-3867-2013
Réponses de Paul Chernick à la DDR no 1 de la Régie au ROEÉ
10
the establishment of the access component on the basis of the marginal costs and as
regards economies of scale.
A: I cannot endorse the use of 26.7 mm in Tables 1–4 of my written expert evidence (
C-ROEÉ-040), because I do not have enough information regarding whether the
capacity of the 26.7 mm mains would be sufficient to serve the load for smaller
customers.
3.3 Veuillez confirmer si le coût supplémentaire de 17,40 $/m (passage de 114,3 mm à 168,3
mm) cité en référence (ii) ne devrait pas plutôt s’élever à 23,03 $/m présenté en référence
(iv). Suivant le même raisonnement, veuillez confirmer si le 1,74 $/m ne devrait pas plutôt
s’élever à 2,30 $/m et le coût total devrait être 2 165 274 $ au lieu de 1 636 594 $.
3.3 Please confirm whether the additional cost of $17.40/m (from 114.3 mm to 168.3
mm) referenced in (ii) should not rather be $23.03/m as presented in reference (iv).
Following the same reasoning, please confirm whether the $1.74/m should not rather
be $2.30/m and the total cost $2,165,274 instead of $1,636,594.
A: Confirmed.
3.4 Veuillez expliquer la colonne « Capacity as multiple of 60 mm ». Veuillez indiquer si
les valeurs qui se retrouvent dans cette colonne ne représentent pas un multiple du
diamètre X par rapport au diamètre 60 mm, mais plutôt un multiple du diamètre X par
rapport au diamètre inférieur. Dans l’affirmative, veuillez expliquer pourquoi ce multiple
n’est pas calculé par rapport au 60 mm.
3.4 Please explain the “Capacity as multiple of 60 mm” column. Please indicate whether
the values to be found in this column represent not a multiple of the diameter X in
relation to the diameter of 60 mm, but rather a multiple of the diameter X compared
to the smaller diameter. If so, please explain why this multiple is not calculated in
relation to 60 mm.

Le 19 mars 2015
No de dossier: R-3867-2013
Réponses de Paul Chernick à la DDR no 1 de la Régie au ROEÉ
11
A: No, the ratio of a main’s capacity to the capacity of a 60 mm main is not the ratio of
the diameters. The capacity of a main varies in proportion to the formula on page 17
of my evidence, which is roughly proportional to the diameter raised to the 2.5
power.
3.5 Veuillez répondre à la sous-question précédente mais en prenant la colonne « Cost
per meter ».
3.5 Please answer the previous sub-question but taking the “Cost per meter” column.
A: The cost per meter column does not reflect the capacity of the various size pipes.
3.6 La Régie a élaboré le tableau en référence (v), en utilisant les concepts présentés
aux Tableaux 1 et 2 (références (iii) et (iv)). Veuillez commenter la méthode employée
par la Régie lorsqu’elle combine l’« Access-Related Share » du tableau 1 (colonne 6)
avec le « Cost per meter » du tableau 2 (colonne 7). Veuillez commenter les résultats de
la colonne 10 (Il est à noter que ces calculs ont été effectués en prenant comme référence
le 60 mm).
3.6 The Board has developed table in reference (v), using the concepts presented in
Tables 1 and 2 (references (iii) and (iv)). Please comment on the methodology used
by the Board when it combined the “Access-Related Share” in Table 1 (column 6)
with the “Cost per meter” in Table 2 (column 7). Please comment on the results of
column 10 (Note that these calculations were made taking as reference the 60 mm
pipe).
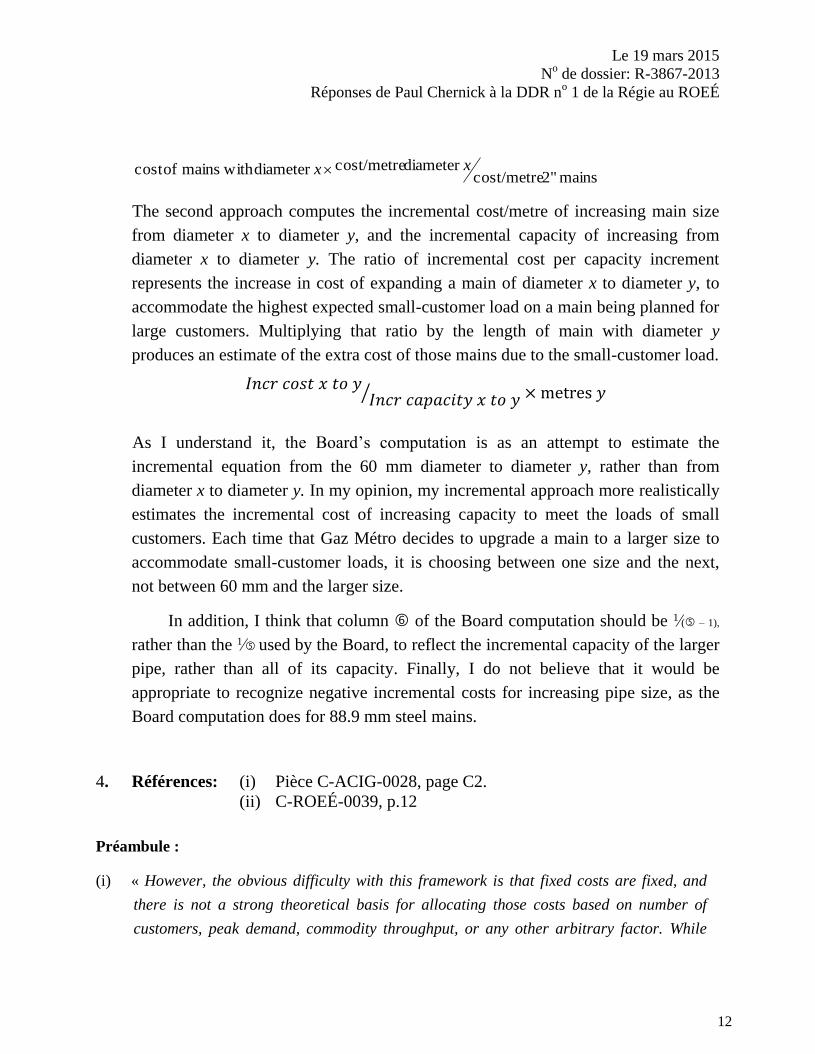
A: The Board’s methodology combines two methodologies presented in my written
expert evidence. The first treats as access-related the ratio of the capacity of mains
with diameter x to the capacity of 2” mains, and multiplies the cost of those the
mains with diameter x by that ratio. Thus, the estimated access-related cost is
Le 19 mars 2015
No de dossier: R-3867-2013
Réponses de Paul Chernick à la DDR no 1 de la Régie au ROEÉ
12
mains 2" cost/metrediameter cost/metrediameter withmains ofcost xx
The second approach computes the incremental cost/metre of increasing main size
from diameter x to diameter y, and the incremental capacity of increasing from
diameter x to diameter y. The ratio of incremental cost per capacity increment
represents the increase in cost of expanding a main of diameter x to diameter y, to
accommodate the highest expected small-customer load on a main being planned for
large customers. Multiplying that ratio by the length of main with diameter y
produces an estimate of the extra cost of those mains due to the small-customer load.
⁄
As I understand it, the Board’s computation is as an attempt to estimate the
incremental equation from the 60 mm diameter to diameter y, rather than from
diameter x to diameter y. In my opinion, my incremental approach more realistically
estimates the incremental cost of increasing capacity to meet the loads of small
customers. Each time that Gaz Métro decides to upgrade a main to a larger size to
accommodate small-customer loads, it is choosing between one size and the next,
not between 60 mm and the larger size.
In addition, I think that column of the Board computation should be 1⁄( – 1),
rather than the 1⁄ used by the Board, to reflect the incremental capacity of the larger
pipe, rather than all of its capacity. Finally, I do not believe that it would be
appropriate to recognize negative incremental costs for increasing pipe size, as the
Board computation does for 88.9 mm steel mains.
4. Références: (i) Pièce C-ACIG-0028, page C2.
(ii) C-ROEÉ-0039, p.12
Préambule :
(i) « However, the obvious difficulty with this framework is that fixed costs are fixed, and
there is not a strong theoretical basis for allocating those costs based on number of
customers, peak demand, commodity throughput, or any other arbitrary factor. While
Le 19 mars 2015
No de dossier: R-3867-2013
Réponses de Paul Chernick à la DDR no 1 de la Régie au ROEÉ
13
there may be rate design advantages to recovering fixed costs with a customer charge,
there is no cost causation reason for allocating truly fixed costs based on number of
customers. This basic argument is often advanced by cost allocation practitioners who
oppose zero-intercept or minimum system methods. »
(ii) « Q: What alternative approaches exist for classifying the costs of the area
spanning system?
A: There are at least two approaches. One approach, which is used in many jurisdictions, is
to treat all the area-spanning costs as demand-related to reflect the reality that the
system is built out primarily to serve load, not customer number. »
Demandes :
4.1 Veuillez donner votre opinion sur le texte de la référence (i).
4.1 Please provide your opinion on the text of reference (i).
A: Reference (i) makes well the point that the assumption that fixed costs are driven by
customers is insupportable. Unfortunately, Mr. Knecht’s Exhibit IEc-3 goes on to
make a similar unjustified assumption that the length of mains is driven by customer
number.
14
4.2 Veuillez indiquer si l’approche que vous évoquez à la référence (ii), constitue une
solution pour tenir compte des éléments soulevés à la référence (i).
4.2 Please indicate whether the approach you mention in reference (ii), provides a
solution to address the issues raised in the reference (i).
A: Yes. Expansion of the mains network is driven primarily by the value of gas service
to customers, which depends on annual throughput. Allocating mains on usage
(some combination of peak demand and throughput) eliminates the need to justify
the fundamentally inappropriate classification of mains as customer-related and
better reflects cost causation.
4.3 Veuillez indiquer les motifs invoqués par les organismes réglementaires qui ont
retenu l’approche de la référence (ii). Veuillez donner des références précises.
4.3 Please indicate the reasons given by the regulatory agencies that have adopted the
approach of the reference (ii). Please give precise references.
A: I have not reviewed the orders in which various regulators have adopted a demand
or demand/energy allocation of the distribution system. Some of those orders would
be decades old. This work could be done, but would involve time and fees that go
beyond the budget so far available to the ROEÉ and UC in this hearing. If the Régie
indicates that the fees will be covered through the cost award, I can certainly
undertake this work.