Prospects for star formation studies with infrared ...
10
Prospects for star formation studies with infrared instruments (TIRCAM2 and TANSPEC) on the 3.6-m Devasthal Optical Telescope Devendra Ojha 1* , Swarna Kanti Ghosh 1 , Saurabh Sharma 2 , Anil Pandey 2 , Tapas Baug 1,2 , Joe Philip Ninan 3 , Brijesh Kumar 2 , Manoj Puravankara 1 , Savio D’Costa 1 , Milind Naik 1 , Satheesha Poojary 1 , Shailesh Bhagat 1 , Rajesh Jadhav 1 , Ganesh Meshram 1 , Pradeep Sandimani 1 , Sanjay Gharat 1 , Chandrakant Bakalkar 1 1 Tata Institute of Fundamental Research, Homi Bhabha Road, Colaba, Mumbai 400 005, India 2 Aryabhatta Research Institute of Observational Sciences, Manora Peak, Nainital 263 001, India 3 Department of Astronomy and Astrophysics, The Pennsylvania State University, University Park, PA, USA Abstract: We present a brief description of the activities of the infrared astronomy group of Tata Institute of Fundamental Research with special emphasis on the ground-based near infrared instrumentation for star for- mation studies. We describe the unique capability of TIRCAM2 for observations in the polycyclic aromatic hydrocarbon (λ cen ∼ 3.3 μm) and narrow-band L (λ cen ∼ 3.59 μm) bands, currently being used by the astron- omy community, and of the upcoming TANSPEC, which is being built for India’s largest telescope, i.e. the 3.6-m Devasthal Optical Telescope (DOT). The TIRCAM2 on the 3.6-m DOT was successfully commissioned in June 2016, and the subsequent characterization and astronomical observations are presented here. Based on the successful engineering runs on the 3.6-m DOT, TIRCAM2 has been made available to the Indian and Bel- gian astronomical community for science observations since Early Science Cycle 2017A (May 2017) onwards. The fabrication of TANSPEC is in an advanced stage and the spectrometer is expected to be commissioned by the end of January 2018. 1 Introduction The central research theme of the infrared astronomy (IRA) group at Tata Institute of Fundamental Research (TIFR) is the study of the interstellar medium (ISM) in relation to star formation in our Galaxy and nearby galaxies. The study of the ISM provides a powerful probe into the physical and chemical properties of the interstellar dust and gas, which predominantly emits in the infrared waveband. Infrared emitting ISM is a tracer of several important astrophysical phenomena, namely, * [email protected] ”First Belgo-Indian Network for Astronomy & Astrophysics (BINA) workshop”, held in Nainital (India), 15-18 November 2016 Bulletin de la Société Royale des Sciences de Liège, Vol. 87, Actes de colloques, 2018, p. 58 - 67
Transcript of Prospects for star formation studies with infrared ...

Prospects for star formation studies with infraredinstruments (TIRCAM2 and TANSPEC) on the 3.6-m
Devasthal Optical Telescope
Devendra Ojha1∗, Swarna Kanti Ghosh1, Saurabh Sharma2, Anil Pandey2,Tapas Baug1,2, Joe Philip Ninan3, Brijesh Kumar2, Manoj Puravankara1,
Savio D’Costa1, Milind Naik1, Satheesha Poojary1, Shailesh Bhagat1,Rajesh Jadhav1, Ganesh Meshram1, Pradeep Sandimani1,
Sanjay Gharat1, Chandrakant Bakalkar1
1 Tata Institute of Fundamental Research, Homi Bhabha Road, Colaba, Mumbai 400 005, India2 Aryabhatta Research Institute of Observational Sciences, Manora Peak, Nainital 263 001, India
3 Department of Astronomy and Astrophysics, The Pennsylvania State University,University Park, PA, USA
Abstract: We present a brief description of the activities of the infrared astronomy group of Tata Institute ofFundamental Research with special emphasis on the ground-based near infrared instrumentation for star for-mation studies. We describe the unique capability of TIRCAM2 for observations in the polycyclic aromatichydrocarbon (λcen ∼ 3.3 µm) and narrow-band L (λcen ∼ 3.59 µm) bands, currently being used by the astron-omy community, and of the upcoming TANSPEC, which is being built for India’s largest telescope, i.e. the3.6-m Devasthal Optical Telescope (DOT). The TIRCAM2 on the 3.6-m DOT was successfully commissionedin June 2016, and the subsequent characterization and astronomical observations are presented here. Based onthe successful engineering runs on the 3.6-m DOT, TIRCAM2 has been made available to the Indian and Bel-gian astronomical community for science observations since Early Science Cycle 2017A (May 2017) onwards.The fabrication of TANSPEC is in an advanced stage and the spectrometer is expected to be commissioned bythe end of January 2018.
1 IntroductionThe central research theme of the infrared astronomy (IRA) group at Tata Institute of FundamentalResearch (TIFR) is the study of the interstellar medium (ISM) in relation to star formation in ourGalaxy and nearby galaxies. The study of the ISM provides a powerful probe into the physicaland chemical properties of the interstellar dust and gas, which predominantly emits in the infraredwaveband. Infrared emitting ISM is a tracer of several important astrophysical phenomena, namely,
”First Belgo-Indian Network for Astronomy & Astrophysics (BINA) workshop”, held in Nainital (India), 15-18 November 2016
Bulletin de la Société Royale des Sciences de Liège, Vol. 87, Actes de colloques, 2018, p. 58 - 67

star formation activity, shock front, material recycling, photo processes in the proximity of youngstars, and plasma cooling. The corresponding research activities are currently executed using TIFR’sown ground-based near-infrared (NIR) imagers & spectrometers, TIFR’s indigenously developed 100-cm balloon borne far-infrared (FIR) telescope, national optical imagers & spectrometers, the GiantMetrewave Radio Telescope as well as international facilities such as the large aperture ground-basedtelescopes and astronomical satellites. The observations are complemented with interpretation backedby image processing as well as numerical modelling (e.g. radiative transfer) schemes based on codesdeveloped in-house as well as those available publicly. In addition to the above activities, the groupactively participates in instrument development for ground-based and space-based astronomy.
With the above aim, the IRA group designed and built the TIFR Near Infrared Spectrometer andImager (TIRSPEC) in collaboration with M/s Mauna Kea Infrared, LLC, Hawaii (hereafter MKIR)during the 2007-2012 five-year period, now in operation on the side port of the 2-m Himalayan Chan-dra Telescope (HCT; Hanle, Ladakh, India) at an altitude of 4 550 meters above mean sea level. TheTIRSPEC uses a Teledyne 1024×1024 pixel Hawaii-1 PACE array detector with a cutoff wavelengthat 2.5 µm and provides a field of view (FoV) of 307′′×307′′, with a plate scale of 0.3′′/pixel. TheTIRSPEC was installed at the 2-m HCT during June 2013 for the engineering and scientific runs onthe telescope. The first light took place on 21 June 2013. The characterization of the TIRSPEC wasdone over the next few months. Some engineering runs and science observations of several astronom-ical sources were also carried out during July and August 2013. The TIRSPEC provides for variousmodes of operation which include photometry with broad and narrow band filters, spectrometry insingle order mode with long slits of 300′′ length, and widths ranging from 1 to 7.92′′, with ordersorter filters in the Y , J , H & K bands, and a grism as the dispersing element as well as a crossdispersed (XD) mode with slit lengths of 10′′ to give a coverage from 1.0 to 2.5 µm at the resolv-ing power R of 1200. The slit lengths were upgraded to 50′′ during 2014, and minor mechanicalmodifications in the filter movement mechanisms were made to improve the movement of the filterwheels. The placement of various slits was also optimised for efficient observations. The TIRSPECwas commissioned successfully and the subsequent characterization and astronomical observationswere completed. The TIRSPEC is available to the worldwide astronomical community for scienceobservations since May 2014. Subsequently, subarray readout capability has been incorporated intothe system to allow for photometry of brighter objects. Currently, about 50% of the observing pro-posals on HCT use TIRSPEC as the focal plane instrument (see details in Ojha et al. 2012a; Ninan etal. 2014).
Recently, the IRA group has also upgraded the TIFR Near Infrared Imaging Camera-II (TIR-CAM2) (Ojha et al. 2012b; Naik et al. 2012) which was being used with the 2-mr Inter-UniversityCentre for Astronomy and Astrophysics’s Girawali observatory telescope, near Pune. This instru-ment has been tested by the IRA group at the 3.6-m DOT and is being used by Indian and Belgianastronomers since May 2017 onwards. Besides this, TIFR has also been observing in the FIR band(120 to 220 µm) using the 100-cm balloon borne FIR telescope (Ghosh et al. 1988; Ghosh 2010). Re-cently, as a part of the TIFR-Japan collaboration in balloon-borne FIR astronomy, the TIFR 100-cmballoon-borne FIR telescope along with the Japanese Fabry-Perot Spectrometer, tuned to the astro-physically interesting [C II] fine structure line at 157.74 µm, has been successfully flown several timesto map large regions in [C II] line and continuum of several northern and southern star-forming com-plexes (Mookerjea et al. 2001, 2003; Kaneda et al. 2013). To complement these studies in the NIRband, the need was felt for a dedicated Optical-NIR spectrometer in the 0.5 to 2.5 µm range, whichcould be used with the 3.6-m DOT. To meet this need, the TIFR-ARIES Near Infrared Spectrometer(TANSPEC) (Ojha et al. 2012b) was conceived to provide spectroscopy in the range from 0.55 to2.54 µm, with a spectral resolving power of ∼2750 to be used on the axial port of the 3.6-m DOT.
In this paper, we describe the technical details of TIRCAM2 and TANSPEC. We also present the
59
Bulletin de la Société Royale des Sciences de Liège, Vol. 87, Actes de colloques, 2018, p. 58 - 67
characterization and performance results of TIRCAM2 obtained before releasing the instrument tothe users for scientific observations.
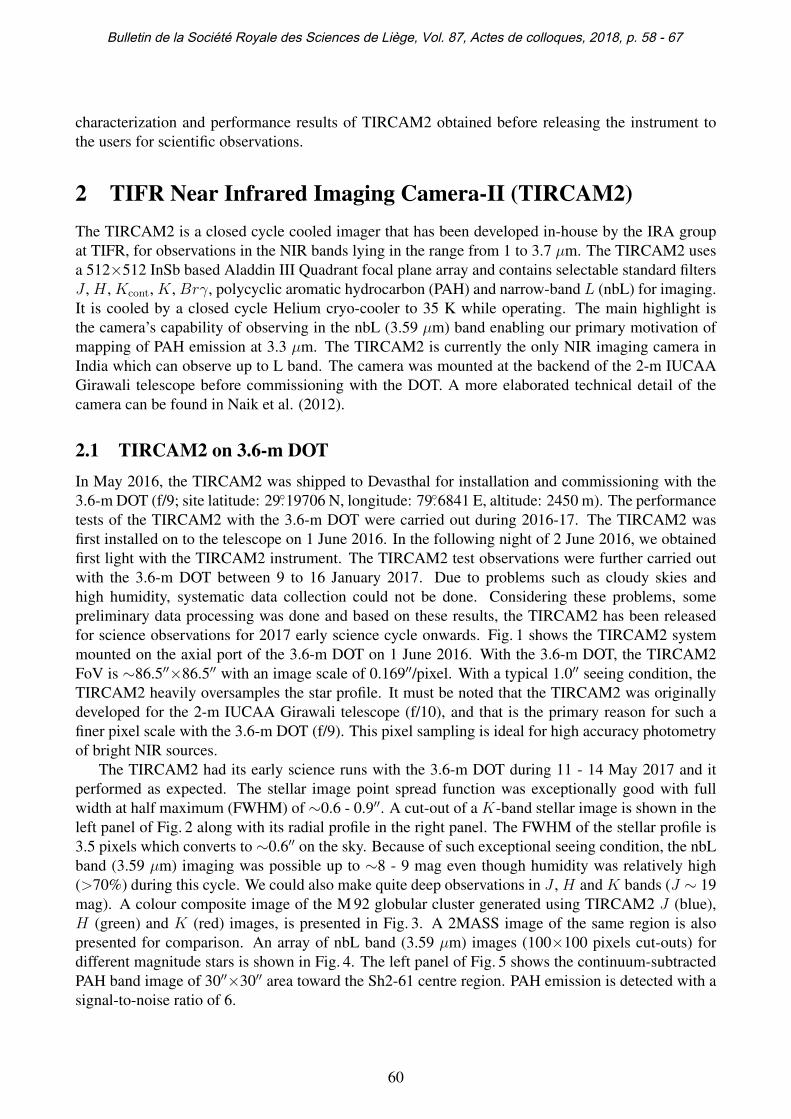
2 TIFR Near Infrared Imaging Camera-II (TIRCAM2)The TIRCAM2 is a closed cycle cooled imager that has been developed in-house by the IRA groupat TIFR, for observations in the NIR bands lying in the range from 1 to 3.7 µm. The TIRCAM2 usesa 512×512 InSb based Aladdin III Quadrant focal plane array and contains selectable standard filtersJ , H , Kcont, K, Brγ, polycyclic aromatic hydrocarbon (PAH) and narrow-band L (nbL) for imaging.It is cooled by a closed cycle Helium cryo-cooler to 35 K while operating. The main highlight isthe camera’s capability of observing in the nbL (3.59 µm) band enabling our primary motivation ofmapping of PAH emission at 3.3 µm. The TIRCAM2 is currently the only NIR imaging camera inIndia which can observe up to L band. The camera was mounted at the backend of the 2-m IUCAAGirawali telescope before commissioning with the DOT. A more elaborated technical detail of thecamera can be found in Naik et al. (2012).
2.1 TIRCAM2 on 3.6-m DOTIn May 2016, the TIRCAM2 was shipped to Devasthal for installation and commissioning with the3.6-m DOT (f/9; site latitude: 29.◦19706 N, longitude: 79.◦6841 E, altitude: 2450 m). The performancetests of the TIRCAM2 with the 3.6-m DOT were carried out during 2016-17. The TIRCAM2 wasfirst installed on to the telescope on 1 June 2016. In the following night of 2 June 2016, we obtainedfirst light with the TIRCAM2 instrument. The TIRCAM2 test observations were further carried outwith the 3.6-m DOT between 9 to 16 January 2017. Due to problems such as cloudy skies andhigh humidity, systematic data collection could not be done. Considering these problems, somepreliminary data processing was done and based on these results, the TIRCAM2 has been releasedfor science observations for 2017 early science cycle onwards. Fig. 1 shows the TIRCAM2 systemmounted on the axial port of the 3.6-m DOT on 1 June 2016. With the 3.6-m DOT, the TIRCAM2FoV is ∼86.5′′×86.5′′ with an image scale of 0.169′′/pixel. With a typical 1.0′′ seeing condition, theTIRCAM2 heavily oversamples the star profile. It must be noted that the TIRCAM2 was originallydeveloped for the 2-m IUCAA Girawali telescope (f/10), and that is the primary reason for such afiner pixel scale with the 3.6-m DOT (f/9). This pixel sampling is ideal for high accuracy photometryof bright NIR sources.
The TIRCAM2 had its early science runs with the 3.6-m DOT during 11 - 14 May 2017 and itperformed as expected. The stellar image point spread function was exceptionally good with fullwidth at half maximum (FWHM) of ∼0.6 - 0.9′′. A cut-out of a K-band stellar image is shown in theleft panel of Fig. 2 along with its radial profile in the right panel. The FWHM of the stellar profile is3.5 pixels which converts to ∼0.6′′ on the sky. Because of such exceptional seeing condition, the nbLband (3.59 µm) imaging was possible up to ∼8 - 9 mag even though humidity was relatively high(>70%) during this cycle. We could also make quite deep observations in J , H and K bands (J ∼ 19mag). A colour composite image of the M 92 globular cluster generated using TIRCAM2 J (blue),H (green) and K (red) images, is presented in Fig. 3. A 2MASS image of the same region is alsopresented for comparison. An array of nbL band (3.59 µm) images (100×100 pixels cut-outs) fordifferent magnitude stars is shown in Fig. 4. The left panel of Fig. 5 shows the continuum-subtractedPAH band image of 30′′×30′′ area toward the Sh2-61 centre region. PAH emission is detected with asignal-to-noise ratio of 6.
60
Bulletin de la Société Royale des Sciences de Liège, Vol. 87, Actes de colloques, 2018, p. 58 - 67

Figure 1: The TIRCAM2 system mounted on the axial port of the 3.6-m DOT on 1 June 2016.
61
Bulletin de la Société Royale des Sciences de Liège, Vol. 87, Actes de colloques, 2018, p. 58 - 67

Figure 2: Left: Cut-out of a stellar image observed with TIRCAM2 in the K-band on 22 May 2017towards the Serpens OB2 association. The typical seeing on this night was ∼0.′′6. The outer greencontour shows the stellar FWHM of the image. Right: The radial profile of the image shown in theleft panel.
17h17m05.0s06.0s07.0s08.0s09.0s10.0s
RA (J2000)
+43◦07′30.0′′
45.0′′
08′00.0′′
15.0′′
30.0′′
Dec
(J20
00)
17h17m05.0s06.0s07.0s08.0s09.0s10.0s
RA (J2000)
+43◦07′30.0′′
45.0′′
08′00.0′′
15.0′′
30.0′′D
ec(J
2000
)
Figure 3: RGB colour composite image (red: K, green: H , blue: J) of M 92, a Galactic globularcluster, generated using TIRCAM2 with the 3.6-m DOT (left), and 2MASS (right).
2.2 TIRCAM2 performanceWe estimate that with the 3.6-m DOT, we can carry out photometric observations up to 19 and 18mag (S/N ∼ 10) in the J and K band for 550 s and 1000 s exposures, respectively, and up to 8.2mag (detection limit) in the nbL band for 20 s net exposures under typical seeing conditions. It isalso interesting to compare the Spitzer-IRAC values of the saturation limit in the 3.6 µm band. Fora frame time of 2 s, the point source saturation limit in the IRAC 3.6-µm band is <7.92 mag. TheTIRCAM2 can therefore be used to observe sources having magnitudes brighter than the saturationlimit of Spitzer-IRAC. Table 1 lists the overview of the performance of TIRCAM2 on the 3.6-m DOT.
3 TIFR-ARIES Near Infrared Spectrometer (TANSPEC)During 2012, the TIFR and ARIES decided to jointly develop an Optical-NIR medium resolutionspectrograph, based on a 2048×2048 Hawaii-2RG (H2RG) focal plane array, to be used on the axialport of the 3.6-m DOT. MKIR was chosen to design and fabricate the spectrometer, and the designswere thoroughly reviewed by international experts during 2015. The work of fabrication of the TIFR-ARIES Near Infrared Spectrometer (TANSPEC) was taken up by MKIR in early 2016.
62
Bulletin de la Société Royale des Sciences de Liège, Vol. 87, Actes de colloques, 2018, p. 58 - 67

DL Boo: 3.1magS/N~250
20 CVn: 4.0magS/N~180
HD 114253: 5.0magS/N~102
BD+68 738: 6.0magS/N~40
TYC 3033-20-1: 7.0magS/N~7
HD 113763: 8.2magS/N~2
Figure 4: Mosaic of nbL band images (100×100 pixels cut-outs) observed during 13 -14 May 2017.Sources brighter than nbL ∼ 6 mag are aligned and combined and the remaining sources are co-addedblindly.
Figure 5: The left panel shows the continuum-subtracted PAH band image of the 30′′×30′′ area towardthe Sh 2-61 star-forming region. Contours are overlaid for clarity. The Spitzer 3.6-µm image for thesame area is also presented for comparison in the right panel.
3.1 TANSPEC optical layout and specificationsThe TANSPEC is being built in collaboration with MKIR for the 3.6-m DOT. The overall opticallayout of the instrument is shown in Fig. 6. With f/12 into the spectrograph, the Foreoptics which isan Offner relay, serves two major purposes. (1) Re-images the telescope’s f/9 beam focal plane imageas an f/12 beam on to the slit. (2) The secondary of the telescope is imaged to the secondary of Offner,hence, it works as a cold stop to block stray light from the sides. The center portion is also blackenedto mask the central portion of the secondary mirror of the telescope. Reflective slit mirrors split thebeam into the spectrograph through the slit gap and reflects the remaining light to the slit viewercamera. The spectrograph operates in two modes whereby the spectrum is focussed on to a 2k×2kH2RG array. In the XD mode, a combination of a grating and two prisms are used to pack all theorders on to the H2RG array at a highest resolution of R ∼2750. A range of slit widths are availablefrom 0.5 to 4.0′′. The narrowest slit (0.5′′), which provides the R∼2750, is undersized than the typicalseeing for the Devasthal site for obtaining stable line profiles. It also has a low resolution prism mode(R∼100) for high throughput observations. The instrument also has an independent imaging camerawith a 1k×1k H1RG detector which is the slit viewer. The reflected beam from the slit is imaged tothis camera through a filter wheel which consists of broad band r′, i′, Y , J , H , Ks and narrow bandH2 & Brγ filters. This camera has a field of view of 1′×1′, and is used for guiding the telescope (IRguider) as well as imaging for photometry. It also functions as a pupil viewer for instrument alignmenton the telescope. A brief summary of the TANSPEC’s observational modes are tabulated in Table 2.
63
Bulletin de la Société Royale des Sciences de Liège, Vol. 87, Actes de colloques, 2018, p. 58 - 67

Table 1: TIRCAM2 performance with the 3.6-m DOT.FoV ∼86.5′′×86.5′′
Image scale 0.169′′/pixelBest seeing 0.6′′ (22 May 2017)
10σ limits (with effective integration)J-band 19.0 mag (550 s)H-band 18.8 mag (550 s)K-band 18.0 mag (1000 s)nbL-band (detection limit) 8.2 (20 s)
For calibration, a uniform flat field from an integrating sphere outside the dewar having an identicalf/9 beam is imaged. Wavelength calibration is done by Argon and Neon lamps.
The TANSPEC will be used for a wide range of studies from local star formation to extra-galacticastronomy. Simultaneous coverage of wavelength from 0.55 to 2.54 µm makes TANSPEC a uniqueinstrument and ideal for studies which require simultaneous measurement of lines in the optical andNIR. The XD spectral format is shown in Fig. 7. The free spectral range is plotted for each order.This mode is optimized for 2.54-0.63 µm and orders 3-10.
The sensitivity of the TANSPEC is estimated which requires the instrument parameters. In theabsence of atmospheric data for the Devasthal site, data for Mauna Kea was used. Table 2 gives theestimated 100σ-one hour sensitivity of the instrument in XD and prism modes. The spectroscopicsensitivity (100σ-one hour, 1′′ seeing) is expected to be 15.4 mag (R∼2750), whereas in prism mode(R∼100) it would be 17.3 mag in the J band.
Figure 6: Overall optical layout of TANSPEC.
3.2 TANSPEC current statusAll parts for the instrument have been received by MKIR. The assembly of the cryostat and all of themechanisms has been completed (Fig. 8). The mechanisms, software and cold run tests have been
64
Bulletin de la Société Royale des Sciences de Liège, Vol. 87, Actes de colloques, 2018, p. 58 - 67
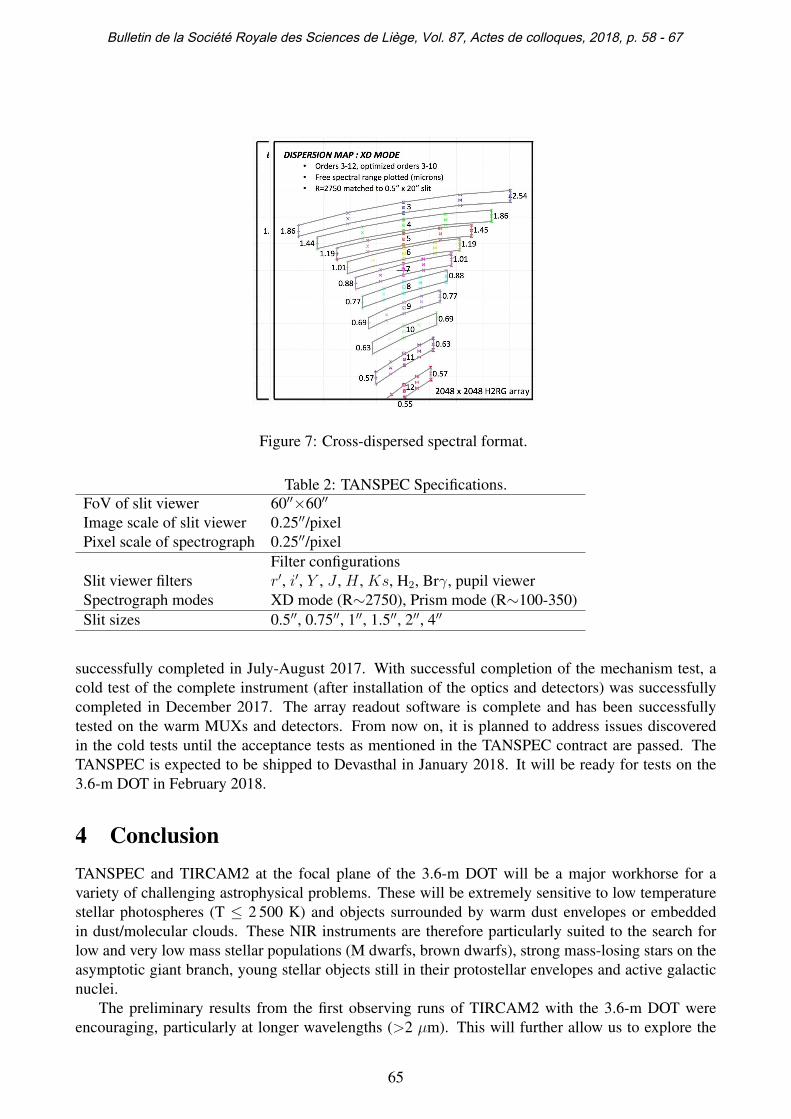
Figure 7: Cross-dispersed spectral format.
Table 2: TANSPEC Specifications.FoV of slit viewer 60′′×60′′
Image scale of slit viewer 0.25′′/pixelPixel scale of spectrograph 0.25′′/pixel
Filter configurationsSlit viewer filters r′, i′, Y , J , H , Ks, H2, Brγ, pupil viewerSpectrograph modes XD mode (R∼2750), Prism mode (R∼100-350)Slit sizes 0.5′′, 0.75′′, 1′′, 1.5′′, 2′′, 4′′
successfully completed in July-August 2017. With successful completion of the mechanism test, acold test of the complete instrument (after installation of the optics and detectors) was successfullycompleted in December 2017. The array readout software is complete and has been successfullytested on the warm MUXs and detectors. From now on, it is planned to address issues discoveredin the cold tests until the acceptance tests as mentioned in the TANSPEC contract are passed. TheTANSPEC is expected to be shipped to Devasthal in January 2018. It will be ready for tests on the3.6-m DOT in February 2018.
4 ConclusionTANSPEC and TIRCAM2 at the focal plane of the 3.6-m DOT will be a major workhorse for avariety of challenging astrophysical problems. These will be extremely sensitive to low temperaturestellar photospheres (T ≤ 2 500 K) and objects surrounded by warm dust envelopes or embeddedin dust/molecular clouds. These NIR instruments are therefore particularly suited to the search forlow and very low mass stellar populations (M dwarfs, brown dwarfs), strong mass-losing stars on theasymptotic giant branch, young stellar objects still in their protostellar envelopes and active galacticnuclei.
The preliminary results from the first observing runs of TIRCAM2 with the 3.6-m DOT wereencouraging, particularly at longer wavelengths (>2 µm). This will further allow us to explore the
65
Bulletin de la Société Royale des Sciences de Liège, Vol. 87, Actes de colloques, 2018, p. 58 - 67
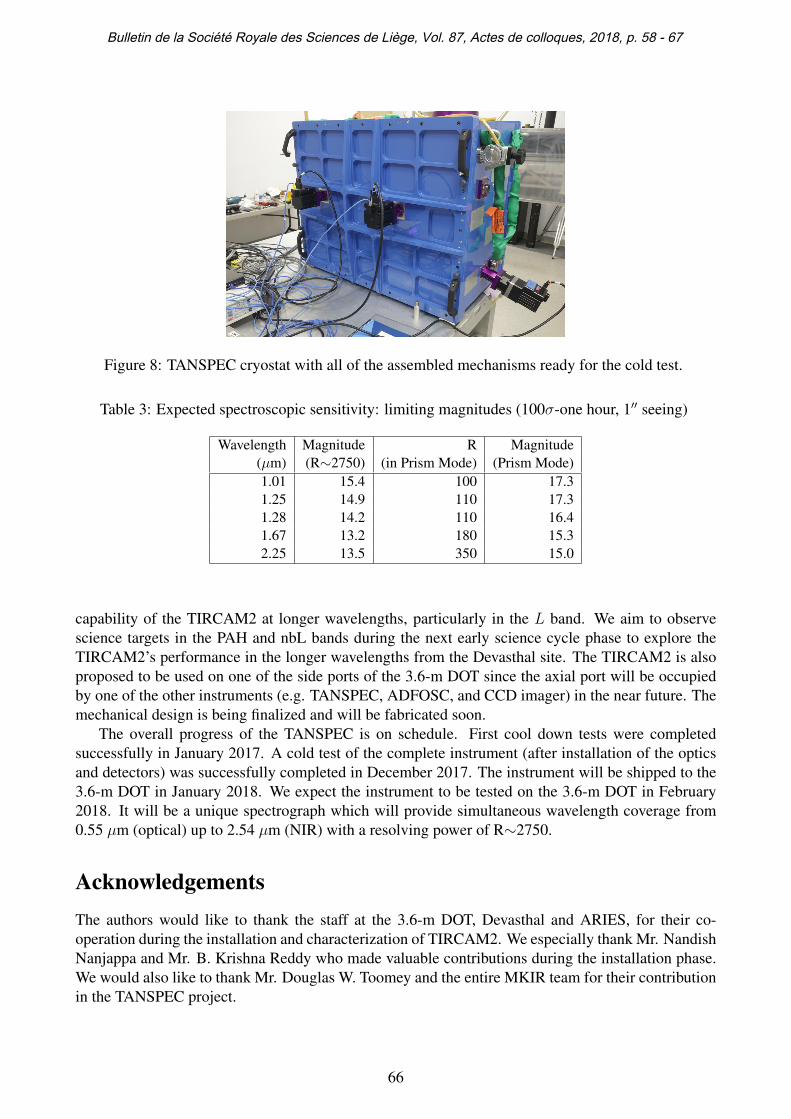
Figure 8: TANSPEC cryostat with all of the assembled mechanisms ready for the cold test.
Table 3: Expected spectroscopic sensitivity: limiting magnitudes (100σ-one hour, 1′′ seeing)
Wavelength Magnitude R Magnitude(µm) (R∼2750) (in Prism Mode) (Prism Mode)1.01 15.4 100 17.31.25 14.9 110 17.31.28 14.2 110 16.41.67 13.2 180 15.32.25 13.5 350 15.0
capability of the TIRCAM2 at longer wavelengths, particularly in the L band. We aim to observescience targets in the PAH and nbL bands during the next early science cycle phase to explore theTIRCAM2’s performance in the longer wavelengths from the Devasthal site. The TIRCAM2 is alsoproposed to be used on one of the side ports of the 3.6-m DOT since the axial port will be occupiedby one of the other instruments (e.g. TANSPEC, ADFOSC, and CCD imager) in the near future. Themechanical design is being finalized and will be fabricated soon.
The overall progress of the TANSPEC is on schedule. First cool down tests were completedsuccessfully in January 2017. A cold test of the complete instrument (after installation of the opticsand detectors) was successfully completed in December 2017. The instrument will be shipped to the3.6-m DOT in January 2018. We expect the instrument to be tested on the 3.6-m DOT in February2018. It will be a unique spectrograph which will provide simultaneous wavelength coverage from0.55 µm (optical) up to 2.54 µm (NIR) with a resolving power of R∼2750.
AcknowledgementsThe authors would like to thank the staff at the 3.6-m DOT, Devasthal and ARIES, for their co-operation during the installation and characterization of TIRCAM2. We especially thank Mr. NandishNanjappa and Mr. B. Krishna Reddy who made valuable contributions during the installation phase.We would also like to thank Mr. Douglas W. Toomey and the entire MKIR team for their contributionin the TANSPEC project.
66
Bulletin de la Société Royale des Sciences de Liège, Vol. 87, Actes de colloques, 2018, p. 58 - 67

References
Ghosh S. K. 2010, ASI Conference Series, 1, 167Ghosh S. K., Iyengar K. V. K., Rengarajan T. N. et al. 1988, ApJ, 330, 928Kaneda H., Nakagawa T., Ghosh S. K. et al. 2013, A&A, 556, id. A92Mookerjea B., Ghosh S. K., Kaneda H. et al. 2001, BASI, 29, 337Mookerjea B., Ghosh S. K., Kaneda H. et al. 2003, A&A, 404, 569Naik M. B., Ojha D. K., Ghosh S. K. et al. 2012, BASI, 40, 531Ninan J. P., Ojha D. K., Ghosh S. K. et al. 2014, JAI, id. 1450006Ojha D. K., Ghosh S. K., D’Costa, S. L. A et al. 2012a, ASI Conference Series, 4, 191Ojha D. K., Ghosh S. K., D’Costa, S. L. A et al. 2012b, ASI Conference Series, 1, 189
67
Bulletin de la Société Royale des Sciences de Liège, Vol. 87, Actes de colloques, 2018, p. 58 - 67