NON-INTRUSIVE METHODS FOR CONDITION ASSESSMENT OF ...
215
737 NON-INTRUSIVE METHODS FOR CONDITION ASSESSMENT OF DISTRIBUTION AND TRANSMISSION SWITCHGEAR JOINT WORKING GROUP A3.32/CIRED AUGUST 2018
Transcript of NON-INTRUSIVE METHODS FOR CONDITION ASSESSMENT OF ...
737
NON-INTRUSIVE METHODS FOR CONDITION ASSESSMENT OF DISTRIBUTION
AND TRANSMISSION SWITCHGEAR
JOINT WORKING GROUP
A3.32/CIRED
AUGUST 2018
Members
N.UZELAC, Convenor US C. HEINRICH, Secretary DE
R. PATER, Webmaster CA J. ARNOLD US
K. BENSON US B. DECK CH
A. FANGET FR V. FERRARO FR
N. GARIBOLDI CH A. LIVSHITZ US
J. MACLEOD US J. MANTILA CH
T. MYAMOTO JP A. NENNING AT
S. POIRIER CA R. SICKER US
B. SCHUEPFERLING DE J. SMIT NL
E. TAYLOR DE X. WANG CN
P. WESTERLUND SE S. WETZELER DE
Corresponding Members
D. EICHHOFF DE T. ITO JP
M. GERMAIN CA A. GIOSEFFI AR
P. KOPEJTKO CZ J. LOPEZ-ROLDAN AU
S. SMEETS NL
JWG A3.32/CIRED
Copyright © 2018
“All rights to this Technical Brochure are retained by CIGRE. It is strictly prohibited to reproduce or provide this publication in any form or by any means to any third party. Only CIGRE Collective Members companies are allowed to store their copy on their internal intranet or other company network provided access is restricted to their own employees. No part of this publication may be reproduced or utilized without permission from CIGRE”.
Disclaimer notice
“CIGRE gives no warranty or assurance about the contents of this publication, nor does it accept any responsibility, as to the accuracy or exhaustiveness of the information. All implied warranties and conditions are excluded to the maximum extent permitted by law”.
WG XX.XXpany network provided access is restricted to their own employees. No part of this publication may be reproduced or utilized without permission from CIGRE”.
Disclaimer notice
“CIGRE gives no warranty or assurance about the contents of this publication, nor does it accept any responsibility, as to the accuracy or exhaustiveness of the information. All implied warranties and conditions are excluded to the maximum extent
NON-INTRUSIVE METHODS FOR
CONDITION ASSESSMENT OF
DISTRIBUTION AND TRANSMISSION
SWITCHGEAR
ISBN : 978-2-85873-438-2
NON-INTRUSIVE METHODS FOR CONDITION ASSESSMENT OF DISTRIBUTION AND TRANSMISSION SWITCHGEAR
3
EXECUTIVE SUMMARY
Over the last decade, the plummeting prices for renewable and energy storage, coal power in decline,
the proliferation of distributed energy resources, and grid modernization with the subsequent two-way
power flow, have meant that power transmission and distribution are going through rapid changes.
Not only is the power system changing, switchgear design is following suit. To adapt to the need of the
modern electrical system, we have witnessed the evolution from a manual operated switch to an interconnected “smart” switch with embedded sensors, digital protection and control devices. New
switchgear standards have been developed, resulting in safer, more environmentally friendly devices.
With the development of novel materials and design concepts, switch sizes have reduced. All of this has resulted in increased switchgear functionality and connectivity.
At the same time, requirements for the electrical grid are becoming more stringent; including reduction of power outages, higher safety, health and environmental requirements, and better power quality.
Such requirements have a large impact on the switchgear specifications and design.
In the aim to optimize the maintenance costs of switchgear equipment, there is a general trend in the utilities to move from systematic, time-based, maintenance to condition based and risk based
maintenance by taking advantage of modern diagnostic tools and the advancing transformation of the network to the smart grid. There are many diagnostic techniques available today for the condition
assessment of switchgear equipment.
This technical brochure provides a comprehensive information on Non-Intrusive Condition assessment
of the T&D switchgear, that can be applied on HV and MV circuit breakers, HV and MV switches, MV
reclosers and fault interrupters.
In order to clarify the process of condition monitoring, some terms are defined. Non-Intrusive Condition
assessment methods are defined according to a following scale.
Non-intrusive: The switchgear is not affected.
Minimally intrusive: No major tests or repairs required before returning to service.
Intrusive: Tests are necessary before returning to service
The intrusiveness is considered for both the switchgear and the grid, and during installation and during
operation. The usefulness of the condition assessment method and the degree of maturity are also
defined.
A total of 53 condition assessment methods for switchgear are presented. Examples include:
electromagnetic transient emission measurement, partial discharges detection, dynamic resistance measurement, online temperature monitoring, vibrations measurement, gas leaks detection, vacuum
integrity inside VI, and analysis of gas decomposition products. The majority of them can be used for both MV and HV switchgear.
The discussed methods are classified in three different categories according to the part of the
switchgear that is measured: primary path (contacts, switching and isolation), mechanical parts (both mechanical linkage and driving mechanism), and control and auxiliary circuits. Each method is described
in detail with the application, the theoretical background, and the ease of use and the constraints. Many of the methods are very mature and some are still in investigation phase.
The usage of non-intrusive diagnostics is covered by two means: an international survey conducted by
the JWG that included questions about the methods and experience with condition monitoring, and a selection of recent case studies the authors found in the literature. The case studies show how different
methods are applied. In some cases non-intrusive diagnostics allowed to avoid major failures by detecting on time a malfunction or a beginning of degradation based on the actual condition of the
switchgear.
The technical and economic benefits of non-intrusive condition assessment methods must be weighted
taking into account its implementation and other associated costs, installation versus the costs
generated by the possible failures the equipment might encounter between maintenance periods. Several failure modes are presented for a live tank high voltage circuit breaker. Three main cost
elements have been identified: investment in the non-intrusive method, maintenance costs with and

NON-INTRUSIVE METHODS FOR CONDITION ASSESSMENT OF DISTRIBUTION AND TRANSMISSION SWITCHGEAR
4
without the non-intrusive method and failure/outage costs with and without the non-intrusive method.
The cost calculation contains several values that should be estimated by the user.
Lastly, some trends of the development of condition-monitoring methods for circuit breakers are
summarised, for example monitoring of new isolation gases and further development of partial discharge diagnostics.
NON-INTRUSIVE METHODS FOR CONDITION ASSESSMENT OF DISTRIBUTION AND TRANSMISSION SWITCHGEAR
5
CONTENTS
EXECUTIVE SUMMARY ............................................................................................................................... 3
1. INTRODUCTION ............................................................................................................................ 11
2. METHODOLOGY OF ANALYSIS ................................................................................................ 13
2.1 INTRODUCTION .............................................................................................................................................................. 13
2.2 OVERVIEW OF TERMS ................................................................................................................................................... 13
2.3 MEANING OF NON-INTRUSIVE DIAGNOSTIC METHOD ...................................................................................... 15 2.3.1 Examples of Non-Intrusive Diagnostic Method ................................................................................................ 16
2.4 DEGREE OF MATURITY OF DIAGNOSTIC METHOD ............................................................................................... 17
2.5 MODES OF APPLICATION OF SWITCHGEAR DIAGNOSTIC METHODS ........................................................... 18
2.6 MEANING OF USEFULNESS OF DIAGNOSTIC METHOD ...................................................................................... 18
2.7 SUMMARY ........................................................................................................................................................................ 19
3. CONDITION ASSESSMENT METHODS IN SWITCHGEAR ..................................................... 21
3.1 INTRODUCTION .............................................................................................................................................................. 21
3.2 SUMMARY OF METHODS ............................................................................................................................................. 21
3.3 DETAILED DESCRIPTION OF THE METHODS ............................................................................................................. 23 3.3.1 Nozzle Ablation ..................................................................................................................................................... 27 3.3.2 Contact Resistance ................................................................................................................................................. 28 3.3.3 Substation Intelligent Electronics Devices .......................................................................................................... 33 3.3.4 Gas Condition ......................................................................................................................................................... 35 3.3.5 Oil Condition ........................................................................................................................................................... 43 3.3.6 Partial Discharge ................................................................................................................................................... 44 3.3.7 Power Factor / Capacitance ............................................................................................................................... 49 3.3.8 Radiographic .......................................................................................................................................................... 51 3.3.9 Resistance of Insulation ......................................................................................................................................... 53 3.3.10 Transient Electromagnetic Emissions ................................................................................................................... 54 3.3.11 Temperature ........................................................................................................................................................... 57 3.3.12 Timing ....................................................................................................................................................................... 62 3.3.13 Vacuum Condition .................................................................................................................................................. 66 3.3.14 Vibration .................................................................................................................................................................. 78 3.3.15 Visual Inspection ..................................................................................................................................................... 82 3.3.16 Drive Mechanism status ......................................................................................................................................... 86 3.3.17 History of operation .............................................................................................................................................. 89 3.3.18 Travel Recording .................................................................................................................................................... 92 3.3.19 Coil current .............................................................................................................................................................. 95
3.4 SUMMARY ........................................................................................................................................................................ 97
4. APPLICATION OF CONDITION ASSESSMENT METHODS ..................................................... 99
4.1 INTRODUCTION .............................................................................................................................................................. 99
4.2 SURVEY RESULTS ............................................................................................................................................................. 99
4.3 SELECTED CASE STUDIES ............................................................................................................................................. 107 4.3.1 Main Contact Motion Measurements ............................................................................................................... 108 4.3.2 SF6 Density Monitoring ........................................................................................................................................ 109 4.3.3 Digital Fault Recorder and Protective Relay Data Analysis ....................................................................... 111 4.3.4 Monitoring in Controlled Switching Devices ................................................................................................... 113 4.3.5 Experience with Vibration Analysis .................................................................................................................. 115
NON-INTRUSIVE METHODS FOR CONDITION ASSESSMENT OF DISTRIBUTION AND TRANSMISSION SWITCHGEAR
6
4.3.6 Experience with Power Factor Testing............................................................................................................. 116 4.3.7 Experience with Coil Current Analysis ............................................................................................................. 117 4.3.8 Experience with Partial Discharge Measurements on MV Switchgear ..................................................... 120 4.3.9 Experience with Dynamic Contact Resistance Measurement ...................................................................... 121 4.3.10 Experience with Wireless Temperature Monitoring ..................................................................................... 123
4.4 SUMMARY ...................................................................................................................................................................... 124
5. TECHNICAL AND ECONOMIC EVALUATION OF NON-INTRUSIVE CONDITION ASSESSMENT METHODS ...................................................................................................................... 125
5.1 INTRODUCTION ............................................................................................................................................................ 125
5.2 FAILURE MODES ............................................................................................................................................................ 125
5.3 ANALYSIS TECHNIQUES .............................................................................................................................................. 130
5.4 EVALUATION PROCESSES OF NICAM ..................................................................................................................... 132
5.5 TECHNICAL VERSUS ECONOMICAL BENEFITS ....................................................................................................... 134 5.5.1 Technical Benefits and Usefulness..................................................................................................................... 134 5.5.2 Economic Benefits ................................................................................................................................................. 135 5.5.3 Example of Economic Benefit Calculation of NICAM ................................................................................... 135
5.6 DIFFERENCES IN THE APPLICATION OF NICAM FOR T&D ASSETS ................................................................... 140
5.7 SUMMARY ...................................................................................................................................................................... 140
6. FUTURE TRENDS .......................................................................................................................... 143
6.1 SWITCHGEAR USER TRENDS ..................................................................................................................................... 143
6.2 TRENDS IN DATA COLLECTION AND INFORMATION PROCESS ....................................................................... 143
6.3 INTEGRATION OF MONITORING INTO CONTROL UNITS ................................................................................. 143
6.4 INTRUSIVE AND NON-INTRUSIVE MONITORING ................................................................................................. 143
6.5 APPLICATION OF NON-INTRUSIVE SENSORS FOR MONITORING OF CIRCUIT BREAKER PARAMETERS144
6.6 MONITORING OF NEW GASES USED IN HV AND MV SWITCHGEAR ........................................................... 144
6.7 EXPANSION OF THE APPLICATION OF PARTIAL DISCHARGE DIAGNOSTICS .............................................. 144
6.8 MAKING SWITCHGEAR DESIGN MORE SAFE ....................................................................................................... 144
6.9 ASSET MANAGEMENT ................................................................................................................................................. 144
6.10 AUGMENTED REALITY .................................................................................................................................................. 144
6.11 FUTURE TRENDS IN SENSORS .................................................................................................................................... 144
6.12 MONITORING IN CONTROLLED SWITCHING DEVICES ..................................................................................... 145 6.12.1 Introduction ............................................................................................................................................................ 145 6.12.2 Mechanical Time Monitoring (contact touch, contact separation) .............................................................. 145 6.12.3 Dielectric strength considerations ..................................................................................................................... 147 6.12.4 Arcing Time Monitoring ....................................................................................................................................... 147 6.12.5 Environmental Influence ...................................................................................................................................... 147
7. CONCLUSION ............................................................................................................................. 149
APPENDIX A. DEFINITIONS, ABBREVIATIONS AND SYMBOLS ..................................................... 151
A.1. TERMINOLOGY ............................................................................................................................................................. 151
A.2. ABBREVIATIONS ............................................................................................................................................................ 152
APPENDIX B. LINKS AND REFERENCES .............................................................................................. 157
NON-INTRUSIVE METHODS FOR CONDITION ASSESSMENT OF DISTRIBUTION AND TRANSMISSION SWITCHGEAR
7
APPENDIX C. SENSORS REVIEW ........................................................................................................ 171
C.1. INTRODUCTION ............................................................................................................................................................ 171
C.2. SENSORS USED IN HV SWITCHGEAR ..................................................................................................................... 171
C.3. SENSORS USED IN MV SWITCHGEAR ..................................................................................................................... 173
C.4. INTRODUCTION ............................................................................................................................................................ 176
C.5. SENSORS USED BOTH IN HV AND MV SWITCHGEAR ........................................................................................ 176
C.6. SUMMARY ...................................................................................................................................................................... 178
APPENDIX D. SWITCHGEAR REVIEW ................................................................................................ 179
D.1. HV SWITCHGEAR ......................................................................................................................................................... 179
D.2. MV SWITCHGEAR ........................................................................................................................................................ 183
D.3. SUMMARY ...................................................................................................................................................................... 191
APPENDIX E. SURVEY ............................................................................................................................ 193
E.1. INTRODUCTION ............................................................................................................................................................ 193
E.2. SURVEY QUESTIONNAIRE ........................................................................................................................................... 194
APPENDIX F. MATRIX ............................................................................................................................ 199
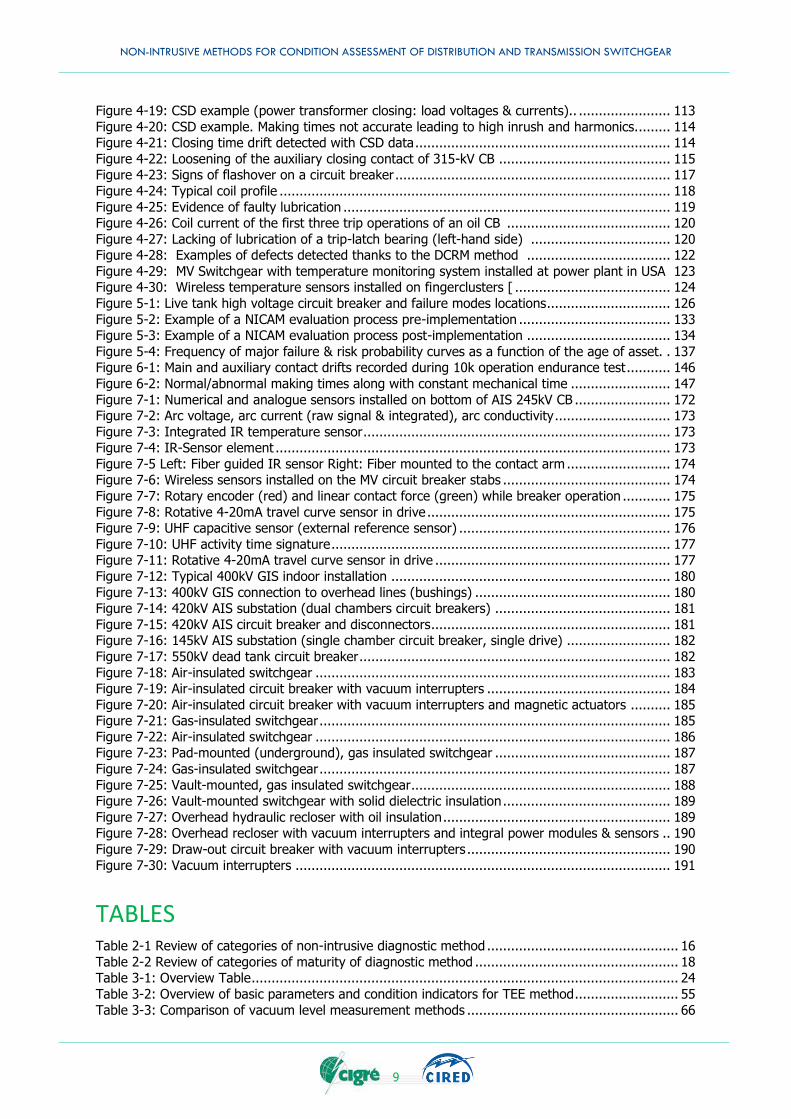
FIGURES AND ILLUSTRATIONS Figure 2-1: Threefold relationship between the switchgear, diagnostic method and diagnoses ......... 13 Figure 2-2 Measured physical parameters in switchgear condition evaluation .................................. 14 Figure 3-1: Circuit breaker integrity in installation ......................................................................... 21 Figure 3-2: Left: Grid integrity in installation Right: Grid integrity in operation ................................ 22 Figure 3-3: Distribution of the degree of maturity ......................................................................... 22 Figure 3-4: Overview of the methods ........................................................................................... 23 Figure 3-5: Connection point with pressure sensor (main filling valve) ............................................ 27 Figure 3-6: Raw data of a measurement at the main filling valve ................................................... 28 Figure 3-7: Frequency spectrum of raw data................................................................................. 28 Figure 3-8: Four point resistance measurement ........................................................................... 29 Figure 3-9: Insulating grounding switch ...................................................................................... 30 Figure 3-10: Two examples of DCRM measurement performed on the same CB .............................. 31 Figure 3-11: Parameters to be extracted from the dynamic contact resistance curve ....................... 31 Figure 3-12: Abnormal current path detected by the DCRM method ............................................... 32 Figure 3-13: Wrong assembly; 31.5 kA arcing contact instead of 40 kA arcing contact used ............ 32 Figure 3-14: Recording of CB restrike ........................................................................................... 34 Figure 3-15: Bourdon tube ......................................................................................................... 36 Figure 3-16: Flir SF6 camera ........................................................................................................ 37 Figure 3-17: Dew point mirror...................................................................................................... 38 Figure 3-18: Structure of a polymer sensor ................................................................................... 39 Figure 3-19: Aluminum oxide sensor ............................................................................................ 39 Figure 3-20: Detector tube and sampling arrangement .................................................................. 41 Figure 3-21: Internally mounted plate sensor installed on gas-insulated switchgear ....................... 46 Figure 3-22: High frequency CT installed on the ground conductor of the 145kV SF6 CB .................. 47 Figure 3-23: Principle of TEV sensor arrangement ....................................................................... 48 Figure 3-24: On-line PD measurement on 27kV solid dielectic insulation recloser ............................ 48 Figure 3-25: Dead tank circuit breaker ......................................................................................... 50

NON-INTRUSIVE METHODS FOR CONDITION ASSESSMENT OF DISTRIBUTION AND TRANSMISSION SWITCHGEAR
8
Figure 3-26: Live tank circuit breaker ........................................................................................... 51 Figure 3-27: Example placement of X-ray source and image plates. .............................................. 52 Figure 3-28: X-ray images of an incorrectly inserted bolt] .............................................................. 52 Figure 3-29: Comparison of outage times between an invasive internal inspection and radiography. 53 Figure 3-30: Measurement setup with four antennas installed around a 230 kV SF6 CB ................... 54 Figure 3-31: TEE recorded by four antennas required for location of the interrupter ........................ 55 Figure 3-32: Measurement setup with three PAs and one AA: ........................................................ 56 Figure 3-33: Double re-ignition in phase A recorded by AA ........................................................... 57 Figure 3-34: IR window .............................................................................................................. 58 Figure 3-35: Fiber guided IR sensor mounted to the contact arm ................................................... 59 Figure 3-36: Wireless SAW-based temperature measurement system ............................................ 60 Figure 3-37: Complex UHF RFID system to monitor a complete MV switchboard ............................. 61 Figure 3-38: ZigBee thermal sensor with energy harvesting ........................................................... 61 Figure 3-39: Timing test device setup........................................................................................... 62 Figure 3-40: Relay programming for circuit breaker trip timing ..................................................... 64 Figure 3-41: Connection of circuit breaker analyzer ....................................................................... 65 Figure 3-42: Opening time during first trip ................................................................................... 65 Figure 3-43: Left: Permanent magnet arrangements Right: Flexible coil system ............................. 67 Figure 3-44: Typical setup for a DC measurement of vacuum integrity .......................................... 69 Figure 3-45: Basic design of a cold cathode gauge ....................................................................... 70 Figure 3-46: Spinning rotor gauge including the rotating metal ball. ............................................... 71 Figure 3-47: Pressure monitoring via an additional bellows ........................................................... 72 Figure 3-48: PD as a function of the phase angle of the voltage and pressure level inside the VI ..... 74 Figure 3-49: System for monitoring the PD from in-service circuit breakers. ................................... 75 Figure 3-50: Sound detection technique for a VI under vacuum (top) and up-to-air (below) ............ 77 Figure 3-51: System for detecting the level of light emission during arcing in VI's . ......................... 77 Figure 3-52: Measurement setup for three pole circuit breaker ..................................................... 79 Figure 3-53: Timing difference of arcing and nominal contacts ..................................................... 80 Figure 3-54: Graphs of the vibration analysis on a 230 kV CB ....................................................... 81 Figure 3-55: Single pressure dead tank circuit breaker visual inspection – external ........................ 83 Figure 3-56: Dead tank circuit breaker visual inspection - controls, mechanism and alarms ............. 84 Figure 3-57: Actual installation of circuit breaker with motor drive ................................................ 86 Figure 3-58: Time- and quality-based warning and alarm thresholds ............................................. 88 Figure 3-59: Fatal attempt to charge diagram .............................................................................. 88 Figure 3-60: Maximum permissible electrical wear ......................................................................... 90 Figure 3-61: Motion transducer mounted on operating shaft of circuit breaker ............................... 93 Figure 3-62: Example of dynamic contact travel measurement ...................................................... 94 Figure 3-63: Diagram of a trip coil of a CB energized with DC voltage through auxiliary switch ........ 95 Figure 3-64: Recoding of a coil current during an opening operation .............................................. 96 Figure 4-1: <38 kV Survey responses by country ........................................................................ 100 Figure 4-2: >38 to ≤170 kV Survey responses by country ........................................................... 100 Figure 4-3: >170 kV Survey responses by country ...................................................................... 100 Figure 4-4: Survey structure ...................................................................................................... 102 Figure 4-5: All respondent’s in-service techniques ....................................................................... 103 Figure 4-6: All respondent’s off-service techniques ...................................................................... 104 Figure 4-7: Switchgear types per voltage class ............................................................................ 104 Figure 4-8: Importance of the cost advantage of using non-intrusive diagnostic techniques ........... 106 Figure 4-9: Importance of the advantage of performing tests on equipment without dismantling it 106 Figure 4-10: Importance of the advantage of performing tests on equipment remaining in service . 107 Figure 4-11: Example of diagnostic process in progressive step ................................................... 108 Figure 4-12: Deviation by zone between the reference curve and each phase of the tested HVCB . 109 Figure 4-13: Oil leak detected on the opening dashpot, phase C ................................................. 109 Figure 4-14: Leak rates of a population of 1000 CBs in Australia ................................................. 110 Figure 4-15: Proportion of leaking CBs of a population of CBs manufactured 1998-2002 in the US . 110 Figure 4-16: Gas leak inspection of a SF6 CB with laser system .................................................... 111 Figure 4-17: Example of data received from fault recorder .......................................................... 112 Figure 4-18: Example of re-ignition detected by CSD during reactor opening ................................ 113
NON-INTRUSIVE METHODS FOR CONDITION ASSESSMENT OF DISTRIBUTION AND TRANSMISSION SWITCHGEAR
9
Figure 4-19: CSD example (power transformer closing: load voltages & currents).. ....................... 113 Figure 4-20: CSD example. Making times not accurate leading to high inrush and harmonics. ........ 114 Figure 4-21: Closing time drift detected with CSD data ................................................................ 114 Figure 4-22: Loosening of the auxiliary closing contact of 315-kV CB ........................................... 115 Figure 4-23: Signs of flashover on a circuit breaker ..................................................................... 117 Figure 4-24: Typical coil profile .................................................................................................. 118 Figure 4-25: Evidence of faulty lubrication .................................................................................. 119 Figure 4-26: Coil current of the first three trip operations of an oil CB ......................................... 120 Figure 4-27: Lacking of lubrication of a trip-latch bearing (left-hand side) ................................... 120 Figure 4-28: Examples of defects detected thanks to the DCRM method .................................... 122 Figure 4-29: MV Switchgear with temperature monitoring system installed at power plant in USA 123 Figure 4-30: Wireless temperature sensors installed on fingerclusters [ ....................................... 124 Figure 5-1: Live tank high voltage circuit breaker and failure modes locations............................... 126 Figure 5-2: Example of a NICAM evaluation process pre-implementation ...................................... 133 Figure 5-3: Example of a NICAM evaluation process post-implementation .................................... 134 Figure 5-4: Frequency of major failure & risk probability curves as a function of the age of asset. . 137 Figure 6-1: Main and auxiliary contact drifts recorded during 10k operation endurance test ........... 146 Figure 6-2: Normal/abnormal making times along with constant mechanical time ......................... 147 Figure 7-1: Numerical and analogue sensors installed on bottom of AIS 245kV CB ........................ 172 Figure 7-2: Arc voltage, arc current (raw signal & integrated), arc conductivity ............................. 173 Figure 7-3: Integrated IR temperature sensor ............................................................................. 173 Figure 7-4: IR-Sensor element ................................................................................................... 173 Figure 7-5 Left: Fiber guided IR sensor Right: Fiber mounted to the contact arm .......................... 174 Figure 7-6: Wireless sensors installed on the MV circuit breaker stabs .......................................... 174 Figure 7-7: Rotary encoder (red) and linear contact force (green) while breaker operation ............ 175 Figure 7-8: Rotative 4-20mA travel curve sensor in drive ............................................................. 175 Figure 7-9: UHF capacitive sensor (external reference sensor) ..................................................... 176 Figure 7-10: UHF activity time signature ..................................................................................... 177 Figure 7-11: Rotative 4-20mA travel curve sensor in drive ........................................................... 177 Figure 7-12: Typical 400kV GIS indoor installation ...................................................................... 180 Figure 7-13: 400kV GIS connection to overhead lines (bushings) ................................................. 180 Figure 7-14: 420kV AIS substation (dual chambers circuit breakers) ............................................ 181 Figure 7-15: 420kV AIS circuit breaker and disconnectors ............................................................ 181 Figure 7-16: 145kV AIS substation (single chamber circuit breaker, single drive) .......................... 182 Figure 7-17: 550kV dead tank circuit breaker .............................................................................. 182 Figure 7-18: Air-insulated switchgear ......................................................................................... 183 Figure 7-19: Air-insulated circuit breaker with vacuum interrupters .............................................. 184 Figure 7-20: Air-insulated circuit breaker with vacuum interrupters and magnetic actuators .......... 185 Figure 7-21: Gas-insulated switchgear ........................................................................................ 185 Figure 7-22: Air-insulated switchgear ......................................................................................... 186 Figure 7-23: Pad-mounted (underground), gas insulated switchgear ............................................ 187 Figure 7-24: Gas-insulated switchgear ........................................................................................ 187 Figure 7-25: Vault-mounted, gas insulated switchgear................................................................. 188 Figure 7-26: Vault-mounted switchgear with solid dielectric insulation .......................................... 189 Figure 7-27: Overhead hydraulic recloser with oil insulation ......................................................... 189 Figure 7-28: Overhead recloser with vacuum interrupters and integral power modules & sensors .. 190 Figure 7-29: Draw-out circuit breaker with vacuum interrupters ................................................... 190 Figure 7-30: Vacuum interrupters .............................................................................................. 191
TABLES Table 2-1 Review of categories of non-intrusive diagnostic method ................................................ 16 Table 2-2 Review of categories of maturity of diagnostic method ................................................... 18 Table 3-1: Overview Table ........................................................................................................... 24 Table 3-2: Overview of basic parameters and condition indicators for TEE method .......................... 55 Table 3-3: Comparison of vacuum level measurement methods ..................................................... 66
NON-INTRUSIVE METHODS FOR CONDITION ASSESSMENT OF DISTRIBUTION AND TRANSMISSION SWITCHGEAR
10
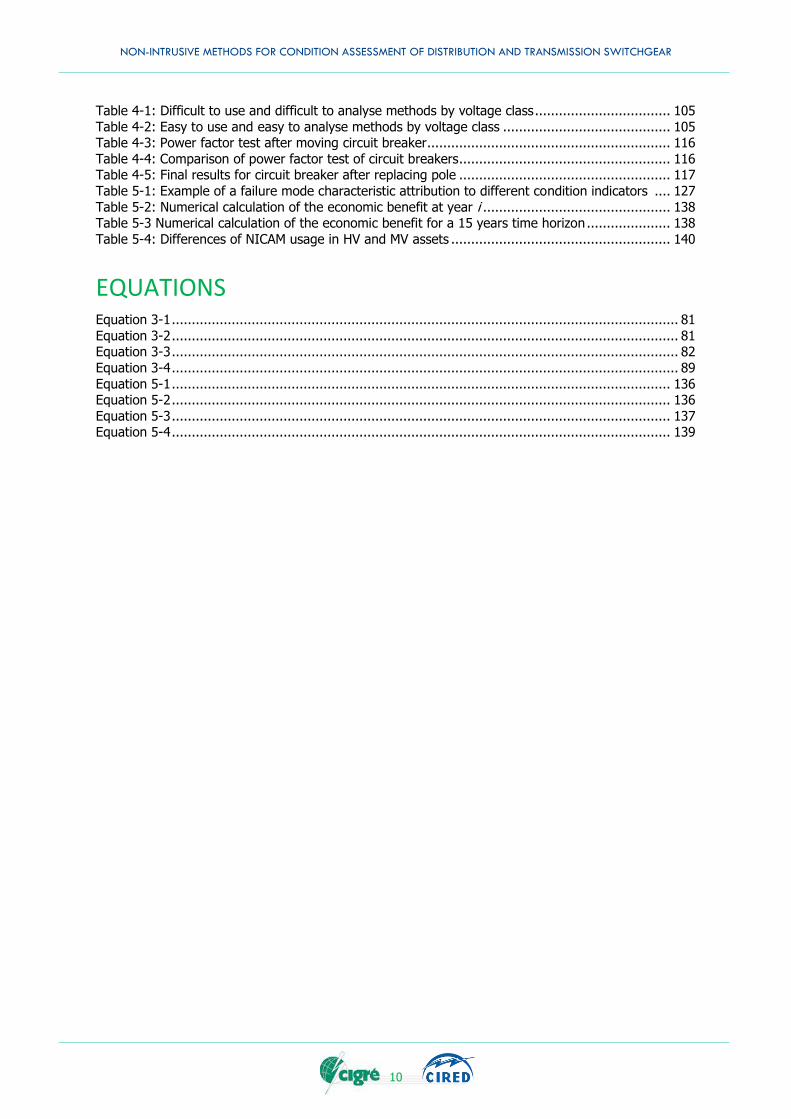
Table 4-1: Difficult to use and difficult to analyse methods by voltage class .................................. 105 Table 4-2: Easy to use and easy to analyse methods by voltage class .......................................... 105 Table 4-3: Power factor test after moving circuit breaker............................................................. 116 Table 4-4: Comparison of power factor test of circuit breakers ..................................................... 116 Table 4-5: Final results for circuit breaker after replacing pole ..................................................... 117 Table 5-1: Example of a failure mode characteristic attribution to different condition indicators .... 127 Table 5-2: Numerical calculation of the economic benefit at year i ............................................... 138 Table 5-3 Numerical calculation of the economic benefit for a 15 years time horizon ..................... 138 Table 5-4: Differences of NICAM usage in HV and MV assets ....................................................... 140
EQUATIONS Equation 3-1 ............................................................................................................................... 81 Equation 3-2 ............................................................................................................................... 81 Equation 3-3 ............................................................................................................................... 82 Equation 3-4 ............................................................................................................................... 89 Equation 5-1 ............................................................................................................................. 136 Equation 5-2 ............................................................................................................................. 136 Equation 5-3 ............................................................................................................................. 137 Equation 5-4 ............................................................................................................................. 139
NON-INTRUSIVE METHODS FOR CONDITION ASSESSMENT OF DISTRIBUTION AND TRANSMISSION SWITCHGEAR
11
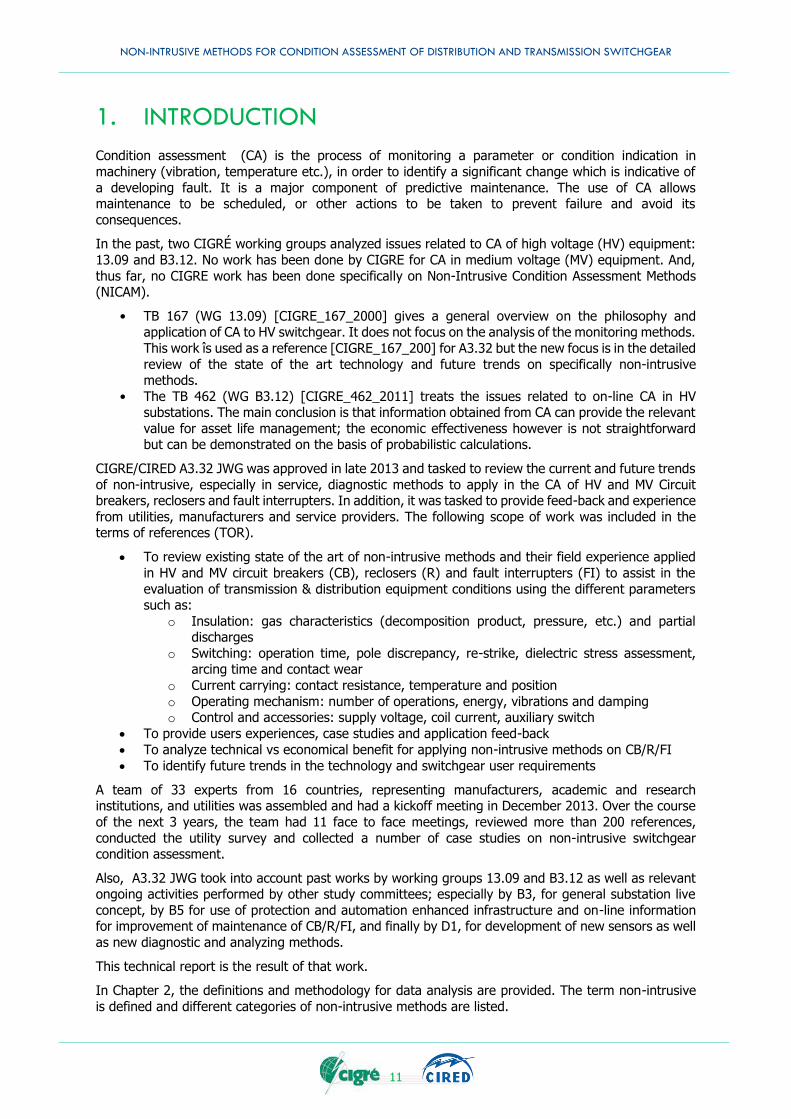
1. INTRODUCTION
Condition assessment (CA) is the process of monitoring a parameter or condition indication in
machinery (vibration, temperature etc.), in order to identify a significant change which is indicative of
a developing fault. It is a major component of predictive maintenance. The use of CA allows maintenance to be scheduled, or other actions to be taken to prevent failure and avoid its
consequences.
In the past, two CIGRÉ working groups analyzed issues related to CA of high voltage (HV) equipment:
13.09 and B3.12. No work has been done by CIGRE for CA in medium voltage (MV) equipment. And,
thus far, no CIGRE work has been done specifically on Non-Intrusive Condition Assessment Methods (NICAM).
• TB 167 (WG 13.09) [CIGRE_167_2000] gives a general overview on the philosophy and application of CA to HV switchgear. It does not focus on the analysis of the monitoring methods.
This work îs used as a reference [CIGRE_167_200] for A3.32 but the new focus is in the detailed
review of the state of the art technology and future trends on specifically non-intrusive methods.
• The TB 462 (WG B3.12) [CIGRE_462_2011] treats the issues related to on-line CA in HV substations. The main conclusion is that information obtained from CA can provide the relevant
value for asset life management; the economic effectiveness however is not straightforward but can be demonstrated on the basis of probabilistic calculations.
CIGRE/CIRED A3.32 JWG was approved in late 2013 and tasked to review the current and future trends
of non-intrusive, especially in service, diagnostic methods to apply in the CA of HV and MV Circuit breakers, reclosers and fault interrupters. In addition, it was tasked to provide feed-back and experience
from utilities, manufacturers and service providers. The following scope of work was included in the terms of references (TOR).
To review existing state of the art of non-intrusive methods and their field experience applied
in HV and MV circuit breakers (CB), reclosers (R) and fault interrupters (FI) to assist in the
evaluation of transmission & distribution equipment conditions using the different parameters such as:
o Insulation: gas characteristics (decomposition product, pressure, etc.) and partial discharges
o Switching: operation time, pole discrepancy, re-strike, dielectric stress assessment, arcing time and contact wear
o Current carrying: contact resistance, temperature and position
o Operating mechanism: number of operations, energy, vibrations and damping o Control and accessories: supply voltage, coil current, auxiliary switch
To provide users experiences, case studies and application feed-back
To analyze technical vs economical benefit for applying non-intrusive methods on CB/R/FI
To identify future trends in the technology and switchgear user requirements
A team of 33 experts from 16 countries, representing manufacturers, academic and research institutions, and utilities was assembled and had a kickoff meeting in December 2013. Over the course
of the next 3 years, the team had 11 face to face meetings, reviewed more than 200 references,
conducted the utility survey and collected a number of case studies on non-intrusive switchgear condition assessment.
Also, A3.32 JWG took into account past works by working groups 13.09 and B3.12 as well as relevant ongoing activities performed by other study committees; especially by B3, for general substation live
concept, by B5 for use of protection and automation enhanced infrastructure and on-line information for improvement of maintenance of CB/R/FI, and finally by D1, for development of new sensors as well
as new diagnostic and analyzing methods.
This technical report is the result of that work.
In Chapter 2, the definitions and methodology for data analysis are provided. The term non-intrusive
is defined and different categories of non-intrusive methods are listed.
NON-INTRUSIVE METHODS FOR CONDITION ASSESSMENT OF DISTRIBUTION AND TRANSMISSION SWITCHGEAR
12
In Chapter 3, all the non-intrusive methods are listed and divided in different groups by categorizing their characteristics. All methods are categorized by their degree of intrusion in the switchgear (non-
intrusive, minimally intrusive, intrusive), condition of the switchgear while the method is used (in-service, off-service), degree of maturity (from theoretical concept to standard practice in the field), and
mode of application (periodic measurement, continous measurement). In addition, each method is
briefly explained, and its benefits and limitations are provided.
Chapter 4 has two parts. In the first part it provides the results from the utility survey. The survey was developed using a specialized web tool and sent to hundreds of utilities around the globe and received
results from 45 respondents. The results give some insight on the current condition assessment practices from those utilities. In the second part, some of the current practices are covered in more
detail.
Chapter 5 covers the technical and economic evaluation of non-intrusive CA methods. Benefits of the
CA has to be weighted with its cost of installation and operation and risk of failure, yet, it might not be easy to quantify the costs and risks. This chapter give some state of the art methodologies and
examples how to make a good business case for CA.
Lastly, in Chapter 6 some new developments and technology trends are mentioned that are relevant to
CA; from the development of smaller and cheaper sensors to augmented reality.
NON-INTRUSIVE METHODS FOR CONDITION ASSESSMENT OF DISTRIBUTION AND TRANSMISSION SWITCHGEAR
13
2. METHODOLOGY OF ANALYSIS
2.1 INTRODUCTION
For the purpose of this brochure, this section reviews the relevant definitions and terminology. To
ensure consistency with preceding publications regarding circuit breaker diagnostics, we refer to the
previous definitions and outline discrepancies, especially if different meanings are given for similar expressions.
In this chapter we also provide a detailed discussion of more specifc terms such as non-intrusive diagnostic method, usefulness of the diagnostic method and the maturity level. Specific terms and
abbreviation definitions are provided in APPENDIX A.
2.2 OVERVIEW OF TERMS
CIGRE WG B3.12 introduced a term of diagnosis of electrical equipment as decision aid tool for
maintenance (postponing or advancing preventive maintenance, troubleshooting), residual life evaluation (prognosis, can we rely on equipment), actual performance evaluation (achieving optimum,
increasing or reducing), forensic investigations, etc. The diagnosis integrates diagnostic tests and other available data to provide information on equipment condition or failure mode.
The diagnostic methods – also referred to as condition assessment methods – include technology or
techniques using tests, condition measurements and other examinations that obtain one or more condition indicators or symptoms. Sensors, acquisition systems, communication, signal processing, data
analysis, software and firmware would be used in the diagnostic method. Condition indicators are quantitative or qualitative values (parameters) related to the condition of one part or one function of
the switchgear.
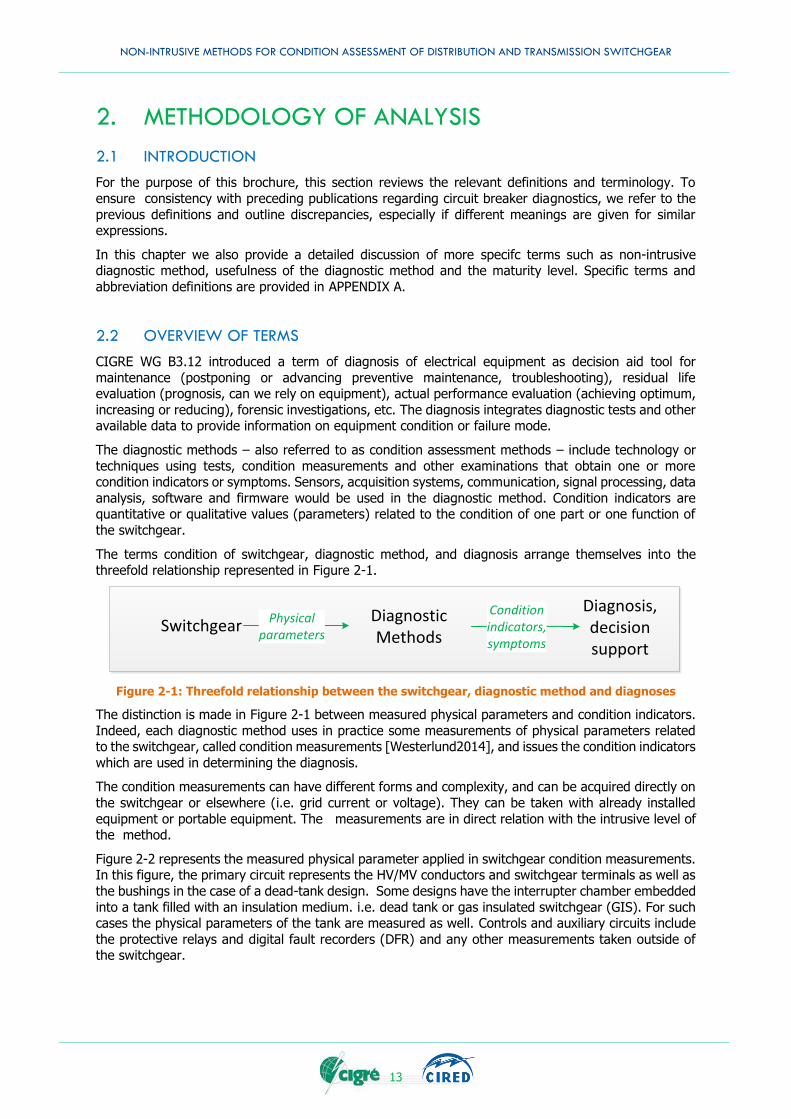
The terms condition of switchgear, diagnostic method, and diagnosis arrange themselves into the threefold relationship represented in Figure 2-1.
Figure 2-1: Threefold relationship between the switchgear, diagnostic method and diagnoses
The distinction is made in Figure 2-1 between measured physical parameters and condition indicators.
Indeed, each diagnostic method uses in practice some measurements of physical parameters related to the switchgear, called condition measurements [Westerlund2014], and issues the condition indicators
which are used in determining the diagnosis.
The condition measurements can have different forms and complexity, and can be acquired directly on
the switchgear or elsewhere (i.e. grid current or voltage). They can be taken with already installed
equipment or portable equipment. The measurements are in direct relation with the intrusive level of the method.
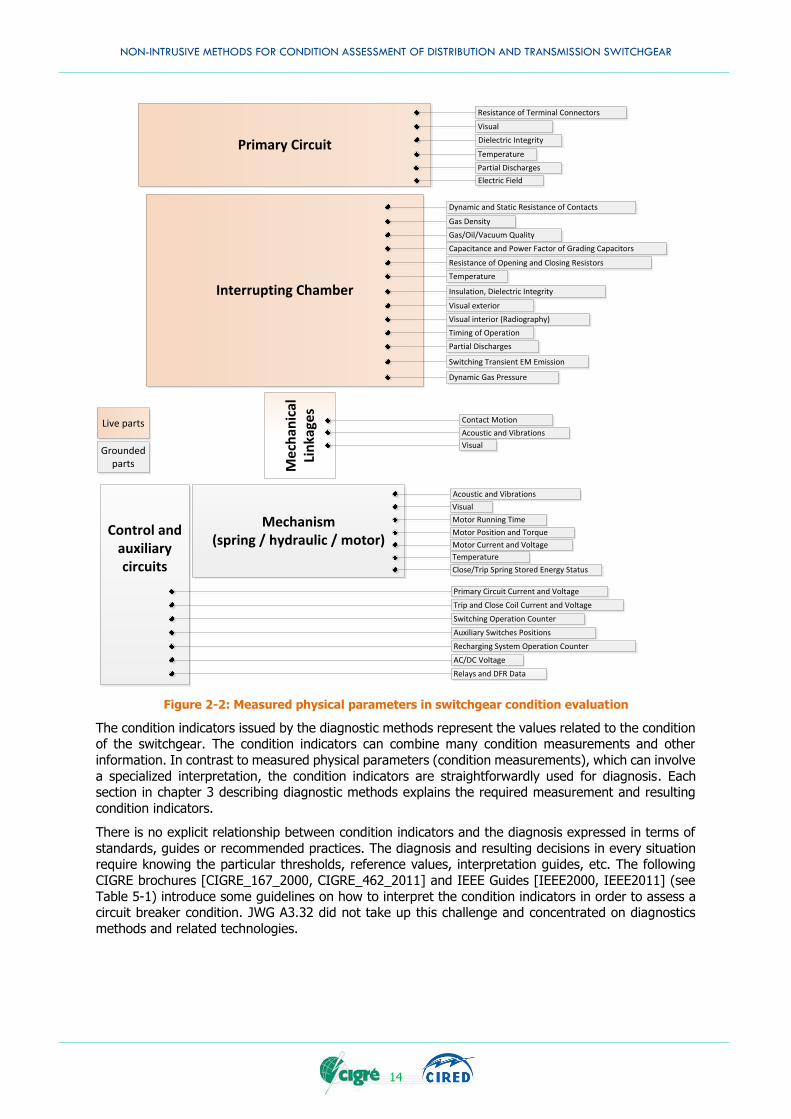
Figure 2-2 represents the measured physical parameter applied in switchgear condition measurements. In this figure, the primary circuit represents the HV/MV conductors and switchgear terminals as well as
the bushings in the case of a dead-tank design. Some designs have the interrupter chamber embedded
into a tank filled with an insulation medium. i.e. dead tank or gas insulated switchgear (GIS). For such cases the physical parameters of the tank are measured as well. Controls and auxiliary circuits include
the protective relays and digital fault recorders (DFR) and any other measurements taken outside of the switchgear.
Diagnosis,decision support
Diagnostic Methods
SwitchgearCondition indicators,symptoms
Physical parameters
NON-INTRUSIVE METHODS FOR CONDITION ASSESSMENT OF DISTRIBUTION AND TRANSMISSION SWITCHGEAR
14
Figure 2-2: Measured physical parameters in switchgear condition evaluation
The condition indicators issued by the diagnostic methods represent the values related to the condition of the switchgear. The condition indicators can combine many condition measurements and other
information. In contrast to measured physical parameters (condition measurements), which can involve
a specialized interpretation, the condition indicators are straightforwardly used for diagnosis. Each section in chapter 3 describing diagnostic methods explains the required measurement and resulting
condition indicators.
There is no explicit relationship between condition indicators and the diagnosis expressed in terms of
standards, guides or recommended practices. The diagnosis and resulting decisions in every situation require knowing the particular thresholds, reference values, interpretation guides, etc. The following
CIGRE brochures [CIGRE_167_2000, CIGRE_462_2011] and IEEE Guides [IEEE2000, IEEE2011] (see
Table 5-1) introduce some guidelines on how to interpret the condition indicators in order to assess a circuit breaker condition. JWG A3.32 did not take up this challenge and concentrated on diagnostics
methods and related technologies.
Control and auxiliary circuits
Primary Circuit
Interrupting Chamber
Mechanism (spring / hydraulic / motor)
Partial Discharges
Trip and Close Coil Current and Voltage
Switching Operation Counter
Me
chan
ical
Li
nka
ges
Contact Motion
Acoustic and Vibrations
Auxiliary Switches Positions
Primary Circuit Current and Voltage
Switching Transient EM Emission
Gas Density
Gas/Oil/Vacuum Quality
Capacitance and Power Factor of Grading Capacitors
Dynamic Gas Pressure
Resistance of Opening and Closing Resistors
Temperature
Dynamic and Static Resistance of Contacts
Insulation, Dielectric Integrity
Visual interior (Radiography)
Visual exterior
Timing of Operation
Visual
Recharging System Operation Counter
Electric Field
Partial Discharges
AC/DC Voltage
Relays and DFR Data
Acoustic and Vibrations
Visual
Motor Current and Voltage
Temperature
Close/Trip Spring Stored Energy Status
Live parts
Grounded parts
Motor Running Time
Motor Position and Torque
Temperature
Dielectric Integrity
Visual
Resistance of Terminal Connectors
NON-INTRUSIVE METHODS FOR CONDITION ASSESSMENT OF DISTRIBUTION AND TRANSMISSION SWITCHGEAR
15
2.3 MEANING OF NON-INTRUSIVE DIAGNOSTIC METHOD
The adjectives intrusive/nonintrusive/non-intrusive and invasive/noninvasive/non-invasive are
commonly used in technical literature complementing nouns such as diagnosis, procedure, method, technique, and etc. For instance, research of titles in IEEEXplore Digital Library shows more than 3000
documents with these terms. The spelling with hyphen after the prefix “non” seems to be privileged.
The term “non-invasive diagnostic” is precisely defined in medicine as a procedure that does not require
the insertion of instruments through the skin or into a body cavity. However, following such a formal definition some simple tests, for example a venipuncture, are classified as invasive. The notion
“minimally invasive” procedures were therefore introduced in medicine. In the domain of electricity, the
International Electrotechnical Vocabulary (IEC 60050) defines in §212-18-35 “non-invasive testing” as testing which maintains the physical and chemical integrity of the material under test.
The difference between the terms non-intrusive and non-invasive is slight and these terms are often used as synonyms. WG A3.32 recommends using non-intrusive in the context of electrical equipment.
It refers to the fact that there is no intrusion into the system.
There are two criteria to classify a diagnostic method of switchgear as non-intrusive: how the integrity of the switchgear itself is affected by the diagnostics and the impact on the grid.
There is no clear, and broad, definition for switchgear integrity. It should take into account the particularities of each equipment and diagnostic method. In general terms, one can suppose that the
switchgear's integrity is not affected if its performance is not altered i.e., it can continue to operate
within the manufacturer assigned ratings. This should be validated by relevant tests, including electrical, dielectric, mechanical and environmental performance tests, personal safety tests, life expectation,
influence on adjacent equipment (i.e. EMC), etc.
The impact on the grid relates to the continued ability of the switchgear to pursue its duty during the
diagnostic procedure. In this brochure, the diagnostic method is qualified as 'in-service' if the switchgear is fully functional during the diagnostic procedure and as 'off-service' if the switchgear needs to be off-
duty during the procedure. WG A3.32 proposes to introduce these qualifiers in the context of switchgear
diagnostics.
Consequently, non-intrusive diagnostic methods are classified as:
1. in-service – applied while the switchgear remains connected to the grid and can operate normally (can perform the expected duty), consequently the normal grid operation is not
affected; however, in some cases the switchgear should be exercised (i.e. forced to
operate) 2. off-service – installed or applied when switchgear is temporarily disconnected from the
grid but not affecting the integrity of the switchgear, it can be returned to the grid after the diagnostics without any further verifications
Other methods should be classified as minimally intrusive or intrusive.
For some diagnostic methods, especially those which are installed for permanent monitoring, the
distinction is required between the installation and the operation of condition measurement equipment.
If the switchgear comes with a monitoring system or some sensors installed in the factory we consider it as an intrinsic, built-in system. The switchgear integrity including this system is guaranteed by the
switchgear manufacturer. Properly using such a system will be non-intrusive and eventually in-service. If a built-in factory monitoring system or sensors are optional, i.e. may not be installed before
commissioning but the supports or orifices are preinstalled in the factory, then installing such a system
after commissioning will be considered as non-intrusive as long as one follows the procedures provided by the factory. In these cases the manufacturer takes responsibility for guaranteeing the integrity of
switchgear.
For example, removal of a cover may be considered non-intrusive (usually off-service), if the equipment
can be returned to its normal duty after inspection and if it is not forbidden in the equipment manual.
NON-INTRUSIVE METHODS FOR CONDITION ASSESSMENT OF DISTRIBUTION AND TRANSMISSION SWITCHGEAR
16
If a diagnostic method involves some minor intervention or intervention limited to auxiliary subsystems
and no major test or repairs to the switchgear are required after the diagnostic test, it is considered as minimally intrusive.
If a diagnostic method involves major intervention or intervention on vital parts of the switchgear, it is considered as intrusive. In this case, tests or studies are required before the switchgear is returned to
service. A method requiring the switchgear to be dismantled is classified as intrusive. Usually switchgear
will be examined and eventually repaired at this time and such intervention is not only an act of diagnostic but rather an ultimate act of overhaul/maintenance.
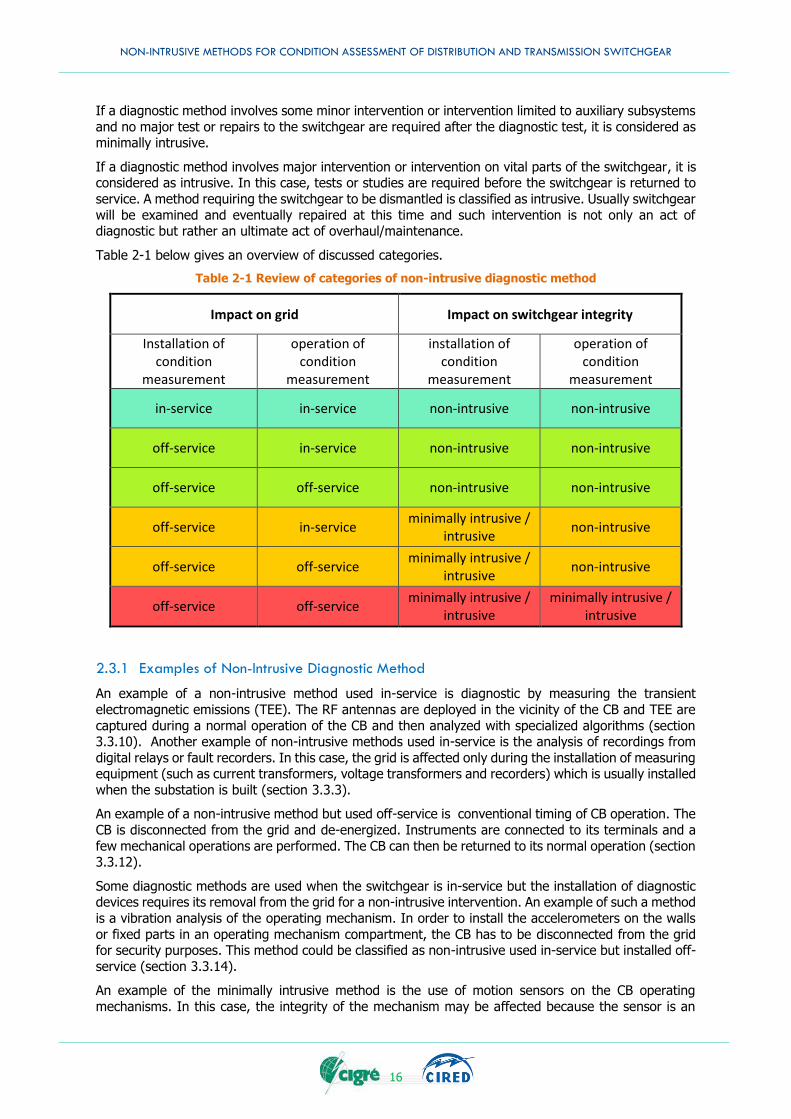
Table 2-1 below gives an overview of discussed categories.
Table 2-1 Review of categories of non-intrusive diagnostic method
Impact on grid Impact on switchgear integrity
Installation of condition
measurement
operation of condition
measurement
installation of condition
measurement
operation of condition
measurement
in-service in-service non-intrusive non-intrusive
off-service in-service non-intrusive non-intrusive
off-service off-service non-intrusive non-intrusive
off-service in-service minimally intrusive /
intrusive non-intrusive
off-service off-service minimally intrusive /
intrusive non-intrusive
off-service off-service minimally intrusive /
intrusive minimally intrusive /
intrusive
2.3.1 Examples of Non-Intrusive Diagnostic Method
An example of a non-intrusive method used in-service is diagnostic by measuring the transient
electromagnetic emissions (TEE). The RF antennas are deployed in the vicinity of the CB and TEE are
captured during a normal operation of the CB and then analyzed with specialized algorithms (section 3.3.10). Another example of non-intrusive methods used in-service is the analysis of recordings from
digital relays or fault recorders. In this case, the grid is affected only during the installation of measuring equipment (such as current transformers, voltage transformers and recorders) which is usually installed
when the substation is built (section 3.3.3).
An example of a non-intrusive method but used off-service is conventional timing of CB operation. The
CB is disconnected from the grid and de-energized. Instruments are connected to its terminals and a
few mechanical operations are performed. The CB can then be returned to its normal operation (section 3.3.12).
Some diagnostic methods are used when the switchgear is in-service but the installation of diagnostic devices requires its removal from the grid for a non-intrusive intervention. An example of such a method
is a vibration analysis of the operating mechanism. In order to install the accelerometers on the walls
or fixed parts in an operating mechanism compartment, the CB has to be disconnected from the grid for security purposes. This method could be classified as non-intrusive used in-service but installed off-
service (section 3.3.14).
An example of the minimally intrusive method is the use of motion sensors on the CB operating
mechanisms. In this case, the integrity of the mechanism may be affected because the sensor is an
NON-INTRUSIVE METHODS FOR CONDITION ASSESSMENT OF DISTRIBUTION AND TRANSMISSION SWITCHGEAR
17
extra part added to the system which may influence moving parts. Moreover, there is a certain risk that
the manipulations themselves may affect the integrity of the operating mechanism. Some tests or analyses are required to ensure that the performance of the operating mechanism is not altered (mass,
inertia, fixations, etc.). However, one agrees that the integrity of a CB as a whole will not be affected. Its electrical performance will remain the same as long as the operating mechanism works well. No
additional tests are required for switching performance (section 3.3.18).
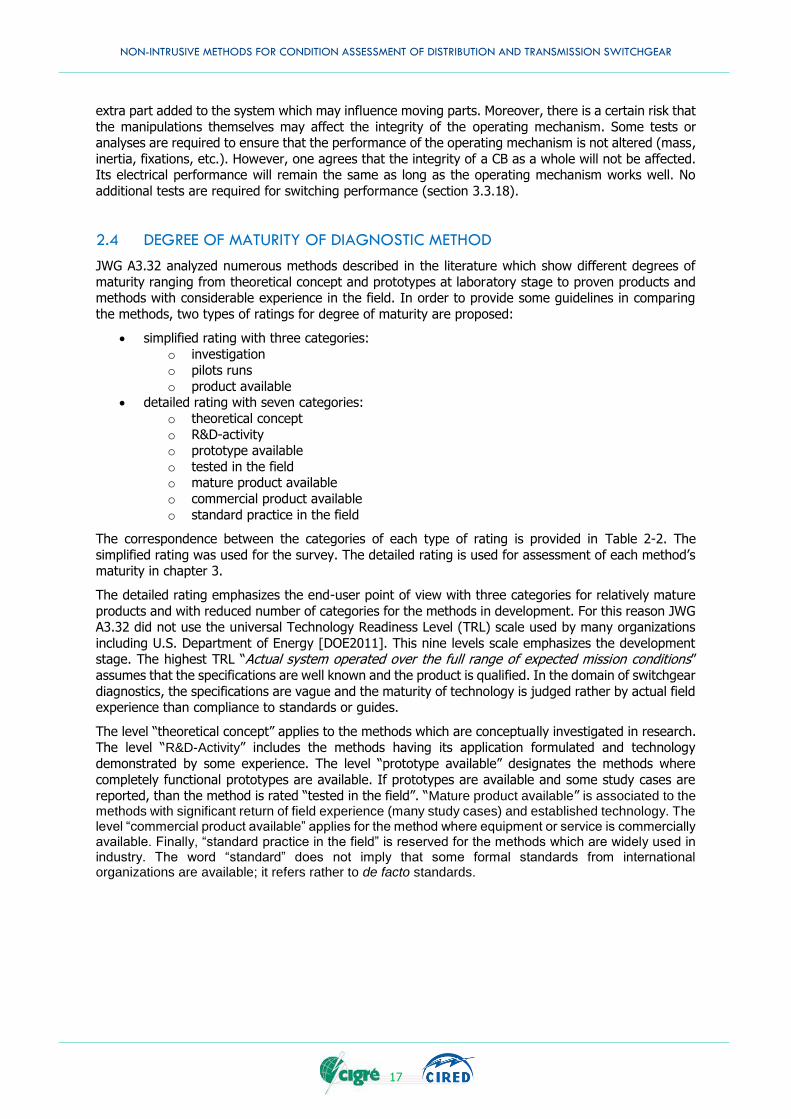
2.4 DEGREE OF MATURITY OF DIAGNOSTIC METHOD
JWG A3.32 analyzed numerous methods described in the literature which show different degrees of
maturity ranging from theoretical concept and prototypes at laboratory stage to proven products and methods with considerable experience in the field. In order to provide some guidelines in comparing
the methods, two types of ratings for degree of maturity are proposed:
simplified rating with three categories:
o investigation
o pilots runs
o product available detailed rating with seven categories:
o theoretical concept
o R&D-activity o prototype available
o tested in the field o mature product available
o commercial product available
o standard practice in the field
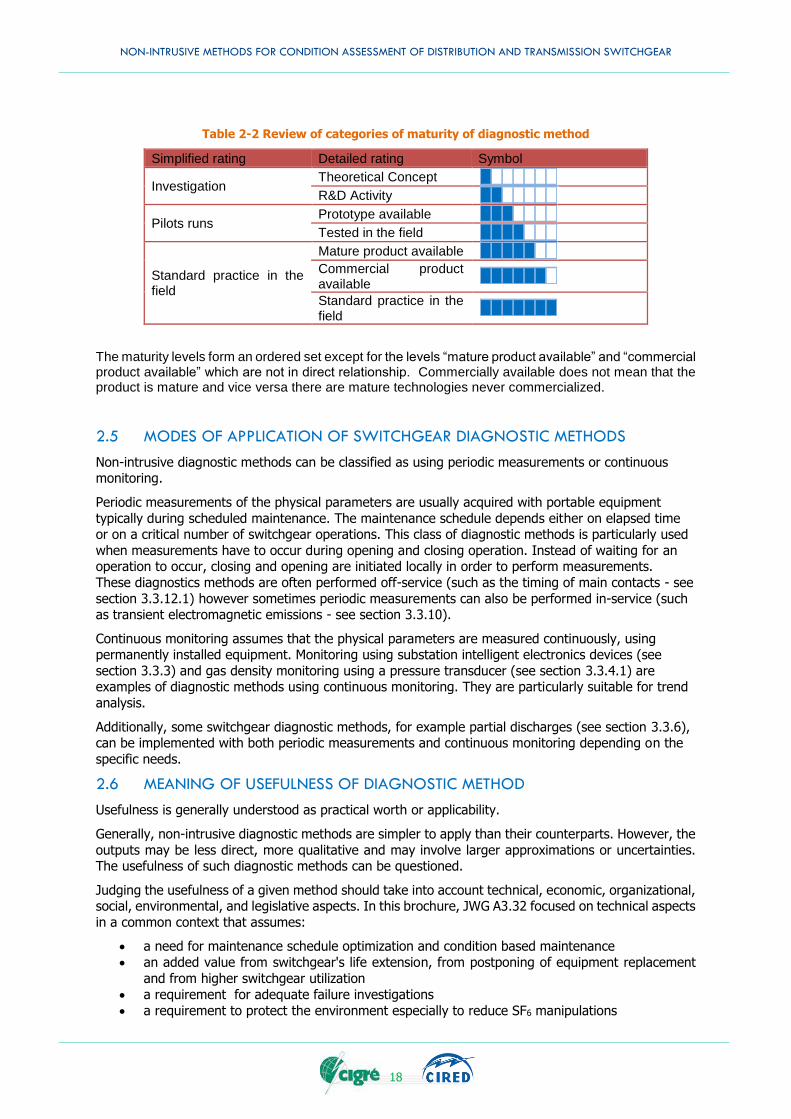
The correspondence between the categories of each type of rating is provided in Table 2-2. The
simplified rating was used for the survey. The detailed rating is used for assessment of each method’s maturity in chapter 3.
The detailed rating emphasizes the end-user point of view with three categories for relatively mature
products and with reduced number of categories for the methods in development. For this reason JWG A3.32 did not use the universal Technology Readiness Level (TRL) scale used by many organizations
including U.S. Department of Energy [DOE2011]. This nine levels scale emphasizes the development stage. The highest TRL “Actual system operated over the full range of expected mission conditions” assumes that the specifications are well known and the product is qualified. In the domain of switchgear
diagnostics, the specifications are vague and the maturity of technology is judged rather by actual field experience than compliance to standards or guides.
The level “theoretical concept” applies to the methods which are conceptually investigated in research. The level “R&D-Activity” includes the methods having its application formulated and technology
demonstrated by some experience. The level “prototype available” designates the methods where
completely functional prototypes are available. If prototypes are available and some study cases are reported, than the method is rated “tested in the field”. “Mature product available” is associated to the methods with significant return of field experience (many study cases) and established technology. The level “commercial product available” applies for the method where equipment or service is commercially available. Finally, “standard practice in the field” is reserved for the methods which are widely used in industry. The word “standard” does not imply that some formal standards from international organizations are available; it refers rather to de facto standards.
NON-INTRUSIVE METHODS FOR CONDITION ASSESSMENT OF DISTRIBUTION AND TRANSMISSION SWITCHGEAR
18
Table 2-2 Review of categories of maturity of diagnostic method
Simplified rating Detailed rating Symbol
Investigation Theoretical Concept
R&D Activity
Pilots runs Prototype available
Tested in the field
Standard practice in the field
Mature product available
Commercial product available
Standard practice in the field
The maturity levels form an ordered set except for the levels “mature product available” and “commercial product available” which are not in direct relationship. Commercially available does not mean that the product is mature and vice versa there are mature technologies never commercialized.
2.5 MODES OF APPLICATION OF SWITCHGEAR DIAGNOSTIC METHODS
Non-intrusive diagnostic methods can be classified as using periodic measurements or continuous monitoring.
Periodic measurements of the physical parameters are usually acquired with portable equipment
typically during scheduled maintenance. The maintenance schedule depends either on elapsed time or on a critical number of switchgear operations. This class of diagnostic methods is particularly used
when measurements have to occur during opening and closing operation. Instead of waiting for an operation to occur, closing and opening are initiated locally in order to perform measurements.
These diagnostics methods are often performed off-service (such as the timing of main contacts - see
section 3.3.12.1) however sometimes periodic measurements can also be performed in-service (such as transient electromagnetic emissions - see section 3.3.10).
Continuous monitoring assumes that the physical parameters are measured continuously, using permanently installed equipment. Monitoring using substation intelligent electronics devices (see
section 3.3.3) and gas density monitoring using a pressure transducer (see section 3.3.4.1) are examples of diagnostic methods using continuous monitoring. They are particularly suitable for trend
analysis.
Additionally, some switchgear diagnostic methods, for example partial discharges (see section 3.3.6), can be implemented with both periodic measurements and continuous monitoring depending on the
specific needs.
2.6 MEANING OF USEFULNESS OF DIAGNOSTIC METHOD
Usefulness is generally understood as practical worth or applicability.
Generally, non-intrusive diagnostic methods are simpler to apply than their counterparts. However, the
outputs may be less direct, more qualitative and may involve larger approximations or uncertainties. The usefulness of such diagnostic methods can be questioned.
Judging the usefulness of a given method should take into account technical, economic, organizational, social, environmental, and legislative aspects. In this brochure, JWG A3.32 focused on technical aspects
in a common context that assumes:
a need for maintenance schedule optimization and condition based maintenance
an added value from switchgear's life extension, from postponing of equipment replacement
and from higher switchgear utilization
a requirement for adequate failure investigations
a requirement to protect the environment especially to reduce SF6 manipulations
NON-INTRUSIVE METHODS FOR CONDITION ASSESSMENT OF DISTRIBUTION AND TRANSMISSION SWITCHGEAR
19
a non-zero tolerance to risk in asset management
In order to establish the usefulness of diagnostic methods, JWG A3.32 recommends that appropriate
cost-benefit analyses be conducted. 'Benefits' of the diagnostic method can be expressed in terms of condition indicators and potential achievable diagnosis. On the other hand, 'costs' encompass the total
expenses, efforts, and risks involved in the elaboration and realization of the diagnostic.
Many condition indicators are commonly used for switchgear diagnosis (Table 5-1). However, often the
outcome of a non-intrusive diagnostic method may be expressed in some other form, with, possibly,
less accuracy and certitude. In such cases, a higher tolerance to risk is required to decide on maintenance, repair or replacement of the switchgear. Even when applying the finest intrusive sensors
or when proceeding with direct inspections, total guarantee that failures won't happen is not possible; a risk of zero does not exist. Without a doubt, a lack of accuracy may increase the risk of a wrong
diagnosis of the switchgear’s condition. However, the final decisions are often taken on the basis of other inputs and the overall risk of a wrong decision may not increase as much. Nevertheless, this
increase in risk should be separately analyzed for every particular scenario involving a given diagnostic
method, particular switchgear, and its duty in the grid.
The 'benefit' of a given diagnostic method can also be evaluated with appropriate statistical models and
failure mode analysis as discussed in Chapter 5.
Evaluating the 'cost' of a diagnostic method is much more direct. Each utility may consider different
levels of detail, but the evaluation should at least consider the following:
direct charges (instruments, sensors, software, licenses, labor, professional services, etc.)
costs of implementation - how the results fit the organization decision process and the review
of maintenance policies cost of an outage (for off-service diagnostic methods)
costs related to environmental considerations or risks (SF6 or oil leaks, …)
costs related to damaging the switchgear (for intrusive methods requiring dismantling)
costs related to results interpretation (supplementary expertise or software)
Generally, one would expect a non-intrusive method to be less costly than an equal-benefits intrusive
method.
2.7 SUMMARY
General terms such as switchgear condition, diagnostic method, condition measurement, condition
indicators and diagnoses have been discussed. The latter is considered as the end use of the diagnostic process.
The definition of non-intrusive diagnostics is explained in detail and the maturity levels as well as
application modes of a diagnostic method are introduced. These terms are used widely in Chapter 3.
Finally, the approach for evaluating the usefulness of non-intrusive diagnostic methods as a cost-benefit
analysis is introduced and is further developed in Chapter 5.

NON-INTRUSIVE METHODS FOR CONDITION ASSESSMENT OF DISTRIBUTION AND TRANSMISSION SWITCHGEAR
20
NON-INTRUSIVE METHODS FOR CONDITION ASSESSMENT OF DISTRIBUTION AND TRANSMISSION SWITCHGEAR
21
3. CONDITION ASSESSMENT METHODS IN SWITCHGEAR
3.1 INTRODUCTION
Among the large variety of condition assessment methods for switchgear, which are dealt with in
technical and scientific publications, this technical brochure (TB) mainly focusses on those methods considered “non-intrusive” with respect to the integrity of the device according to the definition given
in Chapter 2. These methods are addressed in great detail in this chapter. Additionally, further methods categorized “minimally intrusive” are covered to a certain extent. Each method is analyzed regarding
its technical background, experience, maturity and its value for condition assessment.
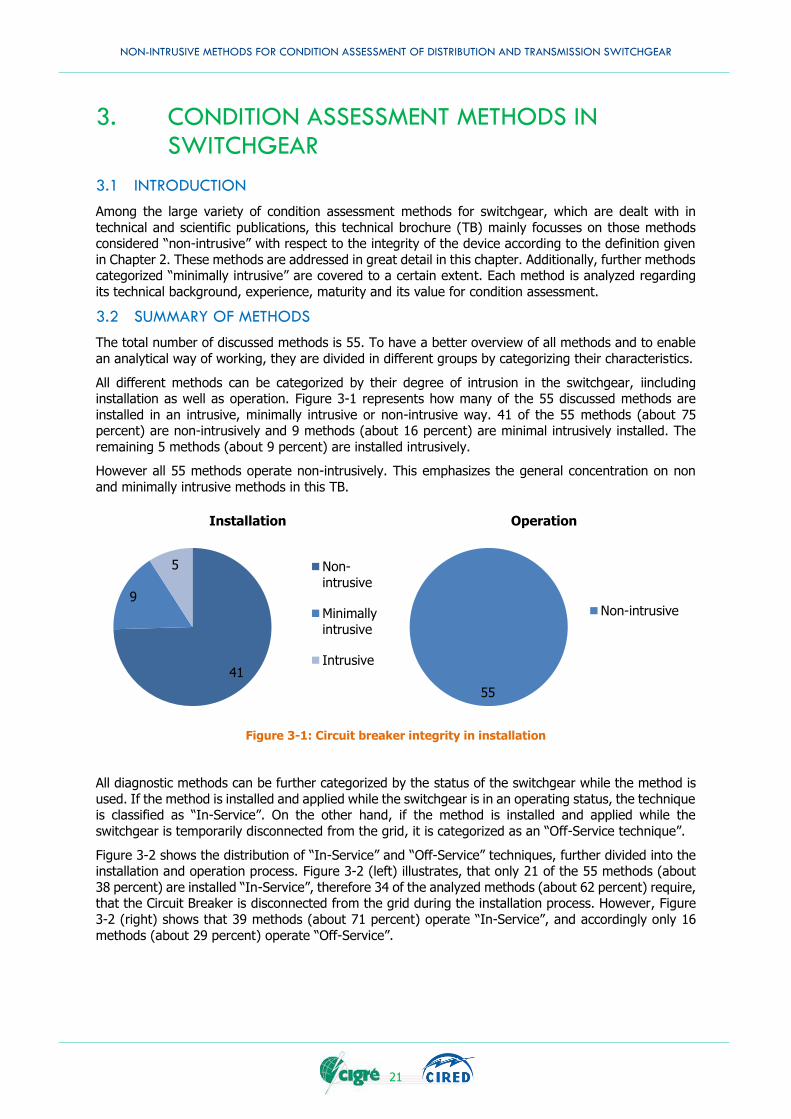
3.2 SUMMARY OF METHODS
The total number of discussed methods is 55. To have a better overview of all methods and to enable
an analytical way of working, they are divided in different groups by categorizing their characteristics.
All different methods can be categorized by their degree of intrusion in the switchgear, iincluding installation as well as operation. Figure 3-1 represents how many of the 55 discussed methods are
installed in an intrusive, minimally intrusive or non-intrusive way. 41 of the 55 methods (about 75 percent) are non-intrusively and 9 methods (about 16 percent) are minimal intrusively installed. The
remaining 5 methods (about 9 percent) are installed intrusively.
However all 55 methods operate non-intrusively. This emphasizes the general concentration on non
and minimally intrusive methods in this TB.
Figure 3-1: Circuit breaker integrity in installation
All diagnostic methods can be further categorized by the status of the switchgear while the method is
used. If the method is installed and applied while the switchgear is in an operating status, the technique is classified as “In-Service”. On the other hand, if the method is installed and applied while the
switchgear is temporarily disconnected from the grid, it is categorized as an “Off-Service technique”.
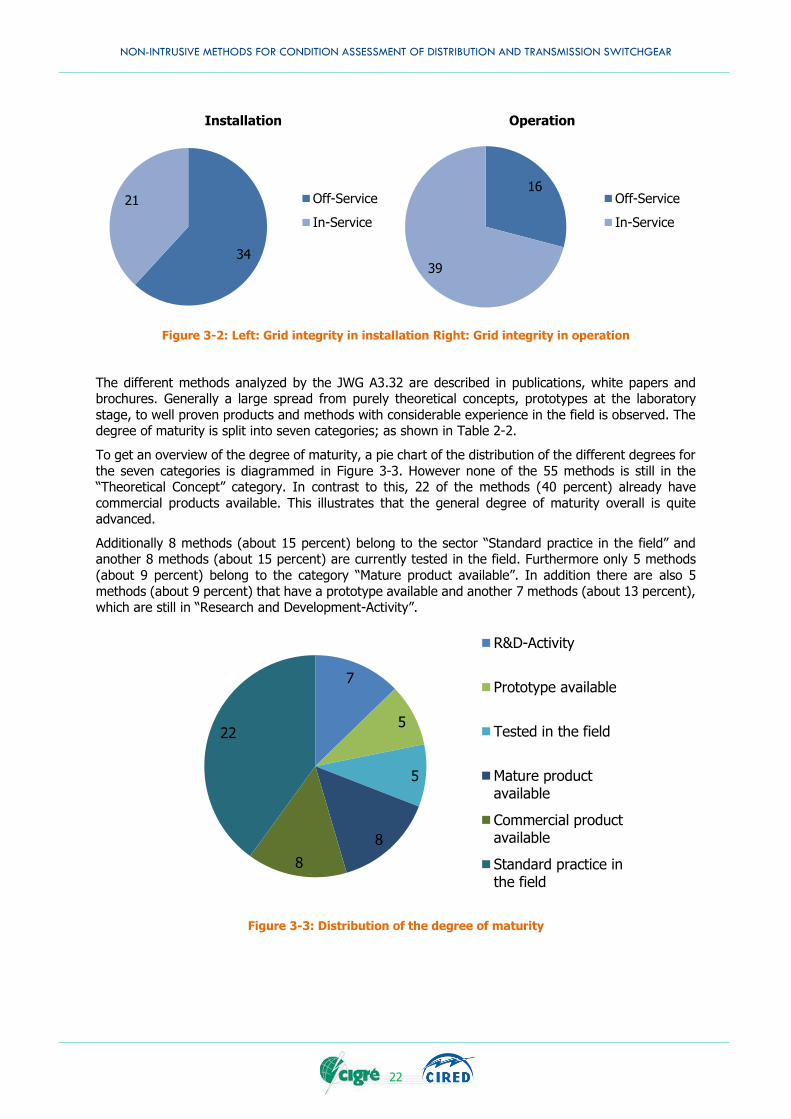
Figure 3-2 shows the distribution of “In-Service” and “Off-Service” techniques, further divided into the installation and operation process. Figure 3-2 (left) illustrates, that only 21 of the 55 methods (about
38 percent) are installed “In-Service”, therefore 34 of the analyzed methods (about 62 percent) require, that the Circuit Breaker is disconnected from the grid during the installation process. However, Figure
3-2 (right) shows that 39 methods (about 71 percent) operate “In-Service”, and accordingly only 16
methods (about 29 percent) operate “Off-Service”.
41
9
5
Installation
Non-intrusive
Minimallyintrusive
Intrusive
55
Operation
Non-intrusive
NON-INTRUSIVE METHODS FOR CONDITION ASSESSMENT OF DISTRIBUTION AND TRANSMISSION SWITCHGEAR
22
Figure 3-2: Left: Grid integrity in installation Right: Grid integrity in operation
The different methods analyzed by the JWG A3.32 are described in publications, white papers and brochures. Generally a large spread from purely theoretical concepts, prototypes at the laboratory
stage, to well proven products and methods with considerable experience in the field is observed. The degree of maturity is split into seven categories; as shown in Table 2-2.
To get an overview of the degree of maturity, a pie chart of the distribution of the different degrees for
the seven categories is diagrammed in Figure 3-3. However none of the 55 methods is still in the “Theoretical Concept” category. In contrast to this, 22 of the methods (40 percent) already have
commercial products available. This illustrates that the general degree of maturity overall is quite advanced.
Additionally 8 methods (about 15 percent) belong to the sector “Standard practice in the field” and another 8 methods (about 15 percent) are currently tested in the field. Furthermore only 5 methods
(about 9 percent) belong to the category “Mature product available”. In addition there are also 5
methods (about 9 percent) that have a prototype available and another 7 methods (about 13 percent), which are still in “Research and Development-Activity”.
Figure 3-3: Distribution of the degree of maturity
34
21
Installation
Off-Service
In-Service
16
39
Operation
Off-Service
In-Service
7
5
5
8
8
22
R&D-Activity
Prototype available
Tested in the field
Mature productavailable
Commercial productavailable
Standard practice inthe field
NON-INTRUSIVE METHODS FOR CONDITION ASSESSMENT OF DISTRIBUTION AND TRANSMISSION SWITCHGEAR
23
3.3 DETAILED DESCRIPTION OF THE METHODS
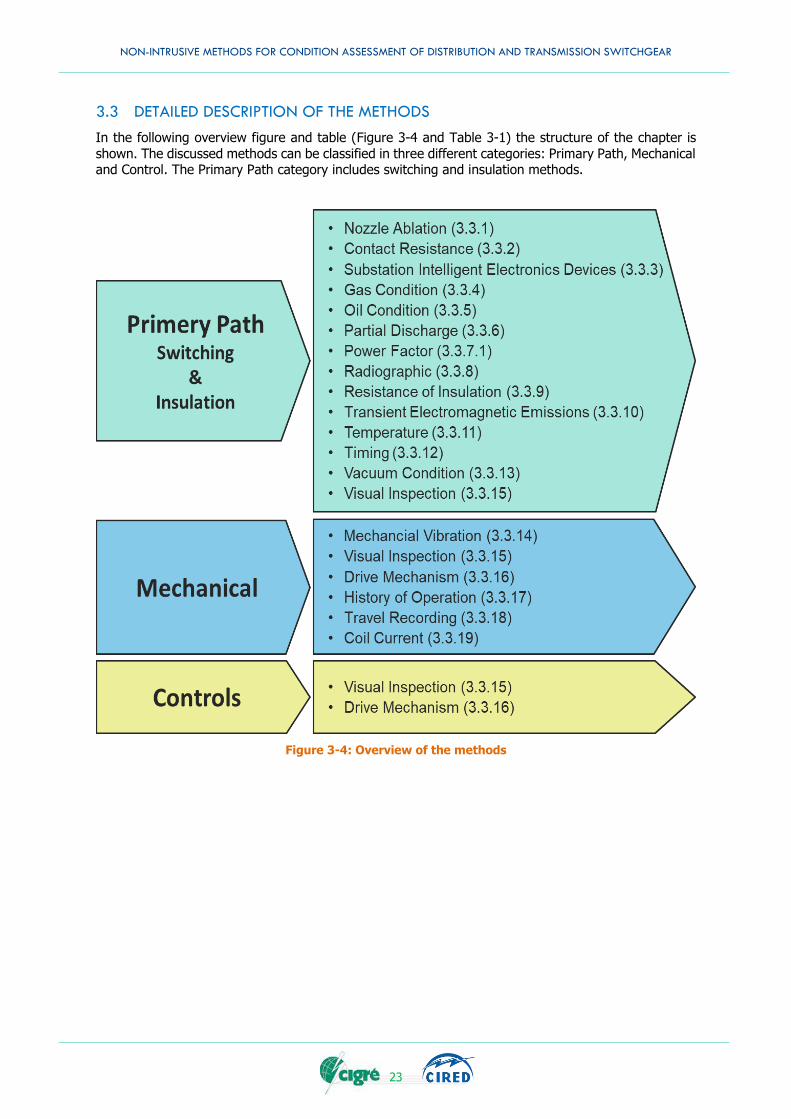
In the following overview figure and table (Figure 3-4 and Table 3-1) the structure of the chapter is
shown. The discussed methods can be classified in three different categories: Primary Path, Mechanical and Control. The Primary Path category includes switching and insulation methods.
Figure 3-4: Overview of the methods
NON-INTRUSIVE METHODS FOR CONDITION ASSESSMENT OF DISTRIBUTION AND TRANSMISSION SWITCHGEAR
24
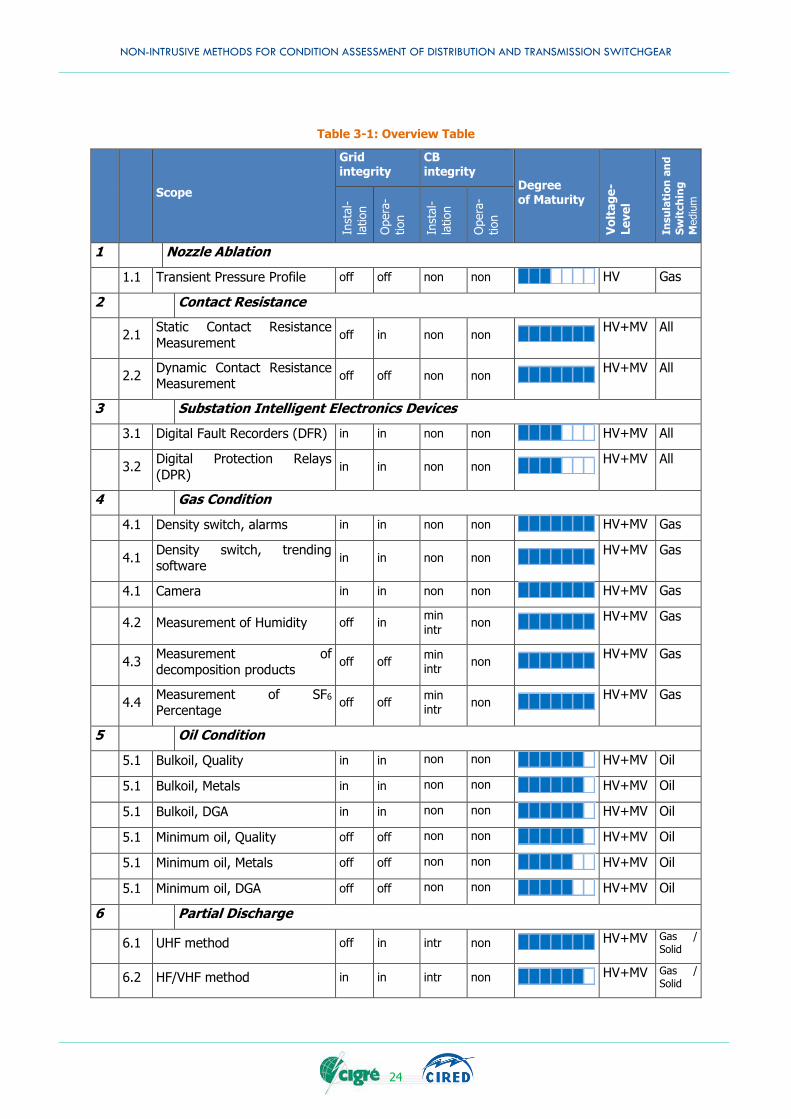
Table 3-1: Overview Table
Scope
Grid integrity
CB integrity
Degree of Maturity
Vo
lta
ge
-
Le
ve
l
Insu
lati
on
an
d
Sw
itch
ing
Mediu
m
Inst
al-
lation
Opera
-
tion
Inst
al-
lation
Opera
-
tion
1 Nozzle Ablation
1.1 Transient Pressure Profile off off non non HV Gas
2 Contact Resistance
2.1 Static Contact Resistance
Measurement off in non non
HV+MV All
2.2 Dynamic Contact Resistance Measurement
off off non non HV+MV All
3 Substation Intelligent Electronics Devices
3.1 Digital Fault Recorders (DFR) in in non non HV+MV All
3.2 Digital Protection Relays
(DPR) in in non non
HV+MV All
4 Gas Condition
4.1 Density switch, alarms in in non non HV+MV Gas
4.1 Density switch, trending software
in in non non HV+MV Gas
4.1 Camera in in non non HV+MV Gas
4.2 Measurement of Humidity off in min intr
non HV+MV Gas
4.3 Measurement of decomposition products
off off min intr
non HV+MV Gas
4.4 Measurement of SF6
Percentage off off
min intr
non HV+MV Gas
5 Oil Condition
5.1 Bulkoil, Quality in in non non HV+MV Oil
5.1 Bulkoil, Metals in in non non HV+MV Oil
5.1 Bulkoil, DGA in in non non HV+MV Oil
5.1 Minimum oil, Quality off off non non HV+MV Oil
5.1 Minimum oil, Metals off off non non HV+MV Oil
5.1 Minimum oil, DGA off off non non HV+MV Oil
6 Partial Discharge
6.1 UHF method off in intr non HV+MV Gas /
Solid
6.2 HF/VHF method in in intr non HV+MV Gas /
Solid
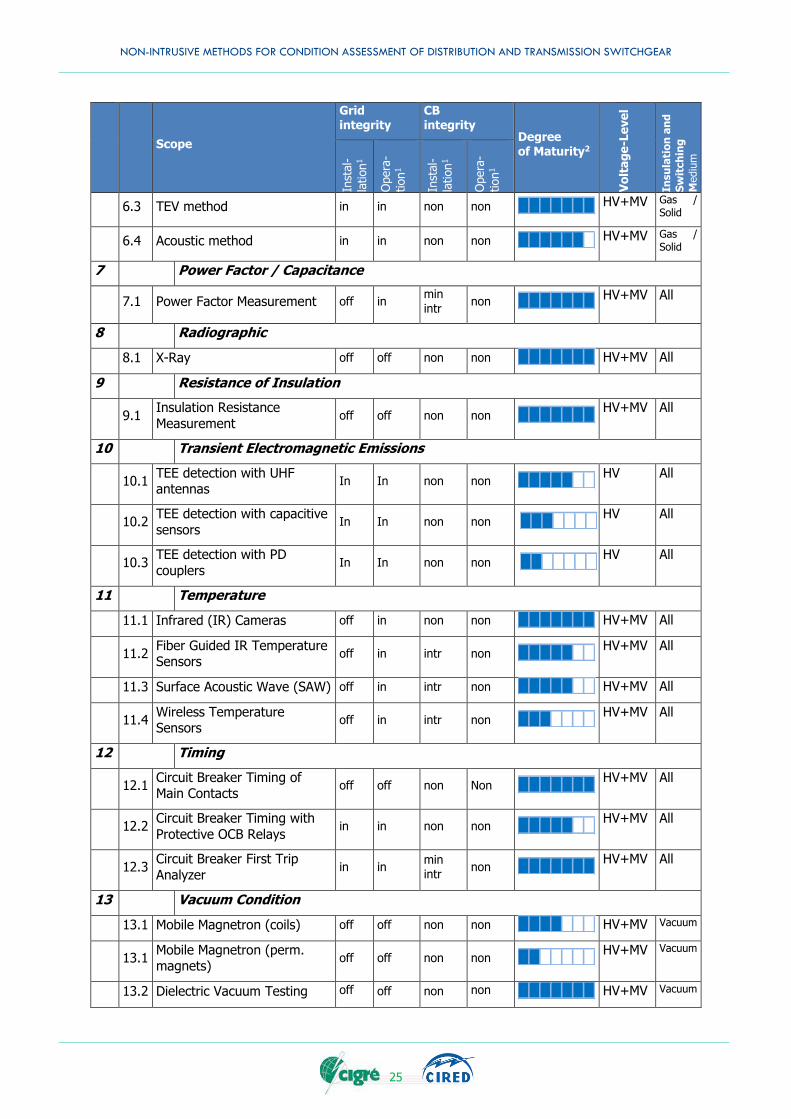
NON-INTRUSIVE METHODS FOR CONDITION ASSESSMENT OF DISTRIBUTION AND TRANSMISSION SWITCHGEAR
25
Scope
Grid integrity
CB integrity
Degree of Maturity2
Vo
lta
ge
-Le
ve
l
Insu
lati
on
an
d
Sw
itch
ing
Mediu
m
Inst
al-
lation
1
Opera
-
tion
1
Inst
al-
lation
1
Opera
-
tion
1
6.3 TEV method in in non non HV+MV Gas /
Solid
6.4 Acoustic method in in non non HV+MV Gas /
Solid
7 Power Factor / Capacitance
7.1 Power Factor Measurement off in min intr
non HV+MV All
8 Radiographic
8.1 X-Ray off off non non HV+MV All
9 Resistance of Insulation
9.1 Insulation Resistance
Measurement off off non non
HV+MV All
10 Transient Electromagnetic Emissions
10.1 TEE detection with UHF antennas
In In non non HV All
10.2 TEE detection with capacitive
sensors In In non non
HV All
10.3 TEE detection with PD
couplers In In non non
HV All
11 Temperature
11.1 Infrared (IR) Cameras off in non non HV+MV All
11.2 Fiber Guided IR Temperature Sensors
off in intr non HV+MV All
11.3 Surface Acoustic Wave (SAW) off in intr non HV+MV All
11.4 Wireless Temperature Sensors
off in intr non HV+MV All
12 Timing
12.1 Circuit Breaker Timing of Main Contacts
off off non Non HV+MV All
12.2 Circuit Breaker Timing with
Protective OCB Relays in in non non
HV+MV All
12.3 Circuit Breaker First Trip
Analyzer in in
min intr
non HV+MV All
13 Vacuum Condition
13.1 Mobile Magnetron (coils) off off non non HV+MV Vacuum
13.1 Mobile Magnetron (perm. magnets)
off off non non HV+MV Vacuum
13.2 Dielectric Vacuum Testing off off non non HV+MV Vacuum
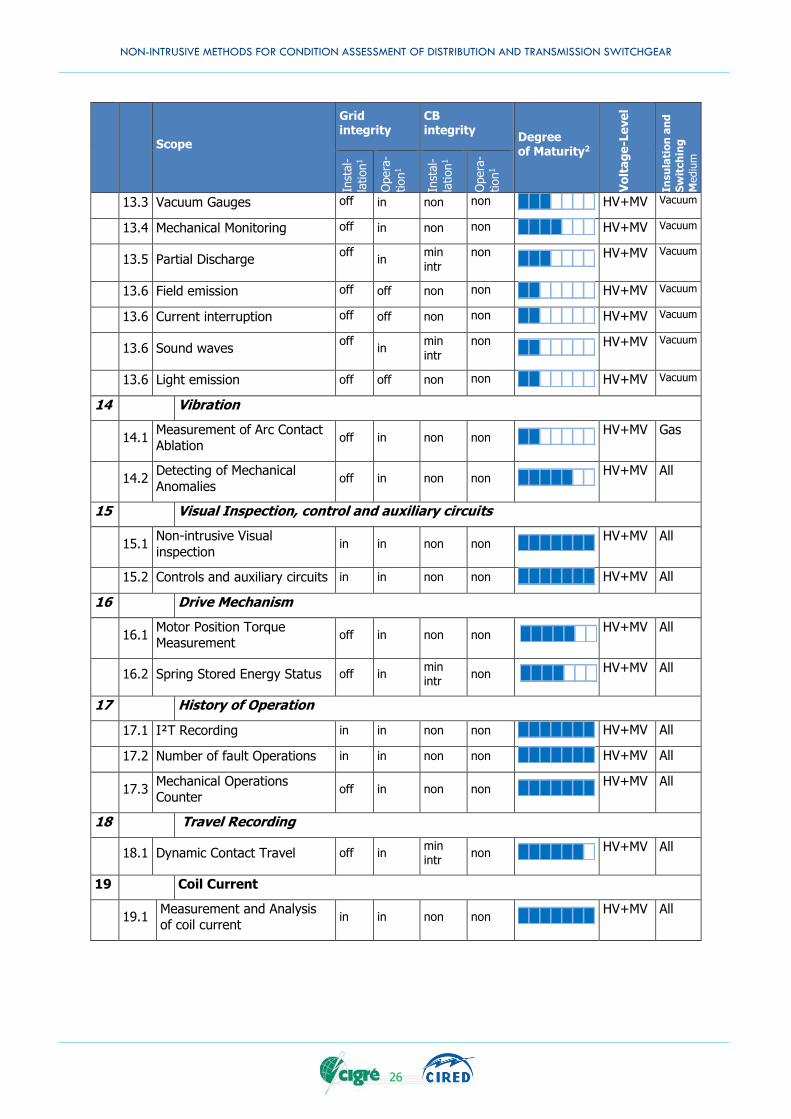
NON-INTRUSIVE METHODS FOR CONDITION ASSESSMENT OF DISTRIBUTION AND TRANSMISSION SWITCHGEAR
26
Scope
Grid integrity
CB integrity
Degree of Maturity2
Vo
lta
ge
-Le
ve
l
Insu
lati
on
an
d
Sw
itch
ing
Mediu
m
Inst
al-
lation
1
Opera
-
tion
1
Inst
al-
lation
1
Opera
-
tion
1
13.3 Vacuum Gauges off in non non HV+MV Vacuum
13.4 Mechanical Monitoring off in non non HV+MV Vacuum
13.5 Partial Discharge off
in min intr
non HV+MV Vacuum
13.6 Field emission off off non non HV+MV Vacuum
13.6 Current interruption off off non non HV+MV Vacuum
13.6 Sound waves off
in min intr
non HV+MV Vacuum
13.6 Light emission off off non non HV+MV Vacuum
14 Vibration
14.1 Measurement of Arc Contact Ablation
off in non non HV+MV Gas
14.2 Detecting of Mechanical
Anomalies off in non non
HV+MV All
15 Visual Inspection, control and auxiliary circuits
15.1 Non-intrusive Visual
inspection in in non non
HV+MV All
15.2 Controls and auxiliary circuits in in non non HV+MV All
16 Drive Mechanism
16.1 Motor Position Torque Measurement
off in non non HV+MV All
16.2 Spring Stored Energy Status off in min intr
non HV+MV All
17 History of Operation
17.1 I²T Recording in in non non HV+MV All
17.2 Number of fault Operations in in non non HV+MV All
17.3 Mechanical Operations Counter
off in non non HV+MV All
18 Travel Recording
18.1 Dynamic Contact Travel off in min intr
non HV+MV All
19 Coil Current
19.1 Measurement and Analysis of coil current
in in non non HV+MV All
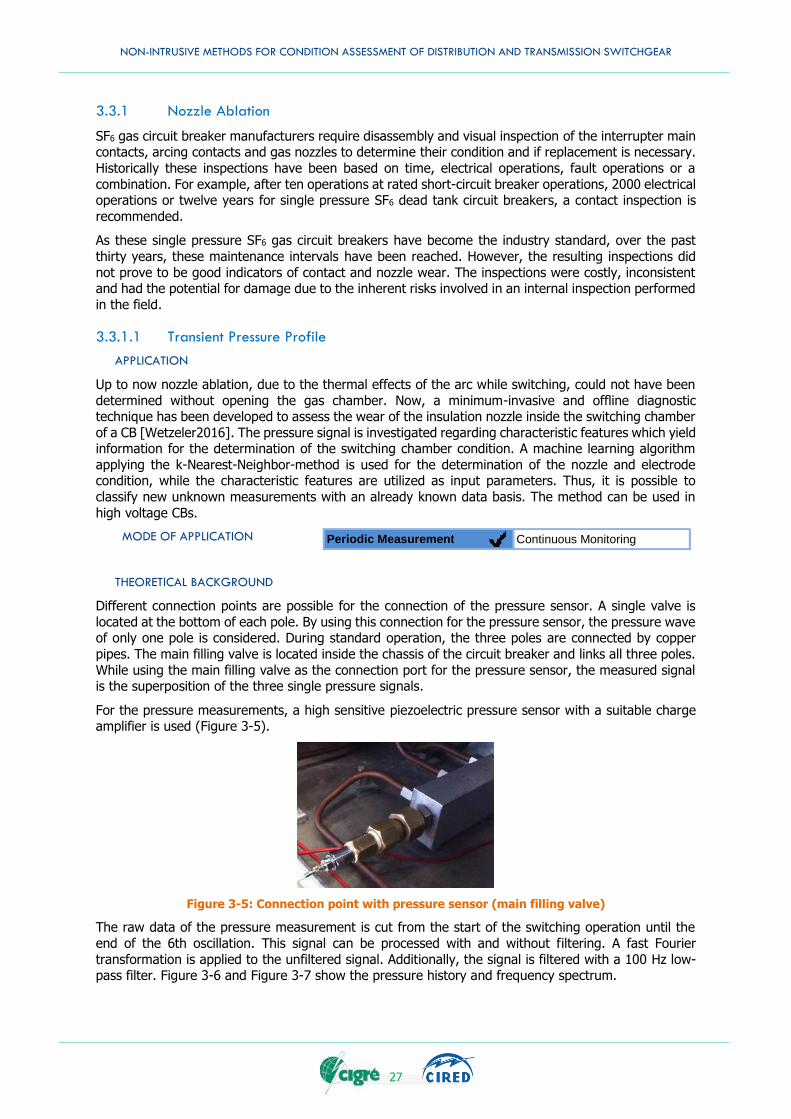
NON-INTRUSIVE METHODS FOR CONDITION ASSESSMENT OF DISTRIBUTION AND TRANSMISSION SWITCHGEAR
27
3.3.1 Nozzle Ablation
SF6 gas circuit breaker manufacturers require disassembly and visual inspection of the interrupter main contacts, arcing contacts and gas nozzles to determine their condition and if replacement is necessary.
Historically these inspections have been based on time, electrical operations, fault operations or a
combination. For example, after ten operations at rated short-circuit breaker operations, 2000 electrical operations or twelve years for single pressure SF6 dead tank circuit breakers, a contact inspection is
recommended.
As these single pressure SF6 gas circuit breakers have become the industry standard, over the past
thirty years, these maintenance intervals have been reached. However, the resulting inspections did
not prove to be good indicators of contact and nozzle wear. The inspections were costly, inconsistent and had the potential for damage due to the inherent risks involved in an internal inspection performed
in the field.
3.3.1.1 Transient Pressure Profile
APPLICATION
Up to now nozzle ablation, due to the thermal effects of the arc while switching, could not have been
determined without opening the gas chamber. Now, a minimum-invasive and offline diagnostic technique has been developed to assess the wear of the insulation nozzle inside the switching chamber
of a CB [Wetzeler2016]. The pressure signal is investigated regarding characteristic features which yield information for the determination of the switching chamber condition. A machine learning algorithm
applying the k-Nearest-Neighbor-method is used for the determination of the nozzle and electrode condition, while the characteristic features are utilized as input parameters. Thus, it is possible to
classify new unknown measurements with an already known data basis. The method can be used in
high voltage CBs.
MODE OF APPLICATION
THEORETICAL BACKGROUND
Different connection points are possible for the connection of the pressure sensor. A single valve is
located at the bottom of each pole. By using this connection for the pressure sensor, the pressure wave of only one pole is considered. During standard operation, the three poles are connected by copper
pipes. The main filling valve is located inside the chassis of the circuit breaker and links all three poles.
While using the main filling valve as the connection port for the pressure sensor, the measured signal is the superposition of the three single pressure signals.
For the pressure measurements, a high sensitive piezoelectric pressure sensor with a suitable charge amplifier is used (Figure 3-5).
Figure 3-5: Connection point with pressure sensor (main filling valve)
The raw data of the pressure measurement is cut from the start of the switching operation until the
end of the 6th oscillation. This signal can be processed with and without filtering. A fast Fourier
transformation is applied to the unfiltered signal. Additionally, the signal is filtered with a 100 Hz low-pass filter. Figure 3-6 and Figure 3-7 show the pressure history and frequency spectrum.
Periodic Measurement Continuous Monitoring
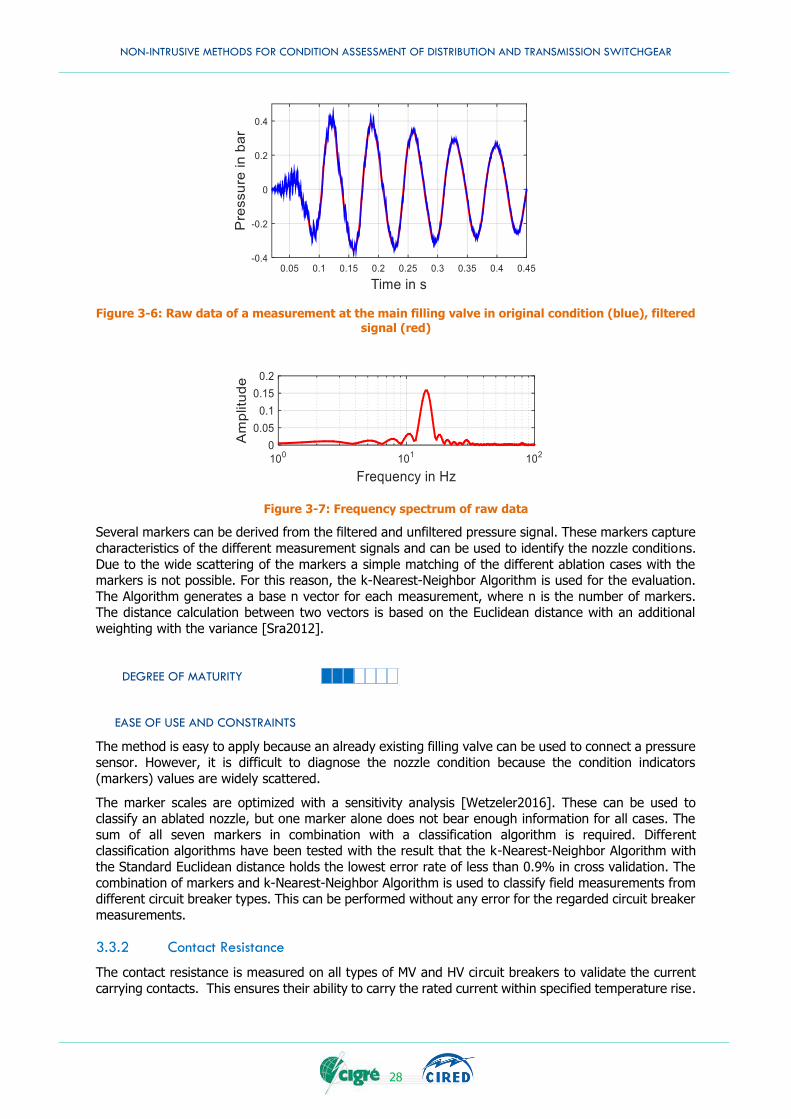
NON-INTRUSIVE METHODS FOR CONDITION ASSESSMENT OF DISTRIBUTION AND TRANSMISSION SWITCHGEAR
28
Figure 3-6: Raw data of a measurement at the main filling valve in original condition (blue), filtered
signal (red)
Figure 3-7: Frequency spectrum of raw data
Several markers can be derived from the filtered and unfiltered pressure signal. These markers capture
characteristics of the different measurement signals and can be used to identify the nozzle conditions.
Due to the wide scattering of the markers a simple matching of the different ablation cases with the markers is not possible. For this reason, the k-Nearest-Neighbor Algorithm is used for the evaluation.
The Algorithm generates a base n vector for each measurement, where n is the number of markers. The distance calculation between two vectors is based on the Euclidean distance with an additional
weighting with the variance [Sra2012].
DEGREE OF MATURITY
EASE OF USE AND CONSTRAINTS
The method is easy to apply because an already existing filling valve can be used to connect a pressure sensor. However, it is difficult to diagnose the nozzle condition because the condition indicators
(markers) values are widely scattered.
The marker scales are optimized with a sensitivity analysis [Wetzeler2016]. These can be used to classify an ablated nozzle, but one marker alone does not bear enough information for all cases. The
sum of all seven markers in combination with a classification algorithm is required. Different classification algorithms have been tested with the result that the k-Nearest-Neighbor Algorithm with
the Standard Euclidean distance holds the lowest error rate of less than 0.9% in cross validation. The
combination of markers and k-Nearest-Neighbor Algorithm is used to classify field measurements from different circuit breaker types. This can be performed without any error for the regarded circuit breaker
measurements.
3.3.2 Contact Resistance
The contact resistance is measured on all types of MV and HV circuit breakers to validate the current
carrying contacts. This ensures their ability to carry the rated current within specified temperature rise.
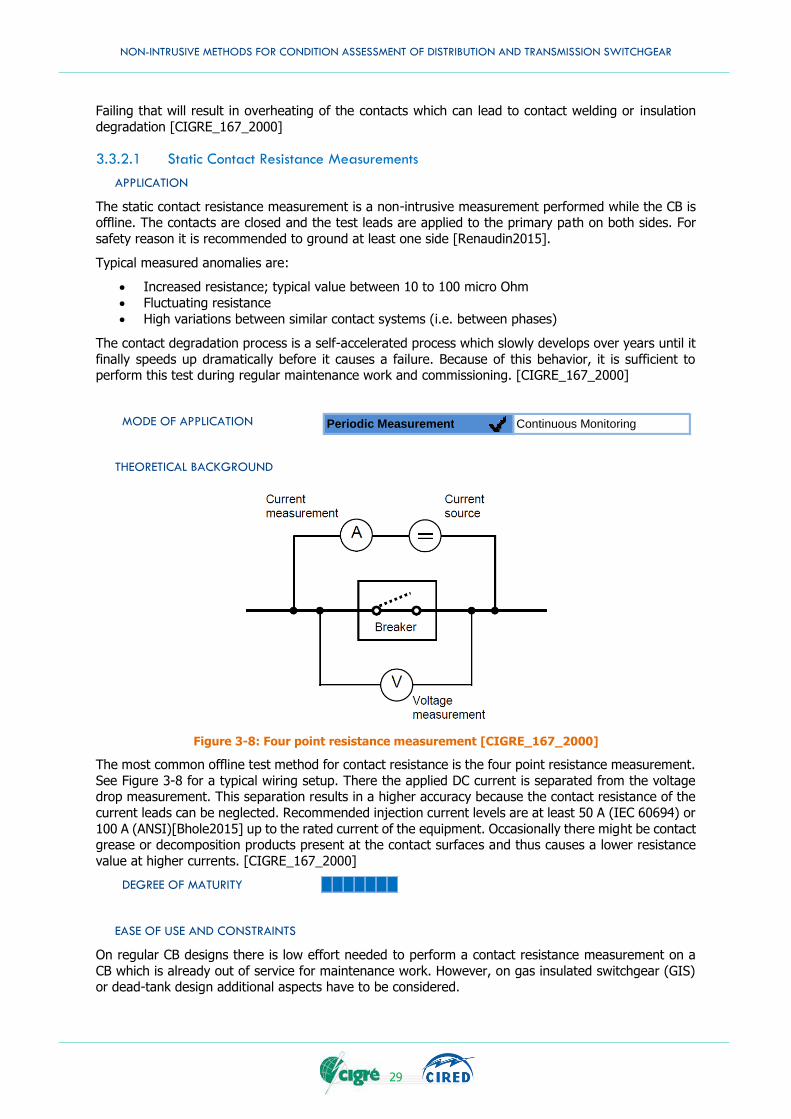
NON-INTRUSIVE METHODS FOR CONDITION ASSESSMENT OF DISTRIBUTION AND TRANSMISSION SWITCHGEAR
29
Failing that will result in overheating of the contacts which can lead to contact welding or insulation
degradation [CIGRE_167_2000]
3.3.2.1 Static Contact Resistance Measurements
APPLICATION
The static contact resistance measurement is a non-intrusive measurement performed while the CB is offline. The contacts are closed and the test leads are applied to the primary path on both sides. For
safety reason it is recommended to ground at least one side [Renaudin2015].
Typical measured anomalies are:
Increased resistance; typical value between 10 to 100 micro Ohm
Fluctuating resistance
High variations between similar contact systems (i.e. between phases)
The contact degradation process is a self-accelerated process which slowly develops over years until it
finally speeds up dramatically before it causes a failure. Because of this behavior, it is sufficient to perform this test during regular maintenance work and commissioning. [CIGRE_167_2000]
MODE OF APPLICATION
THEORETICAL BACKGROUND
Figure 3-8: Four point resistance measurement [CIGRE_167_2000]
The most common offline test method for contact resistance is the four point resistance measurement.
See Figure 3-8 for a typical wiring setup. There the applied DC current is separated from the voltage drop measurement. This separation results in a higher accuracy because the contact resistance of the
current leads can be neglected. Recommended injection current levels are at least 50 A (IEC 60694) or
100 A (ANSI)[Bhole2015] up to the rated current of the equipment. Occasionally there might be contact grease or decomposition products present at the contact surfaces and thus causes a lower resistance
value at higher currents. [CIGRE_167_2000]
DEGREE OF MATURITY
EASE OF USE AND CONSTRAINTS
On regular CB designs there is low effort needed to perform a contact resistance measurement on a
CB which is already out of service for maintenance work. However, on gas insulated switchgear (GIS) or dead-tank design additional aspects have to be considered.
Periodic Measurement Continuous Monitoring
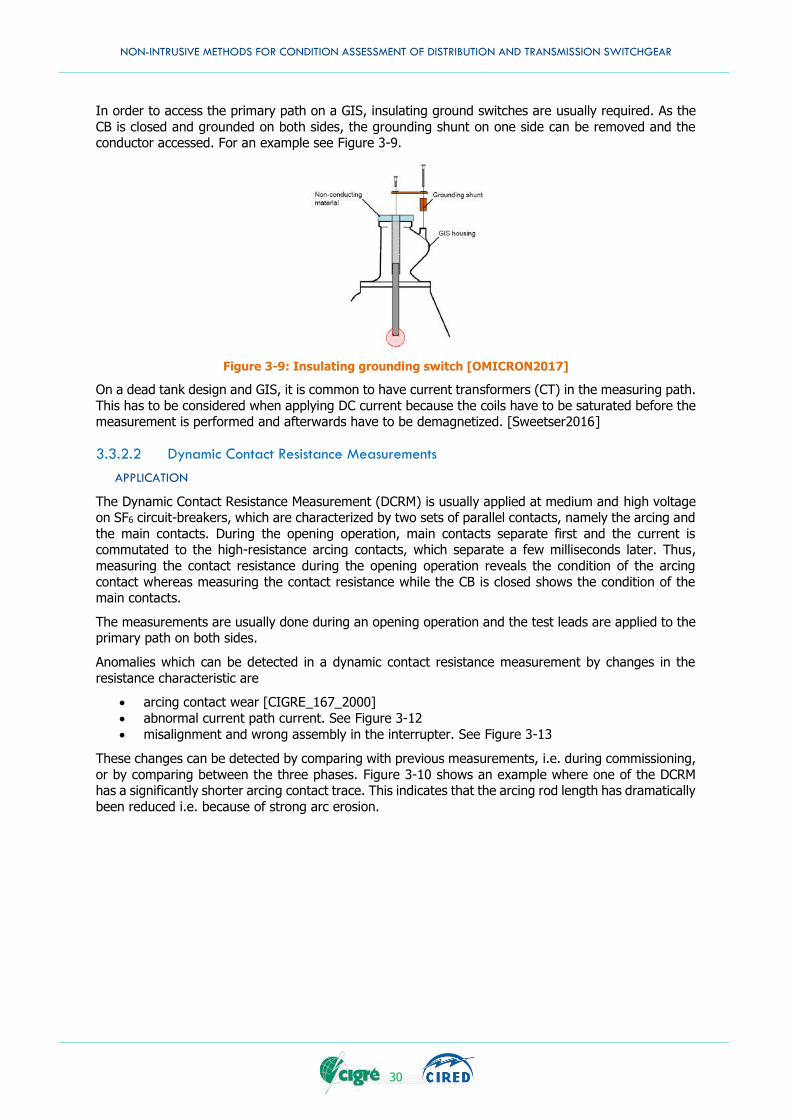
NON-INTRUSIVE METHODS FOR CONDITION ASSESSMENT OF DISTRIBUTION AND TRANSMISSION SWITCHGEAR
30
In order to access the primary path on a GIS, insulating ground switches are usually required. As the
CB is closed and grounded on both sides, the grounding shunt on one side can be removed and the conductor accessed. For an example see Figure 3-9.
Figure 3-9: Insulating grounding switch [OMICRON2017]
On a dead tank design and GIS, it is common to have current transformers (CT) in the measuring path.
This has to be considered when applying DC current because the coils have to be saturated before the measurement is performed and afterwards have to be demagnetized. [Sweetser2016]
3.3.2.2 Dynamic Contact Resistance Measurements
APPLICATION
The Dynamic Contact Resistance Measurement (DCRM) is usually applied at medium and high voltage on SF6 circuit-breakers, which are characterized by two sets of parallel contacts, namely the arcing and
the main contacts. During the opening operation, main contacts separate first and the current is commutated to the high-resistance arcing contacts, which separate a few milliseconds later. Thus,
measuring the contact resistance during the opening operation reveals the condition of the arcing
contact whereas measuring the contact resistance while the CB is closed shows the condition of the main contacts.
The measurements are usually done during an opening operation and the test leads are applied to the primary path on both sides.
Anomalies which can be detected in a dynamic contact resistance measurement by changes in the
resistance characteristic are
arcing contact wear [CIGRE_167_2000]
abnormal current path current. See Figure 3-12
misalignment and wrong assembly in the interrupter. See Figure 3-13
These changes can be detected by comparing with previous measurements, i.e. during commissioning,
or by comparing between the three phases. Figure 3-10 shows an example where one of the DCRM has a significantly shorter arcing contact trace. This indicates that the arcing rod length has dramatically
been reduced i.e. because of strong arc erosion.
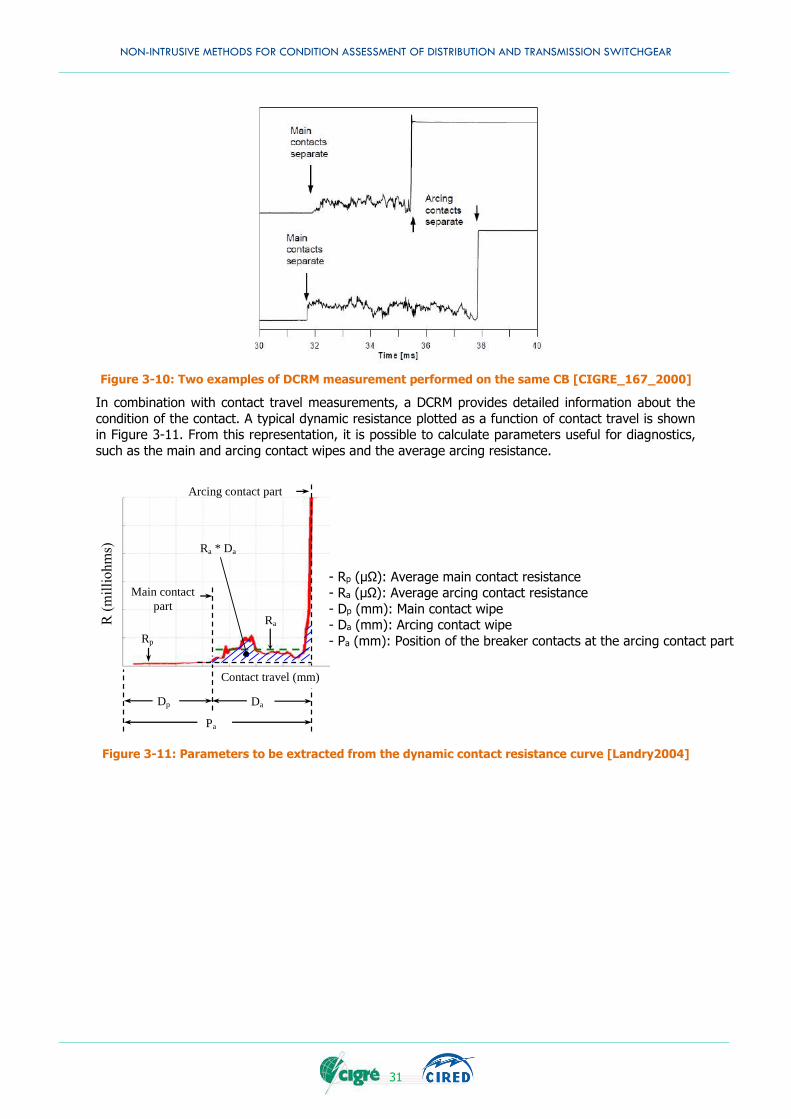
NON-INTRUSIVE METHODS FOR CONDITION ASSESSMENT OF DISTRIBUTION AND TRANSMISSION SWITCHGEAR
31
Figure 3-10: Two examples of DCRM measurement performed on the same CB [CIGRE_167_2000]
In combination with contact travel measurements, a DCRM provides detailed information about the
condition of the contact. A typical dynamic resistance plotted as a function of contact travel is shown in Figure 3-11. From this representation, it is possible to calculate parameters useful for diagnostics,
such as the main and arcing contact wipes and the average arcing resistance.
Figure 3-11: Parameters to be extracted from the dynamic contact resistance curve [Landry2004]
Contact travel (mm)
Arcing contact part
Main contact
part
Ra
Ra * Da
Rp
Da
Pa
Dp
R (
mil
liohm
s)
- Rp (μΩ): Average main contact resistance - Ra (μΩ): Average arcing contact resistance
- Dp (mm): Main contact wipe - Da (mm): Arcing contact wipe
- Pa (mm): Position of the breaker contacts at the arcing contact part
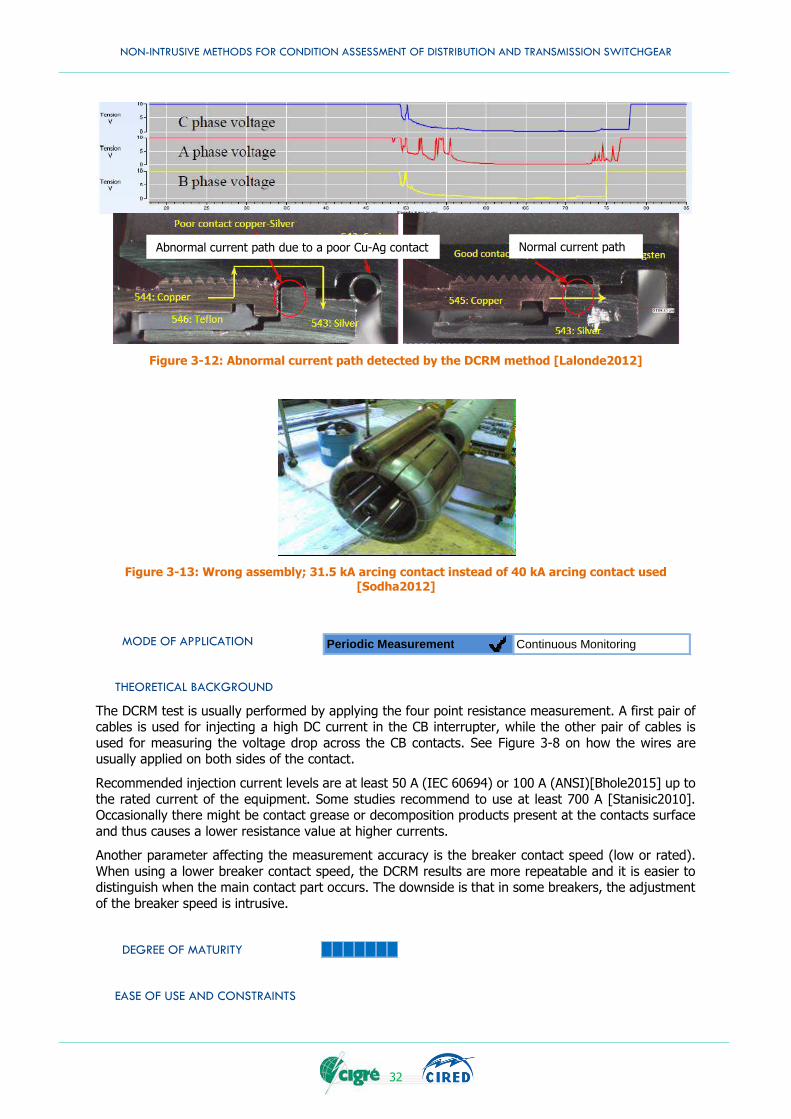
NON-INTRUSIVE METHODS FOR CONDITION ASSESSMENT OF DISTRIBUTION AND TRANSMISSION SWITCHGEAR
32
Figure 3-12: Abnormal current path detected by the DCRM method [Lalonde2012]
Figure 3-13: Wrong assembly; 31.5 kA arcing contact instead of 40 kA arcing contact used [Sodha2012]
MODE OF APPLICATION
THEORETICAL BACKGROUND
The DCRM test is usually performed by applying the four point resistance measurement. A first pair of cables is used for injecting a high DC current in the CB interrupter, while the other pair of cables is
used for measuring the voltage drop across the CB contacts. See Figure 3-8 on how the wires are usually applied on both sides of the contact.
Recommended injection current levels are at least 50 A (IEC 60694) or 100 A (ANSI)[Bhole2015] up to
the rated current of the equipment. Some studies recommend to use at least 700 A [Stanisic2010]. Occasionally there might be contact grease or decomposition products present at the contacts surface
and thus causes a lower resistance value at higher currents.
Another parameter affecting the measurement accuracy is the breaker contact speed (low or rated).
When using a lower breaker contact speed, the DCRM results are more repeatable and it is easier to distinguish when the main contact part occurs. The downside is that in some breakers, the adjustment
of the breaker speed is intrusive.
DEGREE OF MATURITY
EASE OF USE AND CONSTRAINTS
Abnormal current path due to a poor Cu-Ag contact Normal current path
Periodic Measurement Continuous Monitoring
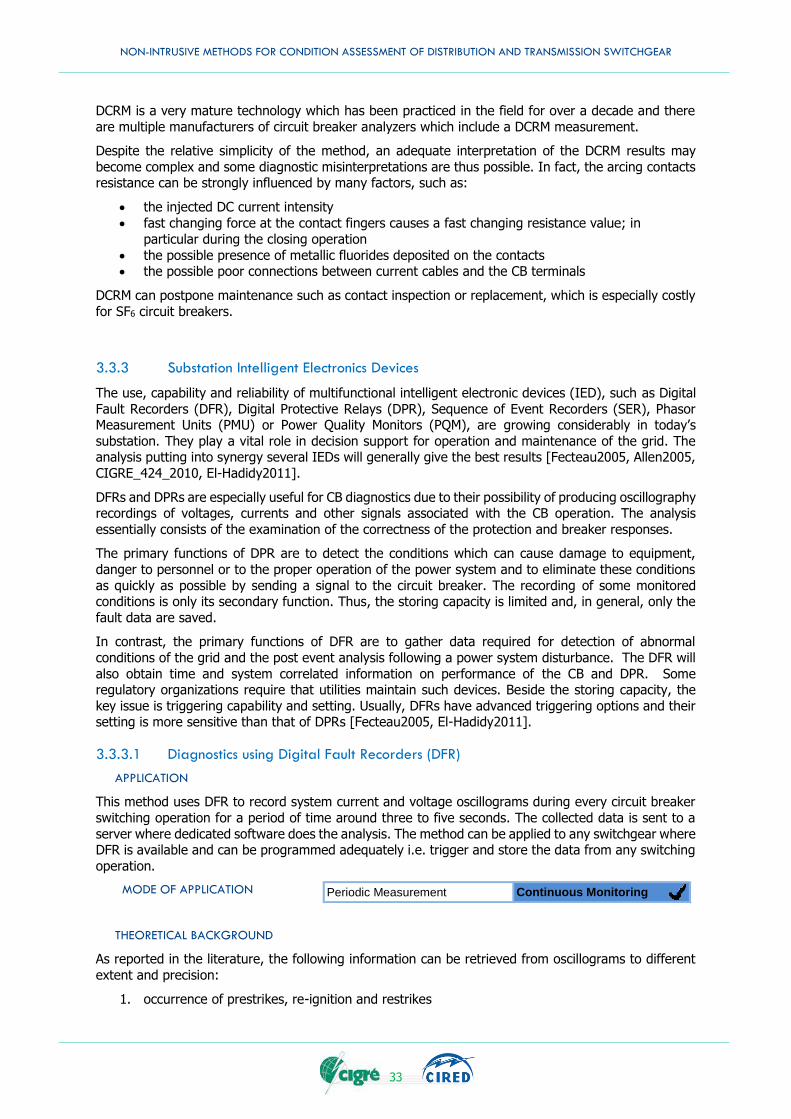
NON-INTRUSIVE METHODS FOR CONDITION ASSESSMENT OF DISTRIBUTION AND TRANSMISSION SWITCHGEAR
33
DCRM is a very mature technology which has been practiced in the field for over a decade and there
are multiple manufacturers of circuit breaker analyzers which include a DCRM measurement.
Despite the relative simplicity of the method, an adequate interpretation of the DCRM results may
become complex and some diagnostic misinterpretations are thus possible. In fact, the arcing contacts resistance can be strongly influenced by many factors, such as:
the injected DC current intensity
fast changing force at the contact fingers causes a fast changing resistance value; in
particular during the closing operation
the possible presence of metallic fluorides deposited on the contacts the possible poor connections between current cables and the CB terminals
DCRM can postpone maintenance such as contact inspection or replacement, which is especially costly
for SF6 circuit breakers.
3.3.3 Substation Intelligent Electronics Devices
The use, capability and reliability of multifunctional intelligent electronic devices (IED), such as Digital
Fault Recorders (DFR), Digital Protective Relays (DPR), Sequence of Event Recorders (SER), Phasor Measurement Units (PMU) or Power Quality Monitors (PQM), are growing considerably in today’s
substation. They play a vital role in decision support for operation and maintenance of the grid. The analysis putting into synergy several IEDs will generally give the best results [Fecteau2005, Allen2005,
CIGRE_424_2010, El-Hadidy2011].
DFRs and DPRs are especially useful for CB diagnostics due to their possibility of producing oscillography recordings of voltages, currents and other signals associated with the CB operation. The analysis
essentially consists of the examination of the correctness of the protection and breaker responses.
The primary functions of DPR are to detect the conditions which can cause damage to equipment,
danger to personnel or to the proper operation of the power system and to eliminate these conditions
as quickly as possible by sending a signal to the circuit breaker. The recording of some monitored conditions is only its secondary function. Thus, the storing capacity is limited and, in general, only the
fault data are saved.
In contrast, the primary functions of DFR are to gather data required for detection of abnormal
conditions of the grid and the post event analysis following a power system disturbance. The DFR will
also obtain time and system correlated information on performance of the CB and DPR. Some regulatory organizations require that utilities maintain such devices. Beside the storing capacity, the
key issue is triggering capability and setting. Usually, DFRs have advanced triggering options and their setting is more sensitive than that of DPRs [Fecteau2005, El-Hadidy2011].
3.3.3.1 Diagnostics using Digital Fault Recorders (DFR)
APPLICATION
This method uses DFR to record system current and voltage oscillograms during every circuit breaker
switching operation for a period of time around three to five seconds. The collected data is sent to a
server where dedicated software does the analysis. The method can be applied to any switchgear where DFR is available and can be programmed adequately i.e. trigger and store the data from any switching
operation.
MODE OF APPLICATION
THEORETICAL BACKGROUND
As reported in the literature, the following information can be retrieved from oscillograms to different
extent and precision:
1. occurrence of prestrikes, re-ignition and restrikes
Periodic Measurement Continuous Monitoring
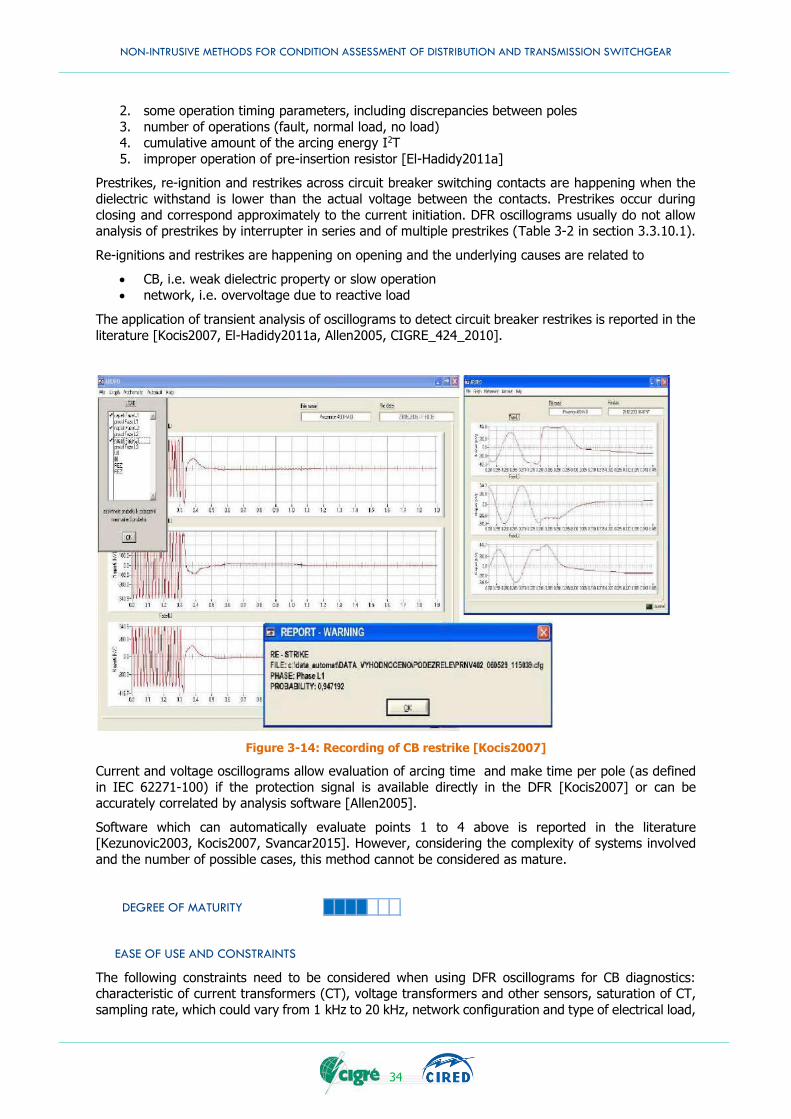
NON-INTRUSIVE METHODS FOR CONDITION ASSESSMENT OF DISTRIBUTION AND TRANSMISSION SWITCHGEAR
34
2. some operation timing parameters, including discrepancies between poles
3. number of operations (fault, normal load, no load) 4. cumulative amount of the arcing energy I2T
5. improper operation of pre-insertion resistor [El-Hadidy2011a]
Prestrikes, re-ignition and restrikes across circuit breaker switching contacts are happening when the
dielectric withstand is lower than the actual voltage between the contacts. Prestrikes occur during
closing and correspond approximately to the current initiation. DFR oscillograms usually do not allow analysis of prestrikes by interrupter in series and of multiple prestrikes (Table 3-2 in section 3.3.10.1).
Re-ignitions and restrikes are happening on opening and the underlying causes are related to
CB, i.e. weak dielectric property or slow operation
network, i.e. overvoltage due to reactive load
The application of transient analysis of oscillograms to detect circuit breaker restrikes is reported in the
literature [Kocis2007, El-Hadidy2011a, Allen2005, CIGRE_424_2010].
Figure 3-14: Recording of CB restrike [Kocis2007]
Current and voltage oscillograms allow evaluation of arcing time and make time per pole (as defined
in IEC 62271-100) if the protection signal is available directly in the DFR [Kocis2007] or can be accurately correlated by analysis software [Allen2005].
Software which can automatically evaluate points 1 to 4 above is reported in the literature [Kezunovic2003, Kocis2007, Svancar2015]. However, considering the complexity of systems involved
and the number of possible cases, this method cannot be considered as mature.
DEGREE OF MATURITY
EASE OF USE AND CONSTRAINTS
The following constraints need to be considered when using DFR oscillograms for CB diagnostics: characteristic of current transformers (CT), voltage transformers and other sensors, saturation of CT,
sampling rate, which could vary from 1 kHz to 20 kHz, network configuration and type of electrical load,
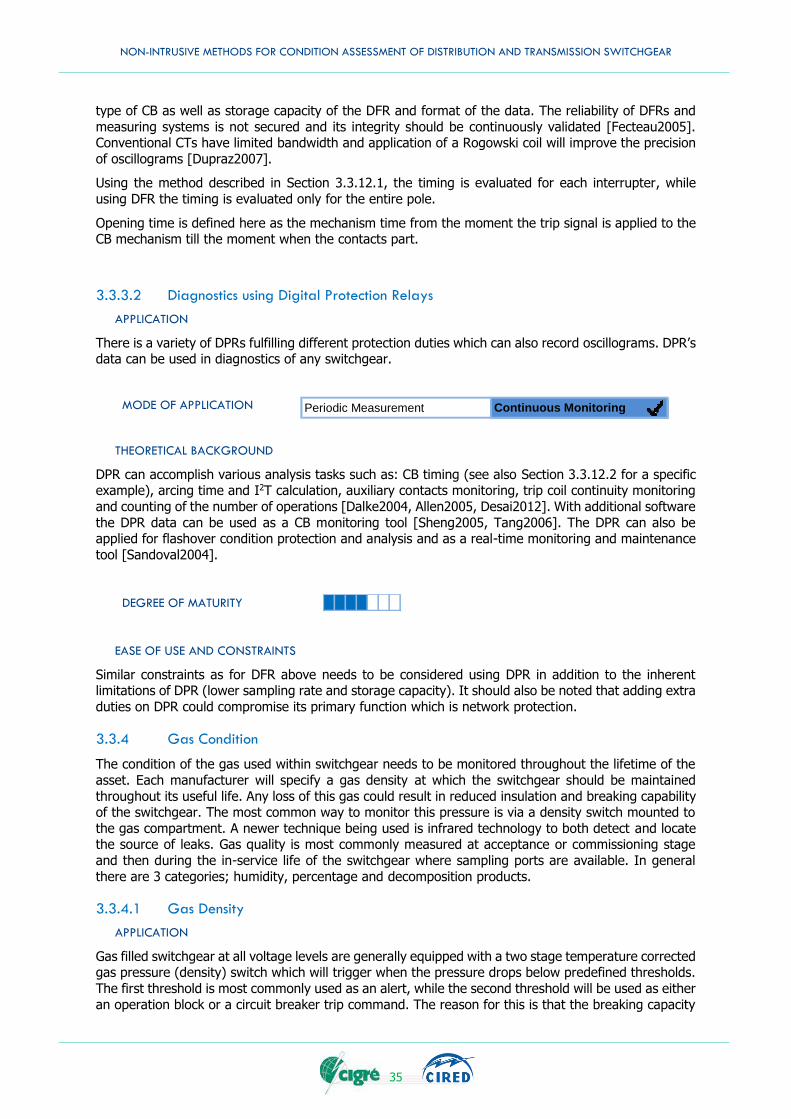
NON-INTRUSIVE METHODS FOR CONDITION ASSESSMENT OF DISTRIBUTION AND TRANSMISSION SWITCHGEAR
35
type of CB as well as storage capacity of the DFR and format of the data. The reliability of DFRs and
measuring systems is not secured and its integrity should be continuously validated [Fecteau2005]. Conventional CTs have limited bandwidth and application of a Rogowski coil will improve the precision
of oscillograms [Dupraz2007].
Using the method described in Section 3.3.12.1, the timing is evaluated for each interrupter, while
using DFR the timing is evaluated only for the entire pole.
Opening time is defined here as the mechanism time from the moment the trip signal is applied to the CB mechanism till the moment when the contacts part.
3.3.3.2 Diagnostics using Digital Protection Relays
APPLICATION
There is a variety of DPRs fulfilling different protection duties which can also record oscillograms. DPR’s data can be used in diagnostics of any switchgear.
MODE OF APPLICATION
THEORETICAL BACKGROUND
DPR can accomplish various analysis tasks such as: CB timing (see also Section 3.3.12.2 for a specific example), arcing time and I2T calculation, auxiliary contacts monitoring, trip coil continuity monitoring
and counting of the number of operations [Dalke2004, Allen2005, Desai2012]. With additional software
the DPR data can be used as a CB monitoring tool [Sheng2005, Tang2006]. The DPR can also be applied for flashover condition protection and analysis and as a real-time monitoring and maintenance
tool [Sandoval2004].
DEGREE OF MATURITY
EASE OF USE AND CONSTRAINTS
Similar constraints as for DFR above needs to be considered using DPR in addition to the inherent limitations of DPR (lower sampling rate and storage capacity). It should also be noted that adding extra
duties on DPR could compromise its primary function which is network protection.
3.3.4 Gas Condition
The condition of the gas used within switchgear needs to be monitored throughout the lifetime of the
asset. Each manufacturer will specify a gas density at which the switchgear should be maintained
throughout its useful life. Any loss of this gas could result in reduced insulation and breaking capability of the switchgear. The most common way to monitor this pressure is via a density switch mounted to
the gas compartment. A newer technique being used is infrared technology to both detect and locate the source of leaks. Gas quality is most commonly measured at acceptance or commissioning stage
and then during the in-service life of the switchgear where sampling ports are available. In general
there are 3 categories; humidity, percentage and decomposition products.
3.3.4.1 Gas Density
APPLICATION
Gas filled switchgear at all voltage levels are generally equipped with a two stage temperature corrected gas pressure (density) switch which will trigger when the pressure drops below predefined thresholds.
The first threshold is most commonly used as an alert, while the second threshold will be used as either
an operation block or a circuit breaker trip command. The reason for this is that the breaking capacity
Periodic Measurement Continuous Monitoring
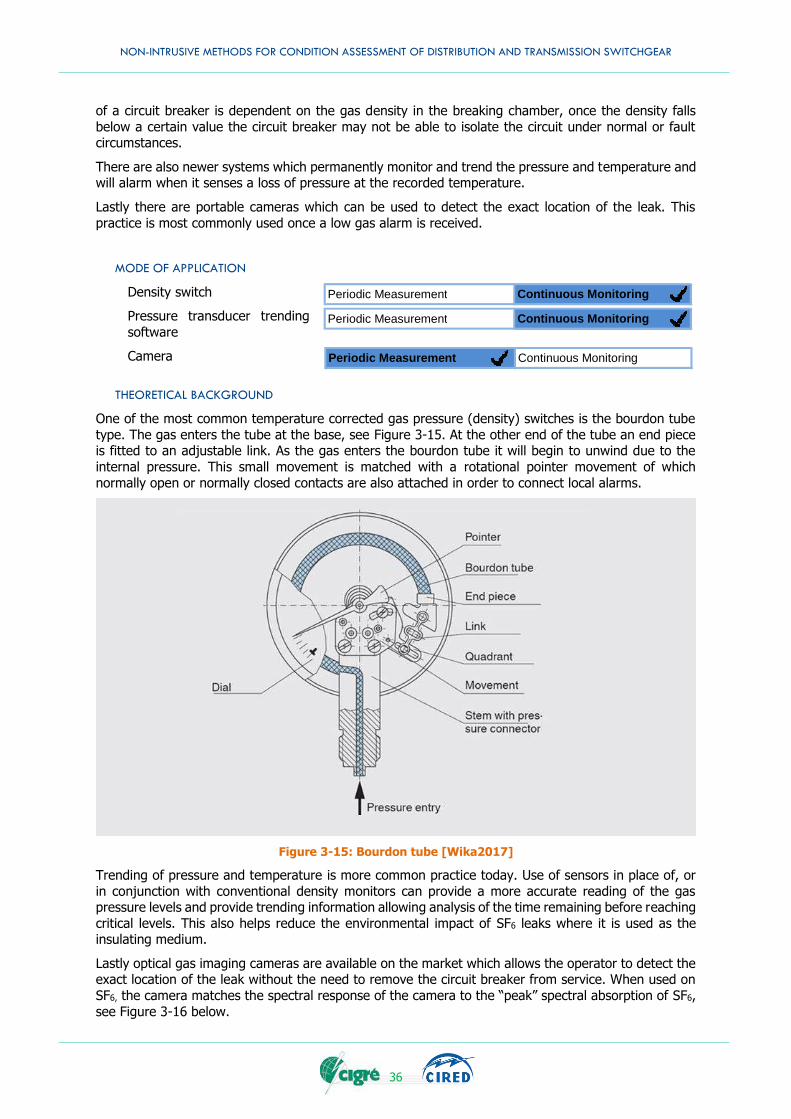
NON-INTRUSIVE METHODS FOR CONDITION ASSESSMENT OF DISTRIBUTION AND TRANSMISSION SWITCHGEAR
36
of a circuit breaker is dependent on the gas density in the breaking chamber, once the density falls
below a certain value the circuit breaker may not be able to isolate the circuit under normal or fault circumstances.
There are also newer systems which permanently monitor and trend the pressure and temperature and will alarm when it senses a loss of pressure at the recorded temperature.
Lastly there are portable cameras which can be used to detect the exact location of the leak. This
practice is most commonly used once a low gas alarm is received.
MODE OF APPLICATION
Density switch
Pressure transducer trending
software
Camera
THEORETICAL BACKGROUND
One of the most common temperature corrected gas pressure (density) switches is the bourdon tube
type. The gas enters the tube at the base, see Figure 3-15. At the other end of the tube an end piece is fitted to an adjustable link. As the gas enters the bourdon tube it will begin to unwind due to the
internal pressure. This small movement is matched with a rotational pointer movement of which
normally open or normally closed contacts are also attached in order to connect local alarms.
Figure 3-15: Bourdon tube [Wika2017]
Trending of pressure and temperature is more common practice today. Use of sensors in place of, or
in conjunction with conventional density monitors can provide a more accurate reading of the gas pressure levels and provide trending information allowing analysis of the time remaining before reaching
critical levels. This also helps reduce the environmental impact of SF6 leaks where it is used as the insulating medium.
Lastly optical gas imaging cameras are available on the market which allows the operator to detect the exact location of the leak without the need to remove the circuit breaker from service. When used on
SF6, the camera matches the spectral response of the camera to the “peak” spectral absorption of SF6,
see Figure 3-16 below.
Periodic Measurement Continuous Monitoring
Periodic Measurement Continuous Monitoring
Periodic Measurement Continuous Monitoring
NON-INTRUSIVE METHODS FOR CONDITION ASSESSMENT OF DISTRIBUTION AND TRANSMISSION SWITCHGEAR
37
Figure 3-16: Flir SF6 camera[Czerepuszko2007]
This results in an image which shows the SF6 leak as a black cloud.
DEGREE OF MATURITY
Density switch, alarms
Pressure transducer, trending software
Camera
EASE OF USE AND CONSTRAINTS
All methods mentioned above are non-intrusive, the bourdon tube type monitor provides two stage alarms which in most cases will allow time for the circuit breaker to be taken out of service in a timely
manner and topped up or repaired as necessary. The downside to this is that a certain amount of SF6
will have leaked before the alarm is activated. Sometimes there will be temperature differences between the poles on a live tank circuit breaker and the density switch, this can lead to alarms being activated
at cooler times such as late night or early morning.
Trending of the SF6 density provides an earlier indicator that a leak is present on the circuit breaker
and allows the system operator to decide how to deal with the leak in a timely manner, such as isolate in advance of high load periods rather than risk an alarm at these times.
The optical SF6 imaging camera is a very convenient way to detect the location of leaks from a safe
distance. The camera will detect almost all leak locations which allows for spare parts to be purchased in advance of removal from service for the repair [CIGRE TB 430]. The first versions of this camera
were very expensive whereas the newer models have been reduced in price and as such are becoming more commonly used.
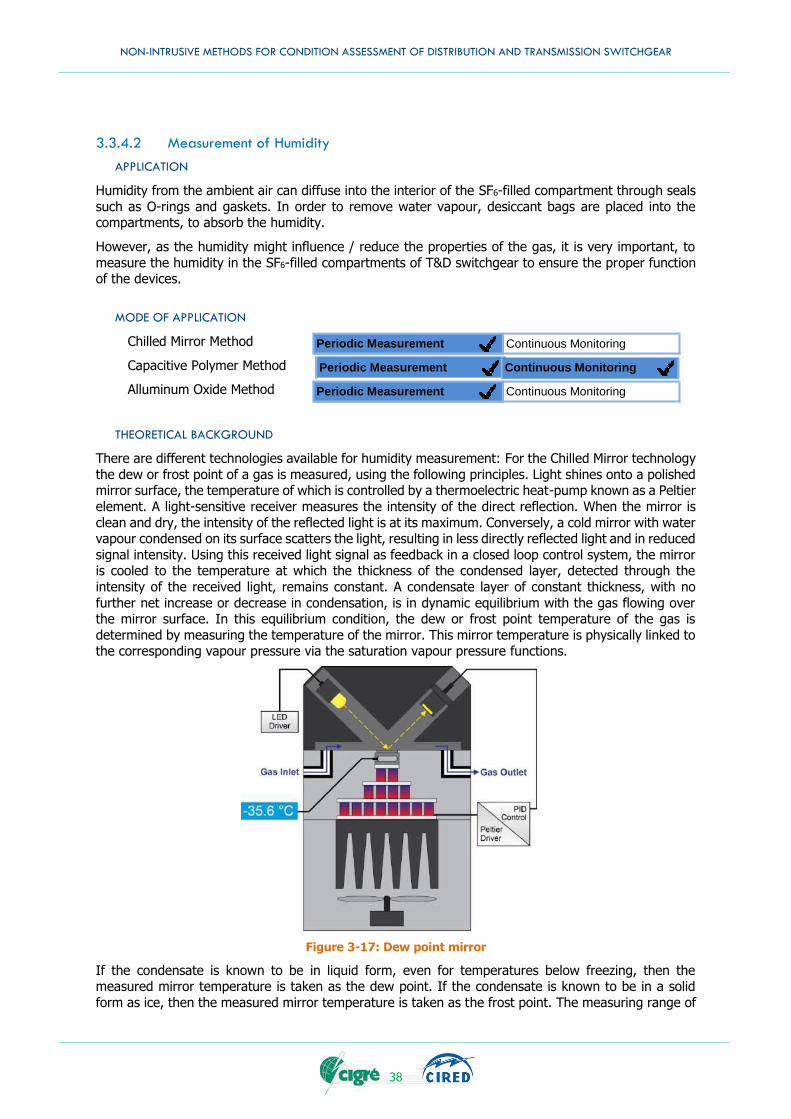
NON-INTRUSIVE METHODS FOR CONDITION ASSESSMENT OF DISTRIBUTION AND TRANSMISSION SWITCHGEAR
38
3.3.4.2 Measurement of Humidity
APPLICATION
Humidity from the ambient air can diffuse into the interior of the SF6-filled compartment through seals
such as O-rings and gaskets. In order to remove water vapour, desiccant bags are placed into the compartments, to absorb the humidity.
However, as the humidity might influence / reduce the properties of the gas, it is very important, to
measure the humidity in the SF6-filled compartments of T&D switchgear to ensure the proper function of the devices.
MODE OF APPLICATION
Chilled Mirror Method
Capacitive Polymer Method
Alluminum Oxide Method
THEORETICAL BACKGROUND
There are different technologies available for humidity measurement: For the Chilled Mirror technology
the dew or frost point of a gas is measured, using the following principles. Light shines onto a polished mirror surface, the temperature of which is controlled by a thermoelectric heat-pump known as a Peltier
element. A light-sensitive receiver measures the intensity of the direct reflection. When the mirror is
clean and dry, the intensity of the reflected light is at its maximum. Conversely, a cold mirror with water vapour condensed on its surface scatters the light, resulting in less directly reflected light and in reduced
signal intensity. Using this received light signal as feedback in a closed loop control system, the mirror is cooled to the temperature at which the thickness of the condensed layer, detected through the
intensity of the received light, remains constant. A condensate layer of constant thickness, with no
further net increase or decrease in condensation, is in dynamic equilibrium with the gas flowing over the mirror surface. In this equilibrium condition, the dew or frost point temperature of the gas is
determined by measuring the temperature of the mirror. This mirror temperature is physically linked to the corresponding vapour pressure via the saturation vapour pressure functions.
Figure 3-17: Dew point mirror
If the condensate is known to be in liquid form, even for temperatures below freezing, then the measured mirror temperature is taken as the dew point. If the condensate is known to be in a solid
form as ice, then the measured mirror temperature is taken as the frost point. The measuring range of
Periodic Measurement Continuous Monitoring
Periodic Measurement Continuous Monitoring
Periodic Measurement Continuous Monitoring
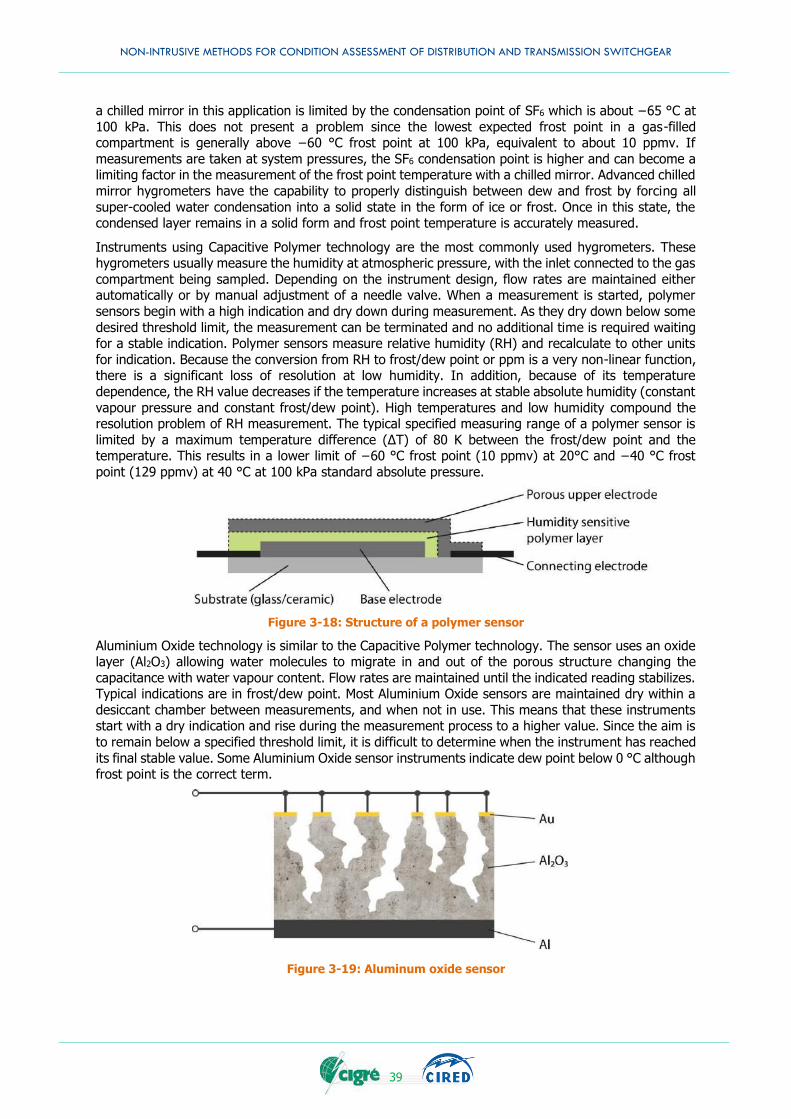
NON-INTRUSIVE METHODS FOR CONDITION ASSESSMENT OF DISTRIBUTION AND TRANSMISSION SWITCHGEAR
39
a chilled mirror in this application is limited by the condensation point of SF6 which is about −65 °C at
100 kPa. This does not present a problem since the lowest expected frost point in a gas-filled compartment is generally above −60 °C frost point at 100 kPa, equivalent to about 10 ppmv. If
measurements are taken at system pressures, the SF6 condensation point is higher and can become a limiting factor in the measurement of the frost point temperature with a chilled mirror. Advanced chilled
mirror hygrometers have the capability to properly distinguish between dew and frost by forcing all
super-cooled water condensation into a solid state in the form of ice or frost. Once in this state, the condensed layer remains in a solid form and frost point temperature is accurately measured.
Instruments using Capacitive Polymer technology are the most commonly used hygrometers. These hygrometers usually measure the humidity at atmospheric pressure, with the inlet connected to the gas
compartment being sampled. Depending on the instrument design, flow rates are maintained either automatically or by manual adjustment of a needle valve. When a measurement is started, polymer
sensors begin with a high indication and dry down during measurement. As they dry down below some
desired threshold limit, the measurement can be terminated and no additional time is required waiting for a stable indication. Polymer sensors measure relative humidity (RH) and recalculate to other units
for indication. Because the conversion from RH to frost/dew point or ppm is a very non-linear function, there is a significant loss of resolution at low humidity. In addition, because of its temperature
dependence, the RH value decreases if the temperature increases at stable absolute humidity (constant
vapour pressure and constant frost/dew point). High temperatures and low humidity compound the resolution problem of RH measurement. The typical specified measuring range of a polymer sensor is
limited by a maximum temperature difference (ΔT) of 80 K between the frost/dew point and the temperature. This results in a lower limit of −60 °C frost point (10 ppmv) at 20°C and −40 °C frost
point (129 ppmv) at 40 °C at 100 kPa standard absolute pressure.
Figure 3-18: Structure of a polymer sensor
Aluminium Oxide technology is similar to the Capacitive Polymer technology. The sensor uses an oxide layer (Al2O3) allowing water molecules to migrate in and out of the porous structure changing the
capacitance with water vapour content. Flow rates are maintained until the indicated reading stabilizes. Typical indications are in frost/dew point. Most Aluminium Oxide sensors are maintained dry within a
desiccant chamber between measurements, and when not in use. This means that these instruments start with a dry indication and rise during the measurement process to a higher value. Since the aim is
to remain below a specified threshold limit, it is difficult to determine when the instrument has reached
its final stable value. Some Aluminium Oxide sensor instruments indicate dew point below 0 °C although frost point is the correct term.
Figure 3-19: Aluminum oxide sensor
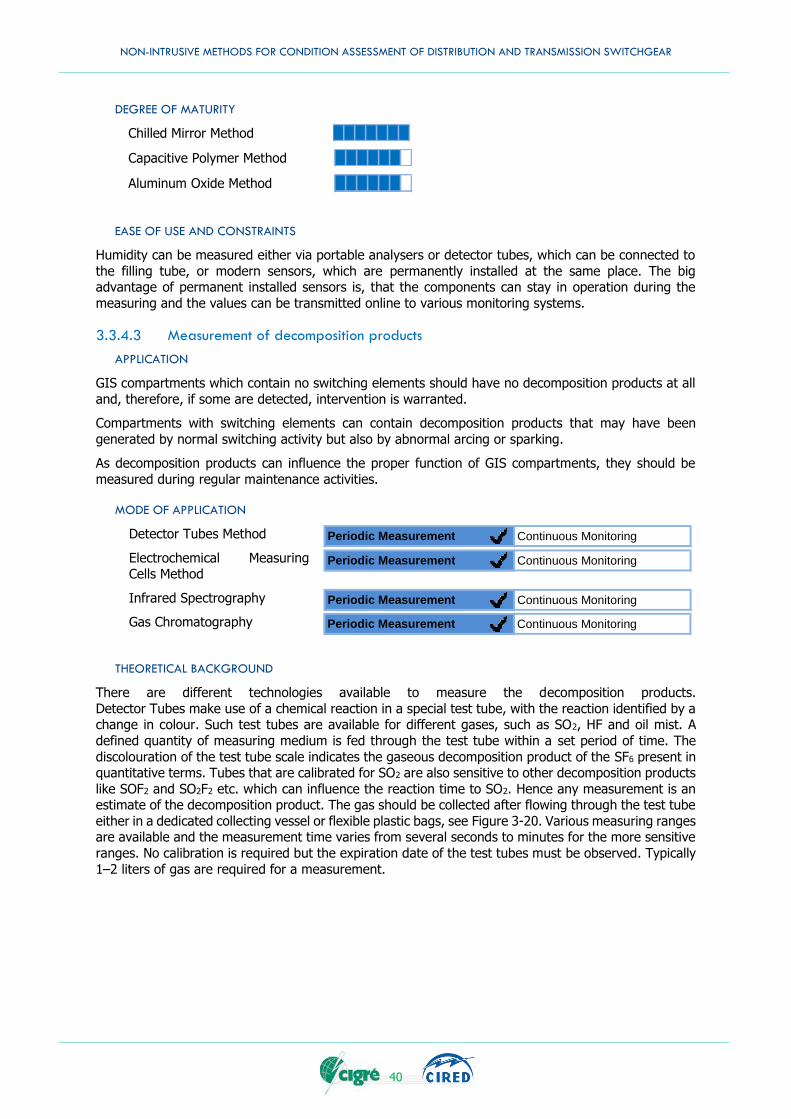
NON-INTRUSIVE METHODS FOR CONDITION ASSESSMENT OF DISTRIBUTION AND TRANSMISSION SWITCHGEAR
40
DEGREE OF MATURITY
Chilled Mirror Method
Capacitive Polymer Method
Aluminum Oxide Method
EASE OF USE AND CONSTRAINTS
Humidity can be measured either via portable analysers or detector tubes, which can be connected to
the filling tube, or modern sensors, which are permanently installed at the same place. The big advantage of permanent installed sensors is, that the components can stay in operation during the
measuring and the values can be transmitted online to various monitoring systems.
3.3.4.3 Measurement of decomposition products
APPLICATION
GIS compartments which contain no switching elements should have no decomposition products at all
and, therefore, if some are detected, intervention is warranted.
Compartments with switching elements can contain decomposition products that may have been
generated by normal switching activity but also by abnormal arcing or sparking.
As decomposition products can influence the proper function of GIS compartments, they should be
measured during regular maintenance activities.
MODE OF APPLICATION
Detector Tubes Method
Electrochemical Measuring Cells Method
Infrared Spectrography
Gas Chromatography
THEORETICAL BACKGROUND
There are different technologies available to measure the decomposition products.
Detector Tubes make use of a chemical reaction in a special test tube, with the reaction identified by a change in colour. Such test tubes are available for different gases, such as SO2, HF and oil mist. A
defined quantity of measuring medium is fed through the test tube within a set period of time. The
discolouration of the test tube scale indicates the gaseous decomposition product of the SF6 present in quantitative terms. Tubes that are calibrated for SO2 are also sensitive to other decomposition products
like SOF2 and SO2F2 etc. which can influence the reaction time to SO2. Hence any measurement is an estimate of the decomposition product. The gas should be collected after flowing through the test tube
either in a dedicated collecting vessel or flexible plastic bags, see Figure 3-20. Various measuring ranges are available and the measurement time varies from several seconds to minutes for the more sensitive
ranges. No calibration is required but the expiration date of the test tubes must be observed. Typically
1–2 liters of gas are required for a measurement.
Periodic Measurement Continuous Monitoring
Periodic Measurement Continuous Monitoring
Periodic Measurement Continuous Monitoring
Periodic Measurement Continuous Monitoring
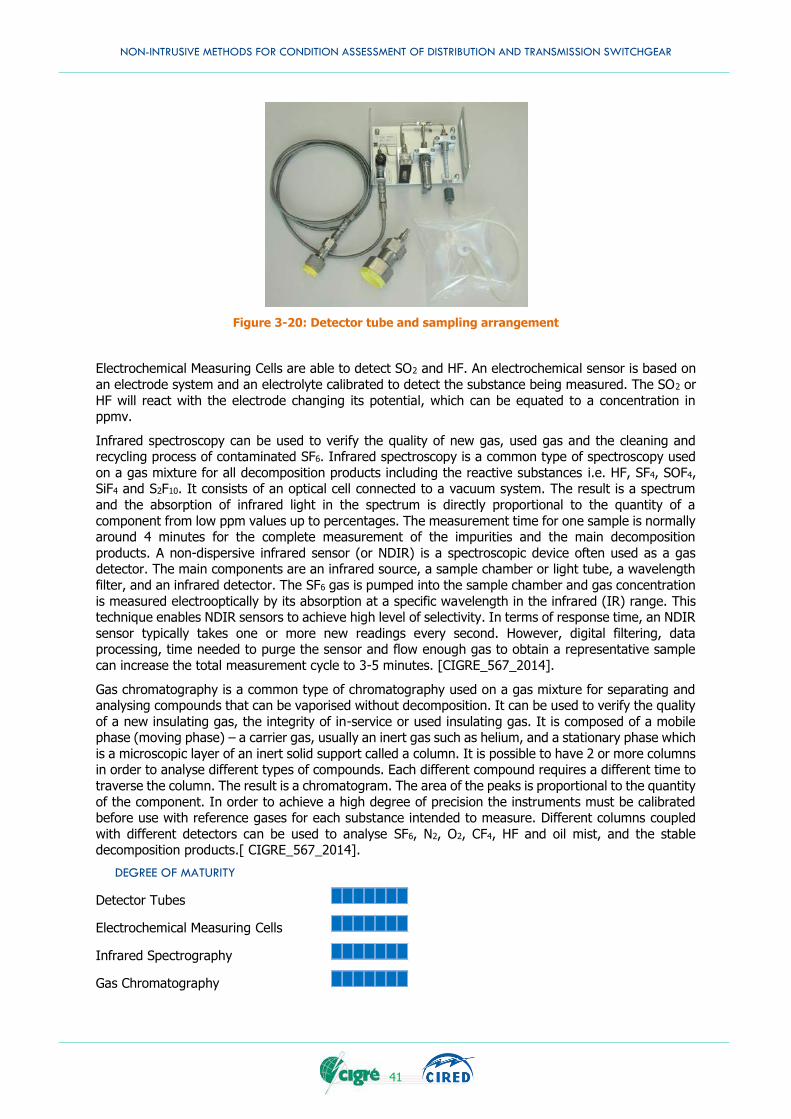
NON-INTRUSIVE METHODS FOR CONDITION ASSESSMENT OF DISTRIBUTION AND TRANSMISSION SWITCHGEAR
41
Figure 3-20: Detector tube and sampling arrangement
Electrochemical Measuring Cells are able to detect SO2 and HF. An electrochemical sensor is based on
an electrode system and an electrolyte calibrated to detect the substance being measured. The SO2 or
HF will react with the electrode changing its potential, which can be equated to a concentration in ppmv.
Infrared spectroscopy can be used to verify the quality of new gas, used gas and the cleaning and recycling process of contaminated SF6. Infrared spectroscopy is a common type of spectroscopy used
on a gas mixture for all decomposition products including the reactive substances i.e. HF, SF4, SOF4, SiF4 and S2F10. It consists of an optical cell connected to a vacuum system. The result is a spectrum
and the absorption of infrared light in the spectrum is directly proportional to the quantity of a
component from low ppm values up to percentages. The measurement time for one sample is normally around 4 minutes for the complete measurement of the impurities and the main decomposition
products. A non-dispersive infrared sensor (or NDIR) is a spectroscopic device often used as a gas detector. The main components are an infrared source, a sample chamber or light tube, a wavelength
filter, and an infrared detector. The SF6 gas is pumped into the sample chamber and gas concentration
is measured electrooptically by its absorption at a specific wavelength in the infrared (IR) range. This technique enables NDIR sensors to achieve high level of selectivity. In terms of response time, an NDIR
sensor typically takes one or more new readings every second. However, digital filtering, data processing, time needed to purge the sensor and flow enough gas to obtain a representative sample
can increase the total measurement cycle to 3-5 minutes. [CIGRE_567_2014].
Gas chromatography is a common type of chromatography used on a gas mixture for separating and analysing compounds that can be vaporised without decomposition. It can be used to verify the quality
of a new insulating gas, the integrity of in-service or used insulating gas. It is composed of a mobile phase (moving phase) – a carrier gas, usually an inert gas such as helium, and a stationary phase which
is a microscopic layer of an inert solid support called a column. It is possible to have 2 or more columns in order to analyse different types of compounds. Each different compound requires a different time to
traverse the column. The result is a chromatogram. The area of the peaks is proportional to the quantity
of the component. In order to achieve a high degree of precision the instruments must be calibrated before use with reference gases for each substance intended to measure. Different columns coupled
with different detectors can be used to analyse SF6, N2, O2, CF4, HF and oil mist, and the stable decomposition products.[ CIGRE_567_2014].
DEGREE OF MATURITY
Detector Tubes
Electrochemical Measuring Cells
Infrared Spectrography
Gas Chromatography
NON-INTRUSIVE METHODS FOR CONDITION ASSESSMENT OF DISTRIBUTION AND TRANSMISSION SWITCHGEAR
42
EASE OF USE AND CONSTRAINTS
Identifying a threshold for the permissible level of decomposition products without a reduction of the
dielectric performance of the gas is very complex and has proven to be impossible in practice.
Portable analysers are available in various numbers for on-site measurement. They can typically measure the decomposition products with Electrochemical Measuring Cells or Infrared spectroscopy.
Gas Chromatography usually is executed in laboratories. It is possible to use on-site portable Gas Chromatography having also a TCD (thermal conductivity detector) which can precisely measure the
levels of Air, CF4, SO2, SOF2 and SO2F2 in SF6. However, a high levels of skill is required to operate
these instruments and, therefore, they do not offer a practical option.
3.3.4.4 Measurement of SF6 percentage
APPLICATION
From an equipment performance perspective, the most critical element is SF6 content (clearly coupled with SF6 density) and should be measured during regular maintenance activities as a consequence.
MODE OF APPLICATION
THEORETICAL BACKGROUND
There are different measuring technologies available. The measurement of the velocity of sound and the thermal conductivity in the measuring medium are usual. But recently there have been devices
which are operated by measurement of condensation points.
The Sound Velocity works by evaluating the different sound velocities of gases. The sound velocity in nitrogen is normally around 337 m/s at 20° C and for SF6 around 130 m/s at 20° C. The sound velocity
measured in the measurement cell is temperature-compensated and is converted into the percentage SF6 volume assuming that the mixture is composed only of SF6 and nitrogen. Since the velocity of sound
in oxygen is similar to that in nitrogen the results are applicable for an SF6/air mixture. The accuracy of such devices is +/-1 % SF6 content.
The same Condensation technique employed by a chilled mirror to measure the water vapour in SF6
can be used to determine the purity of the SF6 gas. Since the condensation point of pure SF6 at a given pressure is a known value on the SF6 vapour pressure curve, the %Vol SF6 can be calculated based on
the difference between the SF6 partial pressure and the measured total pressure. This is a selective measuring method directly detecting the actual SF6 content in a gas compartment, at 20° C. Thermal
conductivity detectors (TCDs) continually measure the thermal conductivity of the SF6 using the heated-
filament method. The accuracy of TCDs is typically lower than those instruments based on sound velocity.
DEGREE OF MATURITY
EASE OF USE AND CONSTRAINTS
SF6 percentage can be measured via portable analysers. Portable analysers are available in various numbers for on-site measurement.The test results are available immediatelly after the measurement,
which takes approx. 2 minutes, dependent on the device type.
Periodic Measurement Continuous Monitoring
NON-INTRUSIVE METHODS FOR CONDITION ASSESSMENT OF DISTRIBUTION AND TRANSMISSION SWITCHGEAR
43
3.3.5 Oil Condition
3.3.5.1 Oil Condition
APPLICATION
Laboratory testing of oil has historically been used to determine the condition of equipment such as oil
circuit breakers (OCB’s) across all voltage levels. Information gained from this testing is used to detect if underlying faults exist or are developing and also to determine their severity. For bulk OCB’s this can
also assist in identifying ageing trends of the various components.
The oil tests can be divided in to three main categories; Dissolved gas-in-oil analysis (DGA), oil quality
and particle analysis.
Failure modes for OCB’s include electrical, mechanical and overheating. These failure modes can therefore be detected by using similar diagnostic techniques as used on transformers. There are two
main types of OCB’s, bulk oil and minimum oil. All tests can be performed on the oil from both types. However, for minimum oil circuit breakers, the most common tests are the oil quality set.
MODE OF APPLICATION
Bulk oil, Quality
Bulk oil, Metals
Bulk oil, DGA
Minimum oil, Quality
Minimumoil, Metals
Minimum oil, DGA
For bulk oil circuit breakers samples can be taken with the equipment in-service, whereas for minimum
oil circuit breakers, the equipment is generally required to be off-service. Sampling frequency can vary
from yearly to bi-annual and even up to every 8/10 years depending on the maintenance policy of the company.
THEORETICAL BACKGROUND
Oil quality
Routine oil quality tests are most commonly referred to as being dielectric breakdown voltage, water
content and acidity. Information gained from these three tests offer a good insight as to the overall condition of the oil. Dielectric breakdown voltage will provide information on the insulating capability of
the oil. Water content will determine if the OCB has excessive amounts of water present. Since the majority of OCB’s are free breathing, this is a common problem. Acidity will provide an indication of the
extent of the degradation of the oil.
Particle analysis
The total number of particles can be used to detect abnormal quantities of by-products and wear
materials. The ratio(s) of the size groupings provides information as to the extent a detrimental condition has progressed. Larger particles are especially important, as the dielectric strength of the
insulating oil is more adversely affected by these particles, and formation of larger particles are an indicator of advanced deterioration. Particle typing has been used successfully in other fields such as
lubrication and hydraulic systems for quite some time. In OCB’s, particles are formed from three main
mechanisms: wear, arcing and overheating.[Lewand2004]
Periodic Measurement Continuous Monitoring
Periodic Measurement Continuous Monitoring
Periodic Measurement Continuous Monitoring
Periodic Measurement Continuous Monitoring
Periodic Measurement Continuous Monitoring
Periodic Measurement Continuous Monitoring
NON-INTRUSIVE METHODS FOR CONDITION ASSESSMENT OF DISTRIBUTION AND TRANSMISSION SWITCHGEAR
44
Dissolved gas-in-oil analysis
During the operation of OCB’s, gases are produced as the contacts separate. A prevalent gas is acetylene which can indicate normal or excessive arcing, hydrogen will also be associated with normal
operation and are classified as arcing gases. As very little heating occurs in a healthy CB there should not be any significant amounts of gases such as ethylene, ethane and methane. Overheating of
conductors and insulation can lead to a thermal condition which may cause surface carbonization, which
can then lead to increased surface resistance and result in a thermal runaway scenario unless corrected. The ratio of heating to arcing gases should be consistent. Any change in these ratios can be used as
an indicator of an abnormal condition developing.
DEGREE OF MATURITY
Bulk oil, Quality
Bulk oil, Metals
Bulk oil, DGA
Minimum oil, Quality
Minimum oil, Metals
Minimum oil, DGA
EASE OF USE AND CONSTRAINTS
For bulk oil circuit breakers the process of oil sampling is very much straight forward. Sampling ports are generally provided at accessible points without the need to remove the equipment from service.
For minimum oil circuit breakers the sample cannot be extracted without removing the equipment from
service.
For both applications tests such as BDV, moisture content and neutralisation number can be performed
on site using widely available portable test kits. The metal and DGA testing is most commonly performed in a laboratory environment.
3.3.6 Partial Discharge
A partial discharge (PD) in HV/MV switchgear is a localized dielectric breakdown due to a defect which causes local electrical stress concentration in the insulation medium. IEC 60270 standard defines PD
as “localized electrical discharges that only partially bridges the insulation between conductors and
which can or cannot occur adjacent to a conductor. PD are in general a consequence of local electrical stress concentrations in the insulation or on the surface of the insulation.”
PD measurements provide important information about the health condition of the switchgear insulation. Traditionally PD tests have been used as quality assurance measurements during the
production process of the switchgear in order to check for defects in insulation that could appear during
the manufacturing process. Over the last 10-20 years they also started to be used for testing equipment in the field, which will be the focus of this section.
Some of the causes of PD in HV/MV switchgear are assembly error, free moving metallic particles, metallic protrusions or sharp edges fixed on the conductors, poor or loose electrical contacts, defects
in solid insulators such as voids, cracks and metallic particles on insulator surface and contamination of the insulation medium.
Since PD activity causes progressive deterioration of insulating materials, the condition of the insulation
should be monitored, preferably during the lifetime of the device. Because PD can increase the risk of insulation breakdown, early detection and location are important.
NON-INTRUSIVE METHODS FOR CONDITION ASSESSMENT OF DISTRIBUTION AND TRANSMISSION SWITCHGEAR
45
PD appears with various effects such as electromagnetic and acoustic (mechanical) waves, emission of
light and chemical decomposition of the insulation medium. These physical and chemical effects can be detected by different diagnostic methods with sensors which are mainly classified as:
Electrical methods
Conventional methods according to IEC60270 (typically used for factory tests)
Non-conventional electrical methods (typically used for field tests)
Acoustic methods (typically used of field tests)
Optical methods (typically used for field tests)
Chemical methods
This section will focus on Electrical and Acoustic methods, both of which are widely used for switchgear testing.
The PD detection methods can be divided into conventional and non-conventional methods [Cho2011]. The conventional methods refer to the PD measurement procedures specified, i.e. by the international
standard IEC60270, which requires the disconnection of power cables from the switchgear and testing
offline with the specified test circuit. This can be avoided by using non-conventional methods that are non-intrusive and allow the PD detection without disconnecting the cables from the switchgear
[Kornhuber2012]
PD measurements in HV GIS is very well accepted and is a mature measurement technique. In MV
application it has started to be applied recently.
With this said, it should be stated that field PD testing could have false positive results due to large external noise or measurement disturbances outside the switchgear, as well as cross talk between
phases. Therefore, for the interpretation of the results, it is necesary to have a PD expert or use a PD expert system. In addition, it is advisible that results are reviewed by the switchgear expert, in order
to draw the relationship between the test results of non-conventional field tests and conventional tests
in the factory. This practice should lower the probability of false positive results.
3.3.6.1 UHF method
APPLICATION
The UHF method was first developed in the late 80’s for use in high voltage GIS, specially because GIS insulation was very sensitive to the presence of metallic particles. The detection of partial discharge by
the UHF method made possible the detection and location of these metallic particles. Currently the UHF method is used not only in GIS but in MTS (Mixed Technology Switchgear) and also in power
transformers and in MV equipment.
MODE OF APPLICATION
UHF Partial Discharge
THEORETICAL BACKGROUND
PD appears as high frequency current pulses whose rise time can be shorter than 100 ps. The fast rise-time pulses provide a high frequency electromagnetic transient propagating inside the enclosure whose
frequency contents can distribute above 2GHz. The PD detection method working in the UHF range,
300MHz to 3GHz, is called the UHF method. The propagation velocity of the UHF electromagnetic waves depends on the relative permittivity of the surrounding medium. For example, in oil insulation it is
estimated about 2∙[10]^8 m/s and is around 3∙[10]^8 m/s in SF6. The electromagnetic wave generated by PD can be detected by means of antennas internally and externally mounted on the apparatus.
Sensors mainly used for the UHF method are:
Internally mounted disc shaped sensors
External window / barrier antennas
Periodic Measurement Continuous Monitoring
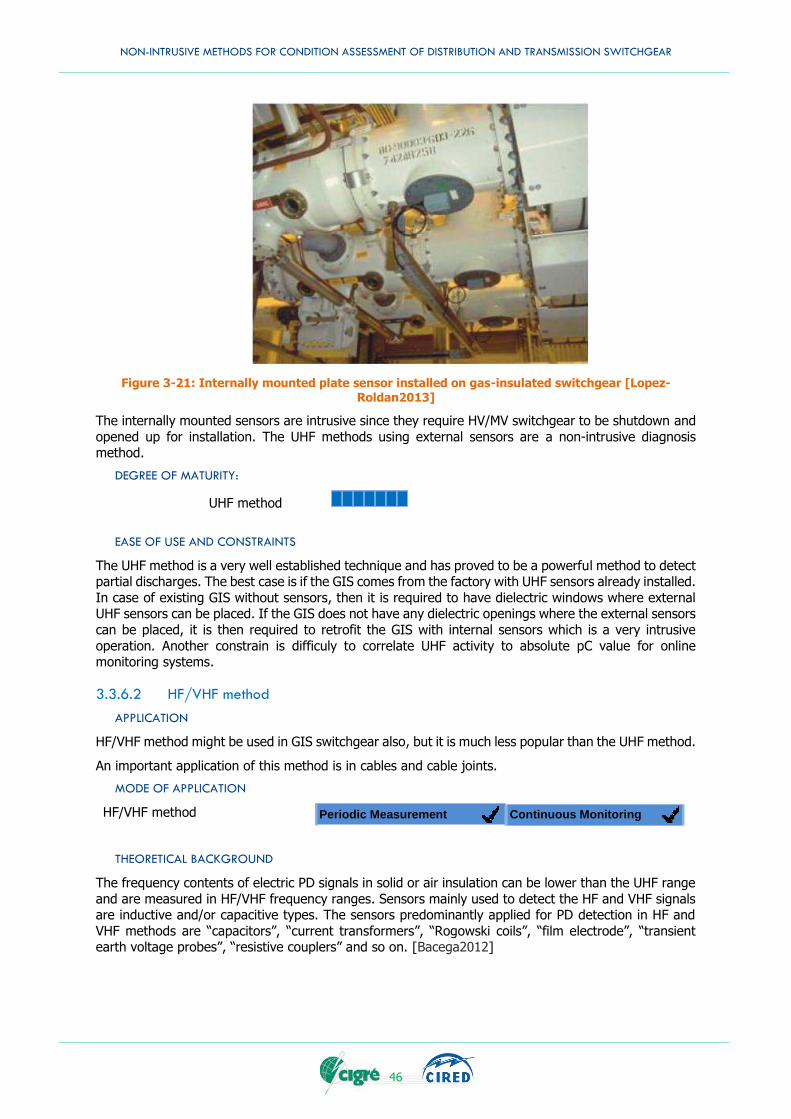
NON-INTRUSIVE METHODS FOR CONDITION ASSESSMENT OF DISTRIBUTION AND TRANSMISSION SWITCHGEAR
46
Figure 3-21: Internally mounted plate sensor installed on gas-insulated switchgear [Lopez-Roldan2013]
The internally mounted sensors are intrusive since they require HV/MV switchgear to be shutdown and
opened up for installation. The UHF methods using external sensors are a non-intrusive diagnosis method.
DEGREE OF MATURITY:
UHF method
EASE OF USE AND CONSTRAINTS
The UHF method is a very well established technique and has proved to be a powerful method to detect partial discharges. The best case is if the GIS comes from the factory with UHF sensors already installed.
In case of existing GIS without sensors, then it is required to have dielectric windows where external UHF sensors can be placed. If the GIS does not have any dielectric openings where the external sensors
can be placed, it is then required to retrofit the GIS with internal sensors which is a very intrusive
operation. Another constrain is difficuly to correlate UHF activity to absolute pC value for online monitoring systems.
3.3.6.2 HF/VHF method
APPLICATION
HF/VHF method might be used in GIS switchgear also, but it is much less popular than the UHF method.
An important application of this method is in cables and cable joints.
MODE OF APPLICATION
HF/VHF method
THEORETICAL BACKGROUND
The frequency contents of electric PD signals in solid or air insulation can be lower than the UHF range
and are measured in HF/VHF frequency ranges. Sensors mainly used to detect the HF and VHF signals are inductive and/or capacitive types. The sensors predominantly applied for PD detection in HF and
VHF methods are “capacitors”, “current transformers”, “Rogowski coils”, “film electrode”, “transient earth voltage probes”, “resistive couplers” and so on. [Bacega2012]
Continuous Monitoring Periodic Measurement
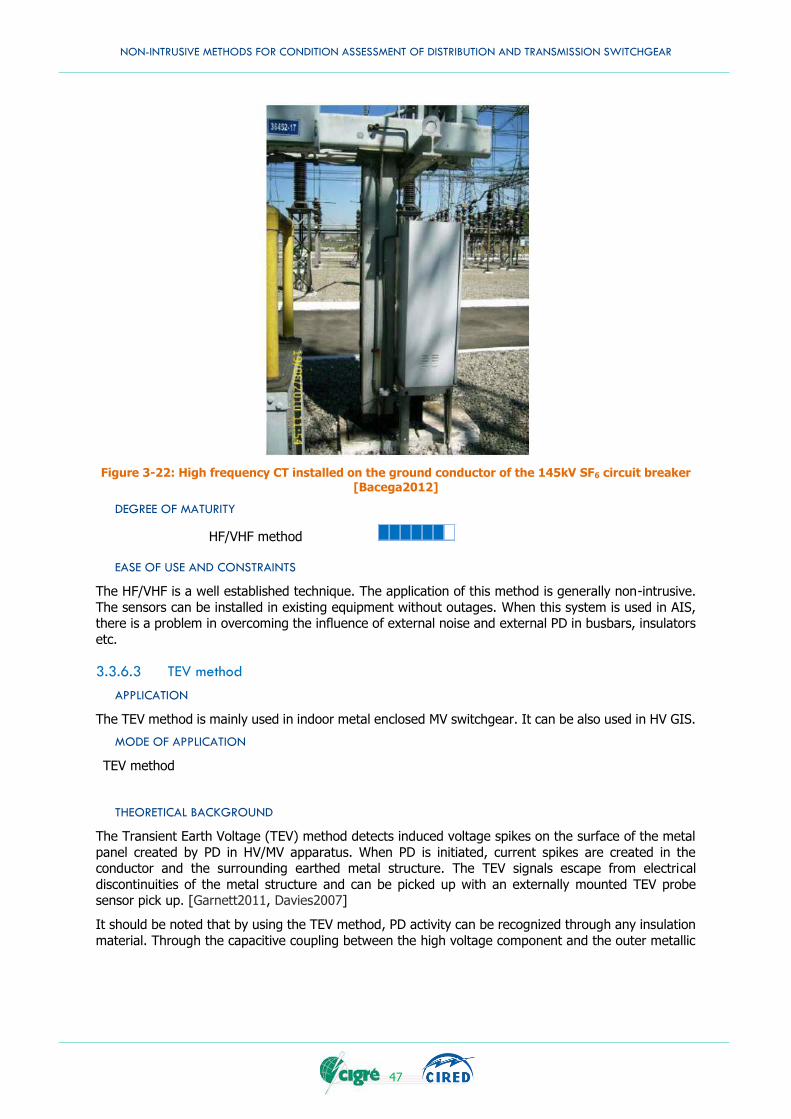
NON-INTRUSIVE METHODS FOR CONDITION ASSESSMENT OF DISTRIBUTION AND TRANSMISSION SWITCHGEAR
47
Figure 3-22: High frequency CT installed on the ground conductor of the 145kV SF6 circuit breaker [Bacega2012]
DEGREE OF MATURITY
HF/VHF method
EASE OF USE AND CONSTRAINTS
The HF/VHF is a well established technique. The application of this method is generally non-intrusive.
The sensors can be installed in existing equipment without outages. When this system is used in AIS, there is a problem in overcoming the influence of external noise and external PD in busbars, insulators
etc.
3.3.6.3 TEV method
APPLICATION
The TEV method is mainly used in indoor metal enclosed MV switchgear. It can be also used in HV GIS.
MODE OF APPLICATION
TEV method
THEORETICAL BACKGROUND
The Transient Earth Voltage (TEV) method detects induced voltage spikes on the surface of the metal
panel created by PD in HV/MV apparatus. When PD is initiated, current spikes are created in the conductor and the surrounding earthed metal structure. The TEV signals escape from electrical
discontinuities of the metal structure and can be picked up with an externally mounted TEV probe sensor pick up. [Garnett2011, Davies2007]
It should be noted that by using the TEV method, PD activity can be recognized through any insulation
material. Through the capacitive coupling between the high voltage component and the outer metallic
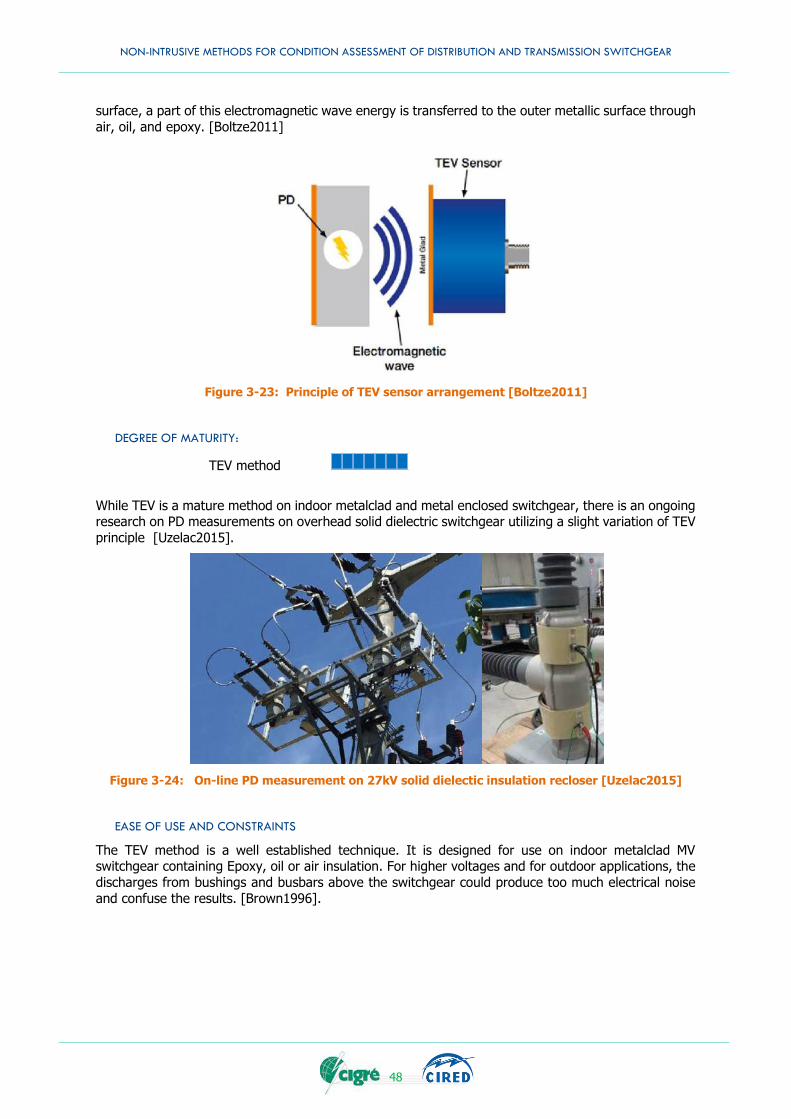
NON-INTRUSIVE METHODS FOR CONDITION ASSESSMENT OF DISTRIBUTION AND TRANSMISSION SWITCHGEAR
48
surface, a part of this electromagnetic wave energy is transferred to the outer metallic surface through
air, oil, and epoxy. [Boltze2011]
Figure 3-23: Principle of TEV sensor arrangement [Boltze2011]
DEGREE OF MATURITY:
TEV method
While TEV is a mature method on indoor metalclad and metal enclosed switchgear, there is an ongoing research on PD measurements on overhead solid dielectric switchgear utilizing a slight variation of TEV
principle [Uzelac2015].
Figure 3-24: On-line PD measurement on 27kV solid dielectic insulation recloser [Uzelac2015]
EASE OF USE AND CONSTRAINTS
The TEV method is a well established technique. It is designed for use on indoor metalclad MV switchgear containing Epoxy, oil or air insulation. For higher voltages and for outdoor applications, the
discharges from bushings and busbars above the switchgear could produce too much electrical noise
and confuse the results. [Brown1996].
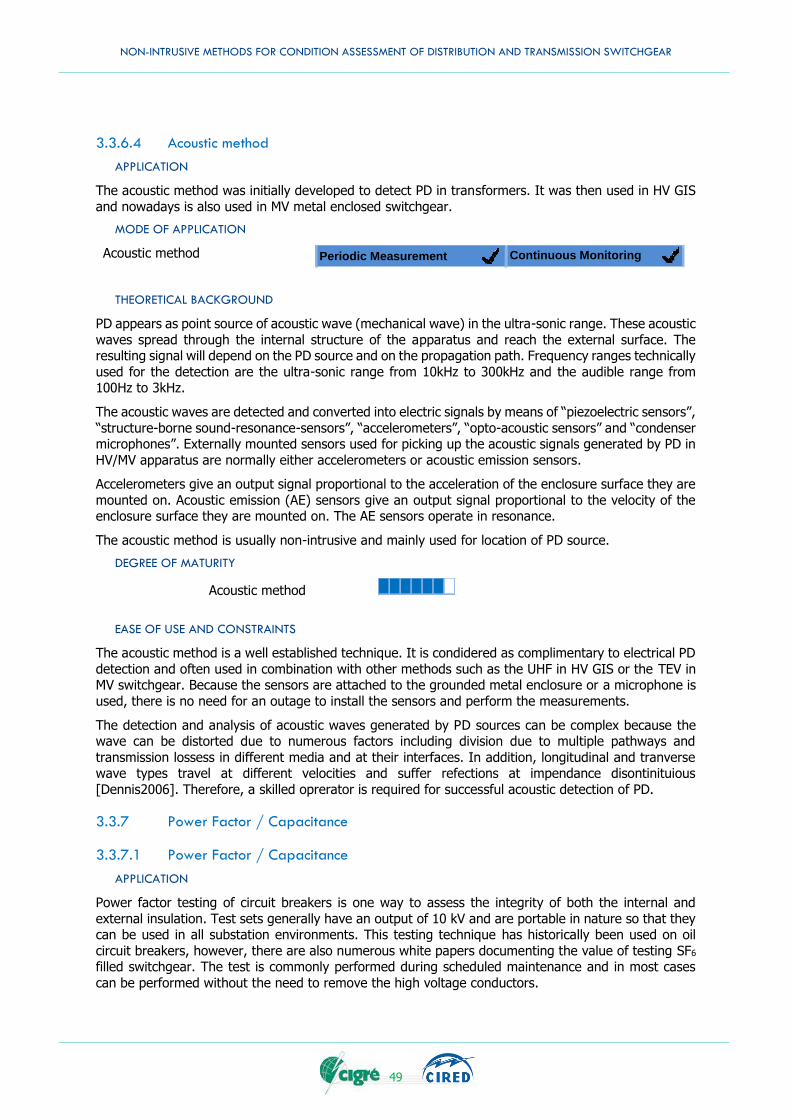
NON-INTRUSIVE METHODS FOR CONDITION ASSESSMENT OF DISTRIBUTION AND TRANSMISSION SWITCHGEAR
49
3.3.6.4 Acoustic method
APPLICATION
The acoustic method was initially developed to detect PD in transformers. It was then used in HV GIS
and nowadays is also used in MV metal enclosed switchgear.
MODE OF APPLICATION
Acoustic method
THEORETICAL BACKGROUND
PD appears as point source of acoustic wave (mechanical wave) in the ultra-sonic range. These acoustic
waves spread through the internal structure of the apparatus and reach the external surface. The resulting signal will depend on the PD source and on the propagation path. Frequency ranges technically
used for the detection are the ultra-sonic range from 10kHz to 300kHz and the audible range from 100Hz to 3kHz.
The acoustic waves are detected and converted into electric signals by means of “piezoelectric sensors”,
“structure-borne sound-resonance-sensors”, “accelerometers”, “opto-acoustic sensors” and “condenser microphones”. Externally mounted sensors used for picking up the acoustic signals generated by PD in
HV/MV apparatus are normally either accelerometers or acoustic emission sensors.
Accelerometers give an output signal proportional to the acceleration of the enclosure surface they are
mounted on. Acoustic emission (AE) sensors give an output signal proportional to the velocity of the enclosure surface they are mounted on. The AE sensors operate in resonance.
The acoustic method is usually non-intrusive and mainly used for location of PD source.
DEGREE OF MATURITY
Acoustic method
EASE OF USE AND CONSTRAINTS
The acoustic method is a well established technique. It is condidered as complimentary to electrical PD
detection and often used in combination with other methods such as the UHF in HV GIS or the TEV in MV switchgear. Because the sensors are attached to the grounded metal enclosure or a microphone is
used, there is no need for an outage to install the sensors and perform the measurements.
The detection and analysis of acoustic waves generated by PD sources can be complex because the wave can be distorted due to numerous factors including division due to multiple pathways and
transmission lossess in different media and at their interfaces. In addition, longitudinal and tranverse wave types travel at different velocities and suffer refections at impendance disontinituious
[Dennis2006]. Therefore, a skilled oprerator is required for successful acoustic detection of PD.
3.3.7 Power Factor / Capacitance
3.3.7.1 Power Factor / Capacitance
APPLICATION
Power factor testing of circuit breakers is one way to assess the integrity of both the internal and
external insulation. Test sets generally have an output of 10 kV and are portable in nature so that they can be used in all substation environments. This testing technique has historically been used on oil
circuit breakers, however, there are also numerous white papers documenting the value of testing SF6 filled switchgear. The test is commonly performed during scheduled maintenance and in most cases
can be performed without the need to remove the high voltage conductors.
Continuous Monitoring Periodic Measurement
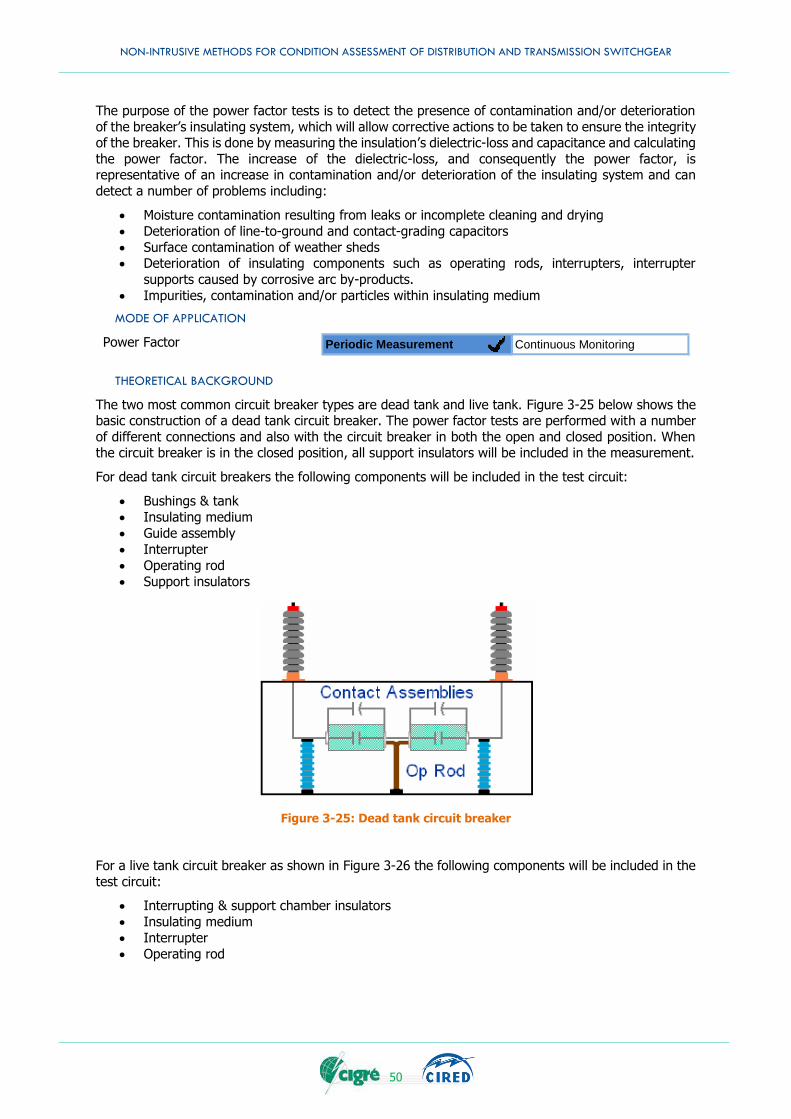
NON-INTRUSIVE METHODS FOR CONDITION ASSESSMENT OF DISTRIBUTION AND TRANSMISSION SWITCHGEAR
50
The purpose of the power factor tests is to detect the presence of contamination and/or deterioration
of the breaker’s insulating system, which will allow corrective actions to be taken to ensure the integrity of the breaker. This is done by measuring the insulation’s dielectric-loss and capacitance and calculating
the power factor. The increase of the dielectric-loss, and consequently the power factor, is representative of an increase in contamination and/or deterioration of the insulating system and can
detect a number of problems including:
Moisture contamination resulting from leaks or incomplete cleaning and drying
Deterioration of line-to-ground and contact-grading capacitors
Surface contamination of weather sheds Deterioration of insulating components such as operating rods, interrupters, interrupter
supports caused by corrosive arc by-products.
Impurities, contamination and/or particles within insulating medium
MODE OF APPLICATION
Power Factor
THEORETICAL BACKGROUND
The two most common circuit breaker types are dead tank and live tank. Figure 3-25 below shows the basic construction of a dead tank circuit breaker. The power factor tests are performed with a number
of different connections and also with the circuit breaker in both the open and closed position. When the circuit breaker is in the closed position, all support insulators will be included in the measurement.
For dead tank circuit breakers the following components will be included in the test circuit:
Bushings & tank
Insulating medium
Guide assembly
Interrupter
Operating rod
Support insulators
Figure 3-25: Dead tank circuit breaker
For a live tank circuit breaker as shown in Figure 3-26 the following components will be included in the
test circuit:
Interrupting & support chamber insulators
Insulating medium
Interrupter
Operating rod
Periodic Measurement Continuous Monitoring
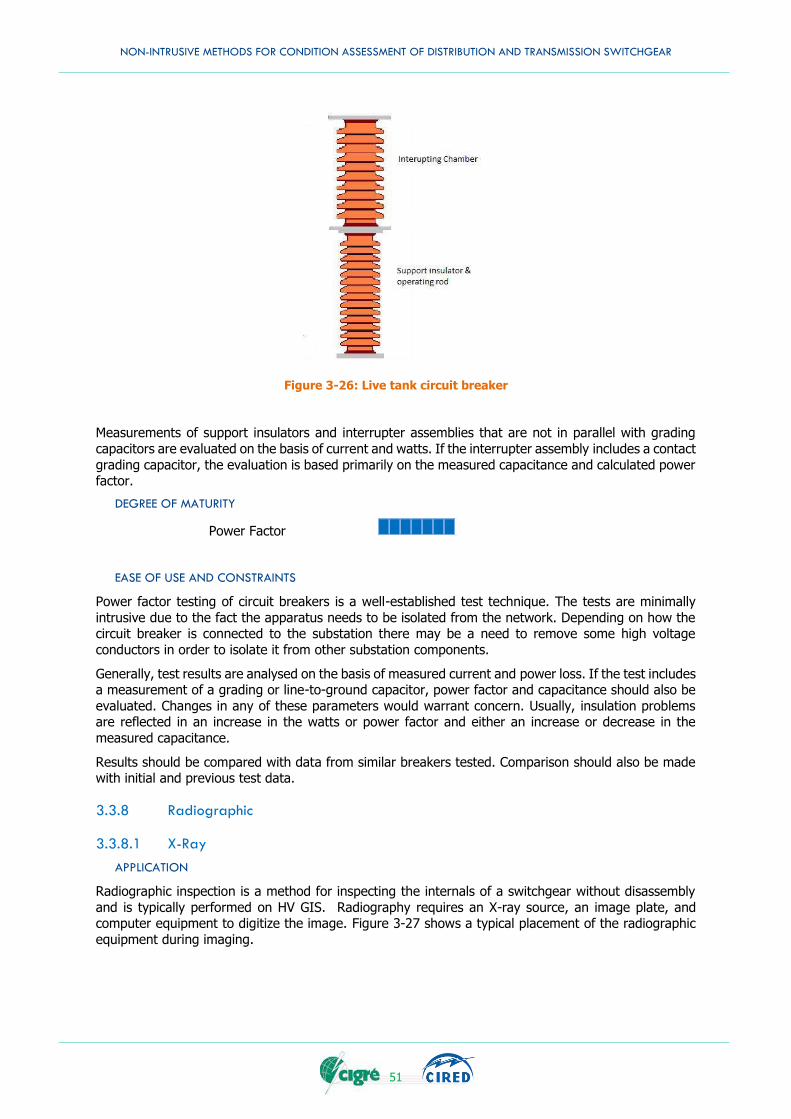
NON-INTRUSIVE METHODS FOR CONDITION ASSESSMENT OF DISTRIBUTION AND TRANSMISSION SWITCHGEAR
51
Figure 3-26: Live tank circuit breaker
Measurements of support insulators and interrupter assemblies that are not in parallel with grading
capacitors are evaluated on the basis of current and watts. If the interrupter assembly includes a contact
grading capacitor, the evaluation is based primarily on the measured capacitance and calculated power factor.
DEGREE OF MATURITY
Power Factor
EASE OF USE AND CONSTRAINTS
Power factor testing of circuit breakers is a well-established test technique. The tests are minimally
intrusive due to the fact the apparatus needs to be isolated from the network. Depending on how the circuit breaker is connected to the substation there may be a need to remove some high voltage
conductors in order to isolate it from other substation components.
Generally, test results are analysed on the basis of measured current and power loss. If the test includes a measurement of a grading or line-to-ground capacitor, power factor and capacitance should also be
evaluated. Changes in any of these parameters would warrant concern. Usually, insulation problems are reflected in an increase in the watts or power factor and either an increase or decrease in the
measured capacitance.
Results should be compared with data from similar breakers tested. Comparison should also be made with initial and previous test data.
3.3.8 Radiographic
3.3.8.1 X-Ray
APPLICATION
Radiographic inspection is a method for inspecting the internals of a switchgear without disassembly
and is typically performed on HV GIS. Radiography requires an X-ray source, an image plate, and computer equipment to digitize the image. Figure 3-27 shows a typical placement of the radiographic
equipment during imaging.
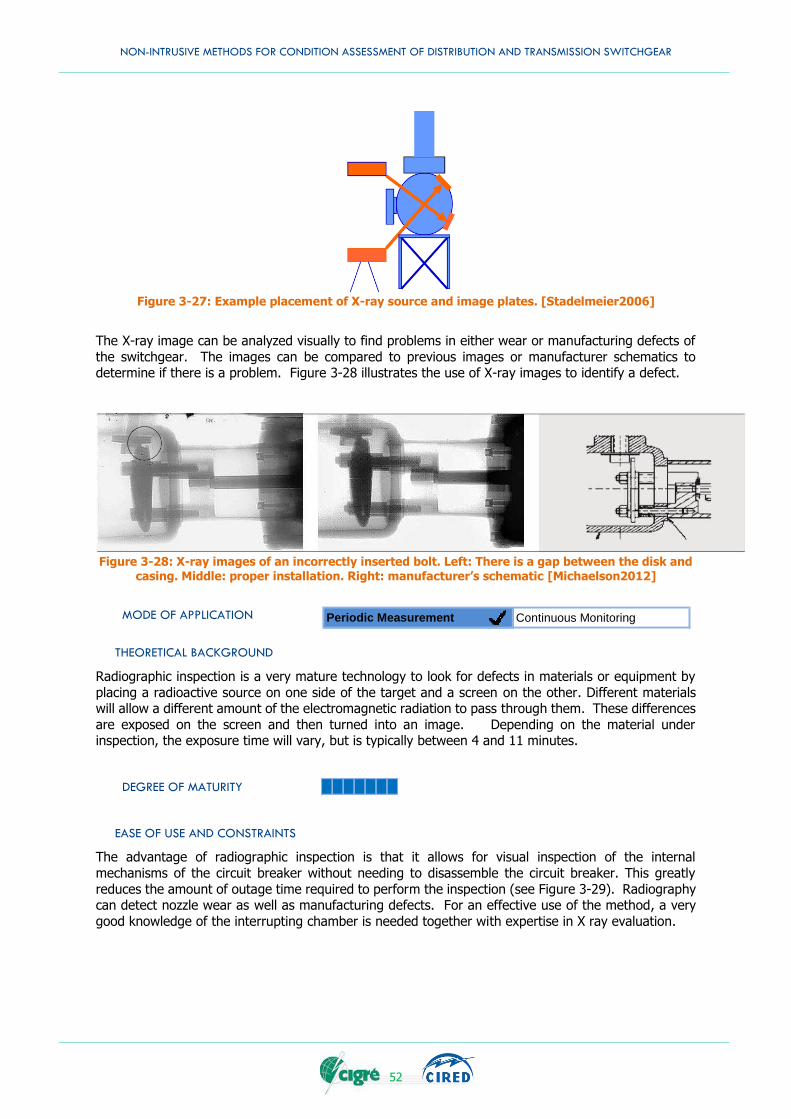
NON-INTRUSIVE METHODS FOR CONDITION ASSESSMENT OF DISTRIBUTION AND TRANSMISSION SWITCHGEAR
52
Figure 3-27: Example placement of X-ray source and image plates. [Stadelmeier2006]
The X-ray image can be analyzed visually to find problems in either wear or manufacturing defects of
the switchgear. The images can be compared to previous images or manufacturer schematics to determine if there is a problem. Figure 3-28 illustrates the use of X-ray images to identify a defect.
Figure 3-28: X-ray images of an incorrectly inserted bolt. Left: There is a gap between the disk and
casing. Middle: proper installation. Right: manufacturer’s schematic [Michaelson2012]
MODE OF APPLICATION
THEORETICAL BACKGROUND
Radiographic inspection is a very mature technology to look for defects in materials or equipment by
placing a radioactive source on one side of the target and a screen on the other. Different materials will allow a different amount of the electromagnetic radiation to pass through them. These differences
are exposed on the screen and then turned into an image. Depending on the material under inspection, the exposure time will vary, but is typically between 4 and 11 minutes.
DEGREE OF MATURITY
EASE OF USE AND CONSTRAINTS
The advantage of radiographic inspection is that it allows for visual inspection of the internal
mechanisms of the circuit breaker without needing to disassemble the circuit breaker. This greatly
reduces the amount of outage time required to perform the inspection (see Figure 3-29). Radiography can detect nozzle wear as well as manufacturing defects. For an effective use of the method, a very
good knowledge of the interrupting chamber is needed together with expertise in X ray evaluation.
Periodic Measurement Continuous Monitoring
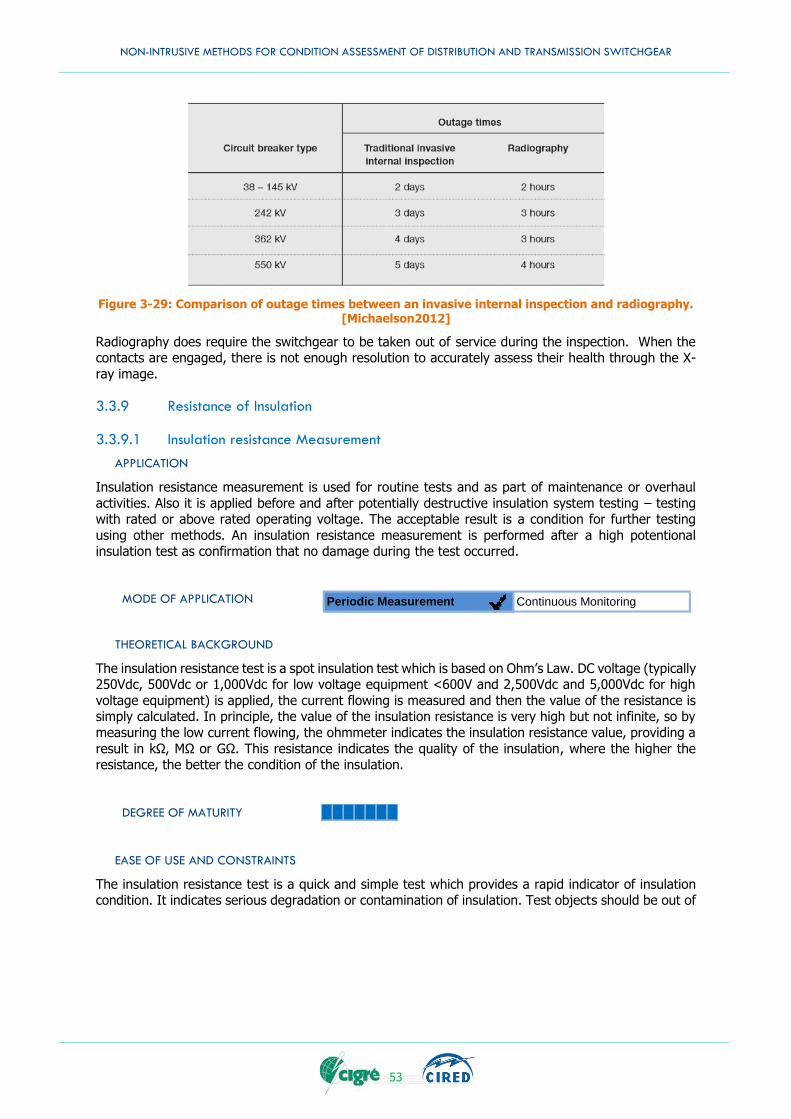
NON-INTRUSIVE METHODS FOR CONDITION ASSESSMENT OF DISTRIBUTION AND TRANSMISSION SWITCHGEAR
53
Figure 3-29: Comparison of outage times between an invasive internal inspection and radiography. [Michaelson2012]
Radiography does require the switchgear to be taken out of service during the inspection. When the contacts are engaged, there is not enough resolution to accurately assess their health through the X-
ray image.
3.3.9 Resistance of Insulation
3.3.9.1 Insulation resistance Measurement
APPLICATION
Insulation resistance measurement is used for routine tests and as part of maintenance or overhaul
activities. Also it is applied before and after potentially destructive insulation system testing – testing with rated or above rated operating voltage. The acceptable result is a condition for further testing
using other methods. An insulation resistance measurement is performed after a high potentional insulation test as confirmation that no damage during the test occurred.
MODE OF APPLICATION
THEORETICAL BACKGROUND
The insulation resistance test is a spot insulation test which is based on Ohm’s Law. DC voltage (typically 250Vdc, 500Vdc or 1,000Vdc for low voltage equipment <600V and 2,500Vdc and 5,000Vdc for high
voltage equipment) is applied, the current flowing is measured and then the value of the resistance is simply calculated. In principle, the value of the insulation resistance is very high but not infinite, so by
measuring the low current flowing, the ohmmeter indicates the insulation resistance value, providing a
result in kΩ, MΩ or GΩ. This resistance indicates the quality of the insulation, where the higher the resistance, the better the condition of the insulation.
DEGREE OF MATURITY
EASE OF USE AND CONSTRAINTS
The insulation resistance test is a quick and simple test which provides a rapid indicator of insulation condition. It indicates serious degradation or contamination of insulation. Test objects should be out of
Periodic Measurement Continuous Monitoring
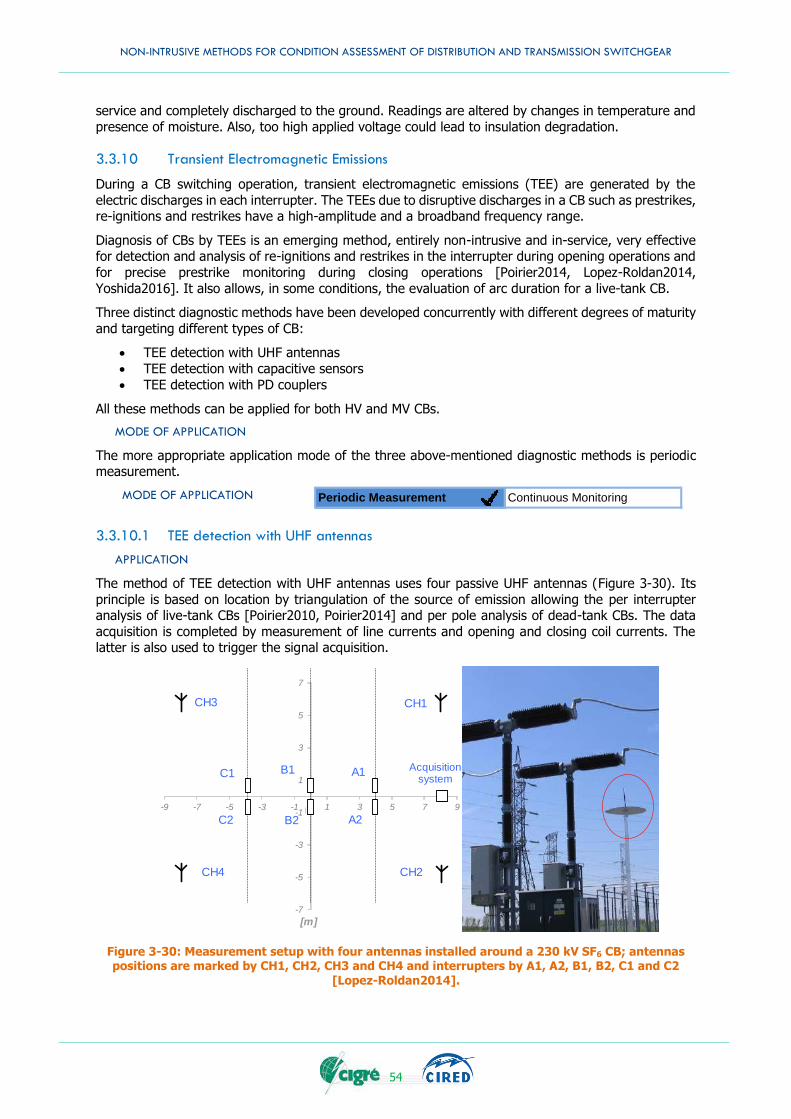
NON-INTRUSIVE METHODS FOR CONDITION ASSESSMENT OF DISTRIBUTION AND TRANSMISSION SWITCHGEAR
54
service and completely discharged to the ground. Readings are altered by changes in temperature and
presence of moisture. Also, too high applied voltage could lead to insulation degradation.
3.3.10 Transient Electromagnetic Emissions
During a CB switching operation, transient electromagnetic emissions (TEE) are generated by the
electric discharges in each interrupter. The TEEs due to disruptive discharges in a CB such as prestrikes, re-ignitions and restrikes have a high-amplitude and a broadband frequency range.
Diagnosis of CBs by TEEs is an emerging method, entirely non-intrusive and in-service, very effective for detection and analysis of re-ignitions and restrikes in the interrupter during opening operations and
for precise prestrike monitoring during closing operations [Poirier2014, Lopez-Roldan2014,
Yoshida2016]. It also allows, in some conditions, the evaluation of arc duration for a live-tank CB.
Three distinct diagnostic methods have been developed concurrently with different degrees of maturity
and targeting different types of CB:
TEE detection with UHF antennas
TEE detection with capacitive sensors
TEE detection with PD couplers
All these methods can be applied for both HV and MV CBs.
MODE OF APPLICATION
The more appropriate application mode of the three above-mentioned diagnostic methods is periodic measurement.
MODE OF APPLICATION
3.3.10.1 TEE detection with UHF antennas
APPLICATION
The method of TEE detection with UHF antennas uses four passive UHF antennas (Figure 3-30). Its
principle is based on location by triangulation of the source of emission allowing the per interrupter analysis of live-tank CBs [Poirier2010, Poirier2014] and per pole analysis of dead-tank CBs. The data
acquisition is completed by measurement of line currents and opening and closing coil currents. The latter is also used to trigger the signal acquisition.
Figure 3-30: Measurement setup with four antennas installed around a 230 kV SF6 CB; antennas positions are marked by CH1, CH2, CH3 and CH4 and interrupters by A1, A2, B1, B2, C1 and C2
[Lopez-Roldan2014].
CH1
CH2
CH3
CH4
A1
A2
B1
B2
C1
C2
Acquisition system
-7
-5
-3
-1
1
3
5
7
-9 -7 -5 -3 -1 1 3 5 7 9
[m]
Periodic Measurement Continuous Monitoring
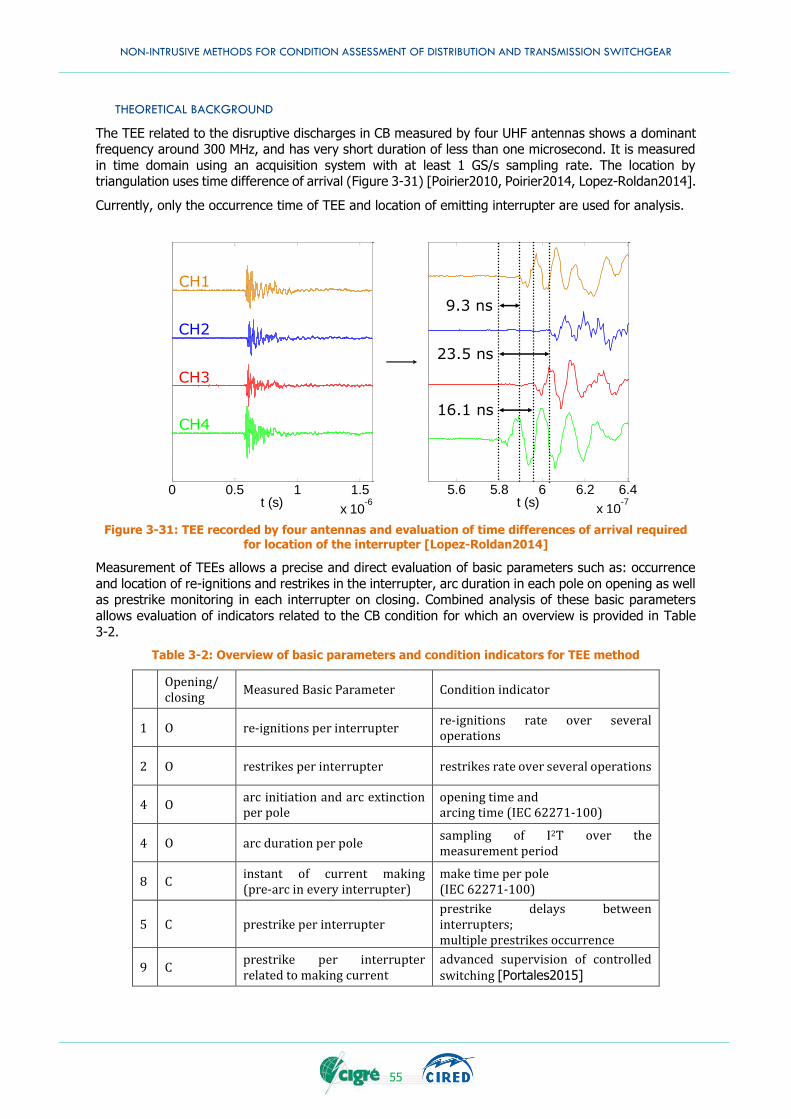
NON-INTRUSIVE METHODS FOR CONDITION ASSESSMENT OF DISTRIBUTION AND TRANSMISSION SWITCHGEAR
55
THEORETICAL BACKGROUND
The TEE related to the disruptive discharges in CB measured by four UHF antennas shows a dominant frequency around 300 MHz, and has very short duration of less than one microsecond. It is measured
in time domain using an acquisition system with at least 1 GS/s sampling rate. The location by triangulation uses time difference of arrival (Figure 3-31) [Poirier2010, Poirier2014, Lopez-Roldan2014].
Currently, only the occurrence time of TEE and location of emitting interrupter are used for analysis.
Figure 3-31: TEE recorded by four antennas and evaluation of time differences of arrival required
for location of the interrupter [Lopez-Roldan2014]
Measurement of TEEs allows a precise and direct evaluation of basic parameters such as: occurrence
and location of re-ignitions and restrikes in the interrupter, arc duration in each pole on opening as well as prestrike monitoring in each interrupter on closing. Combined analysis of these basic parameters
allows evaluation of indicators related to the CB condition for which an overview is provided in Table
3-2.
Table 3-2: Overview of basic parameters and condition indicators for TEE method
Opening/ closing
Measured Basic Parameter Condition indicator
1 O re-ignitions per interrupter re-ignitions rate over several operations
2 O restrikes per interrupter restrikes rate over several operations
4 O arc initiation and arc extinction per pole
opening time and arcing time (IEC 62271-100)
4 O arc duration per pole sampling of I2T over the measurement period
8 C instant of current making (pre-arc in every interrupter)
make time per pole (IEC 62271-100)
5 C prestrike per interrupter prestrike delays between interrupters; multiple prestrikes occurrence
9 C prestrike per interrupter related to making current
advanced supervision of controlled switching [Portales2015]
5.6 5.8 6 6.2 6.4
x 10-7t (s)
0 0.5 1 1.5
x 10-6t (s)
CH1
CH2
CH3
CH4
9.3 ns
23.5 ns
16.1 ns

NON-INTRUSIVE METHODS FOR CONDITION ASSESSMENT OF DISTRIBUTION AND TRANSMISSION SWITCHGEAR
56
DEGREE OF MATURITY
The system is tested in the field. Preindustrial prototype is available and is used on a regular basis at least in one utility. Many case studies are reported [Portales2015], [Doche2017].
TEE detection with UHF antennas
EASE OF USE AND CONSTRAINTS
The measuring system is installed and used while the CB operates normally and is installed for a limited
period of time (few months) which allows recording of a sufficient number of CB operations for statistical
analysis.
The installation and utilization are entirely non-intrusive. Clip-on current clamps need to be installed on
opening and closing coil conductor and, optionally, in the secondary circuit of current transformer.
3.3.10.2 TEE detection with with capacitive sensors
APPLICATION
The TEE detection with the capacitive sensors method is more suited for dead-tank CBs. It uses an
active high-frequency antenna (AA) placed in the vicinity of the CB and three broadband passive antennas (PA), acting as capacitive sensors of electric field, placed under each phase conductor (Figure
3-32). Its astuteness relies on the analysis of voltage image waveforms allowing per pole investigation [Lopez-Roldan2007, Lopez-Roldan2012].
Figure 3-32: Measurement setup with three PAs and one AA: (a) general test arrangement and (b) positioning of AA and three PAs next to a 275-kV dead tank CB [Lopez-Roldan2014].
THEORETICAL BACKGROUND
The TEEs related to the disruptive discharges in dead-tank CB are attenuated by the tank and its
bushings but they can be measured with AA. On the other hand the voltage perturbation is propagated on three phase conductors and can be captured by capacitive sensors (PA) (Figure 3-33). The analysis
of amplitude of PA recordings allows determining on which pole the discharge occurred. The signal of AA is used to trigger the signal acquisition.
PA
a b
AA CB
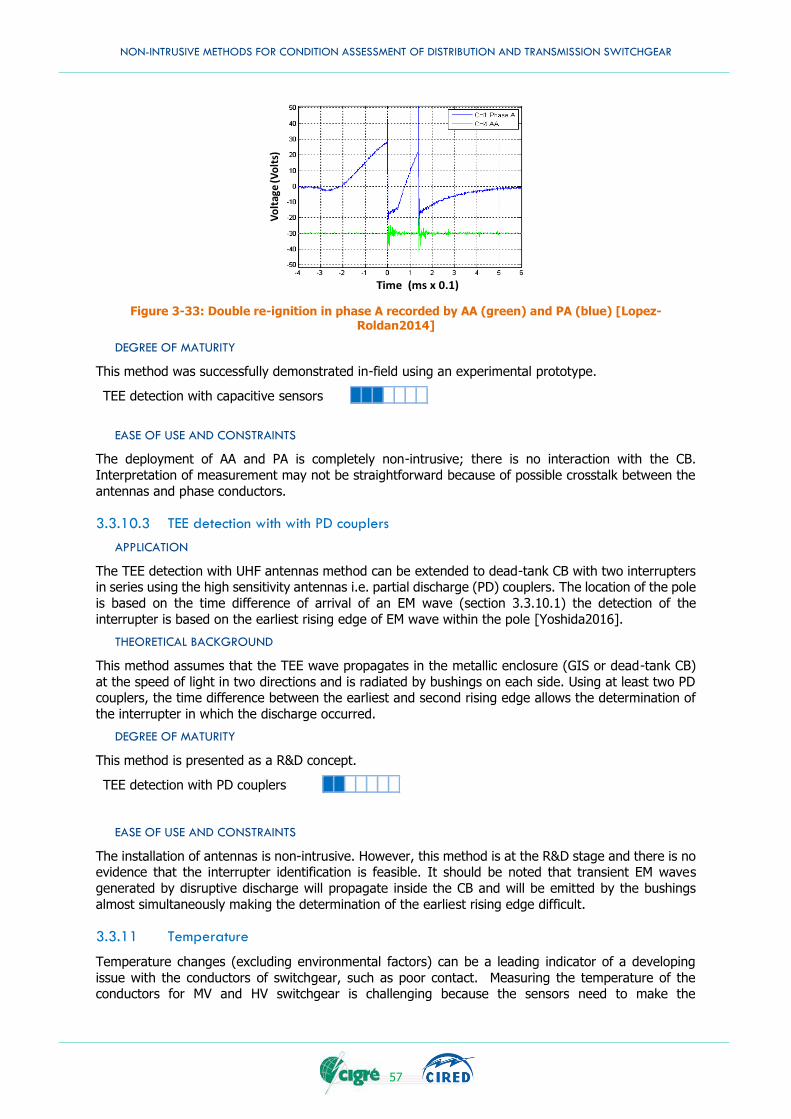
NON-INTRUSIVE METHODS FOR CONDITION ASSESSMENT OF DISTRIBUTION AND TRANSMISSION SWITCHGEAR
57
Figure 3-33: Double re-ignition in phase A recorded by AA (green) and PA (blue) [Lopez-Roldan2014]
DEGREE OF MATURITY
This method was successfully demonstrated in-field using an experimental prototype.
TEE detection with capacitive sensors
EASE OF USE AND CONSTRAINTS
The deployment of AA and PA is completely non-intrusive; there is no interaction with the CB.
Interpretation of measurement may not be straightforward because of possible crosstalk between the
antennas and phase conductors.
3.3.10.3 TEE detection with with PD couplers
APPLICATION
The TEE detection with UHF antennas method can be extended to dead-tank CB with two interrupters in series using the high sensitivity antennas i.e. partial discharge (PD) couplers. The location of the pole
is based on the time difference of arrival of an EM wave (section 3.3.10.1) the detection of the
interrupter is based on the earliest rising edge of EM wave within the pole [Yoshida2016].
THEORETICAL BACKGROUND
This method assumes that the TEE wave propagates in the metallic enclosure (GIS or dead-tank CB)
at the speed of light in two directions and is radiated by bushings on each side. Using at least two PD couplers, the time difference between the earliest and second rising edge allows the determination of
the interrupter in which the discharge occurred.
DEGREE OF MATURITY
This method is presented as a R&D concept.
TEE detection with PD couplers
EASE OF USE AND CONSTRAINTS
The installation of antennas is non-intrusive. However, this method is at the R&D stage and there is no evidence that the interrupter identification is feasible. It should be noted that transient EM waves
generated by disruptive discharge will propagate inside the CB and will be emitted by the bushings
almost simultaneously making the determination of the earliest rising edge difficult.
3.3.11 Temperature
Temperature changes (excluding environmental factors) can be a leading indicator of a developing
issue with the conductors of switchgear, such as poor contact. Measuring the temperature of the conductors for MV and HV switchgear is challenging because the sensors need to make the
Time (ms x 0.1)V
olt
age
(Vo
lts)
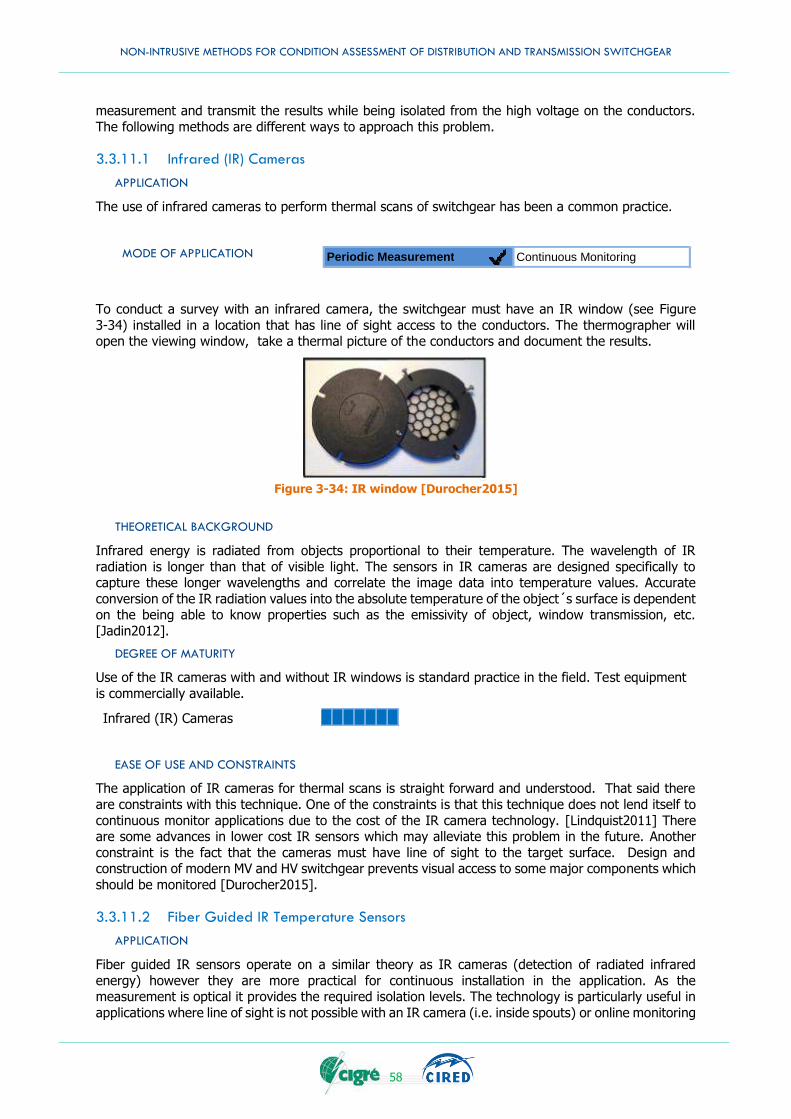
NON-INTRUSIVE METHODS FOR CONDITION ASSESSMENT OF DISTRIBUTION AND TRANSMISSION SWITCHGEAR
58
measurement and transmit the results while being isolated from the high voltage on the conductors.
The following methods are different ways to approach this problem.
3.3.11.1 Infrared (IR) Cameras
APPLICATION
The use of infrared cameras to perform thermal scans of switchgear has been a common practice.
MODE OF APPLICATION
To conduct a survey with an infrared camera, the switchgear must have an IR window (see Figure
3-34) installed in a location that has line of sight access to the conductors. The thermographer will open the viewing window, take a thermal picture of the conductors and document the results.
Figure 3-34: IR window [Durocher2015]
THEORETICAL BACKGROUND
Infrared energy is radiated from objects proportional to their temperature. The wavelength of IR
radiation is longer than that of visible light. The sensors in IR cameras are designed specifically to capture these longer wavelengths and correlate the image data into temperature values. Accurate
conversion of the IR radiation values into the absolute temperature of the object´s surface is dependent on the being able to know properties such as the emissivity of object, window transmission, etc.
[Jadin2012].
DEGREE OF MATURITY
Use of the IR cameras with and without IR windows is standard practice in the field. Test equipment
is commercially available.
Infrared (IR) Cameras
EASE OF USE AND CONSTRAINTS
The application of IR cameras for thermal scans is straight forward and understood. That said there
are constraints with this technique. One of the constraints is that this technique does not lend itself to
continuous monitor applications due to the cost of the IR camera technology. [Lindquist2011] There are some advances in lower cost IR sensors which may alleviate this problem in the future. Another
constraint is the fact that the cameras must have line of sight to the target surface. Design and construction of modern MV and HV switchgear prevents visual access to some major components which
should be monitored [Durocher2015].
3.3.11.2 Fiber Guided IR Temperature Sensors
APPLICATION
Fiber guided IR sensors operate on a similar theory as IR cameras (detection of radiated infrared
energy) however they are more practical for continuous installation in the application. As the measurement is optical it provides the required isolation levels. The technology is particularly useful in
applications where line of sight is not possible with an IR camera (i.e. inside spouts) or online monitoring
Periodic Measurement Continuous Monitoring
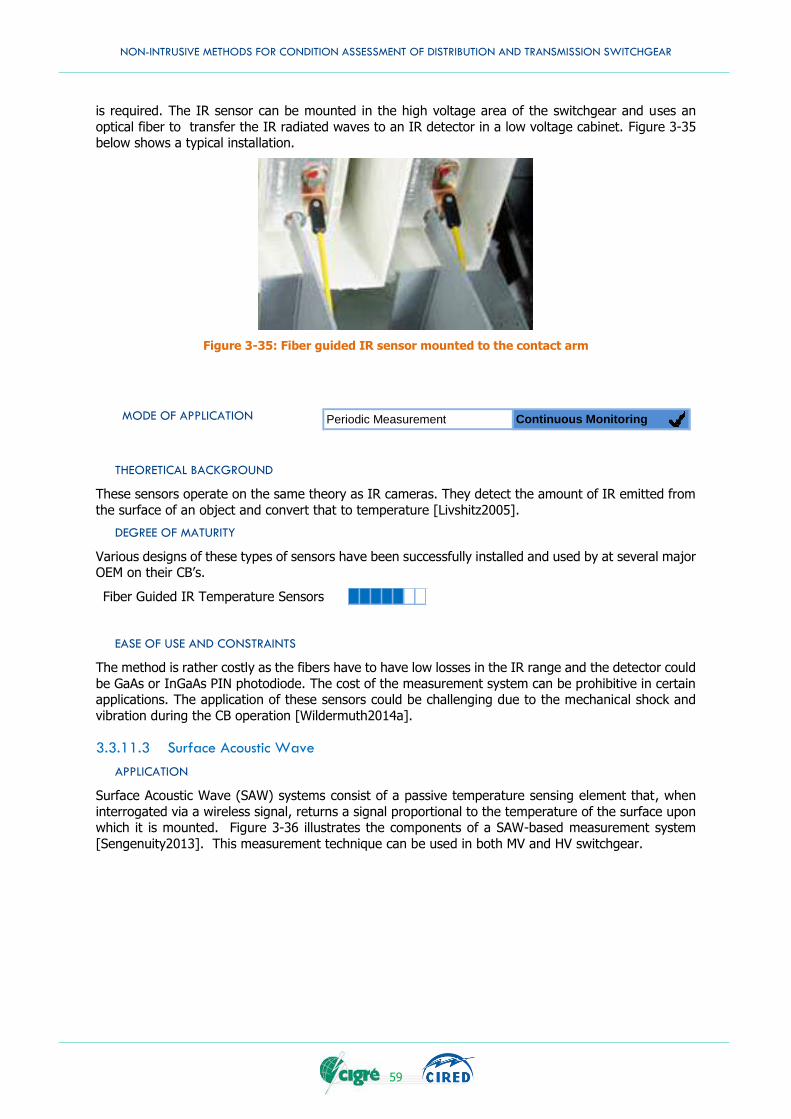
NON-INTRUSIVE METHODS FOR CONDITION ASSESSMENT OF DISTRIBUTION AND TRANSMISSION SWITCHGEAR
59
is required. The IR sensor can be mounted in the high voltage area of the switchgear and uses an
optical fiber to transfer the IR radiated waves to an IR detector in a low voltage cabinet. Figure 3-35 below shows a typical installation.
Figure 3-35: Fiber guided IR sensor mounted to the contact arm
MODE OF APPLICATION
THEORETICAL BACKGROUND
These sensors operate on the same theory as IR cameras. They detect the amount of IR emitted from
the surface of an object and convert that to temperature [Livshitz2005].
DEGREE OF MATURITY
Various designs of these types of sensors have been successfully installed and used by at several major OEM on their CB’s.
Fiber Guided IR Temperature Sensors
EASE OF USE AND CONSTRAINTS
The method is rather costly as the fibers have to have low losses in the IR range and the detector could
be GaAs or InGaAs PIN photodiode. The cost of the measurement system can be prohibitive in certain applications. The application of these sensors could be challenging due to the mechanical shock and
vibration during the CB operation [Wildermuth2014a].
3.3.11.3 Surface Acoustic Wave
APPLICATION
Surface Acoustic Wave (SAW) systems consist of a passive temperature sensing element that, when
interrogated via a wireless signal, returns a signal proportional to the temperature of the surface upon which it is mounted. Figure 3-36 illustrates the components of a SAW-based measurement system
[Sengenuity2013]. This measurement technique can be used in both MV and HV switchgear.
Periodic Measurement Continuous Monitoring
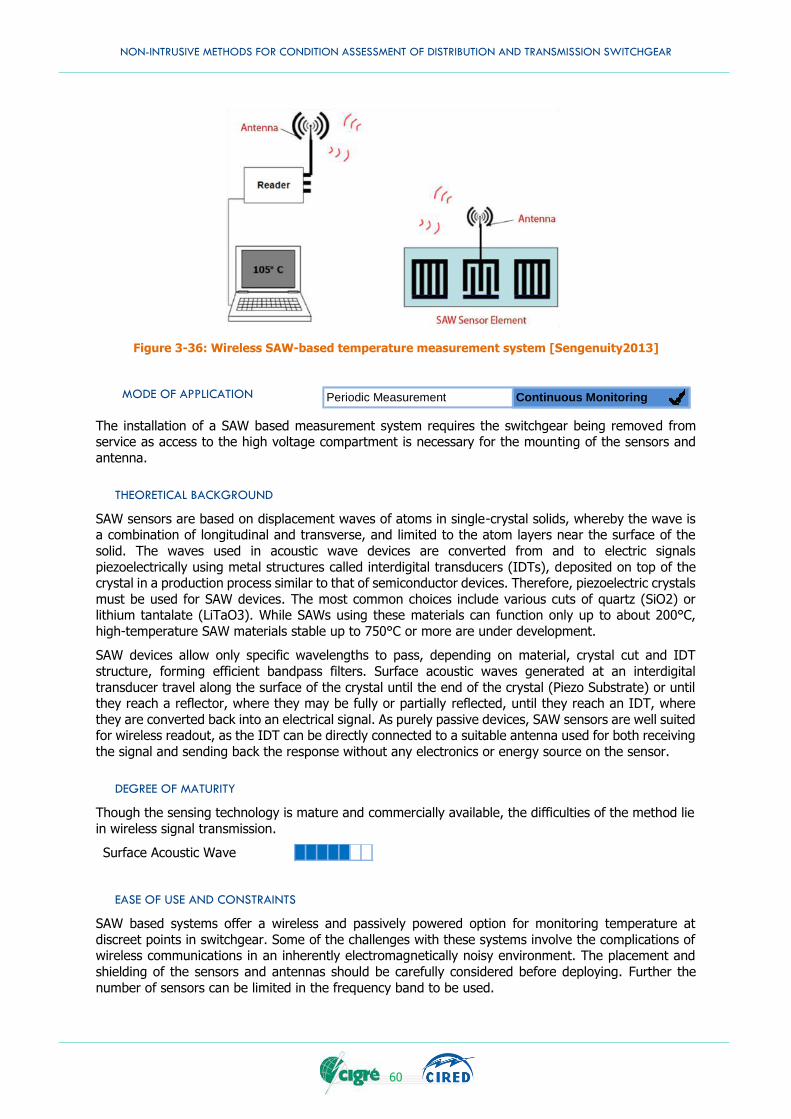
NON-INTRUSIVE METHODS FOR CONDITION ASSESSMENT OF DISTRIBUTION AND TRANSMISSION SWITCHGEAR
60
Figure 3-36: Wireless SAW-based temperature measurement system [Sengenuity2013]
MODE OF APPLICATION
The installation of a SAW based measurement system requires the switchgear being removed from service as access to the high voltage compartment is necessary for the mounting of the sensors and
antenna.
THEORETICAL BACKGROUND
SAW sensors are based on displacement waves of atoms in single-crystal solids, whereby the wave is a combination of longitudinal and transverse, and limited to the atom layers near the surface of the
solid. The waves used in acoustic wave devices are converted from and to electric signals
piezoelectrically using metal structures called interdigital transducers (IDTs), deposited on top of the crystal in a production process similar to that of semiconductor devices. Therefore, piezoelectric crystals
must be used for SAW devices. The most common choices include various cuts of quartz (SiO2) or lithium tantalate (LiTaO3). While SAWs using these materials can function only up to about 200°C,
high-temperature SAW materials stable up to 750°C or more are under development.
SAW devices allow only specific wavelengths to pass, depending on material, crystal cut and IDT
structure, forming efficient bandpass filters. Surface acoustic waves generated at an interdigital
transducer travel along the surface of the crystal until the end of the crystal (Piezo Substrate) or until they reach a reflector, where they may be fully or partially reflected, until they reach an IDT, where
they are converted back into an electrical signal. As purely passive devices, SAW sensors are well suited for wireless readout, as the IDT can be directly connected to a suitable antenna used for both receiving
the signal and sending back the response without any electronics or energy source on the sensor.
DEGREE OF MATURITY
Though the sensing technology is mature and commercially available, the difficulties of the method lie
in wireless signal transmission.
Surface Acoustic Wave
EASE OF USE AND CONSTRAINTS
SAW based systems offer a wireless and passively powered option for monitoring temperature at
discreet points in switchgear. Some of the challenges with these systems involve the complications of wireless communications in an inherently electromagnetically noisy environment. The placement and
shielding of the sensors and antennas should be carefully considered before deploying. Further the
number of sensors can be limited in the frequency band to be used.
Periodic Measurement Continuous Monitoring
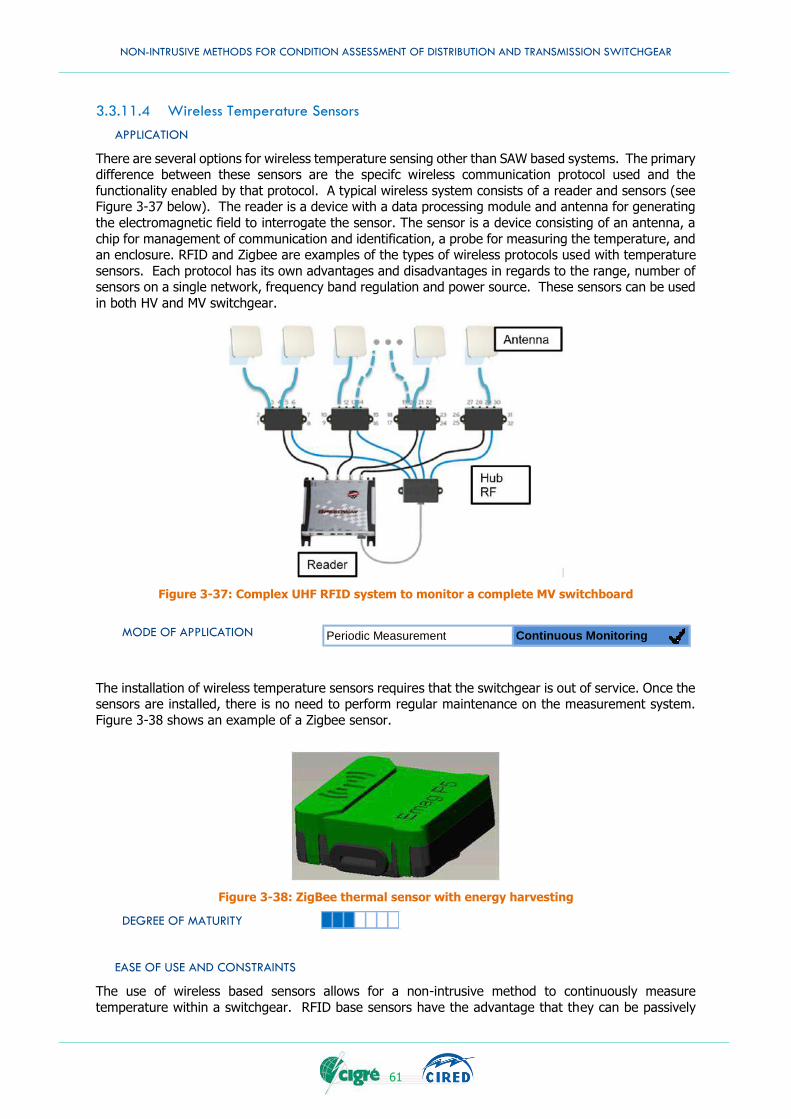
NON-INTRUSIVE METHODS FOR CONDITION ASSESSMENT OF DISTRIBUTION AND TRANSMISSION SWITCHGEAR
61
3.3.11.4 Wireless Temperature Sensors
APPLICATION
There are several options for wireless temperature sensing other than SAW based systems. The primary difference between these sensors are the specifc wireless communication protocol used and the
functionality enabled by that protocol. A typical wireless system consists of a reader and sensors (see Figure 3-37 below). The reader is a device with a data processing module and antenna for generating
the electromagnetic field to interrogate the sensor. The sensor is a device consisting of an antenna, a
chip for management of communication and identification, a probe for measuring the temperature, and an enclosure. RFID and Zigbee are examples of the types of wireless protocols used with temperature
sensors. Each protocol has its own advantages and disadvantages in regards to the range, number of sensors on a single network, frequency band regulation and power source. These sensors can be used
in both HV and MV switchgear.
Figure 3-37: Complex UHF RFID system to monitor a complete MV switchboard
MODE OF APPLICATION
The installation of wireless temperature sensors requires that the switchgear is out of service. Once the sensors are installed, there is no need to perform regular maintenance on the measurement system.
Figure 3-38 shows an example of a Zigbee sensor.
Figure 3-38: ZigBee thermal sensor with energy harvesting
DEGREE OF MATURITY
EASE OF USE AND CONSTRAINTS
The use of wireless based sensors allows for a non-intrusive method to continuously measure
temperature within a switchgear. RFID base sensors have the advantage that they can be passively
Periodic Measurement Continuous Monitoring
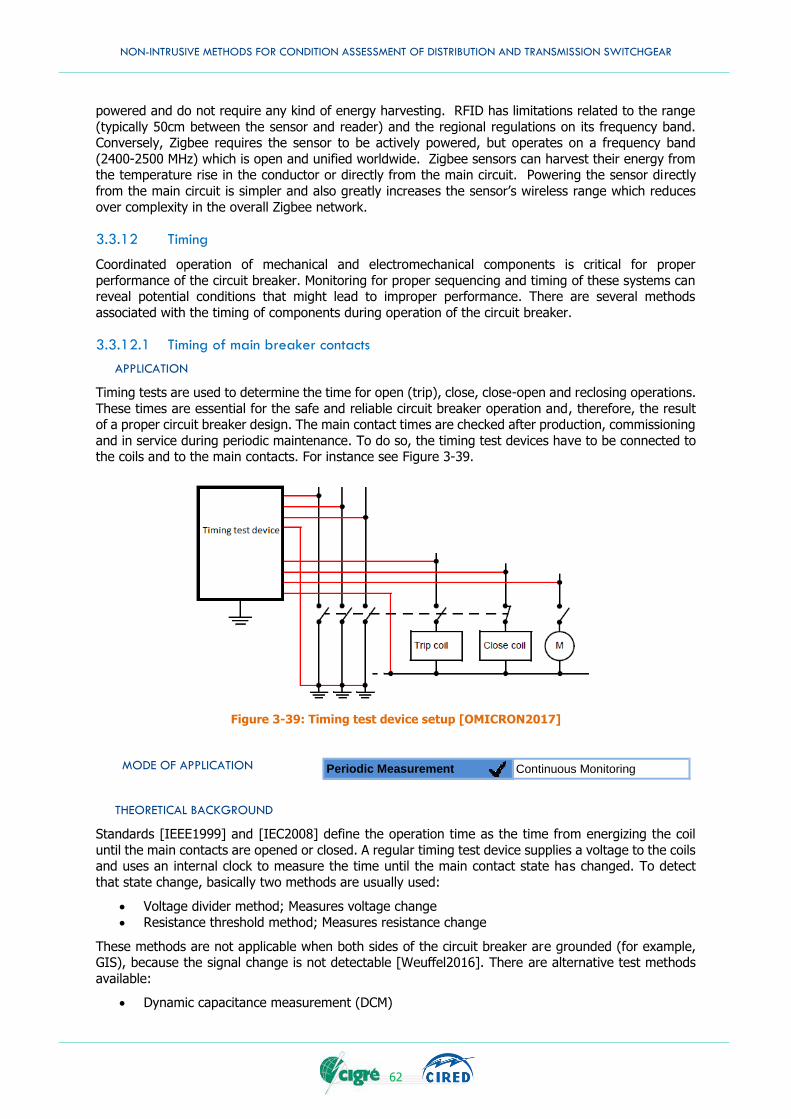
NON-INTRUSIVE METHODS FOR CONDITION ASSESSMENT OF DISTRIBUTION AND TRANSMISSION SWITCHGEAR
62
powered and do not require any kind of energy harvesting. RFID has limitations related to the range
(typically 50cm between the sensor and reader) and the regional regulations on its frequency band. Conversely, Zigbee requires the sensor to be actively powered, but operates on a frequency band
(2400-2500 MHz) which is open and unified worldwide. Zigbee sensors can harvest their energy from the temperature rise in the conductor or directly from the main circuit. Powering the sensor directly
from the main circuit is simpler and also greatly increases the sensor’s wireless range which reduces
over complexity in the overall Zigbee network.
3.3.12 Timing
Coordinated operation of mechanical and electromechanical components is critical for proper
performance of the circuit breaker. Monitoring for proper sequencing and timing of these systems can reveal potential conditions that might lead to improper performance. There are several methods
associated with the timing of components during operation of the circuit breaker.
3.3.12.1 Timing of main breaker contacts
APPLICATION
Timing tests are used to determine the time for open (trip), close, close-open and reclosing operations.
These times are essential for the safe and reliable circuit breaker operation and, therefore, the result of a proper circuit breaker design. The main contact times are checked after production, commissioning
and in service during periodic maintenance. To do so, the timing test devices have to be connected to the coils and to the main contacts. For instance see Figure 3-39.
Figure 3-39: Timing test device setup [OMICRON2017]
MODE OF APPLICATION
THEORETICAL BACKGROUND
Standards [IEEE1999] and [IEC2008] define the operation time as the time from energizing the coil
until the main contacts are opened or closed. A regular timing test device supplies a voltage to the coils and uses an internal clock to measure the time until the main contact state has changed. To detect
that state change, basically two methods are usually used:
Voltage divider method; Measures voltage change
Resistance threshold method; Measures resistance change
These methods are not applicable when both sides of the circuit breaker are grounded (for example, GIS), because the signal change is not detectable [Weuffel2016]. There are alternative test methods
available:
Dynamic capacitance measurement (DCM)
Periodic Measurement Continuous Monitoring
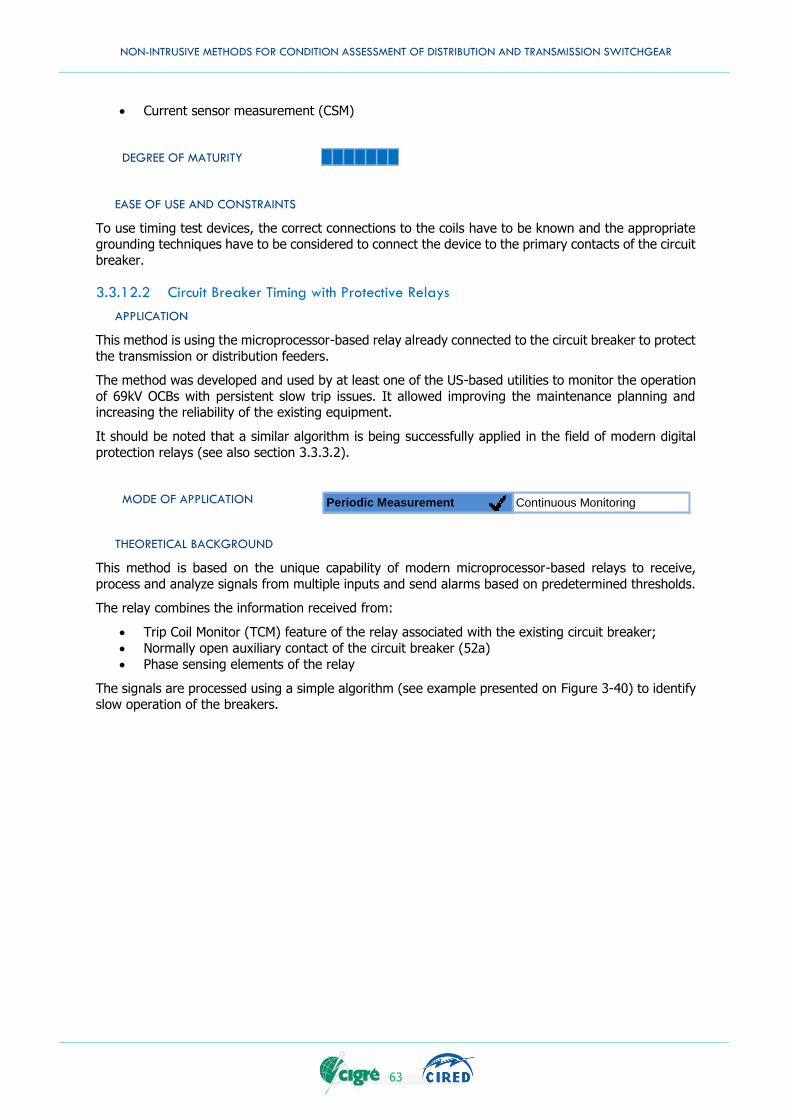
NON-INTRUSIVE METHODS FOR CONDITION ASSESSMENT OF DISTRIBUTION AND TRANSMISSION SWITCHGEAR
63
Current sensor measurement (CSM)
DEGREE OF MATURITY
EASE OF USE AND CONSTRAINTS
To use timing test devices, the correct connections to the coils have to be known and the appropriate grounding techniques have to be considered to connect the device to the primary contacts of the circuit
breaker.
3.3.12.2 Circuit Breaker Timing with Protective Relays
APPLICATION
This method is using the microprocessor-based relay already connected to the circuit breaker to protect
the transmission or distribution feeders.
The method was developed and used by at least one of the US-based utilities to monitor the operation
of 69kV OCBs with persistent slow trip issues. It allowed improving the maintenance planning and increasing the reliability of the existing equipment.
It should be noted that a similar algorithm is being successfully applied in the field of modern digital
protection relays (see also section 3.3.3.2).
MODE OF APPLICATION
THEORETICAL BACKGROUND
This method is based on the unique capability of modern microprocessor-based relays to receive,
process and analyze signals from multiple inputs and send alarms based on predetermined thresholds.
The relay combines the information received from:
Trip Coil Monitor (TCM) feature of the relay associated with the existing circuit breaker;
Normally open auxiliary contact of the circuit breaker (52a)
Phase sensing elements of the relay
The signals are processed using a simple algorithm (see example presented on Figure 3-40) to identify slow operation of the breakers.
Periodic Measurement Continuous Monitoring
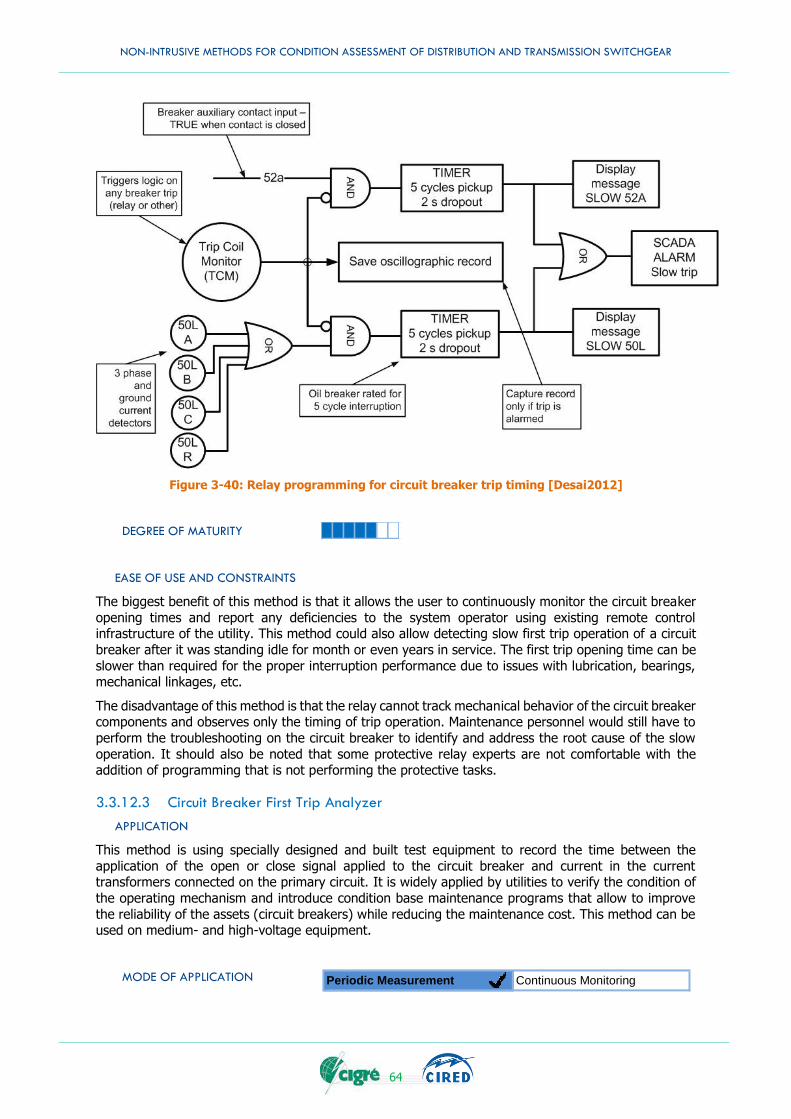
NON-INTRUSIVE METHODS FOR CONDITION ASSESSMENT OF DISTRIBUTION AND TRANSMISSION SWITCHGEAR
64
Figure 3-40: Relay programming for circuit breaker trip timing [Desai2012]
DEGREE OF MATURITY
EASE OF USE AND CONSTRAINTS
The biggest benefit of this method is that it allows the user to continuously monitor the circuit breaker
opening times and report any deficiencies to the system operator using existing remote control infrastructure of the utility. This method could also allow detecting slow first trip operation of a circuit
breaker after it was standing idle for month or even years in service. The first trip opening time can be
slower than required for the proper interruption performance due to issues with lubrication, bearings, mechanical linkages, etc.
The disadvantage of this method is that the relay cannot track mechanical behavior of the circuit breaker components and observes only the timing of trip operation. Maintenance personnel would still have to
perform the troubleshooting on the circuit breaker to identify and address the root cause of the slow
operation. It should also be noted that some protective relay experts are not comfortable with the addition of programming that is not performing the protective tasks.
3.3.12.3 Circuit Breaker First Trip Analyzer
APPLICATION
This method is using specially designed and built test equipment to record the time between the
application of the open or close signal applied to the circuit breaker and current in the current transformers connected on the primary circuit. It is widely applied by utilities to verify the condition of
the operating mechanism and introduce condition base maintenance programs that allow to improve
the reliability of the assets (circuit breakers) while reducing the maintenance cost. This method can be used on medium- and high-voltage equipment.
MODE OF APPLICATION
Periodic Measurement Continuous Monitoring
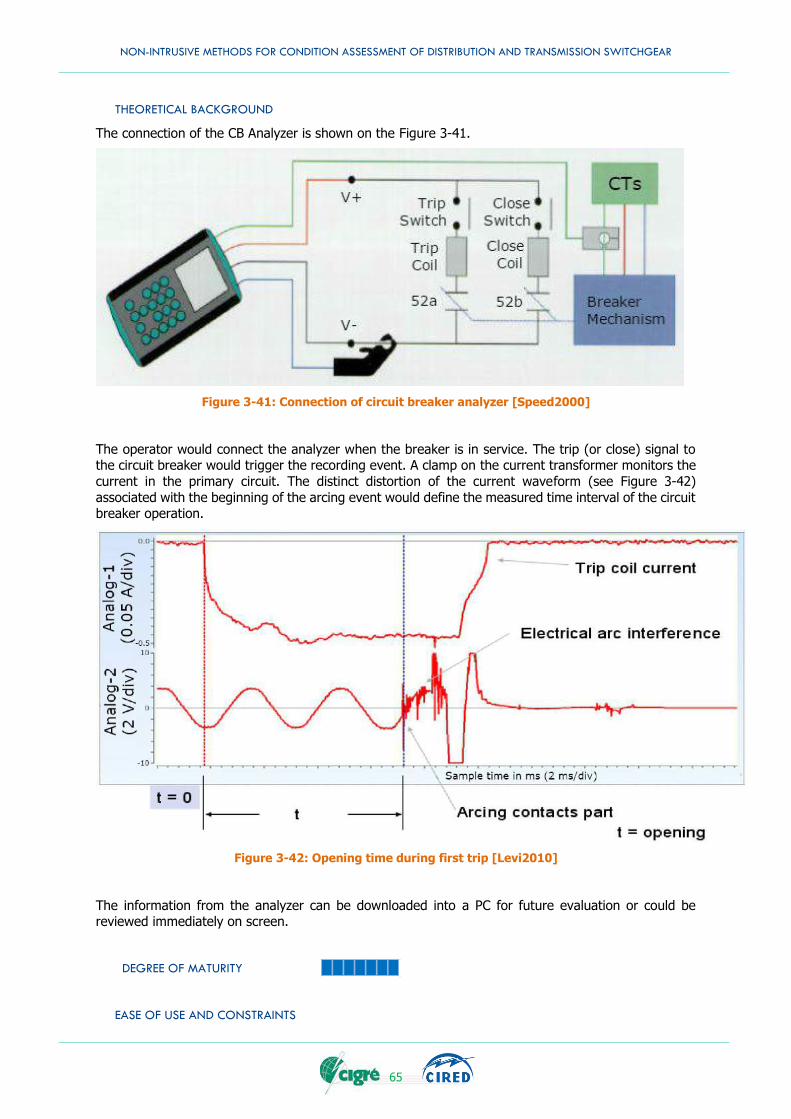
NON-INTRUSIVE METHODS FOR CONDITION ASSESSMENT OF DISTRIBUTION AND TRANSMISSION SWITCHGEAR
65
THEORETICAL BACKGROUND
The connection of the CB Analyzer is shown on the Figure 3-41.
Figure 3-41: Connection of circuit breaker analyzer [Speed2000]
The operator would connect the analyzer when the breaker is in service. The trip (or close) signal to the circuit breaker would trigger the recording event. A clamp on the current transformer monitors the
current in the primary circuit. The distinct distortion of the current waveform (see Figure 3-42)
associated with the beginning of the arcing event would define the measured time interval of the circuit breaker operation.
Figure 3-42: Opening time during first trip [Levi2010]
The information from the analyzer can be downloaded into a PC for future evaluation or could be reviewed immediately on screen.
DEGREE OF MATURITY
EASE OF USE AND CONSTRAINTS
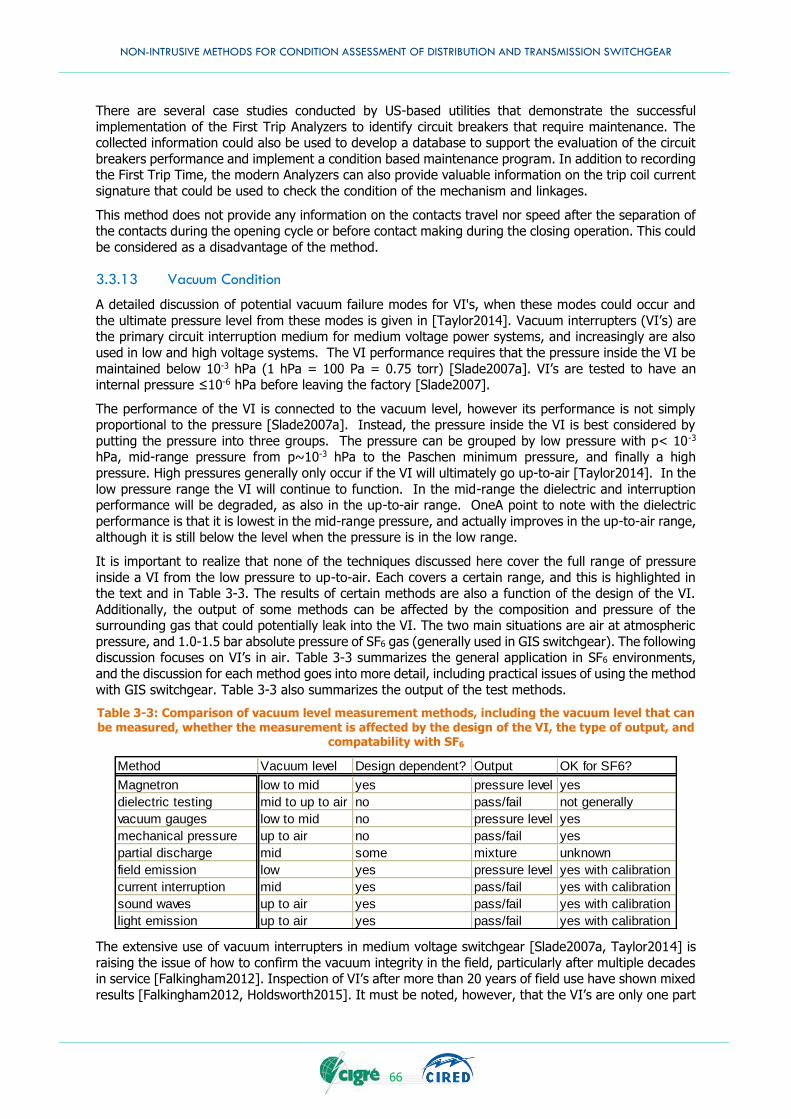
NON-INTRUSIVE METHODS FOR CONDITION ASSESSMENT OF DISTRIBUTION AND TRANSMISSION SWITCHGEAR
66
There are several case studies conducted by US-based utilities that demonstrate the successful
implementation of the First Trip Analyzers to identify circuit breakers that require maintenance. The collected information could also be used to develop a database to support the evaluation of the circuit
breakers performance and implement a condition based maintenance program. In addition to recording the First Trip Time, the modern Analyzers can also provide valuable information on the trip coil current
signature that could be used to check the condition of the mechanism and linkages.
This method does not provide any information on the contacts travel nor speed after the separation of the contacts during the opening cycle or before contact making during the closing operation. This could
be considered as a disadvantage of the method.
3.3.13 Vacuum Condition
A detailed discussion of potential vacuum failure modes for VI's, when these modes could occur and
the ultimate pressure level from these modes is given in [Taylor2014]. Vacuum interrupters (VI’s) are the primary circuit interruption medium for medium voltage power systems, and increasingly are also
used in low and high voltage systems. The VI performance requires that the pressure inside the VI be
maintained below 10-3 hPa (1 hPa = 100 Pa = 0.75 torr) [Slade2007a]. VI’s are tested to have an internal pressure ≤10-6 hPa before leaving the factory [Slade2007].
The performance of the VI is connected to the vacuum level, however its performance is not simply proportional to the pressure [Slade2007a]. Instead, the pressure inside the VI is best considered by
putting the pressure into three groups. The pressure can be grouped by low pressure with p< 10-3 hPa, mid-range pressure from p~10-3 hPa to the Paschen minimum pressure, and finally a high
pressure. High pressures generally only occur if the VI will ultimately go up-to-air [Taylor2014]. In the
low pressure range the VI will continue to function. In the mid-range the dielectric and interruption performance will be degraded, as also in the up-to-air range. OneA point to note with the dielectric
performance is that it is lowest in the mid-range pressure, and actually improves in the up-to-air range, although it is still below the level when the pressure is in the low range.
It is important to realize that none of the techniques discussed here cover the full range of pressure
inside a VI from the low pressure to up-to-air. Each covers a certain range, and this is highlighted in the text and in Table 3-3. The results of certain methods are also a function of the design of the VI.
Additionally, the output of some methods can be affected by the composition and pressure of the surrounding gas that could potentially leak into the VI. The two main situations are air at atmospheric
pressure, and 1.0-1.5 bar absolute pressure of SF6 gas (generally used in GIS switchgear). The following discussion focuses on VI’s in air. Table 3-3 summarizes the general application in SF6 environments,
and the discussion for each method goes into more detail, including practical issues of using the method
with GIS switchgear. Table 3-3 also summarizes the output of the test methods.
Table 3-3: Comparison of vacuum level measurement methods, including the vacuum level that can be measured, whether the measurement is affected by the design of the VI, the type of output, and
compatability with SF6
The extensive use of vacuum interrupters in medium voltage switchgear [Slade2007a, Taylor2014] is
raising the issue of how to confirm the vacuum integrity in the field, particularly after multiple decades in service [Falkingham2012]. Inspection of VI’s after more than 20 years of field use have shown mixed
results [Falkingham2012, Holdsworth2015]. It must be noted, however, that the VI’s are only one part
Method Vacuum level Design dependent? Output OK for SF6?
Magnetron low to mid yes pressure level yes
dielectric testing mid to up to air no pass/fail not generally
vacuum gauges low to mid no pressure level yes
mechanical pressure up to air no pass/fail yes
partial discharge mid some mixture unknown
field emission low yes pressure level yes with calibration
current interruption mid yes pass/fail yes with calibration
sound waves up to air yes pass/fail yes with calibration
light emission up to air yes pass/fail yes with calibration
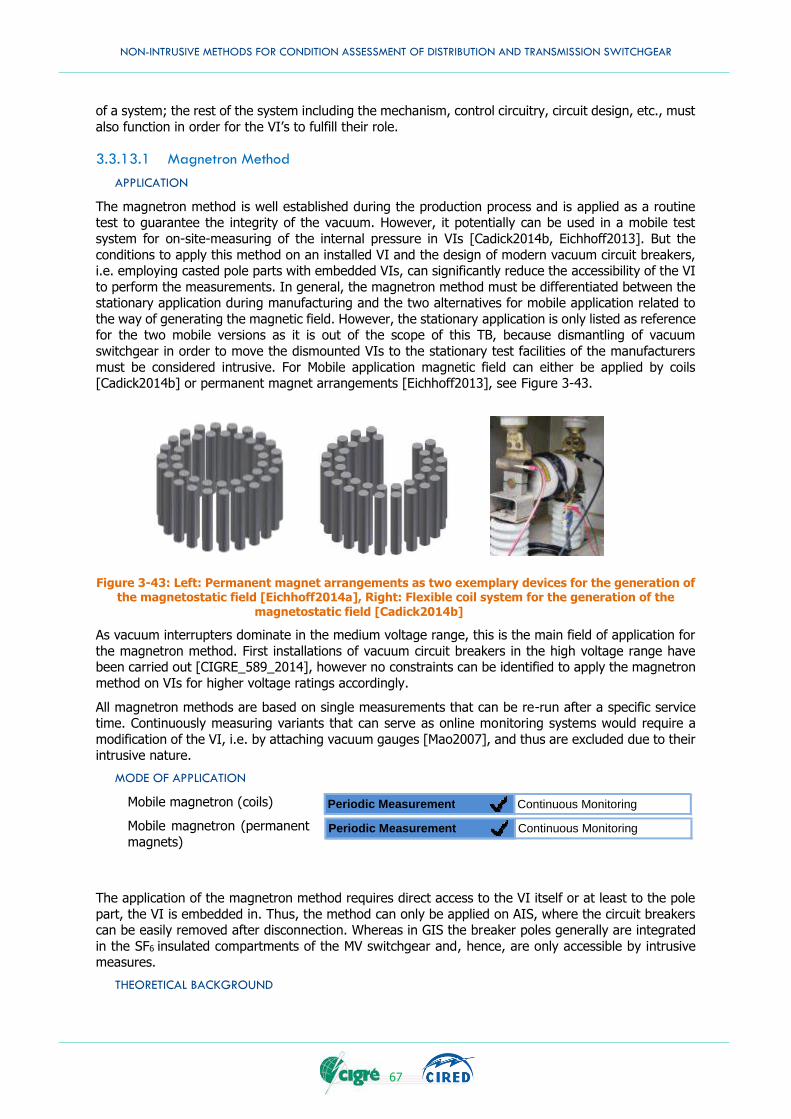
NON-INTRUSIVE METHODS FOR CONDITION ASSESSMENT OF DISTRIBUTION AND TRANSMISSION SWITCHGEAR
67
of a system; the rest of the system including the mechanism, control circuitry, circuit design, etc., must
also function in order for the VI’s to fulfill their role.
3.3.13.1 Magnetron Method
APPLICATION
The magnetron method is well established during the production process and is applied as a routine test to guarantee the integrity of the vacuum. However, it potentially can be used in a mobile test
system for on-site-measuring of the internal pressure in VIs [Cadick2014b, Eichhoff2013]. But the
conditions to apply this method on an installed VI and the design of modern vacuum circuit breakers, i.e. employing casted pole parts with embedded VIs, can significantly reduce the accessibility of the VI
to perform the measurements. In general, the magnetron method must be differentiated between the stationary application during manufacturing and the two alternatives for mobile application related to
the way of generating the magnetic field. However, the stationary application is only listed as reference for the two mobile versions as it is out of the scope of this TB, because dismantling of vacuum
switchgear in order to move the dismounted VIs to the stationary test facilities of the manufacturers
must be considered intrusive. For Mobile application magnetic field can either be applied by coils [Cadick2014b] or permanent magnet arrangements [Eichhoff2013], see Figure 3-43.
Figure 3-43: Left: Permanent magnet arrangements as two exemplary devices for the generation of
the magnetostatic field [Eichhoff2014a], Right: Flexible coil system for the generation of the magnetostatic field [Cadick2014b]
As vacuum interrupters dominate in the medium voltage range, this is the main field of application for
the magnetron method. First installations of vacuum circuit breakers in the high voltage range have been carried out [CIGRE_589_2014], however no constraints can be identified to apply the magnetron
method on VIs for higher voltage ratings accordingly.
All magnetron methods are based on single measurements that can be re-run after a specific service time. Continuously measuring variants that can serve as online monitoring systems would require a
modification of the VI, i.e. by attaching vacuum gauges [Mao2007], and thus are excluded due to their intrusive nature.
MODE OF APPLICATION
Mobile magnetron (coils)
Mobile magnetron (permanent
magnets)
The application of the magnetron method requires direct access to the VI itself or at least to the pole
part, the VI is embedded in. Thus, the method can only be applied on AIS, where the circuit breakers can be easily removed after disconnection. Whereas in GIS the breaker poles generally are integrated
in the SF6 insulated compartments of the MV switchgear and, hence, are only accessible by intrusive measures.
THEORETICAL BACKGROUND
Periodic Measurement Continuous Monitoring
Periodic Measurement Continuous Monitoring
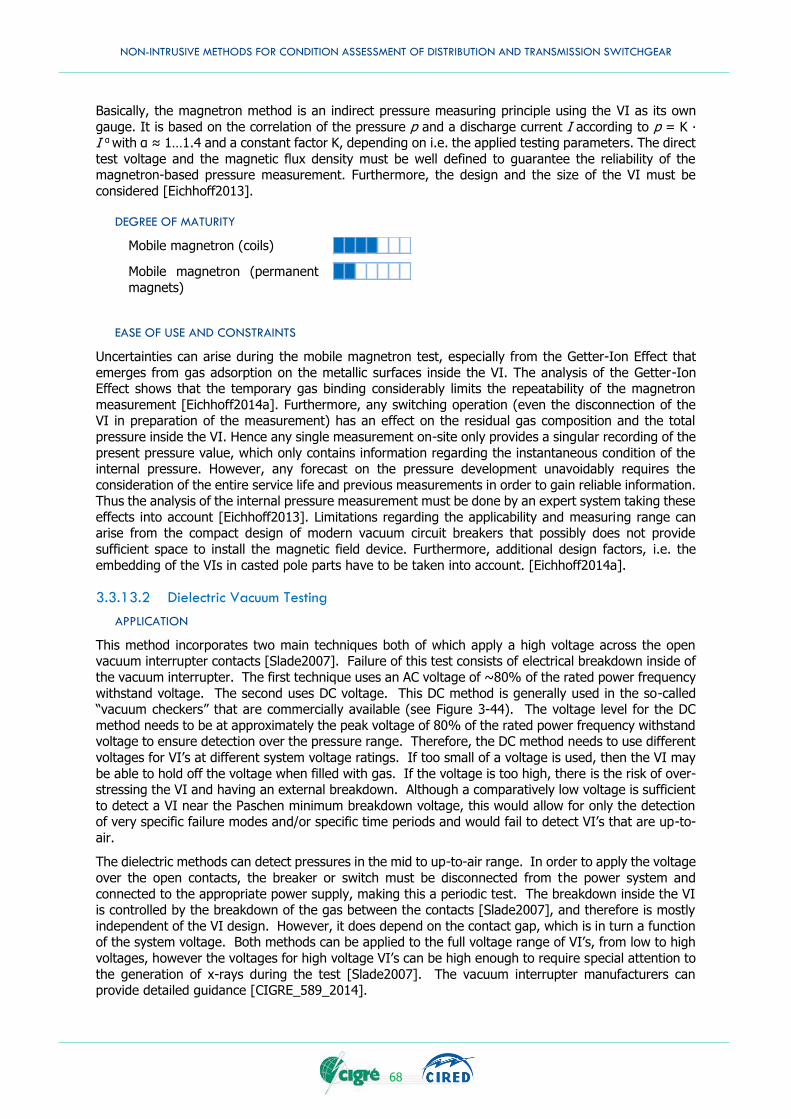
NON-INTRUSIVE METHODS FOR CONDITION ASSESSMENT OF DISTRIBUTION AND TRANSMISSION SWITCHGEAR
68
Basically, the magnetron method is an indirect pressure measuring principle using the VI as its own
gauge. It is based on the correlation of the pressure p and a discharge current I according to p = K ∙ I α with α ≈ 1…1.4 and a constant factor K, depending on i.e. the applied testing parameters. The direct
test voltage and the magnetic flux density must be well defined to guarantee the reliability of the magnetron-based pressure measurement. Furthermore, the design and the size of the VI must be
considered [Eichhoff2013].
DEGREE OF MATURITY
Mobile magnetron (coils)
Mobile magnetron (permanent
magnets)
EASE OF USE AND CONSTRAINTS
Uncertainties can arise during the mobile magnetron test, especially from the Getter-Ion Effect that
emerges from gas adsorption on the metallic surfaces inside the VI. The analysis of the Getter-Ion Effect shows that the temporary gas binding considerably limits the repeatability of the magnetron
measurement [Eichhoff2014a]. Furthermore, any switching operation (even the disconnection of the VI in preparation of the measurement) has an effect on the residual gas composition and the total
pressure inside the VI. Hence any single measurement on-site only provides a singular recording of the
present pressure value, which only contains information regarding the instantaneous condition of the internal pressure. However, any forecast on the pressure development unavoidably requires the
consideration of the entire service life and previous measurements in order to gain reliable information. Thus the analysis of the internal pressure measurement must be done by an expert system taking these
effects into account [Eichhoff2013]. Limitations regarding the applicability and measuring range can arise from the compact design of modern vacuum circuit breakers that possibly does not provide
sufficient space to install the magnetic field device. Furthermore, additional design factors, i.e. the
embedding of the VIs in casted pole parts have to be taken into account. [Eichhoff2014a].
3.3.13.2 Dielectric Vacuum Testing
APPLICATION
This method incorporates two main techniques both of which apply a high voltage across the open vacuum interrupter contacts [Slade2007]. Failure of this test consists of electrical breakdown inside of
the vacuum interrupter. The first technique uses an AC voltage of ~80% of the rated power frequency
withstand voltage. The second uses DC voltage. This DC method is generally used in the so-called “vacuum checkers” that are commercially available (see Figure 3-44). The voltage level for the DC
method needs to be at approximately the peak voltage of 80% of the rated power frequency withstand voltage to ensure detection over the pressure range. Therefore, the DC method needs to use different
voltages for VI’s at different system voltage ratings. If too small of a voltage is used, then the VI may
be able to hold off the voltage when filled with gas. If the voltage is too high, there is the risk of over-stressing the VI and having an external breakdown. Although a comparatively low voltage is sufficient
to detect a VI near the Paschen minimum breakdown voltage, this would allow for only the detection of very specific failure modes and/or specific time periods and would fail to detect VI’s that are up-to-
air.
The dielectric methods can detect pressures in the mid to up-to-air range. In order to apply the voltage
over the open contacts, the breaker or switch must be disconnected from the power system and
connected to the appropriate power supply, making this a periodic test. The breakdown inside the VI is controlled by the breakdown of the gas between the contacts [Slade2007], and therefore is mostly
independent of the VI design. However, it does depend on the contact gap, which is in turn a function of the system voltage. Both methods can be applied to the full voltage range of VI’s, from low to high
voltages, however the voltages for high voltage VI’s can be high enough to require special attention to
the generation of x-rays during the test [Slade2007]. The vacuum interrupter manufacturers can provide detailed guidance [CIGRE_589_2014].
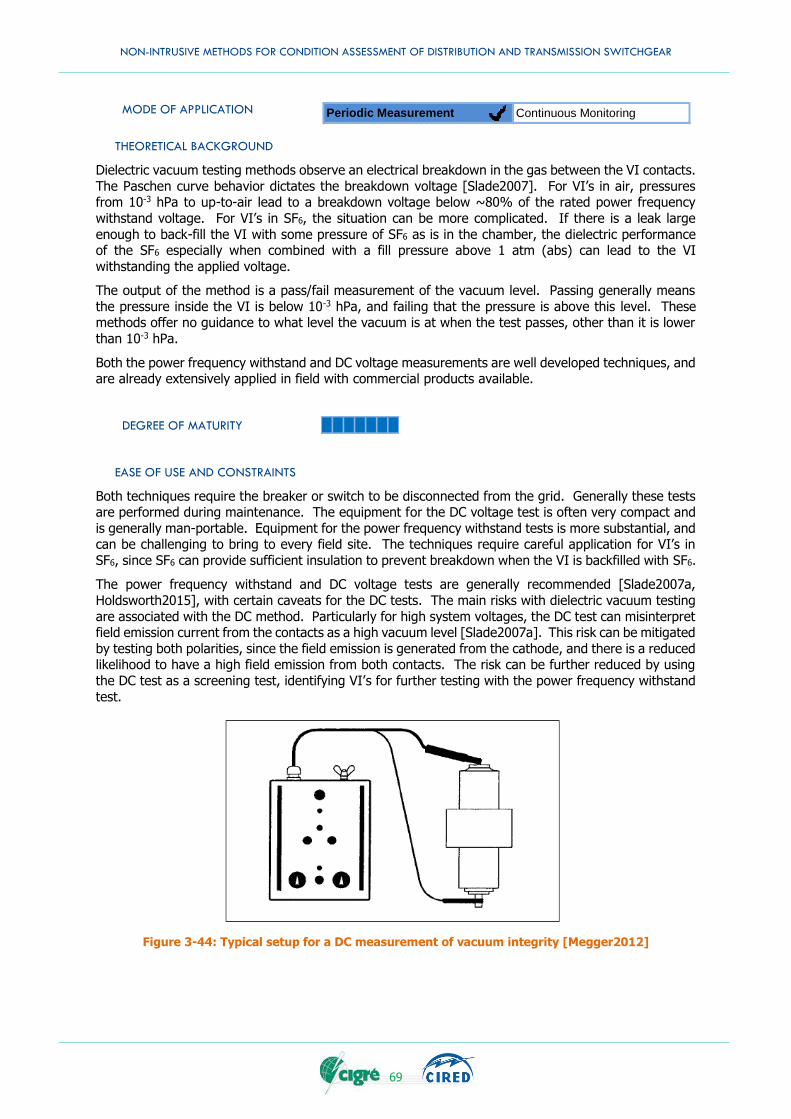
NON-INTRUSIVE METHODS FOR CONDITION ASSESSMENT OF DISTRIBUTION AND TRANSMISSION SWITCHGEAR
69
MODE OF APPLICATION
THEORETICAL BACKGROUND
Dielectric vacuum testing methods observe an electrical breakdown in the gas between the VI contacts.
The Paschen curve behavior dictates the breakdown voltage [Slade2007]. For VI’s in air, pressures from 10-3 hPa to up-to-air lead to a breakdown voltage below ~80% of the rated power frequency
withstand voltage. For VI’s in SF6, the situation can be more complicated. If there is a leak large
enough to back-fill the VI with some pressure of SF6 as is in the chamber, the dielectric performance of the SF6 especially when combined with a fill pressure above 1 atm (abs) can lead to the VI
withstanding the applied voltage.
The output of the method is a pass/fail measurement of the vacuum level. Passing generally means
the pressure inside the VI is below 10-3 hPa, and failing that the pressure is above this level. These methods offer no guidance to what level the vacuum is at when the test passes, other than it is lower
than 10-3 hPa.
Both the power frequency withstand and DC voltage measurements are well developed techniques, and are already extensively applied in field with commercial products available.
DEGREE OF MATURITY
EASE OF USE AND CONSTRAINTS
Both techniques require the breaker or switch to be disconnected from the grid. Generally these tests are performed during maintenance. The equipment for the DC voltage test is often very compact and
is generally man-portable. Equipment for the power frequency withstand tests is more substantial, and can be challenging to bring to every field site. The techniques require careful application for VI’s in
SF6, since SF6 can provide sufficient insulation to prevent breakdown when the VI is backfilled with SF6.
The power frequency withstand and DC voltage tests are generally recommended [Slade2007a,
Holdsworth2015], with certain caveats for the DC tests. The main risks with dielectric vacuum testing
are associated with the DC method. Particularly for high system voltages, the DC test can misinterpret field emission current from the contacts as a high vacuum level [Slade2007a]. This risk can be mitigated
by testing both polarities, since the field emission is generated from the cathode, and there is a reduced likelihood to have a high field emission from both contacts. The risk can be further reduced by using
the DC test as a screening test, identifying VI’s for further testing with the power frequency withstand
test.
Figure 3-44: Typical setup for a DC measurement of vacuum integrity [Megger2012]
Periodic Measurement Continuous Monitoring
NON-INTRUSIVE METHODS FOR CONDITION ASSESSMENT OF DISTRIBUTION AND TRANSMISSION SWITCHGEAR
70
3.3.13.3 Vacuum gauges
APPLICATION
The method involves incorporating a vacuum gauge directly into the vacuum interrupter, so that the pressure can be directly measured. The two main techniques would be building the VI with a cold
cathode [Mao2007] or a spinning rotor gauge [Schellekens2014]. The gauge would need to be brazed or in some other way permanently attached to the VI. The means that the materials used in the
construction of the gauge would need to be able to go through the brazing cycle of the VI with
temperatures between 800-900° C.
Both techniques are regularly used in the monitoring of actively pumped vacuum systems. These
provide measurements from the low to mid vacuum range, and could (at least conceptually) provide continuous monitoring of the vacuum pressure. Since the pressure is measured locally at the gauge,
the gauges do not need to be calibrated or adjusted to the particular VI design, as long as there is sufficient space to mount the gauge on the VI. Naturally the calibration for the particular gauge type
would need to be known beforehand. This technique would be applicable for low, medium and high
voltage VI’s.
MODE OF APPLICATION
THEORETICAL BACKGROUND
The cold cathode gauge operates under the same principle as discussed in the magnetron section. The magnetron method essentially uses the entire VI as the cold cathode gauge. The cold cathode gauge
requires a magnetic field to increase the chance of a collision with a molecule and a potential difference
(usually in the kilovolts range) between the two electrodes. The current drawn between the electrodes is then proportional to the pressure (Figure 3-45).
The spinning rotor gauge uses a small metal ball that is magnetically levitated and driven to rotate (Figure 3-46). The rotation rate is affected by the presence of gas, which increase the viscosity and
reduces the rotation rate. This rate is measured and is then proportional to the pressure.
Periodic Measurement Continuous Monitoring
Figure 3-45: Basic design of a cold cathode gauge [Mao2007]
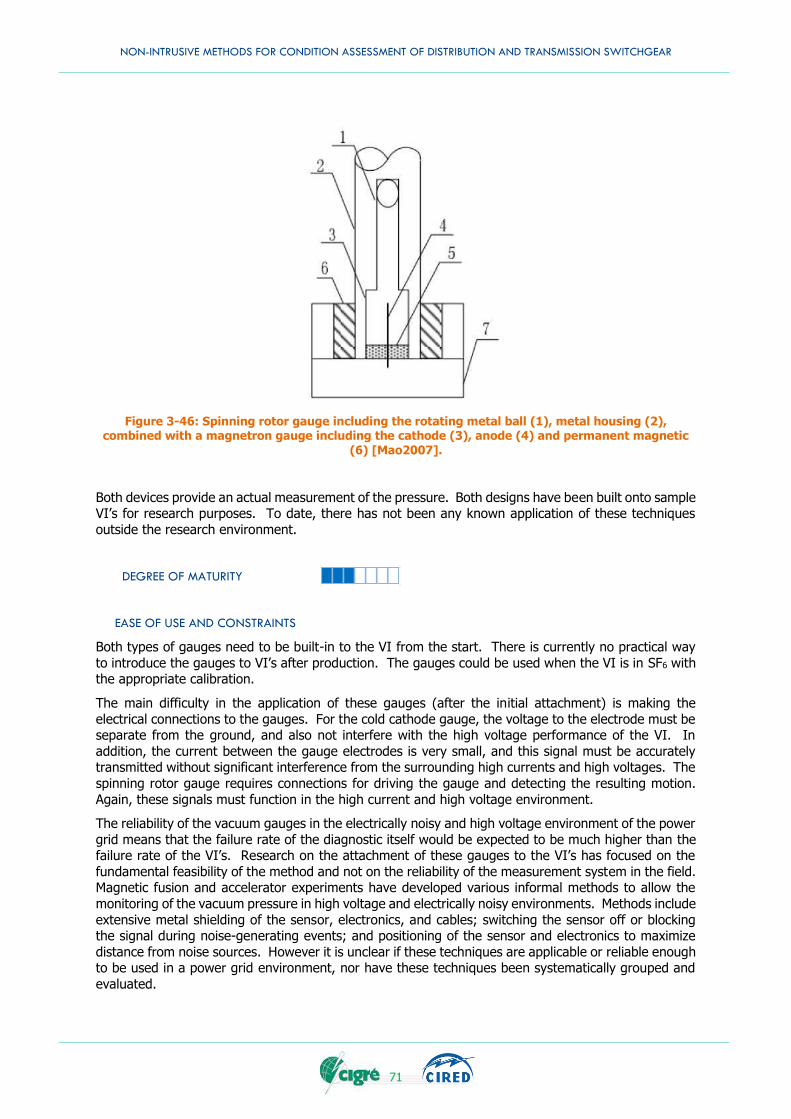
NON-INTRUSIVE METHODS FOR CONDITION ASSESSMENT OF DISTRIBUTION AND TRANSMISSION SWITCHGEAR
71
Figure 3-46: Spinning rotor gauge including the rotating metal ball (1), metal housing (2), combined with a magnetron gauge including the cathode (3), anode (4) and permanent magnetic
(6) [Mao2007].
Both devices provide an actual measurement of the pressure. Both designs have been built onto sample VI’s for research purposes. To date, there has not been any known application of these techniques
outside the research environment.
DEGREE OF MATURITY
EASE OF USE AND CONSTRAINTS
Both types of gauges need to be built-in to the VI from the start. There is currently no practical way
to introduce the gauges to VI’s after production. The gauges could be used when the VI is in SF6 with the appropriate calibration.
The main difficulty in the application of these gauges (after the initial attachment) is making the
electrical connections to the gauges. For the cold cathode gauge, the voltage to the electrode must be separate from the ground, and also not interfere with the high voltage performance of the VI. In
addition, the current between the gauge electrodes is very small, and this signal must be accurately transmitted without significant interference from the surrounding high currents and high voltages. The
spinning rotor gauge requires connections for driving the gauge and detecting the resulting motion.
Again, these signals must function in the high current and high voltage environment.
The reliability of the vacuum gauges in the electrically noisy and high voltage environment of the power
grid means that the failure rate of the diagnostic itself would be expected to be much higher than the failure rate of the VI’s. Research on the attachment of these gauges to the VI’s has focused on the
fundamental feasibility of the method and not on the reliability of the measurement system in the field. Magnetic fusion and accelerator experiments have developed various informal methods to allow the
monitoring of the vacuum pressure in high voltage and electrically noisy environments. Methods include
extensive metal shielding of the sensor, electronics, and cables; switching the sensor off or blocking the signal during noise-generating events; and positioning of the sensor and electronics to maximize
distance from noise sources. However it is unclear if these techniques are applicable or reliable enough to be used in a power grid environment, nor have these techniques been systematically grouped and
evaluated.
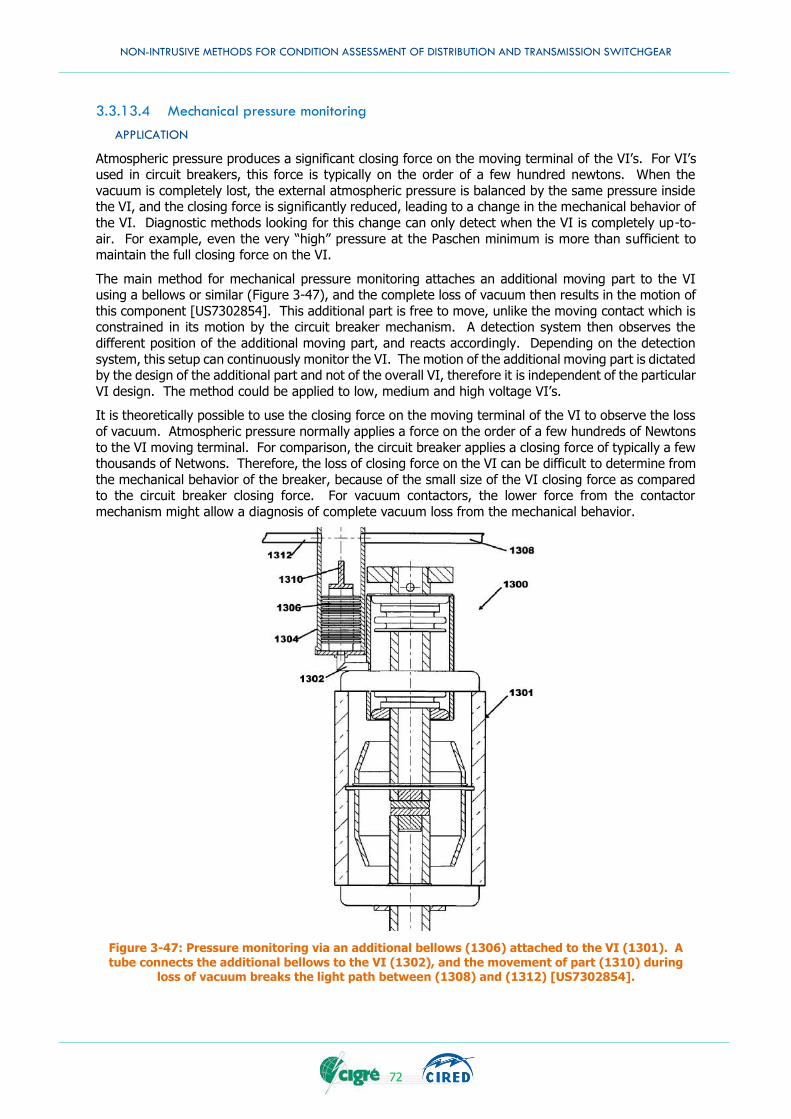
NON-INTRUSIVE METHODS FOR CONDITION ASSESSMENT OF DISTRIBUTION AND TRANSMISSION SWITCHGEAR
72
3.3.13.4 Mechanical pressure monitoring
APPLICATION
Atmospheric pressure produces a significant closing force on the moving terminal of the VI’s. For VI’s used in circuit breakers, this force is typically on the order of a few hundred newtons. When the
vacuum is completely lost, the external atmospheric pressure is balanced by the same pressure inside the VI, and the closing force is significantly reduced, leading to a change in the mechanical behavior of
the VI. Diagnostic methods looking for this change can only detect when the VI is completely up-to-
air. For example, even the very “high” pressure at the Paschen minimum is more than sufficient to maintain the full closing force on the VI.
The main method for mechanical pressure monitoring attaches an additional moving part to the VI using a bellows or similar (Figure 3-47), and the complete loss of vacuum then results in the motion of
this component [US7302854]. This additional part is free to move, unlike the moving contact which is constrained in its motion by the circuit breaker mechanism. A detection system then observes the
different position of the additional moving part, and reacts accordingly. Depending on the detection
system, this setup can continuously monitor the VI. The motion of the additional moving part is dictated by the design of the additional part and not of the overall VI, therefore it is independent of the particular
VI design. The method could be applied to low, medium and high voltage VI’s.
It is theoretically possible to use the closing force on the moving terminal of the VI to observe the loss
of vacuum. Atmospheric pressure normally applies a force on the order of a few hundreds of Newtons
to the VI moving terminal. For comparison, the circuit breaker applies a closing force of typically a few thousands of Netwons. Therefore, the loss of closing force on the VI can be difficult to determine from
the mechanical behavior of the breaker, because of the small size of the VI closing force as compared to the circuit breaker closing force. For vacuum contactors, the lower force from the contactor
mechanism might allow a diagnosis of complete vacuum loss from the mechanical behavior.
Figure 3-47: Pressure monitoring via an additional bellows (1306) attached to the VI (1301). A tube connects the additional bellows to the VI (1302), and the movement of part (1310) during
loss of vacuum breaks the light path between (1308) and (1312) [US7302854].
NON-INTRUSIVE METHODS FOR CONDITION ASSESSMENT OF DISTRIBUTION AND TRANSMISSION SWITCHGEAR
73
MODE OF APPLICATION
THEORETICAL BACKGROUND
The technique measures a mechanical change due to the loss of the closing force from the atmospheric
pressure on the moving terminal of the VI. This technique would only provide a pass/fail measurement of whether the VI was up-to-air or not. The pressures around the Paschen minimum and other points
where the VI performance starts to be affected are far too low to produce any detectable mechanical change.
A key part of the measurement method is the detection system. One implementation uses an optical
system to detect the motion [US7802480]. The motion disturbs an optical path between two fibers, either stopping the light transmission, or allowing the light through by inserting a mirror or removing a
block. The light can be guided through fiber optics to the detection system. This maintains an electrical separation between the VI and the measurement system, and allows the electronics to be placed in the
low voltage compartment of the switchgear. A second implementation uses the motion of the additional
part to make or break an electrical connection. Since this contact must be electrically isolated from earth, this signal must be converted into an optical signal for transmission along a fiber optic, or be
converted into a wireless signal (RF, etc.). This requires a microelectronic circuit near the VI to convert the signal, together with some method of powering the circuit while maintaining the electrical isolation.
Mechanical pressure monitoring has been implemented into prototype products from one manufacturer. The field experience with this method is not known.
DEGREE OF MATURITY
EASE OF USE AND CONSTRAINTS
The moving part needed for the pressure monitoring must be installed on the VI during its initial manufacturing. There is no possibility to add this to already built VI’s. It is conceivable to add VI’s
with this feature to existing circuit breakers, along with the monitoring equipment. However, the practical issues with fitting a VI with the extension for the extra part into existing equipment will most
likely prevent this. The method is generally compatible with SF6, oil, and solid insulation as long as
practical issues of space, guiding the light to the detection equipment, etc., can be dealt with.
The main risk is the reliability of the measurement equipment as compared to the VI’s. In general, the
additional parts brazed to the VI lead to additional potential leak paths. Also, these components can be more fragile and/or vulnerable to damage during installation that can lead to a loss of vacuum. The
optical technique has the advantage of moving the non-optical components into the low voltage
compartment of the switchgear. However, fiber optics are vulnerable to misalignment of the two fibers, damage on installation, blockage by condensation or dust, etc. The electrical contact method of motion
detection needs a powered microcircuit near the VI that is also electrically isolated. This creates several potential failure modes related to the microcircuit reliability, successful transmission of the signal,
powering of the circuit, and maintaining the electrical isolation.
3.3.13.5 Partial discharge (PD)
APPLICATION
Partial discharge is a well developed technique often used to detect defects and voids in solid insulation.
The application of an AC voltage below the breakdown voltage can generate microdischarges. These microdischarges transfer some pico-coulombs of charge, and can be detected with specialized
equipment. In vacuum, various features of the partial discharge signal change with the internal
pressure of the VI [Yokomichi2016]. These systems could detect vacuum levels in the mid-range (Figure 3-48). The performance in the up-to-air region is unknown. Acquiring a PD signal requires a
voltage difference in the VI; generally this would be over the open contacts. The need to open the contacts and stop the power flow leads to a periodic measurement of the pressure. The PD signal
Periodic Measurement Continuous Monitoring
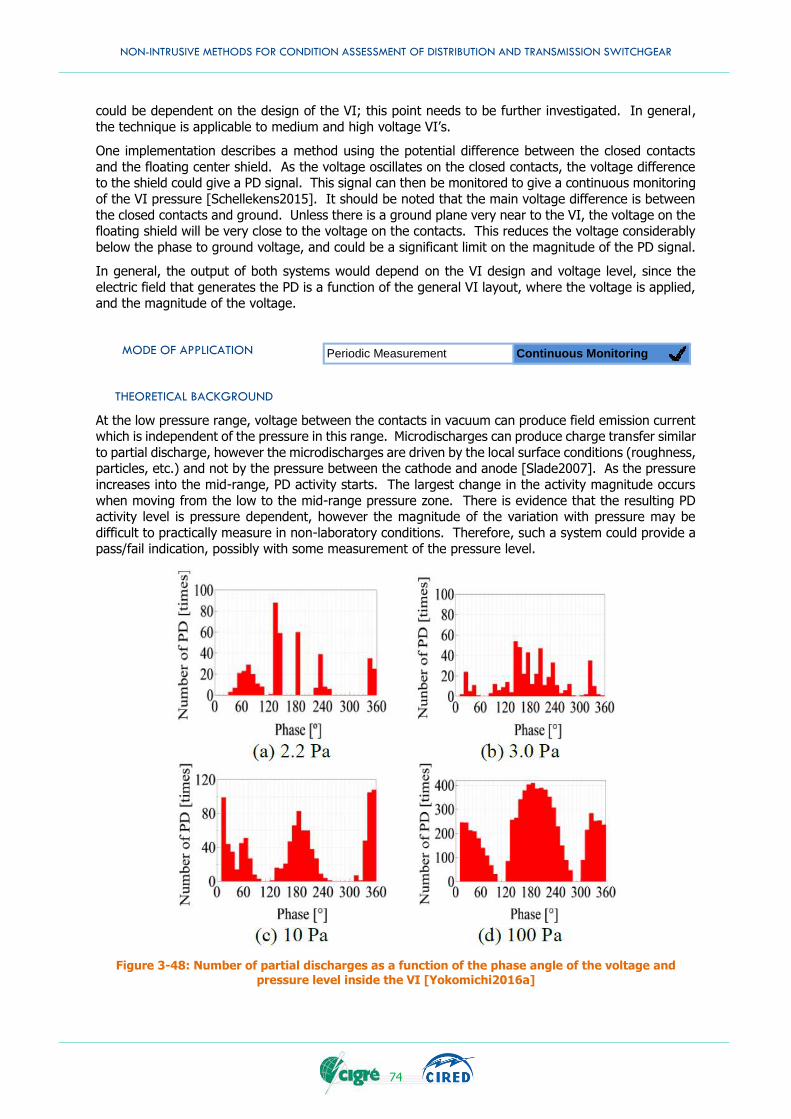
NON-INTRUSIVE METHODS FOR CONDITION ASSESSMENT OF DISTRIBUTION AND TRANSMISSION SWITCHGEAR
74
could be dependent on the design of the VI; this point needs to be further investigated. In general,
the technique is applicable to medium and high voltage VI’s.
One implementation describes a method using the potential difference between the closed contacts
and the floating center shield. As the voltage oscillates on the closed contacts, the voltage difference to the shield could give a PD signal. This signal can then be monitored to give a continuous monitoring
of the VI pressure [Schellekens2015]. It should be noted that the main voltage difference is between
the closed contacts and ground. Unless there is a ground plane very near to the VI, the voltage on the floating shield will be very close to the voltage on the contacts. This reduces the voltage considerably
below the phase to ground voltage, and could be a significant limit on the magnitude of the PD signal.
In general, the output of both systems would depend on the VI design and voltage level, since the
electric field that generates the PD is a function of the general VI layout, where the voltage is applied, and the magnitude of the voltage.
MODE OF APPLICATION
THEORETICAL BACKGROUND
At the low pressure range, voltage between the contacts in vacuum can produce field emission current which is independent of the pressure in this range. Microdischarges can produce charge transfer similar
to partial discharge, however the microdischarges are driven by the local surface conditions (roughness, particles, etc.) and not by the pressure between the cathode and anode [Slade2007]. As the pressure
increases into the mid-range, PD activity starts. The largest change in the activity magnitude occurs
when moving from the low to the mid-range pressure zone. There is evidence that the resulting PD activity level is pressure dependent, however the magnitude of the variation with pressure may be
difficult to practically measure in non-laboratory conditions. Therefore, such a system could provide a pass/fail indication, possibly with some measurement of the pressure level.
Figure 3-48: Number of partial discharges as a function of the phase angle of the voltage and
pressure level inside the VI [Yokomichi2016a]
Periodic Measurement Continuous Monitoring
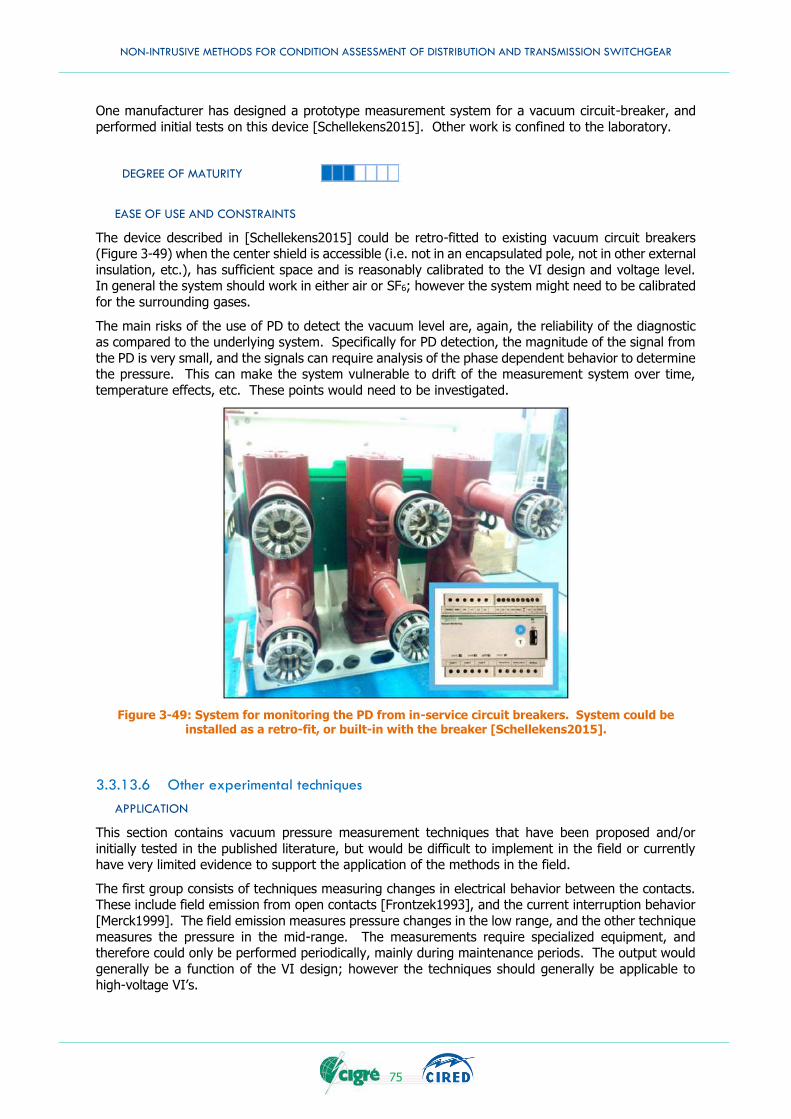
NON-INTRUSIVE METHODS FOR CONDITION ASSESSMENT OF DISTRIBUTION AND TRANSMISSION SWITCHGEAR
75
One manufacturer has designed a prototype measurement system for a vacuum circuit-breaker, and
performed initial tests on this device [Schellekens2015]. Other work is confined to the laboratory.
DEGREE OF MATURITY
EASE OF USE AND CONSTRAINTS
The device described in [Schellekens2015] could be retro-fitted to existing vacuum circuit breakers (Figure 3-49) when the center shield is accessible (i.e. not in an encapsulated pole, not in other external
insulation, etc.), has sufficient space and is reasonably calibrated to the VI design and voltage level. In general the system should work in either air or SF6; however the system might need to be calibrated
for the surrounding gases.
The main risks of the use of PD to detect the vacuum level are, again, the reliability of the diagnostic as compared to the underlying system. Specifically for PD detection, the magnitude of the signal from
the PD is very small, and the signals can require analysis of the phase dependent behavior to determine the pressure. This can make the system vulnerable to drift of the measurement system over time,
temperature effects, etc. These points would need to be investigated.
Figure 3-49: System for monitoring the PD from in-service circuit breakers. System could be installed as a retro-fit, or built-in with the breaker [Schellekens2015].
3.3.13.6 Other experimental techniques
APPLICATION
This section contains vacuum pressure measurement techniques that have been proposed and/or
initially tested in the published literature, but would be difficult to implement in the field or currently have very limited evidence to support the application of the methods in the field.
The first group consists of techniques measuring changes in electrical behavior between the contacts. These include field emission from open contacts [Frontzek1993], and the current interruption behavior
[Merck1999]. The field emission measures pressure changes in the low range, and the other technique
measures the pressure in the mid-range. The measurements require specialized equipment, and therefore could only be performed periodically, mainly during maintenance periods. The output would
generally be a function of the VI design; however the techniques should generally be applicable to high-voltage VI’s.
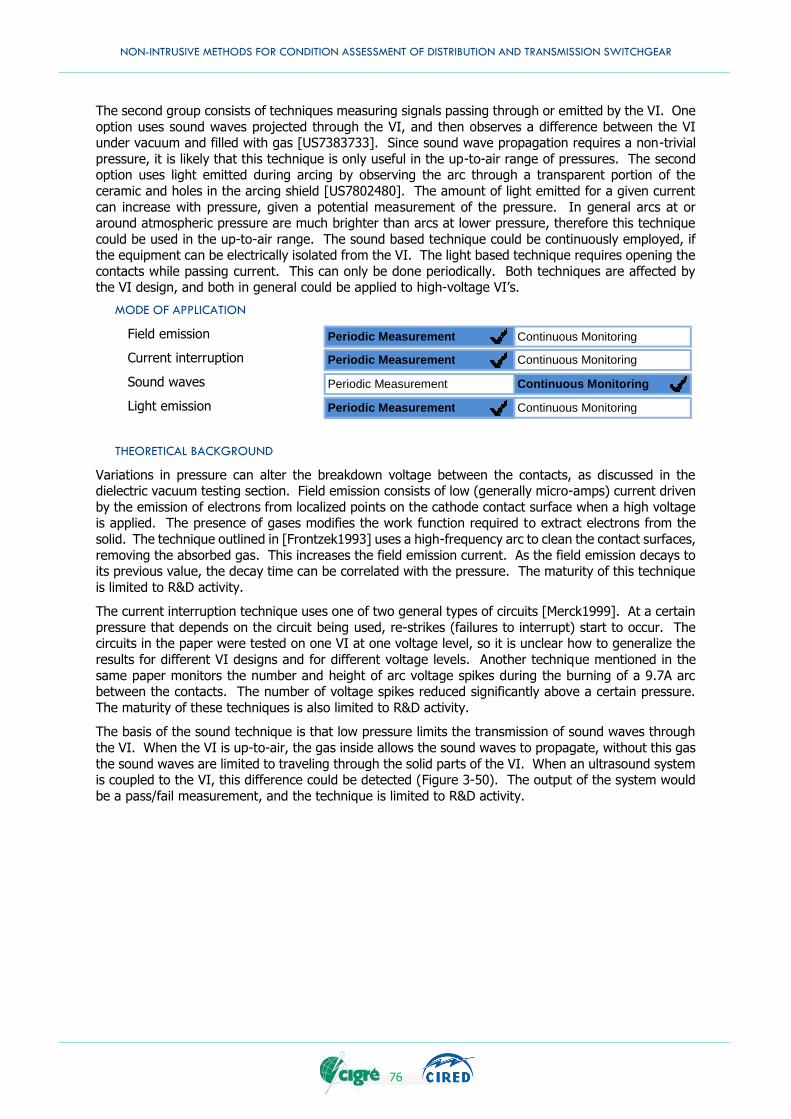
NON-INTRUSIVE METHODS FOR CONDITION ASSESSMENT OF DISTRIBUTION AND TRANSMISSION SWITCHGEAR
76
The second group consists of techniques measuring signals passing through or emitted by the VI. One
option uses sound waves projected through the VI, and then observes a difference between the VI under vacuum and filled with gas [US7383733]. Since sound wave propagation requires a non-trivial
pressure, it is likely that this technique is only useful in the up-to-air range of pressures. The second option uses light emitted during arcing by observing the arc through a transparent portion of the
ceramic and holes in the arcing shield [US7802480]. The amount of light emitted for a given current
can increase with pressure, given a potential measurement of the pressure. In general arcs at or around atmospheric pressure are much brighter than arcs at lower pressure, therefore this technique
could be used in the up-to-air range. The sound based technique could be continuously employed, if the equipment can be electrically isolated from the VI. The light based technique requires opening the
contacts while passing current. This can only be done periodically. Both techniques are affected by the VI design, and both in general could be applied to high-voltage VI’s.
MODE OF APPLICATION
Field emission
Current interruption
Sound waves
Light emission
THEORETICAL BACKGROUND
Variations in pressure can alter the breakdown voltage between the contacts, as discussed in the dielectric vacuum testing section. Field emission consists of low (generally micro-amps) current driven
by the emission of electrons from localized points on the cathode contact surface when a high voltage is applied. The presence of gases modifies the work function required to extract electrons from the
solid. The technique outlined in [Frontzek1993] uses a high-frequency arc to clean the contact surfaces,
removing the absorbed gas. This increases the field emission current. As the field emission decays to its previous value, the decay time can be correlated with the pressure. The maturity of this technique
is limited to R&D activity.
The current interruption technique uses one of two general types of circuits [Merck1999]. At a certain
pressure that depends on the circuit being used, re-strikes (failures to interrupt) start to occur. The circuits in the paper were tested on one VI at one voltage level, so it is unclear how to generalize the
results for different VI designs and for different voltage levels. Another technique mentioned in the
same paper monitors the number and height of arc voltage spikes during the burning of a 9.7A arc between the contacts. The number of voltage spikes reduced significantly above a certain pressure.
The maturity of these techniques is also limited to R&D activity.
The basis of the sound technique is that low pressure limits the transmission of sound waves through
the VI. When the VI is up-to-air, the gas inside allows the sound waves to propagate, without this gas
the sound waves are limited to traveling through the solid parts of the VI. When an ultrasound system is coupled to the VI, this difference could be detected (Figure 3-50). The output of the system would
be a pass/fail measurement, and the technique is limited to R&D activity.
Periodic Measurement Continuous Monitoring
Periodic Measurement Continuous Monitoring
Periodic Measurement Continuous Monitoring
Periodic Measurement Continuous Monitoring
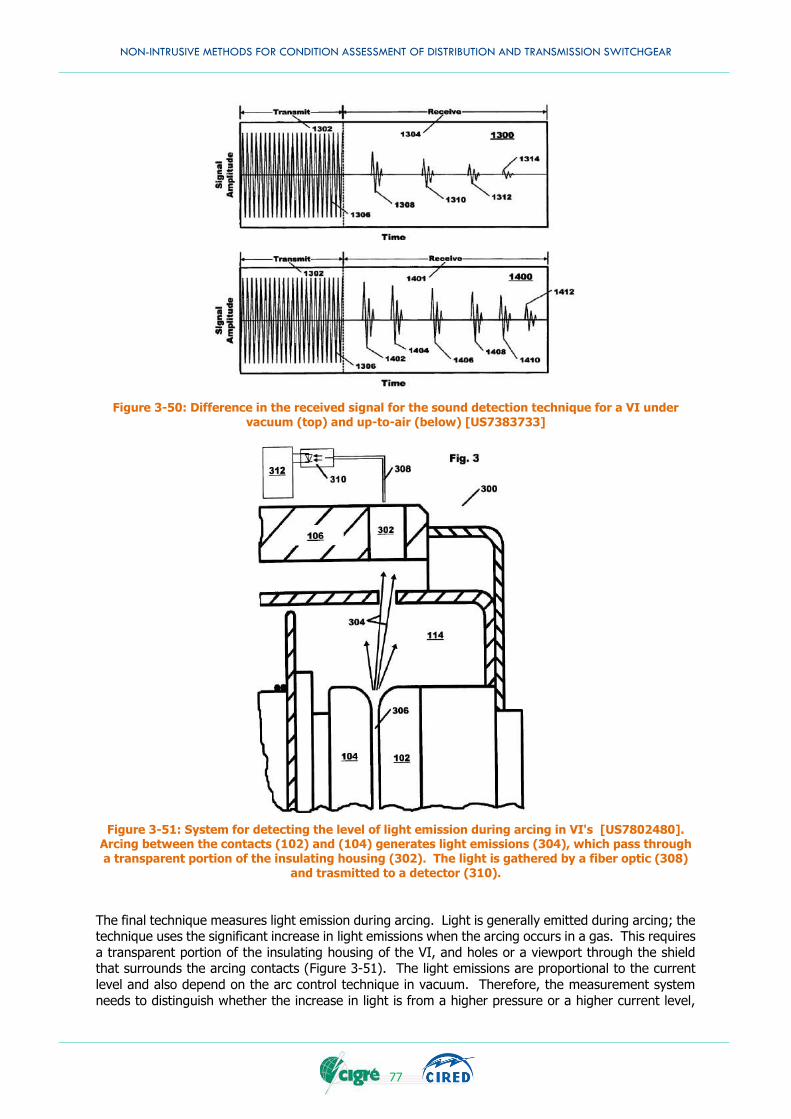
NON-INTRUSIVE METHODS FOR CONDITION ASSESSMENT OF DISTRIBUTION AND TRANSMISSION SWITCHGEAR
77
Figure 3-50: Difference in the received signal for the sound detection technique for a VI under vacuum (top) and up-to-air (below) [US7383733]
Figure 3-51: System for detecting the level of light emission during arcing in VI's [US7802480]. Arcing between the contacts (102) and (104) generates light emissions (304), which pass through a transparent portion of the insulating housing (302). The light is gathered by a fiber optic (308)
and trasmitted to a detector (310).
The final technique measures light emission during arcing. Light is generally emitted during arcing; the technique uses the significant increase in light emissions when the arcing occurs in a gas. This requires
a transparent portion of the insulating housing of the VI, and holes or a viewport through the shield that surrounds the arcing contacts (Figure 3-51). The light emissions are proportional to the current
level and also depend on the arc control technique in vacuum. Therefore, the measurement system
needs to distinguish whether the increase in light is from a higher pressure or a higher current level,
NON-INTRUSIVE METHODS FOR CONDITION ASSESSMENT OF DISTRIBUTION AND TRANSMISSION SWITCHGEAR
78
and be calibrated to the VI design. A significant increase in the light emissions would be restricted to
the shift to the up-to-air range, making this a pass/fail test. This technique is also currently limited to R&D activity.
DEGREE OF MATURITY
Field emission
Current interruption
Sound waves
Light emission
EASE OF USE AND CONSTRAINTS
The field emission and current interruption techniques both can only be performed during maintenance
periods and require a significant amount of equipment to generate the voltage/current and make the detailed measurements needed for analysis. The sound method could conceivably be retro-fitted to
existing systems, provided the waveguides to concentrate the sound signal through the VI could be electrically isolated from the high voltage and not interfere with the operation of the breaker. Once
installed, the sound method could provide continuous monitoring since it is independent of the operational state of the breaker. The light emission method requires that the specific features required
to observe the light be built into the VI from the start. If the light detection system can be electrically
isolated from the breaker, then the method could be used on breakers in service. However, a signal will only appear when the VI opens on a current. This means that either the test is only performed
when the breaker opens in operation (and the detection system is continuously available for this event), or the breaker must be deliberately opened when current is flowing. The current could be from the
power system, or supplied by a separate source if the test is performed with the breaker out of regular
service.
All four techniques would generally be applicable for VI’s in SF6, however, since these methods depend
on the behavior of the gas inside the VI, they would need to be calibrated (or the operation confirmed) with the SF6 gas.
The primary risks with the field emission and current interruption techniques are the difficultly with
interpreting the results. Field emission current and multiple re-ignitions are active subjects of current research, and the interpretation of these signals even in a research environment is challenging. The
statistical scatter of the data is significant, and this is combined with a limited understanding of the effect of the local contact conditions (based on previous breaker operations, contact material, etc.) on
the signals. The reliability of measurements of voltage fluctuations requires significant further research to understand its reliability.
The sound method had the general risk of the reliability of the diagnostic as compared to the underlying
VI failure rate. The complex dependence of light emission strength on the pressure level, current level, arcing time, VI design and contact material make isolating the pressure level difficult in the field without
extensive expertise. The requirement that the breaker open with current significantly reduces the value of the technique for continuous monitoring, since the main goal of continuous monitoring is to prevent
operations on compromised VI’s.
3.3.14 Vibration
A vibration signal will arise during the opening and closing process of the circuit breaker. It contains a
lot of information which can indicate a healthy status of the equipment, such as the moment of arc
contact opening. Since vibration signals can be measured in non-intrusive ways which enhance its anti-interference ability significantly, vibration signal measurement in electrical equipment field monitoring
has drawn much attention of researchers.
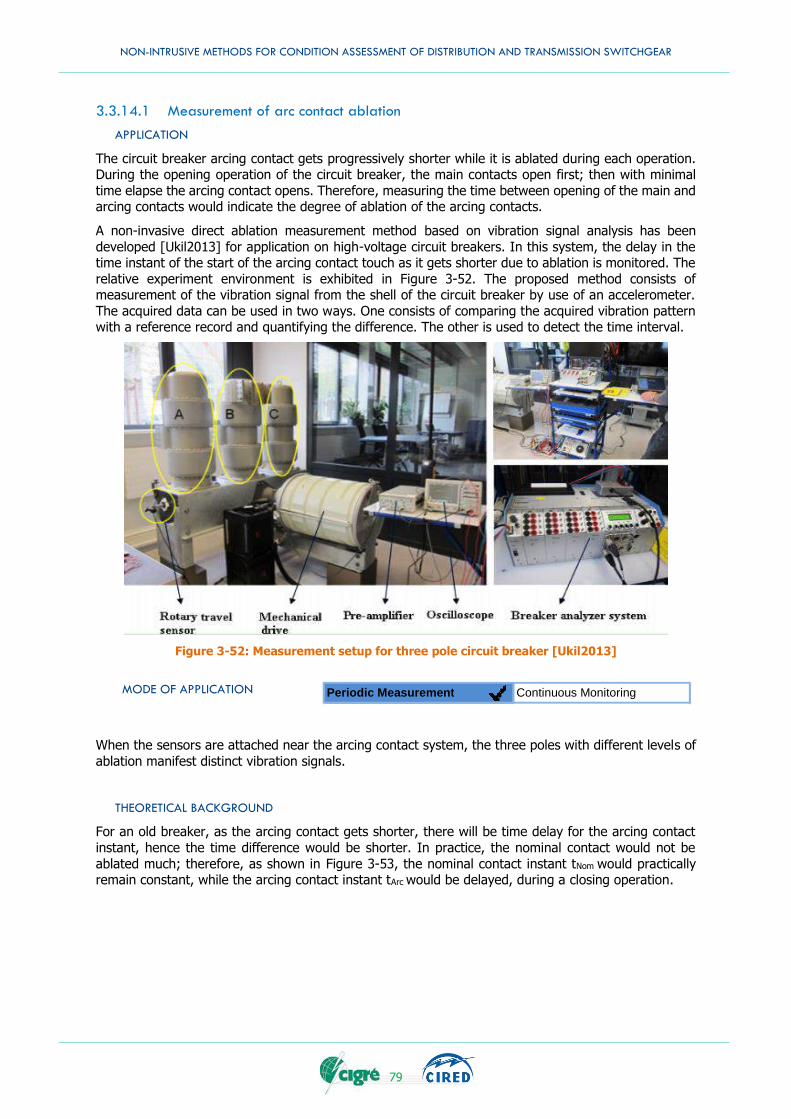
NON-INTRUSIVE METHODS FOR CONDITION ASSESSMENT OF DISTRIBUTION AND TRANSMISSION SWITCHGEAR
79
3.3.14.1 Measurement of arc contact ablation
APPLICATION
The circuit breaker arcing contact gets progressively shorter while it is ablated during each operation. During the opening operation of the circuit breaker, the main contacts open first; then with minimal
time elapse the arcing contact opens. Therefore, measuring the time between opening of the main and arcing contacts would indicate the degree of ablation of the arcing contacts.
A non-invasive direct ablation measurement method based on vibration signal analysis has been
developed [Ukil2013] for application on high-voltage circuit breakers. In this system, the delay in the time instant of the start of the arcing contact touch as it gets shorter due to ablation is monitored. The
relative experiment environment is exhibited in Figure 3-52. The proposed method consists of measurement of the vibration signal from the shell of the circuit breaker by use of an accelerometer.
The acquired data can be used in two ways. One consists of comparing the acquired vibration pattern with a reference record and quantifying the difference. The other is used to detect the time interval.
Figure 3-52: Measurement setup for three pole circuit breaker [Ukil2013]
MODE OF APPLICATION
When the sensors are attached near the arcing contact system, the three poles with different levels of
ablation manifest distinct vibration signals.
THEORETICAL BACKGROUND
For an old breaker, as the arcing contact gets shorter, there will be time delay for the arcing contact
instant, hence the time difference would be shorter. In practice, the nominal contact would not be
ablated much; therefore, as shown in Figure 3-53, the nominal contact instant tNom would practically remain constant, while the arcing contact instant tArc would be delayed, during a closing operation.
Periodic Measurement Continuous Monitoring
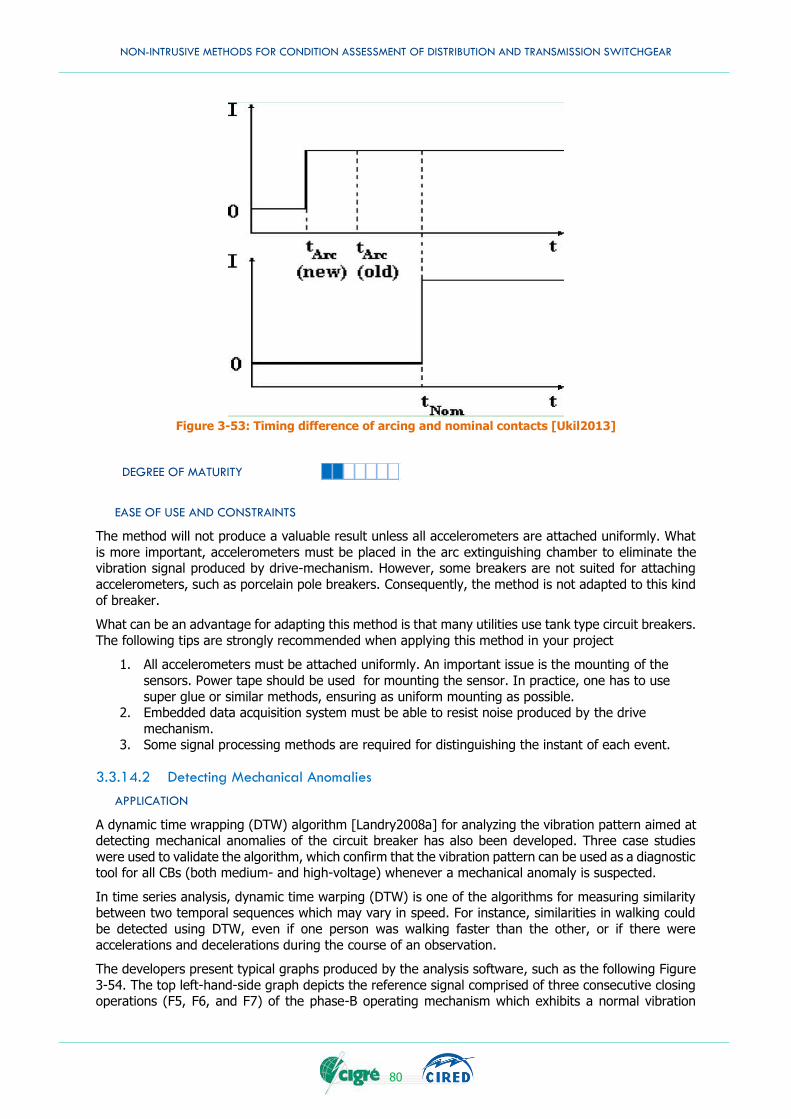
NON-INTRUSIVE METHODS FOR CONDITION ASSESSMENT OF DISTRIBUTION AND TRANSMISSION SWITCHGEAR
80
Figure 3-53: Timing difference of arcing and nominal contacts [Ukil2013]
DEGREE OF MATURITY
EASE OF USE AND CONSTRAINTS
The method will not produce a valuable result unless all accelerometers are attached uniformly. What
is more important, accelerometers must be placed in the arc extinguishing chamber to eliminate the vibration signal produced by drive-mechanism. However, some breakers are not suited for attaching
accelerometers, such as porcelain pole breakers. Consequently, the method is not adapted to this kind
of breaker.
What can be an advantage for adapting this method is that many utilities use tank type circuit breakers.
The following tips are strongly recommended when applying this method in your project
1. All accelerometers must be attached uniformly. An important issue is the mounting of the
sensors. Power tape should be used for mounting the sensor. In practice, one has to use
super glue or similar methods, ensuring as uniform mounting as possible. 2. Embedded data acquisition system must be able to resist noise produced by the drive
mechanism. 3. Some signal processing methods are required for distinguishing the instant of each event.
3.3.14.2 Detecting Mechanical Anomalies
APPLICATION
A dynamic time wrapping (DTW) algorithm [Landry2008a] for analyzing the vibration pattern aimed at detecting mechanical anomalies of the circuit breaker has also been developed. Three case studies
were used to validate the algorithm, which confirm that the vibration pattern can be used as a diagnostic tool for all CBs (both medium- and high-voltage) whenever a mechanical anomaly is suspected.
In time series analysis, dynamic time warping (DTW) is one of the algorithms for measuring similarity between two temporal sequences which may vary in speed. For instance, similarities in walking could
be detected using DTW, even if one person was walking faster than the other, or if there were
accelerations and decelerations during the course of an observation.
The developers present typical graphs produced by the analysis software, such as the following Figure
3-54. The top left-hand-side graph depicts the reference signal comprised of three consecutive closing operations (F5, F6, and F7) of the phase-B operating mechanism which exhibits a normal vibration
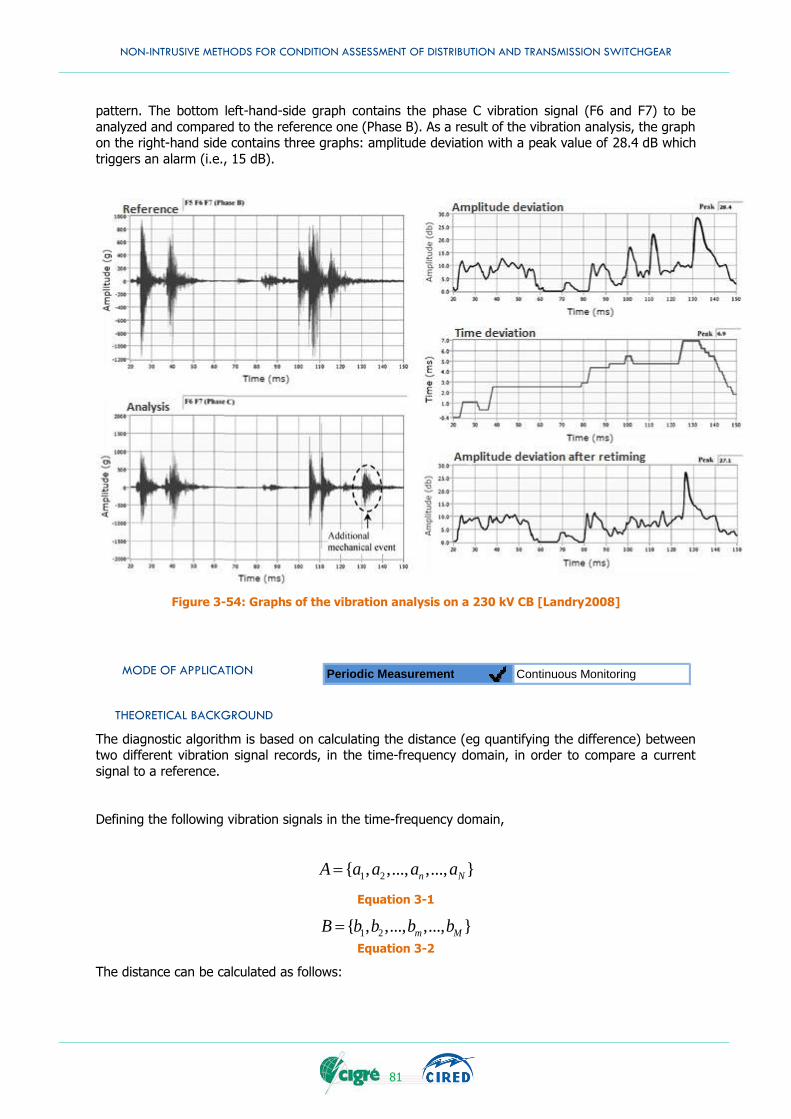
NON-INTRUSIVE METHODS FOR CONDITION ASSESSMENT OF DISTRIBUTION AND TRANSMISSION SWITCHGEAR
81
pattern. The bottom left-hand-side graph contains the phase C vibration signal (F6 and F7) to be
analyzed and compared to the reference one (Phase B). As a result of the vibration analysis, the graph on the right-hand side contains three graphs: amplitude deviation with a peak value of 28.4 dB which
triggers an alarm (i.e., 15 dB).
Figure 3-54: Graphs of the vibration analysis on a 230 kV CB [Landry2008]
MODE OF APPLICATION
THEORETICAL BACKGROUND
The diagnostic algorithm is based on calculating the distance (eg quantifying the difference) between two different vibration signal records, in the time-frequency domain, in order to compare a current
signal to a reference.
Defining the following vibration signals in the time-frequency domain,
1 2{ , ,..., ,..., }n NA a a a a
Equation 3-1
1 2{ , ,..., ,..., }m MB b b b b
Equation 3-2
The distance can be calculated as follows:
Periodic Measurement Continuous Monitoring
NON-INTRUSIVE METHODS FOR CONDITION ASSESSMENT OF DISTRIBUTION AND TRANSMISSION SWITCHGEAR
82
( )
1
1( , ) ( , )
N
n m w n
n
D A B d a bN
Equation 3-3
DEGREE OF MATURITY
EASE OF USE AND CONSTRAINTS
The case studies presented here confirm that vibration analysis can be used as a diagnostic tool for all
CBs whenever mechanical anomalies are suspected. It is anticipated that mechanical anomalies can be detected, which may arise from a large variety of causes such as defects in transmission shafts,
loosening of internal parts in breaker interrupting chambers, low oil levels in closing and opening oil dampers, driving rod thread stripping, etc.
3.3.15 Visual Inspection
3.3.15.1 Visual inspection and Recording
APPLICATION
Visual inspection is a fundamental inspection method applied to all types of equipment in its in service
state, useful in periodical prevention and discovering symptoms of deteriorated conditions [Kopejtkova2014]. Especially for switchgear, it is defined in IEC 62271-1 as “visual investigation of the
principal features of switchgear and controlgear in service without dismantling”.
Visual inspection is applicable to a large portion of components of switchgear including controls,
indication, alarms, gas, air and hydraulic systemes as well as a variety of auxillary components.
The visual inspection is the most common of routine scheduled inspections, often providing the first indication of trouble.
Components visualy inspected may include:
Trip/closing coils
Auxiliary switches
Wiring, joints and lugs
Control, indication, alarm and various auxiliary relay
SF6 Gas density monitoring system
Air, hydraulic or spring operating systems as applicable
Anti-condensation device including thermostats heater and fans
Control and mechanism doors, gaskets, insulation, vents and filters
Switching control devices such as circuit breakers, fuses and switches
A general external visual inspection of the physical condition including cabinets, switchgear,
bushings and ground connections
Recorded information may include:
Operations counters
Operation timers
SF6 gas density
Air or Hydraulic pressure
Fluid levels
Local alarms and indication
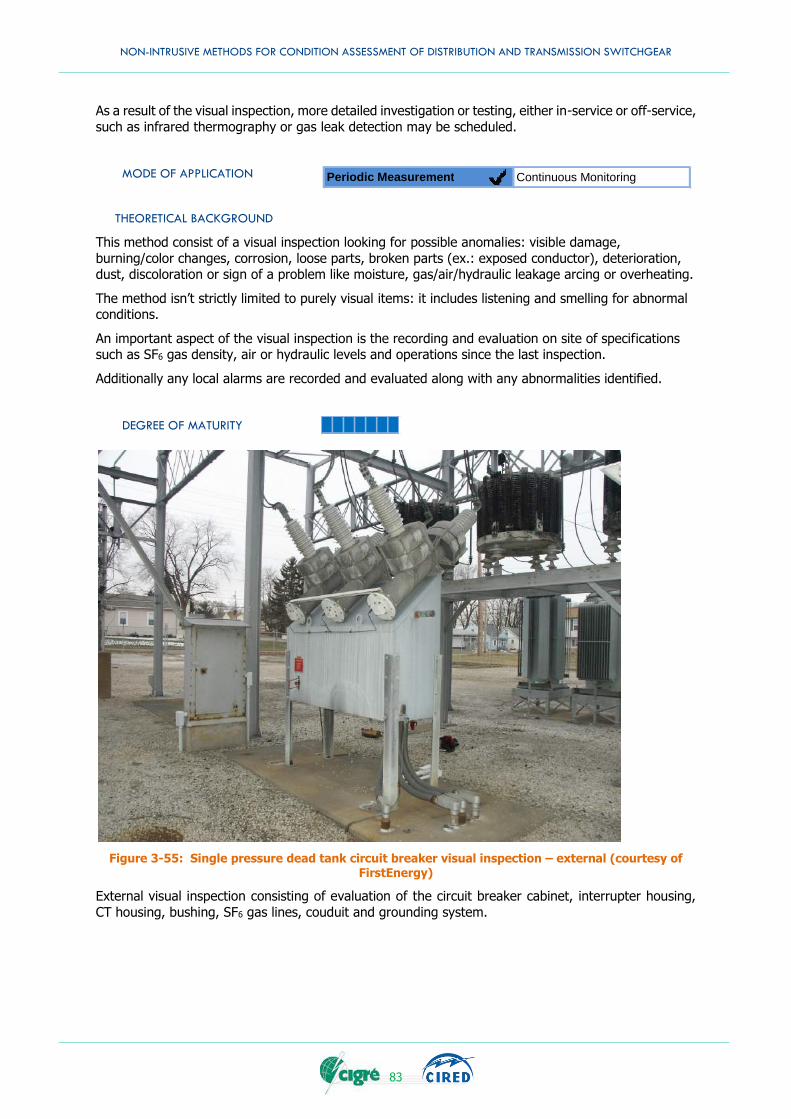
NON-INTRUSIVE METHODS FOR CONDITION ASSESSMENT OF DISTRIBUTION AND TRANSMISSION SWITCHGEAR
83
As a result of the visual inspection, more detailed investigation or testing, either in-service or off-service,
such as infrared thermography or gas leak detection may be scheduled.
MODE OF APPLICATION
THEORETICAL BACKGROUND
This method consist of a visual inspection looking for possible anomalies: visible damage,
burning/color changes, corrosion, loose parts, broken parts (ex.: exposed conductor), deterioration, dust, discoloration or sign of a problem like moisture, gas/air/hydraulic leakage arcing or overheating.
The method isn’t strictly limited to purely visual items: it includes listening and smelling for abnormal conditions.
An important aspect of the visual inspection is the recording and evaluation on site of specifications such as SF6 gas density, air or hydraulic levels and operations since the last inspection.
Additionally any local alarms are recorded and evaluated along with any abnormalities identified.
DEGREE OF MATURITY
Figure 3-55: Single pressure dead tank circuit breaker visual inspection – external (courtesy of FirstEnergy)
External visual inspection consisting of evaluation of the circuit breaker cabinet, interrupter housing,
CT housing, bushing, SF6 gas lines, couduit and grounding system.
Periodic Measurement Continuous Monitoring
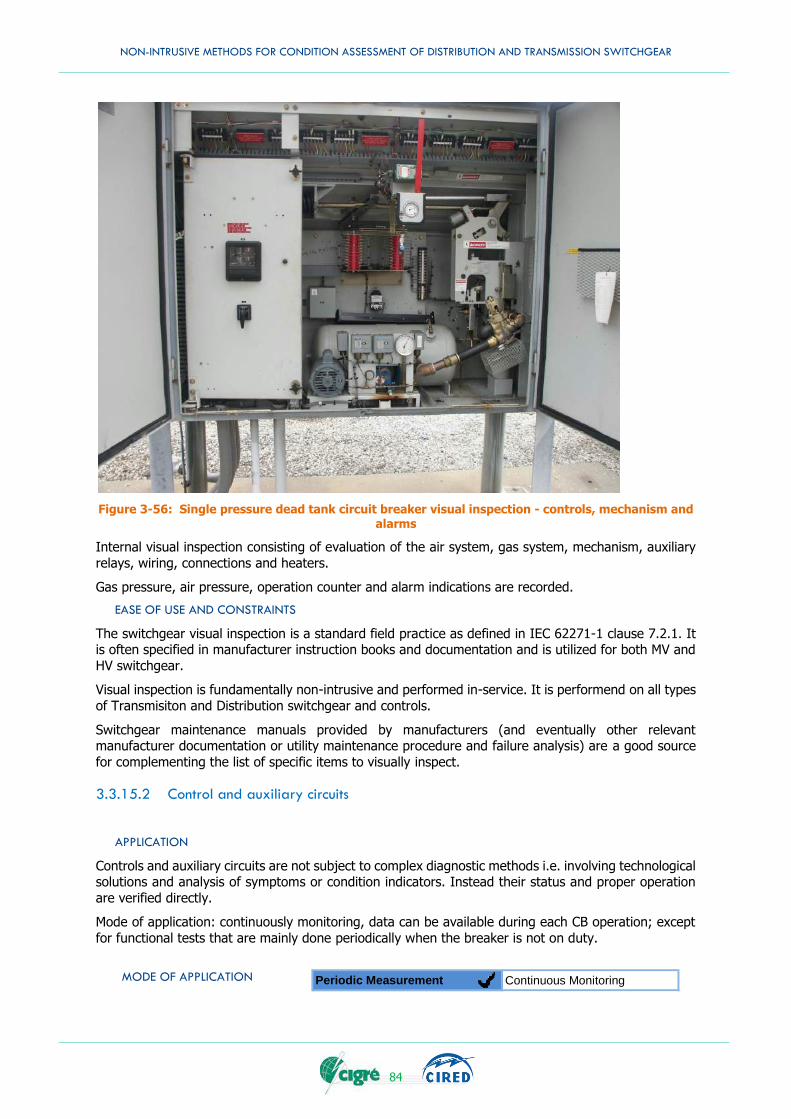
NON-INTRUSIVE METHODS FOR CONDITION ASSESSMENT OF DISTRIBUTION AND TRANSMISSION SWITCHGEAR
84
Figure 3-56: Single pressure dead tank circuit breaker visual inspection - controls, mechanism and alarms
Internal visual inspection consisting of evaluation of the air system, gas system, mechanism, auxiliary
relays, wiring, connections and heaters.
Gas pressure, air pressure, operation counter and alarm indications are recorded.
EASE OF USE AND CONSTRAINTS
The switchgear visual inspection is a standard field practice as defined in IEC 62271-1 clause 7.2.1. It is often specified in manufacturer instruction books and documentation and is utilized for both MV and
HV switchgear.
Visual inspection is fundamentally non-intrusive and performed in-service. It is performend on all types
of Transmisiton and Distribution switchgear and controls.
Switchgear maintenance manuals provided by manufacturers (and eventually other relevant manufacturer documentation or utility maintenance procedure and failure analysis) are a good source
for complementing the list of specific items to visually inspect.
3.3.15.2 Control and auxiliary circuits
APPLICATION
Controls and auxiliary circuits are not subject to complex diagnostic methods i.e. involving technological solutions and analysis of symptoms or condition indicators. Instead their status and proper operation
are verified directly.
Mode of application: continuously monitoring, data can be available during each CB operation; except
for functional tests that are mainly done periodically when the breaker is not on duty.
MODE OF APPLICATION
Periodic Measurement Continuous Monitoring
NON-INTRUSIVE METHODS FOR CONDITION ASSESSMENT OF DISTRIBUTION AND TRANSMISSION SWITCHGEAR
85
THEORETICAL BACKGROUND
Many signals, such as coil currents, auxiliary contact operation, supply voltages and environmental parameters of the cabinets, may be evaluated and are often continuously monitored by automation or
monitoring systems. The following status parameters can be obtained: trip or close timing (slow/fast), circuit continuity, sequence of operation, auxiliary switch condition, maladjustment of coils, battery and
charger status [CIGRE_167_2000] [Djekic2007].
Tripping or closing coil current depends on the source (battery) voltage and coil impedance which is a function of coil resistance and mechanical restriction on plunger. Therefore, analysis of the coil current
profile during switchgear operation can provide valuable information about the operation mechanism (section “Coil current profile”) but also about battery status and the coil itself [CIGRE_167_2000]. For
evaluating the latter, the value of coil current at the end of the operation, when the current is stable,
is used. Multiple shallow bumps (slight saw tooth), multiple deep and abrupt humps may indicate a loose wire in the trip circuit [Rogers2007].
On some kinds of switchgear, a motor is used instead of a coil. In this case, the motor current profile is used.
Battery and charger status is usually verified by voltage measurement. The problems with charging
systems can be found by voltage level. The degradation of a battery may be found by measuring the voltage drop when the CB operates. Most of the time, the simplest way is to measure voltage at the
trip coil and/or closing coil [Levi2010] but measuring voltage at each cell gives better results [Picagli2013].
Trending is the most useful data analysis method applied for control and auxiliary circuits. Trending consists of verifying if the signal is in the normal range, has consistent behavior with other information
and is not drifting or abnormally fluctuating. Examples of measurements to follow by trending are:
Operating environmental conditions (temperature and humidity)
CB mechanical operation counter: can be validated by monitoring the number of operations by
automation data. The mechanical counter can double count, stay with a frozen count, had been manually reset by mistake or replaced (subject related to section “History of operation”)
Count of recharging system: monitoring of number of operations of the recharging system
allows verifying consistency with the physical counter, but also is a way to detect problems in the recharging system by discerning an anomaly in the maximum run time or the number of
starts/day (see 3.3.16.2)
Status of auxiliary switches (verification of timing and correct behavior)
Other auxiliary services: power sources (DC, AC, mechanical, electromagnetic, thermal, etc.)
and other supplies like high pressure supply (hydraulic, pneumatic, etc.). For example, the monitoring of air pressure allows discerning starts and stops of the compressor and
consequently gives the total time of operation of the compressor. This could be used to validate the mechanical counter on the compressor.
Other parameters may be included according to manufacturer documentation, trending of secondary parameters may sometimes be useful in finding the symptoms of a more important problem.
DEGREE OF MATURITY
Diagnostics of controls and auxiliary circuits
EASE OF USE AND CONSTRAINTS
Most of these measurements are in-service and non-intrusive except for functional tests that are mainly off-service but remain typically non-intrusive.
If a measure of coil current is not available, a current sensor should be installed. For DC sensors the installation is generally off-service.
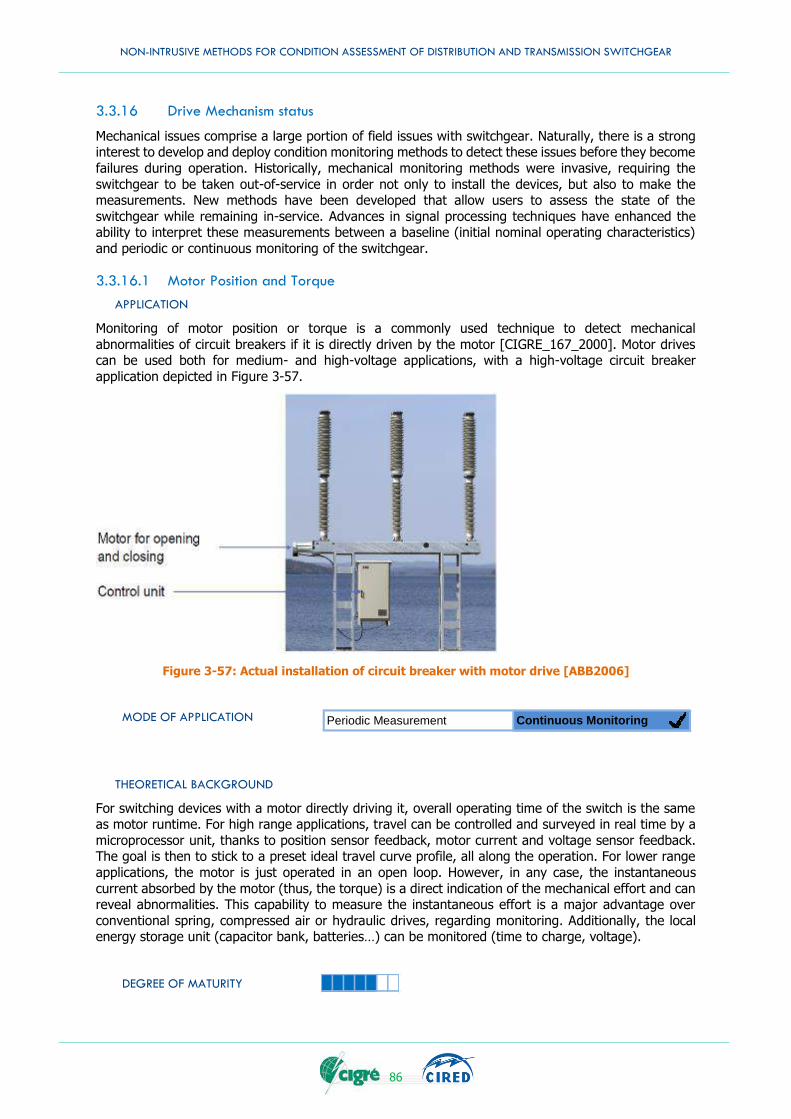
NON-INTRUSIVE METHODS FOR CONDITION ASSESSMENT OF DISTRIBUTION AND TRANSMISSION SWITCHGEAR
86
3.3.16 Drive Mechanism status
Mechanical issues comprise a large portion of field issues with switchgear. Naturally, there is a strong interest to develop and deploy condition monitoring methods to detect these issues before they become
failures during operation. Historically, mechanical monitoring methods were invasive, requiring the
switchgear to be taken out-of-service in order not only to install the devices, but also to make the measurements. New methods have been developed that allow users to assess the state of the
switchgear while remaining in-service. Advances in signal processing techniques have enhanced the ability to interpret these measurements between a baseline (initial nominal operating characteristics)
and periodic or continuous monitoring of the switchgear.
3.3.16.1 Motor Position and Torque
APPLICATION
Monitoring of motor position or torque is a commonly used technique to detect mechanical
abnormalities of circuit breakers if it is directly driven by the motor [CIGRE_167_2000]. Motor drives can be used both for medium- and high-voltage applications, with a high-voltage circuit breaker
application depicted in Figure 3-57.
Figure 3-57: Actual installation of circuit breaker with motor drive [ABB2006]
MODE OF APPLICATION
THEORETICAL BACKGROUND
For switching devices with a motor directly driving it, overall operating time of the switch is the same as motor runtime. For high range applications, travel can be controlled and surveyed in real time by a
microprocessor unit, thanks to position sensor feedback, motor current and voltage sensor feedback. The goal is then to stick to a preset ideal travel curve profile, all along the operation. For lower range
applications, the motor is just operated in an open loop. However, in any case, the instantaneous
current absorbed by the motor (thus, the torque) is a direct indication of the mechanical effort and can reveal abnormalities. This capability to measure the instantaneous effort is a major advantage over
conventional spring, compressed air or hydraulic drives, regarding monitoring. Additionally, the local energy storage unit (capacitor bank, batteries…) can be monitored (time to charge, voltage).
DEGREE OF MATURITY
Periodic Measurement Continuous Monitoring
NON-INTRUSIVE METHODS FOR CONDITION ASSESSMENT OF DISTRIBUTION AND TRANSMISSION SWITCHGEAR
87
EASE OF USE AND CONSTRAINTS
Nowadays many modern electronic devices, including protection relays, have motor current or voltage
measurement functions. Also, modern MV/HV circuit breakers normally have very small variation in motor operating characteristics measurable by motor current or voltage, therefore, users can detect
deviation of measured data in a relatively accurate manner.
On the other hand, there are constraints for switching devices with the motor not directly driving the mechanism, i.e. spring charged type circuit breakers. In this case, motor motion or torque will not
represent the state of the main current part of the circuit breakers, thus it is recommended users adopt another method like trip coil current monitoring.
3.3.16.2 Spring Stored Energy Status
APPLICATION
For motor charged spring type mechanism circuit breakers, the easiest way to recognize whether the
status of the operation spring is ready or not is to see the commonly integrated stored energy indicator [IEEE1999a] on the device. While such can provide information whether the motor and the mechanisms
are still functional, it does not signify a completely healthy mechanical system. In order to ensure
reliability of the switching equipment, such as medium-voltage and high-voltage switchgear, it is also important to monitor soundness of the spring charging mechanisms.
MODE OF APPLICATION
THEORETICAL BACKGROUND
Spring Charge Quality Estimation Function
The spring charge quality estimation function calculates the spring charging time. The circuit breaker
spring should be charged within a specified time. Long spring charging can be due to early motor failures as seen in the measurements or can be due to higher friction forces. A shorter recharging time
can be due to a lower spring constant. Therefore, detecting long or small spring charging time indicates that it is time for circuit breaker maintenance. This diagnostic function is based on the quality scheme.
Warning and alarm threshold times are set by the manufacturer who knows the expected times for
each breaker (Figure 3-58). If the spring charging times drops in zones different from the normal ones, the quality of the breaker will decrease.
Periodic Measurement Continuous Monitoring
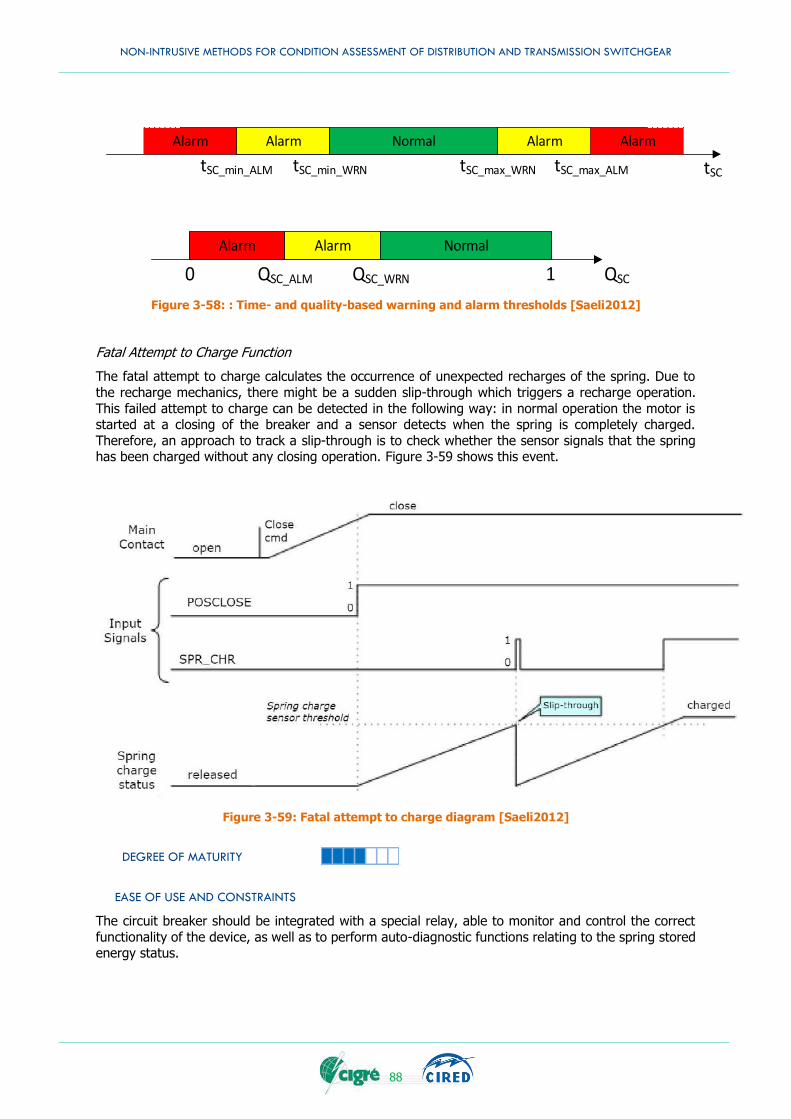
NON-INTRUSIVE METHODS FOR CONDITION ASSESSMENT OF DISTRIBUTION AND TRANSMISSION SWITCHGEAR
88
Alarm Alarm Normal Alarm Alarm
tSC_min_ALM tSC_max_ALMtSC_max_WRNtSC_min_WRN tSC
Alarm Alarm Normal
QSC_ALM QSC_WRN QSC0 1
Figure 3-58: : Time- and quality-based warning and alarm thresholds [Saeli2012]
Fatal Attempt to Charge Function
The fatal attempt to charge calculates the occurrence of unexpected recharges of the spring. Due to
the recharge mechanics, there might be a sudden slip-through which triggers a recharge operation.
This failed attempt to charge can be detected in the following way: in normal operation the motor is started at a closing of the breaker and a sensor detects when the spring is completely charged.
Therefore, an approach to track a slip-through is to check whether the sensor signals that the spring has been charged without any closing operation. Figure 3-59 shows this event.
Figure 3-59: Fatal attempt to charge diagram [Saeli2012]
DEGREE OF MATURITY
EASE OF USE AND CONSTRAINTS
The circuit breaker should be integrated with a special relay, able to monitor and control the correct
functionality of the device, as well as to perform auto-diagnostic functions relating to the spring stored energy status.
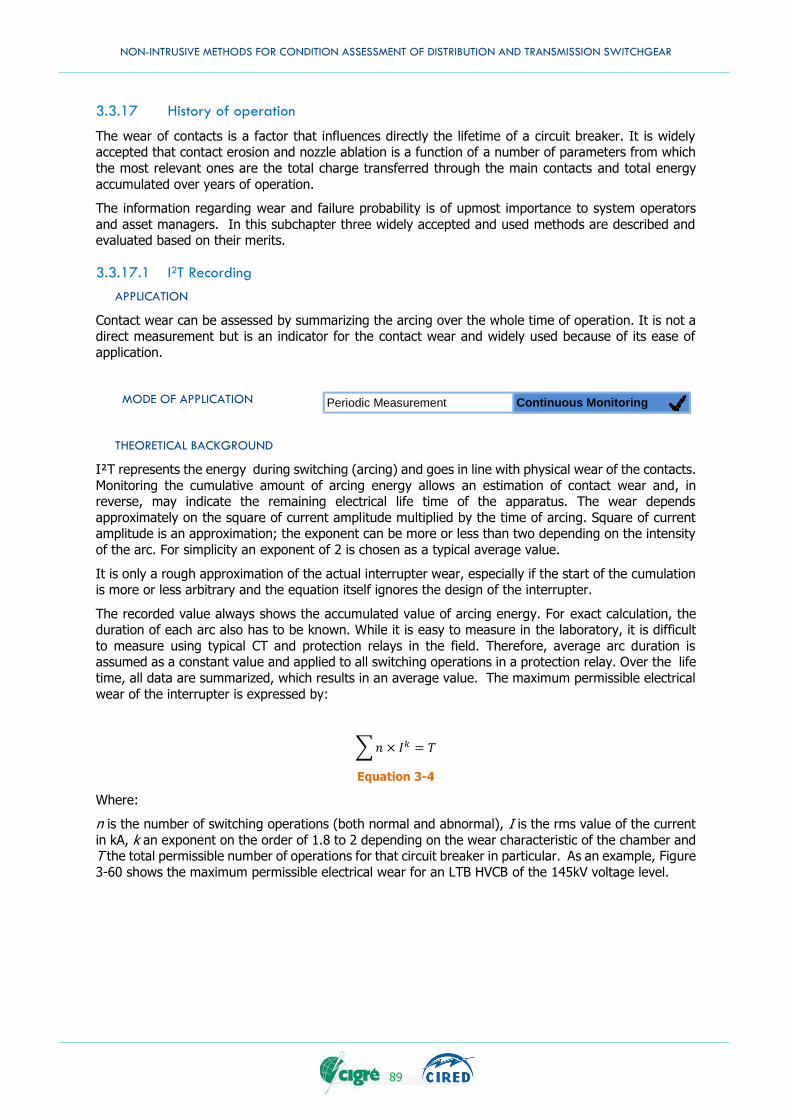
NON-INTRUSIVE METHODS FOR CONDITION ASSESSMENT OF DISTRIBUTION AND TRANSMISSION SWITCHGEAR
89
3.3.17 History of operation
The wear of contacts is a factor that influences directly the lifetime of a circuit breaker. It is widely accepted that contact erosion and nozzle ablation is a function of a number of parameters from which
the most relevant ones are the total charge transferred through the main contacts and total energy
accumulated over years of operation.
The information regarding wear and failure probability is of upmost importance to system operators
and asset managers. In this subchapter three widely accepted and used methods are described and evaluated based on their merits.
3.3.17.1 I2T Recording
APPLICATION
Contact wear can be assessed by summarizing the arcing over the whole time of operation. It is not a direct measurement but is an indicator for the contact wear and widely used because of its ease of
application.
MODE OF APPLICATION
THEORETICAL BACKGROUND
I²T represents the energy during switching (arcing) and goes in line with physical wear of the contacts.
Monitoring the cumulative amount of arcing energy allows an estimation of contact wear and, in reverse, may indicate the remaining electrical life time of the apparatus. The wear depends
approximately on the square of current amplitude multiplied by the time of arcing. Square of current amplitude is an approximation; the exponent can be more or less than two depending on the intensity
of the arc. For simplicity an exponent of 2 is chosen as a typical average value.
It is only a rough approximation of the actual interrupter wear, especially if the start of the cumulation is more or less arbitrary and the equation itself ignores the design of the interrupter.
The recorded value always shows the accumulated value of arcing energy. For exact calculation, the duration of each arc also has to be known. While it is easy to measure in the laboratory, it is difficult
to measure using typical CT and protection relays in the field. Therefore, average arc duration is assumed as a constant value and applied to all switching operations in a protection relay. Over the life
time, all data are summarized, which results in an average value. The maximum permissible electrical
wear of the interrupter is expressed by:
∑ 𝑛 × 𝐼𝑘 = 𝑇
Equation 3-4
Where:
n is the number of switching operations (both normal and abnormal), I is the rms value of the current
in kA, k an exponent on the order of 1.8 to 2 depending on the wear characteristic of the chamber and T the total permissible number of operations for that circuit breaker in particular. As an example, Figure
3-60 shows the maximum permissible electrical wear for an LTB HVCB of the 145kV voltage level.
Periodic Measurement Continuous Monitoring
NON-INTRUSIVE METHODS FOR CONDITION ASSESSMENT OF DISTRIBUTION AND TRANSMISSION SWITCHGEAR
90
Figure 3-60: Maximum permissible electrical wear [ABB2013]
Digital protection relays or controller can easily calculate this value. It is state-of-the-art for modern protection relays to have this function. When reaching a threshold, sometimes called ageing factor K,
an alarm or other status information will be sent out. The threshold as a certain percentage of the maximum value as well as the maximum value have to be set during commissioning.
DEGREE OF MATURITY
EASE OF USE AND CONSTRAINTS
It is an easy method to monitor for any relay or controller which measures primary current. Exact values
of maximum value and previous life (in case the switch / breaker was not new when the relay / controller
was commissioned) have to be entered, otherwise the warning signal will not be issued at the correct instant of time.
End of life prediction is unprecise. Whether it will still be able to break 100% of short circuit current, withstand 80% of test voltage or withstand full TRV cannot be determined with this information without
a more elaborated assessment.
It is not an accurate diagnostic method and there are a number of uncertainties using this method:
1. Calculation is not very accurate and despite the averaging effect over lifetime it will never be an
exact value.
The exponent is not exactly two. due to manufacturers using different designs and the arc
energy also depending on the kind of fault current
the arc duration varies in reality while calculation assumes a constant (average) value
some relays may only count fault interruptions. High load current interruptions also result in
(very small) contact wear overall and the result may become less accurate for a higher ratio of load current switching to fault current switching
2. The “end of life” value when measured as I²T is not exactly known. Manufacturers can assign this
value based on experience, but it will still have tolerances.
NON-INTRUSIVE METHODS FOR CONDITION ASSESSMENT OF DISTRIBUTION AND TRANSMISSION SWITCHGEAR
91
Considering the fact that most circuit breakers operate during their life well below the possible number
of fault interruptions, comparing the I²T value to historical data will give a good indication that there is an issue when a circuit breaker approaches the end of life based on fault interruptions.
3.3.17.2 Number of fault operations
APPLICATION
Protection relays often have the option to count fault operations. This would count any trip operation
initiated by a protection element and may be limited to certain fault types only.
As a function of the protection relay or control unit, it is not linked to any particular voltage range but is used in high and medium voltage devices.
MODE OF APPLICATION
THEORETICAL BACKGROUND
Every time the protection relay issues a trip signal, it will count this as a fault operation. It could be limited to certain fault types, i.e. to count overcurrent faults only but no over-/undervoltage faults.
There might be different counters, i.e. (i) total number of fault operations, (ii) fault operations since last maintenance, (iii) fault operations within a pre-defined timeframe.
This information is often used to draw conclusions about the situation in the network, as it shows the frequency of fault situations. It may also be used to indicate the consumption of service life, but would
need to be compared to other counters of this section.
DEGREE OF MATURITY
EASE OF USE AND CONSTRAINTS
Fault Operations counter is an integral part of protection relays. The reliability is very high.
It should also be mentioned that their primary task is to show fault activities in the network. This information on its own does not allow conclusions about life time of the circuit breaker. It always has
to be seen in conjunction with the other counter readings described in this section.
Operations counter by protection relays have the disadvantage that they only count since the time of commissioning. Hence a certain number of operations might be missed if the switch has already
operated before commissioning of the protection.
3.3.17.3 Mechanical Operations Counter
APPLICATION
Operations counters are typically factory-installed devices that count the number of mechanical
operations of a circuit breaker over its lifetime (including commissioning and field operations). Although prudent to record and use this data as part of a fleet maintenance program, this condition monitoring
method of counting the number of operations will not be discussed in detail in this brochure. Mechanical operations counters are widely deployed on both medium- and high-voltage equipment.
MODE OF APPLICATION
Periodic Measurement Continuous Monitoring
Periodic Measurement Continuous Monitoring
NON-INTRUSIVE METHODS FOR CONDITION ASSESSMENT OF DISTRIBUTION AND TRANSMISSION SWITCHGEAR
92
THEORETICAL BACKGROUND
The operating cycle (of a mechanical switching device) is a succession of operations from one position to another and back to the first position through all other positions, if any. As per IEC it is left open
which, whether the operating cycle starts with OPEN or CLOSE.
Counting of operations is well established and proven for a long time. There are two fundamental
ways to monitor the number of operations:
1. Most circuit breaker and switches have mechanical operations counters. Often mechanically linked, sometimes also linked by electrical or magnetic means.
2. Protection relays (controller) also count the number of operations. They monitor the signals from auxiliary switches and count the operations. There might be different counters, i.e. (i)
total number of operations, (ii) operations since last maintenance, (iii) operations within a
pre-defined timeframe.
DEGREE OF MATURITY
EASE OF USE AND CONSTRAINTS
Operations counter is an integral part of the circuit breaker or switch. The reliability is very high, especially for mechanical linked counters. Since it is an integral part of the circuit breaker and not a
separate device, the counter will always monitor the total number of operations since manufacturing.
Visibility of the counter may be limited for a number of reasons: (i) location of the counter, (ii) size of the numbers, (iii) accessibility of the counter. It can make it difficult for daily use. However, during
maintenance it is no issue to read the counter.
Mechanical counters are not readable by electronic means, they are meant to be visually read.
Operations counter of protection relays have the disadvantage that they only count since time of
commissioning. Hence a certain number of operations might be missed if the switch has already operated before commissioning together with the protection relay i.e. during factory testing. Also in
case of relay change for maintenance or upgrade reasons the counter may start at a wrong number. Some relays allow adjustment to the historical value, but not all. Finally, the accuracy also depends on
the care during commissioning, whether this value is entered correctly or not.
3.3.18 Travel Recording
3.3.18.1 Dynamic Contact Travel
APPLICATION
The performance of the circuit breaker is highly dependent on the travel characteristics of the closing
and opening operation. Designers of the high voltage circuit breakers identify these critical parameters for each type of the breaker during the development stage (contact closing speed, contact opening
speed, contact overtravel). Since the travel characteristics of the CB contacts can provide great insight into the proper functioning of the gear, measuring and analyzing these values can provide excellent
insight into the health of the equipment. Measurements that deviate from the manufacturer’s tolerance
can provide early indication of mechanical problems, so condition-based maintenance can be scheduled to investigate and repair. [Andrusca2013, Levi2011, Renaudin2015, Levi2013]
In order to perform these measurements online, the circuit breaker must be outfitted with travel transducers that report the instantaneous position of the contacts, or some other portion of the
mechanism (Figure 3-61).
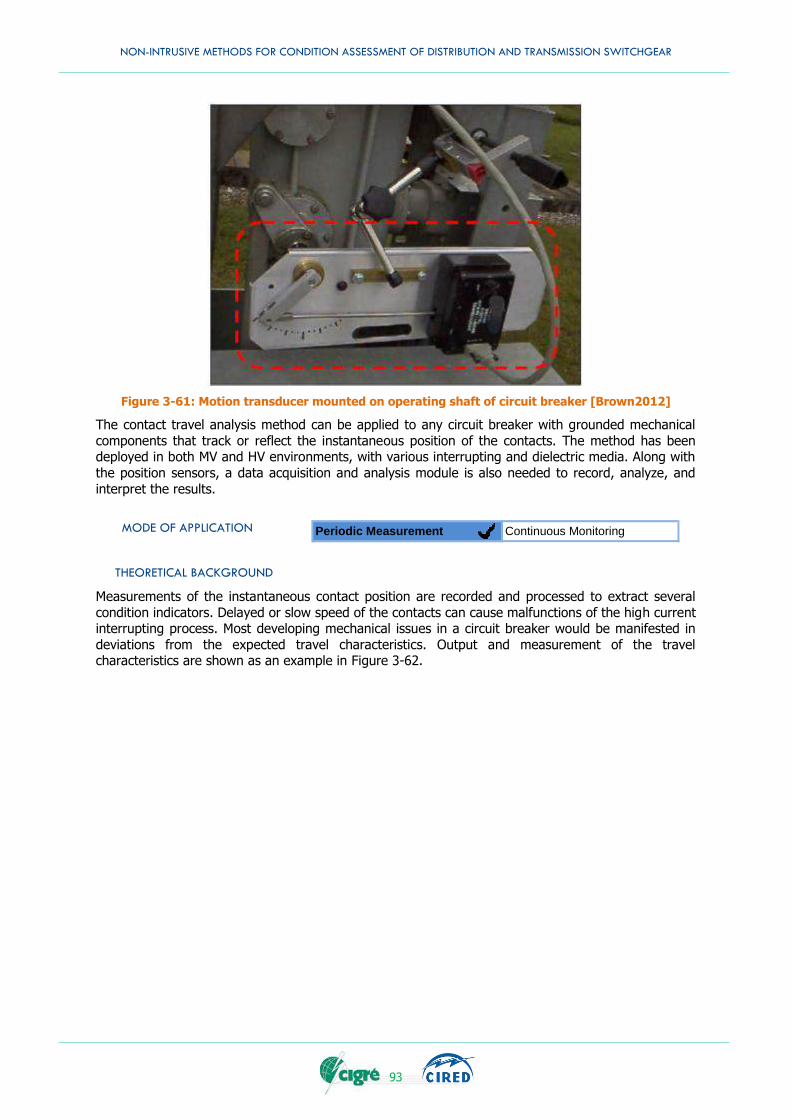
NON-INTRUSIVE METHODS FOR CONDITION ASSESSMENT OF DISTRIBUTION AND TRANSMISSION SWITCHGEAR
93
Figure 3-61: Motion transducer mounted on operating shaft of circuit breaker [Brown2012]
The contact travel analysis method can be applied to any circuit breaker with grounded mechanical
components that track or reflect the instantaneous position of the contacts. The method has been deployed in both MV and HV environments, with various interrupting and dielectric media. Along with
the position sensors, a data acquisition and analysis module is also needed to record, analyze, and
interpret the results.
MODE OF APPLICATION
THEORETICAL BACKGROUND
Measurements of the instantaneous contact position are recorded and processed to extract several
condition indicators. Delayed or slow speed of the contacts can cause malfunctions of the high current interrupting process. Most developing mechanical issues in a circuit breaker would be manifested in
deviations from the expected travel characteristics. Output and measurement of the travel characteristics are shown as an example in Figure 3-62.
Periodic Measurement Continuous Monitoring
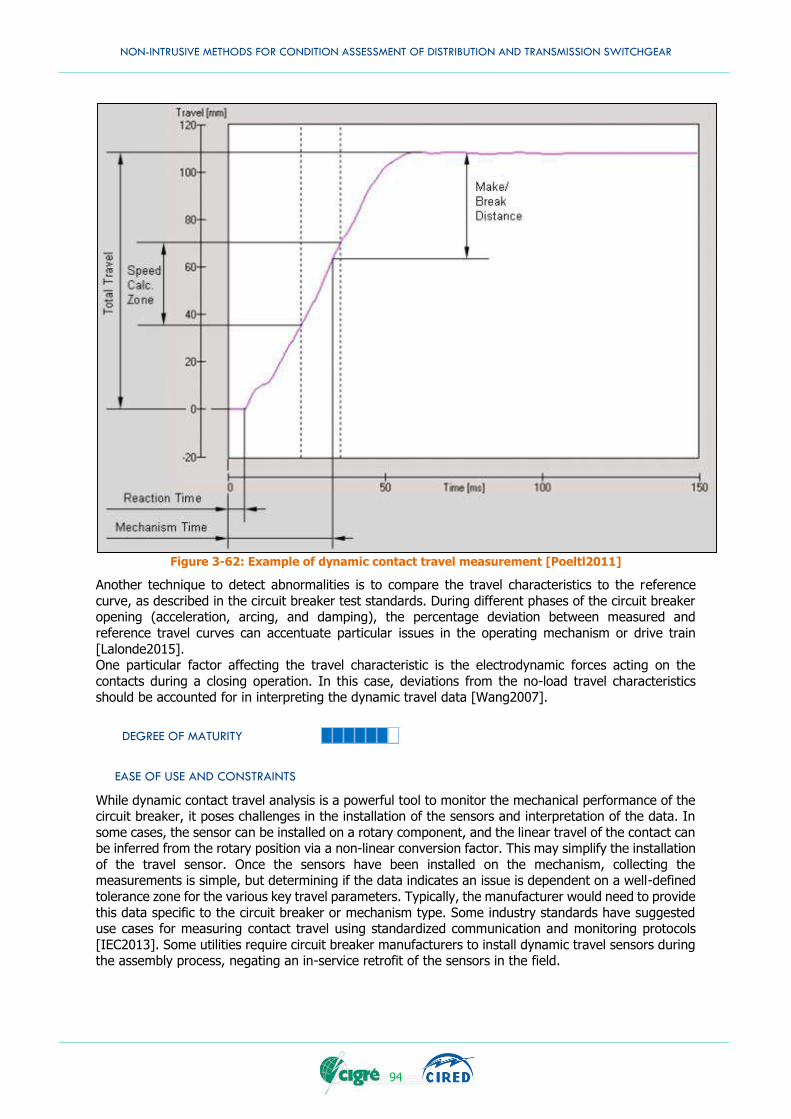
NON-INTRUSIVE METHODS FOR CONDITION ASSESSMENT OF DISTRIBUTION AND TRANSMISSION SWITCHGEAR
94
Figure 3-62: Example of dynamic contact travel measurement [Poeltl2011]
Another technique to detect abnormalities is to compare the travel characteristics to the reference
curve, as described in the circuit breaker test standards. During different phases of the circuit breaker opening (acceleration, arcing, and damping), the percentage deviation between measured and
reference travel curves can accentuate particular issues in the operating mechanism or drive train
[Lalonde2015]. One particular factor affecting the travel characteristic is the electrodynamic forces acting on the
contacts during a closing operation. In this case, deviations from the no-load travel characteristics should be accounted for in interpreting the dynamic travel data [Wang2007].
DEGREE OF MATURITY
EASE OF USE AND CONSTRAINTS
While dynamic contact travel analysis is a powerful tool to monitor the mechanical performance of the circuit breaker, it poses challenges in the installation of the sensors and interpretation of the data. In
some cases, the sensor can be installed on a rotary component, and the linear travel of the contact can be inferred from the rotary position via a non-linear conversion factor. This may simplify the installation
of the travel sensor. Once the sensors have been installed on the mechanism, collecting the measurements is simple, but determining if the data indicates an issue is dependent on a well-defined
tolerance zone for the various key travel parameters. Typically, the manufacturer would need to provide
this data specific to the circuit breaker or mechanism type. Some industry standards have suggested use cases for measuring contact travel using standardized communication and monitoring protocols
[IEC2013]. Some utilities require circuit breaker manufacturers to install dynamic travel sensors during the assembly process, negating an in-service retrofit of the sensors in the field.
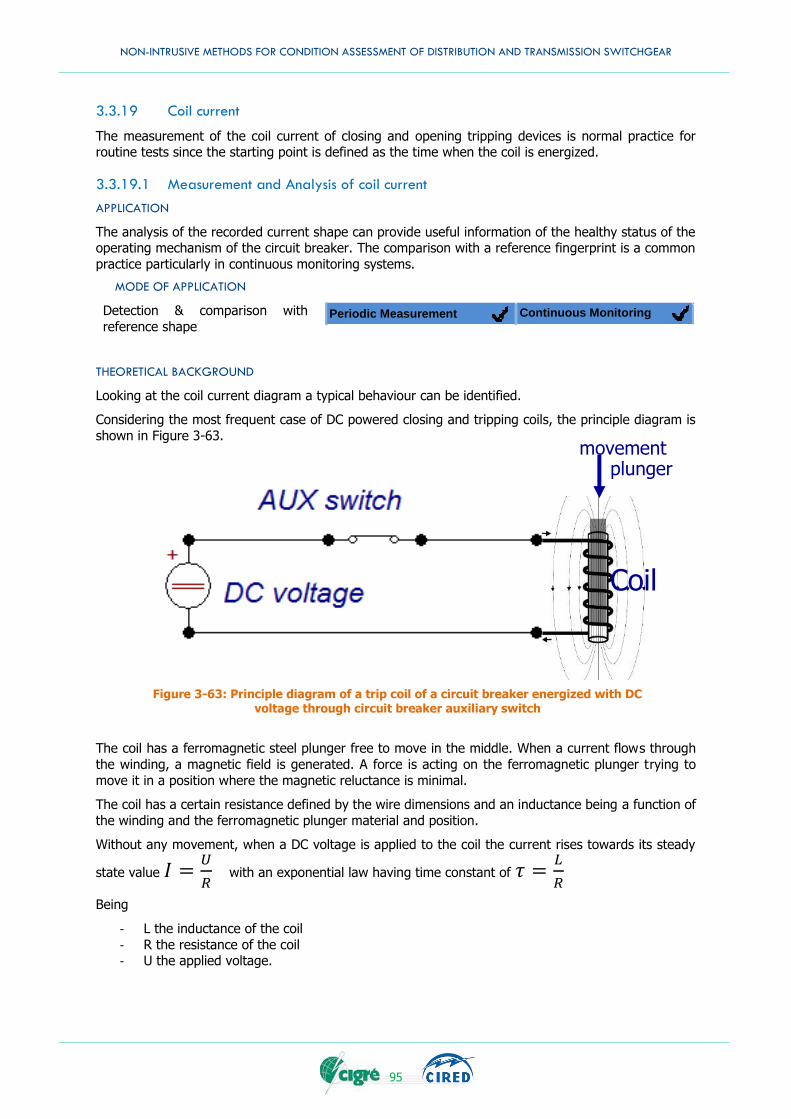
NON-INTRUSIVE METHODS FOR CONDITION ASSESSMENT OF DISTRIBUTION AND TRANSMISSION SWITCHGEAR
95
Figure 3-63: Principle diagram of a trip coil of a circuit breaker energized with DC voltage through circuit breaker auxiliary switch
3.3.19 Coil current
The measurement of the coil current of closing and opening tripping devices is normal practice for routine tests since the starting point is defined as the time when the coil is energized.
3.3.19.1 Measurement and Analysis of coil current
APPLICATION
The analysis of the recorded current shape can provide useful information of the healthy status of the operating mechanism of the circuit breaker. The comparison with a reference fingerprint is a common
practice particularly in continuous monitoring systems.
MODE OF APPLICATION
Detection & comparison with
reference shape
THEORETICAL BACKGROUND
Looking at the coil current diagram a typical behaviour can be identified.
Considering the most frequent case of DC powered closing and tripping coils, the principle diagram is
shown in Figure 3-63.
The coil has a ferromagnetic steel plunger free to move in the middle. When a current flows through
the winding, a magnetic field is generated. A force is acting on the ferromagnetic plunger trying to
move it in a position where the magnetic reluctance is minimal.
The coil has a certain resistance defined by the wire dimensions and an inductance being a function of
the winding and the ferromagnetic plunger material and position.
Without any movement, when a DC voltage is applied to the coil the current rises towards its steady
state value 𝐼 =𝑈
𝑅 with an exponential law having time constant of 𝜏 =
𝐿
𝑅
Being
- L the inductance of the coil
- R the resistance of the coil - U the applied voltage.
Continuous Monitoring Periodic Measurement
Coil
movement plunger
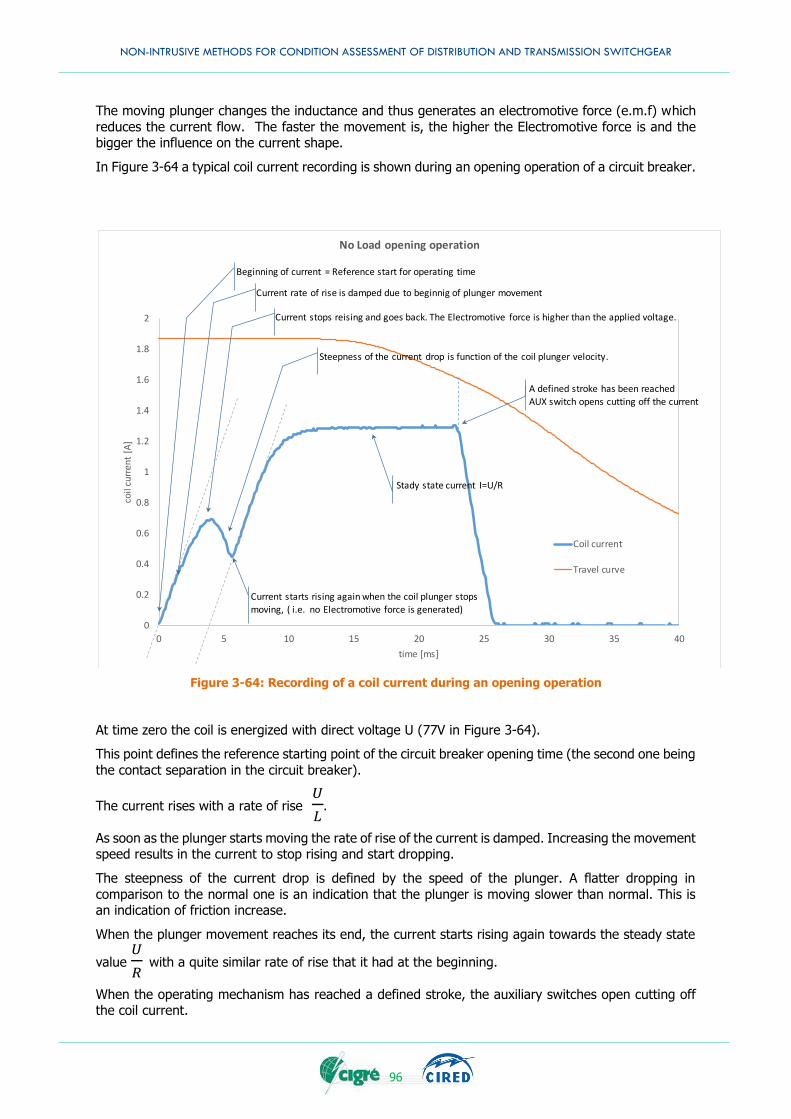
NON-INTRUSIVE METHODS FOR CONDITION ASSESSMENT OF DISTRIBUTION AND TRANSMISSION SWITCHGEAR
96
The moving plunger changes the inductance and thus generates an electromotive force (e.m.f) which
reduces the current flow. The faster the movement is, the higher the Electromotive force is and the bigger the influence on the current shape.
In Figure 3-64 a typical coil current recording is shown during an opening operation of a circuit breaker.
Figure 3-64: Recording of a coil current during an opening operation
At time zero the coil is energized with direct voltage U (77V in Figure 3-64).
This point defines the reference starting point of the circuit breaker opening time (the second one being
the contact separation in the circuit breaker).
The current rises with a rate of rise 𝑈
𝐿.
As soon as the plunger starts moving the rate of rise of the current is damped. Increasing the movement speed results in the current to stop rising and start dropping.
The steepness of the current drop is defined by the speed of the plunger. A flatter dropping in
comparison to the normal one is an indication that the plunger is moving slower than normal. This is an indication of friction increase.
When the plunger movement reaches its end, the current starts rising again towards the steady state
value 𝑈
𝑅 with a quite similar rate of rise that it had at the beginning.
When the operating mechanism has reached a defined stroke, the auxiliary switches open cutting off the coil current.
0
0.2
0.4
0.6
0.8
1
1.2
1.4
1.6
1.8
2
0 5 10 15 20 25 30 35 40
coil
curr
ent
[A]
time [ms]
No Load opening operation
Coil current
Travel curve
Beginning of current = Reference start for operating time
Stady state current I=U/R
Current stops reising and goes back. The Electromotive force is higher than the applied voltage.
Current starts rising again when the coil plunger stops moving, ( i.e. no Electromotive force is generated)
Steepness of the current drop is function of the coil plunger velocity.
A defined stroke has been reachedAUX switch opens cutting off the current
Current rate of rise is damped due to beginnig of plunger movement
NON-INTRUSIVE METHODS FOR CONDITION ASSESSMENT OF DISTRIBUTION AND TRANSMISSION SWITCHGEAR
97
An earlier or later start of the current cut off indicates a change of velocity of the operating mechanism.
DEGREE OF MATURITY
EASE OF USE AND CONSTRAINTS
Analysis of the shape is a well known and settled diagnostic method for people dealing with
circuit breakers.
It requires a basic knowledge to be carried out properly.
Limit settings and use of comparison method with a reference finger print allows an automatic evaluation quite useful in the case of continuous monitoring.
3.4 SUMMARY
In this chapter, 55 condition assessment methods for switchgear were presented. The majority of
these can be used for both MV and HV switchgear. The discussed methods were classified in three different categories: Primary Path, Mechanical and Control. While some of the methods have to be
installed intrusively or minimally intrusively, all of the presented methods operate completely non-
intrusively. In addition, the presented methods have been further categorized in their grid integrity as well as their degree of maturity. Many of the methods are very mature, however for example most of
the methods that investigate the condition of the vacuum in a vacuum circuit breaker are still in the investigation phase.

NON-INTRUSIVE METHODS FOR CONDITION ASSESSMENT OF DISTRIBUTION AND TRANSMISSION SWITCHGEAR
98
NON-INTRUSIVE METHODS FOR CONDITION ASSESSMENT OF DISTRIBUTION AND TRANSMISSION SWITCHGEAR
99
4. APPLICATION OF CONDITION ASSESSMENT METHODS
4.1 INTRODUCTION
Having identified and documented a large number of non-intrusive diagnostic methods that could
potentially improve maintenance and condition assessment practices in the power delivery industry, the JWG A3.32 was then interested in knowing how these methods are actually used and perceived by
different utilities. Therefore, the WG decided to conduct an international survey on condition assessment of T&D switchgear. The questionnaire was developed using a specialized web tool, allowing
users to conveniently answer the survey online (Figure 4-4). The survey could be filled in for three voltage levels; <38 kV, >38 to ≤170 kV and >170 kV. It was sent at the beginning of 2015 to hundreds
of people with some relationship to the WG members.
Altogether, a total of 49 independent respondents coming from 18 different countries have answered the survey. When broken down across the different voltage classes, the number of completed surveys
were 31 for <38 kV, 33 for >38 to ≤170 kV and 27 for >170 kV. The answers have been collected anonymously from February 2nd, 2015 to November 25th, 2016. The analyses and outcomes of the
survey are presented in Section 4.2 and APPENDIX E provides full details of the survey questionnaire.
Among the objectives of the survey, we wanted to gather feedback, experience and future needs from utilities regarding condition assessment, and to better understand the context in which non-intrusive
diagnostics are applied by utilities.
4.2 SURVEY RESULTS
At first, the respondent was asked to provide general information on its company profile (location, size,
etc.) and detailed information on its circuit breaker fleet, such as voltage levels, number of units, technologies, etc. Then, for each category of circuit breaker, we asked which type of maintenance is
usually applied:
TIME BASED PREVENTIVE MAINTENANCE (TBPM)
Maintenance activities are performed at fixed intervals of calendar time or according to a number of
switching operations. Both procedures and schedules are usually based on manufacturers’
recommendations or industry standards.
CONDITION BASED MAINTENANCE (CBM)
Incipient failures are usually corrected before they become an impact to the grid operation. Under this approach, information from diagnostic tests and monitoring systems are usually used to predict future
failures.
RELIABILITY CENTERED MAINTENANCE (RCM)
Maintenance activities are specified and scheduled in accordance with the statistical failure rate and/or
life expectancy of the equipment.
CORRECTIVE MAINTENANCE (CM)
Degraded equipment is only repaired and or replaced when the impact of the degradation on the grid
operation becomes unacceptable. This approach is often called "run to failure".
From the long list of non-intrusive methods presented in the previous chapter, the respondent selected
those presently used by its company. For each non-intrusive diagnostic method selected, the
respondent was asked to specify how the method was actually employed by its company by giving, for example, its degree of maturity and frequency of utilization.
Furthermore, we wanted to know the respondent’s perception of each selected diagnostic method regarding its ease of use and also the ease in analyzing the diagnostic results. Also, the respondent’s
general opinion was sought by asking the following three questions for each voltage level:
How important is the cost advantage of using non-intrusive diagnostic techniques?
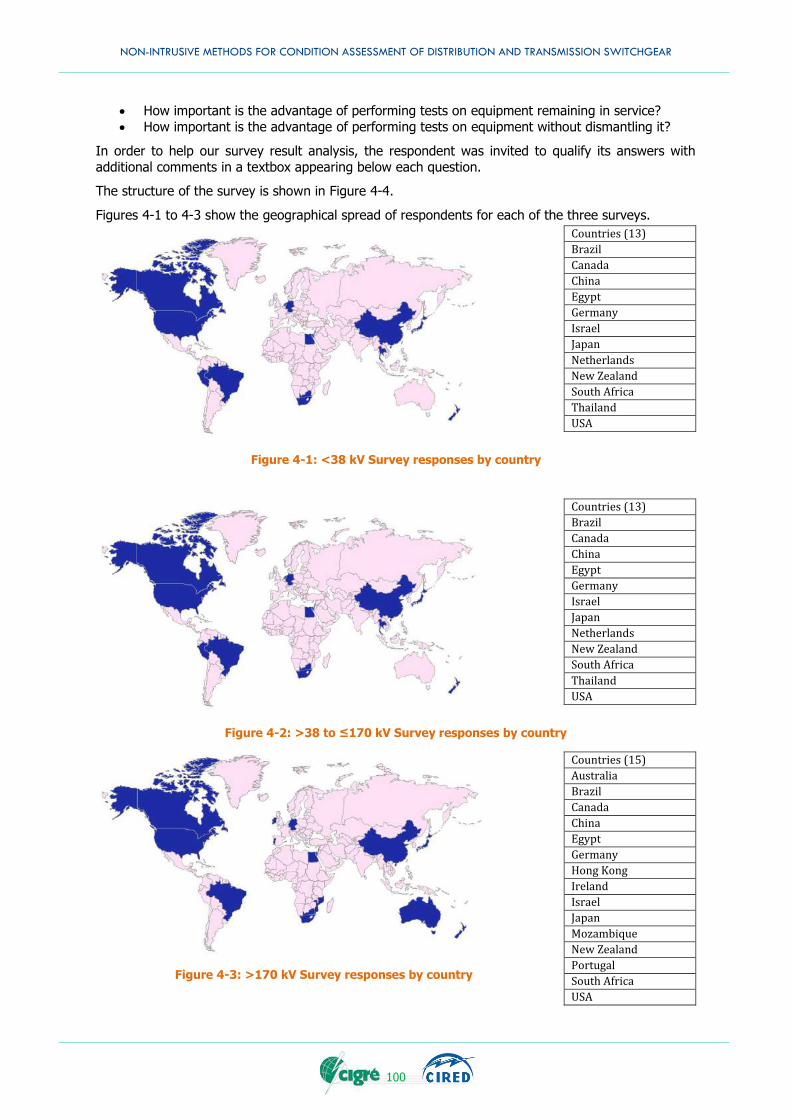
NON-INTRUSIVE METHODS FOR CONDITION ASSESSMENT OF DISTRIBUTION AND TRANSMISSION SWITCHGEAR
100
How important is the advantage of performing tests on equipment remaining in service?
How important is the advantage of performing tests on equipment without dismantling it?
In order to help our survey result analysis, the respondent was invited to qualify its answers with
additional comments in a textbox appearing below each question.
The structure of the survey is shown in Figure 4-4.
Figures 4-1 to 4-3 show the geographical spread of respondents for each of the three surveys.
Figure 4-1: <38 kV Survey responses by country
Figure 4-2: >38 to ≤170 kV Survey responses by country
Figure 4-3: >170 kV Survey responses by country
Countries (13)
Brazil
Canada
China
Egypt
Germany
Israel
Japan
Netherlands
New Zealand
South Africa
Thailand
USA
Countries (13)
Brazil
Canada
China
Egypt
Germany
Israel
Japan
Netherlands
New Zealand
South Africa
Thailand
USA
Countries (15)
Australia
Brazil
Canada
China
Egypt
Germany
Hong Kong
Ireland
Israel
Japan
Mozambique
New Zealand
Portugal
South Africa
USA
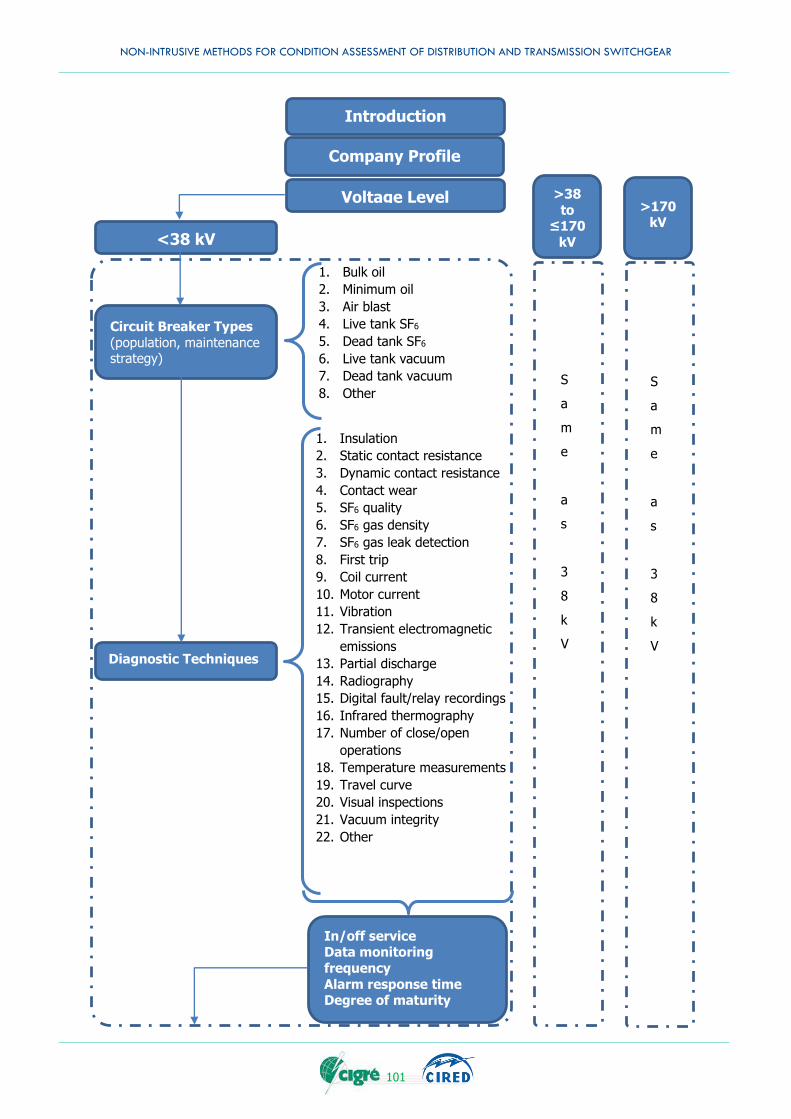
NON-INTRUSIVE METHODS FOR CONDITION ASSESSMENT OF DISTRIBUTION AND TRANSMISSION SWITCHGEAR
101
Introduction
Company Profile
Voltage Level
<38 kV
Circuit Breaker Types
(population, maintenance strategy)
1. Bulk oil
2. Minimum oil
3. Air blast
4. Live tank SF6
5. Dead tank SF6
6. Live tank vacuum
7. Dead tank vacuum
8. Other
Diagnostic Techniques
1. Insulation
2. Static contact resistance
3. Dynamic contact resistance
4. Contact wear
5. SF6 quality
6. SF6 gas density
7. SF6 gas leak detection
8. First trip
9. Coil current
10. Motor current
11. Vibration
12. Transient electromagnetic
emissions
13. Partial discharge
14. Radiography
15. Digital fault/relay recordings
16. Infrared thermography
17. Number of close/open
operations
18. Temperature measurements
19. Travel curve
20. Visual inspections
21. Vacuum integrity
22. Other
S
a
m
e
a
s
3
8
k
V
S
a
m
e
a
s
3
8
k
V
In/off service Data monitoring
frequency
Alarm response time Degree of maturity
>38
to ≤170
kV
>170 kV
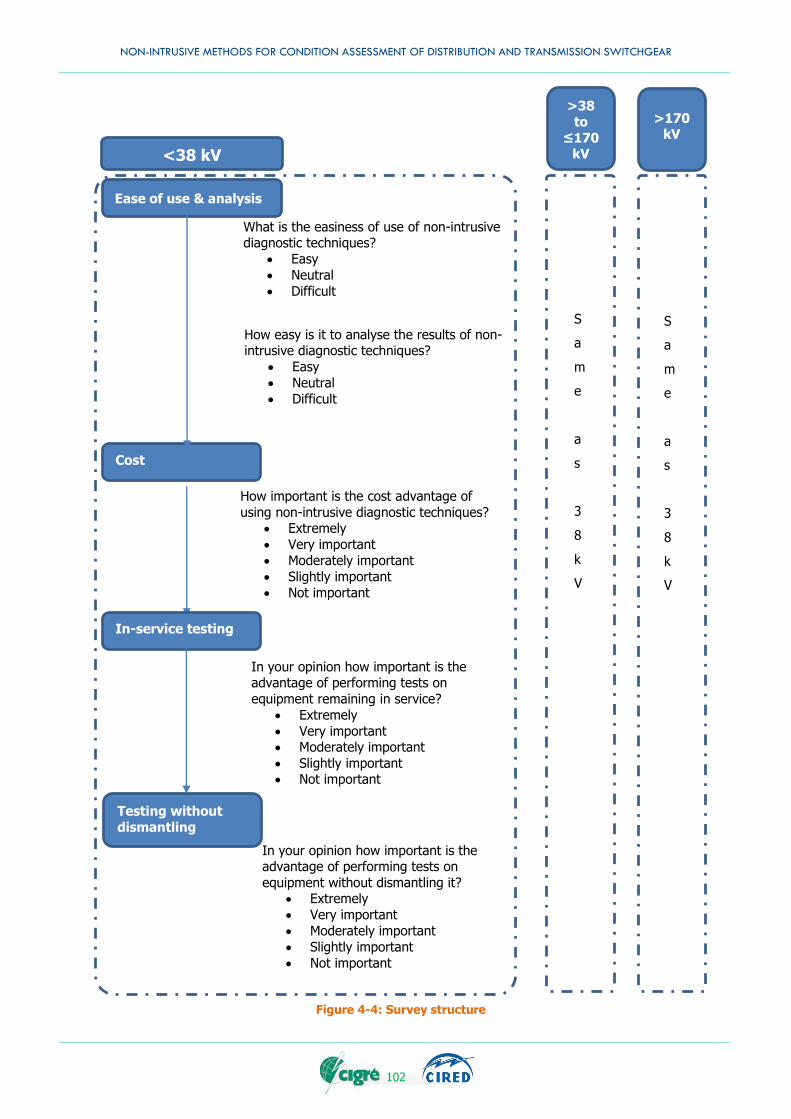
NON-INTRUSIVE METHODS FOR CONDITION ASSESSMENT OF DISTRIBUTION AND TRANSMISSION SWITCHGEAR
102
In your opinion how important is the advantage of performing tests on
equipment without dismantling it? Extremely
Very important
Moderately important
Slightly important
Not important
In your opinion how important is the advantage of performing tests on
equipment remaining in service?
Extremely
Very important Moderately important
Slightly important Not important
How important is the cost advantage of
using non-intrusive diagnostic techniques? Extremely
Very important
Moderately important
Slightly important
Not important
How easy is it to analyse the results of non-intrusive diagnostic techniques?
Easy
Neutral
Difficult
What is the easiness of use of non-intrusive diagnostic techniques?
Easy
Neutral
Difficult
Ease of use & analysis
Cost
S
a
m
e
a
s
3
8
k
V
S
a
m
e
a
s
3
8
k
V
In-service testing
Testing without
dismantling
Figure 4-4: Survey structure
<38 kV
>38 to
≤170 kV
>170 kV
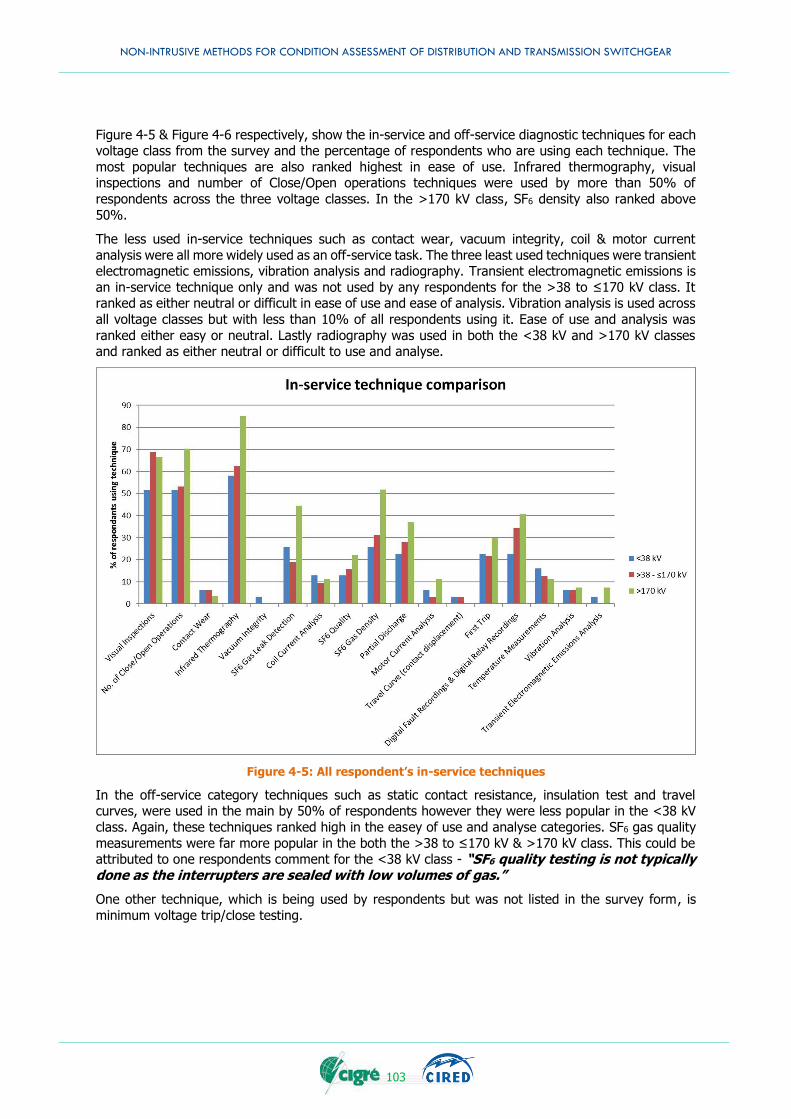
NON-INTRUSIVE METHODS FOR CONDITION ASSESSMENT OF DISTRIBUTION AND TRANSMISSION SWITCHGEAR
103
Figure 4-5 & Figure 4-6 respectively, show the in-service and off-service diagnostic techniques for each voltage class from the survey and the percentage of respondents who are using each technique. The
most popular techniques are also ranked highest in ease of use. Infrared thermography, visual inspections and number of Close/Open operations techniques were used by more than 50% of
respondents across the three voltage classes. In the >170 kV class, SF6 density also ranked above
50%.
The less used in-service techniques such as contact wear, vacuum integrity, coil & motor current
analysis were all more widely used as an off-service task. The three least used techniques were transient electromagnetic emissions, vibration analysis and radiography. Transient electromagnetic emissions is
an in-service technique only and was not used by any respondents for the >38 to ≤170 kV class. It ranked as either neutral or difficult in ease of use and ease of analysis. Vibration analysis is used across
all voltage classes but with less than 10% of all respondents using it. Ease of use and analysis was
ranked either easy or neutral. Lastly radiography was used in both the <38 kV and >170 kV classes and ranked as either neutral or difficult to use and analyse.
Figure 4-5: All respondent’s in-service techniques
In the off-service category techniques such as static contact resistance, insulation test and travel curves, were used in the main by 50% of respondents however they were less popular in the <38 kV
class. Again, these techniques ranked high in the easey of use and analyse categories. SF6 gas quality
measurements were far more popular in the both the >38 to ≤170 kV & >170 kV class. This could be attributed to one respondents comment for the <38 kV class - “SF6 quality testing is not typically done as the interrupters are sealed with low volumes of gas.”
One other technique, which is being used by respondents but was not listed in the survey form, is
minimum voltage trip/close testing.
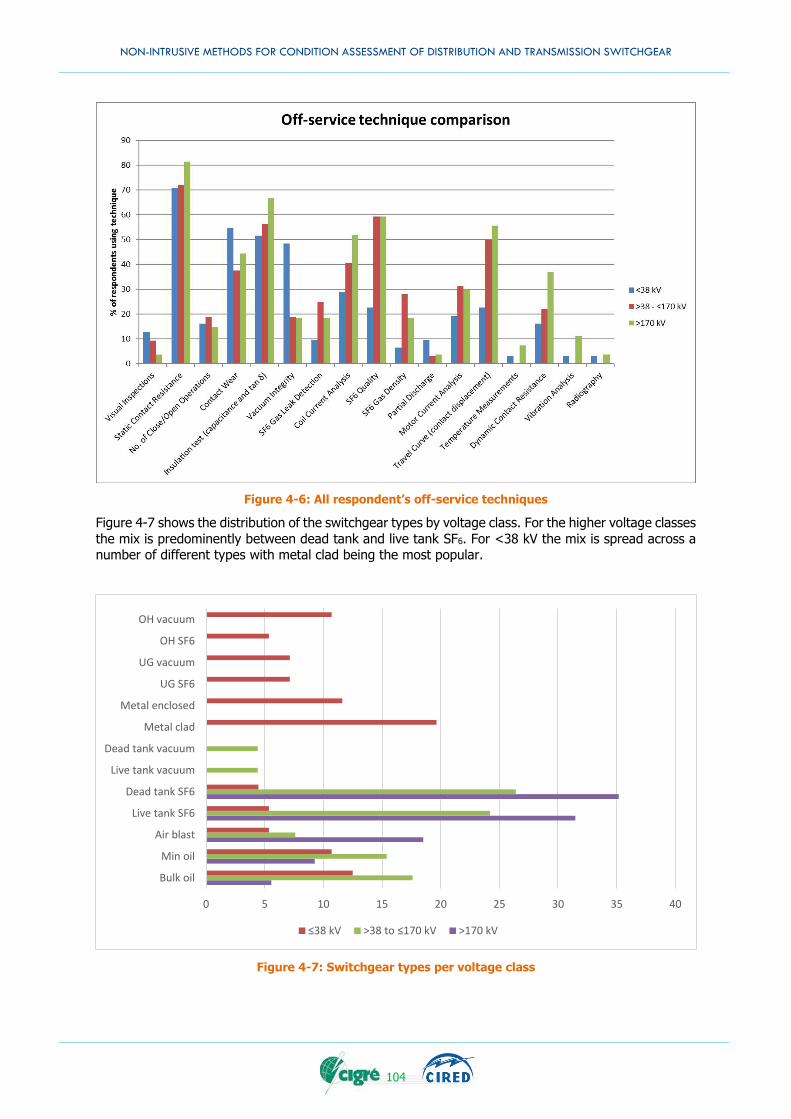
NON-INTRUSIVE METHODS FOR CONDITION ASSESSMENT OF DISTRIBUTION AND TRANSMISSION SWITCHGEAR
104
Figure 4-6: All respondent’s off-service techniques
Figure 4-7 shows the distribution of the switchgear types by voltage class. For the higher voltage classes
the mix is predominently between dead tank and live tank SF6. For <38 kV the mix is spread across a number of different types with metal clad being the most popular.
Figure 4-7: Switchgear types per voltage class
0 5 10 15 20 25 30 35 40
Bulk oil
Min oil
Air blast
Live tank SF6
Dead tank SF6
Live tank vacuum
Dead tank vacuum
Metal clad
Metal enclosed
UG SF6
UG vacuum
OH SF6
OH vacuum
≤38 kV >38 to ≤170 kV >170 kV
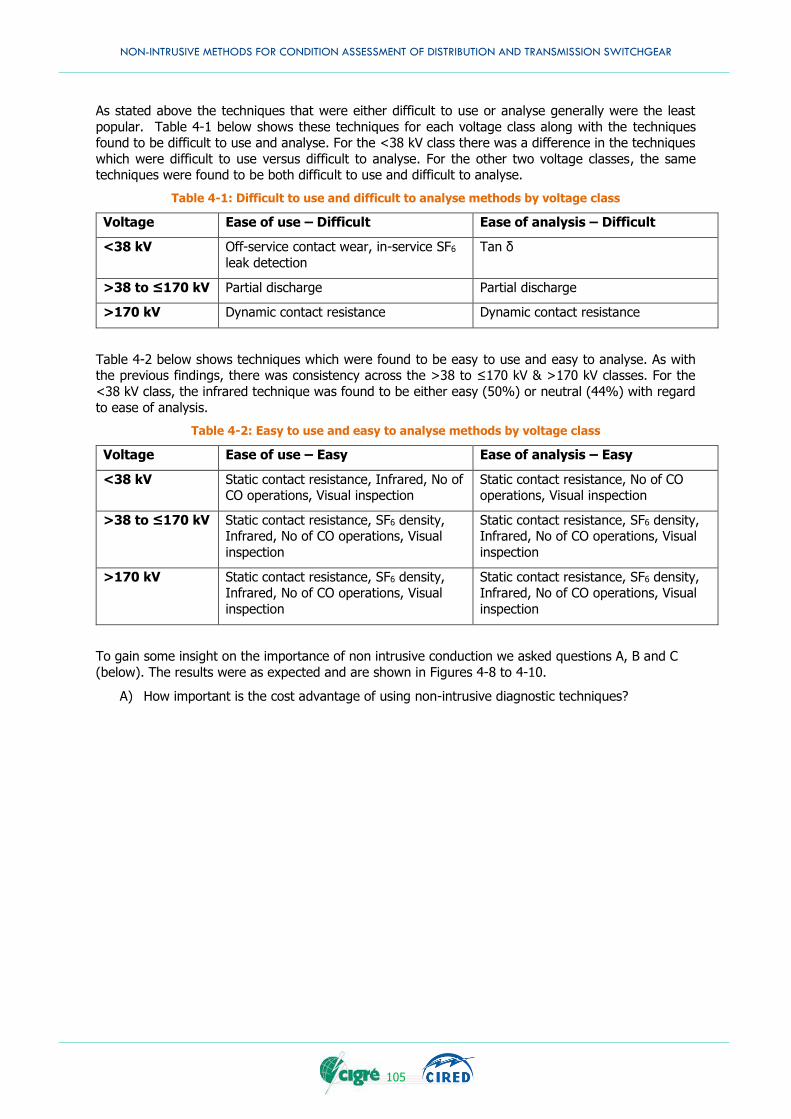
NON-INTRUSIVE METHODS FOR CONDITION ASSESSMENT OF DISTRIBUTION AND TRANSMISSION SWITCHGEAR
105
As stated above the techniques that were either difficult to use or analyse generally were the least
popular. Table 4-1 below shows these techniques for each voltage class along with the techniques found to be difficult to use and analyse. For the <38 kV class there was a difference in the techniques
which were difficult to use versus difficult to analyse. For the other two voltage classes, the same techniques were found to be both difficult to use and difficult to analyse.
Table 4-1: Difficult to use and difficult to analyse methods by voltage class
Voltage Ease of use – Difficult Ease of analysis – Difficult
<38 kV Off-service contact wear, in-service SF6
leak detection
Tan δ
>38 to ≤170 kV Partial discharge Partial discharge
>170 kV Dynamic contact resistance Dynamic contact resistance
Table 4-2 below shows techniques which were found to be easy to use and easy to analyse. As with the previous findings, there was consistency across the >38 to ≤170 kV & >170 kV classes. For the
<38 kV class, the infrared technique was found to be either easy (50%) or neutral (44%) with regard
to ease of analysis.
Table 4-2: Easy to use and easy to analyse methods by voltage class
Voltage Ease of use – Easy Ease of analysis – Easy
<38 kV Static contact resistance, Infrared, No of CO operations, Visual inspection
Static contact resistance, No of CO operations, Visual inspection
>38 to ≤170 kV Static contact resistance, SF6 density, Infrared, No of CO operations, Visual
inspection
Static contact resistance, SF6 density, Infrared, No of CO operations, Visual
inspection
>170 kV Static contact resistance, SF6 density, Infrared, No of CO operations, Visual
inspection
Static contact resistance, SF6 density, Infrared, No of CO operations, Visual
inspection
To gain some insight on the importance of non intrusive conduction we asked questions A, B and C
(below). The results were as expected and are shown in Figures 4-8 to 4-10.
A) How important is the cost advantage of using non-intrusive diagnostic techniques?
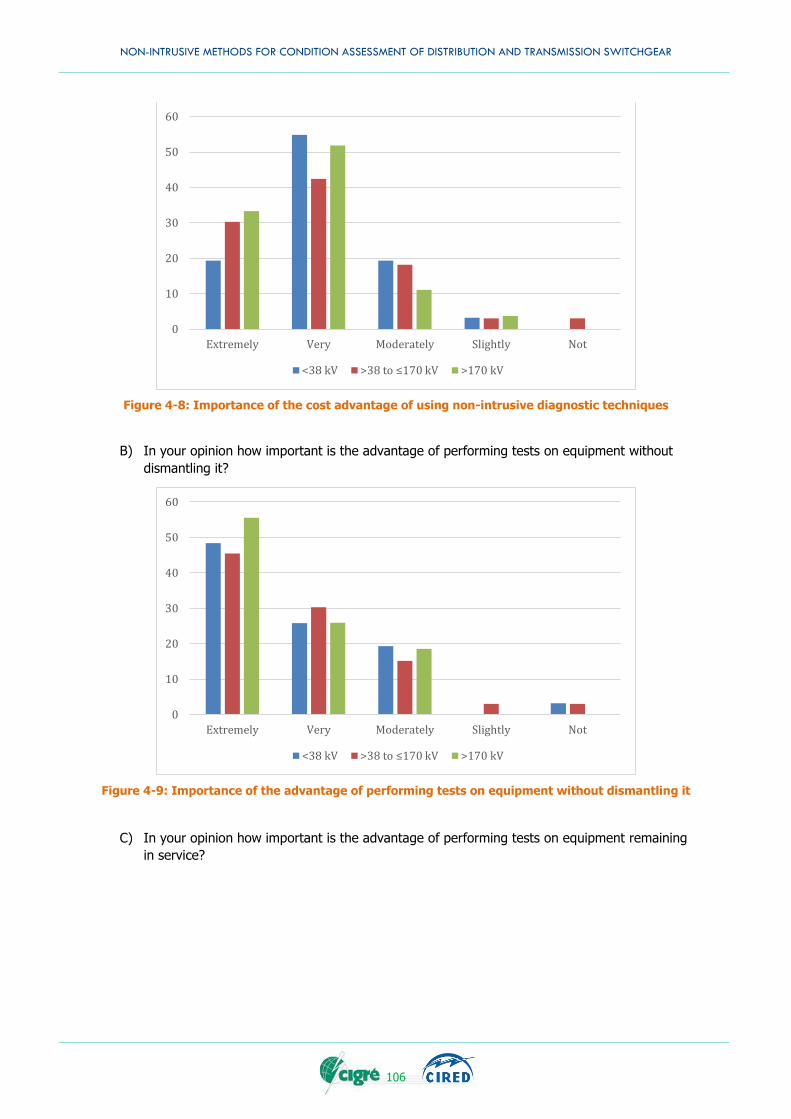
NON-INTRUSIVE METHODS FOR CONDITION ASSESSMENT OF DISTRIBUTION AND TRANSMISSION SWITCHGEAR
106
Figure 4-8: Importance of the cost advantage of using non-intrusive diagnostic techniques
B) In your opinion how important is the advantage of performing tests on equipment without
dismantling it?
Figure 4-9: Importance of the advantage of performing tests on equipment without dismantling it
C) In your opinion how important is the advantage of performing tests on equipment remaining
in service?
0
10
20
30
40
50
60
Extremely Very Moderately Slightly Not
<38 kV >38 to ≤170 kV >170 kV
0
10
20
30
40
50
60
Extremely Very Moderately Slightly Not
<38 kV >38 to ≤170 kV >170 kV

NON-INTRUSIVE METHODS FOR CONDITION ASSESSMENT OF DISTRIBUTION AND TRANSMISSION SWITCHGEAR
107
Figure 4-10: Importance of the advantage of performing tests on equipment remaining in service
As expected by the working group, the responses to the questions concerning costs, importance of not dismantling the equipment and that the equipment remains in service were either regarded as
very or extremely important. Figure 4-8 to Figure 4-10 show how the respondents answer these three questions. The authors of this document believe that as the techniques become less expensive and
easier to use, they will become more common place.
4.3 SELECTED CASE STUDIES
Case studies presented in this chapter are extracted from the literature review conducted by the JWG
and from personal experience of WG members.
Condition assessment methods introduced in previous chapter may be applied in different contexts and for several different reasons. The main situations where such methods could be required include:
Maintenance
Investigation of failures
End-of-life assessment
Case studies were selected in order to highlight the value and usefulness of applying non-intrusive methods in different situations. They also show how such methods can be applied by users. In this
section, different strategies are presented, like applying a combination of non-intrusive methods to improve the CB condition assessment. In some others case studies, diagnostic methods are applied in
progressive steps, starting with the most non-intrusive method that can be applied cheaply and easily.
Then, after discovering a suspicious functioning or a bad condition of the CB, the investigation can progress towards intrusive methods. Such a diagnostic process is illustrated in Figure 4-11.
Some case studies also provide some ideas on how to analyse results obtained from non-intrusive diagnostics, which are often indirect measurements, without any acceptance criteria. The analyses
include comparison between poles of the same breaker, trending analysis over a long period of time,
etc.
0
10
20
30
40
50
60
Extremely Very Moderately Slightly Not
<38 kV >38 to ≤170 kV >170 kV
NON-INTRUSIVE METHODS FOR CONDITION ASSESSMENT OF DISTRIBUTION AND TRANSMISSION SWITCHGEAR
108
Figure 4-11: Example of diagnostic process in progressive step
4.3.1 Main Contact Motion Measurements
Measurement of contact motion with a transducer mounted on the operating mechanism is a well-
established diagnostic test widely used on several types of circuit breakers. This method is known for providing good indications on the circuit breaker mechanism condition. However, some factors may
complicate the analysis of motion curves:
Unavailability of acceptance criteria
Type and position of the transducer
Lack of knowledge on the mechanical design
The unknown relationship between the linear contact motion and the rotation
Typical condition indicators for motion measurement are (See Figure 3-62):
Total Travel
Speed Calculation Zone
Make / Break Distance
Reaction Time
Mechanism time
Nevertheless, such criteria are not always provided by the manufacturer or known by the users. On the other hand, these criteria are only applicable for one moving point. If for a practical reason a transducer
is mounted away from this point, a correspondence function should be applied, but this latter is not
always available.
In the following example [Lalonde2015], motion test results at commissioning are used as reference
for a 330 kV SF6 circuit breaker without acceptance criteria. During routine maintenance tests, rotary motion curves were compared with the reference curve in three distinct zones (Figure 4-12). As the
percentage of deviation for phase C motion in zone 3 (damping) differs considerably from A and B, it was decided to do a visual inspection of the opening dashpot accessible from the top of the operating
mechanism, where obvious oil leaks have been found (Figure 4-13).
Non-intrusive method
Minimally intrusive method method
Intrusive method
Decision
Example #1
Non-intrusive method #1
Non-intrusive method #2
Non-intrusive method #3
Intrusive method
Example #2
Decision
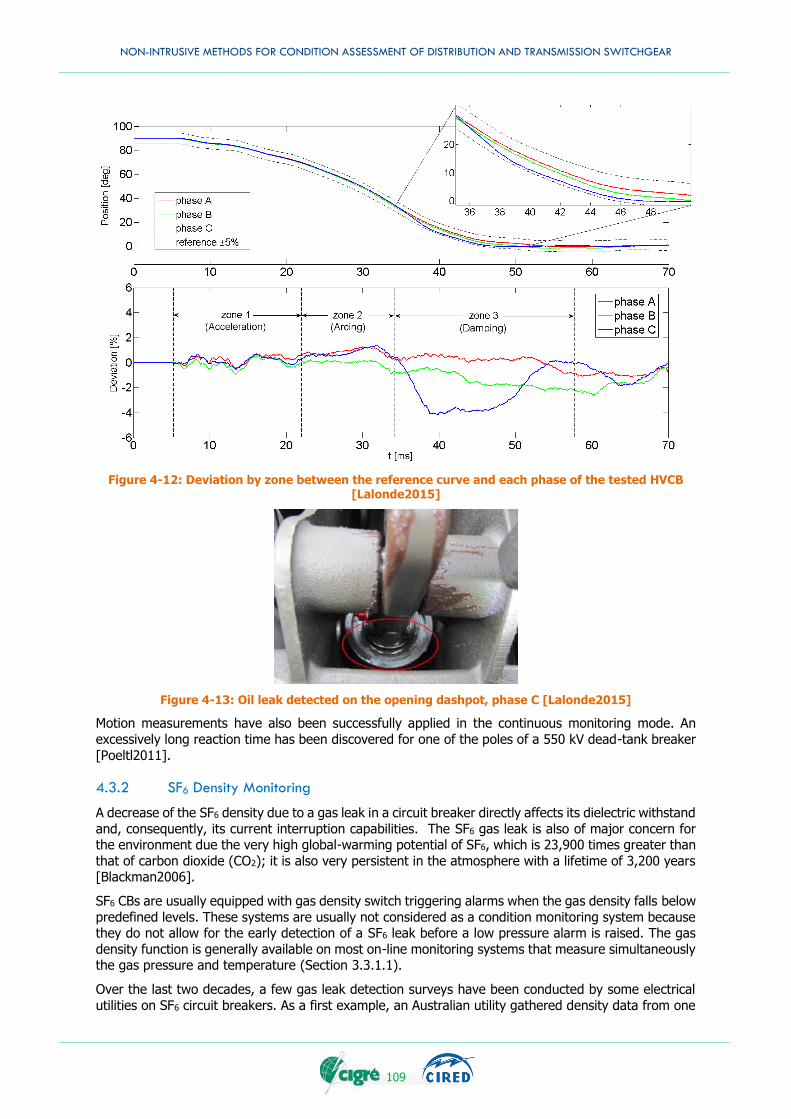
NON-INTRUSIVE METHODS FOR CONDITION ASSESSMENT OF DISTRIBUTION AND TRANSMISSION SWITCHGEAR
109
Figure 4-12: Deviation by zone between the reference curve and each phase of the tested HVCB [Lalonde2015]
Figure 4-13: Oil leak detected on the opening dashpot, phase C [Lalonde2015]
Motion measurements have also been successfully applied in the continuous monitoring mode. An
excessively long reaction time has been discovered for one of the poles of a 550 kV dead-tank breaker
[Poeltl2011].
4.3.2 SF6 Density Monitoring
A decrease of the SF6 density due to a gas leak in a circuit breaker directly affects its dielectric withstand
and, consequently, its current interruption capabilities. The SF6 gas leak is also of major concern for the environment due the very high global-warming potential of SF6, which is 23,900 times greater than
that of carbon dioxide (CO2); it is also very persistent in the atmosphere with a lifetime of 3,200 years [Blackman2006].
SF6 CBs are usually equipped with gas density switch triggering alarms when the gas density falls below
predefined levels. These systems are usually not considered as a condition monitoring system because they do not allow for the early detection of a SF6 leak before a low pressure alarm is raised. The gas
density function is generally available on most on-line monitoring systems that measure simultaneously the gas pressure and temperature (Section 3.3.1.1).
Over the last two decades, a few gas leak detection surveys have been conducted by some electrical
utilities on SF6 circuit breakers. As a first example, an Australian utility gathered density data from one
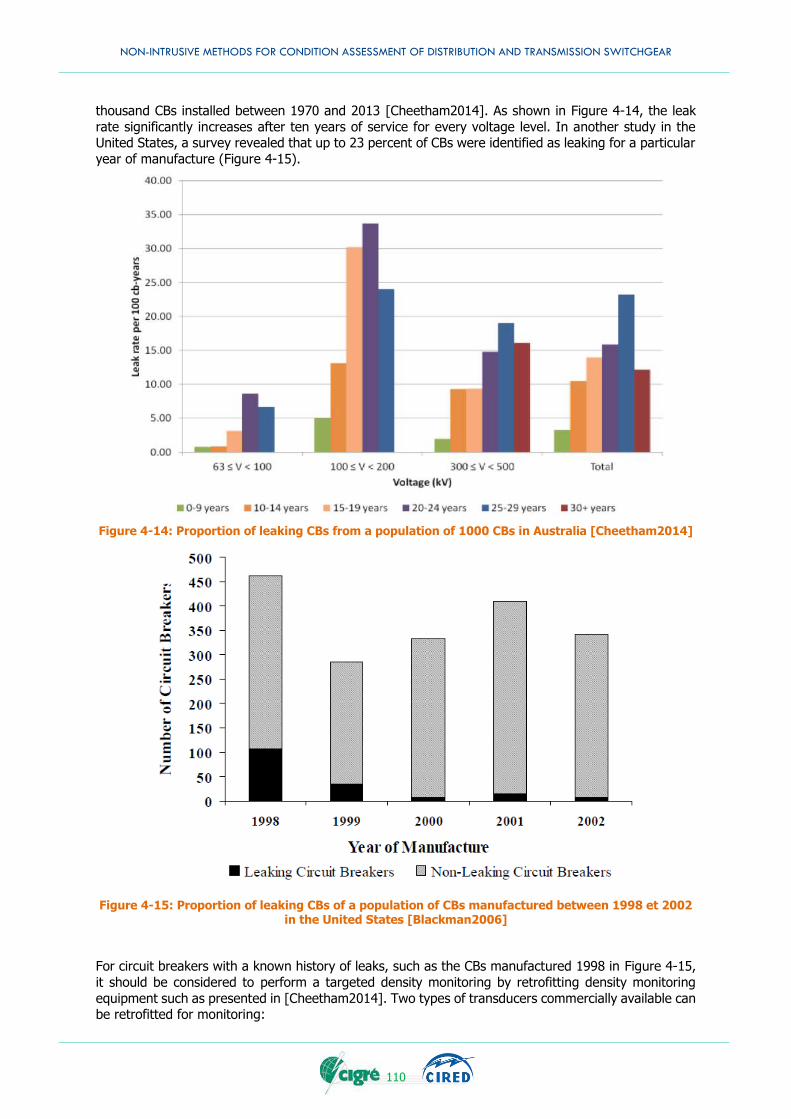
NON-INTRUSIVE METHODS FOR CONDITION ASSESSMENT OF DISTRIBUTION AND TRANSMISSION SWITCHGEAR
110
thousand CBs installed between 1970 and 2013 [Cheetham2014]. As shown in Figure 4-14, the leak
rate significantly increases after ten years of service for every voltage level. In another study in the United States, a survey revealed that up to 23 percent of CBs were identified as leaking for a particular
year of manufacture (Figure 4-15).
Figure 4-14: Proportion of leaking CBs from a population of 1000 CBs in Australia [Cheetham2014]
Figure 4-15: Proportion of leaking CBs of a population of CBs manufactured between 1998 et 2002 in the United States [Blackman2006]
For circuit breakers with a known history of leaks, such as the CBs manufactured 1998 in Figure 4-15,
it should be considered to perform a targeted density monitoring by retrofitting density monitoring
equipment such as presented in [Cheetham2014]. Two types of transducers commercially available can be retrofitted for monitoring:
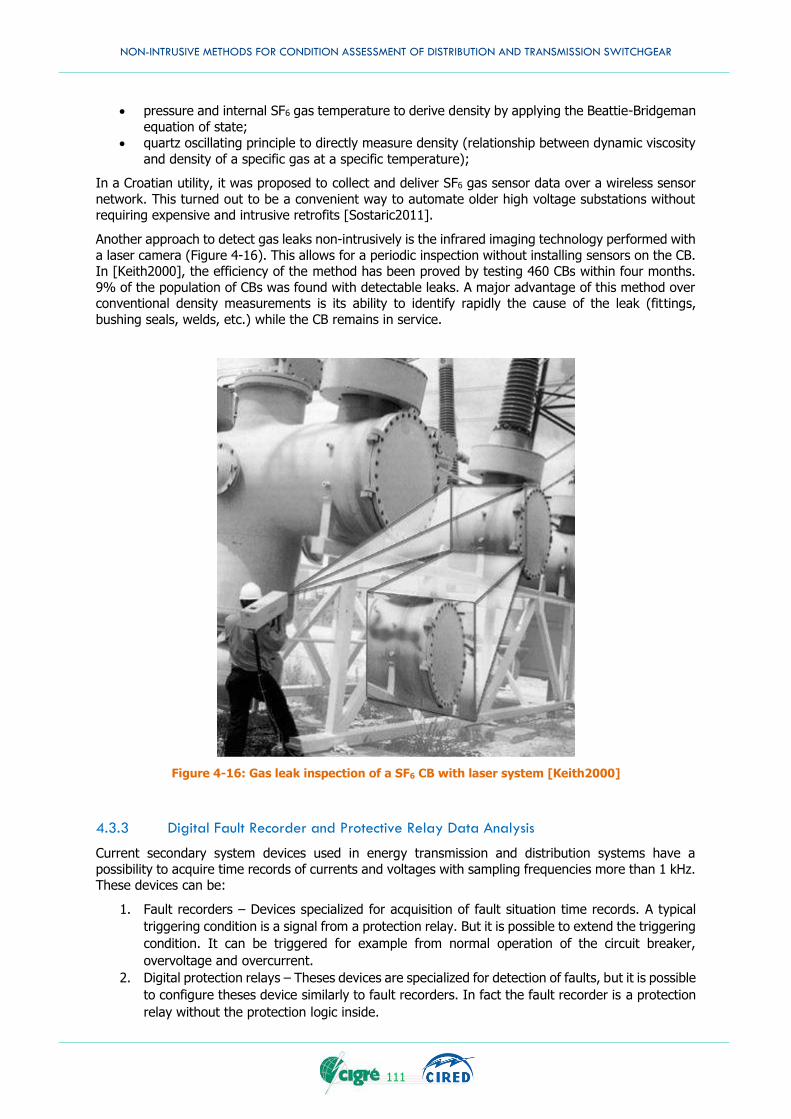
NON-INTRUSIVE METHODS FOR CONDITION ASSESSMENT OF DISTRIBUTION AND TRANSMISSION SWITCHGEAR
111
pressure and internal SF6 gas temperature to derive density by applying the Beattie-Bridgeman
equation of state;
quartz oscillating principle to directly measure density (relationship between dynamic viscosity
and density of a specific gas at a specific temperature);
In a Croatian utility, it was proposed to collect and deliver SF6 gas sensor data over a wireless sensor
network. This turned out to be a convenient way to automate older high voltage substations without requiring expensive and intrusive retrofits [Sostaric2011].
Another approach to detect gas leaks non-intrusively is the infrared imaging technology performed with
a laser camera (Figure 4-16). This allows for a periodic inspection without installing sensors on the CB. In [Keith2000], the efficiency of the method has been proved by testing 460 CBs within four months.
9% of the population of CBs was found with detectable leaks. A major advantage of this method over conventional density measurements is its ability to identify rapidly the cause of the leak (fittings,
bushing seals, welds, etc.) while the CB remains in service.
Figure 4-16: Gas leak inspection of a SF6 CB with laser system [Keith2000]
4.3.3 Digital Fault Recorder and Protective Relay Data Analysis
Current secondary system devices used in energy transmission and distribution systems have a
possibility to acquire time records of currents and voltages with sampling frequencies more than 1 kHz. These devices can be:
1. Fault recorders – Devices specialized for acquisition of fault situation time records. A typical
triggering condition is a signal from a protection relay. But it is possible to extend the triggering
condition. It can be triggered for example from normal operation of the circuit breaker,
overvoltage and overcurrent.
2. Digital protection relays – Theses devices are specialized for detection of faults, but it is possible
to configure theses device similarly to fault recorders. In fact the fault recorder is a protection
relay without the protection logic inside.
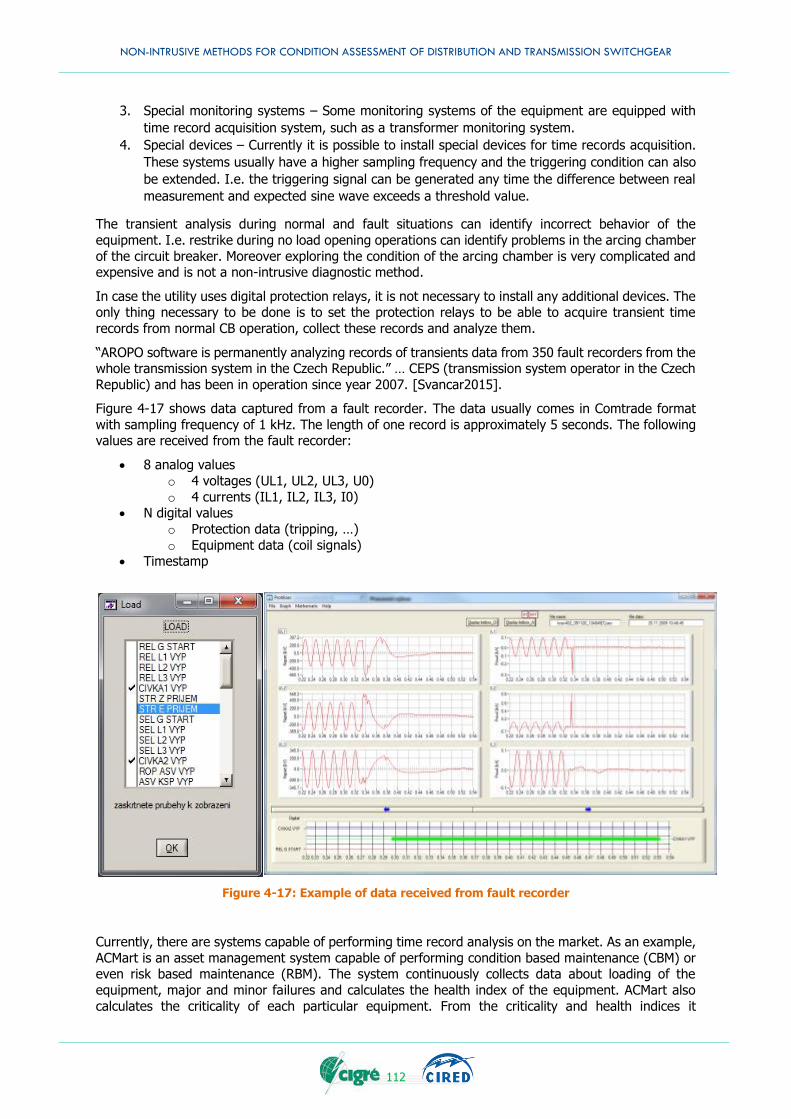
NON-INTRUSIVE METHODS FOR CONDITION ASSESSMENT OF DISTRIBUTION AND TRANSMISSION SWITCHGEAR
112
3. Special monitoring systems – Some monitoring systems of the equipment are equipped with
time record acquisition system, such as a transformer monitoring system.
4. Special devices – Currently it is possible to install special devices for time records acquisition.
These systems usually have a higher sampling frequency and the triggering condition can also
be extended. I.e. the triggering signal can be generated any time the difference between real
measurement and expected sine wave exceeds a threshold value.
The transient analysis during normal and fault situations can identify incorrect behavior of the
equipment. I.e. restrike during no load opening operations can identify problems in the arcing chamber
of the circuit breaker. Moreover exploring the condition of the arcing chamber is very complicated and expensive and is not a non-intrusive diagnostic method.
In case the utility uses digital protection relays, it is not necessary to install any additional devices. The only thing necessary to be done is to set the protection relays to be able to acquire transient time
records from normal CB operation, collect these records and analyze them.
“AROPO software is permanently analyzing records of transients data from 350 fault recorders from the whole transmission system in the Czech Republic.” … CEPS (transmission system operator in the Czech
Republic) and has been in operation since year 2007. [Svancar2015].
Figure 4-17 shows data captured from a fault recorder. The data usually comes in Comtrade format
with sampling frequency of 1 kHz. The length of one record is approximately 5 seconds. The following values are received from the fault recorder:
8 analog values
o 4 voltages (UL1, UL2, UL3, U0)
o 4 currents (IL1, IL2, IL3, I0) N digital values
o Protection data (tripping, …)
o Equipment data (coil signals) Timestamp
Figure 4-17: Example of data received from fault recorder
Currently, there are systems capable of performing time record analysis on the market. As an example,
ACMart is an asset management system capable of performing condition based maintenance (CBM) or even risk based maintenance (RBM). The system continuously collects data about loading of the
equipment, major and minor failures and calculates the health index of the equipment. ACMart also
calculates the criticality of each particular equipment. From the criticality and health indices it
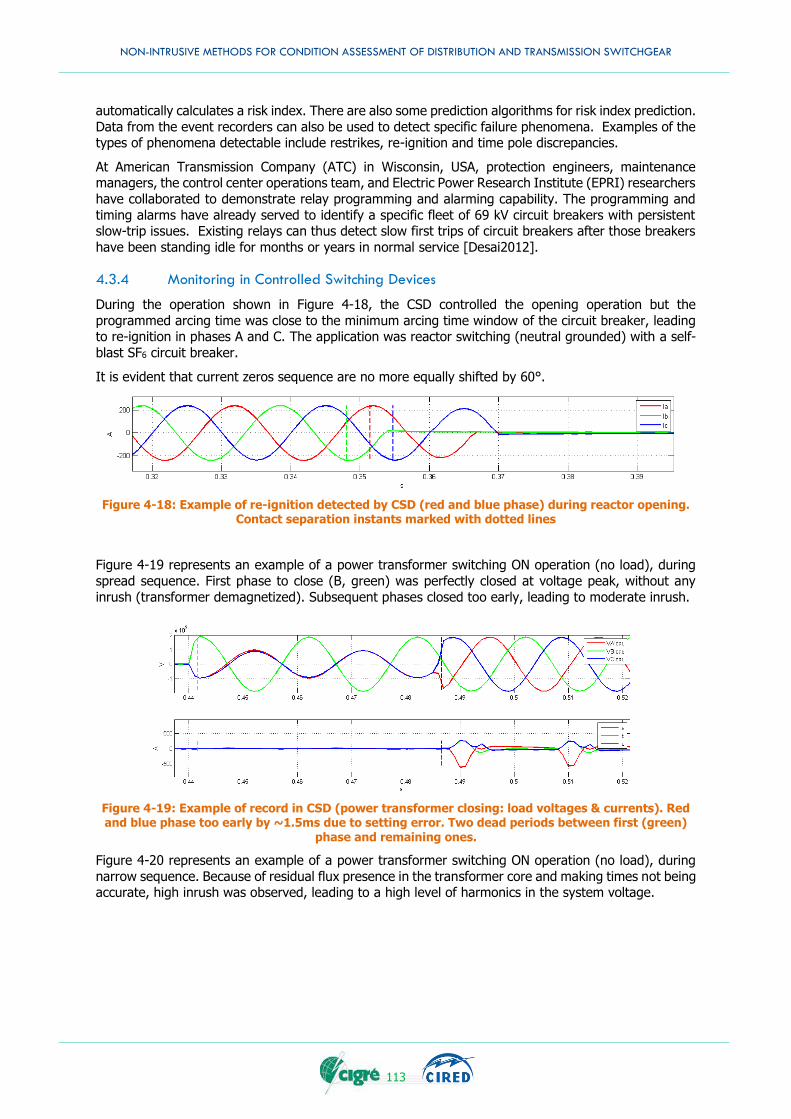
NON-INTRUSIVE METHODS FOR CONDITION ASSESSMENT OF DISTRIBUTION AND TRANSMISSION SWITCHGEAR
113
automatically calculates a risk index. There are also some prediction algorithms for risk index prediction.
Data from the event recorders can also be used to detect specific failure phenomena. Examples of the types of phenomena detectable include restrikes, re-ignition and time pole discrepancies.
At American Transmission Company (ATC) in Wisconsin, USA, protection engineers, maintenance managers, the control center operations team, and Electric Power Research Institute (EPRI) researchers
have collaborated to demonstrate relay programming and alarming capability. The programming and
timing alarms have already served to identify a specific fleet of 69 kV circuit breakers with persistent slow-trip issues. Existing relays can thus detect slow first trips of circuit breakers after those breakers
have been standing idle for months or years in normal service [Desai2012].
4.3.4 Monitoring in Controlled Switching Devices
During the operation shown in Figure 4-18, the CSD controlled the opening operation but the
programmed arcing time was close to the minimum arcing time window of the circuit breaker, leading to re-ignition in phases A and C. The application was reactor switching (neutral grounded) with a self-
blast SF6 circuit breaker.
It is evident that current zeros sequence are no more equally shifted by 60°.
Figure 4-18: Example of re-ignition detected by CSD (red and blue phase) during reactor opening. Contact separation instants marked with dotted lines
Figure 4-19 represents an example of a power transformer switching ON operation (no load), during
spread sequence. First phase to close (B, green) was perfectly closed at voltage peak, without any
inrush (transformer demagnetized). Subsequent phases closed too early, leading to moderate inrush.
Figure 4-19: Example of record in CSD (power transformer closing: load voltages & currents). Red and blue phase too early by ~1.5ms due to setting error. Two dead periods between first (green)
phase and remaining ones.
Figure 4-20 represents an example of a power transformer switching ON operation (no load), during
narrow sequence. Because of residual flux presence in the transformer core and making times not being accurate, high inrush was observed, leading to a high level of harmonics in the system voltage.
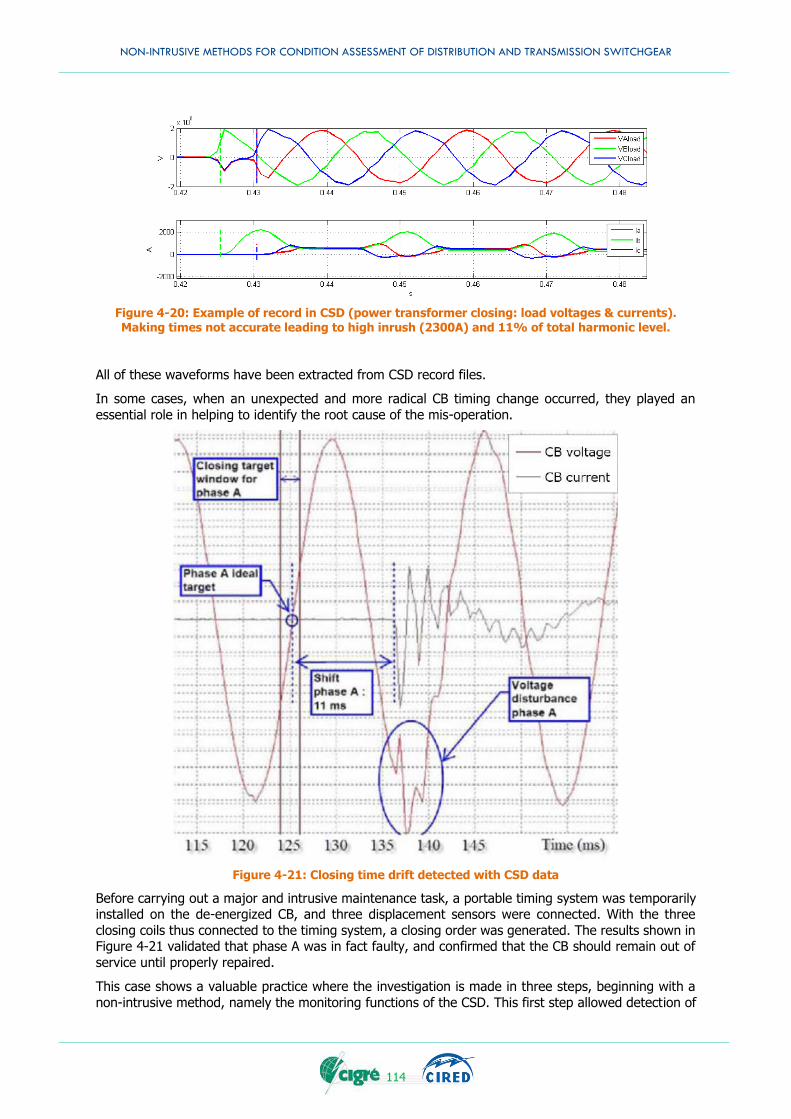
NON-INTRUSIVE METHODS FOR CONDITION ASSESSMENT OF DISTRIBUTION AND TRANSMISSION SWITCHGEAR
114
Figure 4-20: Example of record in CSD (power transformer closing: load voltages & currents).
Making times not accurate leading to high inrush (2300A) and 11% of total harmonic level.
All of these waveforms have been extracted from CSD record files.
In some cases, when an unexpected and more radical CB timing change occurred, they played an
essential role in helping to identify the root cause of the mis-operation.
Figure 4-21: Closing time drift detected with CSD data
Before carrying out a major and intrusive maintenance task, a portable timing system was temporarily installed on the de-energized CB, and three displacement sensors were connected. With the three
closing coils thus connected to the timing system, a closing order was generated. The results shown in Figure 4-21 validated that phase A was in fact faulty, and confirmed that the CB should remain out of
service until properly repaired.
This case shows a valuable practice where the investigation is made in three steps, beginning with a
non-intrusive method, namely the monitoring functions of the CSD. This first step allowed detection of
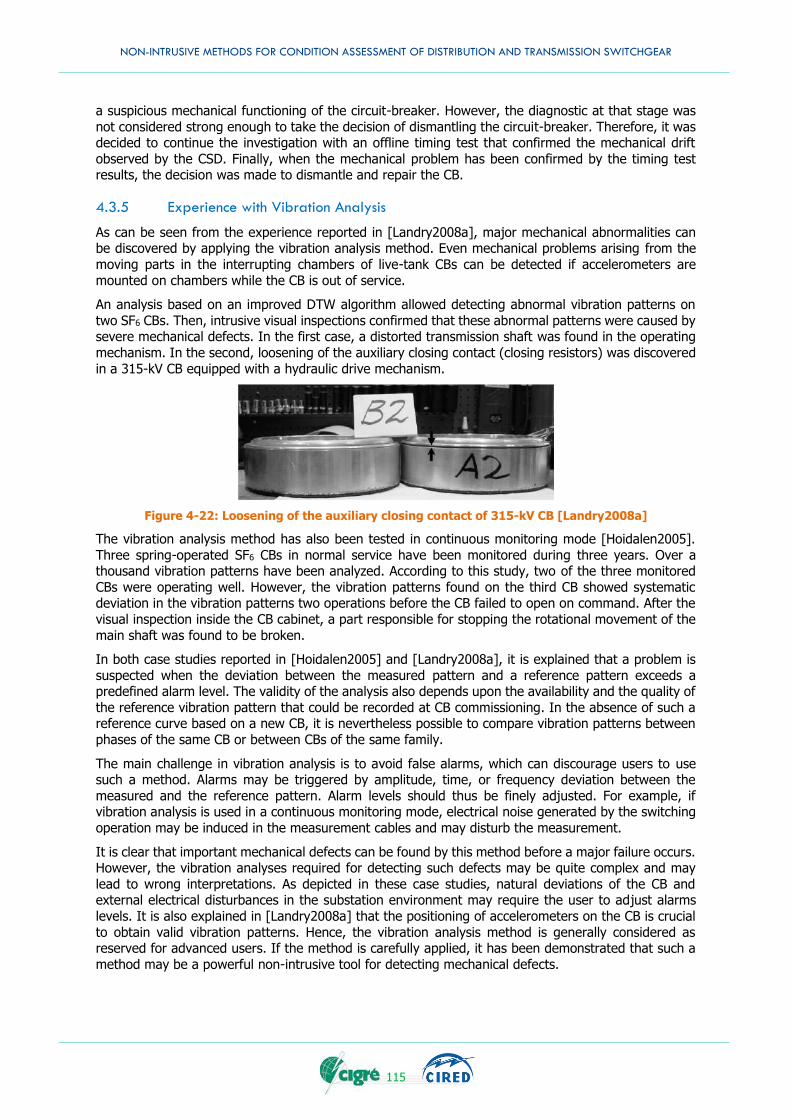
NON-INTRUSIVE METHODS FOR CONDITION ASSESSMENT OF DISTRIBUTION AND TRANSMISSION SWITCHGEAR
115
a suspicious mechanical functioning of the circuit-breaker. However, the diagnostic at that stage was
not considered strong enough to take the decision of dismantling the circuit-breaker. Therefore, it was decided to continue the investigation with an offline timing test that confirmed the mechanical drift
observed by the CSD. Finally, when the mechanical problem has been confirmed by the timing test results, the decision was made to dismantle and repair the CB.
4.3.5 Experience with Vibration Analysis
As can be seen from the experience reported in [Landry2008a], major mechanical abnormalities can be discovered by applying the vibration analysis method. Even mechanical problems arising from the
moving parts in the interrupting chambers of live-tank CBs can be detected if accelerometers are
mounted on chambers while the CB is out of service.
An analysis based on an improved DTW algorithm allowed detecting abnormal vibration patterns on
two SF6 CBs. Then, intrusive visual inspections confirmed that these abnormal patterns were caused by severe mechanical defects. In the first case, a distorted transmission shaft was found in the operating
mechanism. In the second, loosening of the auxiliary closing contact (closing resistors) was discovered
in a 315-kV CB equipped with a hydraulic drive mechanism.
Figure 4-22: Loosening of the auxiliary closing contact of 315-kV CB [Landry2008a]
The vibration analysis method has also been tested in continuous monitoring mode [Hoidalen2005].
Three spring-operated SF6 CBs in normal service have been monitored during three years. Over a thousand vibration patterns have been analyzed. According to this study, two of the three monitored
CBs were operating well. However, the vibration patterns found on the third CB showed systematic deviation in the vibration patterns two operations before the CB failed to open on command. After the
visual inspection inside the CB cabinet, a part responsible for stopping the rotational movement of the
main shaft was found to be broken.
In both case studies reported in [Hoidalen2005] and [Landry2008a], it is explained that a problem is
suspected when the deviation between the measured pattern and a reference pattern exceeds a predefined alarm level. The validity of the analysis also depends upon the availability and the quality of
the reference vibration pattern that could be recorded at CB commissioning. In the absence of such a reference curve based on a new CB, it is nevertheless possible to compare vibration patterns between
phases of the same CB or between CBs of the same family.
The main challenge in vibration analysis is to avoid false alarms, which can discourage users to use such a method. Alarms may be triggered by amplitude, time, or frequency deviation between the
measured and the reference pattern. Alarm levels should thus be finely adjusted. For example, if vibration analysis is used in a continuous monitoring mode, electrical noise generated by the switching
operation may be induced in the measurement cables and may disturb the measurement.
It is clear that important mechanical defects can be found by this method before a major failure occurs. However, the vibration analyses required for detecting such defects may be quite complex and may
lead to wrong interpretations. As depicted in these case studies, natural deviations of the CB and external electrical disturbances in the substation environment may require the user to adjust alarms
levels. It is also explained in [Landry2008a] that the positioning of accelerometers on the CB is crucial
to obtain valid vibration patterns. Hence, the vibration analysis method is generally considered as reserved for advanced users. If the method is carefully applied, it has been demonstrated that such a
method may be a powerful non-intrusive tool for detecting mechanical defects.
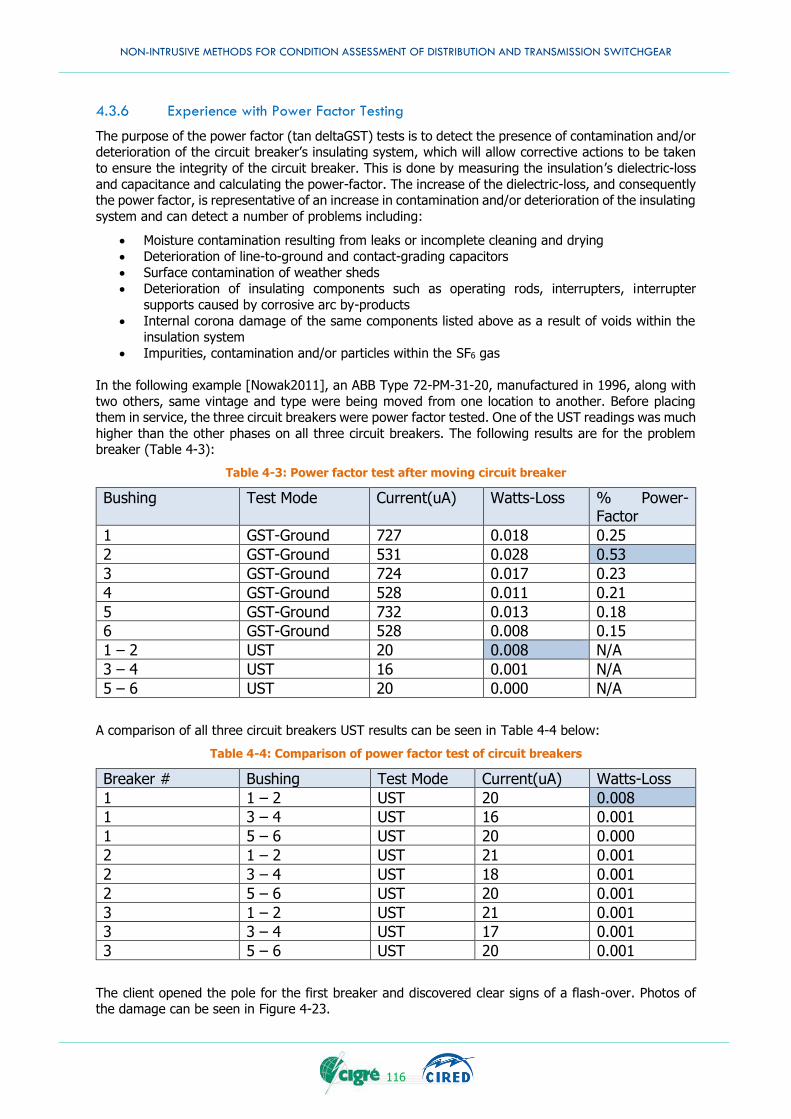
NON-INTRUSIVE METHODS FOR CONDITION ASSESSMENT OF DISTRIBUTION AND TRANSMISSION SWITCHGEAR
116
4.3.6 Experience with Power Factor Testing
The purpose of the power factor (tan deltaGST) tests is to detect the presence of contamination and/or deterioration of the circuit breaker’s insulating system, which will allow corrective actions to be taken
to ensure the integrity of the circuit breaker. This is done by measuring the insulation’s dielectric-loss
and capacitance and calculating the power-factor. The increase of the dielectric-loss, and consequently the power factor, is representative of an increase in contamination and/or deterioration of the insulating
system and can detect a number of problems including:
Moisture contamination resulting from leaks or incomplete cleaning and drying
Deterioration of line-to-ground and contact-grading capacitors
Surface contamination of weather sheds
Deterioration of insulating components such as operating rods, interrupters, interrupter
supports caused by corrosive arc by-products
Internal corona damage of the same components listed above as a result of voids within the
insulation system
Impurities, contamination and/or particles within the SF6 gas
In the following example [Nowak2011], an ABB Type 72-PM-31-20, manufactured in 1996, along with
two others, same vintage and type were being moved from one location to another. Before placing them in service, the three circuit breakers were power factor tested. One of the UST readings was much
higher than the other phases on all three circuit breakers. The following results are for the problem breaker (Table 4-3):
Table 4-3: Power factor test after moving circuit breaker
Bushing Test Mode Current(uA) Watts-Loss % Power-Factor
1 GST-Ground 727 0.018 0.25
2 GST-Ground 531 0.028 0.53
3 GST-Ground 724 0.017 0.23
4 GST-Ground 528 0.011 0.21
5 GST-Ground 732 0.013 0.18
6 GST-Ground 528 0.008 0.15
1 – 2 UST 20 0.008 N/A
3 – 4 UST 16 0.001 N/A
5 – 6 UST 20 0.000 N/A
A comparison of all three circuit breakers UST results can be seen in Table 4-4 below:
Table 4-4: Comparison of power factor test of circuit breakers
Breaker # Bushing Test Mode Current(uA) Watts-Loss
1 1 – 2 UST 20 0.008
1 3 – 4 UST 16 0.001
1 5 – 6 UST 20 0.000
2 1 – 2 UST 21 0.001
2 3 – 4 UST 18 0.001
2 5 – 6 UST 20 0.001
3 1 – 2 UST 21 0.001
3 3 – 4 UST 17 0.001
3 5 – 6 UST 20 0.001
The client opened the pole for the first breaker and discovered clear signs of a flash-over. Photos of the damage can be seen in Figure 4-23.
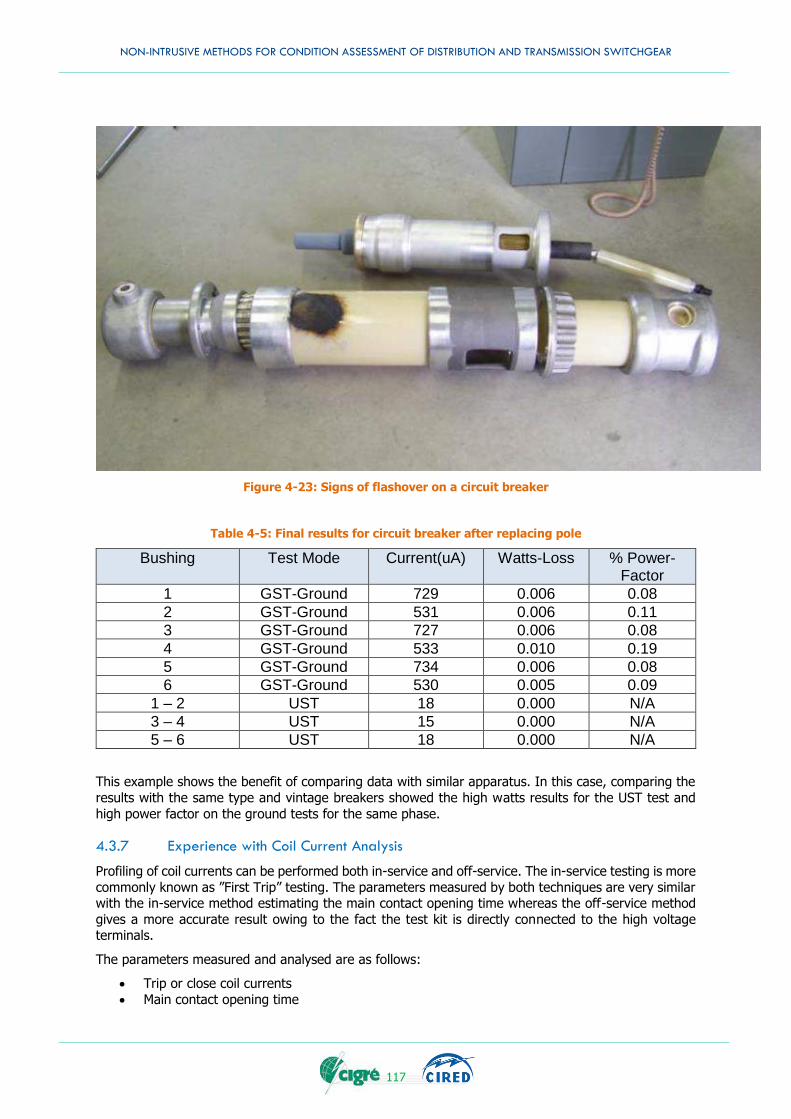
NON-INTRUSIVE METHODS FOR CONDITION ASSESSMENT OF DISTRIBUTION AND TRANSMISSION SWITCHGEAR
117
Figure 4-23: Signs of flashover on a circuit breaker
Table 4-5: Final results for circuit breaker after replacing pole
Bushing Test Mode Current(uA) Watts-Loss % Power-Factor
1 GST-Ground 729 0.006 0.08
2 GST-Ground 531 0.006 0.11
3 GST-Ground 727 0.006 0.08
4 GST-Ground 533 0.010 0.19
5 GST-Ground 734 0.006 0.08
6 GST-Ground 530 0.005 0.09
1 – 2 UST 18 0.000 N/A
3 – 4 UST 15 0.000 N/A
5 – 6 UST 18 0.000 N/A
This example shows the benefit of comparing data with similar apparatus. In this case, comparing the
results with the same type and vintage breakers showed the high watts results for the UST test and
high power factor on the ground tests for the same phase.
4.3.7 Experience with Coil Current Analysis
Profiling of coil currents can be performed both in-service and off-service. The in-service testing is more
commonly known as ”First Trip” testing. The parameters measured by both techniques are very similar with the in-service method estimating the main contact opening time whereas the off-service method
gives a more accurate result owing to the fact the test kit is directly connected to the high voltage terminals.
The parameters measured and analysed are as follows:
Trip or close coil currents
Main contact opening time
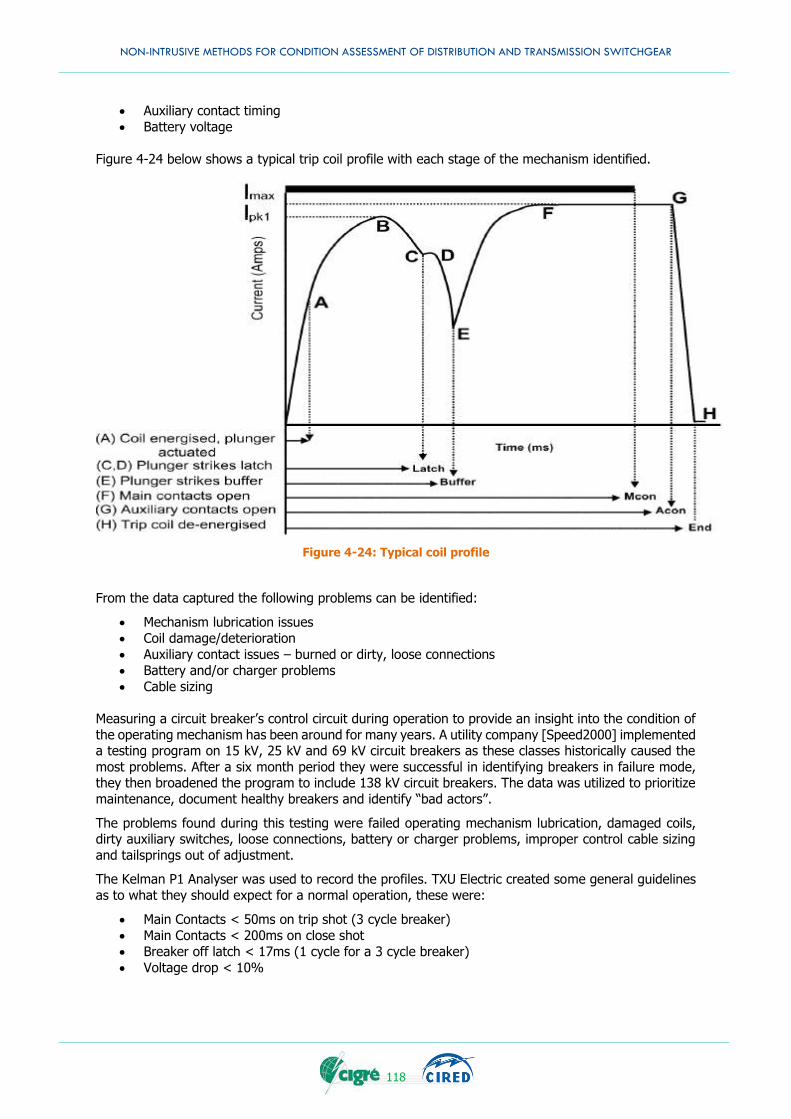
NON-INTRUSIVE METHODS FOR CONDITION ASSESSMENT OF DISTRIBUTION AND TRANSMISSION SWITCHGEAR
118
Auxiliary contact timing
Battery voltage
Figure 4-24 below shows a typical trip coil profile with each stage of the mechanism identified.
Figure 4-24: Typical coil profile
From the data captured the following problems can be identified:
Mechanism lubrication issues
Coil damage/deterioration
Auxiliary contact issues – burned or dirty, loose connections
Battery and/or charger problems
Cable sizing
Measuring a circuit breaker’s control circuit during operation to provide an insight into the condition of
the operating mechanism has been around for many years. A utility company [Speed2000] implemented a testing program on 15 kV, 25 kV and 69 kV circuit breakers as these classes historically caused the
most problems. After a six month period they were successful in identifying breakers in failure mode, they then broadened the program to include 138 kV circuit breakers. The data was utilized to prioritize
maintenance, document healthy breakers and identify “bad actors”.
The problems found during this testing were failed operating mechanism lubrication, damaged coils, dirty auxiliary switches, loose connections, battery or charger problems, improper control cable sizing
and tailsprings out of adjustment.
The Kelman P1 Analyser was used to record the profiles. TXU Electric created some general guidelines
as to what they should expect for a normal operation, these were:
Main Contacts < 50ms on trip shot (3 cycle breaker)
Main Contacts < 200ms on close shot
Breaker off latch < 17ms (1 cycle for a 3 cycle breaker)
Voltage drop < 10%
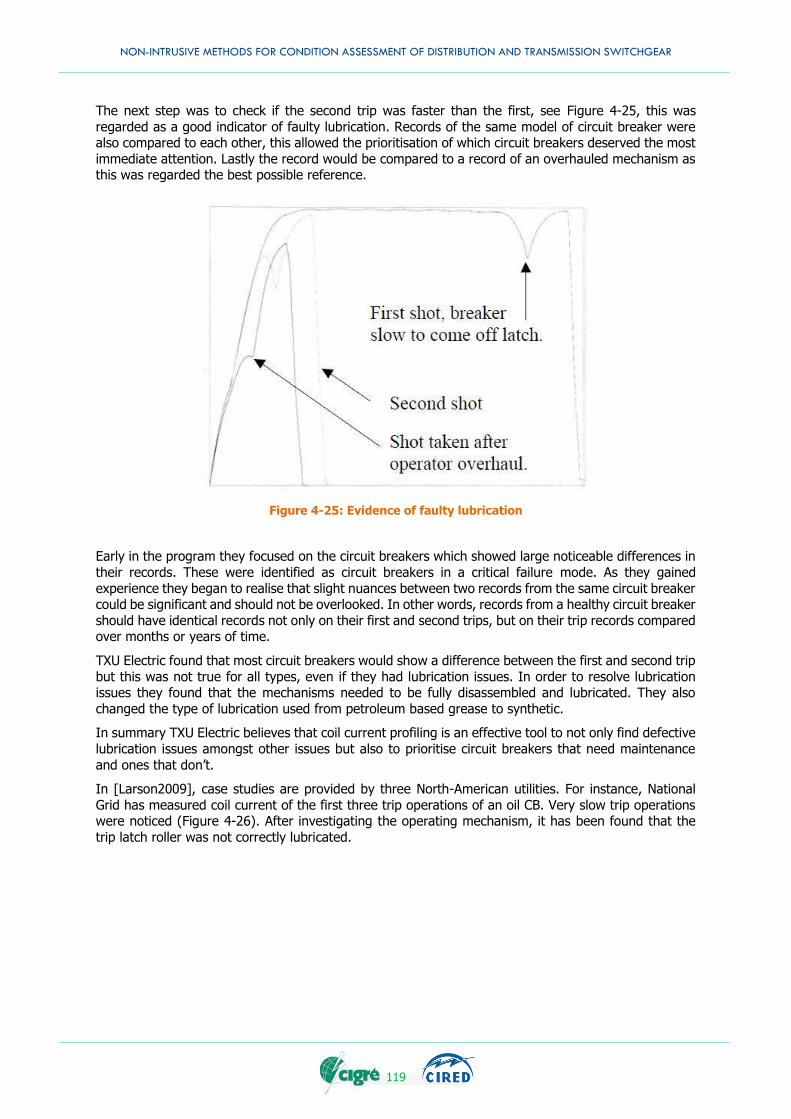
NON-INTRUSIVE METHODS FOR CONDITION ASSESSMENT OF DISTRIBUTION AND TRANSMISSION SWITCHGEAR
119
The next step was to check if the second trip was faster than the first, see Figure 4-25, this was
regarded as a good indicator of faulty lubrication. Records of the same model of circuit breaker were also compared to each other, this allowed the prioritisation of which circuit breakers deserved the most
immediate attention. Lastly the record would be compared to a record of an overhauled mechanism as this was regarded the best possible reference.
Figure 4-25: Evidence of faulty lubrication
Early in the program they focused on the circuit breakers which showed large noticeable differences in
their records. These were identified as circuit breakers in a critical failure mode. As they gained
experience they began to realise that slight nuances between two records from the same circuit breaker could be significant and should not be overlooked. In other words, records from a healthy circuit breaker
should have identical records not only on their first and second trips, but on their trip records compared over months or years of time.
TXU Electric found that most circuit breakers would show a difference between the first and second trip
but this was not true for all types, even if they had lubrication issues. In order to resolve lubrication issues they found that the mechanisms needed to be fully disassembled and lubricated. They also
changed the type of lubrication used from petroleum based grease to synthetic.
In summary TXU Electric believes that coil current profiling is an effective tool to not only find defective
lubrication issues amongst other issues but also to prioritise circuit breakers that need maintenance
and ones that don’t.
In [Larson2009], case studies are provided by three North-American utilities. For instance, National
Grid has measured coil current of the first three trip operations of an oil CB. Very slow trip operations were noticed (Figure 4-26). After investigating the operating mechanism, it has been found that the
trip latch roller was not correctly lubricated.
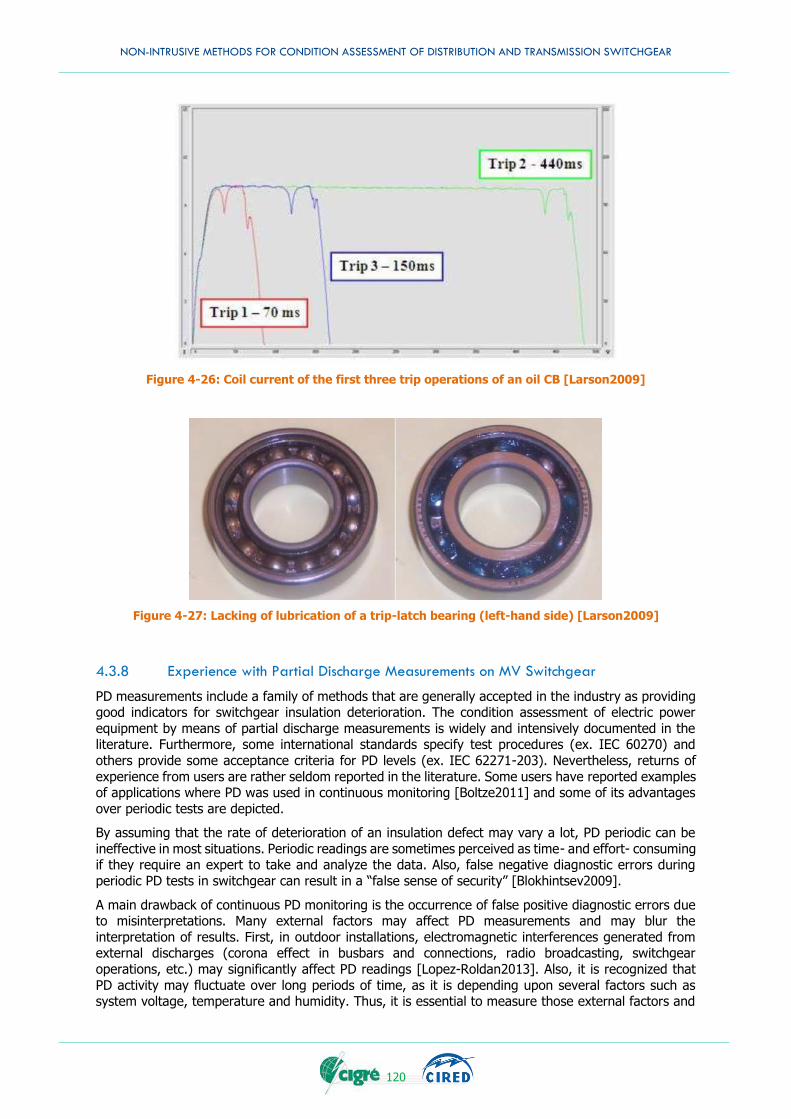
NON-INTRUSIVE METHODS FOR CONDITION ASSESSMENT OF DISTRIBUTION AND TRANSMISSION SWITCHGEAR
120
Figure 4-26: Coil current of the first three trip operations of an oil CB [Larson2009]
Figure 4-27: Lacking of lubrication of a trip-latch bearing (left-hand side) [Larson2009]
4.3.8 Experience with Partial Discharge Measurements on MV Switchgear
PD measurements include a family of methods that are generally accepted in the industry as providing good indicators for switchgear insulation deterioration. The condition assessment of electric power
equipment by means of partial discharge measurements is widely and intensively documented in the literature. Furthermore, some international standards specify test procedures (ex. IEC 60270) and
others provide some acceptance criteria for PD levels (ex. IEC 62271-203). Nevertheless, returns of
experience from users are rather seldom reported in the literature. Some users have reported examples of applications where PD was used in continuous monitoring [Boltze2011] and some of its advantages
over periodic tests are depicted.
By assuming that the rate of deterioration of an insulation defect may vary a lot, PD periodic can be
ineffective in most situations. Periodic readings are sometimes perceived as time- and effort- consuming if they require an expert to take and analyze the data. Also, false negative diagnostic errors during
periodic PD tests in switchgear can result in a “false sense of security” [Blokhintsev2009].
A main drawback of continuous PD monitoring is the occurrence of false positive diagnostic errors due to misinterpretations. Many external factors may affect PD measurements and may blur the
interpretation of results. First, in outdoor installations, electromagnetic interferences generated from external discharges (corona effect in busbars and connections, radio broadcasting, switchgear
operations, etc.) may significantly affect PD readings [Lopez-Roldan2013]. Also, it is recognized that
PD activity may fluctuate over long periods of time, as it is depending upon several factors such as system voltage, temperature and humidity. Thus, it is essential to measure those external factors and
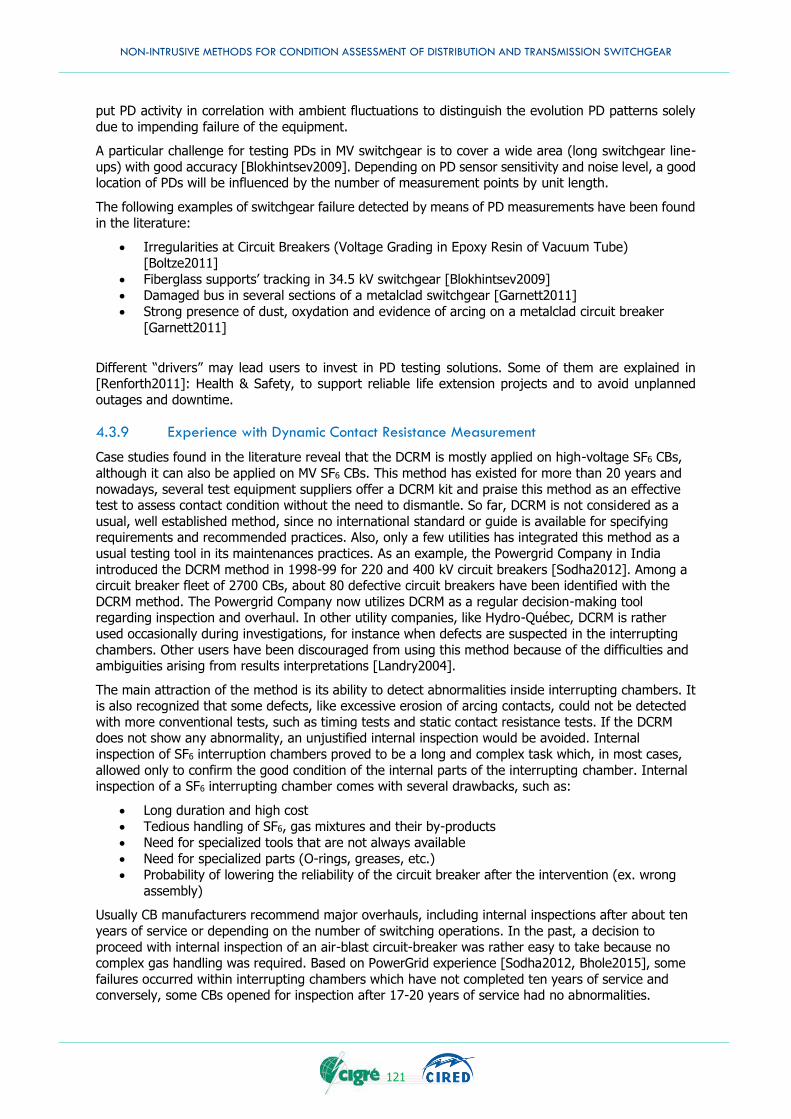
NON-INTRUSIVE METHODS FOR CONDITION ASSESSMENT OF DISTRIBUTION AND TRANSMISSION SWITCHGEAR
121
put PD activity in correlation with ambient fluctuations to distinguish the evolution PD patterns solely
due to impending failure of the equipment.
A particular challenge for testing PDs in MV switchgear is to cover a wide area (long switchgear line-
ups) with good accuracy [Blokhintsev2009]. Depending on PD sensor sensitivity and noise level, a good location of PDs will be influenced by the number of measurement points by unit length.
The following examples of switchgear failure detected by means of PD measurements have been found
in the literature:
Irregularities at Circuit Breakers (Voltage Grading in Epoxy Resin of Vacuum Tube)
[Boltze2011]
Fiberglass supports’ tracking in 34.5 kV switchgear [Blokhintsev2009]
Damaged bus in several sections of a metalclad switchgear [Garnett2011]
Strong presence of dust, oxydation and evidence of arcing on a metalclad circuit breaker
[Garnett2011]
Different “drivers” may lead users to invest in PD testing solutions. Some of them are explained in [Renforth2011]: Health & Safety, to support reliable life extension projects and to avoid unplanned
outages and downtime.
4.3.9 Experience with Dynamic Contact Resistance Measurement
Case studies found in the literature reveal that the DCRM is mostly applied on high-voltage SF6 CBs,
although it can also be applied on MV SF6 CBs. This method has existed for more than 20 years and
nowadays, several test equipment suppliers offer a DCRM kit and praise this method as an effective test to assess contact condition without the need to dismantle. So far, DCRM is not considered as a
usual, well established method, since no international standard or guide is available for specifying requirements and recommended practices. Also, only a few utilities has integrated this method as a
usual testing tool in its maintenances practices. As an example, the Powergrid Company in India
introduced the DCRM method in 1998-99 for 220 and 400 kV circuit breakers [Sodha2012]. Among a circuit breaker fleet of 2700 CBs, about 80 defective circuit breakers have been identified with the
DCRM method. The Powergrid Company now utilizes DCRM as a regular decision-making tool regarding inspection and overhaul. In other utility companies, like Hydro-Québec, DCRM is rather
used occasionally during investigations, for instance when defects are suspected in the interrupting
chambers. Other users have been discouraged from using this method because of the difficulties and ambiguities arising from results interpretations [Landry2004].
The main attraction of the method is its ability to detect abnormalities inside interrupting chambers. It is also recognized that some defects, like excessive erosion of arcing contacts, could not be detected
with more conventional tests, such as timing tests and static contact resistance tests. If the DCRM does not show any abnormality, an unjustified internal inspection would be avoided. Internal
inspection of SF6 interruption chambers proved to be a long and complex task which, in most cases,
allowed only to confirm the good condition of the internal parts of the interrupting chamber. Internal inspection of a SF6 interrupting chamber comes with several drawbacks, such as:
Long duration and high cost
Tedious handling of SF6, gas mixtures and their by-products
Need for specialized tools that are not always available
Need for specialized parts (O-rings, greases, etc.)
Probability of lowering the reliability of the circuit breaker after the intervention (ex. wrong
assembly)
Usually CB manufacturers recommend major overhauls, including internal inspections after about ten
years of service or depending on the number of switching operations. In the past, a decision to
proceed with internal inspection of an air-blast circuit-breaker was rather easy to take because no complex gas handling was required. Based on PowerGrid experience [Sodha2012, Bhole2015], some
failures occurred within interrupting chambers which have not completed ten years of service and conversely, some CBs opened for inspection after 17-20 years of service had no abnormalities.
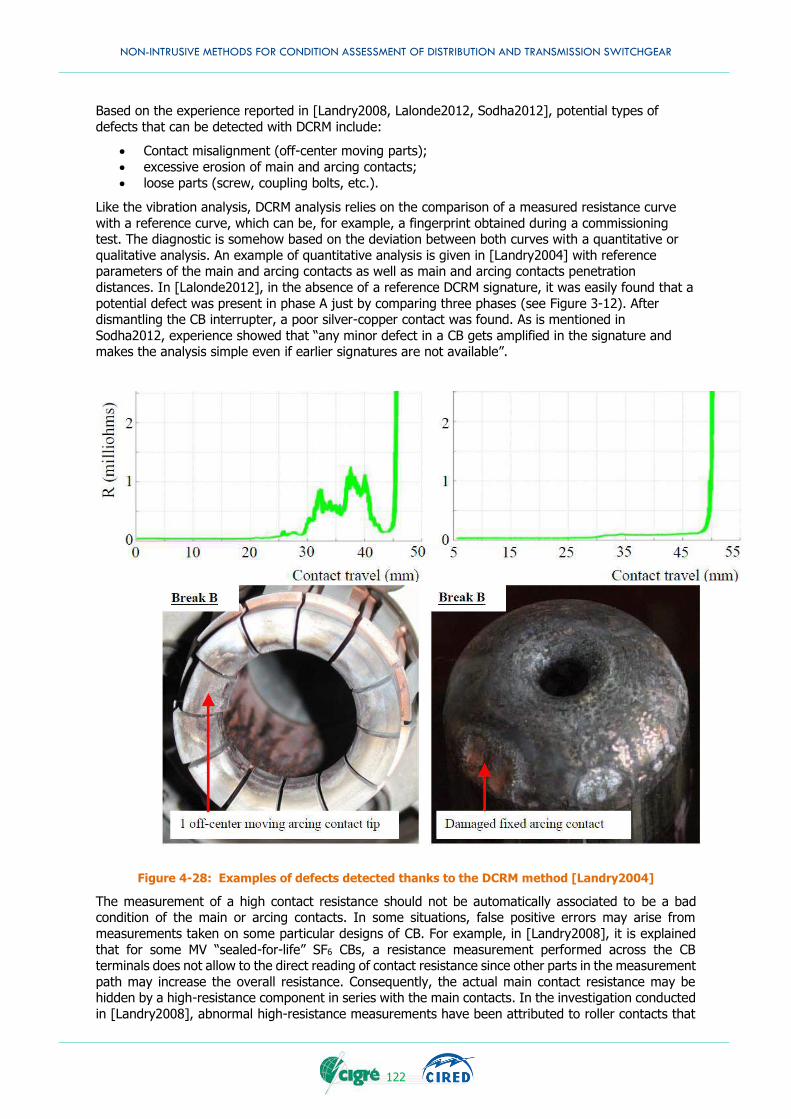
NON-INTRUSIVE METHODS FOR CONDITION ASSESSMENT OF DISTRIBUTION AND TRANSMISSION SWITCHGEAR
122
Based on the experience reported in [Landry2008, Lalonde2012, Sodha2012], potential types of
defects that can be detected with DCRM include:
Contact misalignment (off-center moving parts);
excessive erosion of main and arcing contacts;
loose parts (screw, coupling bolts, etc.).
Like the vibration analysis, DCRM analysis relies on the comparison of a measured resistance curve
with a reference curve, which can be, for example, a fingerprint obtained during a commissioning test. The diagnostic is somehow based on the deviation between both curves with a quantitative or
qualitative analysis. An example of quantitative analysis is given in [Landry2004] with reference parameters of the main and arcing contacts as well as main and arcing contacts penetration
distances. In [Lalonde2012], in the absence of a reference DCRM signature, it was easily found that a
potential defect was present in phase A just by comparing three phases (see Figure 3-12). After dismantling the CB interrupter, a poor silver-copper contact was found. As is mentioned in
Sodha2012, experience showed that “any minor defect in a CB gets amplified in the signature and makes the analysis simple even if earlier signatures are not available”.
Figure 4-28: Examples of defects detected thanks to the DCRM method [Landry2004]
The measurement of a high contact resistance should not be automatically associated to be a bad condition of the main or arcing contacts. In some situations, false positive errors may arise from
measurements taken on some particular designs of CB. For example, in [Landry2008], it is explained
that for some MV “sealed-for-life” SF6 CBs, a resistance measurement performed across the CB terminals does not allow to the direct reading of contact resistance since other parts in the measurement
path may increase the overall resistance. Consequently, the actual main contact resistance may be hidden by a high-resistance component in series with the main contacts. In the investigation conducted
in [Landry2008], abnormal high-resistance measurements have been attributed to roller contacts that
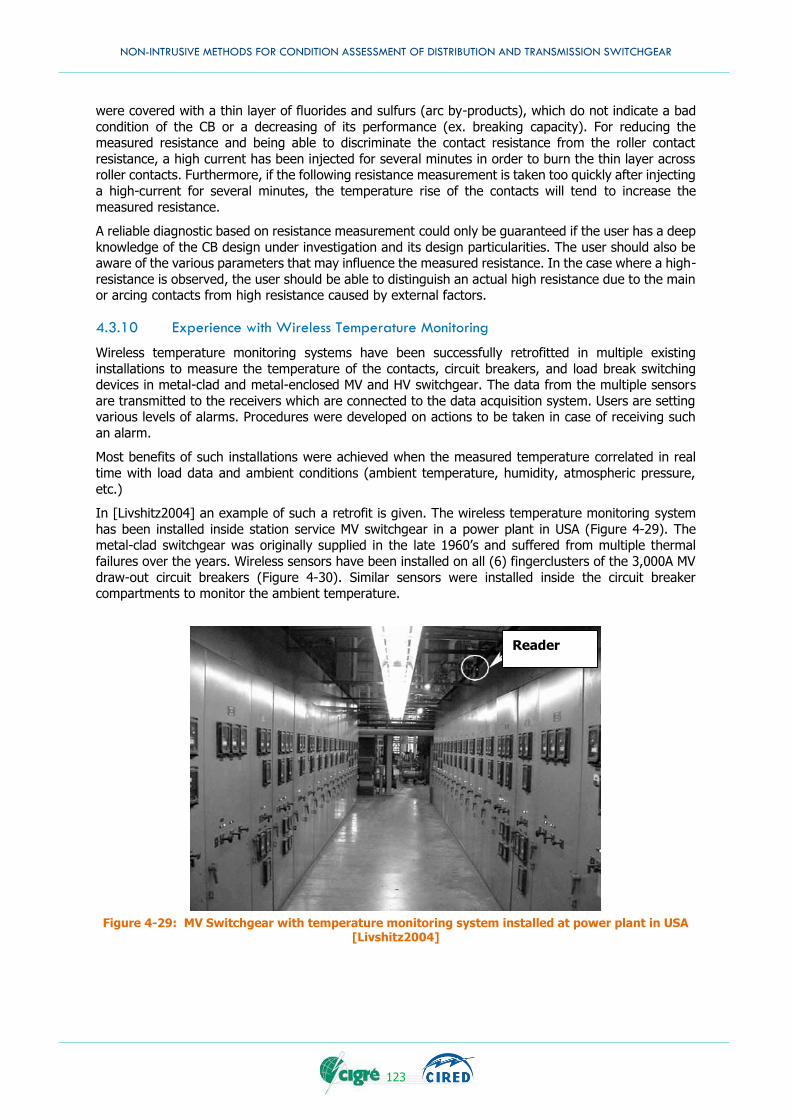
NON-INTRUSIVE METHODS FOR CONDITION ASSESSMENT OF DISTRIBUTION AND TRANSMISSION SWITCHGEAR
123
Reader
Figure 4-29: MV Switchgear with temperature monitoring system installed at power plant in USA [Livshitz2004]
were covered with a thin layer of fluorides and sulfurs (arc by-products), which do not indicate a bad
condition of the CB or a decreasing of its performance (ex. breaking capacity). For reducing the measured resistance and being able to discriminate the contact resistance from the roller contact
resistance, a high current has been injected for several minutes in order to burn the thin layer across roller contacts. Furthermore, if the following resistance measurement is taken too quickly after injecting
a high-current for several minutes, the temperature rise of the contacts will tend to increase the
measured resistance.
A reliable diagnostic based on resistance measurement could only be guaranteed if the user has a deep
knowledge of the CB design under investigation and its design particularities. The user should also be aware of the various parameters that may influence the measured resistance. In the case where a high-
resistance is observed, the user should be able to distinguish an actual high resistance due to the main or arcing contacts from high resistance caused by external factors.
4.3.10 Experience with Wireless Temperature Monitoring
Wireless temperature monitoring systems have been successfully retrofitted in multiple existing
installations to measure the temperature of the contacts, circuit breakers, and load break switching devices in metal-clad and metal-enclosed MV and HV switchgear. The data from the multiple sensors
are transmitted to the receivers which are connected to the data acquisition system. Users are setting various levels of alarms. Procedures were developed on actions to be taken in case of receiving such
an alarm.
Most benefits of such installations were achieved when the measured temperature correlated in real
time with load data and ambient conditions (ambient temperature, humidity, atmospheric pressure,
etc.)
In [Livshitz2004] an example of such a retrofit is given. The wireless temperature monitoring system
has been installed inside station service MV switchgear in a power plant in USA (Figure 4-29). The metal-clad switchgear was originally supplied in the late 1960’s and suffered from multiple thermal
failures over the years. Wireless sensors have been installed on all (6) fingerclusters of the 3,000A MV
draw-out circuit breakers (Figure 4-30). Similar sensors were installed inside the circuit breaker compartments to monitor the ambient temperature.
NON-INTRUSIVE METHODS FOR CONDITION ASSESSMENT OF DISTRIBUTION AND TRANSMISSION SWITCHGEAR
124
Figure 4-30: Wireless temperature sensors installed on fingerclusters [Livshitz2004]
Sensors
After only a month of monitoring it was uncovered that the absolute temperature of the fingerclusters
on multiple occasions would reach up to 100° C while the load current was about two-thirds of the rated continuous current for these circuit breakers. It was also noted that the ambient temperature
inside the breaker compartments would reach 60° C.
The doors of the breaker compartments were modified and forced cooling was installed. After these modifications all temperatures of the circuit breaker fingerclusters and ambient temperatures inside the
breaker compartments dropped by 10° C on average. This helped to avert another thermal failure of the circuit breakers. Such failures would be typically associated with prolonged and costly switchgear
repairs and service interruption.
4.4 SUMMARY
The actual utilization of non-intrusive diagnostics has been depicted by two means: an international
survey conducted by the JWG and a selection of recent case studies found in the literature. As can be seen from the case studies reported in this chapter, non-intrusive diagnostics are often based on indirect
measurement of some physical phenomena (ex. radiated UHF signal generated from a partial discharge). Therefore, a lot of effort is required to process and analyzethe measured data. On the
other hand, these non-intrusive diagnostic methods are very attractive from the user point-of-view due
to their relative simplicity to use and their moderate impact on grid operations. Many examples in this chapter showed how such non-intrusive diagnostics have been successfully applied to various types of
switchgear. It allowed, in some cases, to avoid major failures by detecting on time a malfunction or the beginning of degradation and to schedule a maintenance based on the actual condition of the
switchgear.
NON-INTRUSIVE METHODS FOR CONDITION ASSESSMENT OF DISTRIBUTION AND TRANSMISSION SWITCHGEAR
125
5. TECHNICAL AND ECONOMIC EVALUATION OF NON-INTRUSIVE CONDITION ASSESSMENT METHODS
5.1 INTRODUCTION
One of the most important elements in a power transmission and distribution grid is the circuit breaker.
Under normal operating conditions in the closed state, it acts as a perfect conductor carrying the
nominal current with minimal losses. In the open position, it acts as a perfect insulator withstanding the nominal network voltage as well as transient overvoltages between its terminals. In the case of a
short circuit event, the circuit breaker shall interrupt without producing unacceptable overvoltages or reduce the device’s operational integrity.
In order to take informed decisions regarding the residual life of the circuit breaker and its maintenance strategy, proper condition assessment methods are necessary. Excluding defects caused by
inappropriate design, assembly, production, erection, and operation; the benefit of assessment
methods discussed here refer only to the ageing and wear characteristics of the circuit breaker in service and its resulting reduction in performance and reliability. These also fall under the classification of non-
intrusive condition assessment methods (NICAM), which are methods that require only non-intrusive intervention to the switchgear preserving its integrity and allowing its return to the grid without any
further verification. Intrusive methods are not considered in this document.
Granted technical maturity, the technical and economic benefits of non-intrusive condition assessment methods must be weighted taking into account its implementation costs, installation, maintenance,
operation and data utilization versus the costs generated by the possible failures the equipment might encounter between maintenance periods. While, the implementation costs, can be easily taken as fixed
costs and, hence, generalised over the equipment population, the failure resolution costs, on the other
hand, involve a more detailed evaluation and assertion of risk. The probability of occurrence of any given failure event and the impact this may have on the surrounding equipment in the substation and
ultimately to the network has a more individual characteristic that needs to be taken into account on a case by case basis.
This chapter presents the state of the art methodologies to assess the technical and economic benefits of non-intrusive condition assessment methods. It starts with a collection from the literature of the
different failure modes and condition indicators as described in Chapter 3 along the switchgear lifetime.
The proper identification of each of the failure modes of the switchgear under evaluation is key to the selection of the condition assessment method. Next, a compendium of the different analysis techniques
to evaluate the economic benefits over the technical ones for a given situation is presented. Each of the assessment stages is presented with an example to illustrate the different aspects of a non-intrusive
condition assessment method selection and evaluation.
5.2 FAILURE MODES
The importance of understanding the failure characteristics, mechanisms or modes that the network switchgear may encounter during its operational life is linked to the application of condition assessment
methods and their associated economic benefits.
The term failure, means the unsuccessful performance of function regardless of cause, component, or
device involved. Failure to perform the intended function does not imply that the particular component failed, but that the component or system function was not satisfied. The evolution of how a failure
develops over time is known as the failure pattern. Failures can occur very suddenly or over a long
period of time and may vary in nature with the types of devices and the physics and chemistry of the failure mechanism.
In [IEEE2000], eleven failure characteristics are described. The failure pattern is to be considered when a condition assessment method is selected as its benefits might differ during different periods of
expected failure probability. The understanding of the possible failure characteristics determines
whenever the use of a specific monitoring method would be beneficial, for example in the case of a
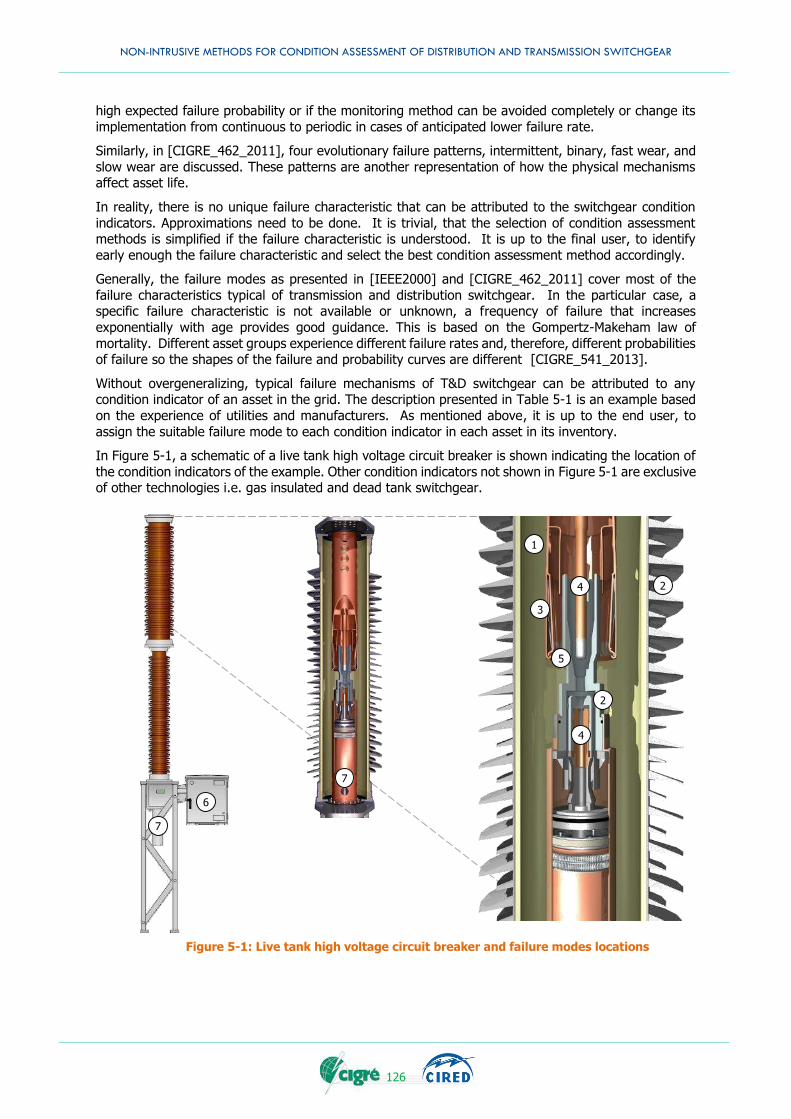
NON-INTRUSIVE METHODS FOR CONDITION ASSESSMENT OF DISTRIBUTION AND TRANSMISSION SWITCHGEAR
126
high expected failure probability or if the monitoring method can be avoided completely or change its
implementation from continuous to periodic in cases of anticipated lower failure rate.
Similarly, in [CIGRE_462_2011], four evolutionary failure patterns, intermittent, binary, fast wear, and
slow wear are discussed. These patterns are another representation of how the physical mechanisms affect asset life.
In reality, there is no unique failure characteristic that can be attributed to the switchgear condition
indicators. Approximations need to be done. It is trivial, that the selection of condition assessment methods is simplified if the failure characteristic is understood. It is up to the final user, to identify
early enough the failure characteristic and select the best condition assessment method accordingly.
Generally, the failure modes as presented in [IEEE2000] and [CIGRE_462_2011] cover most of the
failure characteristics typical of transmission and distribution switchgear. In the particular case, a specific failure characteristic is not available or unknown, a frequency of failure that increases
exponentially with age provides good guidance. This is based on the Gompertz-Makeham law of
mortality. Different asset groups experience different failure rates and, therefore, different probabilities of failure so the shapes of the failure and probability curves are different [CIGRE_541_2013].
Without overgeneralizing, typical failure mechanisms of T&D switchgear can be attributed to any condition indicator of an asset in the grid. The description presented in Table 5-1 is an example based
on the experience of utilities and manufacturers. As mentioned above, it is up to the end user, to
assign the suitable failure mode to each condition indicator in each asset in its inventory.
In Figure 5-1, a schematic of a live tank high voltage circuit breaker is shown indicating the location of
the condition indicators of the example. Other condition indicators not shown in Figure 5-1 are exclusive of other technologies i.e. gas insulated and dead tank switchgear.
1
2
2
3
4
4
5
6
7
7
Figure 5-1: Live tank high voltage circuit breaker and failure modes locations
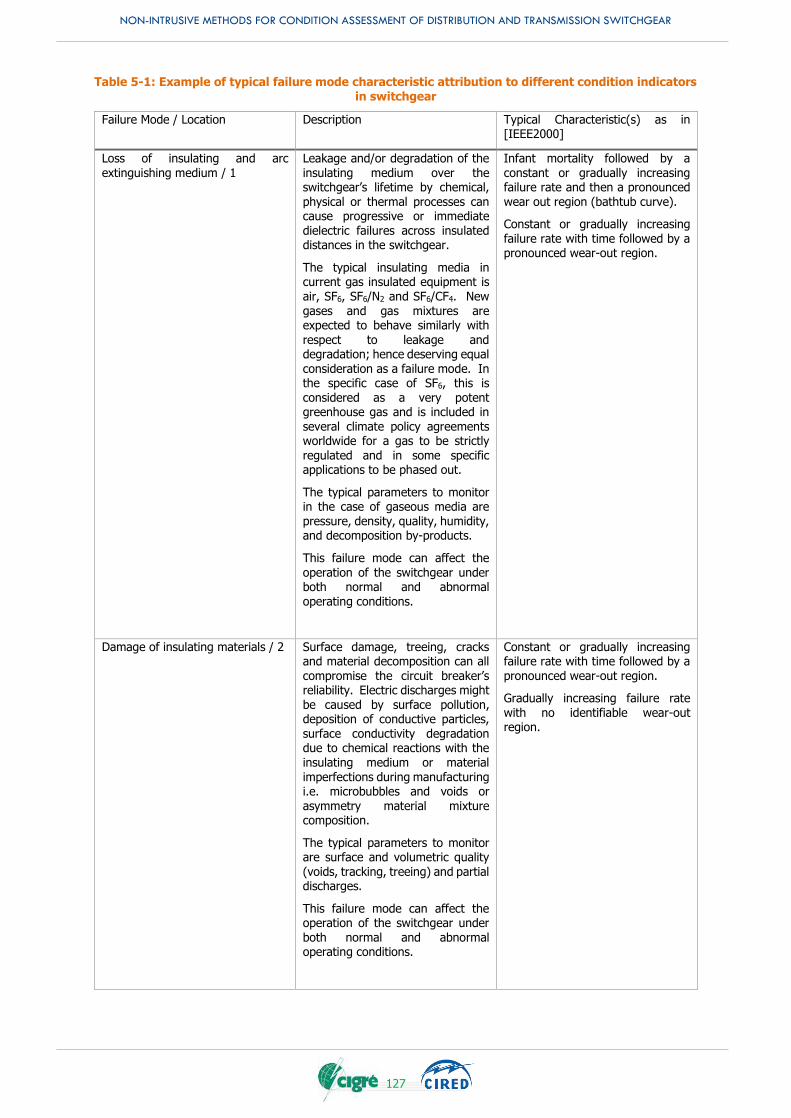
NON-INTRUSIVE METHODS FOR CONDITION ASSESSMENT OF DISTRIBUTION AND TRANSMISSION SWITCHGEAR
127
Table 5-1: Example of typical failure mode characteristic attribution to different condition indicators in switchgear
Failure Mode / Location Description Typical Characteristic(s) as in [IEEE2000]
Loss of insulating and arc extinguishing medium / 1
Leakage and/or degradation of the insulating medium over the switchgear’s lifetime by chemical, physical or thermal processes can cause progressive or immediate dielectric failures across insulated distances in the switchgear.
The typical insulating media in current gas insulated equipment is air, SF6, SF6/N2 and SF6/CF4. New gases and gas mixtures are expected to behave similarly with
respect to leakage and degradation; hence deserving equal consideration as a failure mode. In the specific case of SF6, this is considered as a very potent greenhouse gas and is included in several climate policy agreements worldwide for a gas to be strictly regulated and in some specific applications to be phased out.
The typical parameters to monitor in the case of gaseous media are pressure, density, quality, humidity, and decomposition by-products.
This failure mode can affect the
operation of the switchgear under both normal and abnormal operating conditions.
Infant mortality followed by a constant or gradually increasing failure rate and then a pronounced wear out region (bathtub curve).
Constant or gradually increasing failure rate with time followed by a pronounced wear-out region.
Damage of insulating materials / 2 Surface damage, treeing, cracks and material decomposition can all compromise the circuit breaker’s reliability. Electric discharges might be caused by surface pollution, deposition of conductive particles, surface conductivity degradation due to chemical reactions with the insulating medium or material imperfections during manufacturing i.e. microbubbles and voids or asymmetry material mixture composition.
The typical parameters to monitor are surface and volumetric quality (voids, tracking, treeing) and partial discharges.
This failure mode can affect the operation of the switchgear under both normal and abnormal operating conditions.
Constant or gradually increasing failure rate with time followed by a pronounced wear-out region.
Gradually increasing failure rate with no identifiable wear-out region.
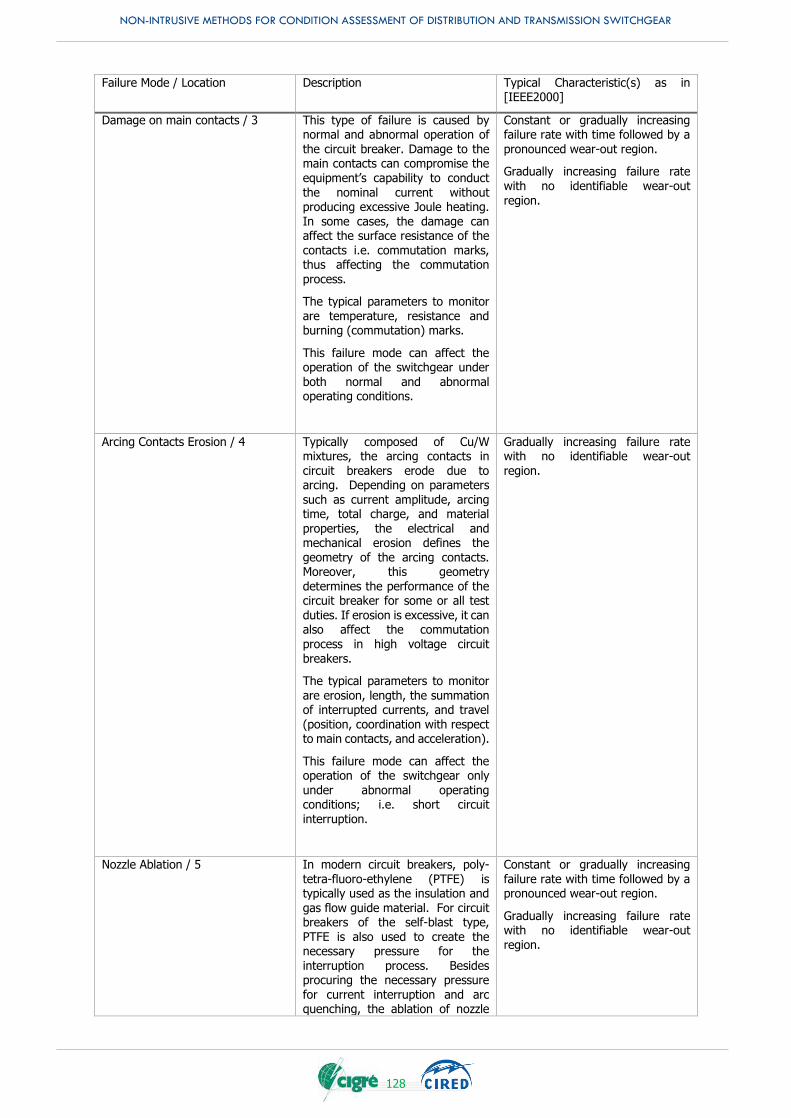
NON-INTRUSIVE METHODS FOR CONDITION ASSESSMENT OF DISTRIBUTION AND TRANSMISSION SWITCHGEAR
128
Failure Mode / Location Description Typical Characteristic(s) as in [IEEE2000]
Damage on main contacts / 3 This type of failure is caused by normal and abnormal operation of the circuit breaker. Damage to the main contacts can compromise the equipment’s capability to conduct the nominal current without producing excessive Joule heating. In some cases, the damage can affect the surface resistance of the contacts i.e. commutation marks, thus affecting the commutation process.
The typical parameters to monitor are temperature, resistance and burning (commutation) marks.
This failure mode can affect the operation of the switchgear under both normal and abnormal operating conditions.
Constant or gradually increasing failure rate with time followed by a pronounced wear-out region.
Gradually increasing failure rate with no identifiable wear-out region.
Arcing Contacts Erosion / 4
Typically composed of Cu/W mixtures, the arcing contacts in circuit breakers erode due to arcing. Depending on parameters such as current amplitude, arcing time, total charge, and material properties, the electrical and mechanical erosion defines the geometry of the arcing contacts. Moreover, this geometry determines the performance of the circuit breaker for some or all test duties. If erosion is excessive, it can also affect the commutation process in high voltage circuit breakers.
The typical parameters to monitor are erosion, length, the summation of interrupted currents, and travel (position, coordination with respect to main contacts, and acceleration).
This failure mode can affect the operation of the switchgear only
under abnormal operating conditions; i.e. short circuit interruption.
Gradually increasing failure rate with no identifiable wear-out region.
Nozzle Ablation / 5 In modern circuit breakers, poly-tetra-fluoro-ethylene (PTFE) is typically used as the insulation and gas flow guide material. For circuit breakers of the self-blast type, PTFE is also used to create the necessary pressure for the interruption process. Besides procuring the necessary pressure for current interruption and arc quenching, the ablation of nozzle
Constant or gradually increasing failure rate with time followed by a pronounced wear-out region.
Gradually increasing failure rate with no identifiable wear-out region.
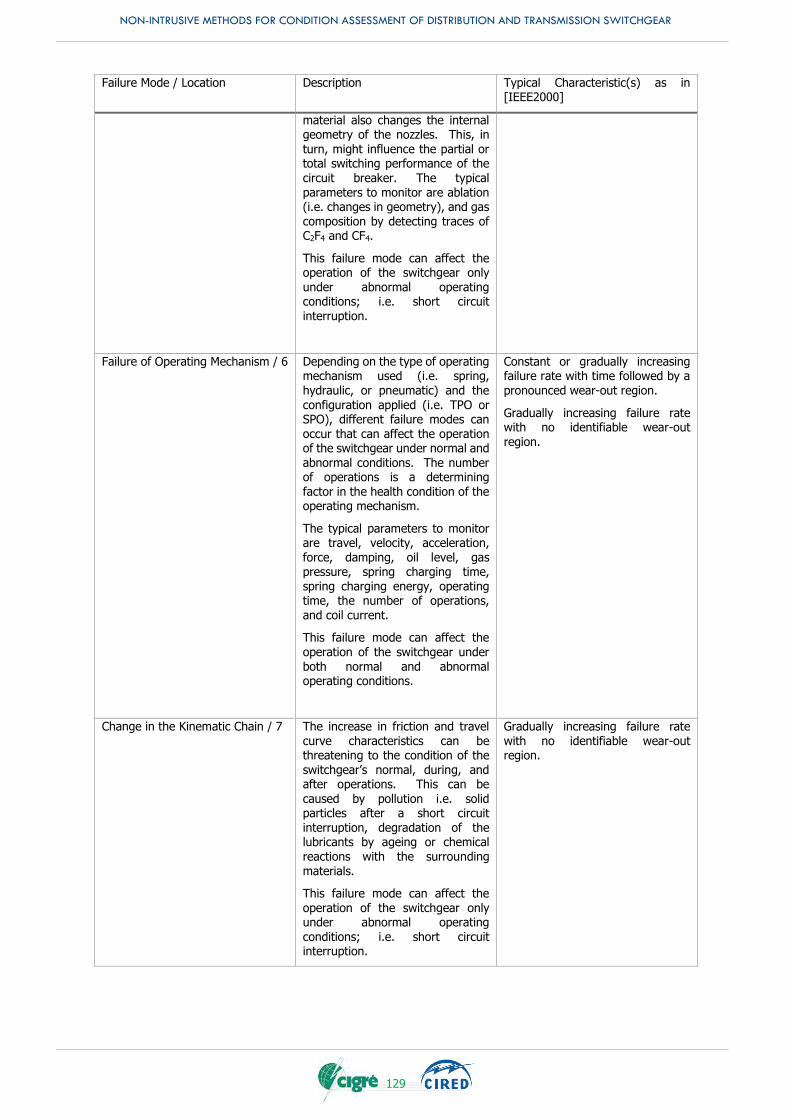
NON-INTRUSIVE METHODS FOR CONDITION ASSESSMENT OF DISTRIBUTION AND TRANSMISSION SWITCHGEAR
129
Failure Mode / Location Description Typical Characteristic(s) as in [IEEE2000]
material also changes the internal geometry of the nozzles. This, in turn, might influence the partial or total switching performance of the circuit breaker. The typical parameters to monitor are ablation (i.e. changes in geometry), and gas composition by detecting traces of C2F4 and CF4.
This failure mode can affect the operation of the switchgear only under abnormal operating conditions; i.e. short circuit interruption.
Failure of Operating Mechanism / 6 Depending on the type of operating mechanism used (i.e. spring, hydraulic, or pneumatic) and the configuration applied (i.e. TPO or SPO), different failure modes can occur that can affect the operation of the switchgear under normal and abnormal conditions. The number of operations is a determining factor in the health condition of the operating mechanism.
The typical parameters to monitor are travel, velocity, acceleration, force, damping, oil level, gas pressure, spring charging time, spring charging energy, operating time, the number of operations, and coil current.
This failure mode can affect the operation of the switchgear under both normal and abnormal operating conditions.
Constant or gradually increasing failure rate with time followed by a pronounced wear-out region.
Gradually increasing failure rate with no identifiable wear-out region.
Change in the Kinematic Chain / 7 The increase in friction and travel curve characteristics can be threatening to the condition of the switchgear’s normal, during, and after operations. This can be
caused by pollution i.e. solid particles after a short circuit interruption, degradation of the lubricants by ageing or chemical reactions with the surrounding materials.
This failure mode can affect the operation of the switchgear only under abnormal operating conditions; i.e. short circuit interruption.
Gradually increasing failure rate with no identifiable wear-out region.
NON-INTRUSIVE METHODS FOR CONDITION ASSESSMENT OF DISTRIBUTION AND TRANSMISSION SWITCHGEAR
130
Once the condition indicator is understood following the guidance of Chapter 3, and the failure
mechanism identified as exemplified above, the economic evaluation can start.
5.3 ANALYSIS TECHNIQUES
Several techniques can be used to assess the benefits of utilizing condition assessment methods. Each
of these techniques presents its own advantages and shortcomings and the choice is to the end user of
which technique or combination of these is more suitable for its assets base management.
From different perspectives, all the methods compare three main cost elements:
1. Investment on the condition assessment system 2. Cost of failure/outage with and without condition assessment (Involves a risk assessment)
3. Cost of maintenance with and without condition assessment (Time Based Maintenance vs
Condition Based Maintenance)
An important element is the definition of the End of Life of the asset and the evaluation of benefits of
its assertion based on its conditions instead of statistics or age. This distinction allows individual maintenance schedules starting with assets deemed critical and deferring intervention on the ones still
in a healthy condition. From a quantitative viewpoint, this means assigning a certain reliability of the condition assessment system applied and an associated failure risk reduction calculation ultimately
exposing the benefits of the applied NICAM.
The risk acceptance level for any specific asset is also a factor to consider. Common sense concepts like failure damage, outage time, environmental impact, image consequences and others must be turned
into monetary values in order to be used in the evaluation of applying or not a condition assessment method. The criteria used should be homogeneously defined and used for all the assets under evaluation
in order to come to a balanced decision strategy.
In 2000, Working Group 13.08, published [a guide to managing the life of circuit breakers. The use of Life Cycle Cost (LCC) analysis is discussed. In this technique, all cost components that occur during a
circuit breaker’s life are inventoried and their future costs recalculated to present values compensated for inflation. Building on top of the LCC technique, Monte Carlo simulation can be used to reduce the
uncertainty level where timing and costs failures, forced outages, planned and corrective maintenance
and disposal methods are all represented as probability distributions. The consideration and inclusion of all the costs in any evaluation technique is central. All costs that accrue from purchasing, installation,
operation, maintenance (preventative and corrective), adaptations, outages, dismantling, and disposal must be accounted for. Special attention must be paid to the accounting practices of utilities and
countries where salvage value and depreciation methods among others could influence the evaluation of economic and technical benefits. Ideally, the GAAP are used to reduce uncertainty in the assets
valuation.
That the ultimate goal of condition assessment methods is to reduce costs, these can be justified if the net benefit results are positive from its application. The cost of monitoring should be related to
equipment cost and its importance. In the same work, it is noted that although there are no rules for determining the benefits of condition monitoring, certain trends can be observed. For example, for an
old switchgear, the costs of installation and application of new monitoring techniques are higher in
comparison to a new switchgear. However, it is with the older equipment where new monitoring methods are of the most importance.
In 2001, the IEEE Standards board, introduced a guide for the selection of monitoring for circuit breakers [IEEE2000]. Here the use of Failure Mode and Effects Analysis (FMEA) is selected as the method to
determine the possible failure characteristics of a specific family of circuit breakers and this information is used to select the most appropriate monitoring method. Once the monitoring method is selected, a
risk assessment is done to quantify the risk associated with each circuit breaker failure mode and a
cost-benefit analysis performed to support the final decision of either implementing continuous or periodic monitoring.
In 2004, Working Group A2.20 approached the subject of transformer management from an economic viewpoint [CIGRE_248_2004]. Particularly useful, the repair versus replacement dilemma is approached
through normative models and decision charts, where several are presented to aid the decision process.
NON-INTRUSIVE METHODS FOR CONDITION ASSESSMENT OF DISTRIBUTION AND TRANSMISSION SWITCHGEAR
131
In 2010, Working Group C1.16 looked into the management of transmission assets and the economic
benefit of monitoring [CIGRE_422_2010]. An objective, for operational asset managers and
maintenance engineers, is the ability to determine and control the failure risk of a specific asset and its associated maintenance schedule. Based on statistics and expert knowledge, different scenarios can
be estimated assuming a service interval. Several examples are given where service cycles are shown for different scenarios with and without monitoring. With the application of condition assessment
methods, it should be possible to profit by a reduced failure rate, making maintenance only when and
where it is needed. The savings generated should be higher than the investment for the method itself.
In 2011, Working Group B3.12, studied value capturing schemes from on-line substation condition
monitoring [CIGRE_462_2011]. Specifically, the economic justification for the use of condition monitoring used different techniques like:
Cost Benefit Analysis (CBA), where the total expected cost of online monitoring is compared against
the expected benefits both expressed in financial terms and adjusted for the time value of money.
Lost Opportunity Value (LOV), where the relationship between scarcity and choice is discussed and
defines the opportunity cost as the cost related to the next-best choice available to someone who has chosen among several mutually exclusive choices. It is generally used in cases where there is
not enough data to make an accurate cost-benefit analysis or if only generalisations are required. Qualitative and Quantitative Risk Analysis, where risk is treated as a relative measure ranked in
categories such as low, medium, high or determined using measurable objective data respectively.
The latter is an extension of the qualitative technique that recognises that quantities used to estimate risk are not always constants or deterministic numbers but rather are better described as
statistical distributions. In both cases, the risk is monetized on the financial impact of the use or not
of monitoring methods. Avoided Maintenance technique, which is based on a comparison of the cost of resources needed
for the application of condition monitoring systems compared with the cost of resources without
condition monitoring. Since condition monitoring may ease maintenance and failure resolution, the need for resources such as labour, spare parts, vehicles, tools, contractor services, clerical support,
and so on may be reduced; consequently, their corresponding costs should be reduced in the same
proportion. Synthesis technique, where the financial investments in monitoring systems for repairable assets
such as circuit breakers is analysed against the repair costs and failure impact.
System Performance, where Key Performance Indicators (KPIs) of utilities are improved by the
reduced risk associated with the use of condition monitoring methods. The benefits are categorised as micro benefits (short term), intermediate benefits (tactical) and macro benefits (strategic).
In 2013, in Working Group C1.25, the decision-making process of asset managers using different risk assessment methodologies is approached [CIGRE_541_2013]. Here, an overview is given on
quantitative evaluation of risk treatment plans for grid development and sustainment, and how utilities
quantify the monetary consequences for events affecting business values that are not directly measured in financial terms. Environmental impact is specially treated and considered in the decision-making
process.
Outside standardisation and investigation bodies, other techniques have been explored. For example,
in [Davies2015], Condition Based Risk Management (CBRM), a methodology to calculate the risk
associated with large numbers of assets by developing calibrated estimates of each assets probability and consequences of failure, is provided. A quantitative probability of failures per year is derived from
an asset ‘Health Index’ which combines known information relating to the assets age, design, operating environment, operating duty and physical observations of the condition. Consequences of failure are
evaluated at the individual asset level in financial terms. This is achieved by first developing quantified estimates of the average consequences of failure in the dimensions of Network Performance, Safety,
Financial, and Environmental impact. These average consequences are then individualised by scaling
up or down to reflect individual assets operating context through the application of appropriate criticality factors. The economic aspect of the CBRM method is based on Net Present Value (NPV) estimations
and the payback period taken as the time for the value of mitigated risk to be equal to the investment cost of the equipment plus the sum of the annual operating costs.
NON-INTRUSIVE METHODS FOR CONDITION ASSESSMENT OF DISTRIBUTION AND TRANSMISSION SWITCHGEAR
132
5.4 EVALUATION PROCESSES OF NICAM
The choice for a non-intrusive condition assessment method is both a technical and an economic matter.
There is no simple answer or one-size-fits-all solution when it comes to the correct criteria and usage
of NICAM for installed or planned assets. Figure 5-2 and Figure 5-3 offer possible NICAM selection processes from different starting points.
In Figure 5-2, the selection process of NICAM is shown from the perspective of a technical and economic analysis prior to implementation. The first step is to select the assets to be monitored and select the
condition indicators to be assessed. It is important to distinguish between the in-operation age and the
manufacturing age, which for some assets might be relevant (i.e. VI’s). Having the assets inventoried with their respective age and the condition indicators selected, their failure mode characteristic is to be
determined using the methods discussed in 5.2. In the case where no specific failure mode can be confidently assigned, a deeper study is needed to derive a dedicated one. Knowing the failure mode for
each of the assets, the selection of the proper NICAM can be done using the references presented in Chapter 3. The last stage involves the economic analysis using the most appropriate method from those
described in Chapter 5.3. If the user arrives at the conclusion that the economic benefits surpass the
investment in NICAM, the decision to apply these is taken, otherwise the decision can be postponed to a later stage where the overall picture might change.
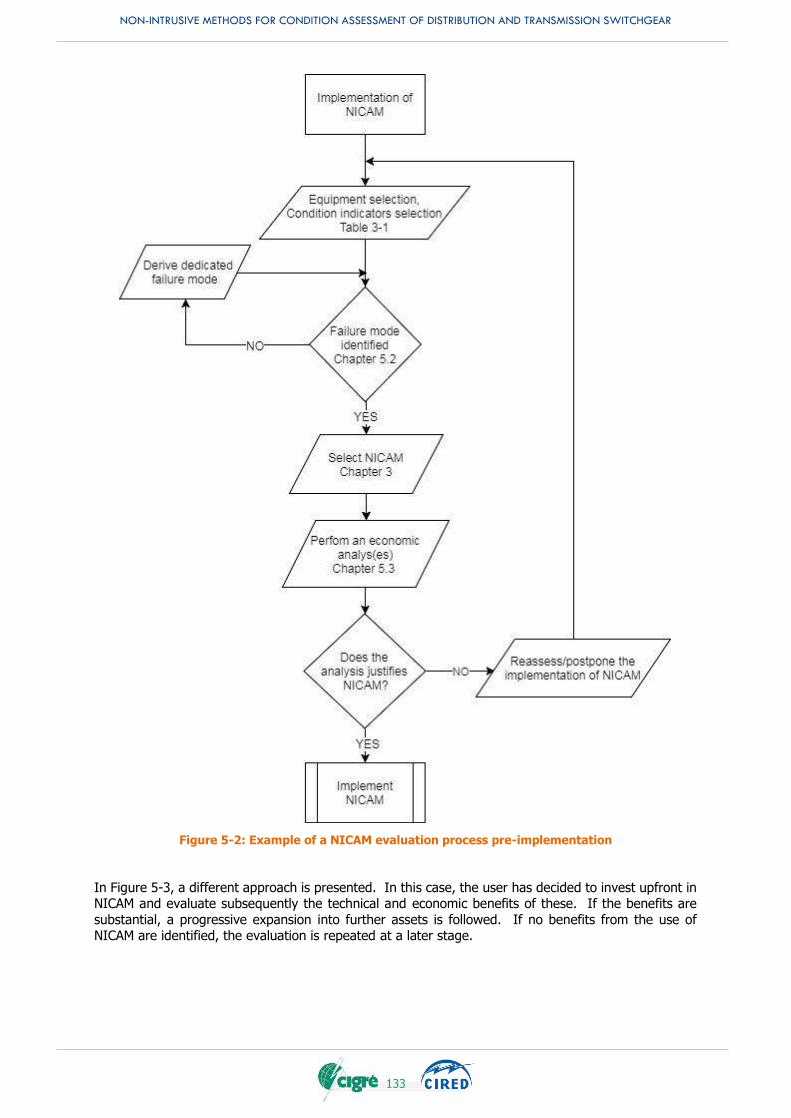
NON-INTRUSIVE METHODS FOR CONDITION ASSESSMENT OF DISTRIBUTION AND TRANSMISSION SWITCHGEAR
133
Figure 5-2: Example of a NICAM evaluation process pre-implementation
In Figure 5-3, a different approach is presented. In this case, the user has decided to invest upfront in NICAM and evaluate subsequently the technical and economic benefits of these. If the benefits are
substantial, a progressive expansion into further assets is followed. If no benefits from the use of NICAM are identified, the evaluation is repeated at a later stage.
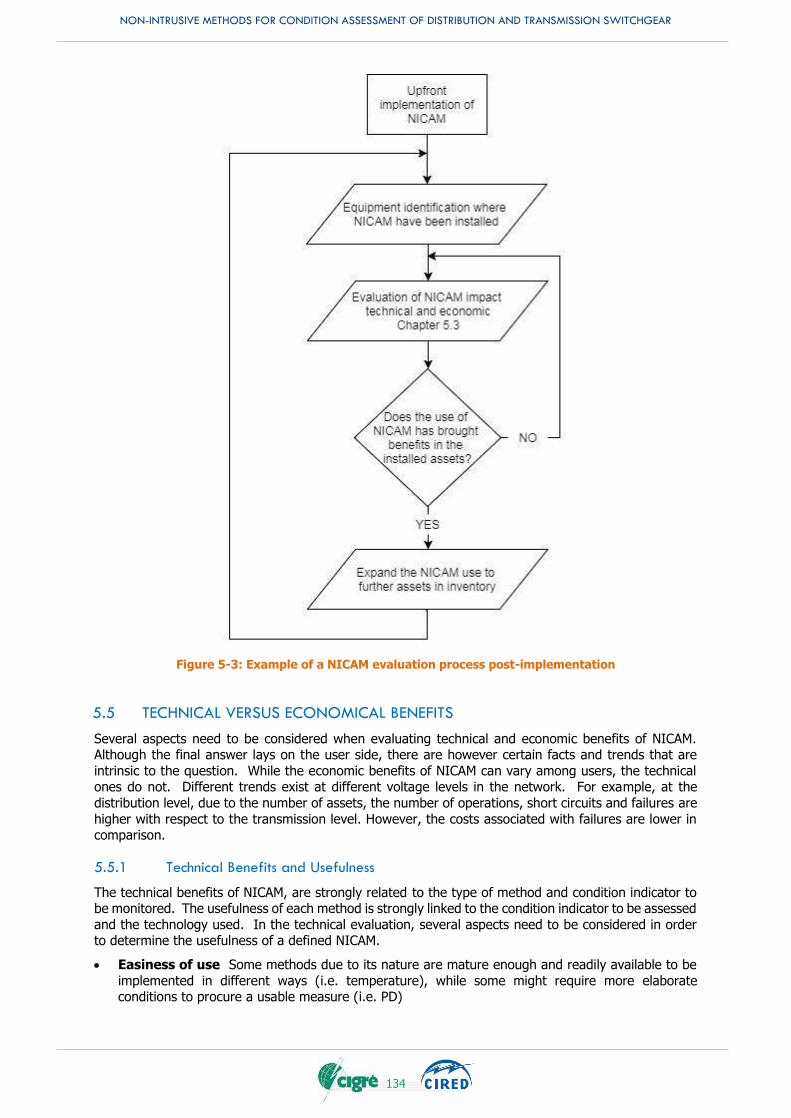
NON-INTRUSIVE METHODS FOR CONDITION ASSESSMENT OF DISTRIBUTION AND TRANSMISSION SWITCHGEAR
134
Figure 5-3: Example of a NICAM evaluation process post-implementation
5.5 TECHNICAL VERSUS ECONOMICAL BENEFITS
Several aspects need to be considered when evaluating technical and economic benefits of NICAM. Although the final answer lays on the user side, there are however certain facts and trends that are
intrinsic to the question. While the economic benefits of NICAM can vary among users, the technical ones do not. Different trends exist at different voltage levels in the network. For example, at the
distribution level, due to the number of assets, the number of operations, short circuits and failures are
higher with respect to the transmission level. However, the costs associated with failures are lower in comparison.
5.5.1 Technical Benefits and Usefulness
The technical benefits of NICAM, are strongly related to the type of method and condition indicator to be monitored. The usefulness of each method is strongly linked to the condition indicator to be assessed
and the technology used. In the technical evaluation, several aspects need to be considered in order to determine the usefulness of a defined NICAM.
Easiness of use Some methods due to its nature are mature enough and readily available to be
implemented in different ways (i.e. temperature), while some might require more elaborate conditions to procure a usable measure (i.e. PD)
NON-INTRUSIVE METHODS FOR CONDITION ASSESSMENT OF DISTRIBUTION AND TRANSMISSION SWITCHGEAR
135
Easiness of interpretation While some methods offer a directly measurable variable on the asset
(i.e. pressure) some might require data post-processing and interpretation by qualified personnel
(i.e. PD)
Quality of information Regardless of the easiness of use and interpretation, different NICAM
might provide different levels and degrees and types of information, i.e. a pressure sensor will provide quantitative data on absolute or relative pressure, while gas analysis on top of that will
provide gas quality and species. Scalability across all voltage levels and equipment Some methods might offer a more robust
concept to be applied independent of the voltage level, network configuration and type of
equipment.
5.5.2 Economic Benefits
The economic benefits of NICAM are visible once several risk factors and their consequences are
monetized and interpreted inside the user’s framework. It is general to all the works mentioned in 5.3
that the main economic benefits are those related to the costs avoided in the case of failure.
Expressed in similar terms, the economic benefits common to all NICAM are:
Reduction or total avoidance of outage costs
Reduction of insurance premiums
Reduction of repair costs
Reduction of safety training related costs
Reduction of costs for studies
Reduction of maintenance costs
Reduction of CAPEX
Reduction of exploratory non-destructive testing
Reduction of replacement costs
Reduction of environmental costs
Reputation costs
Reduction of driving risk
Reduction of injury/fatality costs
etc.
5.5.3 Example of Economic Benefit Calculation of NICAM
In [CIGRE_167_2000] three approaches are given to evaluate the economic benefit of condition assessment systems, going from the microscopic level (analytical approach), middle level (synthesis
approach) to macroscopic level (resources driven approach). Here, a simple way of how to evaluate the economic benefit of NICAM is given based on the more general “resources driven approach”.
Independent from the specific diagnostic technique or technology, the basic concept is applying
methods to assess the switchgear condition along the time, reduction of costs connected to maintenance and operation or to major failure probability of the asset, namely:
Reduction of outage cost
Reduction of repair cost
The cumulated economic benefit along the observation time (i.e. from installation of the monitoring system or start of a systematic diagnostic program, to the end of life of the asset) actualized to year
zero should justify the investment. Additionally, the lower failure risk resulting from applying NICAM can defer renewal or refurbish of the asset ensuring the same reliability.
As shown in [CIGRE_422_2010], the concept is:
Risk identification
o Risk probability o Costs connected to the failure event
Risk = consequence costs * probability of occurence
Cost of mitigation actions (condition assessment programs)
Risk acceptance is defined by break-even between value at risk and cost of mitigation actions
Following the same concept, the following can be obtained:
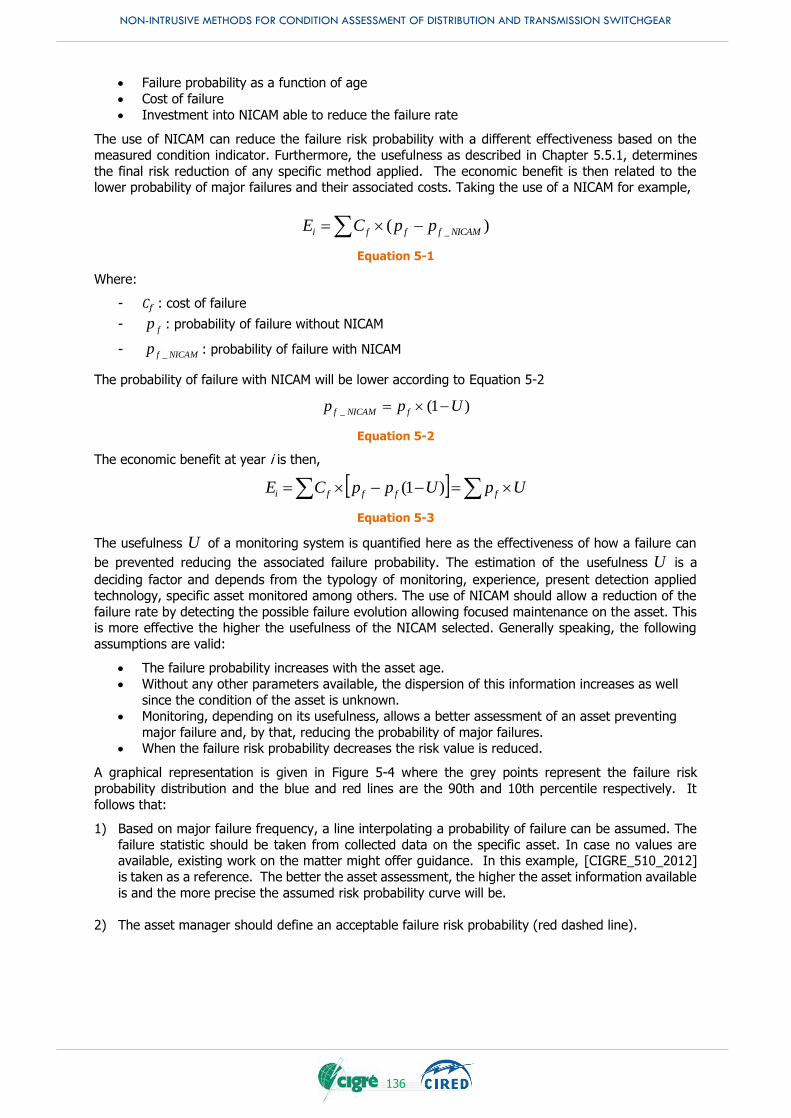
NON-INTRUSIVE METHODS FOR CONDITION ASSESSMENT OF DISTRIBUTION AND TRANSMISSION SWITCHGEAR
136
Failure probability as a function of age
Cost of failure
Investment into NICAM able to reduce the failure rate
The use of NICAM can reduce the failure risk probability with a different effectiveness based on the
measured condition indicator. Furthermore, the usefulness as described in Chapter 5.5.1, determines
the final risk reduction of any specific method applied. The economic benefit is then related to the lower probability of major failures and their associated costs. Taking the use of a NICAM for example,
)( _ NICAMfffi ppCE
Equation 5-1
Where:
- 𝐶𝑓 : cost of failure
- fp : probability of failure without NICAM
- NICAMfp _ : probability of failure with NICAM
The probability of failure with NICAM will be lower according to Equation 5-2
)1(_ Upp fNICAMf
Equation 5-2
The economic benefit at year i is then,
UpUppCE ffffi )1(
Equation 5-3
The usefulness U of a monitoring system is quantified here as the effectiveness of how a failure can
be prevented reducing the associated failure probability. The estimation of the usefulness U is a
deciding factor and depends from the typology of monitoring, experience, present detection applied
technology, specific asset monitored among others. The use of NICAM should allow a reduction of the
failure rate by detecting the possible failure evolution allowing focused maintenance on the asset. This is more effective the higher the usefulness of the NICAM selected. Generally speaking, the following
assumptions are valid:
The failure probability increases with the asset age.
Without any other parameters available, the dispersion of this information increases as well
since the condition of the asset is unknown.
Monitoring, depending on its usefulness, allows a better assessment of an asset preventing
major failure and, by that, reducing the probability of major failures. When the failure risk probability decreases the risk value is reduced.
A graphical representation is given in Figure 5-4 where the grey points represent the failure risk
probability distribution and the blue and red lines are the 90th and 10th percentile respectively. It
follows that:
1) Based on major failure frequency, a line interpolating a probability of failure can be assumed. The
failure statistic should be taken from collected data on the specific asset. In case no values are available, existing work on the matter might offer guidance. In this example, [CIGRE_510_2012]
is taken as a reference. The better the asset assessment, the higher the asset information available
is and the more precise the assumed risk probability curve will be.
2) The asset manager should define an acceptable failure risk probability (red dashed line).
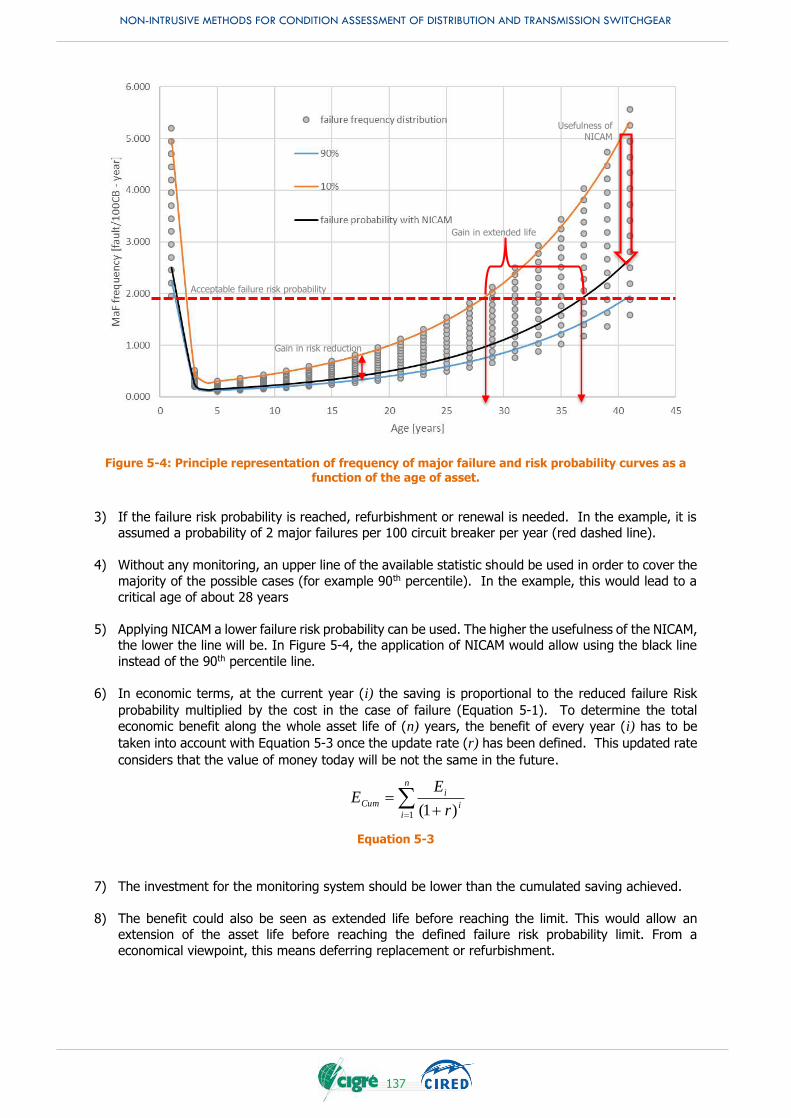
NON-INTRUSIVE METHODS FOR CONDITION ASSESSMENT OF DISTRIBUTION AND TRANSMISSION SWITCHGEAR
137
Figure 5-4: Principle representation of frequency of major failure and risk probability curves as a function of the age of asset.
3) If the failure risk probability is reached, refurbishment or renewal is needed. In the example, it is assumed a probability of 2 major failures per 100 circuit breaker per year (red dashed line).
4) Without any monitoring, an upper line of the available statistic should be used in order to cover the
majority of the possible cases (for example 90th percentile). In the example, this would lead to a
critical age of about 28 years
5) Applying NICAM a lower failure risk probability can be used. The higher the usefulness of the NICAM, the lower the line will be. In Figure 5-4, the application of NICAM would allow using the black line
instead of the 90th percentile line.
6) In economic terms, at the current year (i) the saving is proportional to the reduced failure Risk
probability multiplied by the cost in the case of failure (Equation 5-1). To determine the total
economic benefit along the whole asset life of (n) years, the benefit of every year (i) has to be
taken into account with Equation 5-3 once the update rate (r) has been defined. This updated rate
considers that the value of money today will be not the same in the future.
n
ii
iCum
r
EE
1 )1(
Equation 5-3
7) The investment for the monitoring system should be lower than the cumulated saving achieved.
8) The benefit could also be seen as extended life before reaching the limit. This would allow an extension of the asset life before reaching the defined failure risk probability limit. From a
economical viewpoint, this means deferring replacement or refurbishment.
Gain in extended life
Acceptable failure risk probability
Usefulness of NICAM
Gain in risk reduction
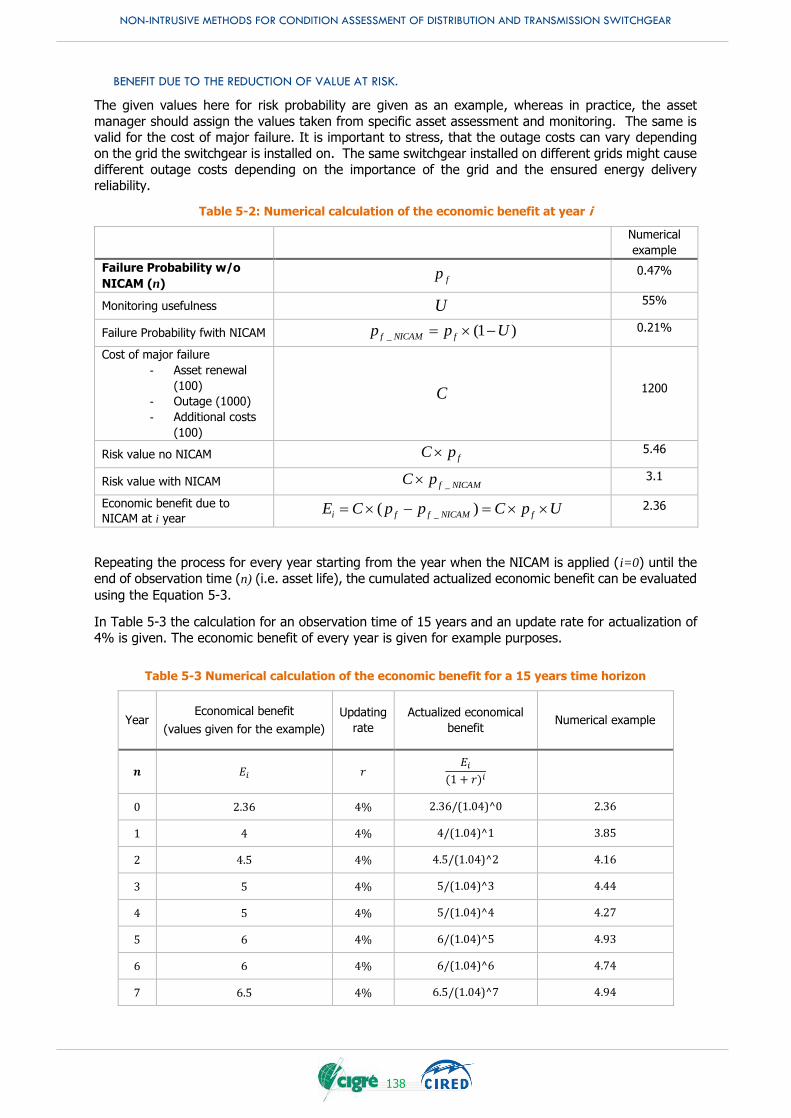
NON-INTRUSIVE METHODS FOR CONDITION ASSESSMENT OF DISTRIBUTION AND TRANSMISSION SWITCHGEAR
138
BENEFIT DUE TO THE REDUCTION OF VALUE AT RISK.
The given values here for risk probability are given as an example, whereas in practice, the asset
manager should assign the values taken from specific asset assessment and monitoring. The same is valid for the cost of major failure. It is important to stress, that the outage costs can vary depending
on the grid the switchgear is installed on. The same switchgear installed on different grids might cause
different outage costs depending on the importance of the grid and the ensured energy delivery reliability.
Table 5-2: Numerical calculation of the economic benefit at year i
Numerical
example
Failure Probability w/o
NICAM (n) fp 0.47%
Monitoring usefulness U 55%
Failure Probability fwith NICAM )1(_ Upp fNICAMf 0.21%
Cost of major failure
- Asset renewal
(100)
- Outage (1000)
- Additional costs
(100)
C 1200
Risk value no NICAM fpC 5.46
Risk value with NICAM NICAMfpC _ 3.1
Economic benefit due to
NICAM at i year UpCppCE fNICAMffi )( _ 2.36
Repeating the process for every year starting from the year when the NICAM is applied (i=0) until the
end of observation time (n) (i.e. asset life), the cumulated actualized economic benefit can be evaluated
using the Equation 5-3.
In Table 5-3 the calculation for an observation time of 15 years and an update rate for actualization of
4% is given. The economic benefit of every year is given for example purposes.
Table 5-3 Numerical calculation of the economic benefit for a 15 years time horizon
Year Economical benefit
(values given for the example)
Updating
rate
Actualized economical
benefit Numerical example
𝒏 𝐸𝑖 𝑟 𝐸𝑖
(1 + 𝑟)𝑖
0 2.36 4% 2.36/(1.04)^0 2.36
1 4 4% 4/(1.04)^1 3.85
2 4.5 4% 4.5/(1.04)^2 4.16
3 5 4% 5/(1.04)^3 4.44
4 5 4% 5/(1.04)^4 4.27
5 6 4% 6/(1.04)^5 4.93
6 6 4% 6/(1.04)^6 4.74
7 6.5 4% 6.5/(1.04)^7 4.94
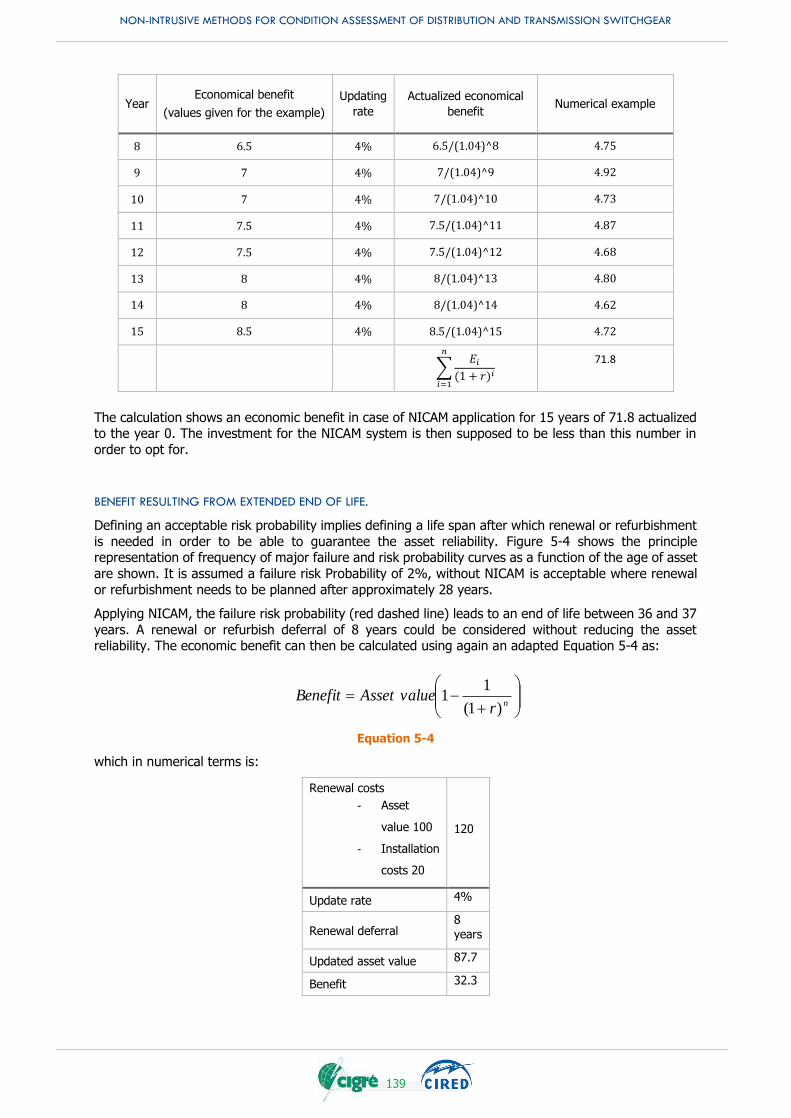
NON-INTRUSIVE METHODS FOR CONDITION ASSESSMENT OF DISTRIBUTION AND TRANSMISSION SWITCHGEAR
139
Year Economical benefit
(values given for the example)
Updating
rate
Actualized economical
benefit Numerical example
8 6.5 4% 6.5/(1.04)^8 4.75
9 7 4% 7/(1.04)^9 4.92
10 7 4% 7/(1.04)^10 4.73
11 7.5 4% 7.5/(1.04)^11 4.87
12 7.5 4% 7.5/(1.04)^12 4.68
13 8 4% 8/(1.04)^13 4.80
14 8 4% 8/(1.04)^14 4.62
15 8.5 4% 8.5/(1.04)^15 4.72
∑𝐸𝑖
(1 + 𝑟)𝑖
𝑛
𝑖=1
71.8
The calculation shows an economic benefit in case of NICAM application for 15 years of 71.8 actualized to the year 0. The investment for the NICAM system is then supposed to be less than this number in
order to opt for.
BENEFIT RESULTING FROM EXTENDED END OF LIFE.
Defining an acceptable risk probability implies defining a life span after which renewal or refurbishment
is needed in order to be able to guarantee the asset reliability. Figure 5-4 shows the principle representation of frequency of major failure and risk probability curves as a function of the age of asset
are shown. It is assumed a failure risk Probability of 2%, without NICAM is acceptable where renewal
or refurbishment needs to be planned after approximately 28 years.
Applying NICAM, the failure risk probability (red dashed line) leads to an end of life between 36 and 37
years. A renewal or refurbish deferral of 8 years could be considered without reducing the asset reliability. The economic benefit can then be calculated using again an adapted Equation 5-4 as:
nrvalueAssetBenefit
)1(
11
Equation 5-4
which in numerical terms is:
Renewal costs
- Asset
value 100
- Installation
costs 20
120
Update rate 4%
Renewal deferral 8 years
Updated asset value 87.7
Benefit 32.3
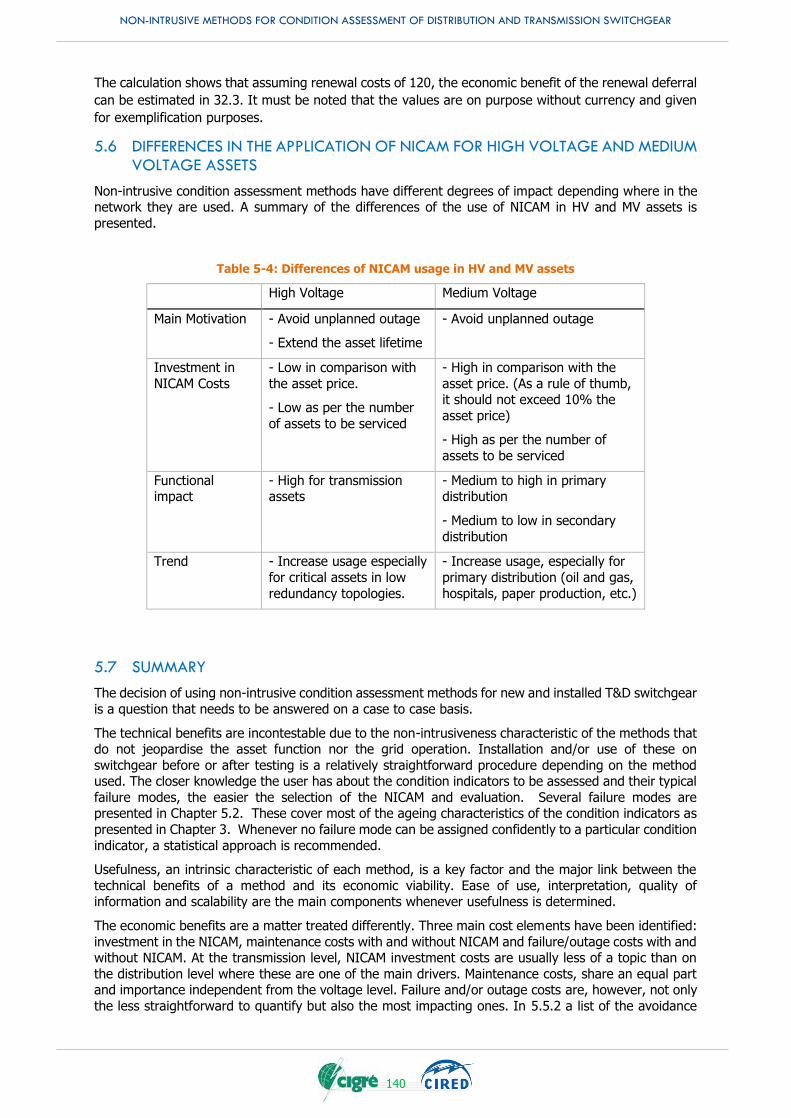
NON-INTRUSIVE METHODS FOR CONDITION ASSESSMENT OF DISTRIBUTION AND TRANSMISSION SWITCHGEAR
140
The calculation shows that assuming renewal costs of 120, the economic benefit of the renewal deferral
can be estimated in 32.3. It must be noted that the values are on purpose without currency and given
for exemplification purposes.
5.6 DIFFERENCES IN THE APPLICATION OF NICAM FOR HIGH VOLTAGE AND MEDIUM VOLTAGE ASSETS
Non-intrusive condition assessment methods have different degrees of impact depending where in the network they are used. A summary of the differences of the use of NICAM in HV and MV assets is
presented.
Table 5-4: Differences of NICAM usage in HV and MV assets
High Voltage Medium Voltage
Main Motivation - Avoid unplanned outage
- Extend the asset lifetime
- Avoid unplanned outage
Investment in
NICAM Costs
- Low in comparison with
the asset price.
- Low as per the number
of assets to be serviced
- High in comparison with the
asset price. (As a rule of thumb, it should not exceed 10% the
asset price)
- High as per the number of
assets to be serviced
Functional impact
- High for transmission assets
- Medium to high in primary distribution
- Medium to low in secondary
distribution
Trend - Increase usage especially
for critical assets in low
redundancy topologies.
- Increase usage, especially for
primary distribution (oil and gas,
hospitals, paper production, etc.)
5.7 SUMMARY
The decision of using non-intrusive condition assessment methods for new and installed T&D switchgear
is a question that needs to be answered on a case to case basis.
The technical benefits are incontestable due to the non-intrusiveness characteristic of the methods that do not jeopardise the asset function nor the grid operation. Installation and/or use of these on
switchgear before or after testing is a relatively straightforward procedure depending on the method used. The closer knowledge the user has about the condition indicators to be assessed and their typical
failure modes, the easier the selection of the NICAM and evaluation. Several failure modes are presented in Chapter 5.2. These cover most of the ageing characteristics of the condition indicators as
presented in Chapter 3. Whenever no failure mode can be assigned confidently to a particular condition
indicator, a statistical approach is recommended.
Usefulness, an intrinsic characteristic of each method, is a key factor and the major link between the
technical benefits of a method and its economic viability. Ease of use, interpretation, quality of information and scalability are the main components whenever usefulness is determined.
The economic benefits are a matter treated differently. Three main cost elements have been identified:
investment in the NICAM, maintenance costs with and without NICAM and failure/outage costs with and without NICAM. At the transmission level, NICAM investment costs are usually less of a topic than on
the distribution level where these are one of the main drivers. Maintenance costs, share an equal part and importance independent from the voltage level. Failure and/or outage costs are, however, not only
the less straightforward to quantify but also the most impacting ones. In 5.5.2 a list of the avoidance

NON-INTRUSIVE METHODS FOR CONDITION ASSESSMENT OF DISTRIBUTION AND TRANSMISSION SWITCHGEAR
141
costs is presented. Whereas some of these are tangible costs, some others require intangible valuation
techniques to monetize and signify their impact.
When evaluating the use of NICAM, there are no identical situations that lead to the same outcome in an economic analysis. Differences in accounting rules, expenditures schemes, risk appetite and others,
differentiate users vastly leading to possibly opposite decisions for similar situations. Even for a single user, the choice for the implementation of NICAM could have different perspectives at different points
in time. This renders the economic benefits analysis of NICAM a privy and timed matter that should be
done as precise as possible, revised and updated regularly.
It is finally to the end user to consciously evaluate the economic benefits that the use of NICAM could
bring to its operation. If costs are not a matter of concern, it is always recommended to increase the level of information of the installed base by means of NICAM. Future trends signal a movement of the
industry towards a more unified and informed network, which is a topic presented in the next chapter.

NON-INTRUSIVE METHODS FOR CONDITION ASSESSMENT OF DISTRIBUTION AND TRANSMISSION SWITCHGEAR
142
NON-INTRUSIVE METHODS FOR CONDITION ASSESSMENT OF DISTRIBUTION AND TRANSMISSION SWITCHGEAR
143
6. FUTURE TRENDS
6.1 SWITCHGEAR USER TRENDS
The industry environment has changed radically in the last years. There used to be a large powerful
workforce and a depth of knowledge with limited computer power. Now there are large powerful computers and a small workforce with a limited depth of knowledge. This results in new trends in
managing and operating the diagnostics and condition monitoring of switchgear. Many utilities do not have switchgear experts which are able to decide what parameters to monitor, develop technology and
interprete results. They are replaced by “generalist” engineers who have to deal with other equipment also. Therefore, the know-how is shifted to the switchgear manufacturers and to manufacturers of
condition monitoring equipment.
There is also a stricter criteria on safety and low tolerance towards explosive failures in the switchyard. These types of failures trigger the adoption of condition monitoring by the user.
Due to this environment the switchgear user prefer:
To have expert systems manage monitoring outputs and advice action
Outsource to specialised companies and manufacturers the management of the condition
monitoring of its own plant
6.2 TRENDS IN DATA COLLECTION AND INFORMATION PROCESS
Today it is possible to gather much information on the condition of the switchgear. This data can be
gathered continuously and can be centralized [CIGRE_567_2014]. There is a need for expert systems
to process this amount of data in a simplified way. The future of continuous monitoring methods depends on having a simple process with clear and defined outcomes, to be implemented by the end
user. The trend to go from periodic monitoring to continuous monitoring will increase the amount of data to
analyse and store. There is a need for the integration and interpretation of a large amount of data. This data can be stored in cloud applications. For the data analysis, interpretation and trending, there will
be an intensive use of expert systems and artificial intelligence.
6.3 INTEGRATION OF MONITORING INTO CONTROL UNITS
There is a trend to integrate condition monitoring in the control and automation of the switchgear.
In High Voltage applications, there already exists integrated monitoring platforms where all the
monitoring parameters are measured by sensors and information is centralized.
In order to apply these monitoring platforms into MV switchgear, the cost of the units should decrease
considerably. With the cost of sensors going down, cost of communication going down, with data
processing power going up, the trend of increasing the monitoring in MV in the future is expected. This applies to new equipment, but not necessary to the old. However, the installation cost of the monitoring
system on the old equpment is not going down.
6.4 INTRUSIVE AND NON-INTRUSIVE MONITORING
The trend for new equipment is to be fitted with sensors where it is possible to gather information on
the state of the device. However, there is great need to monitor old plants with the aim to extend the life of installed equipment. There is a preference for non-intrusive monitoring for this application.
One of the issues for extensive application of monitoring in HV switchgear is the shorter life of the
sensors and monitoring platforms (10-15 years) versus the life of the switchgear (40 years).
Since HV switchgear is getting smaller, it is more challenging to apply non-intrusive diagnostic methods
(dynamic resistance for instance), or find a better example of non-intrusive monitoring.
NON-INTRUSIVE METHODS FOR CONDITION ASSESSMENT OF DISTRIBUTION AND TRANSMISSION SWITCHGEAR
144
6.5 APPLICATION OF NON-INTRUSIVE SENSORS FOR MONITORING OF CIRCUIT BREAKER PARAMETERS
There is a clear advantage to use non-intrusive sensors which can be placed outside the live-parts of
the circuit breaker. Examples of this type of sensors are:
Switching diagnostics through electro-magnetic emissions of the arc detected by antennas
Antennas for detection of partial discharges placed outside the CB
Transient voltage measurements through capacitive sensors
6.6 MONITORING OF NEW GASES USED IN HV AND MV SWITCHGEAR
Today vacuum and SF6 are the two main media used in circuit breakers. However, due to the environmental impact of the gas SF6, there are new alternative gases starting to be used (CO2, dry-air,
N2…). There will then be a shift from a single gas (SF6) to different gases depending on the equipment rating and manufacturer.
SF6 was very well known and standards existed. It is required to investigate long-term evolution of combination of new solid-gas materials in the presence of humidity, oxidation, gas decomposition etc.
6.7 EXPANSION OF THE APPLICATION OF PARTIAL DISCHARGE DIAGNOSTICS
Traditionally PD diagnostics were only applied to strategic and expensive equipment such as EHV GIS
substations and cables. The use of PD diagnostics has been extended to MV distribution switchgear.
The trend is to apply PD monitoring not just to GIS substations but also to AIS substations.
Partial discharge interpretation and decision making based on PD diagnostics is still complex and experienced engineers are required for the interpretation. The trend is to implement better expert
systems which process the PD data and provide clear and simple solutions.
6.8 MAKING SWITCHGEAR DESIGN MORE SAFE
The increase in safety requirements puts a strong demand in the capability of the switchgear to
withstand an internal arc during a fault without risk to the operation personnel. This arc withstand
capability is proved by test. There is also an interest to avoid or to reduce the consequences of the internal arc. The application of thermal monitoring and partial discharge diagnostics will reduce the
chances of the internal arc by giving early warning. The use of fast operating arc quenching devices triggered by light, sound or current sensors will limit the damage produced by the internal fault.
6.9 ASSET MANAGEMENT
An important outcome of the application of condition monitoring is the ability to use data to predict the
end of life of the switchgear. This is a valuable output for the asset manager. The prediction of the end of life allows utilities to make decisions on which switchgear must be replaced and when.
6.10 AUGMENTED REALITY
Augmented Reality (AR) is a technology that superimposes digital information and media, such as 3D models and videos, upon the real world through smartphone, tablet, PC, or connected glasses. One
potential use for AR is for equipment maintenance and condition assessment. With AR, technicians in the field can overlay a 3D model on an actual piece of equipment. They also can view the internal
components of a piece of equipment, including measurements from sensors and gauges. In addition,
AR can also improve operation safety because it allows for better visualization and understanding of the complex assets, thus reducing accidents.
6.11 FUTURE TRENDS IN SENSORS
The macro trend of IoT is leading the drive to more and more sensing options at lower cost, lower power, and increased connectivity. The technology advancements are occurring on three main fronts:
sensing element, wireless communication, and battery technology. MEMS (Microelectromechanical Systems) leverage new microfabrication techniques to create sensing elements at the micro scale which
can be combined onto a single piece of silicon with other integrated circuits. Temperature, pressure,
vibration and strain gauges are a few of the sensing types which are currently available in a MEMS package. Wireless communication protocols such as LoRa, SigFox, BLE, and LTE-M are focusing on
addressing the needs of IoT applications. While each of the protocols has different features (mesh
NON-INTRUSIVE METHODS FOR CONDITION ASSESSMENT OF DISTRIBUTION AND TRANSMISSION SWITCHGEAR
145
networking, range, data bandwidth), they all are becoming lower cost and lower power. Driven by
demands of the consumer electronic device market, batteries are becoming smaller with higher energy
density. Batteries are also being manufactured in a much wider variety of form factors allowing companies to have more flexibility in the size and form factor of their product to fit specific application
needs. In the future, we will see more sensors leveraging the advances in these three areas to create lower cost wireless sensors with longer battery life.
6.12 MONITORING IN CONTROLLED SWITCHING DEVICES
6.12.1 Introduction
The development and modernization of electrical grids, the need for more availability and reliability, the gradual introduction of grid codes and the availability of advanced flexible controlled switching device
(CSD) have recently been accompanied by the increase of controlled switching applications.
In order to maintain switching performance, circuit breaker monitoring functions need to be implemented in CSD. The aim is to accurately anticipate circuit breaker operation times (break/make).
The following typical values may be found in CSD:
Mechanical time, measured from auxilliary sensor
Circuit breaker voltages and currents (6U/3I)
Circuit breaker ambient temperature
Auxiliary voltages
The duties of CSD are:
For opening operation: to precisely predict the arcing time for each operation by syncing the
arcing contacts separation with the circuit breaker current. Every circuit breaker (self blast or
puffer) has an arcing time window for which the limits should be avoided. Possible detrimental issues are restrikes and reignitions. Reignitions, which lead to abnormally long arcing times, can
be detected with primary current acquisition. For closing operation: to determine the making time durations in each pole (which shall
anticipate both mechanical time and prestrike time), depending of the load type (transformer,
overhead line, capacitor bank…) and voltage conditions at the time of operation. This is in order to reduce detrimentals issues (overvoltages, inrush currents, network voltage sag, harmonics).
6.12.2 Mechanical Time Monitoring (contact touch, contact separation)
Regarding the mechanical aspect, an essential distinction between random scatter and long term drift has to be made:
Random scatter, from one operation to another is something that cannot be compensated. There is no
other choice than keeping it low, by design (drive and circuit breaker).
Long term drift is the main reason for a CSD to monitor the mechanical operation times: if the
mechanical time measurement sensor (auxiliary contact, travel curve, or whatever solution) is proven to be consistent with the main contact, the drift can easily be compensated by servoing control law.
The aim is to compensate for ageing or a running issue. As the required making time accuracy to
maintain highest performance is on the order of ±1ms, this compensation is essential.
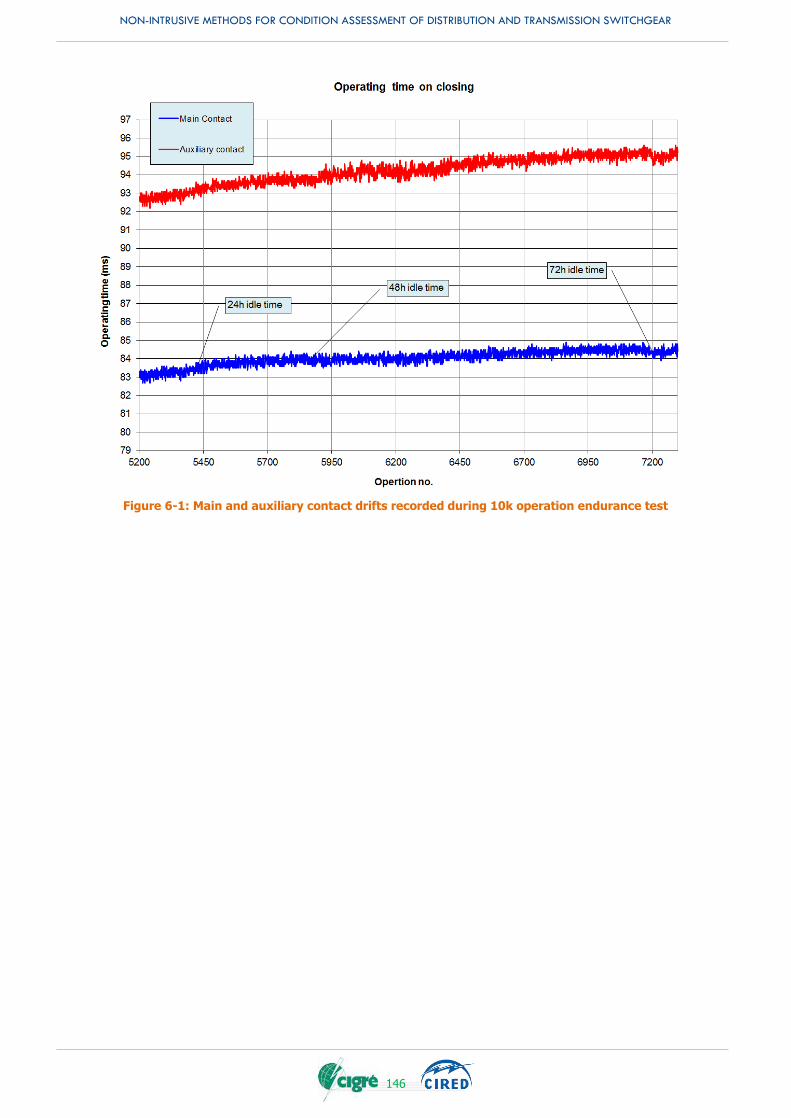
NON-INTRUSIVE METHODS FOR CONDITION ASSESSMENT OF DISTRIBUTION AND TRANSMISSION SWITCHGEAR
146
Figure 6-1: Main and auxiliary contact drifts recorded during 10k operation endurance test
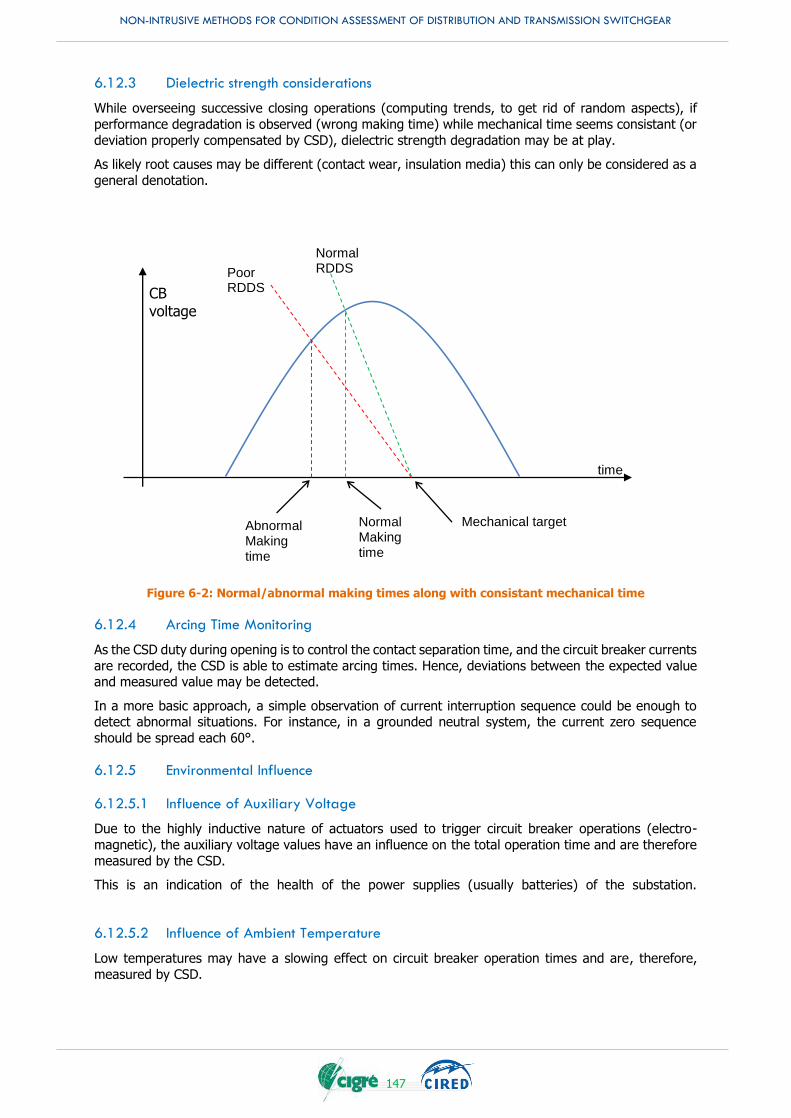
NON-INTRUSIVE METHODS FOR CONDITION ASSESSMENT OF DISTRIBUTION AND TRANSMISSION SWITCHGEAR
147
6.12.3 Dielectric strength considerations
While overseeing successive closing operations (computing trends, to get rid of random aspects), if
performance degradation is observed (wrong making time) while mechanical time seems consistant (or
deviation properly compensated by CSD), dielectric strength degradation may be at play.
As likely root causes may be different (contact wear, insulation media) this can only be considered as a
general denotation.
Figure 6-2: Normal/abnormal making times along with consistant mechanical time
6.12.4 Arcing Time Monitoring
As the CSD duty during opening is to control the contact separation time, and the circuit breaker currents
are recorded, the CSD is able to estimate arcing times. Hence, deviations between the expected value and measured value may be detected.
In a more basic approach, a simple observation of current interruption sequence could be enough to detect abnormal situations. For instance, in a grounded neutral system, the current zero sequence
should be spread each 60°.
6.12.5 Environmental Influence
6.12.5.1 Influence of Auxiliary Voltage
Due to the highly inductive nature of actuators used to trigger circuit breaker operations (electro-
magnetic), the auxiliary voltage values have an influence on the total operation time and are therefore
measured by the CSD.
This is an indication of the health of the power supplies (usually batteries) of the substation.
6.12.5.2 Influence of Ambient Temperature
Low temperatures may have a slowing effect on circuit breaker operation times and are, therefore,
measured by CSD.
CB
voltage
Normal RDDS
time
Mechanical target
Poor RDDS
Normal Making time
Abnormal Making time

NON-INTRUSIVE METHODS FOR CONDITION ASSESSMENT OF DISTRIBUTION AND TRANSMISSION SWITCHGEAR
148
NON-INTRUSIVE METHODS FOR CONDITION ASSESSMENT OF DISTRIBUTION AND TRANSMISSION SWITCHGEAR
149
7. CONCLUSION
To clarify the process of condition monitoring, some terms are defined. A diagnostic method takes some
measured physical parameters of the switchgear and produces some condition indicators, which are used for diagnosis and, later on, when making a decision about the maintenance of the switchgear. The
notion of non-intrusive diagnostics is defined according to a scale consisting of:
1. Non-intrusive: The switchgear is not affected.
2. Minimally intrusive: No major tests or repairs are required before returning to service. 3. Intrusive: Tests are necessary before returning to service.
The intrusiveness is considered for both the switchgear and the grid, and during installation and during
operation. The usefulness and the degree of maturity are also defined, the latter as a modification of the Technology Readiness Level (TRL).
55 condition assessment methods for switchgear are presented. The majority of them can be used for both MV and HV switchgear. They are routinely being deployed in newly manufactured switchgear, so
the equipment is becoming “smarter” out-of-the-factory. But there is still plenty of legacy equipment in
the field to operate and maintain, and it’s desirable to preserve that gear as long as it remains functional. Many of these techniques/methods can be deployed, but it still takes some knowledgeable engineers to
interpret the non-intrusive measurements and decide the best course of action.
The discussed methods were classified into three different categories according to the part of the
switchgear that is measured: primary path (contacts, switching and isolation), mechanical parts (both
mechanical linkage and driving mechanism), and control and auxiliary circuits.
A comprehensive table classifies the methods according to the physical parameter measured. The table
includes the intrusiveness, the degree of maturity, the voltage level, and the insolation and switching medium. Then every method is described in detail with the application, the theoretical background, and
the ease of use and the constraints. Many of the methods are very mature, however, for example, most of the methods that investigate the condition of the vacuum in a vacuum circuit breaker are still in the
investigation phase.
The actual utilization of non-intrusive diagnostics has been depicted by two means: an international survey conducted by the JWG and a selection of recent case studies found in the literature. The survey
included questions about the methods used for condition monitoring. The case studies show how different methods are applied. Non-intrusive diagnostics are often based on indirect measurement of
some physical phenomena (ex. radiated UHF signal generated from a partial discharge). Therefore, a
lot of effort is required to process and analyse measuring data. Non-intrusive diagnostics allowed in some cases the avoidance of major failures by detecting on time a malfunction or the beginning of
degradation and the scheduling of maintenance based on the actual condition of the switchgear.
The closer knowledge the user has about the condition indicators to be assessed and their typical failure
modes, the easier the selection of the non-intrusive method and its evaluation. Several failure modes are presented for a live tank high voltage circuit breaker. Three main cost elements have been identified:
investment in the non-intrusive method, maintenance costs with and without the non-intrusive method
and failure/outage costs with and without the non-intrusive method. The cost calculation contains several values that should be set by the user, as some costs are difficult to estimate or to quantify, as
the cost for outage.
Finally, some trends of the development of condition-monitoring methods for circuit breakers are
summarised, such as monitoring of new isolation gases, further development of partial discharge
diagnostics and antennas to get electromagnetic emissions from different parts of the switchgear.

NON-INTRUSIVE METHODS FOR CONDITION ASSESSMENT OF DISTRIBUTION AND TRANSMISSION SWITCHGEAR
150
NON-INTRUSIVE METHODS FOR CONDITION ASSESSMENT OF DISTRIBUTION AND TRANSMISSION SWITCHGEAR
151
APPENDIX A. DEFINITIONS, ABBREVIATIONS AND SYMBOLS
A.1. TERMINOLOGY
Condition indicator (of switchgear) – quantitative or qualitative value (parameter) related to the
condition of one part or one function of switchgear
Condition measurements (on switchgear) – all kind of measurements of physical values that could
be used to assess the condition indicator of switchgear
Condition (of switchgear) – physical state or operational parameters (IEC 60050 §192-06-28) of one
module or overall which takes into account its aged state as well as any inherent faults (CIGRE B3.12)
Note 1: It refers the knowledge about switchgear (design details, context of operation, etc.), failures
mode analysis (including FMEA), standards, and expert’s knowledge
Note 2: Condition classifications: normal, aged but normal in service, defective, faulty, failed
Cost of diagnostic method is a total of expenses and effort needed to use the method
Diagnosis – discovery and naming of what is problematic:
1. the act of identifying a problem by examining something, analysis, examination, investigation,
scrutiny
2. a statement or conclusion that describes problem, interpretation, opinion, pronouncement 3. as verb: to diagnose–to recognize by examining, to find the cause of a problem
Diagnosis of electrical equipment (after CIGRE B3.12) – a decision aid tool for: maintenance (postponing or advancing preventive maintenance, troubleshooting), residual life evaluation (prognosis,
can we rely on equipment), and load (duty) withstand evaluation (achieving optimum, increasing or reducing)
Note 1: Diagnosis may rely on many diagnostics and any available data.
Note 2: In practice, diagnosis based on non-intrusive diagnostics almost always is hypothetical i.e. involves some confidence level and, consequently admits risk, which is more and more accepted in asset
management.
Diagnostic – adjective: relating to, or used in diagnosis
Diagnostics – the skill or practice of identifying problems, methods used for diagnosis, “diagnostics”
is similar to “diagnostic method”
Diagnostic method (of switchgear) – technology (technique) to obtain one or many condition
indicators, it may include diagnostic test, condition measurement, examination, signal processing, data analysis, software and firmware, etc., as well as the resulting condition indicators (chapter 3)
In-service diagnostic method of switchgear – the method which is applied while the switchgear
remains on the grid and can operate normally (can perform his duty)
Note: Usually the diagnostic methods require that the measurements are taken during the switchgear
operations; in some cases the switchgear should be exercised (forced to operate)
Inspection – documentation of machines operational status, recommendations to ensure proper
operation
Integrity of switchgear – its capacity to operate within the ratings assigned by the manufacturer
without any constraints
Intrusive intervention on switchgear – any intervention on switchgear which does not guarantee that the integrity of the switchgear is preserved;
NON-INTRUSIVE METHODS FOR CONDITION ASSESSMENT OF DISTRIBUTION AND TRANSMISSION SWITCHGEAR
152
Note 1: Any operation of the switchgear prescribed in the equipment manual is considered as non-
intrusive (i.e. opening, closing, powering within the normal range, normal current carrying, etc.)
Note 2: Minimally intrusive – minor intervention or intervention limited to auxiliary subsystems, no major test required after intervention
Note 3: Intrusive – major intervention involving vital parts of switchgear, tests or studies required after intervention
Note 4: Intrusive methods are off-service
Maintenance – required minor adjustment work to ensure safe and reliable operation. Consumables (sealing, oil) might be exchanged and moving parts greased.
Non-intrusive diagnostic method of switchgear – the method which requires only the non-intrusive interventions, switchgear can be returned to the grid without any further verification
Non-intrusive intervention on switchgear – the intervention which preserve the integrity of the
switchgear
Off-service diagnostic method of switchgear – installed or applied when switchgear is temporarily
disconnected from the grid
Note: In CIGRE TB 462 in-service and off-service are rather referred as on-line and offline. In this
brochure on-line and offline refer rather the remote telecommunication link
Overhaul / Refurbish – replace essential parts, asset gets partly or complete disassembled,
restoration of original condition
Usefulness of diagnostic method – a comparison of its value versus its cost, i.e. its cost-effectiveness
Value of diagnostic method - the information i.e. condition indicators and potential diagnosis one can get using the method
A.2. ABBREVIATIONS
AA Active antenna
AC Alternating current
AE Acoustic emission
AIS Air Insulated Switchgear
ANN Artificial Neural Networks
ANSI American National Standards Institute
AR Augmented Reality
ATC American Transmission Company
BDV Breakdown voltage
BLE Bluetooth Low Energy
CA Condition assessment
CAN Controller Area Network
CAPEX Capital expenditure
CB Circuit Breaker
CBA Cost Benefit Analysis
CBM Condition Based Maintenance
CBRM Condition Based Risk Management
CIGRE Conseil International des Grands Réseaux Electriques (Council on Large Electric Systems)
NON-INTRUSIVE METHODS FOR CONDITION ASSESSMENT OF DISTRIBUTION AND TRANSMISSION SWITCHGEAR
153
CIRED Congrès international des réseaux électriques de distribution (International Conference on
Electricity Distribution)
CM Corrective Maintenance
CSD Controlled Switching Device
CSM Current sensor measurement
CT Current Transformer
DC Direct current
DCM Dynamic capacitance measurement
DCRM Dynamic Contact Resistance Measurement
DFR Digital Fault Recorder
DGA Dissolved Gas-in-oil Analysis
DPR Digital Protection Relay
DRM Dynamic Resistance Measurement
DTW Dynamic Time Wrapping
EHV Extra high voltage
EM Electromagnetic
EMC Electromagnetic compatibility
EPRI Electric Power Research Institute
FI Fault interrupters
FMEA Failure Mode and Effects Analysis
FS Full scale
GAAP General Accepted Accounting Principles
GCB Generator circuit-breaker
GIS Gas Insulated Switchgear
GS/s Giga-Samples Per Second
GST Grounded-Specimen Test Mode
HF Hydrogen fluoride / High frequency
HV High Voltage
HVCB High Voltage Circuit Breaker
IDT InterDigital Transducers
IEC International Electrotechnical Commission
IED Intelligent Electronic Device
IEEE Institute of Electrical and Electronics Engineers
IR InfraRed
IR Insulation Resistance
JWG Joint Working Group
KPI Critical Performance Indicator
LCC Life Cycle Cost
LOV Lost Opportunity Value
LTE-M Long Term Evolution (4G), category M1
NON-INTRUSIVE METHODS FOR CONDITION ASSESSMENT OF DISTRIBUTION AND TRANSMISSION SWITCHGEAR
154
LV Low Voltage
MEMS Microelectromechanical Systems
MTS Mixed Technology Switchgear
MV Medium Voltage
NDIR Non-Dispersive Infrared Sensor
NICAM Non-Intrusive Condition Assessment Methods
NPV Net Present Value
NSDD Non Sustained Disruptive Discharges
OC Over Current
OCB Oil Circuit Breaker
OEM Original Equipment Manufacturer
PA Passive antenna
PC Personal computer
PD Partial Discharge
PIN Positive-Intrinsic-Negative
PMU Phasor Measurement Unit
PQM Power Quality Monitor
PTFE Polytetrafluoroethylene
RBM Risk based maintenance
RCM Reliability Centered Maintenance
RDDS Rate of Decrease of Dielectric Strength
RF Radio frequency
RFID Radio frequency identification
RH Relative Humidity
RVDT Rotary Variable Differential Transformer
SAW Surface Acoustic Wave
SER Sequence of Event Recorder
SPO Single Pole Operated
T&D Transmission and Distribution
TB Technical Brochure
TBPM Time Based Preventive Maintenance
TCD Thermal Conductivity Detector
TCM Trip Coil Monitor
TEE Transient Electromagnetic Emission
TEV Transient Earth Voltage
TOR Terms of references
TPO Tandem Pole Operated
TRL Technology Readiness Level
UHF Ultra High Frequency

NON-INTRUSIVE METHODS FOR CONDITION ASSESSMENT OF DISTRIBUTION AND TRANSMISSION SWITCHGEAR
155
UST Ungrounded-Specimen Test Mode
VHF Very High Frequency
VI Vacuum Interrupter
WG Working Group

NON-INTRUSIVE METHODS FOR CONDITION ASSESSMENT OF DISTRIBUTION AND TRANSMISSION SWITCHGEAR
156
NON-INTRUSIVE METHODS FOR CONDITION ASSESSMENT OF DISTRIBUTION AND TRANSMISSION SWITCHGEAR
157
APPENDIX B. LINKS AND REFERENCES
[ABB2005] ABB, "Dynamic Resistance Measurement Part of the Analysis Inspection Service", 2005, Product Brochure
[ABB2006] ABB, "Circuit Breaker LTB D with Motor Drive", 2006, Product Brochure
[ABB2012] ABB, "Generator Circuit Breaker Monitoring System GMS600", 2012, Product Brochure
[ABB2012a] ABB, "Generator Circuit-Breakers HVR-63XS HVR-63S", 2012, Product Brochure
[ABB2013] ABB LTB application guide, page 127", 2013, ABB https://library.e.abb.com/public/26886facea44b7b1c1257cec0046a07c/1HSM%209543%2023-02en%20Live%20Tank%20Circuit%20Breaker%20-%20Application%20Guide%20Ed1.2.pdf
[ABB2016] ABB, "MySiteCare - Operation manual", 2016, ABB SPA EPMV Service
[Abbey2010] Chad Abbey and Yves Brissette and GillesOuellet and Francisc Zavoda and Stéphane Mercier and Tarek Hussein Mostafa El-Fouly, "Advanced distribution system research on a 25 kV distribution test line", 2010, European journal of electrical engineering
[Ahmad2016] Harriezan Ahmad and Tiong Sieh Kiong, "Trip Coil Signature Measurement and Analysis Techniques for Circuit Breaker", 2016, 7th International Conference on Intelligent Systems, Modelling and Simulation, IEEE Computer Society
[Allen2005] D. E. Allen and A. Apostolov and D. G. Kreiss, "Automated analysis of power system events", 2005, IEEE Power and Energy Magazine
[Andle2010] Andle, Jeffrey C. and Sabah, Sabah and Stevens, Daniel S. and Shravan, J. Jumani and Baier, Marcus and Wall, Bert W.A. and Martens,Thomas and Gruenwald, Richard, "Temperature Monitoring System Using Passive Wireless Sensors for Switchgear and Power Grid Asset Management", 2010, Transmission and Distribution Asset Management Workshop
[Andrusca2013] M. Andrusca and M. Adam and R. Pantelimon and A. Baraboi, "About diagnosis of circuit breakers", 2013, 8th International Symposium On Advanced Topics In Electrical Engineering (ATEE)
[Antur1991] Antur, A. and Benenson, D.M. and Demjanenko, V. and Hess, D.P. and Naidu, H. and Park, S.Y. and Soom, A. and Soumekh, M. and Tangri, M.K. and Valtin, R.A. and Wright, S.E., "A noninvasive diagnostic instrument for power circuit breakers", 1991, Transmission and Distribution Conference, IEEE PES
[Bacega2012] Bacega, W.R. and Tatizawa, H. and Bacega, F., "Detection of partial discharges at field in SF6 insulated equipments", 2012, Transmission and Distribution Conference and Exposition, IEEE PES
[Bagavathiappan2013]
S. Bagavathiappan and B.B. Lahiri and T. Saravanan and John Philip and T. Jayakumar, "Infrared thermography for condition monitoring – A review ", 2013, Infrared Physics and Technology
[Beattie1996] Beattie, S., "Circuit breaker condition assessment by vibration and trip coil analysis", 1996, IEE Colloquium on Monitors and Condition Assessment Equipment
[Bhole2015] Bhole, A.A. and Gandhare, W.Z., "An Overview of Dynamic Contact Resistance Measurement of HV Circuit Breakers", 2015, Journal of The Institution of Engineers (India): Series B
[Biswas2015] S. S. Biswas and A. K. Srivastava and D. Whitehead, "A Real-Time Data-Driven Algorithm for Health Diagnosis and Prognosis of a Circuit Breaker Trip Assembly", 2015, IEEE Transactions on Industrial Electronics
[Blackman2006] J. Blackman and M. Averyt and Z. Taylor, "SF6 leak rates from high voltage circuit breakers - U.S. EPA investigates potential greenhouse gas emissions source", 2006, IEEE Power Engineering Society General Meeting
[Blokhintsev2009] Blokhintsev, I. and Patterson, C.L. and Cassidy, B.J. and Loesch, A.H., "Advantage of On-Line Partial Discharge continuous monitoring of medium voltage substation", 2009, Electrical Insulation Conference, IEEE
NON-INTRUSIVE METHODS FOR CONDITION ASSESSMENT OF DISTRIBUTION AND TRANSMISSION SWITCHGEAR
158
[Bollen1993] Bollen, M.H.J, "Literature Search For Reliability Data of Components in Electric Distribution Networks.", 1993, Faculty of Electrical Engineering, Eindhoven University of Technology
[Boltze2011] Boltze, M. and Kornhuber, S. and Pfeiffer, J. and Valtin, G., "Various Methods of the Partial Discharge Detection at Switchgears", 2011, 78th Annual International Doble Client Conference
[Bosma2001] Bosma, A. and Thureson, P.-O., "A new reliable operating mechanism for HVAC circuit-breakers", 2001, Transmission and Distribution Conference and Exposition, IEEE PES
[Braunovic2005] M. Braunovic and V. V. Izmailov and M. V. Novoselova, "A model for life time evaluation of closed electrical contacts", 2005, Proceedings of the Fifty-First IEEE Holm Conference on Electrical Contacts
[Braunovic2009] M. Braunovic and V. V. Izmailov and A. E. Naumov and M. V. Novoselova, "Estimation of Remaining Lifetime of Power Connections Using Infrared Thermography", 2009, Proceedings of the 55th IEEE Holm Conference on Electrical Contacts
[Briggs1995] Briggs, S.J. and Bartos, M. and Arno, R., "Reliability and availability assessment of electrical and mechanical systems", 1995, Industry Applications Conference, Thirtieth IAS Annual Meeting, IAS '95., IEEE
[Brown1996] P.M. Brown, "Non-Intrusive Partial Discharge Measurements On High Voltage Switchgear", 1996, IEE Colloquium on Monitors and condition assessment equipment, Leatherhead Surrey, UK
[Brown2012] Brown, J.R., "Circuit Breaker Linear Motion Measurement using Linear and Rotary Transducers", 2012, 79th Annual International Doble Client Conference
[Budyn2010] M. Budyn and H. M. Karandikar and M. G. Urmson, "Switchgear Condition Monitoring", 2010, CIGRE Canada Conference on Power Systems
[Cadick2014] Cadick, John and Ledbetter, Finley, "Determining Circuit Breaker Health Using Vibration Analysis a Field Study", 2014, 81st International Conference of Doble Clients
[Cadick2014b] Cadick, John and Ledbetter, Finley and Seidel, Alan, "Predicting the Remaining Life of Vacuum Interrupters in the Field", 2014, 81st International Conference of Doble Clients
[Cai2011] Xiaolan Cai and Dada Wang and Hong Yu and Xianping Zhao and Wei Zhang, "The Application of X-ray Digital Real-time Imaging Technology in \{GIS\} Defect Diagnosis", 2011, Procedia Engineering
[Camps2004] Camps, G. D. and Cumming, T.A. and Gibson, D. and Olson, S. and Walker, D. and Ault, G.W. and McDonald, J.R., "An economic and technical evaluation of condition monitoring for new SF6 circuit breakers", 2004, 39th International Universities Power Engineering Conference (UPEC)
[Cao2011] Ran Cao and Ying Chen and Rui Kang, "Failure mechanism analysis of quartz accelerometer under vibration condition", 2011, Prognostics and System Health Management Conference (PHM-Shenzhen)
[Catalin2009] Pancu Catalin and Baraboi Adrian and Adam Maricel, "New Approach Regarding the Electroerosion Estimation of the Circuit Breakers Contacts", 2009, WSEAS Transactions On Circuits And Systems
[Charbkaew2012] Charbkaew, Noppadol and Suwanasri, Thanapong and Bunyagul, Teratam and Schnettler, Armin, "Vibration signal analysis for condition monitoring of puffer-type high-voltage circuit breakers using wavelet tranSForm", 2012, IEEJ Transactions on Electrical and Electronic Engineering
[Charbkeaw2008] Charbkeaw, N. and Suwanasri, T. and Bunyagul, T., "Mechanical defect detection of SF6 high voltage circuit breaker using wavelet based vibration signal analysis", 2008, 5th International Conference on Electrical Engineering, Electronics, Computer, Telecommunications and Information Technology (ECTI-CON), Bangkok, Thailand
[Cheetham2014] Cheetham, P. and Hellany, A., "Density monitoring of high voltage SF6 circuit breakers", 2014, Electrical Insulation Conference (EIC), IEEE
[Cheng2008] Chao-Yuan Cheng and L. J. Chen and W. S. Kao, "Diagnosing Medium Voltage GIS Circuit Breaker by Observing Trip Coil Current with Simulation and Actual Tests", 2008, Electric Power Components and Systems
[Cho2011] Cho, S.-In, "On-Line PD (Partial Discharge) Monitoring of Power System Components", 2011, Aalto University
NON-INTRUSIVE METHODS FOR CONDITION ASSESSMENT OF DISTRIBUTION AND TRANSMISSION SWITCHGEAR
159
[Christophorou1995]
Christophorou, L.G. and Van Brunt, R.J., "SF6/N2 mixtures: basic and HV insulation properties", 1995, IEEE Transactions on Dielectrics and Electrical Insulation
[Chudnovsky2006] B. H. Chudnovsky, "Electrical Contacts Condition Diagnostics Based on Wireless Temperature Monitoring of Energized Equipment", 2006, Proceedings of the 52nd IEEE Holm Conference on Electrical Contacts
[Chunguang2009] Hou Chunguang and Cao Yundong, "Research on a novel on-line monitoring system for Mechanical Characteristic of Circuit Breaker", 2009, 4th IEEE Conference on Industrial Electronics and Applications (ICIEA)
[CIGRE_165_2000] CIGRÉ WG 13.8, "LIFE MANAGEMENT OF CIRCUIT-BREAKERS", 2000, CIGRE
[CIGRE_167_2000] CIGRÉ WG 13.09, "User Guide for the Application of Monitoring and DIiagnostic Techniques for Switching Equipment for Rated Voltages of 72.5 kV and Above", 2000, CIGRÉ
[CIGRE_1969] CIGRÉ WG 21.03, "Recognition of Discharges", 1969, CIGRÉ
[CIGRE_2007] CIGRÉ WG D1.33, "Electra Brochure on PD Measurements - Guide to IEC Publication 60270-2000", 2007, CIGRÉ
[CIGRE_319_2007] CIGRÉ WG A3.12, "Circuit breaker controls - Failure survey on CB controls systems", 2007, CIGRE
[CIGRE_368_2009] CIGRÉ WG A3.18, "Operating Environement of Voltage Grading Capacitors Applied to High Voltage Circuit-Breakers", 2009, CIGRÉ
[CIGRE_422_2010] CIGRE WG C1.16, "Transmission Asset Risk Management", 2010, CIGRÉ
[CIGRE_424_2010] CIGRÉ WG B5.20, "New Trends for Automated Fault and Disturbance Analysis", 2010, CIGRÉ
[CIGRE_462_2011] CIGRÉ WG B3.12, "Obtaining Value from On-Line Substation Condition Monitoring", 2011, CIGRÉ
[CIGRE_567_2014] CIGRE WG B3.25, "SF6 Analysis for AIS, GIS and MTS Condition Assessment", 2014, CIGRÉ
[CIGRE_576_2014] CIGRE WG B3.06. (2014). Technical Brochure 576—IT strategies for asset management of substations. France, Paris: CIGRÉ
[CIGRE_589_2014] CIGRE WG A3.27, "The Impact of the Application of Vacuum Switchgear at Transmission Voltages", 2014, CIGRÉ
[CIGRE_597_2014] CIGRE WG C1.25, "Transmission Asset Risk Management Progress in Application", 2014, CIGRÉ
[Coventry2011] Coventry, Paul and Runde, Magne, "Electrical stresses on circuit-breaker voltage grading capacitors caused by unequal voltage sharing during switching operations", 2011, European Transactions on Electrical Power
[Czerepuszko2007] Paul A. Czerepuszko, "Tracking Down the Greenhouse Gas SF6 with Infrared Thermography", 2007, Product Brochure FLIR
[Dalke2004] G. Dalke and J. Horak, "Application of numeric protective relay circuit breaker duty monitoring", 2004, Conference Record of the IEEE Industry Applications Conference, 39th IAS Annual Meeting
[Davies2007] Neil Davies and Joe Cheung Yin Tang and Paul Shiel, "Benefits And Experiences Of Non-Intrusive Partial Discharge Measurements On Mv Switchgear", 2007, 19th International Conference on Electricity Distribution, CIRED, Vienna
[Davies2008] Davies, N. and Yuan Tian and Tang, J.C.Y. and Shiel, P., "Non-intrusive partial discharge measurements of MV switchgears", 2008, International Conference on Condition Monitoring and Diagnosis (CMD)
[Davies2015] Neil Davies and Paul Blackmore and Ying Wang, "Quantifying the Economic Benefits of Online Monitoring", 2015, International Journal of Condition Monitoring and Diagnostic Engineering Management
[Demjanenko1992] Demjanenko, V. and Valtin, R. A. and Soumekh, M. and Naidu, H. and Antur, A. and Hess, D. P. and Soom, A. and Tangri, M. K. and Park, S. Y. and Benenson, D.M. and Wright, S.E., "A noninvasive diagnostic instrument for power circuit breakers", 1992, IEEE Transactions on Power Delivery
NON-INTRUSIVE METHODS FOR CONDITION ASSESSMENT OF DISTRIBUTION AND TRANSMISSION SWITCHGEAR
160
[Deng2011] Xin Deng and Weiguo Li and Bin Liu, "Discharge properties and diagnosis of gas pressure in vacuum interrupter", 2011, Power Engineering and Automation Conference (PEAM), IEEE
[Dennis2006] Dennis, G. and Redfern, M. and Pennock, S., "The Development of Non-Intrusive Techniques for Partial Discharge Detection on MV and EHV Switchgear", 2006, 41st International Universities Power Engineering Conference (UPEC)
[Desai2012] B. Desai and Y. Lu and M. Westrich and E. Udren, "Practical Circuit Breaker Condition Monitoring With Protective Relays", 2012, CIGRE Session
[Dewulf2003] J. A. Dewulf and T. Jung and J. P. Dupraz and G. F. Montillet, "A development and application of circuit breakers diagnostic and monitoring", 2003, Transmission and Distribution Conference and Exposition, IEEE PES
[Djekic2007] Zarko Djekic, "Online Circuit Breaker Monitoring System", 2007, Texas A\&M University
[Doble2006] Doble, "Oil-Form-191", 2006, form
[Doche2017] René Doche and Ryszard Pater and Sébastien Poirier and Mario Germain and Stéphane Gingras, "Field Experience with Non-intrusive In-service Diagnostics of Circuit Breaker Based on Transient Electromagnetic Emissions", 2017, 3rd International Conference on Condition Monitoring, Diagnosis and Maintenance (CMDM), Bucharest, Romania
[Dongyan2011] Li Dongyan and He Weifeng and Rong Mingzhe and Wang XiaoHua and Su Haibo, "On-Line Monitoring System for Switching Synchronization of Ultra-High Voltage Circuit Breaker in GIS", 2011, Power and Energy Engineering Conference (APPEEC), Asia-Pacific
[Dorovatovski2005] Dorovatovski, N. and Liik, O., "Results Of Thermographic Diagnostics Of Electric Grid Contact Junctions And Generators Of Oil Shale Power Plants", 2005, Oil Shale
[Dupraz2007] Jean Pierre Dupraz and Alain Fanget and Wolfgang Grieshaber and Georges F. Montillet, "New Applications for Rogowski Coils Design in the Electrical Industry", 2007, MatPost
[Durocher2015] D. B. Durocher and D. Loucks, "Infrared Windows Applied in Switchgear Assemblies: Taking Another Look", 2015, IEEE Transactions on Industry Applications
[Eichhoff2013] Eichhoff, Daniel, "Mobile test system for the on-site measurement of the internal pressure in vacuum interrupters (in German)", 2013, RWTH Aachen University
[Eichhoff2014] D. Eichhoff and D. Gentsch and M. Weuffel and A. Schnettler, "Influence of the residual gas composition and the Getter-Ion effect on the measurement of the internal pressure in vacuum interrupters", 2014, International Symposium on Discharges and Electrical Insulation in Vacuum (ISDEIV)
[Eichhoff2014a] D. Eichhoff and D. Gentsch and M. Weuffel and A. Schnettler, "Magnetron-based on-site measurement of the internal pressure in vacuum interrupters", 2014, International Symposium on Discharges and Electrical Insulation in Vacuum (ISDEIV)
[El-Hadidy2011] Mohamed El-Hadidy and Dalal Helmi, "Examples of Condition Based Maintenance in Distribution Systems", 2011, 21st International Conference on Electricity Distribution, CIRED
[El-Hadidy2011a] Mohamed A. El-Hadidy and Dalal H. Helmi, "Predictive Maintenance Strategy Based on Disturbance Recorders", 2011, The Online Journal on Power and Energy Engineering (OJPEE)
[Falkingham2012] L. T. Falkingham and R. Reeves and S. Mistry and C. H. Gill, "A study of vacuum levels in a sample of long service vacuum interrupters", 2012, 25th International Symposium on Discharges and Electrical Insulation in Vacuum (ISDEIV)
[Fecteau2005] Fecteau, C. and Larose, D. and Bégin, R. and Lachance, J.-G., "Daily Integrity Checks using Automated DFR's Records Analysis", 2005, 8th Annual Fault and Disturbance Analysis Conference
[Frontzek1993] Frontzek, F R and Konig, D, "Measurement of emission currents immediately after arc polishing of contacts-Method for internal-pressure diagnostics of vacuum interrupters", 1993, IEEE Transactions on Electrical Insulation
[Garnett2011] Garnett, J.M. and Gavin, J.E. and McGrail, A.J. and Miles, T.J and Doster, P.J. and Davis, M., "Substation Metalclad Assessment using Handheld Ultrasonic and Transient Earth Voltage Testing Devices", 2011, 78th Annual International Doble Client Conference
NON-INTRUSIVE METHODS FOR CONDITION ASSESSMENT OF DISTRIBUTION AND TRANSMISSION SWITCHGEAR
161
[Gautschi2014] D. Gautschi and F. Meyer and Y. Kieffel, "Verwendung alternativer Gase für metallgekapselte Hochspannungsschaltanlagen", 2014, Stuttgarter Hochspannungssymposium, Universität Stuttgart
[Gillette2014] Gillette, L. and Gaborit, G. and Volat, C. and Dahdah, J. and Lecoche, F. and Jarrige, P. and Duvillaret, L., "Optical Sensor for the diagnostic of high voltage equipment", 2014, Electrical Insulation Conference (EIC), IEEE
[Graf2016] T. Graf, "Contactless thermal online-monitoring of electrical equipment under load to determine the load level and damage avoidance", 2016, CIGRE Session
[Grijp1996] M. H. B. de Grijp and J. S. Bedet and R. A. Hopkins and J. E. Greyling, "Condition monitoring of high voltage circuit breakers", 1996, 4th AFRICON, IEEE
[Guan2013] Yufan Guan and M. Kezunovic and P. Dehghanian and G. Gurrala, "Assessing circuit breaker life cycle using condition-based data", 2013, IEEE Power Energy Society General Meeting
[Hale2000] Hale, P.S. and Arno, R.G., "Survey of reliability and availability information for power distribution, power generation, and HVAC components for commercial, industrial, and utility installations", 2000, Industrial and Commercial Power Systems Technical Conference, Annual Meeting, IEEE
[Henderson1996] Henderson, R. and Seeds, D., "Condition assessment of circuit breakers using a trip coil profiling approach", 1996, IEE Colloquium on Monitors and Condition Assessment Equipment
[Hess1992] Hess, D. P. and Park, S. Y. and Tangri, M. K. and Vougioukas, S.G. and Soom, A. and Demjanenko, V. and Acharya, R. and Benenson, D.M. and Wright, S.E., "Noninvasive condition assessment and event timing for power circuit breakers", 1992, IEEE Transactions on Power Delivery
[Hilber2015] Hilber, Patrik and Westerlund, Per and Lindquist, Tommie, "The reliability chain", 2015, CIGRE SC A3 and B3 Joint Colloquium, Nagoya, Japan
[Hoidalen2005] Hoidalen, H.K. and Runde, M., "Continuous monitoring of circuit breakers using vibration analysis", 2005, IEEE Transactions on Power Delivery
[Holdsworth2015] Chris Holdsworth, "Performance review of vacuum interrupters in UK distribution networks", 2015, Energy Network Association, UK
[Hu2001] Xiao-guang Hu and Yan-chao Ji and Wen-bin Yu, "The application of wavelet singularity detection in fault diagnosis of high voltage breakers", 2001, 27th Annual Conference of the IEEE Industrial Electronics Society, IECON
[Huang2009] Jian Huang and Peilei Rao and Xiaoguang Hu and Jin Xiao, "Research of on-line monitoring system of the condition of circuit breaker based on ARM and FPGA", 2009, IEEE International Conference on Control and Automation, ICCA
[Huang2011] X. Huang and B. Huang and H. Wang, "Design of compositive on-line monitoring and fault diagnosis system for high-voltage switch cabinet", 2011, International Conference on Electrical and Control Engineering (ICECE),
[Huda2013] A.S. Nazmul Huda and Soib Taib, "Application of infrared thermography for predictive/preventive maintenance of thermal defect in electrical equipment ", 2013, Applied Thermal Engineering
[Hughes2016] David Hughes, "Future vision for digital substations", 2016, Focus on Power Grid
[Hussain2013] Hussain, G.A. and Kumpulainen, L. and Lehtonen, M. and Hashmi, M. and Shafiq, M., "Signal processing of PD measurements to predict arcing faults in MV switchgears", 2013, IEEE International Conference on Industrial Technology (ICIT)
[IEC2008] IEC, "High-voltage switchgear and controlgear - Part 100: Alternating-current circuit breakers", 2008, IEC
[IEC2013] IEC61850_90_3_, "Part 90-3: Using IEC 61850 for Condition Monitoring Diagnosis and Analysis", 2013, IEC
[IEEE1993] IEEE, "Guide for Partial Discharge Measurement in Power Switchgear", 1993, IEEE
[IEEE2000] IEEE, "Guide for the Selection of Monitoring for Circuit Breakers", 2001, IEEE C37.10.1
[IEEE2011] IEEE, "Guide for Investigation, Analysis, and Reporting of Power Circuit Breaker Failures", 2011, IEEE
[IEEE1999] IEEE, "Standard Test Procedure for AC High-Voltage Circuit Breakers Rated on a Symmetrical Current Basis", 1999, IEEE
NON-INTRUSIVE METHODS FOR CONDITION ASSESSMENT OF DISTRIBUTION AND TRANSMISSION SWITCHGEAR
162
[IEEE1974] IEEE Committee Report,, "Report on Reliability Survey of Industrial Plants, Part IV: Additional Detailed Tabulation of Some Data Previously Reported in the First Three Parts", 1974, IEEE Transactions on Industry Applications
[Ikeda2008] Ikeda, H. and Makisaka, K. and Harada, K. and Ohtsuka, S. and Hikita, M. and Iwamoto, K. and Nagata, T., "Preliminary investigation for application of MEMS acceleration sensor to SF6 gas circuit breaker", 2008, International Conference on Condition Monitoring and Diagnosis, CMD
[Ikeda2009] Ikeda, H. and Kawachi, S. and Harada, K. and Ohtsuka, S. and Hikita, M. and Nagata, T. and Iwamoto, K., "Research on acceleration phenomena with test equipment of simulating puffer type gas circuit breaker", 2009, Transmission Distribution Conference Exposition: Asia and Pacific
[Izmailov2008] Izmailov, V. V. and Novoselova, M. V. and Naumov, A. E., "Application of statistical methods for forecasting the residual service life of electric connectors", 2008, Russian Electrical Engineering
[Jadin2012] Mohd Shawal Jadin and Soib Taib, "Recent progress in diagnosing the reliability of electrical equipment by using infrared thermography ", 2012, Infrared Physics and Technology
[Jang2011] SungIl Jang and JungHwan Choi and SeungGuk Baek and JeongA Yun and KwangHo Kim, "Development of an integrated Condition Monitoring and Diagnosis system (IEC61850) for cubicle-GIS", 2011, International Conference on Advanced Power System Automation and Protection (APAP)
[Johal2008] Johal, H. and Mousavi, M.J., "Coil current analysis method for predictive maintenance of circuit breakers", 2008, Transmission and Distribution Conference and Exposition, IEEE PES
[Juhre2005] Juhre, K. and Kynast, E., "High pressure N2, N2/CO2 and CO2 gas insulation in comparison to SF6 in GIS applications", 2005, Proceedings of the XIVth International Symposium on High Voltage Engineering
[Kam2013] S. Kam and S. Nielsen and G. Ledwich, "A systematic review of a statistical vacuum circuit breaker model for condition monitoring", 2013, IEEE Transactions on Dielectrics and Electrical Insulation
[Kamei2011] M. Kamei and O. Takai, "Influence of Sensor Information Accuracy on Condition-Based Maintenance Strategy for GIS/GCB Maintenance", 2011, IEEE Transactions on Power Delivery
[Kane2003] Kane, C. and Golubev, A., "Advantages of continuous monitoring of partial discharges in rotating equipment and switchgear", 2003, Conference Record of the Annual Pulp and Paper Industry Technical Conference
[Kayano2004] Kayano, P. S. D. and Silva, M. S. and Magrini, L. C. and Calderbn, Y. P. and Jardini, J. A., and Veiga, F. E. C., "Distribution substation transformer and circuit breaker diagnoses with the assistance of real-time monitoring", 2004, IEEWPES Transmission and Distribution Conference and Exposition: Latin America
[Keith2000] Keith, D. and Fischer, J. and McRae, T., "Experience with infrared leak detection on FPL Switchgear", 2000, 1st International Conference on SF6 and the Environment, San Diego, CA
[Kezunovic2002] M. Kezunovic and C. Nail and Z. Ren and D. R. Sevcik and J. Lucey and W. Cook and E. Koch, "Automated circuit breaker monitoring and analysis", 2002, Power Engineering Society Summer Meeting, IEEE
[Kezunovic2003] Mladen Kezunovic and Goran Latisko and Zhifang Ren and Don Sevcik and John Lucey and Edward Koch and Wayland Cook, "Automated analysis of circuit breaker operation", 2003, 17th International Conference on Electricity Distribution, CIRED
[Kezunovic2005] Kezunovic, M. and Zhifang Ren and Latisko, G. and Sevcik, D.R. and Lucey, J. S. and Cook, W. E. and Koch, E. A., "Automated monitoring and analysis of circuit breaker operation", 2005, IEEE Transactions on Power Delivery
[Knezev2007] M. Knezev and Z. Djekic and M. Kezunovic, "Automated Circuit Breaker Monitoring", 2007, IEEE Power Engineering Society General Meeting
[Kocis2007] Lubomir Kocis and Petr Kopejtko, "Automatic Collection and Evaluation of Monitored HV Equipment Service Conditions", 2007, MatPost07
[Kocos2013] Kocos, "Dynamic timing measurement", 2013, Product Brochure
[Kopejtkova2014] D. Kopejtkova and L. Kocis and J. Konrad, "Life-cycle management of HV substation equipment", 2014, CIGRE Session
NON-INTRUSIVE METHODS FOR CONDITION ASSESSMENT OF DISTRIBUTION AND TRANSMISSION SWITCHGEAR
163
[Korendo2001] Z. Korendo and M. Florkowski, "Thermography based diagnostics of power equipment", 2001, Power Engineering Journal
[Kornhuber2012] Kornhuber, S. and Jani, K. and Boltze, M. and Valtin, G., "Partial discharge (PD) detection on medium voltage switchgears using non-invasive sensing methods", 2012, International Conference on Condition Monitoring and Diagnosis (CMD)
[Kramer2013] A. Kramer and Th.A. Paul, "High-precision density sensor for concentration monitoring of binary gas mixtures ", 2013, Sensors and Actuators A: Physical
[Lalonde2012] Mathieu Lalonde and Long Pong, "Dynamic Resistance Measurement Field Experiences - Testing, Diagnostic", 2012, 79th Annual International Doble Client
[Lalonde2013] Lalonde, M. and Levi, J., "Shock Absorber Reaction Measurement on HV Circuit Breaker Spring Mechanism Analysis and Diagnostic", 2013, 80th Annual International Doble Client Conference
[Lalonde2015] Lalonde, Mathieu and Poirier, Sébastien, "Analyzing High-Voltage Circuit Breaker Motion Based on a Reference Curve", 2015, 82nd International Conference of Doble Clients
[Landry1997] Michel Landry, "In-Service Diagnostics of High-Voltage Power Apparatus On-Line Condition Monitoring Systems for HV Circuit Breakers", 1997, 10th International Symposium on High Voltage Engineering (ISH)
[Landry2004] M. Landry and A. Mercier and G. Ouellet and C. Rajotte and J. Caron and M. Roy and Fouad Brikci, "A New Measurement Method of the Dynamic Contact Resistance of HV Circuit Breakers", 2004, CIGRÉ session
[Landry2008] Landry, Michel and Turcotte, O. and Brikci, F., "A Complete Strategy for Conducting Dynamic Contact Resistance Measurements on HV Circuit Breakers", 2008, IEEE Transactions on Power Delivery
[Landry2008a] Landry, M. and Leonard, F. and Landry, C. and Beauchemin, R. and Turcotte, O. and Brikci, F., "An Improved Vibration Analysis Algorithm as a Diagnostic Tool for Detecting Mechanical Anomalies on Power Circuit Breakers", 2008, IEEE Transactions on Power Delivery
[Larson2009] Larson, S. and Prout, P. and Salinas, A. and Bustamante, R. and Wampole, R. and Nowak, L.A., "Trip Coil Analysis Case Studies", 2009, 76th Annual International Doble Client Conference
[Lee2002] Lee, Dennis S. and Lithgow, Brian and Morrison, R. E., "New Fault Diagnosis of Circuit Breakers", 2002, Power Engineering Review, IEEE
[Leonard2011] Léonard, F. and Reynaud, L. and Bherer, J. and Pineau, D., "Partial Discharge (PD) Sniffer for Workers’ Safety in Underground Vaults", 2011, 21st International Conference on Electricity Distribution, CIRED
[Leusenkamp2015] Leusenkamp, Martin and Van Rijn, Theo and Binnendijk, Martin and Ter Hedde, Bert, "Check On The Condition Of Vacuum Interrupters After Long Periods Of Service", 2015, 23rd International Conference on Electricity Distribution, Lyon
[Levi2010] Jozef Levi, "First Trip testing using the TDR Test instruments", 2010, 77th Annual International Doble Client Conference
[Levi2011] Levi, J., "Motion Measurement and Use of Transducers for Detection of Circuit Breaker Characteristics", 2011, 78th Annual International Doble Client Conference
[Levi2012] Levi, J., "New Method for Close Shock Absorber Measurement on ABB BLG Spring Mechanism", 2012, 79th Annual International Conference of Doble Clients
[Levi2013] Levi, Jozef, "Timing and motion testing of high voltage circuit breakers", 2013, Doble Engineering Company
[Lewand2004] Lance R. Lewand and Paul Griffin, "Condition Assessment of Oil Circuit Breakers and Load Tap-Changers by the Use of Laboratory Testing and Diagnostics", 2004, NETA WORLD
[Li2004] Wenhua Li and Kui Li and Lijun Sun and Shangwu Zhao and Lijuan Ji, "The test data verifying prediction model of electrical contact", 2004, Proceedings of the 50th IEEE Holm Conference on Electrical Contacts and the 22nd International Conference on Electrical Contacts
[Li2011] Li, Kui and Zhang, Xiujuan and Yuan, Jinli and Wang, Yao and Pang, Jiayuan and Zhang, Jing and Huang, Shaopo, "Design of the Mechanical Condition Monitoring System for Molded Case Circuit Breakers", 2011, 1st International Conference on Electric Power Equipment – Switching Technology – Xi’an – China
NON-INTRUSIVE METHODS FOR CONDITION ASSESSMENT OF DISTRIBUTION AND TRANSMISSION SWITCHGEAR
164
[Li2013] Li, C.-R. and Ma, G.-M. and Qi, B. and Zhang, G.-J. and Su, Q., "Condition monitoring and diagnosis of high-voltage equipment in China-recent progress", 2013, Electrical Insulation Magazine, IEEE
[Lin2011] Xin Lin and Hong-kui Zhang and Yong-xiang Li and Jian-yuan Xu, "Research on mechanical characteristics monitoring system for high-voltage circuit breaker motor operating mechanism", 2011, International Conference on Electrical Machines and Systems (ICEMS)
[Lin2011a] Jiayang Lin and Chaoying Xiong and Jian Fu, "Online Monitoring and Fault Diagnostics of Mechanical Conditions of High-Voltage Disconnector", 2011, 21st International Conference on Electricity Distribution, CIRED, Frankfurt
[Lindquist2005] Tommie Lindquist, "On reliability modelling of ageing equipment in electric power systems with regard to the effect of maintenance", 2005, Licentiate thesis, KTH Electrical Engineering, Stockholm, Sweden
[Lindquist2005a] Lindquist, T.M. and Bertling, L. and Eriksson, R., "Estimation of disconnector contact condition for modelling the effect of maintenance and ageing", 2005, Power Tech, IEEE Russia
[Lindquist2007] Lindquist, T. and Bertling, L., "A method for calculating disconnector contact availability as a function of thermography inspection intervals and load current", 2007, CIGRE Colloquium, Osaka
[Lindquist2008] Tommie Lindquist, "On reliability and maintenance modelling of ageing equipment in electric power systems", 2008, Doctoral thesis, KTH Electrical Engineering, Stockholm, Sweden
[Lindquist2010] Lindquist, T. and Akesson, U. and Sölver, C-E., "Reliability modelling of aged circuit-breakers using data from the design process", 2010, A3-206, CIGRE Session
[Lindquist2011] Tommie Lindquist, "Wireless sensors VS Thermography – Comparing accuracy and applications", 2011, A3-202, CIGRE SC A3 Technical Colloquium
[Livshitz2004] A. Livshitz and B. H. Chudnovsky and B. Bukengolts, "Online condition monitoring and diagnostics of power distribution equipment", 2004, Power Systems Conference and Exposition, IEEE PES
[Livshitz2005] A. Livshitz and B. H. Chudnovsky and B. Bukengolts and B. A. Chudnovsky, "On-line temperature monitoring of power distribution equipment", 2005, 52nd Annual Petroleum and Chemical Industry Conference, IEEE Industry Applications Society
[Lopez-Roldan2007]
J. Lopez-Roldan and M. Blundell and D. Wing and D. Birtwhistle and M. Ramli and T. Tang,, "Analysis of Modern High Voltage Circuit Breaker Failure during Shunt Reactor Switching Operations and Corrective Measures", 2007, MATPOST
[Lopez-Roldan2012]
Lopez-Roldan, J. and Birtwhistle, D. and Blundell, M. and Tee Tang, "A Noninvasive Method for Detecting Restriking: Application to the Switching of HV Shunt Reactors", 2012, IEEE Transactions on Power Delivery
[Lopez-Roldan2013]
Lopez-Roldan, J. and Blundell, M. and Irwin, T. and Charlson, C., "Partial discharge diagnostics for mixed-technology switchgear (MTS) in outdoor substations", 2013, Electrical Insulation Magazine, IEEE
[Lopez-Roldan2014]
Jose Lopez-Roldan and Ryszard Pater and Sebastien Poirier and David Birtwhistle and Tee Tang and Rene Doche and Mark Blundell, "Development of non-intrusive monitoring for reactive switching of high voltage circuit breaker", 2014, International Journal of Electrical Power and Energy Systems
[Lundin2000] Leif Lundin, "The Intelligent AX1 Switchgear for Medium Voltage", 2000, 5th International seminar - Switchgear and controlgear
[Lundqvist2000] Bertil Lundqvist, "Intelligent Switchgear And Information Technology", 2000, Wold Energy Conference, Neptun, Romania
[Mantilla2014] Mantilla, J.D. and Gariboldi, N. and Grob, S. and Claessens, M., "Investigation of the insulation performance of a new gas mixture with extremely low GWP", 2014, Electrical Insulation Conference (EIC), IEEE
[Mao2007] H. Mao and G. Chang and X. Zhu and Y. Wang, "On-line monitoring of pressure in vacuum interrupters", 2007, IEEE Transactions on Dielectrics and Electrical Insulation
[McCalley2006] McCalley, Jim and Jiang, Yong and Honavar, Vasant and Pathak, Jyotishman and Kezunovic, Mladen and Natti, Satish and Singh, Chanan and Panida Jirutitijaroen, "Automated Integration of Condition Monitoring with an Optimized Maintenance Scheduler for Circuit Breakers and Power Transformers", 2006, PSERC Publication
NON-INTRUSIVE METHODS FOR CONDITION ASSESSMENT OF DISTRIBUTION AND TRANSMISSION SWITCHGEAR
165
[Medjoudj2011] R. Medjoudj and D. Aissani and R. Medjoudj, "Reliability and data analysis of electrical degraded system subject to random shocks", 2011, 7th International Conference on Electrical and Electronics Engineering (ELECO)
[Megger2012] Megger GmbH, "Megger VIDAR Vacuum Interrupter Tester - Datasheet", 2012
[Meng2004] YonPeng Meng and Shenli Jia and Mingzhe Rong, "Condition monitoring of vacuum circuit breakers using vibration analysis", 2004, XXIst International Symposium on Discharges and Electrical Insulation in Vacuum, ISDEIV
[Meng2006] Yongpeng Meng and Shenli Jia and Zongqian Shi and Mingzhe Rong, "The detection of the closing moments of a vacuum circuit breaker by vibration analysis", 2006, IEEE Transactions on Power Delivery
[Mercier2014] A. Mercier and S. De Carufel and P. Taillefer, "Long-term Reliability of Controlled Switching Systems: Observations from Two Decades of Development and Experience", 2014, CIGRE Session
[Merck1999] Merck, WFH and Damstra, GC and Bouwmeester, CE and Gruntjes, RJB, "Methods for estimation of the vacuum status in vacuum circuit breakers", 1999, IEEE Transactions on Dielectrics and Electrical Insulation
[Michaelson2012] Michaelson, Jerry and Moglestue, Andreas, "Seeing through switchgear", 2012, ABB Review
[Middleton2000] Bob Middleton, "Cold Weather Applications of Gas Mixture (SF6/N2, SF6/CF4) Circuit Breakers: A User Utility’s Perspective", 2000, The US Environmental Protection Agency’s Conference on SF6 and the Environment, San Diego, California
[Milovic2014] Milovic, Budo, "Dynamic Resistance Measurement, Condition Testing of Circuit Breaker’s Arcing Contacts", 2014, Electricity Today
[Moore2004] Moore, P.J., "Radiometric measurement of Circuit Breaker interpole switching times", 2004, IEEE Transactions on Power Delivery
[Morgan2014] Morgan, Lee and Levi, Jozef, "New Use for Linear Transducer Tr3171 for Motion Measurement of HV Circuit Breakers", 2014, 81st International Conference of Doble Clients
[Muhr2006] Muhr, M. and Pack, S. and Jaufer, S.and Lugschitz, H., "Thermography of Aged Contacts of High Voltage Equipment", 2006, CIGRE Session
[Muyi2010] Li Muyi and Huang Jian and Hu Xiaoguang, "Insulative condition monitoring of high voltage circuit breaker", 2010, 5th IEEE Conference on Industrial Electronics and Applications (ICIEA)
[Natti2011] Satish Natti and Mladen Kezunovic, "Assessing circuit breaker performance using condition-based data and Bayesian approach ", 2011, Electric Power Systems Research
[Ngoc2009] Ngoc, M.N. and Denat, A. and Bonifaci, N. and Lesaint, O. and Daoud, W. and Hassanzadeh, M., "Electrical breakdown of CF3I and CF3I-N2 gas mixtures", 2009, IEEE Conference on Electrical Insulation and Dielectric Phenomena, CEIDP
[Norris1989] A. Norris, "Report of circuit breaker reliability survey of industrial and commercial installations", 1989, Industrial and Commercial Power Systems Technical Conference
[Nowak2011] Linda Nowak and Leah Simmons, "Doble Testing SF6 Circuit Breakers (A Progress Report)", 2011, 78th Annual International Doble Client Conference
[OMICRON2017] OMICRON, "CIBANO 500 PTM User Manual", 2017, OMICRON electronics GmbH
[Ostojic2013] Radenko Ostojic and Jozef Levi, "Use of Micro Ohm Meter as a Power Source for DRM Testing on Dead Tank Circuit Breakers", 2013, 80th International Conference of Doble Clients
[Paoletti2002] Paoletti, G.J. and Baier, M., "Failure contributors of my electrical equipment and condition assessment program development", 2002, IEEE Transactions on Industry Applications
[Pfeiffer2004] W. Pfeiffer and D. Schoen, "Requirements for Gaseous Insulation for Application in GITL Considering N2, N2O and CO2 with Low Content SF6", 2004, International Symposium on Electrical Insulation
[Picagli2012] Picagli, Anthony J., "Determining Circuit Breaker Test Parameters When Manufacturer’s Data Is Not Available", 2012, 79th Annual International Doble Client Conference
NON-INTRUSIVE METHODS FOR CONDITION ASSESSMENT OF DISTRIBUTION AND TRANSMISSION SWITCHGEAR
166
[Picagli2013] Anthony J. Picagli, "Focus on Batteries", 2013, Transmission And Distribution World Magazine
[Pieniak2014] Pieniak, T. and Kurrat, M. and Gentsch, D. and Puzankov, S., "Experimental setup for quantifying the emission coefficient of contact material for infrared temperature measurement", 2014, International Symposium on Discharges and Electrical Insulation in Vacuum (ISDEIV)
[Poeltl2011] Pöltl, Anton and Lane, Michael, "Field Experiences with HV Circuit Breaker Condition Monitoring", 2011, ABB Review
[Poirier2010] Poirier, S. and Pater, R. and Doche, R., "A Non-Intrusive Diagnostic Approach to Prevent Circuit-Breaker Critical Failures", 2010, International Conference on Condition Monitoring and Diagnosis, CMD
[Poirier2014] Poirier, S., and Doche, R., and Pater, R., and Poirier, J., "Measurements of Dielectric Breakdown Delays between Series-Connected Interrupters of a HV Circuit Breaker", 2014, CIGRE Session
[Pons1993] A. Pons and A. Sabot and G. Babusci, "Electrical endurance and reliability of circuit-breakers-common experience and practice of two utilities", 1993, IEEE Transactions on Power Delivery
[Portales2015] E. Portales and Y. Filion and D.Thibault-Couture and C. Morin and A. Mercier and S. Poirier and R. Pater, "Assessment of controlled switching mitigation technique for a 735/315/12,5 kV, 1 650 MVA autotransformer: field tests results", 2015, CIGRE SC A3 and B3 Joint Colloquium, Nagoya, Japan
[Prochaska2014] Jan Prochaska and Patrick Halbach and Kristian Ermeler and Achim Kalter and Gerd Valtin and Michael Weise, "On-site partial discharge measurement at gas-insulated switchgear for the medium-voltage level (Onsite-Teilentladungsmessung an gasisolierten Schaltanlagen für die Mittelspannungsebene)", 2014, ew - Magazin für die Energiewirtschaft
[Qingmin2014] Qingmin, Li and Haoxi, Cong and Jinyuan, Xing and Bo, Qi and Chengrong, Li, "On-line Temperature Monitoring of the GIS Contacts Based on Infrared Sensing Technology", 2014, Journal of Electrical Engineering and Technology
[Rabie2013] M. Rabie and C. M. Franck,, "Predicting the Electric Strength of Proposed SF6 Replacement Gases by Means of Density Functional Theory,", 2013, 18th International Symposium on High-Voltage Equipment
[Ramli2008] M.H. Ramli, "Investigation of circuit breaker switching transients for shunt reactors and shunt capacitors", 2008, Queensland University of Technology
[Razi2014] Razi-Kazemi, A.A. and Vakilian, M. and Niayesh, K. and Lehtonen, M., "Circuit-Breaker Automated Failure Tracking Based on Coil Current Signature", 2014, IEEE Transactions on Power Delivery
[Renaudin2015] Thomas Renaudin and Wenyu Guo, "On-Site Non-Intrusive Testing Of Circuit Breakers", 2015, TechCon Asia Pacific
[Renforth2011] Renforth, L. and Seltzer-Grant, M. and MacKinlay, R. and Goodfellow, S. and Clark, D. and Shuttleworth, R., "Experiences from over 15 years of on-line partial discharge (OLPD) testing of in-service MV and HV cables, switchgear, transformers and rotating machines", 2011, Robotics Symposium, IEEE IX Latin American and IEEE Colombian Conference on Automatic Control and Industry Applications (LARC)
[Renz2007] Renz, R. and Gentsch, D. and Fink, H. and Slade, P. and Schlaug, M., "Vacuum Interrupters -Sealed for Life", 2007, 19th International conference on electricity distribution, CIRED
[Rogers2007] Rogers, Dale B., "Circuit Breaker Signature Analysis", 2007, Progress Energy Carolinas
[Rong2005] Mingzhe Rong and Xiaohua Wang and Wu Yang and Shenli Jia, "Mechanical condition recognition of medium-voltage vacuum circuit breaker based on mechanism dynamic features simulation and ANN", 2005, IEEE Transactions on Power Delivery
[Rudd2011] S. E. Rudd and V. M. Catterson and S. D. J. McArthur and C. Johnstone, "Circuit breaker prognostics using SF6 data", 2011, IEEE Power and Energy Society General Meeting
[Runde1992] M. Runde and T. Aurud and L. E. Lundgaard and G. E. Ottesen and K. Faugstad, "Acoustic diagnosis of high voltage circuit-breakers", 1992, IEEE Transactions on Power Delivery
NON-INTRUSIVE METHODS FOR CONDITION ASSESSMENT OF DISTRIBUTION AND TRANSMISSION SWITCHGEAR
167
[Runde1996] Runde, M. and Ottesen, G.E. and Skyberg, B. and Ohlen, M., "Vibration analysis for diagnostic testing of circuit-breakers", 1996, IEEE Transactions on Power Delivery
[Runde1999] M. Runde and B. Skyberg and M. Öhlén, "Vibration Analysis for Periodic Diagnostic Testing of Circuit-Breakers", 1999, High Voltage Engineering Symposium
[Runde2004] Runde, M. and Lillevik, O. and Larsen, V. and Skyberg, B. and Mjelve, A. and Tonstad, A., "Condition assessment of contacts in gas-insulated substations", 2004, IEEE Transactions on Power Delivery
[Rusek2008] Bartosz Rusek and Gerd Balzer and Martin Holstein and Max-Steffen Claessens, "Timings of high voltage circuit-breaker ", 2008, Electric Power Systems Research
[Saeli2012] Saeli, C. and Serpellini, F. and Gatti, C. and Bianco, A. and De Natale, G., "How to guarantee continuity of supply and reliability in the smart grids? diagnostic systems in the MV network components, circuit breakers and switch disconnectors", 2012, Petroleum and Chemical Industry Conference Europe Conference Proceedings (PCIC EUROPE)
[Safou2014] Safou, Fadi, "Development of analysis method for condition control of disconnecting circuit breakers on transmission level (in Swedish)", 2014, KTH Royal Institute of Technology
[Sandoval2004] Ramón Sandoval and Jean León Eternod, "Evaluation of Methods for Breaker-Flashover Protection", 2004, 31st Annual Western Protective Relay Conference, Spokane, Washington, US
[Schellekens2014] H. Schellekens, "Continuous vacuum monitoring in vacuum circuit breakers", 2014, International Symposium on Discharges and Electrical Insulation in Vacuum (ISDEIV)
[Schellekens2015] Schellekens, Hans and Preve, Christophe and Ferraro, Venanzio and Bonnard, François, "Continuous vacuum monitor for air insulated vacuum circuit breakers", 2015, 23rd International Conference on Electricity Distribution, Lyon
[Secic2013] Secic, Adnan and Milovic, Budo, "Dynamic Resistance Measurement method applying high DC current", 2013, Amforum
[Sengenuity2013] Sengenuity, "Wireless SAW Temperature Sensing System for Switchgear", 2013, Product Brochure
[Sheng2005] Su Sheng and Li, K. K. and Chan, W.L. and Zeng, X.J. and Duan Xianzhong, "A practical circuit breaker monitoring system", 2005, Industry Applications Conference, Fourtieth IAS Annual Meeting
[Shi2002] Zongqian Shi and Yongpeng Meng and Wu Yang and Dan Ding and Shenli Jia and Mingzhe Rong and Yonghong Cheng, "On-line condition monitoring system of medium-voltage switchgear", 2002, Transmission and Distribution Conference and Exhibition: Asia Pacific. IEEE/PES
[Shimmin1990] D W Shimmin and G R Jones and S M G Ali, "Transient pressure variations in SF6 puffer circuit breakers", 1990, Journal of Physics D: Applied Physics
[Slade2007] Slade, P G, "The vacuum interrupter: theory, design, and application", 2007, CRC press
[Slade2007a] Slade, Paul G. and Li, Wang-pei and Mayo, Stephen and Smith, R. Kirkland and Taylor, Erik D., "Vacuum interrupter, high reliability component of distribution switches, circuit breakers and contactors", 2007, Journal of Zhejiang University-SCIENCE A
[Sodha2012] Sodha, N.S. and Singh Sanjeev and Victor, S. and Tyagi, R.K., "Condition Assessment of EHV class Circuit Breakers using Dynamic Contact Resistance Measurement Technique", 2012, CIGRE Session
[Sostaric2011] Šoštarić, D. and Horvat, G. and Nikolovski, S, "A sulphur heaxafluoride gas leakage detection system using wireless sensor networks", 2011, Journal of Energy Technology
[Speed2000] Speed, Wesley R., "Circuit Breaker Operator Signature Analysis", 2000, TXU Electric
[Srisupha2011] Srisupha, M. and Hille, C., "Diagnostic of Circuit Breaker Interrupter by Means of a Frequency Response Analysis", 2011, Electrical Power Systems High Voltage Engineering and Insulation
[Stadelmeier2006] Stadelmeier, L., "X-Ray Inspection of SF6 Gas Circuit Breakers", 2006, 73rd Annual International Doble Client Conference
NON-INTRUSIVE METHODS FOR CONDITION ASSESSMENT OF DISTRIBUTION AND TRANSMISSION SWITCHGEAR
168
[Stanisic2010] Z. Stanisic and R. Neimanis, "A new ultra lightweight method for Static and dynamic resistance measurements", 2010, IEEE International Symposium on Electrical Insulation (ISEI)
[Stanisic2011] Stanisic, Z., "Method for static and dynamic resistance measurements of HV circuit breaker", 2011, 2nd IEEE PES International Conference and Exhibition on Innovative Smart Grid Technologies (ISGT Europe)
[Strachan2007] Strachan, S.M. and McArthur, S.D.J. and Stephen, B. and Mcdonald, James R and Campbell, Angus, "Providing Decision Support for the Condition-Based Maintenance of Circuit Breakers Through Data Mining of Trip Coil Current Signatures", 2007, IEEE Transactions on Power Delivery
[Suesut2011] Suesut, T. and Nunak, N. and Nunak, T. and Rotrugsa, A. and Tuppadung, Y., "Emissivity measurements on material and equipment in electrical distribution system", 2011, 11th International Conference on Control, Automation and Systems (ICCAS)
[Sugimoto2002] Sugimoto, T. and Watanabe, T. and Iwamoto, I., "New maintenance method of circuit breaker driving by DC solenoid making use of the closing current waveform measurement", 2002, Transmission and Distribution Conference and Exhibition: Asia Pacific. IEEE/PES
[Svancar2015] M. Švancar and L. Kočiš and P. Spurný, "AROPO - Complex diagnostic system based on transients analysis", 2015, International Conference on Power Systems Transients, Cavtat, Croatia
[Svk_TR01_08E] Enhet, Verksamhetsområde, "Circuit-breakers 245 -- 420 {kV} ", 2015, Swedish National Grid
[Sweetser2002] Sweetser, C. and Bergman, W.J. and Montillet, G. and Mannarino, A. and O'Donnell, E. J. and Long, R.W. and Nelson, J. and Gavazza, R. and Jackson, R., "Strategies for selecting monitoring of circuit breakers", 2002, IEEE Transactions on Power Delivery
[Sweetser2016] Charles Sweetser, "Understanding Testing and Diagnostic Challenges Associated with Magnetically-Actuated Vacuum Circuit Breakers", 2016, OMICRON electronics Corp. USA
[Tang2006] Z. Tang and Y. Zou, "Condition Monitoring System for Circuit Breaker Based on Substation Automation System", 2006, Proceedings of the 41st International Universities Power Engineering Conference (UPEC)
[Taylor2014] E. D. Taylor and A. Lawall and D. Gentsch, "Long-term vacuum integrity of vacuum interrupters", 2014, International Symposium on Discharges and Electrical Insulation in Vacuum (ISDEIV)
[TECHIMP2013] "TECHIMP MV Switchgears Case Studies - PD", 2013, TECHIMP Case Studies
[TJH2b2016] TJH2b Analytical Services Inc., "BOA Breaker Oil Analysis Oil Circuit Breaker Sample Data", 2016, form, check sheets
[Tsurimoto2008] Tsurimoto, T. and Yoshimura, M. and Muto, H. and Arioka, M., "Partial discharge monitoring system for cubicle type GIS", 2008, International Conference on Condition Monitoring and Diagnosis, CMD
[Ukil2013] Ukil, A. and Zlatanski, M. and Hochlehnert, M., "Monitoring of HV Generator Circuit Breaker Contact Ablation Based on Acoustic Emission", 2013, IEEE Transactions on Instrumentation and Measurement
[US2010259275A1] Wolfgang Grieshaber and Alain Fanget, "Device for detecting and locating electric discharges in fluid-insulated electrical equipment", 2007, US Patent US2010259275A1
[US6236548] Jean Marmonier, "Method of discriminating between an internal arc and a circuit-breaking arc in a medium or high voltage circuit breaker", 1998, US Patent US6236548
[US7302854] Mosely, R.C. and Randazzo, S.J. and Sollazzi, B. and John Egermeier, deceased, "Method and apparatus for the detection of high pressure conditions in a vacuum-type electrical device", 2007, US Patent US7302854
[US7383733] Mosely, R.C. and Randazzo, S.J. and Lei, L. and Bestel, E.F., "Method and apparatus for the sonic detection of high pressure conditions in a vacuum switching device", 2008, US Patent US7383733
[US7802480] Mosely, R.C. and Randazzo, S.J., "Method and apparatus for the detection of high pressure conditions in a vacuum-type electrical device", 2010, US Patent US7802480
NON-INTRUSIVE METHODS FOR CONDITION ASSESSMENT OF DISTRIBUTION AND TRANSMISSION SWITCHGEAR
169
[Uzelac2015] Nenad Uzelac and Ana Milosevic and Srdjan Milosavljevic, "New Method For In-Service Partial Discharge Measurement On Solid Dielectric Switch", 2015, 23rd International Conference on Electricity Distribution, CIRED, Lyon,
[Vandamme1999] L.K.J. Vandamme and M.G. Perichaud and E. Noguera and Y. Danto and U. Behner, "1/f Noise in conductive adhesive bonds under mechanical stress as a sensitive and fast diagnostic tool for reliability assessment", 1999, Microelectronics Reliability
[Vaughan2014] D. Vaughan, "Power Factor Testing Of SF6 Circuit Breakers Case Studies", 2014, 81st International Conference of Doble Clients
[Vlase2010] Vlase, S. and Duta, M. and Popescu, S. and Salceanu, C. and Dobrea, C. and Stefan, L., "Local monitoring system of the permissible temperature for the medium voltage metal-enclosed switchgear and control gear", 2010, 3rd International Symposium on Electrical and Electronics Engineering (ISEEE)
[Wang2007] Wang, X. and Rong, M. and Wu, Y. and Yang, F. and Jia, S., "Analyses of mechanical characteristics of vacuum circuit breaker during the closing process taking electrodynamic force into account", 2007, Science, Measurement Technology, IET
[Wang2009] Zhenyuan Wang, "Use vibration monitoring to identify circuit breakers for condition assessment", 2009, Power Systems Conference and Exposition, PSCE, IEEE PES
[Watanabe2008] Watanabe, T. and Sugimoto, T. and Imagawa, H. and Chan, K.K. and Chew, T.Y. and Qin, S.Z., "Practical application of diagnostic method of circuit breaker by measuring three current waveforms", 2008, International Conference on Condition Monitoring and Diagnosis, CMD
[Westerlund2013] Westerlund, Per and Hilber, Patrik and Lindquist, Tommie, "Condition monitoring of the disconnectors in the electric power transmission grid with temperature sensors", 2013, MPMM, Maintenance Performance Measurement and Management Conference, Lappeenranta, Finland
[Westerlund2014] Westerlund, P. and Hilber, P. and Lindquist, T., "A review of methods for condition monitoring, surveys and statistical analyses of disconnectors and circuit breakers", 2014, International Conference on Probabilistic Methods Applied to Power Systems (PMAPS)
[Westerlund2016] Westerlund, Per and Hilber, Patrik and Lindquist, Tommie, "Condition monitoring of disconnectors in the electric power transmission grid with temperature sensors", 2016, International Journal of Industrial and Systems Engineering, Vol. 23, No 1, 90-110 p.
[Westerlund2015] Westerlund, Per and Hilber, Patrik and Lindquist, Tommie, "Function test and condition test for disconnecting circuit breakers", 2015, CIGRE SC A3 and B3 Joint Colloquium, Nagoya, Japan
[Wetzeler2016] Wetzeler, S. and Nikolic, P. G. and Schnettler A., "Minimum-Intrusive Diagnostic System For SF6 High Voltage Self-blast Circuit Breaker Nozzles", 2016, Institute for High Voltage Technology, RWTH Aachen University (preliminary version )
[Weuffel2016] Weuffel, Michael and Krampert, Thomas and Rauscher, Christopher and Schnettler, Armin, "Measurement Procedure for Minimally Invasive Measurement of Switching Time in Gas-Insulated Switchgear (GIS) with Both Sides Grounded", 2016, High-Voltage Switchgear Symposium, GIS User Forum, Darmstadt, Germany
[White2012] J. R. White, "Safety maintenance requirements for power circuit breakers", 2012, Annual IEEE Pulp and Paper Industry Technical Conference (PPIC)
[Wika2017] WIKA Instrument, "Product review - Mechanical pressure measuring instruments", 2017, 9099590 01/2017 EN
[Wildermuth2014] Wildermuth, Stephan and Ahrend, Ulf and Hochlehnert, Moritz, "Infrared Temperature Measurement System for Condition Monitoring of High Voltage Generator Circuit Breakers", 2014, 17. ITG/GMA Symposium, Sensors and Measuring Systems
[Wildermuth2014a] Wildermuth, Stephan and Ahrend, Ulf and Hochlehnert, Moritz and Moritz Ulrich, Moritz, "Hot spot: A new infrared sensor measures temperature in generator circuit breakers", 2014, ABB Review
[Xiping2007] Huang Xiping and Wang Xin and Qiang Wen, "Development of On-line Monitoring Equipment of Medium Voltage Switchgear", 2007, 8th International Conference on Electronic Measurement and Instruments, ICEMI
[Yamamoto2011] Yamamoto, O. and Takuma, T. and Hamada, S. and Yamakawa, Y. and Yashima, M., "Applying a gas mixture containing c-C4F8 as an insulation medium", 2001, IEEE Transactions on Dielectrics and Electrical Insulation
NON-INTRUSIVE METHODS FOR CONDITION ASSESSMENT OF DISTRIBUTION AND TRANSMISSION SWITCHGEAR
170
[Yan2016] Yan, Fei and Jin, Dazhi and Chen, Lei and Wan, Xiang and Xiao, Kunxiang, "Non-Destructive Gas Pressure Measurement in Compact Sealed Electronic Vacuum Devices by Penning-type Discharge", 2016, XXVIIth Int. Symp. on Discharges and Electrical Insulation in Vacuum, Suzhou
[Yokomichi2016] Yokomichi, Shusei and Kozako, Masahiro and Hikita, Masayuki and Sato, Kazuhiro and Moriyama, Tomohiro and Urai, Hajime and Nakaoka, Takashi and Tsuchiya, Kenji, "Diagnostic Methods for Vacuum Leakage from Vacuum Interrupter by Partial Discharge Detection", 2016, XXVIIth Int. Symp. on Discharges and Electrical Insulation in Vacuum, Suzhou
[Yokomichi2016a] S. Yokomichi and M. Kozako and M. Hikita and K. Sato and T. Moriyama and H. Urai and T. Nakaoka and K. Tsuchiya, "Development of diagnostic methods for vacuum leakage from vacuum interrupter by partial discharge detection", 2016, 27th International Symposium on Discharges and Electrical Insulation in Vacuum (ISDEIV)
[Yoshida2016] Daisuke Yoshida and Takashi Ito and Yoshiyuki Tamura and Daigo Matsumoto and Haruhiko Koyama, "Sensor-based non-intrusive condition monitoring technologies for GIS/GCB", 2016, CIGRE-IEC Colloquium, Montréal, QC, Canada
[Zadeh2011] Koochack Zadeh, Masoumeh, "Field Emission Current Analysis for the Assessment of Dielectric and Switching Performance of Vacuum Interrupters", 2011, TU Darmstadt / FG Hochspannungstechnik
[Zheng2013] Yuhuang Zheng, "Algorithm of Change Points Detection for a Trip Coil", 2013, Applied Mechanics and Materials
[Zhong2010] C. Zhong and R. g. Yang and J. Cui, "Mathematical Morphology Method for Pre-processing of Coil Current Waveforms of Circuit Breakers", 2010, Asia-Pacific Power and Energy Engineering Conference
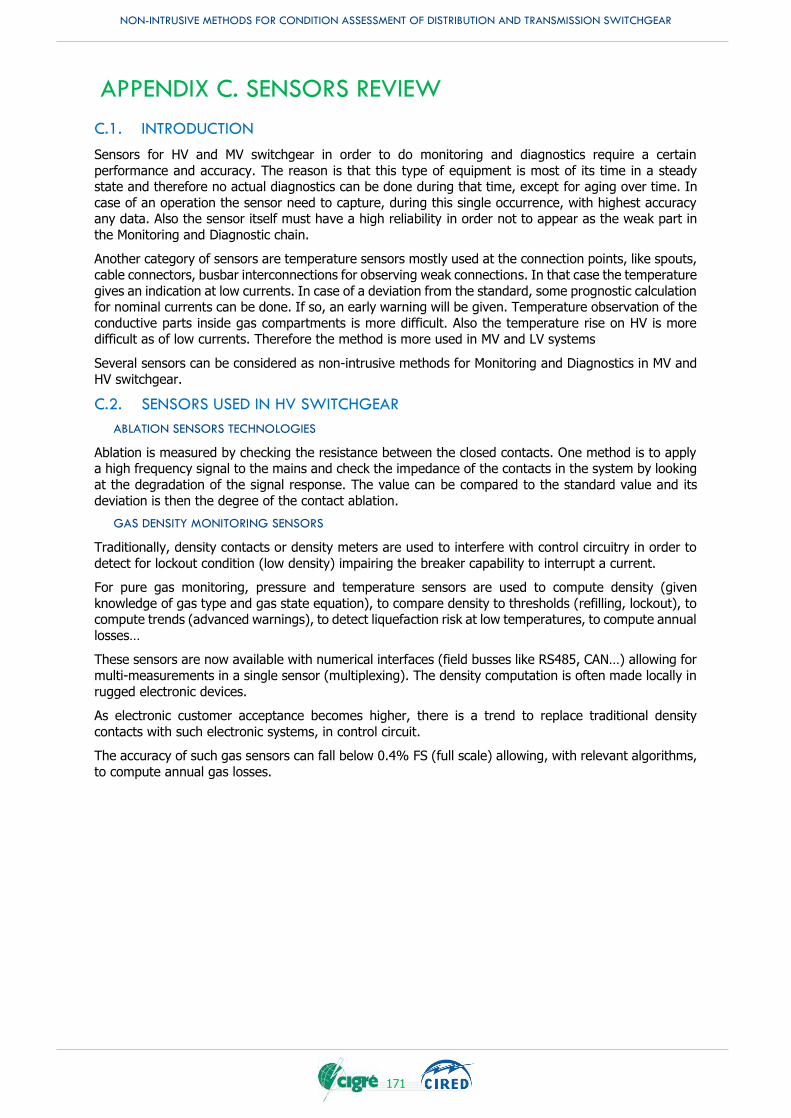
NON-INTRUSIVE METHODS FOR CONDITION ASSESSMENT OF DISTRIBUTION AND TRANSMISSION SWITCHGEAR
171
APPENDIX C. SENSORS REVIEW
C.1. INTRODUCTION
Sensors for HV and MV switchgear in order to do monitoring and diagnostics require a certain
performance and accuracy. The reason is that this type of equipment is most of its time in a steady state and therefore no actual diagnostics can be done during that time, except for aging over time. In
case of an operation the sensor need to capture, during this single occurrence, with highest accuracy any data. Also the sensor itself must have a high reliability in order not to appear as the weak part in
the Monitoring and Diagnostic chain.
Another category of sensors are temperature sensors mostly used at the connection points, like spouts,
cable connectors, busbar interconnections for observing weak connections. In that case the temperature
gives an indication at low currents. In case of a deviation from the standard, some prognostic calculation for nominal currents can be done. If so, an early warning will be given. Temperature observation of the
conductive parts inside gas compartments is more difficult. Also the temperature rise on HV is more difficult as of low currents. Therefore the method is more used in MV and LV systems
Several sensors can be considered as non-intrusive methods for Monitoring and Diagnostics in MV and
HV switchgear.
C.2. SENSORS USED IN HV SWITCHGEAR
ABLATION SENSORS TECHNOLOGIES
Ablation is measured by checking the resistance between the closed contacts. One method is to apply a high frequency signal to the mains and check the impedance of the contacts in the system by looking
at the degradation of the signal response. The value can be compared to the standard value and its
deviation is then the degree of the contact ablation.
GAS DENSITY MONITORING SENSORS
Traditionally, density contacts or density meters are used to interfere with control circuitry in order to
detect for lockout condition (low density) impairing the breaker capability to interrupt a current.
For pure gas monitoring, pressure and temperature sensors are used to compute density (given
knowledge of gas type and gas state equation), to compare density to thresholds (refilling, lockout), to compute trends (advanced warnings), to detect liquefaction risk at low temperatures, to compute annual
losses…
These sensors are now available with numerical interfaces (field busses like RS485, CAN…) allowing for
multi-measurements in a single sensor (multiplexing). The density computation is often made locally in
rugged electronic devices.
As electronic customer acceptance becomes higher, there is a trend to replace traditional density
contacts with such electronic systems, in control circuit.
The accuracy of such gas sensors can fall below 0.4% FS (full scale) allowing, with relevant algorithms,
to compute annual gas losses.
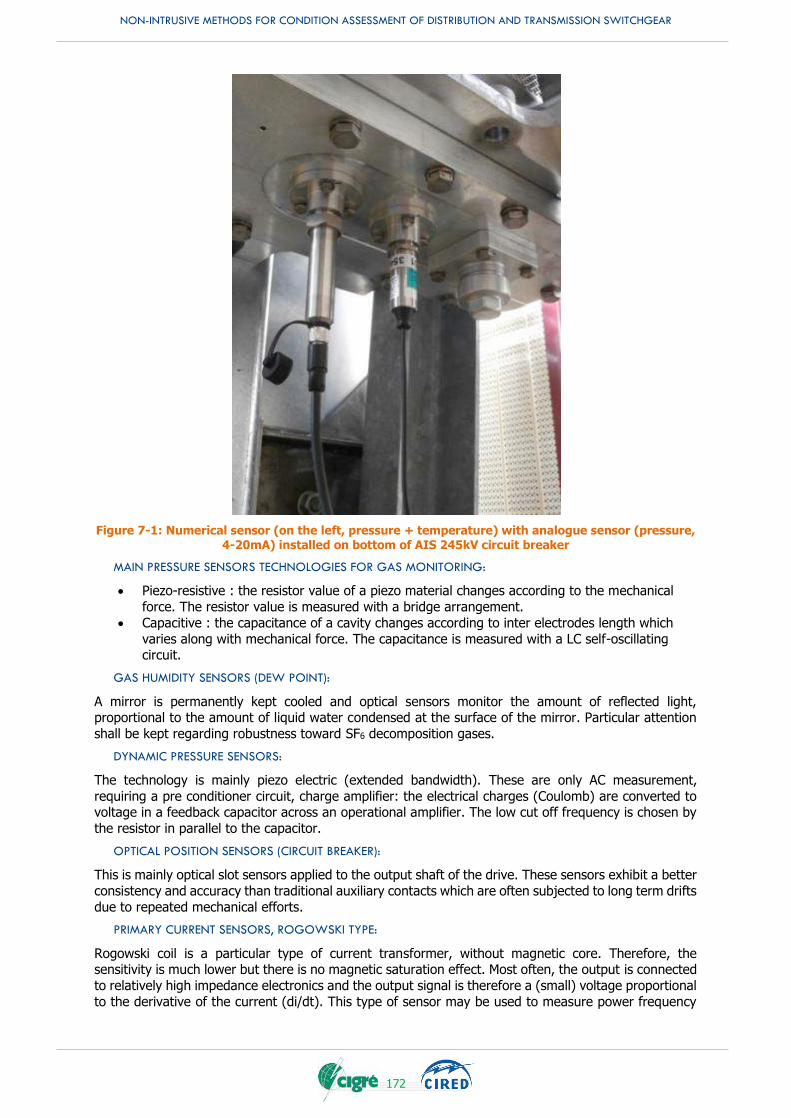
NON-INTRUSIVE METHODS FOR CONDITION ASSESSMENT OF DISTRIBUTION AND TRANSMISSION SWITCHGEAR
172
Figure 7-1: Numerical sensor (on the left, pressure + temperature) with analogue sensor (pressure, 4-20mA) installed on bottom of AIS 245kV circuit breaker
MAIN PRESSURE SENSORS TECHNOLOGIES FOR GAS MONITORING:
Piezo-resistive : the resistor value of a piezo material changes according to the mechanical
force. The resistor value is measured with a bridge arrangement.
Capacitive : the capacitance of a cavity changes according to inter electrodes length which
varies along with mechanical force. The capacitance is measured with a LC self-oscillating circuit.
GAS HUMIDITY SENSORS (DEW POINT):
A mirror is permanently kept cooled and optical sensors monitor the amount of reflected light, proportional to the amount of liquid water condensed at the surface of the mirror. Particular attention
shall be kept regarding robustness toward SF6 decomposition gases.
DYNAMIC PRESSURE SENSORS:
The technology is mainly piezo electric (extended bandwidth). These are only AC measurement,
requiring a pre conditioner circuit, charge amplifier: the electrical charges (Coulomb) are converted to voltage in a feedback capacitor across an operational amplifier. The low cut off frequency is chosen by
the resistor in parallel to the capacitor.
OPTICAL POSITION SENSORS (CIRCUIT BREAKER):
This is mainly optical slot sensors applied to the output shaft of the drive. These sensors exhibit a better
consistency and accuracy than traditional auxiliary contacts which are often subjected to long term drifts
due to repeated mechanical efforts.
PRIMARY CURRENT SENSORS, ROGOWSKI TYPE:
Rogowski coil is a particular type of current transformer, without magnetic core. Therefore, the sensitivity is much lower but there is no magnetic saturation effect. Most often, the output is connected
to relatively high impedance electronics and the output signal is therefore a (small) voltage proportional
to the derivative of the current (di/dt). This type of sensor may be used to measure power frequency
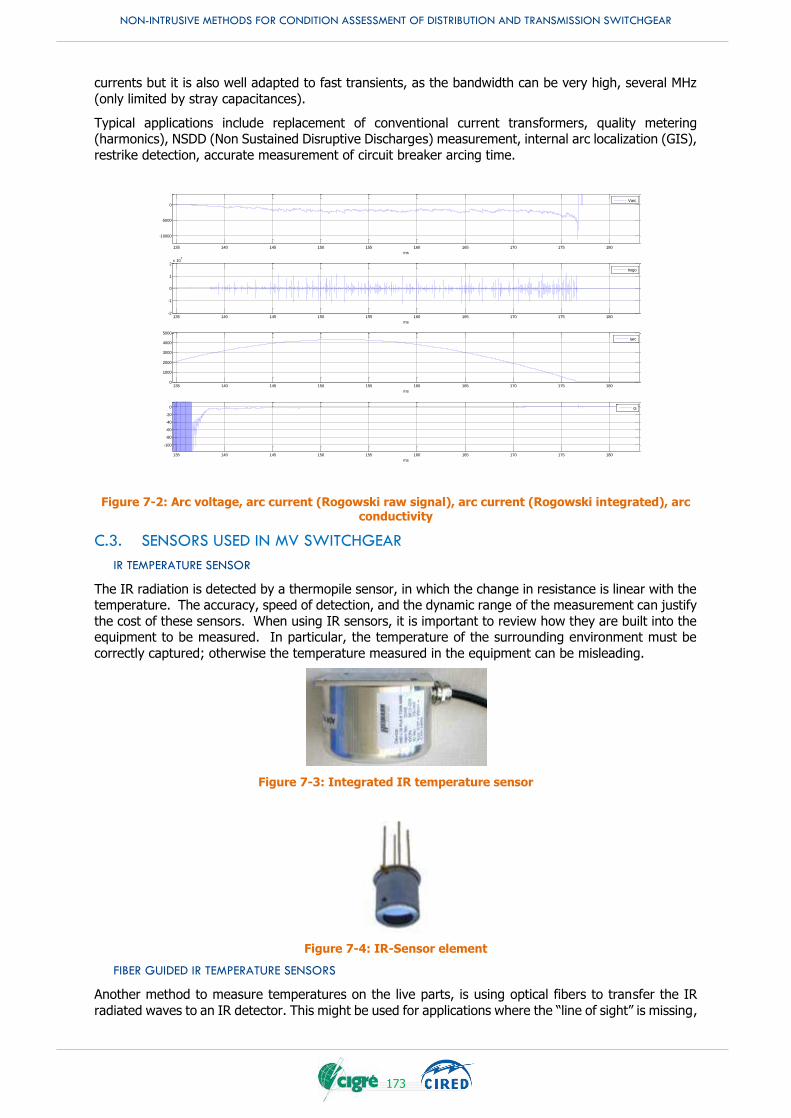
NON-INTRUSIVE METHODS FOR CONDITION ASSESSMENT OF DISTRIBUTION AND TRANSMISSION SWITCHGEAR
173
currents but it is also well adapted to fast transients, as the bandwidth can be very high, several MHz
(only limited by stray capacitances).
Typical applications include replacement of conventional current transformers, quality metering (harmonics), NSDD (Non Sustained Disruptive Discharges) measurement, internal arc localization (GIS),
restrike detection, accurate measurement of circuit breaker arcing time.
Figure 7-2: Arc voltage, arc current (Rogowski raw signal), arc current (Rogowski integrated), arc conductivity
C.3. SENSORS USED IN MV SWITCHGEAR
IR TEMPERATURE SENSOR
The IR radiation is detected by a thermopile sensor, in which the change in resistance is linear with the temperature. The accuracy, speed of detection, and the dynamic range of the measurement can justify
the cost of these sensors. When using IR sensors, it is important to review how they are built into the equipment to be measured. In particular, the temperature of the surrounding environment must be
correctly captured; otherwise the temperature measured in the equipment can be misleading.
Figure 7-3: Integrated IR temperature sensor
Figure 7-4: IR-Sensor element
FIBER GUIDED IR TEMPERATURE SENSORS
Another method to measure temperatures on the live parts, is using optical fibers to transfer the IR
radiated waves to an IR detector. This might be used for applications where the “line of sight” is missing,
135 140 145 150 155 160 165 170 175 180
-10000
-5000
0
ms
Varc
135 140 145 150 155 160 165 170 175 180-2
-1
0
1
2x 10
7
ms
Irogo
135 140 145 150 155 160 165 170 175 1800
1000
2000
3000
4000
5000
ms
Iarc
135 140 145 150 155 160 165 170 175 180
-100
-80
-60
-40
-20
0
ms
G
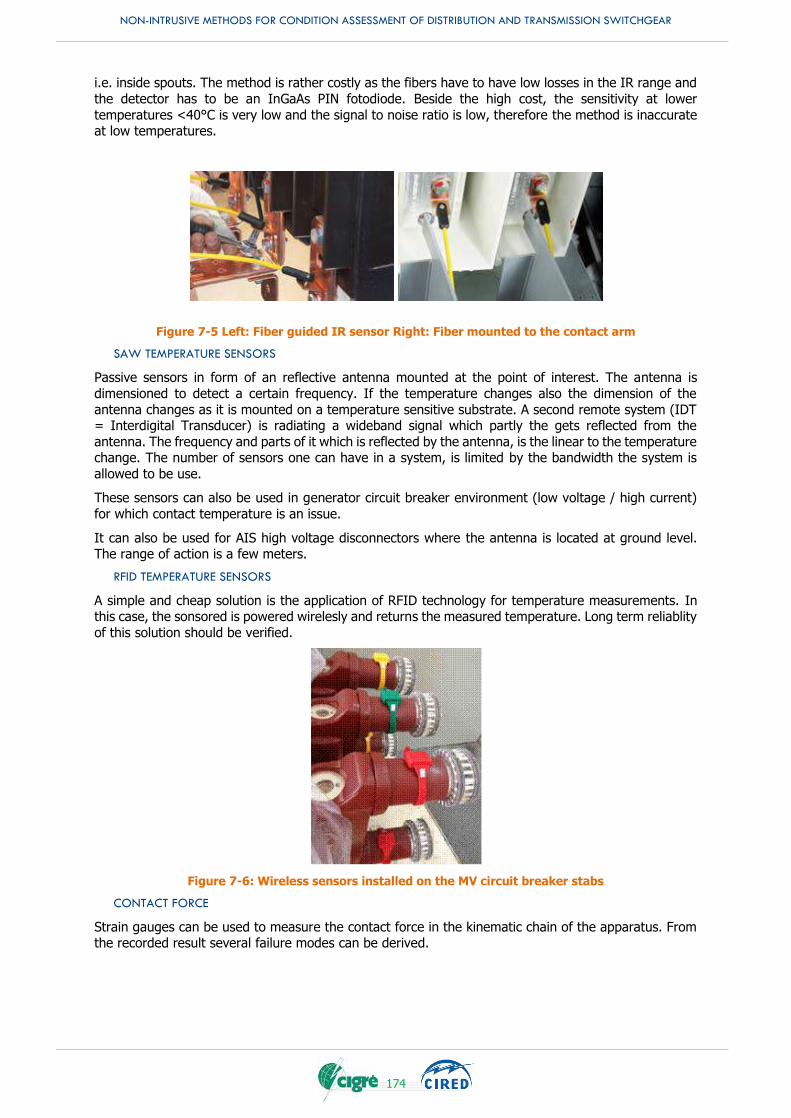
NON-INTRUSIVE METHODS FOR CONDITION ASSESSMENT OF DISTRIBUTION AND TRANSMISSION SWITCHGEAR
174
i.e. inside spouts. The method is rather costly as the fibers have to have low losses in the IR range and
the detector has to be an InGaAs PIN fotodiode. Beside the high cost, the sensitivity at lower
temperatures <40°C is very low and the signal to noise ratio is low, therefore the method is inaccurate at low temperatures.
Figure 7-5 Left: Fiber guided IR sensor Right: Fiber mounted to the contact arm
SAW TEMPERATURE SENSORS
Passive sensors in form of an reflective antenna mounted at the point of interest. The antenna is
dimensioned to detect a certain frequency. If the temperature changes also the dimension of the
antenna changes as it is mounted on a temperature sensitive substrate. A second remote system (IDT = Interdigital Transducer) is radiating a wideband signal which partly the gets reflected from the
antenna. The frequency and parts of it which is reflected by the antenna, is the linear to the temperature change. The number of sensors one can have in a system, is limited by the bandwidth the system is
allowed to be use.
These sensors can also be used in generator circuit breaker environment (low voltage / high current)
for which contact temperature is an issue.
It can also be used for AIS high voltage disconnectors where the antenna is located at ground level. The range of action is a few meters.
RFID TEMPERATURE SENSORS
A simple and cheap solution is the application of RFID technology for temperature measurements. In this case, the sonsored is powered wirelesly and returns the measured temperature. Long term reliablity
of this solution should be verified.
Figure 7-6: Wireless sensors installed on the MV circuit breaker stabs
CONTACT FORCE
Strain gauges can be used to measure the contact force in the kinematic chain of the apparatus. From the recorded result several failure modes can be derived.
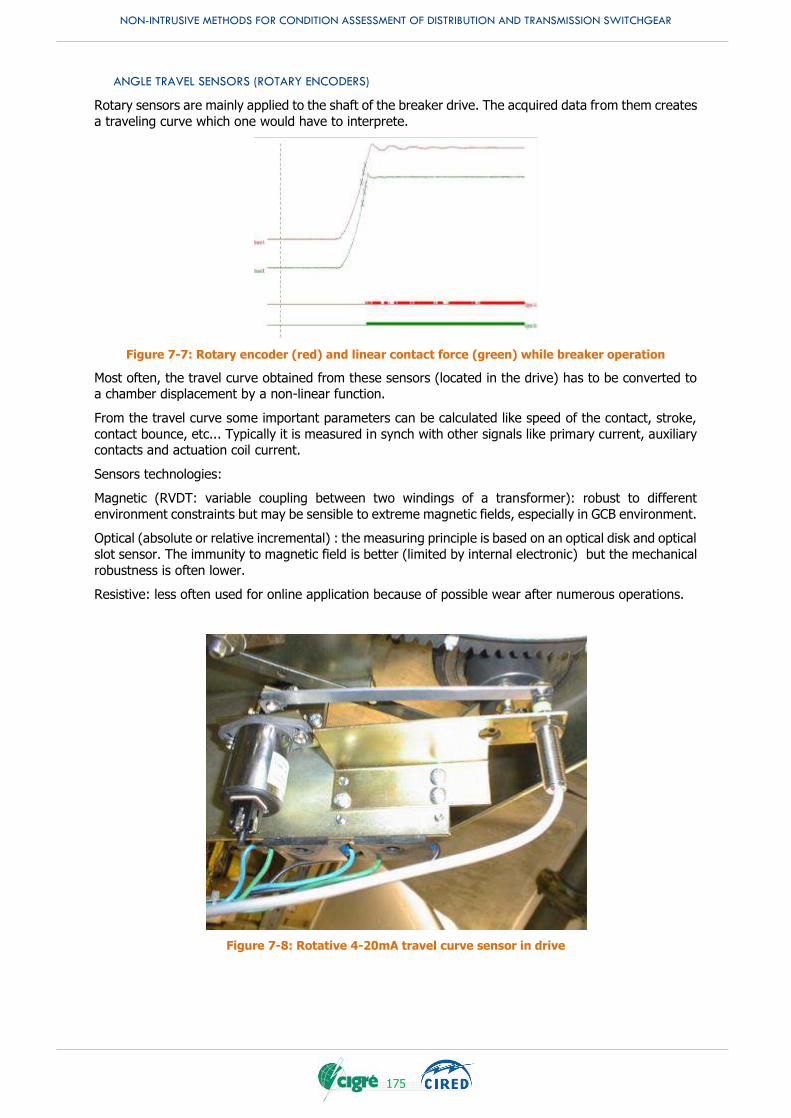
NON-INTRUSIVE METHODS FOR CONDITION ASSESSMENT OF DISTRIBUTION AND TRANSMISSION SWITCHGEAR
175
ANGLE TRAVEL SENSORS (ROTARY ENCODERS)
Rotary sensors are mainly applied to the shaft of the breaker drive. The acquired data from them creates
a traveling curve which one would have to interprete.
Figure 7-7: Rotary encoder (red) and linear contact force (green) while breaker operation
Most often, the travel curve obtained from these sensors (located in the drive) has to be converted to a chamber displacement by a non-linear function.
From the travel curve some important parameters can be calculated like speed of the contact, stroke,
contact bounce, etc... Typically it is measured in synch with other signals like primary current, auxiliary contacts and actuation coil current.
Sensors technologies:
Magnetic (RVDT: variable coupling between two windings of a transformer): robust to different
environment constraints but may be sensible to extreme magnetic fields, especially in GCB environment.
Optical (absolute or relative incremental) : the measuring principle is based on an optical disk and optical
slot sensor. The immunity to magnetic field is better (limited by internal electronic) but the mechanical
robustness is often lower.
Resistive: less often used for online application because of possible wear after numerous operations.
Figure 7-8: Rotative 4-20mA travel curve sensor in drive
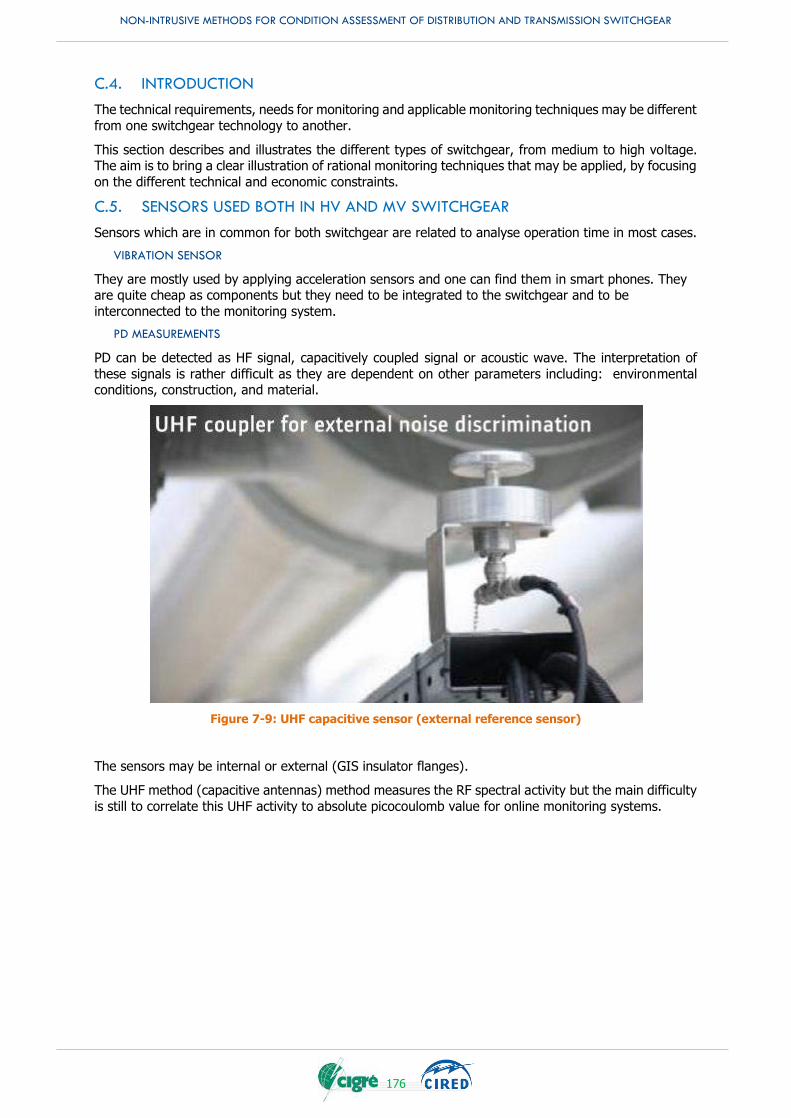
NON-INTRUSIVE METHODS FOR CONDITION ASSESSMENT OF DISTRIBUTION AND TRANSMISSION SWITCHGEAR
176
C.4. INTRODUCTION
The technical requirements, needs for monitoring and applicable monitoring techniques may be different
from one switchgear technology to another.
This section describes and illustrates the different types of switchgear, from medium to high voltage. The aim is to bring a clear illustration of rational monitoring techniques that may be applied, by focusing
on the different technical and economic constraints.
C.5. SENSORS USED BOTH IN HV AND MV SWITCHGEAR
Sensors which are in common for both switchgear are related to analyse operation time in most cases.
VIBRATION SENSOR
They are mostly used by applying acceleration sensors and one can find them in smart phones. They are quite cheap as components but they need to be integrated to the switchgear and to be
interconnected to the monitoring system.
PD MEASUREMENTS
PD can be detected as HF signal, capacitively coupled signal or acoustic wave. The interpretation of
these signals is rather difficult as they are dependent on other parameters including: environmental conditions, construction, and material.
Figure 7-9: UHF capacitive sensor (external reference sensor)
The sensors may be internal or external (GIS insulator flanges).
The UHF method (capacitive antennas) method measures the RF spectral activity but the main difficulty
is still to correlate this UHF activity to absolute picocoulomb value for online monitoring systems.
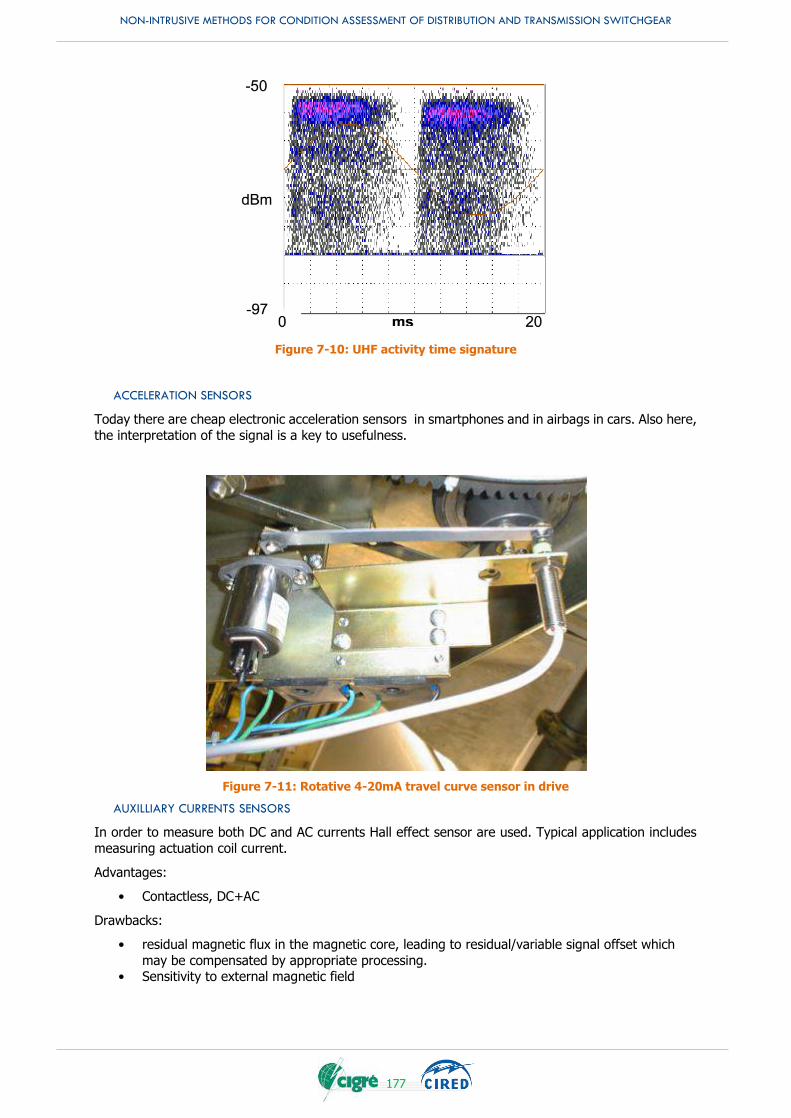
NON-INTRUSIVE METHODS FOR CONDITION ASSESSMENT OF DISTRIBUTION AND TRANSMISSION SWITCHGEAR
177
Figure 7-10: UHF activity time signature
ACCELERATION SENSORS
Today there are cheap electronic acceleration sensors in smartphones and in airbags in cars. Also here,
the interpretation of the signal is a key to usefulness.
Figure 7-11: Rotative 4-20mA travel curve sensor in drive
AUXILLIARY CURRENTS SENSORS
In order to measure both DC and AC currents Hall effect sensor are used. Typical application includes
measuring actuation coil current.
Advantages:
• Contactless, DC+AC
Drawbacks:
• residual magnetic flux in the magnetic core, leading to residual/variable signal offset which
may be compensated by appropriate processing. • Sensitivity to external magnetic field

NON-INTRUSIVE METHODS FOR CONDITION ASSESSMENT OF DISTRIBUTION AND TRANSMISSION SWITCHGEAR
178
Technology : a magnetic core with small gap in which is inserted a hall effect material. Two types of
sensor exist : closed or open loop arrangement. In closed loop (active) arrangement, an opposite
magnetic flux is applied and a regulation is operated in order to nullify the total flux at every time : “zero-flux” technology (more expensive).
C.6. SUMMARY
Sensors used in HV switchgear needs to have a higher performance in terms of isolation to the mains. That requires different methods also which then result in a higher cost for sensor and system.
From system cost view point, the sensor part is a bigger portion this is also because a comprehensive
system needs more than one sensor, with dedicated requirements described in this chapter, to generate useful information about the condition of the assets.
Technologically, sensors getting cheaper and also more integrated, as IoT is driving the market. In the field of application for HV and MV this advantage can only party get used due to high performance and
isolation requirements. In many cases optical or wireless technologies have to be used, which is challenging.
NON-INTRUSIVE METHODS FOR CONDITION ASSESSMENT OF DISTRIBUTION AND TRANSMISSION SWITCHGEAR
179
APPENDIX D. SWITCHGEAR REVIEW
D.1. HV SWITCHGEAR
GAS INSULATED SWITCHGEAR
All active parts are located at ground level and insulated from ground potential by the help of metallic enclosures. A specific insulation media (gas…) is used to guarantee sufficient insulation level (including
surge insulation level) between active parts and enclosure. The metallic enclosures are grounded by regularly spaced grounding links, ensuring for safe operations (“touch potential”).
The cost of such technology is much higher than others, and it is therefore used when land area is an
issue (cities…) or when environmental conditions are too harsh.
One of the main issues of such a switchgear type is the possibility of internal fault between active parts
and enclosure (internal arc), due to failure of insulation media (typically gas, SF6 or recent alternatives).
Therefore, the monitoring of insulation media is of key importance. Traditional approaches include gas
density monitoring and partial discharges monitoring.
The number of gas compartments can be rather high in a unique installation : as each of them has to be monitored, the total number of sensors can be high.
Also, as the quantity of insulation gas (SF6, global warming effect) is much higher in this technology than in other switchgear type, the regulatory constraints emphasize the need for annual losses
measurement.
Logically, the high cost level of the GIS technology has historically contributed to the development of
monitoring techniques: ratio between monitoring system (electronics + sensors) cost and switchgear
cost is low.
Most often, in a given substation, a unique manufacturer delivers all GIS parts (there is no standard
allowing to connect switchgear from different manufacturers). Therefore, monitoring systems are sometimes specific to the GIS manufacturer design, developed and delivered by the manufacturer, and
therefore not generic.
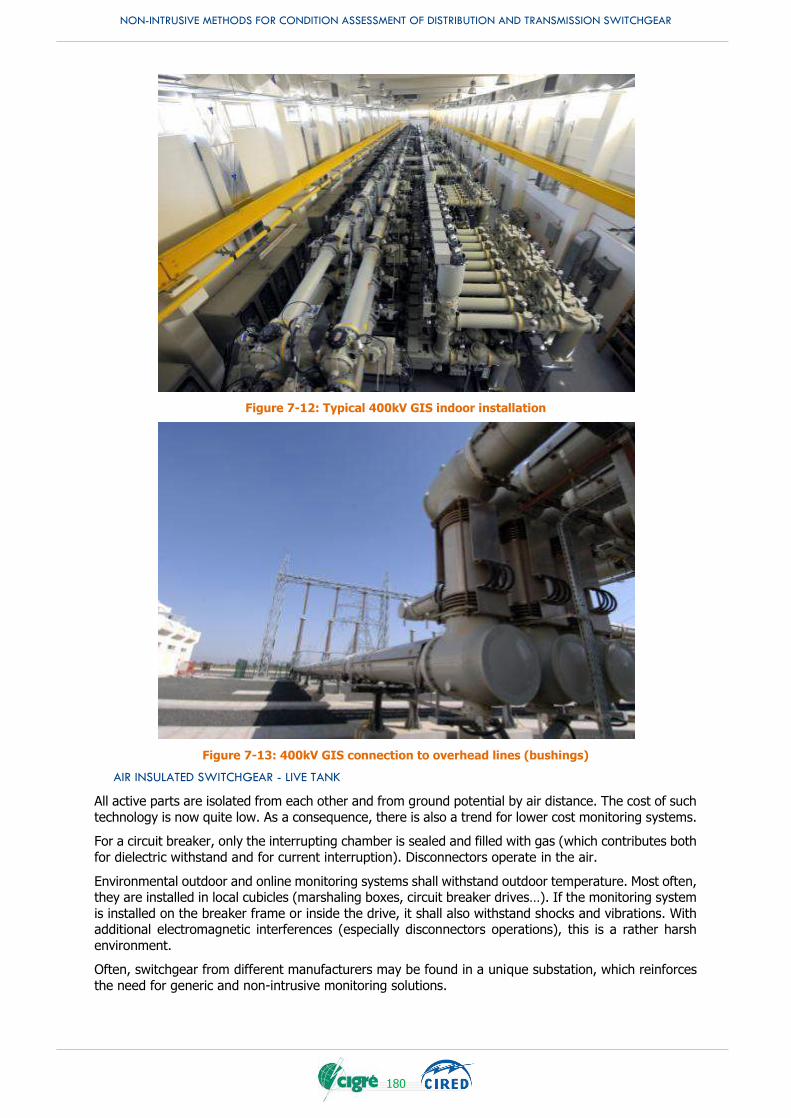
NON-INTRUSIVE METHODS FOR CONDITION ASSESSMENT OF DISTRIBUTION AND TRANSMISSION SWITCHGEAR
180
Figure 7-12: Typical 400kV GIS indoor installation
Figure 7-13: 400kV GIS connection to overhead lines (bushings)
AIR INSULATED SWITCHGEAR - LIVE TANK
All active parts are isolated from each other and from ground potential by air distance. The cost of such
technology is now quite low. As a consequence, there is also a trend for lower cost monitoring systems.
For a circuit breaker, only the interrupting chamber is sealed and filled with gas (which contributes both
for dielectric withstand and for current interruption). Disconnectors operate in the air.
Environmental outdoor and online monitoring systems shall withstand outdoor temperature. Most often, they are installed in local cubicles (marshaling boxes, circuit breaker drives…). If the monitoring system
is installed on the breaker frame or inside the drive, it shall also withstand shocks and vibrations. With additional electromagnetic interferences (especially disconnectors operations), this is a rather harsh
environment.
Often, switchgear from different manufacturers may be found in a unique substation, which reinforces
the need for generic and non-intrusive monitoring solutions.
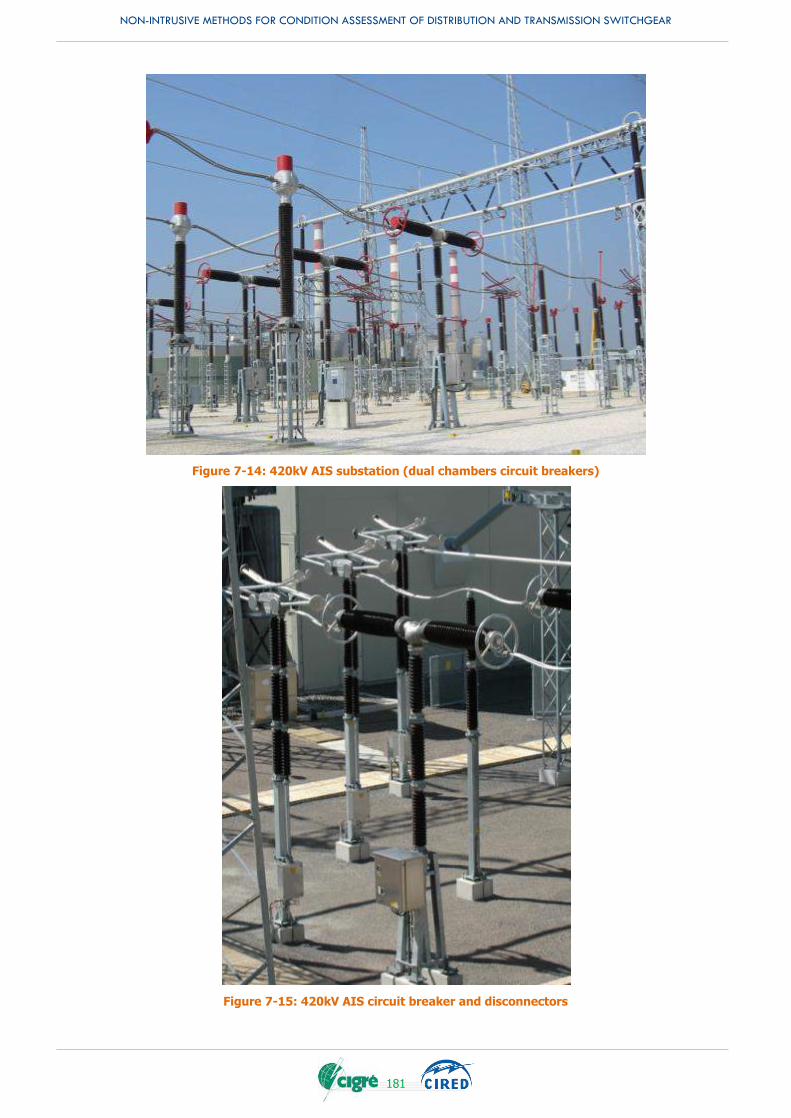
NON-INTRUSIVE METHODS FOR CONDITION ASSESSMENT OF DISTRIBUTION AND TRANSMISSION SWITCHGEAR
181
Figure 7-14: 420kV AIS substation (dual chambers circuit breakers)
Figure 7-15: 420kV AIS circuit breaker and disconnectors

NON-INTRUSIVE METHODS FOR CONDITION ASSESSMENT OF DISTRIBUTION AND TRANSMISSION SWITCHGEAR
182
Figure 7-16: 145kV AIS substation (single chamber circuit breaker, single drive)
AIR INSULATED SWITCHGEAR - DEAD TANK
In this particular case, the circuit breaker is located at ground level and is connected to active parts by the help of bushings. It is very similar to a GIS circuit breaker (grounded metallic enclosure).
The main advantage of such particular arrangement is to facilitate maintenance.
Figure 7-17: 550kV dead tank circuit breaker
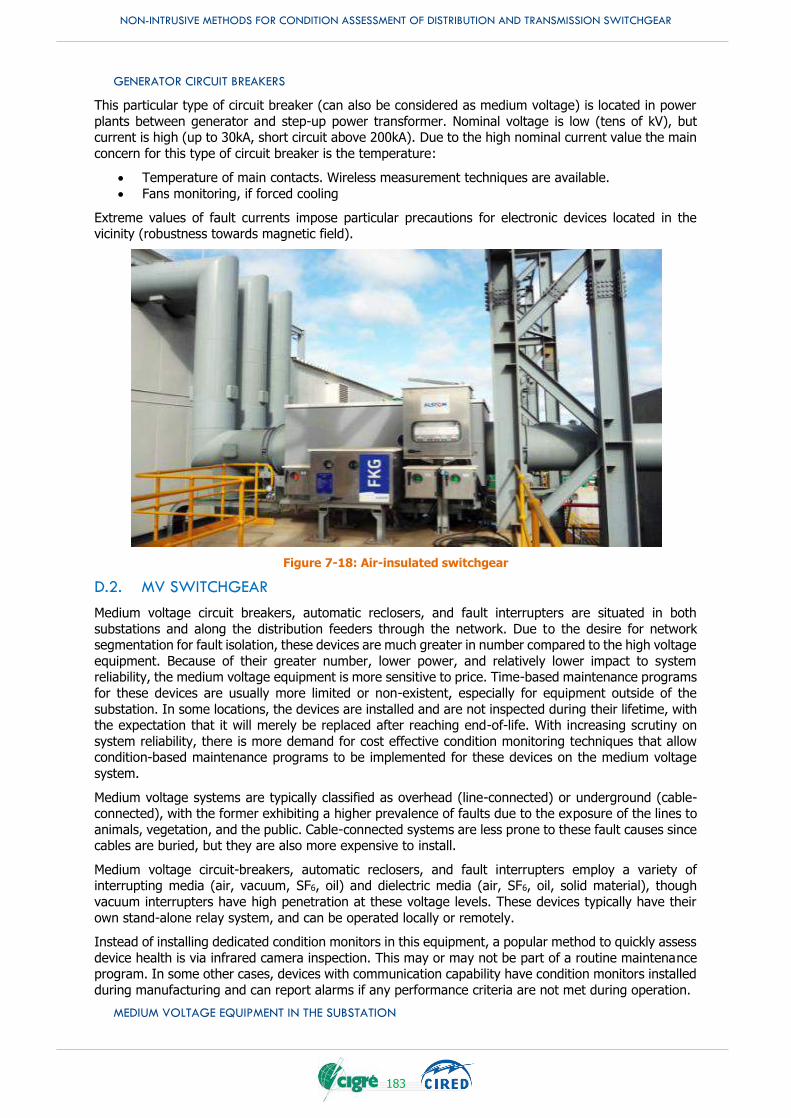
NON-INTRUSIVE METHODS FOR CONDITION ASSESSMENT OF DISTRIBUTION AND TRANSMISSION SWITCHGEAR
183
GENERATOR CIRCUIT BREAKERS
This particular type of circuit breaker (can also be considered as medium voltage) is located in power
plants between generator and step-up power transformer. Nominal voltage is low (tens of kV), but current is high (up to 30kA, short circuit above 200kA). Due to the high nominal current value the main
concern for this type of circuit breaker is the temperature:
Temperature of main contacts. Wireless measurement techniques are available.
Fans monitoring, if forced cooling
Extreme values of fault currents impose particular precautions for electronic devices located in the vicinity (robustness towards magnetic field).
Figure 7-18: Air-insulated switchgear
D.2. MV SWITCHGEAR
Medium voltage circuit breakers, automatic reclosers, and fault interrupters are situated in both
substations and along the distribution feeders through the network. Due to the desire for network segmentation for fault isolation, these devices are much greater in number compared to the high voltage
equipment. Because of their greater number, lower power, and relatively lower impact to system reliability, the medium voltage equipment is more sensitive to price. Time-based maintenance programs
for these devices are usually more limited or non-existent, especially for equipment outside of the
substation. In some locations, the devices are installed and are not inspected during their lifetime, with the expectation that it will merely be replaced after reaching end-of-life. With increasing scrutiny on
system reliability, there is more demand for cost effective condition monitoring techniques that allow condition-based maintenance programs to be implemented for these devices on the medium voltage
system.
Medium voltage systems are typically classified as overhead (line-connected) or underground (cable-connected), with the former exhibiting a higher prevalence of faults due to the exposure of the lines to
animals, vegetation, and the public. Cable-connected systems are less prone to these fault causes since cables are buried, but they are also more expensive to install.
Medium voltage circuit-breakers, automatic reclosers, and fault interrupters employ a variety of interrupting media (air, vacuum, SF6, oil) and dielectric media (air, SF6, oil, solid material), though
vacuum interrupters have high penetration at these voltage levels. These devices typically have their
own stand-alone relay system, and can be operated locally or remotely.
Instead of installing dedicated condition monitors in this equipment, a popular method to quickly assess
device health is via infrared camera inspection. This may or may not be part of a routine maintenance program. In some other cases, devices with communication capability have condition monitors installed
during manufacturing and can report alarms if any performance criteria are not met during operation.
MEDIUM VOLTAGE EQUIPMENT IN THE SUBSTATION
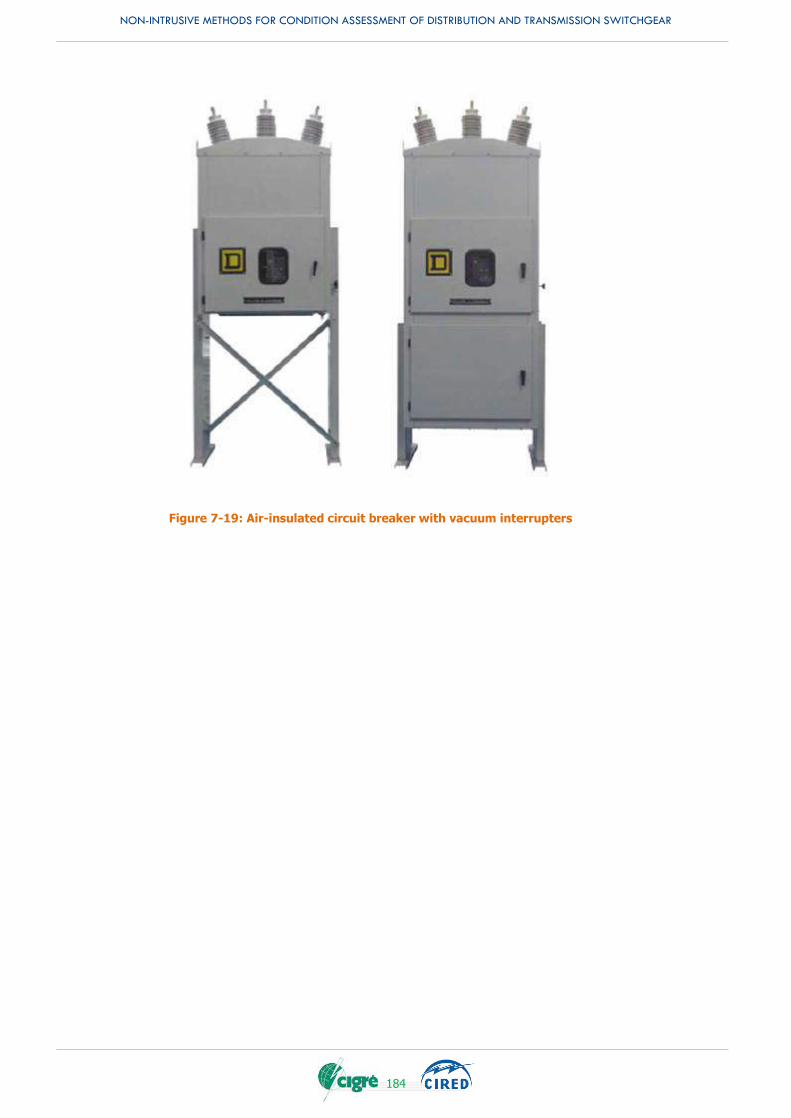
NON-INTRUSIVE METHODS FOR CONDITION ASSESSMENT OF DISTRIBUTION AND TRANSMISSION SWITCHGEAR
184
Figure 7-19: Air-insulated circuit breaker with vacuum interrupters
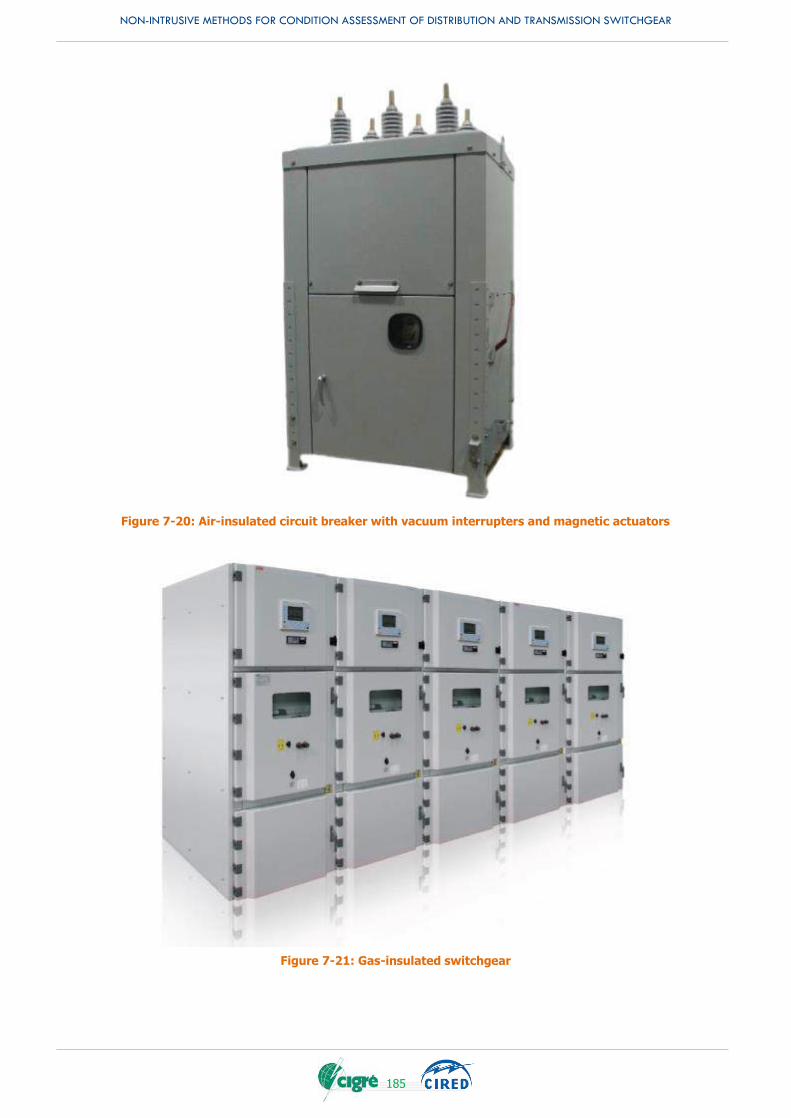
NON-INTRUSIVE METHODS FOR CONDITION ASSESSMENT OF DISTRIBUTION AND TRANSMISSION SWITCHGEAR
185
Figure 7-20: Air-insulated circuit breaker with vacuum interrupters and magnetic actuators
Figure 7-21: Gas-insulated switchgear
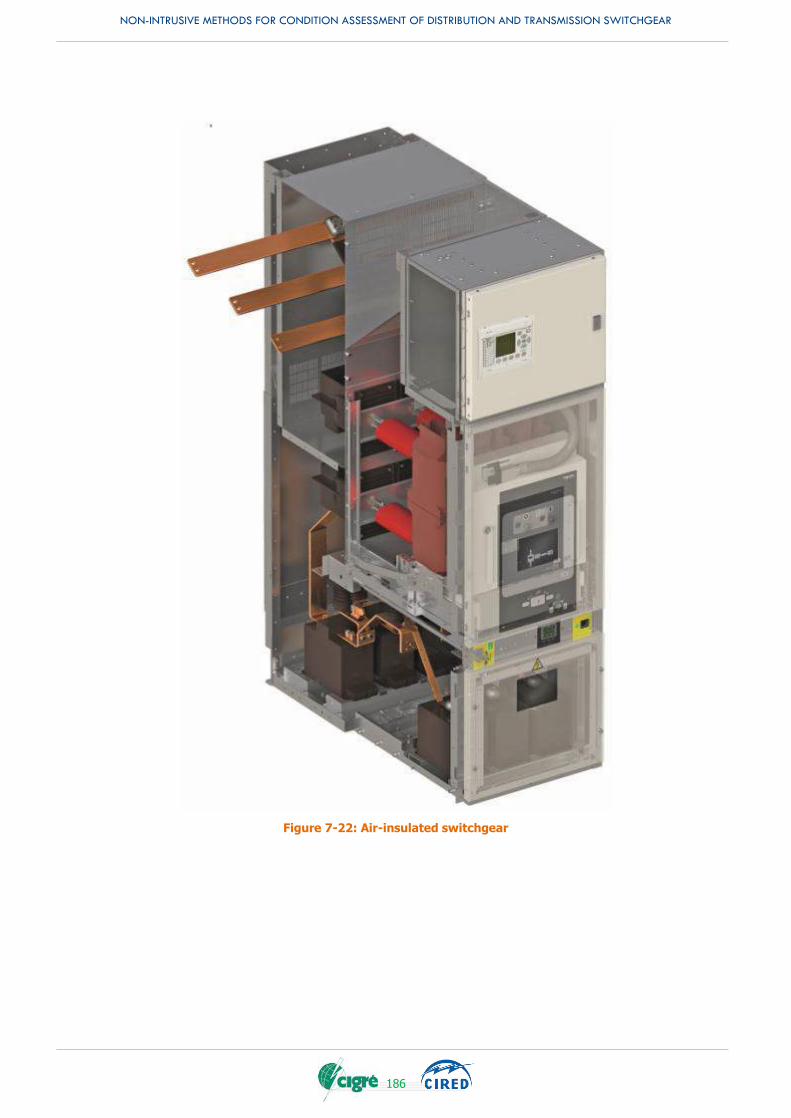
NON-INTRUSIVE METHODS FOR CONDITION ASSESSMENT OF DISTRIBUTION AND TRANSMISSION SWITCHGEAR
186
Figure 7-22: Air-insulated switchgear
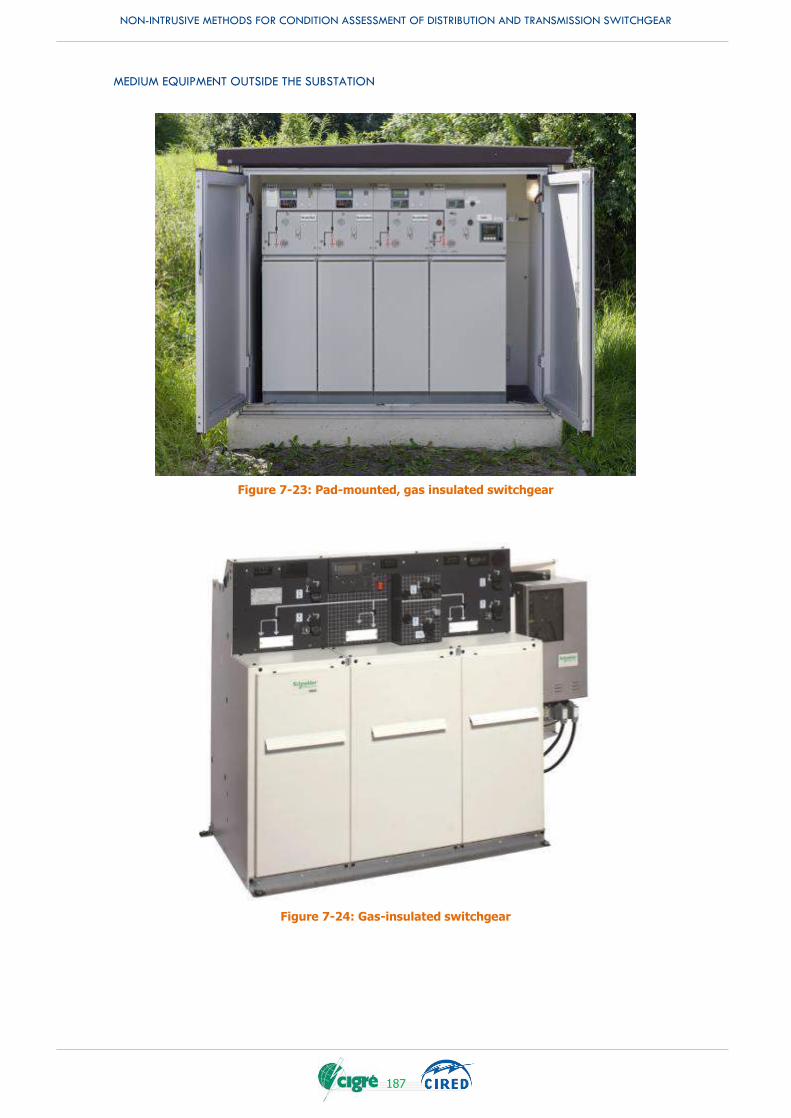
NON-INTRUSIVE METHODS FOR CONDITION ASSESSMENT OF DISTRIBUTION AND TRANSMISSION SWITCHGEAR
187
Figure 7-24: Gas-insulated switchgear
Figure 7-23: Pad-mounted, gas insulated switchgear
MEDIUM EQUIPMENT OUTSIDE THE SUBSTATION
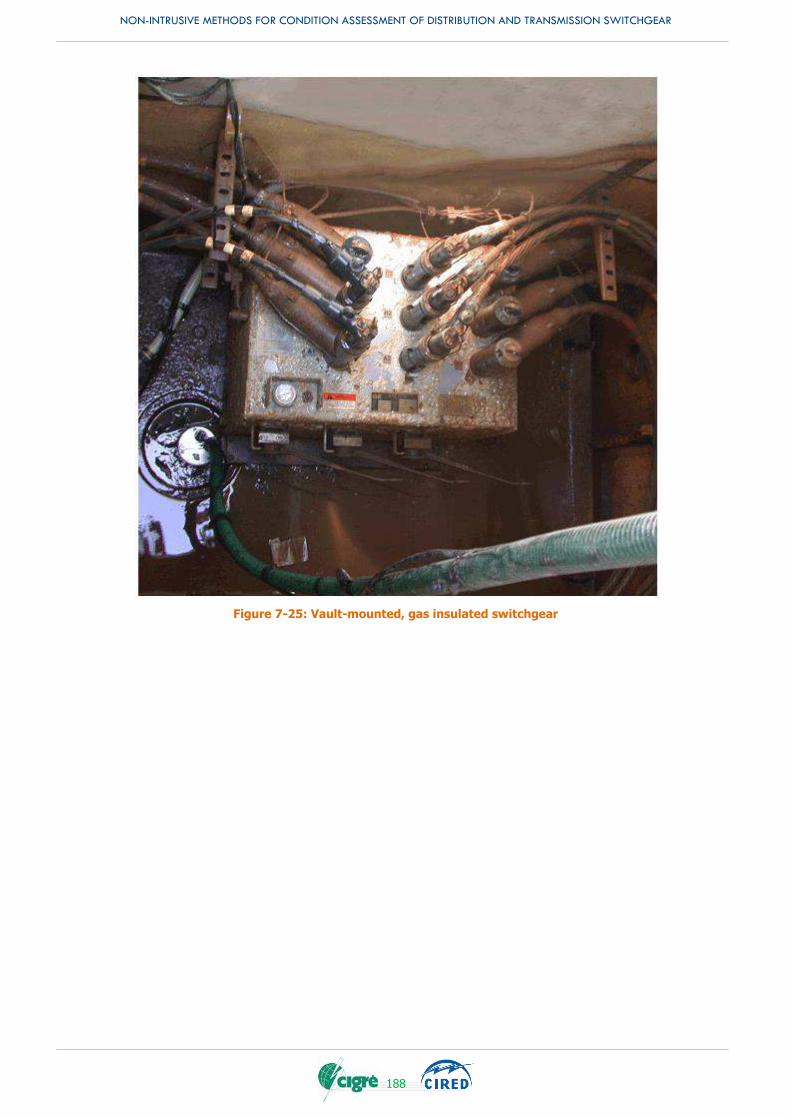
NON-INTRUSIVE METHODS FOR CONDITION ASSESSMENT OF DISTRIBUTION AND TRANSMISSION SWITCHGEAR
188
Figure 7-25: Vault-mounted, gas insulated switchgear
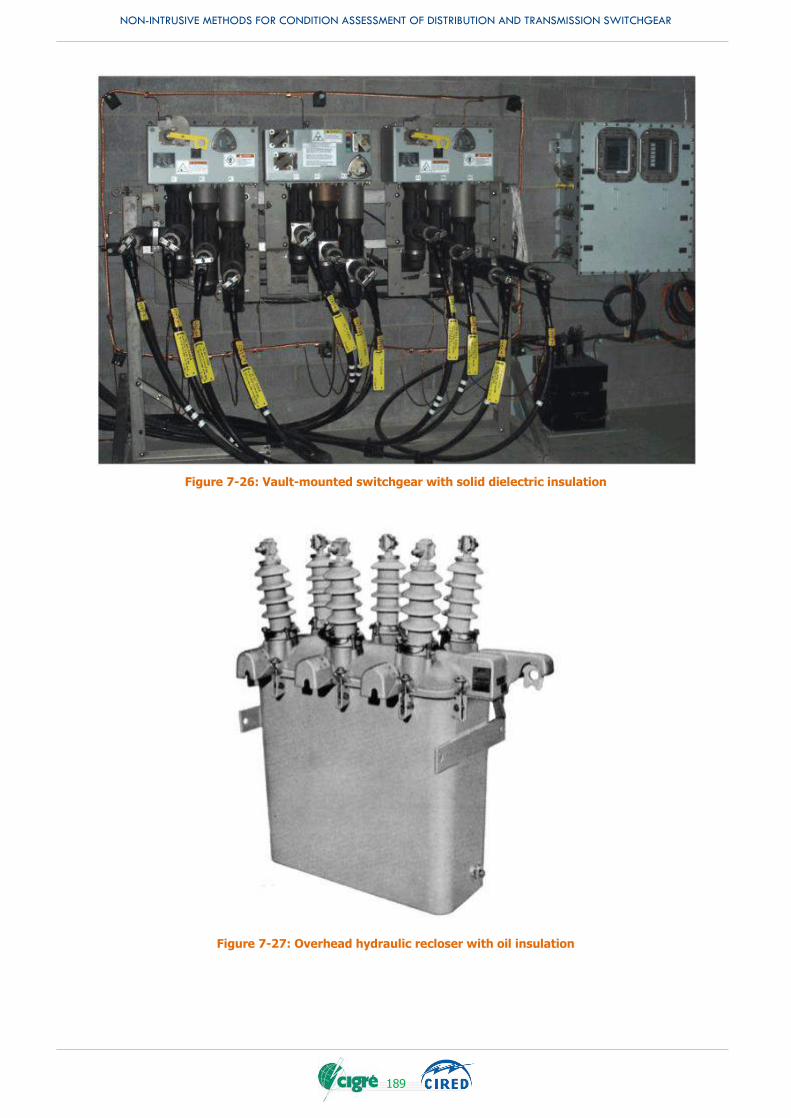
NON-INTRUSIVE METHODS FOR CONDITION ASSESSMENT OF DISTRIBUTION AND TRANSMISSION SWITCHGEAR
189
Figure 7-26: Vault-mounted switchgear with solid dielectric insulation
Figure 7-27: Overhead hydraulic recloser with oil insulation
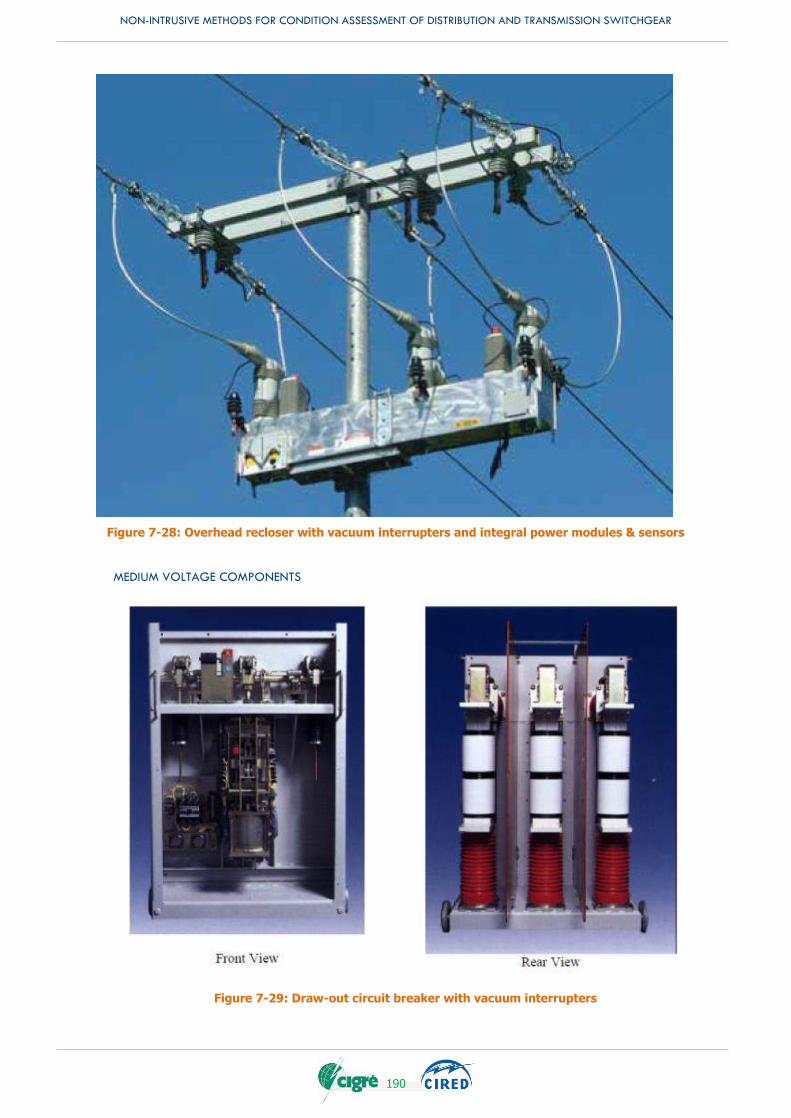
NON-INTRUSIVE METHODS FOR CONDITION ASSESSMENT OF DISTRIBUTION AND TRANSMISSION SWITCHGEAR
190
Figure 7-29: Draw-out circuit breaker with vacuum interrupters
Figure 7-28: Overhead recloser with vacuum interrupters and integral power modules & sensors
MEDIUM VOLTAGE COMPONENTS
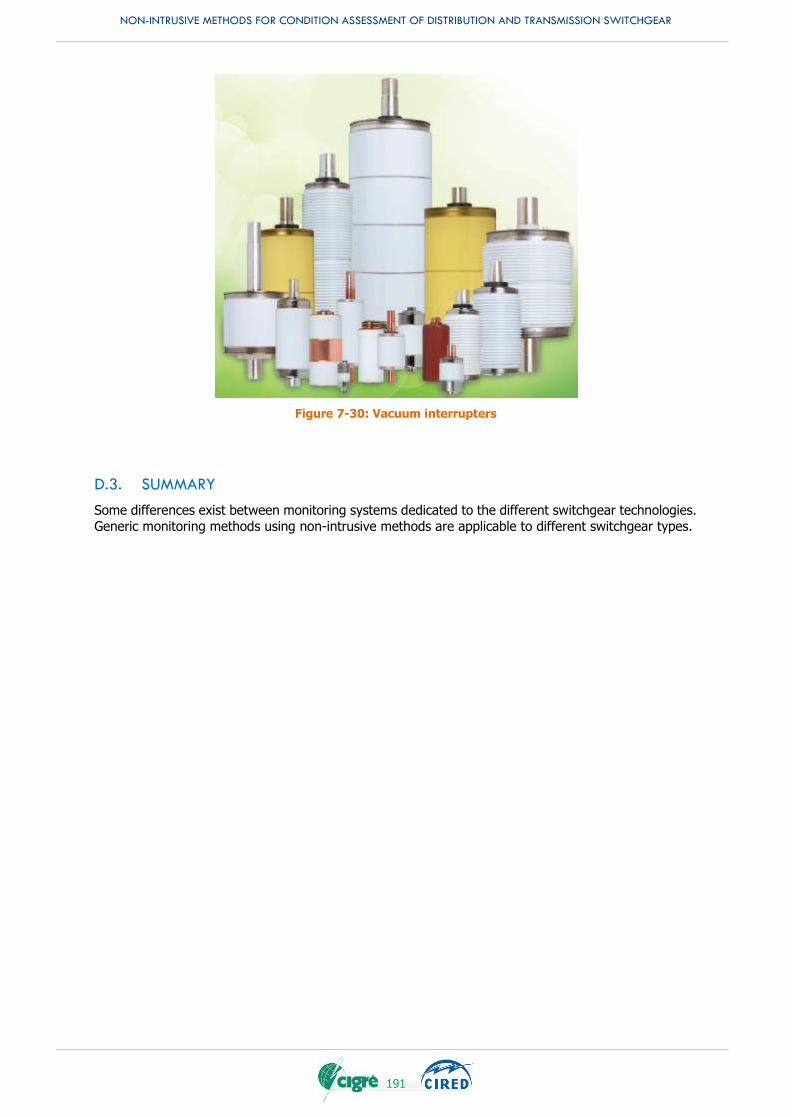
NON-INTRUSIVE METHODS FOR CONDITION ASSESSMENT OF DISTRIBUTION AND TRANSMISSION SWITCHGEAR
191
Figure 7-30: Vacuum interrupters
D.3. SUMMARY
Some differences exist between monitoring systems dedicated to the different switchgear technologies.
Generic monitoring methods using non-intrusive methods are applicable to different switchgear types.

NON-INTRUSIVE METHODS FOR CONDITION ASSESSMENT OF DISTRIBUTION AND TRANSMISSION SWITCHGEAR
192
NON-INTRUSIVE METHODS FOR CONDITION ASSESSMENT OF DISTRIBUTION AND TRANSMISSION SWITCHGEAR
193
APPENDIX E. SURVEY
E.1. INTRODUCTION
A survey was compiled and sent to Consultants, Industry, Maintenance Service providers, Manufacturers
and Utility representatives worldwide to determine current and future trends of non-intrusive diagnostics. Following detailed discussions within the WG it was decided to use a web survey tool to
capture the data from the various different representatives worldwide.
The survey was split in to three voltage levels: ≤38 kV, >38 kV to ≤170 kV and >170 kV. All respondents
were promised to be provided with the survey results when the working group had finished analyzing the information obtained.
The survey consisted of an introduction, company details and 3 sections. In Section 1 respondents were
provided with a list of circuit breaker types to select from. Following the selection of applicable circuit breaker types the respondents were asked to select from four types of maintenance activities and also
indicate the number of units their answers were based on for each type.
The maintenance activity types were:
Time based preventive maintenance (TBPM)
Condition based maintenance (CBM)
Reliability centered maintenance (RCM)
Corrective maintenance (CM)
Section 2 of the survey dealt with “Non-Intrusive Diagnostic Techniques”. Depending on the circuit
breaker types selected previously, the next set of questions related to diagnostic techniques applicable to that circuit breaker. Respondents were asked to answer on whether the technique they used was
“In-service” or “Off-service”, how frequently they monitored the data, how they responded to alarms
and also how mature the technique was within their company. Finally in this section each technique had to be rated on “ease of use” and “ease of analysis of data”.
The last section asked the respondents to rate the importance of “cost”, “performing tests on equipment remaining in-service” and “performing tests on equipment without dismantling” from their company’s
perspective.

NON-INTRUSIVE METHODS FOR CONDITION ASSESSMENT OF DISTRIBUTION AND TRANSMISSION SWITCHGEAR
194
E.2. SURVEY QUESTIONNAIRE
The questionnaire was compiled as follows:
Introduction
Company Name: _______________
Department Name:(Please select)
Distribution, Transmission, Engineering, Maintenance, Other
Company Profile: (Please select)
Utility, Manufacturer, Consultant, Maintenance Service, Industry, Other
Company Size: (Please select)
< 100 employees, 100 – 1000, 1000 – 5000, >5000
Country:_______________
Section 1
Please select voltage level:
≤38kV, >38kV to <170kV, >170kV
Which types of circuit breaker does your company operate? Number of units installed?
Type Number of units installed
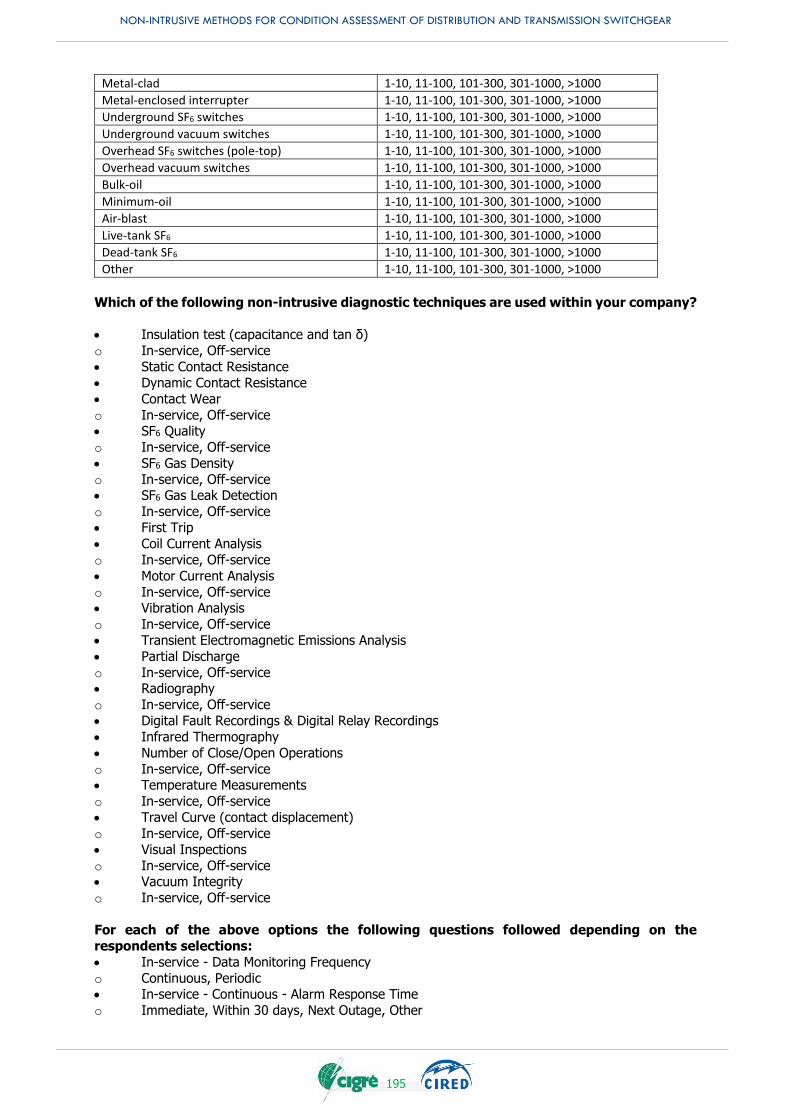
NON-INTRUSIVE METHODS FOR CONDITION ASSESSMENT OF DISTRIBUTION AND TRANSMISSION SWITCHGEAR
195
Metal-clad 1-10, 11-100, 101-300, 301-1000, >1000
Metal-enclosed interrupter 1-10, 11-100, 101-300, 301-1000, >1000
Underground SF6 switches 1-10, 11-100, 101-300, 301-1000, >1000
Underground vacuum switches 1-10, 11-100, 101-300, 301-1000, >1000
Overhead SF6 switches (pole-top) 1-10, 11-100, 101-300, 301-1000, >1000
Overhead vacuum switches 1-10, 11-100, 101-300, 301-1000, >1000
Bulk-oil 1-10, 11-100, 101-300, 301-1000, >1000
Minimum-oil 1-10, 11-100, 101-300, 301-1000, >1000
Air-blast 1-10, 11-100, 101-300, 301-1000, >1000
Live-tank SF6 1-10, 11-100, 101-300, 301-1000, >1000
Dead-tank SF6 1-10, 11-100, 101-300, 301-1000, >1000
Other 1-10, 11-100, 101-300, 301-1000, >1000
Which of the following non-intrusive diagnostic techniques are used within your company?
Insulation test (capacitance and tan δ)
o In-service, Off-service
Static Contact Resistance
Dynamic Contact Resistance
Contact Wear
o In-service, Off-service SF6 Quality
o In-service, Off-service
SF6 Gas Density
o In-service, Off-service SF6 Gas Leak Detection
o In-service, Off-service
First Trip
Coil Current Analysis
o In-service, Off-service
Motor Current Analysis
o In-service, Off-service Vibration Analysis
o In-service, Off-service
Transient Electromagnetic Emissions Analysis
Partial Discharge
o In-service, Off-service Radiography
o In-service, Off-service
Digital Fault Recordings & Digital Relay Recordings
Infrared Thermography
Number of Close/Open Operations
o In-service, Off-service Temperature Measurements
o In-service, Off-service
Travel Curve (contact displacement)
o In-service, Off-service
Visual Inspections
o In-service, Off-service Vacuum Integrity
o In-service, Off-service
For each of the above options the following questions followed depending on the
respondents selections:
In-service - Data Monitoring Frequency
o Continuous, Periodic In-service - Continuous - Alarm Response Time
o Immediate, Within 30 days, Next Outage, Other

NON-INTRUSIVE METHODS FOR CONDITION ASSESSMENT OF DISTRIBUTION AND TRANSMISSION SWITCHGEAR
196
In-service - Continuous - Degree of maturity
o Investigation, Pilot runs, Standard practice in field
In-service - Periodic - Data Monitoring Frequency
o Daily, Weekly, Monthly, Annual, Alarm based
In-service - Periodic – Maturity
o Investigation, Pilot runs, Standard practice in field Off-service frequency
o Investigation only, < 1 year, 1-5 years, 5-10 years, >10 years, Alarm based
Off-service - Degree of maturity
o Investigation, Pilot runs, Standard practice in field
What is the easiness of use of non-intrusive diagnostic techniques?
Insulation test (capacitance and tan δ) - In-service
o Easy, Neutral, Difficult Insulation test (capacitance and tan δ) - Off-service
o Easy, Neutral, Difficult
Static Contact Resistance
o Easy, Neutral, Difficult Dynamic Contact Resistance
o Easy, Neutral, Difficult
Contact Wear - In-service
o Easy, Neutral, Difficult
Contact Wear - Off-service
o Easy, Neutral, Difficult SF6 Gas Quality - In-service
o Easy, Neutral, Difficult
SF6 Gas Quality - Off-service
o Easy, Neutral, Difficult SF6 Gas Density - In-service
o Easy, Neutral, Difficult
SF6 Gas Density - Off-service
o Easy, Neutral, Difficult
SF6 Gas Leak Detection - In-service
o Easy, Neutral, Difficult SF6 Gas Leak Detection - Off-service
o Easy, Neutral, Difficult
First Trip
o Easy, Neutral, Difficult Coil Current Analysis - In-service
o Easy, Neutral, Difficult
Coil Current Analysis - Off-service
o Easy, Neutral, Difficult Motor Current Analysis - In-service
o Easy, Neutral, Difficult
Motor Current Analysis - Off-service
o Easy, Neutral, Difficult
Vibration Analysis - In-service
o Easy, Neutral, Difficult Vibration Analysis - Off-service
o Easy, Neutral, Difficult
Transient Electromagnetic Emissions Analysis
o Easy, Neutral, Difficult Partial Discharge - In-service
o Easy, Neutral, Difficult
Partial Discharge - Off-service
o Easy, Neutral, Difficult
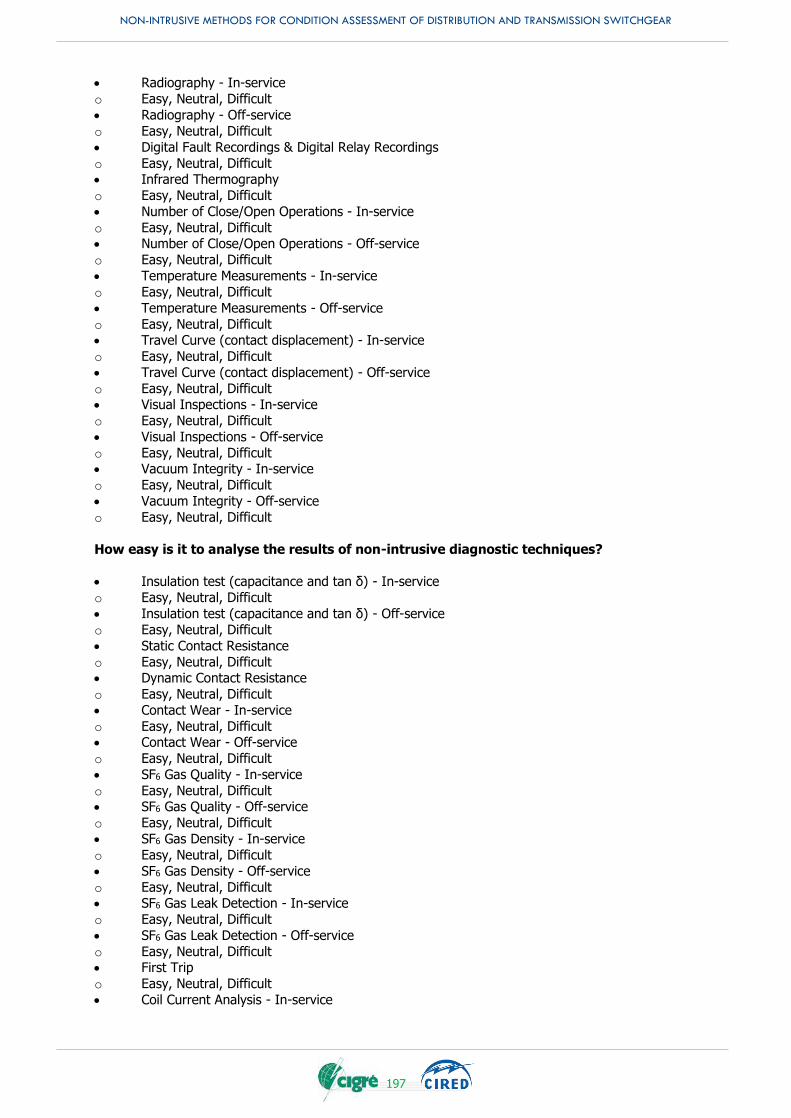
NON-INTRUSIVE METHODS FOR CONDITION ASSESSMENT OF DISTRIBUTION AND TRANSMISSION SWITCHGEAR
197
Radiography - In-service
o Easy, Neutral, Difficult
Radiography - Off-service
o Easy, Neutral, Difficult
Digital Fault Recordings & Digital Relay Recordings
o Easy, Neutral, Difficult Infrared Thermography
o Easy, Neutral, Difficult
Number of Close/Open Operations - In-service
o Easy, Neutral, Difficult Number of Close/Open Operations - Off-service
o Easy, Neutral, Difficult
Temperature Measurements - In-service
o Easy, Neutral, Difficult
Temperature Measurements - Off-service
o Easy, Neutral, Difficult Travel Curve (contact displacement) - In-service
o Easy, Neutral, Difficult
Travel Curve (contact displacement) - Off-service
o Easy, Neutral, Difficult Visual Inspections - In-service
o Easy, Neutral, Difficult
Visual Inspections - Off-service
o Easy, Neutral, Difficult Vacuum Integrity - In-service
o Easy, Neutral, Difficult
Vacuum Integrity - Off-service
o Easy, Neutral, Difficult
How easy is it to analyse the results of non-intrusive diagnostic techniques?
Insulation test (capacitance and tan δ) - In-service
o Easy, Neutral, Difficult
Insulation test (capacitance and tan δ) - Off-service
o Easy, Neutral, Difficult
Static Contact Resistance
o Easy, Neutral, Difficult Dynamic Contact Resistance
o Easy, Neutral, Difficult
Contact Wear - In-service
o Easy, Neutral, Difficult Contact Wear - Off-service
o Easy, Neutral, Difficult
SF6 Gas Quality - In-service
o Easy, Neutral, Difficult SF6 Gas Quality - Off-service
o Easy, Neutral, Difficult
SF6 Gas Density - In-service
o Easy, Neutral, Difficult
SF6 Gas Density - Off-service
o Easy, Neutral, Difficult SF6 Gas Leak Detection - In-service
o Easy, Neutral, Difficult
SF6 Gas Leak Detection - Off-service
o Easy, Neutral, Difficult First Trip
o Easy, Neutral, Difficult
Coil Current Analysis - In-service
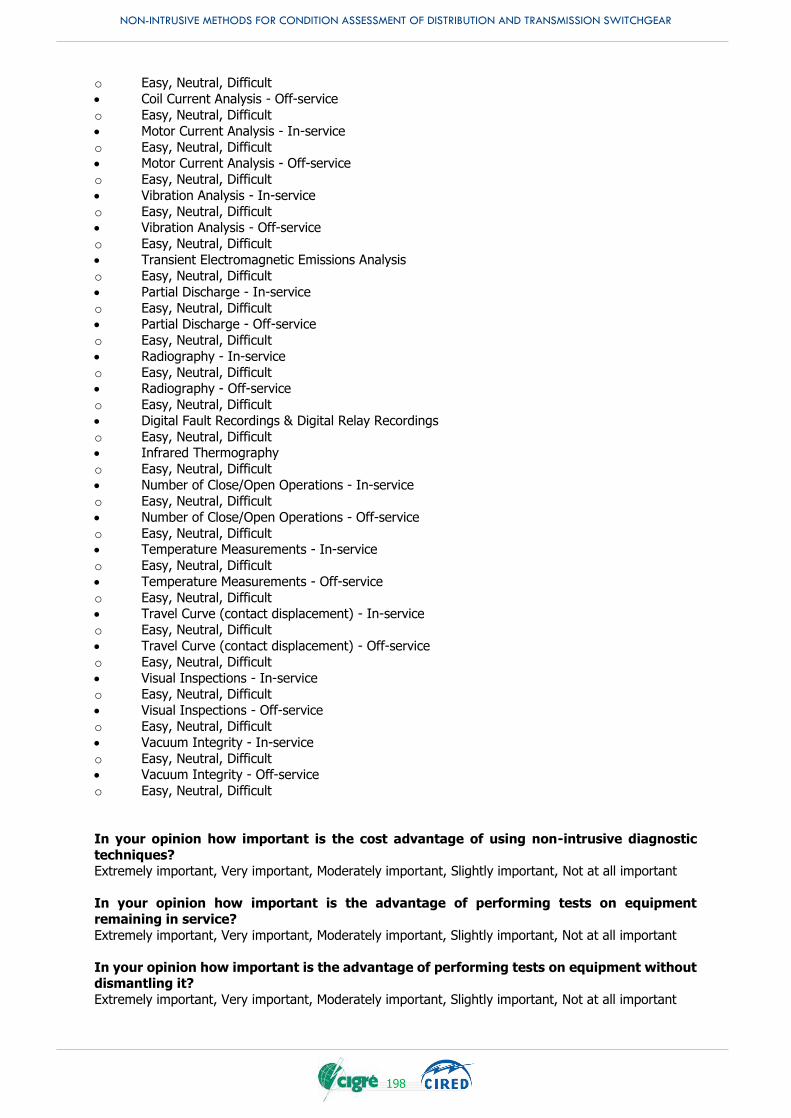
NON-INTRUSIVE METHODS FOR CONDITION ASSESSMENT OF DISTRIBUTION AND TRANSMISSION SWITCHGEAR
198
o Easy, Neutral, Difficult
Coil Current Analysis - Off-service
o Easy, Neutral, Difficult
Motor Current Analysis - In-service
o Easy, Neutral, Difficult Motor Current Analysis - Off-service
o Easy, Neutral, Difficult
Vibration Analysis - In-service
o Easy, Neutral, Difficult Vibration Analysis - Off-service
o Easy, Neutral, Difficult
Transient Electromagnetic Emissions Analysis
o Easy, Neutral, Difficult
Partial Discharge - In-service
o Easy, Neutral, Difficult Partial Discharge - Off-service
o Easy, Neutral, Difficult
Radiography - In-service
o Easy, Neutral, Difficult Radiography - Off-service
o Easy, Neutral, Difficult
Digital Fault Recordings & Digital Relay Recordings
o Easy, Neutral, Difficult Infrared Thermography
o Easy, Neutral, Difficult
Number of Close/Open Operations - In-service
o Easy, Neutral, Difficult
Number of Close/Open Operations - Off-service
o Easy, Neutral, Difficult Temperature Measurements - In-service
o Easy, Neutral, Difficult
Temperature Measurements - Off-service
o Easy, Neutral, Difficult Travel Curve (contact displacement) - In-service
o Easy, Neutral, Difficult
Travel Curve (contact displacement) - Off-service
o Easy, Neutral, Difficult
Visual Inspections - In-service o Easy, Neutral, Difficult
Visual Inspections - Off-service
o Easy, Neutral, Difficult
Vacuum Integrity - In-service
o Easy, Neutral, Difficult Vacuum Integrity - Off-service
o Easy, Neutral, Difficult
In your opinion how important is the cost advantage of using non-intrusive diagnostic
techniques? Extremely important, Very important, Moderately important, Slightly important, Not at all important
In your opinion how important is the advantage of performing tests on equipment
remaining in service?
Extremely important, Very important, Moderately important, Slightly important, Not at all important
In your opinion how important is the advantage of performing tests on equipment without dismantling it?
Extremely important, Very important, Moderately important, Slightly important, Not at all important

NON-INTRUSIVE METHODS FOR CONDITION ASSESSMENT OF DISTRIBUTION AND TRANSMISSION SWITCHGEAR
199
APPENDIX F. MATRIX

NON-INTRUSIVE METHODS FOR CONDITION ASSESSMENT OF DISTRIBUTION AND TRANSMISSION SWITCHGEAR
200
ID
Nam
e
De
scri
pti
on
Gro
up
Mai
n C
ate
gory
Sub
Cat
ego
ry
In-
/Off
-se
rvic
e
Intr
usi
ve
(No
n,
Min
,
Stro
ngl
y)
Pe
rio
dic
ally
Co
nti
nu
ou
sly
De
gre
e o
f M
atu
rity
Vo
ltag
e L
eve
l
Swit
chin
g M
ed
ium
Insu
lati
on
Re
fere
nce
-Ke
ys
1 Magnetron
Well established measurement during production, no field application. Circuit breaker need to be dismounted for measurements during service life.
Insulation Insulation Medium
ISO-vacuum quality
Off Strongly
Per. Standard practice in the field
MV VCB all Renz2007
2 Mobile Magnetron based on stationary application of magnetron discharge for pressure determination
Insulation Insulation Medium
ISO-vacuum quality
Off Non Per. R&D-Activity MV VCB AIS Eichhoff2013,
3 Dielectric Vacuum Testing
based on breakdown characterstic of vacuum gap, BD-voltage significantly decreases if pressure exceeds critical value, no quantitative measurement, only pass/fail
Insulation Insulation Medium
ISO-vacuum quality
Off Non Per. Standard practice in the field
HV VCB all Slade2007, Megger2012
4 FE Current Analysis FE-current measurement after arc-polishing, practical application and evaluation challenging
Insulation Insulation Medium
ISO-vacuum quality
Off Non Per. R&D-Activity MV VCB all Frontzek1993, Zadeh2011
5 Arc Voltage Analysis Analysis of pressure-related spikes in measures arc voltage, limited measuring range
Insulation Insulation Medium
ISO-vacuum quality
Off Non Per. Theoretical Concept MV VCB all Merck1999
6 PD measurement
PD pulse acquisition,measurement of apparent charge,evaluation of magnitude, repetition rate,frequency and phase angle, detected by capacitive sensor
Insulation PD PD-electrical
In Min both Standard practice in the field
HV+ MV
all Blokhintsev 2009
7 PD measurement
PD pulse acquisition,measurement of apparent charge,evaluation of magnitude, repetition rate,frequency and phase angle, detected by UHF space and window sensor
Insulation PD PD-UHF In Non both Standard practice in the field
HV+ MV
all
8 PD measurement
PD pulse acquisition,measurement of apparent charge,evaluation of magnitude, repetition rate,frequency and phase angle, detected by ultrasonic testing
Insulation PD PD-ultra sound
In Non Per. Standard practice in the field
MV Solid-Ins.
Garnett2011
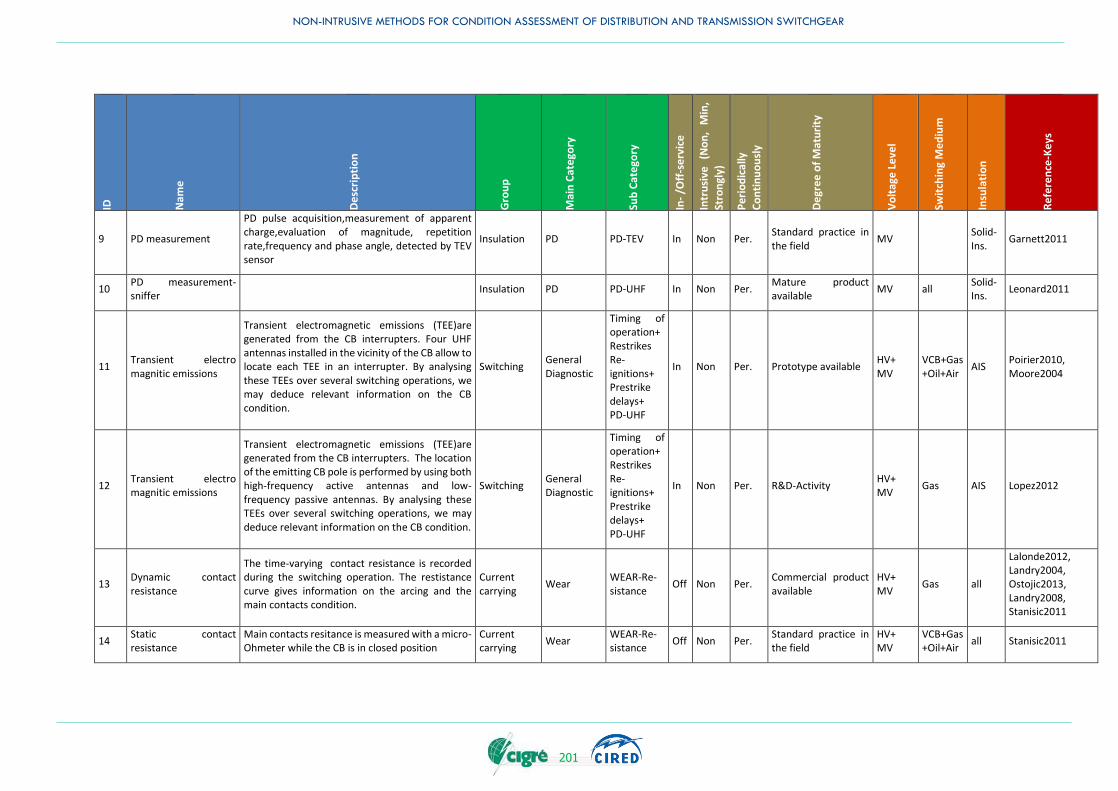
NON-INTRUSIVE METHODS FOR CONDITION ASSESSMENT OF DISTRIBUTION AND TRANSMISSION SWITCHGEAR
201
ID
Nam
e
De
scri
pti
on
Gro
up
Mai
n C
ate
gory
Sub
Cat
ego
ry
In-
/Off
-se
rvic
e
Intr
usi
ve
(No
n,
Min
,
Stro
ngl
y)
Pe
rio
dic
ally
Co
nti
nu
ou
sly
De
gre
e o
f M
atu
rity
Vo
ltag
e L
eve
l
Swit
chin
g M
ed
ium
Insu
lati
on
Re
fere
nce
-Ke
ys
9 PD measurement
PD pulse acquisition,measurement of apparent charge,evaluation of magnitude, repetition rate,frequency and phase angle, detected by TEV sensor
Insulation PD PD-TEV In Non Per. Standard practice in the field
MV Solid-Ins.
Garnett2011
10 PD measurement-sniffer
Insulation PD PD-UHF In Non Per. Mature product available
MV all Solid-Ins.
Leonard2011
11 Transient electro magnitic emissions
Transient electromagnetic emissions (TEE)are generated from the CB interrupters. Four UHF antennas installed in the vicinity of the CB allow to locate each TEE in an interrupter. By analysing these TEEs over several switching operations, we may deduce relevant information on the CB condition.
Switching General Diagnostic
Timing of operation+ Restrikes Re- ignitions+ Prestrike delays+ PD-UHF
In Non Per. Prototype available HV+ MV
VCB+Gas+Oil+Air
AIS Poirier2010, Moore2004
12 Transient electro magnitic emissions
Transient electromagnetic emissions (TEE)are generated from the CB interrupters. The location of the emitting CB pole is performed by using both high-frequency active antennas and low-frequency passive antennas. By analysing these TEEs over several switching operations, we may deduce relevant information on the CB condition.
Switching General Diagnostic
Timing of operation+ Restrikes Re-ignitions+ Prestrike delays+ PD-UHF
In Non Per. R&D-Activity HV+ MV
Gas AIS Lopez2012
13 Dynamic contact resistance
The time-varying contact resistance is recorded during the switching operation. The restistance curve gives information on the arcing and the main contacts condition.
Current carrying
Wear WEAR-Re-sistance
Off Non Per. Commercial product available
HV+ MV
Gas all
Lalonde2012, Landry2004, Ostojic2013, Landry2008, Stanisic2011
14 Static contact resistance
Main contacts resitance is measured with a micro-Ohmeter while the CB is in closed position
Current carrying
Wear WEAR-Re-sistance
Off Non Per. Standard practice in the field
HV+ MV
VCB+Gas+Oil+Air
all Stanisic2011

NON-INTRUSIVE METHODS FOR CONDITION ASSESSMENT OF DISTRIBUTION AND TRANSMISSION SWITCHGEAR
202
ID
Nam
e
De
scri
pti
on
Gro
up
Mai
n C
ate
gory
Sub
Cat
ego
ry
In-
/Off
-se
rvic
e
Intr
usi
ve
(No
n,
Min
,
Stro
ngl
y)
Pe
rio
dic
ally
Co
nti
nu
ou
sly
De
gre
e o
f M
atu
rity
Vo
ltag
e L
eve
l
Swit
chin
g M
ed
ium
Insu
lati
on
Re
fere
nce
-Ke
ys
15 Vibration analysis
Accelerometers are installed on the CB. Mechanical anomalies can be detected by comparing vibrations signals with reference signatures.
Mechani-cal Travel Timing of operation
In & Off
Non Per. Tested in the field HV VCB+Gas+Oil+Air
all
Beattie1996 Hoidalen2005 Landry2008_1 Lee2002 Runde1999
16 Mechanical timing The method evaluates the time elapsed between the command signal and the contact part or the contact touch in each interrupter of the CB
Mechani-cal Travel Timing of operation
Off Non Per. Standard practice in the field
HV+ MV
VCB+Gas+Oil+Air
all Rusek2008
17 Contact travel
A motion transducer is mounted on a moving part of the operating mechanism. The contact position is given as a function of time during the switching operation
Mechani-cal Travel
TRAVEL-rotary (speed, acc,..)+ TRAVEL-linear (speed, acc,..)
Off Min both Standard practice in the field
HV+ MV
VCB+Gas+Oil+Air
all Brown2012 Lalonde2013
18 Vibration analysis
An accelerometer is attached to a operation driving system of the SF6 GCBs. The signals are conditioned by a measurement system and analyzed by with a Dynamic-Time-Warping (DTW) algorithm. Mechanical problems can be detected and it is verified with 3 case studies.
Mechani-cal Travel
Driving system-kinematic chain
In Non both Tested in the field HV Gas Landry2008
19 Current / voltage measurement
Saturation-free non-magnetic current / voltage sensors such as Rogowski Coils, Capacitive & resistive dividers are used for current and voltage measurement of a MV switchgear.
Switching General Diagnostic
current & voltage measurements + I2T + PD-RF
In Non both Standard practice in the field
HV+ MV
VCB+Gas+Oil+Air
AIS Leif_ABB
20 PD measurement Internal PD couplers installed inside the GIS chambers to detect electro magnetic wave generated by partial discharge.
Insulation PD PD-UHF In Strongly
both Standard practice in the field
HV Gas ITO_MELCO
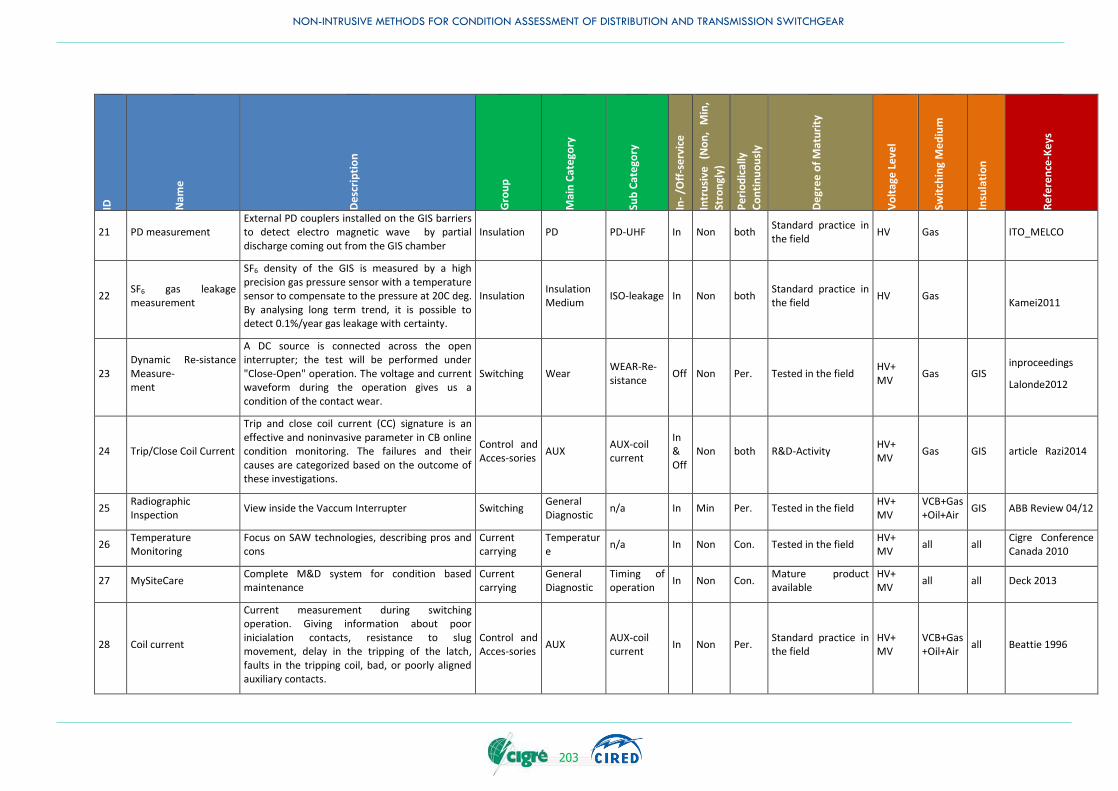
NON-INTRUSIVE METHODS FOR CONDITION ASSESSMENT OF DISTRIBUTION AND TRANSMISSION SWITCHGEAR
203
ID
Nam
e
De
scri
pti
on
Gro
up
Mai
n C
ate
gory
Sub
Cat
ego
ry
In-
/Off
-se
rvic
e
Intr
usi
ve
(No
n,
Min
,
Stro
ngl
y)
Pe
rio
dic
ally
Co
nti
nu
ou
sly
De
gre
e o
f M
atu
rity
Vo
ltag
e L
eve
l
Swit
chin
g M
ed
ium
Insu
lati
on
Re
fere
nce
-Ke
ys
21 PD measurement External PD couplers installed on the GIS barriers to detect electro magnetic wave by partial discharge coming out from the GIS chamber
Insulation PD PD-UHF In Non both Standard practice in the field
HV Gas ITO_MELCO
22 SF6 gas leakage measurement
SF6 density of the GIS is measured by a high precision gas pressure sensor with a temperature sensor to compensate to the pressure at 20C deg. By analysing long term trend, it is possible to detect 0.1%/year gas leakage with certainty.
Insulation Insulation Medium
ISO-leakage In Non both Standard practice in the field
HV Gas Kamei2011
23 Dynamic Re-sistance Measure- ment
A DC source is connected across the open interrupter; the test will be performed under "Close-Open" operation. The voltage and current waveform during the operation gives us a condition of the contact wear.
Switching Wear WEAR-Re-sistance
Off Non Per. Tested in the field HV+ MV
Gas GIS inproceedings
Lalonde2012
24 Trip/Close Coil Current
Trip and close coil current (CC) signature is an effective and noninvasive parameter in CB online condition monitoring. The failures and their causes are categorized based on the outcome of these investigations.
Control and Acces-sories
AUX AUX-coil current
In & Off
Non both R&D-Activity HV+ MV
Gas GIS article Razi2014
25 Radiographic Inspection
View inside the Vaccum Interrupter Switching General Diagnostic
n/a In Min Per. Tested in the field HV+ MV
VCB+Gas+Oil+Air
GIS ABB Review 04/12
26 Temperature Monitoring
Focus on SAW technologies, describing pros and cons
Current carrying
Temperature
n/a In Non Con. Tested in the field HV+ MV
all all Cigre Conference Canada 2010
27 MySiteCare Complete M&D system for condition based maintenance
Current carrying
General Diagnostic
Timing of operation
In Non Con. Mature product available
HV+ MV
all all Deck 2013
28 Coil current
Current measurement during switching operation. Giving information about poor inicialation contacts, resistance to slug movement, delay in the tripping of the latch, faults in the tripping coil, bad, or poorly aligned auxiliary contacts.
Control and Acces-sories
AUX AUX-coil current
In Non Per. Standard practice in the field
HV+ MV
VCB+Gas+Oil+Air
all Beattie 1996
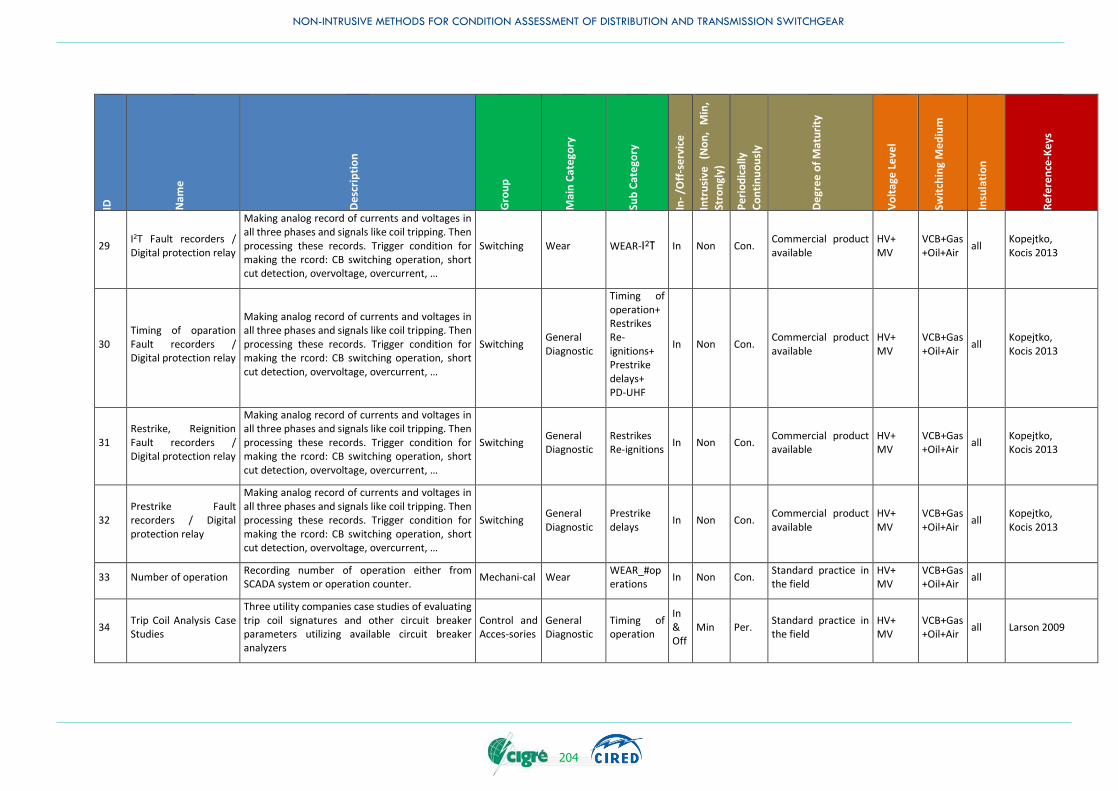
NON-INTRUSIVE METHODS FOR CONDITION ASSESSMENT OF DISTRIBUTION AND TRANSMISSION SWITCHGEAR
204
ID
Nam
e
De
scri
pti
on
Gro
up
Mai
n C
ate
gory
Sub
Cat
ego
ry
In-
/Off
-se
rvic
e
Intr
usi
ve
(No
n,
Min
,
Stro
ngl
y)
Pe
rio
dic
ally
Co
nti
nu
ou
sly
De
gre
e o
f M
atu
rity
Vo
ltag
e L
eve
l
Swit
chin
g M
ed
ium
Insu
lati
on
Re
fere
nce
-Ke
ys
29 I2T Fault recorders / Digital protection relay
Making analog record of currents and voltages in all three phases and signals like coil tripping. Then processing these records. Trigger condition for making the rcord: CB switching operation, short cut detection, overvoltage, overcurrent, …
Switching Wear WEAR-I2T In Non Con. Commercial product available
HV+ MV
VCB+Gas+Oil+Air
all Kopejtko, Kocis 2013
30 Timing of oparation Fault recorders / Digital protection relay
Making analog record of currents and voltages in all three phases and signals like coil tripping. Then processing these records. Trigger condition for making the rcord: CB switching operation, short cut detection, overvoltage, overcurrent, …
Switching General Diagnostic
Timing of operation+ Restrikes Re-ignitions+ Prestrike delays+ PD-UHF
In Non Con. Commercial product available
HV+ MV
VCB+Gas+Oil+Air
all Kopejtko, Kocis 2013
31 Restrike, Reignition Fault recorders / Digital protection relay
Making analog record of currents and voltages in all three phases and signals like coil tripping. Then processing these records. Trigger condition for making the rcord: CB switching operation, short cut detection, overvoltage, overcurrent, …
Switching General Diagnostic
Restrikes Re-ignitions
In Non Con. Commercial product available
HV+ MV
VCB+Gas+Oil+Air
all Kopejtko, Kocis 2013
32 Prestrike Fault recorders / Digital protection relay
Making analog record of currents and voltages in all three phases and signals like coil tripping. Then processing these records. Trigger condition for making the rcord: CB switching operation, short cut detection, overvoltage, overcurrent, …
Switching General Diagnostic
Prestrike delays
In Non Con. Commercial product available
HV+ MV
VCB+Gas+Oil+Air
all Kopejtko, Kocis 2013
33 Number of operation Recording number of operation either from SCADA system or operation counter.
Mechani-cal Wear WEAR_#operations
In Non Con. Standard practice in the field
HV+ MV
VCB+Gas+Oil+Air
all
34 Trip Coil Analysis Case Studies
Three utility companies case studies of evaluating trip coil signatures and other circuit breaker parameters utilizing available circuit breaker analyzers
Control and Acces-sories
General Diagnostic
Timing of operation
In & Off
Min Per. Standard practice in the field
HV+ MV
VCB+Gas+Oil+Air
all Larson 2009
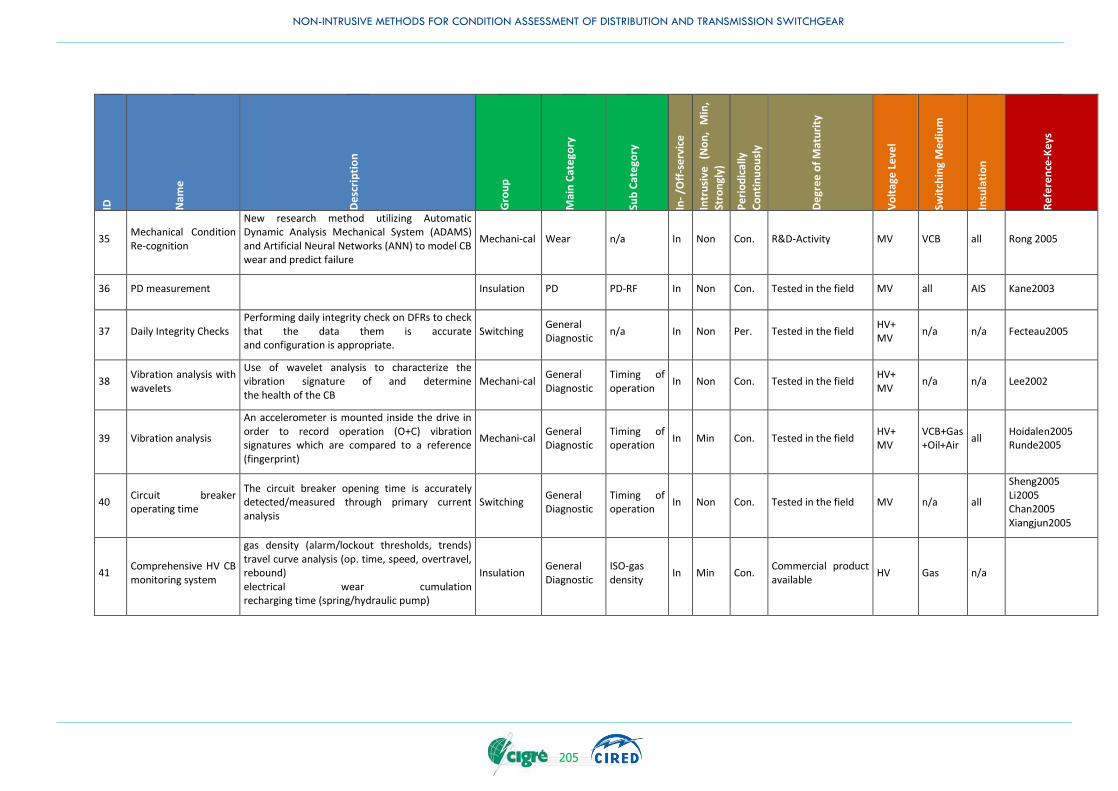
NON-INTRUSIVE METHODS FOR CONDITION ASSESSMENT OF DISTRIBUTION AND TRANSMISSION SWITCHGEAR
205
ID
Nam
e
De
scri
pti
on
Gro
up
Mai
n C
ate
gory
Sub
Cat
ego
ry
In-
/Off
-se
rvic
e
Intr
usi
ve
(No
n,
Min
,
Stro
ngl
y)
Pe
rio
dic
ally
Co
nti
nu
ou
sly
De
gre
e o
f M
atu
rity
Vo
ltag
e L
eve
l
Swit
chin
g M
ed
ium
Insu
lati
on
Re
fere
nce
-Ke
ys
35 Mechanical Condition Re-cognition
New research method utilizing Automatic Dynamic Analysis Mechanical System (ADAMS) and Artificial Neural Networks (ANN) to model CB wear and predict failure
Mechani-cal Wear n/a In Non Con. R&D-Activity MV VCB all Rong 2005
36 PD measurement Insulation PD PD-RF In Non Con. Tested in the field MV all AIS Kane2003
37 Daily Integrity Checks Performing daily integrity check on DFRs to check that the data them is accurate and configuration is appropriate.
Switching General Diagnostic
n/a In Non Per. Tested in the field HV+ MV
n/a n/a Fecteau2005
38 Vibration analysis with wavelets
Use of wavelet analysis to characterize the vibration signature of and determine the health of the CB
Mechani-cal General Diagnostic
Timing of operation
In Non Con. Tested in the field HV+ MV
n/a n/a Lee2002
39 Vibration analysis
An accelerometer is mounted inside the drive in order to record operation (O+C) vibration signatures which are compared to a reference (fingerprint)
Mechani-cal General Diagnostic
Timing of operation
In Min Con. Tested in the field HV+ MV
VCB+Gas+Oil+Air
all Hoidalen2005 Runde2005
40 Circuit breaker operating time
The circuit breaker opening time is accurately detected/measured through primary current analysis
Switching General Diagnostic
Timing of operation
In Non Con. Tested in the field MV n/a all
Sheng2005 Li2005 Chan2005 Xiangjun2005
41 Comprehensive HV CB monitoring system
gas density (alarm/lockout thresholds, trends) travel curve analysis (op. time, speed, overtravel, rebound) electrical wear cumulation recharging time (spring/hydraulic pump)
Insulation General Diagnostic
ISO-gas density
In Min Con. Commercial product available
HV Gas n/a
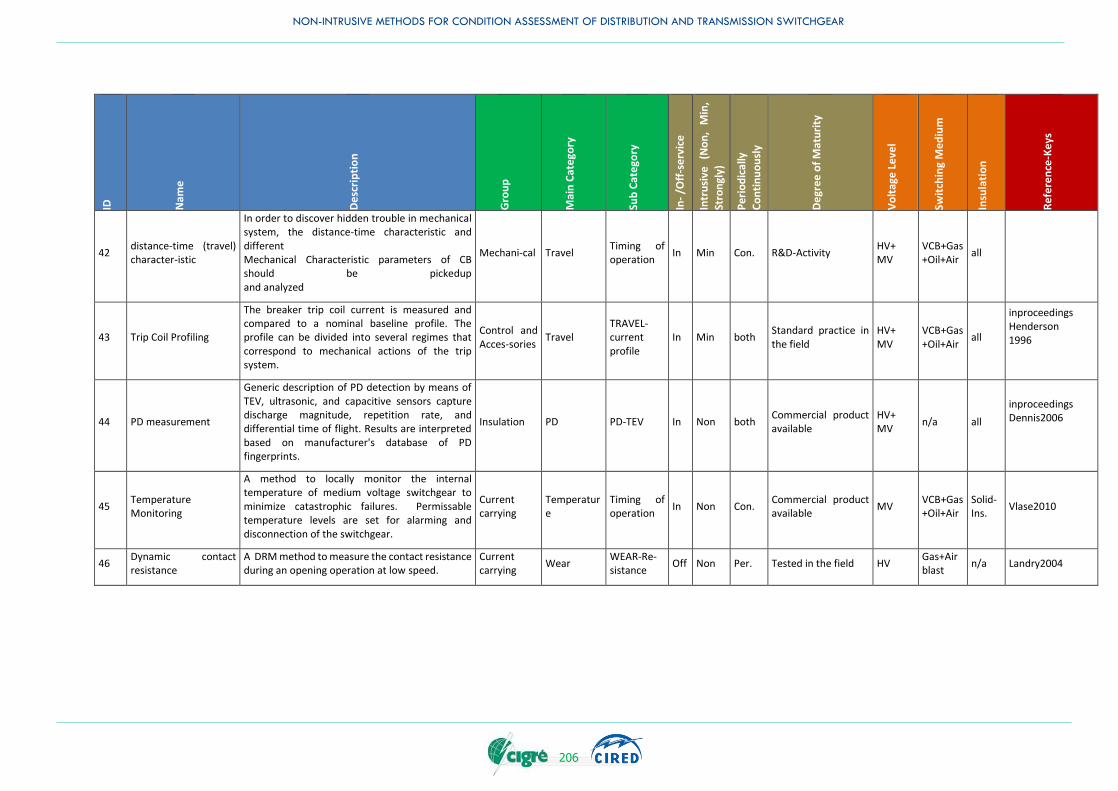
NON-INTRUSIVE METHODS FOR CONDITION ASSESSMENT OF DISTRIBUTION AND TRANSMISSION SWITCHGEAR
206
ID
Nam
e
De
scri
pti
on
Gro
up
Mai
n C
ate
gory
Sub
Cat
ego
ry
In-
/Off
-se
rvic
e
Intr
usi
ve
(No
n,
Min
,
Stro
ngl
y)
Pe
rio
dic
ally
Co
nti
nu
ou
sly
De
gre
e o
f M
atu
rity
Vo
ltag
e L
eve
l
Swit
chin
g M
ed
ium
Insu
lati
on
Re
fere
nce
-Ke
ys
42 distance-time (travel) character-istic
In order to discover hidden trouble in mechanical system, the distance-time characteristic and different Mechanical Characteristic parameters of CB should be pickedup and analyzed
Mechani-cal Travel Timing of operation
In Min Con. R&D-Activity HV+ MV
VCB+Gas+Oil+Air
all
43 Trip Coil Profiling
The breaker trip coil current is measured and compared to a nominal baseline profile. The profile can be divided into several regimes that correspond to mechanical actions of the trip system.
Control and Acces-sories
Travel TRAVEL-current profile
In Min both Standard practice in the field
HV+ MV
VCB+Gas+Oil+Air
all
inproceedings Henderson 1996
44 PD measurement
Generic description of PD detection by means of TEV, ultrasonic, and capacitive sensors capture discharge magnitude, repetition rate, and differential time of flight. Results are interpreted based on manufacturer's database of PD fingerprints.
Insulation PD PD-TEV In Non both Commercial product available
HV+ MV
n/a all
inproceedings Dennis2006
45 Temperature Monitoring
A method to locally monitor the internal temperature of medium voltage switchgear to minimize catastrophic failures. Permissable temperature levels are set for alarming and disconnection of the switchgear.
Current carrying
Temperature
Timing of operation
In Non Con. Commercial product available
MV VCB+Gas+Oil+Air
Solid-Ins.
Vlase2010
46 Dynamic contact resistance
A DRM method to measure the contact resistance during an opening operation at low speed.
Current carrying
Wear WEAR-Re-sistance
Off Non Per. Tested in the field HV Gas+Airblast
n/a Landry2004
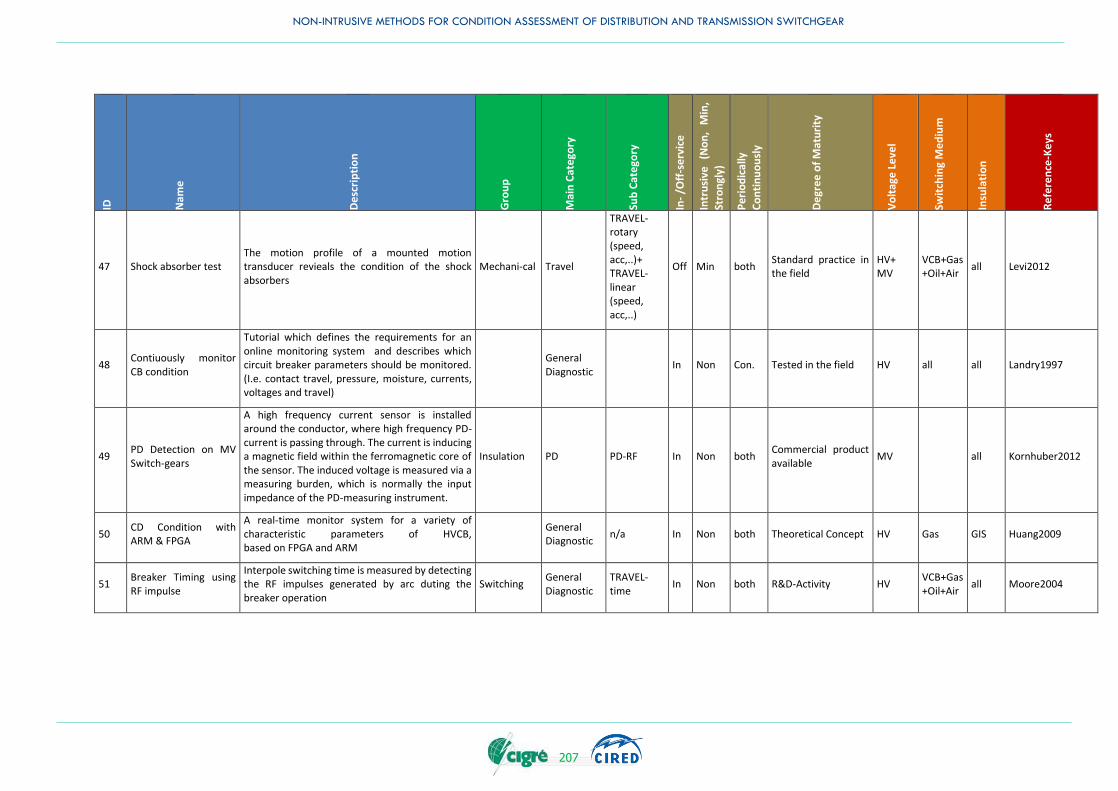
NON-INTRUSIVE METHODS FOR CONDITION ASSESSMENT OF DISTRIBUTION AND TRANSMISSION SWITCHGEAR
207
ID
Nam
e
De
scri
pti
on
Gro
up
Mai
n C
ate
gory
Sub
Cat
ego
ry
In-
/Off
-se
rvic
e
Intr
usi
ve
(No
n,
Min
,
Stro
ngl
y)
Pe
rio
dic
ally
Co
nti
nu
ou
sly
De
gre
e o
f M
atu
rity
Vo
ltag
e L
eve
l
Swit
chin
g M
ed
ium
Insu
lati
on
Re
fere
nce
-Ke
ys
47 Shock absorber test The motion profile of a mounted motion transducer revieals the condition of the shock absorbers
Mechani-cal Travel
TRAVEL-rotary (speed, acc,..)+ TRAVEL-linear (speed, acc,..)
Off Min both Standard practice in the field
HV+ MV
VCB+Gas+Oil+Air
all Levi2012
48 Contiuously monitor CB condition
Tutorial which defines the requirements for an online monitoring system and describes which circuit breaker parameters should be monitored. (I.e. contact travel, pressure, moisture, currents, voltages and travel)
General Diagnostic
In Non Con. Tested in the field HV all all Landry1997
49 PD Detection on MV Switch-gears
A high frequency current sensor is installed around the conductor, where high frequency PD-current is passing through. The current is inducing a magnetic field within the ferromagnetic core of the sensor. The induced voltage is measured via a measuring burden, which is normally the input impedance of the PD-measuring instrument.
Insulation PD PD-RF In Non both Commercial product available
MV all Kornhuber2012
50 CD Condition with ARM & FPGA
A real-time monitor system for a variety of characteristic parameters of HVCB, based on FPGA and ARM
General Diagnostic
n/a In Non both Theoretical Concept HV Gas GIS Huang2009
51 Breaker Timing using RF impulse
Interpole switching time is measured by detecting the RF impulses generated by arc duting the breaker operation
Switching General Diagnostic
TRAVEL-time
In Non both R&D-Activity HV VCB+Gas+Oil+Air
all Moore2004
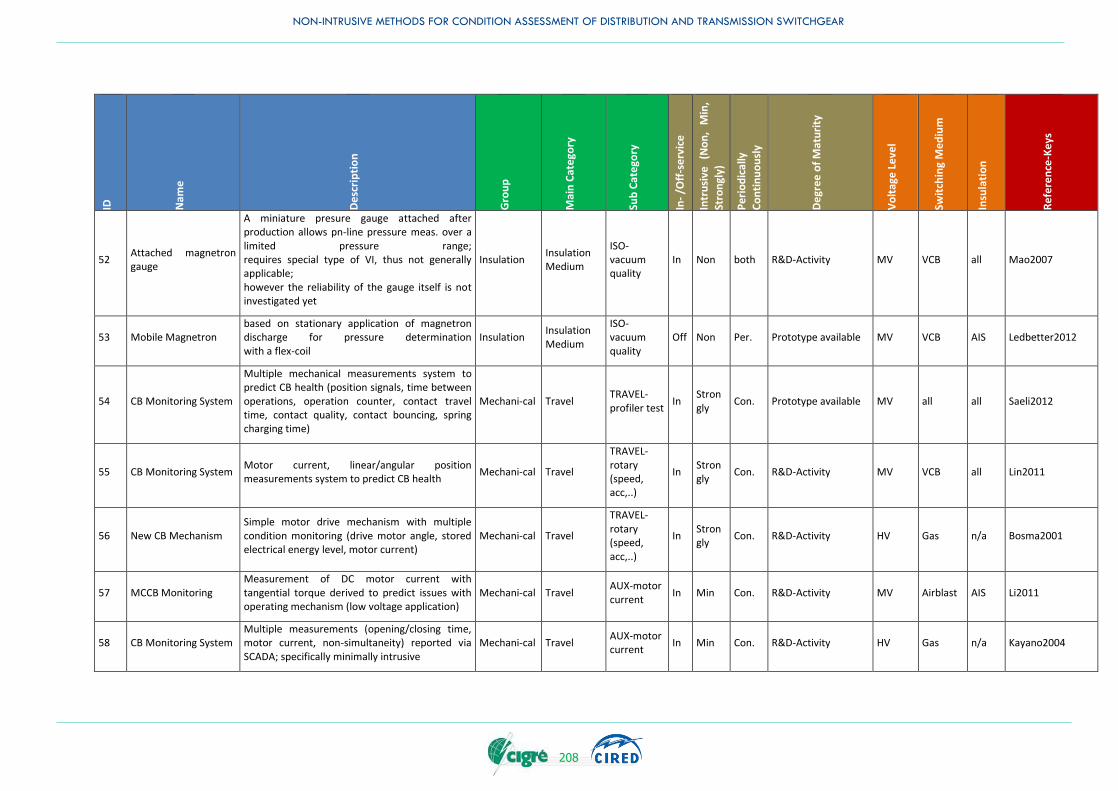
NON-INTRUSIVE METHODS FOR CONDITION ASSESSMENT OF DISTRIBUTION AND TRANSMISSION SWITCHGEAR
208
ID
Nam
e
De
scri
pti
on
Gro
up
Mai
n C
ate
gory
Sub
Cat
ego
ry
In-
/Off
-se
rvic
e
Intr
usi
ve
(No
n,
Min
,
Stro
ngl
y)
Pe
rio
dic
ally
Co
nti
nu
ou
sly
De
gre
e o
f M
atu
rity
Vo
ltag
e L
eve
l
Swit
chin
g M
ed
ium
Insu
lati
on
Re
fere
nce
-Ke
ys
52 Attached magnetron gauge
A miniature presure gauge attached after production allows pn-line pressure meas. over a limited pressure range; requires special type of VI, thus not generally applicable; however the reliability of the gauge itself is not investigated yet
Insulation Insulation Medium
ISO-vacuum quality
In Non both R&D-Activity MV VCB all Mao2007
53 Mobile Magnetron based on stationary application of magnetron discharge for pressure determination with a flex-coil
Insulation Insulation Medium
ISO-vacuum quality
Off Non Per. Prototype available MV VCB AIS Ledbetter2012
54 CB Monitoring System
Multiple mechanical measurements system to predict CB health (position signals, time between operations, operation counter, contact travel time, contact quality, contact bouncing, spring charging time)
Mechani-cal Travel TRAVEL-profiler test
In Strongly
Con. Prototype available MV all all Saeli2012
55 CB Monitoring System Motor current, linear/angular position measurements system to predict CB health
Mechani-cal Travel
TRAVEL-rotary (speed, acc,..)
In Strongly
Con. R&D-Activity MV VCB all Lin2011
56 New CB Mechanism Simple motor drive mechanism with multiple condition monitoring (drive motor angle, stored electrical energy level, motor current)
Mechani-cal Travel
TRAVEL-rotary (speed, acc,..)
In Strongly
Con. R&D-Activity HV Gas n/a Bosma2001
57 MCCB Monitoring Measurement of DC motor current with tangential torque derived to predict issues with operating mechanism (low voltage application)
Mechani-cal Travel AUX-motor current
In Min Con. R&D-Activity MV Airblast AIS Li2011
58 CB Monitoring System Multiple measurements (opening/closing time, motor current, non-simultaneity) reported via SCADA; specifically minimally intrusive
Mechani-cal Travel AUX-motor current
In Min Con. R&D-Activity HV Gas n/a Kayano2004

NON-INTRUSIVE METHODS FOR CONDITION ASSESSMENT OF DISTRIBUTION AND TRANSMISSION SWITCHGEAR
209
ID
Nam
e
De
scri
pti
on
Gro
up
Mai
n C
ate
gory
Sub
Cat
ego
ry
In-
/Off
-se
rvic
e
Intr
usi
ve
(No
n,
Min
,
Stro
ngl
y)
Pe
rio
dic
ally
Co
nti
nu
ou
sly
De
gre
e o
f M
atu
rity
Vo
ltag
e L
eve
l
Swit
chin
g M
ed
ium
Insu
lati
on
Re
fere
nce
-Ke
ys
59 CB Monitoring System Monitoring of dynamic contact travel and current in release coils
Mechani-cal Travel
TRAVEL-linear (speed, acc,..)
In Min Con. Prototype available MV VCB all Shi2002
60 DC Solenoid Monitoring
Measurement of DC solenoid closing current to detect abnormalities
Mechani-cal AUX AUX-coil current
In Min Per. Prototype available HV+ MV
VCB+Gas+Oil+Air
all Sugimoto2002
61 Linear Position Transducer
Dynamic contact travel measurement using Doble TR3171
Mechani-cal Travel
TRAVEL-linear (speed, acc,..)
In Min Per. Mature product available
HV+ MV
VCB+Gas+Oil+Air
all Morgan2014
62 Vibration analysis An accelerometer mounted on the breaker mechanism to analyze the vibration during the close, open or charging operation
Mechani-cal General Diagnostic
Timing of operation
In Non Per. Tested in the field HV+ MV
VCB+Gas+Oil+Air
all Cadick2014_1
63 Breaker Timing using Relay
First Trip time is measured by programming the protective relay
Mechani-cal General Diagnostic
Timing of operation
In Non Per. Tested in the field HV VCB+Gas+Oil+Air
all Desai2012
64 Circuit Breaker Sentinel (CBS) System
Online monitoring of multiple parameters of the HV SF6 Circuit Breakers
Mechani-cal General Diagnostic
TRAVEL-profiler test
In Non Con. Tested in the field HV Gas GIS Poltl2011
65 CB status
Measurement of coil current, contact travel and overtravel, derivation of contact travel velocity. Correlation of open/close signals to current in the main circuit. This paper is focused on the computer that collects the monitoring information.
Mechani-cal AUX AUX-coil current
In Min Per. R&D-Activity HV Gas n/a Chunguang 2009
66 CB status
Multiple measurements (opening/closing time, coil current, contact travel) in an integrated condition monitoring and diagnosis system. Not too much detail on the mechanical techniques.
Mechani-cal AUX AUX-coil current
In Min Per. R&D-Activity MV VCB GIS Jang2011
67 CB status Measurement of capacitor voltage (stored energy state)
Mechani-cal AUX AUX-spring charge
In Min Con. Standard practice in the field
MV VCB GIS JST2007 (Japanese language)
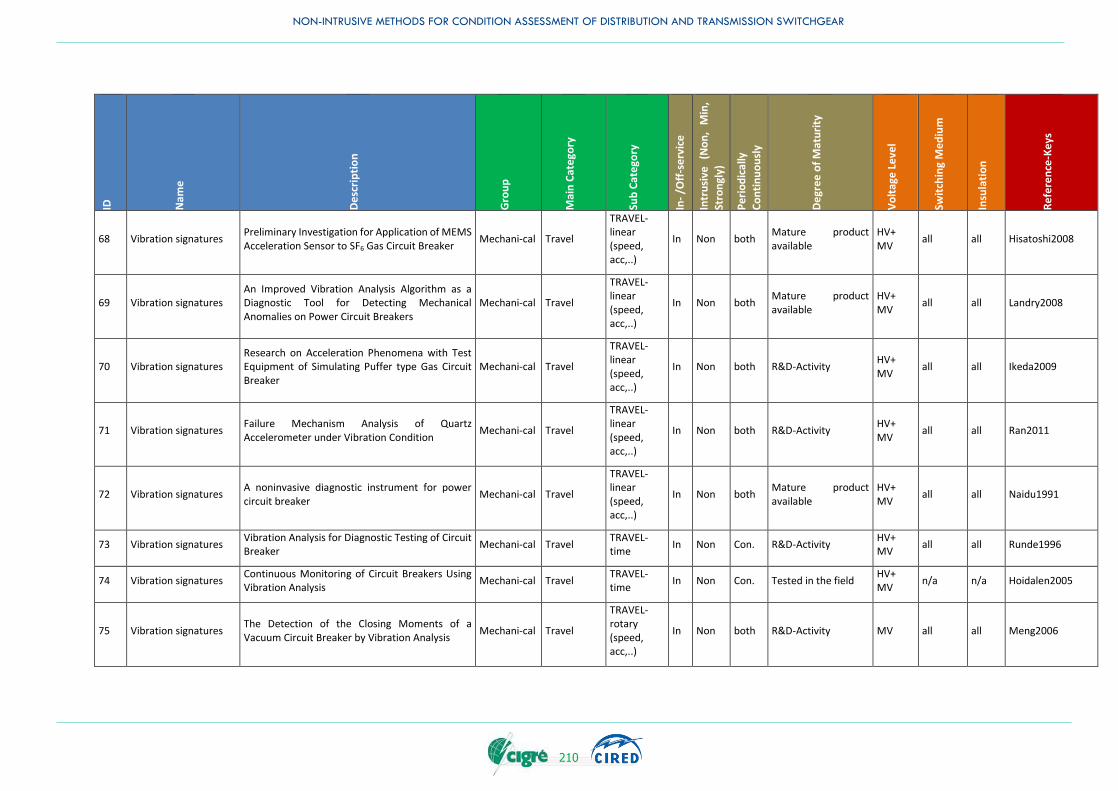
NON-INTRUSIVE METHODS FOR CONDITION ASSESSMENT OF DISTRIBUTION AND TRANSMISSION SWITCHGEAR
210
ID
Nam
e
De
scri
pti
on
Gro
up
Mai
n C
ate
gory
Sub
Cat
ego
ry
In-
/Off
-se
rvic
e
Intr
usi
ve
(No
n,
Min
,
Stro
ngl
y)
Pe
rio
dic
ally
Co
nti
nu
ou
sly
De
gre
e o
f M
atu
rity
Vo
ltag
e L
eve
l
Swit
chin
g M
ed
ium
Insu
lati
on
Re
fere
nce
-Ke
ys
68 Vibration signatures Preliminary Investigation for Application of MEMS Acceleration Sensor to SF6 Gas Circuit Breaker
Mechani-cal Travel
TRAVEL-linear (speed, acc,..)
In Non both Mature product available
HV+ MV
all all Hisatoshi2008
69 Vibration signatures An Improved Vibration Analysis Algorithm as a Diagnostic Tool for Detecting Mechanical Anomalies on Power Circuit Breakers
Mechani-cal Travel
TRAVEL-linear (speed, acc,..)
In Non both Mature product available
HV+ MV
all all Landry2008
70 Vibration signatures Research on Acceleration Phenomena with Test Equipment of Simulating Puffer type Gas Circuit Breaker
Mechani-cal Travel
TRAVEL-linear (speed, acc,..)
In Non both R&D-Activity HV+ MV
all all Ikeda2009
71 Vibration signatures Failure Mechanism Analysis of Quartz Accelerometer under Vibration Condition
Mechani-cal Travel
TRAVEL-linear (speed, acc,..)
In Non both R&D-Activity HV+ MV
all all Ran2011
72 Vibration signatures A noninvasive diagnostic instrument for power circuit breaker
Mechani-cal Travel
TRAVEL-linear (speed, acc,..)
In Non both Mature product available
HV+ MV
all all Naidu1991
73 Vibration signatures Vibration Analysis for Diagnostic Testing of Circuit Breaker
Mechani-cal Travel TRAVEL-time
In Non Con. R&D-Activity HV+ MV
all all Runde1996
74 Vibration signatures Continuous Monitoring of Circuit Breakers Using Vibration Analysis
Mechani-cal Travel TRAVEL-time
In Non Con. Tested in the field HV+ MV
n/a n/a Hoidalen2005
75 Vibration signatures The Detection of the Closing Moments of a Vacuum Circuit Breaker by Vibration Analysis
Mechani-cal Travel
TRAVEL-rotary (speed, acc,..)
In Non both R&D-Activity MV all all Meng2006
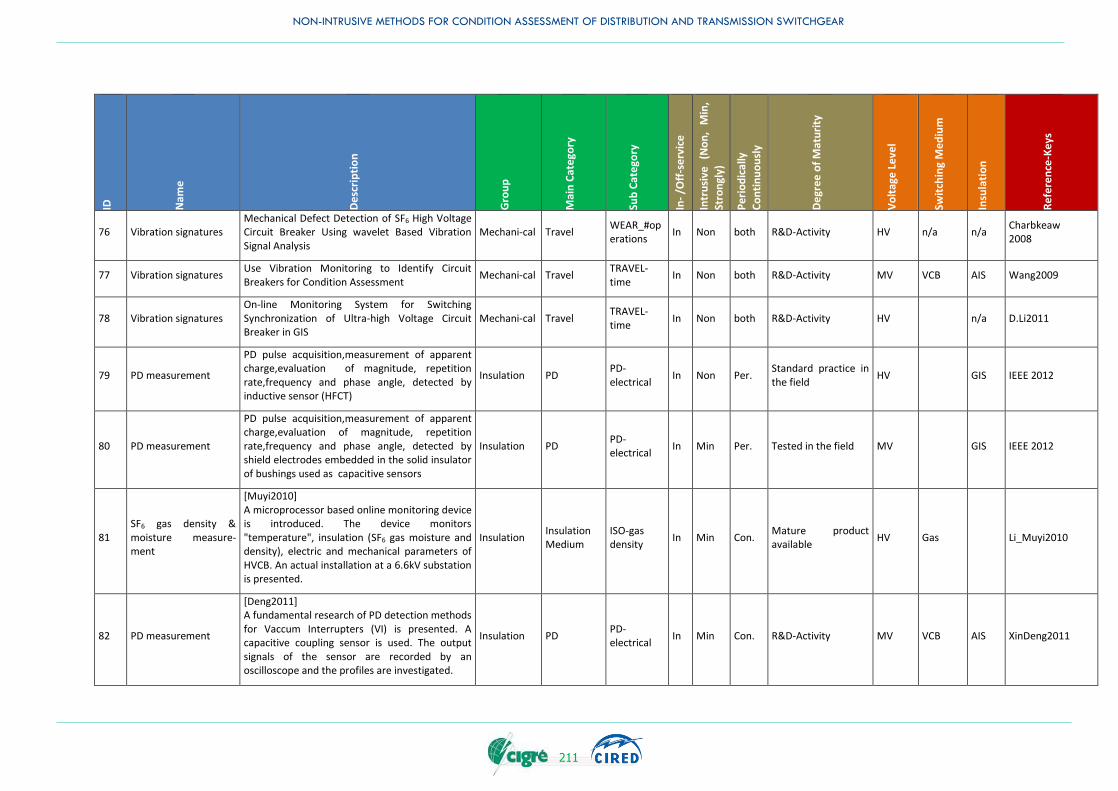
NON-INTRUSIVE METHODS FOR CONDITION ASSESSMENT OF DISTRIBUTION AND TRANSMISSION SWITCHGEAR
211
ID
Nam
e
De
scri
pti
on
Gro
up
Mai
n C
ate
gory
Sub
Cat
ego
ry
In-
/Off
-se
rvic
e
Intr
usi
ve
(No
n,
Min
,
Stro
ngl
y)
Pe
rio
dic
ally
Co
nti
nu
ou
sly
De
gre
e o
f M
atu
rity
Vo
ltag
e L
eve
l
Swit
chin
g M
ed
ium
Insu
lati
on
Re
fere
nce
-Ke
ys
76 Vibration signatures Mechanical Defect Detection of SF6 High Voltage Circuit Breaker Using wavelet Based Vibration Signal Analysis
Mechani-cal Travel WEAR_#operations
In Non both R&D-Activity HV n/a n/a Charbkeaw 2008
77 Vibration signatures Use Vibration Monitoring to Identify Circuit Breakers for Condition Assessment
Mechani-cal Travel TRAVEL-time
In Non both R&D-Activity MV VCB AIS Wang2009
78 Vibration signatures On-line Monitoring System for Switching Synchronization of Ultra-high Voltage Circuit Breaker in GIS
Mechani-cal Travel TRAVEL-time
In Non both R&D-Activity HV n/a D.Li2011
79 PD measurement
PD pulse acquisition,measurement of apparent charge,evaluation of magnitude, repetition rate,frequency and phase angle, detected by inductive sensor (HFCT)
Insulation PD PD-electrical
In Non Per. Standard practice in the field
HV GIS IEEE 2012
80 PD measurement
PD pulse acquisition,measurement of apparent charge,evaluation of magnitude, repetition rate,frequency and phase angle, detected by shield electrodes embedded in the solid insulator of bushings used as capacitive sensors
Insulation PD PD-electrical
In Min Per. Tested in the field MV GIS IEEE 2012
81 SF6 gas density & moisture measure-ment
[Muyi2010] A microprocessor based online monitoring device is introduced. The device monitors "temperature", insulation (SF6 gas moisture and density), electric and mechanical parameters of HVCB. An actual installation at a 6.6kV substation is presented.
Insulation Insulation Medium
ISO-gas density
In Min Con. Mature product available
HV Gas Li_Muyi2010
82 PD measurement
[Deng2011] A fundamental research of PD detection methods for Vaccum Interrupters (VI) is presented. A capacitive coupling sensor is used. The output signals of the sensor are recorded by an oscilloscope and the profiles are investigated.
Insulation PD PD-electrical
In Min Con. R&D-Activity MV VCB AIS XinDeng2011

NON-INTRUSIVE METHODS FOR CONDITION ASSESSMENT OF DISTRIBUTION AND TRANSMISSION SWITCHGEAR
212
ID
Nam
e
De
scri
pti
on
Gro
up
Mai
n C
ate
gory
Sub
Cat
ego
ry
In-
/Off
-se
rvic
e
Intr
usi
ve
(No
n,
Min
,
Stro
ngl
y)
Pe
rio
dic
ally
Co
nti
nu
ou
sly
De
gre
e o
f M
atu
rity
Vo
ltag
e L
eve
l
Swit
chin
g M
ed
ium
Insu
lati
on
Re
fere
nce
-Ke
ys
83 SF6 quality measurements
various sensors and measurement methods such as "dew point mirror", "aluminum oxide sensor" and "decomposition gas detector tube" are present in Cigre Brochure.
Insulation Insulation Medium
ISO-by-products
In Non both Mature product available
HV+ MV
Gas AIS+GIS
Cigre TB 567
84 SF6 quantity measurements
Sensors and mesurement methods for SF6 gas density moitoring such as "tuning fork" and "temperature compensated gauge" are present in Cigre Brochure
Insulation Insulation Medium
ISO-gas density
In Non both Mature product available
HV+ MV
Gas AIS+GIS
Cigre TB 567
85 Vacuum quality monitoring
Magnetrons to measure vacuum level of Vacuum interrupters at field / lab are introduced.
Insulation Insulation Medium
ISO-vacuum quality
Off Non Per. Mature product available
MV VCB AIS Doble2014
86 Oil quality analysis Lab programs for oil analysis by Doble and TKH2b are presented.
Insulation Insulation Medium
ISO-DGA Off Non Per. Mature product available
HV Oil Doble& TKH2b check sheets
87 PD measurement
Unconventional partial discharge measurement techniques for MV switchgears using capacitive voltage denectors (VDS), high-frequency CT (HFCT) and transient earth voltage sensors (TEV) are evaluated their advantages and disadvantages.
Insulation PD PD-electrical
In Non both Mature product available
MV Gas GIS Bernd2014
88 PD, X-ray, Moisture content, IR and UV
Condition monitoring state of the art of several techniques used in the field in the CN SGCC and CSG
Current carrying
General Diagnostic
n/a In Non both Standard practice in the field
HV+ MV
all all
89 Electric field measurement
An electro-optic sensor for non-invasive electric field measurements. The technique is not sensible to magntic field and temperature variations.
Control and Acces-sories
General Diagnostic
n/a In Non Per. Prototype available HV+ MV
all all
90 Temperature Measurement
Temperature measurement based on detection of Infrared radiation.
Current carrying
Temperature
n/a In Min Con. Commercial product available
HV Gas GIS
91 Temperature Measure-ment
Temperature monitoring of GIS contacts based on IR technology.
Current carrying
Temperature
n/a In Min Con. Theoretical Concept HV+ MV
Gas GIS
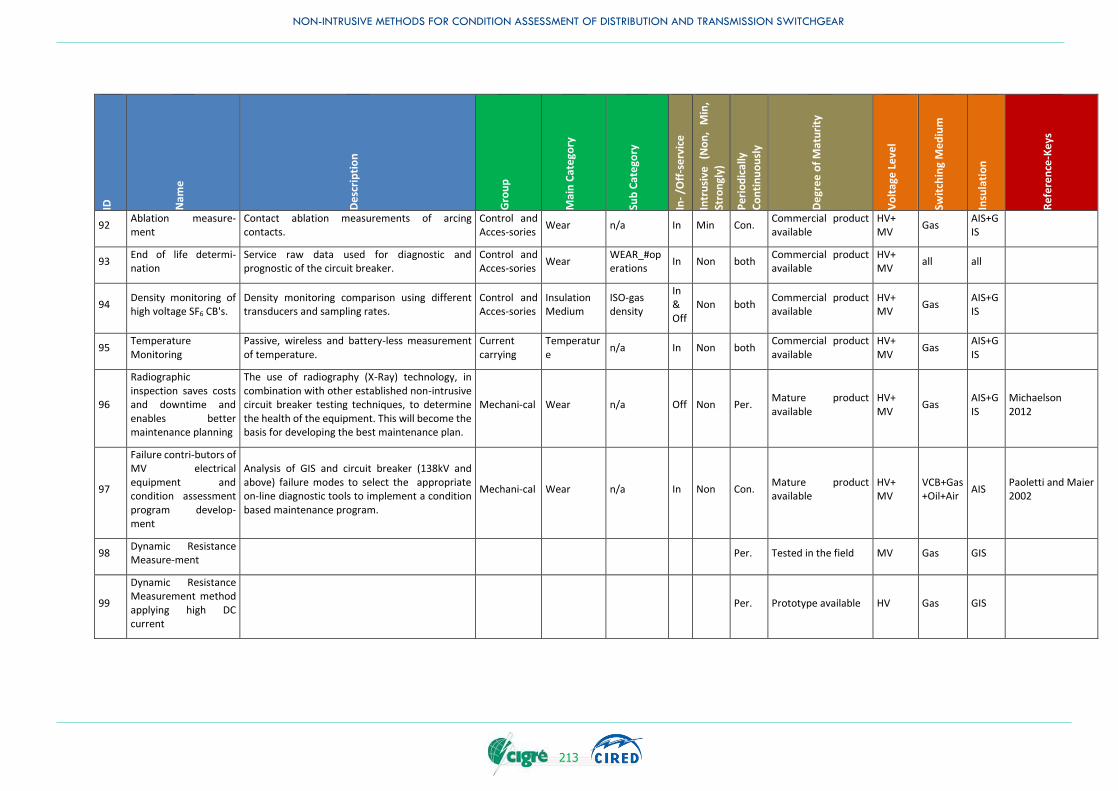
NON-INTRUSIVE METHODS FOR CONDITION ASSESSMENT OF DISTRIBUTION AND TRANSMISSION SWITCHGEAR
213
ID
Nam
e
De
scri
pti
on
Gro
up
Mai
n C
ate
gory
Sub
Cat
ego
ry
In-
/Off
-se
rvic
e
Intr
usi
ve
(No
n,
Min
,
Stro
ngl
y)
Pe
rio
dic
ally
Co
nti
nu
ou
sly
De
gre
e o
f M
atu
rity
Vo
ltag
e L
eve
l
Swit
chin
g M
ed
ium
Insu
lati
on
Re
fere
nce
-Ke
ys
92 Ablation measure-ment
Contact ablation measurements of arcing contacts.
Control and Acces-sories
Wear n/a In Min Con. Commercial product available
HV+ MV
Gas AIS+GIS
93 End of life determi-nation
Service raw data used for diagnostic and prognostic of the circuit breaker.
Control and Acces-sories
Wear WEAR_#operations
In Non both Commercial product available
HV+ MV
all all
94 Density monitoring of high voltage SF6 CB's.
Density monitoring comparison using different transducers and sampling rates.
Control and Acces-sories
Insulation Medium
ISO-gas density
In & Off
Non both Commercial product available
HV+ MV
Gas AIS+GIS
95 Temperature Monitoring
Passive, wireless and battery-less measurement of temperature.
Current carrying
Temperature
n/a In Non both Commercial product available
HV+ MV
Gas AIS+GIS
96
Radiographic inspection saves costs and downtime and enables better maintenance planning
The use of radiography (X-Ray) technology, in combination with other established non-intrusive circuit breaker testing techniques, to determine the health of the equipment. This will become the basis for developing the best maintenance plan.
Mechani-cal Wear n/a Off Non Per. Mature product available
HV+ MV
Gas AIS+GIS
Michaelson 2012
97
Failure contri-butors of MV electrical equipment and condition assessment program develop-ment
Analysis of GIS and circuit breaker (138kV and above) failure modes to select the appropriate on-line diagnostic tools to implement a condition based maintenance program.
Mechani-cal Wear n/a In Non Con. Mature product available
HV+ MV
VCB+Gas+Oil+Air
AIS Paoletti and Maier 2002
98 Dynamic Resistance Measure-ment
Per. Tested in the field MV Gas GIS
99
Dynamic Resistance Measurement method applying high DC current
Per. Prototype available HV Gas GIS
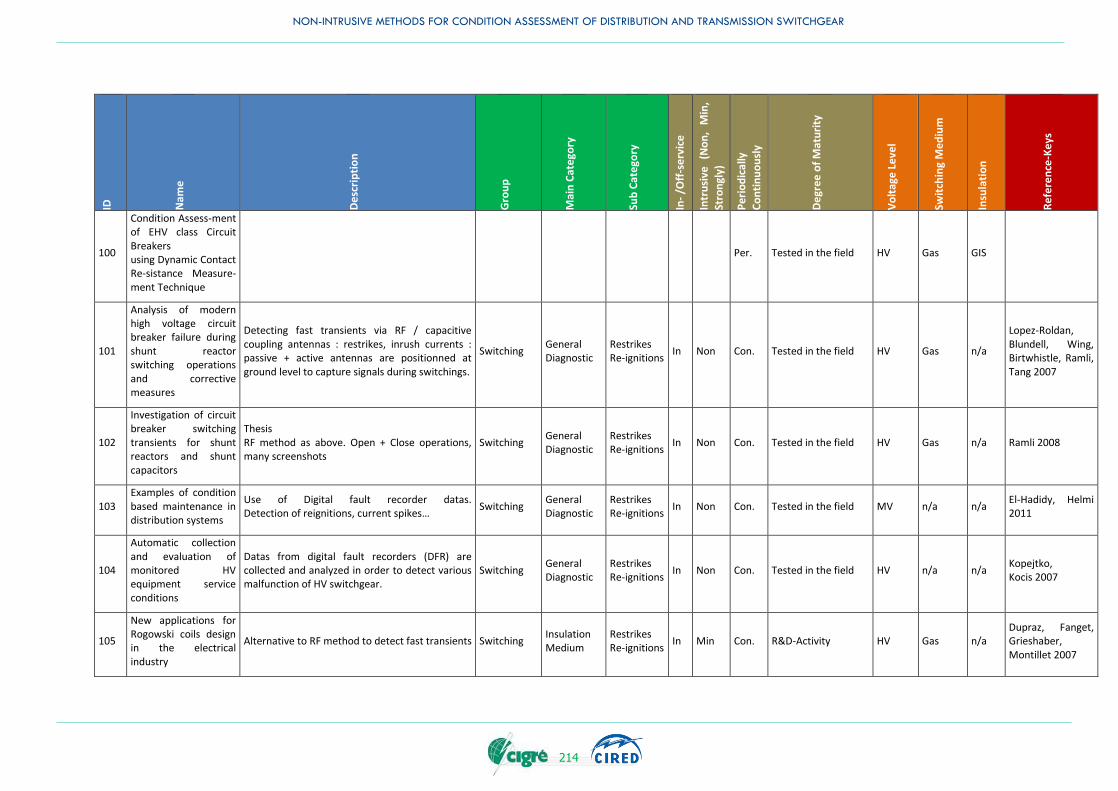
NON-INTRUSIVE METHODS FOR CONDITION ASSESSMENT OF DISTRIBUTION AND TRANSMISSION SWITCHGEAR
214
ID
Nam
e
De
scri
pti
on
Gro
up
Mai
n C
ate
gory
Sub
Cat
ego
ry
In-
/Off
-se
rvic
e
Intr
usi
ve
(No
n,
Min
,
Stro
ngl
y)
Pe
rio
dic
ally
Co
nti
nu
ou
sly
De
gre
e o
f M
atu
rity
Vo
ltag
e L
eve
l
Swit
chin
g M
ed
ium
Insu
lati
on
Re
fere
nce
-Ke
ys
100
Condition Assess-ment of EHV class Circuit Breakers using Dynamic Contact Re-sistance Measure-ment Technique
Per. Tested in the field HV Gas GIS
101
Analysis of modern high voltage circuit breaker failure during shunt reactor switching operations and corrective measures
Detecting fast transients via RF / capacitive coupling antennas : restrikes, inrush currents : passive + active antennas are positionned at ground level to capture signals during switchings.
Switching General Diagnostic
Restrikes Re-ignitions
In Non Con. Tested in the field HV Gas n/a
Lopez-Roldan, Blundell, Wing, Birtwhistle, Ramli, Tang 2007
102
Investigation of circuit breaker switching transients for shunt reactors and shunt capacitors
Thesis RF method as above. Open + Close operations, many screenshots
Switching General Diagnostic
Restrikes Re-ignitions
In Non Con. Tested in the field HV Gas n/a Ramli 2008
103 Examples of condition based maintenance in distribution systems
Use of Digital fault recorder datas. Detection of reignitions, current spikes…
Switching General Diagnostic
Restrikes Re-ignitions
In Non Con. Tested in the field MV n/a n/a El-Hadidy, Helmi 2011
104
Automatic collection and evaluation of monitored HV equipment service conditions
Datas from digital fault recorders (DFR) are collected and analyzed in order to detect various malfunction of HV switchgear.
Switching General Diagnostic
Restrikes Re-ignitions
In Non Con. Tested in the field HV n/a n/a Kopejtko, Kocis 2007
105
New applications for Rogowski coils design in the electrical industry
Alternative to RF method to detect fast transients Switching Insulation Medium
Restrikes Re-ignitions
In Min Con. R&D-Activity HV Gas n/a Dupraz, Fanget, Grieshaber, Montillet 2007
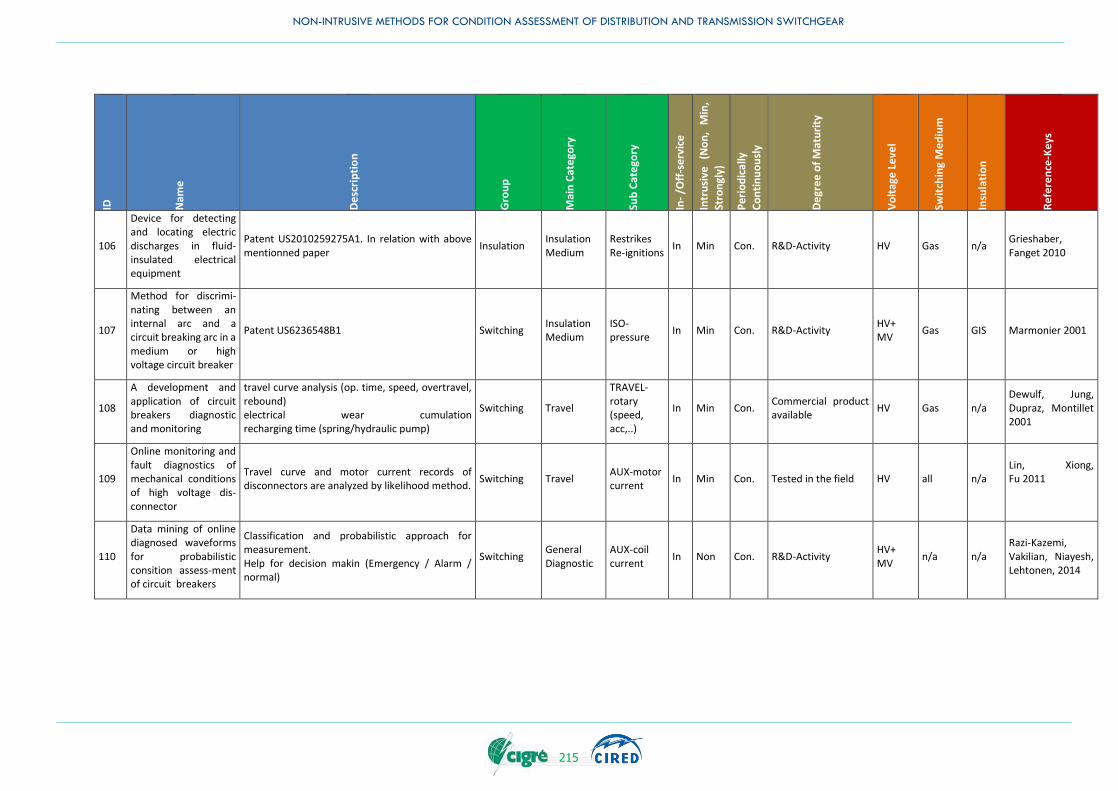
NON-INTRUSIVE METHODS FOR CONDITION ASSESSMENT OF DISTRIBUTION AND TRANSMISSION SWITCHGEAR
215
ID
Nam
e
De
scri
pti
on
Gro
up
Mai
n C
ate
gory
Sub
Cat
ego
ry
In-
/Off
-se
rvic
e
Intr
usi
ve
(No
n,
Min
,
Stro
ngl
y)
Pe
rio
dic
ally
Co
nti
nu
ou
sly
De
gre
e o
f M
atu
rity
Vo
ltag
e L
eve
l
Swit
chin
g M
ed
ium
Insu
lati
on
Re
fere
nce
-Ke
ys
106
Device for detecting and locating electric discharges in fluid-insulated electrical equipment
Patent US2010259275A1. In relation with above mentionned paper
Insulation Insulation Medium
Restrikes Re-ignitions
In Min Con. R&D-Activity HV Gas n/a Grieshaber, Fanget 2010
107
Method for discrimi-nating between an internal arc and a circuit breaking arc in a medium or high voltage circuit breaker
Patent US6236548B1 Switching Insulation Medium
ISO-pressure
In Min Con. R&D-Activity HV+ MV
Gas GIS Marmonier 2001
108
A development and application of circuit breakers diagnostic and monitoring
travel curve analysis (op. time, speed, overtravel, rebound) electrical wear cumulation recharging time (spring/hydraulic pump)
Switching Travel
TRAVEL-rotary (speed, acc,..)
In Min Con. Commercial product available
HV Gas n/a Dewulf, Jung, Dupraz, Montillet 2001
109
Online monitoring and fault diagnostics of mechanical conditions of high voltage dis-connector
Travel curve and motor current records of disconnectors are analyzed by likelihood method.
Switching Travel AUX-motor current
In Min Con. Tested in the field HV all n/a Lin, Xiong, Fu 2011
110
Data mining of online diagnosed waveforms for probabilistic consition assess-ment of circuit breakers
Classification and probabilistic approach for measurement. Help for decision makin (Emergency / Alarm / normal)
Switching General Diagnostic
AUX-coil current
In Non Con. R&D-Activity HV+ MV
n/a n/a Razi-Kazemi, Vakilian, Niayesh, Lehtonen, 2014