Meretrix meretrix) at environmentally relevant concentrations
24
1 Supplementary Information Functionalized polystyrene nanoplastics induced energy homeostasis imbalance and immunomodulation dysfunction of marine clams (Meretrix meretrix) at environmentally relevant concentrations Liuqingqing Liu a , Hao Zheng a,b, *, Liping Luan a , Xianxiang Luo a,b, *, Xiao Wang a,b , Hui Lu a , Yan Li a , Liuying Wen c , Fengmin Li a,b , Jian Zhao a,b a Institute of Coastal Environmental Pollution Control, Frontiers Science Center for Deep Ocean Multispheres and Earth System, Key Laboratory of Marine Environment and Ecology, Ministry of Education, Ocean University of China, Qingdao 266100 China b Laboratory for Marine Ecology and Environmental Science, Qingdao National Laboratory for Marine Science and Technology, Qingdao 266237, China c Tobacco Research Institute, Chinese Academy of Agricultural Science, Qingdao 266101, China *Corresponding authors: [email protected] (Dr. Zheng); [email protected] (Dr. Luo) Name of the journal: Environmental Science: Nano Date of the document prepared: May 11, 2021 Environmentally relevant concentrations of MPs and NPs Determination of the clam ingestion rate and oxygen consumption rate Number of pages: 22 Number of figures: 9 Number of tables: 4 Electronic Supplementary Material (ESI) for Environmental Science: Nano. This journal is © The Royal Society of Chemistry 2021
Transcript of Meretrix meretrix) at environmentally relevant concentrations
1
Supplementary Information
Functionalized polystyrene nanoplastics induced energy homeostasis
imbalance and immunomodulation dysfunction of marine clams
(Meretrix meretrix) at environmentally relevant concentrations
Liuqingqing Liua, Hao Zhenga,b,*, Liping Luana, Xianxiang Luoa,b,*, Xiao Wanga,b,
Hui Lua, Yan Lia, Liuying Wenc, Fengmin Lia,b, Jian Zhaoa,b
aInstitute of Coastal Environmental Pollution Control, Frontiers Science Center for Deep
Ocean Multispheres and Earth System, Key Laboratory of Marine Environment and Ecology,
Ministry of Education, Ocean University of China, Qingdao 266100 China
bLaboratory for Marine Ecology and Environmental Science, Qingdao National Laboratory for
Marine Science and Technology, Qingdao 266237, China
cTobacco Research Institute, Chinese Academy of Agricultural Science, Qingdao 266101,
China
*Corresponding authors: [email protected] (Dr. Zheng);
[email protected] (Dr. Luo)
Name of the journal: Environmental Science: NanoDate of the document prepared: May 11, 2021Environmentally relevant concentrations of MPs and NPsDetermination of the clam ingestion rate and oxygen consumption rateNumber of pages: 22Number of figures: 9Number of tables: 4
Electronic Supplementary Material (ESI) for Environmental Science: Nano.This journal is © The Royal Society of Chemistry 2021
2
Environmentally relevant concentrations of MPs and NPs
The exposure concentration of NPs (0.02–2.0 mg L-1) in the present study was
selected according to the reported and predicted environmentally relevant
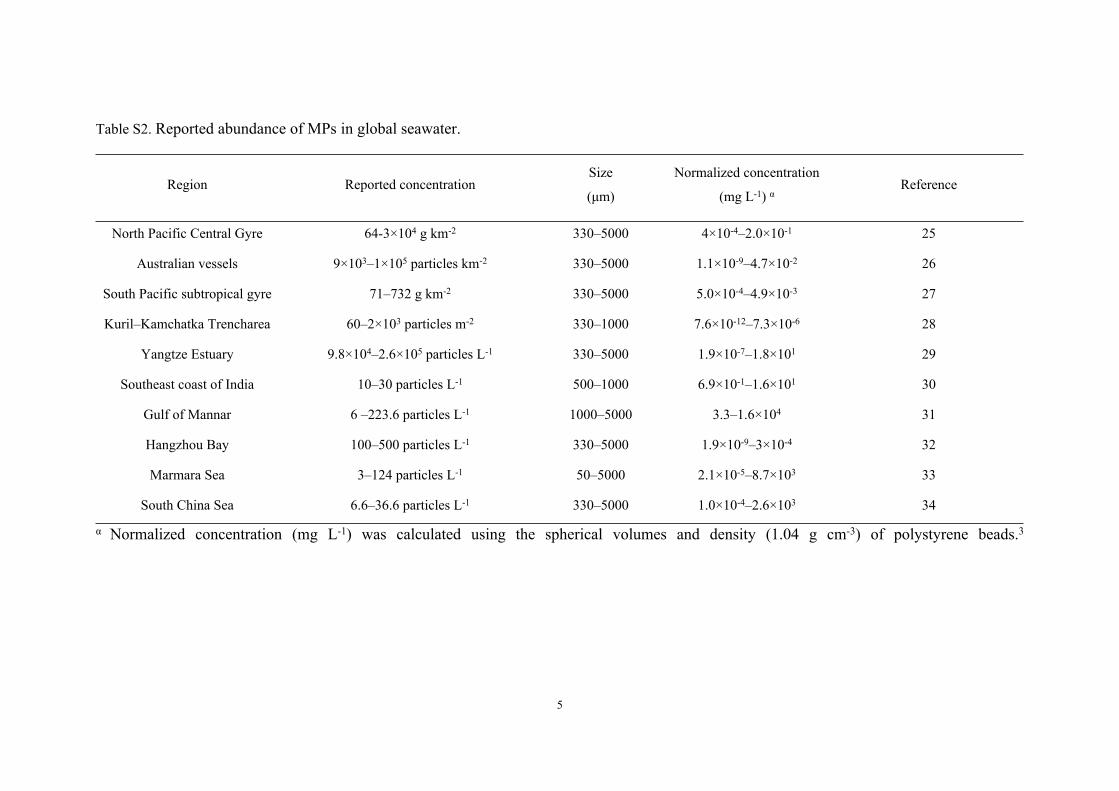
concentrations of MPs and NPs. As shown in Table S2, the reported abundance of MPs
in seawater ranged 7.6×10⁻¹²–1.6×10⁴ mg L-1. Weathering or ageing of a single MP
particle can yield millions to billions of NPs.1 Our previous study reported that the mass
yield of PS NPs (~75.2 nm) from photodegradation (a common ageing process in
marine ecosystem) of PS MPs (∼38.6 μm) was 7.03 ± 0.37% (w%).2 Accordingly, the
estimated concentration of PS NPs in marine environment could be up to 5.3×10⁻¹⁰–
1.1×10³ mg L-1. In addition,3 predicted that the environmental concentration of NPs (50
nm) was 1.0×10⁻⁹–1.5×10⁻² mg L-1 using a theoretical 3D fragmentation model. The
highest predicted concentration of 0.015 mg L-1 was at the same magnitude order of the
lowest exposure concentration of 0.02 mg L-1 used in this study. Moreover, the
concentrations of NPs used in previous toxicological investigations ranged 0.1–100 mg
L-1 (Table S1). Therefore, to be environmentally relevant and comparable with previous
studies, we selected 0.02, 0.2, and 2 mg L-1 as the exposure concentrations of two NPs
in the present study.
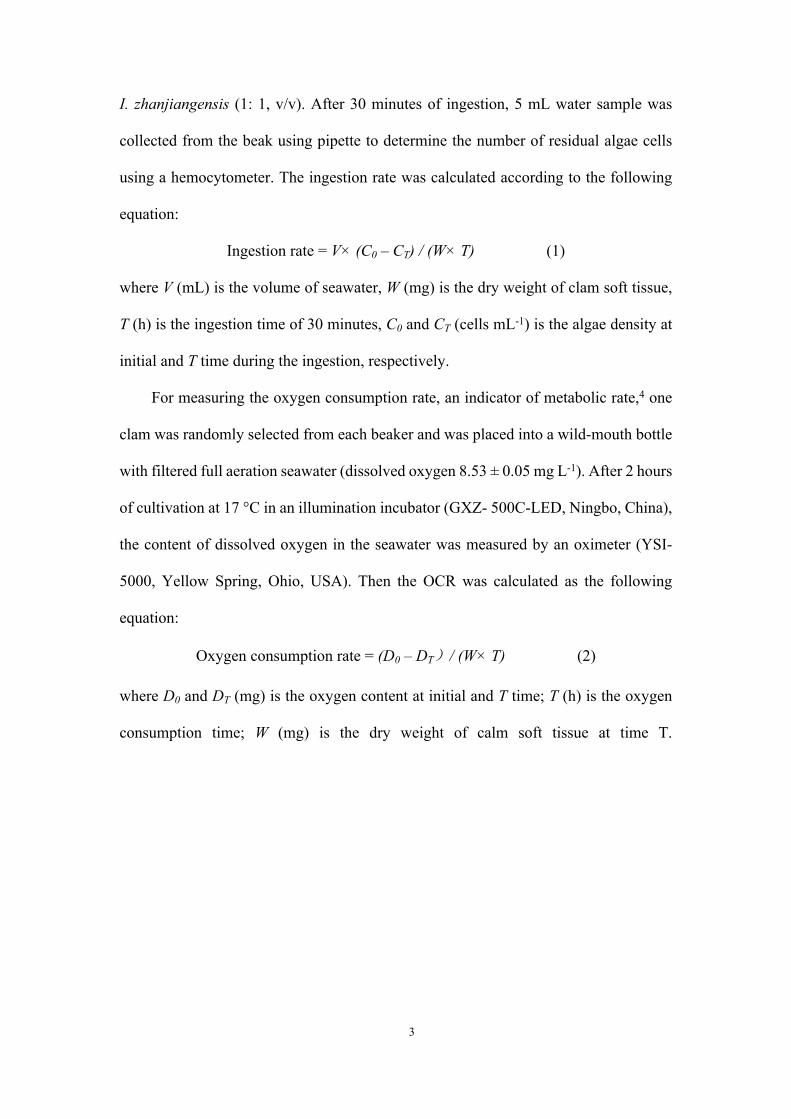
Determination of the clam ingestion rate and oxygen consumption rate
Ingestion rate, an indicator of feeding activity of clam,4 is defined as the quantity
of microalgae ingested by per unit body weight of clams at given time.5 In order to
determine the ingestion rate, one clam was randomly selected from each beaker after 7
days of exposure and maintained in a 500 mL glass beaker containing 400 mL filtered
seawater. The clam was fed with the 2 × 10⁵ cells mL-1 mixed algae of C. meülleri and
3
I. zhanjiangensis (1: 1, v/v). After 30 minutes of ingestion, 5 mL water sample was
collected from the beak using pipette to determine the number of residual algae cells
using a hemocytometer. The ingestion rate was calculated according to the following
equation:
Ingestion rate = V× (C0 – CT) / (W× T) (1)
where V (mL) is the volume of seawater, W (mg) is the dry weight of clam soft tissue,
T (h) is the ingestion time of 30 minutes, C0 and CT (cells mL-1) is the algae density at
initial and T time during the ingestion, respectively.
For measuring the oxygen consumption rate, an indicator of metabolic rate,4 one
clam was randomly selected from each beaker and was placed into a wild-mouth bottle
with filtered full aeration seawater (dissolved oxygen 8.53 ± 0.05 mg L-1). After 2 hours
of cultivation at 17 °C in an illumination incubator (GXZ- 500C-LED, Ningbo, China),
the content of dissolved oxygen in the seawater was measured by an oximeter (YSI-
5000, Yellow Spring, Ohio, USA). Then the OCR was calculated as the following
equation:
Oxygen consumption rate = (D0 – DT)/ (W× T) (2)
where D0 and DT (mg) is the oxygen content at initial and T time; T (h) is the oxygen
consumption time; W (mg) is the dry weight of calm soft tissue at time T.
4
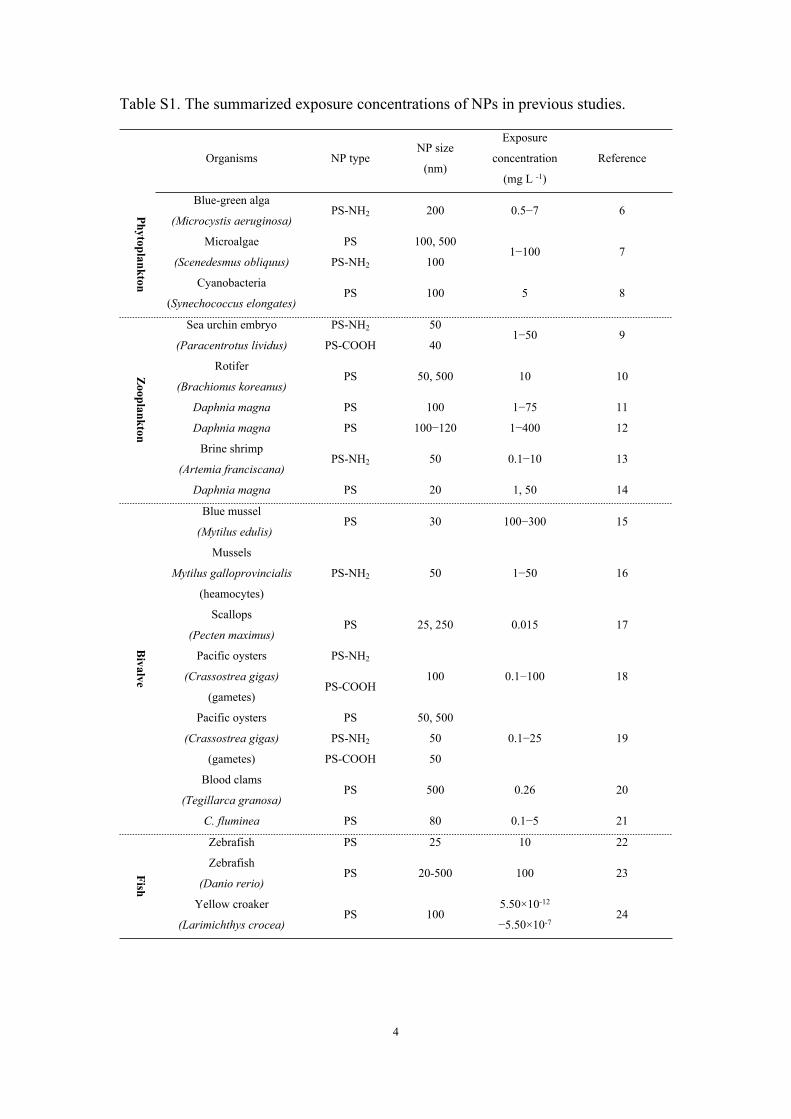
Table S1. The summarized exposure concentrations of NPs in previous studies.
Organisms NP typeNP size
(nm)
Exposure
concentration
(mg L -1)
Reference
Blue-green alga
(Microcystis aeruginosa)PS-NH2 200 0.5−7 6
PS 100, 500Microalgae
(Scenedesmus obliquus) PS-NH2 1001−100 7
Phytoplankton Cyanobacteria
(Synechococcus elongates)PS 100 5 8
PS-NH2 50Sea urchin embryo
(Paracentrotus lividus) PS-COOH 401−50 9
Rotifer
(Brachionus koreanus)PS 50, 500 10 10
Daphnia magna PS 100 1−75 11
Daphnia magna PS 100−120 1−400 12
Brine shrimp
(Artemia franciscana)PS-NH2 50 0.1−10 13
Zooplankton
Daphnia magna PS 20 1, 50 14
Blue mussel
(Mytilus edulis)PS 30 100−300 15
Mussels
Mytilus galloprovincialis
(heamocytes)
PS-NH2 50 1−50 16
Scallops
(Pecten maximus)PS 25, 250 0.015 17
PS-NH2Pacific oysters
(Crassostrea gigas)
(gametes)PS-COOH
100 0.1−100 18
PS 50, 500
PS-NH2 50
Pacific oysters
(Crassostrea gigas)
(gametes) PS-COOH 50
0.1−25 19
Blood clams
(Tegillarca granosa)PS 500 0.26 20
Bivalve
C. fluminea PS 80 0.1−5 21
Zebrafish PS 25 10 22
Zebrafish
(Danio rerio)PS 20-500 100 23Fish
Yellow croaker
(Larimichthys crocea)PS 100
5.50×10⁻¹²
−5.50×10⁻⁷ 24
5
Table S2. Reported abundance of MPs in global seawater.
Region Reported concentrationSize
(μm)
Normalized concentration
(mg L-1) αReference
North Pacific Central Gyre 64-3×10⁴ g km-2 330–5000 4×10⁻⁴–2.0×10⁻¹ 25
Australian vessels 9×10³–1×10⁵ particles km-2 330–5000 1.1×10⁻⁹–4.7×10⁻² 26
South Pacific subtropical gyre 71–732 g km-2 330–5000 5.0×10⁻⁴–4.9×10⁻³ 27
Kuril–Kamchatka Trencharea 60–2×10³ particles m-2 330–1000 7.6×10⁻¹²–7.3×10⁻⁶ 28
Yangtze Estuary 9.8×10⁴–2.6×10⁵ particles L-1 330–5000 1.9×10⁻⁷–1.8×101 29
Southeast coast of India 10–30 particles L-1 500–1000 6.9×10⁻¹–1.6×101 30
Gulf of Mannar 6 –223.6 particles L-1 1000–5000 3.3–1.6×10⁴ 31
Hangzhou Bay 100–500 particles L-1 330–5000 1.9×10⁻⁹–3×10⁻⁴ 32
Marmara Sea 3–124 particles L-1 50–5000 2.1×10⁻⁵–8.7×10³ 33
South China Sea 6.6–36.6 particles L-1 330–5000 1.0×10⁻⁴–2.6×10³ 34
α Normalized concentration (mg L-1) was calculated using the spherical volumes and density (1.04 g cm-3) of polystyrene beads.3
6
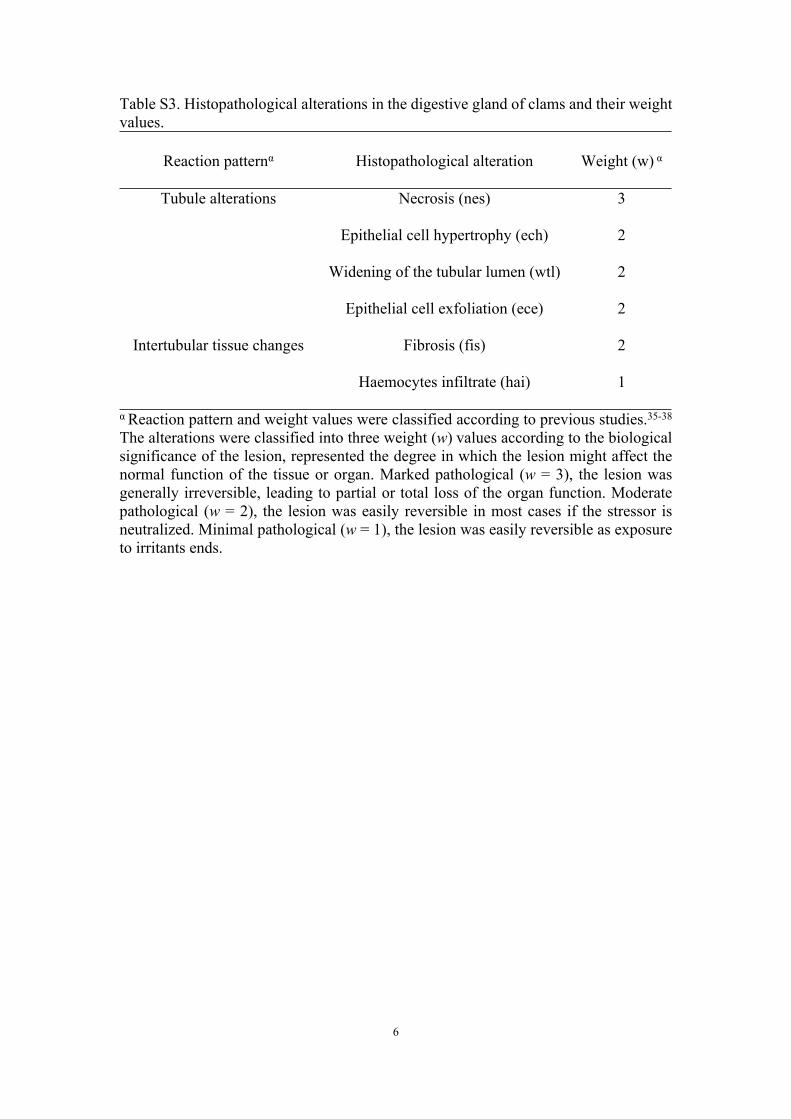
Table S3. Histopathological alterations in the digestive gland of clams and their weight values.
Reaction patternα Histopathological alteration Weight (w) α
Necrosis (nes) 3
Epithelial cell hypertrophy (ech) 2
Widening of the tubular lumen (wtl) 2
Tubule alterations
Epithelial cell exfoliation (ece) 2
Fibrosis (fis) 2Intertubular tissue changes
Haemocytes infiltrate (hai) 1
α Reaction pattern and weight values were classified according to previous studies.35-38 The alterations were classified into three weight (w) values according to the biological significance of the lesion, represented the degree in which the lesion might affect the normal function of the tissue or organ. Marked pathological (w = 3), the lesion was generally irreversible, leading to partial or total loss of the organ function. Moderate pathological (w = 2), the lesion was easily reversible in most cases if the stressor is neutralized. Minimal pathological (w = 1), the lesion was easily reversible as exposure to irritants ends.
7
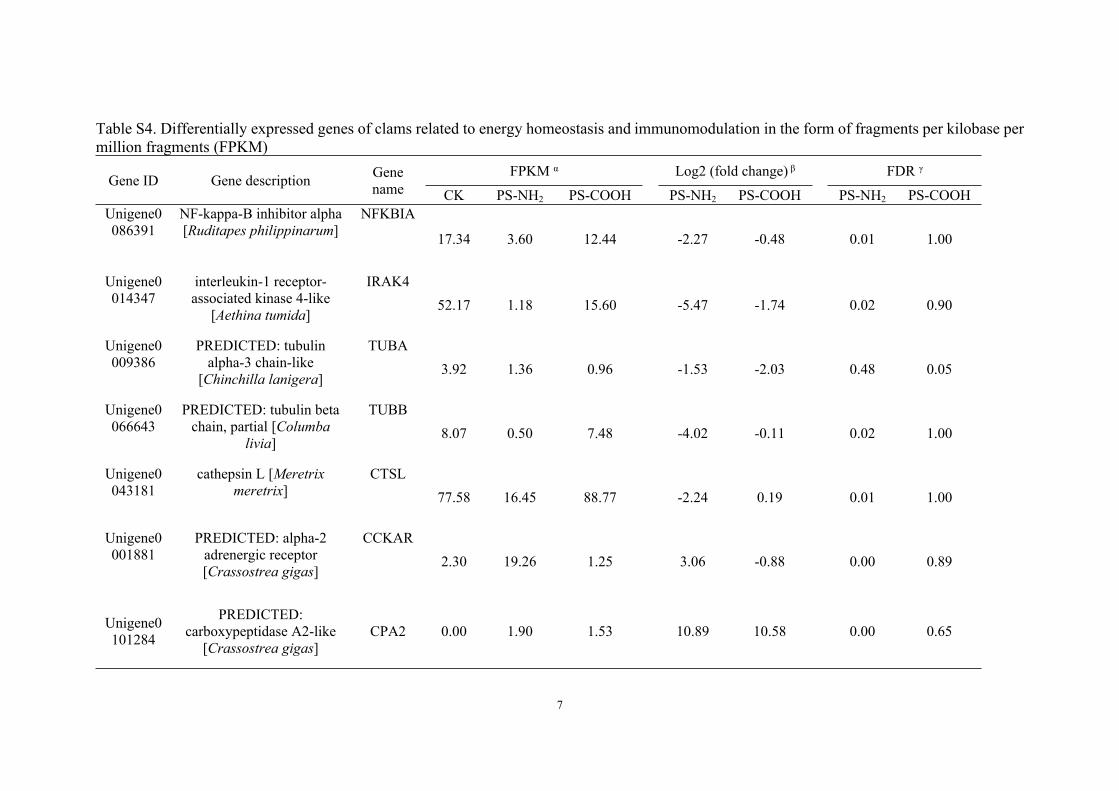
Table S4. Differentially expressed genes of clams related to energy homeostasis and immunomodulation in the form of fragments per kilobase per million fragments (FPKM)
FPKM α Log2 (fold change) β FDR γGene ID Gene description Gene
name CK PS-NH2 PS-COOH PS-NH2 PS-COOH PS-NH2 PS-COOHUnigene0086391
NF-kappa-B inhibitor alpha [Ruditapes philippinarum]
NFKBIA
17.34 3.60 12.44 -2.27 -0.48 0.01 1.00
Unigene0014347
interleukin-1 receptor-associated kinase 4-like
[Aethina tumida]
IRAK452.17 1.18 15.60 -5.47 -1.74 0.02 0.90
Unigene0009386
PREDICTED: tubulin alpha-3 chain-like
[Chinchilla lanigera]
TUBA3.92 1.36 0.96 -1.53 -2.03 0.48 0.05
Unigene0066643
PREDICTED: tubulin beta chain, partial [Columba
livia]
TUBB8.07 0.50 7.48 -4.02 -0.11 0.02 1.00
Unigene0043181
cathepsin L [Meretrix meretrix]
CTSL77.58 16.45 88.77 -2.24 0.19 0.01 1.00
Unigene0001881
PREDICTED: alpha-2 adrenergic receptor [Crassostrea gigas]
CCKAR2.30 19.26 1.25 3.06 -0.88 0.00 0.89
Unigene0101284
PREDICTED: carboxypeptidase A2-like
[Crassostrea gigas]CPA2 0.00 1.90 1.53 10.89 10.58 0.00 0.65
8
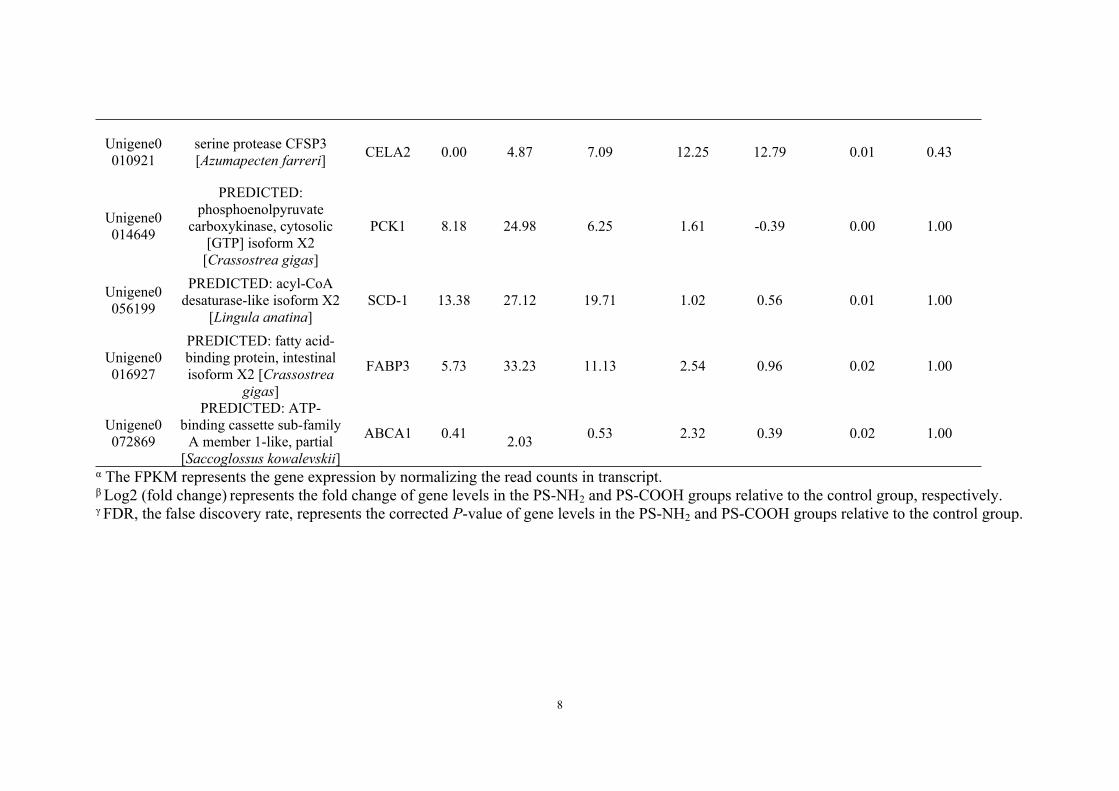
Unigene0010921
serine protease CFSP3 [Azumapecten farreri] CELA2 0.00 4.87 7.09 12.25 12.79 0.01 0.43
Unigene0014649
PREDICTED: phosphoenolpyruvate
carboxykinase, cytosolic [GTP] isoform X2
[Crassostrea gigas]
PCK1 8.18 24.98 6.25 1.61 -0.39 0.00 1.00
Unigene0056199
PREDICTED: acyl-CoA desaturase-like isoform X2
[Lingula anatina]SCD-1 13.38 27.12 19.71 1.02 0.56 0.01 1.00
Unigene0016927
PREDICTED: fatty acid-binding protein, intestinal isoform X2 [Crassostrea
gigas]
FABP3 5.73 33.23 11.13 2.54 0.96 0.02 1.00
Unigene0072869
PREDICTED: ATP-binding cassette sub-family
A member 1-like, partial [Saccoglossus kowalevskii]
ABCA1 0.41 2.03 0.53 2.32 0.39 0.02 1.00
α The FPKM represents the gene expression by normalizing the read counts in transcript.β Log2 (fold change) represents the fold change of gene levels in the PS-NH2 and PS-COOH groups relative to the control group, respectively.γ FDR, the false discovery rate, represents the corrected P-value of gene levels in the PS-NH2 and PS-COOH groups relative to the control group.
9
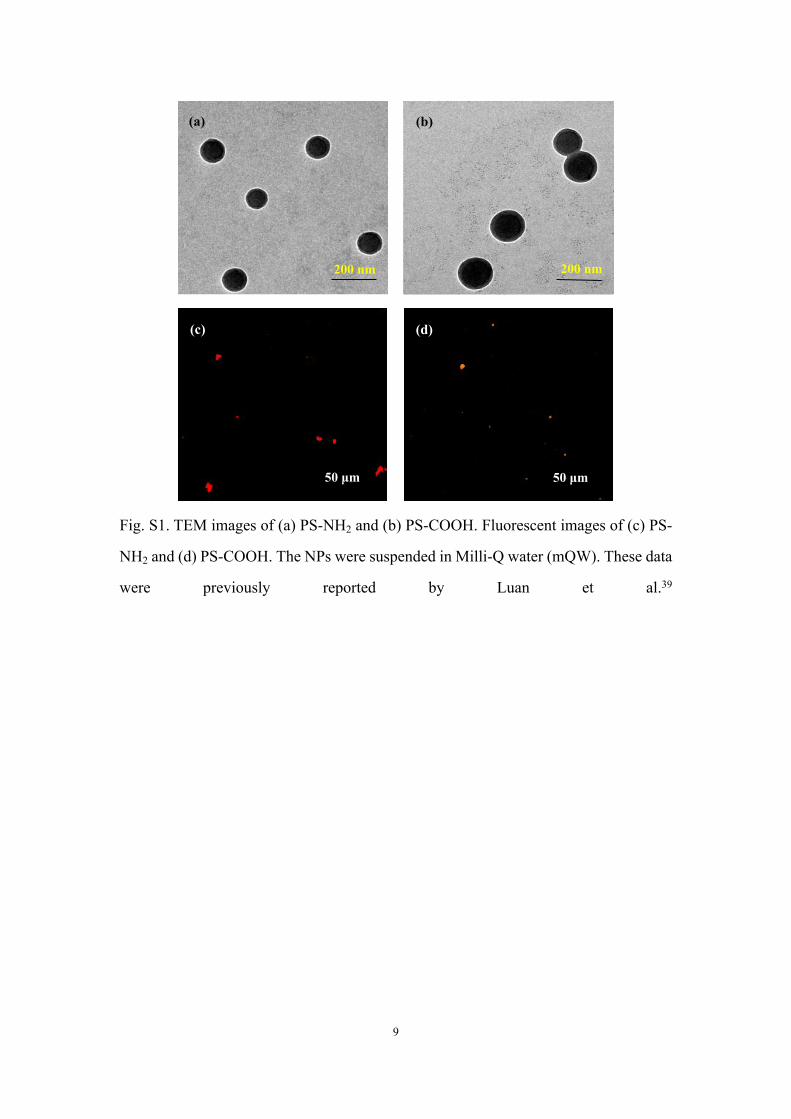
Fig. S1. TEM images of (a) PS-NH2 and (b) PS-COOH. Fluorescent images of (c) PS-
NH2 and (d) PS-COOH. The NPs were suspended in Milli-Q water (mQW). These data
were previously reported by Luan et al.39
50 μm
(c) (d)
50 μm
200 nm 200 nm
(a) (b)

10

11
Condition index Water content
Oxygen consumption rate
BioaccumulationHistopathological analysisTranscriptomic analysis
Waterborne exposure: 7 days Filtration rate
CK
0 mg L-1
PS-COOH PS-COOH PS-COOHCK
0 mg L-1 0.02 mg L-1 0.2 mg L-1 2 mg L-1
1.6 L filtered NSW 17± 1 °CPS-NH2PS-COOH
2 h 0.5 h Shell weightSoft tissue weight
PS-NH2
0.02 mg L-1 0.2 mg L-1
PS-NH2PS-NH2
2 mg L-1
×6 ×6 ×6 ×6
×6×6×6×6
Digestive
glands
HemolymphImmunity analysis Haemocyte count Phagocytosis activity Lysosomal membrane stability
12
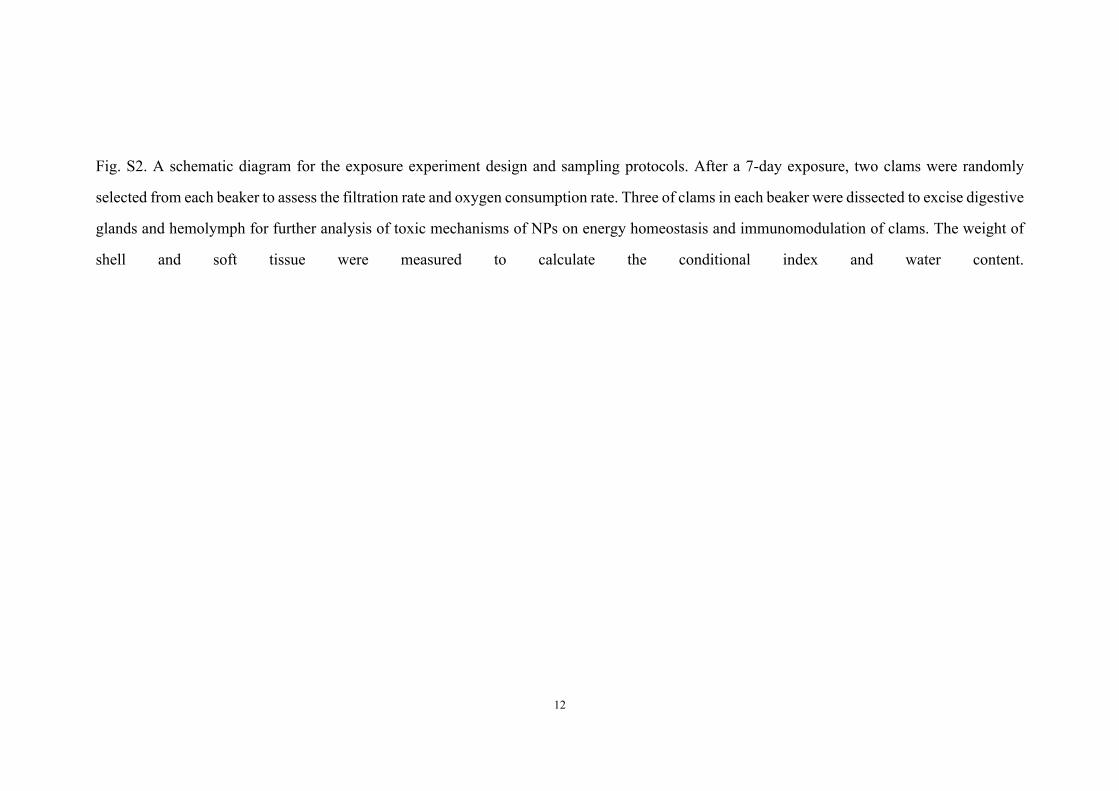
Fig. S2. A schematic diagram for the exposure experiment design and sampling protocols. After a 7-day exposure, two clams were randomly
selected from each beaker to assess the filtration rate and oxygen consumption rate. Three of clams in each beaker were dissected to excise digestive
glands and hemolymph for further analysis of toxic mechanisms of NPs on energy homeostasis and immunomodulation of clams. The weight of
shell and soft tissue were measured to calculate the conditional index and water content.
13
4000 3600 3200 2800 2400 2000 1600 1200 800 400
Abs
orba
nce
(a.u
.)
Wavenumber (cm -1)
aromatic aliphatic
C-H
phenyl ringC=C
phenyl ringC-H
1735C=O 1106
C-O1351C-N
3400-OH
PS-NH2
PS-COOH
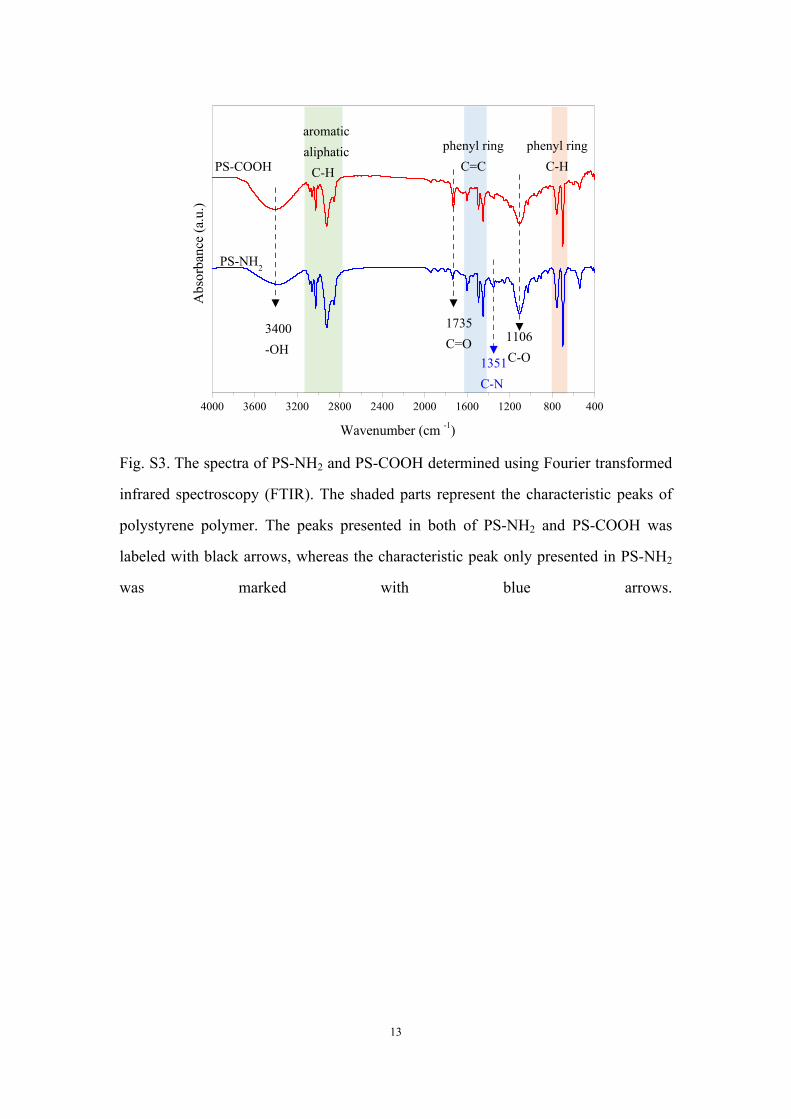
Fig. S3. The spectra of PS-NH2 and PS-COOH determined using Fourier transformed
infrared spectroscopy (FTIR). The shaded parts represent the characteristic peaks of
polystyrene polymer. The peaks presented in both of PS-NH2 and PS-COOH was
labeled with black arrows, whereas the characteristic peak only presented in PS-NH2
was marked with blue arrows.
14
(a) (b) (c) (d)
(i) (j)
(e)
(h)
(f)
(g)
(e1) (f1)
(g1) (h1)
(i1) (j1)
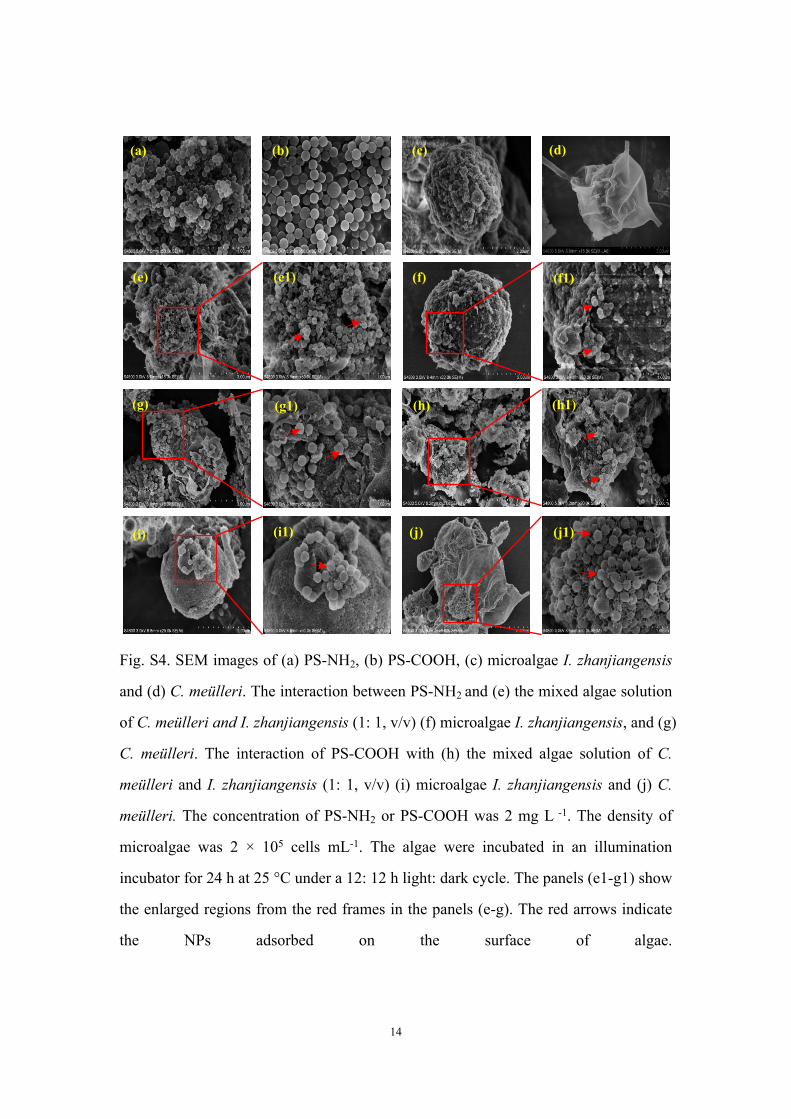
Fig. S4. SEM images of (a) PS-NH2, (b) PS-COOH, (c) microalgae I. zhanjiangensis
and (d) C. meülleri. The interaction between PS-NH2 and (e) the mixed algae solution
of C. meülleri and I. zhanjiangensis (1: 1, v/v) (f) microalgae I. zhanjiangensis, and (g)
C. meülleri. The interaction of PS-COOH with (h) the mixed algae solution of C.
meülleri and I. zhanjiangensis (1: 1, v/v) (i) microalgae I. zhanjiangensis and (j) C.
meülleri. The concentration of PS-NH2 or PS-COOH was 2 mg L -1. The density of
microalgae was 2 × 10⁵ cells mL-1. The algae were incubated in an illumination
incubator for 24 h at 25 °C under a 12: 12 h light: dark cycle. The panels (e1-g1) show
the enlarged regions from the red frames in the panels (e-g). The red arrows indicate
the NPs adsorbed on the surface of algae.
15
12 h
CK PS-NH2
PS-COOH
16 h
CK PS-NH2
PS-COOH
24 h
CK PS-NH2
PS-COOH
0 h
CK PS-NH2
PS-COOH
4 h
CK PS-NH2
PS-COOH
8 h
CK PS-NH2
PS-COOH
0 4 8 12 16 20 24 28#,##0.000;[Re30](#,##0...
#,##0.000;[Re30](#,##0...
#,##0.000;[Re30](#,##0...
#,##0.000;[Re30](#,##0...
#,##0.000;[Re30](#,##0...CKPS-NH2PS-COOH
Time (h)
Opt
ical
den
sity
(420
nm
)
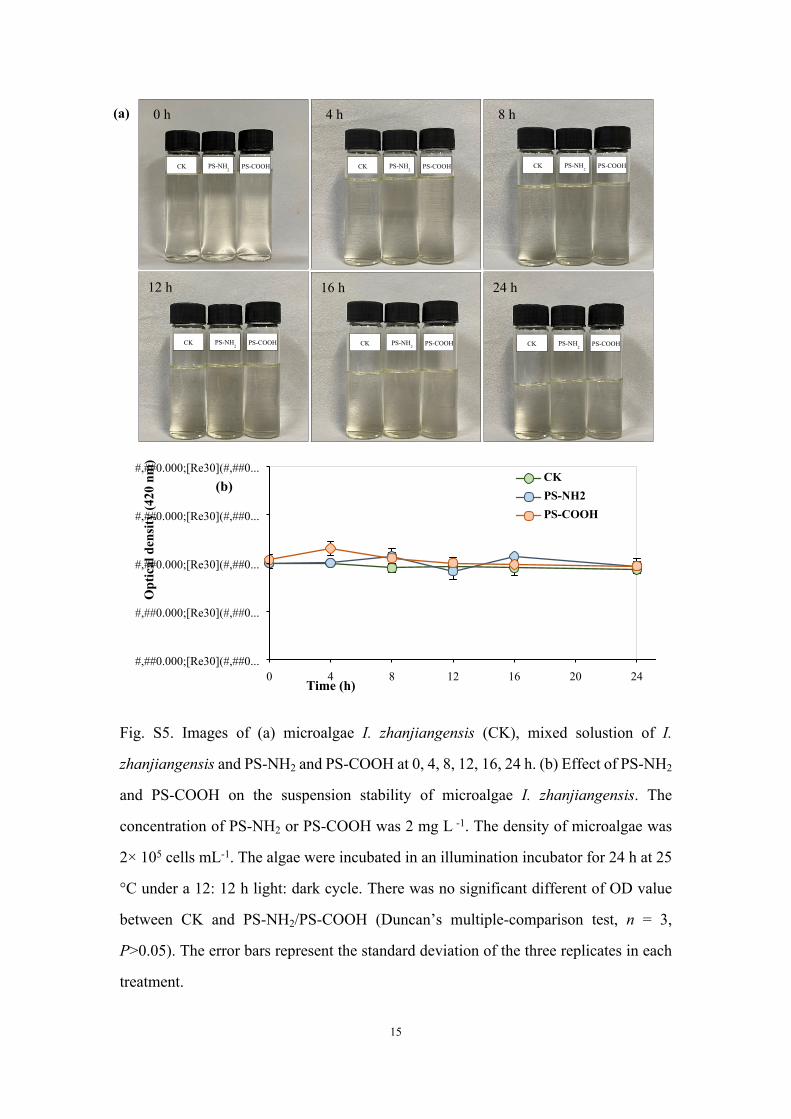
Fig. S5. Images of (a) microalgae I. zhanjiangensis (CK), mixed solustion of I.
zhanjiangensis and PS-NH2 and PS-COOH at 0, 4, 8, 12, 16, 24 h. (b) Effect of PS-NH2
and PS-COOH on the suspension stability of microalgae I. zhanjiangensis. The
concentration of PS-NH2 or PS-COOH was 2 mg L -1. The density of microalgae was
2× 10⁵ cells mL-1. The algae were incubated in an illumination incubator for 24 h at 25
°C under a 12: 12 h light: dark cycle. There was no significant different of OD value
between CK and PS-NH2/PS-COOH (Duncan’s multiple-comparison test, n = 3,
P>0.05). The error bars represent the standard deviation of the three replicates in each
treatment.
(a)
(b)
16
ec
intdt tl
50μm
(a)
ece
wtl
(b)
50μm
ech
(d)
50μm
hai
50μm
(e)
nes
fis 50μm
(c)
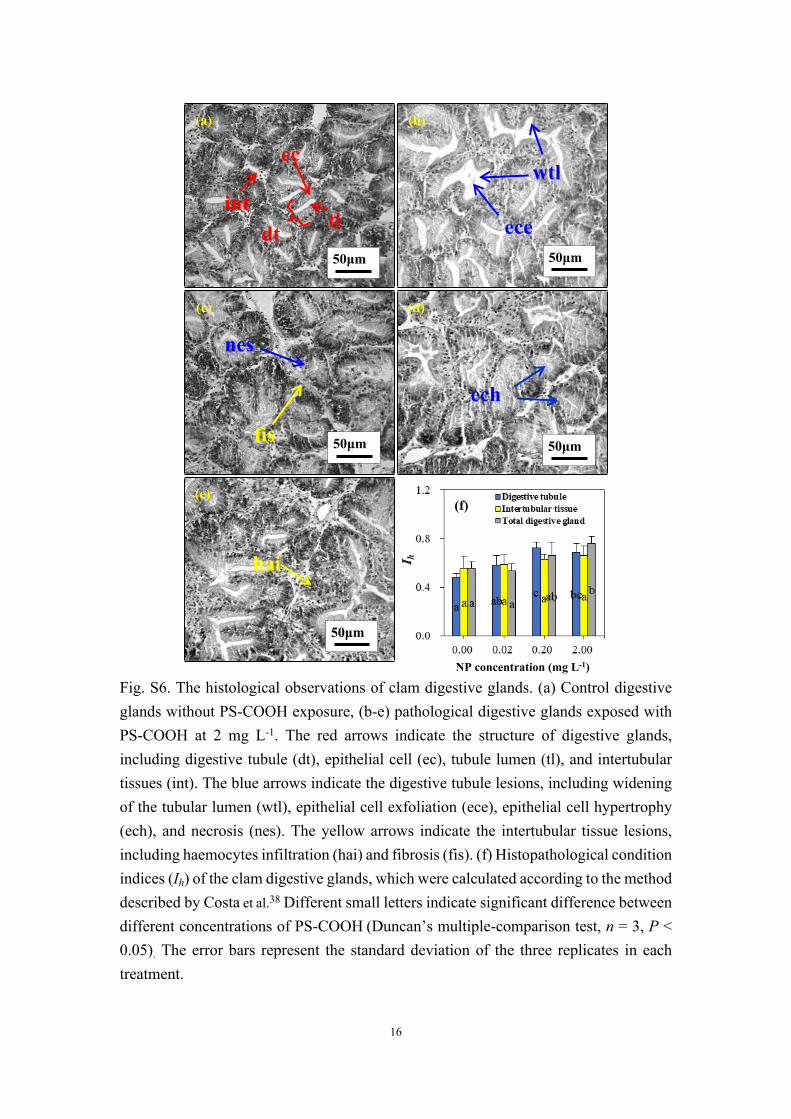
Fig. S6. The histological observations of clam digestive glands. (a) Control digestive glands without PS-COOH exposure, (b-e) pathological digestive glands exposed with PS-COOH at 2 mg L-1. The red arrows indicate the structure of digestive glands, including digestive tubule (dt), epithelial cell (ec), tubule lumen (tl), and intertubular tissues (int). The blue arrows indicate the digestive tubule lesions, including widening of the tubular lumen (wtl), epithelial cell exfoliation (ece), epithelial cell hypertrophy (ech), and necrosis (nes). The yellow arrows indicate the intertubular tissue lesions, including haemocytes infiltration (hai) and fibrosis (fis). (f) Histopathological condition indices (Ih) of the clam digestive glands, which were calculated according to the method described by Costa et al.38 Different small letters indicate significant difference between different concentrations of PS-COOH (Duncan’s multiple-comparison test, n = 3, P < 0.05). The error bars represent the standard deviation of the three replicates in each treatment.
NP concentration (mg L-1)
(f)
17
ec
int
dt
tl
50μm
(a)
50μm
(b)
50μm
(c)
50μm
(d)
ec
intdt tl
50μm
(e)
50μm
(f)
50μm
(g)
50μm
(h)
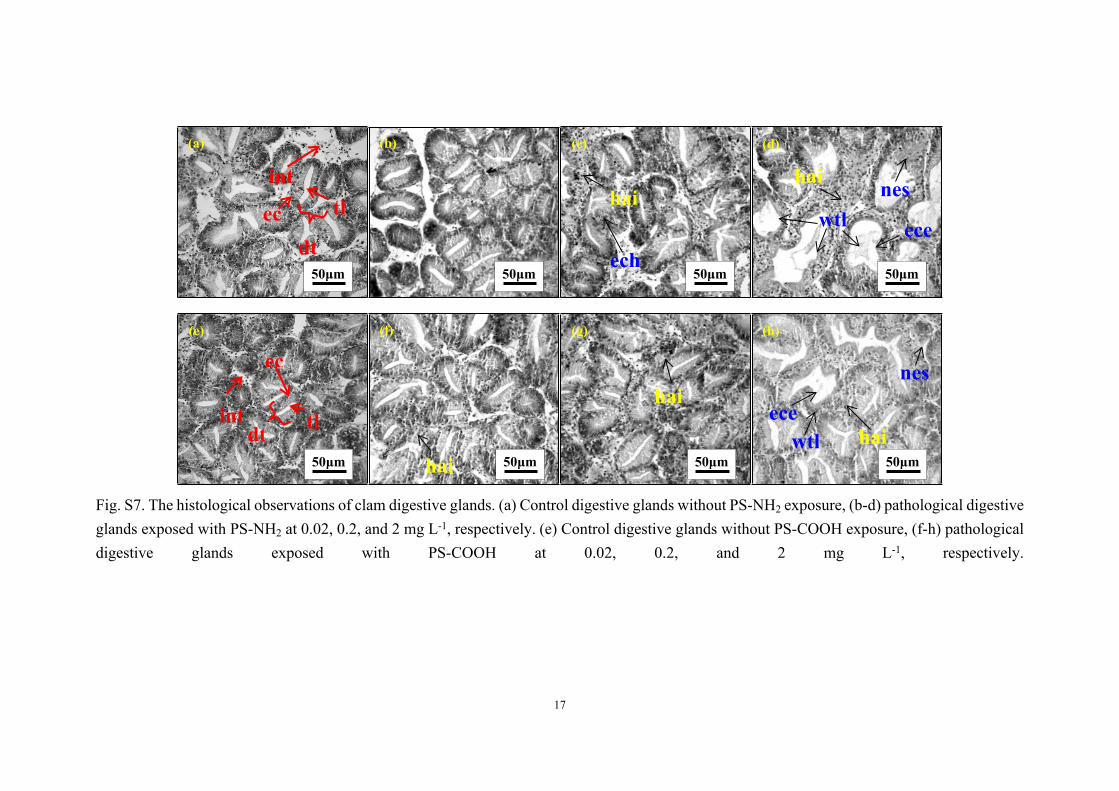
Fig. S7. The histological observations of clam digestive glands. (a) Control digestive glands without PS-NH2 exposure, (b-d) pathological digestive glands exposed with PS-NH2 at 0.02, 0.2, and 2 mg L-1, respectively. (e) Control digestive glands without PS-COOH exposure, (f-h) pathological digestive glands exposed with PS-COOH at 0.02, 0.2, and 2 mg L-1, respectively.
wtl
hai
ece
nes
wtl haiece
nes
hai
hai
ech
hai
18
292 305
940
548
Upregulated Downregulated0
200
400
600
800
1000PS-COOHPS-NH2
Cou
nts o
f D
EG
s
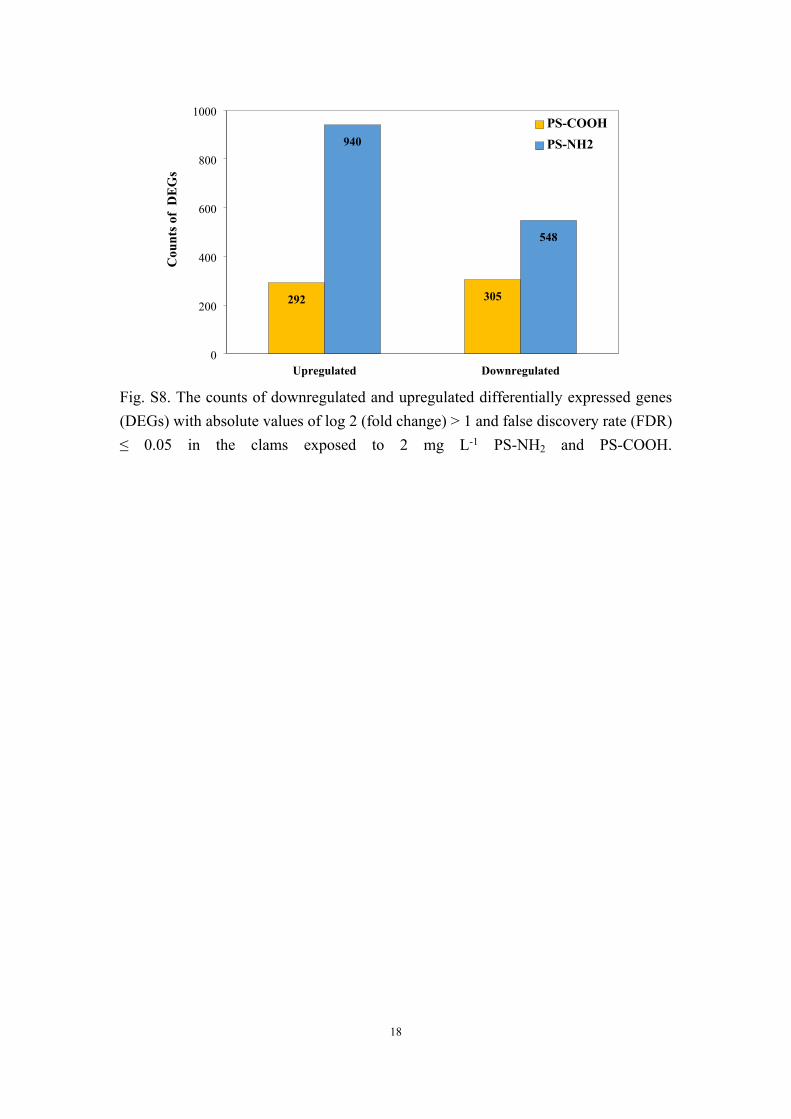
Fig. S8. The counts of downregulated and upregulated differentially expressed genes (DEGs) with absolute values of log 2 (fold change) > 1 and false discovery rate (FDR) ≤ 0.05 in the clams exposed to 2 mg L-1 PS-NH2 and PS-COOH.
19
0 5 10 15 20 25
2516
14777
53
21
176
54
33
22
2615
8555
43
139
83
257
1
62
1
0 5 10
32
11
00
1000
41
41
0000
12
000
12
0
211
0
41
0
10
1
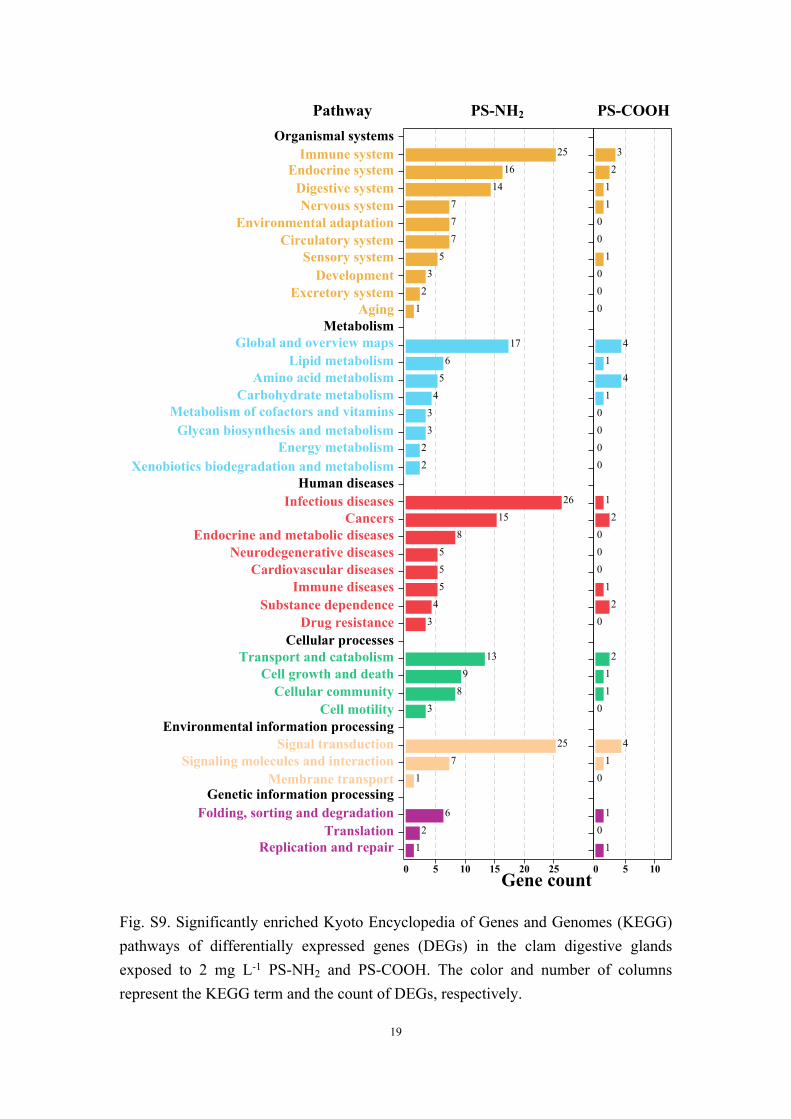
Fig. S9. Significantly enriched Kyoto Encyclopedia of Genes and Genomes (KEGG) pathways of differentially expressed genes (DEGs) in the clam digestive glands exposed to 2 mg L-1 PS-NH2 and PS-COOH. The color and number of columns represent the KEGG term and the count of DEGs, respectively.
Pathway PS-NH2 PS-COOH
Gene count
Aging
Lipid metabolism
Cancers
Cardiovascular diseases
Substance dependence
Cellular communityCell motility
Signal transduction
Immune systemEndocrine system
Digestive systemNervous system
Environmental adaptationCirculatory system
Sensory systemDevelopment
Excretory system
Organismal systems
MetabolismGlobal and overview maps
Amino acid metabolismCarbohydrate metabolism
Metabolism of cofactors and vitaminsGlycan biosynthesis and metabolism
Energy metabolismXenobiotics biodegradation and metabolism
Human diseasesInfectious diseases
Endocrine and metabolic diseasesNeurodegenerative diseases
Immune diseases
Drug resistanceCellular processes
Transport and catabolismCell growth and death
Environmental information processing
Signaling molecules and interactionMembrane transport
Genetic information processingFolding, sorting and degradation
TranslationReplication and repair
20
Reference
1. L. M. Hernandez, N. Yousefi and N. Tufenkji, Are there nanoplastics in your
personal care products?, Environ. Sci. Tech. Lett., 2017, 4, 280-285.
2. X. Wang, H. Zheng, J. Zhao, X. X. Luo, Z. Y. Wang and B. S. Xing,
Photodegradation elevated the toxicity of polystyrene microplastics to grouper
(Epinephelus moara) through disrupting hepatic lipid homeostasis, Environ.
Sci. Technol., 2020, 54, 6202-6212.
3. R. Lenz, K. Enders and T. G. Nielsen, Microplastic exposure studies should be
environmentally realistic, Proc. Natl. Acad. Sci. USA, 2016, 113, E4121-E4122.
4. T. Gardon, C. Reisser, C. Soyez, V. Quillien and G. Le Moullac, Microplastics
affect energy balance and gametogenesis in the pearl oyster Pinctada
margaritifera, Environ. Sci. Technol., 2018, 52, 5277-5286.
5. R. Sussarellu, M. Suquet, Y. Thomas, C. Lambert, C. Fabioux, M. E. J. Pernet,
N. Le Goic, V. Quillien, C. Mingant, Y. Epelboin, C. Corporeau, J. Guyomarch,
J. Robbens, I. Paul-Pont, P. Soudant and A. Huvet, Oyster reproduction is
affected by exposure to polystyrene microplastics, Proc. Natl. Acad. Sci. USA,
2016, 113, 2430-2435.
6. Q. Zhang, Q. Qu, T. Lu, M. J. Ke, Y. C. Zhu, M. Zhang, Z. Y. Zhang, B. B. Du,
X. L. Pan, L. W. Sun and H. F. Qian, The combined toxicity effect of
nanoplastics and glyphosate on Microcystis aeruginosa growth, Environ.
Pollut., 2018, 243, 1106-1112.
7. G. Liu, R. F. Jiang, J. You, D. C. G. Muir and E. Y. Zeng, Microplastic impacts
on microalgae growth: Effects of size and humic acid, Environ. Sci. Technol.,
2020, 54, 1782-1789.
8. T. T. S. de Oliveira, I. Andreu, M. C. Machado, G. Vimbela, A. Tripathi and A.
Bose, Interaction of cyanobacteria with nanometer and micron sized
polystyrene particles in marine and fresh water, Langmuir, 2020, 36, 3963-
3969.
9. C. D. Torre, E. Bergami, A. Salvati, C. Faleri, P. Cirino, K. A. Dawson and I.
Corsi, Accumulation and embryotoxicity of polystyrene nanoparticles at early
21
stage of development of sea urchin embryos Paracentrotus lividus, Environ. Sci.
Technol., 2014, 48, 12302-12311.
10. C. B. Jeong, H. M. Kang, Y. H. Lee, M. S. Kim, J. S. Lee, J. S. Seo, M. Wang
and J. S. Lee, Nanoplastic ingestion enhances toxicity of persistent organic
pollutants (POPs) in the monogonont rotifer Brachionus koreanus via
multixenobiotic resistance (MXR) disruption, Environ. Sci. Technol., 2018,
11411-11418.
11. W. Lin, R. F. Jiang, Y. X. Xiong, J. Y. Wu, J. Q. Xu, J. Zheng, F. Zhu and G. F.
Ouyang, Quantification of the combined toxic effect of polychlorinated
biphenyls and nano-sized polystyrene on Daphnia magna, J. Hazard. Mater.,
2019, 364, 531-536.
12. O. O. Fadare, B. Wan, L. H. Guo, Y. Xin, W. P. Qin and Y. Yang, Humic acid
alleviates the toxicity of polystyrene nanoplastic particles to Daphnia magna,
Environ. Sci.: Nano, 2019, 6, 1466-1477.
13. I. Varo, A. Perini, A. Torreblanca, Y. Garcia, E. Bergami, M. L. Vannuccini and
I. Corsi, Time-dependent effects of polystyrene nanoparticles in brine shrimp
Artemia franciscana at physiological, biochemical and molecular levels, Sci.
Total Environ., 2019, 675, 570-580.
14. E. G. Xu, R. S. Cheong, L. Liu, L. M. Hernandez, A. Azimzada, S. Bayen and N.
Tufenkji, Primary and secondary plastic particles exhibit limited acute toxicity
but chronic effects on Daphnia magna, Environ. Sci. Technol., 2020, 54, 6859-
6868.
15. A. Wegner, E. Besseling, E. M. Foekema, P. Kamermans and A. A. Koelmans,
Effects of nanopolystyrene on the feeding behavior of the blue mussel (Mytilus
edulis L.), Environ. Toxicol. Chem., 2012, 31, 2490-2497.
16. L. Canesi, C. Ciacci, R. Fabbri, T. Balbi, A. Salis, G. Damonte, K. Cortese, V.
Caratto, M. P. Monopoli, K. Dawson, E. Bergami and I. Corsi, Interactions of
cationic polystyrene nanoparticles with marine bivalve hemocytes in a
physiological environment: Role of soluble hemolymph proteins, Environ. Res.,
2016, 150, 73-81.
22
17. M. Al-Sid-Cheikh, S. J. Rowland, K. Stevenson, C. Rouleau, T. B. Henry and R.
C. Thompson, Uptake, whole-body distribution, and depuration of nanoplastics
by the scallop Pecten maximus at environmentally realistic concentrations,
Environ. Sci. Technol., 2018, 52, 14480-14486.
18. C. Gonzalez-Fernandez, K. Tallec, N. Le Goic, C. Lambert, P. Soudant, A.
Huvet, M. Suquet, M. Berchel and I. Paul-Pont, Cellular responses of Pacific
oyster (Crassostrea gigas) gametes exposed in vitro to polystyrene
nanoparticles, Chemosphere, 2018, 208, 764-772.
19. K. Tallec, A. Huvet, C. Di Poi, C. Gonzalez-Fernandez, C. Lambert, B. Petton,
N. Le Goic, M. Berchel, P. Soudant and I. Paul-Pont, Nanoplastics impaired
oyster free living stages, gametes and embryos, Environ. Pollut., 2018, 242,
1226-1235.
20. W. S. Zhou, Y. Han, Y. Tang, W. Shi, X. Y. Du, S. G. Sun and G. X. Liu,
Microplastics aggravate the bioaccumulation of two waterborne veterinary
antibiotics in an edible bivalve species: Potential mechanisms and implications
for human health, Environ. Sci. Technol., 2020, 54, 8115-8122.
21. Z. L. Li, C. H. Feng, Y. H. Wu and X. Y. Guo, Impacts of nanoplastics on
bivalve: Fluorescence tracing of organ accumulation, oxidative stress and
damage, J. Hazard. Mater., 2020, 392, 122418.
22. N. R. Brun, B. E. V. Koch, M. Varela, W. J. G. M. Peijnenburg, H. P. Spaink and
M. G. Vijver, Nanoparticles induce dermal and intestinal innate immune system
responses in zebrafish embryos, Environ. Sci.: Nano, 2018, 5, 904-916.
23. W. S. Lee, H. J. Cho, E. Kim, Y. H. Huh, H. J. Kim, B. Kim, T. Kang, J. S. Lee
and J. Jeong, Bioaccumulation of polystyrene nanoplastics and their effect on
the toxicity of Au ions in zebrafish embryos, Nanoscale, 2019, 11, 3173-3185.
24. H. X. Gu, S. X. Wang, X. H. Wang, X. Yu, M. H. Hu, W. Huang and Y. J. Wang,
Nanoplastics impair the intestinal health of the juvenile large yellow croaker
Larimichthys crocea, J. Hazard. Mater., 2020, 397, 122773.
25. C. J. Moore, S. L. Moore, M. K. Leecaster and S. B. Weisberg, A comparison of
plastic and plankton in the North Pacific Central Gyre, Mar. Pollut. Bull., 2001,
23
42, 1297-1300.
26. J. Reisser, J. Shaw, C. Wilcox, B. D. Hardesty, M. Proietti, M. Thums and C.
Pattiaratchi, Marine plastic pollution in waters around Australia:
Characteristics, concentrations, and pathways, PLoS One, 2013, 8, e80466.
27. M. Eriksen, N. Maximenko, M. Thiel, A. Cummins, G. Lattin, S. Wilson, J.
Hafner, A. Zellers and S. Rifman, Plastic pollution in the South Pacific
subtropical gyre, Mar. Pollut. Bull., 2013, 68, 71-76.
28. V. Fischer, N. O. Elsner, N. Brenke, E. Schwabe and A. Brandt, Plastic pollution
of the Kuril–Kamchatka Trench area (NW pacific), Deep-Sea Res. Pt. II, 2015,
111, 399-405.
29. Y. B. Li, Z. B. Lu, H. Y. Zheng, J. Wang and C. Chen, Microplastics in surface
water and sediments of Chongming Island in the Yangtze Estuary, China,
Environ. Sci. Eur., 2020, 32, 2-12.
30. M. Narmatha Sathish, K. Immaculate Jeyasanta and J. Patterson, Monitoring of
microplastics in the clam Donax cuneatus and its habitat in Tuticorin coast of
Gulf of Mannar (GoM), India, Environ. Pollut., 2020, 266, 115219.
31. J. Patterson, K. I. Jeyasanta, N. Sathish, J. K. P. Edward and A. M. Booth,
Microplastic and heavy metal distributions in an Indian coral reef ecosystem,
Sci. Total Environ., 2020, 744, 140706.
32. T. Wang, M. H. Hu, L. L. Song, J. Yu, R. J. Liu, S. X. Wang, Z. F. Wang, I. M.
Sokolova, W. Huang and Y. J. Wang, Coastal zone use influences the spatial
distribution of microplastics in Hangzhou Bay, China, Environ. Pollut., 2020,
266, 115137.
33. A. Faruk Cullu, V. Z. Sonmez and N. Sivri, Microplastic contamination in
surface waters of the Kucukcekmece Lagoon, Marmara Sea (Turkey): Sources
and areal distribution, Environ. Pollut., 2020, 268, 115801-115801.
34. J. Tang, Z. J. Wu, L. Wan, W. Q. Cai, S. Q. Chen, X. J. Wang, J. Luo, Z. Zhou,
J. M. Zhao and S. J. Lin, Differential enrichment and physiological impacts of
ingested microplastics in scleractinian corals in situ, J. Hazard. Mater., 2020,
404, 124205-124205.
24
35. Y. Bouallegui, R. Ben Younes, H. Bellamine and R. Oueslati, Histopathological
indices and inflammatory response in the digestive gland of the mussel Mytilus
galloprovincialis as biomarker of immunotoxicity to silver nanoparticles,
Biomarkers, 2017, 1-11.
36. T. L. Rocha, S. M. T. Sabóia-Morais and M. J. Bebianno, Histopathological
assessment and inflammatory response in the digestive gland of marine mussel
Mytilus galloprovincialis exposed to cadmium-based quantum dots, Aquat.
Toxicol., 2016, 177, 306-315.
37. N. Cuevas, I. Zorita, P. M. Costa, J. Franco and J. Larreta, Development of
histopathological indices in the digestive gland and gonad of mussels:
integration with contamination levels and effects of confounding factors, Aquat.
Toxicol., 2015, 162, 152-164.
38. P. M. Costa, S. Carreira, M. H. Costa and S. Caeiro, Development of
histopathological indices in a commercial marine bivalve (Ruditapes
decussatus) to determine environmental quality, Aquat. Toxicol., 2013, 126,
442-454.
39. L. P. Luan, X. Wang, H. Zheng, L. Q. Q. Liu, X. X. Luo and F. M. Li,
Differential toxicity of functionalized polystyrene microplastics to clams
(Meretrix meretrix) at three key development stages of life history, Mar. Pollut.
Bull., 2019, 139, 346-354.