L’évaluation des interfaces utilisateurs N.B.: Dans ces diapos, « BGBG » réfère à la 2e...
50
L’évaluation des interfaces utilisateurs N.B.: Dans ces diapos, « BGBG » réfère à la 2e édition du livre « Human-Computer Interaction » de Baecker, Grudin, Buxton et Greenberg (1995)
-
Upload
jeffry-ball -
Category
Documents
-
view
216 -
download
1
Transcript of L’évaluation des interfaces utilisateurs N.B.: Dans ces diapos, « BGBG » réfère à la 2e...
L’évaluation des interfaces utilisateurs
N.B.: Dans ces diapos, « BGBG » réfère à la 2e édition du livre « Human-Computer
Interaction » de Baecker, Grudin, Buxton et Greenberg (1995)
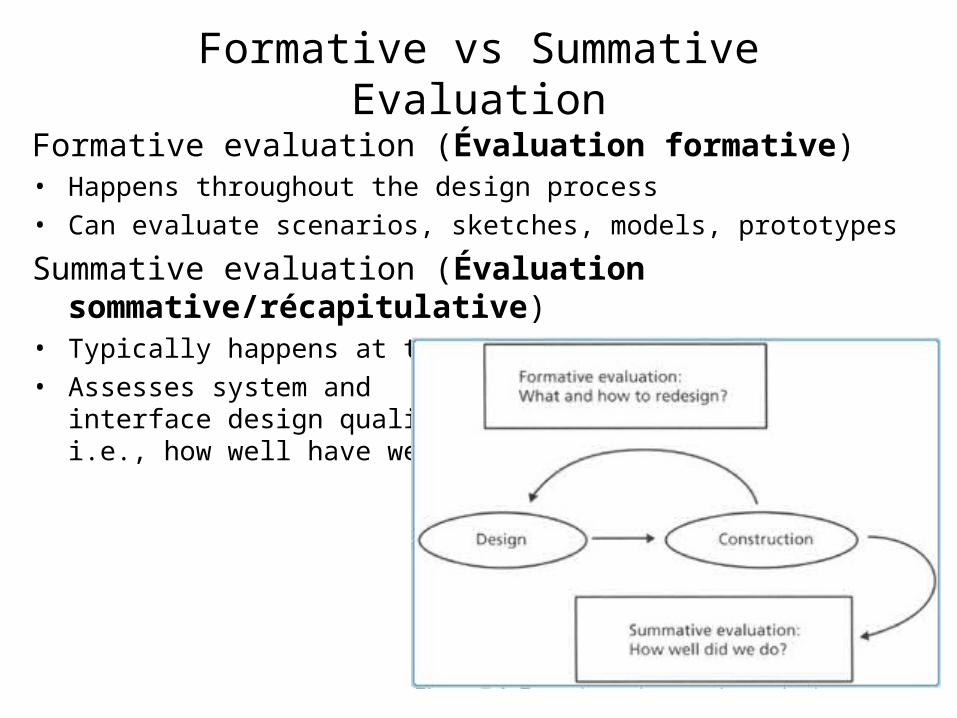
Formative vs Summative Evaluation
Formative evaluation (Évaluation formative)• Happens throughout the design process• Can evaluate scenarios, sketches, models, prototypes
Summative evaluation (Évaluation sommative/récapitulative)• Typically happens at the end• Assesses system and
interface design quality,i.e., how well have we done?
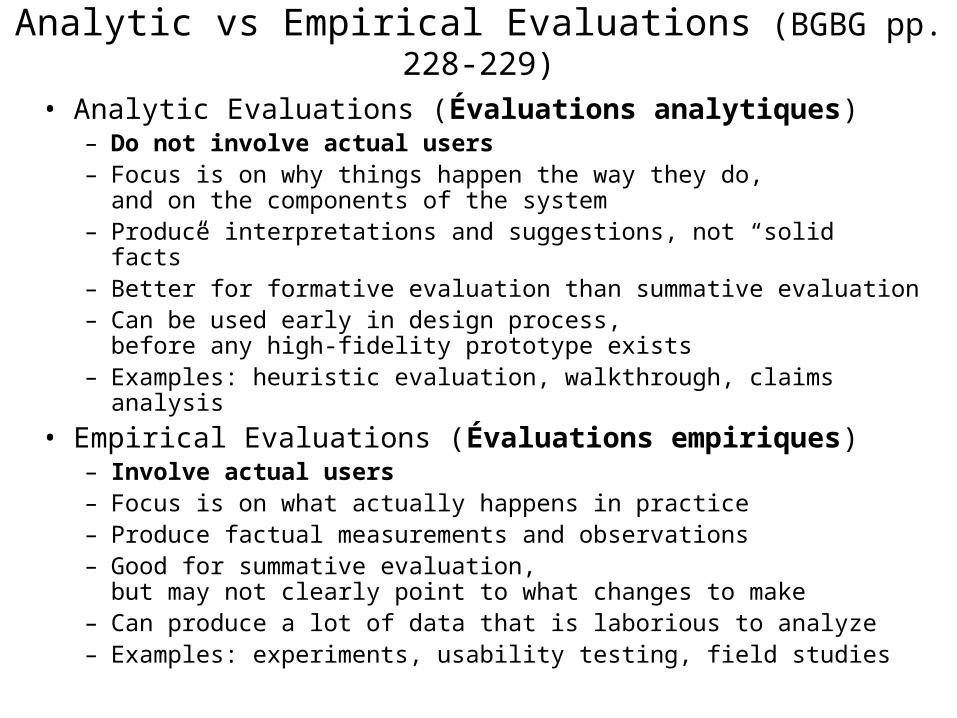
Analytic vs Empirical Evaluations (BGBG pp. 228-229)
• Analytic Evaluations (Évaluations analytiques)– Do not involve actual users– Focus is on why things happen the way they do,
and on the components of the system– Produce interpretations and suggestions, not “solid facts”– Better for formative evaluation than summative evaluation– Can be used early in design process,
before any high-fidelity prototype exists– Examples: heuristic evaluation, walkthrough, claims analysis
• Empirical Evaluations (Évaluations empiriques)– Involve actual users– Focus is on what actually happens in practice– Produce factual measurements and observations– Good for summative evaluation,
but may not clearly point to what changes to make– Can produce a lot of data that is laborious to analyze– Examples: experiments, usability testing, field studies
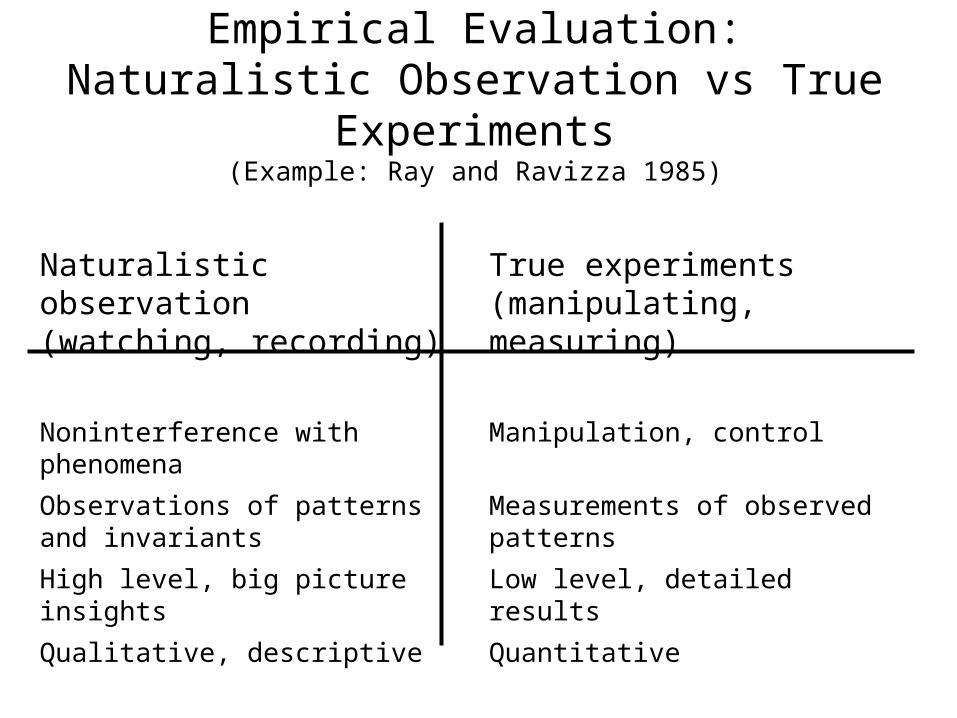
Empirical Evaluation:Naturalistic Observation vs True Experiments
(Example: Ray and Ravizza 1985)
Naturalistic observation(watching, recording)
True experiments(manipulating, measuring)
Noninterference with phenomena Manipulation, control
Observations of patternsand invariants
Measurements of observed patterns
High level, big picture insights Low level, detailed results
Qualitative, descriptive Quantitative
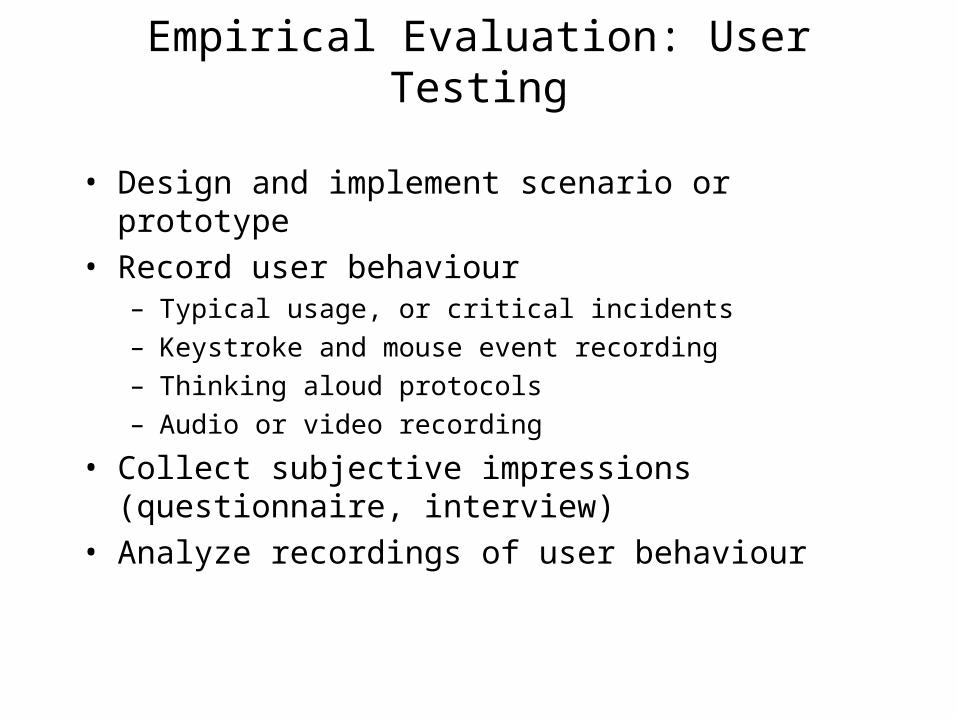
Empirical Evaluation: User Testing
• Design and implement scenario or prototype• Record user behaviour
– Typical usage, or critical incidents– Keystroke and mouse event recording– Thinking aloud protocols– Audio or video recording
• Collect subjective impressions(questionnaire, interview)
• Analyze recordings of user behaviour
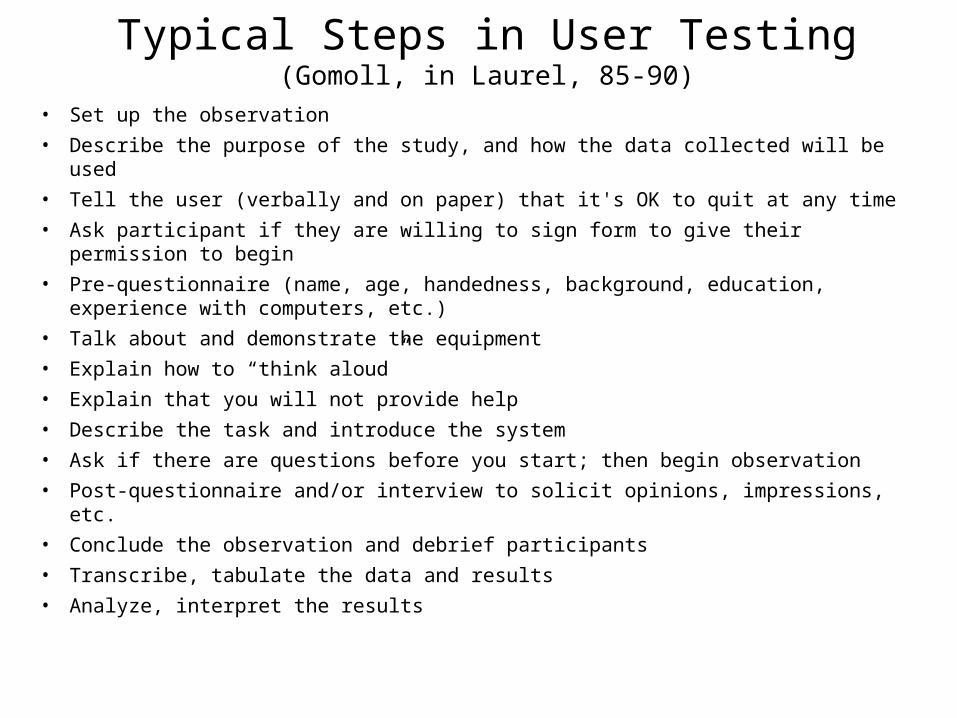
Typical Steps in User Testing (Gomoll, in Laurel, 85-90)
• Set up the observation
• Describe the purpose of the study, and how the data collected will be used
• Tell the user (verbally and on paper) that it's OK to quit at any time
• Ask participant if they are willing to sign form to give their permission to begin
• Pre-questionnaire (name, age, handedness, background, education, experience with computers, etc.)
• Talk about and demonstrate the equipment
• Explain how to “think aloud”
• Explain that you will not provide help
• Describe the task and introduce the system
• Ask if there are questions before you start; then begin observation
• Post-questionnaire and/or interview to solicit opinions, impressions, etc.
• Conclude the observation and debrief participants
• Transcribe, tabulate the data and results
• Analyze, interpret the results

User Testing (BGBG, Fig. 2.8, p. 85, adapted from Neilsen, 1992)
• Practical study design– Reflect on the participants’ backgrounds and how they might affect the study– Be aware of problems that arise when experimenters know the users personally– Prepare for the study carefully (avoid last minute panic)– Select the tasks carefully to be representative and to fit the allotted time– In general, start with an easier (but not frivolous) task– Write down features of system not being tested as well as those that are!– Define the start-up state for the study precisely– Define precise rules for when and how users can be helped during the study– Plan timing and cut-off procedure (if subject gets stuck) for each part of study– Include provisions for data collection (e.g., audio, video, or keystroke capture)– Plan data analysis techniques in advance– Carry out an initial pilot study to test your protocol
• Written materials– Participant release (permission) form– Pre-questionnaire covering prior experience etc.– Introduction to the study for users, including scenario of use,
and description of tasks– Checklist for experimenters, and paper for note-taking– Post-questionnaire or survey
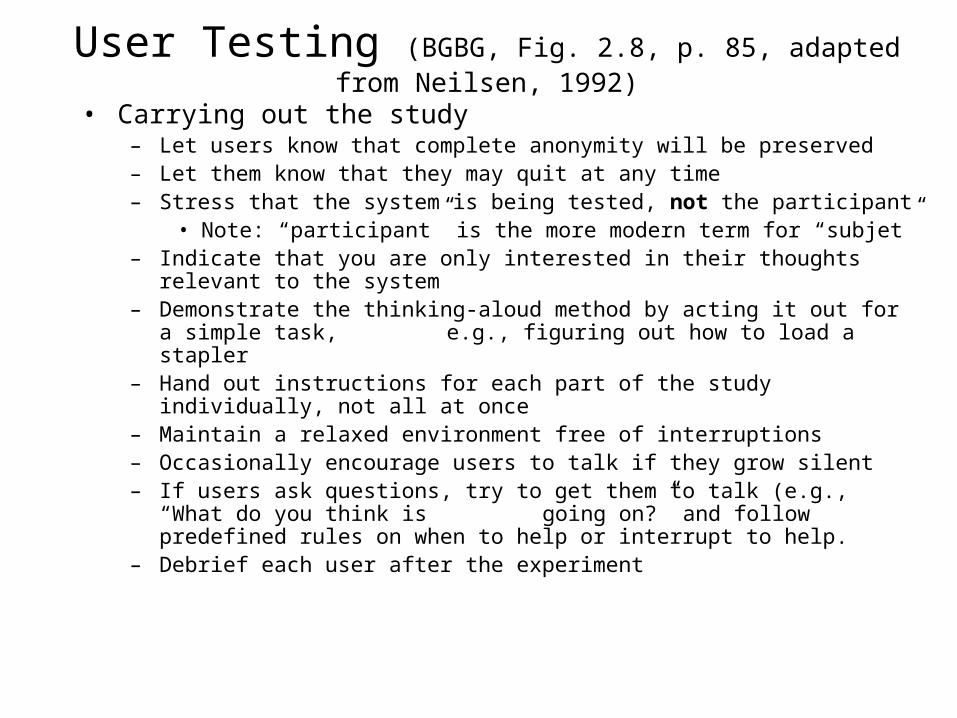
User Testing (BGBG, Fig. 2.8, p. 85, adapted from Neilsen, 1992)
• Carrying out the study– Let users know that complete anonymity will be preserved– Let them know that they may quit at any time– Stress that the system is being tested, not the participant
• Note: “participant” is the more modern term for “subjet”– Indicate that you are only interested in their thoughts relevant to the system– Demonstrate the thinking-aloud method by acting it out for a simple task,
e.g., figuring out how to load a stapler– Hand out instructions for each part of the study individually, not all at once– Maintain a relaxed environment free of interruptions– Occasionally encourage users to talk if they grow silent– If users ask questions, try to get them to talk (e.g., “What do you think is
going on?” and follow predefined rules on when to help or interrupt to help.
– Debrief each user after the experiment
Thinking Aloud
• Attempt to elicit thought processes of participant, thereby yielding valuable insights (although process is slowed down and may be changed)
• Participant talking while they are doing– Problems they are having
– Solutions they are considering
– Why they are having trouble
– Insights that they have
– Wishes that they have
• Co-Discovery: Pairs of participants conversing (Co-Discovery Learning, Kennedy paper in BGBG, pp. 182-185)
Data Capture and Analysis
• Keystroke+mouse logging– Record precise user behaviour
– Record times to carry out actions
– Record user errors
• Observation and note taking by observers,especially of user problems and critical incidents– Best if note taking done by a 2nd observer
• Audio and video recordings– Can't observe and record all behaviour in real-time
– Preserve behaviour for review (even non-verbal behaviour)
– Can produce a lot of data
Asking Users in Addition to Observing Them
Methods• (Post-) Questionnaire design
– Formulating & asking questions, & analyzing answers– Hard to avoid bias in the phrasing of questions– Therefore requires pre-testing (“pilot testing”)
• Surveys (Sondages) — (possibly large-scale) administration of questionnaires to appropriate samples of individuals chosen from a population
• Administration of questions through interviews
Ethical Issues
• Basic principles– Do no harm
– Voluntary participation
– Informed consent
– Right to privacy
• Use of research protocols and consent forms– Explanation of study and purpose– Anonymity– Ability to withdraw at any time– For example, see p. 256 of Rosson & Carroll
Une taxonomie de plusieurs techniques d’évaluation …
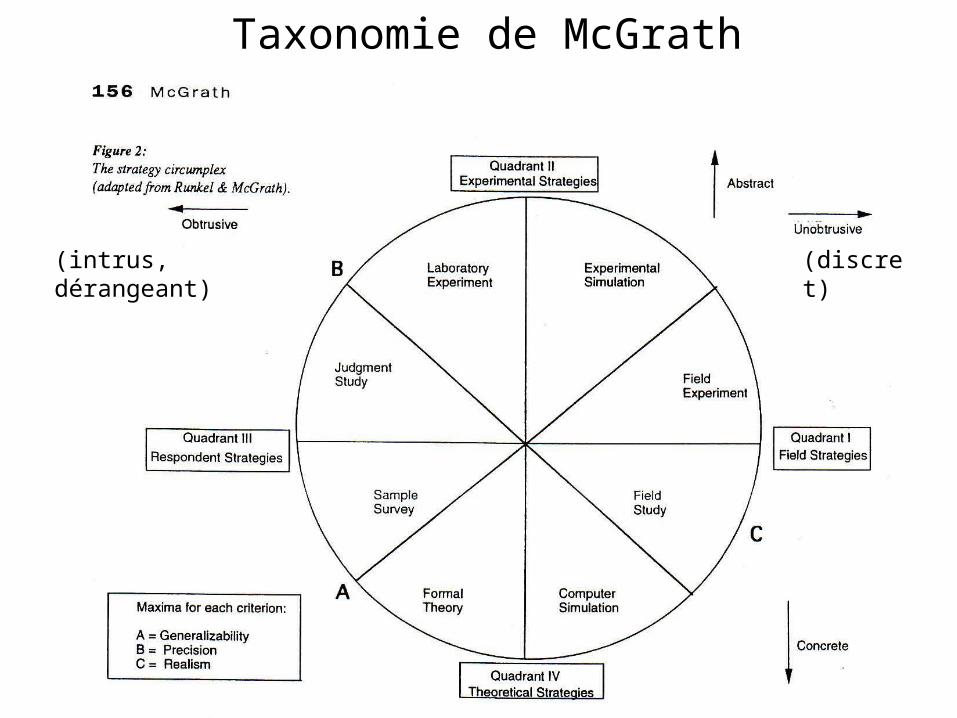
Taxonomie de McGrath
(discret)(intrus, dérangeant)

Quadrant 1 — Field Strategies• Study systems in real use on real tasks in real work
environments, i.e., observe under settings with conditions as natural as possible
• Field studies — Study systems in situ, disturbing as little as possible, e.g., with ethnography, contextual inquiry
• Field experiments — Observe impact of changing (ideally) one aspect of a work environment, e.g., in beta testing, studies of technological change and new technology introduction
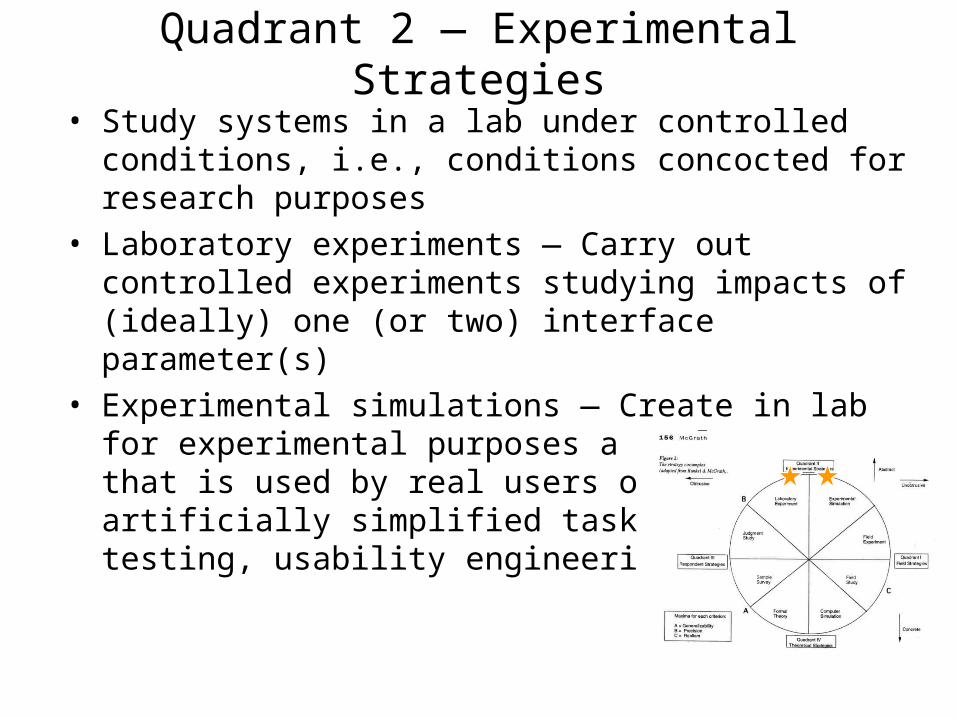
Quadrant 2 — Experimental Strategies
• Study systems in a lab under controlled conditions, i.e., conditions concocted for research purposes
• Laboratory experiments — Carry out controlled experiments studying impacts of (ideally) one (or two) interface parameter(s)
• Experimental simulations — Create in lab for experimental purposes a real system that is used by real users on (usually) artificially simplified tasks, e.g., user testing, usability engineering
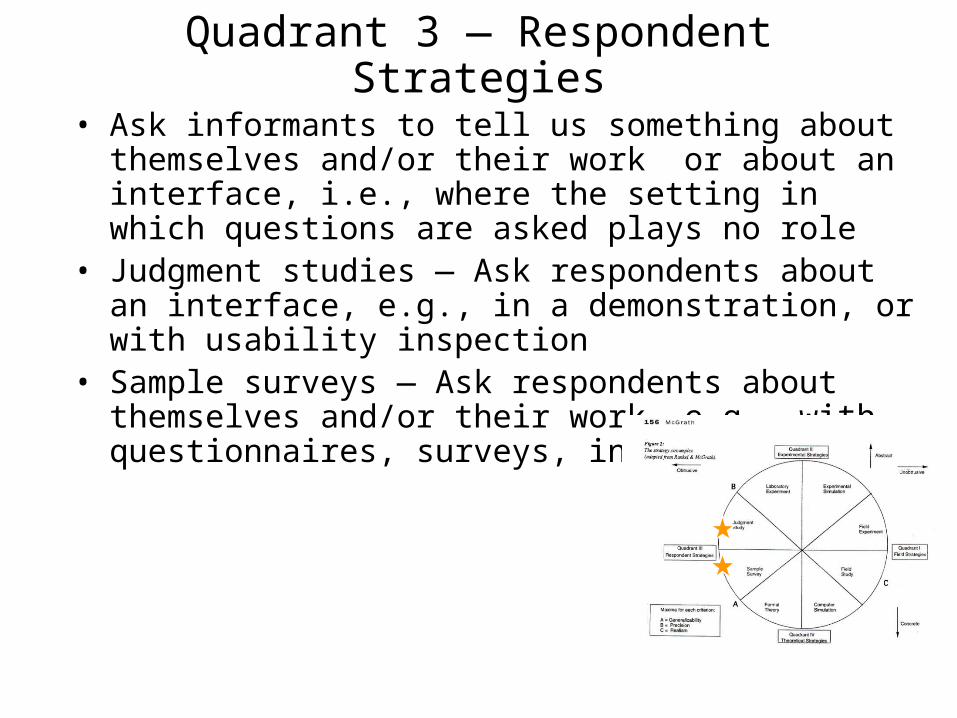
Quadrant 3 — Respondent Strategies
• Ask informants to tell us something about themselves and/or their work or about an interface, i.e., where the setting in which questions are asked plays no role
• Judgment studies — Ask respondents about an interface, e.g., in a demonstration, or with usability inspection
• Sample surveys — Ask respondents about themselves and/or their work, e.g., with questionnaires, surveys, interviews
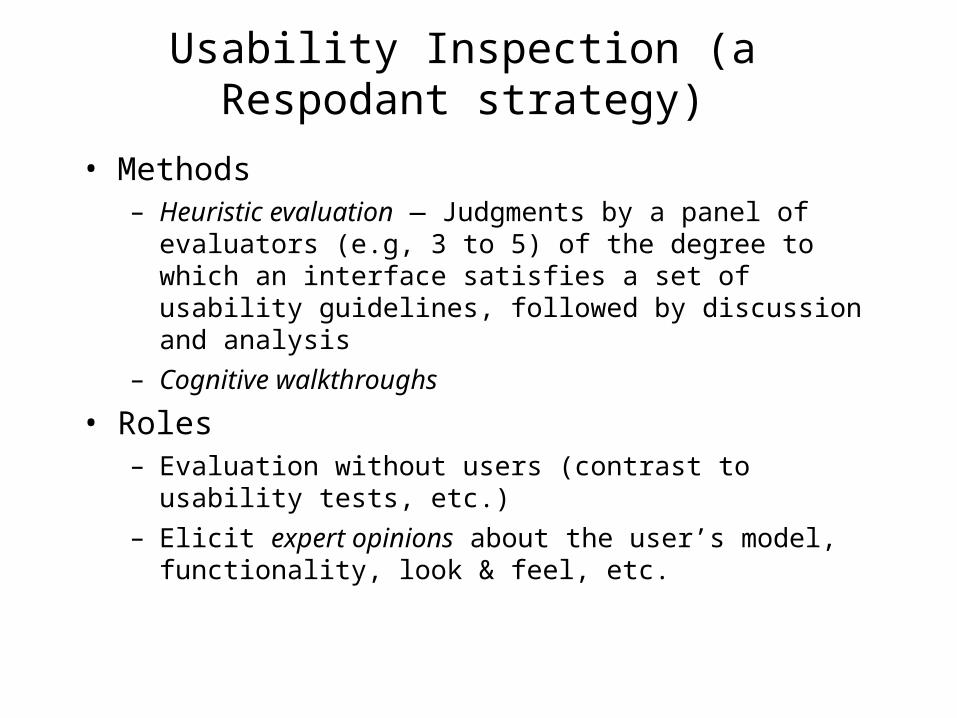
Usability Inspection (a Respodant strategy)
• Methods– Heuristic evaluation — Judgments by a panel of evaluators
(e.g, 3 to 5) of the degree to which an interface satisfies a set of usability guidelines, followed by discussion and analysis
– Cognitive walkthroughs
• Roles– Evaluation without users (contrast to usability tests, etc.)
– Elicit expert opinions about the user’s model, functionality, look & feel, etc.
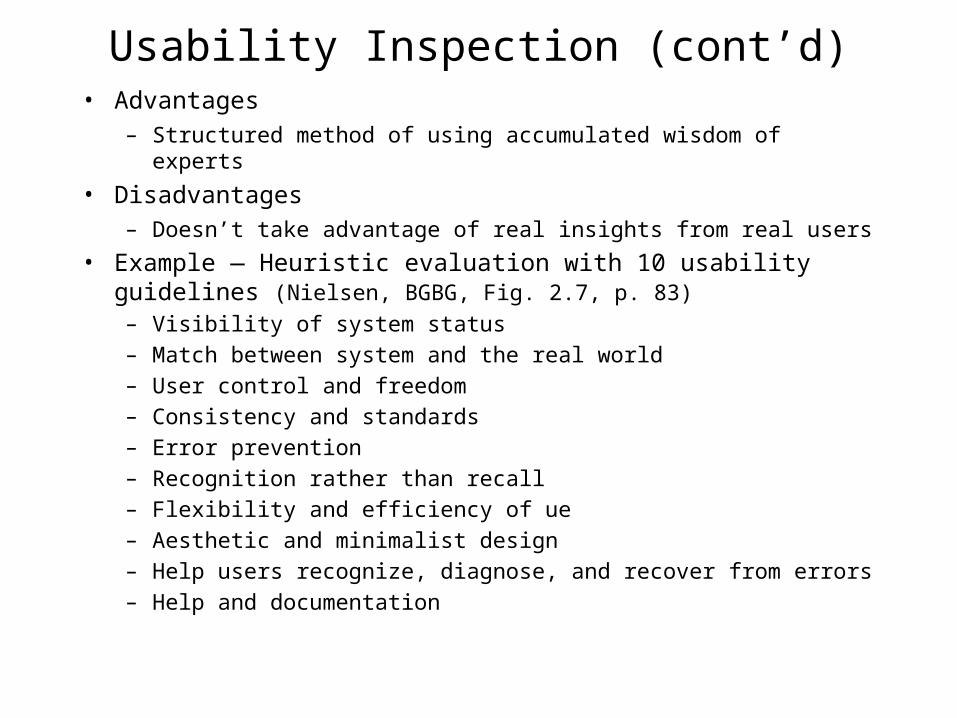
Usability Inspection (cont’d)• Advantages
– Structured method of using accumulated wisdom of experts
• Disadvantages– Doesn’t take advantage of real insights from real users
• Example — Heuristic evaluation with 10 usability guidelines (Nielsen, BGBG, Fig. 2.7, p. 83)– Visibility of system status– Match between system and the real world– User control and freedom– Consistency and standards– Error prevention– Recognition rather than recall– Flexibility and efficiency of ue– Aesthetic and minimalist design– Help users recognize, diagnose, and recover from errors– Help and documentation
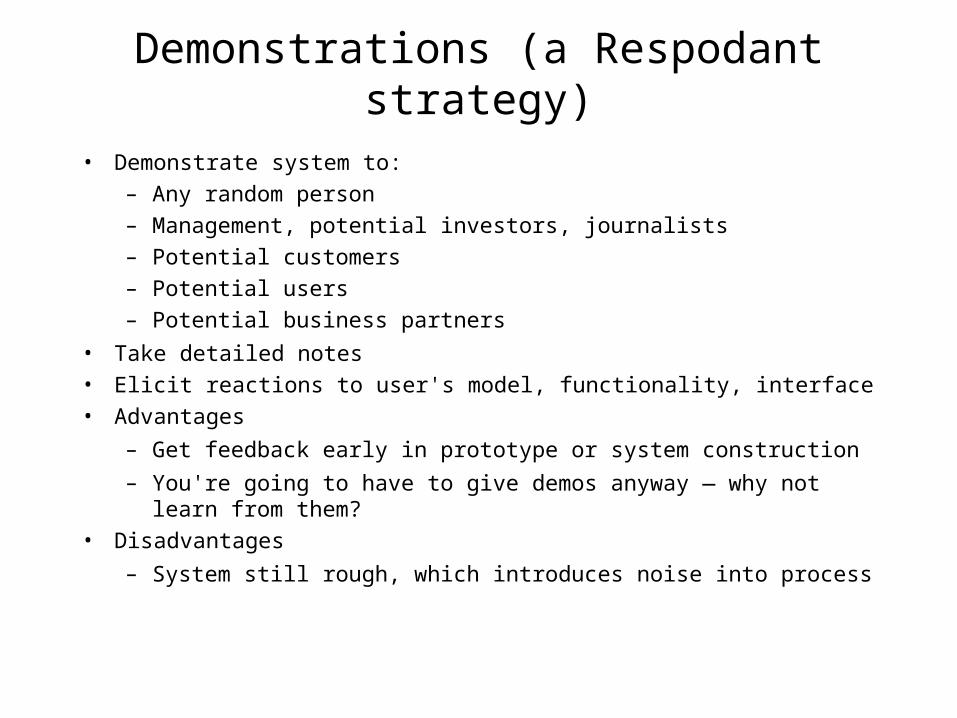
Demonstrations (a Respodant strategy)
• Demonstrate system to:
– Any random person
– Management, potential investors, journalists
– Potential customers
– Potential users
– Potential business partners
• Take detailed notes
• Elicit reactions to user's model, functionality, interface
• Advantages
– Get feedback early in prototype or system construction
– You're going to have to give demos anyway — why not learn from them?
• Disadvantages
– System still rough, which introduces noise into process
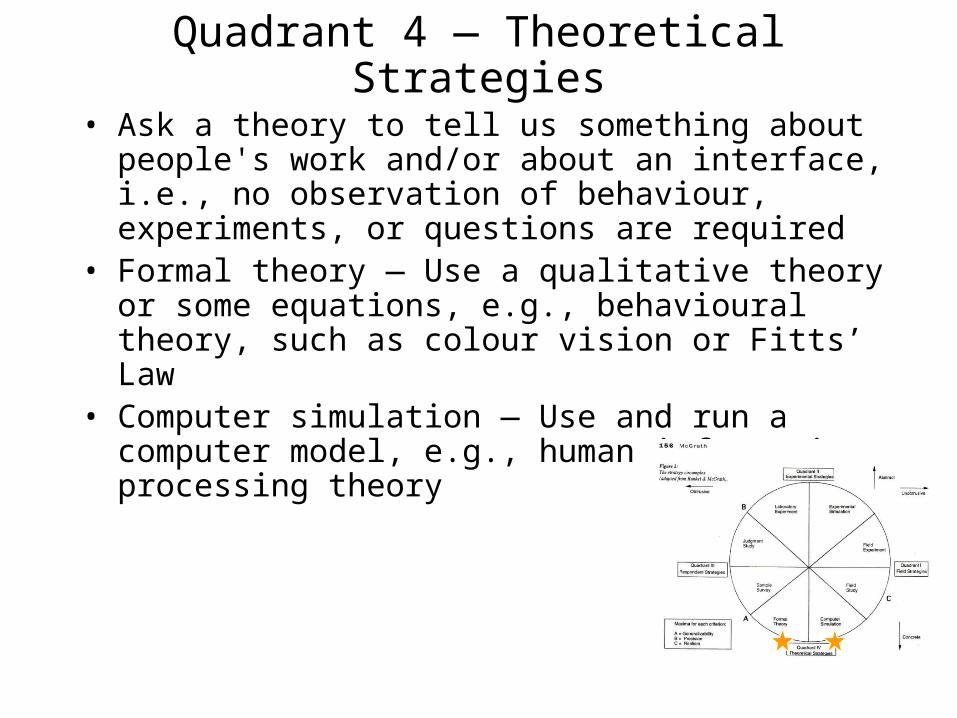
Quadrant 4 — Theoretical Strategies
• Ask a theory to tell us something about people's work and/or about an interface, i.e., no observation of behaviour, experiments, or questions are required
• Formal theory — Use a qualitative theory or some equations, e.g., behavioural theory, such as colour vision or Fitts’ Law
• Computer simulation — Use and run a computer model, e.g., human information processing theory
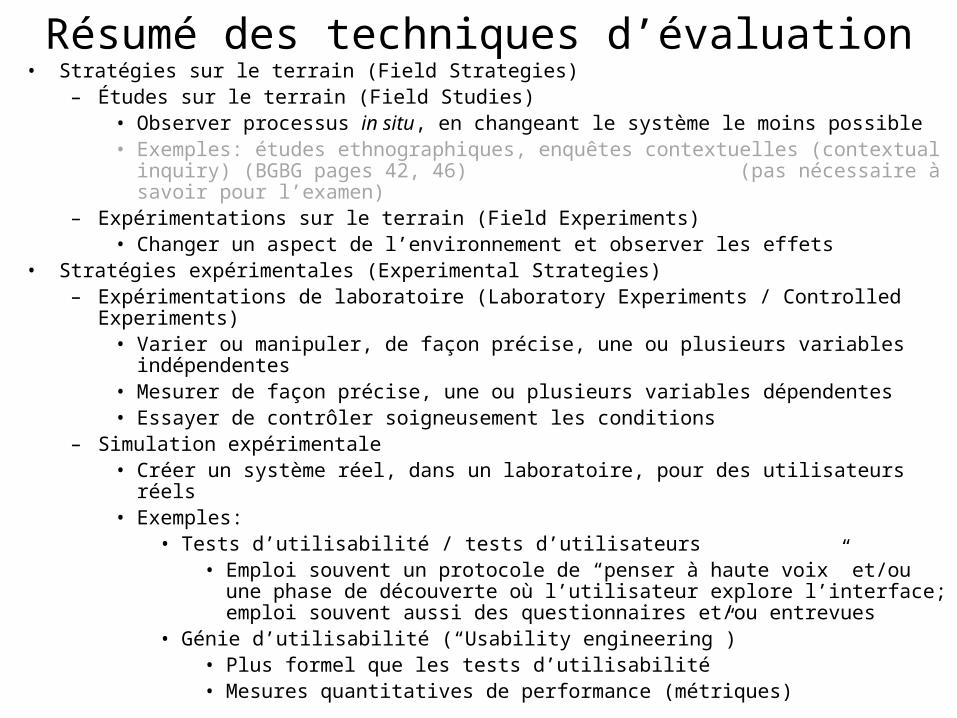
Résumé des techniques d’évaluation• Stratégies sur le terrain (Field Strategies)
– Études sur le terrain (Field Studies)• Observer processus in situ, en changeant le système le moins possible• Exemples: études ethnographiques, enquêtes contextuelles (contextual inquiry)
(BGBG pages 42, 46) (pas nécessaire à savoir pour l’examen)– Expérimentations sur le terrain (Field Experiments)
• Changer un aspect de l’environnement et observer les effets• Stratégies expérimentales (Experimental Strategies)
– Expérimentations de laboratoire (Laboratory Experiments / Controlled Experiments)• Varier ou manipuler, de façon précise, une ou plusieurs variables indépendentes• Mesurer de façon précise, une ou plusieurs variables dépendentes• Essayer de contrôler soigneusement les conditions
– Simulation expérimentale• Créer un système réel, dans un laboratoire, pour des utilisateurs réels• Exemples:
• Tests d’utilisabilité / tests d’utilisateurs• Emploi souvent un protocole de “penser à haute voix” et/ou une phase de
découverte où l’utilisateur explore l’interface; emploi souvent aussi des questionnaires et/ou entrevues
• Génie d’utilisabilité (“Usability engineering”)• Plus formel que les tests d’utilisabilité• Mesures quantitatives de performance (métriques)
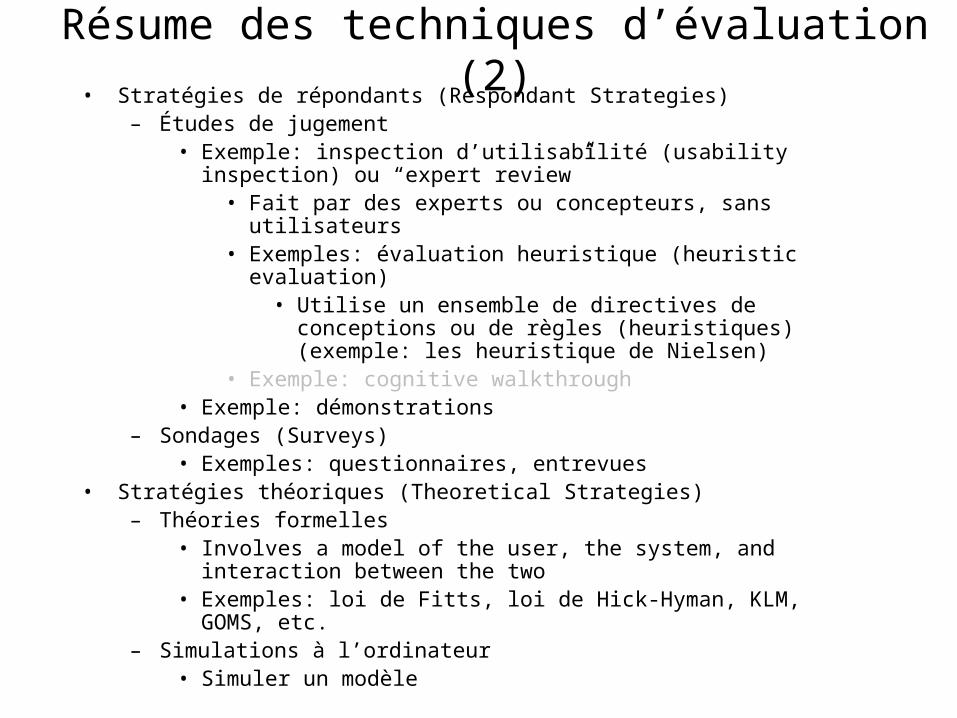
Résume des techniques d’évaluation (2)• Stratégies de répondants (Respondant Strategies)
– Études de jugement• Exemple: inspection d’utilisabilité (usability inspection) ou “expert
review”• Fait par des experts ou concepteurs, sans utilisateurs• Exemples: évaluation heuristique (heuristic evaluation)
• Utilise un ensemble de directives de conceptions ou de règles (heuristiques) (exemple: les heuristique de Nielsen)
• Exemple: cognitive walkthrough• Exemple: démonstrations
– Sondages (Surveys)• Exemples: questionnaires, entrevues
• Stratégies théoriques (Theoretical Strategies)– Théories formelles
• Involves a model of the user, the system, and interaction between the two
• Exemples: loi de Fitts, loi de Hick-Hyman, KLM, GOMS, etc.– Simulations à l’ordinateur
• Simuler un modèle
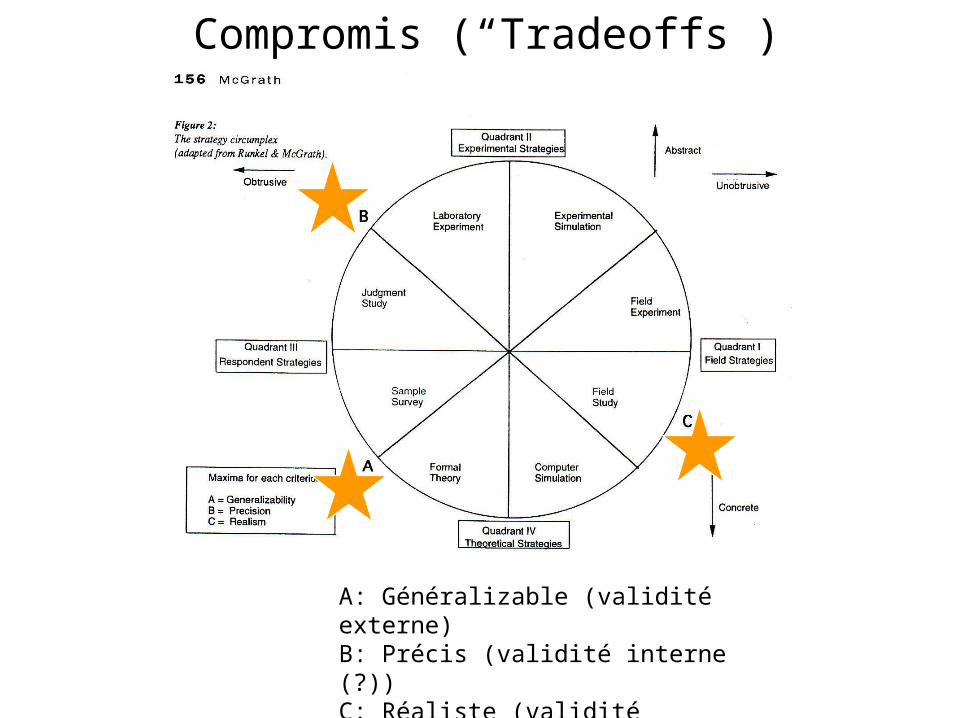
Compromis (“Tradeoffs”)
A: Généralizable (validité externe)B: Précis (validité interne (?))C: Réaliste (validité écologique)
Controlled Experiments
Controlled Experiments
• Method– Manipulate independent variables, system characteristics
– Control for other variables (hold them constant)
– Measure dependent variables, user behaviour
• Roles– Understanding factors influencing interface quality
– Determining which conditions or which interface is best
Controlled Experiments
• Advantages– Strong statements about causality (good internal validity)
– Many experimental designs suitable for varying situations
• Disadvantages– Requires time, planning, may be expensive
– Complex designs (more than 3 or 4 independent variables) are often difficult to interpret
– Often lack external validity and especially ecological validity
Examples
• Of 3 interfaces, A, B, C, which enables fastest performance at a given task?
• Does prozac have an effect on performance at tying shoe laces?
• How does frequency of advertisements on television affect voting behaivour?
• Can casting a spell on a pair of dice affect what numbers appear on them?
Elements of an Experiment• Population
– Set of all possible subjects / observations
• Sample– Subset of the population chosen for study; a set of subjects /
observations
• Subjects– People/users under study. The more politically correct term
within HCI is “participants”.
• Observations / Dependent variable(s)– Individual data points that are measured/collected/recorded
• E.g. time to complete a task, errors, etc.
• Condition / Treatment / Independent variables(s)– Something done to the samples that distinguishes them
(e.g. giving a drug vs placebo, or using interface A vs B)– Goal of experiment is often to determine whether the conditions
have an effect on observations, and what the effect is
Tasks to Design and Run an Experiment• Design
– Choose independent variables– Choose dependent variables– Develop hypothesis– Choose design paradigm (plan expérimental: croisé ou emboîté)– Choose control procedures– Choose a sample size
• Pilot experiment– Often more exploratory, varying a greater number of variables to get
a “feel” for where the effect(s) might be
• Run experiment– Focuses in on the suspected effect; tries to gather lots of data under
key or optimal conditions to result in a strong conclusion
• Analyze data– Using statistical tests such as ANOVA
• Interpret results

The Problem: Effectiveness of New Method of Source Code Presentation
• Source code appearance makes inadequate use of capabilities of digital typography
• Potential to make code more readable, more comprehensible with new and “enhanced” presentation format
• See book by Baecker and Marcus, Human Factors and Typography for More Readable Programs, Addison-Wesley, 1990
• On following slides, bullet points that refer to an experimental study of our new presentation format indicated by **
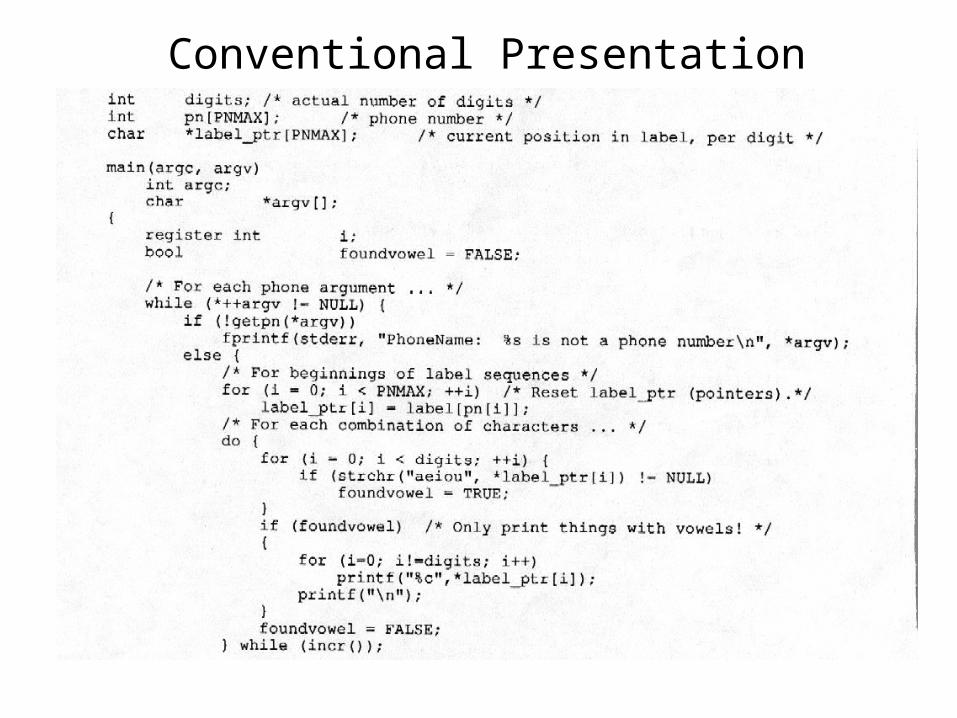
Conventional Presentation
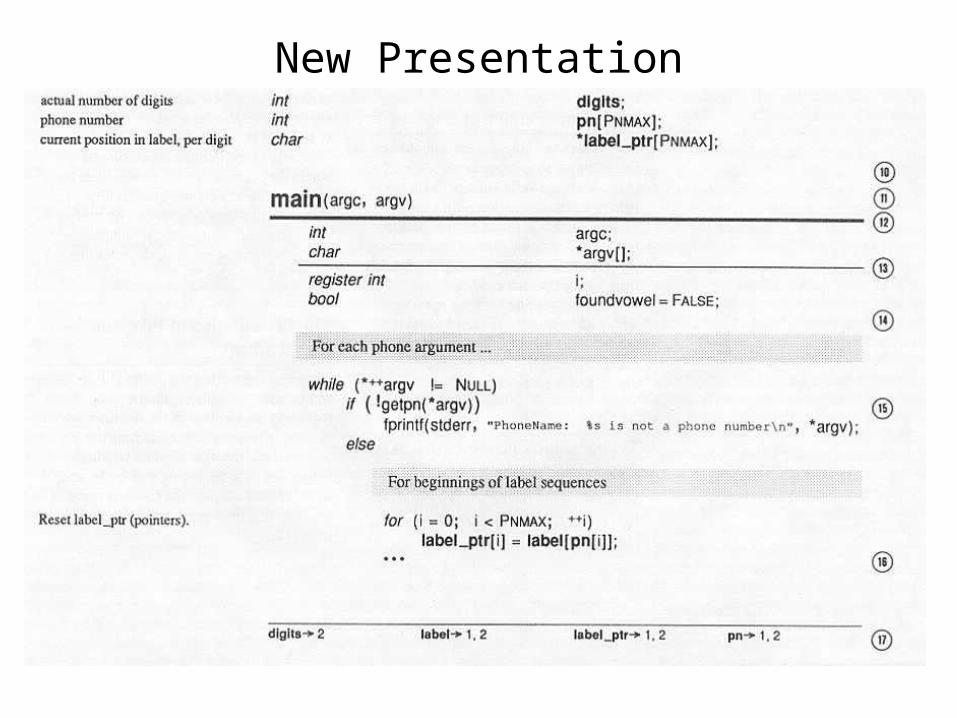
New Presentation
Independent Variables
• The variable manipulated by the experimenter• Also known as factor or treatment• Experiment may involve one or many independent
variables• Each independent variable …
– Has 2 or more levels (i.e. values)– May be metric (continuous, like the length of a menu) or
categorical (discrete, like mouse vs. trackball, or a Likert scale)
• ** In our example: just one independent variable, with two levels: — new typesetting format or traditional presentation format
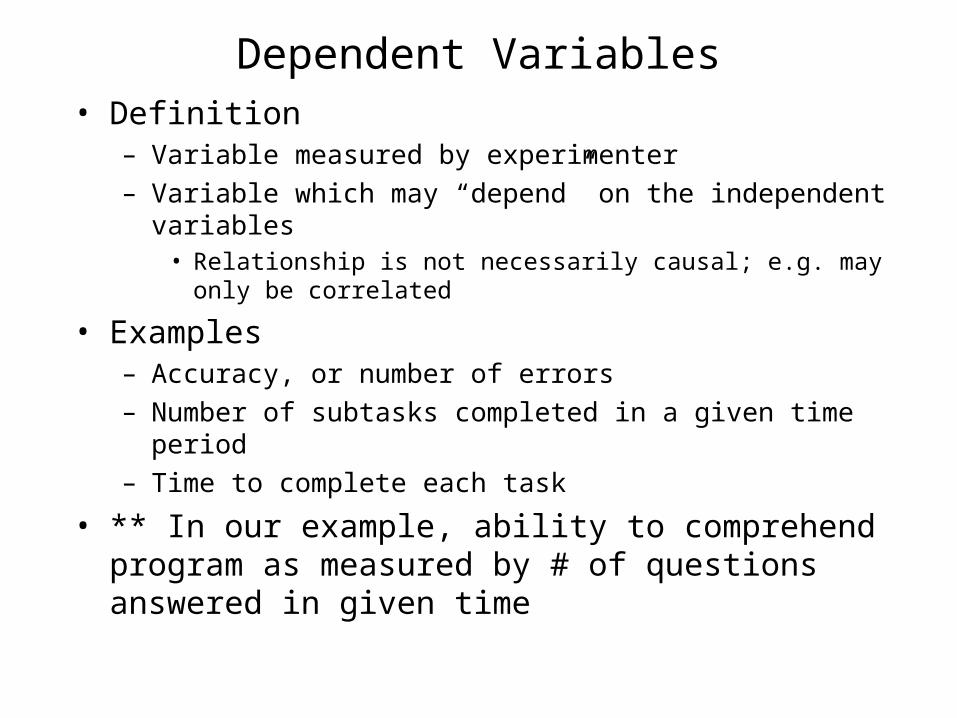
Dependent Variables• Definition
– Variable measured by experimenter– Variable which may “depend” on the independent variables
• Relationship is not necessarily causal; e.g. may only be correlated
• Examples– Accuracy, or number of errors– Number of subtasks completed in a given time period– Time to complete each task
• ** In our example, ability to comprehend program as measured by # of questions answered in given time
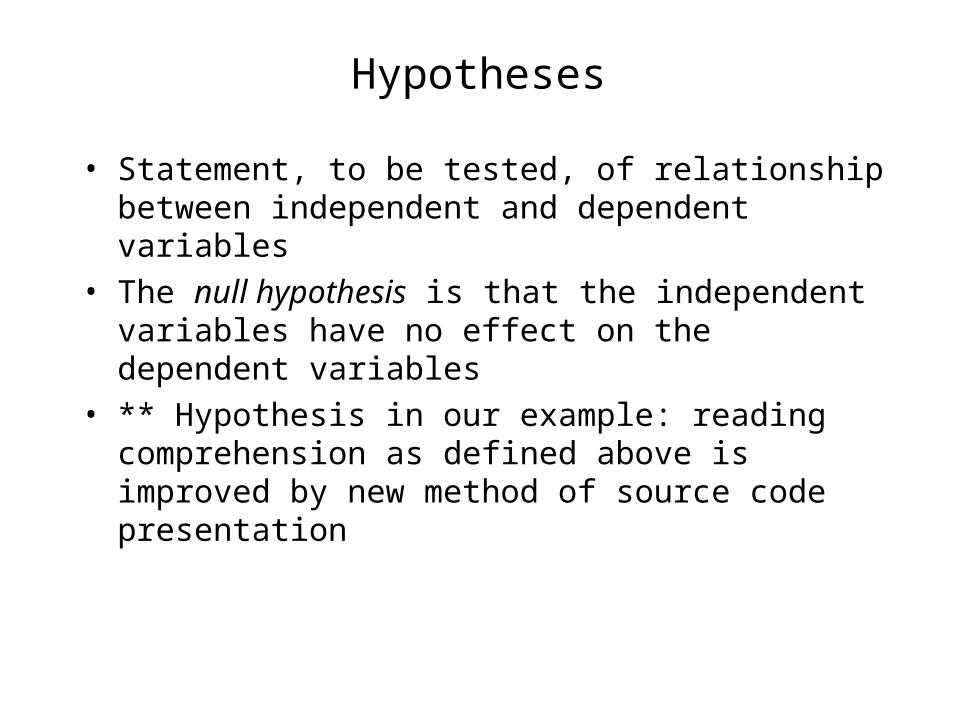
Hypotheses
• Statement, to be tested, of relationship between independent and dependent variables
• The null hypothesis is that the independent variables have no effect on the dependent variables
• ** Hypothesis in our example: reading comprehension as defined above is improved by new method of source code presentation

Experimental Design Paradigms
• Between subjects or within subjects manipulation(entre participants vs à travers tous les participants)
• Example: designs with one independent variable– Between subjects (randomized group) design (emboîté)
• One independent variable with 2 or more levels
• Subjects randomly assigned to groups
• Each subject tested under only 1 condition
– Within subject (repeated measures) design (croisé)• One independent variable with 2 or more levels
• Each subject tested under all conditions
• Order of conditions randomized or counterbalanced (why?)
• **In our example, within subjects chosen with two conditions, i.e., two sample programs
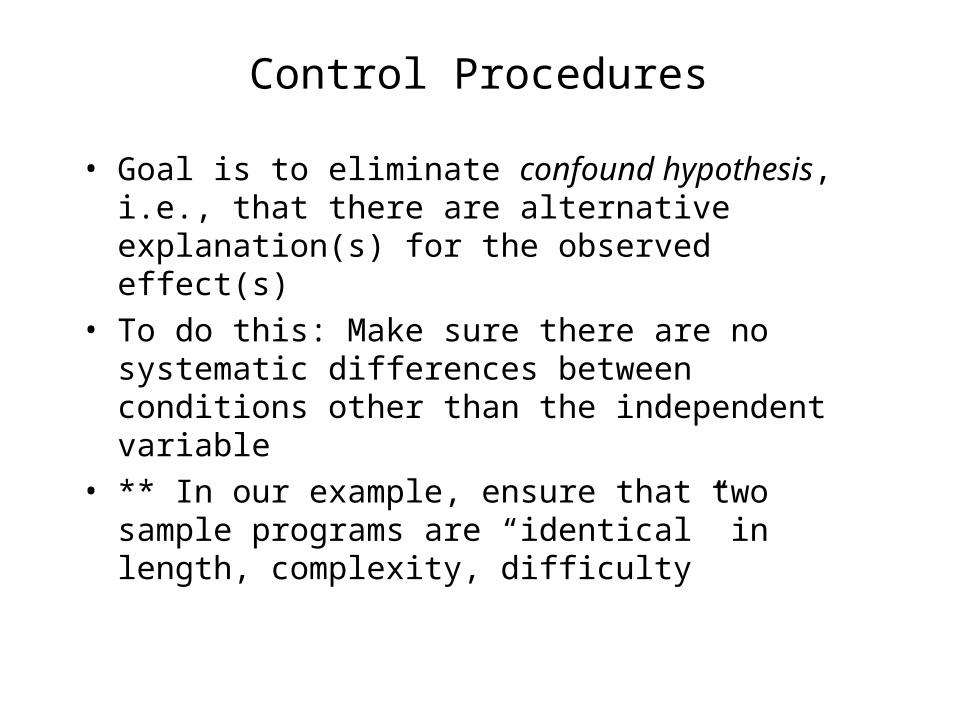
Control Procedures
• Goal is to eliminate confound hypothesis, i.e., that there are alternative explanation(s) for the observed effect(s)
• To do this: Make sure there are no systematic differences between conditions other than the independent variable
• ** In our example, ensure that two sample programs are “identical” in length, complexity, difficulty
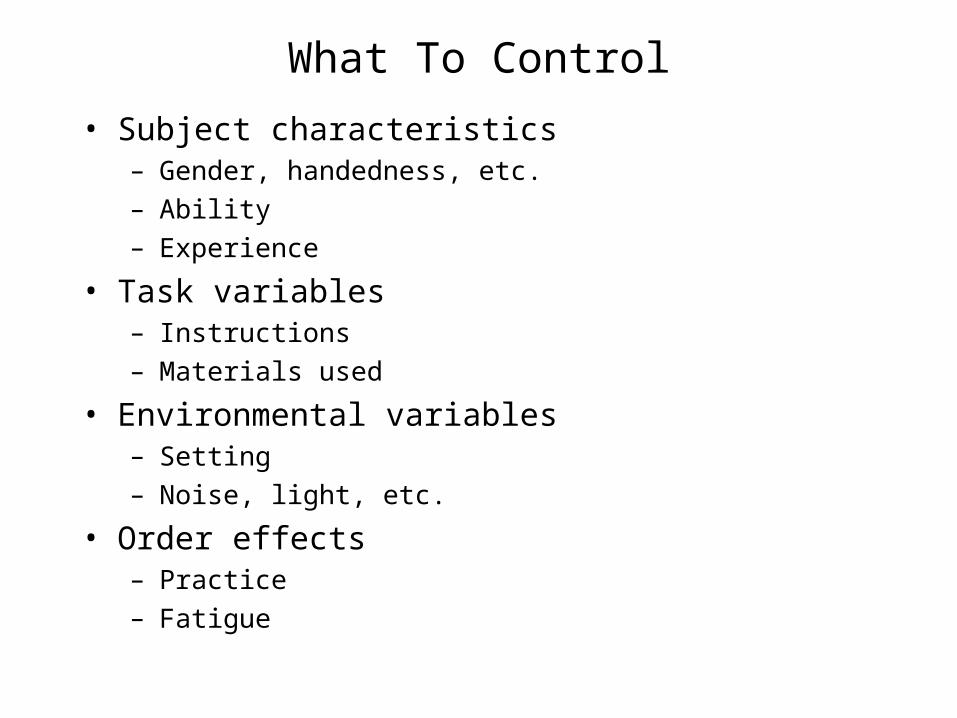
What To Control
• Subject characteristics– Gender, handedness, etc.– Ability– Experience
• Task variables– Instructions– Materials used
• Environmental variables– Setting– Noise, light, etc.
• Order effects– Practice– Fatigue
How to Control• Hold constant
– ** Use males only, or students from same class only– ** Novices only
• Randomize– ** Subjects to groups
• Counterbalance– ** Half (chosen randomly) get new presentation format first
Sample Size Selection
• More subjects --> more confidence in results. i.e., greater statistical significance
• But this can be very expensive• Many methods to reduce the required number of
subjects• Most HCI experiments: 4 to 25 subjects per group• ** In our example, 44 subjects chosen from an 3rd
year programming course
Designing and Running the Experiment and Collecting the Data
• Run pilot studies– Check experimental design– Test and improve:
• Task definition
• Experimental materials (often the most difficult)
• Instructions
• Practice tasks
– Develop experimenter skills– Identify and deal with special problems
• Run actual experiment– Record data– Observe behaviour
** The Presentation Format Experiment
• Within-subjects design, 44 subjects from 3rd year programming course
• Two “similar” short C programs, roughly 200 lines of code, 4 to 5 pages
• 40 minutes to skim first program and attempt to answer 18 questions, half in familiar format and half in new format
• Then each group given other program in other format
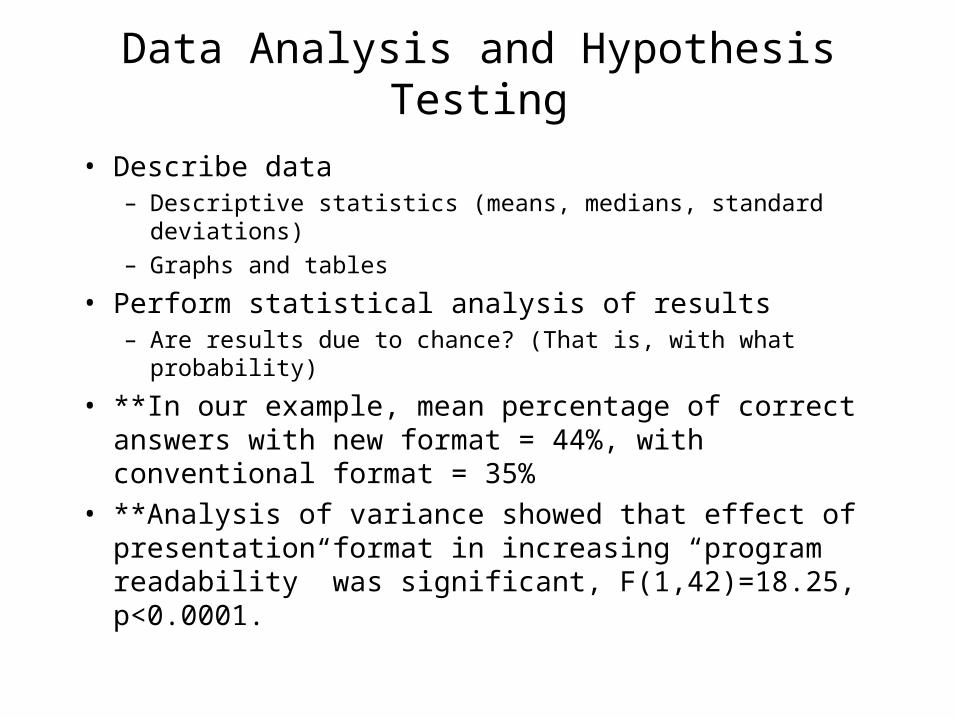
Data Analysis and Hypothesis Testing
• Describe data– Descriptive statistics (means, medians, standard deviations)– Graphs and tables
• Perform statistical analysis of results– Are results due to chance? (That is, with what probability)
• **In our example, mean percentage of correct answers with new format = 44%, with conventional format = 35%
• **Analysis of variance showed that effect of presentation format in increasing “program readability” was significant, F(1,42)=18.25, p<0.0001.
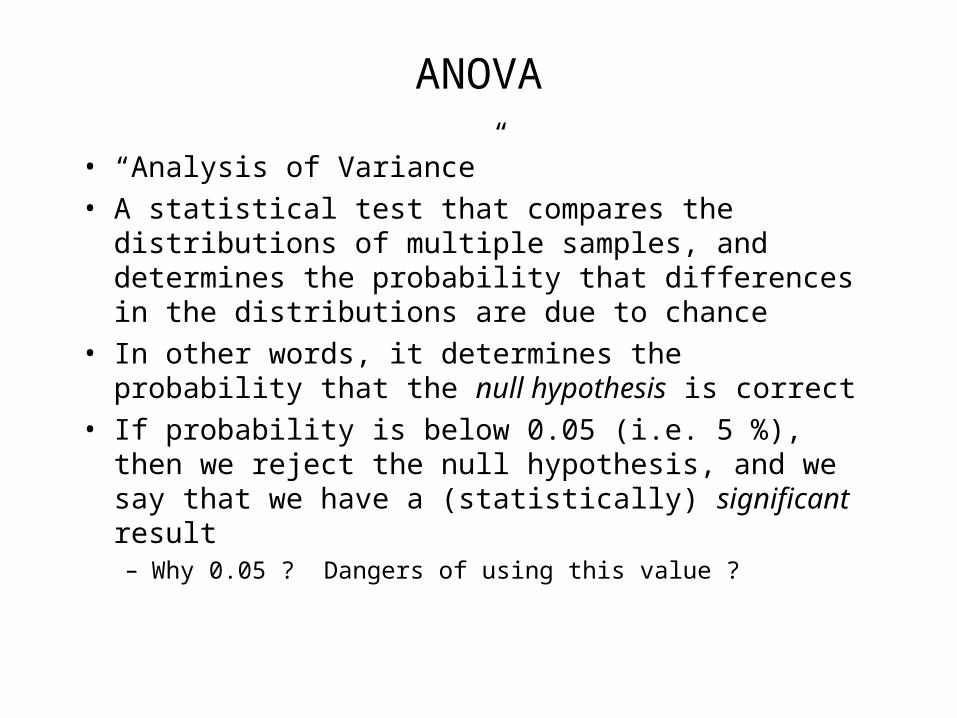
ANOVA
• “Analysis of Variance”• A statistical test that compares the distributions of
multiple samples, and determines the probability that differences in the distributions are due to chance
• In other words, it determines the probability that the null hypothesis is correct
• If probability is below 0.05 (i.e. 5 %), then we reject the null hypothesis, and we say that we have a (statistically) significant result– Why 0.05 ? Dangers of using this value ?
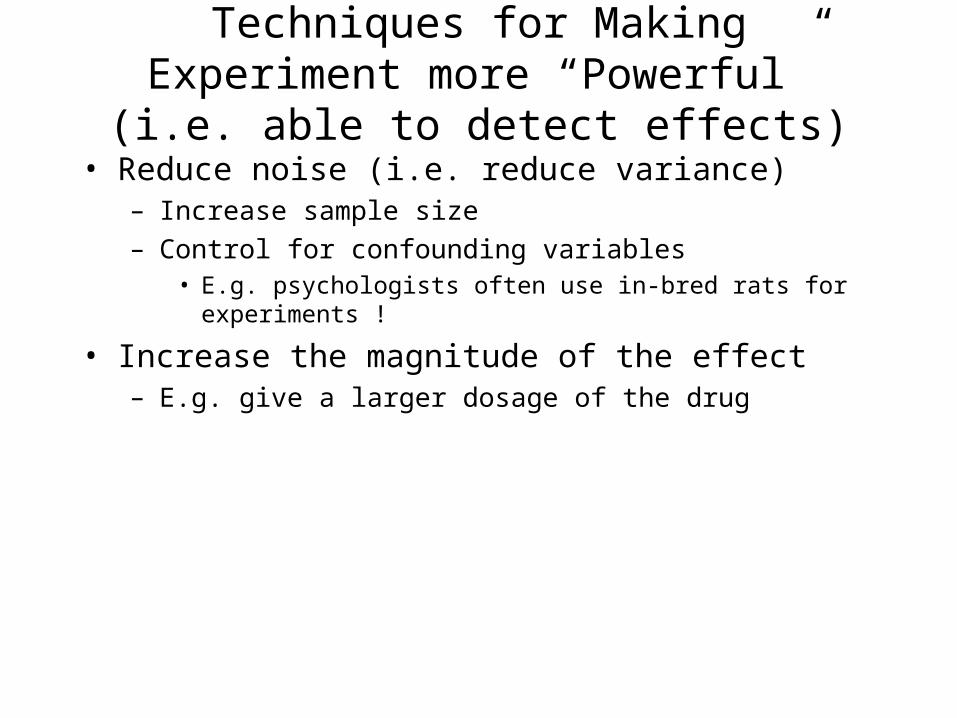
Techniques for Making Experiment more “Powerful” (i.e. able to detect effects)
• Reduce noise (i.e. reduce variance)– Increase sample size– Control for confounding variables
• E.g. psychologists often use in-bred rats for experiments !
• Increase the magnitude of the effect– E.g. give a larger dosage of the drug
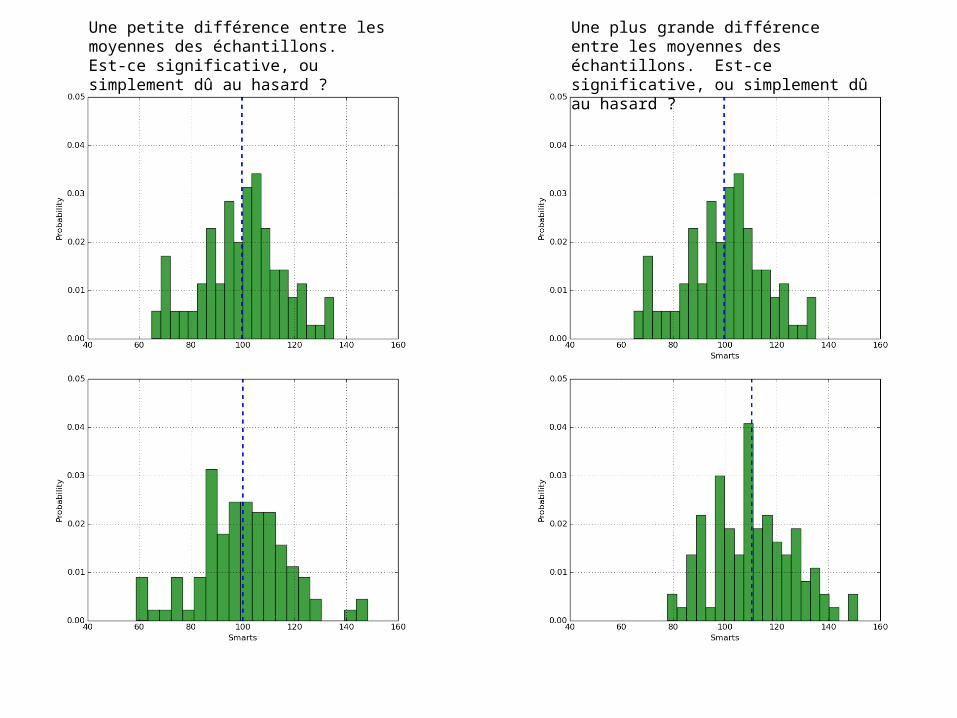
Une petite différence entre les moyennes des échantillons. Est-ce significative, ou simplement dû au hasard ?
Une plus grande différence entre les moyennes des échantillons. Est-ce significative, ou simplement dû au hasard ?
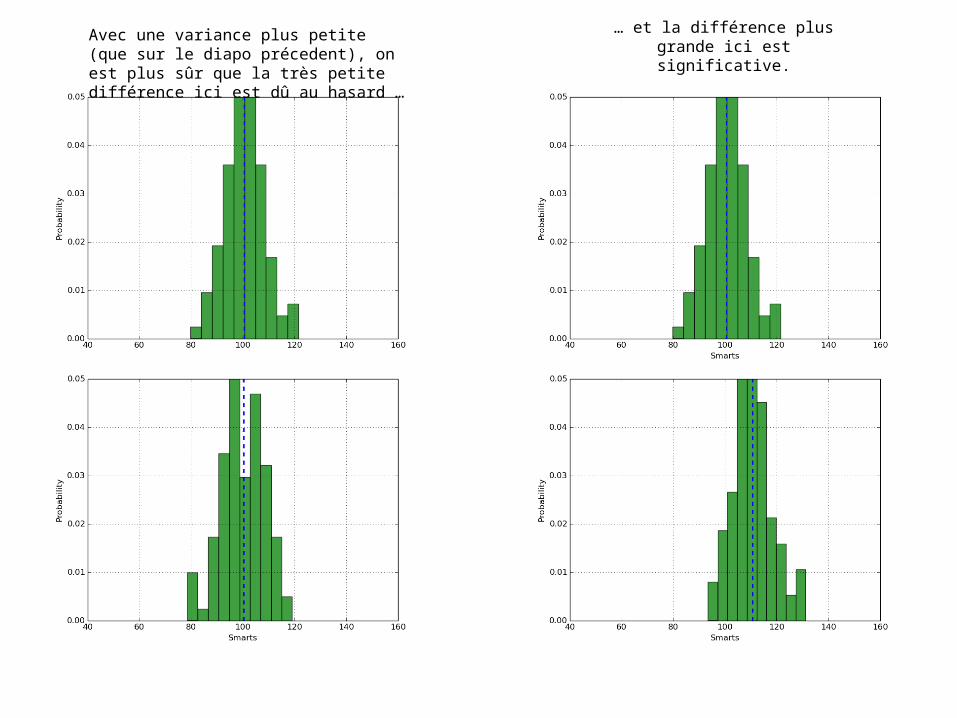
Avec une variance plus petite (que sur le diapo précedent), on est plus sûr que la très petite différence ici est dû au hasard …
… et la différence plus grande ici est significative.
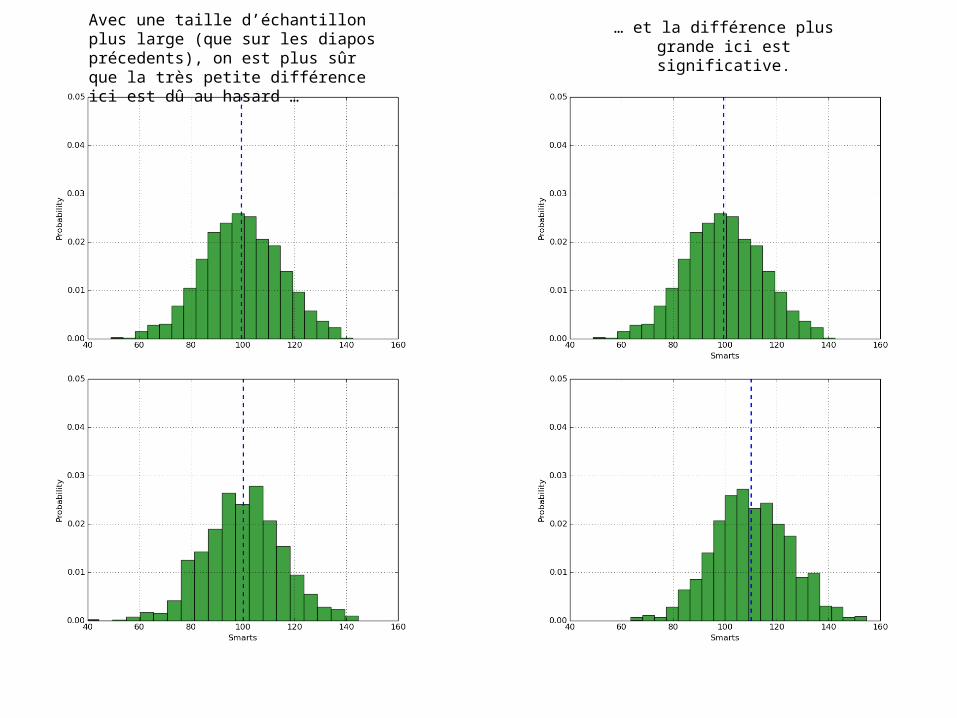
Avec une taille d’échantillon plus large (que sur les diapos précedents), on est plus sûr que la très petite différence ici est dû au hasard …
… et la différence plus grande ici est significative.
Uses of Controlled Experiments within HCI
• Evaluate or compare existing systems/features/interfaces• Discover and test useful scientific principles
– Examples ?
• Establish benchmarks/standards/guidelines– Examples ?