L RICHESSE CACHÉE DES NATIONS - Gabriel Zucmangabriel-zucman.eu/files/Zucman2013LivreAnnexe.pdf ·...
22
LA RICHESSE CACHÉE DES NATIONS ANNEXE EN LIGNE – 7 NOVEMBRE 2013 GABRIEL ZUCMAN LE SEUIL / RÉPUBLIQUE DES IDÉES 1
Transcript of L RICHESSE CACHÉE DES NATIONS - Gabriel Zucmangabriel-zucman.eu/files/Zucman2013LivreAnnexe.pdf ·...
LA RICHESSE CACHÉE DES
NATIONS
ANNEXE EN LIGNE – 7 NOVEMBRE 2013
GABRIEL ZUCMAN
LE SEUIL / RÉPUBLIQUE DES IDÉES
1
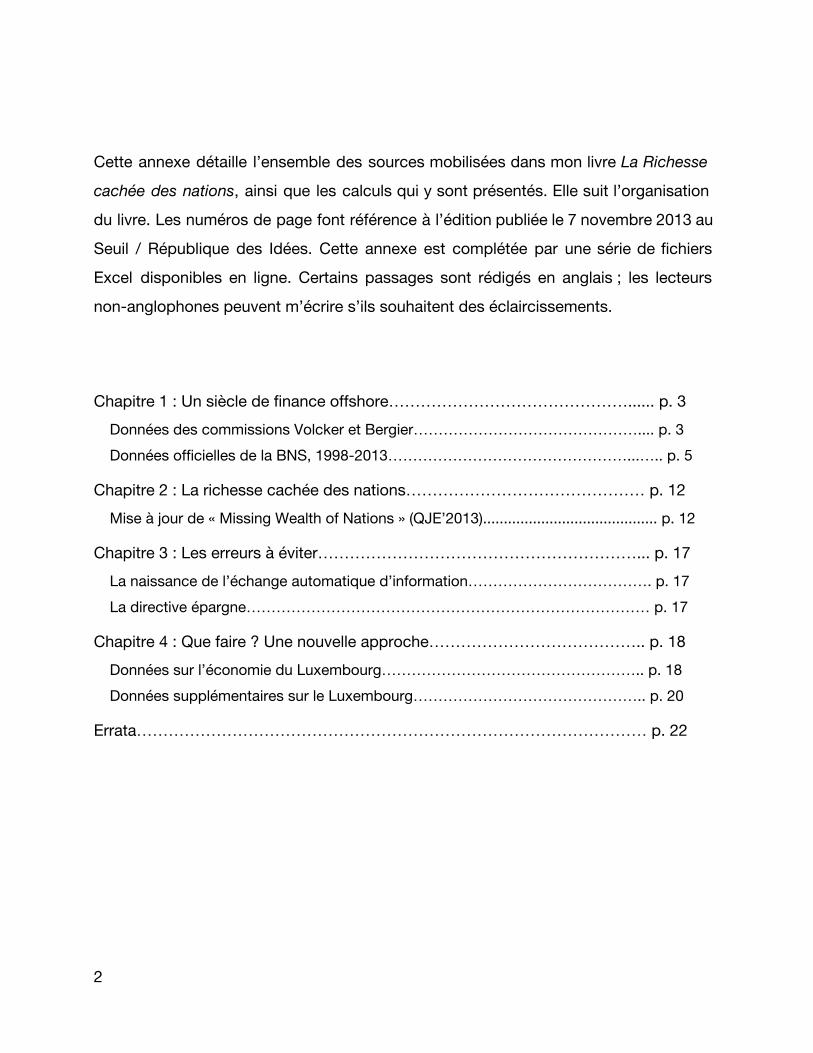
Cette annexe détaille l’ensemble des sources mobilisées dans mon livre La Richesse
cachée des nations, ainsi que les calculs qui y sont présentés. Elle suit l’organisation
du livre. Les numéros de page font référence à l’édition publiée le 7 novembre 2013 au
Seuil / République des Idées. Cette annexe est complétée par une série de fichiers
Excel disponibles en ligne. Certains passages sont rédigés en anglais ; les lecteurs
non-anglophones peuvent m’écrire s’ils souhaitent des éclaircissements.
Chapitre 1 : Un siècle de finance offshore………………………………………...... p. 3
Données des commissions Volcker et Bergier……………………………………….... p. 3
Données officielles de la BNS, 1998-2013…………………………………………...….. p. 5
Chapitre 2 : La richesse cachée des nations……………………………………… p. 12
Mise à jour de « Missing Wealth of Nations » (QJE’2013).......................................... p. 12
Chapitre 3 : Les erreurs à éviter……………………………………………………... p. 17
La naissance de l’échange automatique d’information………………………………. p. 17
La directive épargne……………………………………………………………………… p. 17
Chapitre 4 : Que faire ? Une nouvelle approche………………………………….. p. 18
Données sur l’économie du Luxembourg…………………………………………….. p. 18
Données supplémentaires sur le Luxembourg……………………………………….. p. 20
Errata…………………………………………………………………………………… p. 22
2
Chapitre 1 : Un siècle de finance offshore
Données des commissions Volcker et Bergier
I start with the 1945 value of total customers' securities under custody given by the
Independent Committee of Eminent Persons (ICEP), namely 19,850,884,000 Swiss
francs. This figure covers 254 of the 481 banks that existed in the period 1933-1945 and
that were still operating at the end of the twentieth century (or that still existed through
a successor bank). It is the result of an extensive forensic investigation conducted on
behalf of the Volcker commission by Coopers & Lybrand, Deloitte & Touche, Price
Waterhouse, Arthur Andersen and KPMG.
The commission was careful to select the biggest banks of the time. It fully covered the
7 big banks, as well as the private banks which specialized in asset management. It
covered cantonal banks extensively.
However, the Commission disregarded:
(1) 205 banks that existed in the period 1933-1945 but were subsequently liquidated or
re-defined as non-banks.
(2) 227 banks that still existed at the end of the twentieth century, but that were "almost
exclusively small, local, and regional banks that had retail domestic business and few
contacts with foreigners" (ICEP, 1999, p. 27)
The 254 banks investigated accounted for 82% of the 1945 total Swiss banks
on-balance sheet liabilities. As the Volcker Commission focused on the banks most
likely to have an asset management activity, the 82% figure should be considered as a
3
lower bound for the percentage of securities covered by its investigations.
There is no exact way to know if the actual coverage is closer to 82% (i.e., if the
missing banks were as active in asset management as the covered banks) or 100%
(i.e., if the missing banks were only deposit-taking institutions, with no securities
custody activity).
An examination of the list of the un-investigated banks (ICEP 1999, p.39) reveals that
the vast majority were savings and mortgage banks with probably negligible asset
management activity. However, it also includes a few banks that surely had non-trivial
wealth management business, namely:
1) A major cantonal bank, "Banque Cantonale de Genève", which, though selected for
examination by the ICEP, dit not allow any audit work, possibly posing "a significant
impediment to the accomplishment of the goals of the ICEP investigation" ((ICEP, p.5,
note 15)
2) Swiss branches of foreign banks: Lloyds Bank International, Slavenburg's Bnak
(Schweiz) AG…
Hence I assume that the ICEP figure covers 90% of all customers securities deposits in
1945, and retain CHF 21.84bn as the total figure for 1945.
The 6 big banks for which Perrenoud et al. (2000) provide time series have CHF 12.6 bn
in assets under management, i.e. 57,9% of the ICEP augmented total. Here is how both
estimates (ICEP and Perrenoud et al.) fit in:
1) The seventh big bank (BPS) and all the banks subsequently taken over by the 6 big
banks, which are included in the ICEP total but not in the Perrenoud et al. (2000)
estimates, had CHF 1.8bn;
2) Cantonal banks had 3.8bn;
3) Private banks had 1.64bn;
4
4) Other banks had 1.96bn.
For the 1907-1944 and 1946-1998 periods, all the data and detailed explanations are
found in the Excel file Switzerland.xlsx, Tables S1-S8.
Données officielles de la BNS, 1998-2013
The Swiss National Bank (SNB) has been publishing the value of all the securities in
custody in Swiss banks since December 1998. The SNB conducts a yearly survey and a
monthly survey.
The yearly survey is exhaustive, with the only exception that it excludes the securities
held by Swiss banks on their books. That is, it only – but fully – covers the off-balance
sheet custodial activities of Swiss banks. It gives the total market value of all securities
held off-balance sheet in Switzerland, with a breakdown by residence of the owner
(domestic/foreign), sector (“private customers”, “commercial customers”, “institutional
investors,” which includes foreign banks but excludes Swiss banks), currency of the
security, and type (bond, share, unit in collective investment scheme, and other). The
results are published in the SNB’s Banks in Switzerland, table 38a, 38b and 38c.
The monthly survey covers around 95% of the securities listed in the yearly survey. The
results are published in the SNB’s Monthly Statistical Bulletin, series D51a, D51b, D52,
and D52a. Compared with the yearly survey, the monthly survey contains additional
breakdowns. Most notably, it distinguishes Swiss from foreign securities (that is,
securities issued by Swiss entities and by foreign entities). The slight difference in
sample size explains why the data published in the SNB’s Banks in Switzerland and
Monthly Statistical Bulletin do not match perfectly.
The SNB custody dataset is truly unique. To my knowledge, no other country publishes
5

similar statistics. Custodial surveys are admittedly a key input to the production of
financial accounts, balance of payments and international investment positions across
the world. But statisticians do not usually collect any information on the foreign
securities held by foreigners with domestic custodians; and when they do, they do not
release it on a systematic basis. Indeed, this information is useless for the compilation
of national accounts, which are only concerned with the activity of resident units and
their interaction with the rest of the world.
A key strength of the SNB data is that they only relate to the portfolio securities held on
the Swiss territories – i.e., covered by Swiss bank secrecy laws. This is in contrast to the
“asset under management” (AuM) figures sometimes reported by private banks. Though
rarely defined explicitly, these AuM include the portfolio securities that the banks keep
in custody off their balance sheet. However, for the banks that have foreign branches or
subsidiaries, the AuM figures add up assets held in different countries, subject to
different level of bank-secrecy rules (e.g., automatic exchange of information with
domestic tax authorities, vs. no exchange of information whatsoever); and because
they span several countries, they cannot be used for balance of payments /
international investment positions statistics.
At the outset, it is worth stressing however that there are a number of issues wit the
SNB data. The main issue is that the sectorial breakdowns provided by the SNB are
deeply misleading. Among non-resident custody account holders, The SNB
distinguishes private customers, commercial customers, and institutional investors.
Some users of the SNB statistics focus on private customers accounts and disregard
commercial and institutional accounts. They take seriously a distinction that is almost
meaningless. In fact, commercial/institutional accounts include accounts opened by: (i)
wealth-holdings companies (holdings, NOGA code 642, are treated as institutional
investors by the SNB); (ii) trusts; (iii) financial intermediaries acting as “nominees”; (iv)
sham corporations.
6

Custodians are well aware that most assets of foreign high net worth individuals are
actually held through those types of entities. But the SNB does not try to look through
them. Other entities that are included under foreign commercial/institutional accounts
include (v) foreign mutual funds (vi) foreign banks/insurance companies, (vii) foreign
pension funds, and (viii) foreign central banks & sovereign wealth funds (e.g., from
Middle East countries). Among these, in all likelihood the only significant group is the
last one. For the purpose of this research I treat Middle-East central banks / SWFs as
private wealth, because in many cases there is simply no clear distinction between
“private” and “public” holdings in these countries.
I start the analysis with the data on offshore portfolios (i.e., portfolios of foreign
securities that belong to non-residents) as reported in the SNB’s Monthly Statistical
Bulletin series D5_1a_M33.
By dividing the amount of all portfolio securities reported in the yearly survey series
D38b by those reported in the monthly survey, we can see that the monthly survey
covers about 95-99% of all custodial holdings. On average over 1998-2012 it covered
96.8%, so I multiply all reported monthly data by 1/0.968. (See detailed computations in
Switzerland.xlsx sheets FullPartialSample and Table S8).
I also convert all reported monthly data in euros (and US$) using the official SNB
exchange rates reported in the Monthly Statistical Bulletin, series G1. I use
end-of-month exchange rates (the monthly exchange rates provided on the SNB
website are monthly averages, and I reconstruct end-of-month data from the daily
exchange rates provided).
So for instance, the May 2013 data point for the offshore portfolios (foreign securities
held by foreigners) in Swiss banks is = (1,751.6 / 0.968) / 1.2406 = 1,458bn euros.
7

As explained in the book, this misses a number of things:
1) Fiduciary deposits. Monthly data are available in the Monthly Statistical Bulletin.
There are two different scope of reporting entities: parent company and bank office. The
correct one is bank office. “Parent company” consolidates the fiduciary liabilities of,
say, UBS Switzerland (= money put by foreigners in Zurich) with the fiduciary assets
held by, say, UBS Switzerland in UBS Jersey (= investments made on behalf of the
depositors by UBS Switzerland out of Switzerland in order for the deposits to avoid the
35% advance tax), hence totals are much too low. As of May 2013, total fiduciary
deposits held by foreigners amounted to 165bn CHF (133bn euros), see series D4_1a.
Note that this only captures fiduciary deposits recorded as “foreign-owned”, but there
are also “domestic-owned” fiduciary deposits which in fact include a large chunk of
deposits held by Liechtenstein foundations (Liechtenstein is considered part of
Switzerland for the purpose of these statistics). Data on “domestic-owned” fiduciary
deposits are available in the Monthly Statistical Bulletin, series 2E. As of May 2013,
those amounted to about 25bn euros, so that total fiduciary deposits equaled 133bn +
25bn = 158bn euros.
2) Swiss securities held by foreigners in custody in Swiss banks. This is a bit tricky,
because basically all Swiss equities are ultimately held in custody in Switzerland (for
settlements reasons), irrespective of whether they are primarily held through an
offshore or an onshore account. So it is not possible to use the amount of
foreign-owned Swiss securities reported in the SNB’s monthly bulletin as an estimate
for the amount of Swiss securities held on Swiss offshore bank account.
On the other hand it is pretty clear that some tax evaders have Swiss securities (or fund
shares) on their accounts, so completely disregarding those (as I did in Zucman, 2013)
8
is not totally satisfactory either: it leads to under-estimating the amount of offshore
wealth managed in Switzerland. Many mutual fund shares do not pay dividends (pure
capitalization funds), and many others are mostly invested in foreign securities; in both
cases the 35% Swiss advance tax can be avoided (e.g., when more than 80% of a fund
is invested in foreign securities there is an affidavit procedure that enables foreign fund
shareholders to escape the advance tax). So having Swiss fund shares can be
tax-efficient. The same is true for equities (i.e., many equities pay little dividend and
most of the return comes from capital gains, but there is no advance tax on realized
capital gains).
Swiss securities held by foreign individuals on their offshore Swiss accounts will be
recorded as liabilities by Switzerland but nowhere as assets. So ultimately the method I
retained to estimate those securities is to look at the discrepancy between
Swiss-reported portfolio equity (including fund shares) liabilities and creditor-derived
liabilities. I assume that 100% of the discrepancy comes from offshore holdings of
Swiss securities in Switzerland (a small fraction of those unreported Swiss securities
may be held in other tax havens; plus some of the discrepancy may of course have to
do with pitfalls in some countries’ asset surveys, but I disregard those two issues here;
the sums involved are small so this does not have any important effect on anything).
For the 2000s decade, data are from the Appendix of Zucman (2013, Table A3). To get
an estimate for 2013, I use the latest available data, which are those for 2011. At that
time, Swiss equity liabilities were $624bn, CPIS-derived liabilities were $547bn (I
assume that non-CPIS countries equity assets on Switzerland = 0), so the discrepancy
amounted to $77bn, i.e. 58bn euros.
3) Offshore portfolios incorrectly recorded as Swiss-owned. Foreign clients who provide
a Swiss address, or that have their wealth held through a Swiss nominee (either a
banker, lawyer, fiduciary, etc.) will have their holdings recorded as Swiss-owned. The
9
SNB does not try to “look-through” these intermediaries; it just counts the
corresponding assets as Swiss-owned. Moreover, the SNB considers Liechtenstein as
part of the Swiss territory; this means for instance that all portfolios held by foundations
set up by foreigners in Liechtenstein and deposited in Switzerland are counted as
Swiss-owned (note, however, that the SNB custodial data do not cover the securities
entrusted to banks domiciled in Liechtenstein; it only includes Swiss-domiciled banks).
There is no simple way to estimate the amount of portfolio wealth incorrectly recorded
as “Swiss-owned”. One indication that those holdings are substantial is the
extraordinary amount of mutual fund shares recorded by the SNB as being owned by
Swiss residents. As of May 2013 for instance, those mutual fund shares amounted to
more than 815bn Swiss francs, which is about 135% of Swiss GDP. By contrast, in
France mutual fund shares held by French residents amount to about 60% of GDP, i.e.
1,238bn as of end 2011.
Especially mysterious are the more than CHF 90bn of mutual fund shares held by
“financial asset management institutions other than Swiss funds, banks (whose
holdings are not included in the SNB custodial data), insurance companies, pension
funds, and financial auxiliaries.” In all likelihood a substantial chunk of these assets
(possibly all) correspond to mutual fund shares managed by various types of nominees
on behalf of foreign residents.
Accordingly, I retain a rough (and extremely conservative) estimate of about 100 billion
dollars for the offshore portfolios incorrectly attributed to Swiss owners. Note that if
Swiss residents hold as much mutual fund shares as French residents (60% of GDP, i.e.
about 360bn CHF) then actually more than CHF 450bn of mutual fund shares presently
recorded as Swiss-owned should actually be recorded as foreign-owned… This is an
important area in which additional research needs to be conducted. It is very likely that
at this stage I under-estimate the amount of offshore wealth in Switzerland because I
10
do not fully account for the assets recorded as Swiss-owned in the SNB custody survey
that in fact belong to foreign individuals.
Regarding portfolio compositions, the shares for the different asset classes are taken
from the SNB Monthly Statistical Bulletin series D5_1a_M33. In May 2013, mutual fund
shares accounted for 37% of the offshore portfolios, bonds and notes for 31%, equities
for 24%, and structured products for 7%. Adding my estimate of the fund shares held by
“fake” Swiss residents, we can consider that about 42% of the offshore fortunes in
Switzerland are made of fund shares, which is 0.42 x 1,800bn = 750bn euros. According
to the Swiss fund data analyzed in Zucman (2013), about 4,600 funds distributed in
Switzerland are incorporated in Luxembourg, 1,200 in Ireland, and almost all the rest in
Switzerland. So the amount of Luxembourg fund shares held by foreign residents on
their Swiss accounts comes to 4600 / (4600 + 1200) x 750bn = about 600bn euros, and
the amount of Irish fund shares to about 150bn euros (this disregards the small amount
of Swiss funds with affidavit, and non-Luxembourg, non-Irish foreign funds).
11
Chapitre 2 : La richesse cachée des nations
Mise à jour de « Missing Wealth of Nations » (QJE’2013)
For the purpose of this book, I have updated the estimate of the world’s offshore wealth
derived in Zucman (QJE 2013) and produced in the Online Appendix of this article. The
data ended in December 31st, 2008. The update now has data through to December
31st 2011, as well as preliminary computations for end 2012. It can be found in the file
MissingWealth.xlsx. All the computations are precisely described in this file. Here are
some additional details.
World financial wealth in 2013 (p. 44)
World private wealth income-ratio 2013 = 440 % = Piketty-Zucman (2013 Table A8,
figure for 2010-19 decade)
I assume that net financial wealth is 30% of the total at the global level, in line with
Piketty-Zucman 2013 (for instance France end of 2010: private wealth = €10.1tr,
financial assets = 3.9tr, liabilities = 1.2tr; non-financial assets=7.4tr; so net financial
wealth = 2.7tr= 27%; this is on the low end of rich countries).
World GDP in 2012 (World Bank), in current bn US$ = 75,000bn, so 2013 about $80tr
(exact level depends a lot on exchange rate); with 15% depreciation world income =
$68tr; so world financial wealth = $68 x 0.30 x 4.4 = $90tr. In Piketty-Zucman (2013) we
completely disregarded tax havens, so by constructions this ignores the portfolio wealth
that goes unrecorded in tax havens, which I estimate to be equal to 6% of the total
(recorded) financial wealth (Zucman, 2013). So the total (recorded + unrecorded) world
12
financial wealth is $90tr/(1-0.06) = $95tr = € (95/1.3) = €73tr.
The Luxembourg black hole (p. 47-48)
End of 2012 recorded portfolio liabilities of Luxembourg (2,211bn euros) straight from
official Luxembourg IIP: http://www.bcl.lu/en/statistics/series/09_iip/index.html
Creditor-derived portfolio equity liabilities of Luxembourg: as of August 2013, CPIS has
1,431bn for end 2011. I multiply this by 1.1 (the growth rate of Luxembourg equity
liabilities between 2011 and 2012) and convert this into euros, so that creditor-derived
liabilities = 1,431 x 1.1 / 1.3 = EUR 1,211bn. I disregard non-CPIS countries holdings of
Luxembourg mutual fund shares, because in all likelihood those are negligible (China
and oil do not invest in standard fund shares; the only issue might be Cayman Islands,
as some funds incorporated there may have Luxembourg fund shares on their asset
side in fund-of-fund structures; this will need to be checked when the Cayman fund
data are added to the CPIS).
BIS data on offshore bank deposits (p. 49)
Who owns BIS deposits? The Bank of France provides data on the sectorial
composition of EU deposit-holders in French banks: “créances et engagements des
institutions financères et monétaires. Dépôts du secteur privé des autres EMUM auprès
des établissements de crédit français”, broken down as follows: “autres intermédiaires
financiers”, “sociétés d’assurance et fonds de pension”, “sociétés non financières”,
“ménages et institutions sans but lucratif au service des ménages”. Those data are
published in the quarterly monetary statistics (“statistiques monétaires”). They show
that most cross-border deposits in French banks belong to financial institutions like
insurance companies and mutual funds, not households.
13
Other havens’ central banks providing sectorial breakdown of offshore bank deposits
owners include Luxembourg, Jersey, Guernsey, Isle of Man; see Johannesen and
Zucman (2014) for an analysis of these data.
Currency in circulation (p. 51)
Data on the amount of currency in circulation by denomination (i.e., $100 bills, $50 bills,
etc.) are available on the respective central bank website.
U.S. dollars currency & coin yearly data: Fed.
ECB: euro banknotes and coin circulation, monthly data. As of July 2013, €100 bills =
176bn; €200 bills = 38bn; €500 bills = 290bn.
SNB: banknote circulation. On average in 2012, 1,000 CHF bills = 33bn CHF
(negligible).
Fraction of offshore wealth which is not declared on tax returns
The assumption retained in the book is that 80% of the amount of offshore wealth goes
undeclared on average at the global level. This assumption is based on the
computations presented in Johannesen & Zucman (2014) who use data produced by
the Swiss tax authority, “Administration fédérale des contributions”.
The administration fédérale des contributions provides direct information on tax
compliance on the part of offshore account holders in Switzerland, probably the most
important tax haven as far as personal wealth management is concerned.
Since mid-2005, in the context of the EU Savings Directive, Swiss banks must withhold
a tax on interest income paid to European households who own Swiss accounts. Savers
can escape the withholding tax if they voluntarily declare their income to their home
country tax authority. The Swiss tax authority has published on a yearly basis the
14

amount of interest earned by residents of each EU country, as well as what fraction of
this income savers have chosen to voluntarily disclose. The data is available here. The
latest information (for end 2012) shows that about a third of the interest income covered
by the EU Saving Directive is voluntarily declared to EU authorities, while 2/3 is not.
It should be noted that a 30-35% figure is a large upper bound for the true fraction of
the offshore wealth in Switzerland that is declared, because the Saving Directive does
not apply to the accounts held through shell companies, but only to those accounts
directly held by private customers. About 60% of the offshore wealth in Switzerland is
held through shell companies incorporated in the BVIs etc., and under all likelihood, the
compliance rate for those accounts is much less than for those covered by the EU
Saving Directive. Assuming that the compliance rate is 10% of the accounts held
through trusts, sham companies, foundations, and the like, the overal compliance rate
is around 20%.
We have information on compliance for only a very small fraction of the global offshore
wealth. There is no information on the fraction of offshore wealth declared in the tax
havens other than Switzerland. More research is needed in this area.
Mutual fund returns (p. 54-55)
The MSCI world – which captures equity investments in large and mid-caps across 24
equity markets – had a + 8.16% yearly average return between July 2003 and July
2013, see MSCI world factsheet.
Vanguard provides a large number of benchmark indexes, with 1, 3, 5 and 10-years
return. As of the summer of 2013, all composite indexes show large positive returns
over a 10-years period, typically in the 6-8% range.
15

These are nominal returns, before tax and before fees. They are well in line with the 6%
return average nominal return on offshore accounts I retain.
16
Chapitre 3 : Les erreurs à éviter
La naissance de l’échange automatique d’information
Some references for the birth of automatic information exchange in the 1900-1910
decade and debates about tax evasion in pre-World War 1 period:
Bulletin de Statistique et de législation comparée, 1909, vol. 1, projet de budget pour
l’exercice 1910, pp.616-
http://gallica.bnf.fr/ark:/12148/bpt6k454584x/f455.image
René Dépinchault, La fraude successorale par le procédé du compte joint
http://gallica.bnf.fr/ark:/12148/bpt6k6454789z/f19.image
La directive épargne
The effect of the EU Saving Directive on offshore accounts is analyzed in details in
Zucman (2013), Johannesen & Zucman (2014), and Johannesen (2012). The reader is
referred to these studies for all relevant details.
Data on EU savings directive information exchange / withholding tax in Switzerland can
be found here:
http://www.estv.admin.ch/dokumentation/00075/00076/00946/index.html?lang=fr
17
Chapitre 4 : Que faire ? Une nouvelle approche
Données sur l’économie du Luxembourg
Les données relatives à l’économie luxembourgeoise, qui sont mentionnées aux pages
92-97, sont rassemblées et organisées dans le fichier Excel disponible en ligne
Luxembourg.xlsx. Les sources sont précisément indiquées dans ce fichier. D’une façon
générale, les données proviennent de l’OCDE (revenu national, PIB, décomposition du
PIB par secteur de production, etc.), ainsi dans certains cas que de l’office statistique
luxembourgeois, Statec (http://www.statistiques.public.lu/). L’avantage des données
OCDE est qu’elles remontent à 1970, alors que les comptes nationaux actuellement
diffusés par Statec ne commencent en général qu’en 1995. Pour la période 1995-2013
les deux sources fournissent en général des informations identiques.
Comme le montre le tableau LU1, le PIB luxembourgeois s’élevait à 44 milliards
d’euros en 2012, et le produit intérieur net – c’est-à-dire le PIB une fois déduite la
dépréciation du capital – à 39 milliards d’euros. Mais ce produit intérieur net inclut plus
de 12 milliards de revenus nets payés à l’étranger – des salaires versés aux travailleurs
transfrontaliers, des dividendes et des intérêts payés à des investisseurs étrangers, des
profits réinvestis par les multinationales européennes et américaines qui ont des filiales
au Grand-Duché, nets de tous les revenus reçus du reste du monde. Si bien que le
revenu national (= produit intérieur net – revenus nets versés à l’étranger) ne s’élève
qu’à 27 milliards d’euros à peine (tableau LU1, colonne 1). Soit 68 % du produit intérieur
net. Comme le montre le tableau LU1, la dynamique des paiements nets au reste du
monde est explosive : en 1995 les revenus nets versés à l’étranger ne représentaient
que 9 % du revenu national, contre 46 % en 2012. Il s’agit aujourd’hui pour moitié de
salaires payés aux travailleurs transfrontaliers et pour moitié de revenus du capital
18
versés aux investisseurs étrangers. Comme le montre le tableau LU2, il y a environ 1
150 000 travailleurs transfrontaliers au Luxembourg en 2013 (col. 6), soit environ 40 %
du nombre de personnes travaillant au Grand Duché.
Avec un ratio revenu national / produit intérieur de seulement 68 %, le Luxembourg est
le pays du monde qui verse le plus de revenus primaires à l’étranger, exception faite de
Puerto Rico (66 %) et de la Guinée équatoriale (64 %). Ce constat se fonde sur les
séries publiées par la Banque mondiale sur le PIB d’une part et le revenu national brut
de l’autre, telles que publiées dans la base de données World Development Indicator
(WDI), et reproduites dans le fichier AnnexeGenerale.xlsx
Porto Rico est une colonie américaine (officiellement un “unincorporated territory of the
U.S.”) des Caraïbes. D’après les comptes nationaux de Porto Rico, la part du capital
dans le PIB est de 65 % et la part du travail 35 % (voir Economic Report to the
Governor, 2012, Table 11, p. A22). La part du capital est artificiellement gonflée par les
manipulations des multinationales (notamment pharmaceutiques) qui font apparaître
leurs profits dans l’Archipel. L’essentiel du capital est possédé par des étrangers (au
premier chef américains), si bien que Porto Rico paye 40 % de son revenu domestique
au reste du monde. Le salaire moyen y est néanmoins élevé par rapport aux autres
pays des Caraïbes, de l’ordre de 25 000 dollars.2
1 L’OCDE inclut les impôts sur la production (comme la TVA) versés à l’étranger dans son flux de revenus primaires nets versés à l’étranger. Les flux transfrontières d’impôt sur la production sont calculés dans la col. 7 du tableau LU1 comme le résidu des revenus primaires étrangers d’après l’OCDE (col. 3) et des revenus nets du capital et du travail payés à l’étrangers d’après Statec (colonnes 5 et 6). Ce résidu est faible dans les années récentes, mais assez fortement négatif dans les années 1990 et au début des années 2000. L’explication la plus probable est une mauvaise comptabilisation des revenus du capital de la part de Statec (qui semble reporter des revenus du capital net trop élevé de 1995 et 2003) ; mais il est possible également que l’estimation des flux de TVA internationaux implicites dans les calculs de l’OCDE soient erronés (compte tenu de la place jouée par le Luxembourg dans les montages de type carrousel, cela n’aurait rien d’étonnant). Que l’on regarde les données OCDE ou Statec, la conclusion de fond est cependant exactement même : le solde des revenus nets primaires versés au reste du monde est très fortement négatif aujourd’hui (près de 50 % du revenu national), et s’est détérioré de façon spectaculaire au cours des 15 dernières années.2 (total wage bill =$ 25,000mn) / (employed population = 1 mn) = about $25,000.)
19
En ce qui concerne la Guinée équatoriale, la part du capital est sans doute très élevée
aussi, et il est possible qu’une grosse partie du stock de capital soit possédé par des
étrangers. Mais le plus probable est que le ratio PNB/PIB enregistré par la Banque
mondiale est trop bas en raison d’erreurs de mesure et de la faible qualité des données
de comptabilité nationale guinéennes.
Autre remarque sur les données de comptabilité nationale luxembourgeoises : si l’on
divise le PIB par la population résidant au Luxembourg, comme le font la plupart des
organismes statistiques internationaux, le Grand-Duché affiche une croissance
époustouflante : 3 % en moyenne par an depuis 1970, là où aucun grand pays
développé n’a fait mieux que 2 % l’an. Mais cette division, qui inclut les transfrontaliers
au numérateur mais les exclut du dénominateur, n’a aucun sens. Le calcul correct
divise le PIB par la population employée au Luxembourg (ce qui inclut les
transfrontaliers au numérateur et au dénominateur). , auquel cas la croissance
luxembourgeoise n’a rien d’exceptionnel, et au contraire fait pâle figure
Données supplémentaires sur le Luxembourg
Inequalities (evolution of gap between top and bottom decile since mid-1980s): OECD
(2012), Economic Surveys of Luxembourg, Dec. 2012, Figure 1.2 p. 42
Educational achievement (PISA): OECD (2012), Economic Surveys of Luxembourg, Dec.
2012, Figure 6 p. 25
Housing prices: Educational achievement: OECD (2012), Economic Surveys of
Luxembourg, Dec. 2012, p. 86
Diesel and petrol prices and taxes: Educational achievement: OECD (2012), Economic
Surveys of Luxembourg, Dec. 2012, Figure 2.5 p. 73.
20

Political institutions:
http://www.luxembourg.public.lu/fr/politique/institutions-politiques/index.html
Mahta & co-authors (2012) present the results of the Luxembourg wealth survey. They
find an average wealth per household of 732,000 euros in 2010 (Table 10). Average
household size is 2.48 so average wealth per resident is about 295,000 euros. Given
that national income per resident was 44,000 € in 2010 (see Table LU3), the private
wealth/national income ratio is about 670%, which is comparable to Italy, the country
with the highest wealth-income ratio in Piketty-Zucman (2013).
Memo : Share of financial industry in Swiss GDP (11% of GDP) = Swiss National
Accounts
Commission income earned by Swiss banks (about 4% of GDP) = Banks in Switzerland
Table 40.
21

Errata
Ces errata font référence à l’édition du 7 novembre 2013.
● Une virgule a été supprimée par erreur lors de la composition du livre, p. 9 :
« Seul, l’échange international et automatisé de données risque de buter sur
l’opacité financière ».
● P. 93 : « le Parti Chrétien social fournit le Premier ministre depuis la fin de la
Seconde Guerre mondiale, à l’exception d’une brève période de cinq ans à la fin
des années 1970, et du premier ministre qui vient d’entrer en fonction en
novembre 2013. »
22