![Guimond interactions cp et vpp-22-09-04.ppt [Lecture seule] · VPP CPAP VM PIT BIPAP JGGuimond/A.Pronovost/akimage zPpl, Poes, Pjc zVariabilité zTendances uniformes II. PIT ET HÉMODYNAMIE](https://static.fdocuments.fr/doc/165x107/5f845fe11ae661158e187dc7/guimond-interactions-cp-et-vpp-22-09-04ppt-lecture-seule-vpp-cpap-vm-pit-bipap.jpg)
Inter-ramp and bench design of open-pit mines: the …...Inter-ramp and bench design of open-pit...
19
Inter-ramp and bench design of open-pit mines: the Portage pit case study Martin Grenon & Amélie-Julie Laflamme Faculté des sciences et de génie, Département de génie des mines, de la métallurgie et des matériaux, Université Laval, Québec, Canada ABSTRACT Using a case study, this paper presents an integrated methodology for assessing structural slope stability at the inter-ramp and bench levels. Robust algorithms have been developed and implemented to compute, at inter-ramp and bench levels, slope orientations and slope stability using input data compatible with a commercially available mine-design software tool database structure. Multi-criteria stability analyses were performed based on various design criteria. Susceptibility maps were produced enabling the identification of zones of concern in the designed pit. The obtained results suggest that inter-ramp angles do not present instability concerns over the entire pit surface. At bench levels, potential instability zones were identified within two structural domains totaling 6% of the total pit surface. KEYWORDS mining engineering, slope stability, mine planning, integrated design, acceptance criteria. CITATION Grenon M. & Laflamme A. J. Inter-ramp and bench design of open-pit mines: the Portage pit case study. Canadian Geotechnical Journal (2011) 48(11), 1601-1615. This is the author’s version of the original manuscript. The final publication is available at NRC Research Press Link Online via doi: 10.1139/T11-062 1 INTRODUCTION Slope design is one of the most important aspects of open-pit mines. Read and Stacey (2009) mentioned that unlike civil slopes, where emphasis is on design reliability and performance, open- pit slopes are normally constructed to lower levels of stability, reflecting the emphasis on cost– benefit, the shorter operation life spans involved, and the high level of monitoring that is typically available in the mine. Using the geometry presented in Fig. 1, slope stability needs to be evaluated at three levels in pit engineering: bench, inter-ramp, and global. It is common practice in the industry to quantify slope stability using the factor of safety (FS) and the probability of failure (PF). FS is the ratio between resisting and driving forces. Commonly, an FS value of less than 1 will indicate instability. When considering FS as a random variable, PF is the probability that FS is less than 1. Although not widely seen in the technical literature, some FS and PF acceptance criteria for mining slope design have been proposed over the last 30 years (Priest and Brown 1983; Swan and Sepulveda 2000; Hoek 2007; Read and Stacey 2009). None of them have gained popular acceptance nor are they commonly used. As open-pit mining projects are becoming bigger and deeper, more efficient collaboration is essential between geotechnical and mine design engineers during the slope creation process. Efficiency can be improved when both groups effectively share all available information and analysis results. One convenient way to improve efficiency is by using a unique database and compatible
Transcript of Inter-ramp and bench design of open-pit mines: the …...Inter-ramp and bench design of open-pit...

Inter-ramp and bench design of open-pit mines: the Portage pit case study Martin Grenon & Amélie-Julie Laflamme Faculté des sciences et de génie, Département de génie des mines, de la métallurgie et des matériaux, Université Laval, Québec, Canada ABSTRACT Using a case study, this paper presents an integrated methodology for assessing structural slope stability at the inter-ramp and bench levels. Robust algorithms have been developed and implemented to compute, at inter-ramp and bench levels, slope orientations and slope stability using input data compatible with a commercially available mine-design software tool database structure. Multi-criteria stability analyses were performed based on various design criteria. Susceptibility maps were produced enabling the identification of zones of concern in the designed pit. The obtained results suggest that inter-ramp angles do not present instability concerns over the entire pit surface. At bench levels, potential instability zones were identified within two structural domains totaling 6% of the total pit surface. KEYWORDS mining engineering, slope stability, mine planning, integrated design, acceptance criteria. CITATION Grenon M. & Laflamme A. J. Inter-ramp and bench design of open-pit mines: the Portage pit case study. Canadian Geotechnical Journal (2011) 48(11), 1601-1615. This is the author’s version of the original manuscript. The final publication is available at NRC Research Press Link Online via doi: 10.1139/T11-062 1 INTRODUCTION
Slope design is one of the most important aspects of open-pit mines. Read and Stacey (2009) mentioned that unlike civil slopes, where emphasis is on design reliability and performance, open-pit slopes are normally constructed to lower levels of stability, reflecting the emphasis on cost–benefit, the shorter operation life spans involved, and the high level of monitoring that is typically available in the mine.
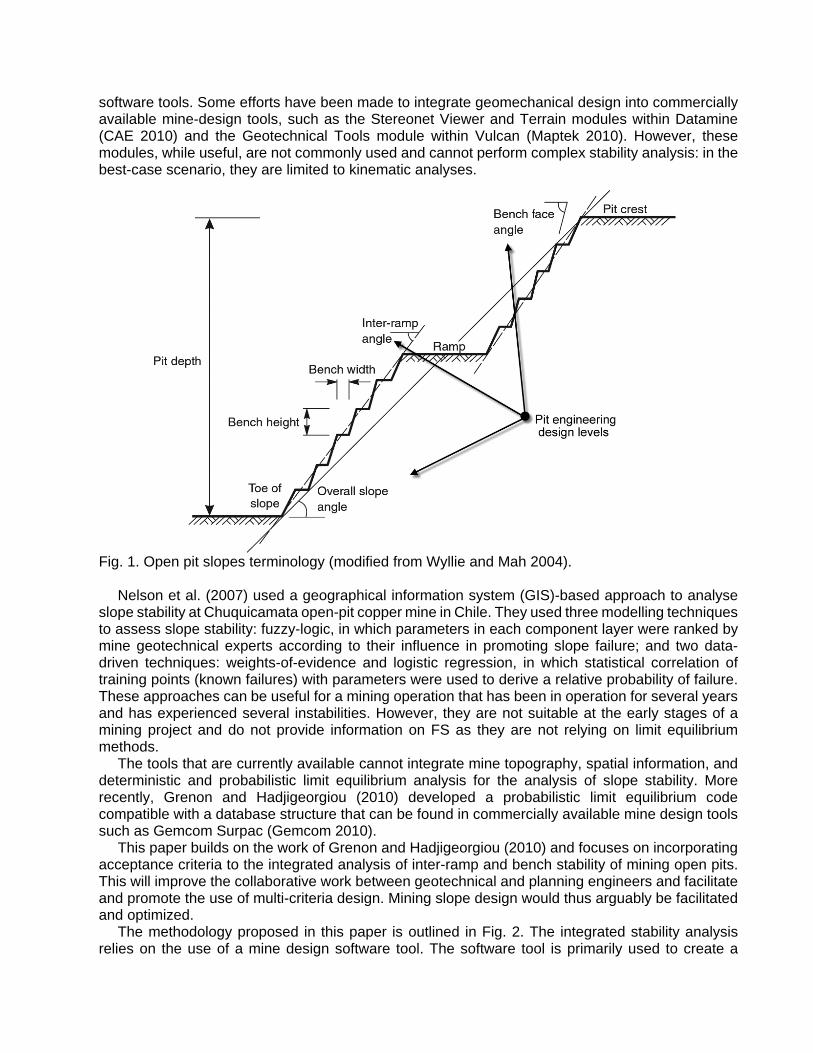
Using the geometry presented in Fig. 1, slope stability needs to be evaluated at three levels in pit engineering: bench, inter-ramp, and global. It is common practice in the industry to quantify slope stability using the factor of safety (FS) and the probability of failure (PF). FS is the ratio between resisting and driving forces. Commonly, an FS value of less than 1 will indicate instability. When considering FS as a random variable, PF is the probability that FS is less than 1.
Although not widely seen in the technical literature, some FS and PF acceptance criteria for mining slope design have been proposed over the last 30 years (Priest and Brown 1983; Swan and Sepulveda 2000; Hoek 2007; Read and Stacey 2009). None of them have gained popular acceptance nor are they commonly used.
As open-pit mining projects are becoming bigger and deeper, more efficient collaboration is essential between geotechnical and mine design engineers during the slope creation process. Efficiency can be improved when both groups effectively share all available information and analysis results. One convenient way to improve efficiency is by using a unique database and compatible
software tools. Some efforts have been made to integrate geomechanical design into commercially available mine-design tools, such as the Stereonet Viewer and Terrain modules within Datamine (CAE 2010) and the Geotechnical Tools module within Vulcan (Maptek 2010). However, these modules, while useful, are not commonly used and cannot perform complex stability analysis: in the best-case scenario, they are limited to kinematic analyses.
Fig. 1. Open pit slopes terminology (modified from Wyllie and Mah 2004).
Nelson et al. (2007) used a geographical information system (GIS)-based approach to analyse slope stability at Chuquicamata open-pit copper mine in Chile. They used three modelling techniques to assess slope stability: fuzzy-logic, in which parameters in each component layer were ranked by mine geotechnical experts according to their influence in promoting slope failure; and two data-driven techniques: weights-of-evidence and logistic regression, in which statistical correlation of training points (known failures) with parameters were used to derive a relative probability of failure. These approaches can be useful for a mining operation that has been in operation for several years and has experienced several instabilities. However, they are not suitable at the early stages of a mining project and do not provide information on FS as they are not relying on limit equilibrium methods.
The tools that are currently available cannot integrate mine topography, spatial information, and deterministic and probabilistic limit equilibrium analysis for the analysis of slope stability. More recently, Grenon and Hadjigeorgiou (2010) developed a probabilistic limit equilibrium code compatible with a database structure that can be found in commercially available mine design tools such as Gemcom Surpac (Gemcom 2010).
This paper builds on the work of Grenon and Hadjigeorgiou (2010) and focuses on incorporating acceptance criteria to the integrated analysis of inter-ramp and bench stability of mining open pits. This will improve the collaborative work between geotechnical and planning engineers and facilitate and promote the use of multi-criteria design. Mining slope design would thus arguably be facilitated and optimized.
The methodology proposed in this paper is outlined in Fig. 2. The integrated stability analysis relies on the use of a mine design software tool. The software tool is primarily used to create a
geotechnical model of the rock mass surrounding the planned pit area. A block modelling approach is used to store pertinent information: x, y, and z coordinates of the block; density; rock type; structural domain; etc. The other main use of the software tool is to provide a three-dimensional representation of the planned ultimate pit topography through a digital elevation model (DEM). The obtained DEM is the basis for slope orientation assessment. Various slope orientation assessment algorithms were implemented to assess slope at the bench and inter-ramp levels. Slope stability analysis can be performed based on the information gathered in the geotechnical database and the calculated slope orientations. Kinematic and limit equilibrium algorithms were programmed to assess slope stability at the bench and inter-ramp levels. The results of the analysis can be visualized on susceptibility maps, and critical zones can be identified. Whenever the geotechnical or geometrical information is updated based on new field data collection results, new analyses can be performed and stability reassessed. The proposed methodology will be presented through the Portage pit case study. 2 CASE STUDY: THE PORTAGE OPEN PIT
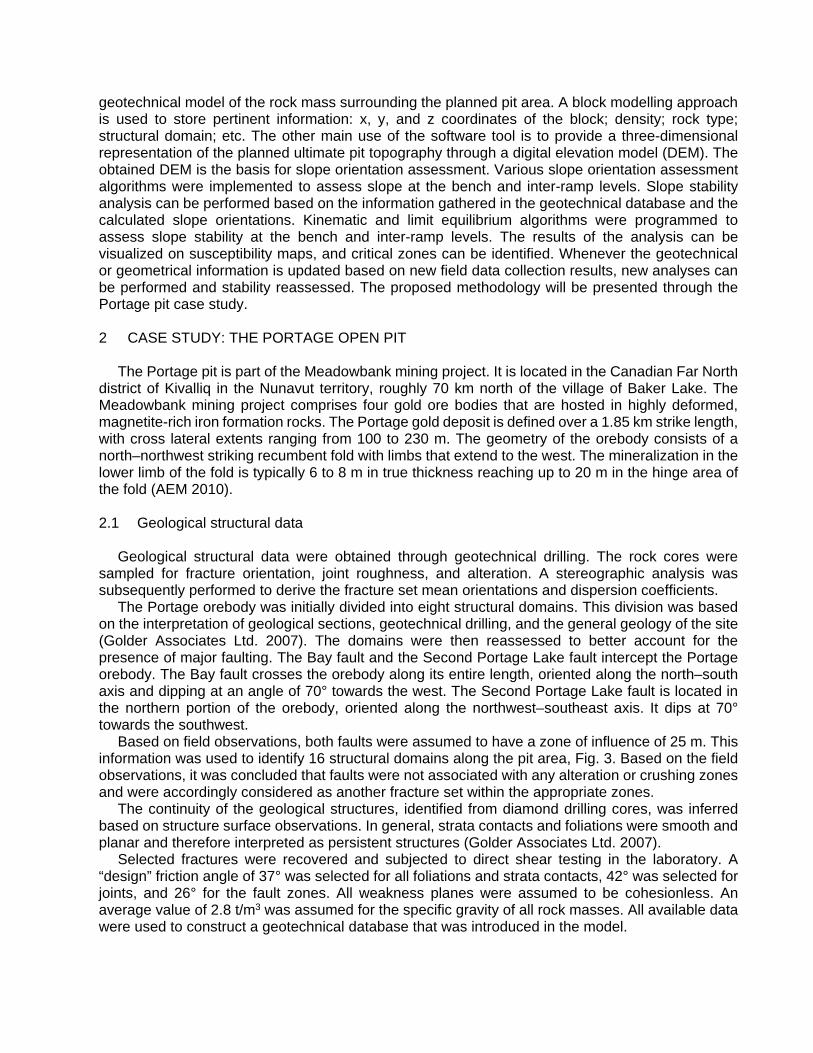
The Portage pit is part of the Meadowbank mining project. It is located in the Canadian Far North district of Kivalliq in the Nunavut territory, roughly 70 km north of the village of Baker Lake. The Meadowbank mining project comprises four gold ore bodies that are hosted in highly deformed, magnetite-rich iron formation rocks. The Portage gold deposit is defined over a 1.85 km strike length, with cross lateral extents ranging from 100 to 230 m. The geometry of the orebody consists of a north–northwest striking recumbent fold with limbs that extend to the west. The mineralization in the lower limb of the fold is typically 6 to 8 m in true thickness reaching up to 20 m in the hinge area of the fold (AEM 2010).
2.1 Geological structural data
Geological structural data were obtained through geotechnical drilling. The rock cores were sampled for fracture orientation, joint roughness, and alteration. A stereographic analysis was subsequently performed to derive the fracture set mean orientations and dispersion coefficients.
The Portage orebody was initially divided into eight structural domains. This division was based on the interpretation of geological sections, geotechnical drilling, and the general geology of the site (Golder Associates Ltd. 2007). The domains were then reassessed to better account for the presence of major faulting. The Bay fault and the Second Portage Lake fault intercept the Portage orebody. The Bay fault crosses the orebody along its entire length, oriented along the north–south axis and dipping at an angle of 70° towards the west. The Second Portage Lake fault is located in the northern portion of the orebody, oriented along the northwest–southeast axis. It dips at 70° towards the southwest.
Based on field observations, both faults were assumed to have a zone of influence of 25 m. This information was used to identify 16 structural domains along the pit area, Fig. 3. Based on the field observations, it was concluded that faults were not associated with any alteration or crushing zones and were accordingly considered as another fracture set within the appropriate zones.
The continuity of the geological structures, identified from diamond drilling cores, was inferred based on structure surface observations. In general, strata contacts and foliations were smooth and planar and therefore interpreted as persistent structures (Golder Associates Ltd. 2007).
Selected fractures were recovered and subjected to direct shear testing in the laboratory. A “design” friction angle of 37° was selected for all foliations and strata contacts, 42° was selected for joints, and 26° for the fault zones. All weakness planes were assumed to be cohesionless. An average value of 2.8 t/m3 was assumed for the specific gravity of all rock masses. All available data were used to construct a geotechnical database that was introduced in the model.

Fig. 2. General methodology for integrated slope stability analysis.
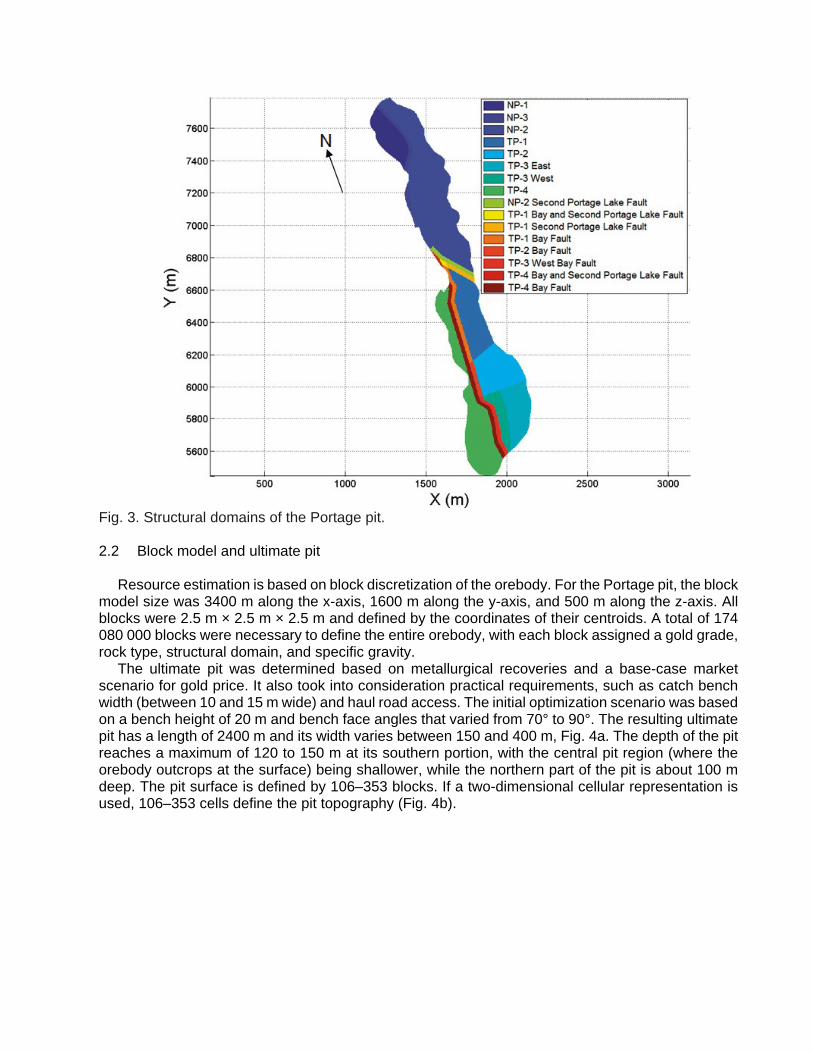
Fig. 3. Structural domains of the Portage pit. 2.2 Block model and ultimate pit
Resource estimation is based on block discretization of the orebody. For the Portage pit, the block model size was 3400 m along the x-axis, 1600 m along the y-axis, and 500 m along the z-axis. All blocks were 2.5 m × 2.5 m × 2.5 m and defined by the coordinates of their centroids. A total of 174 080 000 blocks were necessary to define the entire orebody, with each block assigned a gold grade, rock type, structural domain, and specific gravity.
The ultimate pit was determined based on metallurgical recoveries and a base-case market scenario for gold price. It also took into consideration practical requirements, such as catch bench width (between 10 and 15 m wide) and haul road access. The initial optimization scenario was based on a bench height of 20 m and bench face angles that varied from 70° to 90°. The resulting ultimate pit has a length of 2400 m and its width varies between 150 and 400 m, Fig. 4a. The depth of the pit reaches a maximum of 120 to 150 m at its southern portion, with the central pit region (where the orebody outcrops at the surface) being shallower, while the northern part of the pit is about 100 m deep. The pit surface is defined by 106–353 blocks. If a two-dimensional cellular representation is used, 106–353 cells define the pit topography (Fig. 4b).
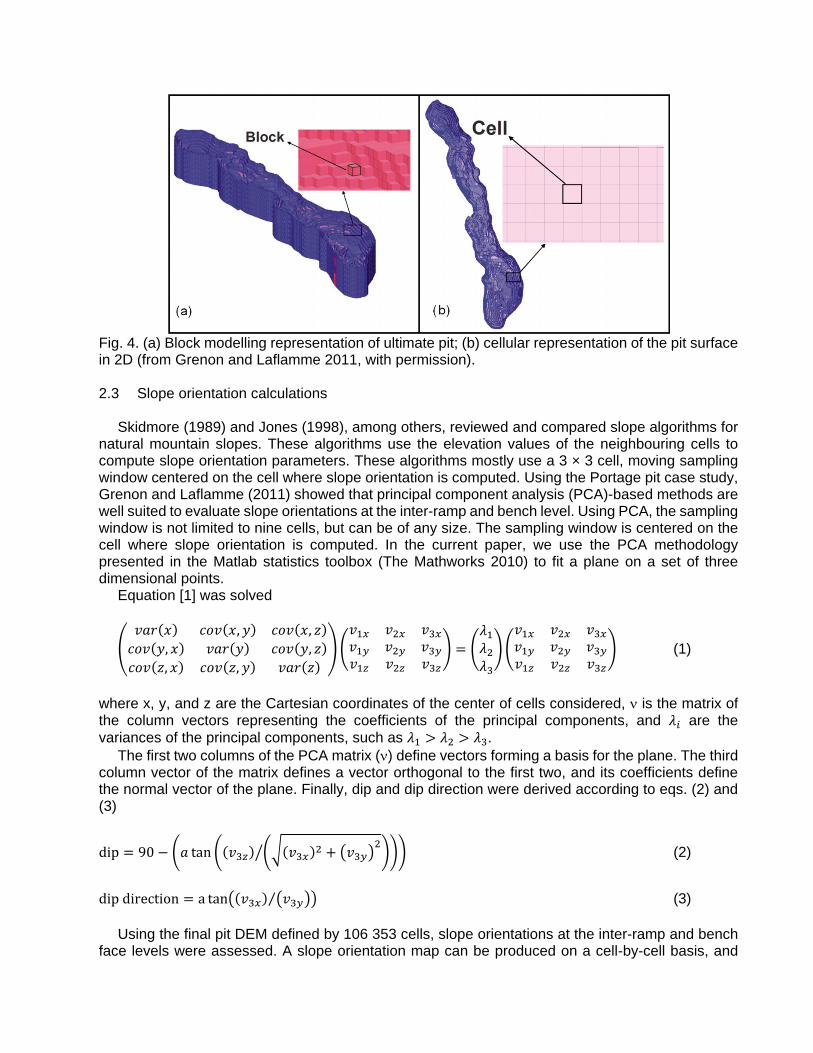
Fig. 4. (a) Block modelling representation of ultimate pit; (b) cellular representation of the pit surface in 2D (from Grenon and Laflamme 2011, with permission). 2.3 Slope orientation calculations
Skidmore (1989) and Jones (1998), among others, reviewed and compared slope algorithms for natural mountain slopes. These algorithms use the elevation values of the neighbouring cells to compute slope orientation parameters. These algorithms mostly use a 3 × 3 cell, moving sampling window centered on the cell where slope orientation is computed. Using the Portage pit case study, Grenon and Laflamme (2011) showed that principal component analysis (PCA)-based methods are well suited to evaluate slope orientations at the inter-ramp and bench level. Using PCA, the sampling window is not limited to nine cells, but can be of any size. The sampling window is centered on the cell where slope orientation is computed. In the current paper, we use the PCA methodology presented in the Matlab statistics toolbox (The Mathworks 2010) to fit a plane on a set of three dimensional points.
Equation [1] was solved
�𝑣𝑣𝑣𝑣𝑣𝑣(𝑥𝑥) 𝑐𝑐𝑐𝑐𝑣𝑣(𝑥𝑥,𝑦𝑦) 𝑐𝑐𝑐𝑐𝑣𝑣(𝑥𝑥, 𝑧𝑧)𝑐𝑐𝑐𝑐𝑣𝑣(𝑦𝑦, 𝑥𝑥) 𝑣𝑣𝑣𝑣𝑣𝑣(𝑦𝑦) 𝑐𝑐𝑐𝑐𝑣𝑣(𝑦𝑦, 𝑧𝑧)𝑐𝑐𝑐𝑐𝑣𝑣(𝑧𝑧, 𝑥𝑥) 𝑐𝑐𝑐𝑐𝑣𝑣(𝑧𝑧,𝑦𝑦) 𝑣𝑣𝑣𝑣𝑣𝑣(𝑧𝑧)
��𝑣𝑣1𝑥𝑥 𝑣𝑣2𝑥𝑥 𝑣𝑣3𝑥𝑥𝑣𝑣1𝑦𝑦 𝑣𝑣2𝑦𝑦 𝑣𝑣3𝑦𝑦𝑣𝑣1𝑧𝑧 𝑣𝑣2𝑧𝑧 𝑣𝑣3𝑧𝑧
� = �𝜆𝜆1𝜆𝜆2𝜆𝜆3��
𝑣𝑣1𝑥𝑥 𝑣𝑣2𝑥𝑥 𝑣𝑣3𝑥𝑥𝑣𝑣1𝑦𝑦 𝑣𝑣2𝑦𝑦 𝑣𝑣3𝑦𝑦𝑣𝑣1𝑧𝑧 𝑣𝑣2𝑧𝑧 𝑣𝑣3𝑧𝑧
� (1)
where x, y, and z are the Cartesian coordinates of the center of cells considered, ν is the matrix of the column vectors representing the coefficients of the principal components, and 𝜆𝜆𝑖𝑖 are the variances of the principal components, such as 𝜆𝜆1 > 𝜆𝜆2 > 𝜆𝜆3.
The first two columns of the PCA matrix (ν) define vectors forming a basis for the plane. The third column vector of the matrix defines a vector orthogonal to the first two, and its coefficients define the normal vector of the plane. Finally, dip and dip direction were derived according to eqs. (2) and (3)
dip = 90 − �𝑣𝑣 tan �(𝑣𝑣3𝑧𝑧) ��(𝑣𝑣3𝑥𝑥)2 + �𝑣𝑣3𝑦𝑦�2�� �� (2)
dip direction = a tan�(𝑣𝑣3𝑥𝑥) �𝑣𝑣3𝑦𝑦�⁄ � (3)
Using the final pit DEM defined by 106 353 cells, slope orientations at the inter-ramp and bench face levels were assessed. A slope orientation map can be produced on a cell-by-cell basis, and
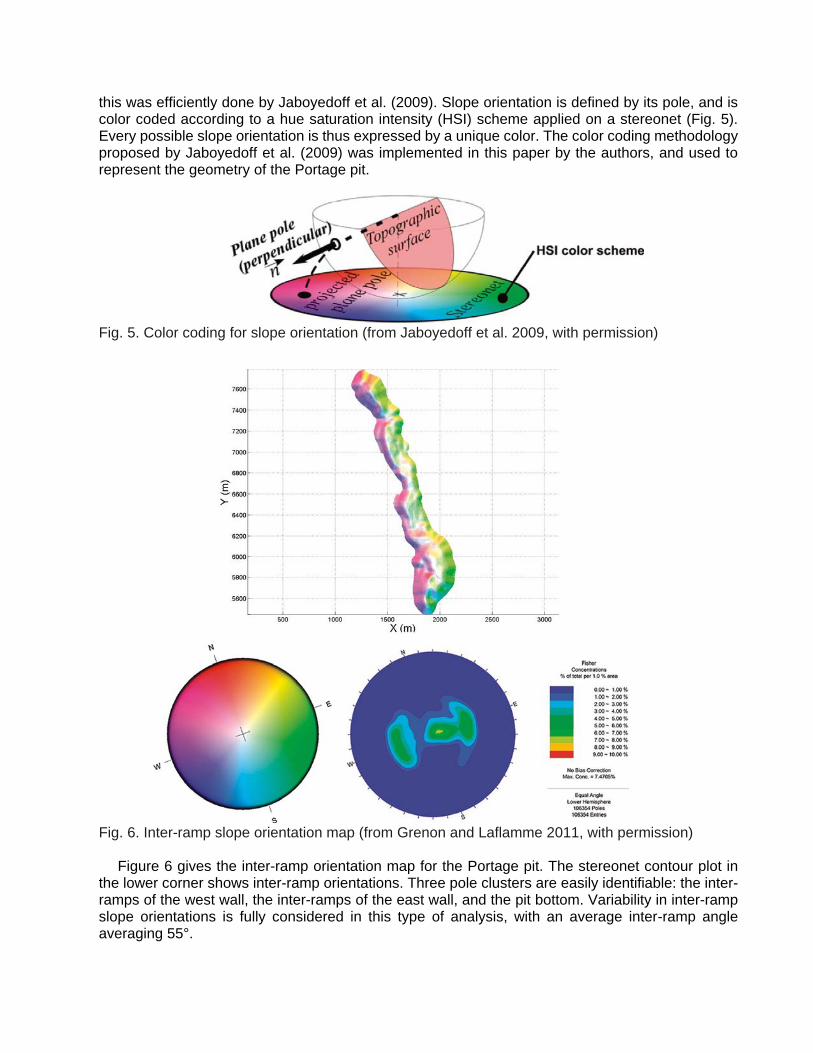
this was efficiently done by Jaboyedoff et al. (2009). Slope orientation is defined by its pole, and is color coded according to a hue saturation intensity (HSI) scheme applied on a stereonet (Fig. 5). Every possible slope orientation is thus expressed by a unique color. The color coding methodology proposed by Jaboyedoff et al. (2009) was implemented in this paper by the authors, and used to represent the geometry of the Portage pit.
Fig. 5. Color coding for slope orientation (from Jaboyedoff et al. 2009, with permission)
Fig. 6. Inter-ramp slope orientation map (from Grenon and Laflamme 2011, with permission) Figure 6 gives the inter-ramp orientation map for the Portage pit. The stereonet contour plot in
the lower corner shows inter-ramp orientations. Three pole clusters are easily identifiable: the inter-ramps of the west wall, the inter-ramps of the east wall, and the pit bottom. Variability in inter-ramp slope orientations is fully considered in this type of analysis, with an average inter-ramp angle averaging 55°.
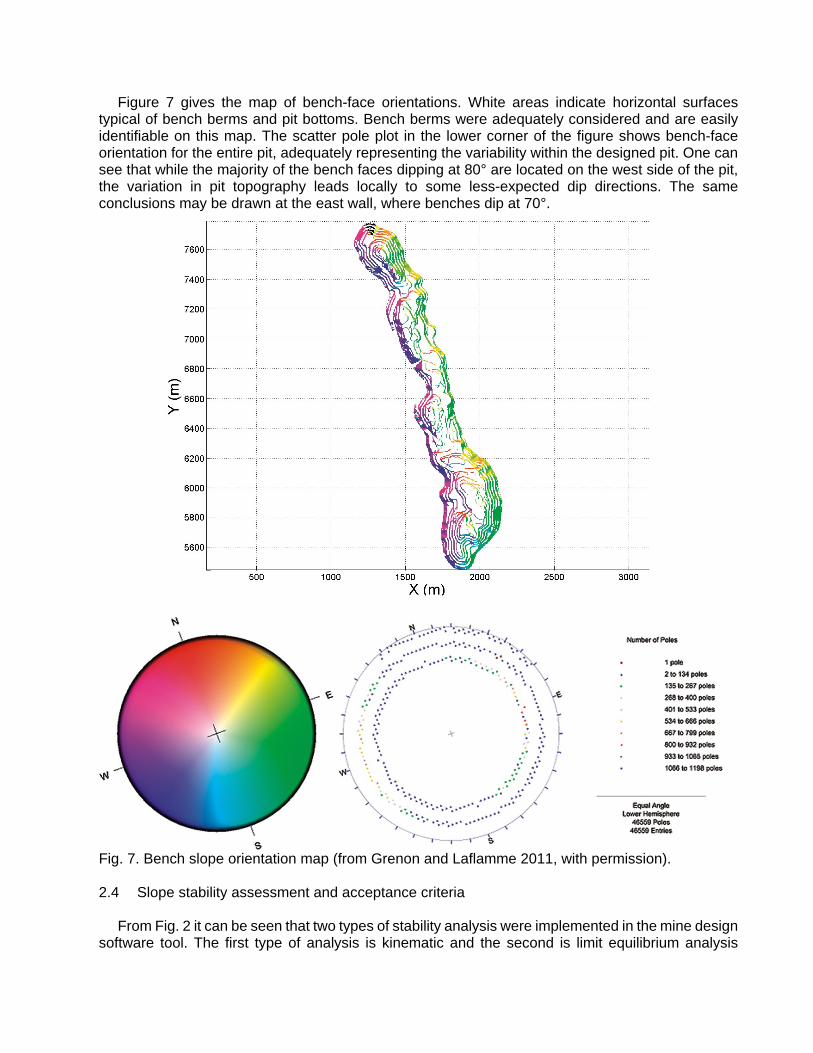
Figure 7 gives the map of bench-face orientations. White areas indicate horizontal surfaces typical of bench berms and pit bottoms. Bench berms were adequately considered and are easily identifiable on this map. The scatter pole plot in the lower corner of the figure shows bench-face orientation for the entire pit, adequately representing the variability within the designed pit. One can see that while the majority of the bench faces dipping at 80° are located on the west side of the pit, the variation in pit topography leads locally to some less-expected dip directions. The same conclusions may be drawn at the east wall, where benches dip at 70°.
Fig. 7. Bench slope orientation map (from Grenon and Laflamme 2011, with permission). 2.4 Slope stability assessment and acceptance criteria
From Fig. 2 it can be seen that two types of stability analysis were implemented in the mine design software tool. The first type of analysis is kinematic and the second is limit equilibrium analysis
(LEA). Based on a preliminary analysis, it was assessed that planar and wedge type instabilities were most problematic for the Portage pit. Accordingly, planar and wedge instabilities were investigated using LEA at both inter-ramp and bench levels.
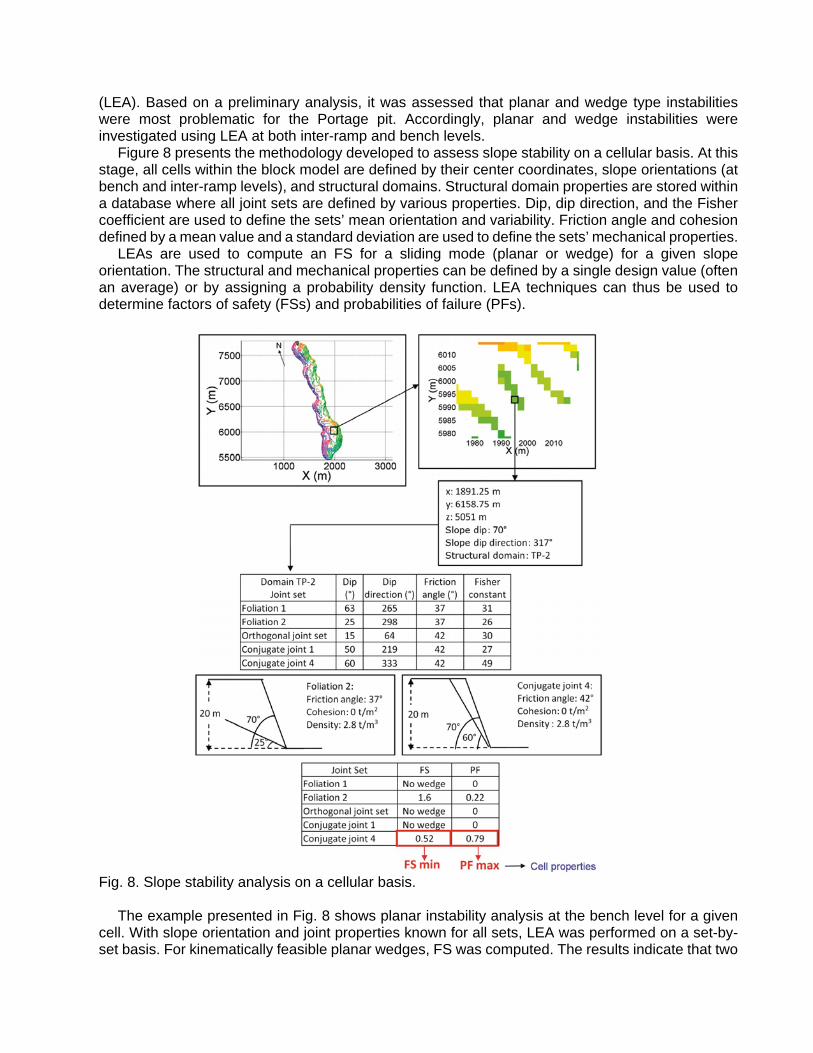
Figure 8 presents the methodology developed to assess slope stability on a cellular basis. At this stage, all cells within the block model are defined by their center coordinates, slope orientations (at bench and inter-ramp levels), and structural domains. Structural domain properties are stored within a database where all joint sets are defined by various properties. Dip, dip direction, and the Fisher coefficient are used to define the sets’ mean orientation and variability. Friction angle and cohesion defined by a mean value and a standard deviation are used to define the sets’ mechanical properties.
LEAs are used to compute an FS for a sliding mode (planar or wedge) for a given slope orientation. The structural and mechanical properties can be defined by a single design value (often an average) or by assigning a probability density function. LEA techniques can thus be used to determine factors of safety (FSs) and probabilities of failure (PFs).
Fig. 8. Slope stability analysis on a cellular basis.
The example presented in Fig. 8 shows planar instability analysis at the bench level for a given cell. With slope orientation and joint properties known for all sets, LEA was performed on a set-by-set basis. For kinematically feasible planar wedges, FS was computed. The results indicate that two

sets form a potential planar instability at that slope level: foliation 2 is characterized by an FS of 1.6, while conjugate joint 4 is characterized by an FS of 0.52. Finally, the cell can be defined by its minimum FS for planar mode, which is 0.52 in this case. Within the database, fracture orientation and friction angle values are characterized by some variability around their mean values. Accordingly, a probability density function can be used to define these joint characteristics. A Monte Carlo sampling approach was used to evaluate the PF. The computed PF is 0.22 for foliation 2 and 0.79 for conjugate joint 4. The maximum PF attributed to this cell is thus 0.79.
The procedure is repeated for the 106 353 cells on the pit surface. For every cell, the minimum FS and maximum PF are computed for planar instability. The procedure is repeated for tetrahedral wedge–type instabilities. The analysis can be performed at bench and inter-ramp levels. 2.4.1 Inter-ramp stability
For planar instabilities at the inter-ramp level, FS and PF were computed on a cell-by-cell basis
for all of the 106 353 cells of the pit surface. The slope angles presented in Fig. 6 were used. The structural properties of foliation, contacts and faults were used as well. Based on the field investigation, it was decided that the joints were not continuous enough to impact the stability at the inter-ramp level. Slope height was set to 60 m. The results are presented in Figs. 9a and 9b. Figure 9a shows the minimum FS for all cells. The FS map was obtained using the mean values for fracture orientations and friction angles. Gray regions on Fig. 9a indicate that planar sliding was not kinematically possible for those cells. Most, if not all, regions of the pit are defined by a minimum FS greater than 1. These results suggest that the designed inter-ramps slopes are stable. The Fig. 9b map shows the PF for planar sliding at the inter-ramp level. Again the PFs are very low, ranging between 0 and 0.3. Figures 9c and 9d show the results for wedge stability analysis at the inter-ramp level. The FS map in Fig. 9c indicates that the FSs are greater than 1 for the entire pit. Figure 9d indicates that the PFs are very low for that mode of failure as well. Looking at the global results of Fig. 9, it could be arguably stated that the designed inter-ramp slopes present a very low potential of instability.
It is increasingly popular to use FS and PF values to determine whether a particular mine slope design is acceptable. Recently, Read and Stacey (2009) suggested a series of typical acceptance criteria values for various slope scales, Table 1. Additionally, these authors described the acceptance criteria based on the consequence of failure. For example, where the consequence of failure of an inter-ramp slope is moderate, the minimum FS should be 1.2 and the maximum PF should be 20%. Table 1. Typical FS and PF acceptance criteria values from Read and Stacey (2009).
*Needs to meet all acceptance criteria.
The cellular or raster approach proposed in the paper to visualize the stability results is particularly well suited for combining various design criteria to produce a map where cells not meeting the acceptance criteria would be easily identifiable. These types of approaches are

commonly used in GIS software tools to evaluate the instability potential of mountainous areas (Jaboyedoff et al. 2009). In this paper, the approach was implemented based on the criteria proposed by Read and Stacey (2009). Figures 10a, 10b, and 10c present susceptibility maps for different criteria. Figures 10a and 10b suggest that in slopes with low to moderate consequences of failure, basically no cells are potentially unstable. For a high consequence of failure (Fig. 10c), a limited region on the east wall of the southeast portion of the pit suggests potential instabilities for planar failure. Table 2 provides a more detailed look at the information given by the map in Fig. 10c. Very few cells do not respect the FS-based criteria. The very limiting PF criterion is not respected by 1879 cells in structural domain TP-2. This represents 18% of this structural domain’s surface and 2% of the total pit area. The main infrastructure within the pit is the ramp, and it is located on the west wall; therefore, the high-consequences criteria should not be applied to the east wall, and the designed inter-ramps are thus arguably adequate.
Figures 10d, 10e, and 10f give the maps for the three previously defined acceptance criteria at the inter-ramp level. Only this time, wedge failure mechanism was investigated. Looking at the three maps, one can arguably conclude that wedge failure is not an issue for inter-ramps at the Portage pit. This approach demonstrates the ease of use, the efficiency in comparing various options, and the advantage of spatially locating the potential zones of concern within the pit.
Fig. 9. Slope stability at the inter-ramp level: (a) FS map for planar instability, (b) PF map for planar instability, (c) FS map for wedge instability, and (d) PF map for wedge instability.

Fig. 10. Acceptability criteria at the inter-ramp level (cells in red (medium gray in grayscale) do not meet the acceptability criterion): (a) FS <1.2 and (or) PF > 25% map for planar instability; (b) FS < 1.2 and (or) PF > 20% map for planar instability; (c) FS < 1.3 and (or) PF > 10% map for planar instability; (d) FS < 1.2 and (or) PF > 25% map for wedge instability; (e) FS < 1.2 and (or) PF > 20% map for wedge instability; (f) FS < 1.3 and (or) PF > 10% map for wedge instability. Table 2. Acceptability criteria analysis results at the inter-ramp level for planar instability.

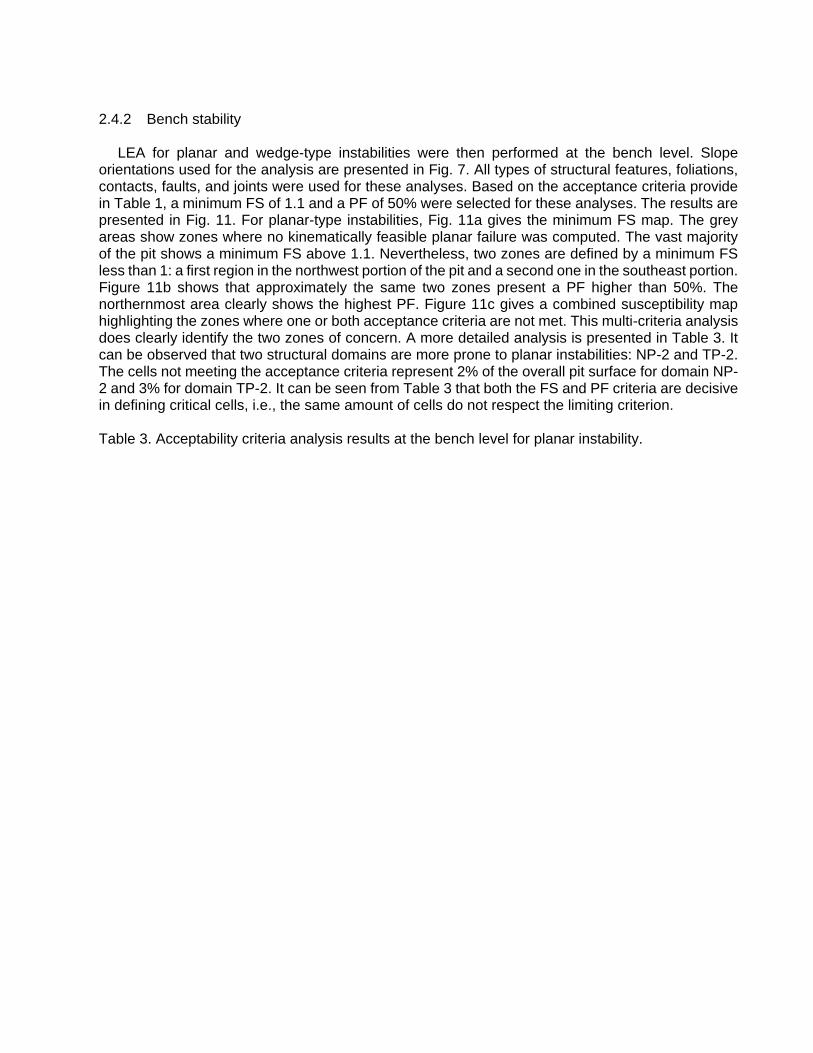
2.4.2 Bench stability
LEA for planar and wedge-type instabilities were then performed at the bench level. Slope
orientations used for the analysis are presented in Fig. 7. All types of structural features, foliations, contacts, faults, and joints were used for these analyses. Based on the acceptance criteria provide in Table 1, a minimum FS of 1.1 and a PF of 50% were selected for these analyses. The results are presented in Fig. 11. For planar-type instabilities, Fig. 11a gives the minimum FS map. The grey areas show zones where no kinematically feasible planar failure was computed. The vast majority of the pit shows a minimum FS above 1.1. Nevertheless, two zones are defined by a minimum FS less than 1: a first region in the northwest portion of the pit and a second one in the southeast portion. Figure 11b shows that approximately the same two zones present a PF higher than 50%. The northernmost area clearly shows the highest PF. Figure 11c gives a combined susceptibility map highlighting the zones where one or both acceptance criteria are not met. This multi-criteria analysis does clearly identify the two zones of concern. A more detailed analysis is presented in Table 3. It can be observed that two structural domains are more prone to planar instabilities: NP-2 and TP-2. The cells not meeting the acceptance criteria represent 2% of the overall pit surface for domain NP-2 and 3% for domain TP-2. It can be seen from Table 3 that both the FS and PF criteria are decisive in defining critical cells, i.e., the same amount of cells do not respect the limiting criterion. Table 3. Acceptability criteria analysis results at the bench level for planar instability.
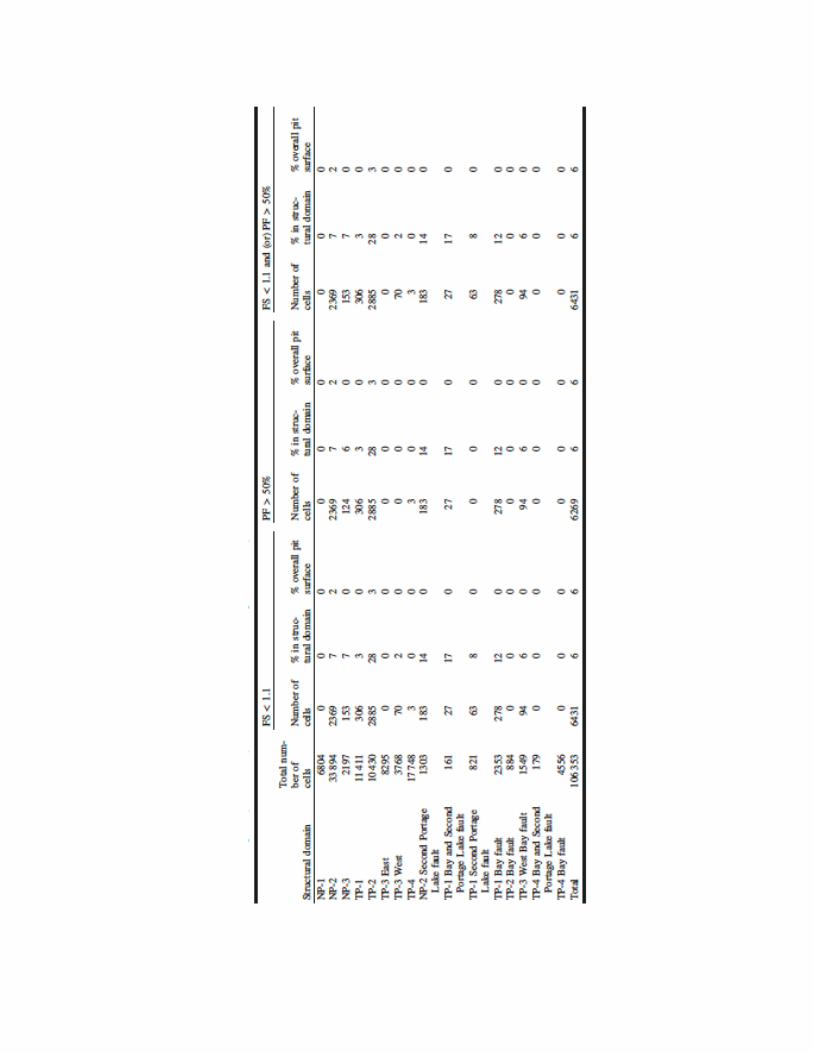
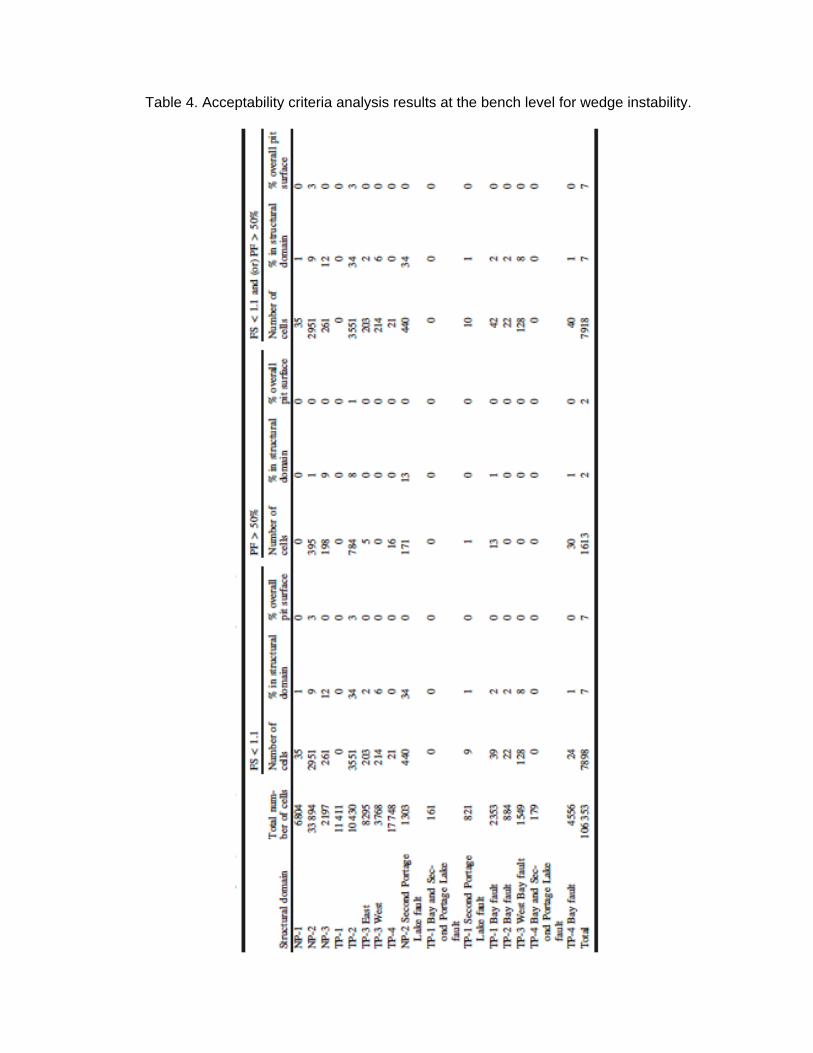
Table 4. Acceptability criteria analysis results at the bench level for wedge instability.
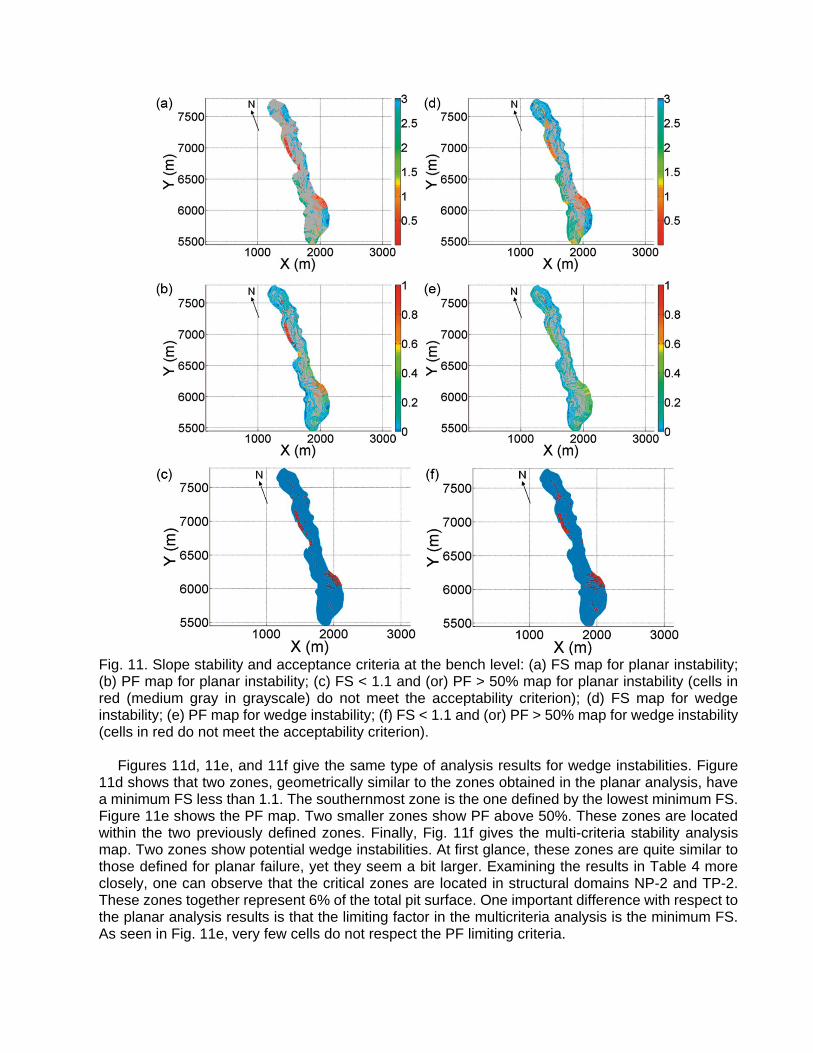
Fig. 11. Slope stability and acceptance criteria at the bench level: (a) FS map for planar instability; (b) PF map for planar instability; (c) FS < 1.1 and (or) PF > 50% map for planar instability (cells in red (medium gray in grayscale) do not meet the acceptability criterion); (d) FS map for wedge instability; (e) PF map for wedge instability; (f) FS < 1.1 and (or) PF > 50% map for wedge instability (cells in red do not meet the acceptability criterion).
Figures 11d, 11e, and 11f give the same type of analysis results for wedge instabilities. Figure
11d shows that two zones, geometrically similar to the zones obtained in the planar analysis, have a minimum FS less than 1.1. The southernmost zone is the one defined by the lowest minimum FS. Figure 11e shows the PF map. Two smaller zones show PF above 50%. These zones are located within the two previously defined zones. Finally, Fig. 11f gives the multi-criteria stability analysis map. Two zones show potential wedge instabilities. At first glance, these zones are quite similar to those defined for planar failure, yet they seem a bit larger. Examining the results in Table 4 more closely, one can observe that the critical zones are located in structural domains NP-2 and TP-2. These zones together represent 6% of the total pit surface. One important difference with respect to the planar analysis results is that the limiting factor in the multicriteria analysis is the minimum FS. As seen in Fig. 11e, very few cells do not respect the PF limiting criteria.

To summarize the results of the bench stability analysis, one can state that the design is adequate in 14 of the 16 structural domains. The two remaining structural domains, NP-2 and TP-2, indicate that some concerns exist regarding both planar and wedge-type instabilities. A total of 6% of the pit surface does not meet the acceptance criteria. These regions are located at the pit’s outer limits. It can therefore be argued that the actual design seems adequate at bench level, but during the first stages of mining more structural information should be gathered on the continuity of the controlling structures, and the magnitude of back break at the bench crest should be examined carefully to ensure that the final bench configuration is satisfactory. CONCLUSIONS
Using the Portage pit as a case study, this paper presented a methodology to assess structural
slope stability at the inter-ramp and bench levels. This integrated approach enables better collaborative work between planning and geotechnical engineers, which is of heightened importance as pits are being made larger and deeper. Mining slope design is thus arguably facilitated and optimized. Robust algorithms have been implemented to compute slope orientation and slope stability at inter-ramp and bench levels. Multi-criteria analyses were performed based on criteria proposed by Read and Stacey (2009). Susceptibility maps were produced enabling the identification of zones of concern in the design pits. The obtained results suggest that inter-ramp angles do not present instability concerns. At bench levels, limited potential instability zones were identified within two structural domains totaling 6% of the pit surface. In the early mining stages, more structural information should be gathered to establish fracture persistence in these structural domains, and back breaks should be measured to ensure that sufficient berm width exists to contain potential rock falls.
ACKNOWLEDGEMENTS
The authors would like to acknowledge the financial support of the Natural Sciences and Engineering Research Council of Canada. The authors are also grateful to Pierre Matte, Daniel Leblanc, and Julie Bélanger of Agnico Eagle Mines for providing the data and constructive comments.
REFERENCES
AEM. 2010. Agnico-Eagle Mines Limited, Toronto [online]. Available from www.agnico-eagle.com/English/Our-Business/Operating-Mines/Meadowbank/default.aspx [accessed 20 October 2010.] CAE. 2010. Datamine Studio. Version 3 [computer program]. CAE Inc., Montréal, Que. Gemcom. 2010. Gemcom Surpac. Version 6.1 [computer program]. Gemcom Software International Inc., Vancouver, B.C. Golder Associates Ltd. 2007. Pit slope design criteria for the Portage and Goose Island deposits, Meadowbank project, Nunavut. Golder Associates Ltd., Burnaby, B.C. Technical report, April 2007. Grenon, M., and Hadjigeorgiou, J. 2010. Integrated structural stability analysis for preliminary open pit design. International Journal of Rock Mechanics and Mining Sciences, 47(3): 450–460. doi:10. 1016/j.ijrmms.2009.11.001.
Grenon, M., and Laflamme, A.-J. 2011. Slope orientation assessment for open-pit mines, using GIS-based algorithms. Computers & Geosciences, 37(9): 1413–1424. doi:10.1016/j.cageo.2010.12.006. Hoek, E. 2007. Practical rock engineering [online.] Rocscience Inc., Toronto. Available from www.rocscience.com/hoek/corner/Practical_Rock_Engineering.pdf [accessed 20 October 2010]. Jaboyedoff, M., Couture, R., and Locat, P. 2009. Structural analysis of Turtle Mountain (Alberta) using digital elevation model: toward a progressive failure. Geomorphology, 103(1): 5–16. doi:10.1016/ j.geomorph.2008.04.012. Jones, K.H. 1998. A comparison of algorithms used to compute hill slope as a property of the DEM. Computers & Geosciences, 24(4): 315–323. doi:10.1016/S0098-3004(98)00032-6. Maptek. 2010. Vulcan. Version 8.1.1 [computer program]. Maptek Pty Ltd., Adelaide, Australia. Nelson, E.P., Connors, K.A., and Suárez S., C. 2007. GIS-based slope stability analysis, Chuquicamata open pit copper mine, Chile. Natural Resources Research, 16(2): 171–190. doi:10.1007/s11053007-9044-7. Priest, S.D., and Brown, E.T. 1983. Probabilistic stability analysis of variable rock slopes. Transactions of the Institution of Mining and Metallurgy A, 92: A1–A2. Read, J., and Stacey, P. 2009. Guidelines for open pit slope design. 1st ed. CSIRO Publishing, Collingwood, Australia. Skidmore, A.K. 1989. A comparison of techniques for calculating gradient and aspect from a gridded digital elevation model. International Journal of Geographical Information Systems, 3(4): 323–334. doi:10.1080/02693798908941519. Swan, G., and Sepulveda, R. 2000. Slope stability at Collahuasi. In Slope stability in surface mining, Colorado. Edited by W.A. Hustrulid, M.K. McCarter, and D.J.A. Van Zyl. Society for Mining Metallurgy and Exploration (SME), Englewood, Colo. pp. 163– 170. The Mathworks. 2010. Matlab. Version R2010b [computer program]. The MathWorks Inc., Natick, Mass. Wyllie, D.C., and Mah, C.W. 2004. Rock slope engineering: civil and mining. 4th ed. Spon Press, New York.