Increased Toll-like Receptor-2 Expression on Nonclassic ...
9
Increased Toll-like Receptor-2 Expression on Nonclassic CD16 Monocytes from Patients with Inflammatory Stage of Eales’ Disease Aditi Sen, 1 Imran Hussain Chowdhury, 1 Debanjan Mukhopadhyay, 2 Suman Kalyan Paine, 1 Amrita Mukherjee, 1 Lakshmi Kanta Mondal, 3 Mitali Chatterjee, 2 and Basudev Bhattacharya 1 PURPOSE. To identify the distribution, differential Toll-like re- ceptor (TLR) expression, and functional contribution of mono- cyte subpopulations in the inflammatory stage of Eales’ disease (ED). METHODS. Peripheral blood mononuclear cells were isolated from nine patients during the inflammatory stage of ED and nine age- and sex-matched healthy controls. The expression of CD14, CD16, TLR-2, and TLR-4 on monocytes was measured by flow cytometry. The CD14 , CD16 , and CD16 monocyte populations were sorted on the basis of magnetic-activated cell-sorting methodology, and levels of cytokines were mea- sured by ELISA. RESULTS. In ED patients, the number of circulating monocytes was significantly expanded compared with that in controls (P 0.01), with a marked increase in the nonclassic CD16 subset, which showed an activated phenotype in patients that correlated with levels of serum proinflammatory cyto- kines and clinical progression. A higher expression of cell surface TLR-2 (P 0.02), but not TLR-4, was found in monocytes of patients with ED. Furthermore, TLR-2 was expressed at higher levels on CD16 monocytes than on CD16 monocytes in patients, whereas no significant varia- tion was found in TLR-4 expression on different monocyte subsets. Peptidoglycan-induced TNF- expression correlated with TLR-2 expression in monocytes isolated from controls (r 0.85, P 0.0061), but not in monocytes isolated from ED patients (r 0.553, P 0.1328). CONCLUSIONS. These results indicate that in the pathogenesis of ED, TLR activation and increased numbers of nonclassic CD16 monocytes are crucial regulators, along with the secre- tion of proinflammatory cytokines that perpetuate the inflam- matory process in the retina. (Invest Ophthalmol Vis Sci. 2011; 52:6940 – 6948) DOI:10.1167/iovs.11-7834 E ales’ disease (ED) is a prototype inflammatory disorder in which immunogenic inflammation of the peripheral retina leads to nonperfusion and neovascularization. At the prolifer- ative or advanced stage of the disease, newly formed retinal vessels are prone to develop vitreous hemorrhages resulting in profound visual loss. 1,2 Although the clinical characteristics of the disease are well recognized, its etiopathogenesis is so far not well defined. However, several lines of experimental evi- dence link ED with Gram-positive bacteria, Mycobacterium tuberculosis, and other nontuberculosis mycobacteria. 3–6 Two studies have demonstrated a statistically significant higher phe- notype frequency of human leukocyte antigen (HLA) in ED patients than in healthy controls 7 and have identified the pres- ence of inflammatory cells in the epiretinal membrane of pa- tients with ED (Badrinath SS, et al. IOVS 1990;31:ARVO Ab- stract 33). Thus, it can be hypothesized that individuals with a predisposition to HLA, predominantly HLAB5 (B51), DR1, and DR4, may develop retinal vasculitis as a consequence of cell- mediated immunologic tissue damage triggered by a seques- tered mycobacterial antigen in an inactive form that clinically presents as ED. 8 Even though most patients with ED lack clinical evidence of infection, laboratory and clinical findings suggest the presence of systemic inflammation in the acute phase of this disease. 9,10 Therefore, it is probable that both innate and adaptive immune systems are involved in the development of ocular inflamma- tion. The ability of the innate immune system to recognize microbial component–associated molecular patterns have highlighted the central role played by one group of pattern recognitions receptors (PRRs), the Toll-like receptors (TLRs), in microbial recognition and host defense. 11 Members of the TLR family are expressed in a variety of cells of the innate immune system 12 and orchestrate the intracellular inflamma- tory signaling pathways after recognition of pathogen-associ- ated molecular patterns (PAMPs), such as bacterial cell wall components, dsRNA, and bacterial DNA bacterial flagellin. 13 Although TLR expression is primarily associated with mono- cytes/macrophages and dendritic cells, other cells of the adap- tive immune system and nonimmune cells have also been shown to express TLRs. 14 In fact, TLRs are capable of forming an important bridge between the innate and adaptive immune response by regulating expression of costimulatory molecules on antigen-presenting cells, to drive T-cell activation, and by creating a cytokine milieu, to conduct differentiation of T-cells into the desired subset. 15 Irrespective of any past effort to identify TLR involvement in pathogenesis of ED, mycobacterial involvement in the patho- genesis of the same is well studied. TLR-2 is a highly relevant TLR in the Mycobacterium-associated pathogenic outcome and responds to various lipoproteins and cell wall compo- From the Departments of 1 Biochemistry and 2 Pharmacology, Dr. B. C. Roy Post Graduate Institute of Basic Medical Education and Research (IPGME&R), Kolkata, India; and the 3 Regional Institute of Ophthalmology, Kolkata, India. Supported by the Indian Council of Medical Research (ICMR), Government of India. Submitted for publication May 6, 2011; revised July 8, 2011; accepted July 10, 2011. Disclosure: A. Sen, None; I.H. Chowdhury, None; D. Mukhopadhyay, None; S.K. Paine, None; A. Mukherjee, None; L.K. Mondal, None; M. Chatterjee, None; B. Bhattacharya, None Corresponding author: Basudev Bhattacharya, Department of Bio- chemistry, Dr. B.C. Roy Post Graduate Institute of Basic Medical Edu- cation and Research (IPGME&R), 244B, A.J.C Bose Road, Kolkata 700020, India; [email protected]. Immunology and Microbiology Investigative Ophthalmology & Visual Science, August 2011, Vol. 52, No. 9 6940 Copyright 2011 The Association for Research in Vision and Ophthalmology, Inc. Downloaded From: http://iovs.arvojournals.org/pdfaccess.ashx?url=/data/journals/iovs/933460/ on 08/22/2017
Transcript of Increased Toll-like Receptor-2 Expression on Nonclassic ...
Increased Toll-like Receptor-2 Expression on NonclassicCD16� Monocytes from Patients with InflammatoryStage of Eales’ Disease
Aditi Sen,1 Imran Hussain Chowdhury,1 Debanjan Mukhopadhyay,2
Suman Kalyan Paine,1 Amrita Mukherjee,1 Lakshmi Kanta Mondal,3 Mitali Chatterjee,2
and Basudev Bhattacharya1
PURPOSE. To identify the distribution, differential Toll-like re-ceptor (TLR) expression, and functional contribution of mono-cyte subpopulations in the inflammatory stage of Eales’ disease(ED).
METHODS. Peripheral blood mononuclear cells were isolatedfrom nine patients during the inflammatory stage of ED andnine age- and sex-matched healthy controls. The expression ofCD14, CD16, TLR-2, and TLR-4 on monocytes was measured byflow cytometry. The CD14�, CD16�, and CD16� monocytepopulations were sorted on the basis of magnetic-activatedcell-sorting methodology, and levels of cytokines were mea-sured by ELISA.
RESULTS. In ED patients, the number of circulating monocyteswas significantly expanded compared with that in controls(P � 0.01), with a marked increase in the nonclassic CD16�
subset, which showed an activated phenotype in patientsthat correlated with levels of serum proinflammatory cyto-kines and clinical progression. A higher expression of cellsurface TLR-2 (P � 0.02), but not TLR-4, was found inmonocytes of patients with ED. Furthermore, TLR-2 wasexpressed at higher levels on CD16� monocytes than onCD16� monocytes in patients, whereas no significant varia-tion was found in TLR-4 expression on different monocytesubsets. Peptidoglycan-induced TNF-� expression correlatedwith TLR-2 expression in monocytes isolated from controls(r � 0.85, P � 0.0061), but not in monocytes isolated fromED patients (r � 0.553, P � 0.1328).
CONCLUSIONS. These results indicate that in the pathogenesis ofED, TLR activation and increased numbers of nonclassicCD16� monocytes are crucial regulators, along with the secre-tion of proinflammatory cytokines that perpetuate the inflam-matory process in the retina. (Invest Ophthalmol Vis Sci. 2011;52:6940–6948) DOI:10.1167/iovs.11-7834
Eales’ disease (ED) is a prototype inflammatory disorder inwhich immunogenic inflammation of the peripheral retina
leads to nonperfusion and neovascularization. At the prolifer-ative or advanced stage of the disease, newly formed retinalvessels are prone to develop vitreous hemorrhages resulting inprofound visual loss.1,2 Although the clinical characteristics ofthe disease are well recognized, its etiopathogenesis is so farnot well defined. However, several lines of experimental evi-dence link ED with Gram-positive bacteria, Mycobacteriumtuberculosis, and other nontuberculosis mycobacteria.3–6 Twostudies have demonstrated a statistically significant higher phe-notype frequency of human leukocyte antigen (HLA) in EDpatients than in healthy controls7 and have identified the pres-ence of inflammatory cells in the epiretinal membrane of pa-tients with ED (Badrinath SS, et al. IOVS 1990;31:ARVO Ab-stract 33). Thus, it can be hypothesized that individuals with apredisposition to HLA, predominantly HLAB5 (B51), DR1, andDR4, may develop retinal vasculitis as a consequence of cell-mediated immunologic tissue damage triggered by a seques-tered mycobacterial antigen in an inactive form that clinicallypresents as ED.8
Even though most patients with ED lack clinical evidence ofinfection, laboratory and clinical findings suggest the presenceof systemic inflammation in the acute phase of this disease.9,10
Therefore, it is probable that both innate and adaptive immunesystems are involved in the development of ocular inflamma-tion. The ability of the innate immune system to recognizemicrobial component–associated molecular patterns havehighlighted the central role played by one group of patternrecognitions receptors (PRRs), the Toll-like receptors (TLRs),in microbial recognition and host defense.11 Members of theTLR family are expressed in a variety of cells of the innateimmune system12 and orchestrate the intracellular inflamma-tory signaling pathways after recognition of pathogen-associ-ated molecular patterns (PAMPs), such as bacterial cell wallcomponents, dsRNA, and bacterial DNA bacterial flagellin.13
Although TLR expression is primarily associated with mono-cytes/macrophages and dendritic cells, other cells of the adap-tive immune system and nonimmune cells have also beenshown to express TLRs.14 In fact, TLRs are capable of formingan important bridge between the innate and adaptive immuneresponse by regulating expression of costimulatory moleculeson antigen-presenting cells, to drive T-cell activation, and bycreating a cytokine milieu, to conduct differentiation of T-cellsinto the desired subset.15
Irrespective of any past effort to identify TLR involvementin pathogenesis of ED, mycobacterial involvement in the patho-genesis of the same is well studied. TLR-2 is a highly relevantTLR in the Mycobacterium-associated pathogenic outcomeand responds to various lipoproteins and cell wall compo-
From the Departments of 1Biochemistry and 2Pharmacology, Dr.B. C. Roy Post Graduate Institute of Basic Medical Education andResearch (IPGME&R), Kolkata, India; and the 3Regional Institute ofOphthalmology, Kolkata, India.
Supported by the Indian Council of Medical Research (ICMR),Government of India.
Submitted for publication May 6, 2011; revised July 8, 2011;accepted July 10, 2011.
Disclosure: A. Sen, None; I.H. Chowdhury, None; D.Mukhopadhyay, None; S.K. Paine, None; A. Mukherjee, None;L.K. Mondal, None; M. Chatterjee, None; B. Bhattacharya, None
Corresponding author: Basudev Bhattacharya, Department of Bio-chemistry, Dr. B.C. Roy Post Graduate Institute of Basic Medical Edu-cation and Research (IPGME&R), 244B, A.J.C Bose Road, Kolkata700020, India; [email protected].
Immunology and Microbiology
Investigative Ophthalmology & Visual Science, August 2011, Vol. 52, No. 96940 Copyright 2011 The Association for Research in Vision and Ophthalmology, Inc.
Downloaded From: http://iovs.arvojournals.org/pdfaccess.ashx?url=/data/journals/iovs/933460/ on 08/22/2017
nents, such as peptidoglycan (PGN),16–18 whereas an unde-fined heat-labile cell–associated mycobacterial factor has beenfound to be the ligand for TLR-4—hence, the relevance ofstudying TLR-2 and-4 in this respect.16,19
Monocytes, too, are crucial for the immune and inflamma-tory response, and by using the PRRs, they produce a largenumber of functionally distinct host cytokines.20 Research in-terest in monocyte heterogeneity has gained strong thrust inthe last decade past decade, as a subset-specific contribution ofmonocytes to immune stimuli has been postulated.21,22 Pres-ently, three human monocyte subsets are defined, by virtue ofdifferential surface expression of LPS receptor CD14 and Fc�IIIreceptor CD16—namely, CD14��CD16� (monocytes ex-pressing CD14 but not CD16), CD14��CD16� (monocytesexpressing CD14 and CD16), and CD14�CD16� (monocytesexpressing CD16 and low CD14) cells, of which the latter twosubsets are summarized as CD16� monocytes and have beenfound to be a minor monocyte population in healthy individ-uals.23
Although, TLR expression is known to differ among classicand minor monocyte populations in peripheral blood,24 nostudy to date has documented any alteration of the monocytesubpopulations and the mechanisms underpinning changes inblood monocyte TLR expression in the pathogenesis of ED.Therefore, the present study was conducted to identify thedistribution, differential TLR expression, and functional contri-bution of monocyte subpopulations, as well as the cytokineproduction pattern of isolated monocytes after interaction of aclinically relevant bacterial antigen with TLR in the inflamma-tory stage of ED.
METHODS
Study Subjects
Nine (eight men, one woman) patients, who received a diagnosis of EDwere recruited from the retina research clinic at the Regional Instituteof Ophthalmology, Kolkata, India, from 2007 through 2010. All ninepatients were in the active stage of ED, as characterized by acuteinflammation of veins in the periphery of the retina. Among them, twopatients (one man, one woman) had inflammation of the small-calibervessels, with superficial retinal hemorrhage; two patients (both men)had large-caliber vessel inflammation, with superficial retinal hemor-rhage; and the remaining five male patients had large-caliber vesselinflammation with macular edema. The patients received no medica-tion before sample collection.
Diagnosis was made for all patients by dilated fundus examinationwith direct and indirect ophthalmoscopy, slit lamp biomicroscopywith �90 D and three-mirror lens, stereoscopic color fundus photog-raphy, and fluorescein angiography. Other detailed ophthalmic exam-inations included visual acuity determination by ETDRS chart andanterior segment evaluation by slit lamp examination. The location andextent of retinal involvement by vasculitis was documented in allpatients by digital color fundus photography and fluorescein angiogra-phy.
Nine (seven men, two women) age- and sex-matched healthyadults, without any history suggestive of ED, attending the outpatientdepartment of the same institute for treatment of visual difficulty dueto refractive errors without any other systemic inflammatory or oculardisease provided blood samples and constituted our healthy controlgroup.
Clinical history was obtained from all participants for the presenceof any associated systemic diseases and use of anti-inflammatory med-ication. Participants were eligible for this study if they had no smokingand/or alcohol addiction, had not received any immunosuppressivetherapy, and did not have any coexisting chronic inflammatory diseaseor any other recent infection 6 months before collection of the sam-ples. Subjects with a history of systemic disorders such as, diabetes
mellitus, hypertension, collagen vascular disease, HIV, symptomaticarthritis, symptomatic malignancy, sarcoidosis, Behcet’s disease, sys-temic lupus erythematosus, Coats’ disease, or syphilis were also ex-cluded from the study. The study protocol complied with the Decla-ration of Helsinki and was approved by the Institution’s EthicsCommittee. Informed consent was obtained from each subject.
Isolation of Peripheral Blood Mononuclear Cells
Peripheral blood was collected in an EDTA-coated vial on the day ofdiagnosis of ED and from healthy control subjects. Peripheral bloodmononuclear cells (PBMCs) were isolated by density gradient separa-tion (Ficoll; GE Healthcare, Piscataway, NJ, with Histopaque-1077;Sigma-Aldrich, St. Louis, MO). Isolated PBMCs were washed withRPMI1640 medium (Invitrogen-Gibco, Grand Island, NY). This cellfraction contained monocytes and lymphocytes and was adjusted to1 � 106 monocytes/mL, viability of the cells confirmed by trypan blueexclusion assay. Expression of CD14, CD16, TLR-2, and TLR-4 wasdetermined, and the remaining cell suspension was used for isolationand culture for CD14� monocytes and different monocyte subpopula-tions, as required.
Flow Cytometry
Four-color flow cytometry was performed on freshly isolated PBMCs,to investigate the cell surface expression of CD14, CD16, TLR-2, andTLR-4, on monocytes of patients with ED and healthy controls. Briefly,PBMCs were washed twice with phosphate-buffered saline (PBS; 0.02M, pH 7.2) and resuspended in PBS containing 2% heat-inactivated fetalbovine serum (FBS). Fifty microliters of PBMC suspension (1 � 106
cells/mL) was incubated with primary antibodies for 30 minutes atroom temperature: fluorescein isothiocyanate (FITC)–conjugated anti-CD14 (clone 61D3, eBioscience, San Diego, CA), phycoerythrin cya-nine 5 (PECy5)–conjugated anti-CD16 (clone 3G8, BioLegend, SanDiego, CA), allophycocycanin (APC)-conjugated anti-TLR-2 (cloneTL2.1; eBioscience), and phycoerythrin (PE)-conjugated anti-TLR-4(clone HTA125, eBioscience), along with isotype-matched antibodycontrols. After they were washed with PBS, the cells were resuspendedin 400 �L PBS containing 2% FBS, and counts were acquired on afour-parameter flow cytometer (FACSCalibur; BD Biosciences, SanDiego, CA). The monocytes were gated on the basis of parametersof forward and side light scatter, and acquisition was performed on5000 gated events. Data analysis was performed with system-associated software (CellQuest Pro; BD Biosciences). The absolutecount of monocytes was obtained with a hemocytometer countingchamber, and the monocyte subpopulation counts were calculatedwith the percentage distribution obtained from flow cytometry. Tomeasure TLR fluorescence in monocytes, the cells were plotted onthe basis of their characteristic linear forward and side scatter andfurther gated with CD14 and/or CD16 positivity, and then TLRfluorescence was measured on a logarithmic scale in the FL2 chan-nel (TLR-4) and FL4 channel (TLR-2). The mean channel fluores-cence intensity (MFI) derived from the fluorescence histogram wasused to determine the extent of cell surface TLR expression andexpressed as the MFI of specific subtracted from the MFI of respec-tive isotype control (i.e., MFI-specific staining minus MFI isotype).
Monocyte Separation and Culture
After isolation of PBMCs from healthy controls and ED patients bydensity gradient, the monocytes were isolated from the PBMCs byincubation with magnetic-activated cell sorting (MACS) beads coatedwith a monoclonal antibody against human CD14 (Miltenyi Biotec,Bergisch Gladbach, Germany). Immunomagnetic separation was per-formed according to the manufacturer’s instructions. Purity �90% wasconfirmed by flow cytometry. The cells were adjusted to 1 � 106
monocytes/mL and cultured in RPMI supplemented with 100 U/mLpenicillin/100 �g /mL streptomycin and 10% FBS for 18 hours at 37°Cin 5% CO2, with or without stimulation by 5 �g/mL PGN of Staphylo-coccus aureus (InvivoGen, San Diego, CA), and the cell supernatants
IOVS, August 2011, Vol. 52, No. 9 Toll-like Receptor in Eales’ Disease 6941
Downloaded From: http://iovs.arvojournals.org/pdfaccess.ashx?url=/data/journals/iovs/933460/ on 08/22/2017
were collected and stored at �20°C until used for detection of cyto-kines.
Separation and Culture ofMonocyte Subpopulation
CD14�CD16� and CD14�CD16� monocytes were selectively isolatedfrom purified CD14� monocytes (isolated by CD14 microbead andMACS methodology) of three ED patients by using a CD16� monocyteisolation kit (Miltenyi Biotec) and MACS methodology, according to themanufacturer’s instructions. Purity �90% was confirmed by flow cy-tometry analysis. CD14�CD16� and CD14�CD16� monocytes wereseparately cultured in RPMI supplemented with 100 U/mL penicillin/100 �g/mL streptomycin and 10% FBS for 48 hours at 37°C in 5% CO2
without any stimulation, and the cell supernatants were collected andstored at �20°C until used for cytokine detection.
Measurement of Cytokines
The presence of cytokines in the culture supernatants and serum wasmeasured by enzyme-linked immunosorbent assay (ELISAs for TNF-�,IL-6, IFN-�, and IL-10; ImmunoTools, Friesoythe, Germany; for IL-1�and TGF-�; R&D System, Inc., Minneapolis, MN). Measurements wereperformed in duplicate with 100-�L sample volume, according to themanufacturer’s instruction.
Determination of Erythrocyte Sedimentation Rateand High-Sensitivity C-reactive Protein
The erythrocyte sedimentation rate (ESR) was determined by using themethod of Westergren within 2 hours of obtaining the blood. Briefly,2 mL of EDTA anticoagulant blood was added to 0.5 mL of 0.85% ofsodium chloride, and the contents of the test tube were mixed gentlyfor 2 minutes. A standard 200-mm, Westergren tube was filled to the 0mark, set in a vertical position, and left for 1 hour. The level to whichthe red cell column fell at the end of 1 hour was noted, and the resultexpressed as millimeters in the first hour.
Serum high-sensitivity C-reactive protein (hsCRP) was then mea-sured (Magiwel Enzyme Immunoassay; United Biotech, Inc., MountainView, CA), per the manufacturer’s instructions.
Inhibition of TLR-2 Expression by siRNA
Human TLR-2-specific or nonspecific control siRNA was transfectedinto purified CD14� monocytes isolated from four healthy controlswith a lipophilic transfection reagent (Lipofectamine 2000; Invitro-gen), according to the protocol of the manufacturer. Briefly, the puri-fied monocytes (0.5 � 106 cells/mL) were plated in a 24-well plate andincubated at 37°C, 5% CO2 for 24 hours. Before the transfection,cultures were washed, and medium was replaced by 400 �L/well ofserum-free RPMI1640 medium (without antibiotics). Serial dilutions ofsiRNA were transfected at 10 to 80 nM, with the transfection reagent(1 �L/mL). The transfection reactions were supplemented with 100 �Lof FBS after 8 hours and changed to fresh culture medium containing10% FBS in the next morning. After 48 hours of transfection, cells from
some wells were harvested and examined for surface TLR-2 expressionby flow cytometry. The remaining cells were stimulated with PGN (5�g/mL) for 18 hours, and cell culture supernatants were collected tomeasure TNF-� by ELISA.
Statistical Analysis
Age and sex differences between the patients and control subjectswere investigated by Student’s t-test and �2 test, respectively. Thesignificance of differences of measured parameters between corre-sponding groups of observations was evaluated by the Mann-WhitneyU test, and all values are expressed as the mean � SD. To examinecorrelations, we used Spearman’s rank correlation coefficient on thelogged data (Graph-Pad, San Jose, CA). Acceptable significance wasrecorded when values reached P � 0.05. To determine the minimumnumber of patients, yet appropriate sample sizes for our experiments,we undertook power analysis calculations (PS Power and Sample SizeCalculation software version 3.0.34; http://biostat.mc.vanderbilt.edu/wiki/Main/PowerSampleSize/ open source software developed by Wil-liam DuPont and Walton Plummer, Jr., Department of Biostatistics,Vanderbilt University, Nashville, TN). First, based on our previousstudies, we estimated the effect size among different experimentalunits. Thereafter, the sample size was set to nine per group to rejectthe null hypothesis at a 5% significance level, ensuring at least 80%power for each experiment.
RESULTS
Nine patients with the inflammatory stage of ED satisfying theinclusion and exclusion criteria were studied and comparedwith nine healthy age- and sex-matched controls. Demographicand clinical characteristics indicative of disease progression aresummarized in Table 1.
Increase in Total Circulating Monocytes inPatients with the Inflammatory Stage of ED,along with a Shift toward the Nonclassic CD16�
Monocyte Subset
Monocytes were analyzed after exclusion of other periph-eral mononuclear cells shortly after the isolation by sidescatter and forward scatter (Fig. 1A); a higher number ofcirculating blood monocytes were found in patients withthe inflammatory stage of ED than were found in healthycontrols (Figs. 1B, 1C).
CD14��CD16� (R1), CD14��CD16� (R2), and CD14�CD16�
(R3) monocytes were distinguished by the surface expressionpattern of the LPS receptor CD14 and the Fc�III receptor CD16(Fig. 1D). In healthy controls, CD14��CD16� monocytes (R1)constituted the major population (69.96% in the representativesubject shown), whereas CD14��CD16� (R2) and CD14�CD16�
(R3) were the minor populations (Fig. 1D). However, in a
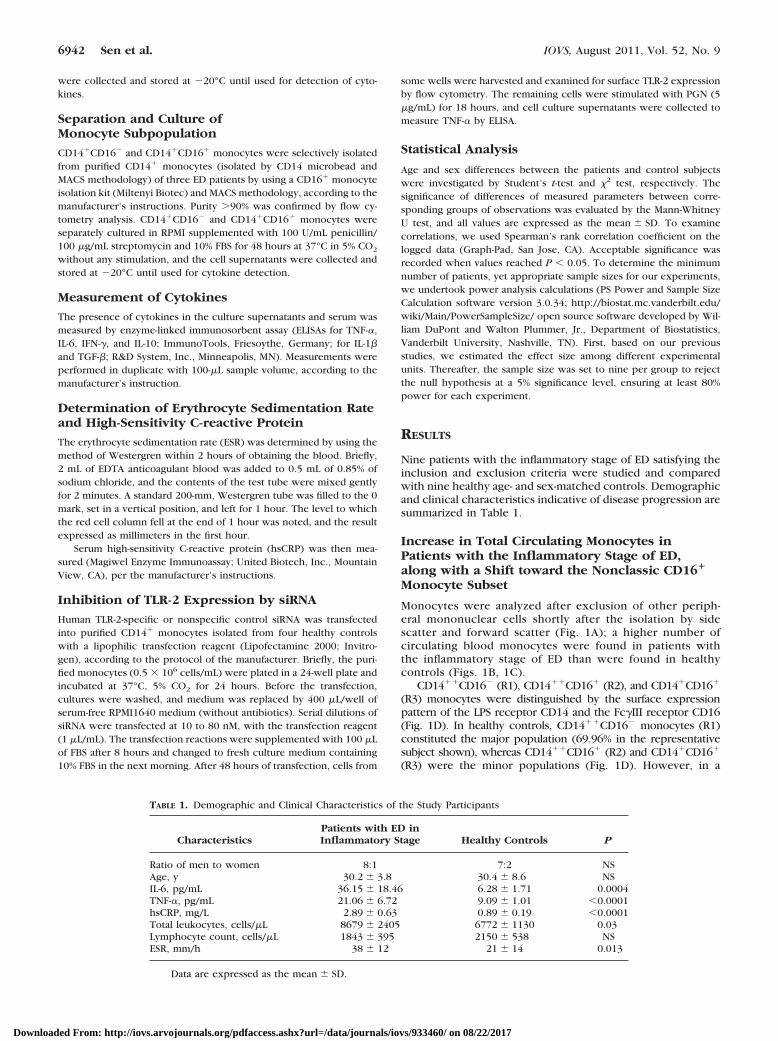
TABLE 1. Demographic and Clinical Characteristics of the Study Participants
CharacteristicsPatients with ED inInflammatory Stage Healthy Controls P
Ratio of men to women 8:1 7:2 NSAge, y 30.2 � 3.8 30.4 � 8.6 NSIL-6, pg/mL 36.15 � 18.46 6.28 � 1.71 0.0004TNF-�, pg/mL 21.06 � 6.72 9.09 � 1.01 �0.0001hsCRP, mg/L 2.89 � 0.63 0.89 � 0.19 �0.0001Total leukocytes, cells/�L 8679 � 2405 6772 � 1130 0.03Lymphocyte count, cells/�L 1843 � 395 2150 � 538 NSESR, mm/h 38 � 12 21 � 14 0.013
Data are expressed as the mean � SD.
6942 Sen et al. IOVS, August 2011, Vol. 52, No. 9
Downloaded From: http://iovs.arvojournals.org/pdfaccess.ashx?url=/data/journals/iovs/933460/ on 08/22/2017
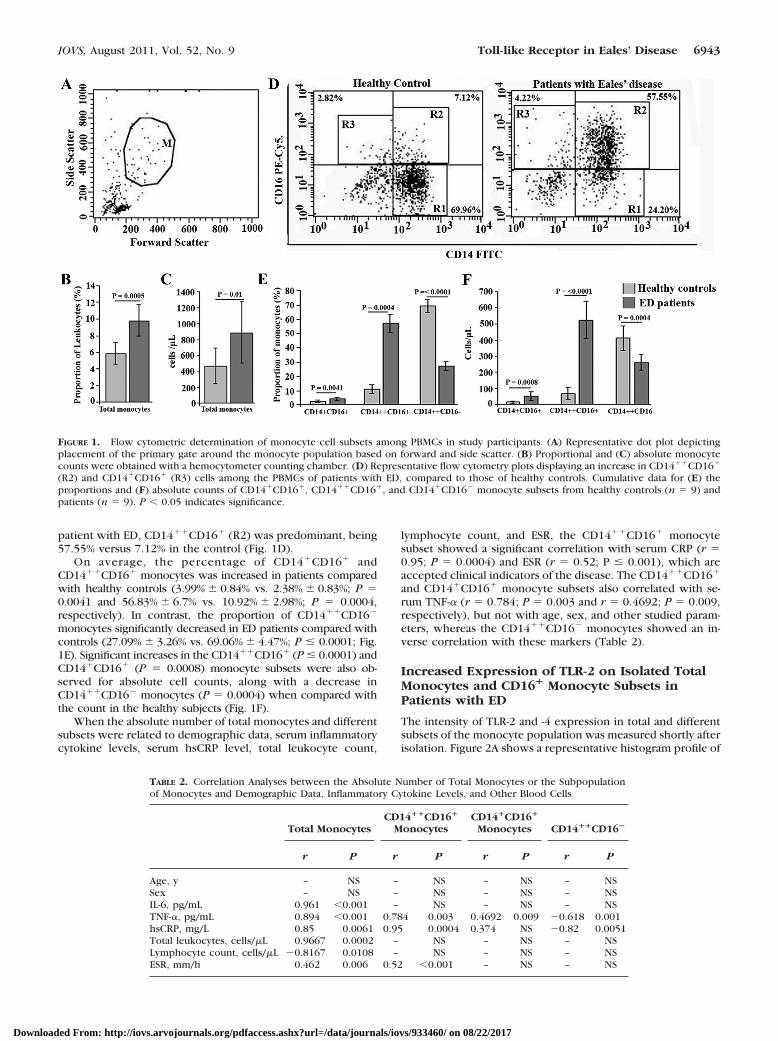
patient with ED, CD14��CD16� (R2) was predominant, being57.55% versus 7.12% in the control (Fig. 1D).
On average, the percentage of CD14�CD16� andCD14��CD16� monocytes was increased in patients comparedwith healthy controls (3.99% � 0.84% vs. 2.38% � 0.83%; P �0.0041 and 56.83% � 6.7% vs. 10.92% � 2.98%; P � 0.0004,respectively). In contrast, the proportion of CD14��CD16�
monocytes significantly decreased in ED patients compared withcontrols (27.09% � 3.26% vs. 69.06% � 4.47%; P � 0.0001; Fig.1E). Significant increases in the CD14��CD16� (P � 0.0001) andCD14�CD16� (P � 0.0008) monocyte subsets were also ob-served for absolute cell counts, along with a decrease inCD14��CD16� monocytes (P � 0.0004) when compared withthe count in the healthy subjects (Fig. 1F).
When the absolute number of total monocytes and differentsubsets were related to demographic data, serum inflammatorycytokine levels, serum hsCRP level, total leukocyte count,
lymphocyte count, and ESR, the CD14��CD16� monocytesubset showed a significant correlation with serum CRP (r �0.95; P � 0.0004) and ESR (r � 0.52; P � 0.001), which areaccepted clinical indicators of the disease. The CD14��CD16�
and CD14�CD16� monocyte subsets also correlated with se-rum TNF-� (r � 0.784; P � 0.003 and r � 0.4692; P � 0.009,respectively), but not with age, sex, and other studied param-eters, whereas the CD14��CD16� monocytes showed an in-verse correlation with these markers (Table 2).
Increased Expression of TLR-2 on Isolated TotalMonocytes and CD16� Monocyte Subsets inPatients with ED
The intensity of TLR-2 and -4 expression in total and differentsubsets of the monocyte population was measured shortly afterisolation. Figure 2A shows a representative histogram profile of
FIGURE 1. Flow cytometric determination of monocyte cell subsets among PBMCs in study participants. (A) Representative dot plot depictingplacement of the primary gate around the monocyte population based on forward and side scatter. (B) Proportional and (C) absolute monocytecounts were obtained with a hemocytometer counting chamber. (D) Representative flow cytometry plots displaying an increase in CD14��CD16�
(R2) and CD14�CD16� (R3) cells among the PBMCs of patients with ED, compared to those of healthy controls. Cumulative data for (E) theproportions and (F) absolute counts of CD14�CD16�, CD14��CD16�, and CD14�CD16� monocyte subsets from healthy controls (n � 9) andpatients (n � 9). P � 0.05 indicates significance.
TABLE 2. Correlation Analyses between the Absolute Number of Total Monocytes or the Subpopulationof Monocytes and Demographic Data, Inflammatory Cytokine Levels, and Other Blood Cells
Total MonocytesCD14��CD16�
MonocytesCD14�CD16�
Monocytes CD14��CD16�
r P r P r P r P
Age, y – NS – NS – NS – NSSex – NS – NS – NS – NSIL-6, pg/mL 0.961 �0.001 – NS – NS – NSTNF-�, pg/mL 0.894 �0.001 0.784 0.003 0.4692 0.009 �0.618 0.001hsCRP, mg/L 0.85 0.0061 0.95 0.0004 0.374 NS �0.82 0.0051Total leukocytes, cells/�L 0.9667 0.0002 – NS – NS – NSLymphocyte count, cells/�L �0.8167 0.0108 – NS – NS – NSESR, mm/h 0.462 0.006 0.52 �0.001 – NS – NS
IOVS, August 2011, Vol. 52, No. 9 Toll-like Receptor in Eales’ Disease 6943
Downloaded From: http://iovs.arvojournals.org/pdfaccess.ashx?url=/data/journals/iovs/933460/ on 08/22/2017

TLR-2 expression on gated monocytes and the different cellsubsets from healthy controls and patients with ED. A sig-nificantly higher level of TLR-2 expression, as measured byMFI, was observed on the total monocytes of patients in theactive stage of ED, compared with age- and sex-matchedhealthy controls (P � 0.02; Fig. 2B). When comparison wasmade between different monocyte subsets in patients, theaverage MFI of TLR-2 on CD14�CD16� and CD14��CD16�
monocytes were significantly higher than that ofCD14��CD16� monocytes in patients with ED (P � 0.028and P � 0.0132, respectively; Fig. 2C). Conversely, inhealthy controls, a higher TLR-2 expression was found inCD14��CD16� monocytes, but the difference in TLR-2 in-tensity in the different subsets was statistically nonsignifi-cant (Fig. 2C).
In contrast to TLR-2, staining for TLR-4 revealed lowfluorescence intensity in both study groups, and no statisti-cally significant intergroup differences and intragroupmonocyte-subset–specific differences were found (Figs.2D–F).
In addition, in patients with ED, the intensity of TLR-2expression in total monocytes showed a positive correlationwith serum hsCRP level (r � 0.843; P � 0.007), whereas nosuch correlation was found in expression of TLR-4 on totalmonocytes and serum hsCRP (r � 0.414; P � 0.21; data notshown).
Increased TLR-2 Induced Cytokine Production byMonocytes Isolated from ED and DifferentialCytokine Secretion in the Monocyte Subsets
The increased baseline TLR-2 expression on monocytes frompatients with ED may be due to a previous contact withendotoxin. Hence, we investigated whether TLR-2 engage-ment results in increased cytokine production. We isolatedcirculating monocytes by human CD14-coated microbeadsvia MACS methodology in cells from patients and healthycontrols, and then pro- and anti-inflammatory cytokine pro-duction was determined after cells were cultured with orwithout PGN.
In the absence of stimulation, monocytes from ED patientshad increased mean levels of proinflammatory (TNF-�, IL-6,IFN-�, and IL-1�) and anti-inflammatory (IL-10 and TGF-�) cy-tokines compared with monocytes isolated from healthy con-trols (Fig. 3A). After activation with PGN, mean levels of allcytokines increased in both groups compared with unstimu-lated cells, within each group, but no statistically significantdifferences were observed after PGN induction, when the twogroups were compared (Fig. 3B).
Because of the marked accumulation of CD16� monocytesin inflammatory phases of ED, we further sought to define thelikely function of this subset in the pathogenesis of this disease.
FIGURE 2. Flow cytometric analysisof TLR-2 and -4 expression on mono-cytes isolated from patients with EDand healthy controls. (A) Representa-tive histograms showing TLR-2 ex-pression in total and different subsetsof monocyte population. (B) TLR-2expression in total monocytes washigher in patients with ED than inhealthy controls. (C) TLR-2 fluores-cence intensity on CD16� mono-cytes was significantly higher thanthat of CD16� monocytes in patientswith ED, but no significant subset-specific differences in TLR-2 expres-sion were found in healthy controls.(D) Representative histograms showTLR-4 expression in total and differ-ent subsets of the monocyte popula-tion. (E) No significant differenceswere found between patients andhealth controls in TLR-4 expressionon total monocytes. (F) There wereno differences in TLR-4 fluorescenceintensity on different monocyte sub-sets in both groups. Fluorescenceintensity of cell surface TLR wasexpressed as the difference be-tween the mean fluorescence inten-sity (MFI) of staining with anti-TLR-2 or anti-TLR-4 antibody andisotype-matched control antibody(MFIspecific staining � MFIisotype). P �0.05 indicates significance. ns, non-significant.
6944 Sen et al. IOVS, August 2011, Vol. 52, No. 9
Downloaded From: http://iovs.arvojournals.org/pdfaccess.ashx?url=/data/journals/iovs/933460/ on 08/22/2017
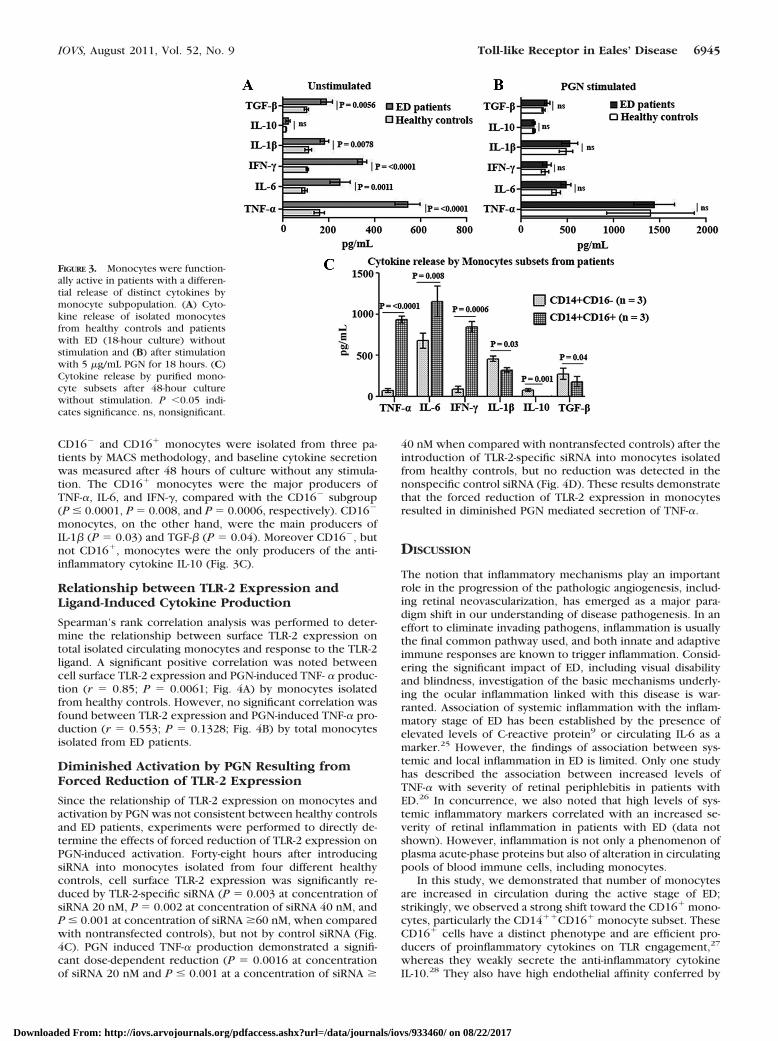
CD16� and CD16� monocytes were isolated from three pa-tients by MACS methodology, and baseline cytokine secretionwas measured after 48 hours of culture without any stimula-tion. The CD16� monocytes were the major producers ofTNF-�, IL-6, and IFN-�, compared with the CD16� subgroup(P � 0.0001, P � 0.008, and P � 0.0006, respectively). CD16�
monocytes, on the other hand, were the main producers ofIL-1� (P � 0.03) and TGF-� (P � 0.04). Moreover CD16�, butnot CD16�, monocytes were the only producers of the anti-inflammatory cytokine IL-10 (Fig. 3C).
Relationship between TLR-2 Expression andLigand-Induced Cytokine Production
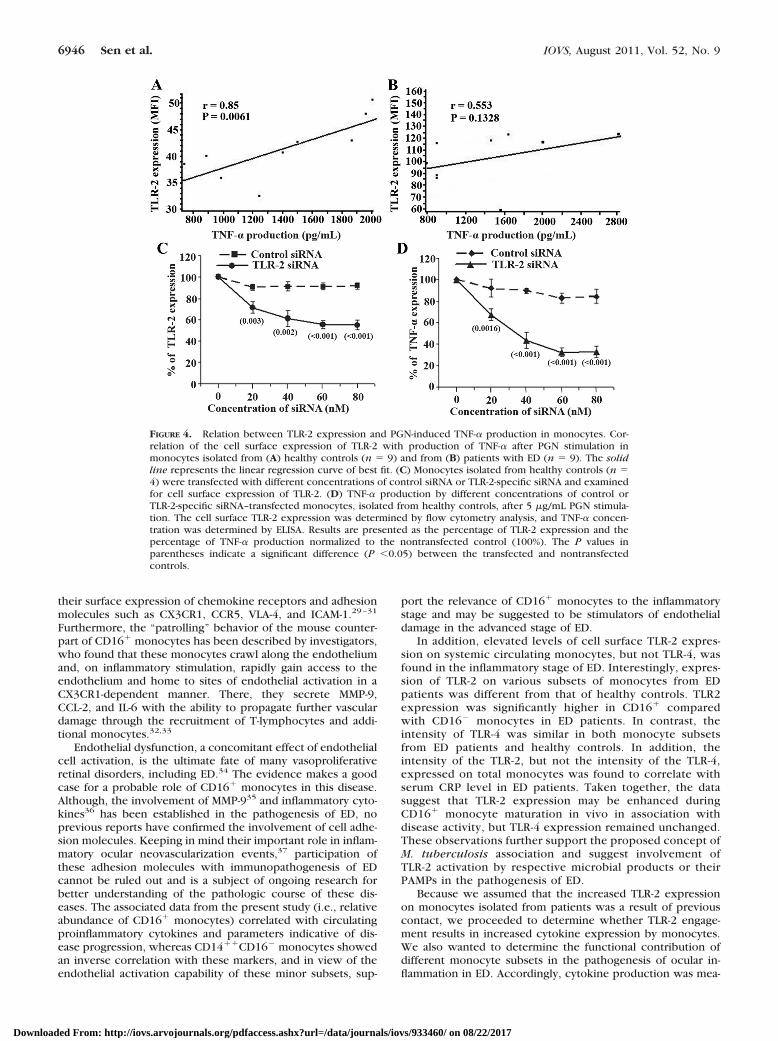
Spearman’s rank correlation analysis was performed to deter-mine the relationship between surface TLR-2 expression ontotal isolated circulating monocytes and response to the TLR-2ligand. A significant positive correlation was noted betweencell surface TLR-2 expression and PGN-induced TNF- � produc-tion (r � 0.85; P � 0.0061; Fig. 4A) by monocytes isolatedfrom healthy controls. However, no significant correlation wasfound between TLR-2 expression and PGN-induced TNF-� pro-duction (r � 0.553; P � 0.1328; Fig. 4B) by total monocytesisolated from ED patients.
Diminished Activation by PGN Resulting fromForced Reduction of TLR-2 Expression
Since the relationship of TLR-2 expression on monocytes andactivation by PGN was not consistent between healthy controlsand ED patients, experiments were performed to directly de-termine the effects of forced reduction of TLR-2 expression onPGN-induced activation. Forty-eight hours after introducingsiRNA into monocytes isolated from four different healthycontrols, cell surface TLR-2 expression was significantly re-duced by TLR-2-specific siRNA (P � 0.003 at concentration ofsiRNA 20 nM, P � 0.002 at concentration of siRNA 40 nM, andP � 0.001 at concentration of siRNA �60 nM, when comparedwith nontransfected controls), but not by control siRNA (Fig.4C). PGN induced TNF-� production demonstrated a signifi-cant dose-dependent reduction (P � 0.0016 at concentrationof siRNA 20 nM and P � 0.001 at a concentration of siRNA �
40 nM when compared with nontransfected controls) after theintroduction of TLR-2-specific siRNA into monocytes isolatedfrom healthy controls, but no reduction was detected in thenonspecific control siRNA (Fig. 4D). These results demonstratethat the forced reduction of TLR-2 expression in monocytesresulted in diminished PGN mediated secretion of TNF-�.
DISCUSSION
The notion that inflammatory mechanisms play an importantrole in the progression of the pathologic angiogenesis, includ-ing retinal neovascularization, has emerged as a major para-digm shift in our understanding of disease pathogenesis. In aneffort to eliminate invading pathogens, inflammation is usuallythe final common pathway used, and both innate and adaptiveimmune responses are known to trigger inflammation. Consid-ering the significant impact of ED, including visual disabilityand blindness, investigation of the basic mechanisms underly-ing the ocular inflammation linked with this disease is war-ranted. Association of systemic inflammation with the inflam-matory stage of ED has been established by the presence ofelevated levels of C-reactive protein9 or circulating IL-6 as amarker.25 However, the findings of association between sys-temic and local inflammation in ED is limited. Only one studyhas described the association between increased levels ofTNF-� with severity of retinal periphlebitis in patients withED.26 In concurrence, we also noted that high levels of sys-temic inflammatory markers correlated with an increased se-verity of retinal inflammation in patients with ED (data notshown). However, inflammation is not only a phenomenon ofplasma acute-phase proteins but also of alteration in circulatingpools of blood immune cells, including monocytes.
In this study, we demonstrated that number of monocytesare increased in circulation during the active stage of ED;strikingly, we observed a strong shift toward the CD16� mono-cytes, particularly the CD14��CD16� monocyte subset. TheseCD16� cells have a distinct phenotype and are efficient pro-ducers of proinflammatory cytokines on TLR engagement,27
whereas they weakly secrete the anti-inflammatory cytokineIL-10.28 They also have high endothelial affinity conferred by
FIGURE 3. Monocytes were function-ally active in patients with a differen-tial release of distinct cytokines bymonocyte subpopulation. (A) Cyto-kine release of isolated monocytesfrom healthy controls and patientswith ED (18-hour culture) withoutstimulation and (B) after stimulationwith 5 �g/mL PGN for 18 hours. (C)Cytokine release by purified mono-cyte subsets after 48-hour culturewithout stimulation. P �0.05 indi-cates significance. ns, nonsignificant.
IOVS, August 2011, Vol. 52, No. 9 Toll-like Receptor in Eales’ Disease 6945
Downloaded From: http://iovs.arvojournals.org/pdfaccess.ashx?url=/data/journals/iovs/933460/ on 08/22/2017
their surface expression of chemokine receptors and adhesionmolecules such as CX3CR1, CCR5, VLA-4, and ICAM-1.29–31
Furthermore, the “patrolling” behavior of the mouse counter-part of CD16� monocytes has been described by investigators,who found that these monocytes crawl along the endotheliumand, on inflammatory stimulation, rapidly gain access to theendothelium and home to sites of endothelial activation in aCX3CR1-dependent manner. There, they secrete MMP-9,CCL-2, and IL-6 with the ability to propagate further vasculardamage through the recruitment of T-lymphocytes and addi-tional monocytes.32,33
Endothelial dysfunction, a concomitant effect of endothelialcell activation, is the ultimate fate of many vasoproliferativeretinal disorders, including ED.34 The evidence makes a goodcase for a probable role of CD16� monocytes in this disease.Although, the involvement of MMP-935 and inflammatory cyto-kines36 has been established in the pathogenesis of ED, noprevious reports have confirmed the involvement of cell adhe-sion molecules. Keeping in mind their important role in inflam-matory ocular neovascularization events,37 participation ofthese adhesion molecules with immunopathogenesis of EDcannot be ruled out and is a subject of ongoing research forbetter understanding of the pathologic course of these dis-eases. The associated data from the present study (i.e., relativeabundance of CD16� monocytes) correlated with circulatingproinflammatory cytokines and parameters indicative of dis-ease progression, whereas CD14��CD16� monocytes showedan inverse correlation with these markers, and in view of theendothelial activation capability of these minor subsets, sup-
port the relevance of CD16� monocytes to the inflammatorystage and may be suggested to be stimulators of endothelialdamage in the advanced stage of ED.
In addition, elevated levels of cell surface TLR-2 expres-sion on systemic circulating monocytes, but not TLR-4, wasfound in the inflammatory stage of ED. Interestingly, expres-sion of TLR-2 on various subsets of monocytes from EDpatients was different from that of healthy controls. TLR2expression was significantly higher in CD16� comparedwith CD16� monocytes in ED patients. In contrast, theintensity of TLR-4 was similar in both monocyte subsetsfrom ED patients and healthy controls. In addition, theintensity of the TLR-2, but not the intensity of the TLR-4,expressed on total monocytes was found to correlate withserum CRP level in ED patients. Taken together, the datasuggest that TLR-2 expression may be enhanced duringCD16� monocyte maturation in vivo in association withdisease activity, but TLR-4 expression remained unchanged.These observations further support the proposed concept ofM. tuberculosis association and suggest involvement ofTLR-2 activation by respective microbial products or theirPAMPs in the pathogenesis of ED.
Because we assumed that the increased TLR-2 expressionon monocytes isolated from patients was a result of previouscontact, we proceeded to determine whether TLR-2 engage-ment results in increased cytokine expression by monocytes.We also wanted to determine the functional contribution ofdifferent monocyte subsets in the pathogenesis of ocular in-flammation in ED. Accordingly, cytokine production was mea-
FIGURE 4. Relation between TLR-2 expression and PGN-induced TNF-� production in monocytes. Cor-relation of the cell surface expression of TLR-2 with production of TNF-� after PGN stimulation inmonocytes isolated from (A) healthy controls (n � 9) and from (B) patients with ED (n � 9). The solidline represents the linear regression curve of best fit. (C) Monocytes isolated from healthy controls (n �4) were transfected with different concentrations of control siRNA or TLR-2-specific siRNA and examinedfor cell surface expression of TLR-2. (D) TNF-� production by different concentrations of control orTLR-2-specific siRNA–transfected monocytes, isolated from healthy controls, after 5 �g/mL PGN stimula-tion. The cell surface TLR-2 expression was determined by flow cytometry analysis, and TNF-� concen-tration was determined by ELISA. Results are presented as the percentage of TLR-2 expression and thepercentage of TNF-� production normalized to the nontransfected control (100%). The P values inparentheses indicate a significant difference (P �0.05) between the transfected and nontransfectedcontrols.
6946 Sen et al. IOVS, August 2011, Vol. 52, No. 9
Downloaded From: http://iovs.arvojournals.org/pdfaccess.ashx?url=/data/journals/iovs/933460/ on 08/22/2017
sured in total monocytes, isolated from patients and matchedcontrols, with and without PGN stimulation, and in monocytesubsets in ED patients without PGN stimulation.
At baseline, total monocytes from ED patients secretedsignificantly higher amounts of inflammatory mediators thanhealthy subjects. These findings are in good agreement withthe hypothesis that increased productions of inflammatorycytokines are a crucial mechanism in development of perireti-nal neovascularization and worsen outcome of ED.34 Furtherdissecting the diverse functional capacities of both monocytesubsets in vitro confirmed that the CD16� monocyte subset isthe main source of proinflammatory mediators, thereby per-petuating the chronic inflammatory response in the retina. Thisconclusion is corroborated by correlating between circulatingCD16� monocyte counts and levels of serum TNF-� in EDpatients.
After PGN stimulation, cytokine production by monocytesincreased in all study groups, and no significant intragroupdifferences were found. It is thought that monocytes isolatedfrom patients are inherently more responsive than those ob-tained from healthy controls, due to the possibility that the cellsurface expression of TLR controls the ligand-induced down-stream response. Forced diminution of TLR-2 expression onmonocytes in our study resulted in a decreased response toPGN, also supporting the hypothesis that increased expressionof TLR-2 results in an enhanced response to TLR-2 ligand.Conversely, when we examined the relationship of surfaceexpression of TLR-2 on monocytes with the levels of cytokinesinduced by stimulation with TLR-2 ligand, a significant positiveassociation was found in monocytes isolated from healthycontrols but not in monocytes from patients. The data revealedthat the PGN-induced responses of monocytes isolated frompatients, although increased compared with those of unstimu-lated monocytes in vitro, were less than would have beenexpected of monocytes isolated from healthy controls at com-parable levels of cell surface TLR-2.
These findings are of relevance, given the further evidencesupporting the role of a microbial trigger and, in particular,Gram-positive bacteria in the development of ED. As all studypatients had active inflammation at the time of sampling, it isfeasible that prior in vivo exposure to potential endogenousTLR-2 ligands induced tolerance to repeat stimulation,38,39 pos-sibly accounting for the lack of association between TLR-2expression and response to TLR-2 ligand in ED patients. Theexistence of TLR-2 ligand in ocular tissue of ED patients has notyet been established. Analysis of vitreous collected from EDpatients at the time of vitrectomy by molecular biology tech-niques has detected the presence of Mycobacterium DNAsuggesting the existence of Mycobacterium-derived ligands.5,6
However, reduced response to PGN is a transient state, and thepresent study did not demonstrate a dynamic change in TLRfunction in ED. It is conceivable that the kinetics of TLR-2expression, along with cytokine production, is different at laterstages of progression of ED and should be investigated in thefuture.
In summary, the findings of the present study indicate thatnonclassic CD16� monocytes are crucial regulators in thepathogenesis of ED and act by secreting an abundance ofcytokines perpetuating the retinal inflammatory process. Fur-thermore, this study also implies a role for TLR-2 activation inthe pathogenic outcome of ED. Demonstration of increasedTLR-2 expression on systemic immune cells in ED togetherwith a functional state of reduced TLR-2 ligand response pro-vides further evidence of the role of Mycobacterium in thedevelopment of Eales’ disease.
Acknowledgments
The authors thank the Regional Institute of Ophthalmology for allow-ing them to contact the patients and to obtain information from theirclinical records.
References
1. Biswas J, Sharma T, Gopal L, Madhavan HN, Sulochana KN, Ra-makrishnan S. Eales’ disease: an update. Surv Ophthalmol. 2002;47:197–214.
2. Das T, Biswas J, Kumar A, et al. Eales’ disease. Indian J Ophthal-mol. 1994;42:3–28.
3. Abu El- Asrar AM, Al- Kharashi SA. Full panretinal photocoagulationand early vitrectomy improve prognosis of retinal vasculitis asso-ciated with tuberculoprotein hypersensitivity (Eales’ disease). Br JOphthalmol. 2002;86:1248–1251.
4. Biswas J, Jain M, Narain S, Roy S, Madhavan HN. Evaluation oflymphocytes proliferation assay to purified protein derivative, en-zyme linked immunosorbent assay and tuberculin hypersensitivityin Eales’ disease. Indian J Ophthalmol. 1997;45:93–97.
5. Madhavan HN, Therese KL, Gunisha P, Jayanthi U, Biswas J. Poly-merase chain reaction for detection of Mycobacterium tuberculo-sis in epiretinal membranes in Eales’ disease. Invest OphthalmolVis Sci. 2000;41:822–825.
6. Therese KL, Deepa P, Therese J, Bagyalakshmi R, Biswas J, Mad-havan HN. Association of mycobacteria with Eales’ disease. IndianJ Med Res. 2007;126:56–62.
7. Biswas J, Mukesh BN, Naratin S, et al. Profiling of human leukocyteantigens in Eales’ disease. Int Ophthalmol. 1998;21:277–281.
8. Rosen PH, Spalton DJ, Gaham EM. Intraocular tuberculosis. Eye.1990;4:486–492.
9. Saxena S, Kumar D, Kapoor S, Jain A. C-reactive protein in Eales’disease. Ann Ophthalmol. 2002;34:179–180.
10. Saxena S, Kumar D. A new staging system for idiopathic retinalperiphlebitis. Eur J Ophthalmol. 2004;14:236–239.
11. Roach JC, Glusman G, Rowen L, et al. The evolution of vertebrateToll-like receptors. Proc Natl Acad Sci USA. 2005;102:9577–9582.
12. Akira S, Uematsu S, Takeuchi O. Pathogen recognition and innateimmunity. Cell. 2006;124:783–801.
13. Waltenbaugh C, Doan T, Melvold R, Viselli S. Immunology. 2008Lippincott’s Illustrated Reviews. Philadelphia: Wolters KluwerHealth/Lippincott Williams & Wilkins; 2008:17.
14. Cole JE, Georgiou E, Monaco C. The expression and functions ofToll-like receptors in atherosclerosis. Mediators Inflamm. 2010;2010:393946.
15. Re F, Strominger JL. Toll-like receptor 2 (TLR2) and TLR4 differ-entially activate human dendritic cells. J Biol Chem. 2001;276:37692–37699.
16. Means TK, Wang S, Lien E, Yoshimura A, Golenbock DT, FentonMJ. Human toll-like receptors mediate cellular activation by Myco-bacterium tuberculosis. J Immunol. 1999;163:3920–3927.
17. Brightbill HD, Libraty DH, Krutzik SR, et al. Host defense mecha-nisms triggered by microbial lipoproteins through toll-like recep-tors. Science. 1999;285:732–736.
18. Noss EH, Pai RK, Sellati TJ, et al. Toll-like 2-dependent inhibition ofmacrophage class II MHC expression and antigen processing by19-kDa lipoprotein of Mycobacterium tuberculosis. J Immunol.2001;167:910–918.
19. Means TK, Lien E, Yoshimura A, Wang S, Golenbock DT, FentonMJ. The CD14 ligands lipoarabinomannan and lipopolysaccharidediffer in their requirement for Toll-like receptors. J Immunol.1999;163:6748–6755.
20. Gordon S. Pattern recognition receptors, doubling up for theinnate immune response. Cell. 2002;111:927–930.
21. Passlick B, Flinger D, Ziegler-Heitbrock HWL. Identification andcharacterization of a novel monocyte subpopulation in humanperipheral blood. Blood. 1989;74:2527–2534.
22. Wang SV, Mak KL, Chen LY, Chou MP, Ho CK. Heterogeneity ofhuman blood monocytes: two subpopulations with different size,phenotypes and functions. Immunology. 1992;77:298–303.
IOVS, August 2011, Vol. 52, No. 9 Toll-like Receptor in Eales’ Disease 6947
Downloaded From: http://iovs.arvojournals.org/pdfaccess.ashx?url=/data/journals/iovs/933460/ on 08/22/2017
23. Ziegler-Heitbrock L. The CD14� CD16� blood monocytes: theirrole in infection and inflammation. J Leukoc Biol. 2007;81:584–592.
24. Skinner NA, Maclsaac CM. Hamilton JA, Visvanathan K. Regulationof Toll-like receptor (TLR)2 and TLR4 on CD14dimCD16� mono-cytes in response to sepsis-related antigens. Clin Exp Immunol.2005;141:270–278.
25. Sen A, Paine SK, Chowdhury IH, et al. Impact of IL-6 promoterpolymorphism and serum IL-6 level on acute inflammation andneovascularization stage of patients with Eales’ disease. Mol Vis. Inpress.
26. Saxena S, Pant AB, Khanna VK, et al. Tumor necrosis factor-�-mediated severity of idiopathic retinal periphlebitis in youngadults (Eales’ disease): implication for anti-TNF-� therapy. J OculBiol Dis Infor. 2010;3:35–38.
27. Belge KU, Dayyani F, Horelt A, et al. The proinflammatory CD14(�) CD16 (�) DR (��) monocytes are a major source of TNFJ Immunol. 2002;168:3536–3542.
28. Szaflarskaa A, Baj-Krzyworzekaa M, Siedlara M, et al. Antitumorresponse of CD14�/CD16� monocyte subpopulation. Exp Hema-tol. 2004;32:748–755.
29. Kawanaka N, Yamamura M, Aita T, et al. CD14�, CD16� bloodmonocytes and joint inflammation in rheumatoid arthritis. Arthri-tis Rheum. 2002;46:2578–2586.
30. Ancuta P, Rao R, Moses A, et al. Fractalkine preferentially mediatesarrest and migration of CD16� monocytes. J Exp Med. 2003;16;197:1701–1707.
31. Steppich B, Dayyani F, Gruber R, Lorenz R, Mack M, Ziegler-Heitbrock HW. Selective mobilization of CD14�CD16� monocytesby exercise. Am J Physiol Cell Physiol. 2000;279:C578–C586.
32. Auffray C, Fogg D, Garfa M, et al. Monitoring of blood vessels andtissues by a population of monocytes with patrolling behavior.Science. 2007;317:666–670.
33. Ancuta P, Wang J, Gabuzda D. CD16� monocytes produce IL-6, CCL2,and matrix metalloproteinase-9 upon interaction with CX3CL1-expressing endothelial cells. J Leukoc Biol. 2006;80:1156–1164.
34. Sen A, Paine SK, Chowdhury IH, et al. Association of interferon-gamma, interleukin-10, and tumor necrosis factor-alpha gene poly-morphisms with occurrence and severity of Eales’ disease. InvestOphthalmol Vis Sci. 2011;52:171–178.
35. Sen A, Paine SK, Chowdhury IH, et al. Assessment of gelatinaseand tumor necrosis factor-� level in the vitreous and serum ofpatients with Eales disease: role of inflammation-mediated an-giogenesis in the pathogenesis of Eales disease. Retina. 2011;31:1412–1420.
36. Saxena S, Pant AB, Khanna VK, et al. Interleukin-1 and tu-mor necrosis factor-alpha: novel targets for immunotherapyin Eales disease. Ocul Immunol Inflamm. 2009;17:201-206.
37. Zhu SN, Dana MR. Expression of cell adhesion molecules onlimbal and neovascular endothelium in corneal inflammatoryneovascularization. Invest Ophthalmol Vis Sci. 1999;40:1427–1434.
38. Kilmartin B, Reen DJ. HSP60 induces self-tolerance to repeatedHSP60 stimulation and cross-tolerance to other pro-inflammatorystimuli. Eur J Immunol. 2004;34:2041–2051.
39. Sato S, Nomura F, Kawai T, et al. Synergy and cross-tolerancebetween Toll-like receptor (TLR)2 and TLR4-mediated signalingpathways. J Immunol. 2000;165:7096–7102.
6948 Sen et al. IOVS, August 2011, Vol. 52, No. 9
Downloaded From: http://iovs.arvojournals.org/pdfaccess.ashx?url=/data/journals/iovs/933460/ on 08/22/2017