Etude Adobe : Les pratiques des internautes de nos jours
24
e State of Content: Expectations on the Rise October 2015
-
Upload
frederic-zugaj -
Category
Internet
-
view
136 -
download
2
Transcript of Etude Adobe : Les pratiques des internautes de nos jours
The State of Content: Expectations on the RiseOctober 2015
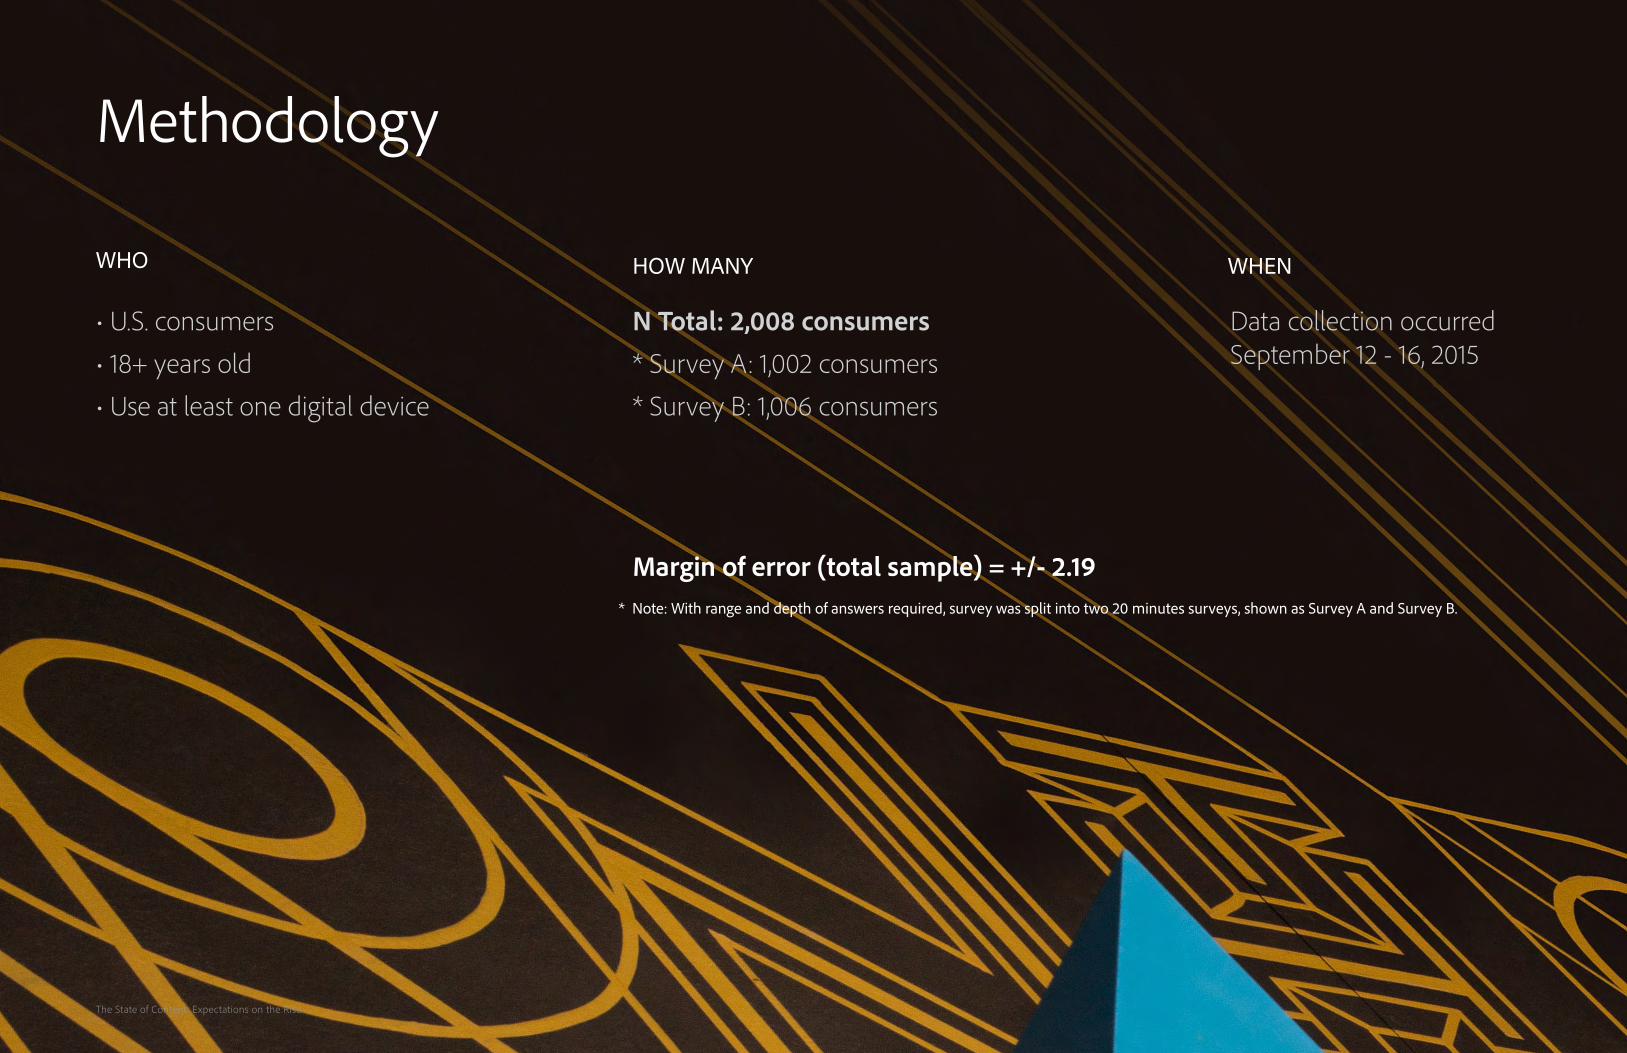
Methodology
• U.S. consumers
• 18+ years old
• Use at least one digital device
N Total: 2,008 consumers* Survey A: 1,002 consumers
* Survey B: 1,006 consumers
Data collection occurredSeptember 12 - 16, 2015
WHO HOW MANY WHEN
Margin of error (total sample) = +/- 2.19* Note: With range and depth of answers required, survey was split into two 20 minutes surveys, shown as Survey A and Survey B.
The State of Content: Expectations on the Rise
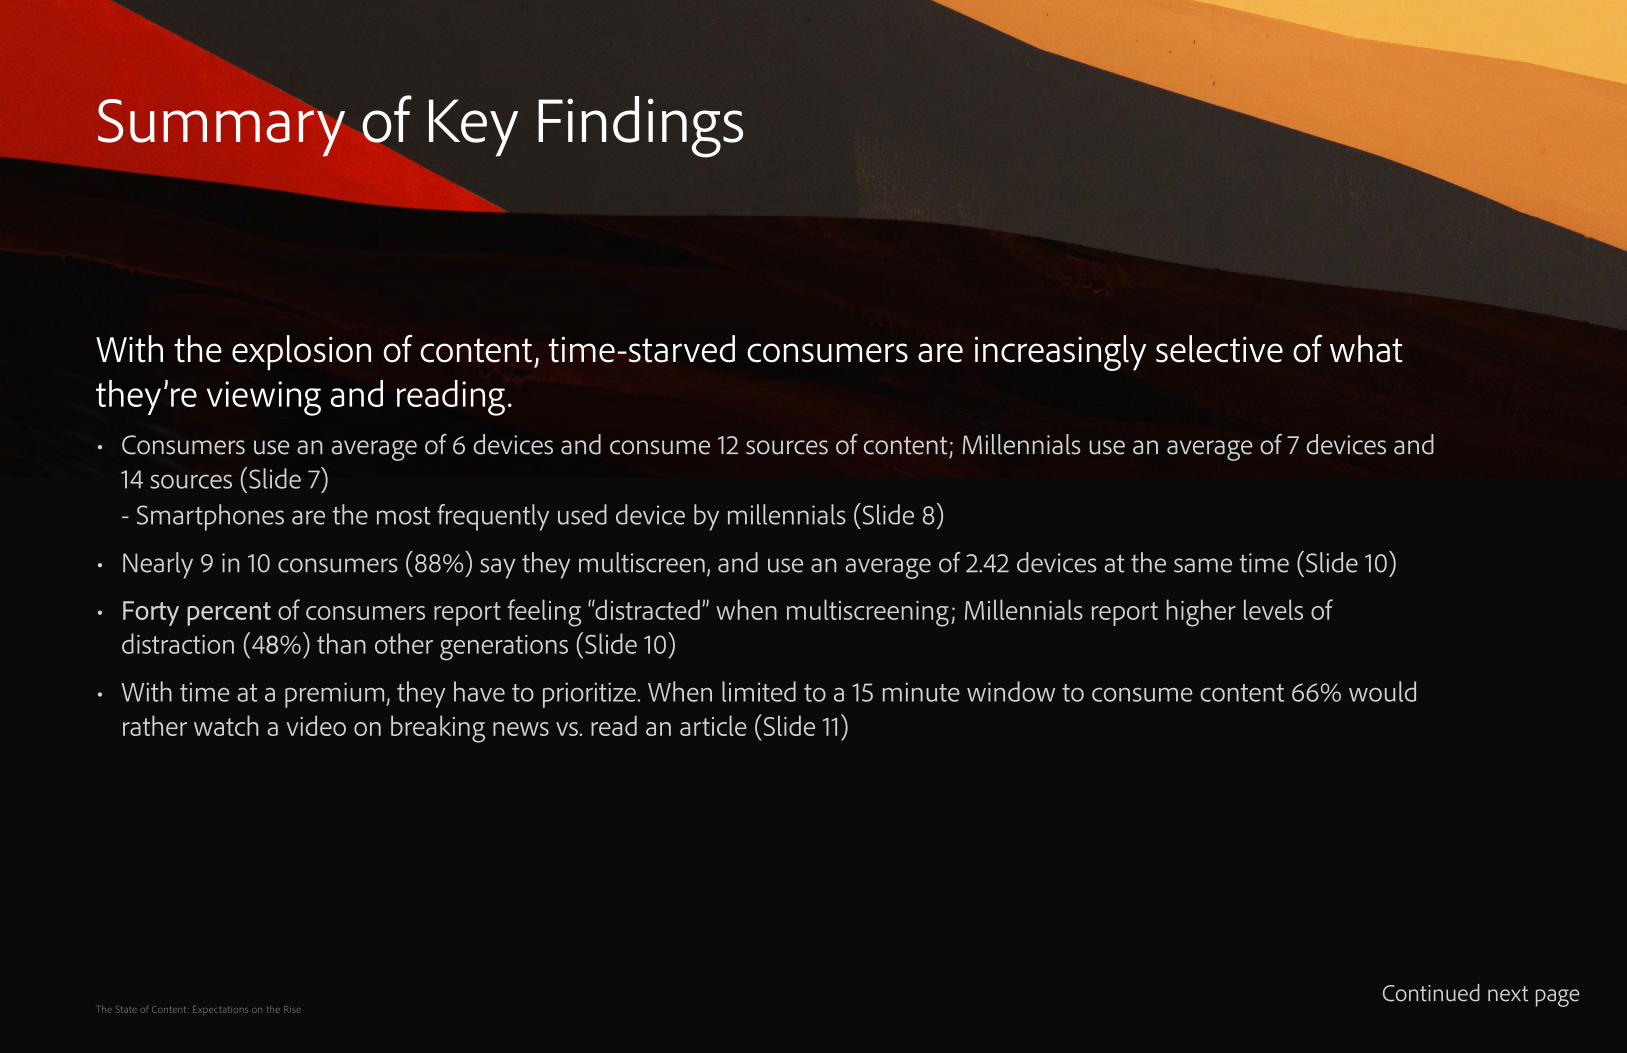
With the explosion of content, time-starved consumers are increasingly selective of what they’re viewing and reading.• Consumers use an average of 6 devices and consume 12 sources of content; Millennials use an average of 7 devices and
14 sources (Slide 7)- Smartphones are the most frequently used device by millennials (Slide 8)
• Nearly 9 in 10 consumers (88%) say they multiscreen, and use an average of 2.42 devices at the same time (Slide 10)
• Forty percent of consumers report feeling “distracted” when multiscreening; Millennials report higher levels of distraction (48%) than other generations (Slide 10)
• With time at a premium, they have to prioritize. When limited to a 15 minute window to consume content 66% would rather watch a video on breaking news vs. read an article (Slide 11)
Summary of Key Findings
The State of Content: Expectations on the RiseContinued next page
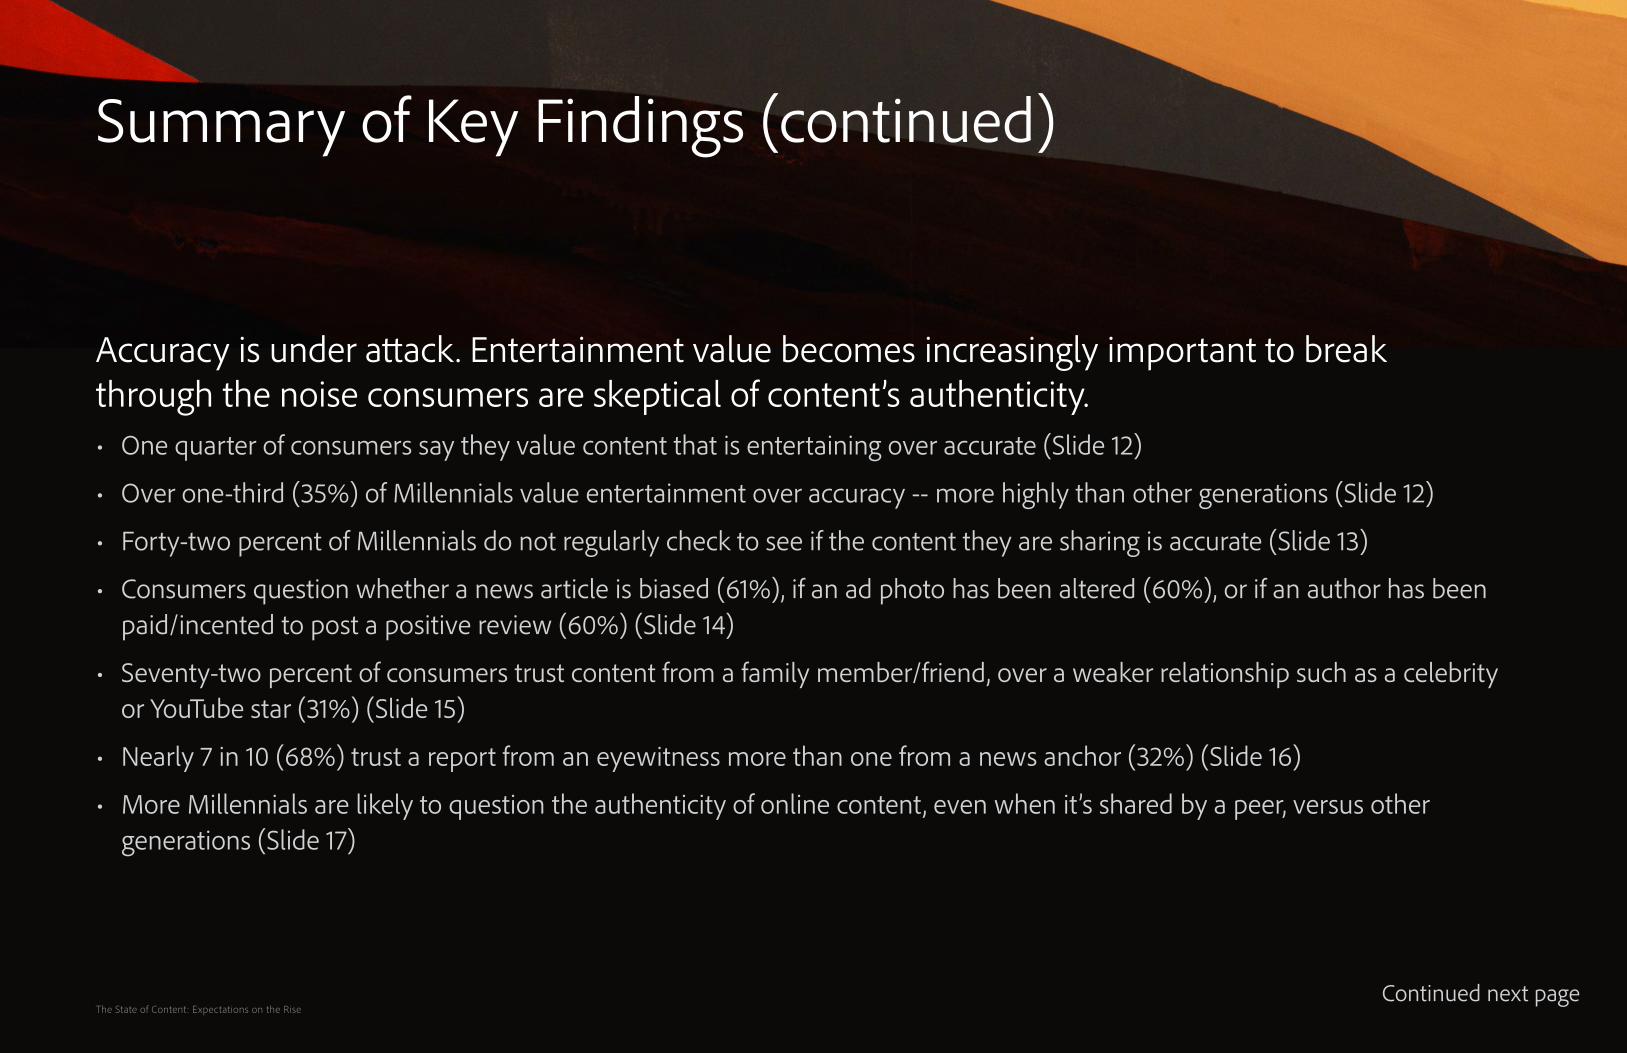
Accuracy is under attack. Entertainment value becomes increasingly important to break through the noise consumers are skeptical of content’s authenticity. • One quarter of consumers say they value content that is entertaining over accurate (Slide 12)
• Over one-third (35%) of Millennials value entertainment over accuracy -- more highly than other generations (Slide 12)
• Forty-two percent of Millennials do not regularly check to see if the content they are sharing is accurate (Slide 13)
• Consumers question whether a news article is biased (61%), if an ad photo has been altered (60%), or if an author has beenpaid/incented to post a positive review (60%) (Slide 14)
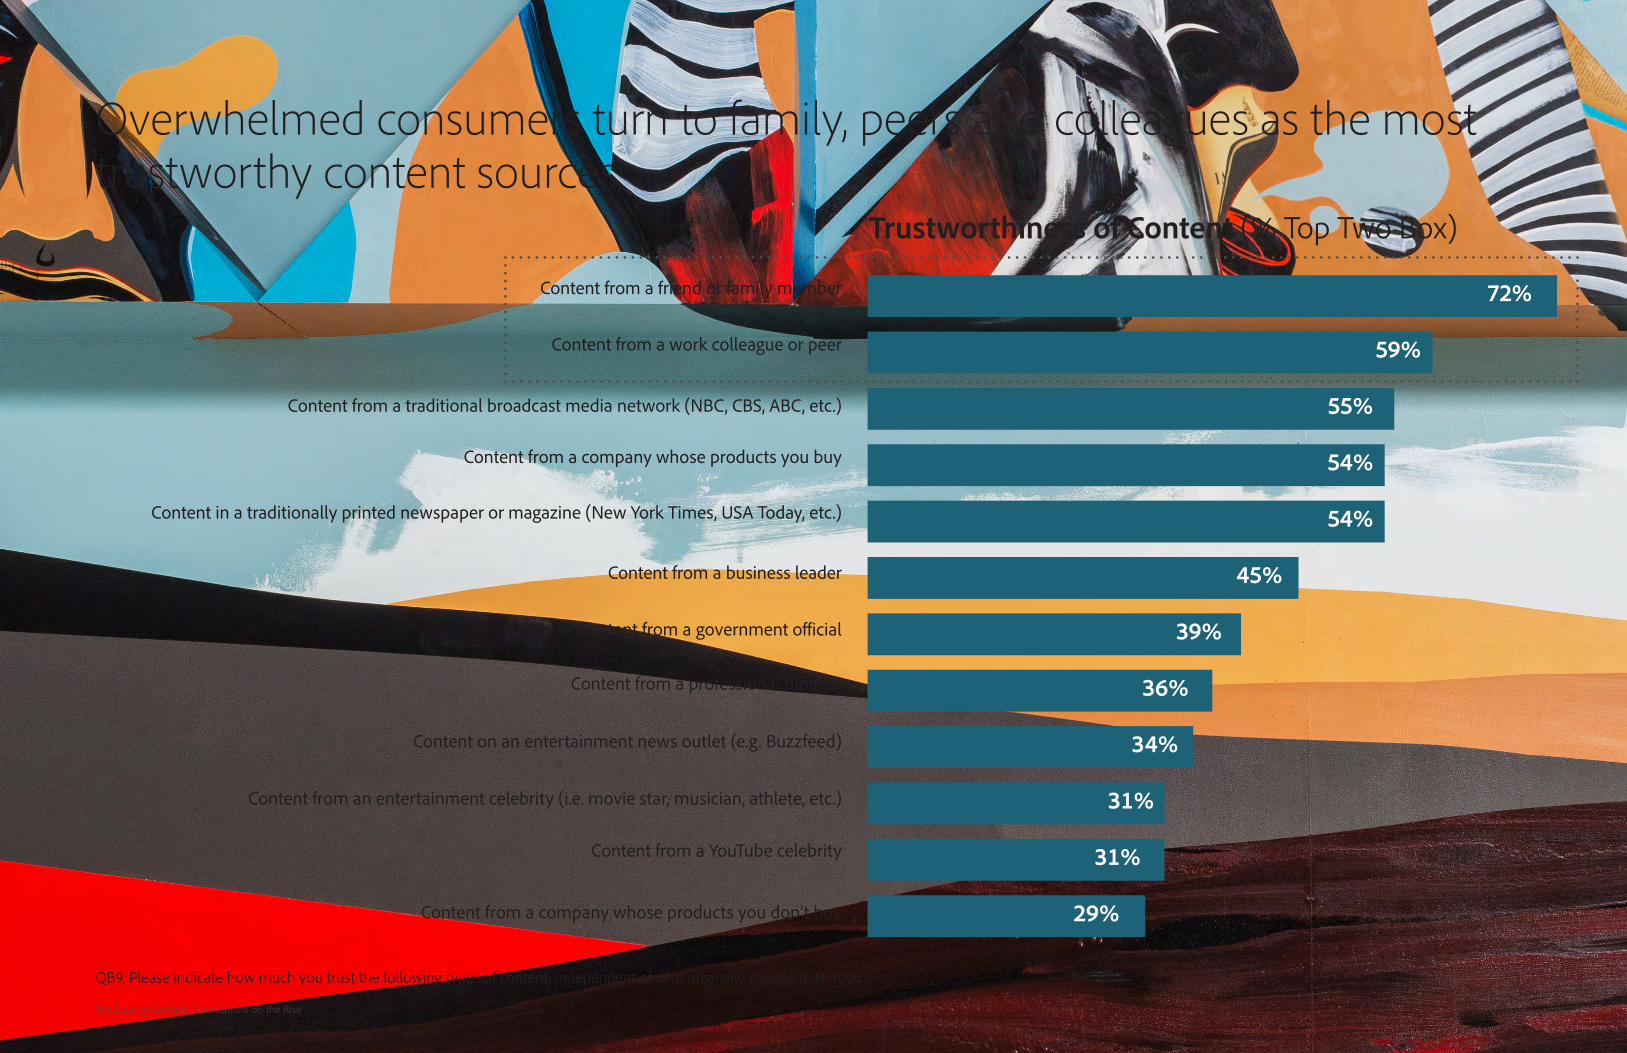
• Seventy-two percent of consumers trust content from a family member/friend, over a weaker relationship such as a celebrityor YouTube star (31%) (Slide 15)
• Nearly 7 in 10 (68%) trust a report from an eyewitness more than one from a news anchor (32%) (Slide 16)
• More Millennials are likely to question the authenticity of online content, even when it’s shared by a peer, versus othergenerations (Slide 17)
Summary of Key Findings (continued)
The State of Content: Expectations on the RiseContinued next page
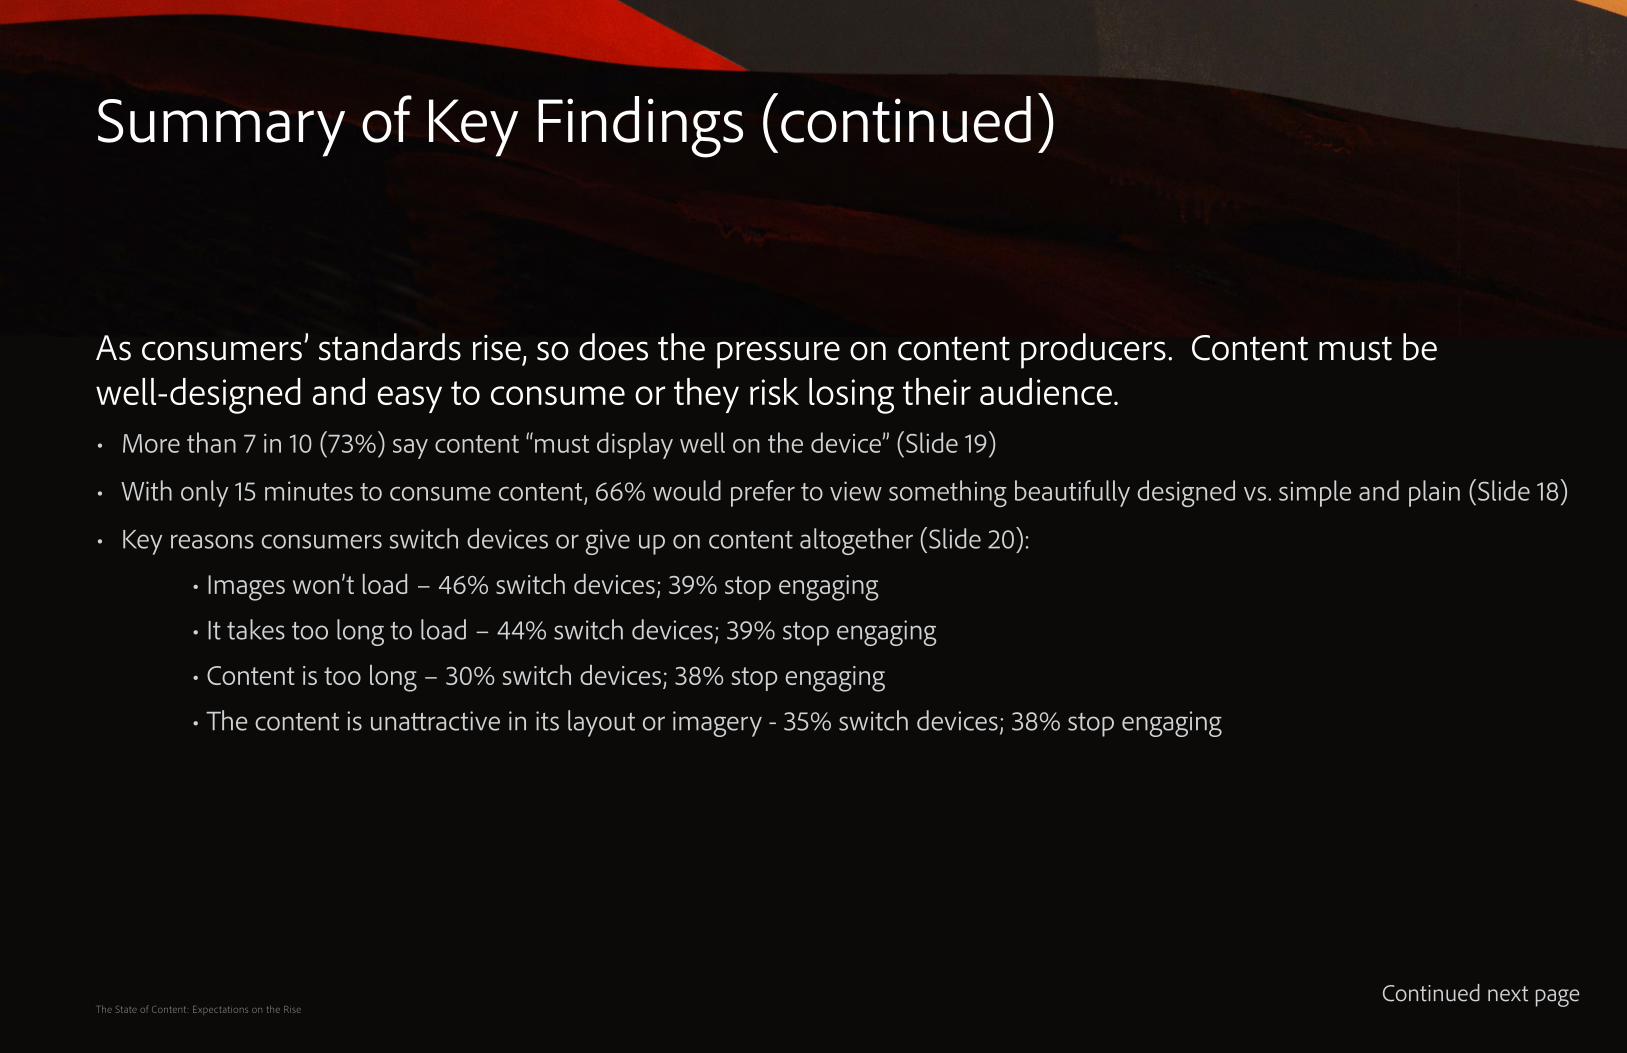
As consumers’ standards rise, so does the pressure on content producers. Content must be well-designed and easy to consume or they risk losing their audience. • More than 7 in 10 (73%) say content “must display well on the device” (Slide 19)
• With only 15 minutes to consume content, 66% would prefer to view something beautifully designed vs. simple and plain (Slide 18)
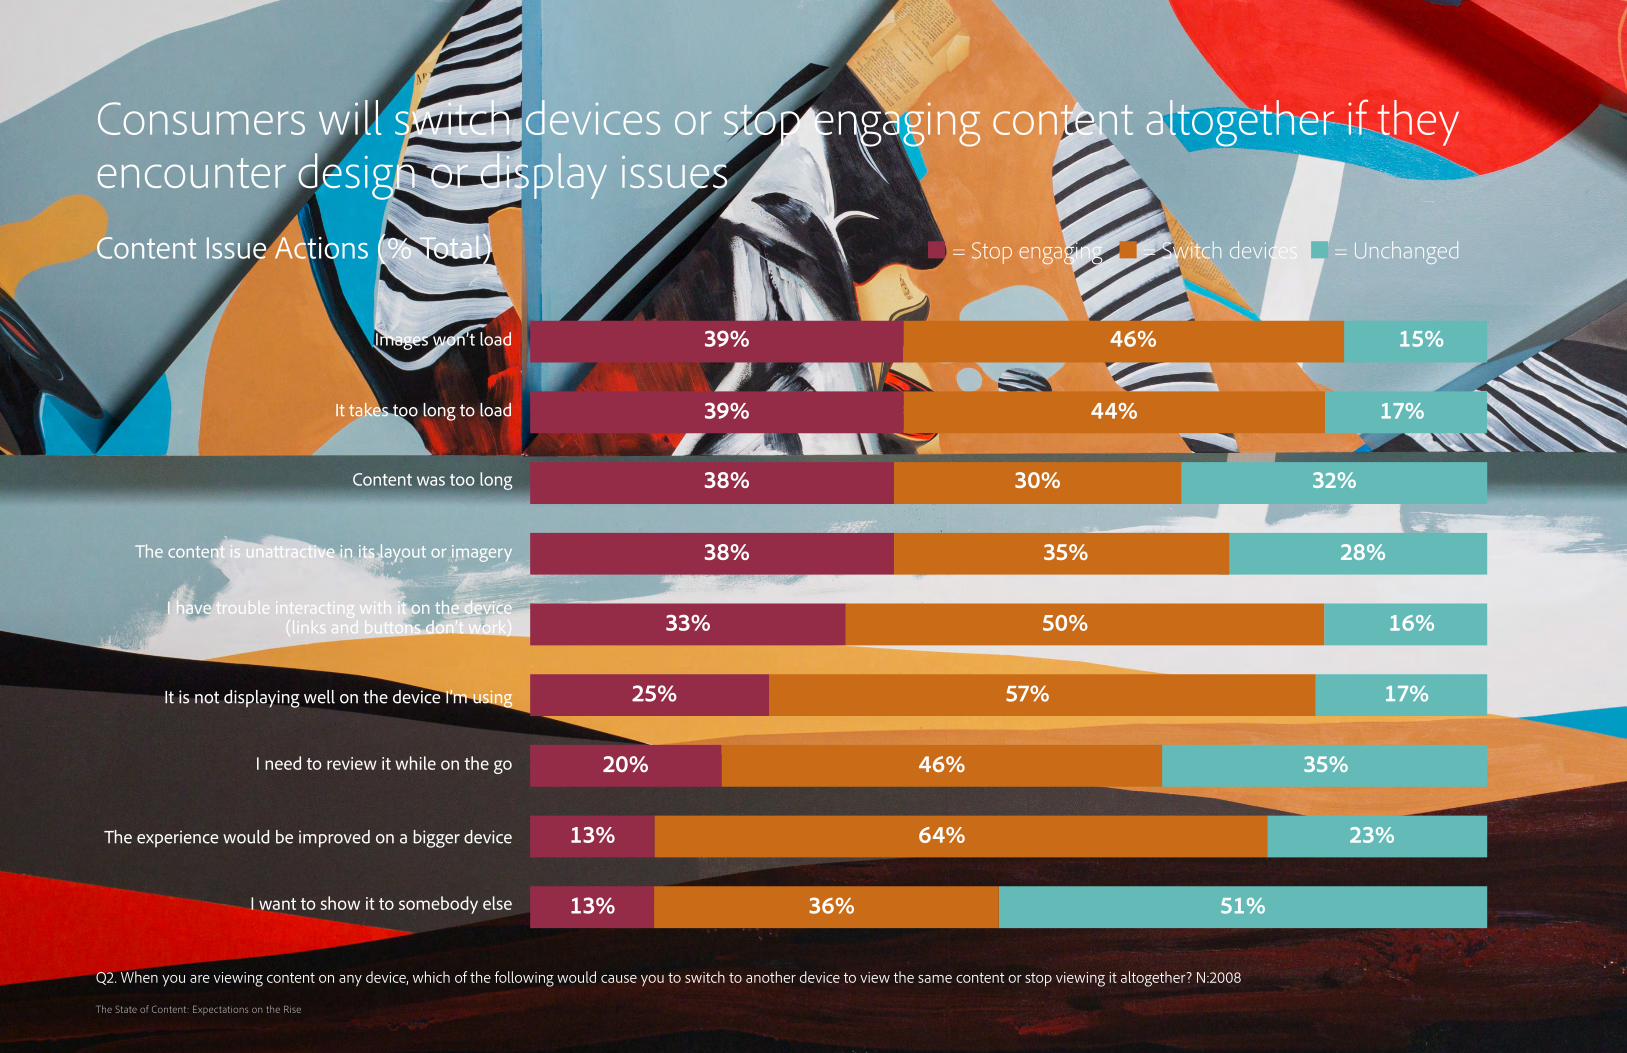
• Key reasons consumers switch devices or give up on content altogether (Slide 20):
• Images won’t load – 46% switch devices; 39% stop engaging
• It takes too long to load – 44% switch devices; 39% stop engaging
• Content is too long – 30% switch devices; 38% stop engaging
• The content is unattractive in its layout or imagery - 35% switch devices; 38% stop engaging
Summary of Key Findings (continued)
The State of Content: Expectations on the RiseContinued next page

Detailed Findings
The State of Content: Expectations on the Rise

Consumers use an average of 6 devices and 12 sources of content. Millennials use even more.
Consumers are constantly plugged in and face an explosion of online content across a variety of devices and sources
6
12 12
9
14
76
4
Total Millennials Gen X Baby Boomers
= Device = Source of Content
Average Number of Devices and Sources of Content
S4: How frequently, if ever, do you use each of the following devices and services? Rounded mean of devices/services selected shown. N: 2008; Millennials: 678, Gen X: 722, BB: 608 Note: Devices include items such as smartphones, laptop/desktop computers, TVs, and sources of content include search engines, cable/satellite TV service, social networking site, text messaging and more.
The State of Content: Expectations on the Rise
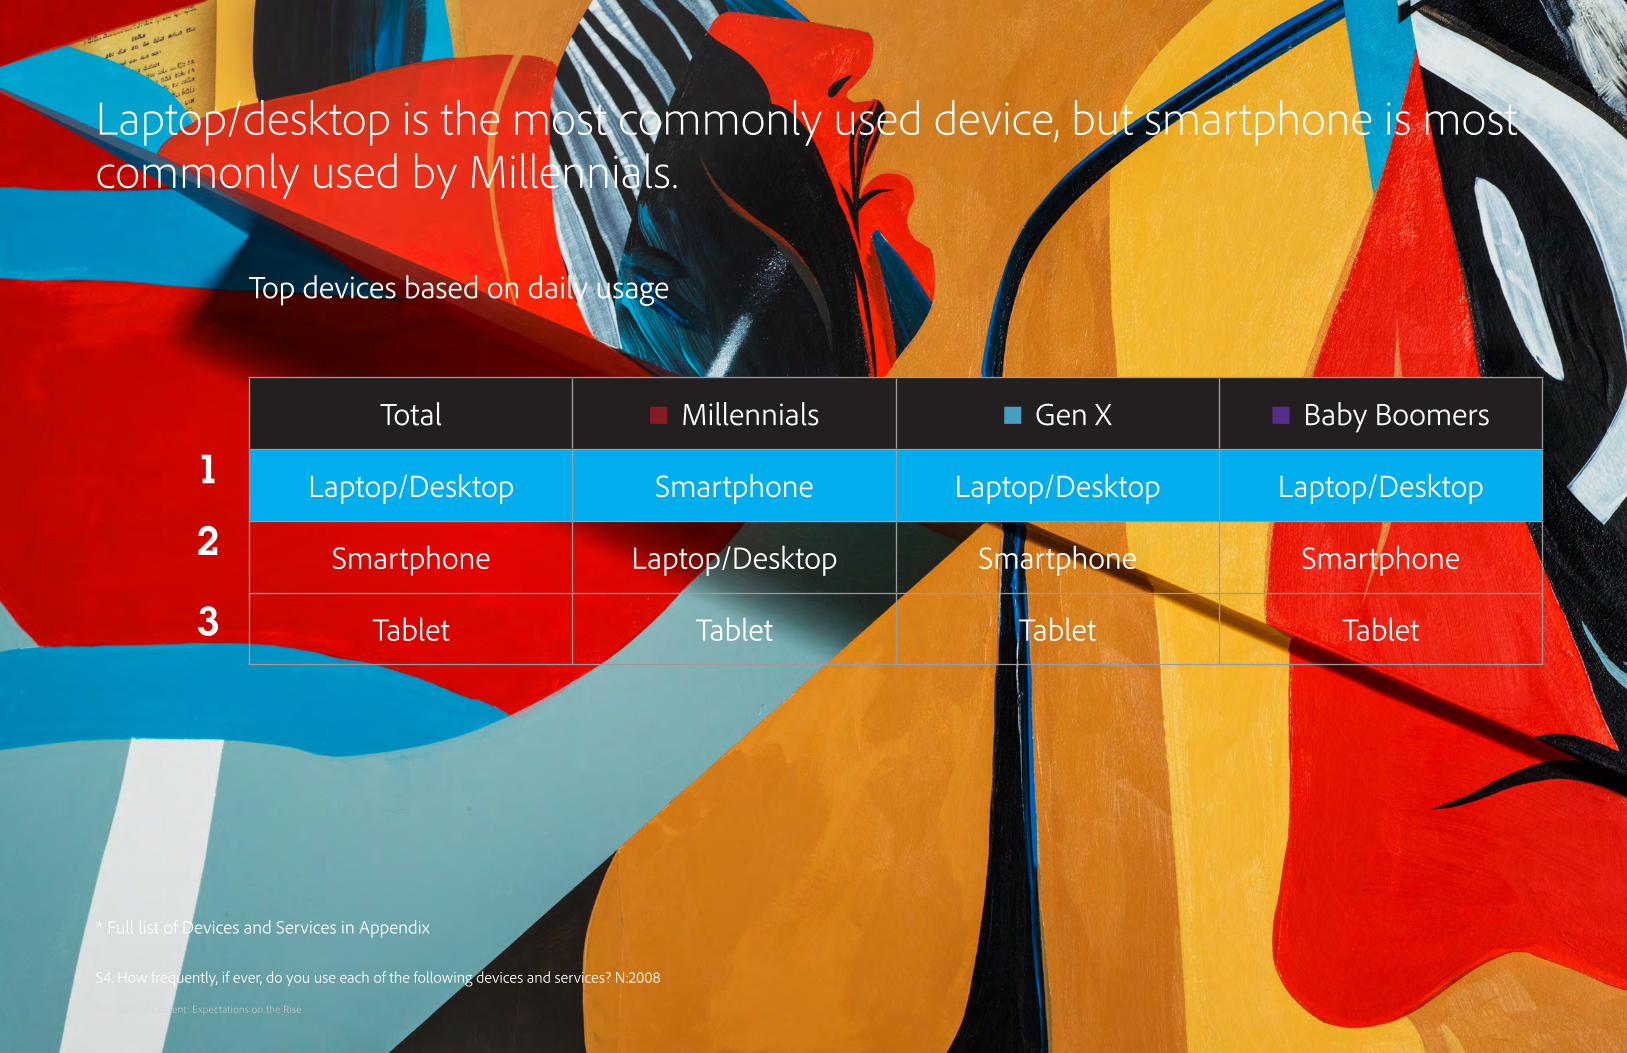
Laptop/desktop is the most commonly used device, but smartphone is most commonly used by Millennials.
Top devices based on daily usage
S4. How frequently, if ever, do you use each of the following devices and services? N:2008
Total Millennials Gen X Baby Boomers
Laptop/Desktop Smartphone Laptop/Desktop Laptop/Desktop
Smartphone Laptop/Desktop Smartphone Smartphone
Tablet Tablet Tablet Tablet
1
3
2
* Full list of Devices and Services in Appendix
The State of Content: Expectations on the Rise
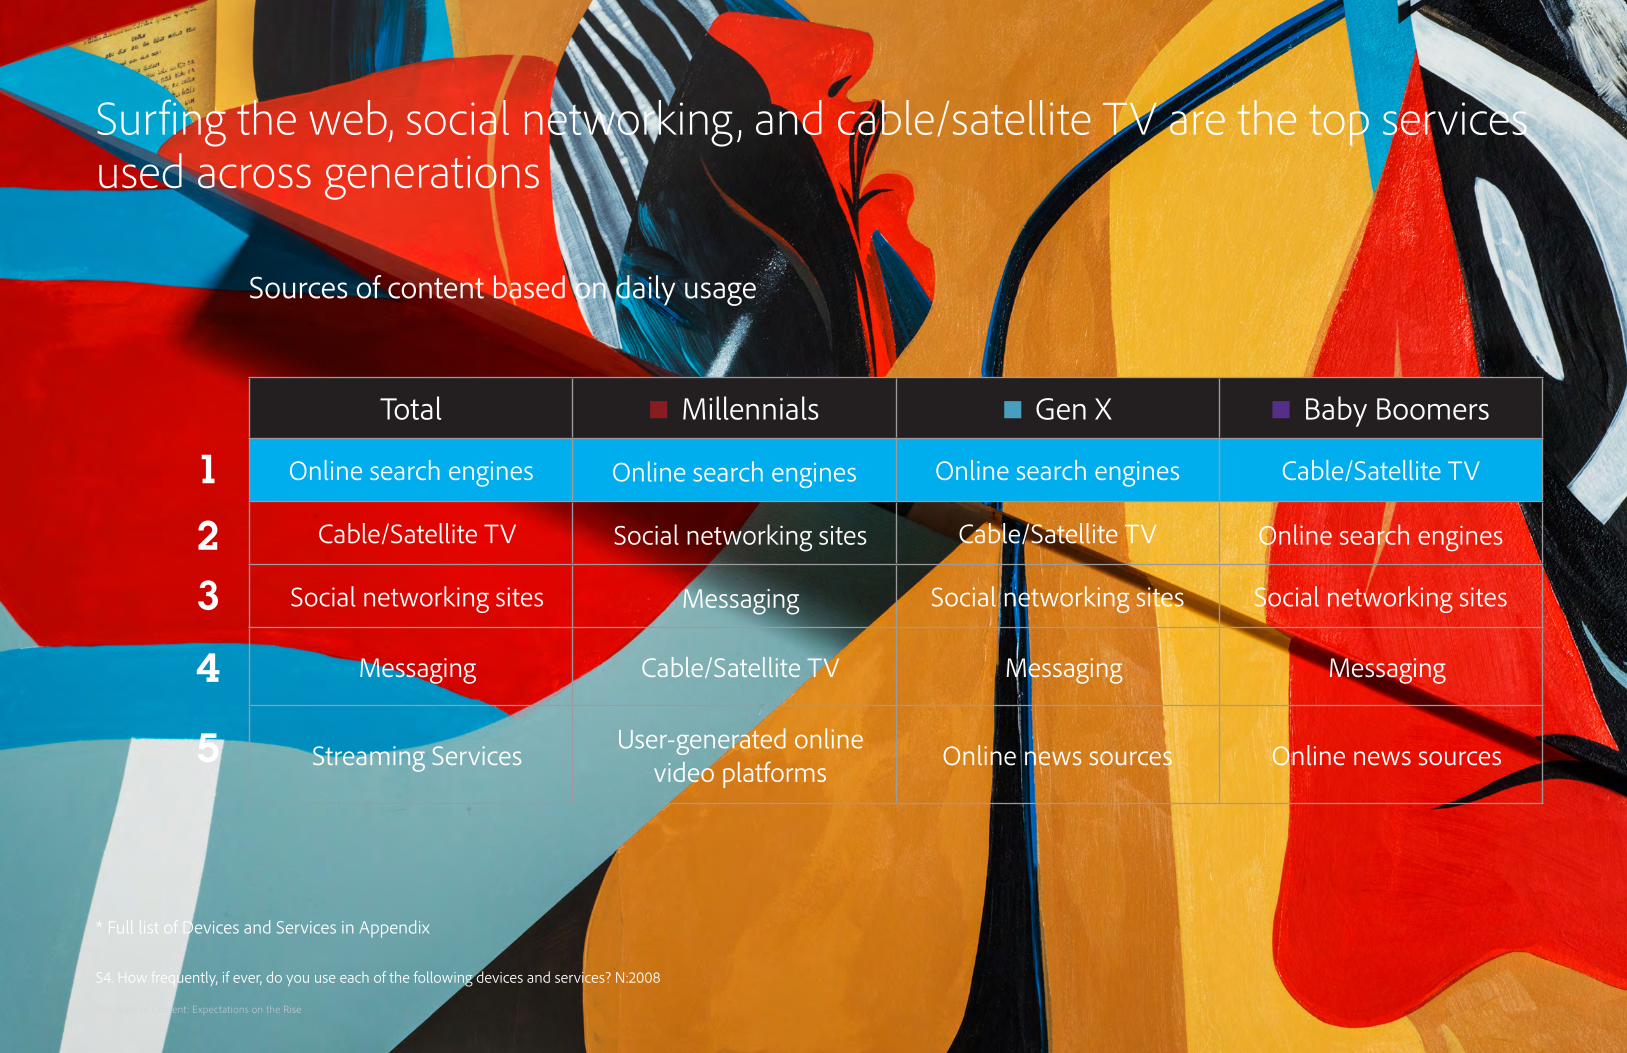
Surfing the web, social networking , and cable/satellite TV are the top services used across generations
Sources of content based on daily usage
S4. How frequently, if ever, do you use each of the following devices and services? N:2008
* Full list of Devices and Services in Appendix
Total Millennials Gen X Baby Boomers
Online search engines Online search engines Online search engines Cable/Satellite TV
Cable/Satellite TV Social networking sites Cable/Satellite TV Online search engines
Social networking sites Messaging Social networking sites Social networking sites
Messaging Cable/Satellite TV Messaging Messaging
Streaming Services User-generated online video platforms Online news sources Online news sources
The State of Content: Expectations on the Rise
1
23
4
5
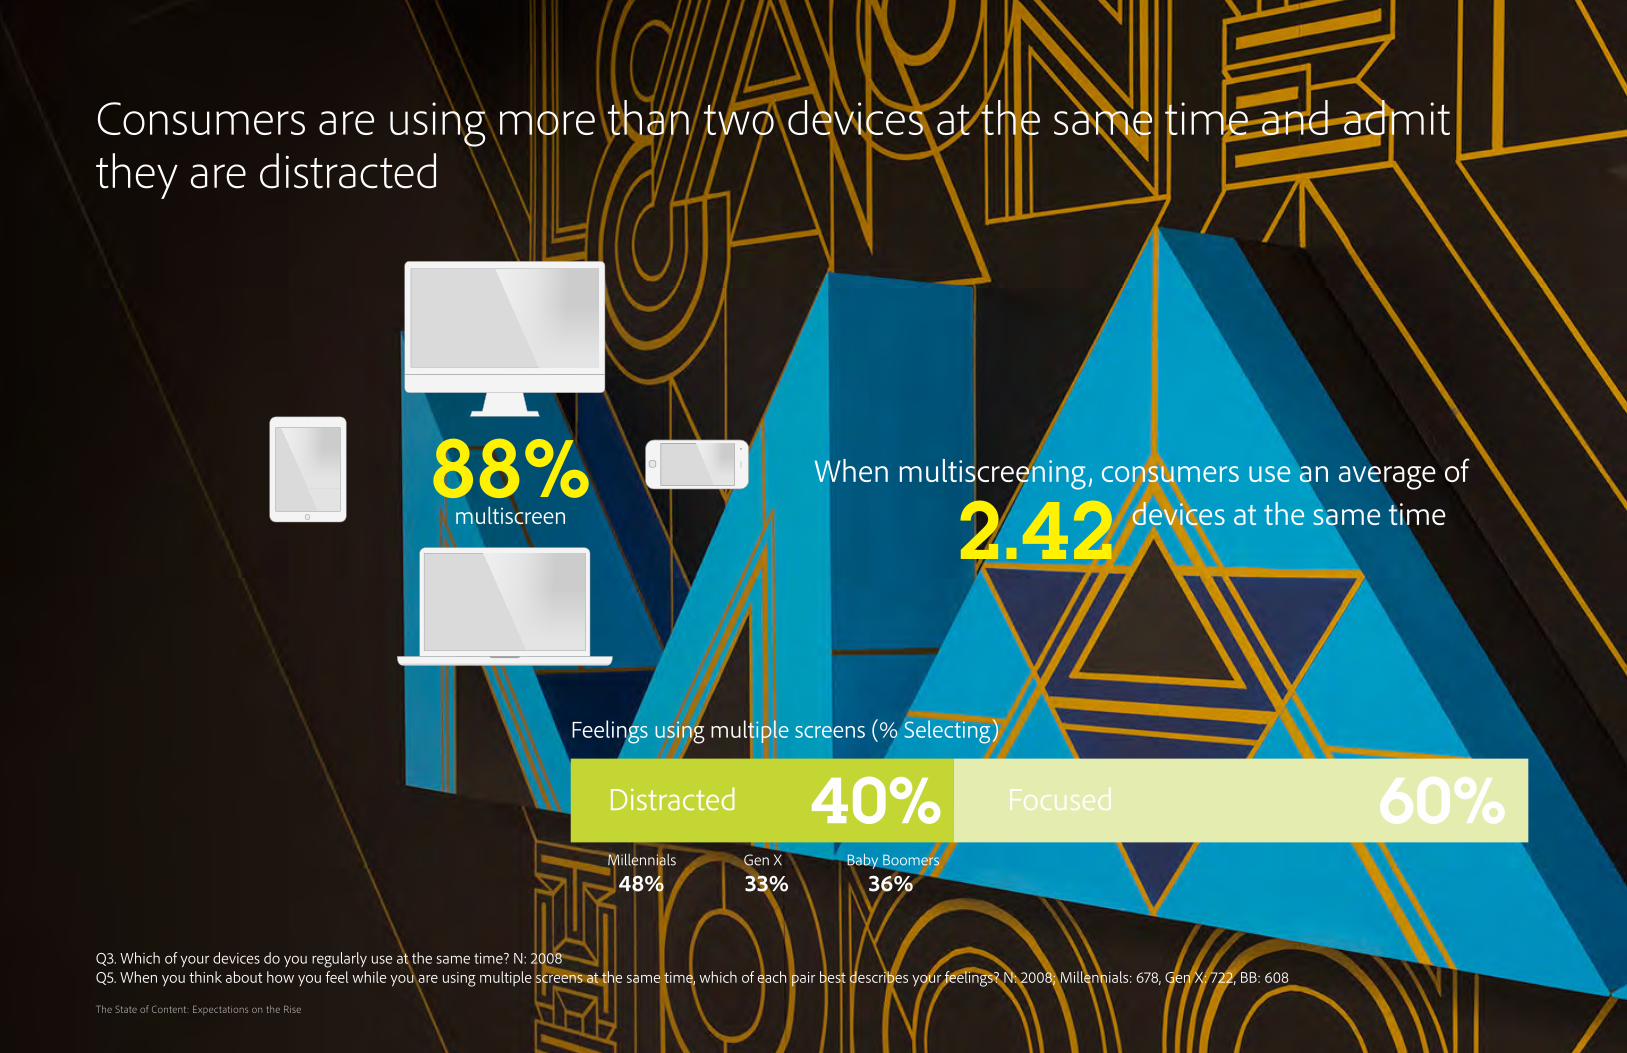
When multiscreening, consumers use an average of devices at the same time
Consumers are using more than two devices at the same time and admit they are distracted
Feelings using multiple screens (% Selecting)
Q3. Which of your devices do you regularly use at the same time? N: 2008Q5. When you think about how you feel while you are using multiple screens at the same time, which of each pair best describes your feelings? N: 2008; Millennials: 678, Gen X: 722, BB: 608
2.42
FocusedDistracted
48% 33% 36%Millennials Gen X Baby Boomers
40% 60%
multiscreen88%
The State of Content: Expectations on the Rise
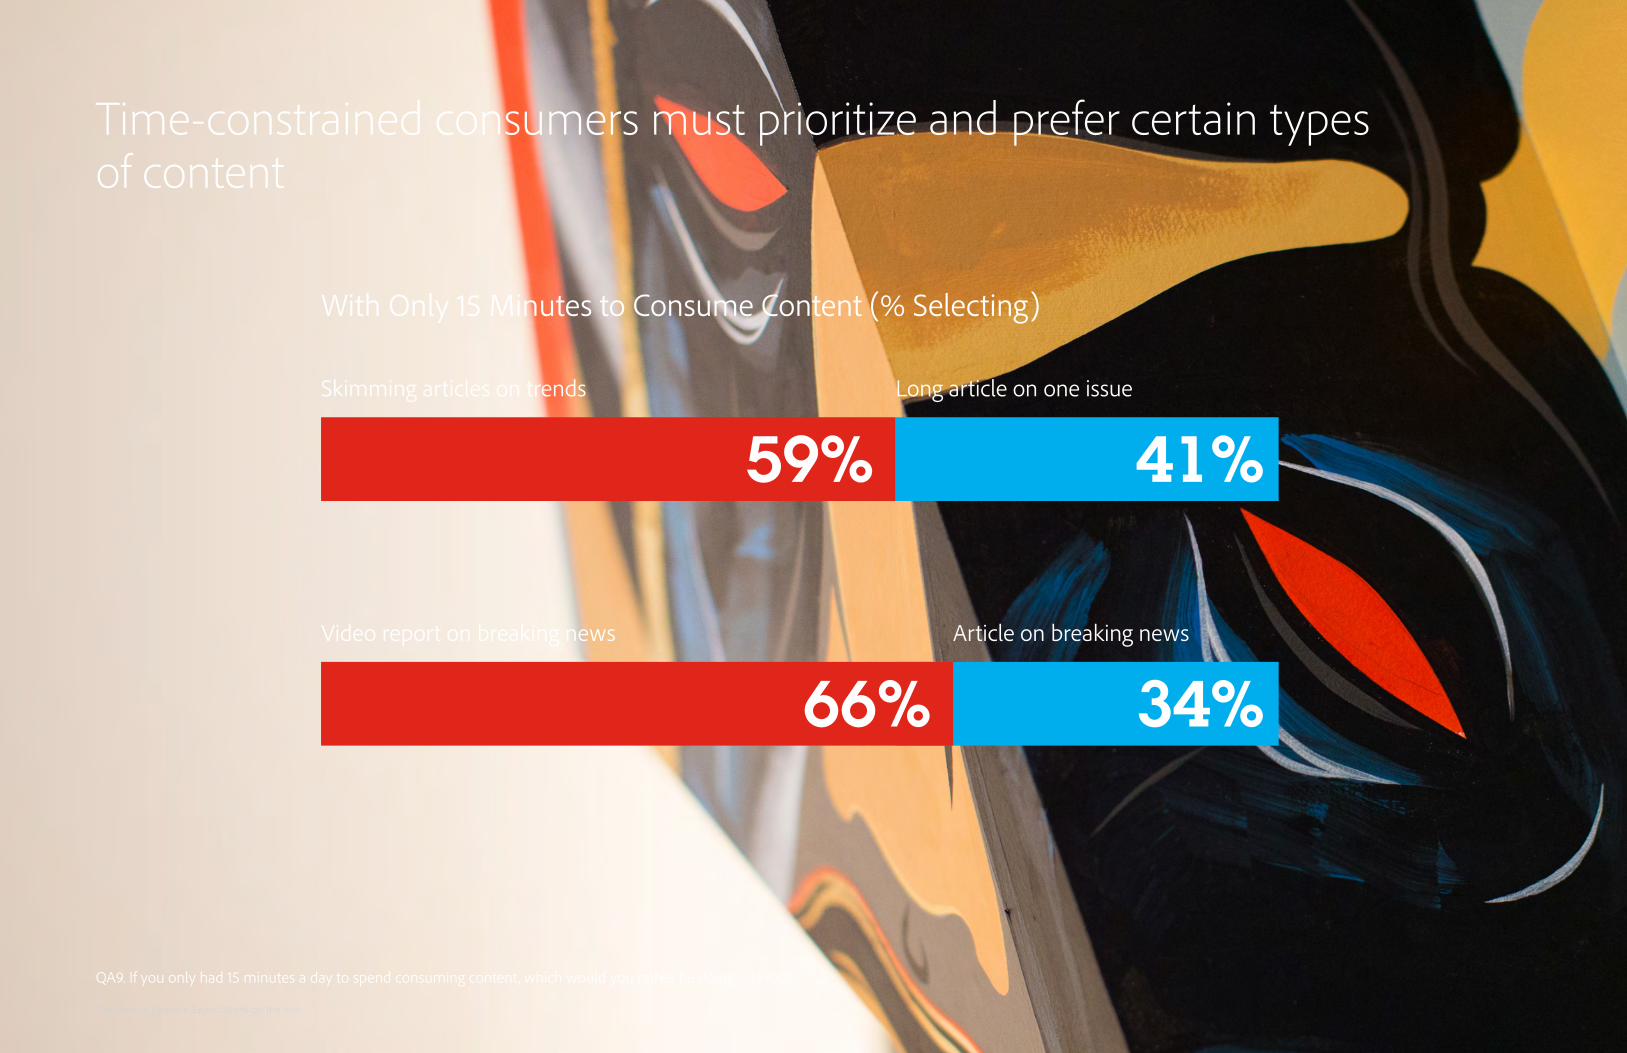
Time-constrained consumers must prioritize and prefer certain types of content
Skimming articles on trends
Video report on breaking news
Long article on one issue
Article on breaking news
With Only 15 Minutes to Consume Content (% Selecting)
QA9. If you only had 15 minutes a day to spend consuming content, which would you rather be doing… N:1002
41%
34%
59%
66%
The State of Content: Expectations on the Rise
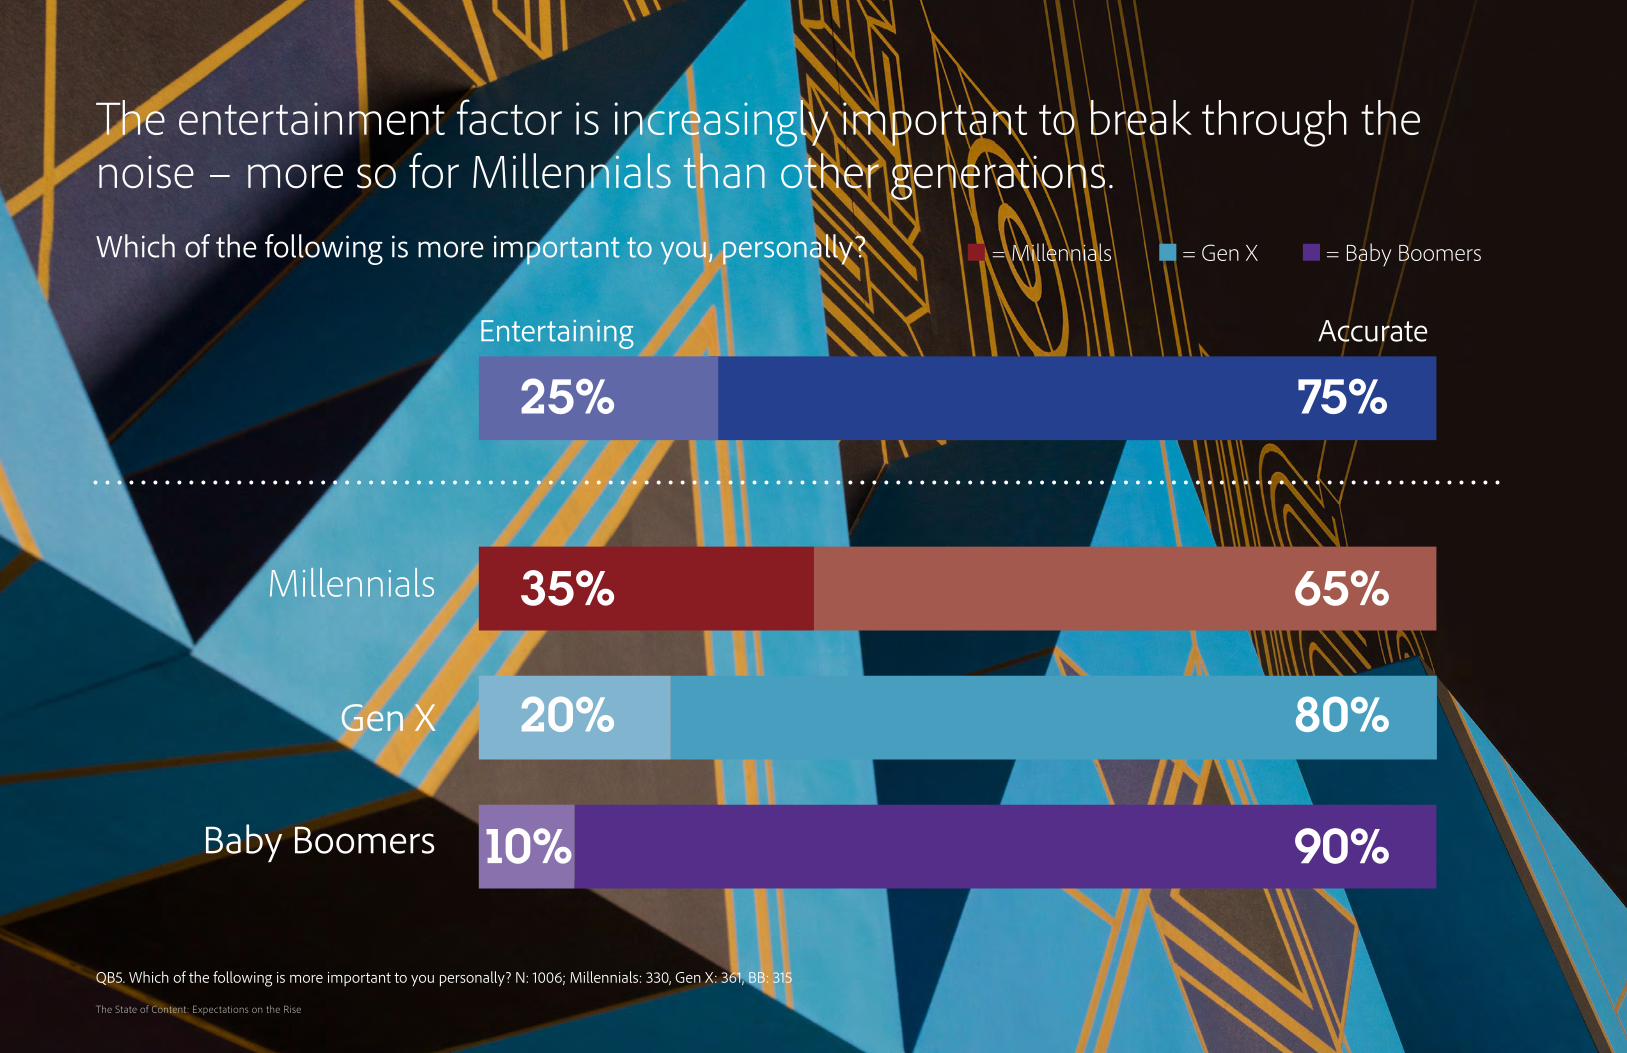
The entertainment factor is increasingly important to break through the noise – more so for Millennials than other generations.
Entertaining Accurate
Which of the following is more important to you, personally?
QB5. Which of the following is more important to you personally? N: 1006; Millennials: 330, Gen X: 361, BB: 315
25%
65%
80%
90%
75%
35%
20%
10%
Millennials
Gen X
Baby Boomers
= Millennials = Gen X = Baby Boomers
The State of Content: Expectations on the Rise
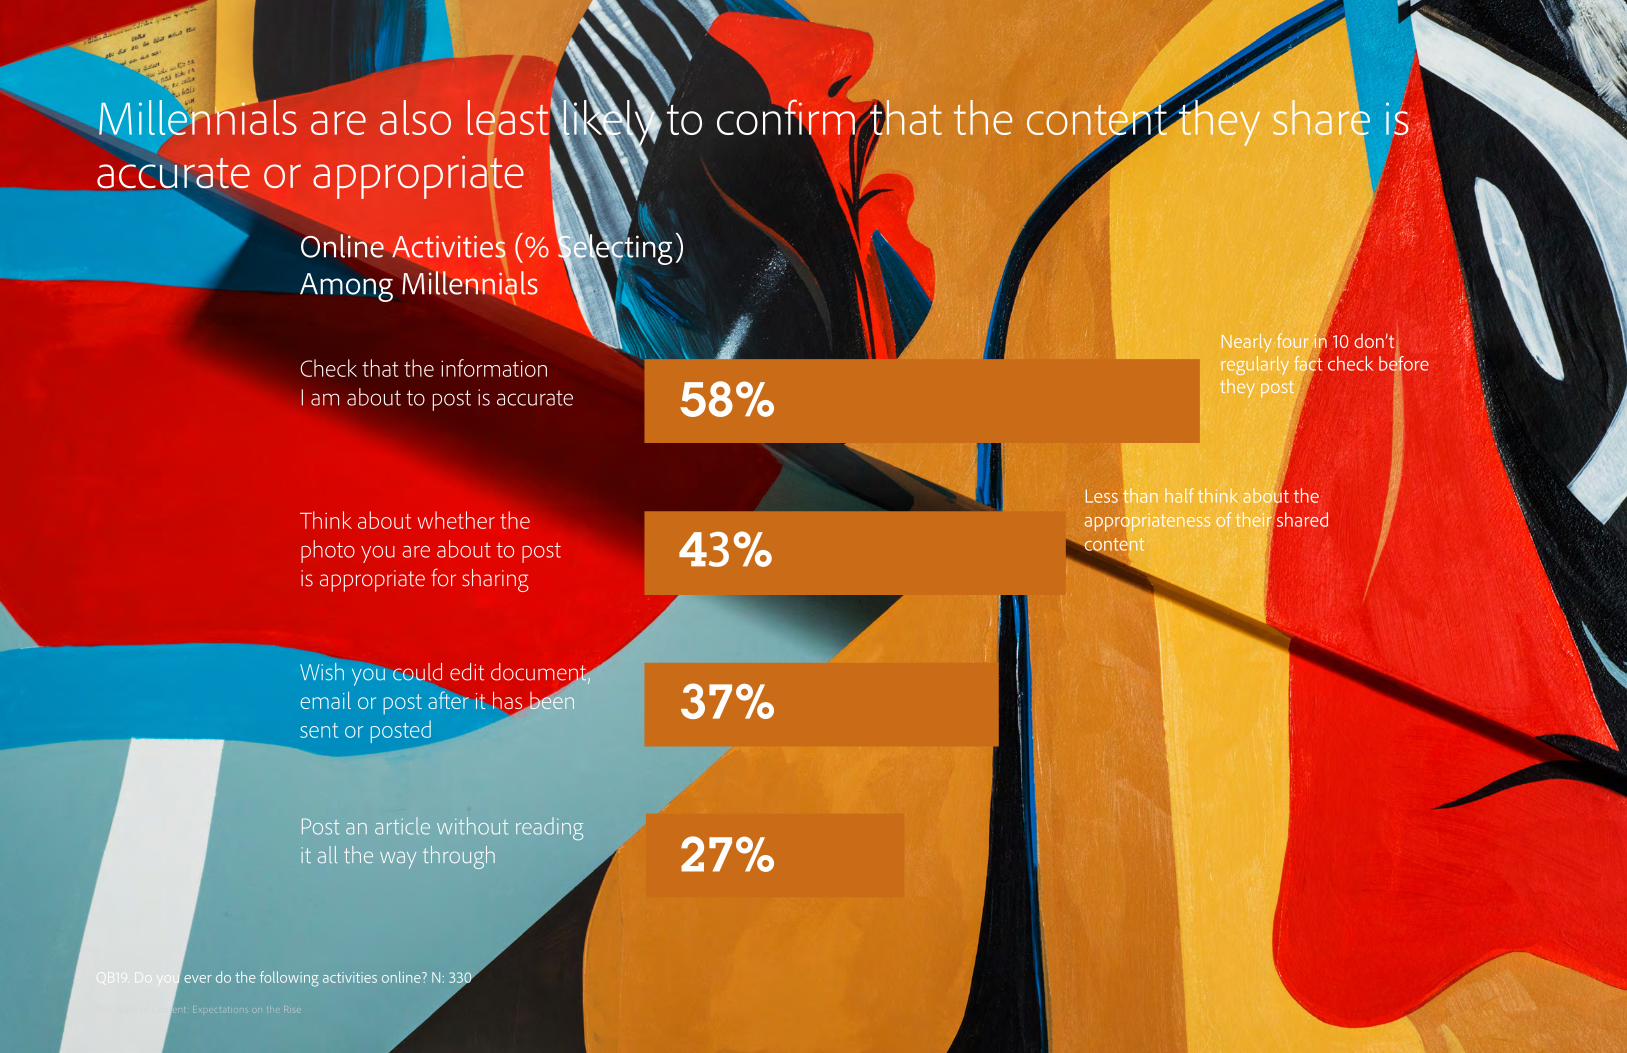
Millennials are also least likely to confirm that the content they share is accurate or appropriate
Online Activities (% Selecting)Among Millennials
QB19. Do you ever do the following activities online? N: 330
43%
37%
27%
58%Check that the information I am about to post is accurate
Think about whether the photo you are about to post is appropriate for sharing
Wish you could edit document, email or post after it has been sent or posted
Post an article without reading it all the way through
Nearly four in 10 don’t regularly fact check before they post
Less than half think about the appropriateness of their shared content
The State of Content: Expectations on the Rise

61%
60%
60%
58%
57%
57%
54%
53%
41%
37%
With tension between accuracy and entertainment, consumers are more skeptical and likely to question the authenticity of content
QB6. When you view the following type of content online how likely are you to question its authenticity? N: 1006
Likelihood to Question Authenticity (% Top Two Box)
Questioning whether a news article is biased
Questioning whether a photo in an ad has been altered (sizes manipulated, filters applied)
Questioning whether the author has been paid/incented to provide a positive review
Questioning whether a photo or image posted by a company has been altered (sizes manipulated, filters applied)
Questioning if unfavorable comments/reviews have been removed
Questioning whether a photo in a magazine or news article has been altered
Questioning whether a video posted by people I don’t know has been altered
Questioning whether a photo posted by people I don’t know has been altered (photo edited, filters applied)
Questioning whether a photo posted by my peers has been altered (photo edited, filters applied)
Questioning whether a video posted by my peers has been altered
Peer-created content is the least likely to be questioned
The State of Content: Expectations on the Rise
72%
59%
55%
54%
54%
45%
39%
36%
34%
31%
31%
29%
Overwhelmed consumers turn to family, peers and colleagues as the most trustworthy content sources
QB9. Please indicate how much you trust the following types of content, independent of who originally created it. N: 1006
Trustworthiness of Content (% Top Two Box)
Content from a friend or family member
Content from a work colleague or peer
Content from a traditional broadcast media network (NBC, CBS, ABC, etc.)
Content from a company whose products you buy
Content in a traditionally printed newspaper or magazine (New York Times, USA Today, etc.)
Content from a business leader
Content from a government official
Content from a professional blogger
Content from an entertainment celebrity (i.e. movie star, musician, athlete, etc.)
Content from a YouTube celebrity
Content from a company whose products you don’t buy
Content on an entertainment news outlet (e.g. Buzzfeed)
The State of Content: Expectations on the Rise
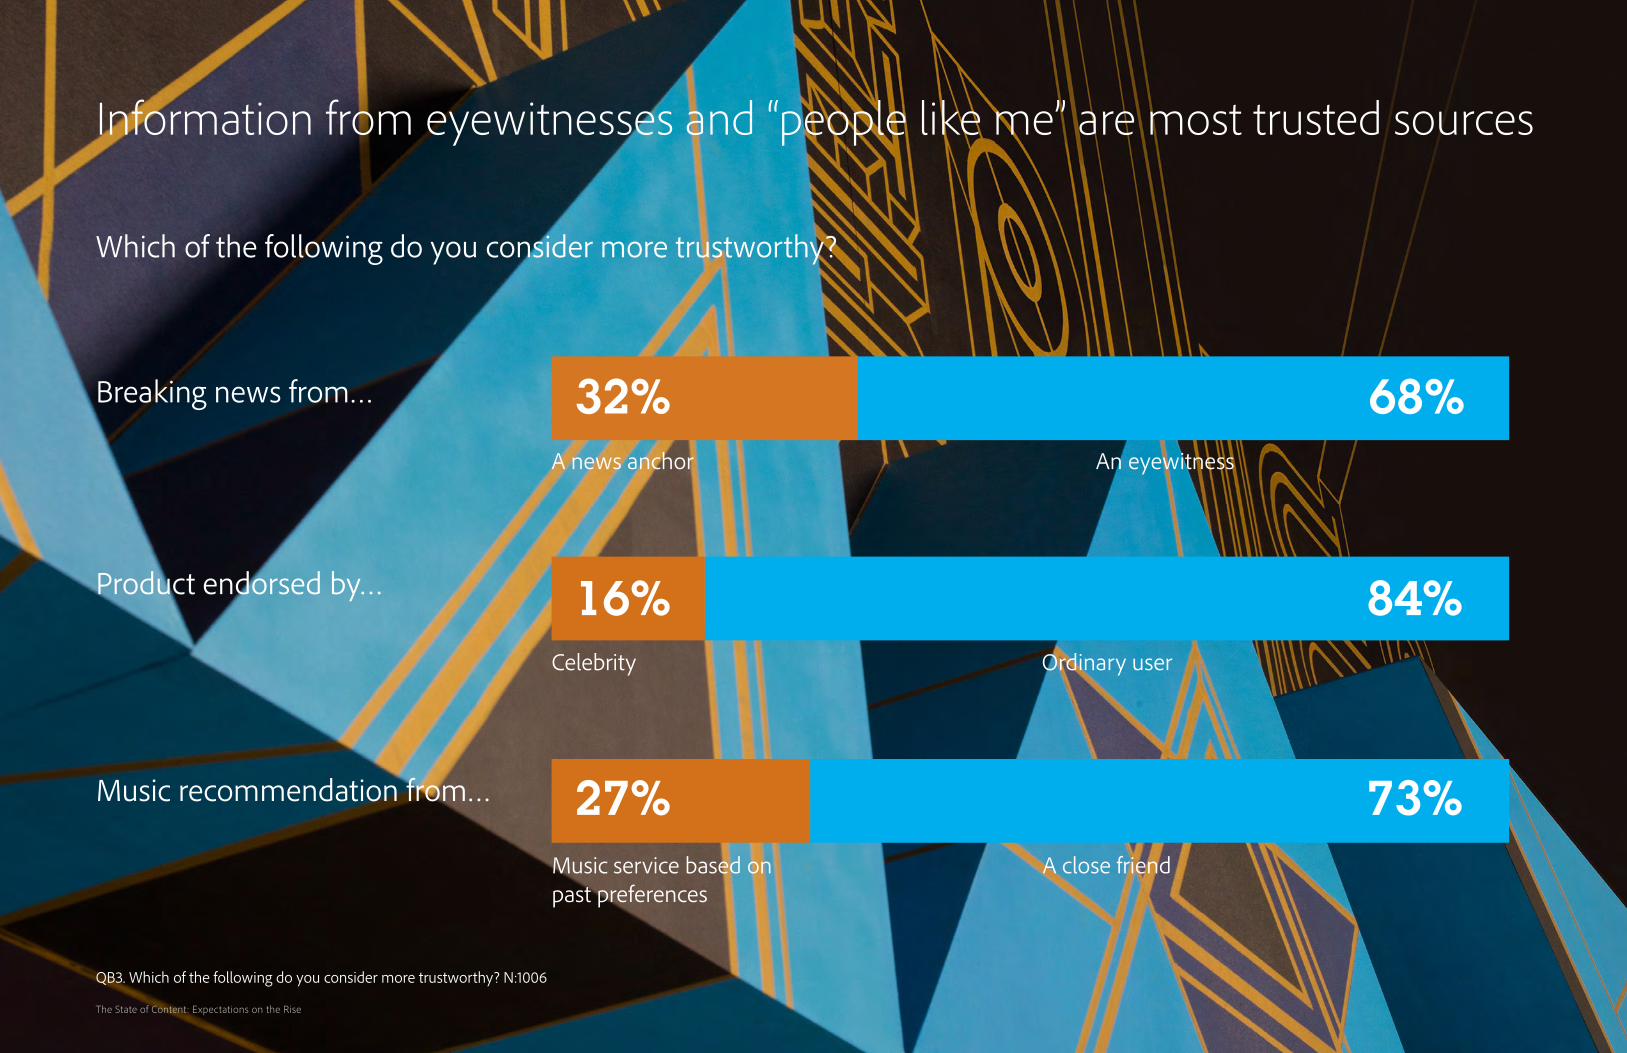
Information from eyewitnesses and “people like me” are most trusted sources
Breaking news from…
Product endorsed by…
Music recommendation from…
Which of the following do you consider more trustworthy?
QB3. Which of the following do you consider more trustworthy? N:1006
32%
84%
73%
68%
16%
27%
An eyewitness
Ordinary user
A close friend
A news anchor
Celebrity
Music service based on past preferences
The State of Content: Expectations on the Rise
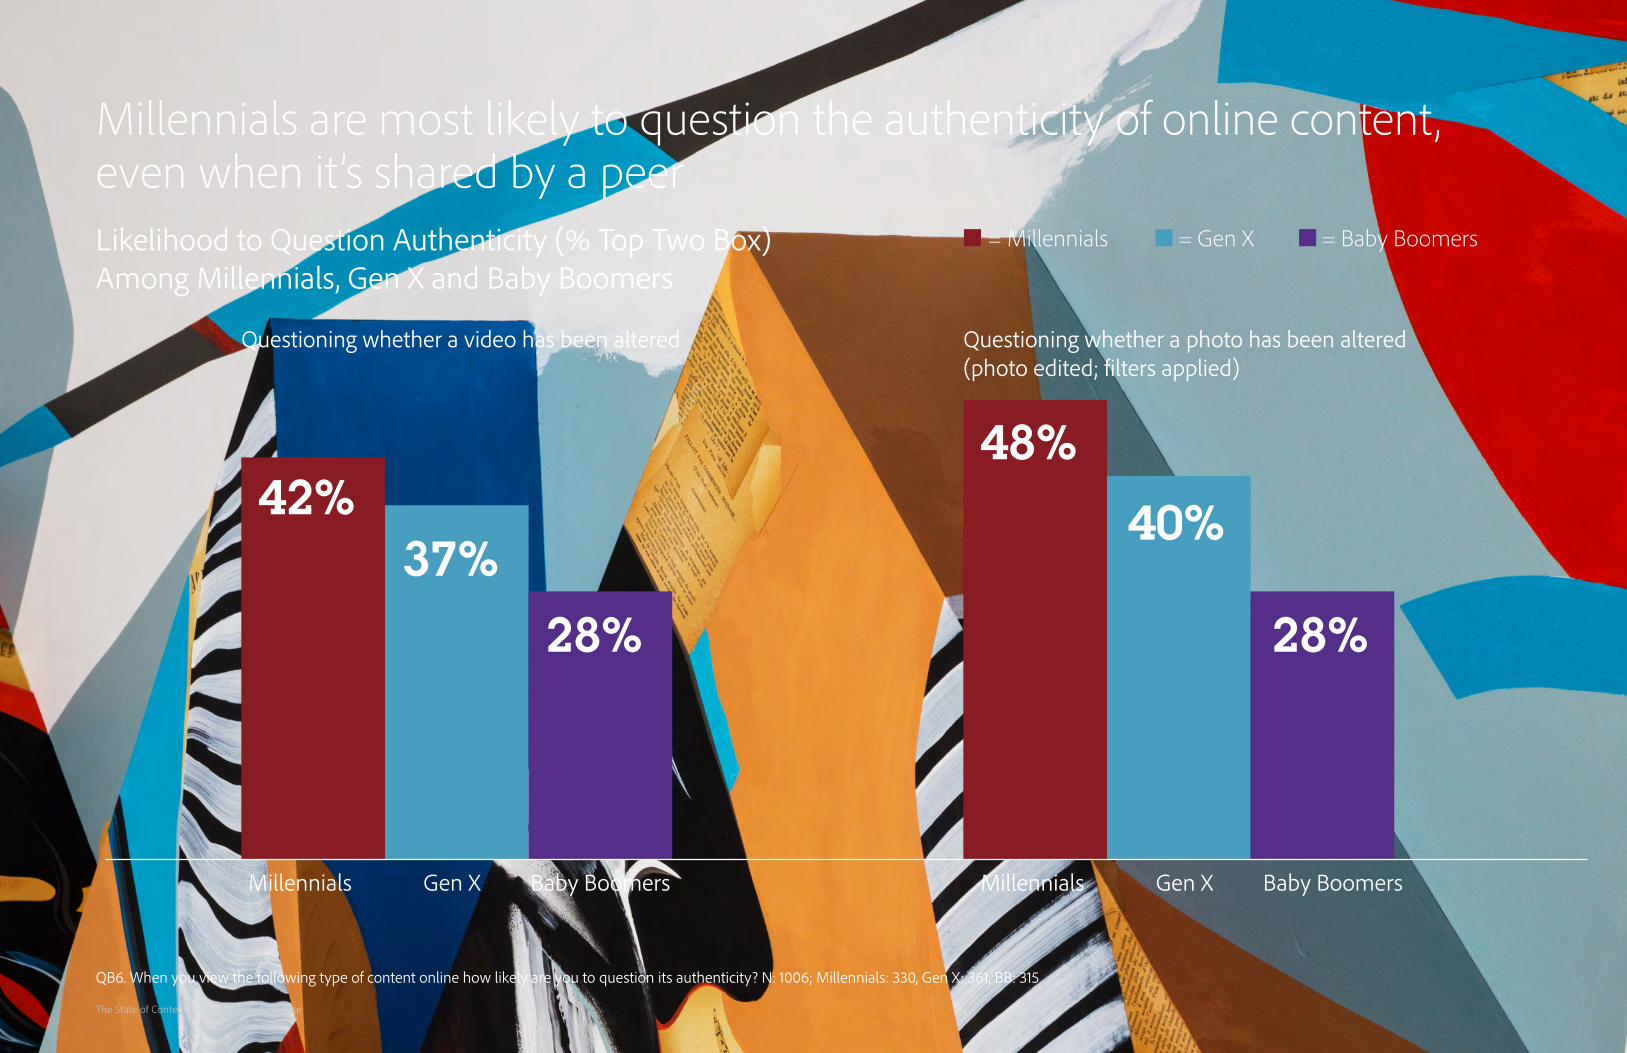
Likelihood to Question Authenticity (% Top Two Box)Among Millennials, Gen X and Baby Boomers
Millennials are most likely to question the authenticity of online content, even when it’s shared by a peer
= Millennials = Gen X = Baby Boomers
QB6. When you view the following type of content online how likely are you to question its authenticity? N: 1006; Millennials: 330, Gen X: 361, BB: 315
42%48%
37%40%
28% 28%
Millennials
Questioning whether a video has been altered Questioning whether a photo has been altered (photo edited; filters applied)
MillennialsGen X Gen XBaby Boomers Baby Boomers
The State of Content: Expectations on the Rise
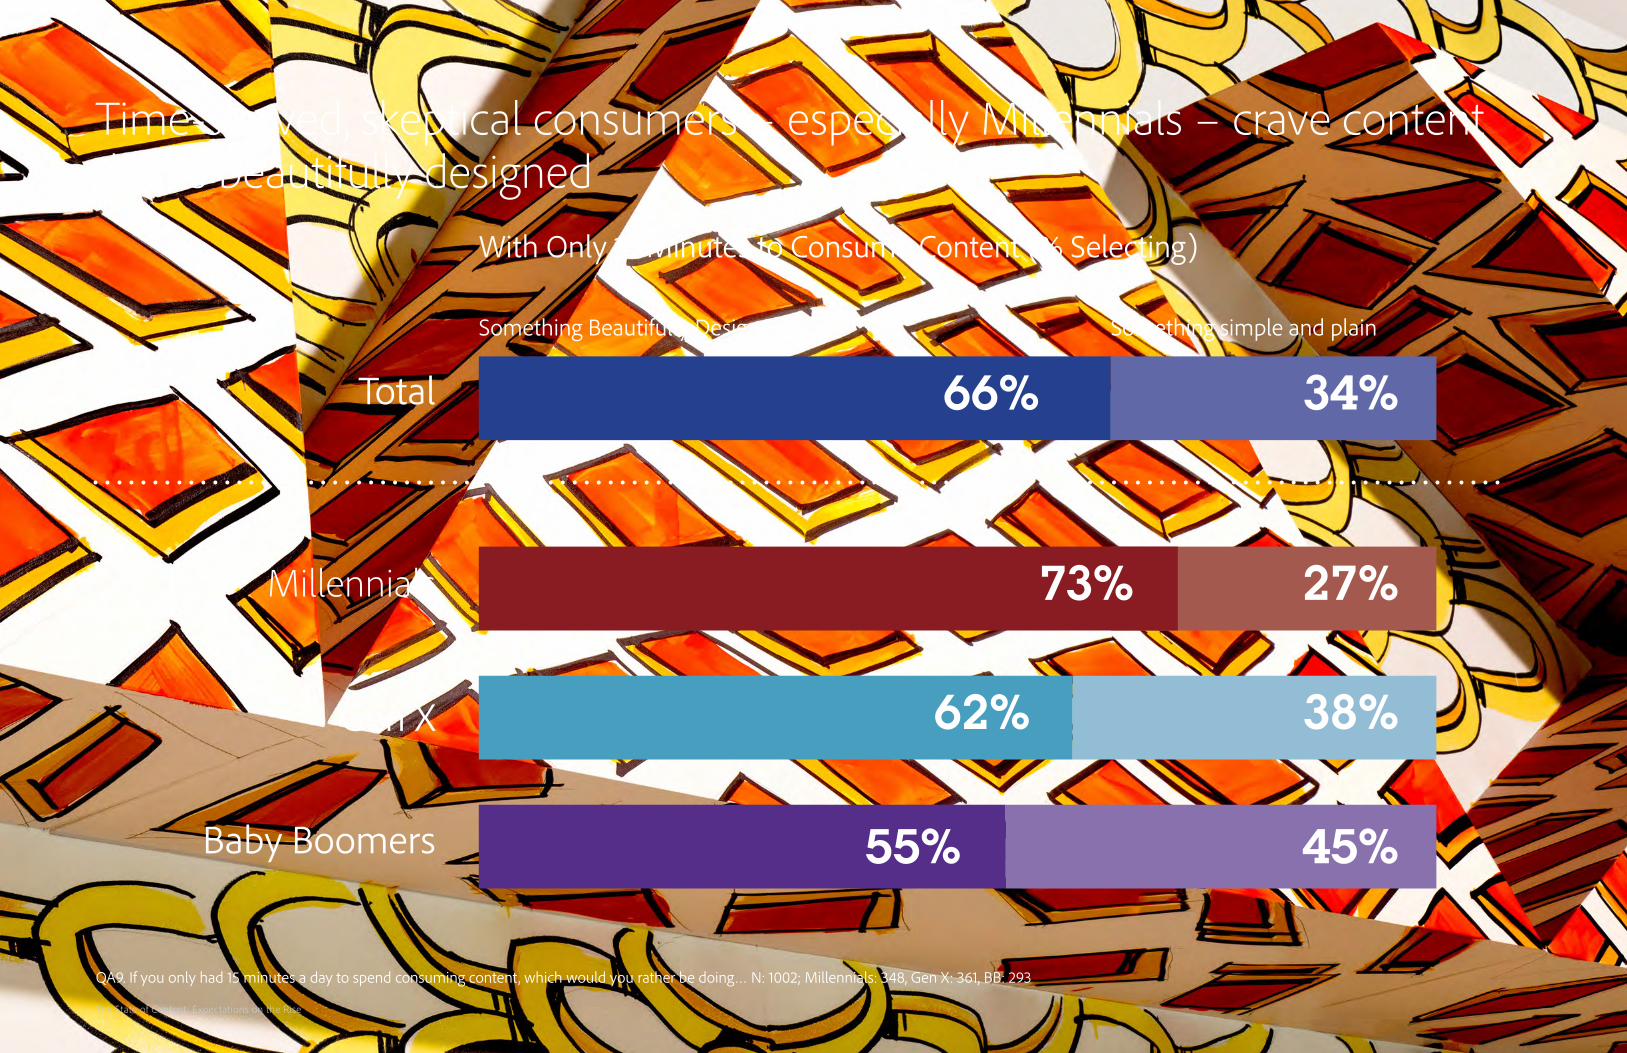
Time-starved, skeptical consumers – especially Millennials – crave content that is beautifully designed
Something Beautifully Designed Something simple and plain
With Only 15 Minutes to Consume Content (% Selecting)
QA9. If you only had 15 minutes a day to spend consuming content, which would you rather be doing… N: 1002; Millennials: 348, Gen X: 361, BB: 293
34%
27%
38%
45%
66%
73%
62%
55%
Total
Millennials
Gen X
Baby Boomers
The State of Content: Expectations on the Rise
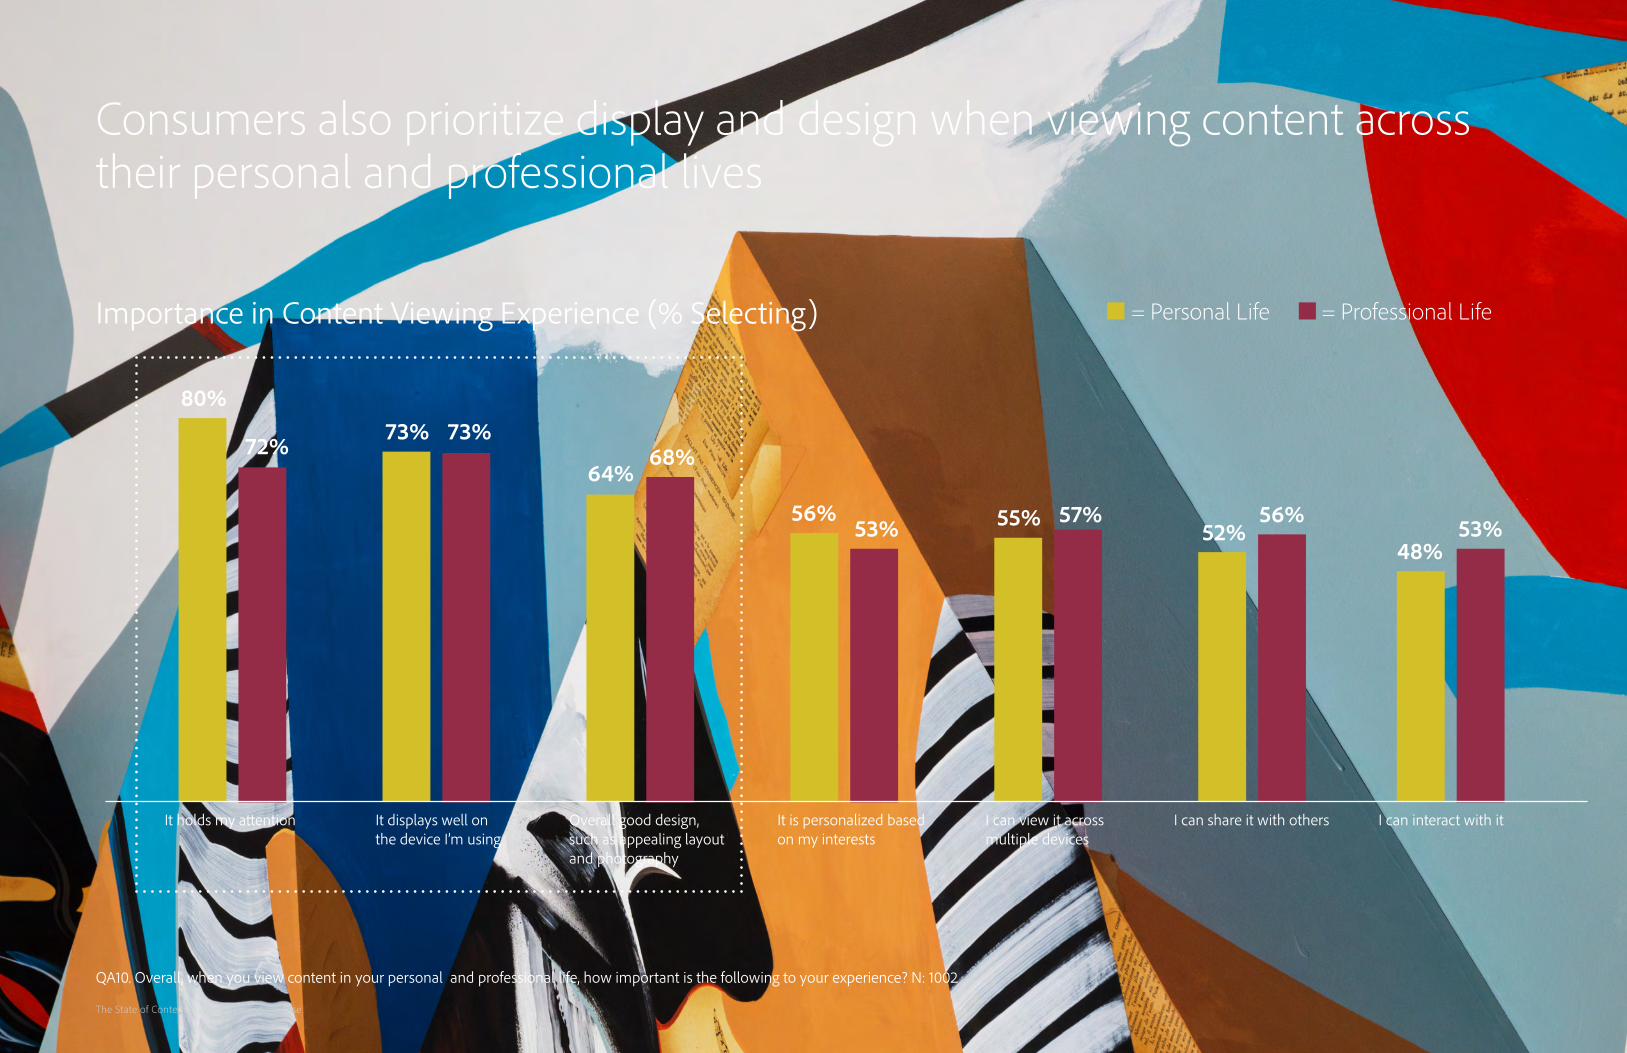
Importance in Content Viewing Experience (% Selecting)
Consumers also prioritize display and design when viewing content across their personal and professional lives
80%
72%73% 73%
64%68%
56% 55% 57% 56%52%53% 53%
48%
It holds my attention It displays well on the device I’m using
Overall good design, such as appealing layout and photography
It is personalized based on my interests
I can view it across multiple devices
I can interact with itI can share it with others
= Personal Life = Professional Life
QA10. Overall, when you view content in your personal and professional life, how important is the following to your experience? N: 1002
The State of Content: Expectations on the Rise
46%
44%
30%
35%
50%
57%
46%
64%
36%
15%
17%
32%
28%
16%
17%
35%
23%
51%
39%
39%
38%
38%
33%
25%
20%
13%
13%
Consumers will switch devices or stop engaging content altogether if they encounter design or display issues
Q2. When you are viewing content on any device, which of the following would cause you to switch to another device to view the same content or stop viewing it altogether? N:2008
Content Issue Actions (% Total) = Stop engaging = Switch devices = Unchanged
Images won’t load
It takes too long to load
Content was too long
The content is unattractive in its layout or imagery
I need to review it while on the go
The experience would be improved on a bigger device
I want to show it to somebody else
It is not displaying well on the device I’m using
I have trouble interacting with it on the device (links and buttons don’t work)
The State of Content: Expectations on the Rise
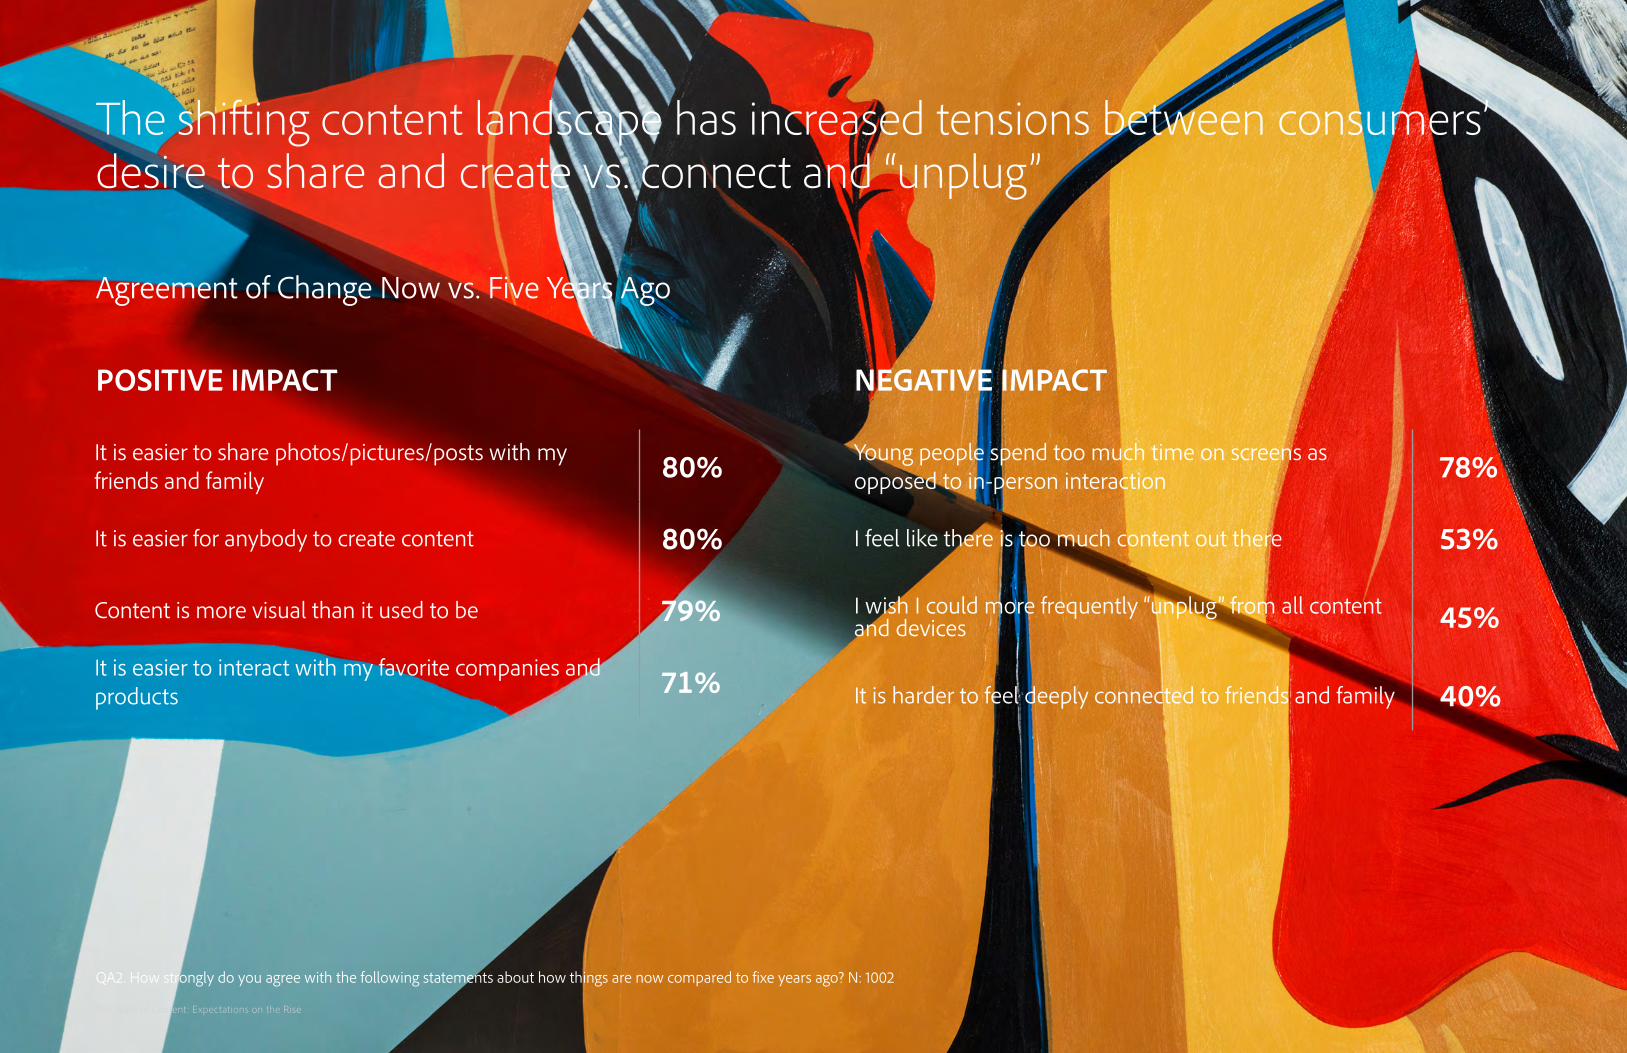
The shifting content landscape has increased tensions between consumers’ desire to share and create vs. connect and “unplug”
Agreement of Change Now vs. Five Years Ago
POSITIVE IMPACT NEGATIVE IMPACT
QA2. How strongly do you agree with the following statements about how things are now compared to fixe years ago? N: 1002
It is easier to share photos/pictures/posts with my friends and family 80%
It is easier for anybody to create content 80%
Content is more visual than it used to be 79%
It is easier to interact with my favorite companies and products 71%
Young people spend too much time on screens as opposed to in-person interaction 78%
I feel like there is too much content out there 53%
I wish I could more frequently “unplug” from all content and devices 45%
It is harder to feel deeply connected to friends and family 40%
The State of Content: Expectations on the Rise

Appendix
The State of Content: Expectations on the Rise
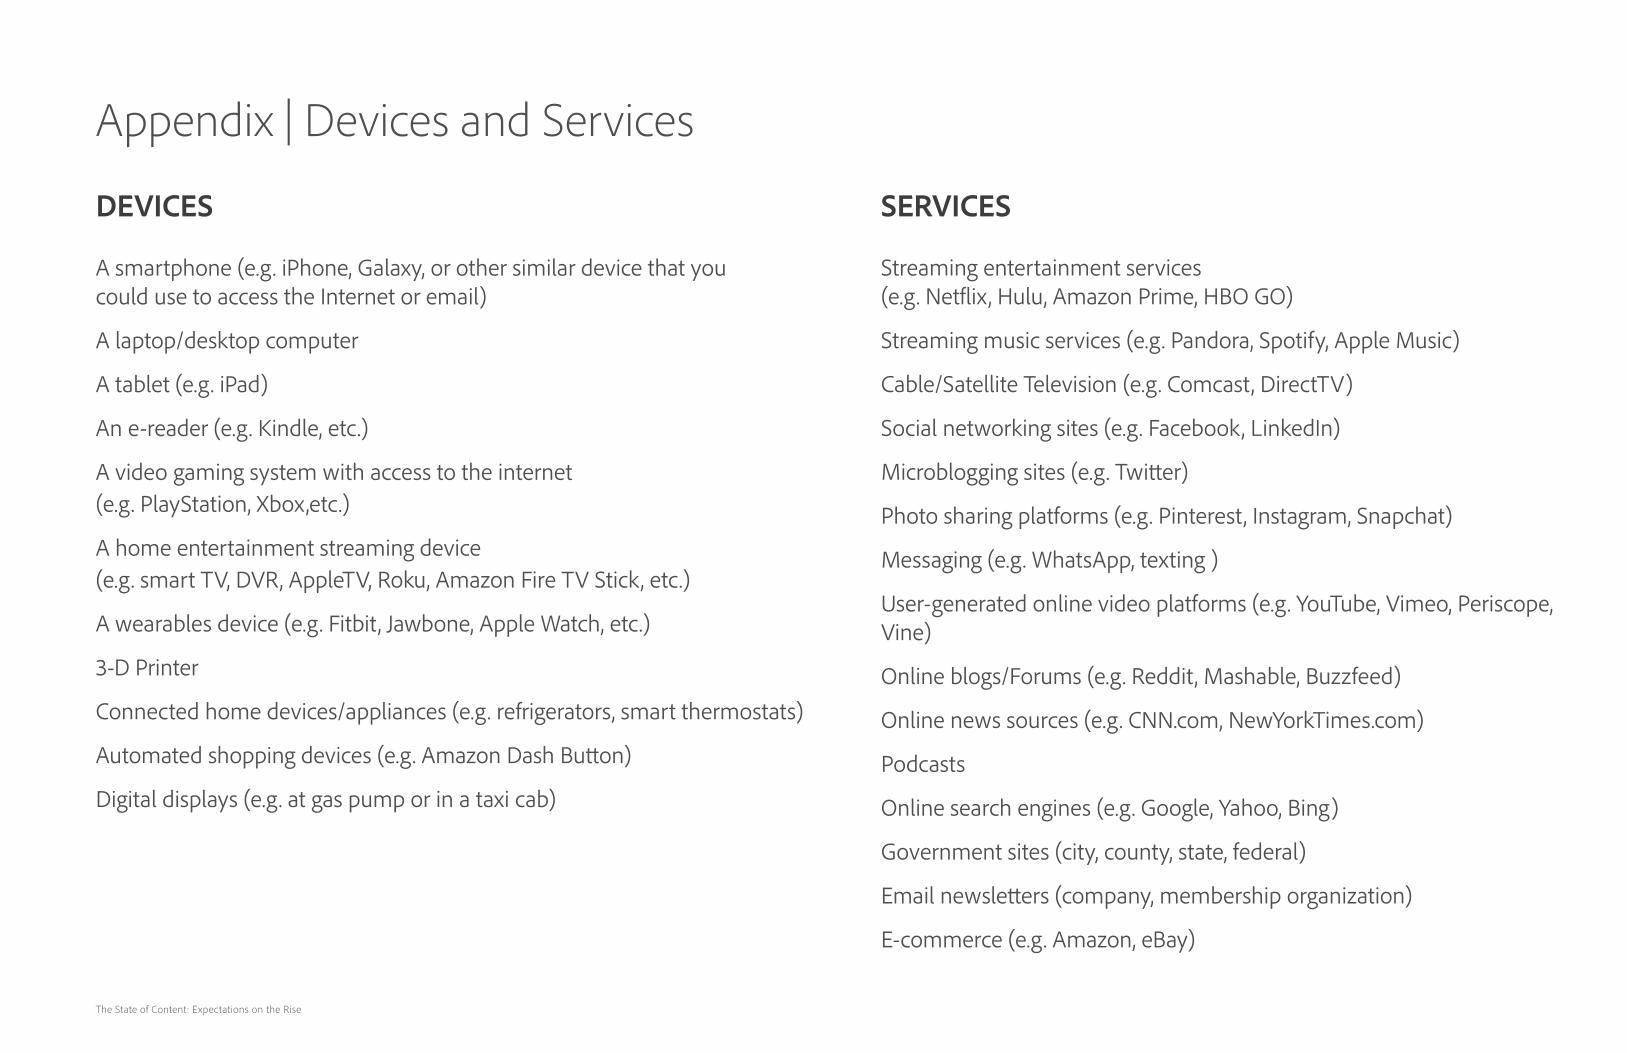
Appendix | Devices and Services
DEVICES SERVICES
A smartphone (e.g. iPhone, Galaxy, or other similar device that you could use to access the Internet or email)
A laptop/desktop computer
A tablet (e.g. iPad)
An e-reader (e.g. Kindle, etc.)
A video gaming system with access to the internet (e.g. PlayStation, Xbox,etc.)
A home entertainment streaming device (e.g. smart TV, DVR, AppleTV, Roku, Amazon Fire TV Stick, etc.)
A wearables device (e.g. Fitbit, Jawbone, Apple Watch, etc.)
3-D Printer
Connected home devices/appliances (e.g. refrigerators, smart thermostats)
Automated shopping devices (e.g. Amazon Dash Button)
Digital displays (e.g. at gas pump or in a taxi cab)
Streaming entertainment services (e.g. Netflix, Hulu, Amazon Prime, HBO GO)
Streaming music services (e.g. Pandora, Spotify, Apple Music)
Cable/Satellite Television (e.g. Comcast, DirectTV)
Social networking sites (e.g. Facebook, LinkedIn)
Microblogging sites (e.g. Twitter)
Photo sharing platforms (e.g. Pinterest, Instagram, Snapchat)
Messaging (e.g. WhatsApp, texting )
User-generated online video platforms (e.g. YouTube, Vimeo, Periscope, Vine)
Online blogs/Forums (e.g. Reddit, Mashable, Buzzfeed)
Online news sources (e.g. CNN.com, NewYorkTimes.com)
Podcasts
Online search engines (e.g. Google, Yahoo, Bing)
Government sites (city, county, state, federal)
Email newsletters (company, membership organization)
E-commerce (e.g. Amazon, eBay)
The State of Content: Expectations on the Rise