
ENERGY EFFICIENCY OPPORTUNITY GUIDE IN THE LIME INDUSTRY CANADIAN
64
Natural Resources Canada Ressources naturelles Canada Office de l'efficacité énergétique Office of Energy Efficiency ENERGY EFFICIENCY OPPORTUNITY GUIDE IN THE LIME INDUSTRY CANADIAN LIME INSTITUTE
Transcript of ENERGY EFFICIENCY OPPORTUNITY GUIDE IN THE LIME INDUSTRY CANADIAN

Natural ResourcesCanada
Ressources naturellesCanada
Office de l'efficacitéénergétique
Office of EnergyEfficiency
ENERGY EFFICIENCY OPPORTUNITY GUIDE IN THE LIME INDUSTRY
CANADIAN LIME INSTITUTE

Energy Efficiency Opportunity Guide in the Lime Industry – Canadian Lime Institute
Aussi disponible en français sous le titre de :
Guide sur les possibilités d’accroissement de l’efficacité énergétique dans l’industrie de la chaux – Canadian Lime Institute
ISBN 0-662-30935-9
Cat. no. M92-231/2001E
© Her Majesty the Queen in Right of Canada, 2001
To obtain additional copies of this publication, please write to:
Office of Energy Efficiency
Natural Resources Canada
580 Booth Street, 18th Floor
Ottawa ON K1A 0E4
Tel: (613) 995-6950
Fax: (613) 947-4121
You can also view or order most of the Office of Energy Efficiency publications on-line.
Visit our Virtual Library at http://oee.nrcan.gc.ca/infosource.
The Office of Energy Efficiency’s Web site is at http://oee.nrcan.gc.ca
Recycled Paper

Disclaimer
The information presented in this publication is based on a combination of publiclyavailable resources and ideas shared by corporate or private organizations in the limeindustry. The views and ideas presented herein are those of the author and do not necessarily reflect the views or policies of the Canadian Industry Program for EnergyConservation (CIPEC), the Canadian Lime Institute or any of its members. Theopportunities presented in this document are generic and should not be interpreted as recommendations for specific sites.
Mention or use of trade names, commercial products or supplier names does not constitute endorsements of their use or application.
Effort has been made to offer current, correct and clearly expressed information in this publication. The information in the text is intended to provide guidelines by supplying general answers to broad questions. This publication is distributed with theunderstanding that its author, Energistics Group Inc., including its directors, officers and employees, is not responsible or liable for the results of any actions taken on thebasis of information in this publication, or for any errors or omissions contained herein. Readers are encouraged to consult with professional advisers before making any decisions concerning specific matters.

Acknowledgements
The Canadian Lime Institute Energy Efficiency Opportunity Guide in the Lime Industrywas developed by Energistics Group Inc., jointly sponsored by the Canadian LimeInstitute (CLI) and Natural Resources Canada through the Canadian Industry Program for Energy Conservation (CIPEC) Lime Task Force.
The CLI is a self-governing body with representatives of 16 lime-producing sites in Canada.
CIPEC, which consists of 23 task forces representing various industrial sectors inCanada, is supported by Natural Resources Canada’s Office of Energy Efficiency. R.L. (Dick) Bowman, Beachville Lime Ltd., (formally Global Stone Ingersoll Ltd.1) represents CLI interests in CIPEC’s lime sector. The Task Force comprises representatives from several lime manufacturers.
We wish to acknowledge the assistance, technical input and comments of all who participated in the preparation of this Guide, especially
■ R.L. (Dick) Bowman, Beachville Lime Ltd., (formally Global Stone Ingersoll Ltd.1)
■ Roger Downham, Beachville Lime Ltd., Ingersoll, Ontario
■ Steve Hood, AERA Energy Solutions Group, Guelph, Ontario
■ Don Taylor, Lafarge Lime, Dundas, Ontario
Energistics Group Inc. is a privately owned, full energy service provider that provides management, consulting and research services focusing on the cost-effective purchase and use of utilities to producers, utilities and end-users. We can be contacted at the following:
Energistics Group Inc.300 Richmond Street, Suite 104Chatham ON N7M 1P7Telephone: (519) 351-2104Facsimile: (519) 351-2146
Neal CockshuttDirector, Energy ServicesEnergistics Group Inc.
1 During the analysis of this project, Global Stone Ingersoll formally became Ingersoll Lime Limited.

TABLE OF CONTENTS
1.0 Introduction
1.1 Introduction to this Guide . . . . . . . . . . . . . . . . . . . . . . . . . . . . . . . . . . . . . . 11.2 Introduction to Conservation and Efficiency . . . . . . . . . . . . . . . . . . . . . . . . 11.3 Environmental Value. . . . . . . . . . . . . . . . . . . . . . . . . . . . . . . . . . . . . . . . . . . 21.4 Utility and Government Assistance . . . . . . . . . . . . . . . . . . . . . . . . . . . . . . . . 31.5 Energy Efficiency Assistance . . . . . . . . . . . . . . . . . . . . . . . . . . . . . . . . . . . . . 41.6 Commitment to Energy Efficiency . . . . . . . . . . . . . . . . . . . . . . . . . . . . . . . . 5
2.0 Lime Industry Conservation and Efficiency
2.1 Introduction to the Lime Industry . . . . . . . . . . . . . . . . . . . . . . . . . . . . . . . . 72.2 Energy Use and Breakdown. . . . . . . . . . . . . . . . . . . . . . . . . . . . . . . . . . . . . . 92.3 Overall Kiln Design. . . . . . . . . . . . . . . . . . . . . . . . . . . . . . . . . . . . . . . . . . . 11
3.0 Energy Costs
3.1 Natural Gas . . . . . . . . . . . . . . . . . . . . . . . . . . . . . . . . . . . . . . . . . . . . . . . . . 123.2 Electricity . . . . . . . . . . . . . . . . . . . . . . . . . . . . . . . . . . . . . . . . . . . . . . . . . . 133.3 Non-utility Energy . . . . . . . . . . . . . . . . . . . . . . . . . . . . . . . . . . . . . . . . . . . 153.4 Purchased Water . . . . . . . . . . . . . . . . . . . . . . . . . . . . . . . . . . . . . . . . . . . . . 15
4.0 General Energy Efficiency Methodologies
4.1 Monitoring and Targeting . . . . . . . . . . . . . . . . . . . . . . . . . . . . . . . . . . . . . . 164.2 Energy Accounting . . . . . . . . . . . . . . . . . . . . . . . . . . . . . . . . . . . . . . . . . . . 174.3 Employee Awareness and Training Programs . . . . . . . . . . . . . . . . . . . . . . . . 174.4 Facility Maintenance . . . . . . . . . . . . . . . . . . . . . . . . . . . . . . . . . . . . . . . . . . 18
5.0 Energy Efficiency Tips
5.1 Introduction . . . . . . . . . . . . . . . . . . . . . . . . . . . . . . . . . . . . . . . . . . . . . . . . 205.2 General Methodologies . . . . . . . . . . . . . . . . . . . . . . . . . . . . . . . . . . . . . . . . 205.3 Lighting. . . . . . . . . . . . . . . . . . . . . . . . . . . . . . . . . . . . . . . . . . . . . . . . . . . . 215.4 Heating of Buildings . . . . . . . . . . . . . . . . . . . . . . . . . . . . . . . . . . . . . . . . . . 225.5 Air Compressor Systems . . . . . . . . . . . . . . . . . . . . . . . . . . . . . . . . . . . . . . . 235.6 Electric Motors . . . . . . . . . . . . . . . . . . . . . . . . . . . . . . . . . . . . . . . . . . . . . . 255.7 Variable Frequency Drives . . . . . . . . . . . . . . . . . . . . . . . . . . . . . . . . . . . . . . 255.8 Quarry Vehicles . . . . . . . . . . . . . . . . . . . . . . . . . . . . . . . . . . . . . . . . . . . . . . 275.9 Pumping . . . . . . . . . . . . . . . . . . . . . . . . . . . . . . . . . . . . . . . . . . . . . . . . . . . 285.10 Fans . . . . . . . . . . . . . . . . . . . . . . . . . . . . . . . . . . . . . . . . . . . . . . . . . . . . . . 29
6.0 Tips for the Lime Industry
6.1 Process Flow, Handling and Product Quality . . . . . . . . . . . . . . . . . . . . . . . 316.2 Material-Handling Systems . . . . . . . . . . . . . . . . . . . . . . . . . . . . . . . . . . . . . 336.3 Limestone Storage . . . . . . . . . . . . . . . . . . . . . . . . . . . . . . . . . . . . . . . . . . . . 336.4 Crushers and Vibrating Feeders . . . . . . . . . . . . . . . . . . . . . . . . . . . . . . . . . . 35

TABLE OF CONTENTS
6.5 Screening . . . . . . . . . . . . . . . . . . . . . . . . . . . . . . . . . . . . . . . . . . . . . . . . . . . 366.6 Limestone Preheaters . . . . . . . . . . . . . . . . . . . . . . . . . . . . . . . . . . . . . . . . . . 366.7 Long Rotary Kilns . . . . . . . . . . . . . . . . . . . . . . . . . . . . . . . . . . . . . . . . . . . . 376.8 Coolers . . . . . . . . . . . . . . . . . . . . . . . . . . . . . . . . . . . . . . . . . . . . . . . . . . . . 38
7.0 Kiln-Related Tips
7.1 Kiln Refractory . . . . . . . . . . . . . . . . . . . . . . . . . . . . . . . . . . . . . . . . . . . . . . 407.2 Combustion Controls . . . . . . . . . . . . . . . . . . . . . . . . . . . . . . . . . . . . . . . . . 41
7.2.1 Combustion Gas Analysis . . . . . . . . . . . . . . . . . . . . . . . . . . . . . . . . . 427.2.2 Airflow Measurement . . . . . . . . . . . . . . . . . . . . . . . . . . . . . . . . . . . . 437.2.3 Fuel Control . . . . . . . . . . . . . . . . . . . . . . . . . . . . . . . . . . . . . . . . . . . 437.2.4 Burners . . . . . . . . . . . . . . . . . . . . . . . . . . . . . . . . . . . . . . . . . . . . . . . 44
7.3 Fuel Handling . . . . . . . . . . . . . . . . . . . . . . . . . . . . . . . . . . . . . . . . . . . . . . . 447.3.1 Fuel Oil . . . . . . . . . . . . . . . . . . . . . . . . . . . . . . . . . . . . . . . . . . . . . . 447.3.2 Coal and Coal Derivatives . . . . . . . . . . . . . . . . . . . . . . . . . . . . . . . . 457.3.3 Alternative Fuels . . . . . . . . . . . . . . . . . . . . . . . . . . . . . . . . . . . . . . . . 46
7.4 Leakage . . . . . . . . . . . . . . . . . . . . . . . . . . . . . . . . . . . . . . . . . . . . . . . . . . . . 467.5 Kiln Internals. . . . . . . . . . . . . . . . . . . . . . . . . . . . . . . . . . . . . . . . . . . . . . . . 477.6 Vertical Kilns . . . . . . . . . . . . . . . . . . . . . . . . . . . . . . . . . . . . . . . . . . . . . . . . 477.7 Cyclones . . . . . . . . . . . . . . . . . . . . . . . . . . . . . . . . . . . . . . . . . . . . . . . . . . . 487.8 Baghouses and Precipitators. . . . . . . . . . . . . . . . . . . . . . . . . . . . . . . . . . . . . 487.9 Briquetting Processes . . . . . . . . . . . . . . . . . . . . . . . . . . . . . . . . . . . . . . . . . . 49
Appendix
Industry Contacts. . . . . . . . . . . . . . . . . . . . . . . . . . . . . . . . . . . . . . . . . . . . . . . . . 50Provincial Government Energy Management Programs . . . . . . . . . . . . . . . . . . . . 51Electrical Utilities . . . . . . . . . . . . . . . . . . . . . . . . . . . . . . . . . . . . . . . . . . . . . . . . . 52Referenced Programs . . . . . . . . . . . . . . . . . . . . . . . . . . . . . . . . . . . . . . . . . . . . . . 54
References . . . . . . . . . . . . . . . . . . . . . . . . . . . . . . . . . . . . . . . . . . . . . . . . . . . . . 55
Figures
1. Project Success Triangle . . . . . . . . . . . . . . . . . . . . . . . . . . . . . . . . . . . . . . . . . . . 52. Lime Processing Schematic . . . . . . . . . . . . . . . . . . . . . . . . . . . . . . . . . . . . . . . . 83. Energy Consumption by Fuel Type . . . . . . . . . . . . . . . . . . . . . . . . . . . . . . . . . . 94. Energy Intensity Indicator: Merchant Lime Facilities . . . . . . . . . . . . . . . . . . . . 10
Tables
1. Merchant Lime Applications, 1996 . . . . . . . . . . . . . . . . . . . . . . . . . . . . . . . . . . 82. Kiln Efficiencies Based on Design Category . . . . . . . . . . . . . . . . . . . . . . . . . . . 113. General Methodologies . . . . . . . . . . . . . . . . . . . . . . . . . . . . . . . . . . . . . . . . . . 204. Example of Variable Frequency Drive Savings . . . . . . . . . . . . . . . . . . . . . . . . . 26

1
INTRODUCTION1.0
1.1 INTRODUCTION TO THIS GUIDE
This Guide has been developed as a practical source of information for lime processors and calcining personnel in Canada. Designed to be user-friendly, it suggests potential areas of energy, utility and associated cost savings for limefacilities and processing operations.
It has been assumed that readers are familiar with lime-processing operations and have the ability to adapt energy-saving tips to their individual applicationsand specific sites.
Purchased energy is not necessarily a fixed business expense because its cost can be reduced through conservation techniques. This Guide can be used as a quickreference to develop self-audit and evaluation techniques to monitor energy usage.
1.2 INTRODUCTION TO CONSERVATION AND EFFICIENCY
Two basic terms are often used interchangeably when discussing improvements inhow much energy is used or how much can be saved – “energy conservation” and“energy efficiency.” Each has a slightly different meaning, but both approachesresult in reducing the total quantity of energy consumed. Whichever approach is used, it is important to consider the impacts that efficiency and conservationmeasures have on production rates and product quality.
Energy conservation refers to measures that reduce the total amount of energyconsumed. This typically relates to reducing wastage or eliminating unnecessarysteps or operations, and is expressed in the units of energy saved. Examples ofconservation measures include turning off lights in vacant rooms, using night setback thermostats and shortening the preheat time on an oven or furnace.Conservation is often achieved by simply modifying the methodology or schedul-ing of operations and can achieve tangible savings with minimal investment costs.
The term “energy conservation” continues to carry negative connotations derived from early attempts, which sometimes included “doing without.” Recentconservation methods offer the same or better results while using less energy.
Energy efficiency refers to more effective use of fuel or energy; the process orenvironment maintains the level of production with similar or improved qualitywhile using less energy. Energy efficiency typically requires capital expendituresand focuses on technology to achieve better use of energy. Efficiency requires abaseline for comparison purposes, which can be a step in the process or operation“as found,” or a benchmarked facility or process. Energy efficiency is typicallyexpressed as a percentage of the quantity of energy actually utilized. This percent-age gain is applicable only to the energy throughput of the equipment affected.Examples of efficiency measures are replacing unit heaters with infrared systems,upgrading the burner in a boiler or preheating combustion air for a furnace.

INTRODUCTION1.0
2
For the purposes of this Guide, efficiency and conservation measures or improvements will not be noted independently but will simply be referred to as “energy efficiency.”
Energy management is a continuous improvement plan for incorporating both of these components into a business and its operations. It can be defined as the judicious use of energy to accomplish pre-described objectives. Mostimportantly, good energy management practices must not reduce the effectivenessof production or the quality of the product.
Good energy management practices also benefit the environment. Lower energyconsumption reduces the amount of pollutants and emissions released into thesoil, atmosphere and bodies of water. Corporations should capitalize on all thecredit and positive public relations from implementing energy efficiency meas-ures. In some areas, environmental benefits can offset the costs associated withefficiency measures. Where corporate strategies allow, contact local utilities andgovernment agencies prior to implementing measures to enquire about the availability of assistance programs. A list of sources of assistance and informationis included in the Appendix (page 50).
Most efficiency and conservation programs consider all types of utilities, includingall energy sources, purchased or processed water and sewer usage. Secondary utilities, such as compressed air or steam produced on site, are also included.
Because purchased energy represents the majority of total utility costs, the term“energy” will be used. The term “utility” or “utilities” will be reserved to identifythe supplier of utilities or local distribution company.
Lastly, this Guide has not attempted to list all potential areas of savings but suggests items most directly applicable to the lime industry. For example, sincethere are very few opportunities to utilize low-grade heat, there are no suggestionsfor researching or implementing heat recovery from air compressors and motors.
1.3 ENVIRONMENTAL VALUE
Energy efficiency measures have a direct impact on emissions and the environment.With public attention on the Rio and Kyoto summits that tabled aggressive targetsfor reductions in energy-related emissions, all actions should be registered, regardless of the level of energy savings.
Canada’s Climate Change Voluntary Challenge and Registry Inc. (VCR Inc.)publicly documents individual company commitments and progress toward emissions reductions. VCR Inc. was developed, in part, to give companies creditfor early and voluntary actions. It is anticipated that this documentation processwill ensure that registered companies can retroactively claim their efforts shouldemissions trading become a full-scale reality.
INTRODUCTION1.0
3
At the time this Guide was prepared, six of the eight member companies in theCanadian Lime Institute (CLI) had registered and submitted plans to VCR Inc.,representing 75% of the membership and approximately 57% of CLI’s annualrated capacity.
A program overview and the corporate benefits of being involved in VCR Inc. is available through the VCR Inc. contact listed in the Appendix (see page 54).
1.4 UTILITY AND GOVERNMENT ASSISTANCE
Most utilities have technical field representatives who can assist energy users with short-term measurement and provide some technical information to helpmake the decision to proceed with an energy efficiency project. The level ofknowledge or support available varies with the utility’s commitment to customerservice. Before requesting site assistance, verify the costs or rates charged for the desired services.
Many local utilities have mandates to work with their customers to ensure that the energy they supply is used in the most efficient fashion. Demand sidemanagement (DSM) programs have been developed to supply market assistanceto implement energy efficiency measures, with the goal of transforming the market to readily accept higher efficiency alternatives. There are three primarytypes of assistance: education, higher efficiency product marketing and technicalassistance. Some utilities continue to offer financial project assistance throughincentives and grants.
Utilities that are involved with DSM programs report energy savings that resultfrom their “influence” to their regulating bodies. To be eligible for financial assis-tance, potential projects must be qualified prior to implementation. Currently,the customer, not the utility, claims emissions reductions and associated credits.Ensure that this is true for the utility in question before receiving any financialgrants or incentives.
A substantial push for increased energy efficiency in the industrial sectorsoccurred in the 1980s. Utilities and governments alike invested substantial timeand effort to help customers identify energy-saving opportunities, usually at littleor no cost to the customer. Many of these reports were shelved before the recom-mendations had been fully investigated or implemented, partially because of lowenergy prices. Today, the focus is on the competitive advantage of increased energyefficiency. Facilities are encouraged to research their archives for suggestions andrecommendations that have already been prepared and may now be feasiblebecause of fuel cost or market changes (i.e. if the product value has increased, it might be viable to increase throughput with an energy-efficient device).

INTRODUCTION1.0
4
Although government programs change, the current push to reduce emissions hasspurred a number of service and financial offerings. One of these is the supply oftechnical resources for new or leading-edge projects or programs. Through theON-SITE program, a partnership between the Government of Canada and theAlliance of Manufacturers & Exporters Canada, unemployed professionals can beprovided to industries at limited cost for projects in areas such as the following:
■ occupational health and safety;
■ solid-waste reduction and waste management;
■ energy management; and
■ quality and environmental management.
Contact details for ON-SITE programs are included in the Appendix (see page 54).
1.5 ENERGY EFFICIENCY ASSISTANCE
Expertise is available in the industrial marketplace to identify, support and implement energy efficiency measures for parties that lack sufficient staff orknowledge. Many energy service companies (ESCos) have built their businesseson identifying and implementing energy-related capital improvement projects.They can suggest innovative financing options and offer guaranteed savings onefficiency projects. Engineering firms and equipment manufacturers are also agood source of information on technology and market trends.
A common approach is to develop a relationship with a non-partisan serviceprovider who can implement projects with the best interests of the company inmind, bringing in only those experts who add value to the proposed project. Agood service provider will also deliver environmental value and utility assistanceat the proper stages, and will request any provincial or federal government assistance that is available at the time of the project.
Some components of a certain process, operation or business approach may have been analysed or studied in the past. There are many excellent publicationsavailable to help identify and implement energy efficiency measures. A good starting point is the Energy Efficiency Planning and Management Guide from theCanadian Industry Program for Energy Conservation (CIPEC). The Appendixincludes contact information to obtain this Guide (see page 54).
INTRODUCTION1.0
5
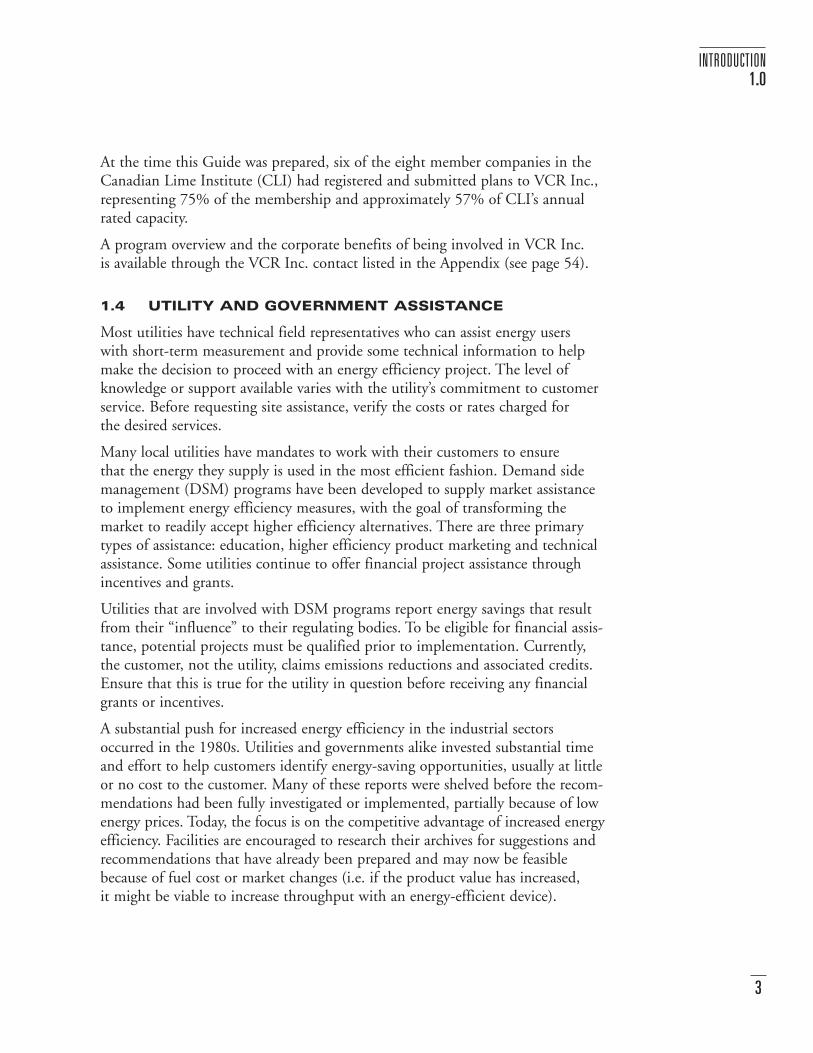
1.6 COMMITMENT TO ENERGY EFFICIENCY
A company needs input from all aspects of a business operation to successfullymanage energy use (see Figure 1). Financial planners are required to outlineacceptable economic parameters, plant managers and supervisors should under-stand the nuances of the facility’s processes, and a project leader should ensurethat all activities are channelled through the proper contacts. Finally, technicalexpertise should be available to implement the measures successfully.
Often, barriers to energy efficiency projects must be overcome to realize savings.The following are some common barriers:
■ lack of awareness of opportunities;
■ lack of understanding on how to proceed;
■ limited support from management;
■ low priority accorded to energy or utilities;
■ limited finances (competition for capital) or staff availability;
■ limited internal accountability for measures; and
■ perceived risk of changing from the status quo.
FIGURE 1. Project Success Triangle
StrategicVision
FinancialResources
ProjectSuccess
Technical Expertise

6
INTRODUCTION1.0
Energy efficiency projects should be implemented in a rational, logical fashion.Allow some time between projects to analyse the impacts of measures beforeimplementing new ones. Overlapping projects may cause confusion, and fine-tuning each measure to receive optimum benefits becomes more difficult. If thereare problems with a specific change, they will become evident more readily andcan be modified without long-term effects.
When performing economic calculations for energy efficiency projects, ensurethat taxation and capital cost depreciation are figured into total costs. In an effort to promote energy efficiency and greenhouse gas reductions, provincial and federal governments have structured tax laws and regulations to provideincentives and accelerated depreciation. Accountants can offer advice on howthese regulations apply at the time of the project.
Often, the economics of replacing capital equipment are considered only at the end of the equipment’s useful life. This practice almost always delays cost-effective projects and energy savings. Where projects are cost-effective within thedefinition of a specific operation, plan to perform the improvement or capitalreplacement as early as possible to realize savings sooner rather than later.
For example, replacing a failed conventional motor with a high-efficiency onemay have a simple payback of six months, whereas replacing a newly installedconventional motor may have a simple payback of five years. If the threshold for implementing projects is a three-year payback, then a schedule could beimplemented to replace conventional motors with high-efficiency ones as theyreach a certain age and are at the necessary depreciation level.
In this Guide, simple payback measures are assumed to be calculated at the endof the equipment’s useful life cycle, unless otherwise noted. This is to ensure thatdecisions to deviate from the base case take individual financial considerationsinto account.

7
LIME INDUSTRY CONSERVATION AND EFFICIENCY2.0
2.1 INTRODUCTION TO THE LIME INDUSTRY
Limestone is an inorganic mineral found in abundance all over the world. In its natural form, it is often strip mined in a conventional manner, crushed andprocessed according to the desired end-use. Some stone is prepared and sold fordecorative or structural aggregate, and the remainder is processed for industrial,chemical or environmental applications. The primary Standard IndustrialClassification (SIC) Code applicable to such producers is 3581.
Two basic types of lime are produced: those with a high calcium content, termed“high calcium” (CaO), and those with a high magnesium and calcium content,termed “dolomitic lime” (MgO.CaO). High-calcium limes, by definition, mustcontain less than 5% magnesium.
Both types of limestone have a high carbonate (CO3) content, which dissociatesCO2 at temperatures of approximately 725°C and 900°C (1337°F and 1652°F),depending on the stone’s chemistry. It is this dissociation or calcining process that transforms the limestone into the desired active lime product. Althoughphysically similar in size before and after the calcining process, the end product is 44–47% lighter than the original stone. It should be noted that chemical grade,high-calcium quicklime is less than 100% calcium oxide.
Following are some of the more common applications for lime.
METALLURGICAL USES
■ iron and steel
■ aluminum and bauxite
INDUSTRIAL AND CHEMICAL USES
■ pulp and paper
■ sugar refining
■ glass
ENVIRONMENTAL USES
■ water treatment
■ sewage treatment
■ flue-gas de-sulfurization
CONSTRUCTION USES
■ soil stabilization
■ lime for building and construction
LIME INDUSTRY CONSERVATION AND EFFICIENCY2.0
8
REFRACTORY USES
A breakdown of sales by major application is shown in Table 1.
MAJOR APPLICATION PERCENTAGE OF SALES (APPROX.)
Steel making 50
Environmental control 14
Pulp and paper 14
Chemical production 8
Other industrial uses 14
Source: Minerals and Metals: Preliminary Analysis of Actions and Opportunities for GHG Mitigation. Minerals and MetalsWorking Group – Industry Issues Table (CIPEC), July 1999.
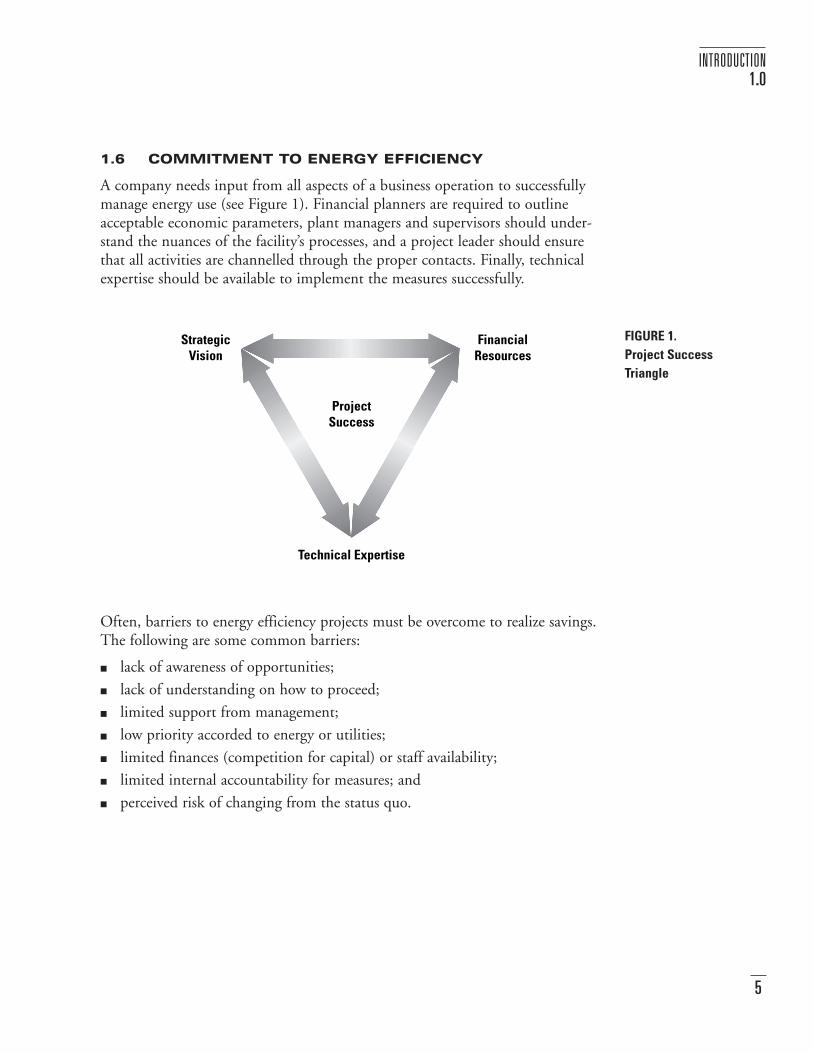
It is important to distinguish between the two processing streams for lime.Merchant lime, as identified in the table above, is typically processed directly at thequarry (or nearby) and is marketed and sold in specific forms for end-user applica-tions. Lime is less expensive to transport than the heavier, unprocessed limestone.
The second major processing stream is through integrated lime producers whoprocess limestone to satisfy their internal production requirements. This integratedprocess is common in the steel, sugar, and pulp and paper industries.
This Guide focuses primarily on merchant lime facilities (identified bySIC 3581). Many ideas and tips presented here, however, are also applicable tointegrated lime producers.
Figure 2 shows the typical lime processing path.
TABLE 1.Merchant Lime
Applications, 1996
DOLOMITIC LIMESTONE QUARRYING HIGH-CALCIUM LIMESTONE QUARRYING
Crushing and Screening
Kiln Calcining
Sizing and Pulverizing
Hydrating
Shipping
Shipping
Dryer and PulverizingScreening and Classifying
Source: Canadian Lime Institute
FIGURE 2.Lime Processing
Schematic
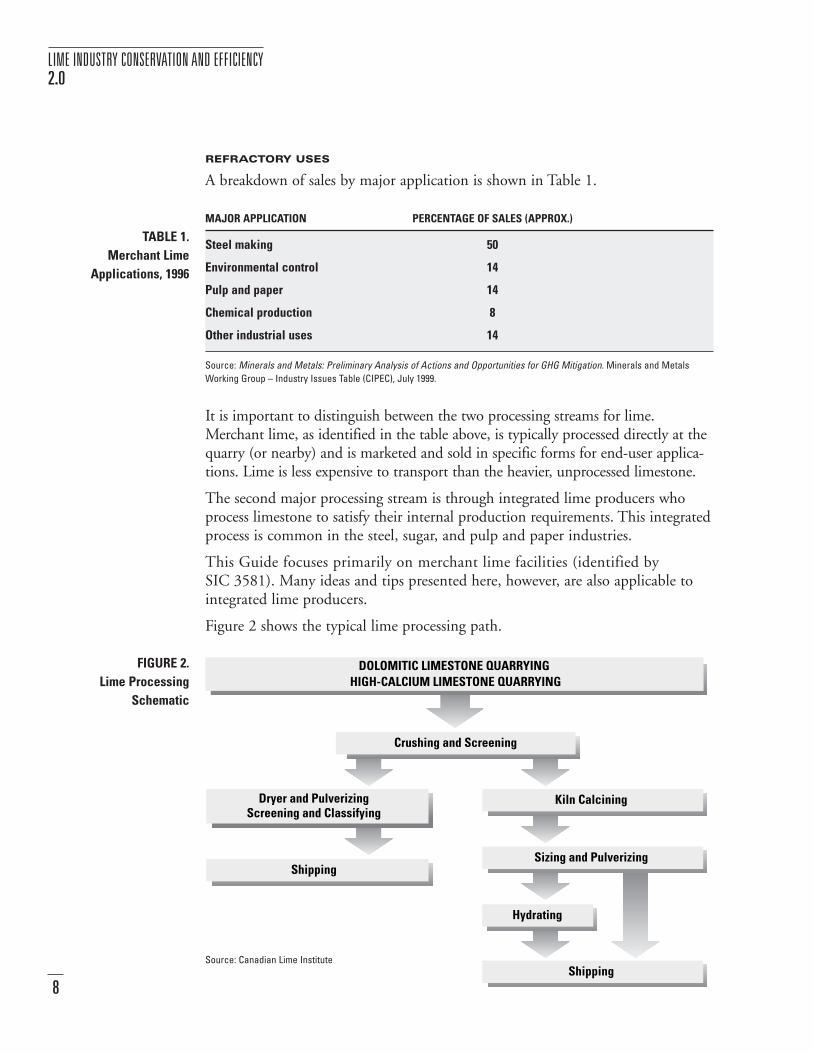
2.2 ENERGY USE AND BREAKDOWN
Energy costs account for approximately 40% of the total production cost of lime. Most of this energy (in the form of natural gas, petroleum coke, coal andheavy oils) is consumed in kilns during the calcining process. Fuels are selectedaccording to their availability and their impact on product quality and cost.Changes in maintenance schedules and costs also come into play in the overallselection of fuel.
Less costly fuels often require more energy to prepare and burn. These parametersmust be fully understood when selecting the fuel type, preparing costs or calculat-ing efficiencies. For example, coal and coal derivatives may require the use of aheated milling operation for which the cost of the fuel used in the preheat, themill drive and the fuel transportation pumps and fans must be included in thetotal energy analysis. The impact that the fuel has on the quality of the limedirectly affects the value and size of the market for the product, and should beincluded in the fuel cost analysis.
In comparison, natural gas requires no ancillary equipment and therefore theburnertip cost can be considered to be the total cost. This is not to imply thatnatural gas is a less expensive fuel to use, but it does require less energy to prepareand burn it. Furthermore, the burnertip fuel cost may be affected by its efficiencyin the kiln. The lower radiant capabilities of natural gas decrease the efficiency inthe kiln relative to coke or coal.
Based on 1996 figures, the total energy consumed in the merchant lime industryis 14.6 million gigajoules.1 Ratios of fuel types used are shown in Figure 3.
FIGURE 3. Energy Consumption byFuel Type
LIME INDUSTRY CONSERVATION AND EFFICIENCY2.0
91 Mineral and Metals Working Group of the Industry Issues Table: Minerals and Metals Foundation Paper, March 1999(available at http://www.nccp.ca/html/index.htm, “Issue Tables” and “Industry”).
Electricity4%Heavy Oils
5%Coal17%
Premium Coke23%
Natural Gas51%
LIME INDUSTRY CONSERVATION AND EFFICIENCY2.0
10
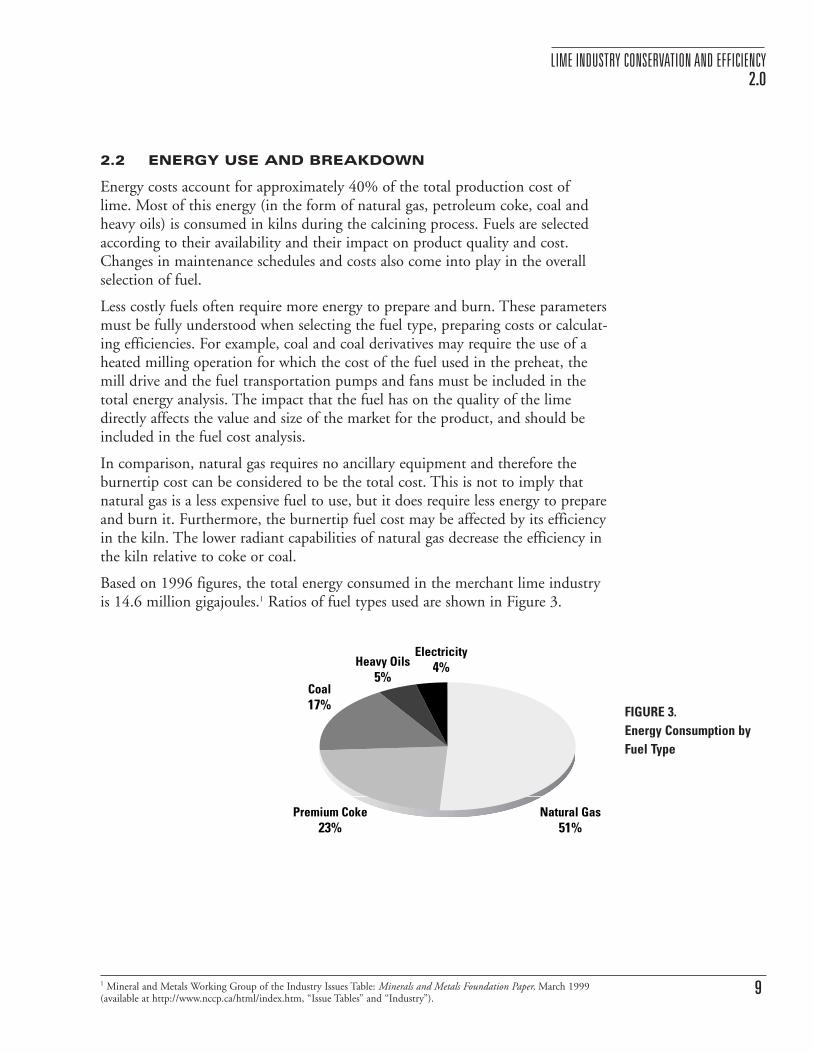
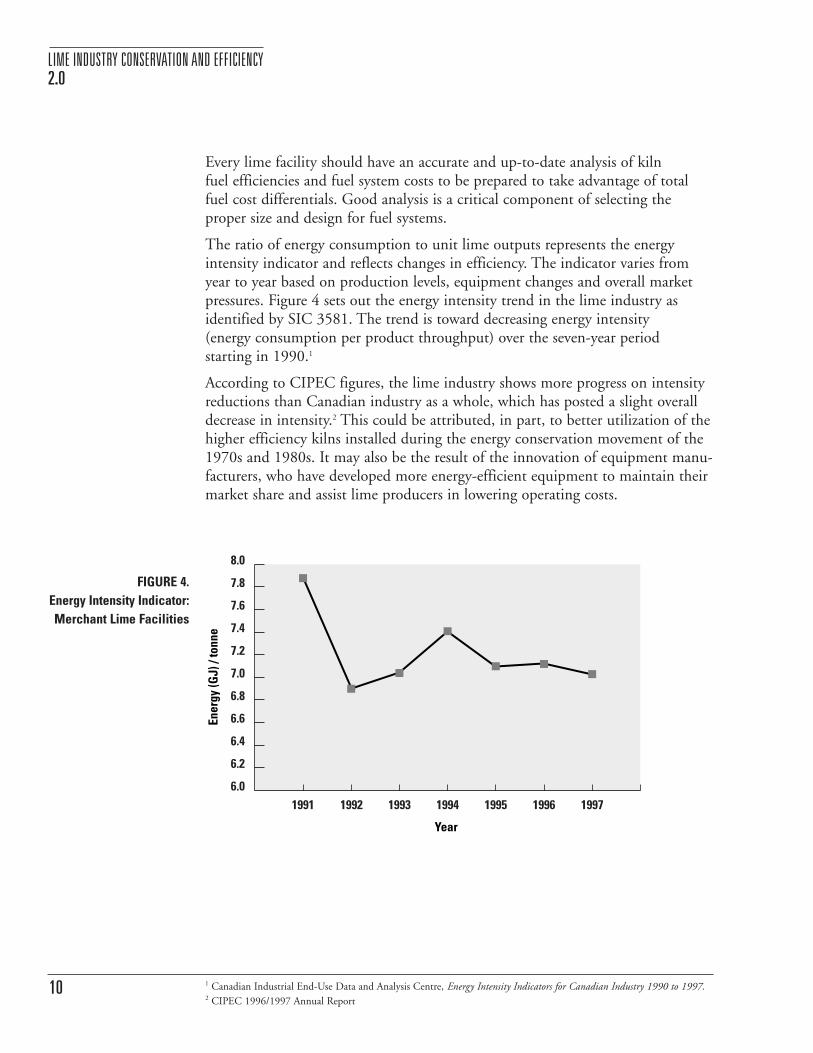
FIGURE 4.Energy Intensity Indicator:Merchant Lime Facilities
Every lime facility should have an accurate and up-to-date analysis of kiln fuel efficiencies and fuel system costs to be prepared to take advantage of totalfuel cost differentials. Good analysis is a critical component of selecting theproper size and design for fuel systems.
The ratio of energy consumption to unit lime outputs represents the energyintensity indicator and reflects changes in efficiency. The indicator varies fromyear to year based on production levels, equipment changes and overall marketpressures. Figure 4 sets out the energy intensity trend in the lime industry asidentified by SIC 3581. The trend is toward decreasing energy intensity (energy consumption per product throughput) over the seven-year period starting in 1990.1
According to CIPEC figures, the lime industry shows more progress on intensityreductions than Canadian industry as a whole, which has posted a slight overalldecrease in intensity.2 This could be attributed, in part, to better utilization of thehigher efficiency kilns installed during the energy conservation movement of the1970s and 1980s. It may also be the result of the innovation of equipment manu-facturers, who have developed more energy-efficient equipment to maintain theirmarket share and assist lime producers in lowering operating costs.
1 Canadian Industrial End-Use Data and Analysis Centre, Energy Intensity Indicators for Canadian Industry 1990 to 1997.2 CIPEC 1996/1997 Annual Report
Year
Ener
gy (G
J) /
tonn
e
6.01991 1992 1993 1994 1995 1996 1997
7.0
6.8
6.6
6.4
6.2
8.0
7.8
7.6
7.4
7.2

2.3 OVERALL KILN DESIGN
The age, type and specific design of a kiln affects its overall efficiency. As set out in Table 2, the efficiency of different units may range from 4.0 gigajoules per tonne (GJ/tonne) to 13 GJ/tonne,1 with a current acceptedindustry average of 6.6 GJ/tonne.2
All kiln replacements fall outside the scope of this Guide because the simple payback based on energy savings alone is well beyond the three-year point.However, market pressures, changes in product demand or consolidation of processes, combined with fuel savings, may make total kiln replacement feasible.
The kiln fuel efficiency analysis discussed in the preceding section provides partof the baseline for decisions on consolidation of process lines, with the under-standing that product quality must not be sacrificed. Whenever possible, themost efficient kiln should be operated the maximum number of hours, with lessefficient kilns brought on only as necessary. Increased throughput in the mostefficient kiln will make other efficiency upgrades, such as improved preheaters or refractory materials, more cost-effective.
Because of variations in chemical and physical properties of the limestone – aswell as in fuel supply, burner design, kiln design, required throughput and manyother factors – it is nearly impossible to recommend cost-effective kiln replace-ments or major modifications for specific sites. However, some basic guides havebeen included in Section 5.0. Overall kiln efficiencies based on design style areincluded in Table 2.
DESIGN OF KILN EFFICIENCY RANGE ESTIMATED PRODUCTION IN GJ/TONNE BY KILN TYPE
Long rotary kilns 7.0–13.0 30%(typically with no preheat)
Rotary hearth kilns 6.0–9.0 5%(calcimatic)
Short rotary kilns 5.5–8.0 30%(typically with preheaters)
Shaft or vertical kilns 5.0–7.0 20%
Double shaft or annular shaft kilns 4.0–4.5 15%
Source: Mineral and Metals Working Group of the Industry Issues Table: Minerals and Metals Foundation Paper, March 1999(available at http://www.nccp.ca/html/tables/industry.htm).
TABLE 2. Kiln Efficiencies Basedon Design Category
LIME INDUSTRY CONSERVATION AND EFFICIENCY2.0
111 Mineral and Metals Working Group of the Industry Issues Table: Minerals and Metals Foundation Paper, March 1999(available at http://www.nccp.ca/html/tables/industry.htm).2 Minerals and Metals Working Group

ENERGY COSTS3.0
12
3.1 NATURAL GAS
Natural gas costs have three primary components: transportation, distributionand commodity. The costs of these three variables can be modified or controlledto a degree. The current situation in the marketplace, in part caused by utilityunbundling and deregulation, represents an opportunity for the informed consumer. End-users can now select services and options to meet the specificrequirements of their facilities. It is important to ensure that natural gas is supplied at the appropriate rate, that pipeline or demand charges are mitigated,and that the proper program is in place to receive advantages from market fluctuations. Some areas to investigate include the following:
DISTRIBUTION
■ ensure an appropriate rate based on usage profile;
■ consolidate the number of meters to limit user charges;
■ choose between interruptible or firm service based on ability to switch fuel sources;
■ modify usage to gain preferential rate; and
■ ensure that correct billing charges are applied.
TRANSPORTATION
■ purchase transportation at the lowest cost according to risk profile;
■ avoid or mitigate demand charges; and
■ ensure that service contract is suitable to market conditions and load profile.
COMMODITY
■ make a least-cost commodity purchase; and
■ ensure that correct billing charges are applied.
The preceding list is not comprehensive, but it illustrates the point that simplypurchasing the commodity at a “good” price does not ensure natural gas at thelowest cost. There are several natural gas agents that work with end-users to monitor the market and recommend strategies for cost-effective purchasing.Using an agent alleviates the time allocation and associated burden of natural gas purchases, especially given the volatile nature of natural gas commodity pricesand frequent changes in tolls, tariffs and opportunities related to transportationand distribution.

3.2 ELECTRICITY
Electricity deregulation and utility unbundling are considered to be positive steps toward encouraging a competitive marketplace – utilities will no longer havea complete monopoly on all aspects of electricity generation, transmission andsupply services. Canada’s provinces have advanced toward deregulation on varyingtimetables, which means that opportunities will differ depending on location.
For example, in Ontario, the electricity sector offers flexibility in purchasing andsome control over transmission, services and distribution costs. Consumers thathave a clear understanding of how electricity is consumed at their facilities willhave the best potential for saving money in this new market.
Markets for electricity are much more complex than natural gas markets; the following discussion is intended to illustrate only a sample of the areas thatshould be investigated. There are two basic electricity rate structures, designedprimarily to recover the costs of power generation and infrastructure in differentmarket sectors. They are the time-of-use rate and the general service rate.
Time-of-use rates are designed to recover costs incurred by the utilities for generation of electricity at specific times. These rates are forecasted based on the anticipated costs to generate power at certain times. During daytime andevening hours (typically 7:00 a.m. to 11:00 p.m.), there is high overall demandand “peaking” generation is usually more costly to operate. Costs are passed backto the customers who consumed the incremental power.
In British Columbia, a variation on the time-of-use theme is called real-time pricing. Real-time pricing rates ensure that customer charges are based on theactual costs at the power pool, rather than on forecast costs.
Time-of-use and real-time pricing rates represent excellent cost-saving opportunities for facilities that can shift energy requirements to off-peak periods.
General service rate contracts allow customers to use electricity at any time of the day without penalties or benefits. The electricity charges are calculated in“blocks” – as the number of blocks used increases, the unit cost of the electricitydecreases. Savings are tied directly to reducing actual consumption. The day andnight peak charges are averaged to cover the costs associated with power genera-tion and supply. There are also seasonal changes in price from summer to winter,but these are of little consequence to the lime industry as most plants operateyear-round.
Most rates incorporate a demand charge element. Peak or maximum demand isusually in the form of a “spike” or high load for a short period, which sets thedemand charge rate for the billing period. Reducing this demand peak will notnecessarily reduce energy consumption, but it will lower electricity costs. Apotential area for demand savings in a quarry is in the de-watering pumps, whichshould be operated in off-peak hours in conjunction with a water level indicator.
ENERGY COSTS3.0
13

Other costs or cost reductions are applied to the basic rate schedules according to services and equipment supplied, such as transformer charges or credits, additional transmission charges, backup power charges, interruptible discountsand high-voltage discounts. It is suggested that all Canadian lime producers thoroughly investigate the rationale for all charges incurred to ensure that theyhave contracted with the electricity supplier at the appropriate and most cost-effective rate.
A cost-of-service analysis can be performed to estimate the profit margin a utility earns by serving a specific lime facility. This analysis can ensure that cross-subsidization of other customers or customer classes is minimized. A companycan achieve cost savings by negotiating with the utility if a specific facility isfound to be less costly for the utility to service than the tariff cost, which is based on an average customer.
The power factor charge is another cost that can be modified and manipulated.Power factor defines the relationship between active power and apparent powerand is, in fact, a measure of how effectively current and voltage are converted into useful electric power.
Power factor = kilowatts (resistive power)
kilovolt-amperes (resistive plus reactive)
Utilities can either charge customers a fee for having low power factors or theycan supply a rebate to those with high power factors. Although this is primarily a cost issue, there is a small efficiency gain through reducing resistive line losses.A low power factor can be improved with properly sized transformers, AC induction motors and heating coils, or by adding capacitor banks.
Lime producers responsible for their own transformers might consider acquiringnew higher-efficiency models that reduce the overall kVA load through reducinginternal losses. When a process or line is shut down or there is no load on a specific transformer, disconnecting the primary side of that transformer will avoid utilizing the energizing current that is consumed, even when there is nosecondary power draw.
A good Web site for support information on transformers can be found atwww.copper.org.
The following are some ways to boost electrical cost savings:
■ ensure that the contract allows for most beneficial rate structure;
■ negotiate custom rates as the utility will allow;
■ reduce the facility’s peak demand;
ENERGY COSTS3.0
14
■ correct power factor billing penalties;
■ ensure that all incurred costs are at the proper level for services received; and
■ prepare a cost-of-service analysis.
Municipal and provincial electrical utilities will often assist customers with temporary metering to provide a clearer picture of energy use. Their services may also include advice on reducing consumption and demand charges, andincreasing power factors.
A monitoring and targeting system (see Section 4.1) will provide the informationrequired to purchase energy intelligently by clearly showing how and when energyis used in a facility.
3.3 NON-UTILITY ENERGY
Non-utility energy – such as coal, coke, propane, gasoline, diesel fuel and oil – is more difficult to deal with in general terms. The price and availability of thesesources depend heavily on the region of use, competition between suppliers andgeneral supply and demand. Since prices are basically market-driven with little orno regulatory intervention, companies are better able to negotiate contracts andrates with suppliers, as they might for the commodity portion of natural gas.
Price and terms of delivery are tied to the risk profile of the end-user and will be decided in conjunction with the preparation of a fuel cost study as set out in Section 2.2, “Energy Use and Breakdown.”
3.4 PURCHASED WATER
Conservation of all natural resources, including water, is of concern to allCanadians. Use of purchased or processed water within the lime industry is very small and is a negligible component of total utility costs and consumption.Most water-related costs occur as a result of de-watering and not from the pur-chase of the commodity or maintenance of a well. Purchased or processed water is therefore not discussed in any detail in this Guide.
The hot water supply represents a very minor water-related energy cost.Mid- to high-efficiency hot water tanks can be purchased or rented for savings in high-usage areas such as showers. Simple payback of this measure will be directlyrelated to the level of consumption but should be less than three years. This meas-ure can be made even more cost-effective by installing water conservation showerheads and properly sizing the water tank. Insulation blankets on older hot watertanks reduce heat loss.
ENERGY COSTS3.0
15
4.1 MONITORING AND TARGETING
Monitoring and targeting (M&T) is a methodology used to quantify energy use,allowing for improvements to be made based on actual data rather than assumedvalues. M&T can be broken down into two stages: understanding in detail howenergy is currently being used and then identifying and implementing changesdesigned to reduce usage. M&T provides a disciplined and structured approachto ensure that all energy sources (gas, oil, electric, water, propane, etc.), primaryand secondary, are utilized to full potential.
Monitoring and targeting provides the baseline measurement of how much, howquickly and where and when energy is consumed in a facility. This information iscritical to the success of energy efficiency projects, as it identifies where the mosteffective improvements should occur and what their subsequent impact on utilityconsumption and cost will be.
Many facilities already have a substantial monitoring system in place and mayneed only to refine it to supply the information required for targeting.
Targeting is the interpretation of accurate data and the resulting identification of detailed solutions. The systems used in targeting should generate reports automatically to limit the amount of operator time required.
Targeting is more specialized energy management work and requires an in-depthunderstanding of energy applications. It is considered a continuous improvementstrategy and does not necessarily require capital resources for equipment replace-ment. Targeting includes the application of information gained through the monitoring or energy management system (EMS).
M&T allows the user to identify, understand and track the effect of many of the energy efficiency measures suggested throughout this Guide; it should be considered part of the process of developing a total energy management program.
A properly designed M&T system ensures that every point measured supplies critical data and has the ability to recover the cost of the meter and associatedhardware. This system should take advantage of existing metering equipmentwherever possible. M&T systems have a direct tie into ISO 14000 programs andcan increase the ongoing value received from investment in a quality system. Thereis also a benefit to the corporate mindset, as changes are accepted and imple-mented much more readily if it is easy to see the difference that has been made.
M&T systems can be implemented in a rather short time (six months) and somesavings can be realized almost immediately as a result of measurement of suspectareas of the process. Identifying larger savings opportunities may take longer, asthe collection of baseline data required to understand and identify problem areasmay take several years, especially for seasonally related issues.
GENERAL ENERGY EFFICIENCY METHODOLOGIES4.0
16

Total energy savings depend on knowledge of energy consumption patterns(when, where and how much). Energy savings are also linked to availability ofhigher efficiency equipment, over and above what is currently being used. AnM&T system is one of the best ways to identify, promote and track cost-effectiveoperational and equipment improvements.
Simple payback of this measure is shown in the table in Section 5.2, “General Methodologies.”
4.2 ENERGY ACCOUNTING
Energy accounting is directly related to the ability to monitor and meter energyuse. Where suitable business units or differentiation in department responsibilitiesexist, energy accounting uses monthly billing and internal reporting to tie energyconsumption to individual budgets or profit centres.
This accountability supports energy efficiency through increased awareness of thelink between cause and effect. It ties the cost of energy and the impact of its usedirectly to those who have the greatest ability to affect them. Managing costs atthis level helps to increase departmental responsibility and encourages users todevelop their own efficiency methodologies.
Breaking energy consumption down into smaller components also allows goals to be set at more realistic, manageable and tangible levels than a corporate-wideinitiative allows. Although targets can be derived from measured data, they mustbe realistic and agreed upon by those responsible for delivering the savings.Energy accounting is part of a continuous improvement strategy.
Simple payback of this measure is shown in the table in Section 5.2, “General Methodologies.”
4.3 EMPLOYEE AWARENESS AND TRAINING PROGRAMS
As with energy management systems, training and awareness can lead to energyreductions and process improvements. The goal should be to train staff, in termsof both skills and approach, to include energy efficiency in day-to-day practicesresulting in small but continuous improvements. It is also possible that excellentenergy-efficient products, services or opportunities have already been identifiedby staff members but have not been promoted because of perceived or real barriers such as those listed in Section 1.6.
An effective awareness and training program starts with senior management’scommitment to energy savings, support of the projects and encouragementthroughout the organization. Wherever possible, management should remove
GENERAL ENERGY EFFICIENCY METHODOLOGIES4.0
17

barriers, encourage open discussion and promote ideas that improve efficiency.Re-evaluate suggestions and opportunities as markets, energy costs and technologies change and evolve.
Several formal training and employee awareness programs are currently available,including those offered by Natural Resources Canada, the Canadian Institute forEnergy Training and a variety of independent stakeholders through conferencesand seminars.
Efficiency gains resulting from employee awareness and efficiency training are difficult to quantify; it is, however, safe to predict that other energy savings will belimited and short-lived without the commitment and support of staff members.
4.4 FACILITY MAINTENANCE
Maintenance is a crucial component of energy efficiency measures. Although the nature of lime itself presents maintenance challenges to the industry, morefacilities are recognizing the value of good maintenance practices.
Each facility should evaluate existing practices and balance preventive and predictive maintenance with the costs associated with downtime and repairs.Downtime represents the hard costs associated with inadequate maintenance and is usually well tracked and managed. The soft costs of maintenance affect the overall efficiency of a process and the quantity of energy required. This is not to indicate that maintenance has been ignored or does not follow the manu-facturers’ recommendations, but that maintenance is relevant to the efficiency of equipment and the facility.
For example, operating an air compressor with an air filter that may have become plugged prematurely (i.e. before scheduled maintenance) decreases inletmanifold pressure. For each 1% decrease, there is a corresponding 1% decrease inoperational efficiency. With improved maintenance practices, it may be possibleto recover 5–7% of this energy by avoiding operation with plugged filters. Theeffect is similar with most filtered equipment such as quarry and fleet vehicles.
Good filter maintenance can also avoid excessive air inlet restrictions, which contribute to excessive oil consumption and premature turbocharger failures.Where possible, perform maintenance in peak-energy cost periods and run systems normally in lower-cost periods. Specific recommendations regarding process equipment are made in Sections 5.1 to 5.10.
GENERAL ENERGY EFFICIENCY METHODOLOGIES4.0
18

The importance of proper sizing of new or replacement equipment is often overlooked. In the 1970s, it was common to design and build equipment thatcould accommodate substantially increased production or load levels. In manycases, the market or need has never increased and the equipment has spent its lifeoperating at partial load, which is usually less efficient than at design capability.Understanding process and load requirements – and measuring and monitoringloads – ultimately leads to replacement equipment which is the proper size, without falling back on the status quo.
It is a well-known and documented principle that most equipment should beshut down when not in use to conserve energy. However, this is often neglectedor forgotten in practice. Wherever possible, add automated controls or system interlocks to control equipment duty cycles. To reduce electricity costs, operateequipment in off-peak times to avoid added demand charges.
Improper lubrication can affect energy consumption at any industrial facility.Using synthetic lubricants in rollers, motors, gearboxes and reduction drivesdecreases friction and reduces associated labour and maintenance costs. Syntheticlubricants retain a more constant viscosity over wider temperature ranges, havehigher lubricating qualities, resist oxidation better and last longer than petroleumlubricants. In fact, using higher quality products can increase lubrication intervalssignificantly. A recent study on energy conservation techniques shows that usingsynthetic lubricants can reduce energy consumption by 10–20%1 (because of thefrictional losses associated with single-grade petroleum lubrication). The increasein initial lubricant cost is offset by longer life expectancy.
When changing lubricants or lubricating intervals, it is necessary to consult with equipment manufacturers to ensure compatibility with the design and materials used. Also, lubricants must be handled carefully to ensure they are contaminant- and moisture-free.
GENERAL ENERGY EFFICIENCY METHODOLOGIES4.0
191 Brewers Association of Canada, Natural Resources Canada and the Canadian Industry Program for Energy Conservation(CIPEC): Energy Efficiency Opportunities in the Canadian Brewing Industry, Ottawa, 1998. Available at no cost fromNatural Resources Canada’s Office of Energy Efficiency; fax (613) 947-4121.

5.1 INTRODUCTION
This section suggests potential areas of savings as applicable to various processesor appliances within the lime industry. The tables found at the end of each topicgive simple payback estimates for identified tips. Simple payback is defined as thetotal cost of a measure divided by the annual energy cost savings. The sampletable below describes typical data presented within this document.
TYPE OF MEASURES TYPE OF INVESTMENT SIMPLE PAYBACK COMMENTS
Low or no investment Resource, training or Six months or less As applicableprocedure
Retrofit opportunities Capital Six months to three years As applicable
Major retrofits Capital More than three years As applicable
An attempt has been made to present tips related to generic measures and technologies before specific ones, because many of the general measures apply toseveral different areas. For example, in the case of electric motors, the initial tipsgiven in the general section apply to almost all motorized appliances, such as conveyors, air compressors and crushers.
Where “each element” is stated in a table, this indicates that each of the measuresin the section individually result in the simple payback specified and that all measures need not be implemented to supply the stated results.
5.2 GENERAL METHODOLOGIES
The following table supplies an economic measurement of the generic energy efficiency tips suggested in the first half of this document. Section numbers ofthis Guide have been listed in the comments column for easy reference to the relevant section.
MEASURE TYPE OF INVESTMENT SIMPLE PAYBACK COMMENTS
Power factor correction Resource, training, Six months to three years Section 3.2capital
Energy-efficient transformers Capital Six months to three years Section 3.2
Disconnecting transformer Resource Six months or less Section 3.2primary when not in use
Higher efficiency hot Capital or rental Six months to three years Section 3.4water tank
Monitoring and targeting Capital Six months to three years Section 4.1
Energy accounting Resource Six months or less Section 4.2
Employee awareness Training Six months or less Section 4.3
Facility maintenance Resource Six months or less Section 4.4
Proper equipment sizing Resource Six months or less Section 4.4
Sample Table
TABLE 3.General Methodologies
ENERGY EFFICIENCY TIPS5.0
20

5.3 LIGHTING
Lighting is not a high priority at most lime facilities. There are, however, somerelatively simple, low-capital opportunities to reduce electricity consumption.When improvements or upgrades are being done, each lighted area should beaddressed to ascertain the correct wattage and number of fixtures for a given styleof lamp. If an area is found to have excessive lighting levels, reduce the number of lighting fixtures in that area.
Lights need to be controlled to ensure that they are operated only when required.This can be done manually, through photocells or through the use of timers.Manual control is a low-cost measure, but is also the least conducive to energyefficiency and probably the least effective. Giving the responsibility for turninglights on and off to one person (say, an employee doing rounds) may help eliminate unnecessary daytime operation. A good employee training program will assist with this measure.
Using photocells to control the timing of lighting is a widely accepted practiceand yields good savings, especially when combined with an override system for off-hours. However, if sunlight is blocked from the sensor (because of dust,dirt, airborne contaminants or shade), lights may remain on, so caution should be exercised.
Timers with manual overrides are the most effective technique for controllinglighting and can be programmed to turn on or off at various times, depending onneed. This is also a more expensive retrofit because it requires integrating lightingcircuits in each building or grounds area. However, timers should be installed as amatter of course for each new building, area design or building stage.
Lighting types should be the most efficient available for the purpose. Where there are low ceilings indoors, use fluorescent instead of incandescent lighting.For outdoor applications, use low-energy sodium lamps. Colour rendition is generally not an important quality for lighting in most areas of the lime industry.
Wherever possible, eliminate the use of portable light stands and generators. A portable generator converts only approximately 30% of the fuel energy intoelectricity; the rest of the fuel is rejected through the engine cooling system.
OVERALL LIGHTING STRATEGIES
■ Use lights out of necessity, not out of routine. Encourage employees to shut off lights when not required.
■ Use motion detectors in offices or where staff presence is intermittent.
■ Use lighting timers instead of photocells on external lights and process building lights.
■ Ensure that external lighting is the most efficient available for the application.
ENERGY EFFICIENCY TIPS5.0
21
CAPITAL PROJECTS
■ Replace incandescent and older fluorescent lamps with high-efficiency fluorescent lighting.
■ Utilize high-efficiency magnetic ballasts (instead of electronic ballasts) for low-duty fluorescent lights and electronic ballasts for higher-duty lights.
■ Replace external lighting with sodium lamps.
■ In buildings with high ceilings, replace older fluorescent lights with sodium or metal halide lights.
■ Install timer systems as appropriate.
MEASURE TYPE OF INVESTMENT SIMPLE PAYBACK
Overall lighting strategies (each element) Resource Six months or less
Capital projects (each element) Capital Six months to three years
5.4 HEATING OF BUILDINGS
Lime processing facilities generally require a marginal amount of space heating;therefore, opportunities for energy reductions are limited. Approximately 10 –15% of the total building heating costs can be recovered through the measures described below.
Most offices are heated with electricity or forced-air gas, oil or propane.Converting from electric to gas, oil or propane can offer cost advantages, depending on fuel availability and prices at each location. New or replacementfurnaces should be mid- and high-efficiency, with automated setback controls. As in the home, ensure that windows and doors are closed promptly and thatweatherstripping and seals are in good condition.
Workshop and repair areas are best heated with tube-type low-intensity infraredheaters. They are more efficient and will be less affected by difficult conditionsthan conventional unit heaters. They are also more durable than high-intensityinfrared heaters, which have the additional drawback of emitting water from theproducts of combustion into the working environment. New ambient and radiantsensing thermostats can assist in avoiding overheating and ensuring temperaturesetback in periods without occupancy, resulting in up to 15% energy efficiency gain.
OPERATIONAL PROCEDURES
■ Where possible, heat only critical equipment storage areas.
■ Install and use setback thermostats.
■ Update weatherstripping and seals in all heated areas.
■ Shut off ventilation in off-peak periods.
ENERGY EFFICIENCY TIPS5.0
22

CAPITAL IMPROVEMENTS
■ Install high-efficiency furnaces.
■ Update the building envelope to minimize air infiltration in maintenanceshops and offices.
■ In shops, use low-intensity infrared heaters along with radiant thermostats.
■ Convert to less expensive fuel.
■ Install rapid door closers in high-traffic areas.
MEASURE TYPE OF INVESTMENT SIMPLE PAYBACK
High-efficiency furnace replacement Capital More than three years
Low-intensity infrared replacement Capital More than three years
Replacement at end of service life Maintenance Six months or less
Infrared thermostat Capital Six months or less
5.5 AIR COMPRESSOR SYSTEMS
Compressed air is used in the lime industry for control systems, cleaning purposes and fluidization of fines. The consumption or waste of compressed air is often overlooked. Compressed air is an inherently inefficient medium as an estimated 85% of the original energy consumed by the compressor is directlyconverted to heat.
Air compressor use and load may not be a prime consideration. However, significant gains are available through equipment replacement and modifiedmaintenance and operational procedures. Most newer equipment incorporatesefficiency practices and controls into the initial design or system package.
MAINTENANCE/DESIGN
■ Replace filters based on pressure drop.
■ Duct the fresh air inlet outdoors to provide the coolest air possible.
■ Ensure proper compressor pump cooling.
■ Identify and eliminate compressed air leakage.
■ Eliminate unused branches of air piping system.
■ Run the system at the lowest practical air pressure.
■ Duct discharged cooling air outdoors in the summer and into the building for additional heating in the winter.
■ Implement leak detection and repair procedures.
ENERGY EFFICIENCY TIPS5.0
23

OPERATIONAL MEASURES
■ Where possible, use air based on actual requirements, not a timed schedule.
■ Shut off all air-consuming equipment and compressors when not in use.
■ Review applications and make changes to ensure that compressed air is usedonly in effective applications.
■ Eliminate air controls that utilize air bleeds to the atmosphere.
CAPITAL PROJECTS
Ordinarily, older inefficient compressors should be replaced with updated efficient models. These models feature advances in the operational parameters,including variable speed drives and full-load/no-load operating techniques. Most manufacturers offer conventional and high-efficiency products for energyefficiency. Heavy-duty systems are also available to ensure the optimum operationeven under less than desirable conditions.
The overall system should be designed to suit the specific site. Undersized filtration systems or poorly designed header or distribution systems can causepressure drops with corresponding efficiency losses.
CAPITAL PROJECTS
■ Consider retrofitting existing air compressors with variable speed electronics and drives.
MEASURE TYPE OF INVESTMENT SIMPLE PAYBACK COMMENTS
Maintenance/design Resource Six months or less —(each element)
Timing and use Resource Six months or less —(each element)
Standard replacement Capital More than three years Lowered paybackwith heat recovery
High-efficiency Capital More than three years Lowered paybackreplacement with heat recovery
Variable frequency Capital More than three years Very dependent drive retrofit on type of load
ENERGY EFFICIENCY TIPS5.0
24
5.6 ELECTRIC MOTORS
A purchasing standard should be adopted to ensure that all newly acquiredmotors fall into the high-efficiency category. This is currently under way in mostfacilities where motors are being replaced as required. Some older motors shouldbe replaced through an updating maintenance schedule, even if they have not yetshown signs of failure.
Standards for high-efficiency motors start at approximately 80% ratings forsmaller motors and increase to approximately 95% for larger motors (more than500 horsepower). As a rule of thumb, purchase motors with efficiency ratings of90% or higher.
However, efficiency ratings are mostly irrelevant if a motor is operating at lessthan approximately 75% of its rated capacity. The tendency to oversize motorscontradicts attempts to become more energy efficient. Therefore, when replacingmotors, ensure that the specifications meet the application requirements (includinga reasonable safety factor) rather than resort to “nameplate replacement” of theold motor. This advice applies to all motors on-site that have regular duty cycles,including pumps, fans and drives.
Excellent reference information regarding motor efficiency and design is availablethrough the Copper Development Association’s Web site at www.copper.org.
All motor drive systems have inherent inefficiencies due to frictional losses.Standard V-belts tend to stretch, slip, bend and compress, which leads to a loss ofefficiency. Under well-maintained conditions, a V-belt will run at approximately92% efficiency. Replacing these belts with cog-style belts can result in savings ofapproximately 2%, and upgrading to high-torque belts can result in up to 6%additional savings over the base case. Cog-style belts also require less maintenanceand have a substantially longer life expectancy.
MEASURE TYPE OF INVESTMENT SIMPLE PAYBACK COMMENTS
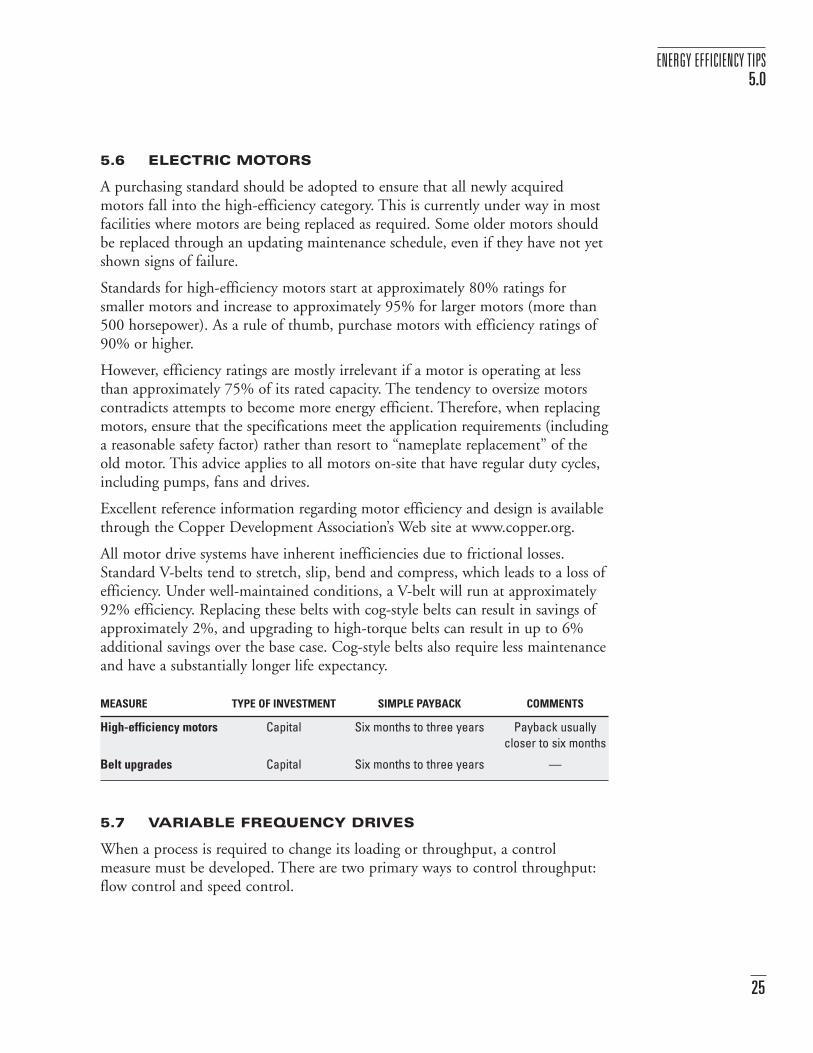
High-efficiency motors Capital Six months to three years Payback usually closer to six months
Belt upgrades Capital Six months to three years —
5.7 VARIABLE FREQUENCY DRIVES
When a process is required to change its loading or throughput, a control measure must be developed. There are two primary ways to control throughput:flow control and speed control.
ENERGY EFFICIENCY TIPS5.0
25
A flow control system typically operates at a constant drive speed but varies theoutput through “throttling” the flow with the use of inlet or outlet dampers, inlet or outlet valves or flow-bypass systems. A damper or valve system typicallyprovides a lower cost alternative at first, but offers slight, if any, energy efficiencyduring partial load operation. A bypass design directs a portion of the outputflow back to the inlet of the pump, thereby reducing the usable output of a fan or pump.
Adjusting the speed of an operation through the use of a variable speed pulleysystem also allows process flow control. This process provides some energy savingsbut may have an adverse effect on the facility’s power factor due to the reductionof motor loads. Whenever changing drive speeds, it is critical to ensure that theefficiency of the driven equipment is not adversely affected, i.e. that slowingdown a fan does not decrease the efficiency of the fan.
A variable frequency drive (VFD) changes the speed of a motor by changing thevoltage and frequency of the electricity supplied to it, based on the system or loadrequirements. Properly engineered and controlled, a VFD will provide a widevariation in motor shaft speeds while offering substantial energy efficiency duringlower speed or partial load operations.
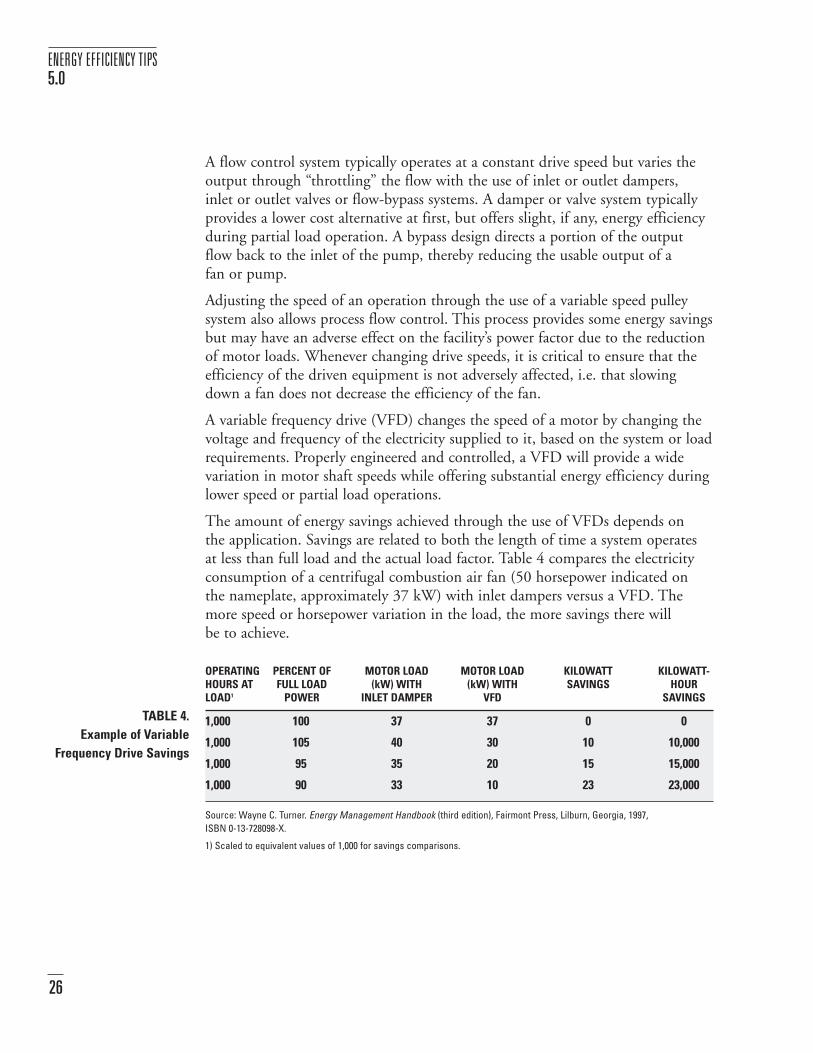
The amount of energy savings achieved through the use of VFDs depends on the application. Savings are related to both the length of time a system operates at less than full load and the actual load factor. Table 4 compares the electricityconsumption of a centrifugal combustion air fan (50 horsepower indicated on the nameplate, approximately 37 kW) with inlet dampers versus a VFD. Themore speed or horsepower variation in the load, the more savings there will be to achieve.
OPERATING PERCENT OF MOTOR LOAD MOTOR LOAD KILOWATT KILOWATT-HOURS AT FULL LOAD (kW) WITH (kW) WITH SAVINGS HOURLOAD1 POWER INLET DAMPER VFD SAVINGS
1,000 100 37 37 0 0
1,000 105 40 30 10 10,000
1,000 95 35 20 15 15,000
1,000 90 33 10 23 23,000
Source: Wayne C. Turner. Energy Management Handbook (third edition), Fairmont Press, Lilburn, Georgia, 1997, ISBN 0-13-728098-X.
1) Scaled to equivalent values of 1,000 for savings comparisons.
TABLE 4.Example of Variable
Frequency Drive Savings
ENERGY EFFICIENCY TIPS5.0
26

5.8 QUARRY VEHICLES
Diesel fuel used in quarry vehicles accounts for a small percentage of the totalfuel consumed within the lime industry. Tracking use by vehicle can identify efficient versus inefficient equipment and can assist in quantifying impacts. Thisinformation can then be equated to equipment design, age, application or main-tenance. Most of the recommendations apply to smaller fleet vehicles with anemphasis on selecting the most appropriate vehicle for the intended use.
The idling time of all vehicles should be reduced as much as possible. Ratings ofengines vary, but a typical diesel highway vehicle engine can consume 2.5 litres offuel per hour of idling. Reducing idling by half an hour per day over an averagework year represents approximately 375 litres of fuel savings. The Toronto CityCouncil has passed a by-law to limit idling to no more than three minutes in agiven 60-minute period to reduce the environmental impact of unnecessary vehicle operation. It was found that shutting off and restarting an engine withinthree minutes was cost-effective.
Some sites have also gained efficiency through face-crushing the limestone andthen transporting it by conveyor rather than trucking the stone to a crusherlocated at the processing plant. These gains may be site-specific.
Air filter maintenance and associated efficiency gains, as discussed in Section 4.4,“Facility Maintenance,” are applicable to all quarry vehicles.
OPERATIONAL MEASURES
■ Log fuel use by vehicle (on-board computers on newer vehicles offer this feature).
■ Where possible, shift efficient vehicles to higher duty cycles and less efficientones to lower duty cycles (select the most appropriate vehicle for the task).
■ Avoid idling for more than three minutes.
■ Reduce spillage during filling, and fill only 95% of the tank to allow for expansion.
■ Operate the vehicle in the most economic fuel range; if necessary, reset the governors.
■ Use synthetic lubricants as applicable.
■ Correct air filter maintenance (approximately 1% efficiency loss for each 1% decrease of inlet air pressure).
CAPITAL PROJECTS
■ Where appropriate, combine the load of many small vehicles into fewer largerones. Evaluate use and select the appropriate vehicle.
ENERGY EFFICIENCY TIPS5.0
27
■ Consider selecting higher-efficiency engines in new vehicles.
■ Evaluate opportunities to face-crush and convey stone rather than trucking to the facility crusher.
MEASURE TYPE OF INVESTMENT SIMPLE PAYBACK COMMENTS
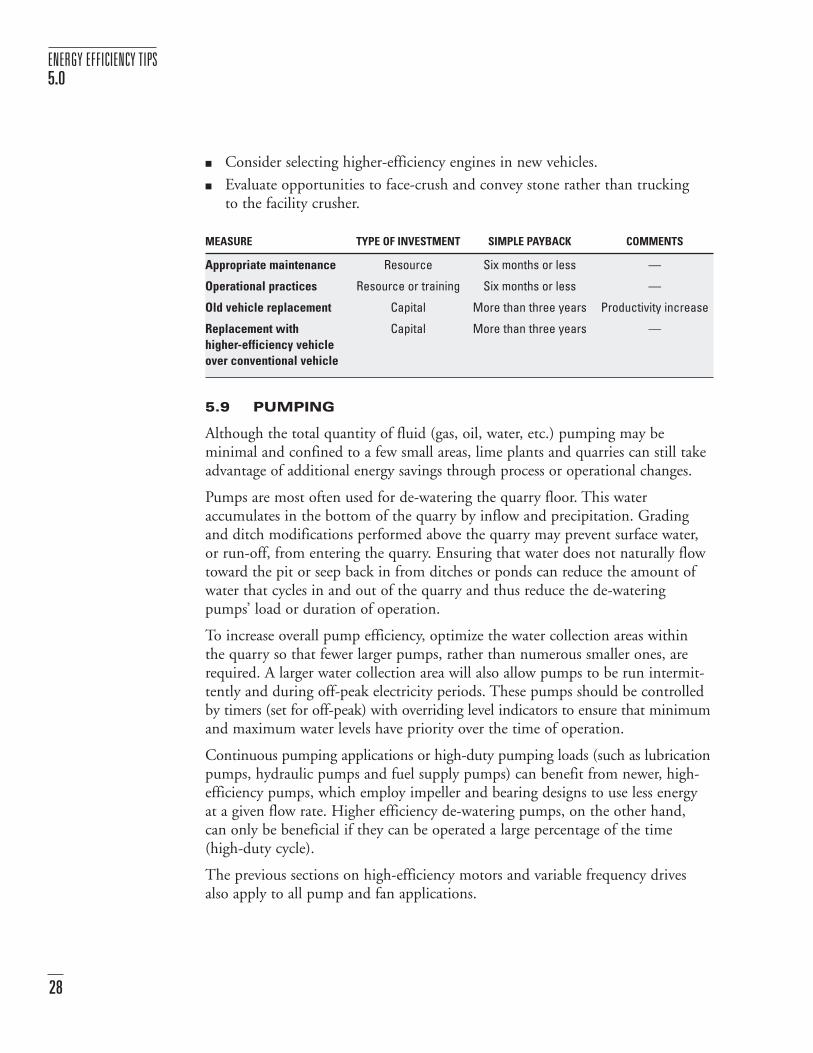
Appropriate maintenance Resource Six months or less —
Operational practices Resource or training Six months or less —
Old vehicle replacement Capital More than three years Productivity increase
Replacement with Capital More than three years —higher-efficiency vehicleover conventional vehicle
5.9 PUMPING
Although the total quantity of fluid (gas, oil, water, etc.) pumping may be minimal and confined to a few small areas, lime plants and quarries can still takeadvantage of additional energy savings through process or operational changes.
Pumps are most often used for de-watering the quarry floor. This water accumulates in the bottom of the quarry by inflow and precipitation. Gradingand ditch modifications performed above the quarry may prevent surface water,or run-off, from entering the quarry. Ensuring that water does not naturally flowtoward the pit or seep back in from ditches or ponds can reduce the amount ofwater that cycles in and out of the quarry and thus reduce the de-wateringpumps’ load or duration of operation.
To increase overall pump efficiency, optimize the water collection areas within the quarry so that fewer larger pumps, rather than numerous smaller ones, arerequired. A larger water collection area will also allow pumps to be run intermit-tently and during off-peak electricity periods. These pumps should be controlledby timers (set for off-peak) with overriding level indicators to ensure that minimumand maximum water levels have priority over the time of operation.
Continuous pumping applications or high-duty pumping loads (such as lubricationpumps, hydraulic pumps and fuel supply pumps) can benefit from newer, high-efficiency pumps, which employ impeller and bearing designs to use less energy at a given flow rate. Higher efficiency de-watering pumps, on the other hand, can only be beneficial if they can be operated a large percentage of the time(high-duty cycle).
The previous sections on high-efficiency motors and variable frequency drivesalso apply to all pump and fan applications.
ENERGY EFFICIENCY TIPS5.0
28
OPERATIONAL MEASURES
■ Reduce water inflow into the quarry.
■ Optimize water collection areas to allow stockpiling or ponding and enable off-peak pumping.
■ De-watering should be performed during off-peak periods instead of when levels warrant.
■ In all pump operations, limit bypass flow control as much as possible.
CAPITAL PROJECTS
■ High-efficiency motors
■ Consolidation of pumps
■ High-duty, high-efficiency pumps
■ Low-duty, high-efficiency pumps
MEASURE TYPE OF INVESTMENT SIMPLE PAYBACK COMMENTS
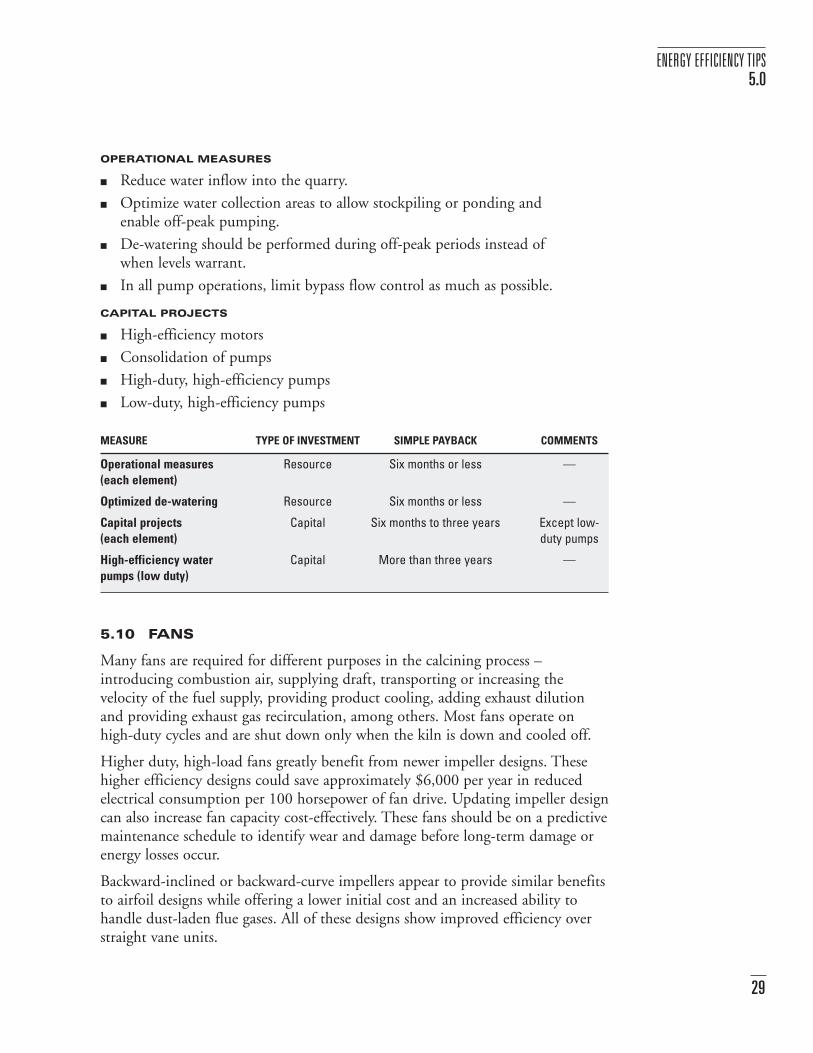
Operational measures Resource Six months or less —(each element)
Optimized de-watering Resource Six months or less —
Capital projects Capital Six months to three years Except low- (each element) duty pumps
High-efficiency water Capital More than three years —pumps (low duty)
5.10 FANS
Many fans are required for different purposes in the calcining process – introducing combustion air, supplying draft, transporting or increasing the velocity of the fuel supply, providing product cooling, adding exhaust dilutionand providing exhaust gas recirculation, among others. Most fans operate onhigh-duty cycles and are shut down only when the kiln is down and cooled off.
Higher duty, high-load fans greatly benefit from newer impeller designs. Thesehigher efficiency designs could save approximately $6,000 per year in reducedelectrical consumption per 100 horsepower of fan drive. Updating impeller designcan also increase fan capacity cost-effectively. These fans should be on a predictivemaintenance schedule to identify wear and damage before long-term damage orenergy losses occur.
Backward-inclined or backward-curve impellers appear to provide similar benefitsto airfoil designs while offering a lower initial cost and an increased ability tohandle dust-laden flue gases. All of these designs show improved efficiency overstraight vane units.
ENERGY EFFICIENCY TIPS5.0
29
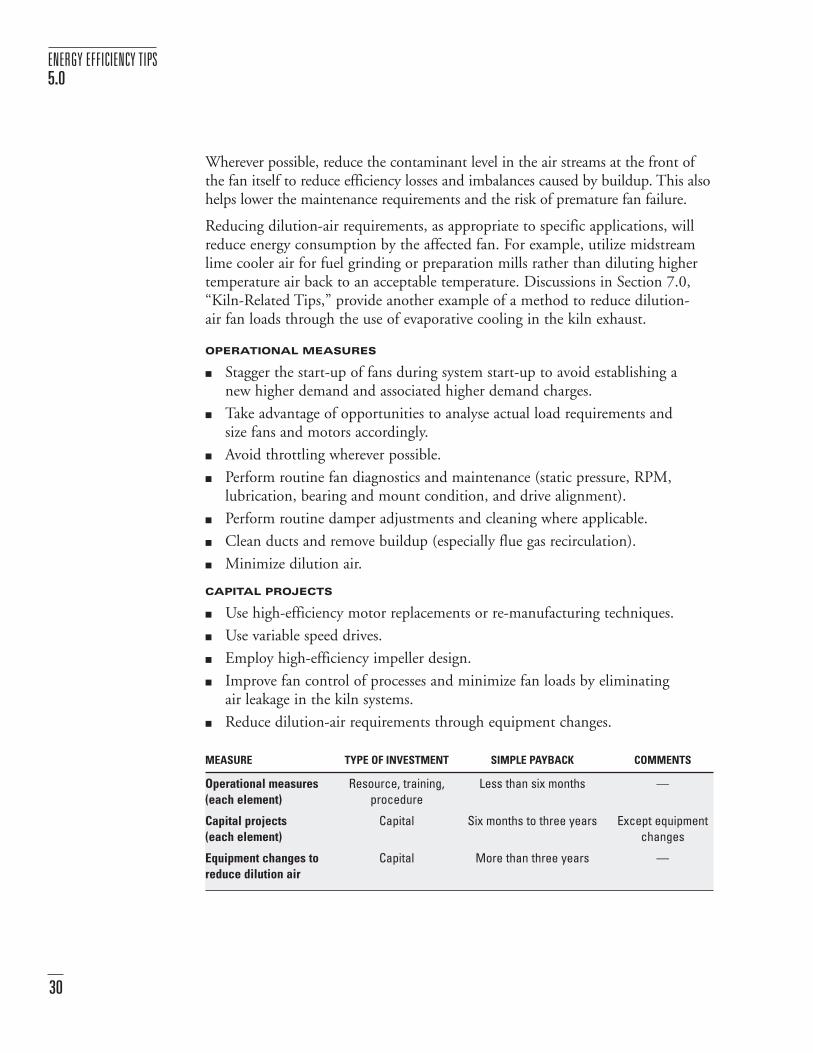
Wherever possible, reduce the contaminant level in the air streams at the front ofthe fan itself to reduce efficiency losses and imbalances caused by buildup. This alsohelps lower the maintenance requirements and the risk of premature fan failure.
Reducing dilution-air requirements, as appropriate to specific applications, willreduce energy consumption by the affected fan. For example, utilize midstreamlime cooler air for fuel grinding or preparation mills rather than diluting highertemperature air back to an acceptable temperature. Discussions in Section 7.0,“Kiln-Related Tips,” provide another example of a method to reduce dilution-air fan loads through the use of evaporative cooling in the kiln exhaust.
OPERATIONAL MEASURES
■ Stagger the start-up of fans during system start-up to avoid establishing a new higher demand and associated higher demand charges.
■ Take advantage of opportunities to analyse actual load requirements and size fans and motors accordingly.
■ Avoid throttling wherever possible.
■ Perform routine fan diagnostics and maintenance (static pressure, RPM, lubrication, bearing and mount condition, and drive alignment).
■ Perform routine damper adjustments and cleaning where applicable.
■ Clean ducts and remove buildup (especially flue gas recirculation).
■ Minimize dilution air.
CAPITAL PROJECTS
■ Use high-efficiency motor replacements or re-manufacturing techniques.
■ Use variable speed drives.
■ Employ high-efficiency impeller design.
■ Improve fan control of processes and minimize fan loads by eliminating air leakage in the kiln systems.
■ Reduce dilution-air requirements through equipment changes.
MEASURE TYPE OF INVESTMENT SIMPLE PAYBACK COMMENTS
Operational measures Resource, training, Less than six months —(each element) procedure
Capital projects Capital Six months to three years Except equipment (each element) changes
Equipment changes to Capital More than three years —reduce dilution air
ENERGY EFFICIENCY TIPS5.0
30

6.1 PROCESS FLOW, HANDLING AND PRODUCT QUALITY
Excessive product handling creates two basic problems: more energy is consumedhandling the product, and the product loses some quality through the increasedlevels of fines.
Reducing the motor hours used for elevating and conveying limestone and limeresults in direct energy savings. If a bypass is required due to a differential in feedrates, investigate the use of a variable speed drive on one of the mechanisms.Wherever possible, handle or move the product as little as possible.
Related to product handling, accurate weighing of the product will encouragegood business decisions. This is not a direct energy measure but may affect theoperators’ ability to understand or compare process settings. For instance, if twoidentical kilns operating at the same fuelling rate and product type seem to beproducing different quantities of product, it would appear that one kiln is moreefficient than the other, which could lead to an inappropriate business decision.
Implementing a recognized quality system such as an ISO 14000 or equivalentprogram provides the tools to understand, document and quantify quality-relatedissues. Quality management with a quality system shows a payback rather than a“cost of doing business.” Efficiency projects are also more likely to be supported bymanagement that has already acknowledged the intrinsic value of a quality system.
Quality systems also offset some of the costs associated with project identificationand quantification. Installing a quality system assists in identifying gaps or inac-curacies in existing procedures and processes. One example might be directenergy savings achieved through a documented and repeatable sensor-calibrationprocedure. Prior to the implementation of a quality system, it would not beunusual for two people to calibrate the same sensor in two different ways, result-ing in the process operating at two slightly different levels or efficiencies.
There are a number of ways to measure product quality based on the residualstone remaining in the product after calcining, which can be identified or quantified by either a loss on ignition test (LOI test) or a CO2 analysis. In simpleterms, the LOI test uses a measured sample of finished lime which is weighed,heated and weighed again. The difference in weight before and after heating is an indicator of the amount of stone still in the product. The maximum allowable difference depends on the end-user’s specification, but it is typicallyapproximately 3%.
It has been proven in practice that partially calcined limestone that is allowed tocool cannot be reprocessed to recover the remaining lime, resulting in failure toachieve quality standards and disposal of the off-specification product.
TIPS FOR THE LIME INDUSTRY 6.0
31
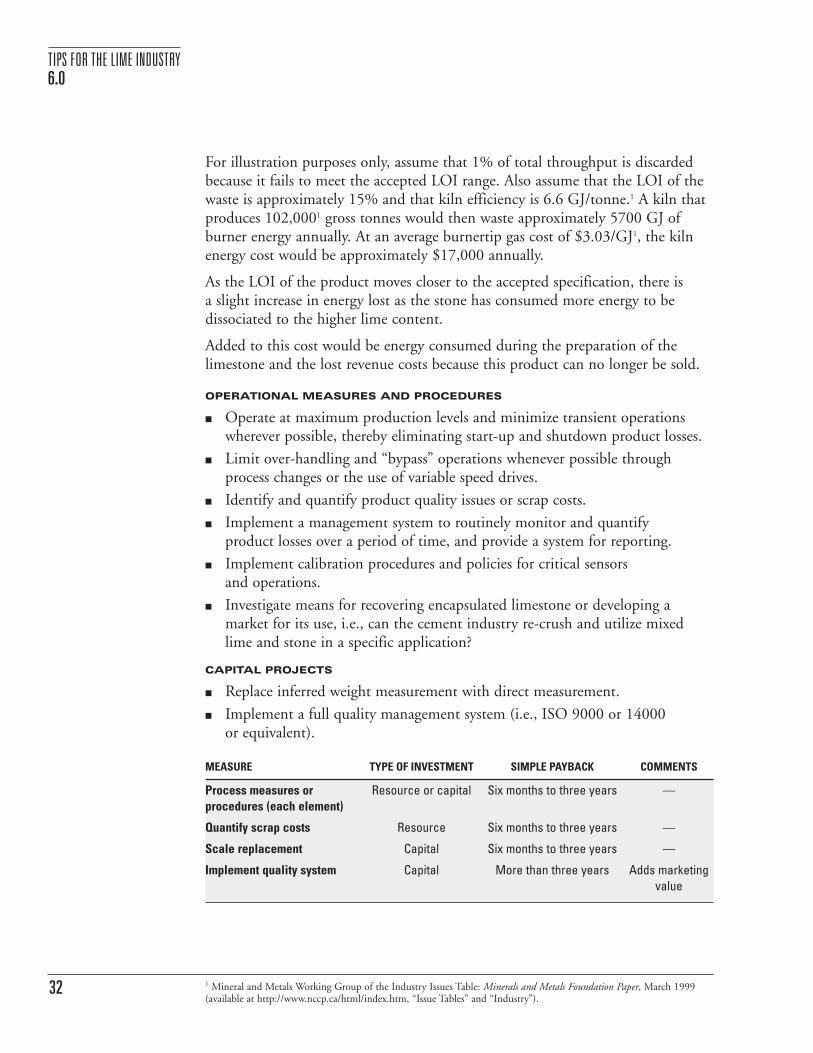
For illustration purposes only, assume that 1% of total throughput is discardedbecause it fails to meet the accepted LOI range. Also assume that the LOI of thewaste is approximately 15% and that kiln efficiency is 6.6 GJ/tonne.1 A kiln thatproduces 102,0001 gross tonnes would then waste approximately 5700 GJ ofburner energy annually. At an average burnertip gas cost of $3.03/GJ1, the kilnenergy cost would be approximately $17,000 annually.
As the LOI of the product moves closer to the accepted specification, there is a slight increase in energy lost as the stone has consumed more energy to be dissociated to the higher lime content.
Added to this cost would be energy consumed during the preparation of the limestone and the lost revenue costs because this product can no longer be sold.
OPERATIONAL MEASURES AND PROCEDURES
■ Operate at maximum production levels and minimize transient operationswherever possible, thereby eliminating start-up and shutdown product losses.
■ Limit over-handling and “bypass” operations whenever possible through process changes or the use of variable speed drives.
■ Identify and quantify product quality issues or scrap costs.
■ Implement a management system to routinely monitor and quantify product losses over a period of time, and provide a system for reporting.
■ Implement calibration procedures and policies for critical sensors and operations.
■ Investigate means for recovering encapsulated limestone or developing a market for its use, i.e., can the cement industry re-crush and utilize mixedlime and stone in a specific application?
CAPITAL PROJECTS
■ Replace inferred weight measurement with direct measurement.
■ Implement a full quality management system (i.e., ISO 9000 or 14000 or equivalent).
MEASURE TYPE OF INVESTMENT SIMPLE PAYBACK COMMENTS
Process measures or Resource or capital Six months to three years —procedures (each element)
Quantify scrap costs Resource Six months to three years —
Scale replacement Capital Six months to three years —
Implement quality system Capital More than three years Adds marketing value
TIPS FOR THE LIME INDUSTRY6.0
32 1 Mineral and Metals Working Group of the Industry Issues Table: Minerals and Metals Foundation Paper, March 1999(available at http://www.nccp.ca/html/index.htm, “Issue Tables” and “Industry”).
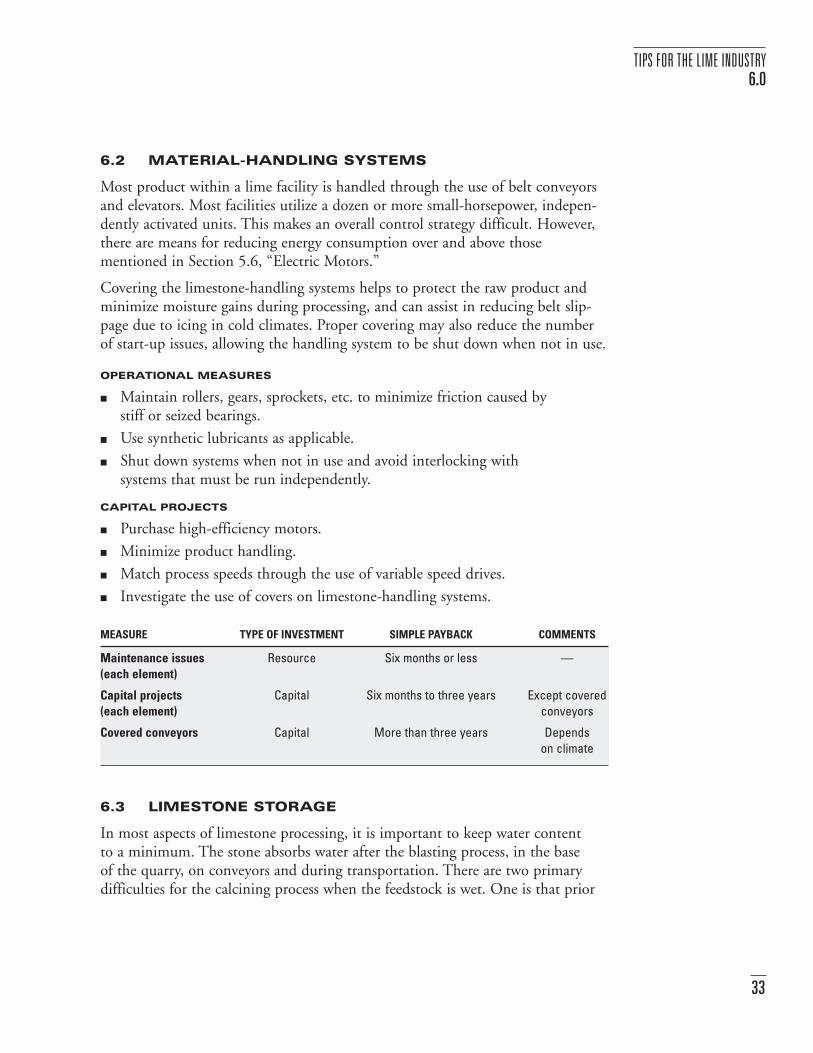
6.2 MATERIAL-HANDLING SYSTEMS
Most product within a lime facility is handled through the use of belt conveyorsand elevators. Most facilities utilize a dozen or more small-horsepower, indepen-dently activated units. This makes an overall control strategy difficult. However,there are means for reducing energy consumption over and above those mentioned in Section 5.6, “Electric Motors.”
Covering the limestone-handling systems helps to protect the raw product andminimize moisture gains during processing, and can assist in reducing belt slip-page due to icing in cold climates. Proper covering may also reduce the numberof start-up issues, allowing the handling system to be shut down when not in use.
OPERATIONAL MEASURES
■ Maintain rollers, gears, sprockets, etc. to minimize friction caused by stiff or seized bearings.
■ Use synthetic lubricants as applicable.
■ Shut down systems when not in use and avoid interlocking with systems that must be run independently.
CAPITAL PROJECTS
■ Purchase high-efficiency motors.
■ Minimize product handling.
■ Match process speeds through the use of variable speed drives.
■ Investigate the use of covers on limestone-handling systems.
MEASURE TYPE OF INVESTMENT SIMPLE PAYBACK COMMENTS
Maintenance issues Resource Six months or less —(each element)
Capital projects Capital Six months to three years Except covered(each element) conveyors
Covered conveyors Capital More than three years Dependson climate
6.3 LIMESTONE STORAGE
In most aspects of limestone processing, it is important to keep water content to a minimum. The stone absorbs water after the blasting process, in the base of the quarry, on conveyors and during transportation. There are two primary difficulties for the calcining process when the feedstock is wet. One is that prior
TIPS FOR THE LIME INDUSTRY 6.0
33

to heating the stone to the calcining point, the moisture must first be driven off or evaporated, a potential source of energy loss. Approximately 1,500 MJ(1400 Btu) is required to elevate the temperature of a pound of water to theevaporation point (latent heat plus assumed sensible heat). This value will varydepending on the drying effect that the airflow has on the stone and the initialtemperature of the moisture. It should, however, be noted that there will alwaysbe some waste heat in the exhaust stream, and it is this low-quality energy that isutilized for drying the raw stone. More investigation may be required to quantifythe total effect of dry versus wet feedstock on kiln energy efficiency.
A second problem is that the limestone may freeze in clumps during the wintermonths, making handling and bin storage evacuation difficult. Some sites useintermittent propane heaters or lances to melt the ice that holds the stonetogether. Direct-fired or direct-contact steam equipment tends to add highamounts of moisture to the storage and therefore compounds the problem once the heat source is removed.
If some form of wasted heat energy is available in the vicinity, then it may bemore cost-effective to use this energy, rather than a primary, purchased fuel, atthat location. For example, excess air from the cooler could be used to avoidfreezing in a local stone storage bin. Caution must be exercised to ensure that the waste heat recovered will not adversely affect the limestone, either throughadding moisture or introducing flue gas contaminants.
OPERATIONAL MEASURES
■ Avoid storage areas with ground-water difficulties.
■ The quarry floor/blast lay-down zone should be maintained as appropriately as possible to avoid any standing water.
■ Transport or cover limestone as quickly as feasible.
CAPITAL PROJECTS
■ Cover limestone storage piles.
■ Preheat stored stone with kiln exhaust or excess cooler air, as applicable.
If water and freezing are still a problem, an indirect heating arrangement wouldbe preferable to a direct system for intermittent heating. One option to investi-gate is routing a portion of the kiln exhaust stream or excess cooler air to the storage hopper for continuous, free heat for thawing. The moisture content andtemperature of the exhaust (to prevent condensation), as well as its gas chemistry(to maintain the limestone’s quality) should be considered. The physical locationof the stone storage bins in relation to the kiln exhaust may also make this a difficult proposition.
TIPS FOR THE LIME INDUSTRY6.0
34

MEASURE TYPE OF INVESTMENT SIMPLE PAYBACK
Operational measures Resource Six months or less(each element)
Capital projects Capital More than three years(each element)
6.4 CRUSHERS AND VIBRATING FEEDERS
The type and style of crushers used on site influence the consistency of stone size and overall efficiency of the process. Depending on the characteristics of thelimestone being processed, certain crushers will produce more uniform stonesizes. This in turn avoids unnecessary or uncontrolled crushing, channelling moreenergy being used in the production of the higher value product and less energyin producing fines or stone dust. Proper primary crushing may lessen the amountof secondary crushing, supporting the goal of minimizing product handling.
Replacing a crusher is a major capital investment, and it may be economicallymore feasible when an existing unit has become capacity limited or has reachedthe end of its useful life. Crusher selection will be directly influenced by themake-up of the limestone being processed and the desired shape and size of thelime product.
Vibrating feeders can be discussed in similar terms as motors, and most of the tips apply to both.
OPERATIONAL MEASURES
■ Avoid excessive motor idling.
■ Replace conventional motors with high-efficiency motors.
■ Ensure that vibrating feeders are properly mounted.
■ Do not interlock vibrating feeders with conveyors if the two are required to operate independently.
■ Maintain crushers to ensure proper operation and that limited re-crushing is required.
CAPITAL PROJECTS
■ Replace conventional motors with high-efficiency motors.
■ Operate crushers only as required to target “once-through” crushing.
■ Eliminate operations that require rehandling.
■ Replace existing crushers with higher-efficiency crushers.
TIPS FOR THE LIME INDUSTRY 6.0
35
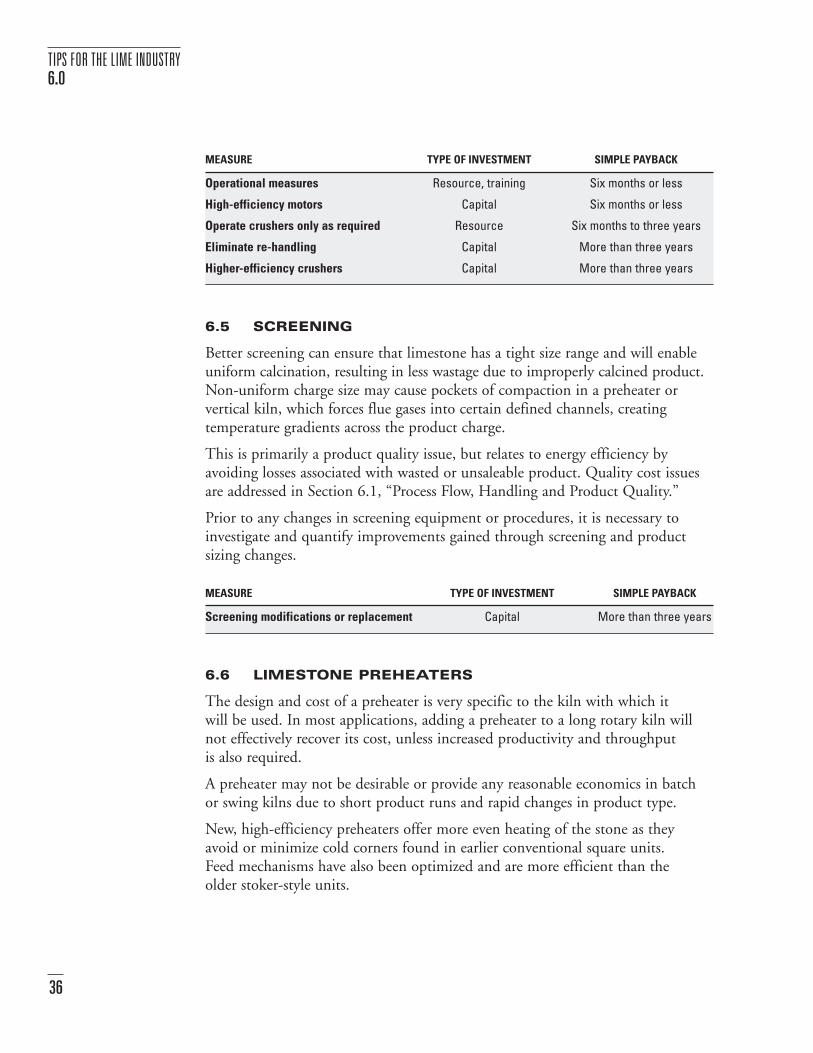
MEASURE TYPE OF INVESTMENT SIMPLE PAYBACK
Operational measures Resource, training Six months or less
High-efficiency motors Capital Six months or less
Operate crushers only as required Resource Six months to three years
Eliminate re-handling Capital More than three years
Higher-efficiency crushers Capital More than three years
6.5 SCREENING
Better screening can ensure that limestone has a tight size range and will enableuniform calcination, resulting in less wastage due to improperly calcined product.Non-uniform charge size may cause pockets of compaction in a preheater or vertical kiln, which forces flue gases into certain defined channels, creating temperature gradients across the product charge.
This is primarily a product quality issue, but relates to energy efficiency by avoiding losses associated with wasted or unsaleable product. Quality cost issuesare addressed in Section 6.1, “Process Flow, Handling and Product Quality.”
Prior to any changes in screening equipment or procedures, it is necessary toinvestigate and quantify improvements gained through screening and product sizing changes.
MEASURE TYPE OF INVESTMENT SIMPLE PAYBACK
Screening modifications or replacement Capital More than three years
6.6 LIMESTONE PREHEATERS
The design and cost of a preheater is very specific to the kiln with which it will be used. In most applications, adding a preheater to a long rotary kiln willnot effectively recover its cost, unless increased productivity and throughput is also required.
A preheater may not be desirable or provide any reasonable economics in batch or swing kilns due to short product runs and rapid changes in product type.
New, high-efficiency preheaters offer more even heating of the stone as they avoid or minimize cold corners found in earlier conventional square units. Feed mechanisms have also been optimized and are more efficient than the older stoker-style units.
TIPS FOR THE LIME INDUSTRY6.0
36

On shaft kilns, continuous feed systems can increase system efficiency by reducing cool-down and warm-up periods common with straight batch systems.
OPERATIONAL MEASURES
■ Optimize the feed rate.
■ Minimize ambient air infiltration into kilns (avoid in-leakage).
CAPITAL PROJECTS
■ Install continuous feed systems as applicable.
■ Upgrade to modern-style preheaters.
■ Add a new preheater and combine energy savings with increased throughputto eliminate or lessen the use of less efficient kilns.
MEASURE TYPE OF INVESTMENT SIMPLE PAYBACK COMMENTS
Operational measures Resource Six months or less —(each element)
Upgrade preheater Capital More than three years —
Add new preheater Capital More than three years Increased productcapability
6.7 LONG ROTARY KILNS
In long rotary kilns, the exhaust temperature is typically too high to be handleddirectly by either a baghouse or a precipitator unit. As discussed in the previoussection, if there is limited requirement for increased product throughput, then it may not be economical to install a preheater. The exhaust air must then betempered to lower the temperature to a level that the baghouse or precipitator can handle. Three ways to achieve this are to add dilution or tempering air, useinduction cooling towers or use water spray systems downstream of the kiln.
Tempering the exhaust air with ambient air has the drawback of increasing thefan requirements (sometimes through adding more fans) and the associatedenergy consumed. It may also increase the flow rate of air beyond the capabilityof the baghouse or precipitator, and additional capital investments may berequired to rectify this.
An induction tower helps to cool the exhaust stream by increasing the surfacearea, allowing the tower to act as an air-to-air heat exchanger. The increased piping will add load on the draft fans.
TIPS FOR THE LIME INDUSTRY 6.0
37

Water injection into the kiln exhaust is used in certain situations to reduce the temperature of the flue gas through evaporative cooling. When this occurs,the cooler exhaust stream does not require as much dilution air, which in turnreduces the dilution fan loads. Also, the draft fans become more effective as they are now moving cooler, denser air.
Depending on the type of fuel being consumed, water injection used in conjunction with precipitators can also improve the efficiency of the precipitatorsby allowing for more effective ionization of the exhaust stream, further loweringenergy consumption.
The amount of water injected into the flue gas stream is tightly controlled so that the temperature does not fall below the dew point and result in the formation of slurry.
MEASURE TYPE OF INVESTMENT SIMPLE PAYBACK COMMENTS
Minimize dilution air Capital Site-specific —
Evaporative cooling Capital Site-specific Requires additionalresearch
6.8 COOLERS
The Niems-style cooler is currently regarded as the most efficient type of cooler.It is able to cool the product with airflow approximately equivalent to the sec-ondary combustion air requirements of the kiln. This reduces the amount of fanpower wasted by adding more air or by exhausting of excess. It also ensures thatall of the heat recovered in the air is reused.
A grate-style cooler, on the other hand, requires much larger quantities of air,resulting in more air than the kiln can handle, that air being of lesser quality(lower heat content). Typically, a portion of this air must be exhausted, resultingin energy being lost in the form of excess fan load and lost heating content of the exhausted air.
If there are nearby uses for some of this excess, lower grade heat, such as a milloperation or stone storage pile thawing, then some energy can be recovered.
It is generally not cost-effective to replace coolers for energy efficiency gains alone.
TIPS FOR THE LIME INDUSTRY6.0
38

OPERATIONAL MEASURES
■ Investigate opportunities for excess cooler air usage.
■ Utilize excess cooler air for primary air supply.
■ Optimize cooler airflow to balance preheated air and product temperature requirements.
CAPITAL PROJECTS
■ Upgrade fans to high-efficiency units.
■ Upgrade cooler to Niems-style (or equivalent) at the time of replacement.
MEASURE TYPE OF INVESTMENT SIMPLE PAYBACK
Operational measures Resource Six months or less(each element)
Install upgraded cooler Resource Six months to three years
TIPS FOR THE LIME INDUSTRY 6.0
39

7.1 KILN REFRACTORY
Equipment manufacturers in Europe have been developing and using refractorywith higher insulation values for several years. As energy costs are substantiallyhigher in Europe, this alternative refractory is a viable option. Although suchmodified refractory is not cost-effective and therefore not widely accepted inCanada, it still warrants mention.
Single-layer, high R-value refractory material can be used in both rotary and vertical kilns. When using this type of insulation, there is usually a trade-off with the life expectancy due to an increased wear rate.
Multi-layer firebrick (high R-value brick used to back a high-duty contact brick)has displayed some reliability issues and also shorter life spans because of thethinness of the contact brick and difficulties with layer separation. One estimateindicated that the life of this type of kiln lining could be reduced by 50%, whichsubstantially increases overall downtime, re-insulation and resource costs.
Increasing the overall thickness of the brick – to either extend the life expectancyor increase the R-value – reduces the kiln’s volume, which reduces the quantity ofproduct that can be processed. This may still be an acceptable method for reduc-ing energy consumption in an intermittent or lower utilization kiln that would beunaffected by reducing the processing rate. However, the lower use may not showthe economic gains of increasing the efficiency.
Relining the kiln with better insulation changes the heat balance of the kiln andrequires a review of the overall process, including changes to the fuelling rates andcontrol strategies. Energy savings are immediate, and operators will need to “backoff the throttle” to maintain proper temperatures.
Providing that the residence time is still acceptable and that product quality doesnot suffer, the other alternative is to maintain the same firing rate but increase theproduction rate on the kiln.
Preparing a kiln heat-loss study will establish the most cost-effective material forselection, the time for refractory replacement and the costs associated with theabove. The study will determine if increased heat loss from the kiln would everjustify early refractory replacement.
A newer style of refractory material, with a textured or ribbed backing, increasesthe R-factor by adding a dead air space. It is claimed to increase the R-factor overstandard refractory and provide a similar life expectancy.1
KILN-RELATED TIPS 7.0
40 1 Source: RHI Canada Inc. (Formerly VRO Canada Inc.)

Along these same lines is the use of thermographic or infrared scanners to analysethe heat loss from the kiln. Some infrared equipment may be under-utilized if itis currently being used solely to identify insulation damage or “hot spots” to prevent kiln damage. Some data manipulation from these systems may allow for measurement or trending of heat loss as compared to an ideal condition.
OPERATIONAL MEASURES
■ Seal kiln systems to minimize ambient air infiltration or radiant heat loss.
■ Optimize refractory replacement periods.
■ Prepare a kiln heat-loss analysis.
■ Replace conventional brick with higher efficiency alternatives, maximizerefractory R-values and optimize kiln controls.
CAPITAL PROJECTS
■ Double-brick the kiln.
■ Use thermographic or infrared monitoring for heat loss trending.
MEASURE TYPE OF INVESTMENT SIMPLE PAYBACK COMMENTS
Seal kiln systems Maintenance Six months or less —
Optimize refractory Maintenance, Six months or less —replacement periods resource
Prepare kiln heat-loss analysis Capital Six months to three years —
Maximize insulation R-value Resource Six months to three years —
Double-brick kiln Maintenance No payback Possible productivity impact
Thermographic or Capital Unknown Requiresinfrared heat-loss trending additional research
7.2 COMBUSTION CONTROLS
Combustion air and fuel controls are two of the most critical and complex variablesin efficient kiln operation. Oxygen content greatly affects product quality andenergy consumption; controlling it, therefore, has great economic advantages.
As an illustration based on comparative analysis, in a natural-gas-fired kiln, each1% oxygen content at the sensor represents an additional 4.8% excess airflow.Using the previous example of a kiln producing 102,000 tonnes of product annually at a rate of 6.6 GJ/tonne and a cost of gas at approximately $3.03/GJ,reducing the excess air content would save approximately $22,000 annually. Theexcess 5% airflow increases the fan load by an equivalent amount.
KILN-RELATED TIPS 7.0
41
Combustion controls are highly site-specific, and the type of control depends onthe overall system design, making economics and associated payback values site-specific. The illustration of the cost of excess air can be used as a basic guide forthe advantages of improving fuel and air control. Where combustion control simple payback periods are available or applicable, they have been included in the analysis tables.
CAPITAL PROJECT
■ Implement and operate on-line automated burner and air controls as much as possible, as they are able to identify irregularities and adjust rapidly.
7.2.1 Combustion Gas Analysis
The internal kiln environment tends to cause plugging and reduces uptime capability in some combustion gas sensors, but measurement still remains animportant part of supplying data for kiln control. Intermittent or timed samplingcan provide accurate flue gas readings at preset measuring intervals. This extendsthe sensor’s life by utilizing a purge sequence between measurements, effectivelyprotecting the sampling tips from fouling or plugging. Frequent, automated calibration procedures must be performed.
Many industrial applications utilize zirconium oxide sensors to measure O2content in exhaust streams. The older the technology used in the cell, the lessconfidence the absolute measurement of the O2 content in the lower oxygenranges will be.1 Also, many of these older cells have a calibrated range of 2% to 20% O2 content. If a kiln is desired to operate at a 3% O2 content, then thesensor will be operating in the lower 5% of capability. Excellent electronics andlinearizers are required to amplify the reading accurately.
Furthermore, the sensor voltage output is affected by the temperature of theexhaust stream (a temperature change of 100°F, or 55°C, represents approxi-mately 4% voltage output differential) so it is important to calibrate both the O2sensor and the temperature-measurement device. Accuracy can be improved if asecond exhaust gas is measured and the results are cross-referenced to determinethe intersecting point on the stoichiometric curve.
New zirconium oxide sensors have better calibration procedures and improvedelectronics that provide more consistent and accurate measurement.
A paramagnetic oxygen sensor – one that provides a more linear measurementand excellent accuracy on low oxygen mixtures (less than 10%) – is anotheroption. It is slightly more expensive than a conventional zirconium-style unit butmay offer improved accuracy, as well as a longer life expectancy.1 Recent improve-ments in sampling methods have made the sensors even more robust and reliable.
KILN-RELATED TIPS 7.0
42 1 Source: CEM Specialties. See the Web site at http://www.cemsi.on.ca/abouthtm.htm.

The capabilities of sensors, metering and monitoring are advancing very quickly,and new and improved systems should be investigated continually. With the overall impact of oxygen content on operating costs and product quality, it is crucial to ensure that measurements are accurate, repeatable and reliable.
OPERATIONAL MEASURES
■ Ensure routinely that all sensors are properly calibrated.
■ Investigate sampling procedures in order to ensure minimal sample tip plugging.
CAPITAL MEASURES
■ Investigate updating older O2 sampling equipment with new zirconium-oxidesensors or paramagnetic sensors.
■ Replace relative airflow sensors with absolute measurement in the form ofPitot tubes or a hot-wire mass airflow meter.
7.2.2 Airflow Measurement
Improved airflow measurement and control also results in more uniform productand higher process efficiency. Inferring flows and controlling creates inherentinaccuracies as fans wear, speeds vary and ducts clog. Direct measurement in the form of Pitot tubes ($3,000–$5,000) or hot-wire mass airflow sensors ($7,000–$10,000) supplies superior measurement of airflows compared with fan motor amp measurements, which change over time.
7.2.3 Fuel Control
Estimating the economics for fuel, air and mixture control is difficult because of the widely varied procedures and equipment currently employed. The key is to clearly understand how an existing system is operating and which parameterswould provide the best benefit through more accurate control. The value ofreplacing existing measurements and controls is lessened if the inferred measurements are regularly checked and verified to be accurate.
Having stated this, it is important to reiterate the savings potential for kilns that operate with less than accurate measurement and control systems. As withthe example shown in Section 7.2, each 1% oxygen content at the sensor, overand above what is needed, represents additional fuel costs of approximately$22,000 per year.
KILN-RELATED TIPS 7.0
43
7.2.4 Burners
Many burner manufacturers supply new-technology burners to kiln users. Theyare designed to perform specific functions as the kiln design dictates. The amountof turbulence, swirl, primary and secondary air, and the flame length and shape(to name a few of the parameters) are all site- and kiln-specific.
The most common strategy is to reduce the primary air stream to the lowestamount possible while still achieving the required injection velocity of the fuel,resulting in a longer, better distributed flame contacting or radiating to more of the kiln charge.
Reducing primary air requirements and preheating secondary air from the coolerto 700–1100°C (1300–2000°F) increases overall efficiency. Pillard suggests thatreducing primary air by 4% and replacing it with secondary air at the tempera-tures given above can result in overall fuel savings of approximately 1.5%. See the Web site at http://www.pillard.com.
Some investigation has been performed to quantify the value of utilizing indirectfired burners in solid-fuelled kilns, but the results to date have been inconclusive.
■ Reduce supply line and control valve restrictions to decrease the primary fan loads.
■ Investigate new burner technologies.
MEASURE TYPE OF INVESTMENT SIMPLE PAYBACK
Accurate equipment calibration Resource/training Six months or less
Automated on-line controls Capital Six months to three years
Direct airflow measurement Capital Six months to three years
7.3 FUEL HANDLING
As discussed in Section 2.2, “Energy Use and Breakdown,” the preparation anduse of some fuels entails additional costs and related energy consumption.
7.3.1 Fuel Oil
Depending on the climate and the grade of fuel oil being consumed, the oil mayhave to be heated to allow easier pumping and better atomization at the burner.Higher-viscosity fuel oils will require more heating, especially during cold weather.
KILN-RELATED TIPS 7.0
44

OPERATIONAL MEASURES
■ Maintain pumps and supply systems to avoid leakage.
■ Limit bypass pumping to the minimum acceptable for normal kiln fuelling rates.
■ Preheat the storage tank and oil to the minimum temperature for acceptable pumping.
CAPITAL PROJECTS
■ If additional oil heating is required for combustion purposes, heat only the oil to be used and not the bypass as well.
■ Use high-efficiency heating methods for oil.
■ Insulate above-ground storage tanks to reduce heat loss.
MEASURE TYPE OF INVESTMENT SIMPLE PAYBACK
Operational measures (each element) Resource Six months or less
Capital projects (each element) Capital Six months to three years
7.3.2 Coal and Coal Derivatives
Coal and coke accounts for approximately 40% of the total fuel consumed by the lime industry. This is due to its relatively low cost and its high radiant heatcapability, thus providing excellent heat transfer to the charge.
One drawback of coal and coke is that it requires grinding or milling to be transformed into a usable, efficient form. Solid-fuel preparation devices consumeenergy and require auxiliary fans to transport the resulting finely ground fuel in a fluidized form. Heated air streams are supplied to the mill to help dry the fuelduring grinding. A 1992 U.S. study shows that the energy-consuming pulverizingancillaries represent an incremental cost of approximately 20% above that of cokeand an additional 13% over coal purchase prices.1
Replacement of a static classifier with a dynamic one brings efficiency gainsthrough avoiding over-grinding of the fuel to ensure accurate particle sizing. Thiscan reduce the quantity of unburned fuel in the fly ash or slag at the exhaust endof the kiln. Energy requirements to operate the classifier are negated by the millenergy savings, giving an overall increase in efficiency equal to the gain in the kiln.
Using properly sized fuel can increase efficiency by 5–10%. Unburned fuel passesthrough the kiln and can bond with other substances in the flue gas adding to theformation of slag. This slag could be crushed and ground for use again to recap-ture the fuel energy, but the preparation process adds to energy consumption.
KILN-RELATED TIPS 7.0
451 Enbridge Consumers Gas. See the Web site at http://www.cg.enbridge.com.
OPERATIONAL MEASURES
■ Ensure proper grinding to meet the optimum fuel particle size without excess grinding.
■ Reduce fuel pumping and movement as much as possible.
■ Size mill according to loads.
CAPITAL PROJECTS
■ Investigate using temperature- and flow-matched heated air streams (use mid-section of cooler to supply low-quality heat and minimize diluting high-quality heat from kiln; not applicable if process is cooler air limited).
■ Replace older or ineffective mills with properly sized grinding/preparationmills (economics may not be favourable because of high capital cost).
■ Ensure that coal and coke are stored in a fashion that minimizes moisturegains; investigate enclosed storage options.
7.3.3 Alternative Fuels
The impact and value of utilizing alternative fuels (such as tires and waste oil) has not yet been determined. The use of some of these alternative fuels has beendemonstrated in cement kilns, but the information is not directly transferablebecause of differences in operational temperature and product chemistry.
7.4 LEAKAGE
One area of kiln inefficiency is the energy lost through ports, openings, cracksand hatches. The energy loss through openings can occur in three fashions.
Convective losses occur when hot gases are pushed out of the kiln into the sur-rounding environment. This represents air that has been heated but does not doany useful work. Actual losses will be based on the temperature of air escapingand the volume, which in turn depends on the pressure differential and the size of the opening.
Radiant losses occur when infrared heat (light) is lost through openings. The lossis partially dependent on the emitter – in this case the flame, firebrick and glow-ing lime – and partially on the absorptivity of the surrounding surfaces. A tablesupplied in the CIPEC Energy Efficiency Guide suggests that a small, hatch-sizedopening of 230 cm2 (36 sq. in.) can emit approximately 125 GJ (120 mmBtu) of radiant energy per year.
When air is introduced into a low pressure area of the kiln (commonly termed in-leakage) through seal leaks, doors or covers, efficiency is reduced. This airintake is also uncontrolled and susceptible to variations, making overall kiln air and fuel control more difficult.
KILN-RELATED TIPS 7.0
46
In-leakage also adds to the load induced on the fans. This is especially undesirablein cases where an induced draft fan has been sized to the point that it becomesthe limiting factor in kiln operation. Air leaks closer to the feed end of the kilncan also affect the measurement of remaining oxygen in the air stream withoutsignificantly adding to the combustion process.
7.5 KILN INTERNALS
Internals such as dams, trefoils, mixers and lifters can assist with two issues in a rotary kiln: increased product mixing and reduced laminar gas flow.
Rotary kilns have a characteristic product flow pattern that results in larger chargepieces sitting on top of smaller ones and forming a kidney-shaped cross-sectionalpattern in the bed. This form prevents heat from being distributed evenly to allthe stones as they tumble. This is less of an issue in preheated kilns because thesmaller charge pieces become calcined in the preheater, and then are protectedfrom hard burning by the large charge pieces surrounding it within the kidney in the kiln.
In long rotary (non-preheated) kilns, adding specific internals (such as lifters,metallic crosses or trefoils) can increase the charge mixing, resulting in more evenproduct burning. This also increases tolerance of the feed size ratio of the chargewhile maintaining an even quality of burn across the charge.
A drawback of increasing the charge turbulence is that it will increase agitationand therefore increase the quantity of breakage and fines.
Installing internals to decrease the laminar flow of the flue gas does not affect the charge condition but will increase the air turbulence, resulting in an increasein heat transfer to the product and more thorough air-fuel mixing.
OPERATIONAL PROCEDURE
■ Investigate current heat transfer within kilns and the benefit of adding charge or combustion gas baffles.
7.6 VERTICAL KILNS
The efficiency of vertical kilns is influenced in many of the same ways as rotarykilns. Vertical kilns work on a batch-type system rather than continuous feed, andthe upper kiln area is used for preheating. Typically, the kiln would be shut down,the batch would be charged and the burners would be re-fired. The calcined lime-stone is then removed from the bottom of the kiln through a cooler system at acontrolled rate. Once the feedstock lowers to a preset level, the process repeats.
The addition of a closed charge feed system eliminates the need to shut the kilndown for charging, thereby reducing transient operations. The kiln is not affectedby adding the charge as it is introduced via an airlock arrangement, which hasminimal affect on the combustion process.
KILN-RELATED TIPS 7.0
47

Recent developments include the addition of perimeter burners (where the existing kiln was not designed with them). These burners utilize high-exhaust gas recirculation flow rates to extend the flame far into the product and supplymore even heating without hard-burning lime that is close to the burner. In oneapplication, perimeter burners have increased product throughput capability by35% while decreasing fuel consumption.
OPERATIONAL PROCEDURE
■ Maintain close screening practices.
CAPITAL PROJECT
■ Prepare a fuel consumption study over time to establish refractory wearimpacts.
MEASURE TYPE OF INVESTMENT SIMPLE PAYBACK
Screening practices Resource Six months to three years
Fuel consumption study Capital Six months to three years
7.7 CYCLONES
Cyclones and multiclones, if utilized, are typically placed in the exhaust streambetween the kiln and the induced draft fan and can collect some particulate matter through the use of centrifugal forces. They use no energy (other than the increased restriction imparted to the induced draft fan), offer low mainte-nance and do not require any flue gas tempering. Typically, they can removeapproximately 70% of the particles in the exhaust stream.
OPERATIONAL PROCEDURE
■ Use cyclones and multiclones to remove as much particulate matter as possible before admitting flue gas to baghouses or precipitators.
7.8 BAGHOUSES AND PRECIPITATORS
Baghouses and precipitators have an impact on energy efficiency, but it is muchmore critical to ensure that they operate properly and are designed to deal withthe temperature and particulate level in the exhaust.
■ Utilize “on-demand” cleaning procedures as required, not on timed schedules.
■ Minimize flue gas dilution through the use of higher-temperature baghouse bags.
■ Investigate using evaporative cooling with precipitators.
KILN-RELATED TIPS 7.0
48
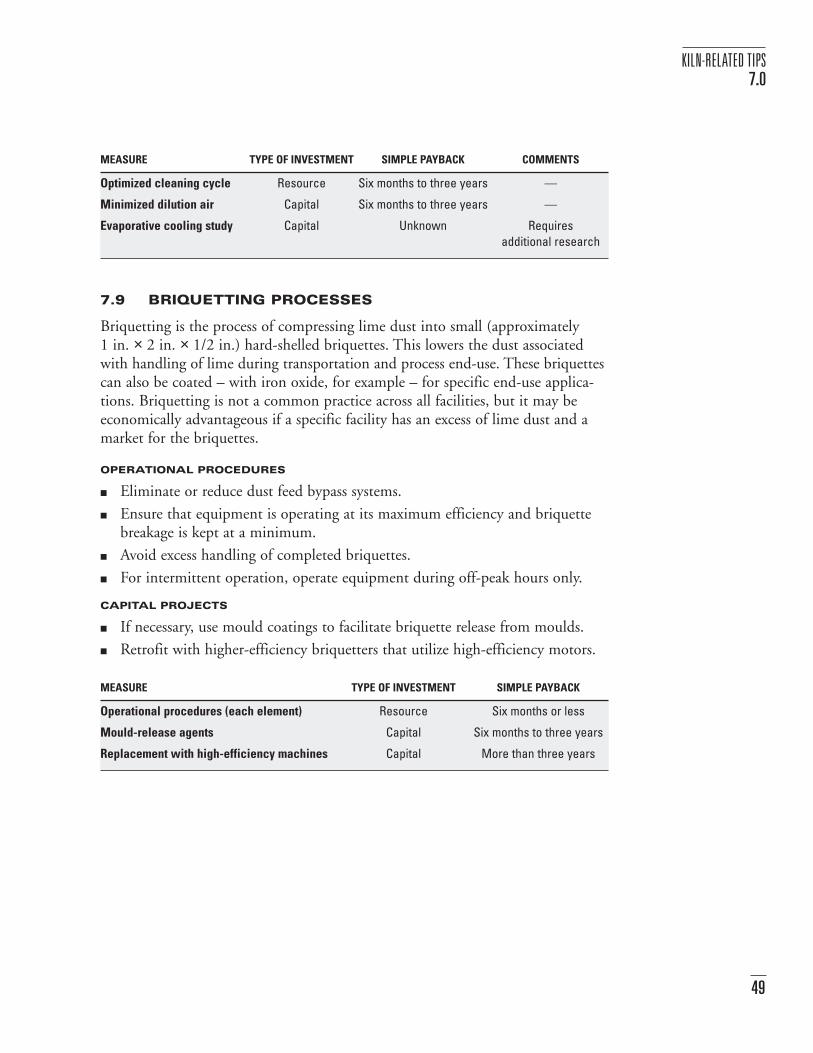
MEASURE TYPE OF INVESTMENT SIMPLE PAYBACK COMMENTS
Optimized cleaning cycle Resource Six months to three years —
Minimized dilution air Capital Six months to three years —
Evaporative cooling study Capital Unknown Requires additional research
7.9 BRIQUETTING PROCESSES
Briquetting is the process of compressing lime dust into small (approximately 1 in. × 2 in. × 1/2 in.) hard-shelled briquettes. This lowers the dust associatedwith handling of lime during transportation and process end-use. These briquettescan also be coated – with iron oxide, for example – for specific end-use applica-tions. Briquetting is not a common practice across all facilities, but it may be economically advantageous if a specific facility has an excess of lime dust and amarket for the briquettes.
OPERATIONAL PROCEDURES
■ Eliminate or reduce dust feed bypass systems.
■ Ensure that equipment is operating at its maximum efficiency and briquettebreakage is kept at a minimum.
■ Avoid excess handling of completed briquettes.
■ For intermittent operation, operate equipment during off-peak hours only.
CAPITAL PROJECTS
■ If necessary, use mould coatings to facilitate briquette release from moulds.
■ Retrofit with higher-efficiency briquetters that utilize high-efficiency motors.
MEASURE TYPE OF INVESTMENT SIMPLE PAYBACK
Operational procedures (each element) Resource Six months or less
Mould-release agents Capital Six months to three years
Replacement with high-efficiency machines Capital More than three years
KILN-RELATED TIPS 7.0
49

INDUSTRY CONTACTS
NATURAL GAS UTILITIES
B.C. Gas Utility Inc.Gary HamerEnergy Efficiency ManagerMarket Development, B.C. Gas2nd Floor, 4190 Lougheed HighwayBurnaby BC V5C 6A8Tel.: (604) 293-8473Fax: (604) 293-8850E-mail: [email protected]
SaskEnergyBernard Ryma1945 Hamilton StreetRegina SK S4P 2C7Tel: (306) 777-9368Fax: (306) 525-3422E-mail: [email protected]
Enbridge Consumers Gas Company Limited
Masoud AlmassiManager of Industrial Marketing2235 Sheppard Avenue EastAtria II, 10th FloorNorth York ON M2J 5B5Tel.: (416) 496-7110Fax: (416) 496-7182E-mail: [email protected]
ATCO GasMark Antonuk, SupervisorCommercial Industrial Marketing909-11 Avenue South WestCalgary AB T2R 1L8Tel.: (403) 245-7199Fax: (403) 245-7405E-mail: [email protected]
Centra Gas Manitoba Inc.Dieter BartelCommercial Business Representative444 St. Mary AvenueSuite 510Winnipeg MB R3C 3T7Tel.: (204) 925-0240Fax: (204) 925-0810E-mail: [email protected]
APPENDIX
50
British ColumbiaEnergy Management BranchEnergy Resources DivisionMinistry of Energy, Mines
and Petroleum Resources617 Government Street, Room 418Victoria BC V8V 1X4Tel.: (250) 952-0583
SaskatchewanHoward LosethEnergy Conservation EngineerEnergy Development BranchSaskatchewan Energy and Mines2101 Scarth StreetRegina SK S4P 3V7Tel.: (306) 787-3379Fax: (306) 787-2333E-mail: [email protected]
OntarioOntario Ministry of EnergyMyra GerowCommodities Coordinator933 Ramsey Lake Rd.Sudbury ON P3E 6B5Tel.: (705) 670-5828Fax: (705) 670-5803E-mail: [email protected]
New BrunswickSam McEwanManager of Mines and Energy
DevelopmentNatural Resources and EnergyP.O. Box 6000Fredericton NB E3B 5H1Tel.: (506) 453-6637Fax: (506) 453-3671E-mail: [email protected]
AlbertaEnergy Efficiency BranchAlberta Department of EnergyDiana PrudyMineral Access and Geology Mapping4th Floor9945-108 StreetEdmonton AB T5K 2G6Tel: (780) 422-9499Fax: (780) 422-1123E-mail: [email protected]
ManitobaErnie ArmittDirector of Mines BranchEnergy and Mines1395 Ellice AvenueWinnipeg MB R3G 3P2Tel: (204) 945-8427Fax: (204) 945-8427E-mail: [email protected]
QuebecLuc MorinDirection de l’efficacité énergétique Ministère des Ressources naturellesGouvernement du Québec 5700, 4th Avenue WestCharlesbourg QC J1H 6R1Tel: (418) 627-6379, ext. 8036Fax: (418) 643-5825E-mail: [email protected]
Prince Edward IslandRon EstabrooksEnergy and Minerals BranchP.E.I. Economic Development
and TourismP.O. Box 2000Charlottetown PE C1A 7N8Tel: (902)368-5011Fax: (902)368-6582E-mail: rgesta @gov.pe.ca
APPENDIX
51
PROVINCIAL GOVERNMENT ENERGY MANAGEMENT PROGRAMS

Nova ScotiaDepartment of Natural ResourcesDon Jones Director of Mines and EnergyDevelopment Division4th Floor Founders Square1701 Hollis StreetP.O. Box 698Halifax NS B2J 2T9Tel.: (902) 424-5618E-mail: [email protected]
NewfoundlandBrian MaynardDeputy Minister of Mines and EnergyP.O. Box 8700St. John’s NF A1B 4J6Tel: (709) 729-2356Fax: (709) 729-0059E-mail: [email protected]
Northwest TerritoriesJacqueline CusvellerMineral, Oils and Gas DivisionRWED Government of Northwest
TerritoriesBox 1320Yellowknife NT X1A 2L9Tel.: (867) 920-3346Fax: (867) 873-0254E-mail: [email protected]
ELECTRICAL UTILITIES
British Columbia HydroEnergy Management DivisionMarty Ahad6911 South Point Drive (East 16)Burnaby BC V3N 4X8Tel: (604) 528-1537Fax: (604) 528-1552E-mail: [email protected]
TransAlta utilitiesRob FalconerProducts and Services ManagerP.O. Box 1900Calgary AB T2P 2M1Tel: (403) 267-2578Fax: (403) 267-4740E-mail: [email protected]
Alberta Power LimitedNap PepinCommercial Sales Representative10035-105th StreetEdmonton AB T5J 2V6Tel: (780) 420-4102Fax: (780) 420-7222E-mail: [email protected]
Edmonton PowerLloyd BertschiProgram ManagerEnvest (EPCOR)Capital Square9th Floor, 10065 Jasper AvenueEdmonton AB T5J 3B1Tel: (780) 412-3438Fax: (780) 412-3346E-mail: [email protected]
APPENDIX
52

SaskPowerRandy GrahamManager of Key Accounts2025 Victoria AvenueRegina SK S4P 0S1Tel: (306) 566-2832Fax: (306) 566-3305E-mail: [email protected]
Winnipeg HydroBrian GaberEnergy Management Coordinator223 James AvenueWinnipeg MB R3B 3L1Tel: (204) 986-2339Fax: (204) 942-7804E-mail: [email protected]
Hydro-QuébecRonald MartineauMarketing Director, Hydro Québec1010 Ste-Catherine Street West, 9th FloorMontreal QC H3C 4S7Tel: (514) 392-8000, ext. 8471Fax: (514) 392-8806E-mail: [email protected]
New Brunswick Power Mike KeaysIndustrial Customer AdministratorP.O. Box 2000Fredericton NB E3B 4X1Tel: (506) 458-4252Fax: (506) 458-4000E-mail: [email protected]
Nova Scotia CorporationAnn HopeManager of Marketing,
Business to BusinessP.O. Box 910Halifax, NS B3J 2W5Tel: (902) 428-6149Fax: (902) 428-6066
Manitoba HydroMichael DudarDivision ManagerIndustrial and Commercial Solutions820 Taylor AvenueP.O. Box 815Winnipeg MB R3C 2P4Tel: (204) 474-4100Fax: (204) 474-4641Email: [email protected]
Ontario HydroBob McKellerEnergy Services and Environment700 University Avenue (H19-A-20)Toronto ON M5G 1X6Tel: (416) 506-3448
New Brunswick PowerGeorge DashnerEnergy Management SpecialistP.O. Box 2000Fredericton NB E3B 4X1Tel: (506) 458-3285Fax: (506) 458-4000E-mail: [email protected]
Maritime Electric Co. Ltd.Angus OrfordManager of Marketing and
Corporate CommunicationsP.O. Box 1328Charlottetown PE C1A 7N2Tel: (902) 629-3628Fax: (902) 629-3665E-mail: [email protected]
Newfoundland PowerMervin CranfordEnergy Utilization SpecialistP.O. Box 8910St. John’s NF A1B 3P6Tel: (709) 737-5891Fax: (709) 737-5339E-mail: [email protected]
APPENDIX1
53

Newfoundland and Labrador HydroAl BallardManager Customer RelationsP.O. Box 12400St. John’s NF A1B 4K7Tel: (709) 737-1754Fax: (709) 737-1902E-mail: [email protected]
Yukon Electrical Company Ltd.Steve SavageP.O. Box 4190Whitehorse YT Y1A 3T4Tel: (867) 633-7034Fax: (867) 633-5797E-mail: [email protected]
NWT Power CorporationMike VaydikGeneral ManagerBox 2818Yellowknife NT X1A 2R1Tel: (867) 873-5281Fax: (867) 920-2145E-mail: [email protected]
Yukon Energy CorporationJohn MaissanDirector Technical ServicesP.O. Box 5920Whitehorse, YT Y1A 5L6Tel: (867) 667-8119Fax: (867) 393-6353E-mail: [email protected]
REFERENCED PROGRAMS
Canada’s Climate ChangeVoluntary Challenge and Registry Inc.
170 Laurier Ave, Suite 600Ottawa ON K1P 5V5Tel.: (613) 565-5151Fax. (613) 565-5743
ON SITEc/o Energy Pathways Inc.251 Laurier Avenue West, Suite 500Ottawa ON K1P 5J6Tel.: (613) 798-9393
CIPEC SecretariatIndustrial Energy Efficiency InitiativeOffice of Energy EfficiencyNatural Resources Canada580 Booth Street, 18th FloorOttawa ON K1A 0E4Fax: (613) 947-4121
CEMETNatural Resources Canada580 Booth Street,18th FloorOttawa ON K1A 0E4Tel.: (613) 947-6814
APPENDIX
54
REFERENCES
Canadian Industry Program for Energy Conservation and Natural Resources Canada.CIPEC Energy Efficiency Planning and Management Guide, 1999.
The Rubber Association of Canada and Natural Resources Canada. Energy EfficiencyOpportunities in the Canadian Rubber Industry, Mississauga, 1997.
The Brewers Association of Canada, Natural Resources Canada and the CanadianIndustry Program for Energy Conservation (CIPEC) with Lom & Associates. Energy Efficiency Opportunities in the Canadian Brewing Industry, Toronto, 1997.
Canadian Industrial Energy End-Use Data and Analysis Centre (CIEEDAC), SimonFraser University. Development of Energy Intensity Indicators for Canadian Industry, 1990 to 1997, Burnaby, British Columbia, December 1998.
Office of Energy Efficiency of Natural Resources Canada. Energy Efficiency Trends inCanada 1990 to 1996: A Review of Indicators of Energy Use – Energy Efficiency andEmissions, June 1998.
An Idling Control By-Law. Works and Emergency Services, Toronto.
Ontario Power Generation Web site: http://www.opgdirect.com
Copper Web site: http://www.copper.org
Minerals and Metals Sector, Natural Resources Canada and Canada’s Climate ChangeVoluntary Challenge and Registry Inc. Mining and Mineral Processing Operations inCanada 1998, MR243.
SRP Management Consulting Associates and the Canadian Industry Program for EnergyConservation (CIPEC). The Mining Association of Canada: Energy Efficiency PlanningGuide, Ottawa, November 1997.
Turner, Wayne C. Energy Management Handbook (third edition), Fairmont Press,Lilburn, Georgia, 1997.
North American Mfg Co. North American Combustion Handbook: Volume 1 –Combustion, Fuels, Stoichiometry, Heat Transfer, Fluid Flow (third edition), Cleveland,Ohio, 1986.
“Schwank Infra-Red Gas Heaters,” sales and product literature manual, tel.: (905) 712-4766;E-mail: [email protected]
Atlas Copco Compressors Canada, Technical Services, tel.: (514) 421-4121.
Mineral and Metals Working Group of the Industry Issues Table: Minerals and Metals Foundation Paper, March 1999 (available at http://www.nccp.ca/html/index.htm,“Issue Tables” and “Industry”).
Minerals and Metals Working Group – Industry Issues Table (CIPEC). Minerals andMetals: Preliminary Analysis of Actions and Opportunities for GHG Mitigation, Ottawa, July 1999.
REFERENCES
55

Statistics Canada. Lime Industry Statistics, Ottawa, 1997.
Natural Resources Canada. Energy Management Series, Process Furnaces,Dryers and Kilns, Cat. No. M91-6/7E.
Industry Canada. Industry Overview, Research and Development Web site: http://strategis.ic.gc.ca
Discussions with Henry Vergeer, CEM Specialties Inc., re oxygen-sensing techniques, tel.: (519) 641-6431.
Ametek Combustion Efficiency Handbook, provided by Willer Engineering Limited, tel.: (416) 499-4421.
Discussions with Joe Fong, Willer Engineering Limited, re oxygen-sensing techniques,tel.: (416) 499-4421.
Discussions with Bill MacDonell and John Thibault, VRD Canada (now RHI Canada Inc.), re maximizing kiln R-values, tel.: (905) 639-8660.
Natural Resources Canada, Minerals and Metals Sector. Canadian Minerals Yearbook, 1997.
REFERENCES
56


Office of Energy EfficiencyOffice de l’efficacité énergétique
Leading Canadians to Energy Efficiency at Home, at Work and on the Road
The Office of Energy Efficiency of Natural Resources Canada is a dynamic organization with a mandate to renew, strengthen and expand Canada’s commitment to energy efficiency in order to help
address the challenges of climate change.
For more information or to receive additional copies of this publication, write to:
Canadian Industry Program for Energy Conservationc/o Natural Resources CanadaOffice of Energy Efficiency580 Booth Street, 18th FloorOttawa ON K1A 0E4Tel: (613) 995-6839Fax: (613) 947-4121E-mail: [email protected]