
eInfochips Tableau Expertise
10
eInfochips Tableau Expertise
-
Upload
einfochips -
Category
Data & Analytics
-
view
1.665 -
download
0
Transcript of eInfochips Tableau Expertise
eInfochips Tableau Expertise

Tableau Offerings
2
Report and Dashboard Development
Advanced Data Discovery and Visualization
Ad-hoc Reporting with Mobile / Self-Service BI
Custom Tableau Portal Design
Load Balancing
Analytics rendering - Tableau Desktop and Mobile BI
Tableau server Cloud / On- premise Deployment and Maintenance
3
Case Studies
Case Study - Executive Dashboards
4
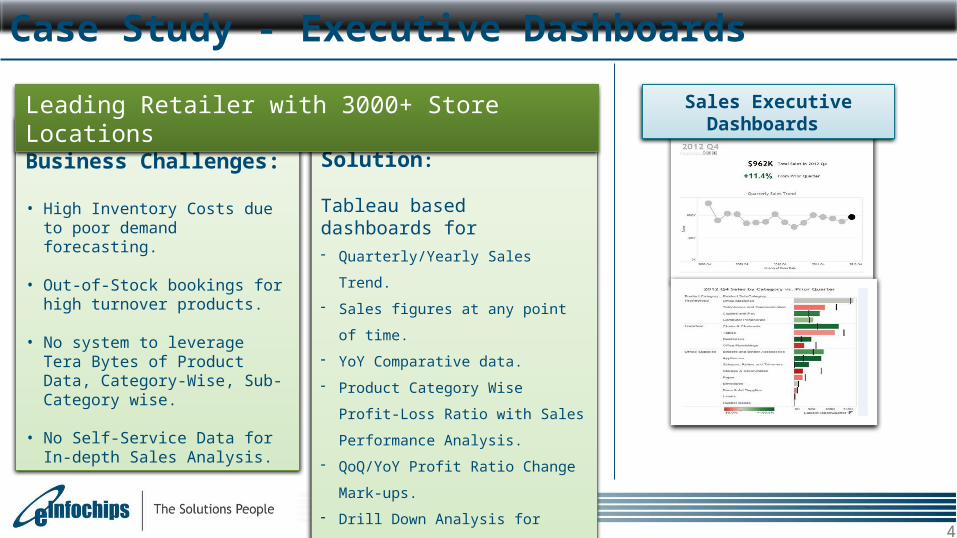
Business Challenges:
• High Inventory Costs due to poor demand forecasting.
• Out-of-Stock bookings for high turnover products.
• No system to leverage Tera Bytes of Product Data, Category-Wise, Sub- Category wise.
• No Self-Service Data for In-depth Sales Analysis.
Solution:
Tableau based dashboards for- Quarterly/Yearly Sales Trend.
- Sales figures at any point of time.
- YoY Comparative data.
- Product Category Wise Profit-Loss Ratio
with Sales Performance Analysis.
- QoQ/YoY Profit Ratio Change Mark-ups.
- Drill Down Analysis for Product Sub
Categories.
Sales Executive Dashboards Leading Retailer with 3000+ Store Locations
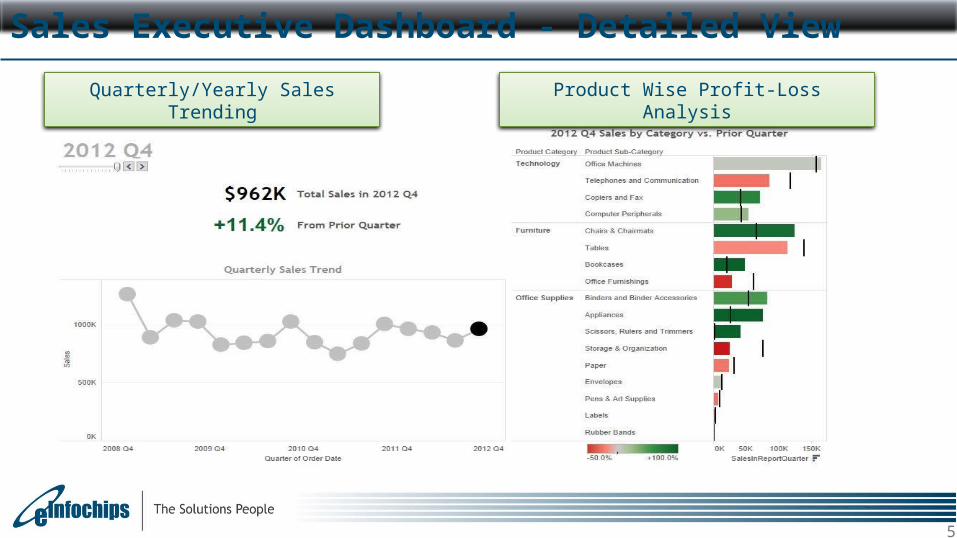
Sales Executive Dashboard - Detailed View
5
Quarterly/Yearly Sales Trending Product Wise Profit-Loss Analysis
Client Benefits
6
• Better inventory planning resulted in 19% inventory holding cost reduction
• 12% reduction in out-of-stock booking incidents
• YoY comparative product wise, Category- Wise, Sub- Category wise data analysis
• Product-Wise Performance Analysis helped executives to take more informed decisions on investments
• Self Service BI ensured real time access to operational insights
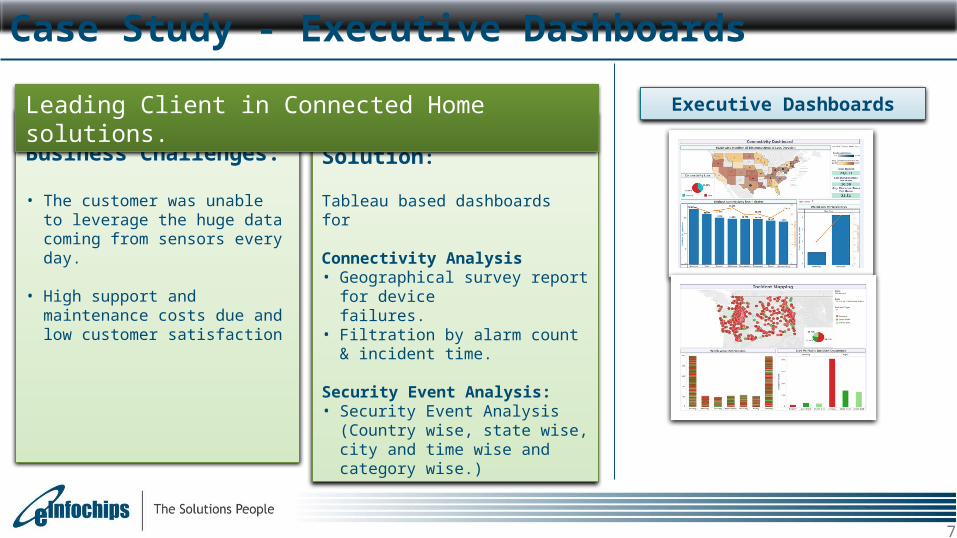
Case Study - Executive Dashboards
7
Business Challenges:
• The customer was unable to leverage the huge data coming from sensors every day.
• High support and maintenance costs due and low customer satisfaction
Solution:
Tableau based dashboards for
Connectivity Analysis • Geographical survey report for device
failures.• Filtration by alarm count & incident
time.
Security Event Analysis:• Security Event Analysis (Country wise,
state wise, city and time wise and category wise.)
Executive DashboardsLeading Client in Connected Home solutions.
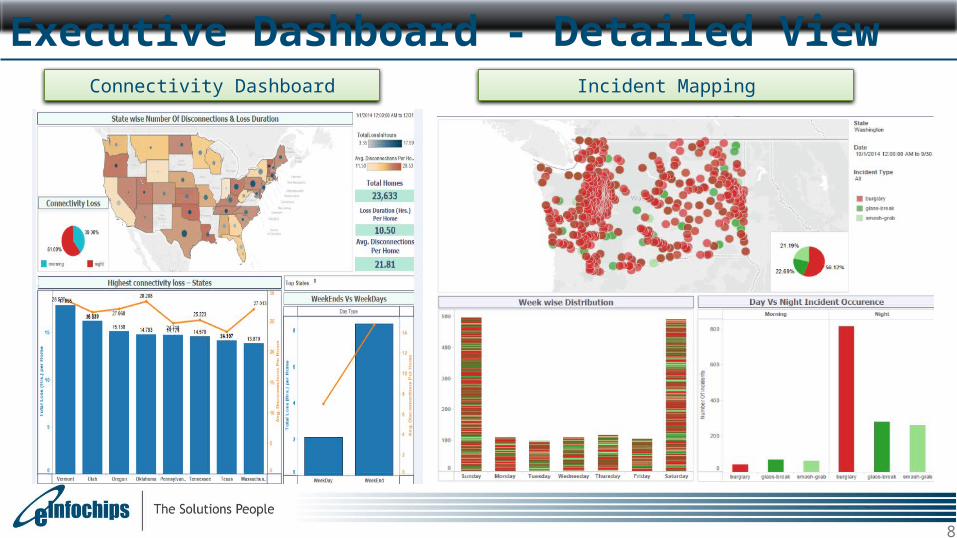
Executive Dashboard - Detailed View
8
Connectivity Dashboard Incident Mapping
Client Benefits
9
• Reduction in Device Maintenance cost
• Increase in Q score due to better Market Segmentation
• Better CSAT score
• Reduction in number of disconnections
• Identification of threat prone areas