Ships' Boys and Youth Culture in Eighteenth-Century Britain: The ...
http://wrap.warwick.ac.uk
Original citation: Kay, Gemma L., Sergeant, Martin J., Zhou, Zhemin, Chan, Jacqueline, Millard, Andrew D., Quick, Joshua, Szikossy, Ildikó, Pap, Ildikó, Spigelman, Mark, Loman, Nicholas J., Achtman, Mark, Donoghue, Helen D. and Pallen, Mark J.. (2015) Eighteenth-century genomes show that mixed infections were common at time of peak tuberculosis in Europe. Nature Communications, Volume 6 . Article number 6717. ISSN 2041-1723 Permanent WRAP url: http://wrap.warwick.ac.uk/67180 Copyright and reuse: The Warwick Research Archive Portal (WRAP) makes this work of researchers of the University of Warwick available open access under the following conditions. This article is made available under the Creative Commons Attribution 4.0 International license (CC BY 4.0) and may be reused according to the conditions of the license. For more details see: http://creativecommons.org/licenses/by/4.0/ A note on versions: The version presented in WRAP is the published version, or, version of record, and may be cited as it appears here. For more information, please contact the WRAP Team at: [email protected]
ARTICLE
Received 24 Oct 2014 | Accepted 18 Feb 2015 | Published 7 Apr 2015
Eighteenth-century genomes show that mixedinfections were common at time of peaktuberculosis in EuropeGemma L. Kay1,*, Martin J. Sergeant1,*, Zhemin Zhou1,*, Jacqueline Z.-M. Chan1, Andrew Millard1,
Joshua Quick2, Ildiko Szikossy3, Ildiko Pap3, Mark Spigelman4,5, Nicholas J. Loman2, Mark Achtman1,
Helen D. Donoghue5 & Mark J. Pallen1
Tuberculosis (TB) was once a major killer in Europe, but it is unclear how the strains and
patterns of infection at ‘peak TB’ relate to what we see today. Here we describe 14 genome
sequences of M. tuberculosis, representing 12 distinct genotypes, obtained from human
remains from eighteenth-century Hungary using metagenomics. All our historic genotypes
belong to M. tuberculosis Lineage 4. Bayesian phylogenetic dating, based on samples with
well-documented dates, places the most recent common ancestor of this lineage in the late
Roman period. We find that most bodies yielded more than one M. tuberculosis genotype
and we document an intimate epidemiological link between infections in two long-dead
individuals. Our results suggest that metagenomic approaches usefully inform detection and
characterization of historical and contemporary infections.
DOI: 10.1038/ncomms7717 OPEN
1 Microbiology and Infection Unit, Division of Translational and Systems Medicine, Warwick Medical School, University of Warwick, Gibbet Hill Road,Coventry CV4 7AL, UK. 2 Institute of Microbiology and Infection, School of Biosciences, University of Birmingham, Birmingham B15 2TT, UK. 3 Department ofAnthropology, Hungarian Natural History Museum, Ludovika ter 2–6, 1083 Budapest, Hungary. 4 Department of Anatomy and Anthropology, Sackler Facultyof Medicine, Tel-Aviv University, Tel-Aviv 9112102, Israel. 5 Centre for Clinical Microbiology, Division of Infection and Immunity, University College London,London NW3 2PF, UK. * These authors contributed equally to this work. Correspondence and requests for materials should be addressed to M.J.P.(email: [email protected]).
NATURE COMMUNICATIONS | 6:6717 | DOI: 10.1038/ncomms7717 | www.nature.com/naturecommunications 1
& 2015 Macmillan Publishers Limited. All rights reserved.
Tuberculosis (TB), although still a major global healthproblem, was once much more common in Europe than itis today—for example, when first describing the bacterial
aetiology of TB in 1882, Robert Koch claimed that this infectionaccounted for one in seven deaths1. However, it remains unclearwhen TB reached peak prevalence in Europe and how theepidemiology of infection differed in a historical high-prevalencecontext from what we see today. In addition, dates of origin of keyTB lineages remain contentious: for example, recent estimates ofthe M. tuberculosis complex, which contains human- and animal-associated lineages, vary by an order of magnitude from 70,000 too6000 years ago2,3.
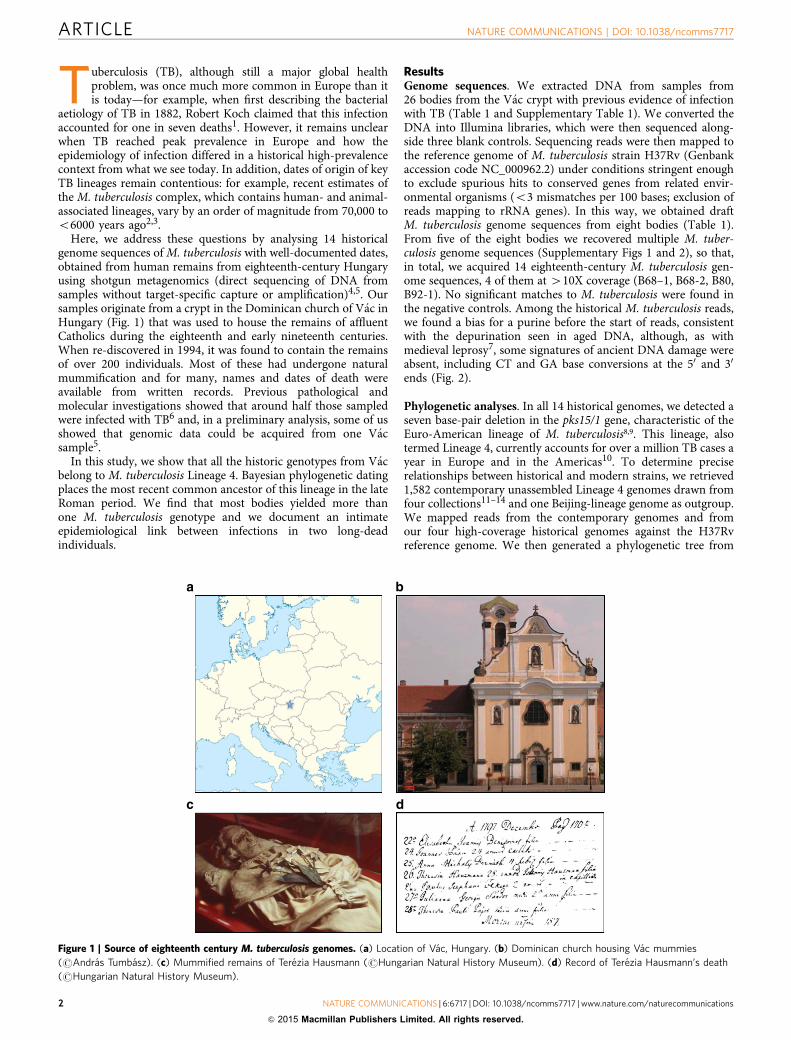
Here, we address these questions by analysing 14 historicalgenome sequences of M. tuberculosis with well-documented dates,obtained from human remains from eighteenth-century Hungaryusing shotgun metagenomics (direct sequencing of DNA fromsamples without target-specific capture or amplification)4,5. Oursamples originate from a crypt in the Dominican church of Vac inHungary (Fig. 1) that was used to house the remains of affluentCatholics during the eighteenth and early nineteenth centuries.When re-discovered in 1994, it was found to contain the remainsof over 200 individuals. Most of these had undergone naturalmummification and for many, names and dates of death wereavailable from written records. Previous pathological andmolecular investigations showed that around half those sampledwere infected with TB6 and, in a preliminary analysis, some of usshowed that genomic data could be acquired from one Vacsample5.
In this study, we show that all the historic genotypes from Vacbelong to M. tuberculosis Lineage 4. Bayesian phylogenetic datingplaces the most recent common ancestor of this lineage in the lateRoman period. We find that most bodies yielded more thanone M. tuberculosis genotype and we document an intimateepidemiological link between infections in two long-deadindividuals.
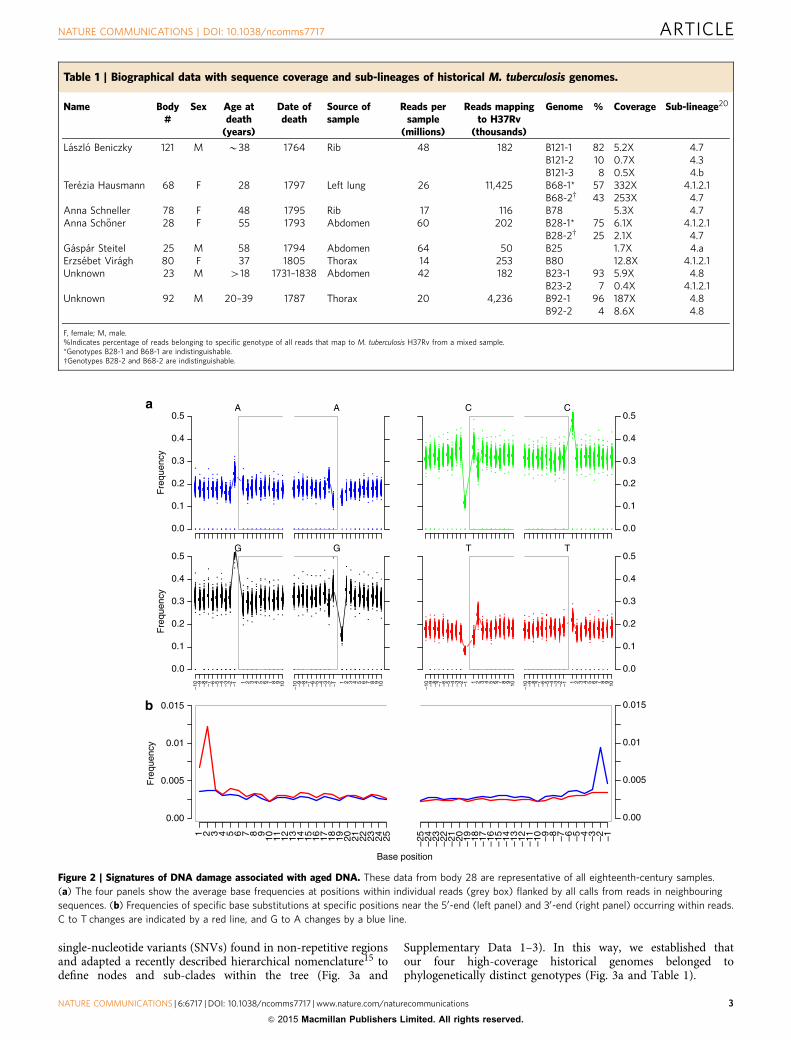
ResultsGenome sequences. We extracted DNA from samples from26 bodies from the Vac crypt with previous evidence of infectionwith TB (Table 1 and Supplementary Table 1). We converted theDNA into Illumina libraries, which were then sequenced along-side three blank controls. Sequencing reads were then mapped tothe reference genome of M. tuberculosis strain H37Rv (Genbankaccession code NC_000962.2) under conditions stringent enoughto exclude spurious hits to conserved genes from related envir-onmental organisms (o3 mismatches per 100 bases; exclusion ofreads mapping to rRNA genes). In this way, we obtained draftM. tuberculosis genome sequences from eight bodies (Table 1).From five of the eight bodies we recovered multiple M. tuber-culosis genome sequences (Supplementary Figs 1 and 2), so that,in total, we acquired 14 eighteenth-century M. tuberculosis gen-ome sequences, 4 of them at 410X coverage (B68–1, B68-2, B80,B92-1). No significant matches to M. tuberculosis were found inthe negative controls. Among the historical M. tuberculosis reads,we found a bias for a purine before the start of reads, consistentwith the depurination seen in aged DNA, although, as withmedieval leprosy7, some signatures of ancient DNA damage wereabsent, including CT and GA base conversions at the 50 and 30
ends (Fig. 2).
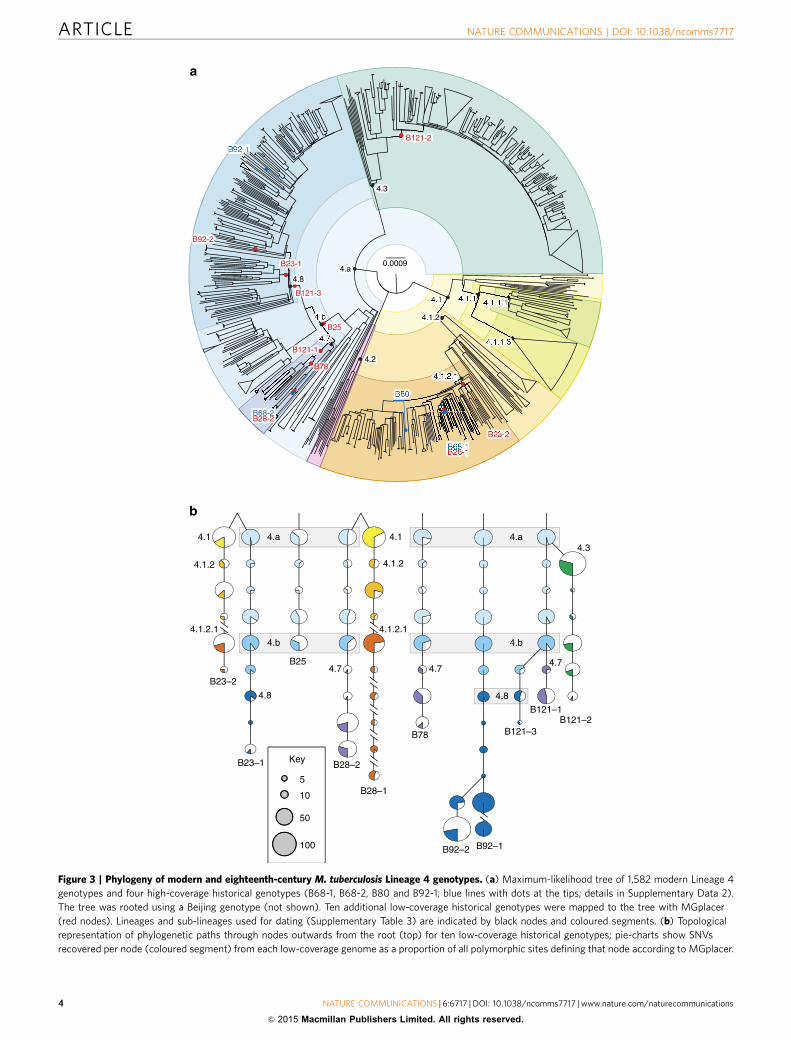
Phylogenetic analyses. In all 14 historical genomes, we detected aseven base-pair deletion in the pks15/1 gene, characteristic of theEuro-American lineage of M. tuberculosis8,9. This lineage, alsotermed Lineage 4, currently accounts for over a million TB cases ayear in Europe and in the Americas10. To determine preciserelationships between historical and modern strains, we retrieved1,582 contemporary unassembled Lineage 4 genomes drawn fromfour collections11–14 and one Beijing-lineage genome as outgroup.We mapped reads from the contemporary genomes and fromour four high-coverage historical genomes against the H37Rvreference genome. We then generated a phylogenetic tree from
Figure 1 | Source of eighteenth century M. tuberculosis genomes. (a) Location of Vac, Hungary. (b) Dominican church housing Vac mummies
(rAndras Tumbasz). (c) Mummified remains of Terezia Hausmann (rHungarian Natural History Museum). (d) Record of Terezia Hausmann’s death
(rHungarian Natural History Museum).
ARTICLE NATURE COMMUNICATIONS | DOI: 10.1038/ncomms7717
2 NATURE COMMUNICATIONS | 6:6717 | DOI: 10.1038/ncomms7717 | www.nature.com/naturecommunications
& 2015 Macmillan Publishers Limited. All rights reserved.
single-nucleotide variants (SNVs) found in non-repetitive regionsand adapted a recently described hierarchical nomenclature15 todefine nodes and sub-clades within the tree (Fig. 3a and
Supplementary Data 1–3). In this way, we established thatour four high-coverage historical genomes belonged tophylogenetically distinct genotypes (Fig. 3a and Table 1).
Table 1 | Biographical data with sequence coverage and sub-lineages of historical M. tuberculosis genomes.
Name Body#
Sex Age atdeath
(years)
Date ofdeath
Source ofsample
Reads persample
(millions)
Reads mappingto H37Rv
(thousands)
Genome % Coverage Sub-lineage20
Laszlo Beniczky 121 M B38 1764 Rib 48 182 B121-1 82 5.2X 4.7B121-2 10 0.7X 4.3B121-3 8 0.5X 4.b
Terezia Hausmann 68 F 28 1797 Left lung 26 11,425 B68-1* 57 332X 4.1.2.1B68-2w 43 253X 4.7
Anna Schneller 78 F 48 1795 Rib 17 116 B78 5.3X 4.7Anna Sch+oner 28 F 55 1793 Abdomen 60 202 B28-1* 75 6.1X 4.1.2.1
B28-2w 25 2.1X 4.7Gaspar Steitel 25 M 58 1794 Abdomen 64 50 B25 1.7X 4.aErzsebet Viragh 80 F 37 1805 Thorax 14 253 B80 12.8X 4.1.2.1Unknown 23 M 418 1731–1838 Abdomen 42 182 B23-1 93 5.9X 4.8
B23-2 7 0.4X 4.1.2.1Unknown 92 M 20–39 1787 Thorax 20 4,236 B92-1 96 187X 4.8
B92-2 4 8.6X 4.8
F, female; M, male.%Indicates percentage of reads belonging to specific genotype of all reads that map to M. tuberculosis H37Rv from a mixed sample.*Genotypes B28-1 and B68-1 are indistinguishable.wGenotypes B28-2 and B68-2 are indistinguishable.
A
0.0
0.1
0.2
0.3
0.4
0.5
Fre
quen
cy
A C C
0.0
0.1
0.2
0.3
0.4
0.5
G
0.0
0.1
0.2
0.3
0.4
0.5
Fre
quen
cy
–10 –9 –8 –7 –6 –5 –4 –3 –2 –1 –10 –9 –8 –7 –6 –5 –4 –3 –2 –1 –10 –9 –8 –7 –6 –5 –4 –3 –2 –1 –10 –9 –8 –7 –6 –5 –4 –3 –2 –11 2 3 4 5 6 7 8 9 10
G
1 2 3 4 5 6 7 8 9 10
T
1 2 3 4 5 6 7 8 9 10
T
0.0
0.1
0.2
0.3
0.4
0.5
1 2 3 4 5 6 7 8 9 10
1 2 3 4 5 6 7 8 9 10 11 12 13 14 15 16 17 18 19 20 21 22 23 24 25
0.00
0.005
0.01
0.015
0.00
0.005
0.01
0.015
Fre
quen
cy
–25
–24
–23
–22
–21
–20
–19
–18
–17
–16
–15
–14
–13
–12
–11
–10 –9 –8 –7 –6 –5 –4 –3 –2 –1
Base position
Figure 2 | Signatures of DNA damage associated with aged DNA. These data from body 28 are representative of all eighteenth-century samples.
(a) The four panels show the average base frequencies at positions within individual reads (grey box) flanked by all calls from reads in neighbouring
sequences. (b) Frequencies of specific base substitutions at specific positions near the 50-end (left panel) and 30-end (right panel) occurring within reads.
C to T changes are indicated by a red line, and G to A changes by a blue line.
NATURE COMMUNICATIONS | DOI: 10.1038/ncomms7717 ARTICLE
NATURE COMMUNICATIONS | 6:6717 | DOI: 10.1038/ncomms7717 | www.nature.com/naturecommunications 3
& 2015 Macmillan Publishers Limited. All rights reserved.
-
-
-
-
4
4 a
4
4
0.0009
B121-1
B25
B78
B68-2B28-2
B23-1
B121-3
B92-1
B92-2
B121-2
B80
B68-1B28-1
B23-2
4.2
4.1
4.a
4.b
4.3
4.1.1
4 14.1.2
4.1.2.1
4.1.1.3
4.1.1.1
4.8
4.7
B23–2
B28–2
B121–1
B121–3
B25
B78
4.a4.1
4.1.2
4.1.2.1
4.1
4.1.2
4.1.2.1
4.b
4.8
4.b
4.8
4.74.7
4.a
4.7
4.3
B23–1
B28–1
B121–2
B92–2 B92–1
5
50
10
100
Key
Figure 3 | Phylogeny of modern and eighteenth-century M. tuberculosis Lineage 4 genotypes. (a) Maximum-likelihood tree of 1,582 modern Lineage 4
genotypes and four high-coverage historical genotypes (B68-1, B68-2, B80 and B92-1; blue lines with dots at the tips; details in Supplementary Data 2).
The tree was rooted using a Beijing genotype (not shown). Ten additional low-coverage historical genotypes were mapped to the tree with MGplacer
(red nodes). Lineages and sub-lineages used for dating (Supplementary Table 3) are indicated by black nodes and coloured segments. (b) Topological
representation of phylogenetic paths through nodes outwards from the root (top) for ten low-coverage historical genotypes; pie-charts show SNVs
recovered per node (coloured segment) from each low-coverage genome as a proportion of all polymorphic sites defining that node according to MGplacer.
ARTICLE NATURE COMMUNICATIONS | DOI: 10.1038/ncomms7717
4 NATURE COMMUNICATIONS | 6:6717 | DOI: 10.1038/ncomms7717 | www.nature.com/naturecommunications
& 2015 Macmillan Publishers Limited. All rights reserved.

Conventional phylogenetic methods that rely on identificationof all trusted SNVs within a genome could not be applied to theten low-coverage genome sequences we obtained. We thusadapted the technique of phylogenetic placement, whereby low-coverage genomes are placed on a fixed reference tree, computedfrom high-coverage genomes. To do this, we reconstructed thesequences of all nodes within the Lineage 4 phylogeny anddocumented the SNVs that characterized each node. We thendevised a new algorithm, MGplacer, capable of mapping low-coverage genomes, including those from multiple-genotypesamples, to successive nodes within the tree. This approachallowed us to perform phylogenetic placements for all ten low-coverage historical genomes (Fig. 3). These phylogenetic analysesrevealed that there were at least 12 distinct strains ofM. tuberculosis circulating in eighteenth-century Hungary. Thismeans we can rule out a clonal outbreak caused by a singleparticularly virulent strain as the explanation for the highprevalence of TB in this population. Furthermore, the deepnesting of our historical M. tuberculosis genotypes withincontemporary sub-divisions of the Lineage 4 phylogeny confirmscontinuity of strain lineages over the past two centuries.
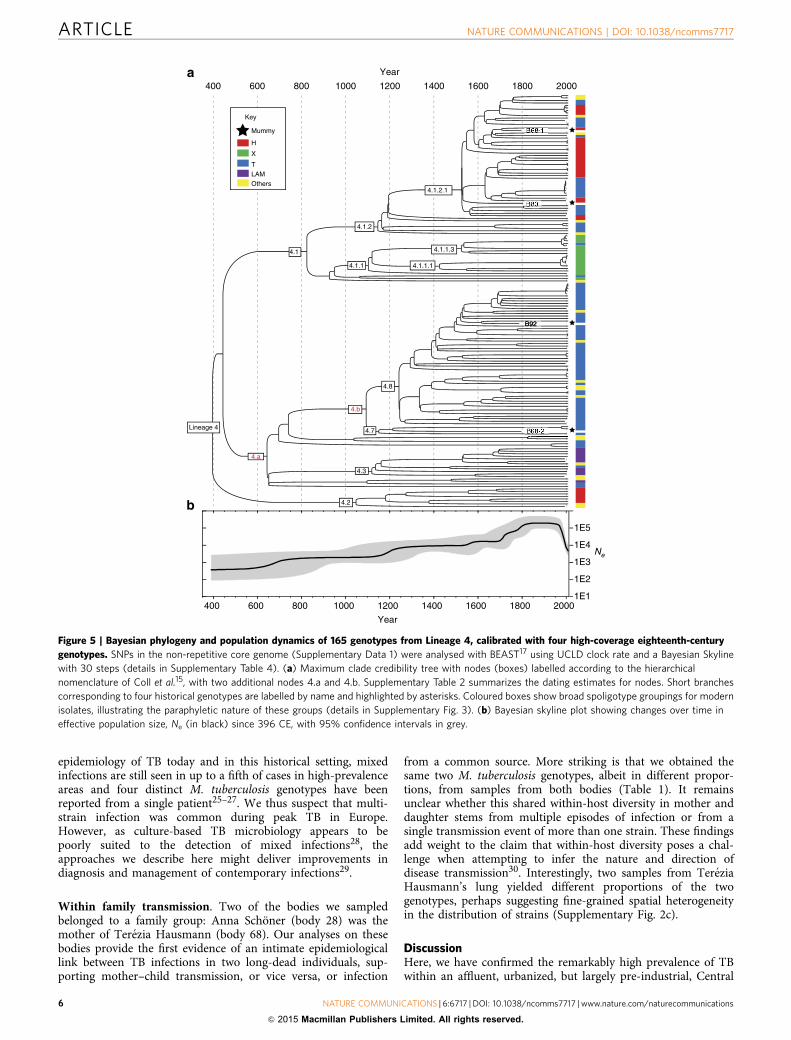
Dating. Next, we estimated divergence times for Lineage 4 and itssub-lineages. For dating, we selected the four high-coverage his-torical genomes, which had well-documented dates of death fortip calibration, as well as 161 modern genomes from Lineage 4that spanned a range of isolation dates from 1992 to 2010(Supplementary Table 2). We detected significant clock-likebehaviour for the Lineage 4 tree when data from modern andhistorical isolates were combined (Fig. 4). We obtained consistentdates of the most recent common ancestors of Lineage 4 and ofseveral internal nodes using two different programmes, Path-O-Gen16 and BEAST17 (Fig. 5a, Supplementary Table 3; Fig. 4 andSupplementary Fig. 3). The Path-O-Gen analysis reported thedate of the most recent common ancestor of Lineage 4 as 470 CE,whereas the median estimate from the best of 12 BEAST modelsplaced the date at 396 CE, that is, within the late Roman period,
with a range between models that spanned the Iron Age to theend of Antiquity (Supplementary Table 4). Our dating isconsistent with evidence that a strain containing the pks15/1deletion was present in Britain by the second–fourth centuriesCE18.
In line with historical epidemiological records19,20, a BayesianSkyline plot21 shows that the effective population size for Lineage4 increased continuously from its origin until the twentiethcentury, when it underwent a precipitous decline (Fig. 5b).Our median estimate of the mutation rate for Lineage 4 is5.00� 10� 08 substitutions per nucleotide per year(Supplementary Table 4). This mutation rate, calibrated withaccurate historical dates, is similar to rates estimated fromcontemporary M. tuberculosis genomes11 and from M. pinnepediigenomes that were obtained from samples radiocarbon-dated to1028–1280 CE3. This mutation rate is consistent with thehypothesis that the most recent common ancestor of theM. tuberculosis complex existed o6,000 years ago3, but isinconsistent with the recovery of amplification productsindicative of sub-lineages within the complex from Neolithicsamples22–24. One potential explanation for this discrepancy isthat some assumptions underlying phylogenetic dating (forexample, of a stable substitution rate) may be erroneous.Alternatively, ancient DNA studies that rely on PCRamplification may have been subject to contamination. Therecovery of additional M. tuberculosis genomes from well-datedhistoric and prehistoric samples will be needed to settle this issue,including from the Neolithic samples that have generated the sub-lineage-specific amplification products.
Mixed infections. Microbiological analyses of samples fromcontemporary TB patients usually report a single strain ofM. tuberculosis per patient. By contrast, five of the eight bodies inour study yielded more than one M. tuberculosis genotype—remarkably, from one individual we obtained three distinctgenotypes (Table 1). Although this predominance of mixedinfections almost certainly reflects a real difference between the
0
0.005
0.01
0.015
0.02
0.025
1750 1800 1850 1900 1950 20000
0.005
0.01
0.015
0.02
0.025
1750 1800 1850 1900 1950 2000
0
0.005
0.01
0.015
0.02
0.025
1750 1800 1850 1900 1950 20000
0.005
0.01
0.015
0.02
0.025
1990 1995 2000 2005 2010
Roo
t-to
-tip
dis
tanc
e
Roo
t-to
-tip
dis
tanc
e
Roo
t-to
-tip
dis
tanc
e
Roo
t-to
-tip
dis
tanc
e
Year of isolationYear of isolation
Year of isolationYear of isolation
y = 1.39E–05 x – 6.55E–03R2 = 0.21P < 0.00001TMRCA = 470 CE
y = 4.63E–05 x – 7.14E–02R2 = 0.063P < 0.0013TMRCA = 1,544 CE
y = 1.31E–05 x – 7.42E–03R2 = 0.27P < 0.00001TMRCA4.a = 565 CE
y = 1.33E–05 x – 1.11E–02R2 = 0.31P < 0.00001TMRCA4.1 = 828 CE
Figure 4 | Linear regression plots of root-to-tip distances according to Path-O-Gen (http://tree.bio.ed.ac.uk/software/pathogen/). (a) All 165
genotypes in Lineage 4, including four high-coverage eighteenth-century genomes. (b) Only the 161 modern isolates. (c) Genotypes from sub-lineage 4.1.
(d) Genotypes from sub-lineage 4.a.
NATURE COMMUNICATIONS | DOI: 10.1038/ncomms7717 ARTICLE
NATURE COMMUNICATIONS | 6:6717 | DOI: 10.1038/ncomms7717 | www.nature.com/naturecommunications 5
& 2015 Macmillan Publishers Limited. All rights reserved.
epidemiology of TB today and in this historical setting, mixedinfections are still seen in up to a fifth of cases in high-prevalenceareas and four distinct M. tuberculosis genotypes have beenreported from a single patient25–27. We thus suspect that multi-strain infection was common during peak TB in Europe.However, as culture-based TB microbiology appears to bepoorly suited to the detection of mixed infections28, theapproaches we describe here might deliver improvements indiagnosis and management of contemporary infections29.
Within family transmission. Two of the bodies we sampledbelonged to a family group: Anna Schoner (body 28) was themother of Terezia Hausmann (body 68). Our analyses on thesebodies provide the first evidence of an intimate epidemiologicallink between TB infections in two long-dead individuals, sup-porting mother–child transmission, or vice versa, or infection
from a common source. More striking is that we obtained thesame two M. tuberculosis genotypes, albeit in different propor-tions, from samples from both bodies (Table 1). It remainsunclear whether this shared within-host diversity in mother anddaughter stems from multiple episodes of infection or from asingle transmission event of more than one strain. These findingsadd weight to the claim that within-host diversity poses a chal-lenge when attempting to infer the nature and direction ofdisease transmission30. Interestingly, two samples from TereziaHausmann’s lung yielded different proportions of the twogenotypes, perhaps suggesting fine-grained spatial heterogeneityin the distribution of strains (Supplementary Fig. 2c).
DiscussionHere, we have confirmed the remarkably high prevalence of TBwithin an affluent, urbanized, but largely pre-industrial, Central
Ne
4.1.2.1
4.1.1.3
4.1.1.1
4.8
4.1.2
4.b
4.1.1
4.a
4.3
4.2
4.1
4.7Lineage 4
400 600 800 1000 1200 1400 1600 1800 2000
B68-2
B92B92
B80
B68-1
Key
Mummy
H
X
TLAMOthers
400 600 800 1000 1200 1400 1600 1800 20001E1
1E2
1E3
1E4
1E5
Year
Year
Figure 5 | Bayesian phylogeny and population dynamics of 165 genotypes from Lineage 4, calibrated with four high-coverage eighteenth-century
genotypes. SNPs in the non-repetitive core genome (Supplementary Data 1) were analysed with BEAST17 using UCLD clock rate and a Bayesian Skyline
with 30 steps (details in Supplementary Table 4). (a) Maximum clade credibility tree with nodes (boxes) labelled according to the hierarchical
nomenclature of Coll et al.15, with two additional nodes 4.a and 4.b. Supplementary Table 2 summarizes the dating estimates for nodes. Short branches
corresponding to four historical genotypes are labelled by name and highlighted by asterisks. Coloured boxes show broad spoligotype groupings for modern
isolates, illustrating the paraphyletic nature of these groups (details in Supplementary Fig. 3). (b) Bayesian skyline plot showing changes over time in
effective population size, Ne (in black) since 396 CE, with 95% confidence intervals in grey.
ARTICLE NATURE COMMUNICATIONS | DOI: 10.1038/ncomms7717
6 NATURE COMMUNICATIONS | 6:6717 | DOI: 10.1038/ncomms7717 | www.nature.com/naturecommunications
& 2015 Macmillan Publishers Limited. All rights reserved.
European population. By showing that historical strains can beaccurately mapped to contemporary lineages, we have ruled out,for early modern Europe, the kind of scenario recently proposedfor the Americas3, that is, wholesale replacement of one majorlineage by another (with a different host range and presumedpathogen biology) and have confirmed the genotypic continuityof an infection that has ravaged the heart of Europe sinceprehistoric times31. With TB resurgent in many parts of theworld, including Hungary32, the struggle to control this ancientinfection is far from over. Here, we have shown that metagenomicapproaches can document past infections. However, we have alsorecently shown that metagenomics can identify and characterizepathogens in contemporary samples29,33, so such approachesmight soon also inform current and future infectious diseasediagnosis and control.
MethodsSample collection and storage. Samples were collected in 1997 and 1999 using aStortz endoscope and aseptic technique. Sample site, body number and name wererecorded and samples were placed into numbered sterile universal bottles, whichwere then individually wrapped in plastic bags and stored at 4 �C. Relevant bio-graphic information (for example, age, sex, family name and relationships, date andcause of death) was retrieved from contemporary written records, including text onthe coffin and information in death, baptismal and marriage registers.
Extraction of DNA with library preparation and sequencing. DNA wasextracted from mummified tissue following a modification of a publishedprotocol34. Mummified tissue (15–20 mg) was added to 400 ml of deproteinationsolution (0.5 M EDTA pH 8.0 and 20 mg ml� 1 proteinase K) in a sterile 2 mlscrew-capped tube containing a minimum of ten glass beads (1–2 mm diameter).The tubes were mixed twice in a mini-bead beater at top speed for 45 s, thenincubated shaking at 56 �C for 48–72 h (or until the samples were fully dispersed).
After deproteination, half the slurry was transferred into sterile 15 ml screw-capped tubes (N-phenacythiazolium bromide (PTB–)), with 4.5 ml lysis buffer (5 Mguanidine thiocyanate, 0.1 M tris-HCl pH 6.4, 0.2 M EDTA pH 8.0 and TritonX-100). PTB (40ml) was added to the remaining residual slurry in the 2-ml tubeand incubated at 56 �C for 1 h. After incubation, the residual slurry was transferredinto sterile 15 ml screw-capped tubes (PTBþ ), with 4.5 ml lysis buffer. Sampletubes were incubated in a water bath at 56 �C for 48–72 h, subjected to three roundsof snap freezing in liquid nitrogen, followed by thawing in a 56 �C water bath.
Tubes were centrifuged at 2,500 r.p.m. (1,258g) for 15 min and the supernatantstransferred to sterile 15 ml screw-capped tubes. Freshly mixed silica (20 ml) wasadded and the samples incubated at room temperature for 1 h on a rotator,centrifuged at 2,500 r.p.m. (1,258g) for 15 min, the silica supernatants were eitherstored at 4 �C (PTB– samples) or discarded (PTBþ samples). The silica pelletswere dislodged by vortexing, resuspended in 200ml wash buffer (5 M guanidinethiocyanate, 0.1 M Tris-HCl, pH 6.4) and transferred to sterile 2 ml screw-cappedtubes. Residual silica was washed out with another 100 ml wash buffer. Tubes werecentrifuged at 14,000 r.p.m. (20,817g) for 1 min to pellet the silica and thesupernatant was discarded. Silica pellets were washed by resuspending once in200ml wash buffer, twice in 200 ml � 20 �C filter-sterilized ethanol and once in200ml of � 20 �C acetone, centrifuging at 14,000 r.p.m. (20,817g) for 1 min anddiscarding washings. Tubes were drained on clean absorbent paper followed bydrying at 56 �C for 1 h. Dried preparations were stored at 4 �C until examined.
Dried silica supernatants were rehydrated with 80 ml of filter sterilized elutionbuffer (EB), mixed and incubated at 60 �C for 15 min. All samples were centrifugedat 14,000 r.p.m. (20,817g) for 1 min, 70ml of supernatant was transferred to 1.5 mlsterile low binding tubes. To remove residual slurry, the supernatant wascentrifuged for a further 1 min at 14,000 r.p.m. (20,817g) and 60 ml of supernatantwas processed. AMPureXP beads (at room temperature) were added to eachsample (36 ml) and mixed by pipetting. All samples were incubated for 10 min atroom temperature, placed on the magnetic stand until the sample was clear, 94 mlof supernatant was removed and stored for further processing. The remainingbeads were washed twice with 80% ethanol for at least 30 s per wash. Beads were airdried for 5 min on the magnetic stand, resuspended in 32.5 ml EB off the magneticstand and incubated for 5 min at room temperature. After placing on the magneticstand 30ml of supernatant was removed and stored at –20 �C in sterile 1.5 ml lowbinding tubes (DNA fragments 4500 bp). The stored 94ml supernatant was takenand 200ml AMPure XP beads added, mixed by pipetting and incubated at roomtemperature for 10 min. Samples were placed on the magnetic stand until clear and290ml of supernatant was discarded. The remaining beads were washed twice with80% ethanol for at least 30 s per wash. Beads were air dried for 10 min on themagnetic stand, resuspended in 65 ml EB off the magnetic stand and incubated for10 min at room temperature. After placing on the magnetic stand 62.5 ml ofsupernatant was transferred to sterile 1.5 ml low binding tubes (DNA fragmentso500 bp). Extracted DNA (o500 bp) was quantified using HS dsDNA qubit assay
(Life Technologies) as per the manufacturer’s instructions (2 ml of sample wasquantified).
Extracted DNA was converted into TruSeq Nano libraries for sequencing on anIllumina MiSeq according to the manufacturer’s low sample protocol with a fewmodifications. No fragmentation step or size selection after end repair was carriedout due to the nature of ancient DNA. Samples were cleaned after end repair with200 ml sample-purification beads. dA-tailing and adapter ligation were according tothe manufacturer’s protocol. DNA fragments were enriched using 15 PCR cyclesinstead of 8. Libraries were quantified using HS dsDNA qubit assay as per themanufacturer’s instructions (2 ml of sample was quantified), then stored at � 20 �Cuntil preparation for sequencing on the MiSeq.
Libraries were pooled in equimolar amounts (determined by analysis on anAgilent Bioanalyser 2100 and HS dsDNA qubit assay) and 12 pM sequenced on anIllumina MiSeq platform v2 2� 250 bp paired end protocol. Body 23, 25, 28 and121 of 4 nM libraries were pooled and sequenced on an Illumina HiSeq platform(rapid run), TruSeq Rapid SBS kit—HS (200 cycle).
Preventing M. tuberculosis contamination. DNA extraction and library pre-paration (up until the library amplification step) were carried out in a dedicatedpre-PCR laboratory in which no mycobacterial strains had been cultured, nomycobacterial DNA had been PCR-amplified and no Lineage 4 strains had beengenome-sequenced. Library preparation was completed in the post-PCR labora-tory. All pipettes were ultraviolet treated and all benches and equipment cleanedwith hypochlorite and wiped with 80% ethanol before and after these procedures.Gloves were changed between handling different samples. Preparation of sequen-cing libraries for M. bovis Bacillus Calmette-Guerin (BCG) had been carried outpreviously in these laboratories, but no contamination of Illumina libraries withBCG sequences was seen in any of the intervening sequencing runs, nor in any ofthe libraries analysed here.
There are no plausible human or environmental sources for M. tuberculosisDNA in our laboratory. The presence of distinct genotypes of M. tuberculosis ineach of the samples, aside from the mother/daughter pair, rules out cross-contamination between samples as the source of M. tuberculosis sequences.In the mother/daughter pair, the marked difference in the proportions of thetwo M. tuberculosis genotypes suggests cross-contamination is unlikely.
Initial analysis of historical M. tuberculosis genotypes. In preliminary analyses,single MiSeq runs from three bodies (bodies 78, 80, 92) and de-multiplexed MiSeqdata from other samples were analysed by mapping reads to the H37Rv genomeusing Bowtie2 (ref. 35), with stringent mapping parameters that specify no morethan 3 mismatches per 100 bases:
--mp 1,1 --ignore-quals --score-min L,0,-0.03.We also excluded reads that matched to rRNA genes. These stringent
conditions rule out spurious matches to reads from environmental mycobacteriaallowing selection of samples, which had appreciable coverage of TB genomes.Under these conditions, we obtained convincing even coverage for eight samples(Table 1) and uneven, low depth of coverage for the others (SupplementaryTable 1). Aligned BAM files were analysed using MapDamage2 (ref. 36) forevidence of DNA damage associated with ancient DNA, revealing little to no C to Tor G to A conversion at the ends of reads (Fig. 2).
Additional single MiSeq and HiSeq runs on the same and/or samples from theeight putatively infected mummies (Supplementary Table 1) were pooled with theoriginal reads for genomic evaluation. The final pooled reads were filtered withBowtie2 using the relaxed parameters:
--local -D 10 -R 3 -N 0 -L 20 -i S,1,0.50to allow sensitive recovery of reads specific to M. tuberculosis. Specificity was
then ensured by filtering the mapping results with the Python script post_filter.py,which retained pairs of reads where the mapped region in at least one read wasZ100 bp in length and Z97.5% identical to the H37Rv reference (using aconservative 100 bp cutoff enabled improved specificity of mapping and excludedshort spurious matches to sequences from related organisms). For each sample,although we also estimated the number of reads that mapped to the humangenome hg19, we found relatively few reads of human origin (SupplementaryTable 1).
Phylogenetic analysis of samples from eight bodies. In an initial phylogeneticanalysis, we examined all reads that mapped to H37Rv and overlapped position3,296,371 in the H37Rv genome, which marks a seven base-pair deletion char-acteristic of Lineage 4 (to which H37Rv belongs)8,9. All such reads showed thesame sequence as H37Rv, so we concluded that all our historical genotypes belongto Lineage 4. For detailed phylogenetic analysis of historical genotypes, we selectedunassembled draft genomes from the European Nucleotide Archive Short ReadArchives drawn from four sets of genotypes. These contemporary Lineage 4genomes were derived from four distinct geographical settings: Malawi (Short ReadArchive accession code ERP001072), the UK (ERP000276), Russia (ERP000192)and the Netherlands (ERP000111)11–14. From these collections, we selectedunassembled draft genomes belonging to various sub-lineages of Lineage 4, basedon lineage-specific IS6110 insertions29 at the following positions (relative toreference strain 9177-77): 486,196 for Harlem and X clades, 935,456 for LAM clade
NATURE COMMUNICATIONS | DOI: 10.1038/ncomms7717 ARTICLE
NATURE COMMUNICATIONS | 6:6717 | DOI: 10.1038/ncomms7717 | www.nature.com/naturecommunications 7
& 2015 Macmillan Publishers Limited. All rights reserved.
and 893,641 for T clade. ERR234658 from the Beijing lineage was chosen as anoutgroup.
Reads from the contemporary Lineage 4 unassembled draft genomes weremapped to H37Rv using Bowtie2 with default settings2. SNVs were called usingSamtools37 with parameters
mpileup -AB -Q 0 -I -C20 -h 50 –gffollowed by BCFtools11 with parametersview -g -cp 1We tagged as ambiguous all sites with o20-fold coverage and where o80% of
reads supported a single nucleotide. Within the entire data set, phylogeneticanalyses were restricted to sites that were unambiguous in Z90% of the genomesand were outside of the repetitive regions in Supplementary Data 3. Genomes with410% ambiguous bases were then removed.
We called SNVs for B68 (Terezia Hausmann) in two phases. In the first phase,we binned SNVs to the B68-1 and B68-2 genotypes by depth of coverage. As shownin supplementary Fig. 2A, the frequency of reads supporting each SNV fell into abimodal distribution with minimal overlap, so that we could call informative SNVsby assigning those with r48% to B68-2 and Z52% to B68-1. After theseprocedures, eight uninformative heterogeneous sites remained unassigned andwere discarded. In a second confirmatory phase, we used a phylogeny–awareapproach (MGPlacer, see below) to analyse the B68 reads, using a pre-computedLineage 4 phylogeny (see below), which gave identical results.
We confirmed that the two high-coverage unmixed historical genomescontained comparable numbers of informative SNVs to the contemporarygenomes. When considering all informative sites (SNVs present in othergenotypes), the proportion of uncovered sites in B80 was found to be only 1.2%(compared with an average of 0.5% sites for the modern genomes). This means thatwe can expect to be missing no more than one or two B80-specific SNVs. TheB92-1 genome has an extremely high coverage (186X and 495% in the sample), sowe see only 0.1% uncovered informative sites. As shown in Supplementary Fig. 2B,all previously known SNVs were supported in B92-1 by 485% of the reads. Thismeans that the SNVs in B92-1 are as good as in any modern genome.
The two historical genomes derived from B68, together with two otherhistorical draft genomes with 410-fold coverage (B80, B92-1) were then combinedwith the 1,582 modern genomes to create a set of 1,586 Lineage 4 genomes (plusBeijing ERR234658), which were subjected to phylogenetic analysis. A maximum-likelihood tree (Fig. 3a) was constructed from the concatenated SNVs from the1,586 M. tuberculosis genomes (Supplementary Data 1) using RAxML 7.2.8 (ref. 38)with the GTRCAT model and illustrated with FigTree v1.4.2 (http://tree.bio.ed.ac.uk/software/figtree).
MGplacer. Conventional phylogenetic methods that rely on identification of alltrusted SNVs within a genome cannot be applied to the low-coverage genomesequences we obtained from most samples. We thus adapted the technique ofphylogenetic placement, whereby low-coverage genomes are placed on a fixedreference tree, computed from high-coverage genomes. To do this, we devised anew algorithm, MGplacer, capable of mapping low-coverage genomes, even fromsamples with mixed genomes. MGplacer provides improved performance whenapplied to samples with mixed genotypes from the same phlogeny in a mono-morphic organism like M. tuberculosis. When using MGplacer, the assignment ofreads to the low-coverage genotypes in mixed samples relies on mapping of eachread to a chain of nodes in an existing pre-computed phylogeny derived from41,500 strains. It does not rely on depth of coverage during this process, or does itrequire all regions of the genome to be recovered. Supplementary Fig. 1 provides avisual of the strength of evidence for the deduced lineage mapping using thisapproach. The scripts for implementing MGplacer and other scripts described herefor public download at https://sourceforge.net/projects/mgplacer/files/.
Reconstructing ancestral states at all phylogenetic nodes (script MGplacer.R).Ancestral states for all nodes in the maximum-likelihood 1,586-Lineage 4genome phylogeny (Fig. 3a) were determined by a time-reversible Markovprocess39, modified from the ACE function in the APE package in R40. Thisprocess uses the JC69 model with a fixed substitution rate, calculated as the numberof all polymorphic sites divided by the total length of non-repetitive sites in thereference genome. The most likely ancestral state at each node was calculated as themaximum a posteriori state by the Viterbi algorithm, a dynamic programmingalgorithm commonly used for finding the most likely sequence of hidden states41.
Branch locations of mummy genotypes with low coverage (script MGplacer2.py).Reads that covered polymorphic sites in the 1,586-genome phylogeny wereextracted from the output of the post_filter.py script. SNVs were classified as‘supported’ when the number of supporting reads was Z1/3 of the mediancoverage of all polymorphic sites within that draft genome and otherwise as ‘notsupported ‘. The likelihood of the assignment of a genotype to a branch b in thephylogeny was calculated from a 2 by 2 table:
Consistent SNVs Inconsistent SNVs
Supported Cb Ci
Not supported Nb–Cb Ni–Ci
where Nb refers to the number of all SNVs that are consistent with a branchassignment to b, of which Cb are supported. Similarly, Ni is the number of all SNVsthat are inconsistent with an assignment onto b, of which Ci are supported.Assuming a binomial distribution of the ratio of supported/not supported SNVs,the likelihood of a genotype belonging to branch b is:
lkb ¼ Cb=Nbð ÞCb Nb �Cbð Þ=Nbð Þ Nb �Cbð Þ Ci=Nið ÞCi Ni �Cið Þ=Nið Þ Ni �Cið Þ
The significance (Supplementary Fig. 1) of these branch assignments was testedby the rank order of lkb in 10,000 random permutations of SNV support across allbranches in the tree. To detect multiple genotypes within each sample, we usedMGplacer in an iterative manner, in which iterations were continued until nofurther significant branch assignment were achieved. After each iteration, onlyinconsistent SNVs and their supporting reads were retained for the subsequentiterations. Examples of the percentage of reads assigned to the major and minorgenotypes in high-coverage samples are shown in Supplementary Figs. 2A and Band examples of the numbers of reads supporting each genotype in low-coveragesamples in Supplementary Fig. 1A–D. Examples of low-coverage samples withno significant reads from more than one genotype are shown in SupplementaryFig. 1E and F.
In silico spoligotyping. SpolPred was used to calculate the spoligotype pattern42
and TB-lineage used to predict the representative clade from this pattern43. Thespoligotype was called as ‘orphan’ if the probability given by TB-lineage was lessthan 0.8.
Bayesian estimates of age and population fluctuation. Calculation of the root totip distances versus dates of isolation indicated linear relationships when using onlymodern isolates (R2¼ 0.063) or both historical and modern isolates (R2¼ 0.21;Fig. 4) using Path-O-Gen (http://tree.bio.ed.ac.uk/software/pathogen/). We esti-mated the population history of lineage 4 with the Bayesian algorithms in Beastv1.8.0 (ref. 17). The input consisted of four historical genotypes with 410Xcoverage (Table 1), as well as 161 modern genomes (Supplementary Table 2),which represented the widest range of isolation dates as well as the genetic diversityin the maximum likelihood phylogeny (Supplementary Fig. 2A and SupplementaryData 2). A total of 16,449 SNVs (selected from Supplementary Data 1) in thenon-repetitive core genome, supplemented by the numbers of invariant A, C, T andG nucleotides were considered in the Bayesian estimates. The dates of isolation foreach strain were included in the Bayesian model as tip dates. Initial comparisonsshowed that the root positions of all maximum clade credibility trees differed fromthe root indicated by outgroup analysis in the maximum-likelihood phylogeny,which would reduce the dating accuracy of the MRCA (time to most recentcommon ancestor (TMRCA)). We therefore assigned lineages 4.1, 4.2 and 4.a tosingle monophyletic clades in order to ensure that the root was between these threelineages. A total of 12 independent Markov Chain Monte Carlo analyses were runfor different combinations of clock rate and population models (SupplementaryTable 4) for 100 million states, with sampling every 1,000 iterations. The initial fivemillion samples from the beginning of each run were treated as burn-in becausethey had significantly lower likelihoods or priors than subsequent samples.
The Bayes factors for all 12 models were evaluated with two methods, pathsampling and stepping-stone sampling, both of which are integrated in BEASTv1.8.0 and out-performed other existing methods44. Both methods require MarkovChain Monte Carlo sampling from a series of power posteriors. To initiate thissampling, a chain of 5M was first run as burn-in, and then 50 path steps, each ofwhich contains 100 K burn-in and a chain length of 1M, were applied to sample thelikelihood every 1,000 iterations. Of all combinations, the Bayesian model withuncorrelated lognormal distribution (UCLD) clock rates and a 30-step BayesianSkyline population size yielded the highest Bayes factor in the path-samplingmethod and the second highest Bayes factor in the stepping stone method.Therefore, the samples generated from this model were applied to yield themaximum clade credibility tree and Bayesian Skyline plot in Fig. 5 andSupplementary Fig 3. Supplementary Table 3 presents the median date estimates ofthe best model, as well as the range of median dates from all 12 models, for theMRCA of lineage 4 and sub-lineages. Supplementary Table 4 presents the Bayesfactors inferred by path sampling and stepping-stone sampling methods, as well asmutation rates and TMRCA generated from all 12 samples.
References1. Koch, R. Die Aetiologie der Tuberkulose. Berl. Klin. Wochenschr. 19, 221–230
(1882).2. Comas, I. et al. Out-of-Africa migration and Neolithic coexpansion of
Mycobacterium tuberculosis with modern humans. Nature Genet. 45,1176–1182 (2013).
3. Bos, K. I. et al. Pre-Columbian mycobacterial genomes reveal seals as a sourceof New World human tuberculosis. Nature 514, 494–497 (2014).
4. Donoghue, H. D. Insights into ancient leprosy and tuberculosis usingmetagenomics. Trends Microbiol. 21, 448–450 (2013).
5. Chan, J. Z. et al. Metagenomic analysis of tuberculosis in a mummy. N. Engl. J.Med. 369, 289–290 (2013).
ARTICLE NATURE COMMUNICATIONS | DOI: 10.1038/ncomms7717
8 NATURE COMMUNICATIONS | 6:6717 | DOI: 10.1038/ncomms7717 | www.nature.com/naturecommunications
& 2015 Macmillan Publishers Limited. All rights reserved.
6. Fletcher, H. A., Donoghue, H. D., Holton, J., Pap, I. & Spigelman, M.Widespread occurrence of Mycobacterium tuberculosis DNA from 18th-19thcentury Hungarians. Am. J. Phys. Anthropol. 120, 144–152 (2003).
7. Schuenemann, V. J. et al. Genome-wide comparison of medieval and modernMycobacterium leprae. Science 341, 179–183 (2013).
8. Gagneux, S. et al. Variable host–pathogen compatibility in Mycobacteriumtuberculosis. Proc. Natl Acad. Sci. USA 103, 2869–2873 (2006).
9. Marmiesse, M. et al. Macro-array and bioinformatic analyses revealmycobacterial ’core’ genes, variation in the ESAT-6 gene family and newphylogenetic markers for the Mycobacterium tuberculosis complex.Microbiology. 150, 483–496 (2004).
10. Gagneux, S. & Small, P. M. Global phylogeography of Mycobacteriumtuberculosis and implications for tuberculosis product development. LancetInfect. Dis. 7, 328–337 (2007).
11. Bryant, J. M. et al. Inferring patient to patient transmission of Mycobacteriumtuberculosis from whole genome sequencing data. BMC Infect. Dis. 13, 110 (2013).
12. Casali, N. et al. Evolution and transmission of drug-resistant tuberculosis in aRussian population. Nature Genet. 46, 279–286 (2014).
13. Walker, T. M. et al. Whole-genome sequencing to delineate Mycobacteriumtuberculosis outbreaks: a retrospective observational study. Lancet Infect. Dis.13, 137–146 (2013).
14. Coll, F. et al. PolyTB: A genomic variation map for Mycobacteriumtuberculosis. Tuberculosis (Edinb) 94, 346–354 (2014).
15. Coll, F. et al. A robust SNP barcode for typing Mycobacterium tuberculosiscomplex strains. Nat. Commun. 5, 4812 (2014).
16. Drummond, A., Pybus, O. G. & Rambaut, A. Inference of viralevolutionary rates from molecular sequences. Adv. Parasitol. 54, 331–358(2003).
17. Drummond, A. J., Suchard, M. A., Xie, D. & Rambaut, A. Bayesianphylogenetics with BEAUti and the BEAST 1.7. Mol. Biol. Evol. 29, 1969–1973(2012).
18. Muller, R., Roberts, C. A. & Brown, T. A. Genotyping of ancientMycobacterium tuberculosis strains reveals historic genetic diversity. Proc. Biol.Sci. 281, 20133236 (2014).
19. Wilson, L. G. Commentary: Medicine, population, and tuberculosis. Int. J.Epidemiol. 34, 521–524 (2005).
20. Newsholme, A. An inquiry into the principal causes of the reduction in thedeath-rate from phthisis during the last forty years, with special reference to thesegregation of phthisical patients in general institutions. J. Hyg. 6, 304–384(1906).
21. Drummond, A. J., Rambaut, A., Shapiro, B. & Pybus, O. G. Bayesian coalescentinference of past population dynamics from molecular sequences. Mol. Biol.Evol. 22, 1185–1192 (2005).
22. Rothschild, B. M. et al. Mycobacterium tuberculosis complex DNA from anextinct bison dated 17,000 years before the present. Clin. Infect. Dis. 33,305–311 (2001).
23. Nicklisch, N. et al. Rib lesions in skeletons from early neolithic sites in CentralGermany: on the trail of tuberculosis at the onset of agriculture. Am. J. Phys.Anthropol. 149, 391–404 (2012).
24. Hershkovitz, I. et al. Detection and molecular characterization of 9,000-year-old Mycobacterium tuberculosis from a Neolithic settlement in the EasternMediterranean. PLoS ONE 3, e3426 (2008).
25. Hanekom, M. et al. Population structure of mixed Mycobacterium tuberculosisinfection is strain genotype and culture medium dependent. PLoS ONE 8,e70178 (2013).
26. Warren, R. M. et al. Patients with active tuberculosis often have different strainsin the same sputum specimen. Am. J. Respir. Crit. Care. Med. 169, 610–614(2004).
27. Shamputa, I. C. et al. Genotypic and phenotypic heterogeneity amongMycobacterium tuberculosis isolates from pulmonary tuberculosis patients.J. Clin. Microbiol. 42, 5528–5536 (2004).
28. Hingley-Wilson, S. M. Metagenomic analysis of tuberculosis--currentlimitations. N. Engl. J. Med. 369, 1572 (2013).
29. Doughty, E. L., Sergeant, M. J., Adetifa, I., Antonio, M. & Pallen, M. J.Culture-independent detection and characterisation of Mycobacteriumtuberculosis and M. africanum in sputum samples using shotgun metagenomicson a benchtop sequencer. PeerJ 2, e585 (2014).
30. Worby, C. J., Lipsitch, M. & Hanage, W. P. Within-host bacterial diversityhinders accurate reconstruction of transmission networks from genomicdistance data. PLoS Comput. Biol. 10, e1003549 (2014).
31. Masson, M. et al. Osteological and biomolecular evidence of a 7000-year-oldcase of hypertrophic pulmonary osteopathy secondary to tuberculosis fromneolithic hungary. PLoS ONE 8, e78252 (2013).
32. Kodmon, C. et al. Molecular clues of a microepidemy among homelesstuberculosis patients in Budapest due to a new and local Mycobacteriumtuberculosis clade. Infect. Genet. Evol. 7, 632–635 (2007).
33. Pallen, M. J. Diagnostic metagenomics: potential applications to bacterial, viraland parasitic infections. Parasitology 141, 1–7 (2014).
34. Fletcher, H. A., Donoghue, H. D., Taylor, G. M., van der Zanden, A. G. &Spigelman, M. Molecular analysis of Mycobacterium tuberculosis DNAfrom a family of 18th century Hungarians. Microbiology 149, 143–151(2003).
35. Langmead, B. & Salzberg, S. L. Fast gapped-read alignment with Bowtie 2. Nat.Methods 9, 357–359 (2012).
36. Jonsson, H., Ginolhac, A., Schubert, M., Johnson, P. L. & Orlando, L.mapDamage2.0: fast approximate Bayesian estimates of ancient DNA damageparameters. Bioinformatics 29, 1682–1684 (2013).
37. Li, H. et al. The Sequence Alignment/Map format and SAMtools.Bioinformatics 25, 2078–2079 (2009).
38. Stamatakis, A. RAxML-VI-HPC: maximum likelihood-based phylogeneticanalyses with thousands of taxa and mixed models. Bioinformatics 22,2688–2690 (2006).
39. Pagel, M. Inferring the historical patterns of biological evolution. Nature 401,877–884 (1999).
40. Paradis, E., Claude, J. & Strimmer, K. APE: Analyses of Phylogenetics andEvolution in R language. Bioinformatics 20, 289–290 (2004).
41. Bykova, N. A., Favorov, A. V. & Mironov, A. A. Hidden Markov models forevolution and comparative genomics analysis. PLoS ONE 8, e65012 (2013).
42. Coll, F. et al. SpolPred: rapid and accurate prediction of Mycobacteriumtuberculosis spoligotypes from short genomic sequences. Bioinformatics 28,2991–2993 (2012).
43. Shabbeer, A. et al. TB-Lineage: an online tool for classification and analysisof strains of Mycobacterium tuberculosis complex. Infect. Genet. Evol. 12,789–797 (2012).
44. Baele, G., Lemey, P. & Vansteelandt, S. Make the most of your samples: Bayesfactor estimators for high-dimensional models of sequence evolution. BMCBioinformatics 14, 85 (2013).
AcknowledgementsWe thank Warwick Medical School for funding sequencing costs and salaries for G.L.K.,M.J.S., Z.Z. Initial sampling from the Vac mummies was funded by the UK WellcomeTrust under award number 0516/Z/97/Z to M.J.S. N.J.L. is supported by a UKMRC fellowship from the UK Medical Research Council. We acknowledge use ofcomputational facilities from the MRC CLIMB project, on which M.J.P. is theprincipal investigator.
Author contributionsM.A, H.D.D. and M.J.P. conceived the investigation. G.L.K. and J.Z.-M.C. and N.J.L.designed the experiments. I.S., I.P., M.S. and H.D.D. provided samples for analysis.G.L.K. J.Z.-M.C., J.Q. and N.J.L. performed laboratory work. G.L.K., M.J.S., Z.Z. andA.M. performed analyses. M.J.P. wrote the manuscript with contributions from allco-authors.
Additional informationAccession codes: Sequence data have been deposited in the European NucleotideArchive with the study accession code PRJEB7454.
Supplementary Information accompanies this paper at http://www.nature.com/naturecommunications
Competing financial interests: The authors declare no competing financial interests.
Reprints and permission information is available online at http://npg.nature.com/reprintsandpermissions/
How to cite this article: Kay, G. L. et al. Eighteenth-century genomes show that mixedinfections were common at time of peak tuberculosis in Europe. Nat. Commun. 6:6717doi: 10.1038/ncomms7717 (2015).
This work is licensed under a Creative Commons Attribution 4.0International License. The images or other third party material in this
article are included in the article’s Creative Commons license, unless indicated otherwisein the credit line; if the material is not included under the Creative Commons license,users will need to obtain permission from the license holder to reproduce the material.To view a copy of this license, visit http://creativecommons.org/licenses/by/4.0/
NATURE COMMUNICATIONS | DOI: 10.1038/ncomms7717 ARTICLE
NATURE COMMUNICATIONS | 6:6717 | DOI: 10.1038/ncomms7717 | www.nature.com/naturecommunications 9
& 2015 Macmillan Publishers Limited. All rights reserved.