D O C U M E N T D E T R A V A I L -...
100
AGRI.C.2 / PEC21 / 11 D O C U M E N T D E T R A V A I L Groupe de travail Prévisions Pêches et Nectarines 17/05/2011 Clause de non-responsabilité : le présent document de la Commission européenne a pour objet d'animer la discussion du groupe de travail prévision du Comité Consultatif du secteur des fruits et légumes. L'objectif est de présenter des informations exactes et à jour, mais la Commission n'assume aucune responsabilité quant aux informations que contient le présent document. Source : les données proviennent de différentes sources. Leur reproduction ou leur utilisation sont autorisées à condition de mentionner leur source.
Transcript of D O C U M E N T D E T R A V A I L -...
AGRI.C.2 / PEC21 / 11
D O C U M E N T D E T R A V A I L
Groupe de travail Prévisions Pêches et Nectarines
17/05/2011
Clause de non-responsabilité : le présent document de la Commission européenne a pour objet d'animer la discussion du groupe de travail prévision du Comité Consultatif du secteur des fruits et légumes. L'objectif est de présenter des informations exactes et à jour, mais la Commission n'assume aucune responsabilité quant aux informations que contient le présent document.Source : les données proviennent de différentes sources. Leur reproduction ou leur utilisation sont autorisées à condition de mentionner leur source.
LISTE DES TABLEAUX ET GRAPHIQUES
ProductionTableau 1.1 : Production totale de pêches et nectarinesTableau 1.2 : Prévisions pêches 2009 (source Europêch)Graphique 1.1 : Production totale de pêches et nectarinesGraphique 1.2 : Répartition de la production pêches et nectarinesGraphique 1.3 : Production par Etat MembreTableau 1.3 : Production de fruits à noyaux et kiwisTableau 1.4 Prévisions abricots 2009 (source Europêch)Graphique 1.4 : Production d'autres fruits à noyauxGraphique 1.5 : Production d'abricotsGraphique 1.6 : Production de cerisesGraphique 1.7 : Production de prunesGraphique 1.8 : Production de kiwis
SuperficieTableau 2.1 : Superficies de pêchers et nectariniers Graphique 2.1 : Superficies de pêchers et nectariniersTableau 2.2 : Superficies d'autres fruits à noyaux Graphique 2.2 : Superficies d'autres fruits à noyaux et kiwis Graphique 2.3 : Superficies d'abricotiersGraphique 2.4 : Superficies de cerisiersGraphique 2.5 : Superficies de pruniersGraphique 2.6 : Superficies de kiwis
RendementTableau 3.1 : Rendement pêches et nectarinesTableau 3.2 : Rendement autres fruits à noyaux
Prix à la productionTableau 4.1 : Prix à la production des pêches Graphique 4.1 : Prix à la production des pêches en EspagneGraphique 4.2 : Prix à la production des pêches en FranceGraphique 4.3 : Prix à la production des pêches en ItalieGraphique 4.4 : Prix à la production des pêches au GrèceTableau 4.2 : Prix à la production des nectarines Graphique 4.5 : Prix à la production des nectarines en EspagneGraphique 4.6 : Prix à la production des nectarines en FranceGraphique 4.7 : Prix à la production des nectarines en ItalieGraphique 4.8 : Prix à la production des nectarines en GrèceTableau 4.3 : Prix à la production des abricots Graphique 4.9 : Prix à la production des abricots en EspagneGraphique 4.10 : Prix à la production des abricots en FranceGraphique 4.11 : Prix à la production des abricots en ItalieTableau 4.4 : Prix à la production des kiwis Graphique 4.12 : Prix à la production des kiwis en ItalieGraphique 4.13 : Prix à la production des kiwis au PortugalTableau 4.5a-b : Prix à la production des pêches blanches et jaunes - par marchésTableau 4.6a-b : Prix à la production des nectarines blanches et jaunes - par marché
Commerce Extérieur de produits fraisTableau 5.1 : Importations de fruits à noyaux Graphique 5.1 : Importations de fruits à noyauxGraphique 5.2 : Importations de pêches et nectarinesGraphique 5.3 : Importations d'abricotsGraphique 5.4 : Importations de cerisesGraphique 5.5 : Importations de prunes
Tableau 5.2 : Exportations de fruits à noyauxGraphique 5.6 : Exportations de fruits à noyauxGraphique 5.7 : Exportations de pêches et nectarinesGraphique 5.8 : Exportations d'abricots Graphique 5.9 : Exportations de cerisesGraphique 5.10 : Exportations de prunes
Tableau 5.3 : Exportateurs de fruits à noyaux Graphique 5.11 : Exportations de pêches et nectarines par Etat MembreGraphique 5.12 : Exportations d'abricots par Etat Membre
Commerce intra-EU de produits fraisTableau 6.1 : Commerce intra-EU de fruits à noyauxGraphique 6.1 : Principaux EM expéditeurs de pêches et nectarinesGraphique 6.2 : Principaux EM expéditeurs d'abricotsGraphique 6.3 : Principaux EM destinataires de pêches et nectarinesGraphique 6.4 : Principaux EM destinataires d'abricots
Tableau 6.2 : Répartition mensuelle des exportations de pêches et nectarinesGraphique 6.5 : Répartition mensuelle des exportations de pêches et nectarinesGraphique 6.6 : Répartition mensuelle des exportations espagnoles de pêches et nectarinesGraphique 6.7 : Répartition mensuelle des exportations italiennes de pêches et nectarinesGraphique 6.8 Répartition mensuelle des exportations grecques de pêches et nectarinesGraphique 6.9 : Répartition mensuelle des exportations françaises de pêches et nectarines
Produits transformés
Tableau 7.1 : Commerce extérieur de conserves de pêchesGraphique 7.1 : Commerce extérieur de conserves de pêchesGraphique 7.2 Importations de conserves de pêchesGraphique 7.3 : Prix à l'importation de conserves de pêchesGraphique 7.4 : Exportations de conserves de pêchesGraphique 7.5 : Prix à l'exportation de conserves de pêches
Tableau 7.2 : Commerce extérieur d'abricotsGraphique 7.6 : Importations de conserves d'abricotsGraphique 7.7 : Exportations de conserves d'abricots
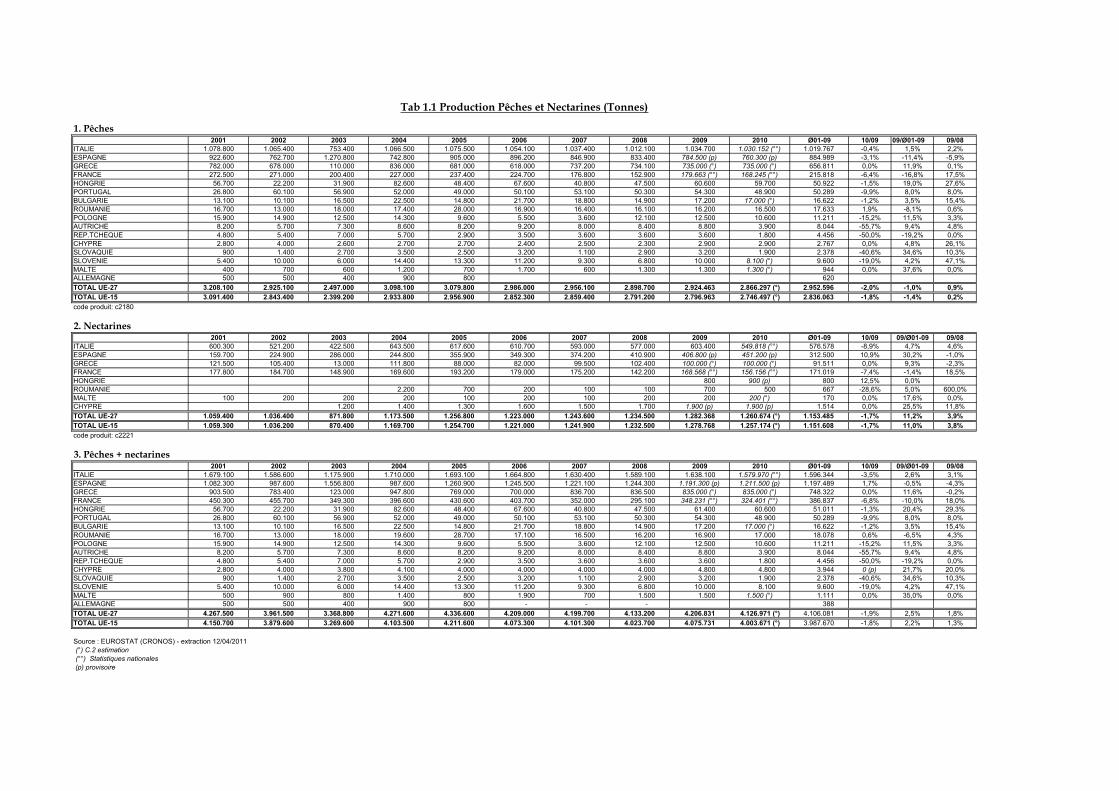
1. Pêches2001 2002 2003 2004 2005 2006 2007 2008 2009 2010 Ø01-09 10/09 09/Ø01-09 09/08
ITALIE 1.078.800 1.065.400 753.400 1.066.500 1.075.500 1.054.100 1.037.400 1.012.100 1.034.700 1.030.152 (°°) 1.019.767 -0,4% 1,5% 2,2%ESPAGNE 922.600 762.700 1.270.800 742.800 905.000 896.200 846.900 833.400 784.500 (p) 760.300 (p) 884.989 -3,1% -11,4% -5,9%GRECE 782.000 678.000 110.000 836.000 681.000 618.000 737.200 734.100 735.000 (°) 735.000 (°) 656.811 0,0% 11,9% 0,1%FRANCE 272.500 271.000 200.400 227.000 237.400 224.700 176.800 152.900 179.663 (°°) 168.245 (°°) 215.818 -6,4% -16,8% 17,5%HONGRIE 56.700 22.200 31.900 82.600 48.400 67.600 40.800 47.500 60.600 59.700 50.922 -1,5% 19,0% 27,6%PORTUGAL 26.800 60.100 56.900 52.000 49.000 50.100 53.100 50.300 54.300 48.900 50.289 -9,9% 8,0% 8,0%BULGARIE 13.100 10.100 16.500 22.500 14.800 21.700 18.800 14.900 17.200 17.000 (°) 16.622 -1,2% 3,5% 15,4%ROUMANIE 16.700 13.000 18.000 17.400 28.000 16.900 16.400 16.100 16.200 16.500 17.633 1,9% -8,1% 0,6%POLOGNE 15.900 14.900 12.500 14.300 9.600 5.500 3.600 12.100 12.500 10.600 11.211 -15,2% 11,5% 3,3%AUTRICHE 8.200 5.700 7.300 8.600 8.200 9.200 8.000 8.400 8.800 3.900 8.044 -55,7% 9,4% 4,8%REP.TCHEQUE 4.800 5.400 7.000 5.700 2.900 3.500 3.600 3.600 3.600 1.800 4.456 -50,0% -19,2% 0,0%CHYPRE 2.800 4.000 2.600 2.700 2.700 2.400 2.500 2.300 2.900 2.900 2.767 0,0% 4,8% 26,1%SLOVAQUIE 900 1.400 2.700 3.500 2.500 3.200 1.100 2.900 3.200 1.900 2.378 -40,6% 34,6% 10,3%SLOVENIE 5.400 10.000 6.000 14.400 13.300 11.200 9.300 6.800 10.000 8.100 (°) 9.600 -19,0% 4,2% 47,1%MALTE 400 700 600 1.200 700 1.700 600 1.300 1.300 1.300 (°) 944 0,0% 37,6% 0,0%ALLEMAGNE 500 500 400 900 800 620 TOTAL UE-27 3.208.100 2.925.100 2.497.000 3.098.100 3.079.800 2.986.000 2.956.100 2.898.700 2.924.463 2.866.297 (°) 2.952.596 -2,0% -1,0% 0,9%TOTAL UE-15 3.091.400 2.843.400 2.399.200 2.933.800 2.956.900 2.852.300 2.859.400 2.791.200 2.796.963 2.746.497 (°) 2.836.063 -1,8% -1,4% 0,2%code produit: c2180
2. Nectarines2001 2002 2003 2004 2005 2006 2007 2008 2009 2010 Ø01-09 10/09 09/Ø01-09 09/08
ITALIE 600.300 521.200 422.500 643.500 617.600 610.700 593.000 577.000 603.400 549.818 (°°) 576.578 -8,9% 4,7% 4,6%ESPAGNE 159.700 224.900 286.000 244.800 355.900 349.300 374.200 410.900 406.800 (p) 451.200 (p) 312.500 10,9% 30,2% -1,0%GRECE 121.500 105.400 13.000 111.800 88.000 82.000 99.500 102.400 100.000 (°) 100.000 (°) 91.511 0,0% 9,3% -2,3%FRANCE 177.800 184.700 148.900 169.600 193.200 179.000 175.200 142.200 168.568 (°°) 156.156 (°°) 171.019 -7,4% -1,4% 18,5%HONGRIE 800 900 (p) 800 12,5% 0,0%ROUMANIE 2.200 700 200 100 100 700 500 667 -28,6% 5,0% 600,0%MALTE 100 200 200 200 100 200 100 200 200 200 (°) 170 0,0% 17,6% 0,0%CHYPRE 1.200 1.400 1.300 1.600 1.500 1.700 1.900 (p) 1.900 (p) 1.514 0,0% 25,5% 11,8%TOTAL UE-27 1.059.400 1.036.400 871.800 1.173.500 1.256.800 1.223.000 1.243.600 1.234.500 1.282.368 1.260.674 (°) 1.153.485 -1,7% 11,2% 3,9%TOTAL UE-15 1.059.300 1.036.200 870.400 1.169.700 1.254.700 1.221.000 1.241.900 1.232.500 1.278.768 1.257.174 (°) 1.151.608 -1,7% 11,0% 3,8%code produit: c2221
3. Pêches + nectarines2001 2002 2003 2004 2005 2006 2007 2008 2009 2010 Ø01-09 10/09 09/Ø01-09 09/08
ITALIE 1.679.100 1.586.600 1.175.900 1.710.000 1.693.100 1.664.800 1.630.400 1.589.100 1.638.100 1.579.970 (°°) 1.596.344 -3,5% 2,6% 3,1%ESPAGNE 1.082.300 987.600 1.556.800 987.600 1.260.900 1.245.500 1.221.100 1.244.300 1.191.300 (p) 1.211.500 (p) 1.197.489 1,7% -0,5% -4,3%GRECE 903.500 783.400 123.000 947.800 769.000 700.000 836.700 836.500 835.000 (°) 835.000 (°) 748.322 0,0% 11,6% -0,2%FRANCE 450.300 455.700 349.300 396.600 430.600 403.700 352.000 295.100 348.231 (°°) 324.401 (°°) 386.837 -6,8% -10,0% 18,0%HONGRIE 56.700 22.200 31.900 82.600 48.400 67.600 40.800 47.500 61.400 60.600 51.011 -1,3% 20,4% 29,3%PORTUGAL 26.800 60.100 56.900 52.000 49.000 50.100 53.100 50.300 54.300 48.900 50.289 -9,9% 8,0% 8,0%BULGARIE 13.100 10.100 16.500 22.500 14.800 21.700 18.800 14.900 17.200 17.000 (°) 16.622 -1,2% 3,5% 15,4%ROUMANIE 16.700 13.000 18.000 19.600 28.700 17.100 16.500 16.200 16.900 17.000 18.078 0,6% -6,5% 4,3%POLOGNE 15.900 14.900 12.500 14.300 9.600 5.500 3.600 12.100 12.500 10.600 11.211 -15,2% 11,5% 3,3%AUTRICHE 8.200 5.700 7.300 8.600 8.200 9.200 8.000 8.400 8.800 3.900 8.044 -55,7% 9,4% 4,8%REP.TCHEQUE 4.800 5.400 7.000 5.700 2.900 3.500 3.600 3.600 3.600 1.800 4.456 -50,0% -19,2% 0,0%CHYPRE 2.800 4.000 3.800 4.100 4.000 4.000 4.000 4.000 4.800 4.800 3.944 0 (p) 21,7% 20,0%SLOVAQUIE 900 1.400 2.700 3.500 2.500 3.200 1.100 2.900 3.200 1.900 2.378 -40,6% 34,6% 10,3%SLOVENIE 5.400 10.000 6.000 14.400 13.300 11.200 9.300 6.800 10.000 8.100 9.600 -19,0% 4,2% 47,1%MALTE 500 900 800 1.400 800 1.900 700 1.500 1.500 1.500 (°) 1.111 0,0% 35,0% 0,0%ALLEMAGNE 500 500 400 900 800 - - - 388 TOTAL UE-27 4.267.500 3.961.500 3.368.800 4.271.600 4.336.600 4.209.000 4.199.700 4.133.200 4.206.831 4.126.971 (°) 4.106.081 -1,9% 2,5% 1,8%TOTAL UE-15 4.150.700 3.879.600 3.269.600 4.103.500 4.211.600 4.073.300 4.101.300 4.023.700 4.075.731 4.003.671 (°) 3.987.670 -1,8% 2,2% 1,3%
Source : EUROSTAT (CRONOS) - extraction 12/04/2011(°) C.2 estimation (°°) Statistiques nationales
(p) provisoire
Tab 1.1 Production Pêches et Nectarines (Tonnes)
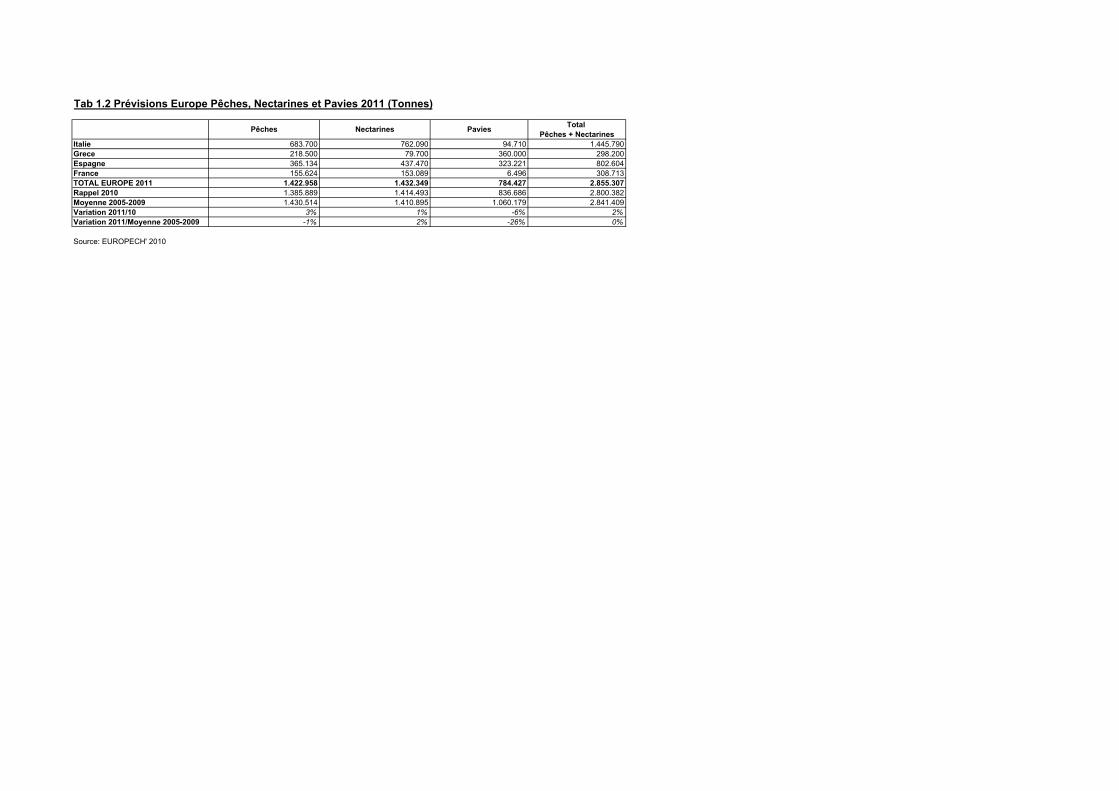
Tab 1.2 Prévisions Europe Pêches, Nectarines et Pavies 2011 (Tonnes)
Total Pêches + Nectarines
Italie 683.700 762.090 94.710 1.445.790Grece 218.500 79.700 360.000 298.200Espagne 365.134 437.470 323.221 802.604France 155.624 153.089 6.496 308.713TOTAL EUROPE 2011 1.422.958 1.432.349 784.427 2.855.307Rappel 2010 1.385.889 1.414.493 836.686 2.800.382Moyenne 2005-2009 1.430.514 1.410.895 1.060.179 2.841.409Variation 2011/10 3% 1% -6% 2%Variation 2011/Moyenne 2005-2009 -1% 2% -26% 0%
Source: EUROPECH' 2010
Pêches Nectarines Pavies
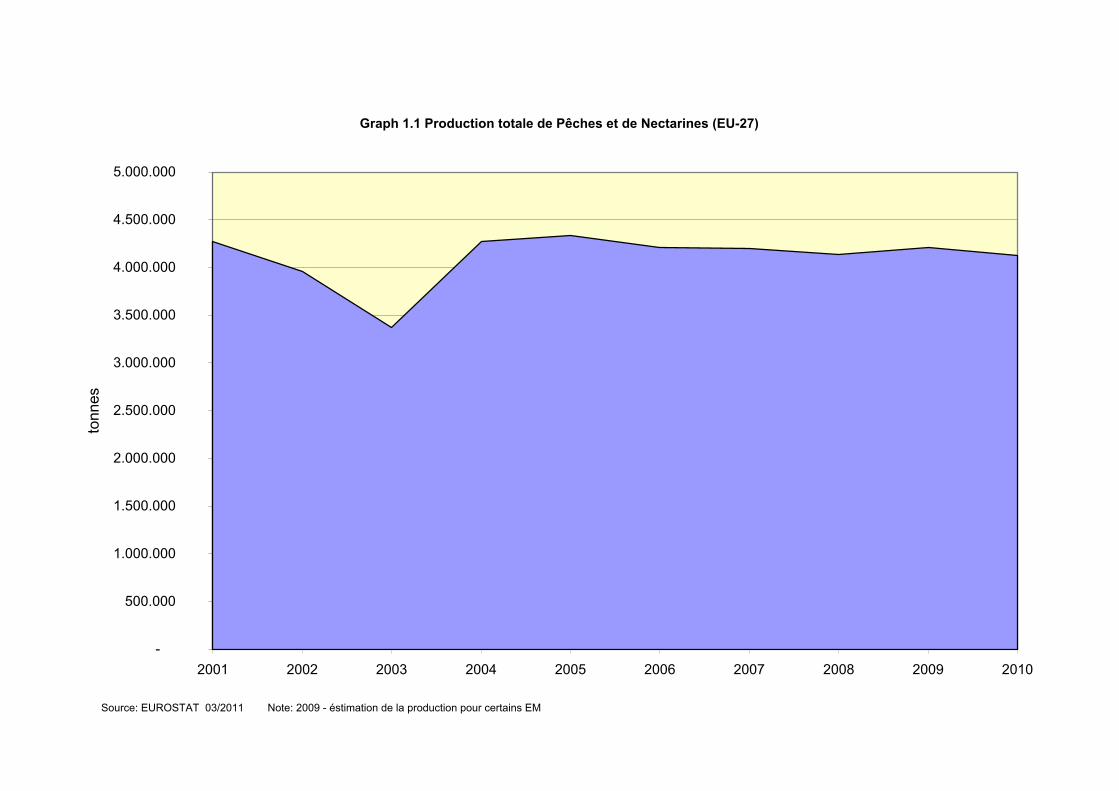
Graph 1.1 Production totale de Pêches et de Nectarines (EU-27)
-
500.000
1.000.000
1.500.000
2.000.000
2.500.000
3.000.000
3.500.000
4.000.000
4.500.000
5.000.000
2001 2002 2003 2004 2005 2006 2007 2008 2009 2010
tonn
es
Source: EUROSTAT 03/2011 Note: 2009 - éstimation de la production pour certains EM
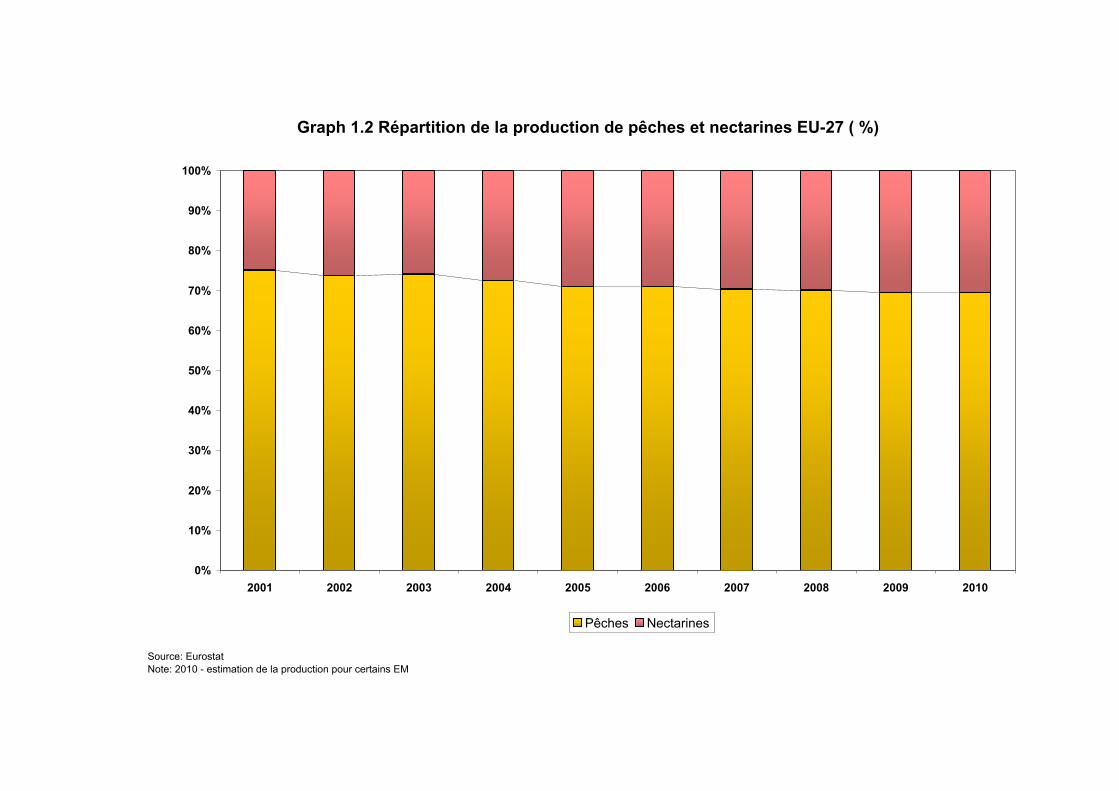
Graph 1.2 Répartition de la production de pêches et nectarines EU-27 ( %)
0%
10%
20%
30%
40%
50%
60%
70%
80%
90%
100%
2001 2002 2003 2004 2005 2006 2007 2008 2009 2010
Pêches Nectarines
Source: EurostatNote: 2010 - estimation de la production pour certains EM
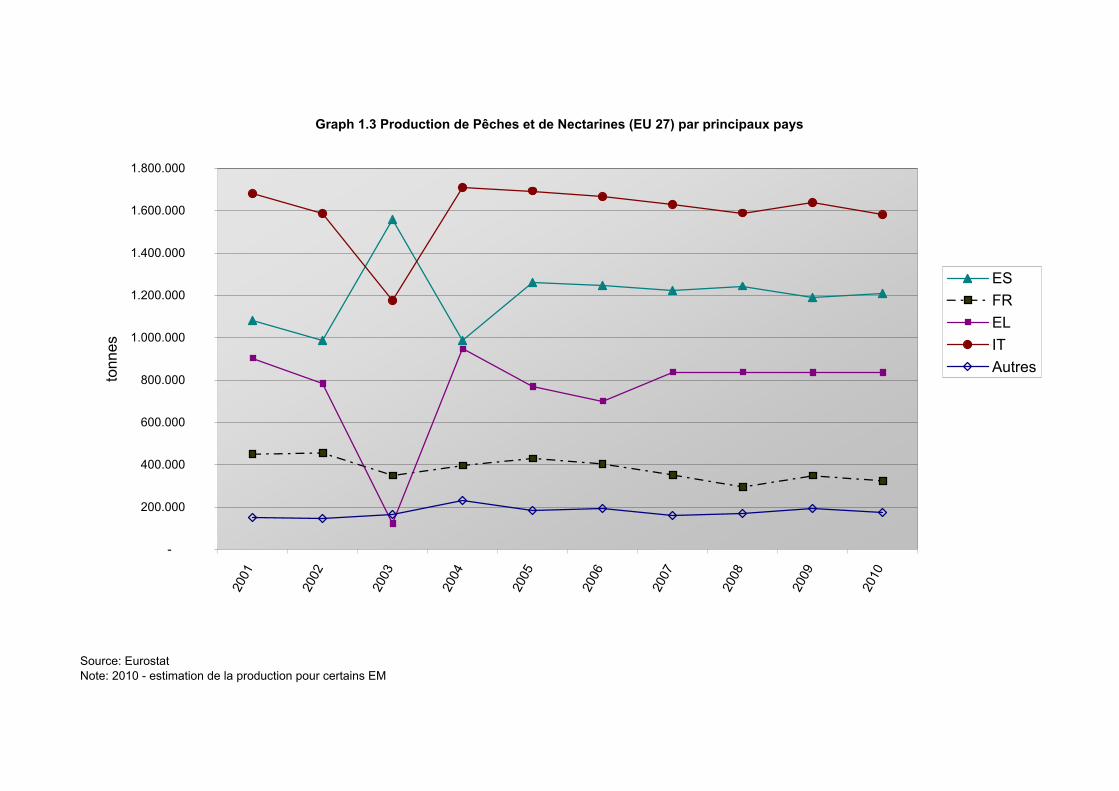
Graph 1.3 Production de Pêches et de Nectarines (EU 27) par principaux pays
-
200.000
400.000
600.000
800.000
1.000.000
1.200.000
1.400.000
1.600.000
1.800.000
2001
2002
2003
2004
2005
2006
2007
2008
2009
2010
tonn
es
ESFRELITAutres
Source: EurostatNote: 2010 - estimation de la production pour certains EM

1. Abricots
2001 2002 2003 2004 2005 2006 2007 2008 2009 2010 Ø01-09 10/09 09/Ø01-09ITALIE 187.700 200.100 108.300 213.400 232.900 222.000 214.600 205.500 233.600 252.894 (°°) 202.011 8,3% 15,6%FRANCE 103.000 169.500 123.900 166.100 181.600 180.200 126.400 94.500 190.382 (°°) 139.569 (°°) 148.398 -27% 28%ESPAGNE 134.800 44.600 143.800 121.500 137.200 156.900 89.000 103.400 (p) 97.100 (p) 75.000 (p) 114.256 -23% -15%GRECE 65.300 54.200 41.500 78.500 59.500 59.700 87.200 77.400 77.000 (°) 77.000 (°) 66.700 0% 15%ROUMANIE 28.300 18.300 42.600 20.600 43.100 36.800 26.900 31.000 31.300 31.500 30.989 1% 1%HONGRIE 15.500 7.000 30.800 35.200 25.700 40.300 21.700 26.800 33.500 33.500 (p) 26.278 0% 27%AUTRICHE 11.200 6.100 17.400 15.700 13.100 25.200 14.600 15.300 24.400 6.200 15.889 -75% 54%BULGARIE 8.400 4.200 18.500 18.500 10.600 13.300 8.300 13.000 7.600 7.600 (°) 11.378 0% -33%REP.TCHEQUE 3.700 1.400 5.000 6.500 2.400 3.000 5.400 2.700 2.700 1.300 3.644 -52% -26%POLOGNE 4.200 4.800 4.900 3.200 2.400 1.100 4.100 5.300 3.400 3.750 -36% 41%PORTUGAL 2.600 4.500 4.500 4.800 4.700 5.000 5.000 5.000 5.000 5.000 4.567 0% 9%CHYPRE 1.900 2.000 800 1.200 1.700 1.800 1.900 1.000 1.800 (p) 1.900 (p) 1.567 6% 15%SLOVENIE 300 700 300 800 400 700 500 300 500 500 (°) 500 0% 0%ALLEMAGNE 100 200 200 500 200 240 SLOVAQUIE 300 100 300 200 100 400 100 400 600 300 278 -50% 116%MALTE 100 100 TOTAL UE-27 563.100 517.100 542.700 688.400 716.400 747.700 602.700 580.500 710.782 635.663 (°) 629.931 -11% 13%TOTAL UE-15 504.700 479.200 439.600 600.500 629.200 649.000 536.800 501.100 627.482 555.663 (°) 551.954 -11% 14%Code produit: c2190
2. Cerises
2001 2002 2003 2004 2005 2006 2007 2008 2009 2010 Ø01-09 10/09 09/Ø01-09POLOGNE 224.400 213.900 235.200 250.200 177.400 233.300 127.800 242.500 239.700 (p) 178.100 216.044 -25,7% 10,9%ITALIE 118.900 134.800 109.100 95.200 101.300 110.900 106.200 134.400 125.900 120.362 (°°) 115.189 -4,4% 9,3%HONGRIE 72.400 44.700 55.800 89.800 54.200 68.700 49.100 75.900 86.900 51.200 (p) 66.389 -41,1% 30,9%ALLEMAGNE 68.900 49.800 67.100 74.500 52.500 68.800 63.200 40.100 69.700 49.100 61.622 -29,6% 13,1%ESPAGNE 90.100 117.800 108.000 83.500 95.700 91.700 75.700 62.900 (p) 90.000 (p) 80.300 (p) 90.600 -10,8% -0,7%ROUMANIE 91.200 66.300 98.500 51.000 104.700 101.800 64.800 66.500 66.400 77.000 79.022 16,0% -16,0%FRANCE 58.700 68.700 55.000 61.700 69.000 67.300 45.800 39.600 53.575 (°°) 45.905 (°°) 57.708 -14,3% -7,2%GRECE 28.300 46.500 29.500 36.500 34.500 30.900 52.000 44.800 44.000 (°) 44.800 (°) 38.556 1,8% 14,1%AUTRICHE 37.700 25.400 34.500 32.200 30.200 32.100 39.700 31.600 35.400 11.000 33.200 -68,9% 6,6%BULGARIE 34.300 23.200 20.400 24.700 21.400 24.200 21.100 19.400 21.400 20.000 (°) 23.344 -6,5% -8,3%PORTUGAL 12.000 20.000 14.200 16.200 15.600 15.600 9.400 10.600 11.100 7.400 13.856 -33,3% -19,9%REP.TCHEQUE 21.800 10.500 10.700 14.100 9.900 11.100 11.400 10.800 10.800 6.600 12.344 -38,9% -12,5%BELGIQUE 3.000 6.800 6.500 6.400 6.800 7.200 7.200 2.600 5.200 5.000 (°) 5.744 -3,8% -9,5%DANEMARK 3.300 3.000 7.100 13.800 9.000 14.200 1.200 (p) 8.400 SLOVENIE 3.000 4.100 3.800 4.600 3.500 4.200 4.000 3.000 4.400 4.000 (°) 3.844 -9,1% 14,5%ROYAUME UNI 1.400 1.300 1.000 1.000 1.000 1.100 1.200 1.143 LETTONIE 1.700 1.900 900 1.000 1.900 1.600 900 300 100 100 1.144 0,0% -91,3%LITUANIE 700 900 900 3.600 800 900 1.000 200 1.257 -80,0% -20,5%SLOVAQUIE 700 400 600 500 400 500 500 800 600 900 556 50,0% 8,0%CHYPRE 1.100 600 700 600 600 600 600 500 600 600 656 0,0% -8,5%LUXEMBOURG 100 300 200 300 200 200 200 - - - 150 PAYS-BAS 9.000 (p)ESTONIE 100 100 SUEDE 900 600 100 533 TOTAL UE-27 874.000 840.600 859.500 858.700 790.800 889.600 681.600 787.200 866.775 712.767 (°) 827.642 -17,8% 4,7%TOTAL UE-15 423.300 475.000 432.200 421.300 415.900 440.000 400.600 366.600 434.875 374.067 (°) 423.308 -14,0% 2,7%Code produit: c2200Source : EUROSTAT (CRONOS) - extraction 12/04/2011(°) C.2 estimation (°°) Statistiques nationales
(p) provisoire
Tab 1.3. Production d'autres fruits à noyaux et kiwis

3. Prunes
2001 2002 2003 2004 2005 2006 2007 2008 2009 2010 Ø01-09 10/09 09/Ø01-09ROUMANIE 557.200 220.600 909.600 475.800 572.900 576.000 370.600 472.200 529.400 653.700 520.478 23,5% 1,7%FRANCE 271.700 246.400 250.200 229.500 214.300 234.500 250.900 146.900 238.491 (°°) 280.415 (°°) 231.432 17,6% 3,0%ITALIE 171.500 177.100 127.600 179.300 185.400 180.500 185.200 184.100 194.100 207.498 (°°) 176.089 6,9% 10,2%ESPAGNE 149.700 168.500 230.300 145.600 251.800 178.700 201.400 184.600 (p) 200.100 (p) 191.500 (p) 190.078 -4,3% 5,3%POLOGNE 131.900 102.900 109.600 132.600 91.400 93.600 53.500 113.600 120.700 90.600 105.533 -24,9% 14,4%ALLEMAGNE 40.900 45.800 52.000 83.800 44.700 57.000 71.300 35.700 82.500 53.200 57.078 -35,5% 44,5%AUTRICHE 75.300 43.300 69.500 69.600 61.600 80.300 68.400 63.400 71.700 33.200 67.011 -53,7% 7,0%HONGRIE 89.800 49.300 45.400 67.000 36.000 64.600 30.800 56.000 51.500 58.100 (p) 54.489 12,8% -5,5%BULGARIE 73.200 48.900 46.400 49.200 18.000 21.000 23.000 14.300 17.200 17.000 (°) 34.578 -1,2% -50,3%PORTUGAL 11.500 16.400 16.800 16.400 16.200 19.700 19.800 21.900 21.000 21.000 17.744 0,0% 18,3%ROYAUME UNI 14.800 12.600 15.100 13.600 15.000 14.100 13.800 13.500 (°) 13.500 (°) 13.500 (°) 13.950 0,0% -3,2%SLOVENIE 6.000 5.400 7.700 10.000 4.300 5.400 6.300 4.200 4.100 4.000 (°) 5.740 -2,4% -28,6%REP.TCHEQUE 23.100 3.200 3.600 6.800 4.500 5.200 5.900 6.300 6.300 4.500 7.211 -28,6% -12,6%GRECE 3.100 2.900 2.900 3.000 3.000 3.500 2.100 2.100 2.000 (°) 2.000 (°) 2.733 0,0% -26,8%SLOVAQUIE 2.700 1.600 2.000 2.300 1.300 2.600 2.200 2.200 2.900 2.300 2.200 -20,7% 31,8%LITUANIE 1.400 1.400 1.600 3.900 600 1.100 1.900 800 1.700 -57,9% 11,8%CHYPRE 1.100 1.100 600 700 800 800 900 800 900 (p) 700 (p) 856 -22,2% 5,2%LETTONIE 2.400 2.900 1.000 1.100 2.400 1.500 300 200 100 - 1.190 -91,6%LUXEMBOURG 300 900 500 900 500 600 600 200 200 100 522 -50,0% -61,7%DANEMARK 300 300 300 300 300 (p) 300 BELGIQUE 300 600 600 300 400 400 500 100 300 389 -22,9%MALTE 100 100 100 300 400 100 300 200 50,0%ESTONIE 100 100 19 100 0 (p) 80 SUEDE 400 500 300 300 375 TOTAL UE-27 1.627.100 1.151.100 1.893.219 1.489.300 1.527.000 1.544.600 1.308.100 1.323.800 1.559.191 1.634.413 1.491.490 4,8% 4,5%TOTAL UE-15 739.500 715.000 765.800 742.300 793.500 769.600 814.000 652.800 823.891 802.713 (°) 757.377 -2,6% 8,8%Code produit: c2210
4. Kiwis
2001 2002 2003 2004 2005 2006 2007 2008 2009 2010 Ø01-09 10/09 09/Ø01-09ITALIE 329.300 379.400 322.800 429.200 415.100 434.700 417.100 452.900 436.300 428.956 (°°) 404.576 -1,7% 7,8%FRANCE 79.200 77.400 73.400 77.800 76.800 76.400 61.300 65.700 73.500 GRECE 60.500 59.500 58.500 74.700 70.100 87.200 70.100 84.300 70.613 PORTUGAL 7.600 11.200 10.500 10.900 11.300 12.500 12.300 11.000 12.800 10.200 11.122 -20,3% 15,1%ESPAGNE 8.900 14.700 12.700 10.900 11.600 18.500 14.000 17.800 18.800 (p) 23.900 (p) 14.211 27,1% 32,3%CHYPRE 400 400 100 100 200 200 200 200 200 (p) 200 (p) 222 0,0% -10,0%SLOVENIE 100 200 200 100 200 200 300 186 61,5%BULGARIE 400 400 100 100 250 -60,0%HONGRIE 100 100 TOTAL UE-27 485.900 542.700 478.100 603.800 585.700 630.000 575.300 632.100 468.500 555.789 -15,7%TOTAL UE-15 485.500 542.200 477.900 603.500 584.900 629.300 574.800 631.700 467.900 555.300 -15,7%Code produit:c2285
Source : EUROSTAT (CRONOS) - extraction 12/04/2011(°) C.2 estimation (°°) Statistiques nationales
(p) provisoire
09/0813,7%101%-6%-1%1%
25%59%-42%0%
29%0%
80%67%
50%
22%25%
09/08-1,2%-6,3%14,5%73,8%43,1%-0,2%35,3%-1,8%12,0%10,3%4,7%0,0%
100,0%
46,7%
-66,7%11,1%-25,0%20,0%
10,1%18,6%

09/0812,1%62,3%5,4%8,4%6,3%
131,1%13,1%-8,0%20,3%-4,1%0,0%-2,4%0,0%-4,8%31,8%72,7%12,5%-50,0%0,0%
200,0%200,0%
17,8%26,2%
09/08-3,7%
16,4%5,6%0,0%
50,0%
-25,9%-25,9%

Tab 1.4 Prévisions Europe Abricots 2011 (Tonnes)
Italie 188.980Grece 42.500Espagne 51.413France 133.829TOTAL EUROPE 2011 416.722Rappel 2010 517.772Moyenne 2005-2009 528.918Variation 2011/10 -20%Variation 2011/Moyenne 2005-2009 -21%
Source: EUROPECH' 2011
Abricots
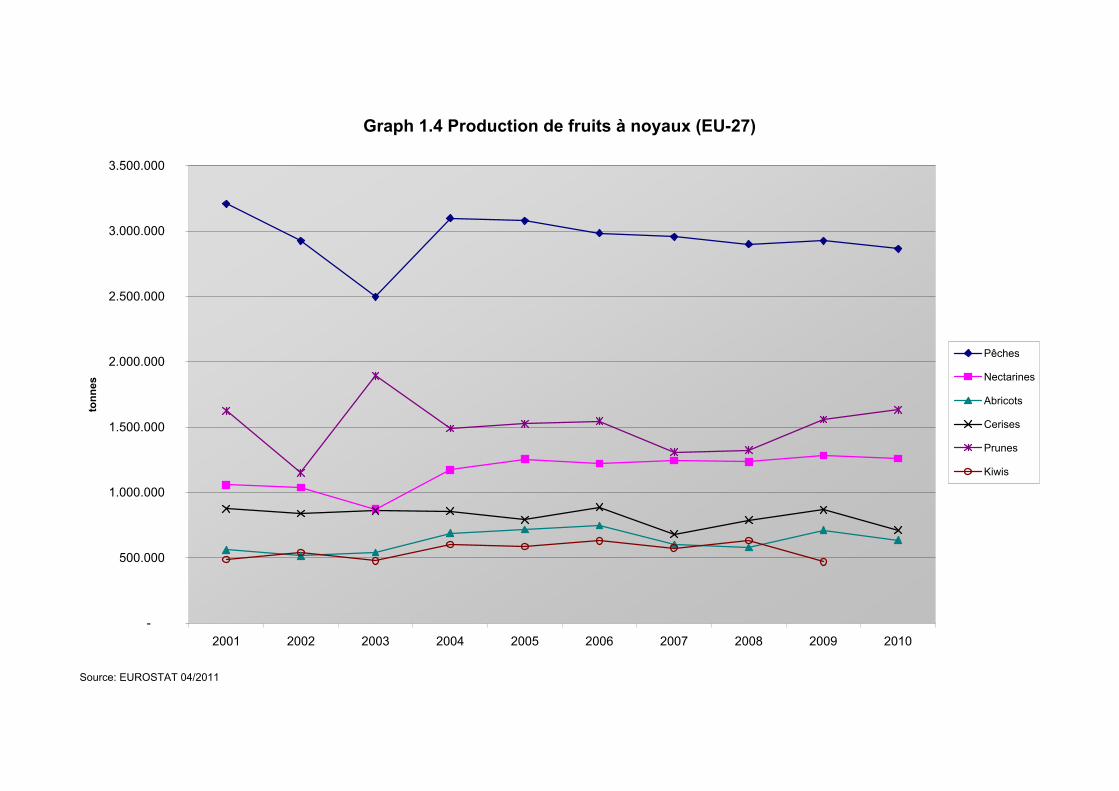
Graph 1.4 Production de fruits à noyaux (EU-27)
-
500.000
1.000.000
1.500.000
2.000.000
2.500.000
3.000.000
3.500.000
2001 2002 2003 2004 2005 2006 2007 2008 2009 2010
tonn
es
Pêches
Nectarines
Abricots
Cerises
Prunes
Kiwis
Source: EUROSTAT 04/2011
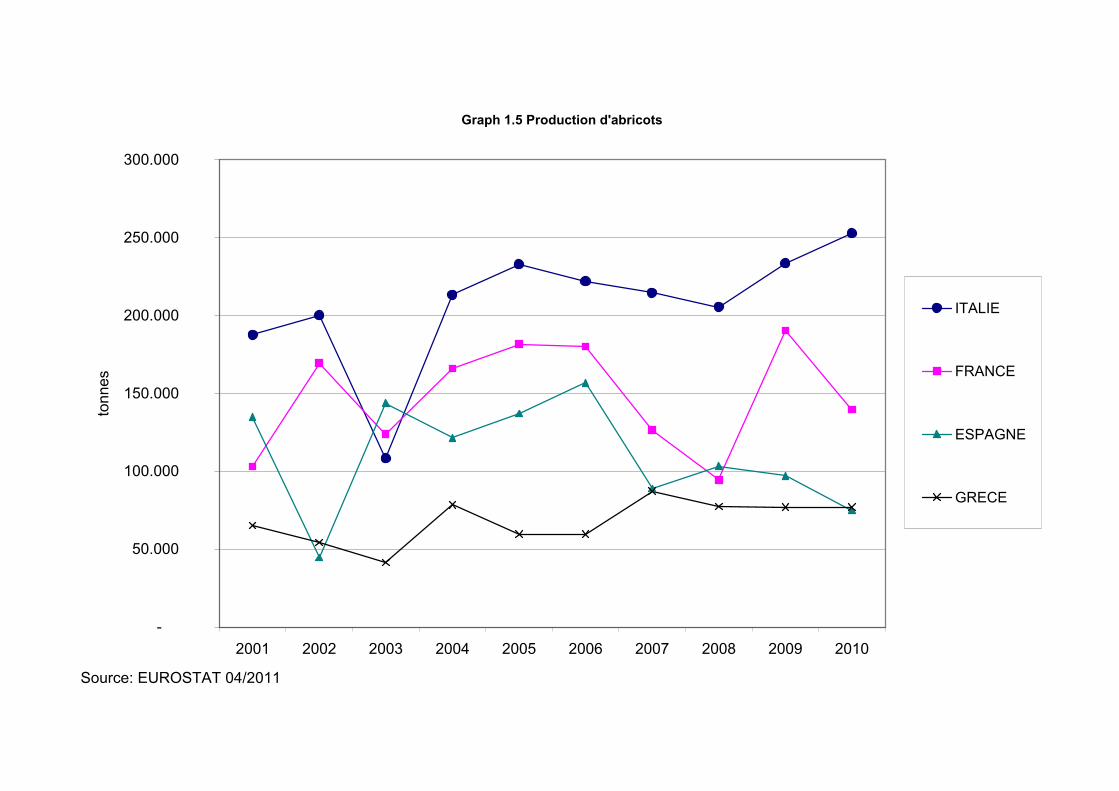
Graph 1.5 Production d'abricots
-
50.000
100.000
150.000
200.000
250.000
300.000
2001 2002 2003 2004 2005 2006 2007 2008 2009 2010
tonn
es
ITALIE
FRANCE
ESPAGNE
GRECE
Source: EUROSTAT 04/2011
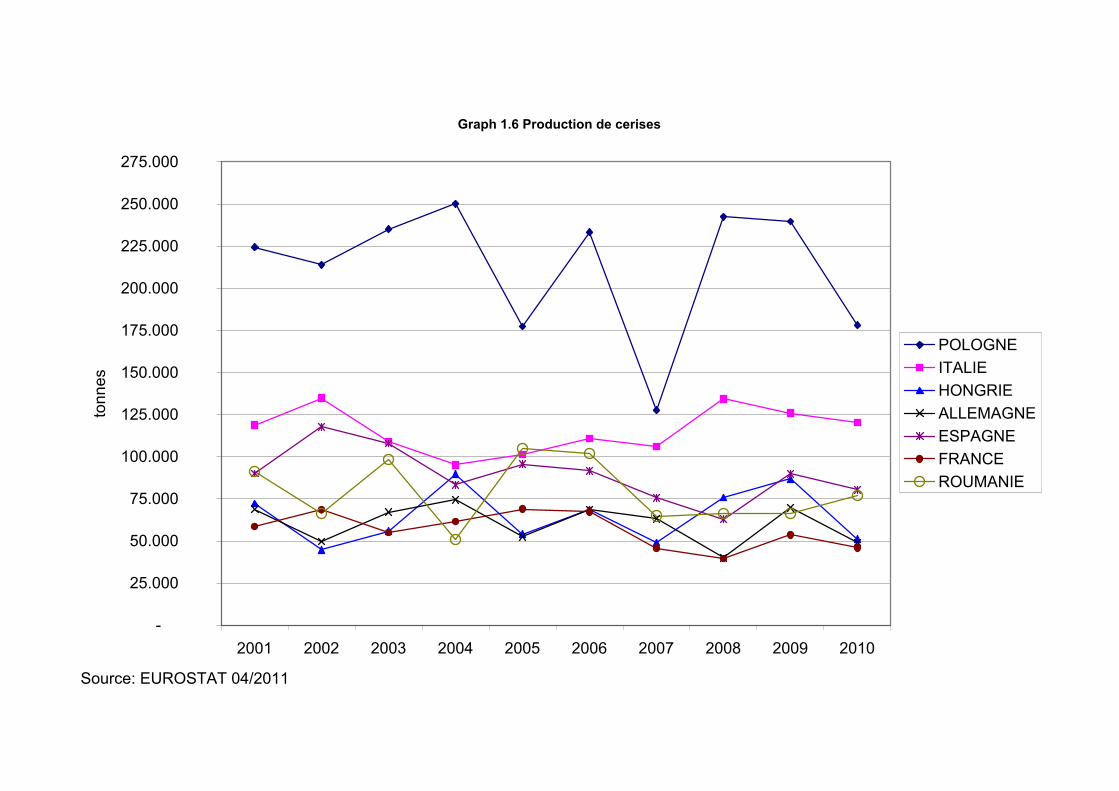
Graph 1.6 Production de cerises
-
25.000
50.000
75.000
100.000
125.000
150.000
175.000
200.000
225.000
250.000
275.000
2001 2002 2003 2004 2005 2006 2007 2008 2009 2010
tonn
es
POLOGNEITALIEHONGRIEALLEMAGNEESPAGNEFRANCEROUMANIE
Source: EUROSTAT 04/2011
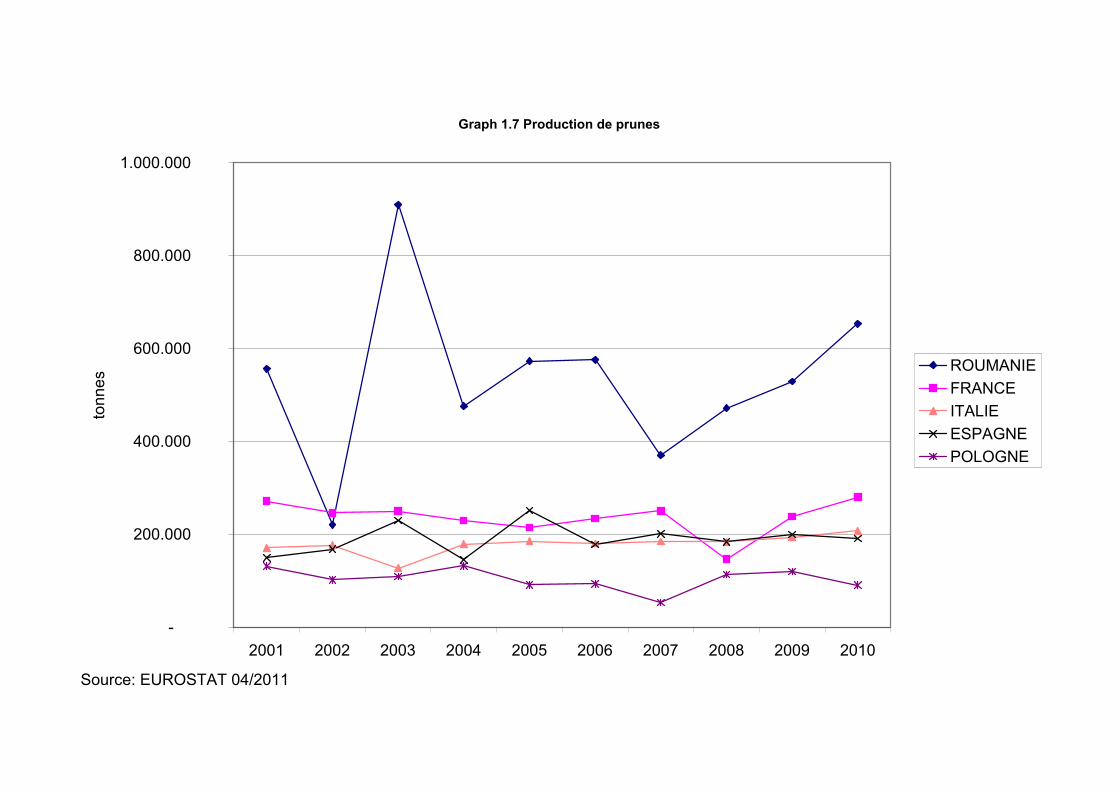
Graph 1.7 Production de prunes
-
200.000
400.000
600.000
800.000
1.000.000
2001 2002 2003 2004 2005 2006 2007 2008 2009 2010
tonn
es
ROUMANIEFRANCEITALIEESPAGNEPOLOGNE
Source: EUROSTAT 04/2011

Graph 1.8 Production de kiwis
-
100.000
200.000
300.000
400.000
500.000
2001 2002 2003 2004 2005 2006 2007 2008 2009 2010
tonn
es ITALIEFRANCEGRECE
Source: EUROSTAT 04/2011
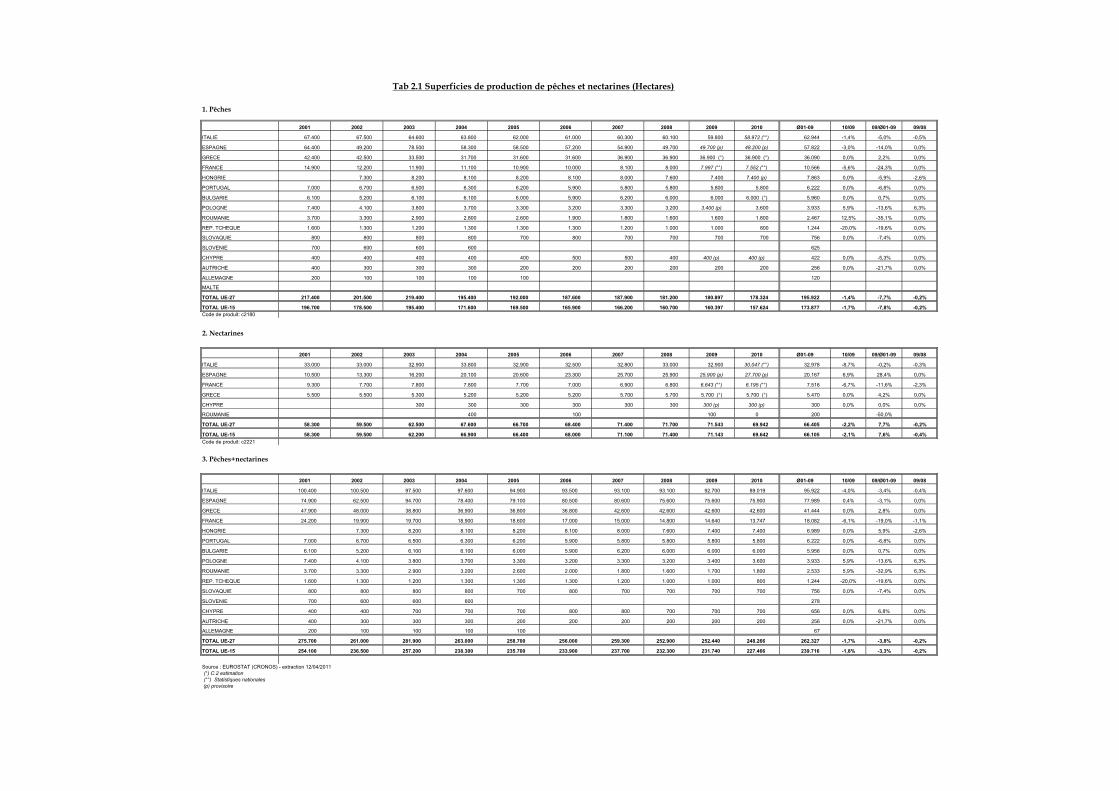
1. Pêches
2001 2002 2003 2004 2005 2006 2007 2008 2009 2010 Ø01-09 10/09 09/Ø01-09 09/08
ITALIE 67.400 67.500 64.600 63.800 62.000 61.000 60.300 60.100 59.800 58.972 (°°) 62.944 -1,4% -5,0% -0,5%
ESPAGNE 64.400 49.200 78.500 58.300 58.500 57.200 54.900 49.700 49.700 (p) 48.200 (p) 57.822 -3,0% -14,0% 0,0%
GRECE 42.400 42.500 33.500 31.700 31.600 31.600 36.900 36.900 36.900 (°) 36.900 (°) 36.090 0,0% 2,2% 0,0%
FRANCE 14.900 12.200 11.900 11.100 10.900 10.000 8.100 8.000 7.997 (°°) 7.552 (°°) 10.566 -5,6% -24,3% 0,0%
HONGRIE 7.300 8.200 8.100 8.200 8.100 8.000 7.600 7.400 7.400 (p) 7.863 0,0% -5,9% -2,6%
PORTUGAL 7.000 6.700 6.500 6.300 6.200 5.900 5.800 5.800 5.800 5.800 6.222 0,0% -6,8% 0,0%
BULGARIE 6.100 5.200 6.100 6.100 6.000 5.900 6.200 6.000 6.000 6.000 (°) 5.960 0,0% 0,7% 0,0%
POLOGNE 7.400 4.100 3.800 3.700 3.300 3.200 3.300 3.200 3.400 (p) 3.600 3.933 5,9% -13,6% 6,3%
ROUMANIE 3.700 3.300 2.900 2.800 2.600 1.900 1.800 1.600 1.600 1.800 2.467 12,5% -35,1% 0,0%
REP. TCHEQUE 1.600 1.300 1.200 1.300 1.300 1.300 1.200 1.000 1.000 800 1.244 -20,0% -19,6% 0,0%
SLOVAQUIE 800 800 800 800 700 800 700 700 700 700 756 0,0% -7,4% 0,0%
SLOVENIE 700 600 600 600 625
CHYPRE 400 400 400 400 400 500 500 400 400 (p) 400 (p) 422 0,0% -5,3% 0,0%
AUTRICHE 400 300 300 300 200 200 200 200 200 200 256 0,0% -21,7% 0,0%
ALLEMAGNE 200 100 100 100 100 120
MALTE
TOTAL UE-27 217.400 201.500 219.400 195.400 192.000 187.600 187.900 181.200 180.897 178.324 195.922 -1,4% -7,7% -0,2%
TOTAL UE-15 196.700 178.500 195.400 171.600 169.500 165.900 166.200 160.700 160.397 157.624 173.877 -1,7% -7,8% -0,2%Code de produit: c2180
2. Nectarines
2001 2002 2003 2004 2005 2006 2007 2008 2009 2010 Ø01-09 10/09 09/Ø01-09 09/08
ITALIE 33.000 33.000 32.900 33.800 32.900 32.500 32.800 33.000 32.900 30.047 (°°) 32.978 -8,7% -0,2% -0,3%
ESPAGNE 10.500 13.300 16.200 20.100 20.600 23.300 25.700 25.900 25.900 (p) 27.700 (p) 20.167 6,9% 28,4% 0,0%
FRANCE 9.300 7.700 7.800 7.800 7.700 7.000 6.900 6.800 6.643 (°°) 6.195 (°°) 7.516 -6,7% -11,6% -2,3%
GRECE 5.500 5.500 5.300 5.200 5.200 5.200 5.700 5.700 5.700 (°) 5.700 (°) 5.470 0,0% 4,2% 0,0%
CHYPRE 300 300 300 300 300 300 300 (p) 300 (p) 300 0,0% 0,0% 0,0%
ROUMANIE 400 100 100 0 200 -50,0%
TOTAL UE-27 58.300 59.500 62.500 67.600 66.700 68.400 71.400 71.700 71.543 69.942 66.405 -2,2% 7,7% -0,2%
TOTAL UE-15 58.300 59.500 62.200 66.900 66.400 68.000 71.100 71.400 71.143 69.642 66.105 -2,1% 7,6% -0,4%Code de produit: c2221
3. Pêches+nectarines
2001 2002 2003 2004 2005 2006 2007 2008 2009 2010 Ø01-09 10/09 09/Ø01-09 09/08
ITALIE 100.400 100.500 97.500 97.600 94.900 93.500 93.100 93.100 92.700 89.019 95.922 -4,0% -3,4% -0,4%
ESPAGNE 74.900 62.500 94.700 78.400 79.100 80.500 80.600 75.600 75.600 75.900 77.989 0,4% -3,1% 0,0%
GRECE 47.900 48.000 38.800 36.900 36.800 36.800 42.600 42.600 42.600 42.600 41.444 0,0% 2,8% 0,0%
FRANCE 24.200 19.900 19.700 18.900 18.600 17.000 15.000 14.800 14.640 13.747 18.082 -6,1% -19,0% -1,1%
HONGRIE 7.300 8.200 8.100 8.200 8.100 8.000 7.600 7.400 7.400 6.989 0,0% 5,9% -2,6%
PORTUGAL 7.000 6.700 6.500 6.300 6.200 5.900 5.800 5.800 5.800 5.800 6.222 0,0% -6,8% 0,0%
BULGARIE 6.100 5.200 6.100 6.100 6.000 5.900 6.200 6.000 6.000 6.000 5.956 0,0% 0,7% 0,0%
POLOGNE 7.400 4.100 3.800 3.700 3.300 3.200 3.300 3.200 3.400 3.600 3.933 5,9% -13,6% 6,3%
ROUMANIE 3.700 3.300 2.900 3.200 2.600 2.000 1.800 1.600 1.700 1.800 2.533 5,9% -32,9% 6,3%
REP. TCHEQUE 1.600 1.300 1.200 1.300 1.300 1.300 1.200 1.000 1.000 800 1.244 -20,0% -19,6% 0,0%
SLOVAQUIE 800 800 800 800 700 800 700 700 700 700 756 0,0% -7,4% 0,0%
SLOVENIE 700 600 600 600 278
CHYPRE 400 400 700 700 700 800 800 700 700 700 656 0,0% 6,8% 0,0%
AUTRICHE 400 300 300 300 200 200 200 200 200 200 256 0,0% -21,7% 0,0%
ALLEMAGNE 200 100 100 100 100 67
TOTAL UE-27 275.700 261.000 281.900 263.000 258.700 256.000 259.300 252.900 252.440 248.266 262.327 -1,7% -3,8% -0,2%
TOTAL UE-15 254.100 236.500 257.200 238.300 235.700 233.900 237.700 232.300 231.740 227.466 239.716 -1,8% -3,3% -0,2%
Source : EUROSTAT (CRONOS) - extraction 12/04/2011(°) C.2 estimation (°°) Statistiques nationales
(p) provisoire
Tab 2.1 Superficies de production de pêches et nectarines (Hectares)
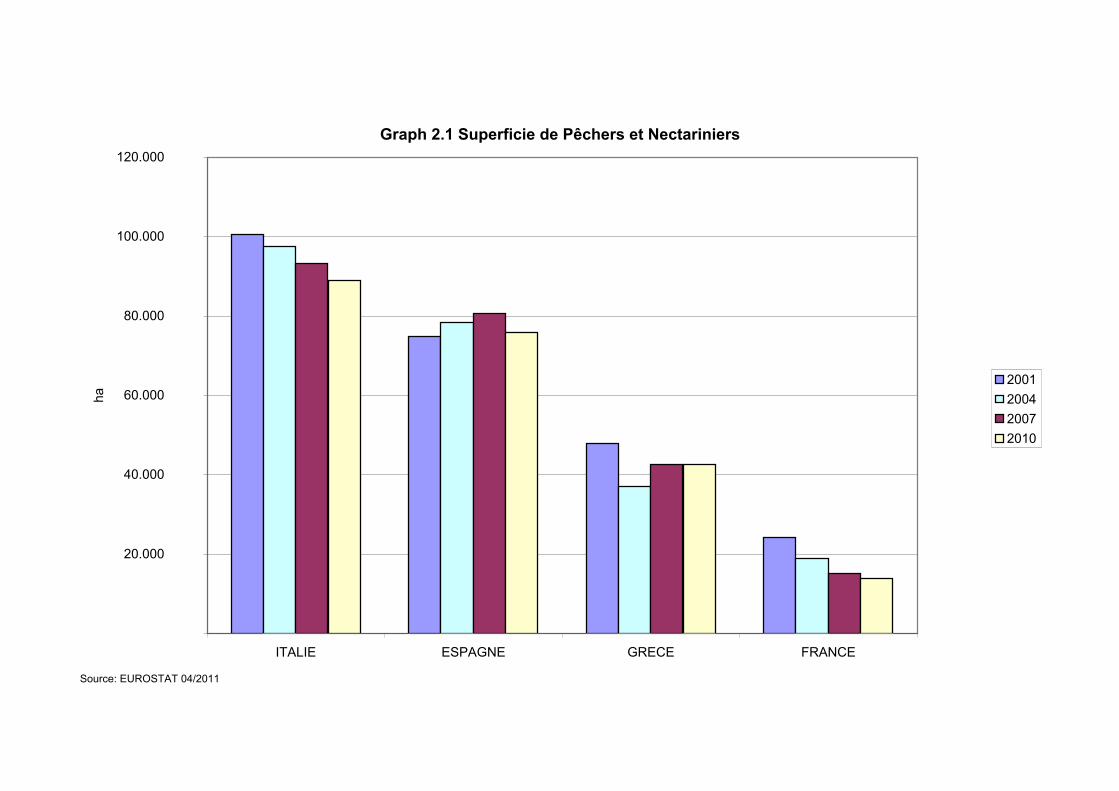
Graph 2.1 Superficie de Pêchers et Nectariniers
20.000
40.000
60.000
80.000
100.000
120.000
ITALIE ESPAGNE GRECE FRANCE
ha
2001200420072010
Source: EUROSTAT 04/2011
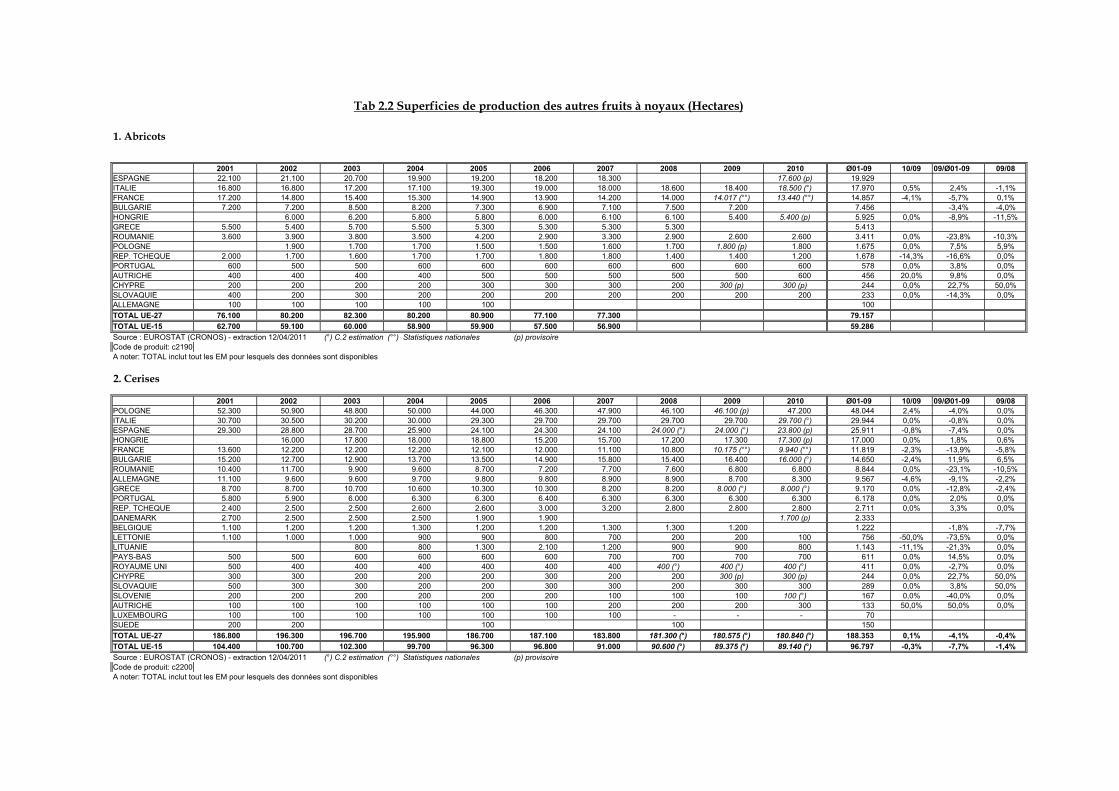
1. Abricots
2001 2002 2003 2004 2005 2006 2007 2008 2009 2010 Ø01-09 10/09 09/Ø01-09 09/08ESPAGNE 22.100 21.100 20.700 19.900 19.200 18.200 18.300 17.600 (p) 19.929 ITALIE 16.800 16.800 17.200 17.100 19.300 19.000 18.000 18.600 18.400 18.500 (°) 17.970 0,5% 2,4% -1,1%FRANCE 17.200 14.800 15.400 15.300 14.900 13.900 14.200 14.000 14.017 (°°) 13.440 (°°) 14.857 -4,1% -5,7% 0,1%BULGARIE 7.200 7.200 8.500 8.200 7.300 6.900 7.100 7.500 7.200 7.456 -3,4% -4,0%HONGRIE 6.000 6.200 5.800 5.800 6.000 6.100 6.100 5.400 5.400 (p) 5.925 0,0% -8,9% -11,5%GRECE 5.500 5.400 5.700 5.500 5.300 5.300 5.300 5.300 5.413 ROUMANIE 3.600 3.900 3.800 3.500 4.200 2.900 3.300 2.900 2.600 2.600 3.411 0,0% -23,8% -10,3%POLOGNE 1.900 1.700 1.700 1.500 1.500 1.600 1.700 1.800 (p) 1.800 1.675 0,0% 7,5% 5,9%REP. TCHEQUE 2.000 1.700 1.600 1.700 1.700 1.800 1.800 1.400 1.400 1.200 1.678 -14,3% -16,6% 0,0%PORTUGAL 600 500 500 600 600 600 600 600 600 600 578 0,0% 3,8% 0,0%AUTRICHE 400 400 400 400 500 500 500 500 500 600 456 20,0% 9,8% 0,0%CHYPRE 200 200 200 200 300 300 300 200 300 (p) 300 (p) 244 0,0% 22,7% 50,0%SLOVAQUIE 400 200 300 200 200 200 200 200 200 200 233 0,0% -14,3% 0,0%ALLEMAGNE 100 100 100 100 100 100 TOTAL UE-27 76.100 80.200 82.300 80.200 80.900 77.100 77.300 79.157 TOTAL UE-15 62.700 59.100 60.000 58.900 59.900 57.500 56.900 59.286 Source : EUROSTAT (CRONOS) - extraction 12/04/2011 (°) C.2 estimation (°°) Statistiques nationales (p) provisoireCode de produit: c2190A noter: TOTAL inclut tout les EM pour lesquels des données sont disponibles
2. Cerises
2001 2002 2003 2004 2005 2006 2007 2008 2009 2010 Ø01-09 10/09 09/Ø01-09 09/08POLOGNE 52.300 50.900 48.800 50.000 44.000 46.300 47.900 46.100 46.100 (p) 47.200 48.044 2,4% -4,0% 0,0%ITALIE 30.700 30.500 30.200 30.000 29.300 29.700 29.700 29.700 29.700 29.700 (°) 29.944 0,0% -0,8% 0,0%ESPAGNE 29.300 28.800 28.700 25.900 24.100 24.300 24.100 24.000 (°) 24.000 (°) 23.800 (p) 25.911 -0,8% -7,4% 0,0%HONGRIE 16.000 17.800 18.000 18.800 15.200 15.700 17.200 17.300 17.300 (p) 17.000 0,0% 1,8% 0,6%FRANCE 13.600 12.200 12.200 12.200 12.100 12.000 11.100 10.800 10.175 (°°) 9.940 (°°) 11.819 -2,3% -13,9% -5,8%BULGARIE 15.200 12.700 12.900 13.700 13.500 14.900 15.800 15.400 16.400 16.000 (°) 14.650 -2,4% 11,9% 6,5%ROUMANIE 10.400 11.700 9.900 9.600 8.700 7.200 7.700 7.600 6.800 6.800 8.844 0,0% -23,1% -10,5%ALLEMAGNE 11.100 9.600 9.600 9.700 9.800 9.800 8.900 8.900 8.700 8.300 9.567 -4,6% -9,1% -2,2%GRECE 8.700 8.700 10.700 10.600 10.300 10.300 8.200 8.200 8.000 (°) 8.000 (°) 9.170 0,0% -12,8% -2,4%PORTUGAL 5.800 5.900 6.000 6.300 6.300 6.400 6.300 6.300 6.300 6.300 6.178 0,0% 2,0% 0,0%REP. TCHEQUE 2.400 2.500 2.500 2.600 2.600 3.000 3.200 2.800 2.800 2.800 2.711 0,0% 3,3% 0,0%DANEMARK 2.700 2.500 2.500 2.500 1.900 1.900 1.700 (p) 2.333 BELGIQUE 1.100 1.200 1.200 1.300 1.200 1.200 1.300 1.300 1.200 1.222 -1,8% -7,7%LETTONIE 1.100 1.000 1.000 900 900 800 700 200 200 100 756 -50,0% -73,5% 0,0%LITUANIE 800 800 1.300 2.100 1.200 900 900 800 1.143 -11,1% -21,3% 0,0%PAYS-BAS 500 500 600 600 600 600 700 700 700 700 611 0,0% 14,5% 0,0%ROYAUME UNI 500 400 400 400 400 400 400 400 (°) 400 (°) 400 (°) 411 0,0% -2,7% 0,0%CHYPRE 300 300 200 200 200 300 200 200 300 (p) 300 (p) 244 0,0% 22,7% 50,0%SLOVAQUIE 500 300 300 200 200 300 300 200 300 300 289 0,0% 3,8% 50,0%SLOVENIE 200 200 200 200 200 200 100 100 100 100 (°) 167 0,0% -40,0% 0,0%AUTRICHE 100 100 100 100 100 100 200 200 200 300 133 50,0% 50,0% 0,0%LUXEMBOURG 100 100 100 100 100 100 100 - - - 70 SUEDE 200 200 100 100 150 TOTAL UE-27 186.800 196.300 196.700 195.900 186.700 187.100 183.800 181.300 (°) 180.575 (°) 180.840 (°) 188.353 0,1% -4,1% -0,4%TOTAL UE-15 104.400 100.700 102.300 99.700 96.300 96.800 91.000 90.600 (°) 89.375 (°) 89.140 (°) 96.797 -0,3% -7,7% -1,4%Source : EUROSTAT (CRONOS) - extraction 12/04/2011 (°) C.2 estimation (°°) Statistiques nationales (p) provisoireCode de produit: c2200A noter: TOTAL inclut tout les EM pour lesquels des données sont disponibles
Tab 2.2 Superficies de production des autres fruits à noyaux (Hectares)
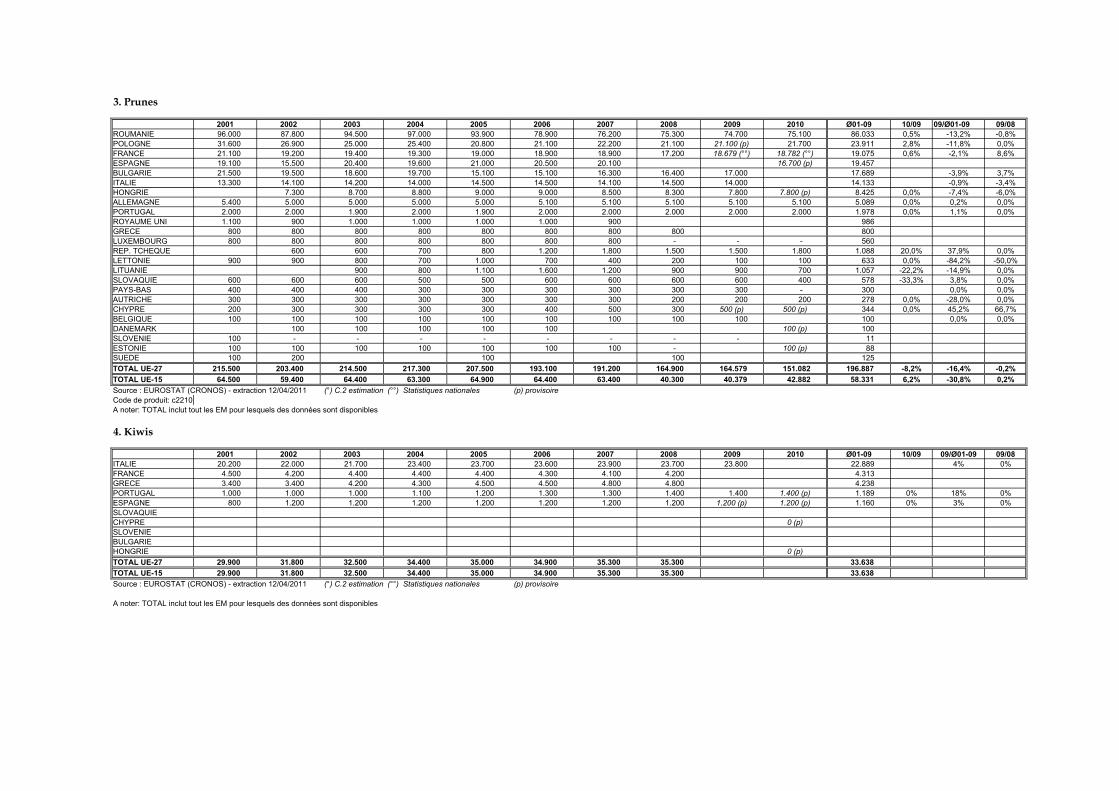
3. Prunes
2001 2002 2003 2004 2005 2006 2007 2008 2009 2010 Ø01-09 10/09 09/Ø01-09 09/08ROUMANIE 96.000 87.800 94.500 97.000 93.900 78.900 76.200 75.300 74.700 75.100 86.033 0,5% -13,2% -0,8%POLOGNE 31.600 26.900 25.000 25.400 20.800 21.100 22.200 21.100 21.100 (p) 21.700 23.911 2,8% -11,8% 0,0%FRANCE 21.100 19.200 19.400 19.300 19.000 18.900 18.900 17.200 18.679 (°°) 18.782 (°°) 19.075 0,6% -2,1% 8,6%ESPAGNE 19.100 15.500 20.400 19.600 21.000 20.500 20.100 16.700 (p) 19.457 BULGARIE 21.500 19.500 18.600 19.700 15.100 15.100 16.300 16.400 17.000 17.689 -3,9% 3,7%ITALIE 13.300 14.100 14.200 14.000 14.500 14.500 14.100 14.500 14.000 14.133 -0,9% -3,4%HONGRIE 7.300 8.700 8.800 9.000 9.000 8.500 8.300 7.800 7.800 (p) 8.425 0,0% -7,4% -6,0%ALLEMAGNE 5.400 5.000 5.000 5.000 5.000 5.100 5.100 5.100 5.100 5.100 5.089 0,0% 0,2% 0,0%PORTUGAL 2.000 2.000 1.900 2.000 1.900 2.000 2.000 2.000 2.000 2.000 1.978 0,0% 1,1% 0,0%ROYAUME UNI 1.100 900 1.000 1.000 1.000 1.000 900 986 GRECE 800 800 800 800 800 800 800 800 800 LUXEMBOURG 800 800 800 800 800 800 800 - - - 560 REP. TCHEQUE 600 600 700 800 1.200 1.800 1.500 1.500 1.800 1.088 20,0% 37,9% 0,0%LETTONIE 900 900 800 700 1.000 700 400 200 100 100 633 0,0% -84,2% -50,0%LITUANIE 900 800 1.100 1.600 1.200 900 900 700 1.057 -22,2% -14,9% 0,0%SLOVAQUIE 600 600 600 500 500 600 600 600 600 400 578 -33,3% 3,8% 0,0%PAYS-BAS 400 400 400 300 300 300 300 300 300 - 300 0,0% 0,0%AUTRICHE 300 300 300 300 300 300 300 200 200 200 278 0,0% -28,0% 0,0%CHYPRE 200 300 300 300 300 400 500 300 500 (p) 500 (p) 344 0,0% 45,2% 66,7%BELGIQUE 100 100 100 100 100 100 100 100 100 100 0,0% 0,0%DANEMARK 100 100 100 100 100 100 (p) 100 SLOVENIE 100 - - - - - - - - 11 ESTONIE 100 100 100 100 100 100 100 - 100 (p) 88 SUEDE 100 200 100 100 125 TOTAL UE-27 215.500 203.400 214.500 217.300 207.500 193.100 191.200 164.900 164.579 151.082 196.887 -8,2% -16,4% -0,2%TOTAL UE-15 64.500 59.400 64.400 63.300 64.900 64.400 63.400 40.300 40.379 42.882 58.331 6,2% -30,8% 0,2%Source : EUROSTAT (CRONOS) - extraction 12/04/2011 (°) C.2 estimation (°°) Statistiques nationales (p) provisoireCode de produit: c2210A noter: TOTAL inclut tout les EM pour lesquels des données sont disponibles
4. Kiwis
2001 2002 2003 2004 2005 2006 2007 2008 2009 2010 Ø01-09 10/09 09/Ø01-09 09/08ITALIE 20.200 22.000 21.700 23.400 23.700 23.600 23.900 23.700 23.800 22.889 4% 0%FRANCE 4.500 4.200 4.400 4.400 4.400 4.300 4.100 4.200 4.313 GRECE 3.400 3.400 4.200 4.300 4.500 4.500 4.800 4.800 4.238 PORTUGAL 1.000 1.000 1.000 1.100 1.200 1.300 1.300 1.400 1.400 1.400 (p) 1.189 0% 18% 0%ESPAGNE 800 1.200 1.200 1.200 1.200 1.200 1.200 1.200 1.200 (p) 1.200 (p) 1.160 0% 3% 0%SLOVAQUIECHYPRE 0 (p)SLOVENIEBULGARIEHONGRIE 0 (p)TOTAL UE-27 29.900 31.800 32.500 34.400 35.000 34.900 35.300 35.300 33.638 TOTAL UE-15 29.900 31.800 32.500 34.400 35.000 34.900 35.300 35.300 33.638 Source : EUROSTAT (CRONOS) - extraction 12/04/2011 (°) C.2 estimation (°°) Statistiques nationales (p) provisoire
A noter: TOTAL inclut tout les EM pour lesquels des données sont disponibles
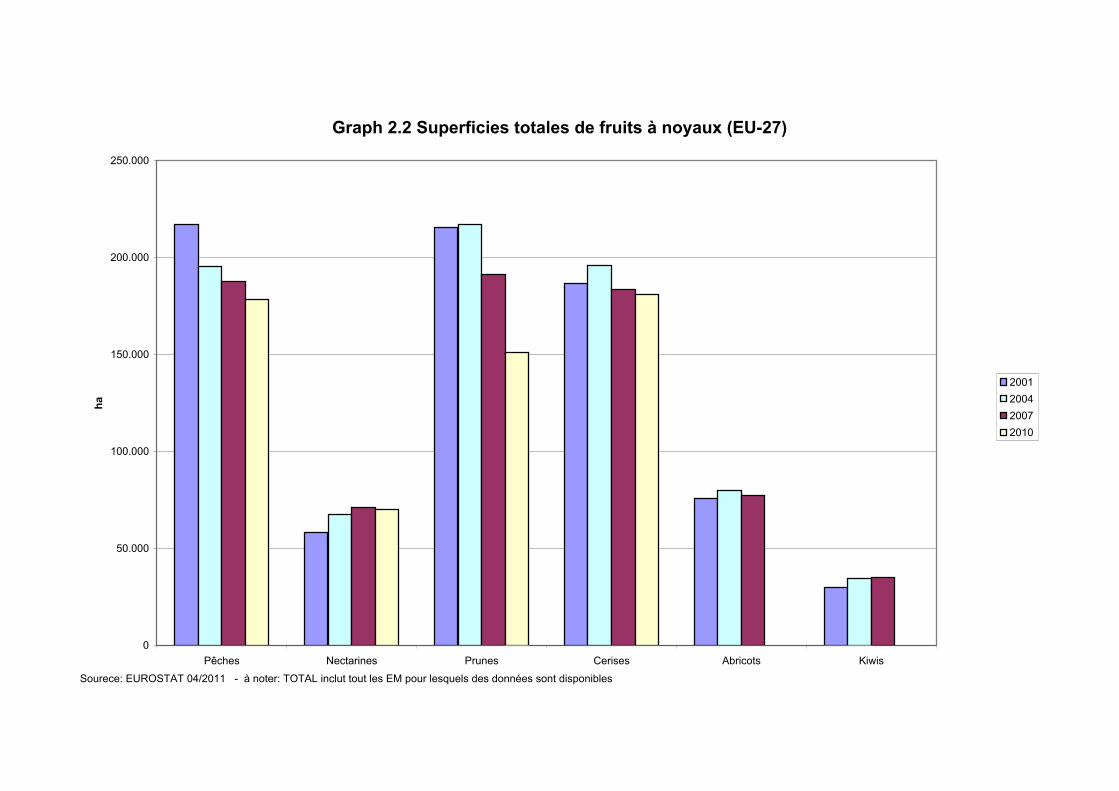
Graph 2.2 Superficies totales de fruits à noyaux (EU-27)
0
50.000
100.000
150.000
200.000
250.000
Pêches Nectarines Prunes Cerises Abricots Kiwis
ha
2001200420072010
Sourece: EUROSTAT 04/2011 - à noter: TOTAL inclut tout les EM pour lesquels des données sont disponibles
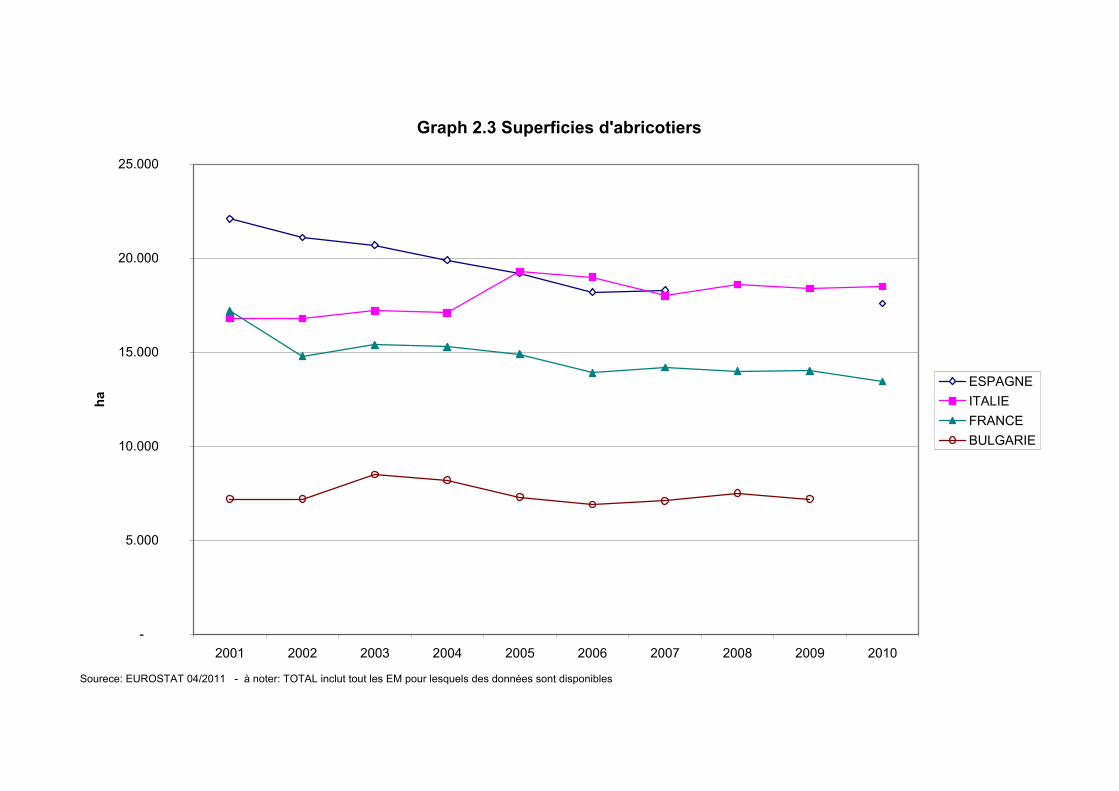
Graph 2.3 Superficies d'abricotiers
-
5.000
10.000
15.000
20.000
25.000
2001 2002 2003 2004 2005 2006 2007 2008 2009 2010
ha
ESPAGNEITALIEFRANCEBULGARIE
Sourece: EUROSTAT 04/2011 - à noter: TOTAL inclut tout les EM pour lesquels des données sont disponibles
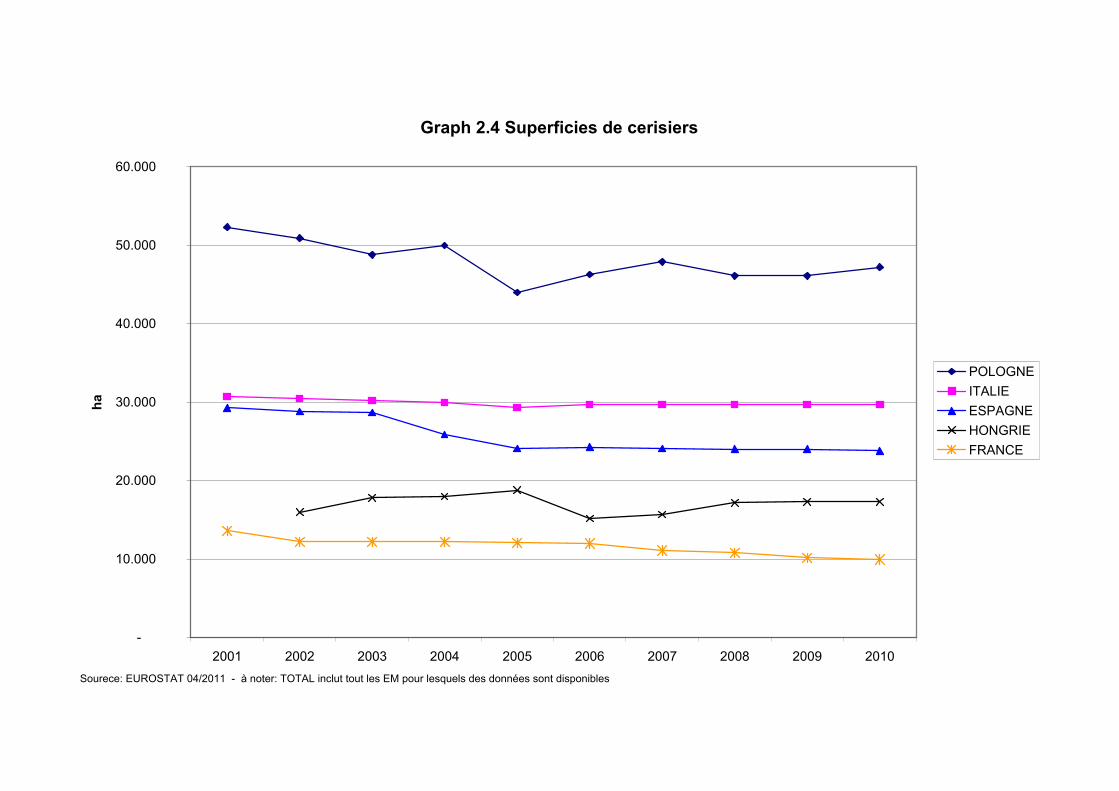
Graph 2.4 Superficies de cerisiers
-
10.000
20.000
30.000
40.000
50.000
60.000
2001 2002 2003 2004 2005 2006 2007 2008 2009 2010
ha
POLOGNEITALIEESPAGNEHONGRIEFRANCE
Sourece: EUROSTAT 04/2011 - à noter: TOTAL inclut tout les EM pour lesquels des données sont disponibles
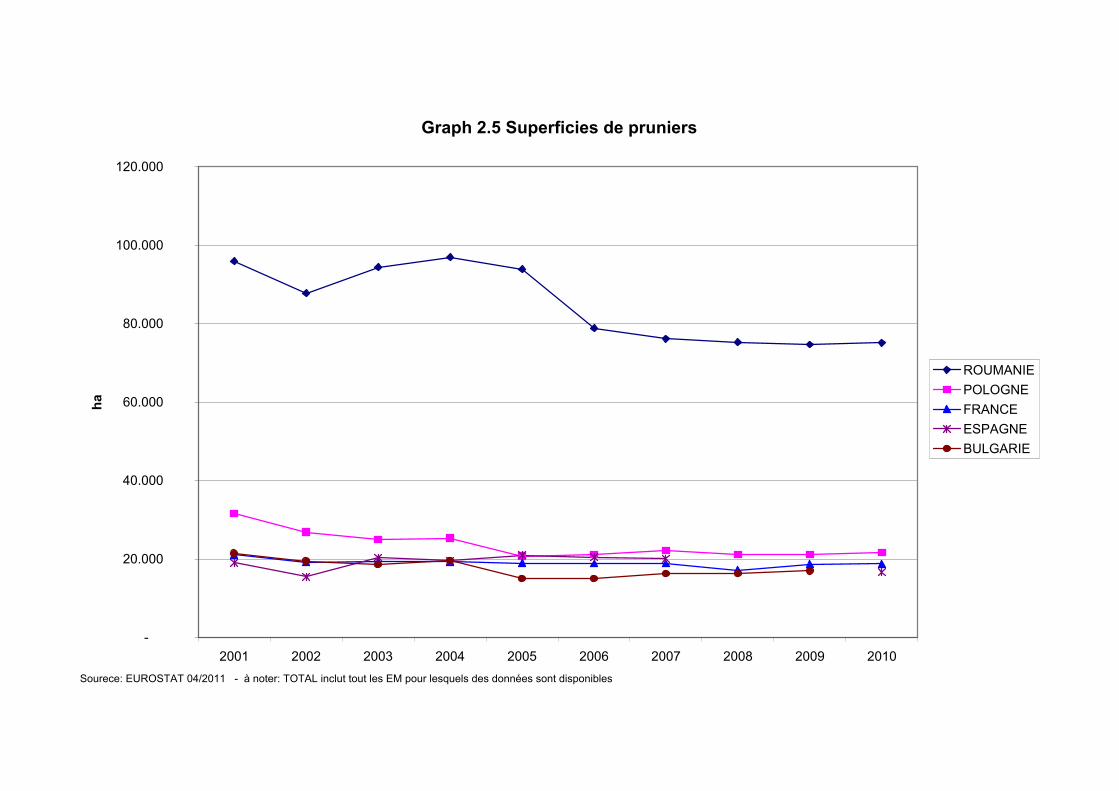
Graph 2.5 Superficies de pruniers
-
20.000
40.000
60.000
80.000
100.000
120.000
2001 2002 2003 2004 2005 2006 2007 2008 2009 2010
ha
ROUMANIEPOLOGNEFRANCEESPAGNEBULGARIE
Sourece: EUROSTAT 04/2011 - à noter: TOTAL inclut tout les EM pour lesquels des données sont disponibles
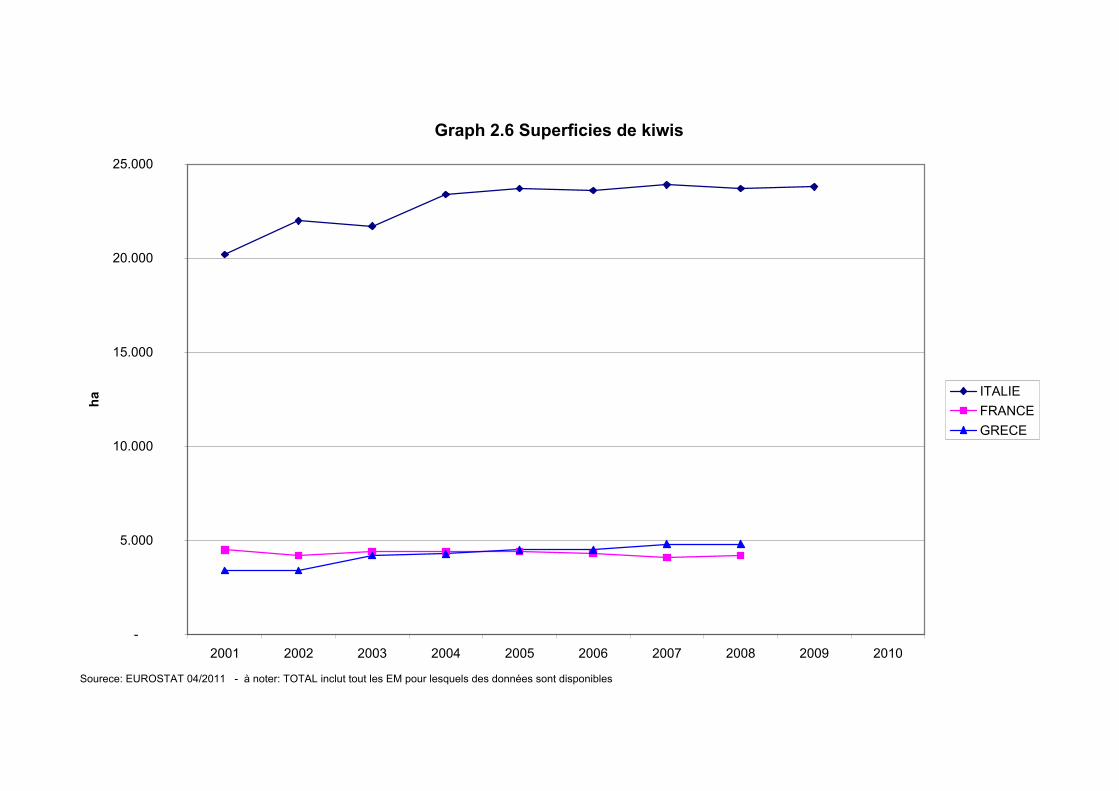
Graph 2.6 Superficies de kiwis
-
5.000
10.000
15.000
20.000
25.000
2001 2002 2003 2004 2005 2006 2007 2008 2009 2010
ha
ITALIEFRANCEGRECE
Sourece: EUROSTAT 04/2011 - à noter: TOTAL inclut tout les EM pour lesquels des données sont disponibles
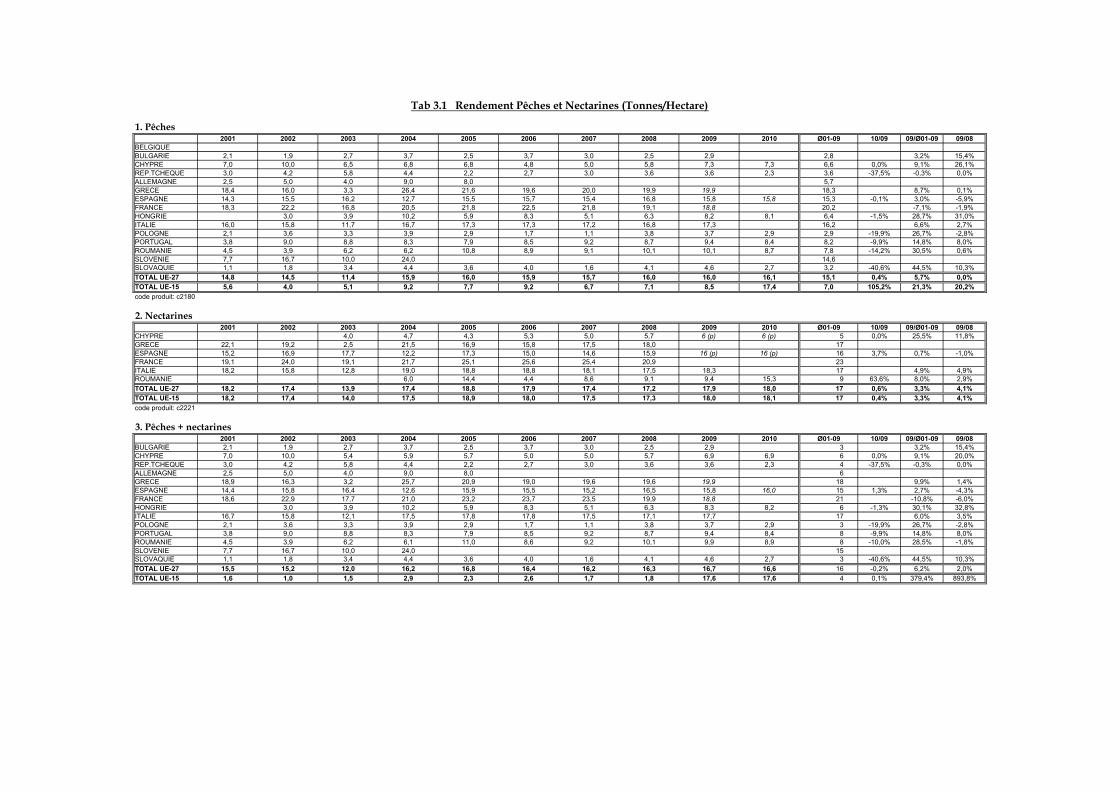
1. Pêches2001 2002 2003 2004 2005 2006 2007 2008 2009 2010 Ø01-09 10/09 09/Ø01-09 09/08
BELGIQUEBULGARIE 2,1 1,9 2,7 3,7 2,5 3,7 3,0 2,5 2,9 2,8 3,2% 15,4%CHYPRE 7,0 10,0 6,5 6,8 6,8 4,8 5,0 5,8 7,3 7,3 6,6 0,0% 9,1% 26,1%REP.TCHEQUE 3,0 4,2 5,8 4,4 2,2 2,7 3,0 3,6 3,6 2,3 3,6 -37,5% -0,3% 0,0%ALLEMAGNE 2,5 5,0 4,0 9,0 8,0 5,7GRECE 18,4 16,0 3,3 26,4 21,6 19,6 20,0 19,9 19,9 18,3 8,7% 0,1%ESPAGNE 14,3 15,5 16,2 12,7 15,5 15,7 15,4 16,8 15,8 15,8 15,3 -0,1% 3,0% -5,9%FRANCE 18,3 22,2 16,8 20,5 21,8 22,5 21,8 19,1 18,8 20,2 -7,1% -1,9%HONGRIE 3,0 3,9 10,2 5,9 8,3 5,1 6,3 8,2 8,1 6,4 -1,5% 28,7% 31,0%ITALIE 16,0 15,8 11,7 16,7 17,3 17,3 17,2 16,8 17,3 16,2 6,6% 2,7%POLOGNE 2,1 3,6 3,3 3,9 2,9 1,7 1,1 3,8 3,7 2,9 2,9 -19,9% 26,7% -2,8%PORTUGAL 3,8 9,0 8,8 8,3 7,9 8,5 9,2 8,7 9,4 8,4 8,2 -9,9% 14,8% 8,0%ROUMANIE 4,5 3,9 6,2 6,2 10,8 8,9 9,1 10,1 10,1 8,7 7,8 -14,2% 30,5% 0,6%SLOVENIE 7,7 16,7 10,0 24,0 14,6SLOVAQUIE 1,1 1,8 3,4 4,4 3,6 4,0 1,6 4,1 4,6 2,7 3,2 -40,6% 44,5% 10,3%TOTAL UE-27 14,8 14,5 11,4 15,9 16,0 15,9 15,7 16,0 16,0 16,1 15,1 0,4% 5,7% 0,0%TOTAL UE-15 5,6 4,0 5,1 9,2 7,7 9,2 6,7 7,1 8,5 17,4 7,0 105,2% 21,3% 20,2%code produit: c2180
2. Nectarines2001 2002 2003 2004 2005 2006 2007 2008 2009 2010 Ø01-09 10/09 09/Ø01-09 09/08
CHYPRE 4,0 4,7 4,3 5,3 5,0 5,7 6 (p) 6 (p) 5 0,0% 25,5% 11,8%GRECE 22,1 19,2 2,5 21,5 16,9 15,8 17,5 18,0 17 ESPAGNE 15,2 16,9 17,7 12,2 17,3 15,0 14,6 15,9 16 (p) 16 (p) 16 3,7% 0,7% -1,0%FRANCE 19,1 24,0 19,1 21,7 25,1 25,6 25,4 20,9 23 ITALIE 18,2 15,8 12,8 19,0 18,8 18,8 18,1 17,5 18,3 17 4,9% 4,9%ROUMANIE 6,0 14,4 4,4 8,6 9,1 9,4 15,3 9 63,6% 8,0% 2,9%TOTAL UE-27 18,2 17,4 13,9 17,4 18,8 17,9 17,4 17,2 17,9 18,0 17 0,6% 3,3% 4,1%TOTAL UE-15 18,2 17,4 14,0 17,5 18,9 18,0 17,5 17,3 18,0 18,1 17 0,4% 3,3% 4,1%code produit: c2221
3. Pêches + nectarines2001 2002 2003 2004 2005 2006 2007 2008 2009 2010 Ø01-09 10/09 09/Ø01-09 09/08
BULGARIE 2,1 1,9 2,7 3,7 2,5 3,7 3,0 2,5 2,9 3 3,2% 15,4%CHYPRE 7,0 10,0 5,4 5,9 5,7 5,0 5,0 5,7 6,9 6,9 6 0,0% 9,1% 20,0%REP.TCHEQUE 3,0 4,2 5,8 4,4 2,2 2,7 3,0 3,6 3,6 2,3 4 -37,5% -0,3% 0,0%ALLEMAGNE 2,5 5,0 4,0 9,0 8,0 6 GRECE 18,9 16,3 3,2 25,7 20,9 19,0 19,6 19,6 19,9 18 9,9% 1,4%ESPAGNE 14,4 15,8 16,4 12,6 15,9 15,5 15,2 16,5 15,8 16,0 15 1,3% 2,7% -4,3%FRANCE 18,6 22,9 17,7 21,0 23,2 23,7 23,5 19,9 18,8 21 -10,8% -6,0%HONGRIE 3,0 3,9 10,2 5,9 8,3 5,1 6,3 8,3 8,2 6 -1,3% 30,1% 32,8%ITALIE 16,7 15,8 12,1 17,5 17,8 17,8 17,5 17,1 17,7 17 6,0% 3,5%POLOGNE 2,1 3,6 3,3 3,9 2,9 1,7 1,1 3,8 3,7 2,9 3 -19,9% 26,7% -2,8%PORTUGAL 3,8 9,0 8,8 8,3 7,9 8,5 9,2 8,7 9,4 8,4 8 -9,9% 14,8% 8,0%ROUMANIE 4,5 3,9 6,2 6,1 11,0 8,6 9,2 10,1 9,9 8,9 8 -10,0% 28,5% -1,8%SLOVENIE 7,7 16,7 10,0 24,0 15 SLOVAQUIE 1,1 1,8 3,4 4,4 3,6 4,0 1,6 4,1 4,6 2,7 3 -40,6% 44,5% 10,3%TOTAL UE-27 15,5 15,2 12,0 16,2 16,8 16,4 16,2 16,3 16,7 16,6 16 -0,2% 6,2% 2,0%TOTAL UE-15 1,6 1,0 1,5 2,9 2,3 2,6 1,7 1,8 17,6 17,6 4 0,1% 379,4% 893,8%
Tab 3.1 Rendement Pêches et Nectarines (Tonnes/Hectare)
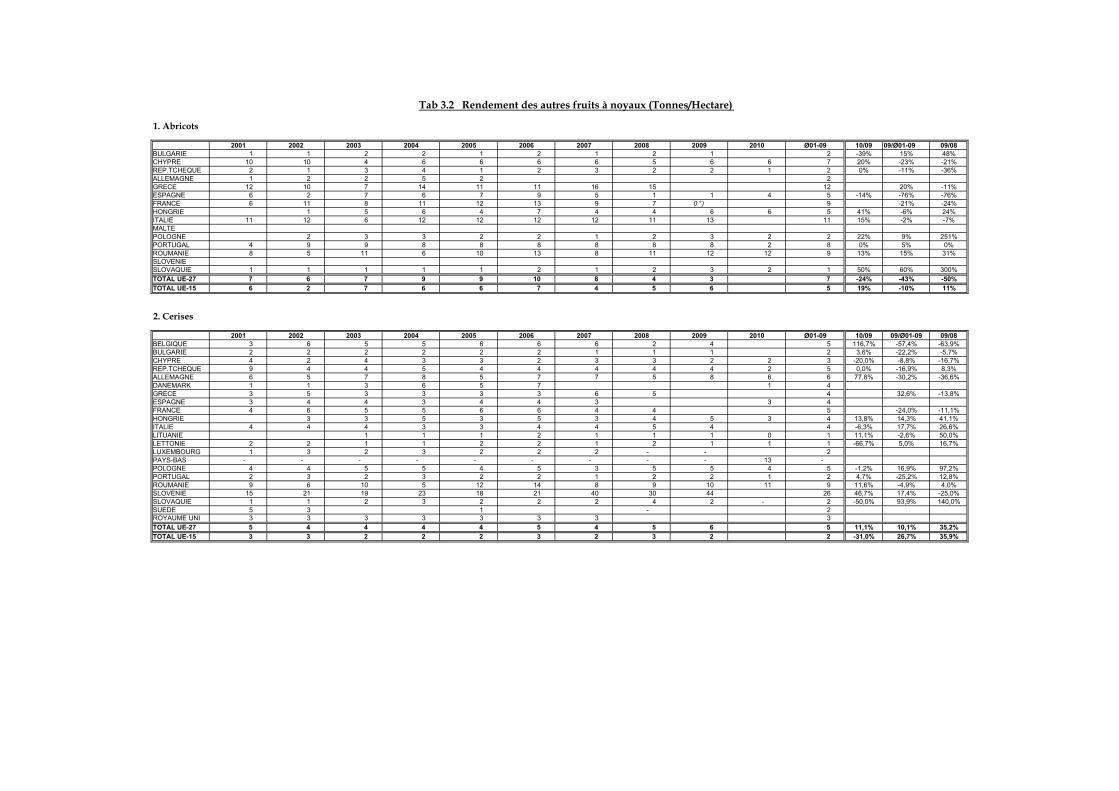
1. Abricots
2001 2002 2003 2004 2005 2006 2007 2008 2009 2010 Ø01-09 10/09 09/Ø01-09 09/08BULGARIE 1 1 2 2 1 2 1 2 1 2 -39% 15% 48%CHYPRE 10 10 4 6 6 6 6 5 6 6 7 20% -23% -21%REP.TCHEQUE 2 1 3 4 1 2 3 2 2 1 2 0% -11% -36%ALLEMAGNE 1 2 2 5 2 2 GRECE 12 10 7 14 11 11 16 15 12 20% -11%ESPAGNE 6 2 7 6 7 9 5 1 1 4 5 -14% -76% -76%FRANCE 6 11 8 11 12 13 9 7 0 °) 9 -21% -24%HONGRIE 1 5 6 4 7 4 4 6 6 5 41% -6% 24%ITALIE 11 12 6 12 12 12 12 11 13 11 15% -2% -7%MALTEPOLOGNE 2 3 3 2 2 1 2 3 2 2 22% 9% 251%PORTUGAL 4 9 9 8 8 8 8 8 8 2 8 0% 5% 0%ROUMANIE 8 5 11 6 10 13 8 11 12 12 9 13% 15% 31%SLOVENIESLOVAQUIE 1 1 1 1 1 2 1 2 3 2 1 50% 60% 300%TOTAL UE-27 7 6 7 9 9 10 8 4 3 7 -24% -43% -50%TOTAL UE-15 6 2 7 6 6 7 4 5 6 5 19% -10% 11%
2. Cerises
2001 2002 2003 2004 2005 2006 2007 2008 2009 2010 Ø01-09 10/09 09/Ø01-09 09/08BELGIQUE 3 6 5 5 6 6 6 2 4 5 116,7% -57,4% -63,9%BULGARIE 2 2 2 2 2 2 1 1 1 2 3,6% -22,2% -5,7%CHYPRE 4 2 4 3 3 2 3 3 2 2 3 -20,0% -8,8% -16,7%REP.TCHEQUE 9 4 4 5 4 4 4 4 4 2 5 0,0% -16,9% 8,3%ALLEMAGNE 6 5 7 8 5 7 7 5 8 6 6 77,8% -30,2% -36,6%DANEMARK 1 1 3 6 5 7 1 4 GRECE 3 5 3 3 3 3 6 5 4 32,6% -13,8%ESPAGNE 3 4 4 3 4 4 3 3 4 FRANCE 4 6 5 5 6 6 4 4 5 -24,0% -11,1%HONGRIE 3 3 5 3 5 3 4 5 3 4 13,8% 14,3% 41,1%ITALIE 4 4 4 3 3 4 4 5 4 4 -6,3% 17,7% 26,6%LITUANIE 1 1 1 2 1 1 1 0 1 11,1% -2,6% 50,0%LETTONIE 2 2 1 1 2 2 1 2 1 1 1 -66,7% 5,0% 16,7%LUXEMBOURG 1 3 2 3 2 2 2 - - 2 PAYS-BAS - - - - - - - - - 13 - POLOGNE 4 4 5 5 4 5 3 5 5 4 5 -1,2% 16,9% 97,2%PORTUGAL 2 3 2 3 2 2 1 2 2 1 2 4,7% -25,2% 12,8%ROUMANIE 9 6 10 5 12 14 8 9 10 11 9 11,6% -4,9% 4,0%SLOVENIE 15 21 19 23 18 21 40 30 44 26 46,7% 17,4% -25,0%SLOVAQUIE 1 1 2 3 2 2 2 4 2 - 2 -50,0% 93,9% 140,0%SUEDE 5 3 1 - 2 ROYAUME UNI 3 3 3 3 3 3 3 3 TOTAL UE-27 5 4 4 4 4 5 4 5 6 5 11,1% 10,1% 35,2%TOTAL UE-15 3 3 2 2 2 3 2 3 2 2 -31,0% 26,7% 35,9%
Tab 3.2 Rendement des autres fruits à noyaux (Tonnes/Hectare)

3. Prunes
2001 2002 2003 2004 2005 2006 2007 2008 2009 2010 Ø01-09 10/09 09/Ø01-09 09/08BELGIQUE 3 6 6 3 4 4 5 1 3 4 200,0% -74,3% -80,0%BULGARIE 3 3 2 2 1 1 1 1 1 2 16,0% -53,2% -38,2%CHYPRE 6 4 2 2 3 2 2 3 2 1 3 -32,5% -1,8% 48,1%REP.TCHEQUE 5 6 10 6 4 3 4 4 3 5 0,0% -21,3% 28,1%ALLEMAGNE 8 9 10 17 9 11 14 7 16 10 11 131,1% -37,7% -49,9%DANEMARK - 3 3 3 3 3 2 ESTONIE 1 1 0 1 - - - 0 GRECE 4 4 4 4 4 4 3 3 4 -25,7% 0,0%ESPAGNE 8 11 11 7 12 9 10 11 10 FRANCE 13 13 13 12 11 12 13 9 12 -28,8% -35,7%HONGRIE 7 5 8 4 7 4 7 7 7 6 -2,1% 13,1% 86,2%IRLANDEITALIE 13 13 9 13 13 12 13 13 14 - 12 9,0% 1,7% -3,6%LITUANIE - 2 2 2 6 2 6 19 8 5 245,5% 19,2% 266,7%LETTONIE 3 4 1 1 3 2 0 0 0 2 -50,0% -84,5% -33,3%LUXEMBOURG 0 2 1 3 2 2 2 1 1 2 0,0% -56,8% -66,7%MALTEPAYS-BAS - - - - - - - - - - POLOGNE 4 4 4 5 4 4 2 5 6 4 4 6,3% 21,3% 123,4%PORTUGAL 6 8 9 8 9 10 10 11 11 11 9 -4,1% 22,1% 10,6%ROUMANIE 6 3 10 5 6 7 5 6 7 9 6 13,0% 3,6% 28,9%SLOVAQUIE 5 3 3 5 3 4 4 4 5 6 4 31,8% -3,5% 0,0%SLOVENIE 60 60 SUEDE 4 3 3 3 ROYAUME UNI 13 14 15 14 15 14 15 14 TOTAL UE-27 8 6 9 7 7 8 7 8 7 7,3% 15,7%TOTAL UE-15 4 4 4 4 4 5 5 5
4. Kiwis
2001 2002 2003 2004 2005 2006 2007 2008 2009 2010 Ø01-09 10/09 09/Ø01-09 09/08BULGARIECHYPREGRECE 18 18 14 17 16 19 15 18 17 5,1% 20,3%ESPAGNE 11 12 11 9 10 15 12 15 16 19,9 °) 12 5,6% 21,0% 27,1%FRANCE 18 18 17 18 17 18 15 16 17 -8,1% 4,6%HONGRIEITALIE 16 17 15 18 18 18 17 19 18 18 -4,1% 9,1% 9,5%PORTUGAL 8 11 11 10 9 10 9 8 9 7 9 16,4% -16,5% -17,0%SLOVENIESLOVAQUIETOTAL UE-27 16 17 15 18 17 18 16 17 TOTAL UE-15 17 17 15 17 16 18 14 16
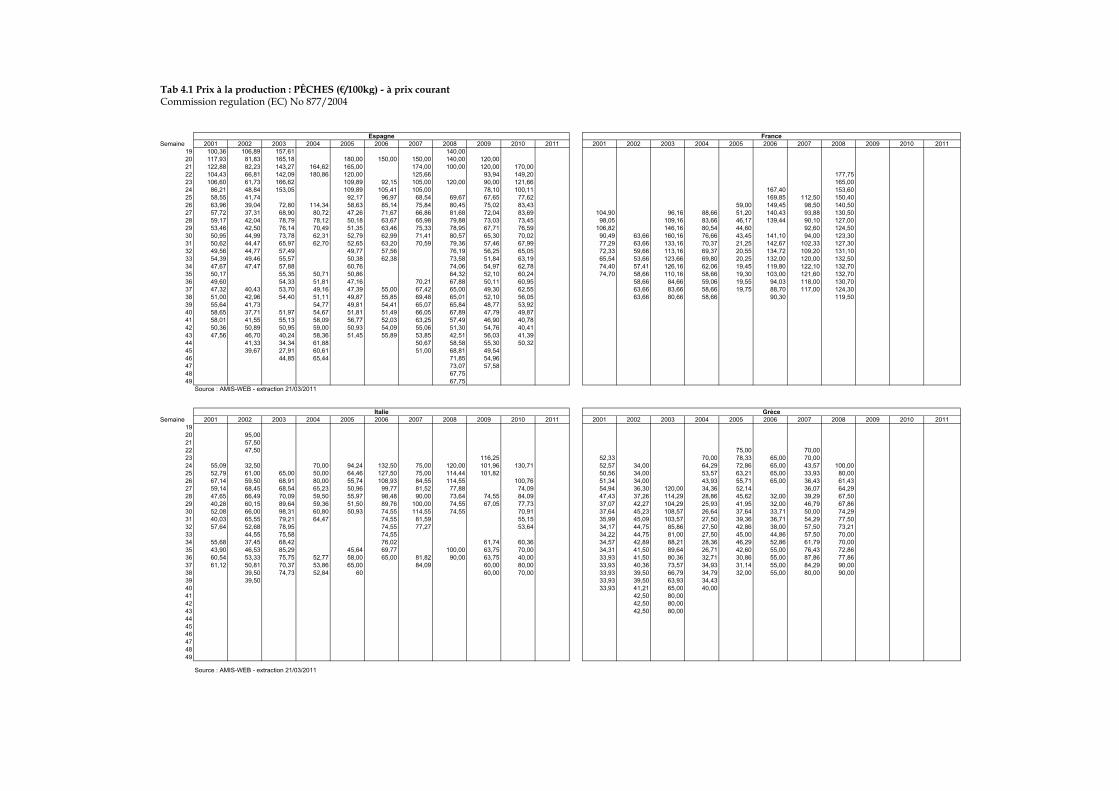
Tab 4.1 Prix à la production : PÊCHES (€/100kg) - à prix courantCommission regulation (EC) No 877/2004
Semaine 2001 2002 2003 2004 2005 2006 2007 2008 2009 2010 2011 2001 2002 2003 2004 2005 2006 2007 2008 2009 2010 201119 100,36 106,89 157,61 140,0020 117,93 81,83 165,18 180,00 150,00 150,00 140,00 120,0021 122,88 82,23 143,27 164,62 165,00 174,00 100,00 120,00 170,0022 104,43 66,81 142,09 180,86 120,00 125,66 93,94 149,20 177,7523 106,60 61,73 166,62 109,89 92,15 105,00 120,00 90,00 121,66 165,0024 86,21 48,84 153,05 109,89 105,41 105,00 78,10 100,11 167,40 153,6025 58,55 41,74 92,17 96,97 68,54 69,67 67,65 77,62 169,85 112,50 150,4026 63,96 39,04 72,80 114,34 58,63 85,14 75,84 80,45 75,02 83,43 59,00 149,45 98,50 140,5027 57,72 37,31 68,90 80,72 47,26 71,67 66,86 81,68 72,04 83,69 104,90 96,16 88,66 51,20 140,43 93,88 130,5028 59,17 42,04 78,79 78,12 50,18 63,67 65,98 79,88 73,03 73,45 98,05 109,16 83,66 46,17 139,44 90,10 127,0029 53,46 42,50 76,14 70,49 51,35 63,46 75,33 78,95 67,71 76,59 106,82 146,16 80,54 44,60 92,60 124,5030 50,95 44,99 73,78 62,31 52,79 62,99 71,41 80,57 65,30 70,02 90,49 63,66 160,16 76,66 43,45 141,10 94,00 123,3031 50,62 44,47 65,97 62,70 52,65 63,20 70,59 79,36 57,46 67,99 77,29 63,66 133,16 70,37 21,25 142,67 102,33 127,3032 49,56 44,77 57,49 49,77 57,56 76,19 56,25 65,05 72,33 59,66 113,16 69,37 20,55 134,72 109,20 131,1033 54,39 49,46 55,57 50,38 62,38 73,58 51,84 63,19 65,54 53,66 123,66 69,80 20,25 132,00 120,00 132,5034 47,67 47,47 57,88 60,76 74,06 54,97 62,78 74,40 57,41 126,16 62,06 19,45 119,80 122,10 132,7035 50,17 55,35 50,71 50,86 64,32 52,10 60,24 74,70 58,66 110,16 58,66 19,30 103,00 121,60 132,7036 49,60 54,33 51,81 47,16 70,21 67,88 50,11 60,95 58,66 84,66 59,06 19,55 94,03 118,00 130,7037 47,32 40,43 53,70 49,16 47,39 55,00 67,42 65,00 49,30 62,55 63,66 83,66 58,66 19,75 88,70 117,00 124,3038 51,00 42,96 54,40 51,11 49,87 55,85 69,48 65,01 52,10 56,05 63,66 80,66 58,66 90,30 119,5039 55,64 41,73 54,77 49,81 54,41 65,07 65,84 48,77 53,9240 58,65 37,71 51,97 54,67 51,81 51,49 66,05 67,89 47,79 49,8741 58,01 41,55 55,13 58,09 56,77 52,03 63,25 57,49 46,90 40,7842 50,36 50,89 50,95 59,00 50,93 54,09 55,06 51,30 54,76 40,4143 47,56 46,70 40,24 58,36 51,45 55,89 53,85 42,51 56,03 41,3944 41,33 34,34 61,88 50,67 58,58 55,30 50,3245 39,67 27,91 60,61 51,00 68,81 49,5446 44,85 65,44 71,85 54,9647 73,07 57,5848 67,7549 67,75
Source : AMIS-WEB - extraction 21/03/2011
Semaine 2001 2002 2003 2004 2005 2006 2007 2008 2009 2010 2011 2001 2002 2003 2004 2005 2006 2007 2008 2009 2010 20111920 95,0021 57,5022 47,50 75,00 70,0023 116,25 52,33 70,00 78,33 65,00 70,0024 55,09 32,50 70,00 94,24 132,50 75,00 120,00 101,96 130,71 52,57 34,00 64,29 72,86 65,00 43,57 100,0025 52,79 61,00 65,00 50,00 64,46 127,50 75,00 114,44 101,82 50,56 34,00 53,57 63,21 65,00 33,93 80,0026 67,14 59,50 68,91 80,00 55,74 108,93 84,55 114,55 100,76 51,34 34,00 43,93 55,71 65,00 36,43 61,4327 59,14 68,45 68,54 65,23 50,96 99,77 81,52 77,88 74,09 54,94 36,30 120,00 34,36 52,14 36,07 64,2928 47,65 66,49 70,09 59,50 55,97 98,48 90,00 73,64 74,55 84,09 47,43 37,26 114,29 28,86 45,62 32,00 39,29 67,5029 40,28 60,15 89,64 59,36 51,50 89,76 100,00 74,55 67,05 77,73 37,07 42,27 104,29 25,93 41,95 32,00 46,79 67,8630 52,08 66,00 98,31 60,80 50,93 74,55 114,55 74,55 70,91 37,64 45,23 108,57 26,64 37,64 33,71 50,00 74,2931 40,03 65,55 79,21 64,47 74,55 81,59 55,15 35,99 45,09 103,57 27,50 39,36 36,71 54,29 77,5032 57,64 52,68 78,95 74,55 77,27 53,64 34,17 44,75 85,86 27,50 42,86 38,00 57,50 73,2133 44,55 75,58 74,55 34,22 44,75 81,00 27,50 45,00 44,86 57,50 70,0034 55,68 37,45 68,42 76,02 61,74 60,36 34,57 42,89 88,21 28,36 46,29 52,86 61,79 70,0035 43,90 46,53 85,29 45,64 69,77 100,00 63,75 70,00 34,31 41,50 89,64 26,71 42,60 55,00 76,43 72,8636 60,54 53,33 75,75 52,77 58,00 65,00 81,82 90,00 63,75 40,00 33,93 41,50 80,36 32,71 30,86 55,00 87,86 77,8637 61,12 50,81 70,37 53,86 65,00 84,09 60,00 80,00 33,93 40,36 73,57 34,93 31,14 55,00 84,29 90,0038 39,50 74,73 52,84 60 60,00 70,00 33,93 39,50 66,79 34,79 32,00 55,00 80,00 90,0039 39,50 33,93 39,50 63,93 34,4340 33,93 41,21 65,00 40,0041 42,50 80,0042 42,50 80,0043 42,50 80,00444546474849
Source : AMIS-WEB - extraction 21/03/2011
Italie
Espagne
Grèce
France
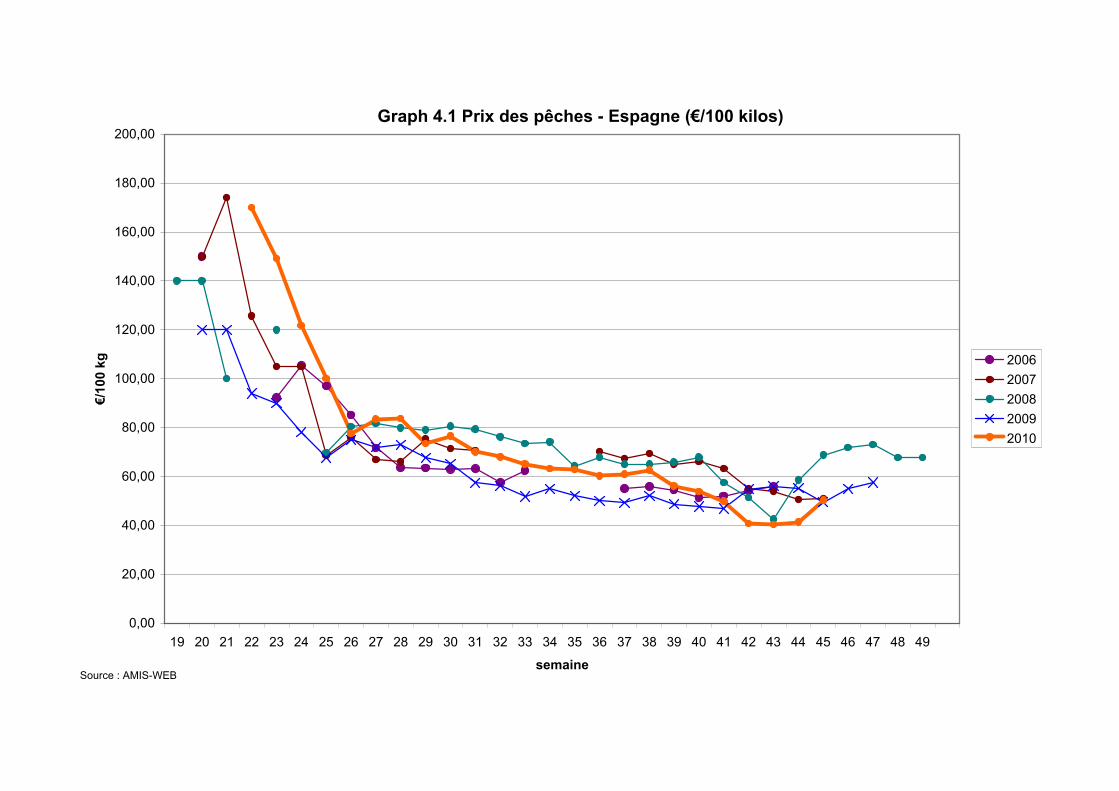
Graph 4.1 Prix des pêches - Espagne (€/100 kilos)
0,00
20,00
40,00
60,00
80,00
100,00
120,00
140,00
160,00
180,00
200,00
19 20 21 22 23 24 25 26 27 28 29 30 31 32 33 34 35 36 37 38 39 40 41 42 43 44 45 46 47 48 49
semaine
€/10
0 kg 2006
2007200820092010
Source : AMIS-WEB
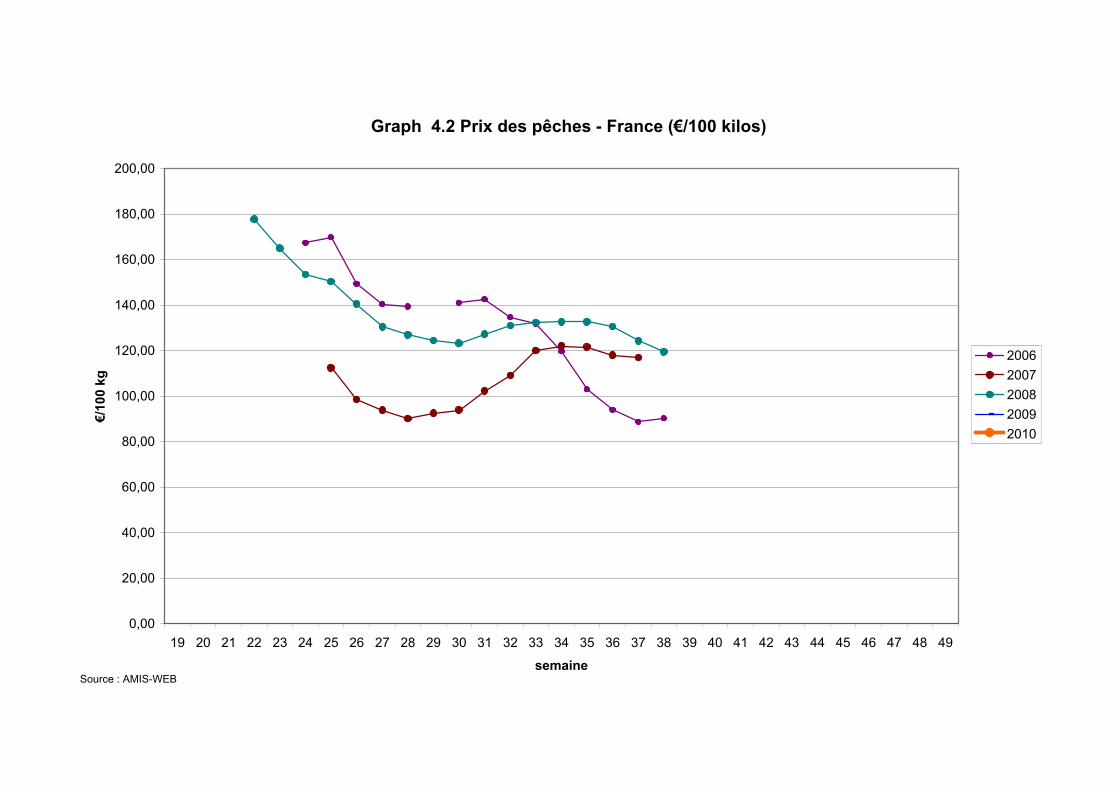
Graph 4.2 Prix des pêches - France (€/100 kilos)
0,00
20,00
40,00
60,00
80,00
100,00
120,00
140,00
160,00
180,00
200,00
19 20 21 22 23 24 25 26 27 28 29 30 31 32 33 34 35 36 37 38 39 40 41 42 43 44 45 46 47 48 49
semaine
€/10
0 kg
20062007200820092010
Source : AMIS-WEB
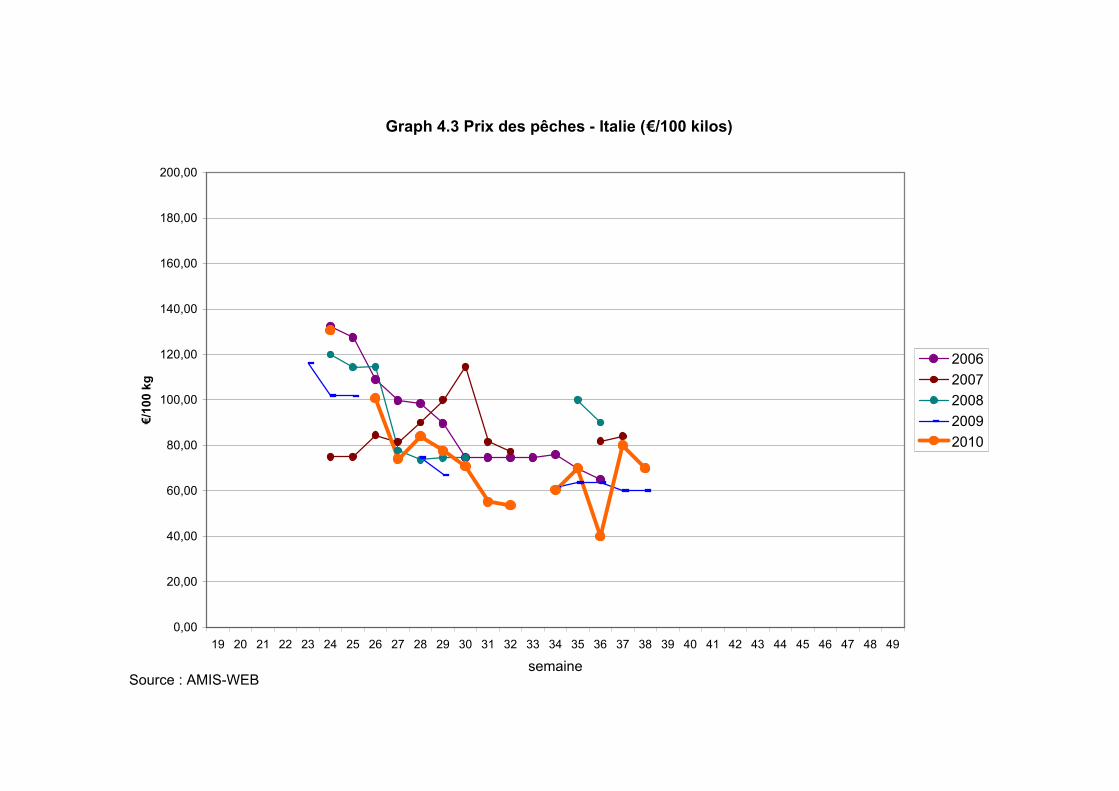
Graph 4.3 Prix des pêches - Italie (€/100 kilos)
0,00
20,00
40,00
60,00
80,00
100,00
120,00
140,00
160,00
180,00
200,00
19 20 21 22 23 24 25 26 27 28 29 30 31 32 33 34 35 36 37 38 39 40 41 42 43 44 45 46 47 48 49
semaine
€/10
0 kg
20062007200820092010
Source : AMIS-WEB

Graph 4.4 Prix des pêches - Grèce (€/100 kilos)
20,00
40,00
60,00
80,00
100,00
120,00
140,00
160,00
180,00
200,00
19 20 21 22 23 24 25 26 27 28 29 30 31 32 33 34 35 36 37 38 39 40 41 42 43 44 45 46 47 48 49
semaine
€/10
0 kg
20062007200820092010
Source : AMIS-WEB

Tab 4.2 Prix à la production : NECTARINES (€/100kg) - à prix courantCommission regulation (EC) No 877/2004
Semaine 2001 2002 2003 2004 2005 2006 2007 2008 2009 2010 2011 2001 2002 2003 2004 2005 2006 2007 2008 2009 2010 201119 119,38 135,5020 141,51 109,80 214,55 137,5021 123,21 110,67 181,89 190,75 110,0022 131,36 89,02 151,82 178,12 100,00 183,5023 128,10 80,23 155,82 100,00 185,93 150,0024 127,10 61,43 150,39 90,00 79,63 178,68 181,30 145,0025 97,20 46,44 133,54 94,73 71,00 78,32 91,88 177,43 137,10 169,60 136,70 168,2526 55,01 41,35 85,97 135,86 60,13 84,51 85,63 69,24 73,95 87,45 72,25 149,85 112,00 160,90 131,40 155,5027 52,29 34,40 76,06 108,47 54,58 71,88 63,39 83,79 75,24 84,75 105,89 128,66 65,50 147,25 104,13 150,50 129,10 146,0028 52,96 35,27 69,25 72,02 47,00 72,21 67,22 84,00 77,96 66,04 107,01 125,16 118,66 58,67 146,50 96,40 147,50 125,63 140,0029 53,77 37,29 64,35 73,04 49,68 69,37 66,10 79,46 69,57 71,84 99,96 137,41 111,79 54,00 96,10 134,38 108,10 126,6730 52,32 42,36 70,47 71,86 45,36 67,24 66,16 81,27 68,64 72,40 101,40 63,66 152,66 87,16 49,65 145,93 96,25 127,70 97,90 133,5031 51,22 44,73 68,75 73,65 54,17 65,59 70,88 81,45 62,85 71,23 106,00 64,66 128,66 77,66 22,70 147,38 103,00 129,70 85,20 110,0032 49,50 44,69 67,66 50,75 68,00 79,90 58,35 68,53 97,08 61,66 119,66 75,16 22,15 140,17 108,90 133,20 96,00 111,5033 49,29 44,64 64,73 46,24 72,82 77,04 55,72 68,69 91,98 57,41 131,16 70,29 21,69 139,21 118,50 133,00 93,40 106,8034 48,90 46,11 68,68 52,68 73,67 53,72 64,89 92,89 64,91 128,66 67,64 20,90 125,30 120,00 130,80 93,00 98,4035 48,43 66,47 62,64 45,75 77,73 59,68 62,31 99,33 63,66 117,66 59,66 19,60 103,13 120,40 131,00 93,00 91,6036 50,38 65,28 55,57 44,89 74,30 74,22 52,84 59,85 100,62 65,66 99,66 59,66 20,00 94,47 120,50 131,00 93,50 86,0037 50,22 39,69 62,66 51,93 45,63 67,01 74,34 78,19 61,06 59,71 120,50 128,70 93,50 84,0038 47,79 37,65 54,37 51,10 49,55 63,61 73,31 74,82 57,59 56,62 125,00 80,0039 48,29 35,42 54,71 51,54 57,24 70,83 68,96 56,52 55,0040 46,90 34,93 52,45 52,37 52,07 58,56 75,78 63,86 55,63 52,3541 41,59 37,39 50,16 58,63 61,21 82,98 64,90 50,04 53,5842 54,00 55,19 62,36 83,10 55,89 52,2443 47,48 75,60 55,7444 38,67 75,00 74,38 54,4845 47,17 76,61 55,7746 78,11 57,0647 78,81 57,6948 78,1549
Source : AMIS-WEB - extraction 21/03/2011
Semaine 2001 2002 2003 2004 2005 2006 2007 2008 2009 2010 2011 2001 2002 2003 2004 2005 2006 2007 2008 2009 2010 20111920 155,0021 110,0022 75,0023 45,50 170,0024 43,33 160,00 140,00 140,00 44,50 77,50 40,0025 59,00 90,00 65,00 140,00 137,50 100,83 87,36 44,50 80,00 76,07 40,00 70,0026 67,30 101,43 115,00 87,50 136,00 100,56 102,18 110,00 44,50 66,57 66,43 40,00 68,5727 69,72 80,02 85,37 95,00 63,56 97,78 82,31 103,75 46,21 150,00 45,93 55,05 40,00 73,2128 52,80 66,91 79,12 82,69 52,89 100,74 81,62 99,78 60,83 93,70 47,50 138,57 35,71 48,71 45,71 77,5029 61,98 56,53 84,12 69,86 52,89 95,56 88,75 104,31 50,56 91,57 48,36 112,86 31,14 45,35 55,71 70,3630 52,52 70,94 94,55 60,94 51,89 100,00 96,44 105,37 85,28 49,00 114,29 30,43 44,51 60,00 75,3631 63,56 69,51 71,25 57,78 100,00 88,84 72,50 41,40 49,00 119,29 35,79 46,61 65,71 77,5032 62,55 70,90 88,24 65,00 41,65 49,00 112,71 37,29 49,07 70,00 78,9333 64,23 43,09 71,59 42,04 49,00 110,43 35,43 47,50 70,00 80,0034 73,48 48,25 70,00 76,25 75,00 60,00 42,04 47,57 114,29 31,57 50,93 70,00 80,0035 61,88 54,40 79,38 57,50 64,17 89,58 55,00 56,25 42,04 46,50 117,50 27,86 50,55 87,14 80,0036 64,51 53,72 69,21 39,72 59,00 59,17 92,50 80,60 55,69 40,00 41,83 46,50 117,50 34,75 41,14 100,00 81,9037 49,17 68,17 45,11 63,26 110,00 69,17 57,50 58,59 41,53 45,07 120,00 37,93 43,71 100,00 90,0038 61,98 45,31 71,90 52,78 70,00 66,20 59,58 47,50 41,53 42,57 114,29 39,88 45,00 100,00 90,0039 45,31 41,53 41,50 110,00 44,2940 41,53 39,21 110,00 40,0041 37,5042 37,5043444546474849
Source : AMIS-WEB - extraction 21/03/2011
Italie
France
Grèce
Espagne
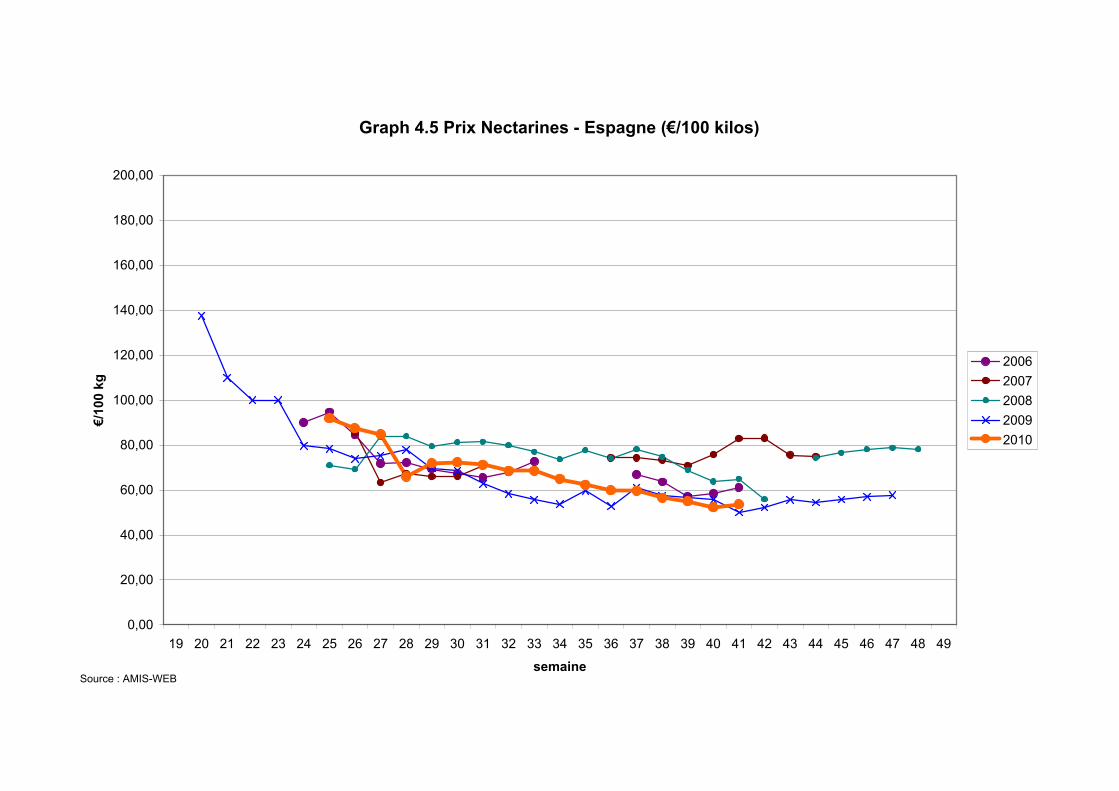
Graph 4.5 Prix Nectarines - Espagne (€/100 kilos)
0,00
20,00
40,00
60,00
80,00
100,00
120,00
140,00
160,00
180,00
200,00
19 20 21 22 23 24 25 26 27 28 29 30 31 32 33 34 35 36 37 38 39 40 41 42 43 44 45 46 47 48 49
semaine
€/10
0 kg
20062007200820092010
Source : AMIS-WEB

Graph 4.6 Prix Nectarines - France (€/100 kilos)
0,00
20,00
40,00
60,00
80,00
100,00
120,00
140,00
160,00
180,00
200,00
19 20 21 22 23 24 25 26 27 28 29 30 31 32 33 34 35 36 37 38 39 40 41 42 43 44 45 46 47 48 49
semaine
€/10
0 kg
20062007200820092010
Source : AMIS-WEB
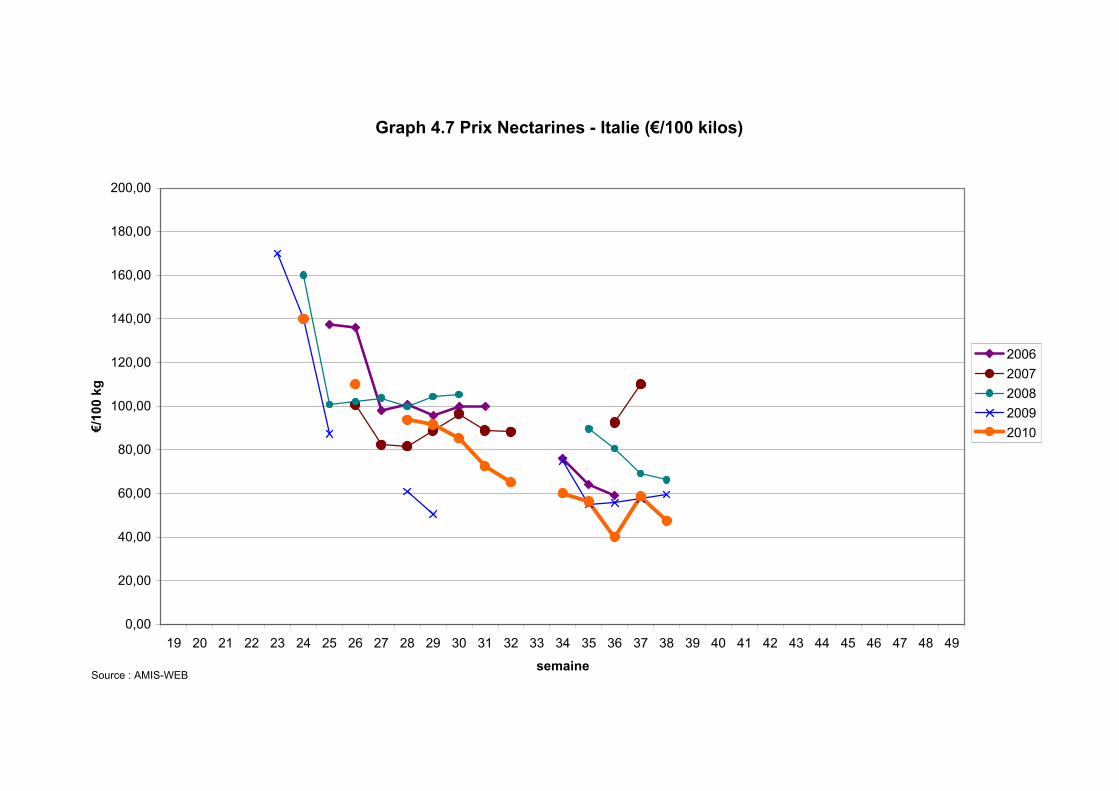
Graph 4.7 Prix Nectarines - Italie (€/100 kilos)
0,00
20,00
40,00
60,00
80,00
100,00
120,00
140,00
160,00
180,00
200,00
19 20 21 22 23 24 25 26 27 28 29 30 31 32 33 34 35 36 37 38 39 40 41 42 43 44 45 46 47 48 49
semaine
€/10
0 kg
20062007200820092010
Source : AMIS-WEB
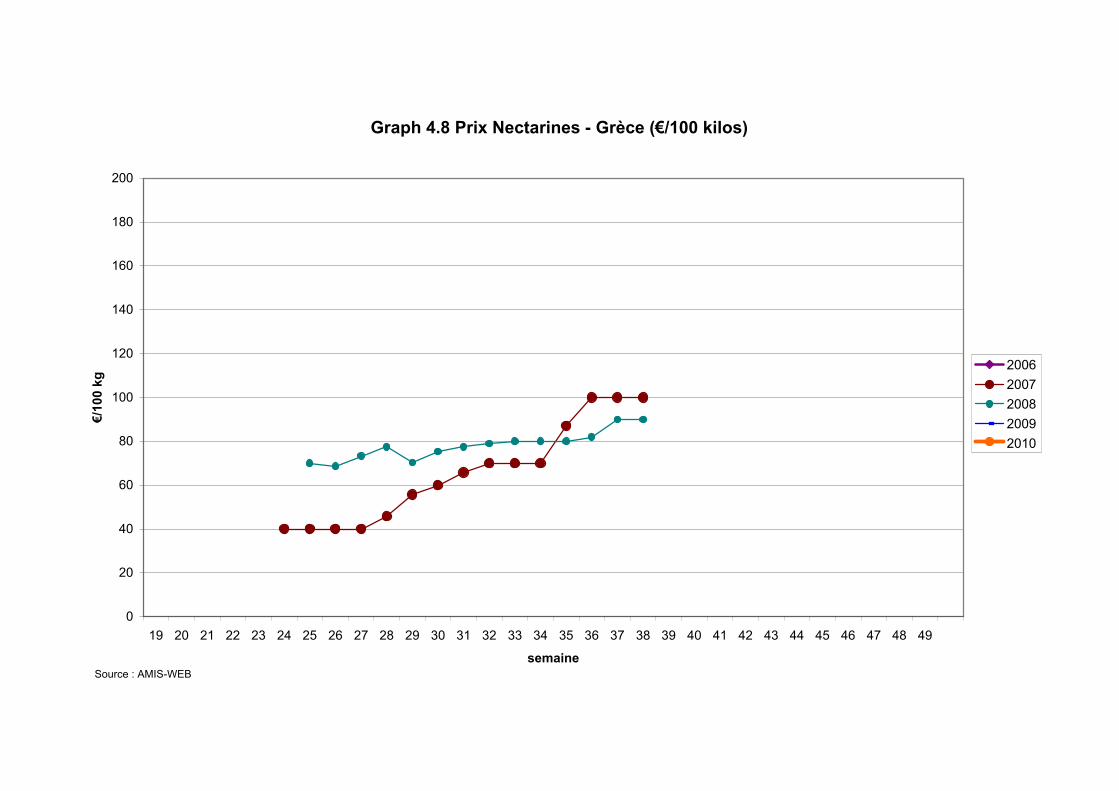
Graph 4.8 Prix Nectarines - Grèce (€/100 kilos)
0
20
40
60
80
100
120
140
160
180
200
19 20 21 22 23 24 25 26 27 28 29 30 31 32 33 34 35 36 37 38 39 40 41 42 43 44 45 46 47 48 49
semaine
€/10
0 kg
20062007200820092010
Source : AMIS-WEB
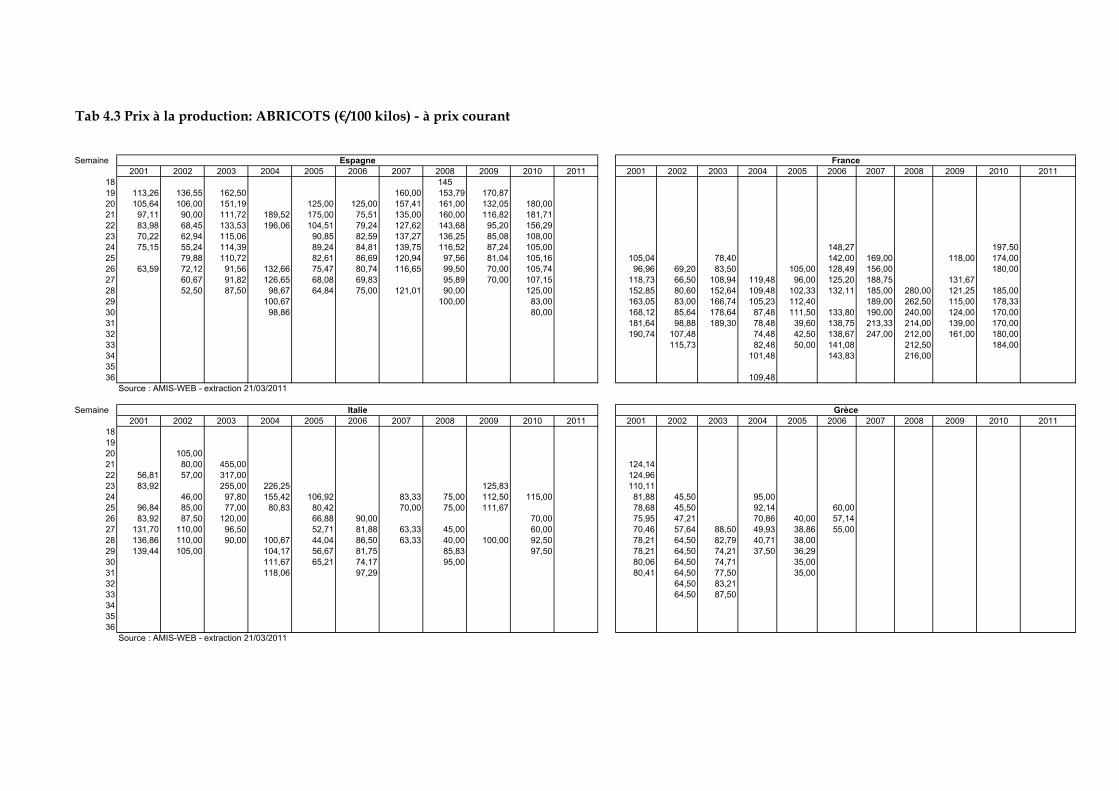
Tab 4.3 Prix à la production: ABRICOTS (€/100 kilos) - à prix courant
Semaine2001 2002 2003 2004 2005 2006 2007 2008 2009 2010 2011 2001 2002 2003 2004 2005 2006 2007 2008 2009 2010 2011
18 14519 113,26 136,55 162,50 160,00 153,79 170,8720 105,64 106,00 151,19 125,00 125,00 157,41 161,00 132,05 180,0021 97,11 90,00 111,72 189,52 175,00 75,51 135,00 160,00 116,82 181,7122 83,98 68,45 133,53 196,06 104,51 79,24 127,62 143,68 95,20 156,2923 70,22 62,94 115,06 90,85 82,59 137,27 136,25 85,08 108,0024 75,15 55,24 114,39 89,24 84,81 139,75 116,52 87,24 105,00 148,27 197,5025 79,88 110,72 82,61 86,69 120,94 97,56 81,04 105,16 105,04 78,40 142,00 169,00 118,00 174,0026 63,59 72,12 91,56 132,66 75,47 80,74 116,65 99,50 70,00 105,74 96,96 69,20 83,50 105,00 128,49 156,00 180,0027 60,67 91,82 126,65 68,08 69,83 95,89 70,00 107,15 118,73 66,50 108,94 119,48 96,00 125,20 188,75 131,6728 52,50 87,50 98,67 64,84 75,00 121,01 90,00 125,00 152,85 80,60 152,64 109,48 102,33 132,11 185,00 280,00 121,25 185,0029 100,67 100,00 83,00 163,05 83,00 166,74 105,23 112,40 189,00 262,50 115,00 178,3330 98,86 80,00 168,12 85,64 178,64 87,48 111,50 133,80 190,00 240,00 124,00 170,0031 181,64 98,88 189,30 78,48 39,60 138,75 213,33 214,00 139,00 170,0032 190,74 107,48 74,48 42,50 138,67 247,00 212,00 161,00 180,0033 115,73 82,48 50,00 141,08 212,50 184,0034 101,48 143,83 216,003536 109,48
Source : AMIS-WEB - extraction 21/03/2011
Semaine2001 2002 2003 2004 2005 2006 2007 2008 2009 2010 2011 2001 2002 2003 2004 2005 2006 2007 2008 2009 2010 2011
181920 105,0021 80,00 455,00 124,1422 56,81 57,00 317,00 124,9623 83,92 255,00 226,25 125,83 110,1124 46,00 97,80 155,42 106,92 83,33 75,00 112,50 115,00 81,88 45,50 95,0025 96,84 85,00 77,00 80,83 80,42 70,00 75,00 111,67 78,68 45,50 92,14 60,0026 83,92 87,50 120,00 66,88 90,00 70,00 75,95 47,21 70,86 40,00 57,1427 131,70 110,00 96,50 52,71 81,88 63,33 45,00 60,00 70,46 57,64 88,50 49,93 38,86 55,0028 136,86 110,00 90,00 100,67 44,04 86,50 63,33 40,00 100,00 92,50 78,21 64,50 82,79 40,71 38,0029 139,44 105,00 104,17 56,67 81,75 85,83 97,50 78,21 64,50 74,21 37,50 36,2930 111,67 65,21 74,17 95,00 80,06 64,50 74,71 35,0031 118,06 97,29 80,41 64,50 77,50 35,0032 64,50 83,2133 64,50 87,50343536
Source : AMIS-WEB - extraction 21/03/2011
Espagne France
Italie Grèce
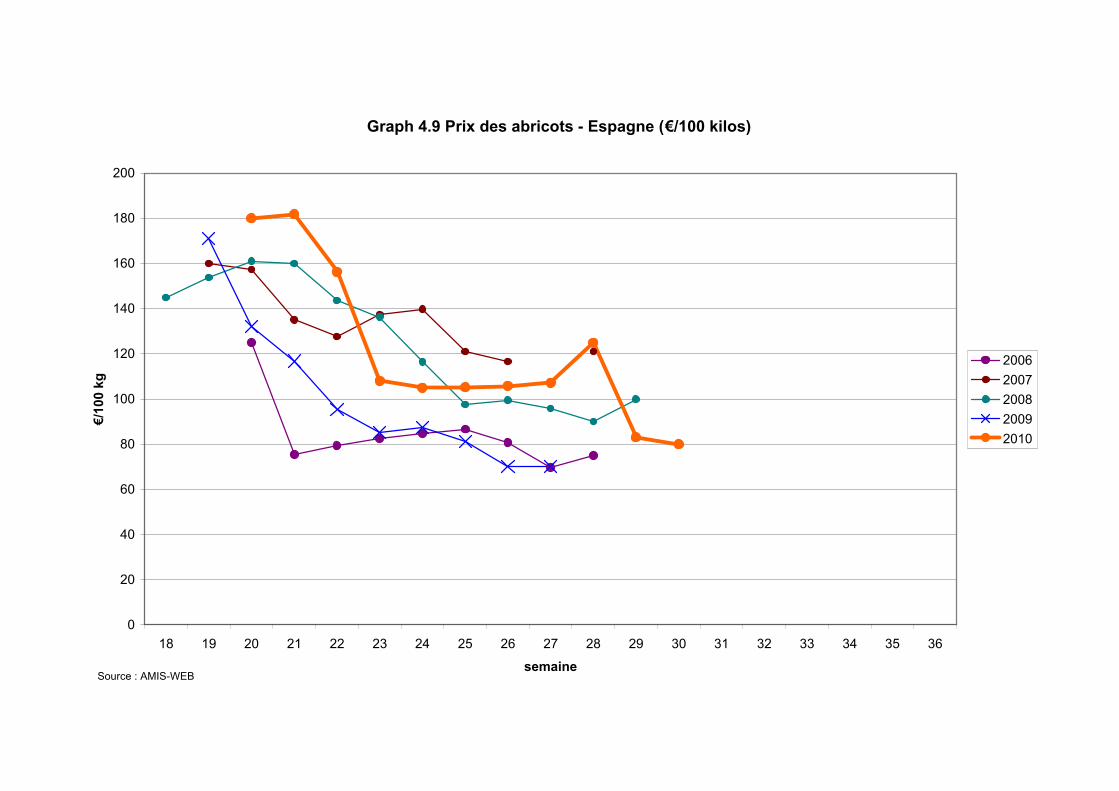
Graph 4.9 Prix des abricots - Espagne (€/100 kilos)
0
20
40
60
80
100
120
140
160
180
200
18 19 20 21 22 23 24 25 26 27 28 29 30 31 32 33 34 35 36
semaine
€/10
0 kg
20062007200820092010
Source : AMIS-WEB

Graph 4.10 Prix des abricots - France (€/100 kilos)
0
20
40
60
80
100
120
140
160
180
200
220
240
260
280
300
18 19 20 21 22 23 24 25 26 27 28 29 30 31 32 33 34 35 36
semaine
€/10
0 kg
20062007200820092010
Source : AMIS-WEB
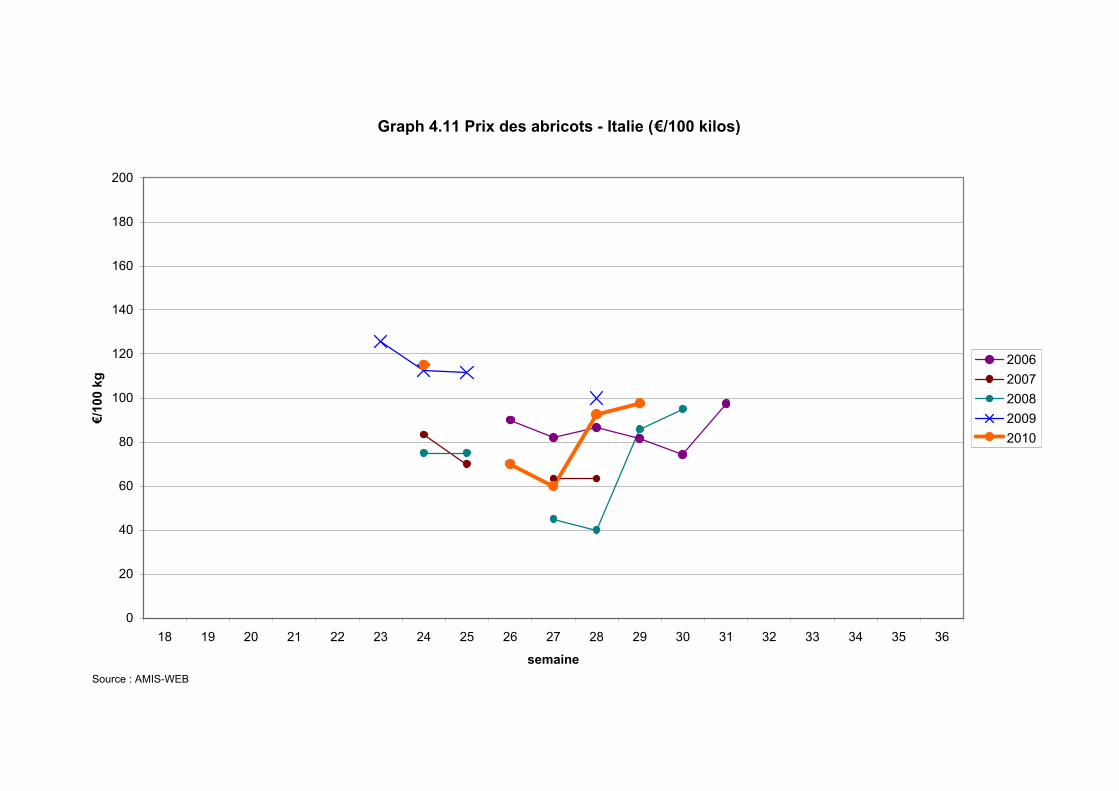
Graph 4.11 Prix des abricots - Italie (€/100 kilos)
0
20
40
60
80
100
120
140
160
180
200
18 19 20 21 22 23 24 25 26 27 28 29 30 31 32 33 34 35 36
semaine
€/10
0 kg
20062007200820092010
Source : AMIS-WEB
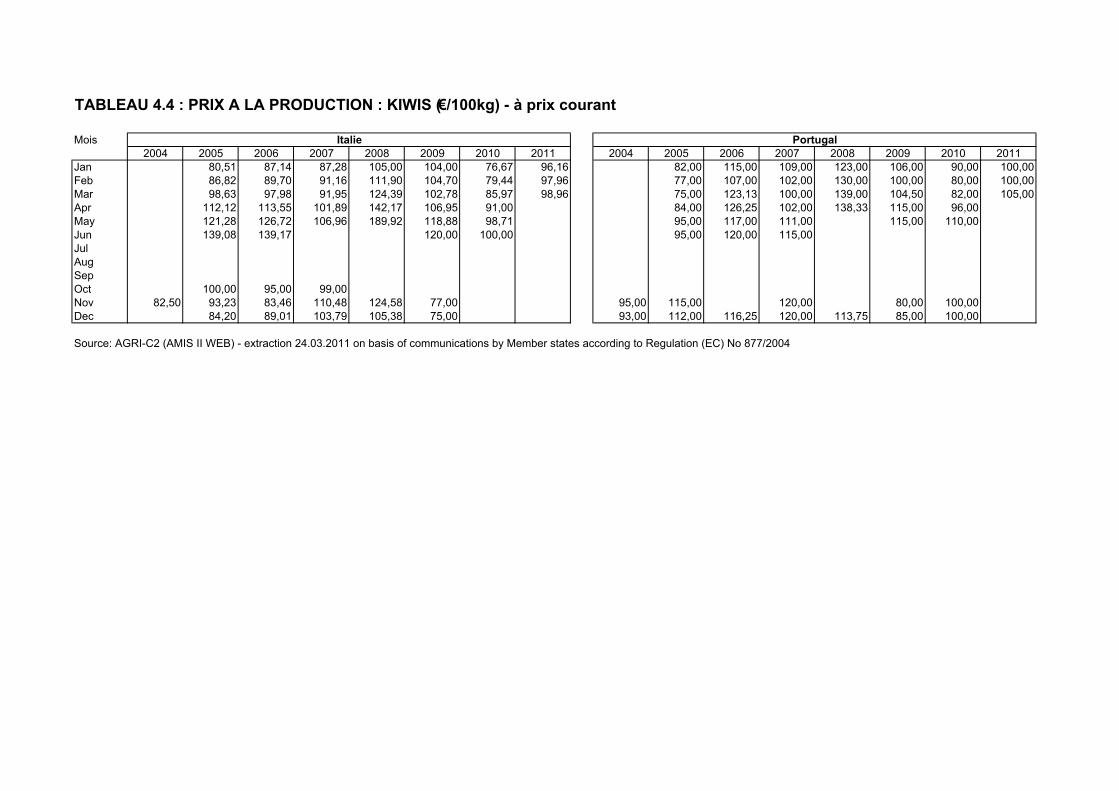
TABLEAU 4.4 : PRIX A LA PRODUCTION : KIWIS (€/100kg) - à prix courant
Mois2004 2005 2006 2007 2008 2009 2010 2011 2004 2005 2006 2007 2008 2009 2010 2011
Jan 80,51 87,14 87,28 105,00 104,00 76,67 96,16 82,00 115,00 109,00 123,00 106,00 90,00 100,00Feb 86,82 89,70 91,16 111,90 104,70 79,44 97,96 77,00 107,00 102,00 130,00 100,00 80,00 100,00Mar 98,63 97,98 91,95 124,39 102,78 85,97 98,96 75,00 123,13 100,00 139,00 104,50 82,00 105,00Apr 112,12 113,55 101,89 142,17 106,95 91,00 84,00 126,25 102,00 138,33 115,00 96,00May 121,28 126,72 106,96 189,92 118,88 98,71 95,00 117,00 111,00 115,00 110,00Jun 139,08 139,17 120,00 100,00 95,00 120,00 115,00JulAugSepOct 100,00 95,00 99,00Nov 82,50 93,23 83,46 110,48 124,58 77,00 95,00 115,00 120,00 80,00 100,00Dec 84,20 89,01 103,79 105,38 75,00 93,00 112,00 116,25 120,00 113,75 85,00 100,00
Source: AGRI-C2 (AMIS II WEB) - extraction 24.03.2011 on basis of communications by Member states according to Regulation (EC) No 877/2004
Italie Portugal

Graph 4.12 Prix des kiwis - Italie (€/100 kilos)
0,00
20,00
40,00
60,00
80,00
100,00
120,00
140,00
160,00
180,00
200,00
Jan Feb Mar Apr May Jun Jul Aug Sep Oct Nov Dec
€/10
0 kg
200620072008200920102011
Source : AMIS-WEB

Graph 4.13 Prix des kiwis - Portugal (€/100 kilos)
0,00
20,00
40,00
60,00
80,00
100,00
120,00
140,00
160,00
180,00
200,00
Jan Feb Mar Apr May Jun Jul Aug Sep Oct Nov Dec
€/10
0 kg
2005200620072008200920102011
Source : AMIS-WEB

Cat. I Cat. I
2007 Huesca LleidaRhône-Médit. Caserta Forli 2008 Huesca Lleida
Rhône-Médit. Caserta Forli
Sem 19 Sem 19Sem 20 Sem 20Sem 21 Sem 21Sem 22 Sem 22 183,00Sem 23 Sem 23 172,60Sem 24 Sem 24 158,40Sem 25 113,00 Sem 25 152,00Sem 26 101,00 90,00 Sem 26 141,40 120,00Sem 27 77,42 95,75 83,33 Sem 27 127,00 56,67 110,00Sem 28 91,20 90,00 Sem 28 122,00 46,00 110,00Sem 29 93,20 100,00 Sem 29 120,50 40,00 120,00Sem 30 63,38 94,00 120,00 Sem 30 119,60 40,00 120,00Sem 31 62,23 102,33 55,00 120,00 Sem 31 124,80Sem 32 109,20 50,00 110,00 Sem 32 130,00Sem 33 120,00 Sem 33 73,90 132,00Sem 34 122,20 Sem 34 67,37 132,40Sem 35 123,00 Sem 35 53,92 133,00 100,00Sem 36 72,18 117,00 80,00 100,00 Sem 36 56,81 132,20 90,00Sem 37 63,38 69,63 115,00 80,00 110,00 Sem 37 53,63 126,80Sem 38 Sem 38 55,95 124,00Sem 39 62,08 65,35 Sem 39 72,90Sem 40 Sem 40 67,99 75,00Sem 41 Sem 41 58,50Sem 42 Sem 42 50,74Sem 43 Sem 43Sem 44 Sem 44 67,28Sem 45 Sem 45 70,20Sem 46 Sem 46Sem 47 Sem 47 78,14Sem 48 Sem 48Sem 49 Sem 49
Saison Ø 62,95 69,36 107,45 66,25 102,59 Saison Ø 62,87 73,95 137,16 45,67 110,00
Tableau 4.5a Prix à la production de pêches blanches dans les principaux marchés européens (€/100 kg)
Tableau 4.5a Prix à la production de pêches blanches dans les principaux marchés européens (€/100 kg)
Source: AMIS-web 03.04.2008 on basis of communications by Member States Source: AMIS-web 09.04.2010 on basis of communications by Member States
Cat. I Cat. I
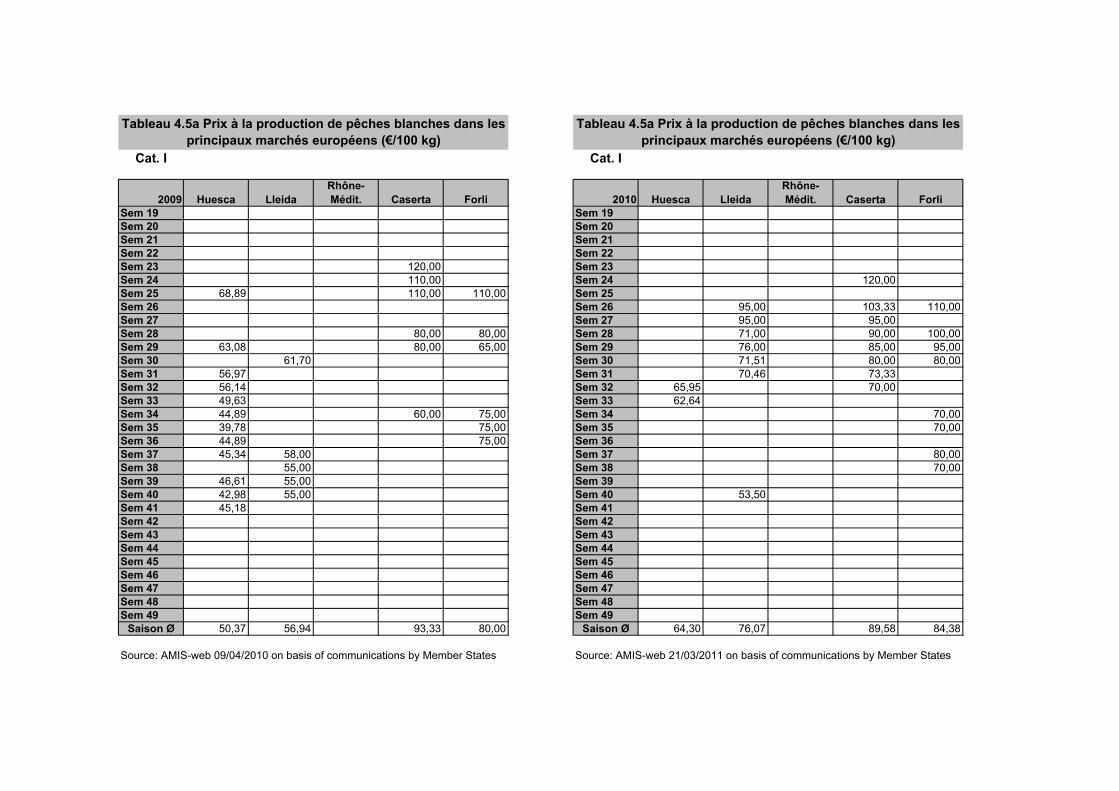
2009 Huesca LleidaRhône-Médit. Caserta Forli 2010 Huesca Lleida
Rhône-Médit. Caserta Forli
Sem 19 Sem 19Sem 20 Sem 20Sem 21 Sem 21Sem 22 Sem 22Sem 23 120,00 Sem 23Sem 24 110,00 Sem 24 120,00Sem 25 68,89 110,00 110,00 Sem 25Sem 26 Sem 26 95,00 103,33 110,00Sem 27 Sem 27 95,00 95,00Sem 28 80,00 80,00 Sem 28 71,00 90,00 100,00Sem 29 63,08 80,00 65,00 Sem 29 76,00 85,00 95,00Sem 30 61,70 Sem 30 71,51 80,00 80,00Sem 31 56,97 Sem 31 70,46 73,33Sem 32 56,14 Sem 32 65,95 70,00Sem 33 49,63 Sem 33 62,64Sem 34 44,89 60,00 75,00 Sem 34 70,00Sem 35 39,78 75,00 Sem 35 70,00Sem 36 44,89 75,00 Sem 36Sem 37 45,34 58,00 Sem 37 80,00Sem 38 55,00 Sem 38 70,00Sem 39 46,61 55,00 Sem 39Sem 40 42,98 55,00 Sem 40 53,50Sem 41 45,18 Sem 41Sem 42 Sem 42Sem 43 Sem 43Sem 44 Sem 44Sem 45 Sem 45Sem 46 Sem 46Sem 47 Sem 47Sem 48 Sem 48Sem 49 Sem 49
Saison Ø 50,37 56,94 93,33 80,00 Saison Ø 64,30 76,07 89,58 84,38
Tableau 4.5a Prix à la production de pêches blanches dans les principaux marchés européens (€/100 kg)
Tableau 4.5a Prix à la production de pêches blanches dans les principaux marchés européens (€/100 kg)
Source: AMIS-web 09/04/2010 on basis of communications by Member States Source: AMIS-web 21/03/2011 on basis of communications by Member States
Cat. I
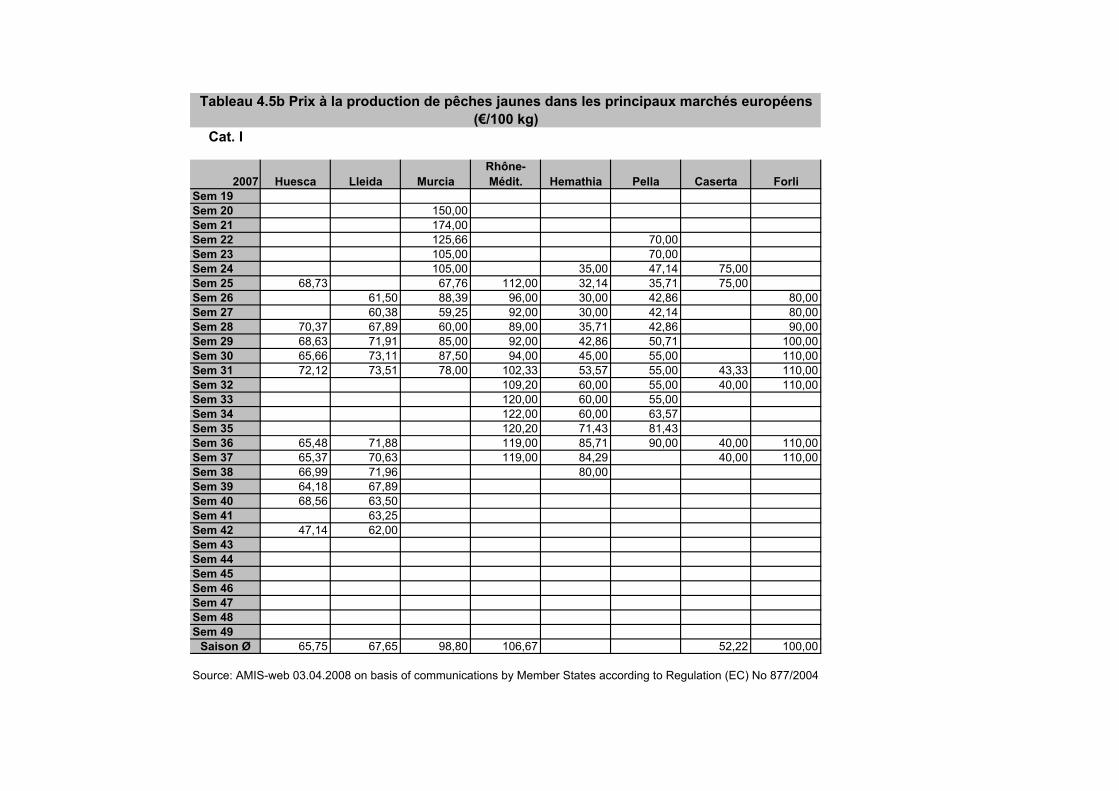
2007 Huesca Lleida MurciaRhône-Médit. Hemathia Pella Caserta Forli
Sem 19Sem 20 150,00Sem 21 174,00Sem 22 125,66 70,00Sem 23 105,00 70,00Sem 24 105,00 35,00 47,14 75,00Sem 25 68,73 67,76 112,00 32,14 35,71 75,00Sem 26 61,50 88,39 96,00 30,00 42,86 80,00Sem 27 60,38 59,25 92,00 30,00 42,14 80,00Sem 28 70,37 67,89 60,00 89,00 35,71 42,86 90,00Sem 29 68,63 71,91 85,00 92,00 42,86 50,71 100,00Sem 30 65,66 73,11 87,50 94,00 45,00 55,00 110,00Sem 31 72,12 73,51 78,00 102,33 53,57 55,00 43,33 110,00Sem 32 109,20 60,00 55,00 40,00 110,00Sem 33 120,00 60,00 55,00Sem 34 122,00 60,00 63,57Sem 35 120,20 71,43 81,43Sem 36 65,48 71,88 119,00 85,71 90,00 40,00 110,00Sem 37 65,37 70,63 119,00 84,29 40,00 110,00Sem 38 66,99 71,96 80,00Sem 39 64,18 67,89Sem 40 68,56 63,50Sem 41 63,25Sem 42 47,14 62,00Sem 43Sem 44Sem 45Sem 46Sem 47Sem 48Sem 49
Saison Ø 65,75 67,65 98,80 106,67 52,22 100,00
Source: AMIS-web 03.04.2008 on basis of communications by Member States according to Regulation (EC) No 877/2004
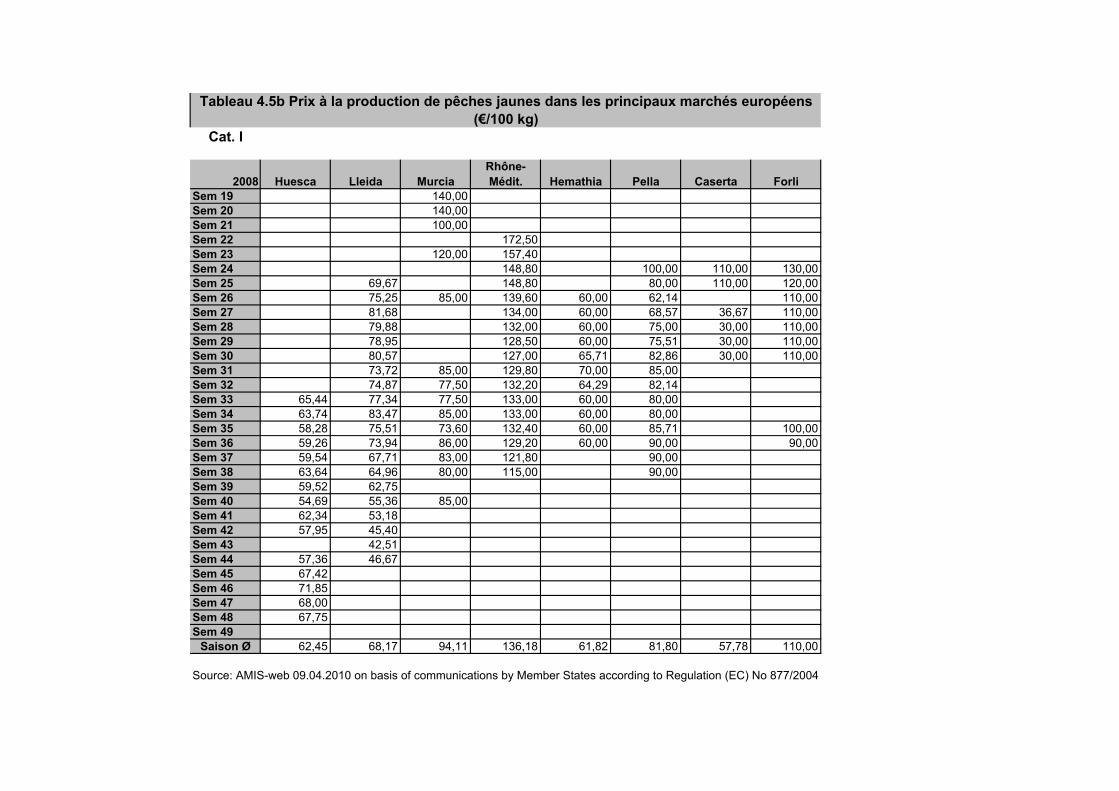
Tableau 4.5b Prix à la production de pêches jaunes dans les principaux marchés européens (€/100 kg)
Cat. I
2008 Huesca Lleida MurciaRhône-Médit. Hemathia Pella Caserta Forli
Sem 19 140,00Sem 20 140,00Sem 21 100,00Sem 22 172,50Sem 23 120,00 157,40Sem 24 148,80 100,00 110,00 130,00Sem 25 69,67 148,80 80,00 110,00 120,00Sem 26 75,25 85,00 139,60 60,00 62,14 110,00Sem 27 81,68 134,00 60,00 68,57 36,67 110,00Sem 28 79,88 132,00 60,00 75,00 30,00 110,00Sem 29 78,95 128,50 60,00 75,51 30,00 110,00Sem 30 80,57 127,00 65,71 82,86 30,00 110,00Sem 31 73,72 85,00 129,80 70,00 85,00Sem 32 74,87 77,50 132,20 64,29 82,14Sem 33 65,44 77,34 77,50 133,00 60,00 80,00Sem 34 63,74 83,47 85,00 133,00 60,00 80,00Sem 35 58,28 75,51 73,60 132,40 60,00 85,71 100,00Sem 36 59,26 73,94 86,00 129,20 60,00 90,00 90,00Sem 37 59,54 67,71 83,00 121,80 90,00Sem 38 63,64 64,96 80,00 115,00 90,00Sem 39 59,52 62,75Sem 40 54,69 55,36 85,00Sem 41 62,34 53,18Sem 42 57,95 45,40Sem 43 42,51Sem 44 57,36 46,67Sem 45 67,42Sem 46 71,85Sem 47 68,00Sem 48 67,75Sem 49
Saison Ø 62,45 68,17 94,11 136,18 61,82 81,80 57,78 110,00
Source: AMIS-web 09.04.2010 on basis of communications by Member States according to Regulation (EC) No 877/2004
Tableau 4.5b Prix à la production de pêches jaunes dans les principaux marchés européens (€/100 kg)
Cat. I
2009 Huesca Lleida MurciaRhône-Médit. Hemathia Pella Caserta Forli
Sem 19Sem 20 120,00Sem 21 120,00Sem 22 93,94Sem 23 90,00 98,33 130,00Sem 24 64,50 90,00 85,00 110,00Sem 25 59,00 64,00 75,00 80,00 110,00Sem 26 69,04 75,00Sem 27 68,85 75,22Sem 28 70,65 75,12 60,00 80,00Sem 29 59,22 69,29 80,00 60,00 65,00Sem 30 64,75 70,66Sem 31 63,78 52,61 56,72Sem 32 57,23 55,97 55,69Sem 33 52,21 50,94 55,69Sem 34 47,45 52,57 80,00 40,00 75,00Sem 35 42,99 51,79 80,00 40,00 75,00Sem 36 46,57 47,74 63,37 40,00 75,00Sem 37 46,19 50,05 40,00 80,00Sem 38 49,21 40,00 80,00Sem 39 46,55 47,63Sem 40 47,17 48,61Sem 41 47,93 48,10Sem 42 54,73 54,80Sem 43 55,14 56,80Sem 44 53,57 56,80Sem 45 53,85 56,80Sem 46 57,90Sem 47 59,59Sem 48Sem 49
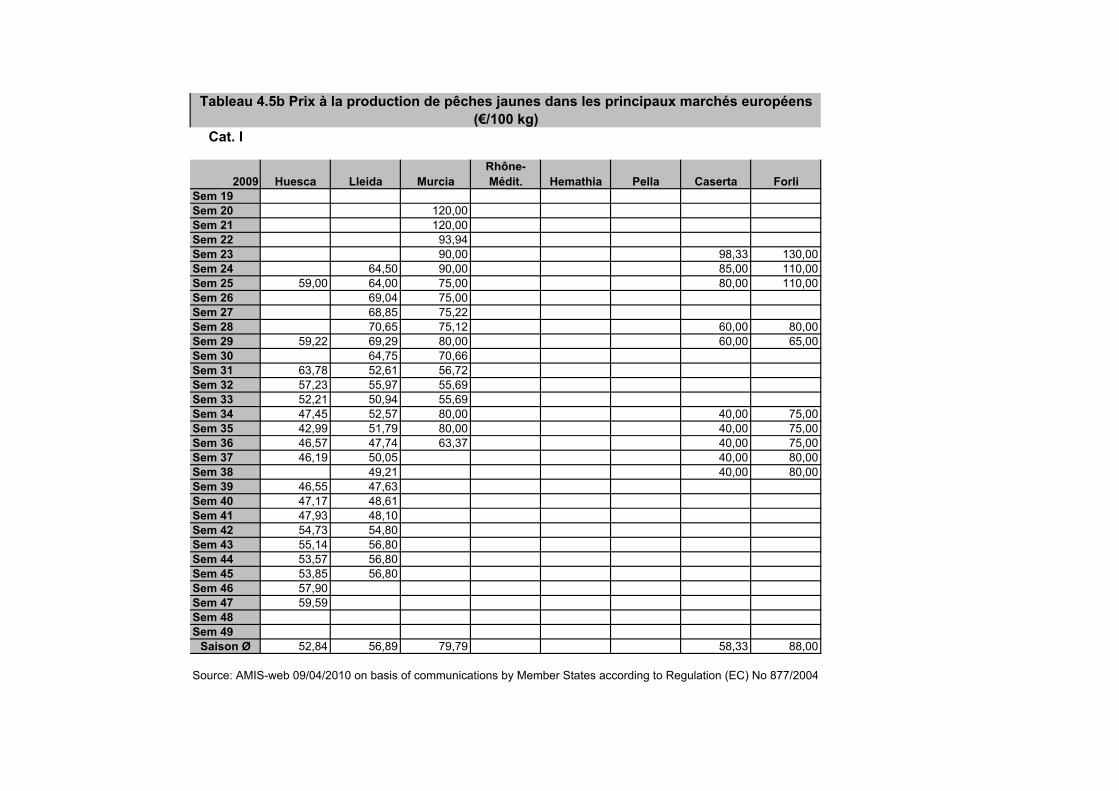
Saison Ø 52,84 56,89 79,79 58,33 88,00
Source: AMIS-web 09/04/2010 on basis of communications by Member States according to Regulation (EC) No 877/2004
Tableau 4.5b Prix à la production de pêches jaunes dans les principaux marchés européens (€/100 kg)
2010 Huesca Lleida MurciaRhône-Médit. Hemathia Pella Caserta Forli
Sem 19Sem 20Sem 21 170,00Sem 22 149,20Sem 23 121,66 163,33 110,00Sem 24 100,11Sem 25 71,86 82,03 110,00Sem 26 76,45 75,00 81,67Sem 27 77,32 75,00 56,67 100,00Sem 28 63,82 86,36 50,00 85,00Sem 29 67,59 86,36 50,00 80,00Sem 30 67,34 70,18 70,00 46,67Sem 31 63,20 67,06 70,00 40,00Sem 32 62,64 66,31 65,00 40,00Sem 33 60,80 61,42 68,00 70,00Sem 34 59,72 58,61 70,00 40,00 70,00Sem 35 53,01 54,98 72,73Sem 36 55,34 57,07 70,00 40,00 80,00Sem 37 56,81 53,35 77,50 70,00Sem 38 56,93 51,22 60,00Sem 39 53,25 48,12 60,00Sem 40 48,83 46,07Sem 41 44,39 38,10Sem 42 44,38 36,44Sem 43 44,25 39,03Sem 44 50,32Sem 45Sem 46Sem 47Sem 48Sem 49
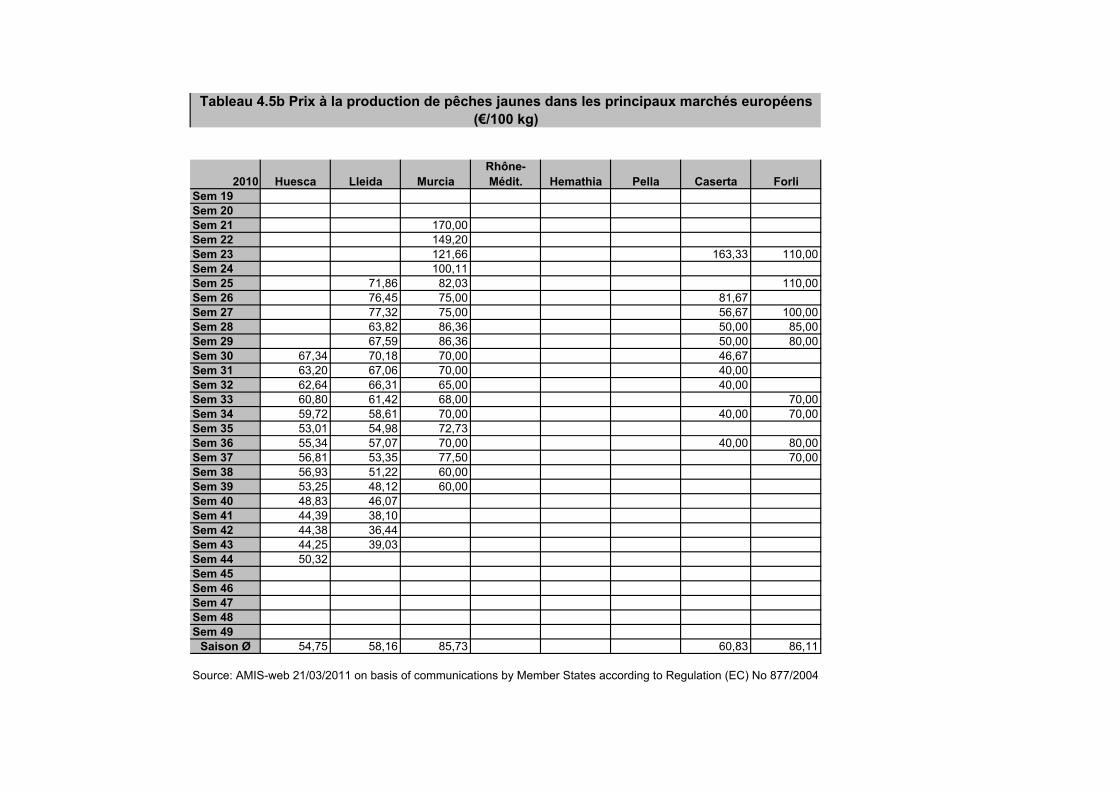
Saison Ø 54,75 58,16 85,73 60,83 86,11
Source: AMIS-web 21/03/2011 on basis of communications by Member States according to Regulation (EC) No 877/2004
Tableau 4.5b Prix à la production de pêches jaunes dans les principaux marchés européens (€/100 kg)

Cat. I Cat. I
2007 Lleida ZaragozaRhône-Médit. Forli Ravenna 2008 Lleida Zaragoza
Rhône-Médit. Forli Ravenna
Sem 19 Sem 19Sem 20 Sem 20Sem 21 Sem 21Sem 22 Sem 22 183,50Sem 23 Sem 23 180,20Sem 24 Sem 24 180,60Sem 25 140,00 Sem 25 71,00 172,80Sem 26 115,33 110,00 96,67 Sem 26 69,24 164,00 130,00 85,00Sem 27 58,74 58,50 108,25 90,00 74,17 Sem 27 87,69 150,20 120,00 87,50Sem 28 60,71 62,77 97,80 80,00 71,67 Sem 28 82,33 148,00 110,00 89,00Sem 29 63,56 60,57 96,00 100,00 77,50 Sem 29 76,60 133,25 120,00 94,17Sem 30 62,19 63,38 95,50 110,00 83,33 Sem 30 78,10 125,40 120,00 95,83Sem 31 70,61 67,24 102,67 100,00 80,00 Sem 31 80,14 127,80Sem 32 108,60 100,00 78,33 Sem 32 73,16 132,40Sem 33 118,50 Sem 33 74,99 70,31 133,00Sem 34 120,00 Sem 34 69,50 62,77 131,60Sem 35 120,80 Sem 35 94,50 62,26 132,00 100,00 79,17Sem 36 73,16 121,00 Sem 36 93,14 53,64 132,00 90,00 71,67Sem 37 73,93 121,00 Sem 37 86,09 130,60 69,17Sem 38 73,73 Sem 38 78,30 128,33 66,67Sem 39 64,20 60,67 Sem 39 69,50Sem 40 67,33 Sem 40 65,06Sem 41 79,90 Sem 41 69,20Sem 42 79,20 Sem 42 52,02Sem 43 Sem 43Sem 44 Sem 44 76,08Sem 45 Sem 45Sem 46 Sem 46Sem 47 Sem 47Sem 48 Sem 48Sem 49 Sem 49
Saison Ø 68,94 62,19 112,73 98,57 80,24 Saison Ø 77,56 62,85 146,22 112,86 82,02
Source: AMIS-web 09/04/2010 on basis of communications by Member States Source: AMIS-web 03.04.2008 on basis of communications by Member States
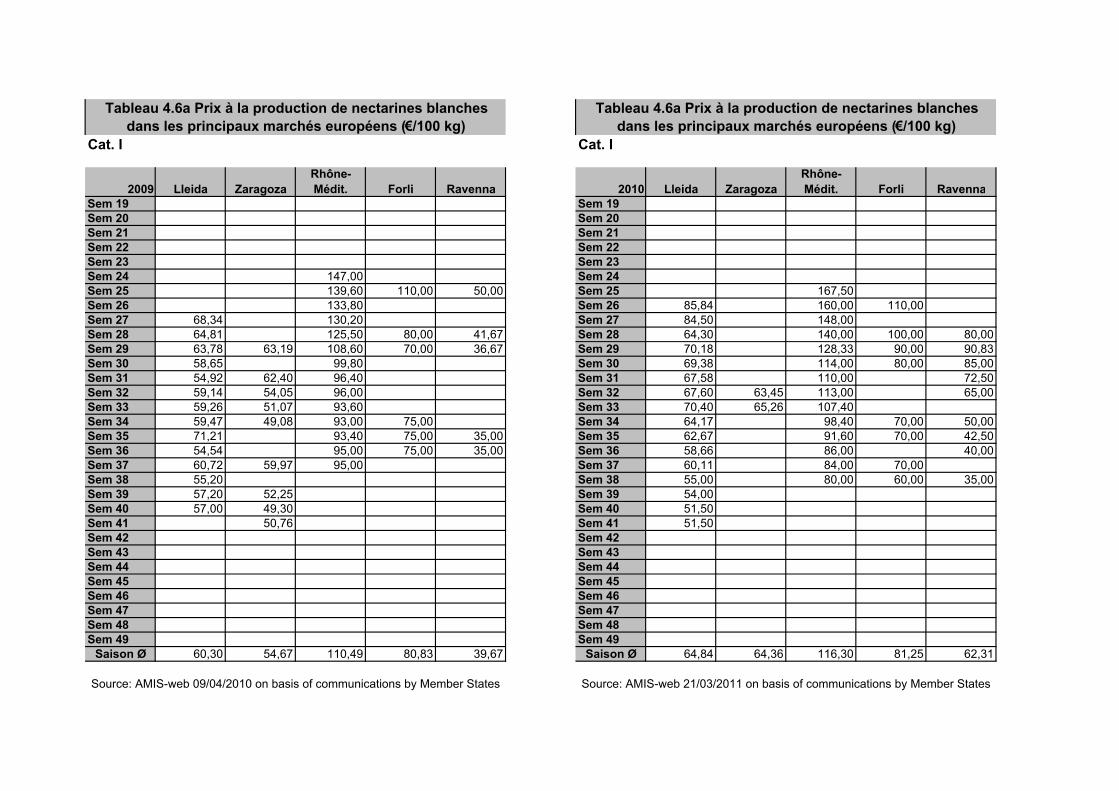
Tableau 4.6a Prix à la production de nectarines blanches dans les principaux marchés européens (€/100 kg)
Tableau 4.6a Prix à la production de nectarines blanches dans les principaux marchés européens (€/100 kg)
Cat. I Cat. I
2009 Lleida ZaragozaRhône-Médit. Forli Ravenna 2010 Lleida Zaragoza
Rhône-Médit. Forli Ravenna
Sem 19 Sem 19Sem 20 Sem 20Sem 21 Sem 21Sem 22 Sem 22Sem 23 Sem 23Sem 24 147,00 Sem 24Sem 25 139,60 110,00 50,00 Sem 25 167,50Sem 26 133,80 Sem 26 85,84 160,00 110,00Sem 27 68,34 130,20 Sem 27 84,50 148,00Sem 28 64,81 125,50 80,00 41,67 Sem 28 64,30 140,00 100,00 80,00Sem 29 63,78 63,19 108,60 70,00 36,67 Sem 29 70,18 128,33 90,00 90,83Sem 30 58,65 99,80 Sem 30 69,38 114,00 80,00 85,00Sem 31 54,92 62,40 96,40 Sem 31 67,58 110,00 72,50Sem 32 59,14 54,05 96,00 Sem 32 67,60 63,45 113,00 65,00Sem 33 59,26 51,07 93,60 Sem 33 70,40 65,26 107,40Sem 34 59,47 49,08 93,00 75,00 Sem 34 64,17 98,40 70,00 50,00Sem 35 71,21 93,40 75,00 35,00 Sem 35 62,67 91,60 70,00 42,50Sem 36 54,54 95,00 75,00 35,00 Sem 36 58,66 86,00 40,00Sem 37 60,72 59,97 95,00 Sem 37 60,11 84,00 70,00Sem 38 55,20 Sem 38 55,00 80,00 60,00 35,00Sem 39 57,20 52,25 Sem 39 54,00Sem 40 57,00 49,30 Sem 40 51,50Sem 41 50,76 Sem 41 51,50Sem 42 Sem 42Sem 43 Sem 43Sem 44 Sem 44Sem 45 Sem 45Sem 46 Sem 46Sem 47 Sem 47Sem 48 Sem 48Sem 49 Sem 49
Saison Ø 60,30 54,67 110,49 80,83 39,67 Saison Ø 64,84 64,36 116,30 81,25 62,31
Source: AMIS-web 09/04/2010 on basis of communications by Member States Source: AMIS-web 21/03/2011 on basis of communications by Member States
Tableau 4.6a Prix à la production de nectarines blanches dans les principaux marchés européens (€/100 kg)
Tableau 4.6a Prix à la production de nectarines blanches dans les principaux marchés européens (€/100 kg)
Cat. I
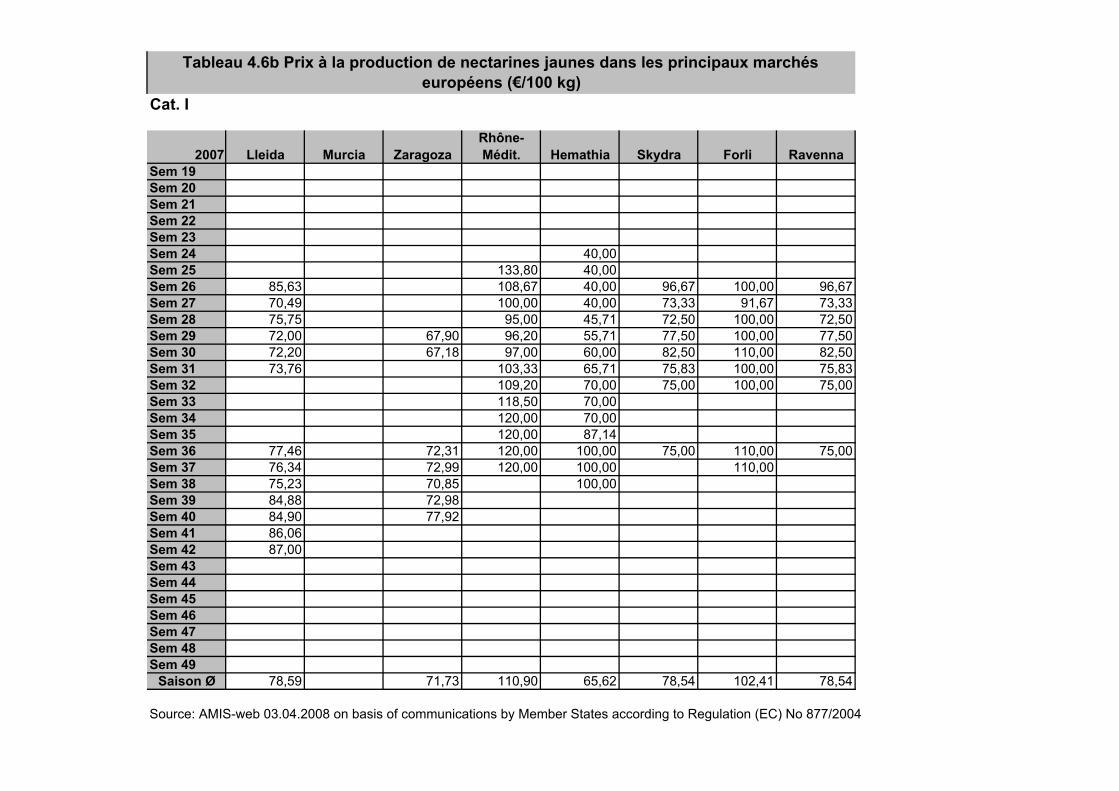
2007 Lleida Murcia ZaragozaRhône-Médit. Hemathia Skydra Forli Ravenna
Sem 19Sem 20Sem 21Sem 22Sem 23Sem 24 40,00Sem 25 133,80 40,00Sem 26 85,63 108,67 40,00 96,67 100,00 96,67Sem 27 70,49 100,00 40,00 73,33 91,67 73,33Sem 28 75,75 95,00 45,71 72,50 100,00 72,50Sem 29 72,00 67,90 96,20 55,71 77,50 100,00 77,50Sem 30 72,20 67,18 97,00 60,00 82,50 110,00 82,50Sem 31 73,76 103,33 65,71 75,83 100,00 75,83Sem 32 109,20 70,00 75,00 100,00 75,00Sem 33 118,50 70,00Sem 34 120,00 70,00Sem 35 120,00 87,14Sem 36 77,46 72,31 120,00 100,00 75,00 110,00 75,00Sem 37 76,34 72,99 120,00 100,00 110,00Sem 38 75,23 70,85 100,00Sem 39 84,88 72,98Sem 40 84,90 77,92Sem 41 86,06Sem 42 87,00Sem 43Sem 44Sem 45Sem 46Sem 47Sem 48Sem 49
Saison Ø 78,59 71,73 110,90 65,62 78,54 102,41 78,54
Source: AMIS-web 03.04.2008 on basis of communications by Member States according to Regulation (EC) No 877/2004
Tableau 4.6b Prix à la production de nectarines jaunes dans les principaux marchés européens (€/100 kg)
Cat. I
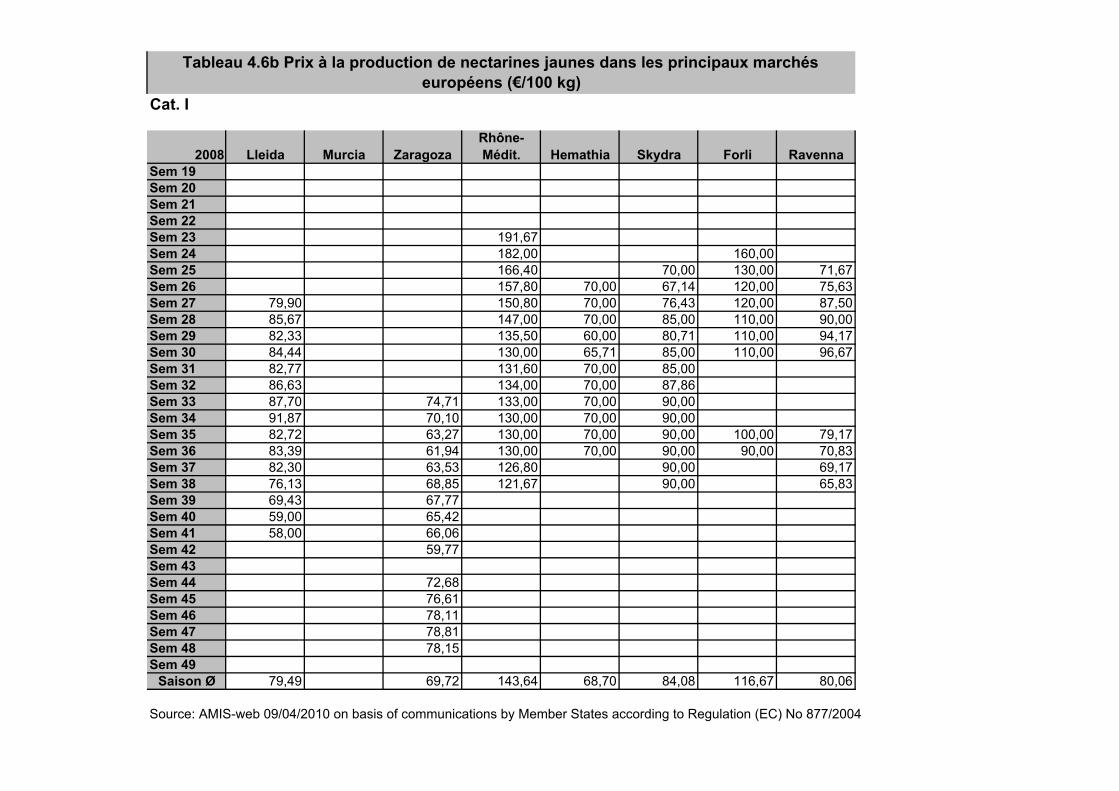
2008 Lleida Murcia ZaragozaRhône-Médit. Hemathia Skydra Forli Ravenna
Sem 19Sem 20Sem 21Sem 22Sem 23 191,67Sem 24 182,00 160,00Sem 25 166,40 70,00 130,00 71,67Sem 26 157,80 70,00 67,14 120,00 75,63Sem 27 79,90 150,80 70,00 76,43 120,00 87,50Sem 28 85,67 147,00 70,00 85,00 110,00 90,00Sem 29 82,33 135,50 60,00 80,71 110,00 94,17Sem 30 84,44 130,00 65,71 85,00 110,00 96,67Sem 31 82,77 131,60 70,00 85,00Sem 32 86,63 134,00 70,00 87,86Sem 33 87,70 74,71 133,00 70,00 90,00Sem 34 91,87 70,10 130,00 70,00 90,00Sem 35 82,72 63,27 130,00 70,00 90,00 100,00 79,17Sem 36 83,39 61,94 130,00 70,00 90,00 90,00 70,83Sem 37 82,30 63,53 126,80 90,00 69,17Sem 38 76,13 68,85 121,67 90,00 65,83Sem 39 69,43 67,77Sem 40 59,00 65,42Sem 41 58,00 66,06Sem 42 59,77Sem 43Sem 44 72,68Sem 45 76,61Sem 46 78,11Sem 47 78,81Sem 48 78,15Sem 49
Saison Ø 79,49 69,72 143,64 68,70 84,08 116,67 80,06
Source: AMIS-web 09/04/2010 on basis of communications by Member States according to Regulation (EC) No 877/2004
Tableau 4.6b Prix à la production de nectarines jaunes dans les principaux marchés européens (€/100 kg)
Cat. I
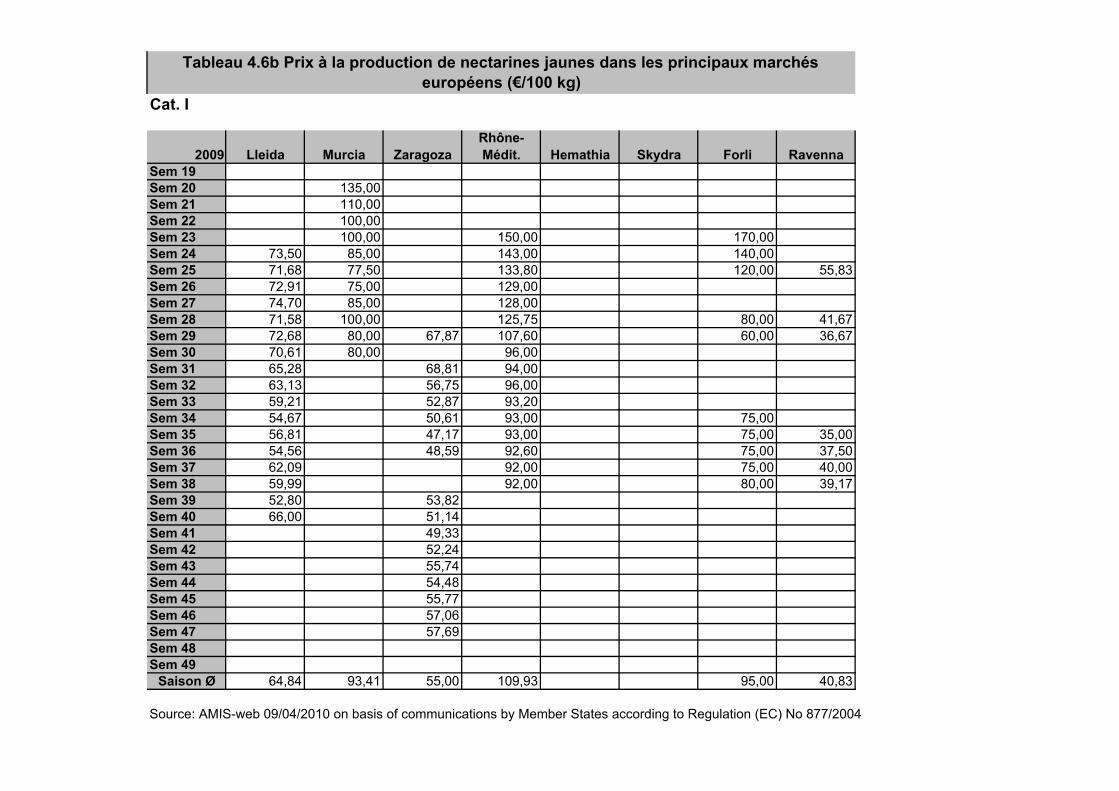
2009 Lleida Murcia ZaragozaRhône-Médit. Hemathia Skydra Forli Ravenna
Sem 19Sem 20 135,00Sem 21 110,00Sem 22 100,00Sem 23 100,00 150,00 170,00Sem 24 73,50 85,00 143,00 140,00Sem 25 71,68 77,50 133,80 120,00 55,83Sem 26 72,91 75,00 129,00Sem 27 74,70 85,00 128,00Sem 28 71,58 100,00 125,75 80,00 41,67Sem 29 72,68 80,00 67,87 107,60 60,00 36,67Sem 30 70,61 80,00 96,00Sem 31 65,28 68,81 94,00Sem 32 63,13 56,75 96,00Sem 33 59,21 52,87 93,20Sem 34 54,67 50,61 93,00 75,00Sem 35 56,81 47,17 93,00 75,00 35,00Sem 36 54,56 48,59 92,60 75,00 37,50Sem 37 62,09 92,00 75,00 40,00Sem 38 59,99 92,00 80,00 39,17Sem 39 52,80 53,82Sem 40 66,00 51,14Sem 41 49,33Sem 42 52,24Sem 43 55,74Sem 44 54,48Sem 45 55,77Sem 46 57,06Sem 47 57,69Sem 48Sem 49
Saison Ø 64,84 93,41 55,00 109,93 95,00 40,83
Source: AMIS-web 09/04/2010 on basis of communications by Member States according to Regulation (EC) No 877/2004
Tableau 4.6b Prix à la production de nectarines jaunes dans les principaux marchés européens (€/100 kg)
Cat. I
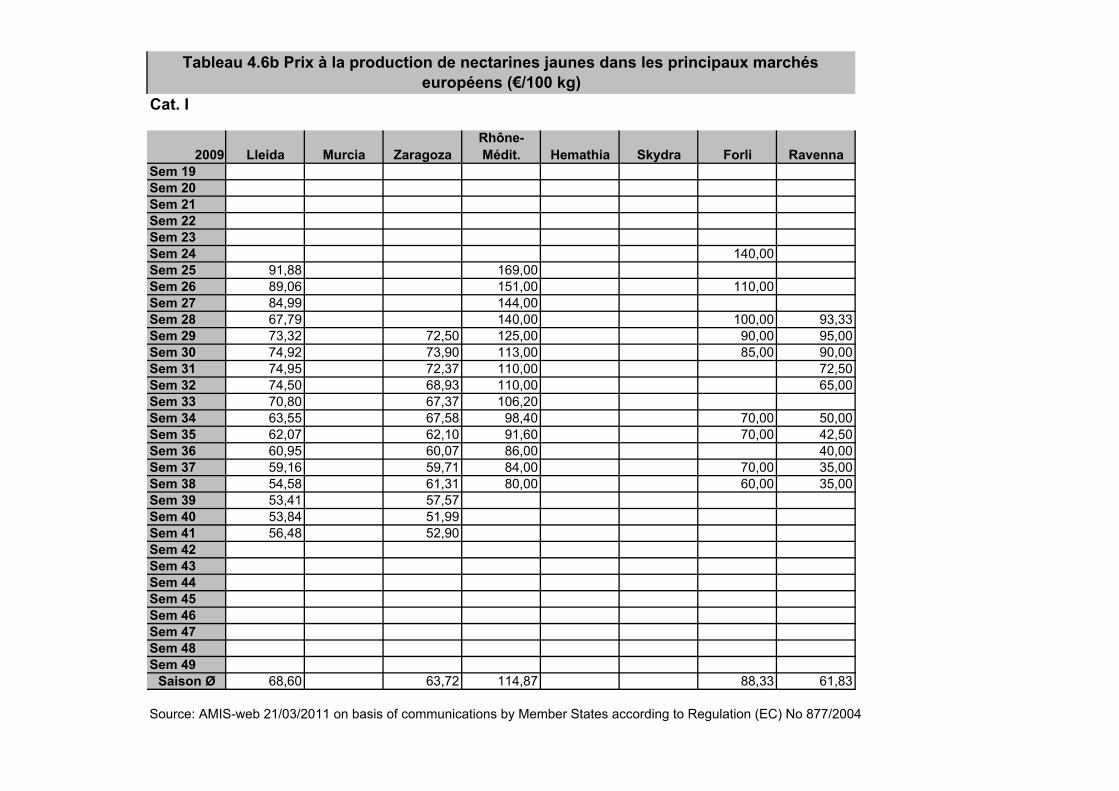
2009 Lleida Murcia ZaragozaRhône-Médit. Hemathia Skydra Forli Ravenna
Sem 19Sem 20Sem 21Sem 22Sem 23Sem 24 140,00Sem 25 91,88 169,00Sem 26 89,06 151,00 110,00Sem 27 84,99 144,00Sem 28 67,79 140,00 100,00 93,33Sem 29 73,32 72,50 125,00 90,00 95,00Sem 30 74,92 73,90 113,00 85,00 90,00Sem 31 74,95 72,37 110,00 72,50Sem 32 74,50 68,93 110,00 65,00Sem 33 70,80 67,37 106,20Sem 34 63,55 67,58 98,40 70,00 50,00Sem 35 62,07 62,10 91,60 70,00 42,50Sem 36 60,95 60,07 86,00 40,00Sem 37 59,16 59,71 84,00 70,00 35,00Sem 38 54,58 61,31 80,00 60,00 35,00Sem 39 53,41 57,57Sem 40 53,84 51,99Sem 41 56,48 52,90Sem 42Sem 43Sem 44Sem 45Sem 46Sem 47Sem 48Sem 49
Saison Ø 68,60 63,72 114,87 88,33 61,83
Source: AMIS-web 21/03/2011 on basis of communications by Member States according to Regulation (EC) No 877/2004
Tableau 4.6b Prix à la production de nectarines jaunes dans les principaux marchés européens (€/100 kg)
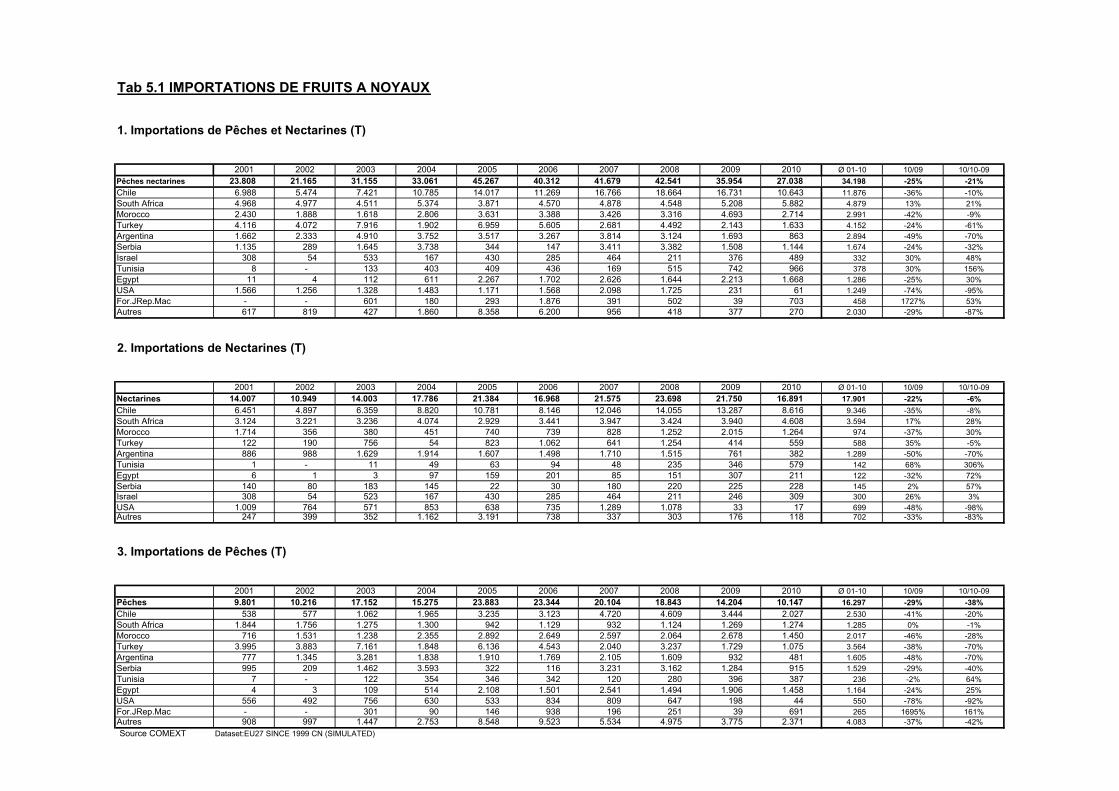
Tab 5.1 IMPORTATIONS DE FRUITS A NOYAUX
1. Importations de Pêches et Nectarines (T)
2001 2002 2003 2004 2005 2006 2007 2008 2009 2010 Ø 01-10 10/09 10/10-09Pêches nectarines 23.808 21.165 31.155 33.061 45.267 40.312 41.679 42.541 35.954 27.038 34.198 -25% -21%Chile 6.988 5.474 7.421 10.785 14.017 11.269 16.766 18.664 16.731 10.643 11.876 -36% -10%South Africa 4.968 4.977 4.511 5.374 3.871 4.570 4.878 4.548 5.208 5.882 4.879 13% 21%Morocco 2.430 1.888 1.618 2.806 3.631 3.388 3.426 3.316 4.693 2.714 2.991 -42% -9%Turkey 4.116 4.072 7.916 1.902 6.959 5.605 2.681 4.492 2.143 1.633 4.152 -24% -61%Argentina 1.662 2.333 4.910 3.752 3.517 3.267 3.814 3.124 1.693 863 2.894 -49% -70%Serbia 1.135 289 1.645 3.738 344 147 3.411 3.382 1.508 1.144 1.674 -24% -32%Israel 308 54 533 167 430 285 464 211 376 489 332 30% 48%Tunisia 8 - 133 403 409 436 169 515 742 966 378 30% 156%Egypt 11 4 112 611 2.267 1.702 2.626 1.644 2.213 1.668 1.286 -25% 30%USA 1.566 1.256 1.328 1.483 1.171 1.568 2.098 1.725 231 61 1.249 -74% -95%For.JRep.Mac - - 601 180 293 1.876 391 502 39 703 458 1727% 53%Autres 617 819 427 1.860 8.358 6.200 956 418 377 270 2.030 -29% -87%
2. Importations de Nectarines (T)
2001 2002 2003 2004 2005 2006 2007 2008 2009 2010 Ø 01-10 10/09 10/10-09Nectarines 14.007 10.949 14.003 17.786 21.384 16.968 21.575 23.698 21.750 16.891 17.901 -22% -6%Chile 6.451 4.897 6.359 8.820 10.781 8.146 12.046 14.055 13.287 8.616 9.346 -35% -8%South Africa 3.124 3.221 3.236 4.074 2.929 3.441 3.947 3.424 3.940 4.608 3.594 17% 28%Morocco 1.714 356 380 451 740 739 828 1.252 2.015 1.264 974 -37% 30%Turkey 122 190 756 54 823 1.062 641 1.254 414 559 588 35% -5%Argentina 886 988 1.629 1.914 1.607 1.498 1.710 1.515 761 382 1.289 -50% -70%Tunisia 1 - 11 49 63 94 48 235 346 579 142 68% 306%Egypt 6 1 3 97 159 201 85 151 307 211 122 -32% 72%Serbia 140 80 183 145 22 30 180 220 225 228 145 2% 57%Israel 308 54 523 167 430 285 464 211 246 309 300 26% 3%USA 1.009 764 571 853 638 735 1.289 1.078 33 17 699 -48% -98%Autres 247 399 352 1.162 3.191 738 337 303 176 118 702 -33% -83%
3. Importations de Pêches (T)
2001 2002 2003 2004 2005 2006 2007 2008 2009 2010 Ø 01-10 10/09 10/10-09Pêches 9.801 10.216 17.152 15.275 23.883 23.344 20.104 18.843 14.204 10.147 16.297 -29% -38%Chile 538 577 1.062 1.965 3.235 3.123 4.720 4.609 3.444 2.027 2.530 -41% -20%South Africa 1.844 1.756 1.275 1.300 942 1.129 932 1.124 1.269 1.274 1.285 0% -1%Morocco 716 1.531 1.238 2.355 2.892 2.649 2.597 2.064 2.678 1.450 2.017 -46% -28%Turkey 3.995 3.883 7.161 1.848 6.136 4.543 2.040 3.237 1.729 1.075 3.564 -38% -70%Argentina 777 1.345 3.281 1.838 1.910 1.769 2.105 1.609 932 481 1.605 -48% -70%Serbia 995 209 1.462 3.593 322 116 3.231 3.162 1.284 915 1.529 -29% -40%Tunisia 7 - 122 354 346 342 120 280 396 387 236 -2% 64%Egypt 4 3 109 514 2.108 1.501 2.541 1.494 1.906 1.458 1.164 -24% 25%USA 556 492 756 630 533 834 809 647 198 44 550 -78% -92%For.JRep.Mac - - 301 90 146 938 196 251 39 691 265 1695% 161%Autres 908 997 1.447 2.753 8.548 9.523 5.534 4.975 3.775 2.371 4.083 -37% -42%Source COMEXT Dataset:EU27 SINCE 1999 CN (SIMULATED)
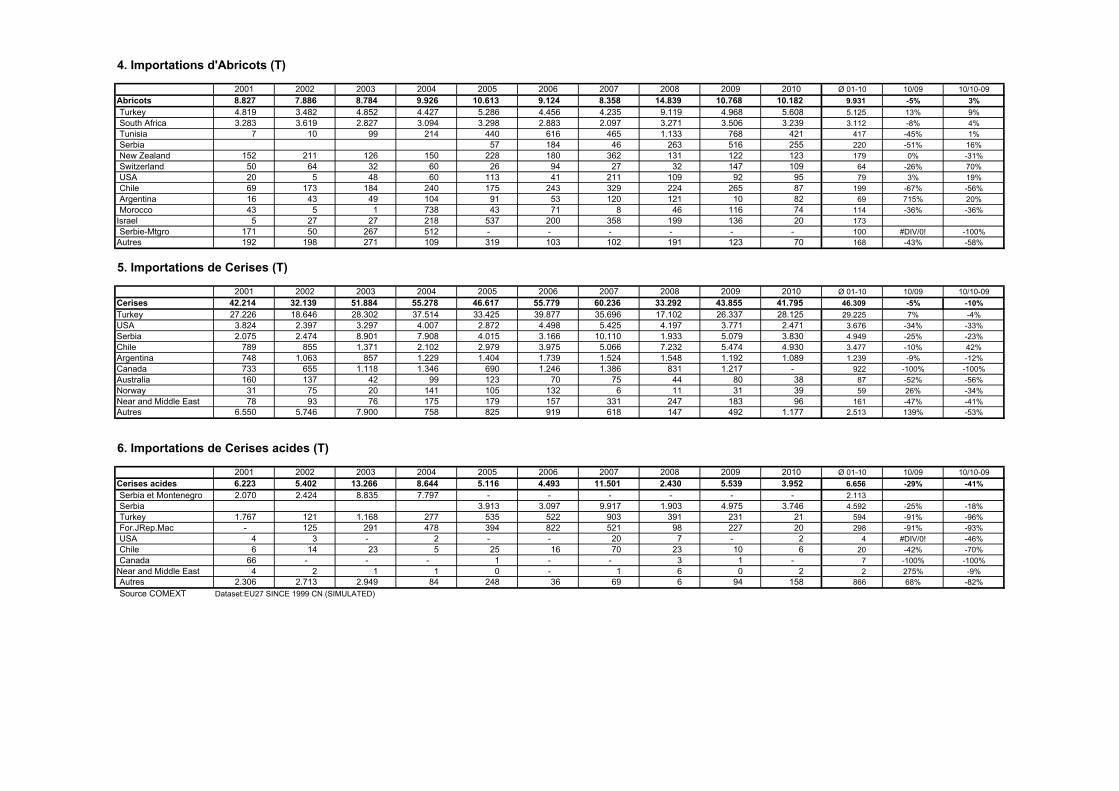
4. Importations d'Abricots (T)
2001 2002 2003 2004 2005 2006 2007 2008 2009 2010 Ø 01-10 10/09 10/10-09Abricots 8.827 7.886 8.784 9.926 10.613 9.124 8.358 14.839 10.768 10.182 9.931 -5% 3%Turkey 4.819 3.482 4.852 4.427 5.286 4.456 4.235 9.119 4.968 5.608 5.125 13% 9%South Africa 3.283 3.619 2.827 3.094 3.298 2.883 2.097 3.271 3.506 3.239 3.112 -8% 4%Tunisia 7 10 99 214 440 616 465 1.133 768 421 417 -45% 1%Serbia 57 184 46 263 516 255 220 -51% 16%New Zealand 152 211 126 150 228 180 362 131 122 123 179 0% -31%Switzerland 50 64 32 60 26 94 27 32 147 109 64 -26% 70%USA 20 5 48 60 113 41 211 109 92 95 79 3% 19%Chile 69 173 184 240 175 243 329 224 265 87 199 -67% -56%Argentina 16 43 49 104 91 53 120 121 10 82 69 715% 20%Morocco 43 5 1 738 43 71 8 46 116 74 114 -36% -36%
Israel 5 27 27 218 537 200 358 199 136 20 173 Serbie-Mtgro 171 50 267 512 - - - - - - 100 #DIV/0! -100%
Autres 192 198 271 109 319 103 102 191 123 70 168 -43% -58%
5. Importations de Cerises (T)
2001 2002 2003 2004 2005 2006 2007 2008 2009 2010 Ø 01-10 10/09 10/10-09Cerises 42.214 32.139 51.884 55.278 46.617 55.779 60.236 33.292 43.855 41.795 46.309 -5% -10%Turkey 27.226 18.646 28.302 37.514 33.425 39.877 35.696 17.102 26.337 28.125 29.225 7% -4%USA 3.824 2.397 3.297 4.007 2.872 4.498 5.425 4.197 3.771 2.471 3.676 -34% -33%Serbia 2.075 2.474 8.901 7.908 4.015 3.166 10.110 1.933 5.079 3.830 4.949 -25% -23%Chile 789 855 1.371 2.102 2.979 3.975 5.066 7.232 5.474 4.930 3.477 -10% 42%Argentina 748 1.063 857 1.229 1.404 1.739 1.524 1.548 1.192 1.089 1.239 -9% -12%Canada 733 655 1.118 1.346 690 1.246 1.386 831 1.217 - 922 -100% -100%Australia 160 137 42 99 123 70 75 44 80 38 87 -52% -56%Norway 31 75 20 141 105 132 6 11 31 39 59 26% -34%Near and Middle East 78 93 76 175 179 157 331 247 183 96 161 -47% -41%Autres 6.550 5.746 7.900 758 825 919 618 147 492 1.177 2.513 139% -53%
6. Importations de Cerises acides (T)
2001 2002 2003 2004 2005 2006 2007 2008 2009 2010 Ø 01-10 10/09 10/10-09Cerises acides 6.223 5.402 13.266 8.644 5.116 4.493 11.501 2.430 5.539 3.952 6.656 -29% -41%Serbia et Montenegro 2.070 2.424 8.835 7.797 - - - - - - 2.113 Serbia 3.913 3.097 9.917 1.903 4.975 3.746 4.592 -25% -18%Turkey 1.767 121 1.168 277 535 522 903 391 231 21 594 -91% -96%For.JRep.Mac - 125 291 478 394 822 521 98 227 20 298 -91% -93%USA 4 3 - 2 - - 20 7 - 2 4 #DIV/0! -46%Chile 6 14 23 5 25 16 70 23 10 6 20 -42% -70%Canada 66 - - - 1 - - 3 1 - 7 -100% -100%
Near and Middle East 4 2 1 1 0 - 1 6 0 2 2 275% -9%Autres 2.306 2.713 2.949 84 248 36 69 6 94 158 866 68% -82%Source COMEXT Dataset:EU27 SINCE 1999 CN (SIMULATED)
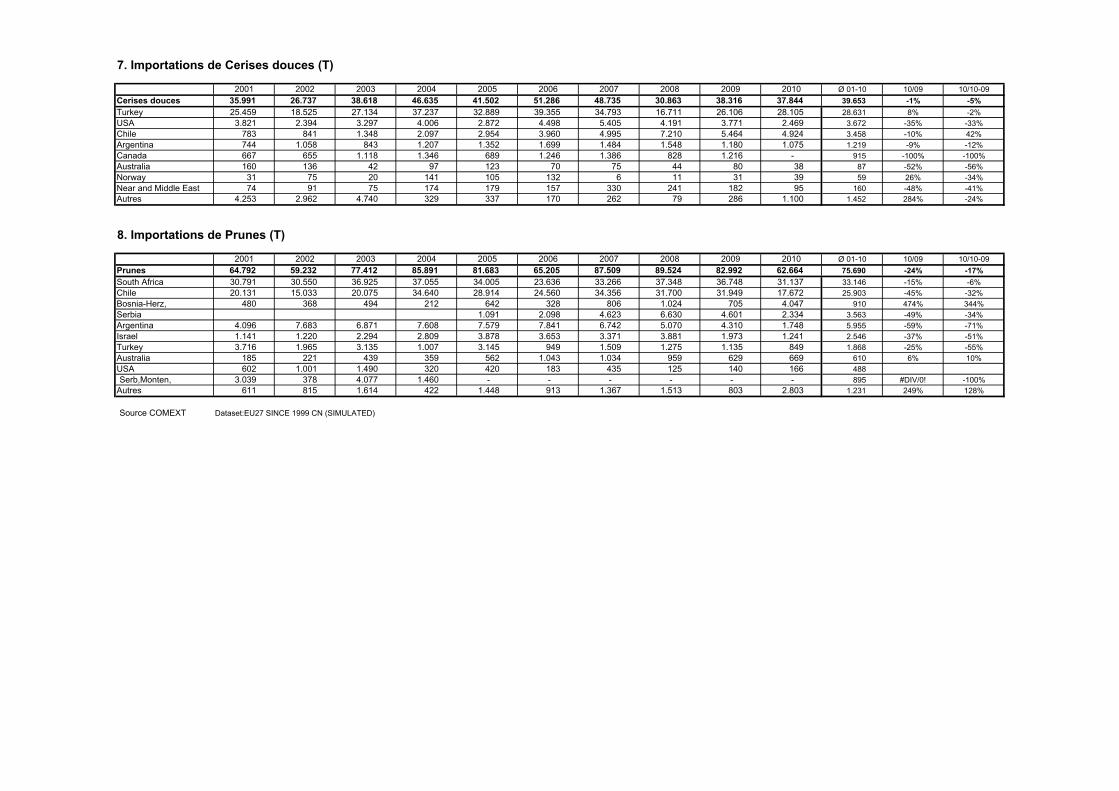
7. Importations de Cerises douces (T)
2001 2002 2003 2004 2005 2006 2007 2008 2009 2010 Ø 01-10 10/09 10/10-09Cerises douces 35.991 26.737 38.618 46.635 41.502 51.286 48.735 30.863 38.316 37.844 39.653 -1% -5%Turkey 25.459 18.525 27.134 37.237 32.889 39.355 34.793 16.711 26.106 28.105 28.631 8% -2%USA 3.821 2.394 3.297 4.006 2.872 4.498 5.405 4.191 3.771 2.469 3.672 -35% -33%Chile 783 841 1.348 2.097 2.954 3.960 4.995 7.210 5.464 4.924 3.458 -10% 42%Argentina 744 1.058 843 1.207 1.352 1.699 1.484 1.548 1.180 1.075 1.219 -9% -12%Canada 667 655 1.118 1.346 689 1.246 1.386 828 1.216 - 915 -100% -100%Australia 160 136 42 97 123 70 75 44 80 38 87 -52% -56%Norway 31 75 20 141 105 132 6 11 31 39 59 26% -34%Near and Middle East 74 91 75 174 179 157 330 241 182 95 160 -48% -41%Autres 4.253 2.962 4.740 329 337 170 262 79 286 1.100 1.452 284% -24%
8. Importations de Prunes (T)
2001 2002 2003 2004 2005 2006 2007 2008 2009 2010 Ø 01-10 10/09 10/10-09Prunes 64.792 59.232 77.412 85.891 81.683 65.205 87.509 89.524 82.992 62.664 75.690 -24% -17%South Africa 30.791 30.550 36.925 37.055 34.005 23.636 33.266 37.348 36.748 31.137 33.146 -15% -6%Chile 20.131 15.033 20.075 34.640 28.914 24.560 34.356 31.700 31.949 17.672 25.903 -45% -32%Bosnia-Herz, 480 368 494 212 642 328 806 1.024 705 4.047 910 474% 344%Serbia 1.091 2.098 4.623 6.630 4.601 2.334 3.563 -49% -34%Argentina 4.096 7.683 6.871 7.608 7.579 7.841 6.742 5.070 4.310 1.748 5.955 -59% -71%Israel 1.141 1.220 2.294 2.809 3.878 3.653 3.371 3.881 1.973 1.241 2.546 -37% -51%Turkey 3.716 1.965 3.135 1.007 3.145 949 1.509 1.275 1.135 849 1.868 -25% -55%Australia 185 221 439 359 562 1.043 1.034 959 629 669 610 6% 10%USA 602 1.001 1.490 320 420 183 435 125 140 166 488 Serb,Monten, 3.039 378 4.077 1.460 - - - - - - 895 #DIV/0! -100%
Autres 611 815 1.614 422 1.448 913 1.367 1.513 803 2.803 1.231 249% 128%
Source COMEXT Dataset:EU27 SINCE 1999 CN (SIMULATED)
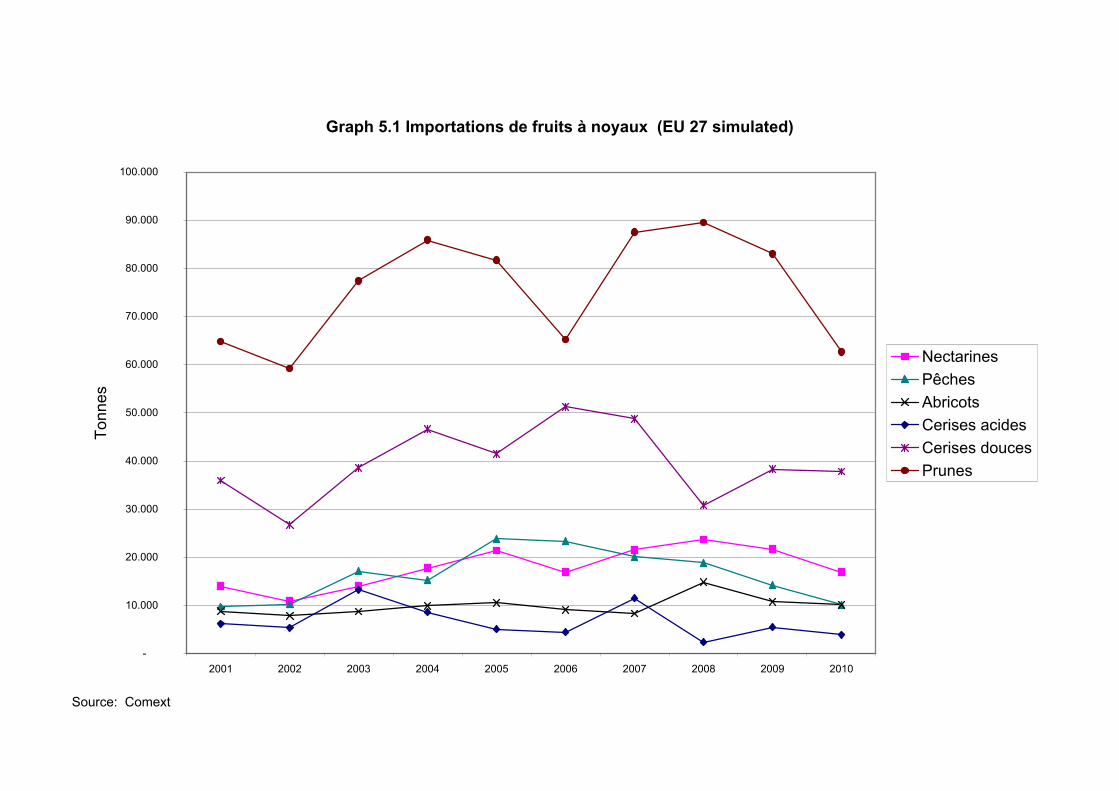
Source: Comext
Graph 5.1 Importations de fruits à noyaux (EU 27 simulated)
-
10.000
20.000
30.000
40.000
50.000
60.000
70.000
80.000
90.000
100.000
2001 2002 2003 2004 2005 2006 2007 2008 2009 2010
Tonn
es
NectarinesPêchesAbricotsCerises acidesCerises doucesPrunes
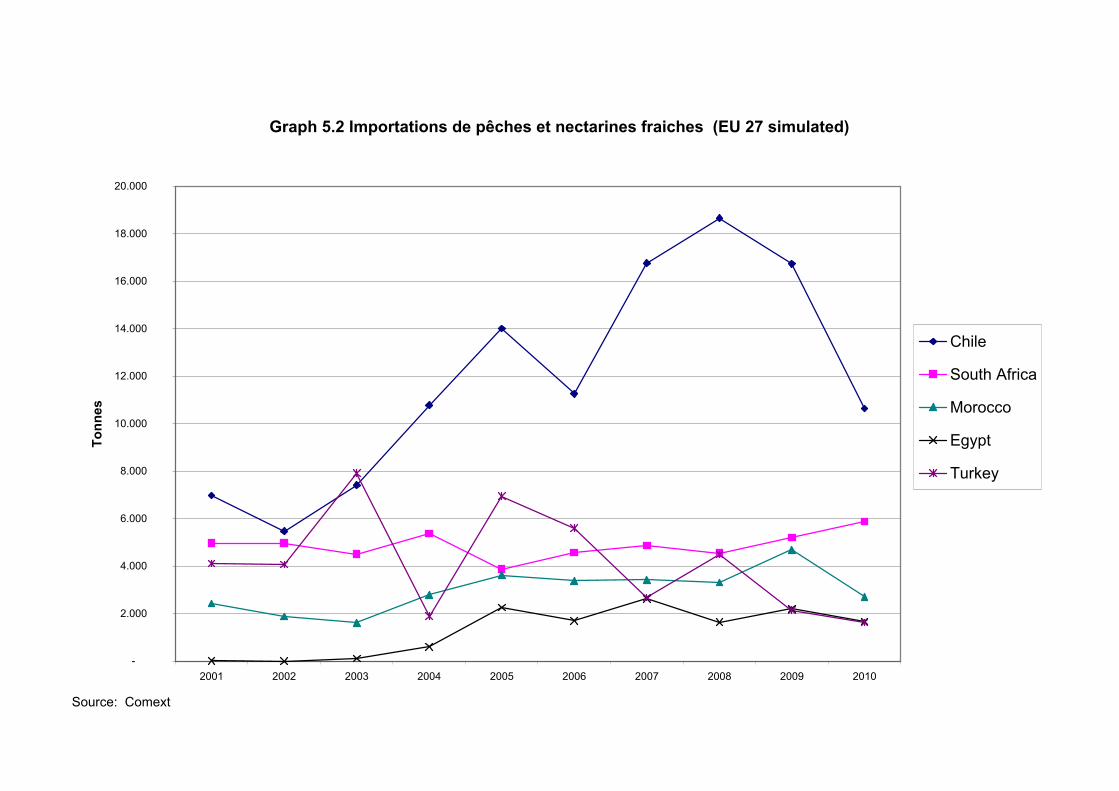
Source: Comext
Graph 5.2 Importations de pêches et nectarines fraiches (EU 27 simulated)
-
2.000
4.000
6.000
8.000
10.000
12.000
14.000
16.000
18.000
20.000
2001 2002 2003 2004 2005 2006 2007 2008 2009 2010
Tonn
es
Chile
South Africa
Morocco
Egypt
Turkey
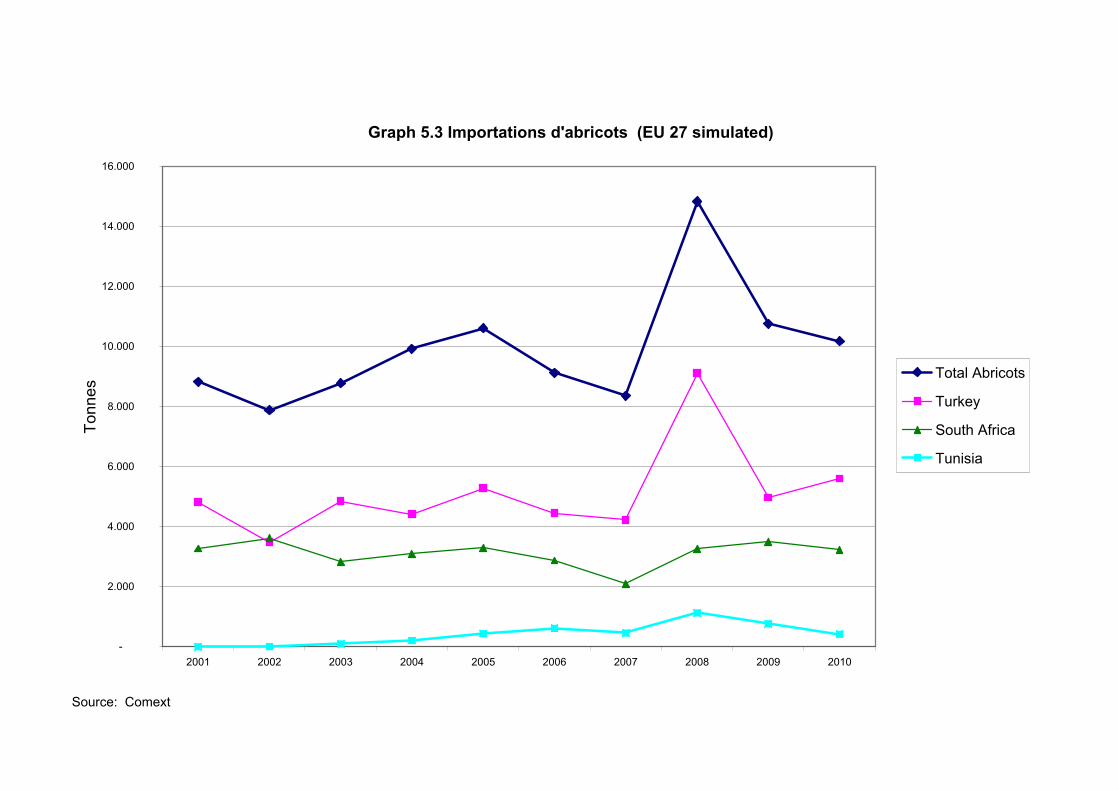
Source: Comext
Graph 5.3 Importations d'abricots (EU 27 simulated)
-
2.000
4.000
6.000
8.000
10.000
12.000
14.000
16.000
2001 2002 2003 2004 2005 2006 2007 2008 2009 2010
Tonn
es
Total Abricots
Turkey
South Africa
Tunisia
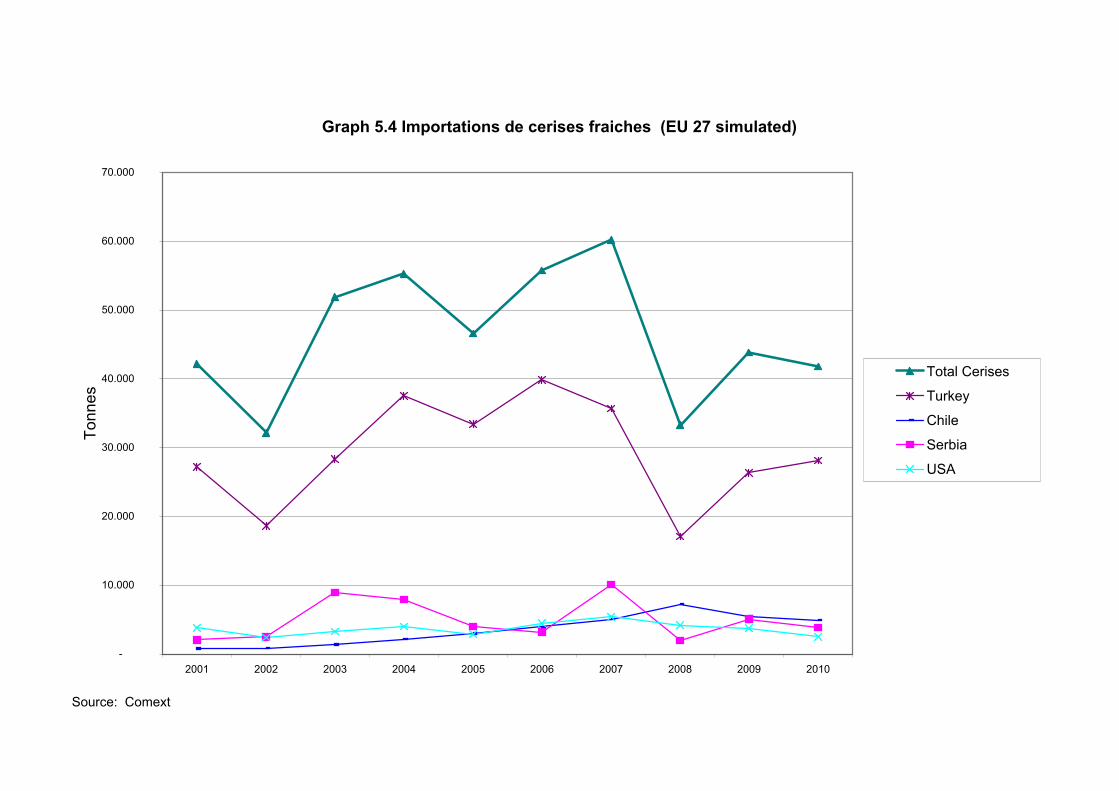
Source: Comext
Graph 5.4 Importations de cerises fraiches (EU 27 simulated)
-
10.000
20.000
30.000
40.000
50.000
60.000
70.000
2001 2002 2003 2004 2005 2006 2007 2008 2009 2010
Tonn
es
Total Cerises
Turkey
Chile
Serbia
USA
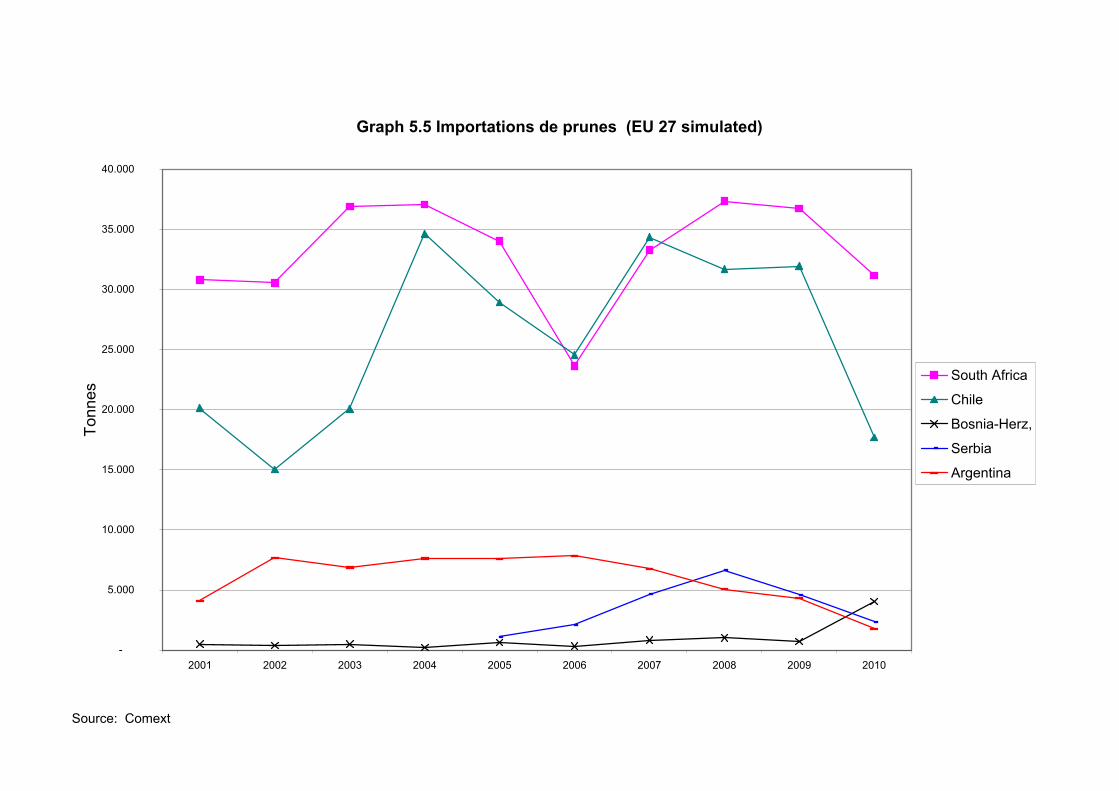
Source: Comext
Graph 5.5 Importations de prunes (EU 27 simulated)
-
5.000
10.000
15.000
20.000
25.000
30.000
35.000
40.000
2001 2002 2003 2004 2005 2006 2007 2008 2009 2010
Tonn
es
South Africa
Chile
Bosnia-Herz,
Serbia
Argentina
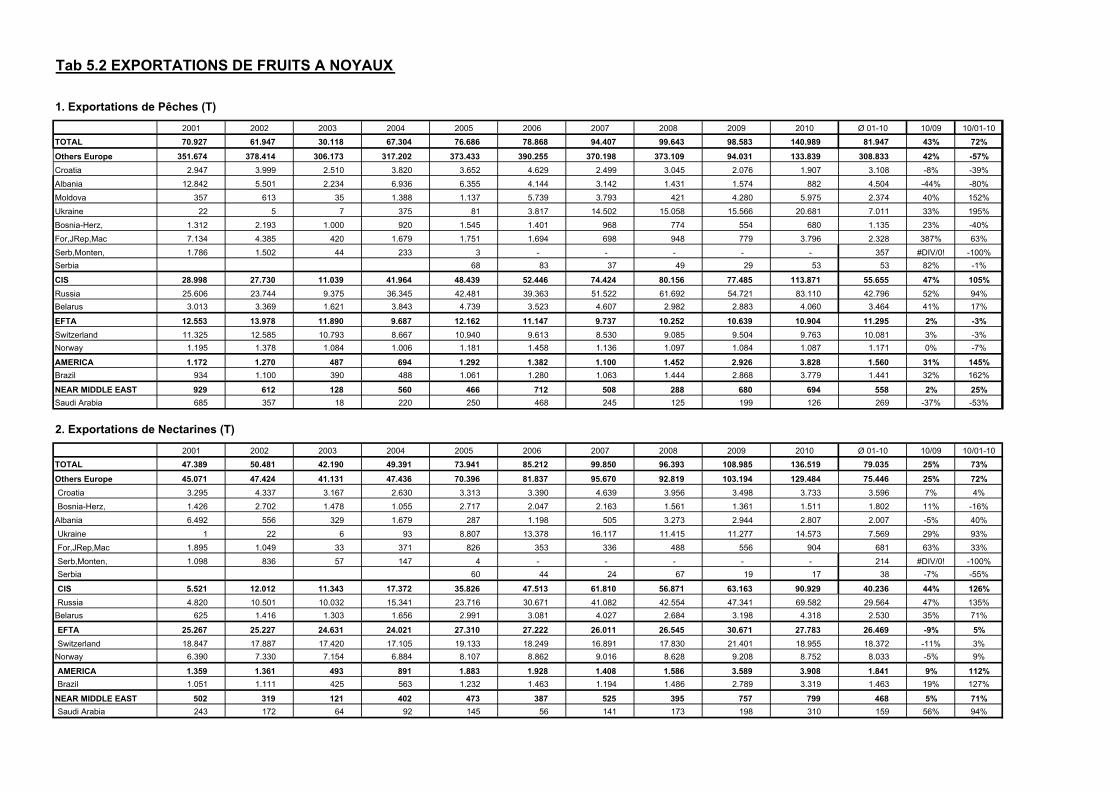
Tab 5.2 EXPORTATIONS DE FRUITS A NOYAUX
1. Exportations de Pêches (T)
2001 2002 2003 2004 2005 2006 2007 2008 2009 2010 Ø 01-10 10/09 10/01-10TOTAL 70.927 61.947 30.118 67.304 76.686 78.868 94.407 99.643 98.583 140.989 81.947 43% 72%
Others Europe 351.674 378.414 306.173 317.202 373.433 390.255 370.198 373.109 94.031 133.839 308.833 42% -57%Croatia 2.947 3.999 2.510 3.820 3.652 4.629 2.499 3.045 2.076 1.907 3.108 -8% -39%Albania 12.842 5.501 2.234 6.936 6.355 4.144 3.142 1.431 1.574 882 4.504 -44% -80%Moldova 357 613 35 1.388 1.137 5.739 3.793 421 4.280 5.975 2.374 40% 152%Ukraine 22 5 7 375 81 3.817 14.502 15.058 15.566 20.681 7.011 33% 195%Bosnia-Herz, 1.312 2.193 1.000 920 1.545 1.401 968 774 554 680 1.135 23% -40%For,JRep,Mac 7.134 4.385 420 1.679 1.751 1.694 698 948 779 3.796 2.328 387% 63%Serb,Monten, 1.786 1.502 44 233 3 - - - - - 357 #DIV/0! -100%Serbia 68 83 37 49 29 53 53 82% -1%
CIS 28.998 27.730 11.039 41.964 48.439 52.446 74.424 80.156 77.485 113.871 55.655 47% 105%Russia 25.606 23.744 9.375 36.345 42.481 39.363 51.522 61.692 54.721 83.110 42.796 52% 94%Belarus 3.013 3.369 1.621 3.843 4.739 3.523 4.607 2.982 2.883 4.060 3.464 41% 17%
EFTA 12.553 13.978 11.890 9.687 12.162 11.147 9.737 10.252 10.639 10.904 11.295 2% -3%Switzerland 11.325 12.585 10.793 8.667 10.940 9.613 8.530 9.085 9.504 9.763 10.081 3% -3%Norway 1.195 1.378 1.084 1.006 1.181 1.458 1.136 1.097 1.084 1.087 1.171 0% -7%
AMERICA 1.172 1.270 487 694 1.292 1.382 1.100 1.452 2.926 3.828 1.560 31% 145%Brazil 934 1.100 390 488 1.061 1.280 1.063 1.444 2.868 3.779 1.441 32% 162%
NEAR MIDDLE EAST 929 612 128 560 466 712 508 288 680 694 558 2% 25%Saudi Arabia 685 357 18 220 250 468 245 125 199 126 269 -37% -53%
2. Exportations de Nectarines (T)
2001 2002 2003 2004 2005 2006 2007 2008 2009 2010 Ø 01-10 10/09 10/01-10TOTAL 47.389 50.481 42.190 49.391 73.941 85.212 99.850 96.393 108.985 136.519 79.035 25% 73%
Others Europe 45.071 47.424 41.131 47.436 70.396 81.837 95.670 92.819 103.194 129.484 75.446 25% 72%Croatia 3.295 4.337 3.167 2.630 3.313 3.390 4.639 3.956 3.498 3.733 3.596 7% 4%Bosnia-Herz, 1.426 2.702 1.478 1.055 2.717 2.047 2.163 1.561 1.361 1.511 1.802 11% -16%
Albania 6.492 556 329 1.679 287 1.198 505 3.273 2.944 2.807 2.007 -5% 40%Ukraine 1 22 6 93 8.807 13.378 16.117 11.415 11.277 14.573 7.569 29% 93%For,JRep,Mac 1.895 1.049 33 371 826 353 336 488 556 904 681 63% 33%Serb,Monten, 1.098 836 57 147 4 - - - - - 214 #DIV/0! -100%Serbia 60 44 24 67 19 17 38 -7% -55%
CIS 5.521 12.012 11.343 17.372 35.826 47.513 61.810 56.871 63.163 90.929 40.236 44% 126%Russia 4.820 10.501 10.032 15.341 23.716 30.671 41.082 42.554 47.341 69.582 29.564 47% 135%
Belarus 625 1.416 1.303 1.656 2.991 3.081 4.027 2.684 3.198 4.318 2.530 35% 71%
EFTA 25.267 25.227 24.631 24.021 27.310 27.222 26.011 26.545 30.671 27.783 26.469 -9% 5%Switzerland 18.847 17.887 17.420 17.105 19.133 18.249 16.891 17.830 21.401 18.955 18.372 -11% 3%
Norway 6.390 7.330 7.154 6.884 8.107 8.862 9.016 8.628 9.208 8.752 8.033 -5% 9%
AMERICA 1.359 1.361 493 891 1.883 1.928 1.408 1.586 3.589 3.908 1.841 9% 112%Brazil 1.051 1.111 425 563 1.232 1.463 1.194 1.486 2.789 3.319 1.463 19% 127%
NEAR MIDDLE EAST 502 319 121 402 473 387 525 395 757 799 468 5% 71%Saudi Arabia 243 172 64 92 145 56 141 173 198 310 159 56% 94%

Source COMEXT Dataset:EU27 SINCE 1999 CN (SIMULATED)
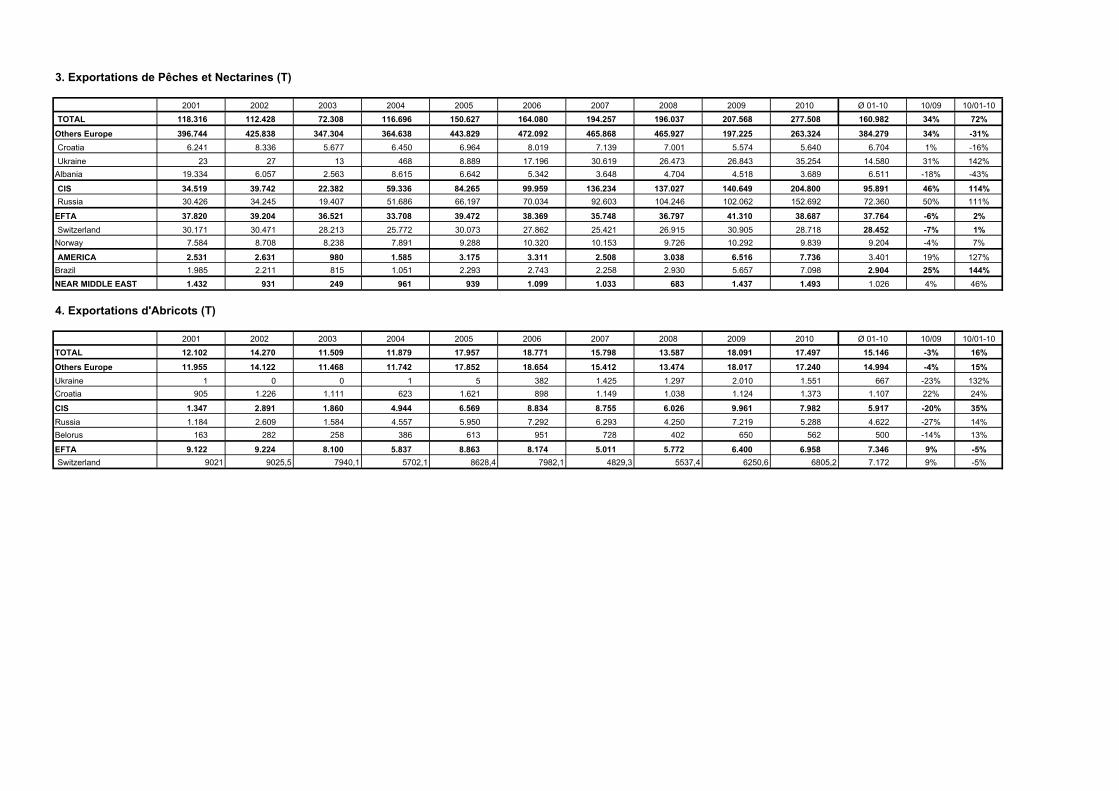
3. Exportations de Pêches et Nectarines (T)
2001 2002 2003 2004 2005 2006 2007 2008 2009 2010 Ø 01-10 10/09 10/01-10TOTAL 118.316 112.428 72.308 116.696 150.627 164.080 194.257 196.037 207.568 277.508 160.982 34% 72%
Others Europe 396.744 425.838 347.304 364.638 443.829 472.092 465.868 465.927 197.225 263.324 384.279 34% -31%Croatia 6.241 8.336 5.677 6.450 6.964 8.019 7.139 7.001 5.574 5.640 6.704 1% -16%Ukraine 23 27 13 468 8.889 17.196 30.619 26.473 26.843 35.254 14.580 31% 142%
Albania 19.334 6.057 2.563 8.615 6.642 5.342 3.648 4.704 4.518 3.689 6.511 -18% -43%
CIS 34.519 39.742 22.382 59.336 84.265 99.959 136.234 137.027 140.649 204.800 95.891 46% 114%Russia 30.426 34.245 19.407 51.686 66.197 70.034 92.603 104.246 102.062 152.692 72.360 50% 111%
EFTA 37.820 39.204 36.521 33.708 39.472 38.369 35.748 36.797 41.310 38.687 37.764 -6% 2%Switzerland 30.171 30.471 28.213 25.772 30.073 27.862 25.421 26.915 30.905 28.718 28.452 -7% 1%
Norway 7.584 8.708 8.238 7.891 9.288 10.320 10.153 9.726 10.292 9.839 9.204 -4% 7%
AMERICA 2.531 2.631 980 1.585 3.175 3.311 2.508 3.038 6.516 7.736 3.401 19% 127%Brazil 1.985 2.211 815 1.051 2.293 2.743 2.258 2.930 5.657 7.098 2.904 25% 144%NEAR MIDDLE EAST 1.432 931 249 961 939 1.099 1.033 683 1.437 1.493 1.026 4% 46%
4. Exportations d'Abricots (T)
2001 2002 2003 2004 2005 2006 2007 2008 2009 2010 Ø 01-10 10/09 10/01-10TOTAL 12.102 14.270 11.509 11.879 17.957 18.771 15.798 13.587 18.091 17.497 15.146 -3% 16%
Others Europe 11.955 14.122 11.468 11.742 17.852 18.654 15.412 13.474 18.017 17.240 14.994 -4% 15%Ukraine 1 0 0 1 5 382 1.425 1.297 2.010 1.551 667 -23% 132%Croatia 905 1.226 1.111 623 1.621 898 1.149 1.038 1.124 1.373 1.107 22% 24%
CIS 1.347 2.891 1.860 4.944 6.569 8.834 8.755 6.026 9.961 7.982 5.917 -20% 35%Russia 1.184 2.609 1.584 4.557 5.950 7.292 6.293 4.250 7.219 5.288 4.622 -27% 14%Belorus 163 282 258 386 613 951 728 402 650 562 500 -14% 13%
EFTA 9.122 9.224 8.100 5.837 8.863 8.174 5.011 5.772 6.400 6.958 7.346 9% -5%Switzerland 9021 9025,5 7940,1 5702,1 8628,4 7982,1 4829,3 5537,4 6250,6 6805,2 7.172 9% -5%

5. Exportations de cerises (T)
2001 2002 2003 2004 2005 2006 2007 2008 2009 2010 Ø 01-10 10/09 10/01-10TOTAL 4.669 5.194 9.893 16.848 13.065 20.653 9.920 31.208 30.858 20.392 16.270 -34% 25%Russia 701 1.348 6.254 11.793 9.829 16.127 6.824 20.694 24.133 14.843 11.255 -38% 32%
EFTA 2.415 2.399 2.359 3.258 2.366 2.379 1.517 1.935 2.515 2.670 2.381 6% 12%Switzerland 2.119 1.977 2.020 2.759 1.715 1.691 994 1.469 2.270 2.407 1.942 6% 24%Norway 294 420 337 496 647 680 520 459 242 252 435 4% -42%Belarus 812 51 405 752 400 955 395 5.045 1.458 436 1.071 -70% -59%Source COMEXT Dataset:EU27 SINCE 1999 CN (SIMULATED)
6. Exportations de prunes (T)
2001 2002 2003 2004 2005 2006 2007 2008 2009 2010 Ø 01-10 10/09 10/01-10TOTAL 15.379 13.908 16.075 25.822 27.660 34.950 38.382 40.904 48.274 56.552 31.790 17% 78%
CIS 3.108 3.593 6.426 14.867 9.393 18.950 20.546 24.323 22.334 23.107 14.665 3% 58%Russia 2.910 3.455 6.300 14.536 9.199 18.235 17.897 21.915 20.472 20.391 13.531 0% 51%
America 3.864 3.190 1.946 2.540 6.935 6.537 6.483 5.763 11.937 14.185 6.338 19% 124%Brazil 3.186 2.762 1.759 1.511 4.998 5.314 4.859 5.116 9.783 12.130 5.142 24% 136%Canada 371 299 105 693 1.126 784 1.058 556 1.537 1.250 778 -19% 61%
EFTA 6.037 4.814 5.852 4.679 6.572 6.029 5.883 7.389 6.845 8.215 6.232 20% 32%Switzerland 4.230 3.128 3.307 2.825 3.818 3.422 2.908 4.744 4.135 5.868 3.838 42% 53%Norway 1.744 1.614 2.458 1.795 2.651 2.451 2.814 2.536 2.586 2.211 2.286 -14% -3%
Africa 284 266 296 457 615 649 1.366 1.124 2.314 5.057 1.243 119% 307%Algeria 13 12 32 24 44 56 384 503 1.282 2.742 509 114% 439%Egypt 22 8 - - - 61 15 56 156 968 129 520% 653%
Near and Middle Eastern 585 660 816 1.306 1.455 1.341 1.723 943 2.774 4.591 1.619 66% 184%U,A,Emirates 274 297 321 352 729 766 1.013 546 1.676 2.607 858 56% 204%Saudi Arabia 224,2 315,4 371 708 637 467 578 360 542 1.358 556 150% 144%

Source: Comext
Graph 5.6 Exportations totales de fruits à noyaux (EU 27 simulated)
-
20.000
40.000
60.000
80.000
100.000
120.000
140.000
160.000
2001 2002 2003 2004 2005 2006 2007 2008 2009 2010
Tonn
es
PêchesNectarinesPrunesCerisesAbricots
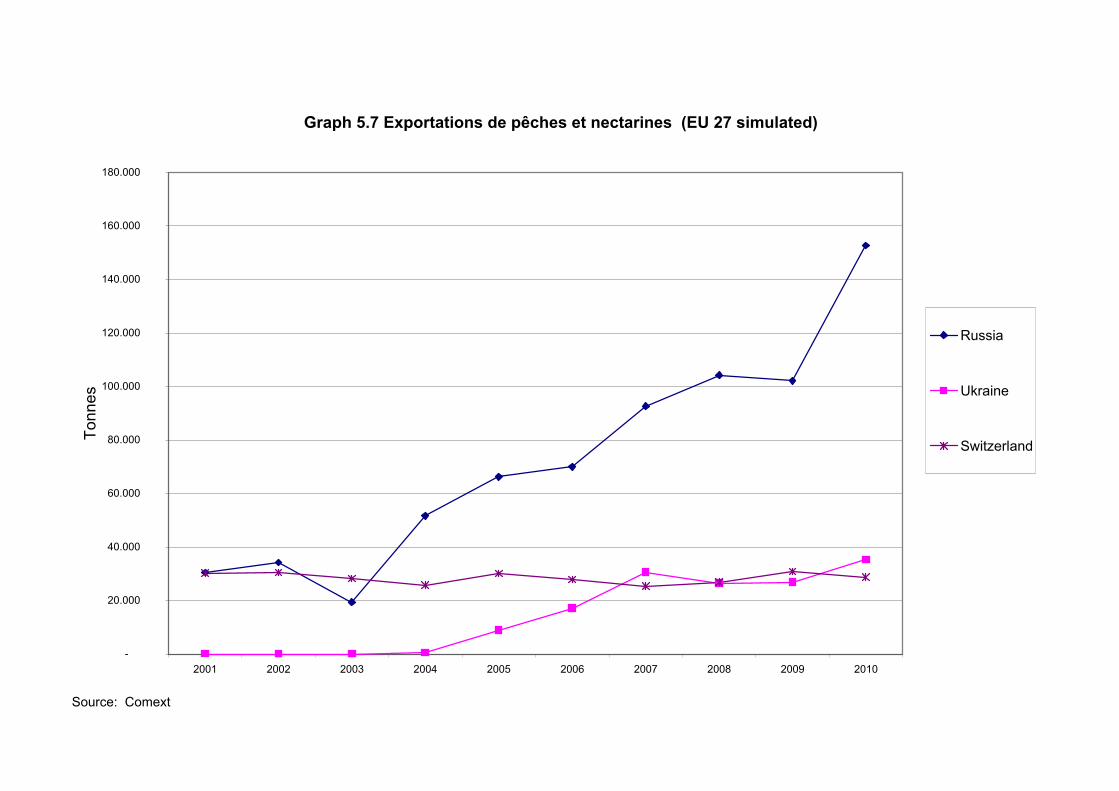
Source: Comext
Graph 5.7 Exportations de pêches et nectarines (EU 27 simulated)
-
20.000
40.000
60.000
80.000
100.000
120.000
140.000
160.000
180.000
2001 2002 2003 2004 2005 2006 2007 2008 2009 2010
Tonn
es
Russia
Ukraine
Switzerland

Source: Comext
Graph 5.8 Exportations d'abricots (EU 27 simulated)
-
2.000
4.000
6.000
8.000
10.000
12.000
14.000
16.000
18.000
20.000
2001 2002 2003 2004 2005 2006 2007 2008 2009 2010
Tonn
es
Total Abricots
Switzerland
Ukraine
Belorus
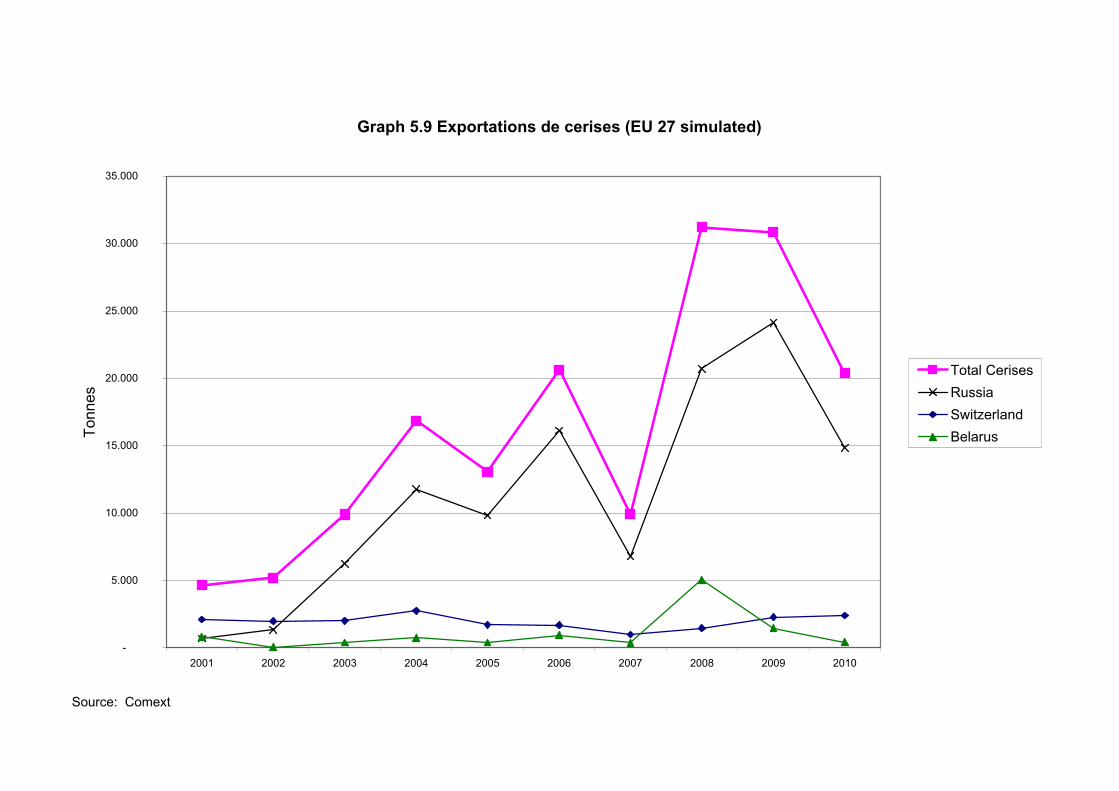
Source: Comext
Graph 5.9 Exportations de cerises (EU 27 simulated)
-
5.000
10.000
15.000
20.000
25.000
30.000
35.000
2001 2002 2003 2004 2005 2006 2007 2008 2009 2010
Tonn
es
Total CerisesRussiaSwitzerlandBelarus
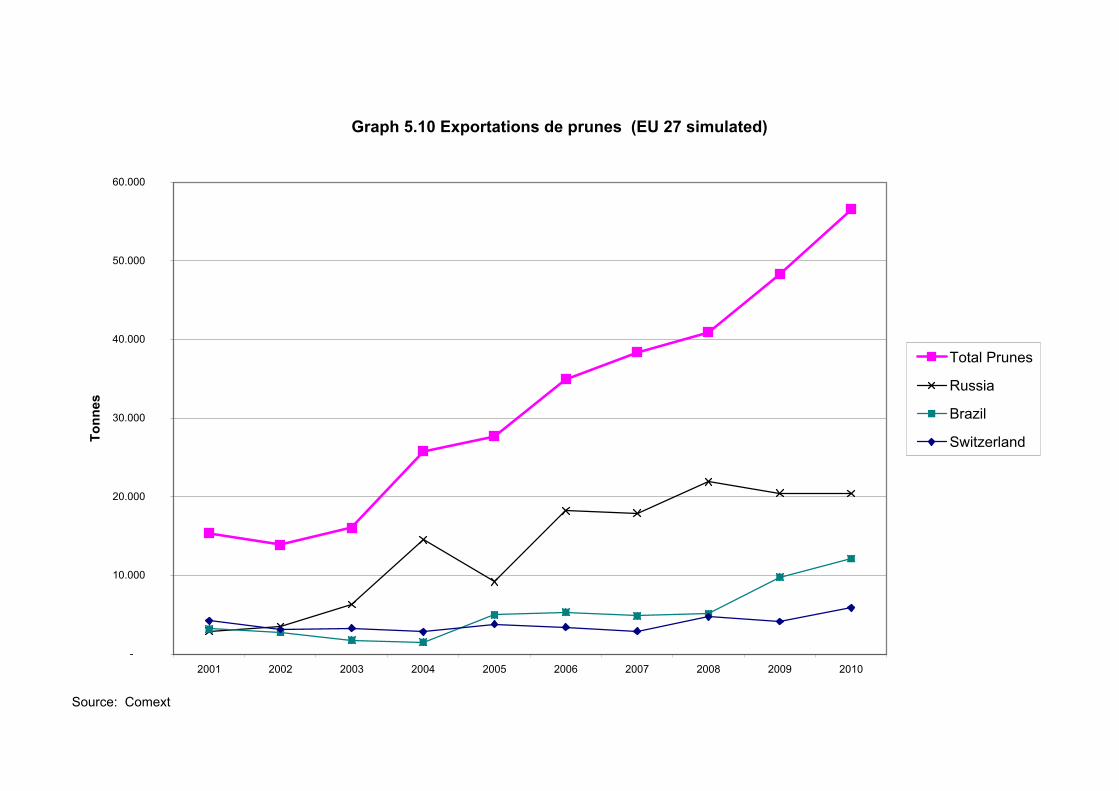
Source: Comext
Graph 5.10 Exportations de prunes (EU 27 simulated)
-
10.000
20.000
30.000
40.000
50.000
60.000
2001 2002 2003 2004 2005 2006 2007 2008 2009 2010
Tonn
es
Total Prunes
Russia
Brazil
Switzerland
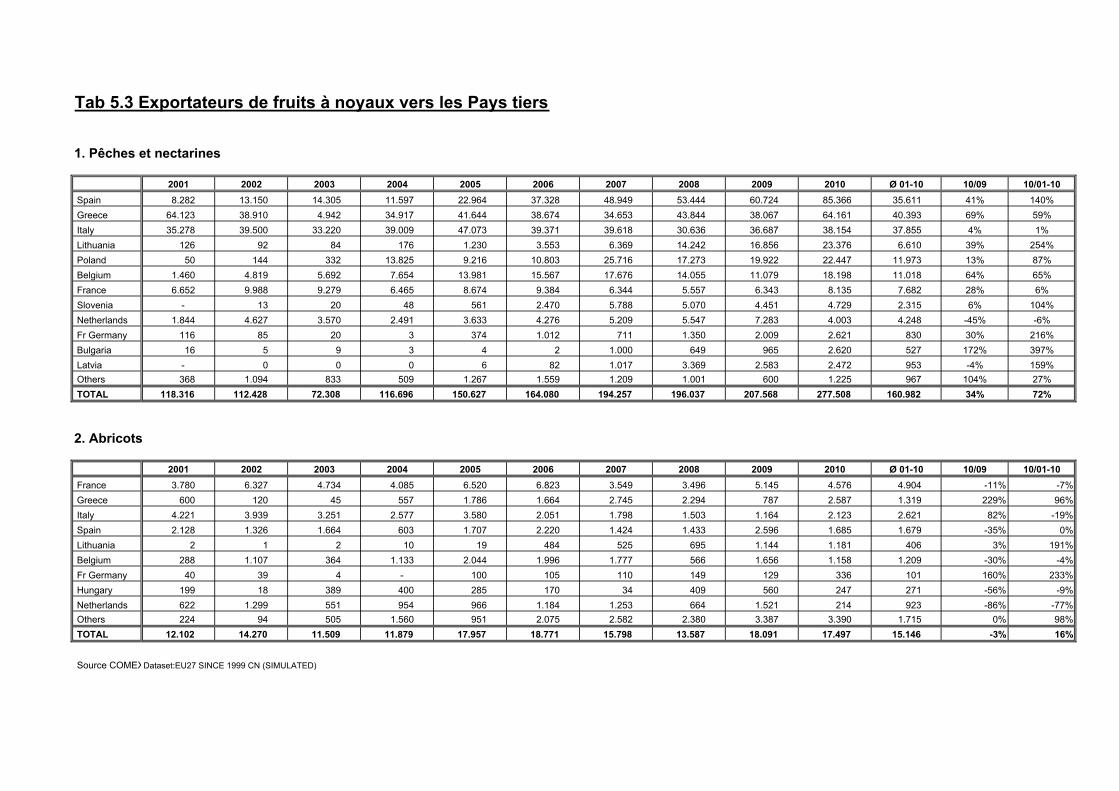
Tab 5.3 Exportateurs de fruits à noyaux vers les Pays tiers
1. Pêches et nectarines
2001 2002 2003 2004 2005 2006 2007 2008 2009 2010 Ø 01-10 10/09 10/01-10Spain 8.282 13.150 14.305 11.597 22.964 37.328 48.949 53.444 60.724 85.366 35.611 41% 140%Greece 64.123 38.910 4.942 34.917 41.644 38.674 34.653 43.844 38.067 64.161 40.393 69% 59%Italy 35.278 39.500 33.220 39.009 47.073 39.371 39.618 30.636 36.687 38.154 37.855 4% 1%Lithuania 126 92 84 176 1.230 3.553 6.369 14.242 16.856 23.376 6.610 39% 254%Poland 50 144 332 13.825 9.216 10.803 25.716 17.273 19.922 22.447 11.973 13% 87%Belgium 1.460 4.819 5.692 7.654 13.981 15.567 17.676 14.055 11.079 18.198 11.018 64% 65%France 6.652 9.988 9.279 6.465 8.674 9.384 6.344 5.557 6.343 8.135 7.682 28% 6%Slovenia - 13 20 48 561 2.470 5.788 5.070 4.451 4.729 2.315 6% 104%Netherlands 1.844 4.627 3.570 2.491 3.633 4.276 5.209 5.547 7.283 4.003 4.248 -45% -6%Fr Germany 116 85 20 3 374 1.012 711 1.350 2.009 2.621 830 30% 216%Bulgaria 16 5 9 3 4 2 1.000 649 965 2.620 527 172% 397%Latvia - 0 0 0 6 82 1.017 3.369 2.583 2.472 953 -4% 159%Others 368 1.094 833 509 1.267 1.559 1.209 1.001 600 1.225 967 104% 27%TOTAL 118.316 112.428 72.308 116.696 150.627 164.080 194.257 196.037 207.568 277.508 160.982 34% 72%
2. Abricots
2001 2002 2003 2004 2005 2006 2007 2008 2009 2010 Ø 01-10 10/09 10/01-10France 3.780 6.327 4.734 4.085 6.520 6.823 3.549 3.496 5.145 4.576 4.904 -11% -7%Greece 600 120 45 557 1.786 1.664 2.745 2.294 787 2.587 1.319 229% 96%Italy 4.221 3.939 3.251 2.577 3.580 2.051 1.798 1.503 1.164 2.123 2.621 82% -19%Spain 2.128 1.326 1.664 603 1.707 2.220 1.424 1.433 2.596 1.685 1.679 -35% 0%Lithuania 2 1 2 10 19 484 525 695 1.144 1.181 406 3% 191%Belgium 288 1.107 364 1.133 2.044 1.996 1.777 566 1.656 1.158 1.209 -30% -4%Fr Germany 40 39 4 - 100 105 110 149 129 336 101 160% 233%Hungary 199 18 389 400 285 170 34 409 560 247 271 -56% -9%Netherlands 622 1.299 551 954 966 1.184 1.253 664 1.521 214 923 -86% -77%Others 224 94 505 1.560 951 2.075 2.582 2.380 3.387 3.390 1.715 0% 98%TOTAL 12.102 14.270 11.509 11.879 17.957 18.771 15.798 13.587 18.091 17.497 15.146 -3% 16%
Source COMEXDataset:EU27 SINCE 1999 CN (SIMULATED)
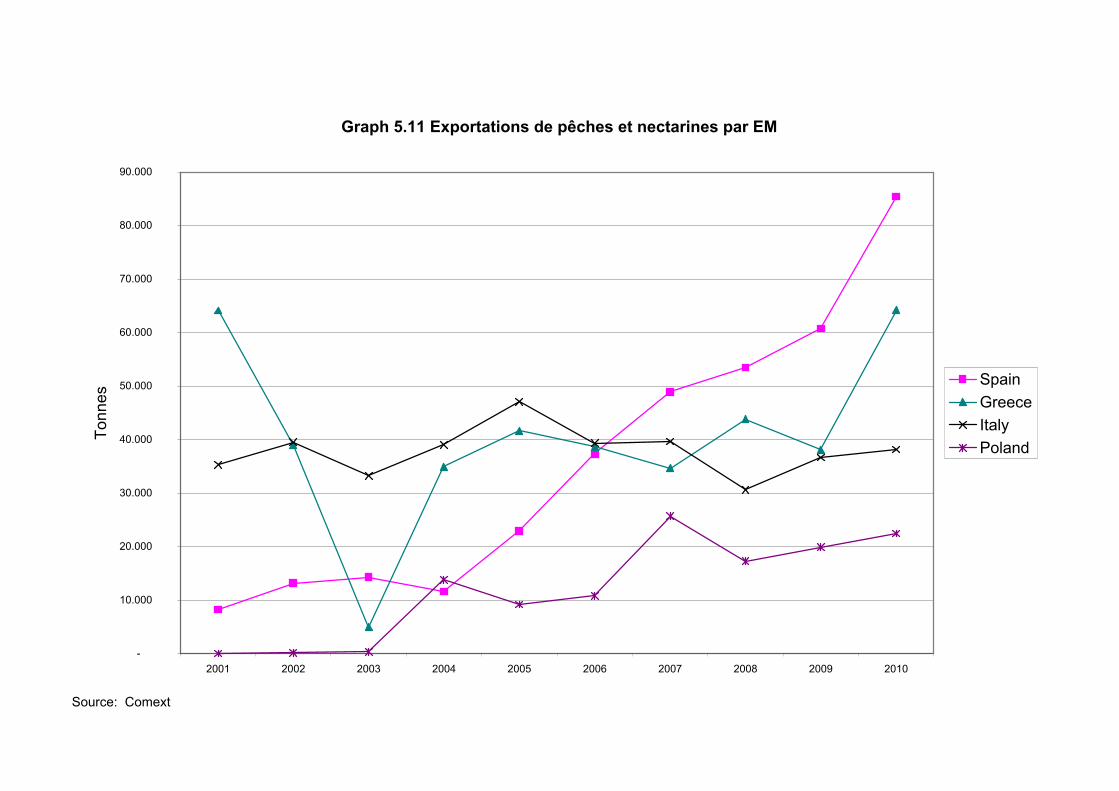
Source: Comext
Graph 5.11 Exportations de pêches et nectarines par EM
-
10.000
20.000
30.000
40.000
50.000
60.000
70.000
80.000
90.000
2001 2002 2003 2004 2005 2006 2007 2008 2009 2010
Tonn
es
SpainGreeceItalyPoland
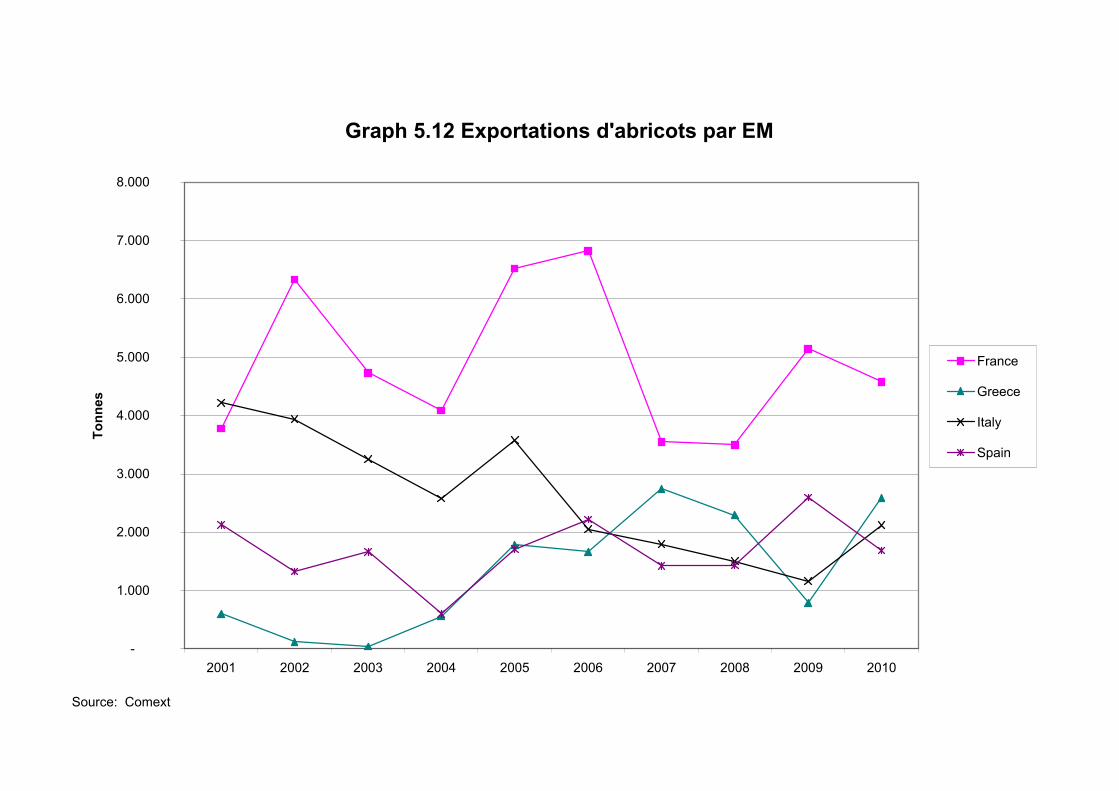
Source: Comext
Graph 5.12 Exportations d'abricots par EM
-
1.000
2.000
3.000
4.000
5.000
6.000
7.000
8.000
2001 2002 2003 2004 2005 2006 2007 2008 2009 2010
Tonn
es
France
Greece
Italy
Spain
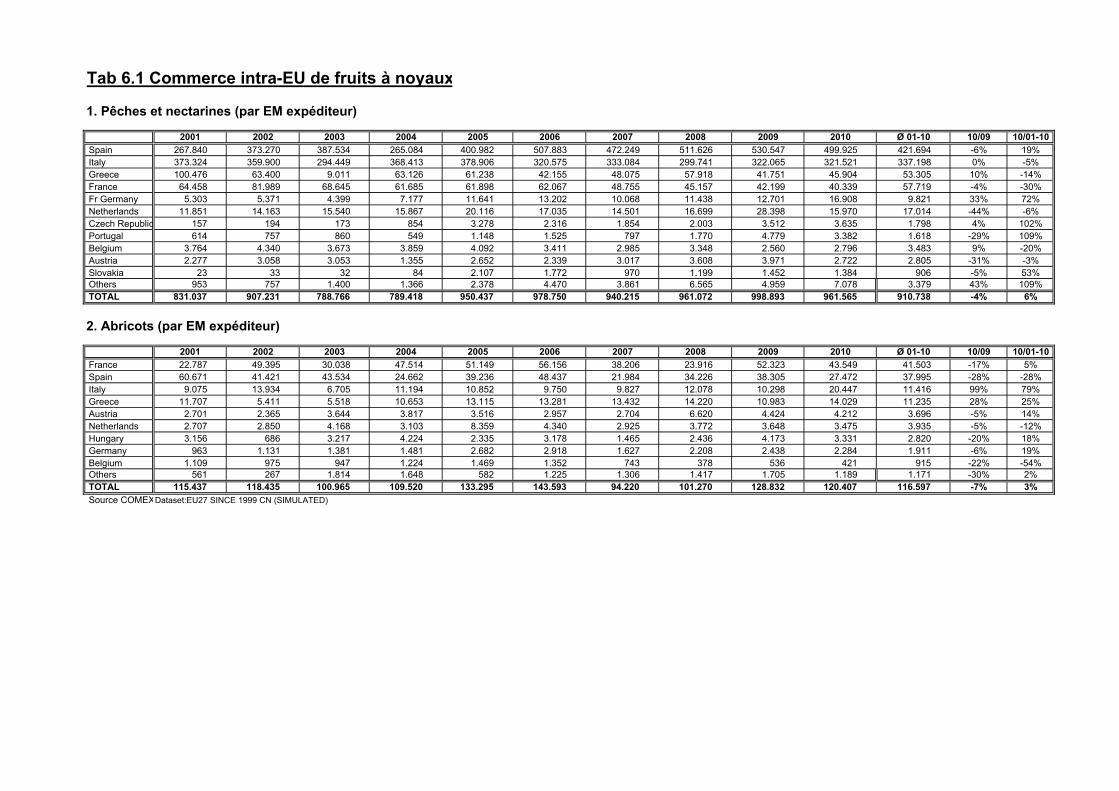
Tab 6.1 Commerce intra-EU de fruits à noyaux
1. Pêches et nectarines (par EM expéditeur)
2001 2002 2003 2004 2005 2006 2007 2008 2009 2010 Ø 01-10 10/09 10/01-10Spain 267.840 373.270 387.534 265.084 400.982 507.883 472.249 511.626 530.547 499.925 421.694 -6% 19%Italy 373.324 359.900 294.449 368.413 378.906 320.575 333.084 299.741 322.065 321.521 337.198 0% -5%Greece 100.476 63.400 9.011 63.126 61.238 42.155 48.075 57.918 41.751 45.904 53.305 10% -14%France 64.458 81.989 68.645 61.685 61.898 62.067 48.755 45.157 42.199 40.339 57.719 -4% -30%Fr Germany 5.303 5.371 4.399 7.177 11.641 13.202 10.068 11.438 12.701 16.908 9.821 33% 72%Netherlands 11.851 14.163 15.540 15.867 20.116 17.035 14.501 16.699 28.398 15.970 17.014 -44% -6%Czech Republic 157 194 173 854 3.278 2.316 1.854 2.003 3.512 3.635 1.798 4% 102%Portugal 614 757 860 549 1.148 1.525 797 1.770 4.779 3.382 1.618 -29% 109%Belgium 3.764 4.340 3.673 3.859 4.092 3.411 2.985 3.348 2.560 2.796 3.483 9% -20%Austria 2.277 3.058 3.053 1.355 2.652 2.339 3.017 3.608 3.971 2.722 2.805 -31% -3%Slovakia 23 33 32 84 2.107 1.772 970 1.199 1.452 1.384 906 -5% 53%Others 953 757 1.400 1.366 2.378 4.470 3.861 6.565 4.959 7.078 3.379 43% 109%TOTAL 831.037 907.231 788.766 789.418 950.437 978.750 940.215 961.072 998.893 961.565 910.738 -4% 6%
2. Abricots (par EM expéditeur)
2001 2002 2003 2004 2005 2006 2007 2008 2009 2010 Ø 01-10 10/09 10/01-10France 22.787 49.395 30.038 47.514 51.149 56.156 38.206 23.916 52.323 43.549 41.503 -17% 5%Spain 60.671 41.421 43.534 24.662 39.236 48.437 21.984 34.226 38.305 27.472 37.995 -28% -28%Italy 9.075 13.934 6.705 11.194 10.852 9.750 9.827 12.078 10.298 20.447 11.416 99% 79%Greece 11.707 5.411 5.518 10.653 13.115 13.281 13.432 14.220 10.983 14.029 11.235 28% 25%Austria 2.701 2.365 3.644 3.817 3.516 2.957 2.704 6.620 4.424 4.212 3.696 -5% 14%Netherlands 2.707 2.850 4.168 3.103 8.359 4.340 2.925 3.772 3.648 3.475 3.935 -5% -12%Hungary 3.156 686 3.217 4.224 2.335 3.178 1.465 2.436 4.173 3.331 2.820 -20% 18%Germany 963 1.131 1.381 1.481 2.682 2.918 1.627 2.208 2.438 2.284 1.911 -6% 19%Belgium 1.109 975 947 1.224 1.469 1.352 743 378 536 421 915 -22% -54%Others 561 267 1.814 1.648 582 1.225 1.306 1.417 1.705 1.189 1.171 -30% 2%TOTAL 115.437 118.435 100.965 109.520 133.295 143.593 94.220 101.270 128.832 120.407 116.597 -7% 3%Source COMEXDataset:EU27 SINCE 1999 CN (SIMULATED)
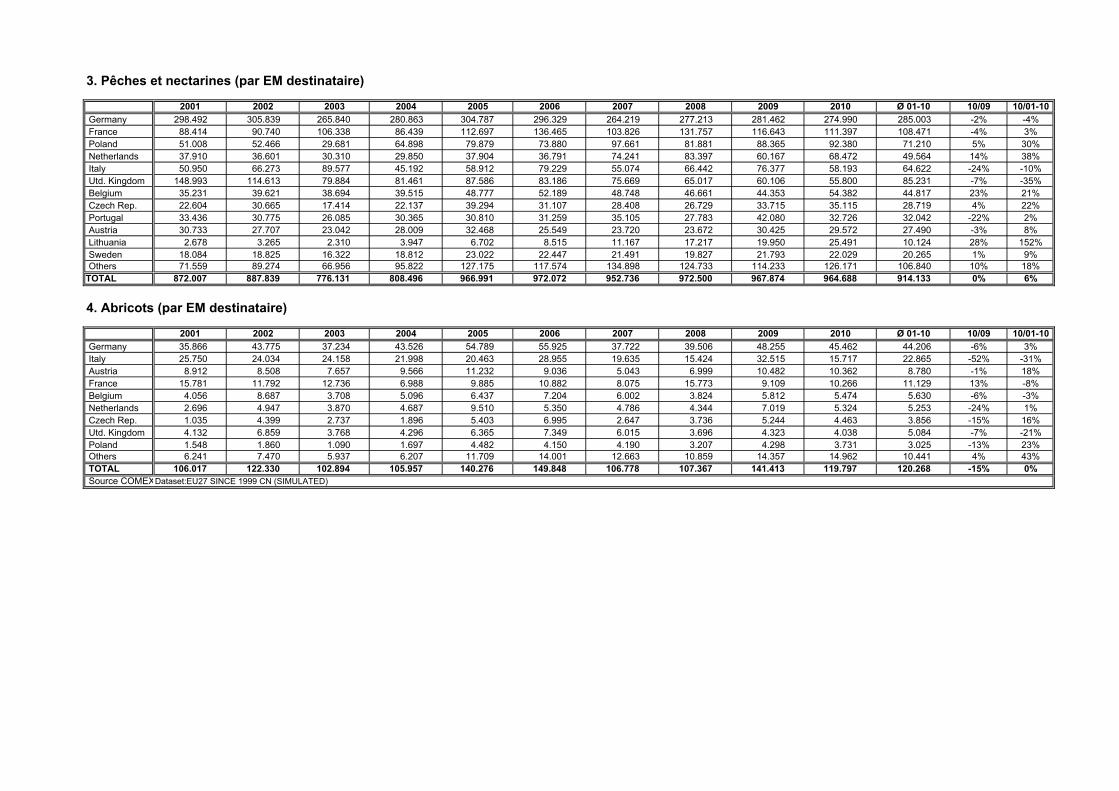
3. Pêches et nectarines (par EM destinataire)
2001 2002 2003 2004 2005 2006 2007 2008 2009 2010 Ø 01-10 10/09 10/01-10Germany 298.492 305.839 265.840 280.863 304.787 296.329 264.219 277.213 281.462 274.990 285.003 -2% -4%France 88.414 90.740 106.338 86.439 112.697 136.465 103.826 131.757 116.643 111.397 108.471 -4% 3%Poland 51.008 52.466 29.681 64.898 79.879 73.880 97.661 81.881 88.365 92.380 71.210 5% 30%Netherlands 37.910 36.601 30.310 29.850 37.904 36.791 74.241 83.397 60.167 68.472 49.564 14% 38%Italy 50.950 66.273 89.577 45.192 58.912 79.229 55.074 66.442 76.377 58.193 64.622 -24% -10%Utd. Kingdom 148.993 114.613 79.884 81.461 87.586 83.186 75.669 65.017 60.106 55.800 85.231 -7% -35%Belgium 35.231 39.621 38.694 39.515 48.777 52.189 48.748 46.661 44.353 54.382 44.817 23% 21%Czech Rep. 22.604 30.665 17.414 22.137 39.294 31.107 28.408 26.729 33.715 35.115 28.719 4% 22%Portugal 33.436 30.775 26.085 30.365 30.810 31.259 35.105 27.783 42.080 32.726 32.042 -22% 2%Austria 30.733 27.707 23.042 28.009 32.468 25.549 23.720 23.672 30.425 29.572 27.490 -3% 8%Lithuania 2.678 3.265 2.310 3.947 6.702 8.515 11.167 17.217 19.950 25.491 10.124 28% 152%Sweden 18.084 18.825 16.322 18.812 23.022 22.447 21.491 19.827 21.793 22.029 20.265 1% 9%Others 71.559 89.274 66.956 95.822 127.175 117.574 134.898 124.733 114.233 126.171 106.840 10% 18%
TOTAL 872.007 887.839 776.131 808.496 966.991 972.072 952.736 972.500 967.874 964.688 914.133 0% 6%
4. Abricots (par EM destinataire)
2001 2002 2003 2004 2005 2006 2007 2008 2009 2010 Ø 01-10 10/09 10/01-10Germany 35.866 43.775 37.234 43.526 54.789 55.925 37.722 39.506 48.255 45.462 44.206 -6% 3%Italy 25.750 24.034 24.158 21.998 20.463 28.955 19.635 15.424 32.515 15.717 22.865 -52% -31%Austria 8.912 8.508 7.657 9.566 11.232 9.036 5.043 6.999 10.482 10.362 8.780 -1% 18%France 15.781 11.792 12.736 6.988 9.885 10.882 8.075 15.773 9.109 10.266 11.129 13% -8%Belgium 4.056 8.687 3.708 5.096 6.437 7.204 6.002 3.824 5.812 5.474 5.630 -6% -3%Netherlands 2.696 4.947 3.870 4.687 9.510 5.350 4.786 4.344 7.019 5.324 5.253 -24% 1%Czech Rep. 1.035 4.399 2.737 1.896 5.403 6.995 2.647 3.736 5.244 4.463 3.856 -15% 16%Utd. Kingdom 4.132 6.859 3.768 4.296 6.365 7.349 6.015 3.696 4.323 4.038 5.084 -7% -21%Poland 1.548 1.860 1.090 1.697 4.482 4.150 4.190 3.207 4.298 3.731 3.025 -13% 23%Others 6.241 7.470 5.937 6.207 11.709 14.001 12.663 10.859 14.357 14.962 10.441 4% 43%TOTAL 106.017 122.330 102.894 105.957 140.276 149.848 106.778 107.367 141.413 119.797 120.268 -15% 0%Source COMEXDataset:EU27 SINCE 1999 CN (SIMULATED)
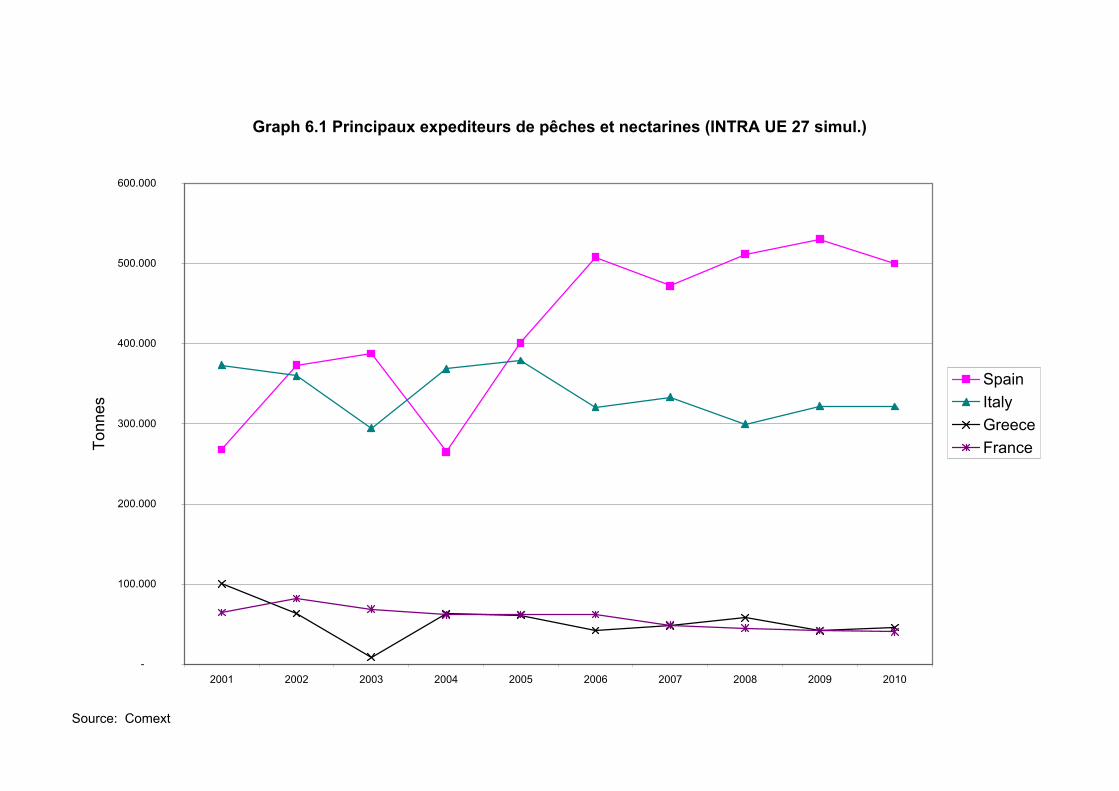
Source: Comext
Graph 6.1 Principaux expediteurs de pêches et nectarines (INTRA UE 27 simul.)
-
100.000
200.000
300.000
400.000
500.000
600.000
2001 2002 2003 2004 2005 2006 2007 2008 2009 2010
Tonn
es
SpainItalyGreeceFrance
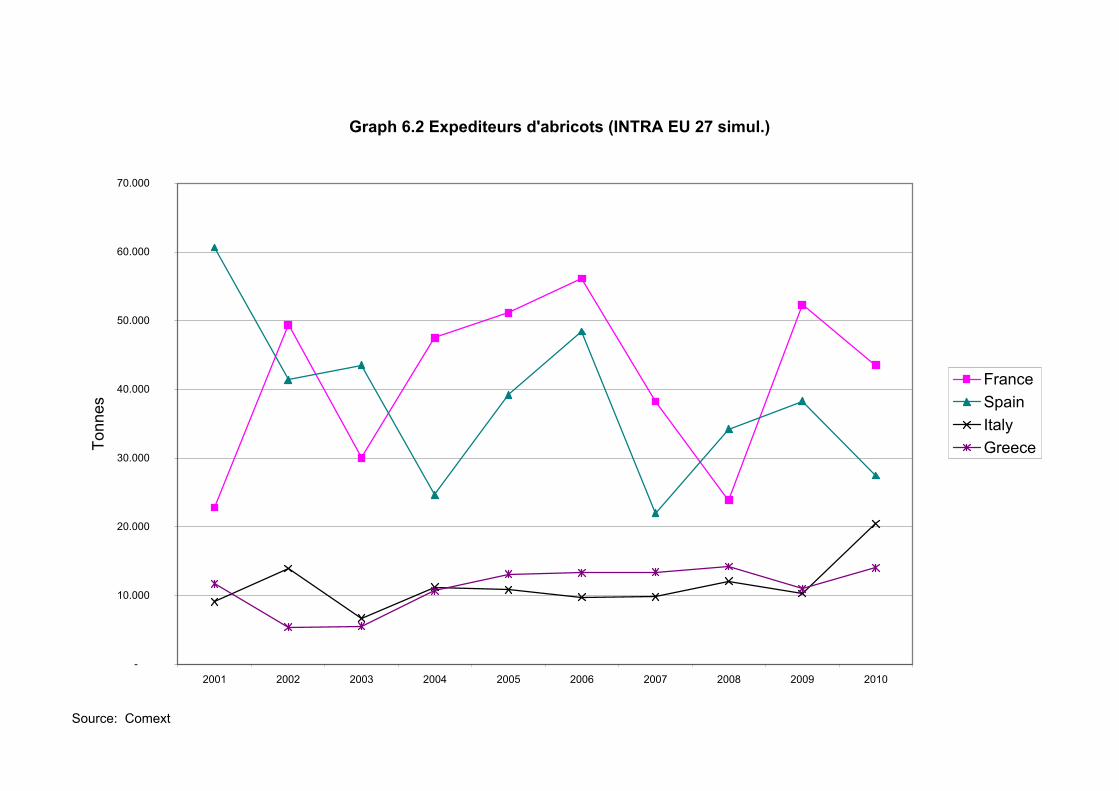
Source: Comext
Graph 6.2 Expediteurs d'abricots (INTRA EU 27 simul.)
-
10.000
20.000
30.000
40.000
50.000
60.000
70.000
2001 2002 2003 2004 2005 2006 2007 2008 2009 2010
Tonn
es
FranceSpainItalyGreece
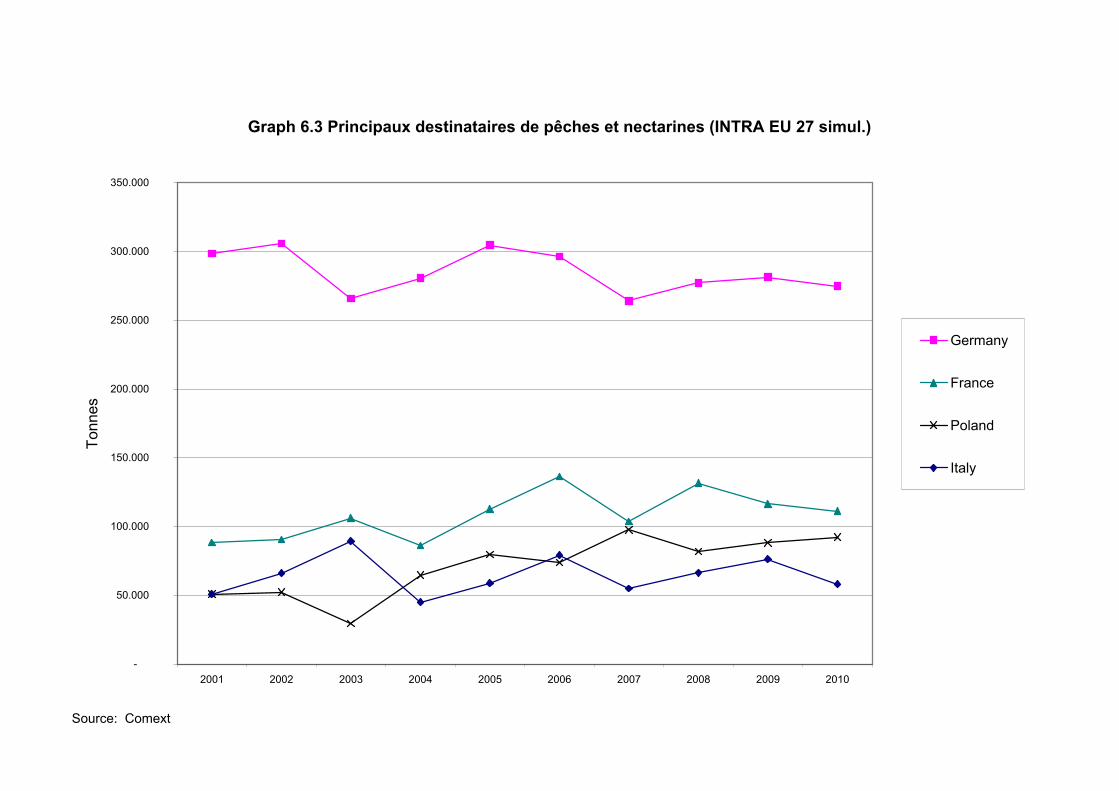
Source: Comext
Graph 6.3 Principaux destinataires de pêches et nectarines (INTRA EU 27 simul.)
-
50.000
100.000
150.000
200.000
250.000
300.000
350.000
2001 2002 2003 2004 2005 2006 2007 2008 2009 2010
Tonn
es
Germany
France
Poland
Italy
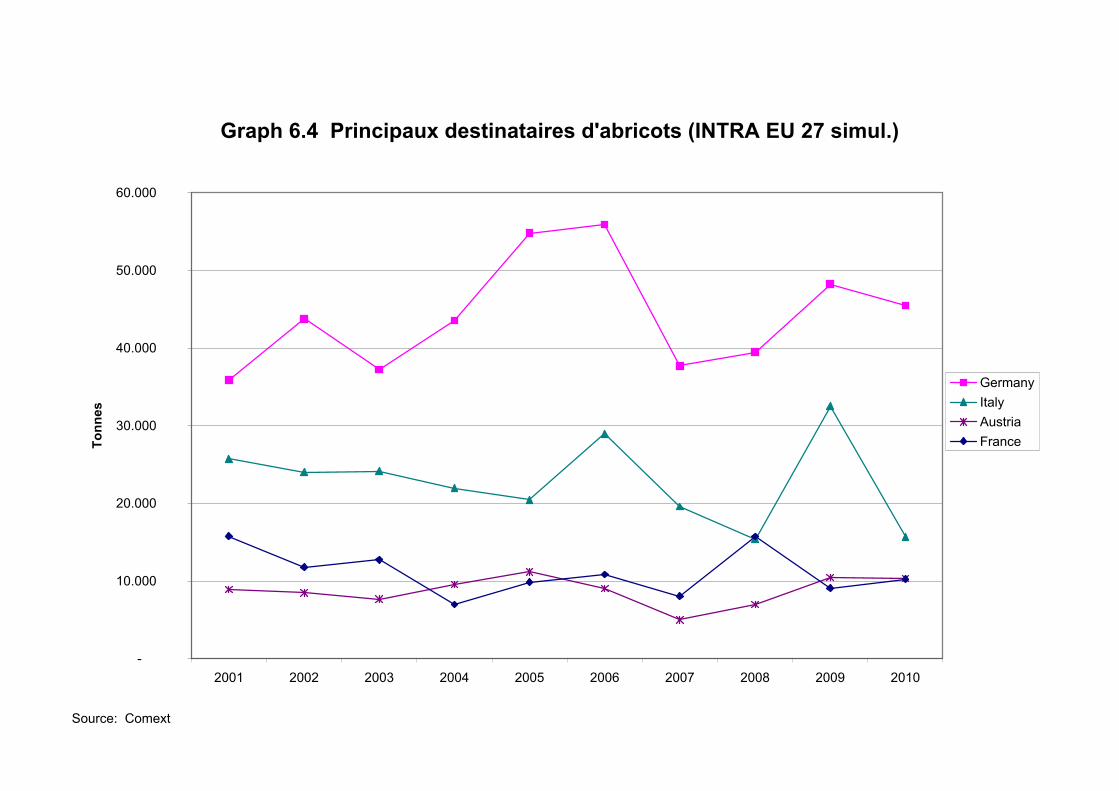
Source: Comext
Graph 6.4 Principaux destinataires d'abricots (INTRA EU 27 simul.)
-
10.000
20.000
30.000
40.000
50.000
60.000
2001 2002 2003 2004 2005 2006 2007 2008 2009 2010
Tonn
es
GermanyItalyAustriaFrance
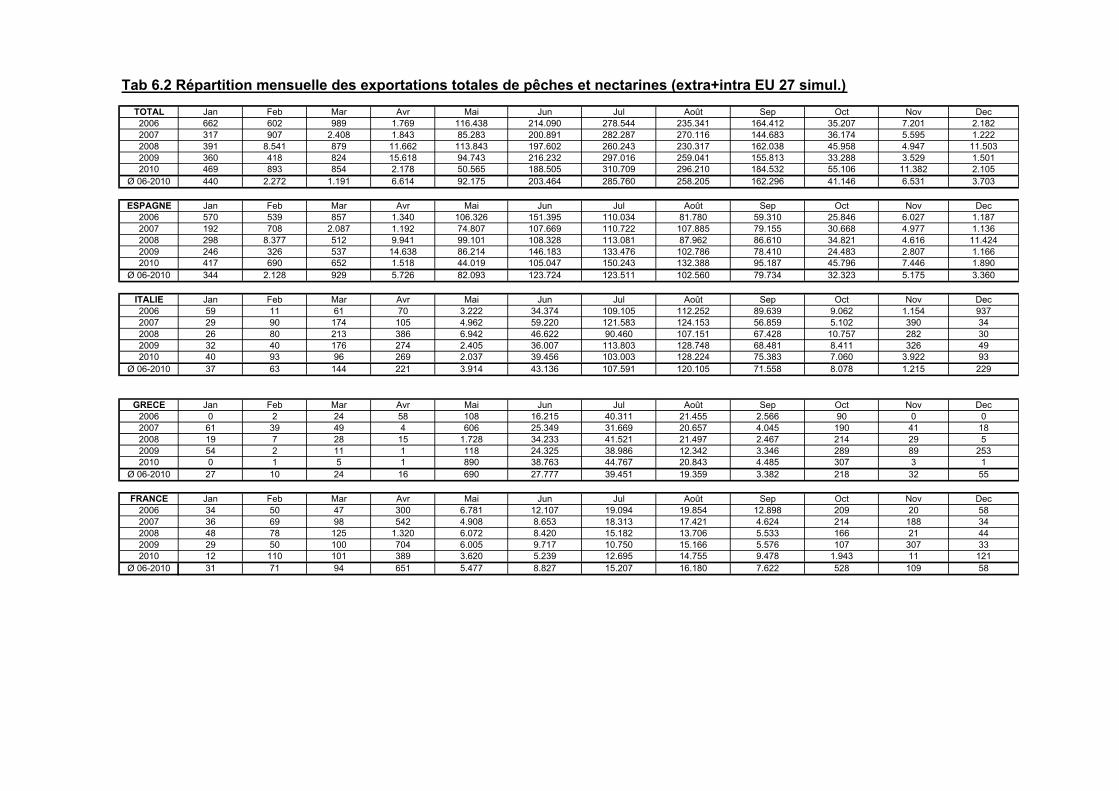
Tab 6.2 Répartition mensuelle des exportations totales de pêches et nectarines (extra+intra EU 27 simul.)TOTAL Jan Feb Mar Avr Mai Jun Jul Août Sep Oct Nov Dec2006 662 602 989 1.769 116.438 214.090 278.544 235.341 164.412 35.207 7.201 2.1822007 317 907 2.408 1.843 85.283 200.891 282.287 270.116 144.683 36.174 5.595 1.2222008 391 8.541 879 11.662 113.843 197.602 260.243 230.317 162.038 45.958 4.947 11.5032009 360 418 824 15.618 94.743 216.232 297.016 259.041 155.813 33.288 3.529 1.5012010 469 893 854 2.178 50.565 188.505 310.709 296.210 184.532 55.106 11.382 2.105
Ø 06-2010 440 2.272 1.191 6.614 92.175 203.464 285.760 258.205 162.296 41.146 6.531 3.703
ESPAGNE Jan Feb Mar Avr Mai Jun Jul Août Sep Oct Nov Dec2006 570 539 857 1.340 106.326 151.395 110.034 81.780 59.310 25.846 6.027 1.1872007 192 708 2.087 1.192 74.807 107.669 110.722 107.885 79.155 30.668 4.977 1.1362008 298 8.377 512 9.941 99.101 108.328 113.081 87.962 86.610 34.821 4.616 11.4242009 246 326 537 14.638 86.214 146.183 133.476 102.786 78.410 24.483 2.807 1.1662010 417 690 652 1.518 44.019 105.047 150.243 132.388 95.187 45.796 7.446 1.890
Ø 06-2010 344 2.128 929 5.726 82.093 123.724 123.511 102.560 79.734 32.323 5.175 3.360
ITALIE Jan Feb Mar Avr Mai Jun Jul Août Sep Oct Nov Dec2006 59 11 61 70 3.222 34.374 109.105 112.252 89.639 9.062 1.154 9372007 29 90 174 105 4.962 59.220 121.583 124.153 56.859 5.102 390 342008 26 80 213 386 6.942 46.622 90.460 107.151 67.428 10.757 282 302009 32 40 176 274 2.405 36.007 113.803 128.748 68.481 8.411 326 492010 40 93 96 269 2.037 39.456 103.003 128.224 75.383 7.060 3.922 93
Ø 06-2010 37 63 144 221 3.914 43.136 107.591 120.105 71.558 8.078 1.215 229
GRECE Jan Feb Mar Avr Mai Jun Jul Août Sep Oct Nov Dec2006 0 2 24 58 108 16.215 40.311 21.455 2.566 90 0 02007 61 39 49 4 606 25.349 31.669 20.657 4.045 190 41 182008 19 7 28 15 1.728 34.233 41.521 21.497 2.467 214 29 52009 54 2 11 1 118 24.325 38.986 12.342 3.346 289 89 2532010 0 1 5 1 890 38.763 44.767 20.843 4.485 307 3 1
Ø 06-2010 27 10 24 16 690 27.777 39.451 19.359 3.382 218 32 55
FRANCE Jan Feb Mar Avr Mai Jun Jul Août Sep Oct Nov Dec2006 34 50 47 300 6.781 12.107 19.094 19.854 12.898 209 20 582007 36 69 98 542 4.908 8.653 18.313 17.421 4.624 214 188 342008 48 78 125 1.320 6.072 8.420 15.182 13.706 5.533 166 21 442009 29 50 100 704 6.005 9.717 10.750 15.166 5.576 107 307 332010 12 110 101 389 3.620 5.239 12.695 14.755 9.478 1.943 11 121
Ø 06-2010 31 71 94 651 5.477 8.827 15.207 16.180 7.622 528 109 58
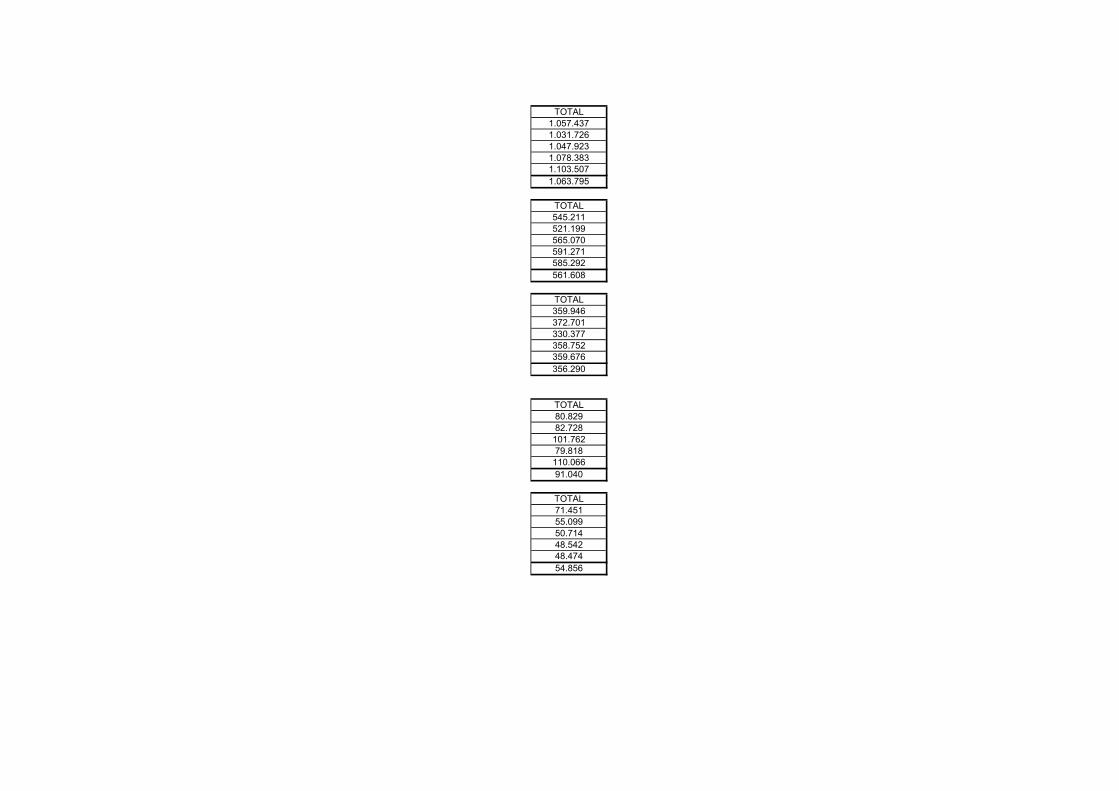
TOTAL1.057.4371.031.7261.047.9231.078.3831.103.5071.063.795
TOTAL545.211521.199565.070591.271585.292561.608
TOTAL359.946372.701330.377358.752359.676356.290
TOTAL80.82982.728
101.76279.818
110.06691.040
TOTAL71.45155.09950.71448.54248.47454.856
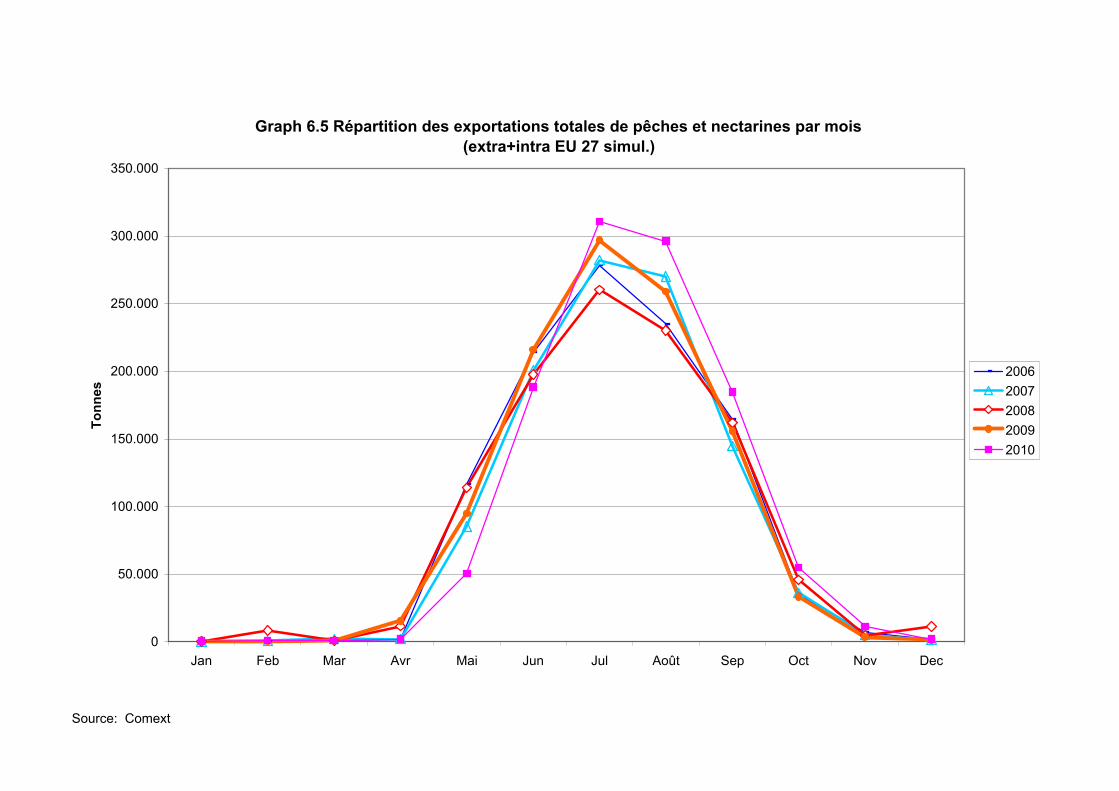
Source: Comext
Graph 6.5 Répartition des exportations totales de pêches et nectarines par mois (extra+intra EU 27 simul.)
0
50.000
100.000
150.000
200.000
250.000
300.000
350.000
Jan Feb Mar Avr Mai Jun Jul Août Sep Oct Nov Dec
Tonn
es
20062007200820092010
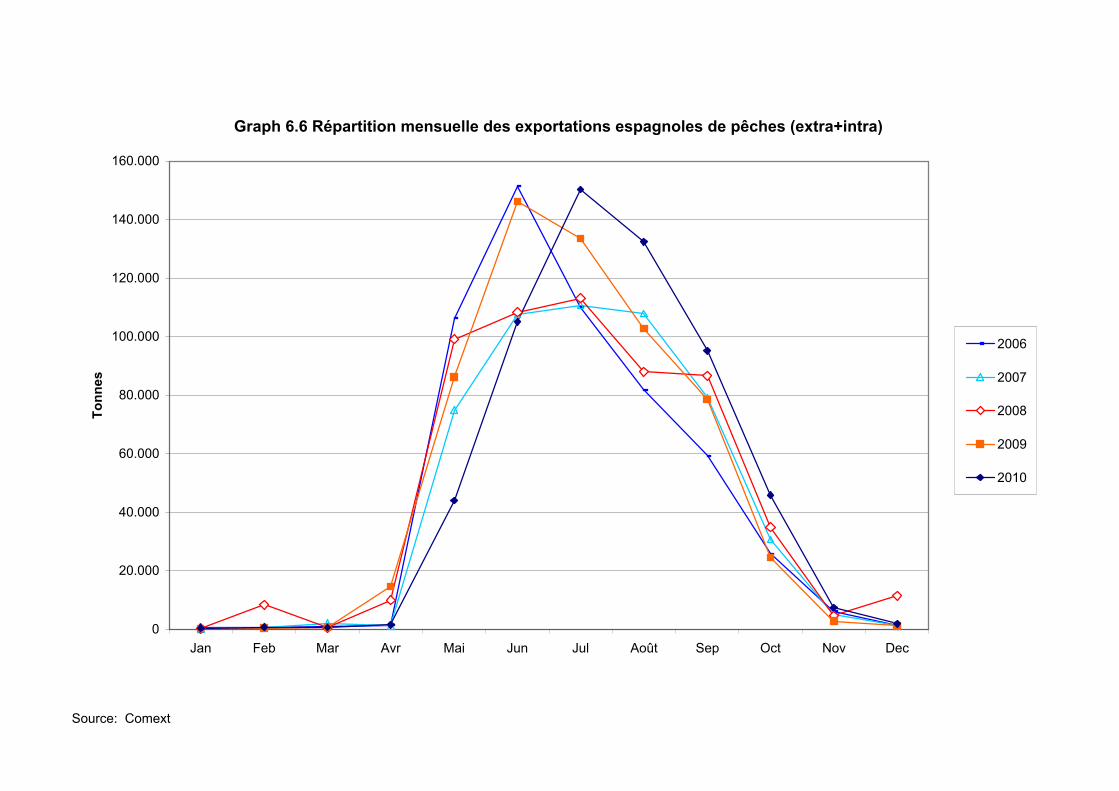
Source: Comext
Graph 6.6 Répartition mensuelle des exportations espagnoles de pêches (extra+intra)
0
20.000
40.000
60.000
80.000
100.000
120.000
140.000
160.000
Jan Feb Mar Avr Mai Jun Jul Août Sep Oct Nov Dec
Tonn
es
2006
2007
2008
2009
2010

Source: Comext
Graph 6.7 Répartition des exportations italiennes de pêches et nectarines (extra+intra)
0
20.000
40.000
60.000
80.000
100.000
120.000
140.000
Jan Feb Mar Avr Mai Jun Jul Août Sep Oct Nov Dec
Tonn
es
20062007200820092010
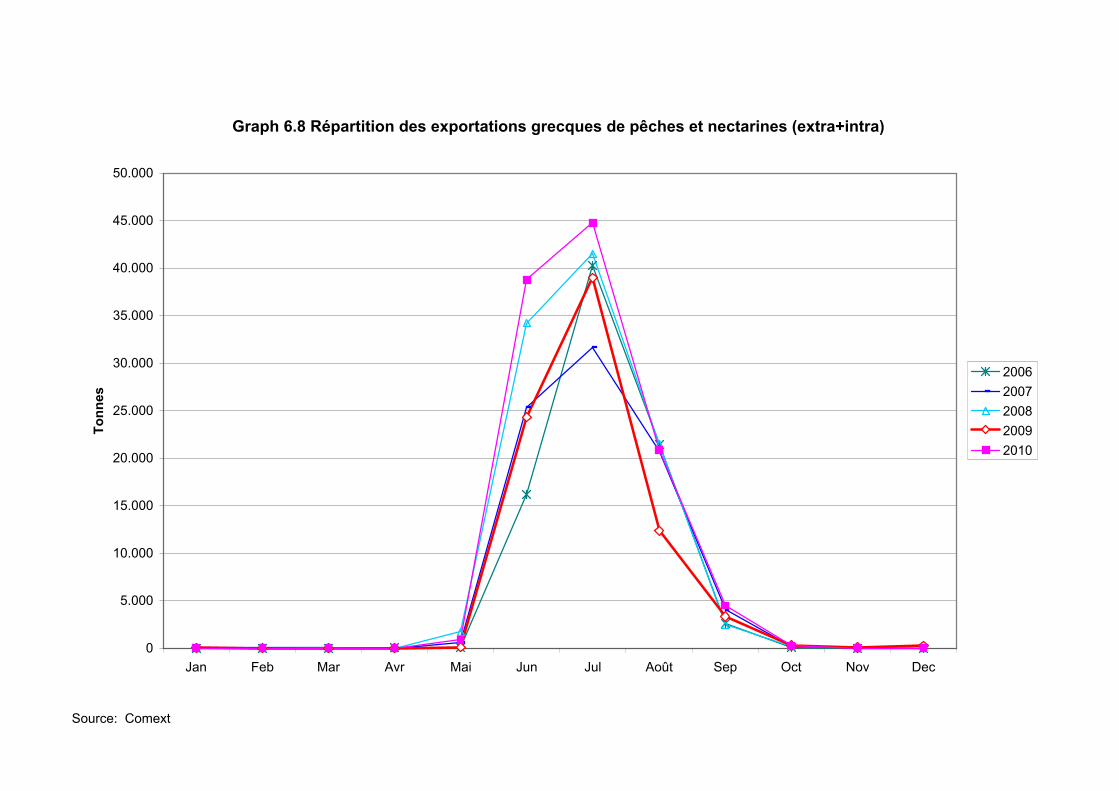
Source: Comext
Graph 6.8 Répartition des exportations grecques de pêches et nectarines (extra+intra)
0
5.000
10.000
15.000
20.000
25.000
30.000
35.000
40.000
45.000
50.000
Jan Feb Mar Avr Mai Jun Jul Août Sep Oct Nov Dec
Tonn
es
20062007200820092010
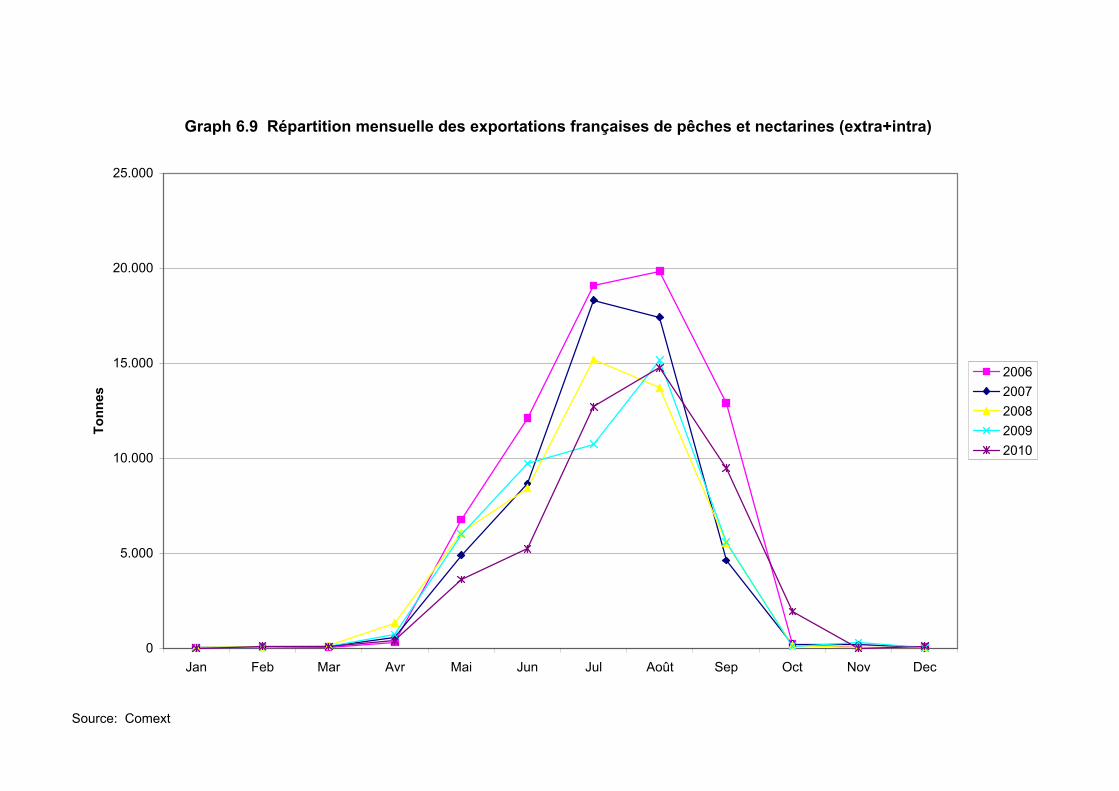
Source: Comext
Graph 6.9 Répartition mensuelle des exportations françaises de pêches et nectarines (extra+intra)
0
5.000
10.000
15.000
20.000
25.000
Jan Feb Mar Avr Mai Jun Jul Août Sep Oct Nov Dec
Tonn
es
20062007200820092010
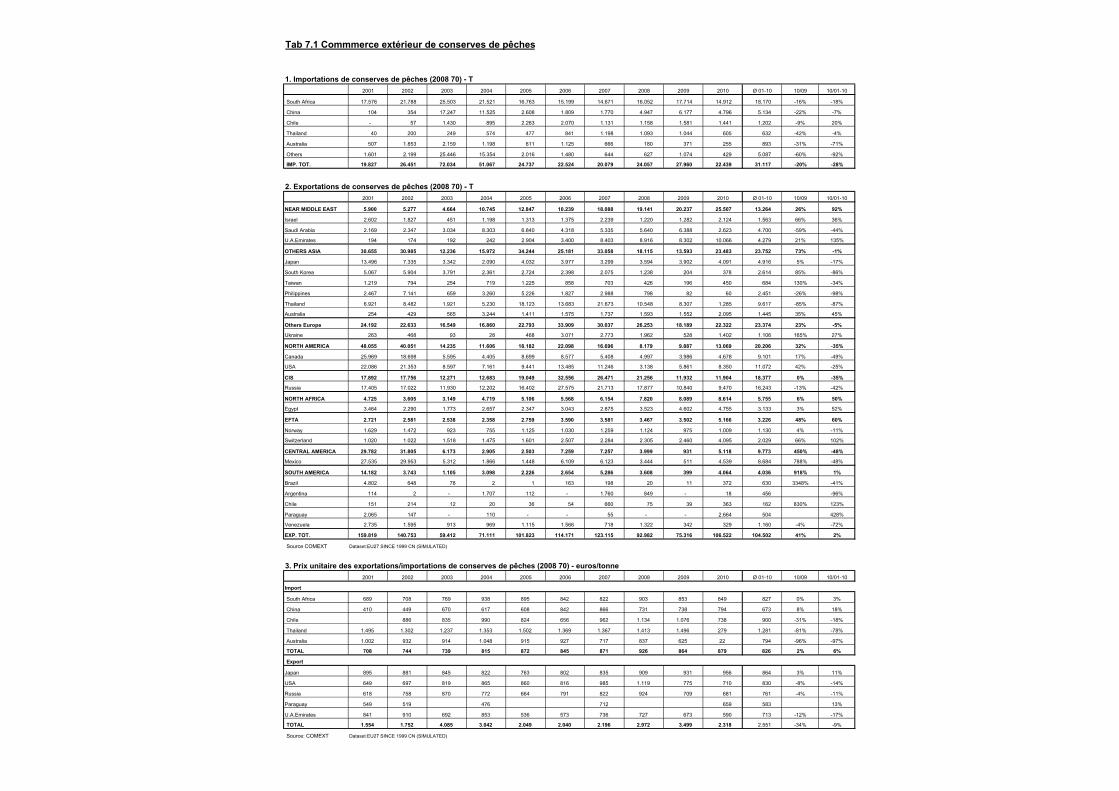
Tab 7.1 Commmerce extérieur de conserves de pêches
1. Importations de conserves de pêches (2008 70) - T 2001 2002 2003 2004 2005 2006 2007 2008 2009 2010 Ø 01-10 10/09 10/01-10
South Africa 17.576 21.788 25.503 21.521 16.763 15.199 14.671 16.052 17.714 14.912 18.170 -16% -18%
China 104 354 17.247 11.525 2.608 1.809 1.770 4.947 6.177 4.796 5.134 -22% -7%
Chile - 57 1.430 895 2.263 2.070 1.131 1.158 1.581 1.441 1.202 -9% 20%
Thailand 40 200 249 574 477 841 1.198 1.093 1.044 605 632 -42% -4%
Australia 507 1.853 2.159 1.198 611 1.125 666 180 371 255 893 -31% -71%
Others 1.601 2.199 25.446 15.354 2.016 1.480 644 627 1.074 429 5.087 -60% -92%
IMP. TOT. 19.827 26.451 72.034 51.067 24.737 22.524 20.079 24.057 27.960 22.439 31.117 -20% -28%
2. Exportations de conserves de pêches (2008 70) - T 2001 2002 2003 2004 2005 2006 2007 2008 2009 2010 Ø 01-10 10/09 10/01-10
NEAR MIDDLE EAST 5.900 5.277 4.664 10.745 12.847 10.239 18.088 19.141 20.237 25.507 13.264 26% 92%
Israel 2.602 1.827 451 1.198 1.313 1.375 2.239 1.220 1.282 2.124 1.563 66% 36%
Saudi Arabia 2.169 2.347 3.034 8.303 6.840 4.318 5.335 5.640 6.388 2.623 4.700 -59% -44%
U.A.Emirates 194 174 192 242 2.904 3.400 8.403 8.916 8.302 10.066 4.279 21% 135%
OTHERS ASIA 30.655 30.985 12.236 15.972 34.244 25.181 33.058 18.115 13.593 23.483 23.752 73% -1%
Japan 13.496 7.335 3.342 2.090 4.032 3.977 3.299 3.594 3.902 4.091 4.916 5% -17%
South Korea 5.067 5.904 3.791 2.361 2.724 2.398 2.075 1.238 204 378 2.614 85% -86%
Taiwan 1.219 794 254 719 1.225 858 703 426 196 450 684 130% -34%
Philippines 2.467 7.141 659 3.260 5.226 1.827 2.988 798 82 60 2.451 -26% -98%
Thailand 6.921 8.482 1.921 5.230 18.123 13.683 21.673 10.548 8.307 1.285 9.617 -85% -87%
Australia 254 429 565 3.244 1.411 1.575 1.737 1.593 1.552 2.095 1.445 35% 45%
Others Europe 24.192 22.633 16.549 16.860 22.793 33.909 30.037 26.253 18.189 22.322 23.374 23% -5%
Ukraine 263 468 93 28 468 3.071 2.773 1.962 528 1.402 1.106 165% 27%
NORTH AMERICA 48.055 40.051 14.235 11.606 18.182 22.098 16.696 8.179 9.887 13.069 20.206 32% -35%
Canada 25.969 18.698 5.595 4.405 8.699 8.577 5.408 4.997 3.986 4.678 9.101 17% -49%
USA 22.086 21.353 8.597 7.161 9.441 13.485 11.246 3.138 5.861 8.350 11.072 42% -25%
CIS 17.892 17.756 12.271 12.683 19.049 32.556 26.471 21.256 11.932 11.904 18.377 0% -35%
Russia 17.405 17.022 11.930 12.202 16.402 27.575 21.713 17.877 10.840 9.470 16.243 -13% -42%
NORTH AFRICA 4.725 3.605 3.149 4.719 5.106 5.568 6.154 7.820 8.089 8.614 5.755 6% 50%
Egypt 3.464 2.290 1.773 2.657 2.347 3.043 2.875 3.523 4.602 4.755 3.133 3% 52%
EFTA 2.721 2.581 2.538 2.358 2.759 3.590 3.581 3.467 3.502 5.166 3.226 48% 60%
Norway 1.629 1.472 923 755 1.125 1.030 1.259 1.124 975 1.009 1.130 4% -11%
Switzerland 1.020 1.022 1.518 1.475 1.601 2.507 2.284 2.305 2.460 4.095 2.029 66% 102%
CENTRAL AMERICA 29.782 31.805 6.173 2.905 2.503 7.259 7.257 3.999 931 5.118 9.773 450% -48%
Mexico 27.535 29.953 5.312 1.866 1.448 6.109 6.123 3.444 511 4.539 8.684 788% -48%
SOUTH AMERICA 14.182 3.743 1.105 3.098 2.226 2.654 5.286 3.608 399 4.064 4.036 918% 1%
Brazil 4.802 648 78 2 1 163 198 20 11 372 630 3348% -41%
Argentina 114 2 - 1.707 112 - 1.760 849 - 18 456 -96%
Chile 151 214 12 20 36 54 660 75 39 363 162 830% 123%
Paraguay 2.065 147 - 110 - - 55 - - 2.664 504 428%
Venezuela 2.735 1.595 913 969 1.115 1.566 718 1.322 342 329 1.160 -4% -72%
EXP. TOT. 159.819 140.753 59.412 71.111 101.823 114.171 123.115 92.982 75.316 106.522 104.502 41% 2%
Source COMEXT Dataset:EU27 SINCE 1999 CN (SIMULATED)
3. Prix unitaire des exportations/importations de conserves de pêches (2008 70) - euros/tonne 2001 2002 2003 2004 2005 2006 2007 2008 2009 2010 Ø 01-10 10/09 10/01-10
Import
South Africa 689 708 769 938 895 842 822 903 853 849 827 0% 3%
China 410 449 670 617 608 842 866 731 738 794 673 8% 18%
Chile 886 835 990 824 656 962 1.134 1.076 738 900 -31% -18%
Thailand 1.495 1.302 1.237 1.353 1.502 1.369 1.367 1.413 1.496 279 1.281 -81% -78%
Australia 1.002 932 914 1.048 915 927 717 837 625 22 794 -96% -97%
TOTAL 708 744 739 815 872 845 871 926 864 879 826 2% 6%
Export
Japan 895 881 845 822 763 802 835 909 931 956 864 3% 11%
USA 649 697 819 865 860 816 985 1.119 775 710 830 -8% -14%
Russia 618 758 870 772 664 791 822 924 709 681 761 -4% -11%
Paraguay 549 519 476 712 659 583 13%
U.A.Emirates 841 910 692 853 536 573 736 727 673 590 713 -12% -17%
TOTAL 1.554 1.752 4.085 3.042 2.049 2.040 2.196 2.972 3.499 2.318 2.551 -34% -9%
Source: COMEXT Dataset:EU27 SINCE 1999 CN (SIMULATED)
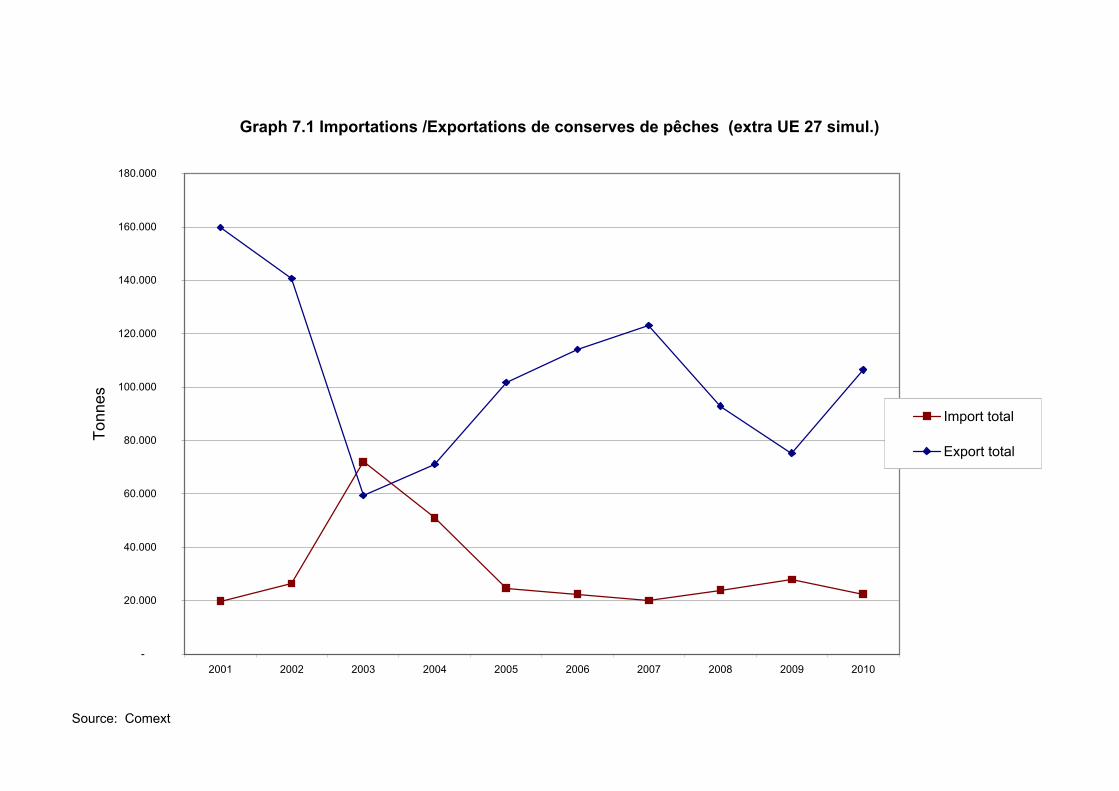
Source: Comext
Graph 7.1 Importations /Exportations de conserves de pêches (extra UE 27 simul.)
-
20.000
40.000
60.000
80.000
100.000
120.000
140.000
160.000
180.000
2001 2002 2003 2004 2005 2006 2007 2008 2009 2010
Tonn
es
Import total
Export total
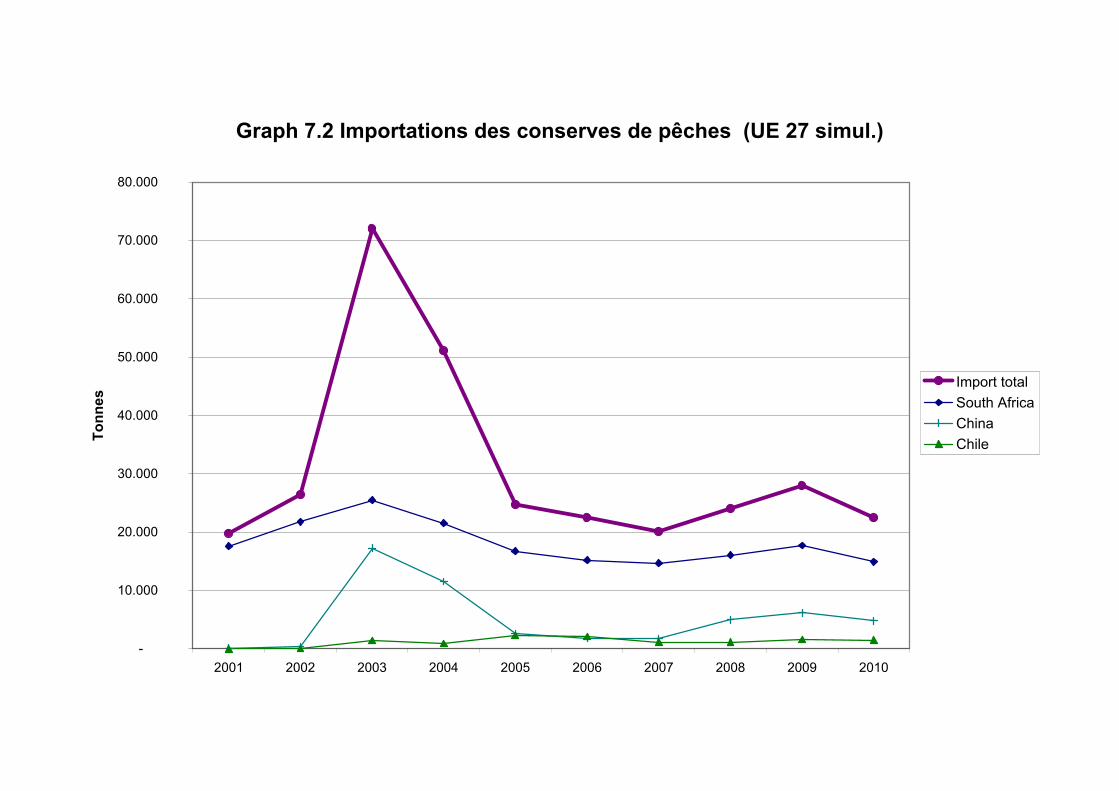
Graph 7.2 Importations des conserves de pêches (UE 27 simul.)
-
10.000
20.000
30.000
40.000
50.000
60.000
70.000
80.000
2001 2002 2003 2004 2005 2006 2007 2008 2009 2010
Tonn
es
Import totalSouth AfricaChinaChile

Source: Comext
Graph 7.3 Prix à l'importation des conserves de pêches (UE 27 simul.)
400
500
600
700
800
900
1.000
1.100
1.200
2001 2002 2003 2004 2005 2006 2007 2008 2009 2010
(€/T
)
Import totalSouth AfricaChinaChile
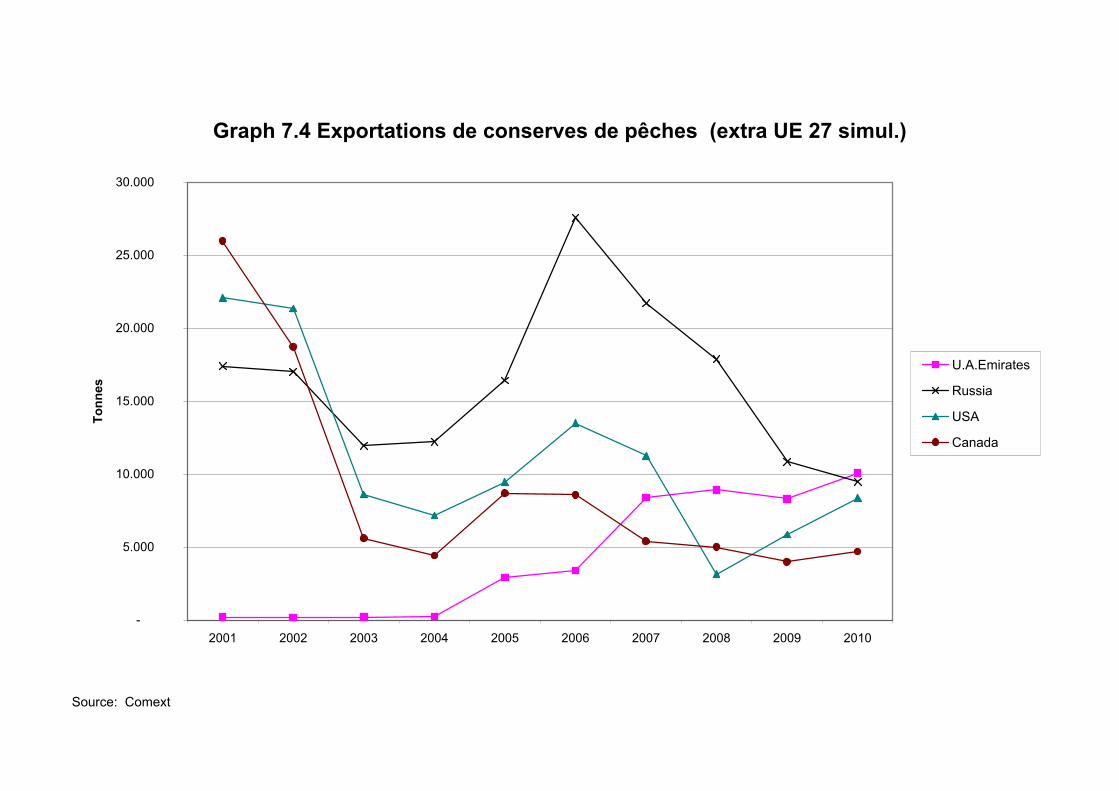
Source: Comext
Graph 7.4 Exportations de conserves de pêches (extra UE 27 simul.)
-
5.000
10.000
15.000
20.000
25.000
30.000
2001 2002 2003 2004 2005 2006 2007 2008 2009 2010
Tonn
es
U.A.Emirates
Russia
USA
Canada
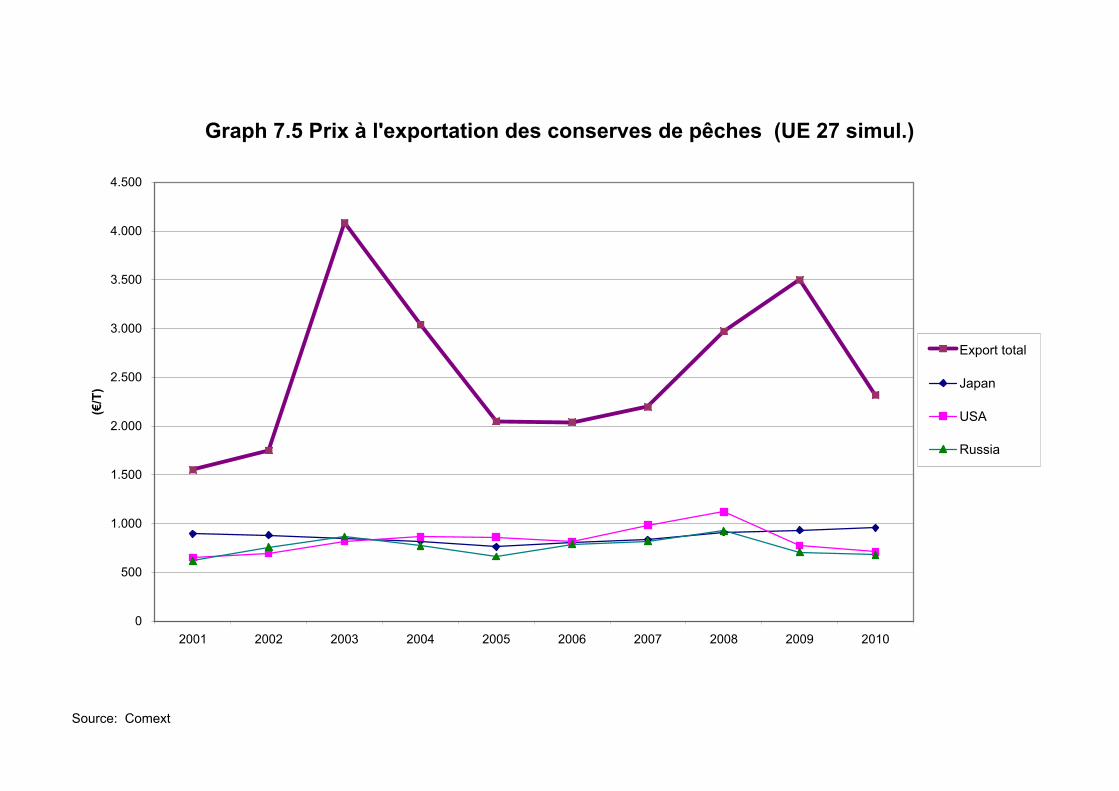
Source: Comext
Graph 7.5 Prix à l'exportation des conserves de pêches (UE 27 simul.)
0
500
1.000
1.500
2.000
2.500
3.000
3.500
4.000
4.500
2001 2002 2003 2004 2005 2006 2007 2008 2009 2010
(€/T
)
Export total
Japan
USA
Russia
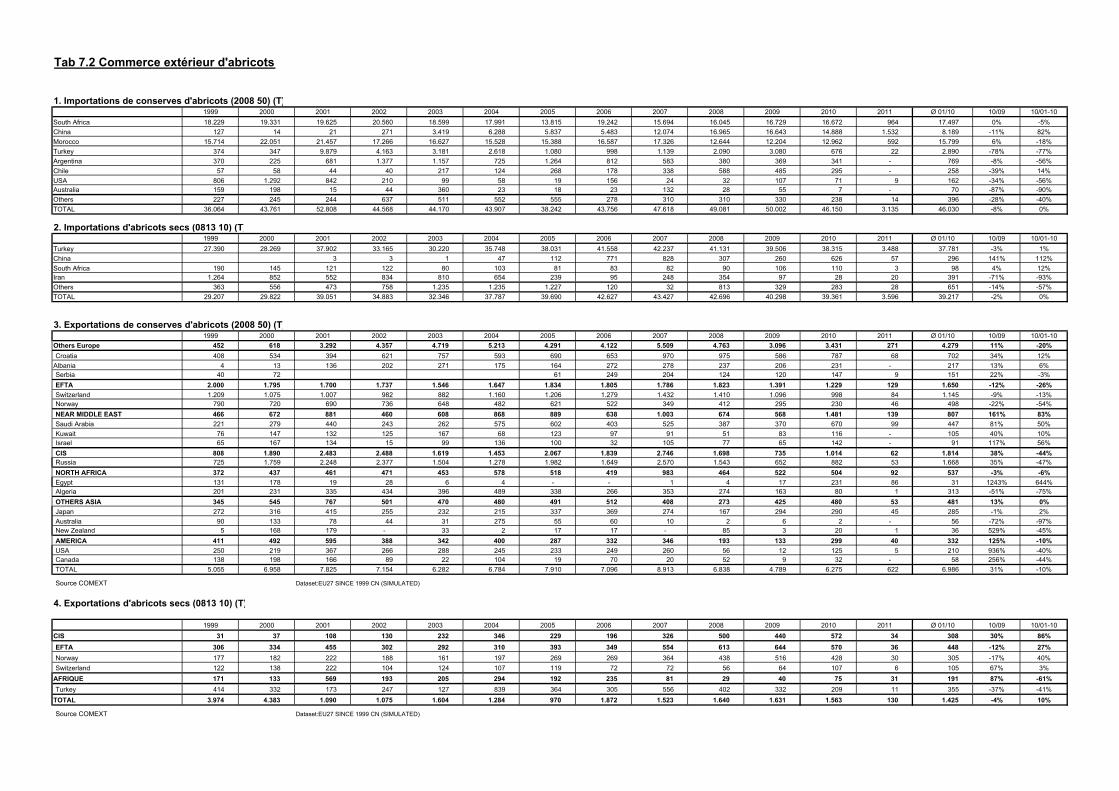
Tab 7.2 Commerce extérieur d'abricots
1. Importations de conserves d'abricots (2008 50) (T) 1999 2000 2001 2002 2003 2004 2005 2006 2007 2008 2009 2010 2011 Ø 01/10 10/09 10/01-10South Africa 18.229 19.331 19.625 20.560 18.599 17.991 13.815 19.242 15.694 16.045 16.729 16.672 964 17.497 0% -5%China 127 14 21 271 3.419 6.288 5.837 5.483 12.074 16.965 16.643 14.888 1.532 8.189 -11% 82%Morocco 15.714 22.051 21.457 17.266 16.627 15.528 15.388 16.587 17.326 12.644 12.204 12.962 592 15.799 6% -18%Turkey 374 347 9.879 4.163 3.181 2.618 1.080 998 1.139 2.090 3.080 676 22 2.890 -78% -77%Argentina 370 225 681 1.377 1.157 725 1.264 812 583 380 369 341 - 769 -8% -56%Chile 57 58 44 40 217 124 268 178 338 588 485 295 - 258 -39% 14%USA 806 1.292 842 210 99 58 19 156 24 32 107 71 9 162 -34% -56%Australia 159 198 15 44 360 23 18 23 132 28 55 7 - 70 -87% -90%Others 227 245 244 637 511 552 555 278 310 310 330 238 14 396 -28% -40%TOTAL 36.064 43.761 52.808 44.568 44.170 43.907 38.242 43.756 47.618 49.081 50.002 46.150 3.135 46.030 -8% 0%
2. Importations d'abricots secs (0813 10) (T) 1999 2000 2001 2002 2003 2004 2005 2006 2007 2008 2009 2010 2011 Ø 01/10 10/09 10/01-10Turkey 27.390 28.269 37.902 33.165 30.220 35.748 38.031 41.558 42.237 41.131 39.506 38.315 3.488 37.781 -3% 1%China 3 3 1 47 112 771 828 307 260 626 57 296 141% 112%South Africa 190 145 121 122 80 103 81 83 82 90 106 110 3 98 4% 12%Iran 1.264 852 552 834 810 654 239 95 248 354 97 28 20 391 -71% -93%Others 363 556 473 758 1.235 1.235 1.227 120 32 813 329 283 28 651 -14% -57%TOTAL 29.207 29.822 39.051 34.883 32.346 37.787 39.690 42.627 43.427 42.696 40.298 39.361 3.596 39.217 -2% 0%
3. Exportations de conserves d'abricots (2008 50) (T) 1999 2000 2001 2002 2003 2004 2005 2006 2007 2008 2009 2010 2011 Ø 01/10 10/09 10/01-10Others Europe 452 618 3.292 4.357 4.719 5.213 4.291 4.122 5.509 4.763 3.096 3.431 271 4.279 11% -20%Croatia 408 534 394 621 757 593 690 653 970 975 586 787 68 702 34% 12%
Albania 4 13 136 202 271 175 164 272 278 237 206 231 - 217 13% 6%Serbia 40 72 61 249 204 124 120 147 9 151 22% -3%EFTA 2.000 1.795 1.700 1.737 1.546 1.647 1.834 1.805 1.786 1.823 1.391 1.229 129 1.650 -12% -26%Switzerland 1.209 1.075 1.007 982 882 1.160 1.206 1.279 1.432 1.410 1.096 998 84 1.145 -9% -13%Norway 790 720 690 736 648 482 621 522 349 412 295 230 46 498 -22% -54%NEAR MIDDLE EAST 466 672 881 460 608 868 889 638 1.003 674 568 1.481 139 807 161% 83%Saudi Arabia 221 279 440 243 262 575 602 403 525 387 370 670 99 447 81% 50%Kuwait 76 147 132 125 167 68 123 97 91 51 83 116 - 105 40% 10%Israel 65 167 134 15 99 136 100 32 105 77 65 142 - 91 117% 56%CIS 808 1.890 2.483 2.488 1.619 1.453 2.067 1.839 2.746 1.698 735 1.014 62 1.814 38% -44%Russia 725 1.759 2.248 2.377 1.504 1.278 1.982 1.649 2.570 1.543 652 882 53 1.668 35% -47%NORTH AFRICA 372 437 461 471 453 578 518 419 983 464 522 504 92 537 -3% -6%Egypt 131 178 19 28 6 4 - - 1 4 17 231 86 31 1243% 644%Algeria 201 231 335 434 396 489 338 266 353 274 163 80 1 313 -51% -75%OTHERS ASIA 345 545 767 501 470 480 491 512 408 273 425 480 53 481 13% 0%Japan 272 316 415 255 232 215 337 369 274 167 294 290 45 285 -1% 2%Australia 90 133 78 44 31 275 55 60 10 2 6 2 - 56 -72% -97%New Zealand 5 168 179 - 33 2 17 17 - 85 3 20 1 36 529% -45%AMERICA 411 492 595 388 342 400 287 332 346 193 133 299 40 332 125% -10%USA 250 219 367 266 288 245 233 249 260 56 12 125 5 210 936% -40%Canada 138 198 166 89 22 104 19 70 20 52 9 32 - 58 256% -44%TOTAL 5.055 6.958 7.825 7.154 6.282 6.784 7.910 7.096 8.913 6.838 4.789 6.275 622 6.986 31% -10%
Source COMEXT Dataset:EU27 SINCE 1999 CN (SIMULATED)
4. Exportations d'abricots secs (0813 10) (T)
1999 2000 2001 2002 2003 2004 2005 2006 2007 2008 2009 2010 2011 Ø 01/10 10/09 10/01-10CIS 31 37 108 130 232 346 229 196 326 500 440 572 34 308 30% 86%EFTA 306 334 455 302 292 310 393 349 554 613 644 570 36 448 -12% 27%Norway 177 182 222 188 161 197 269 269 364 438 516 428 30 305 -17% 40%Switzerland 122 138 222 104 124 107 119 72 72 56 64 107 6 105 67% 3%
AFRIQUE 171 133 569 193 205 294 192 235 81 29 40 75 31 191 87% -61%Turkey 414 332 173 247 127 839 364 305 556 402 332 209 11 355 -37% -41%
TOTAL 3.974 4.383 1.090 1.075 1.604 1.284 970 1.872 1.523 1.640 1.631 1.563 130 1.425 -4% 10%
Source COMEXT Dataset:EU27 SINCE 1999 CN (SIMULATED)
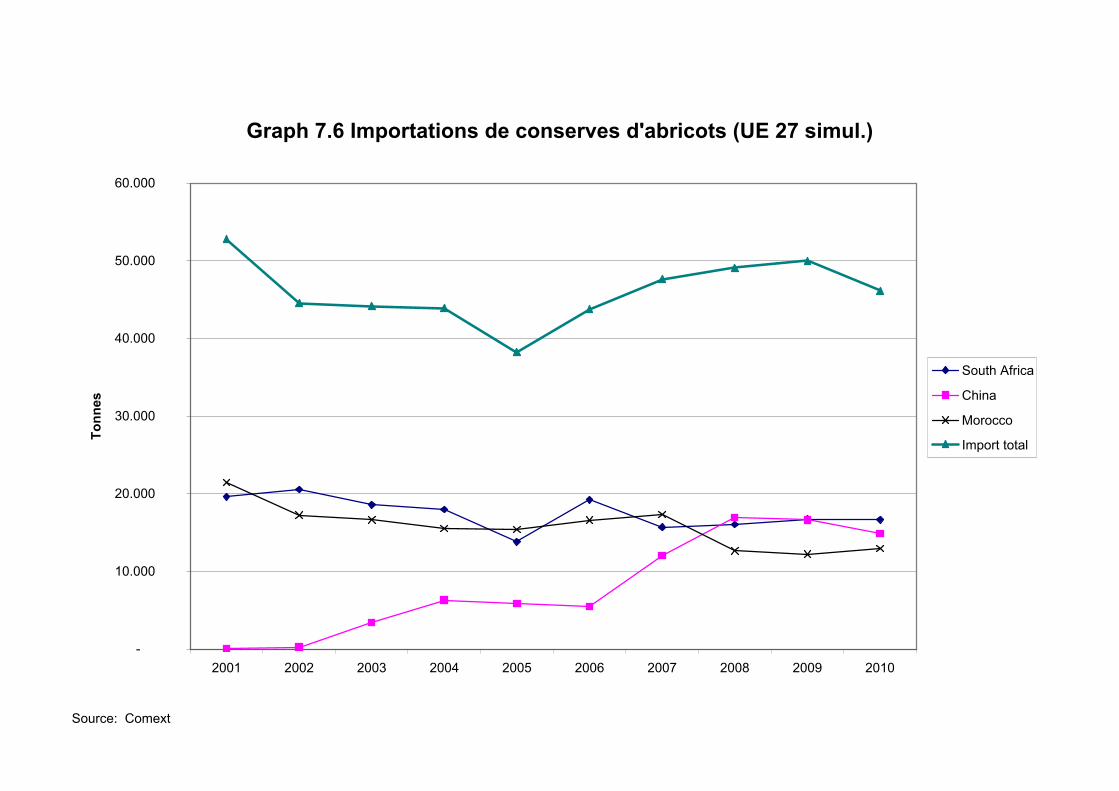
Source: Comext
Graph 7.6 Importations de conserves d'abricots (UE 27 simul.)
-
10.000
20.000
30.000
40.000
50.000
60.000
2001 2002 2003 2004 2005 2006 2007 2008 2009 2010
Tonn
es
South Africa
China
Morocco
Import total
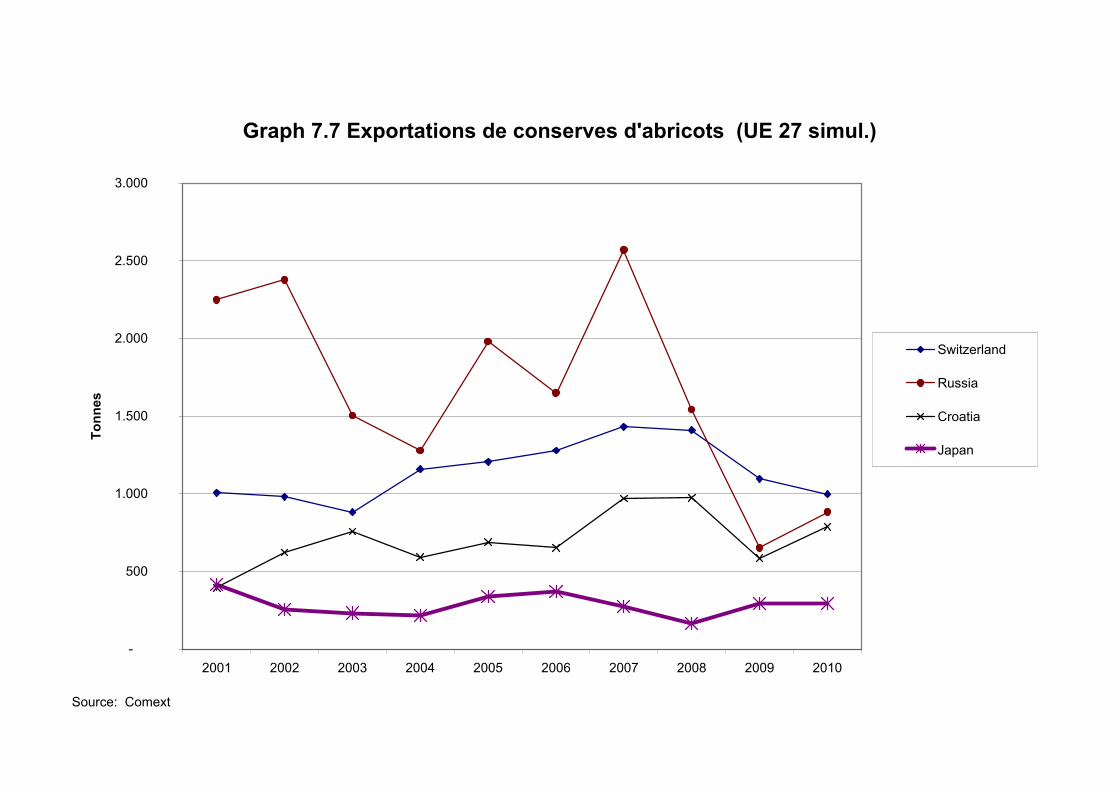
Source: Comext
Graph 7.7 Exportations de conserves d'abricots (UE 27 simul.)
-
500
1.000
1.500
2.000
2.500
3.000
2001 2002 2003 2004 2005 2006 2007 2008 2009 2010
Tonn
es
Switzerland
Russia
Croatia
Japan