Fluorescence techniques to detect and to assess viability ...
COMMUNAUTE FRANCAISE DE BELGIQUE ACADEMIE UNIVERSITAIRE WALLONIE-EUROPE
UNIVERSITE DE LIEGE – GEMBLOUX AGRO-BIO TECH
COST MONITORING IN DAIRY FARMS TO PROMOTE THE VALUE CHAIN OF FRESH MILK IN NORTH VIETNAM
BUI THI NGA
Dissertation originale présentée en vue de l’obtention du grade de
docteur en sciences agronomiques et ingénierie biologique
Membres du Jury:
Monsieur le Professeur FRANCIS F., Président
Messieurs les Professeurs LEBAILLY Ph., Promoteur TRAN, H. C., Co-Promoteur (Université d’agronomie de Hanoi) THEWIS A., Membre BURNY Ph., Membre DOGOT T., Membre VU D. T., Membre (Université d’agronomie de Hanoi) BOUQUIAUX J-M., Membre (Université Catholique de Louvain)
- 2013 -


Copyright Aux termes de la loi belge du 30 juin 1994 sur le droit d’auteur et les droits voisins, seul l’auteur a le droit de reproduire partiellement ou complètement cet ouvrage de quelque façon et de quelque forme que ce soit ou d’en autoriser la reproduction partielle ou complète de quelque manière et sous quelque forme que ce soit. Toute photocopie ou reproduction sous autre forme est donc faite en violation de ladite loi et de ses modifications ultérieures.

DEDICATION
To my beloved family: my parents, my husband and my children

ACKNOWLEDGMENTS
In order to finish the thesis and get this success, I have received many supports and encouragement from many people and institutions that I would gratefully like to acknowledge.
I sincerely thank Professor Lebailly for what he has done for me during my research period. He had created an opportunity and also opened the door for me to enter the world of science, and to research this thesis. He has always oriented me to the right way in the research. He guided me through a suitable research methodology in accordance with the specific conditions of my country. He commented and corrected my thesis patiently and fully. For me, he is not only my promoter, but also my devoted father who helped me, encouraged me in many difficult times along the way of getting the PhD. Deep in my heart, I always remember his grace and will try to become one of his good students.
I would like to thank Professor Tran Huu Cuong, my co-promoter. He has created a motivation for me to study abroad, encouraged and helped me from the first step on the path of this research. Together with Professor Lebailly, he has supported me in the process of implementation of my thesis. He is not only my promoter, but also a good colleague, who is always willing to share with me the difficulties that I encountered during the period of study.
I would also like to thank Professor Philippe Burny for his kindly assistance. He helped me to understand how the agencies such as AWE, CRA-W, etc. support dairy farmers and how the farmers in Wallonie manage and monitor their farms. He also helped me during my time in Belgium as a very good friend, share practical research experience with me and give me necessary aids whenever I need.
During my research period in Belgium, I also received valuable help from various individuals and organizations. I would like to thank Professor Thomas Dogot for giving me many useful advices and consultation; thank François Terrones Gavira for coming with me to the study sites around the Walloon region; thank Nadin, Anne, and Christine for helping me when I studied at the Gembloux. I also thank AWE, CRA-W and dairy farmers in Wallonie for spending time and helping me to understand how to manage and monitor farms.
I would like to thank my friends and colleagues in the Department of Business Management and in the Faculty of Accounting and Business Management, Hanoi University of Agriculture that has encouraged and enabled me to participate and complete this thesis.
My thanks are given to the management board and staffs of Moc Chau dairy plant; and dairy farmers, especially family of Mr. Pham Van Te and Mr. Nguyen Ba Ngoc in Moc Chau District, Son La province for helping me in the process of researching there.
I would like to express my deep gratitude to the University Commission for Development (CUD) for the scholarships that they gave me for my doctoral studies. Thank Professor Dang Vu Binh, Vu Dinh Ton, Joseph Dufey, Mr. Dick Molderez, Madames Maryvonne Aubry, Valérie Voyeux and Lindsay Lebeau for helping me in the procedures for scholarship.
Finally, I would like to thank my whole family: my husband and children, my parents-in-law, brothers and sisters-in-law, my parents, my brothers and sister for helping me and giving me the courage to research and complete the thesis.
I am very thankful for all of you.

Bui Thi Nga (2013). Cost monitoring in dairy farms to promote the value chain of fresh milk in North Vietnam. (PhD in English), Belgium, University of Liège – Gembloux Agro- Bio Tech, 172 p, 38 tables, 48 figures
Summary
In Vietnam, the consumption of dairy products has increased dramatically in recent years due to rising incomes. To meet this growing demand, and reduce imports, the Vietnamese Government has encouraged milk production. In this context, our research is primarily interested in the distribution of value added among the actors within the fresh milk chain observed in the province of Son La.
Our study demonstrates that value added within the fresh milk chain was unequally distributed among actors in the chain in the bias orientation to the non-farmers (non-producer). The key feature in the chain was the dairy farmers, but they were also the most vulnerable actors of the chain. Given the balance of power among the actors, the most appropriate method to promote the added value for dairy producers is to help a better control on their production costs by improving the management at the dairy farm.
In the second part of the work, we are inspired from foreign experience in this field to define an accounting system for technical-economic monitoring of dairy cattle adapted for the situation of Vietnamese farmers. This system has been tested in Moc Chau in an experimental dairy farm to provide data regarding the efficiency and profitability of operations. Dairy farmers were interested in the proposed monitoring system because it allows them to know the level of performance and to compare it to the others. They were interested in revenue generated from costs control. The major constraints in the application of this monitoring in selected farms were the lack of capacity and knowledge from producers.
In conclusion, our study provides an appropriate model for the establishment of a management system of milk production. The most suitable model is to set up an independent agency. The cost of this monitoring was estimated, and scenarios for sustainability have been proposed. Contributing to lower costs through a better understanding of technical and economic performance of farmers, the service management operations will improve the competitiveness of locally produced milk with imported products.

Bui Thi Nga (2013). Coût surveillance dans les fermes laitières pour promouvoir la chaîne de valeur de lait frais dans le Nord du Vietnam. (Doctorat en anglais). Belgique, Université de Liège - Gembloux Agro-Bio Tech, 172 p, 38 tableaux, 48 figures.
Résumé
Au Vietnam, la consommation des produits laitiers a connu une hausse spectaculaire au cours des dernières années suite à l’augmentation des revenus. Afin de répondre à cet accroissement de la demande et de diminuer les importations, le Gouvernement vietnamien a encouragé la production laitière. Dans ce contexte, notre recherche s’est tout d’abord intéressée à la répartition de la valeur ajoutée au niveau des maillons de la filière observée dans la province de Son La.
Notre étude démontre que la valeur ajoutée de la chaîne du lait frais est répartie de façon inégale entre les acteurs de la chaîne au bénéfice de l’aval de la filière. Le maillon essentiel de la chaîne se situe au niveau des producteurs laitiers, mais ces derniers apparaissent comme les plus vulnérables de la chaîne. Compte tenu des rapports de force au niveau des acteurs, la méthode la plus appropriée pour promouvoir la valeur ajoutée pour les producteurs laitiers est de les aider à mieux maîtriser les coûts de production en améliorant la gestion de l’exploitation laitière.
Dans la deuxième partie du travail, nous nous sommes inspiré des expériences étrangères en la matière afin de définir un système comptable de suivi technico-économique des troupeaux laitiers adaptés à la situation des éleveurs vietnamiens. Ce système a été testé à Moc Chau dans des exploitations laitières expérimentales afin de fournir des données relatives à l’efficacité et à la rentabilité de l’exploitation. Les producteurs laitiers se sont montrés intéressés par le système de monitoring proposé car il leur permet de se situer au niveau des performances et de se comparer. Ils sont intéressés par les bénéfices supplémentaires obtenus suite à la maîtrise des coûts. La contrainte majeure dans la généralisation du système de suivi retenu dans les fermes est liée au manque de capacité et de connaissance des producteurs.
En conclusion, notre recherche propose un modèle approprié pour la mise en place d’un système de gestion des performances laitières au départ d'une agence indépendante. Le coût de ce monitoring a été estimé et des scénarios pour sa viabilité ont été proposés. En contribuant à une diminution des coûts par une meilleure connaissance des performances technico-économiques des éleveurs, ce service de gestion des exploitations devrait améliorer la compétitivité du lait produit localement face aux produits importés.

TABLE OF CONTENTS
INTRODUCTION, OBJECTIVES, EXPECTED RESULTS AND SCOPE OF THE STUDY ................................................. 9
INTRODUCTION ................................................................................................................................................ 9
OBJECTIVES OF THE STUDY ............................................................................................................................. 11
GENERAL OBJECTIVE ............................................................................................................................................... 11 SPECIFIC OBJECTIVES .............................................................................................................................................. 11
EXPECTED OUTPUTS AND SCOPE OF THE STUDY ............................................................................................ 12
EXPECTED OUTPUTS ............................................................................................................................................... 12 SCOPE OF THE STUDY ............................................................................................................................................. 12
PART 1 FRESH MILK VALUE CHAIN IN NORTHERN VIETNAM........................................................................... 13
CHAPTER 1 LITERATURE REVIEW AND THEORETICAL FRAMEWORK ............................................................... 15
1.1 LITERATURE REVIEW: VALUE CHAIN AND ITS PROMOTION .................................................................... 15 1.1.1 Conceptual definitions ................................................................................................................... 15 1.1.2 Roles of the value chain approach ................................................................................................ 23 1.1.3 Promotion of the value chain ........................................................................................................ 23
1.2 THEORETICAL FRAMEWORK ................................................................................................................... 29 1.2.1 Value chain theory......................................................................................................................... 29 1.2.2 Economy of scale ........................................................................................................................... 31 1.1.1 Basic factors of farm production ................................................................................................... 33
CHAPTER 2 METHODOLOGY OF THE STUDY AND SITUATION OF DAIRY PRODUCTION IN VIETNAM ............... 35
2.1 METHODOLOGY OF THE STUDY .............................................................................................................. 35 2.1.1 Selection of study sites and survey samples .................................................................................. 35 2.1.2 Method for collecting data ............................................................................................................ 37 2.1.3 Method of analysis ........................................................................................................................ 39 2.1.4 Definition and calculation of economic and financial indicators................................................... 41 2.1.5 Analytical framework .................................................................................................................... 50
2.2 SITUATION OF DAIRY PRODUCTION IN VIETNAM.................................................................................... 57 2.2.1 Basic socioeconomic and agro-ecological characteristics of Vietnam .......................................... 57 2.2.2 Brief history of dairy development in Vietnam .............................................................................. 62 2.2.3 Herd holding pattern ..................................................................................................................... 63 2.2.4 Dairy production ............................................................................................................................ 64 2.2.5 Milk market ................................................................................................................................... 65 2.2.6 Prospects for dairy production in Vietnam .................................................................................... 68 2.2.7 Flow of services and institutions involved in the dairy industry in Vietnam .................................. 69
CHAPTER 3 FRESH MILK VALUE CHAIN IN NORTHERN VIETNAM .................................................................... 71
3.1 ANALYSIS OF THE FRESH MILK CHAIN IN NORTHERN VIETNAM .............................................................. 71 3.1.1 General information about the study site ..................................................................................... 71 3.1.2 Milk chain in Moc Chau ................................................................................................................. 76 3.1.3 Milk distribution channel ............................................................................................................... 78 3.1.4 Value added by dairy farmers ....................................................................................................... 79 3.1.5 Economic calculation and value added by collecting sectors ........................................................ 97 3.1.6 Economic calculation and value added by the dairy processing company (dairy plant) ............... 98 3.1.7 Economic calculation and value added by distributors ................................................................. 99 3.1.8 Milk value chain .......................................................................................................................... 100
3.2 ACTOR ANALYSIS ................................................................................................................................... 101 3.3 DISCUSSION .......................................................................................................................................... 104
PART 2 METHODOLOGY FOR THE APPLICATION OF A COST-MONITORING SYSTEM AND MANAGEMENT OF
DAIRY FARMS IN VIETNAM .......................................................................................................................... 105
CHAPTER 4 MONITORING SYSTEM AND MANAGEMENT OF DAIRY FARMS AROUND
THE WORLD, FOCUSING ON THE WALLOON REGION OF BELGIUM ............................................................... 107
4.1 MONITORING SYSTEM AND MANAGEMENT OF DAIRY FARMS ............................................................. 107 4.1.1 Management and farm management ......................................................................................... 107 4.1.2 Management of dairy farms ....................................................................................................... 109 4.1.3 Monitoring system of dairy farms ............................................................................................... 109
4.2 EXPERIENCE OF MONITORING AND MANAGEMENT OF DAIRY FARMS AROUND THE WORLD, FOCUSING
ON THE WALLOON REGION ............................................................................................................................ 110 4.2.1 Experience of monitoring dairy farms in European countries ..................................................... 110 4.2.2 Monitoring and management system in dairy farms within the Walloon region ....................... 114 4.2.3 Monitoring and management system in dairy farms in the Netherlands ................................... 118 4.2.4 Monitoring and management system in dairy farms in New Zealand ........................................ 122 4.2.5 Monitoring and management system of dairy farms in Australia .............................................. 126
4.3 LESSON LEARNED FOR VIETNAMESE DAIRY FARMERS .......................................................................... 130
CHAPTER 5 METHODOLOGY FOR THE APPLICATION OF THE COST-MONITORING SYSTEM
AND MANAGEMENT ON DAIRY FARMS IN VIETNAM ................................................................................... 133
5.1 FARMS CHOSEN TO APPLY A MONITORING SYSTEM ............................................................................. 133 5.1.1 Farms chosen ............................................................................................................................... 133 5.1.2 Requirements for a form to record farm transactions ................................................................ 134
5.2 CONTENT OF THE MONITORING SYSTEM .............................................................................................. 135 5.2.1 Monitoring of input ..................................................................................................................... 135 5.2.2 Monitoring of processing activities on farms .............................................................................. 136 5.2.3 Monitoring of outputs ................................................................................................................. 138
5.3 SHORT-TERM COST MONITORING AND MANAGEMENT ON FARMS .................................................... 139 5.3.1 Objective...................................................................................................................................... 139 5.3.2 Establishment of a system for collecting information ................................................................. 139 5.3.3 Training farmers on how to record the information ................................................................... 144 5.3.4 Recording the information .......................................................................................................... 144 5.3.5 Processing and analyzing the information .................................................................................. 146
5.4 LONG-TERM MONITORING IN FARMS................................................................................................... 146 5.4.1 Objectives .................................................................................................................................... 146 5.4.2 Decision making based on monitoring system and management on farms ............................... 147
CHAPTER 6 RESULTS OF THE APPLICATION OF COST MONITORING
ON NORTHERN VIETNAM DAIRY FARMS ...................................................................................................... 149
6.1 INTEREST OF DAIRY FARMERS DURING PERIOD OF APPLICATION OF COST-MONITORING SYSTEM ..... 149 6.1.1 Methodology to get results ......................................................................................................... 149 6.1.2 Interest of the dairy farmers ....................................................................................................... 153
6.2 DIFFICULTIES AND LIMITATIONS IN APPLYING THE MONITORING SYSTEM IN VIETNAM ...................... 156 6.2.1 Difficulties and limitations ........................................................................................................... 156 6.2.2 Recommendations ....................................................................................................................... 159
6.3 FUTURE APPLICATION OF THE COST-MONITORING SYSTEM ................................................................ 161 6.3.1 Model for future application of cost monitoring on farms .......................................................... 161 6.3.2 Future application of the monitoring system on dairy farms in Vietnam.................................... 162
CONCLUSIONS AND RECOMMENDATION ..................................................................................................... 171
CONCLUSIONS ................................................................................................................................................ 171 RECOMMENDATIONS ..................................................................................................................................... 172
REFERENCES ................................................................................................................................................. 173
ANNEX ......................................................................................................................................................... 183
LIST OF FIGURES
Figure 1. Porter Generic Value chain – Popular visualization .......................................................... 16
Figure 2. Illustration of a supply chain ............................................................................................. 19
Figure 3. Process of Value Chain analysis ........................................................................................ 24
Figure 4. Value chains upgrading strategy ....................................................................................... 26
Figure 5. Value chain promoting strategy ....................................................................................... 27
Figure 6. Stages of the value chain .................................................................................................. 29
Figure 7. Illustration of economies of scale ..................................................................................... 32
Figure 8. The study site .................................................................................................................... 36
Figure 9. Analytical framework of the study ................................................................................... 51
Figure 10. Technical method for on-farm experiment ...................................................................... 52
Figure 11. Conceptual framework ..................................................................................................... 55
Figure 12. Economic growth .............................................................................................................. 58
Figure 13. Proportion of GDP at constant 1994 prices by economic sector ..................................... 58
Figure 14. Agricultural production in Vietnam 1990-2011 at comparative prices of 1994 ............... 61
Figure 15. Numbers of major animals in Vietnam 2000–2010 .......................................................... 62
Figure 16. Dairy production in Vietnam ............................................................................................. 64
Figure 17. Milk consumption in comparison with the increase in income 1996–2006 ..................... 65
Figure 18. Milk consumption 1990–2010 .......................................................................................... 65
Figure 19. Milk consumption versus production per capita in Vietnam ........................................... 66
Figure 20. Imported quantity of milk in Vietnam .............................................................................. 66
Figure 21. Major milk exporters to Vietnam in first 9 months of 2012 ............................................. 67
Figure 22. CAGR of milk products in Vietnam ................................................................................... 69
Figure 23. Flow of services/ information/inputs in the dairy industry in Vietnam ........................... 70
Figure 24. Milk production in the region ........................................................................................... 72
Figure 25. Milk production in the region ........................................................................................... 72
Figure 26. Numbers and proportion of dairy cattle by production unit in Moc Chau....................... 74
Figure 27. Milk production by unit .................................................................................................... 74
Figure 28. Proportions of the herd by age ......................................................................................... 75
Figure 29. Basic actors and stakeholders in the Moc Chau milk chain .............................................. 76
Figure 30. Milk distribution channel .................................................................................................. 78
Figure 31. Numbers of dairy cows and farms in Belgium and Wallonia .......................................... 114
Figure 32. Dairy herd size in Belgium and Wallonia ........................................................................ 114
Figure 33. Quantity of milk provided in Belgium ............................................................................. 115
Figure 34. Quantity of milk provided in Wallonia ............................................................................ 115
Figure 35. Situations of using an accounting system at dairy farms in Wallonia ............................ 116
Figure 36. Impressions of the organizational structure of the NRS ................................................. 122
Figure 37. Number of dairy farms in Australia and Victoria state ................................................... 127
Figure 38. Number of cows in Australia and Victoria state ............................................................. 127
Figure 39. Demand for applying a monitoring system in farms ...................................................... 133
Figure 40. Requirements for the form ............................................................................................. 134
Figure 41. Presenting margin of results to the dairy farmers (farm 8) ............................................ 150
Figure 42. Presenting costs to the dairy farmers (farm 10) ............................................................. 150
Figure 43. Dairy farmer’s evaluation of the monitoring system application ................................... 154
Figure 44. Dairy farmers’ evaluation of the monitoring method .................................................... 154
Figure 45. Dairy farmers’ evaluation of the content of the monitoring system.............................. 155
Figure 46. Most important variables for farmers ............................................................................ 155
Figure 47. Difficulties and limitations in applying the monitoring system on farms ....................... 156
Figure 48. Expected organizational structure of the monitoring agency ........................................ 164
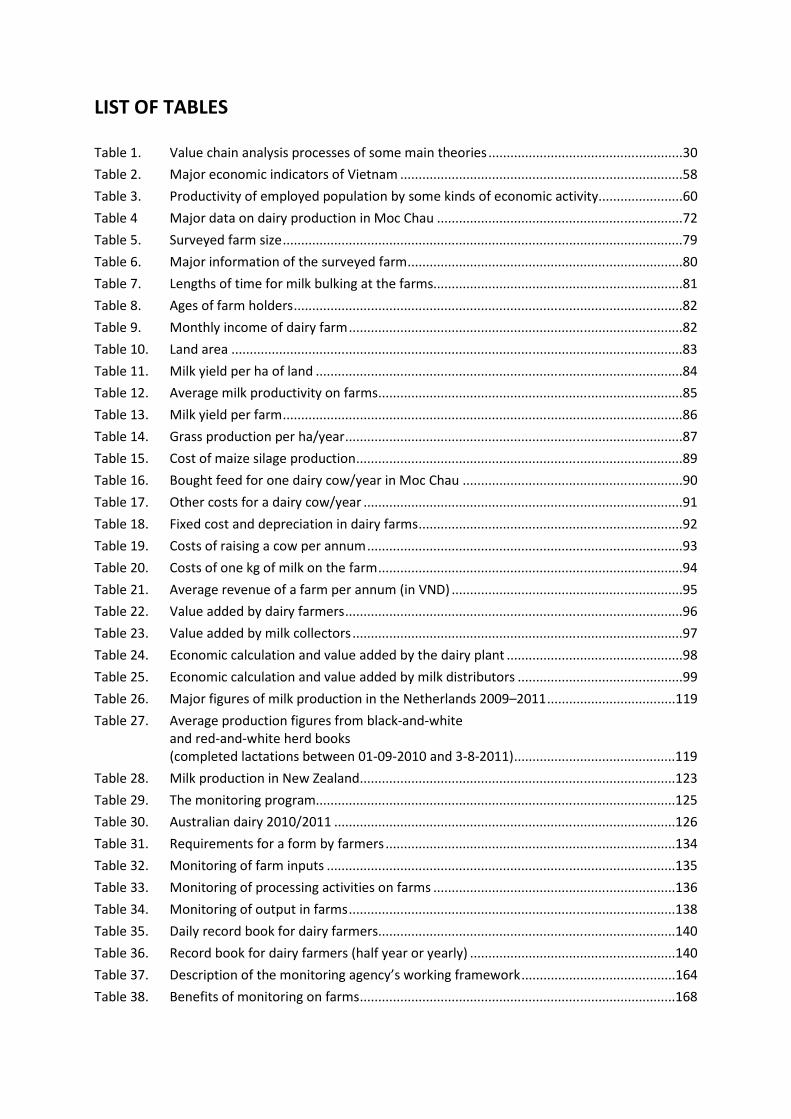
LIST OF TABLES
Table 1. Value chain analysis processes of some main theories .....................................................30
Table 2. Major economic indicators of Vietnam .............................................................................58
Table 3. Productivity of employed population by some kinds of economic activity .......................60
Table 4 Major data on dairy production in Moc Chau ...................................................................72
Table 5. Surveyed farm size .............................................................................................................79
Table 6. Major information of the surveyed farm ...........................................................................80
Table 7. Lengths of time for milk bulking at the farms....................................................................81
Table 8. Ages of farm holders ..........................................................................................................82
Table 9. Monthly income of dairy farm ...........................................................................................82
Table 10. Land area ...........................................................................................................................83
Table 11. Milk yield per ha of land ....................................................................................................84
Table 12. Average milk productivity on farms ...................................................................................85
Table 13. Milk yield per farm .............................................................................................................86
Table 14. Grass production per ha/year ............................................................................................87
Table 15. Cost of maize silage production .........................................................................................89
Table 16. Bought feed for one dairy cow/year in Moc Chau ............................................................90
Table 17. Other costs for a dairy cow/year .......................................................................................91
Table 18. Fixed cost and depreciation in dairy farms ........................................................................92
Table 19. Costs of raising a cow per annum ......................................................................................93
Table 20. Costs of one kg of milk on the farm ...................................................................................94
Table 21. Average revenue of a farm per annum (in VND) ...............................................................95
Table 22. Value added by dairy farmers ............................................................................................96
Table 23. Value added by milk collectors ..........................................................................................97
Table 24. Economic calculation and value added by the dairy plant ................................................98
Table 25. Economic calculation and value added by milk distributors .............................................99
Table 26. Major figures of milk production in the Netherlands 2009–2011 ...................................119
Table 27. Average production figures from black-and-white
and red-and-white herd books
(completed lactations between 01-09-2010 and 3-8-2011) ............................................119
Table 28. Milk production in New Zealand ......................................................................................123
Table 29. The monitoring program..................................................................................................125
Table 30. Australian dairy 2010/2011 .............................................................................................126
Table 31. Requirements for a form by farmers ...............................................................................134
Table 32. Monitoring of farm inputs ...............................................................................................135
Table 33. Monitoring of processing activities on farms ..................................................................136
Table 34. Monitoring of output in farms .........................................................................................138
Table 35. Daily record book for dairy farmers .................................................................................140
Table 36. Record book for dairy farmers (half year or yearly) ........................................................140
Table 37. Description of the monitoring agency’s working framework ..........................................164
Table 38. Benefits of monitoring on farms ......................................................................................168

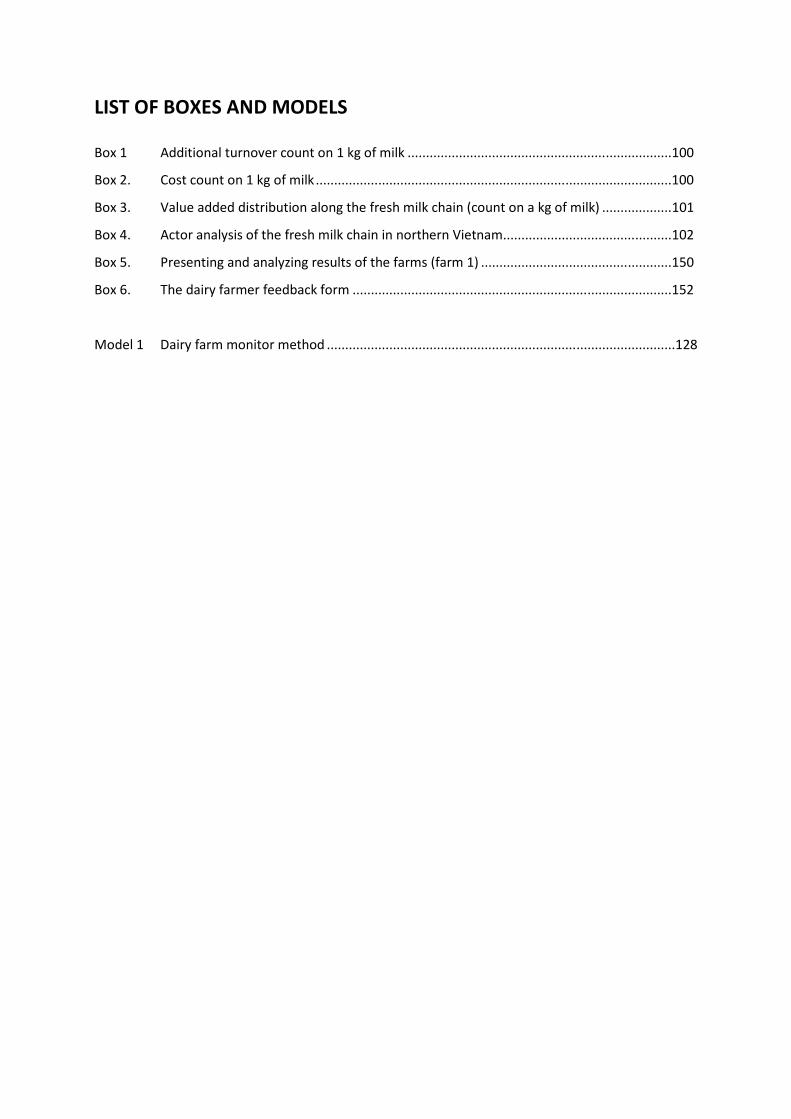
LIST OF BOXES AND MODELS
Box 1 Additional turnover count on 1 kg of milk ........................................................................100
Box 2. Cost count on 1 kg of milk .................................................................................................100
Box 3. Value added distribution along the fresh milk chain (count on a kg of milk) ...................101
Box 4. Actor analysis of the fresh milk chain in northern Vietnam ..............................................102
Box 5. Presenting and analyzing results of the farms (farm 1) ....................................................150
Box 6. The dairy farmer feedback form .......................................................................................152
Model 1 Dairy farm monitor method ...............................................................................................128

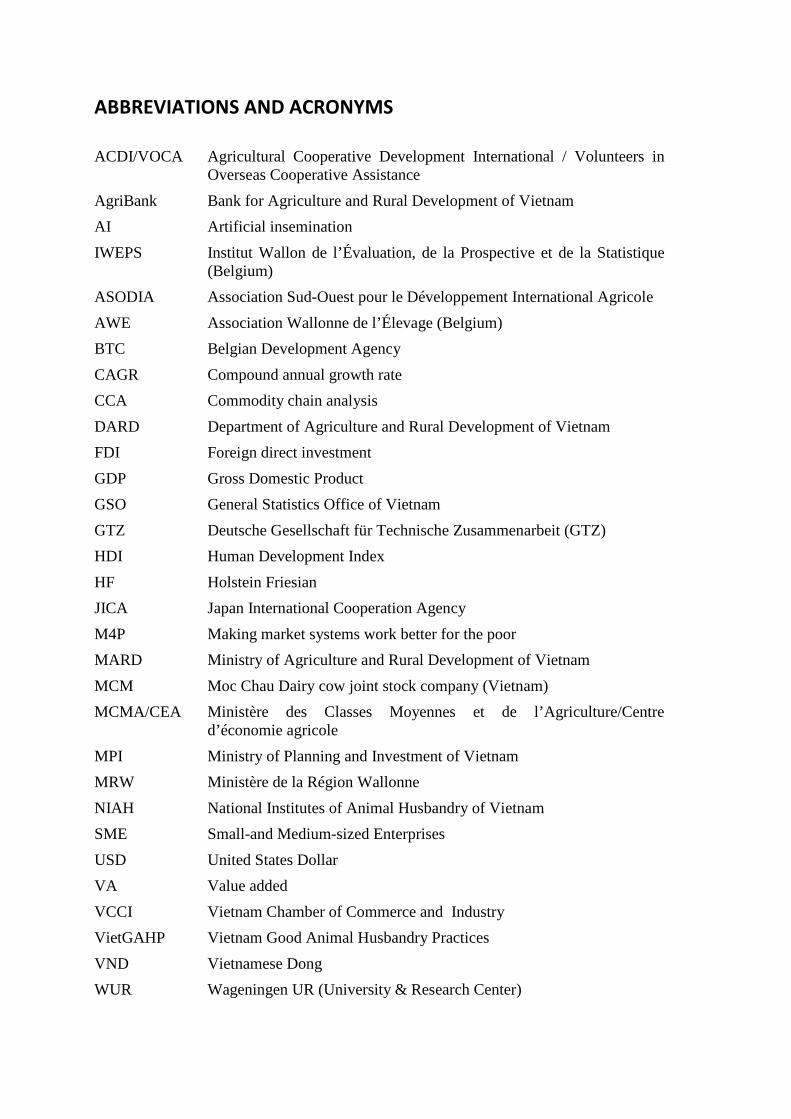
ABBREVIATIONS AND ACRONYMS
ACDI/VOCA Agricultural Cooperative Development International / Volunteers in Overseas Cooperative Assistance
AgriBank Bank for Agriculture and Rural Development of Vietnam
AI Artificial insemination
IWEPS Institut Wallon de l’Évaluation, de la Prospective et de la Statistique (Belgium)
ASODIA Association Sud-Ouest pour le Développement International Agricole
AWE Association Wallonne de l’Élevage (Belgium)
BTC Belgian Development Agency
CAGR Compound annual growth rate
CCA Commodity chain analysis
DARD Department of Agriculture and Rural Development of Vietnam
FDI Foreign direct investment
GDP Gross Domestic Product
GSO General Statistics Office of Vietnam
GTZ Deutsche Gesellschaft für Technische Zusammenarbeit (GTZ)
HDI Human Development Index
HF Holstein Friesian
JICA Japan International Cooperation Agency
M4P Making market systems work better for the poor
MARD Ministry of Agriculture and Rural Development of Vietnam
MCM Moc Chau Dairy cow joint stock company (Vietnam)
MCMA/CEA Ministère des Classes Moyennes et de l’Agriculture/Centre d’économie agricole
MPI Ministry of Planning and Investment of Vietnam
MRW Ministère de la Région Wallonne
NIAH National Institutes of Animal Husbandry of Vietnam
SME Small-and Medium-sized Enterprises
USD United States Dollar
VA Value added
VCCI Vietnam Chamber of Commerce and Industry
VietGAHP Vietnam Good Animal Husbandry Practices
VND Vietnamese Dong
WUR Wageningen UR (University & Research Center)

INTRODUCTION, OBJECTIVES, EXPECTED RESULTS
AND SCOPE OF THE STUDY
INTRODUCTION
By the end of 2012, Vietnam’s population numbered 88.78 million, of which 59.97 million live in rural areas, accounting for 67.48% of the total; 44.86 million were women. Of the country’s workforce, 70.3% live and work in rural areas.1 Creating jobs, generating income, and improving the living standard for people in rural areas are of considerable concern in Vietnam. Agricultural growth is central to poverty reduction in rural areas.2 Therefore, it plays a significant role in the sustainable development of the country.
In recent years, agricultural production in Vietnam has changed. It is no longer a rice-producing monoculture. Types of businesses and production have been diversified, as have crops and livestock raising. In particular, dairy farming and milk production have become relatively effective components of an expanding agro-industry. It is also an important branch within the policy of restructuring the agricultural economy.
A large market for milk exists in Vietnam. And milk consumption in Vietnam is increasing rapidly.3 However, the dairy industry in Vietnam currently meets only 22 percent of the domestic demand (in 2012); the shortfall in demand for dairy products has been met by imports from overseas suppliers and producers.4 This situation makes Vietnam dependent on the foreign market. In addition, there is some distortion in the milk market in Vietnam which, in turn, leads to fluctuations in the price of milk. In such a context, farmers are easily vulnerable. It also leads to reduced production effectiveness throughout the chain. Promotion of the milk value chain through cost monitoring on farms is a move that would contribute to rural development within the country.
Firstly, this initiative would contribute to economic development and to sustainable development. It would help increase the earnings of stakeholders in the chain. That would help develop the local economy, enlarge the market, and improve business conditions.5 Secondly, farm performance and effectiveness would be improved. With a good cost-monitoring system, farms would be assisted to operate more efficiently. This would provide a basis for more effective labor distribution, land use, and exploitation of capital. Thirdly, it would help dairymen to develop themselves through creative initiative and increased knowledge, as well as generate more employment and earnings in the agricultural sector.6 Achieving those goals involves an activity that provides a nutritious, healthful food daily. The end result will be to enable the milk industry to become more independent in the sense of not relying so much on foreign input.
1 GSO, 2013
2 Humphrey, 2006
3 Nancy, 2008
4 MARD, 2013
5 GTZ-SME, 2008
6 Andreas, 2008
10 Introduction, objectives, expected results and scope of the study
Numerous earlier studies have concentrated on this value chain. In Vietnam, an economic and technical cooperation program funded by the German government (GTZ-SME) helped Vietnam to establish and improve a value chain of ornamental trees in Nam Dinh province, tourism in Danang, rattan handicraft production in Quang Nam, coffee in Dak Lak, safe vegetable growing in An Giang, avocadoes in Dak Lak, pangasius fish farming in An Giang and longan fruit in Hung Yen.
These programs have proven that promoting the value chain is meaningful for the development of the farmers. The action creates employment for them, increases their income, enhances their knowledge, and improves their living standard.7 However, in a comprehensive value chain in general and that of milk in particular, farmers who produce and distribute products are forced to bear the largest share of the cost but their corresponding earnings are the lowest and their growth rate lower, especially when it comes to value added.
A case study to estimate the cost of a value chain of rice in Vietnam and Cambodia showed that farmers bore 56.1% of the total cost, with a profitability margin of only about 20%.8 Intangibles such as the distribution and marketing phases, often account for a larger share of the final price of a good than do its manufacturing costs.9
One research project analyzed the stakeholder costs and benefits in a tea value chain in Vietnam10 and found similar results. The farmers had to invest the most but earned the least in terms of proportion of benefit. The highest proportion of benefit came to the retailers. Farmers who joined the export market earned the most in comparison to those who sold in the domestic market.
The Mekong Delta Development Research Institute11 analyzed the pangasius fish value chain and reported that there was an unequal distribution of benefits. Farmers always got the lower proportion of value added in comparison to collectors, retailers, and export manufacturing companies. Statistics showed that farmers got only 19.4% of the total benefits, retailers 2.1% and export manufacturing companies 78.5%. The research recommends that in order to achieve sustainable development, farmers must be in the center of development and be given due consideration.
Although there are many studies about value chains, it seems that none of them has tackled promotion the fresh milk value chain in northern Vietnam. Nor has there has not been any doctoral research on this issue. Besides, milk is a fresh food, highly subject to spoilage and hence waste. Dairymen are affected by the harsh natural conditions of Vietnam such as high temperatures, humidity, and heavy seasonal rains. Thus, they are confronted with increased risk and vulnerability. In addition, it seems that there is an unequal distribution of earnings among actors in the dairy value chain, in which the producers seem to be losers.
Questions have been asked: Is there any way to improve the earnings of dairymen? What should be the approach? To improve the earnings of the dairymen, one way is to promote the value of the whole chain.
There are many methods to promote a value chain: (i) strengthen private business linkages and associations to cooperate better across production stages, increase competitiveness of the whole chain and improve the quality, reliability, and volumes of supply; (ii) enhance collaboration between public agencies and the private sector to enhance the socio-economic 7 GTZ-SME, 2008
8 WB/GDS, 2007; Lebailly et al., 2007
9 Kaplinsky, 2000; Lebailly et al., 2007
10 Ipsard, 2007; Lebailly et al., 2007
11 Can Tho University, 2007

Introduction, objectives, expected results and scope of the study 11
and environmental conditions and impose a positive impact on the overall business and investment climate; (iii) strengthen services in the value chain to provide adequate quantity, quality, and price-effectiveness for essential services (such as input delivery, maintenance, transport, or advertising), along with delivery of additional information, improved technology, higher skills, better logistics and product innovation; and (iv) monitor and manage to track implementation progress, evaluate performance, identify the impact of initiatives and reinforce the prospects for achieving better results.12
Given the current state of affairs in Vietnam, in order to enhance the fresh milk value chain with emphasis on the welfare of dairy farmers and their getting added value from it, the most suitable method is seen to be helping them to exploit effectively internal factors on farms and to improve their performance with support from external sources. This study entitled Cost monitoring in dairy farms to promote the fresh milk value chain in north Vietnam fills a critical need.
OBJECTIVES OF THE STUDY
General objective
This study aims to promote benefits and value added for dairy farmers in north Vietnam in particular and for dairymen in general through applying a cost-monitoring system on farms for better operation and performance and to improve equality among all actors in the milk chain.
Specific objectives
The study intends to:
• Get insight into the characteristics of the fresh milk value chain in northern Vietnam, the role and function of actors in the chain, as well as explore the linkages among actors and stakeholders.
• Define the flows of milk, the information pattern, the distribution of added value among fresh milk chain actors in northern Vietnam;
• Determine the main problems and key obstacles that must be overcome to enhance dairy farmer earnings and equality throughout the chain.
• Research the method of applying a monitoring system in some countries, especially in the Walloon region of Belgium, and define the methodology for applying a cost-monitoring system on farms in Vietnam.
• Apply on some dairy farms in northern Vietnam an experimental cost-monitoring system.
• Highlight the positive implications of promoting the fresh milk value chain through cost-monitoring on farms in northern Vietnam.
12
GTZ-SME, 2008
12 Introduction, objectives, expected results and scope of the study
EXPECTED OUTPUTS AND SCOPE OF THE STUDY
Expected outputs
1) A systematic theory of the milk value chain for the use of policymakers in Vietnam’s agricultural sector.
2) An examination of the natural and socio-economic aspects of the fresh milk value chain and their impacts on the production processes of dairymen in northern Vietnam.
3) Scientific articles on the topic.
4) Model of a cost-monitoring system for dairy farms, which can contribute to increase performance and effectiveness of the farms in Vietnam.
5) Recommendations to dairymen and policymakers about the potential positive effects of promoting the fresh milk value chain through cost monitoring in farms.
6) Documents for researchers, lecturers, and students and future study on promotion of the value chain through cost monitoring in farms.
Scope of the study
Promoting the fresh milk value chain through cost monitoring on farms being a very broad subject, the study concerns itself with:
(i) The chain of fresh cow’s milk production, focusing on dairy farmers in Moc Chau district, Son La province, in Vietnam because, until now, Vietnam is a country that depends heavily on imported milk. Fresh milk is usually always just delivered to domestic customers.
(ii) The vertical chain with horizontal supports will be investigated.
(iii) Concentration mainly on improving benefits for and the welfare of dairy farmers who are the most vulnerable actors in the chain.
PART 1
FRESH MILK VALUE CHAIN IN NORTHERN VIETNAM

CHAPTER 1
LITERATURE REVIEW AND THEORETICAL FRAMEWORK
This chapter begins with a review of literature on the value chain and promotion of the value chain. Some basic definitions such as value chain, fresh milk value chain, and relevant concepts will be reviewed. Then the role of the value chain approach will be presented, followed by promotion of the value chain. The chapter concludes with some theories regarding the value chain.
1.1 LITERATURE REVIEW: VALUE CHAIN AND ITS PROMOTION
1.1.1 Conceptual definitions
Changes in international trade, including reduced transport costs, advances in telecommunications technology, and lower policy barriers have fueled a rapid increase in global integration. The international flows of goods and services, capital, technology, ideas, and people offer great opportunities to boost growth and reduce poverty by stimulating productivity and efficiency, providing access to new markets and ideas, as well as expanding the range of consumer choice. At the same time, these changes have created new challenges, including inequality, along with the need to increase the quality and sophistication of goods and services, and cost-effective approaches to compete with regional and international competitors (Bolnick B., Camoens A., & Zislin J., 2005; Kaplinsky and Morris, 2000).13
The development and business communities involved in the agriculture and agribusiness sectors have recently shown a tremendous resurgence of interest in promoting value chains as a way to add value, diversify rural economies, and contribute to increased rural household incomes. Value chains are increasingly recognized as a means to reduce the prevalence of rural poverty (Martin W. et al., 2007).14
1.1.1.1 Value chain
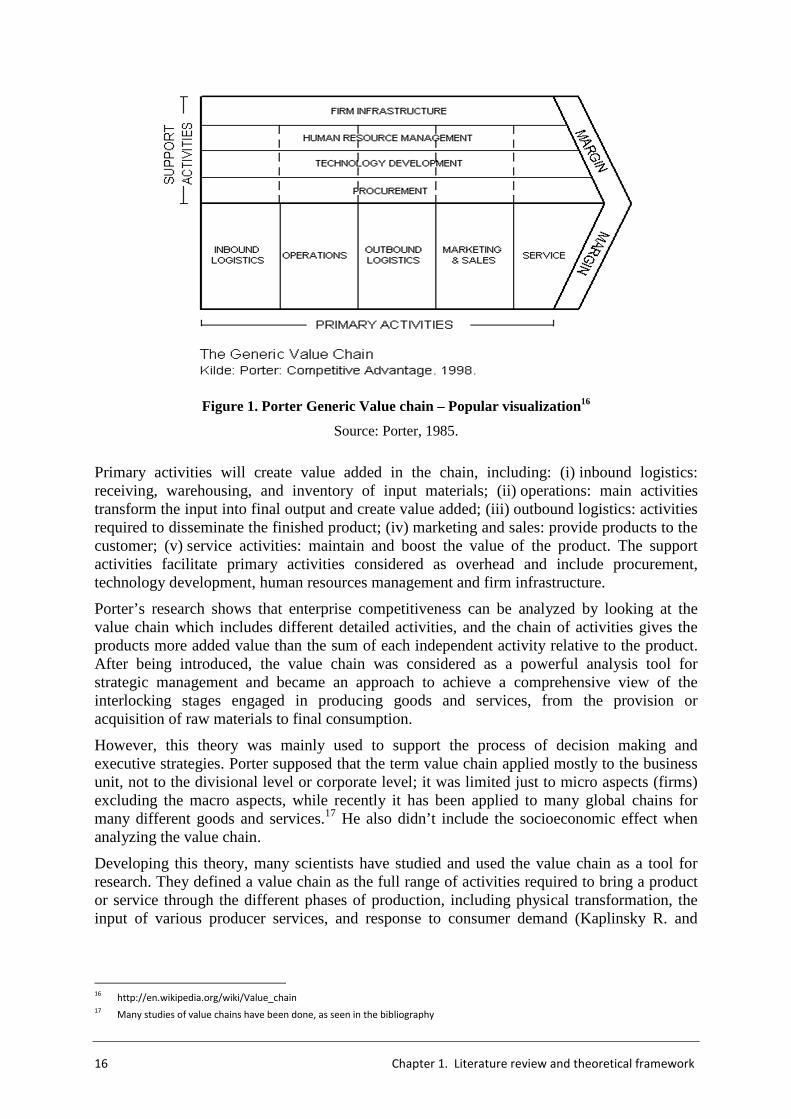
Value chain is a concept from business management, which was first introduced and described in 1985 by Michael Porter (Porter, M. E., 1996).15 It comes across firstly as a chain of activities that are operated in a specific industry in which products pass through all activities of the chain in order, and at each stage the product gains some value. It is illustrated as in the following figure:
13
Bolnick B., Camoens A., & Zislin J. 2005. p. 14; and Kaplinsky and Morris (2000), p1 14
Martin W. et al. (2007), p 1 15
Porter, M. E. (1996). What is strategy? Harvard Business Review, November–December, 61–78
16 Chapter 1. Literature review and theoretical framework
Figure 1. Porter Generic Value chain – Popular visualization16
Source: Porter, 1985.
Primary activities will create value added in the chain, including: (i) inbound logistics: receiving, warehousing, and inventory of input materials; (ii) operations: main activities transform the input into final output and create value added; (iii) outbound logistics: activities required to disseminate the finished product; (iv) marketing and sales: provide products to the customer; (v) service activities: maintain and boost the value of the product. The support activities facilitate primary activities considered as overhead and include procurement, technology development, human resources management and firm infrastructure.
Porter’s research shows that enterprise competitiveness can be analyzed by looking at the value chain which includes different detailed activities, and the chain of activities gives the products more added value than the sum of each independent activity relative to the product. After being introduced, the value chain was considered as a powerful analysis tool for strategic management and became an approach to achieve a comprehensive view of the interlocking stages engaged in producing goods and services, from the provision or acquisition of raw materials to final consumption.
However, this theory was mainly used to support the process of decision making and executive strategies. Porter supposed that the term value chain applied mostly to the business unit, not to the divisional level or corporate level; it was limited just to micro aspects (firms) excluding the macro aspects, while recently it has been applied to many global chains for many different goods and services.17 He also didn’t include the socioeconomic effect when analyzing the value chain.
Developing this theory, many scientists have studied and used the value chain as a tool for research. They defined a value chain as the full range of activities required to bring a product or service through the different phases of production, including physical transformation, the input of various producer services, and response to consumer demand (Kaplinsky R. and
16
http://en.wikipedia.org/wiki/Value_chain 17
Many studies of value chains have been done, as seen in the bibliography
Chapter 1. Literature review and theoretical framework 17
Morris M., 2000).18 As such, value chains include the vertically linked interdependent processes that generate value to the consumer.
The focus of the value chain is on relationships among the various actors involved in the chain and on their implication for development (Humphrey and Schumitz, 2002). The literature on value chains emphasizes the importance in the quasi-hierarchical type of governance, distinguishing between coordination by buyers (buyer-driven chains) and those in which producers take the key role (producer-driven chains) (Gereffi, 1994). However, it seems that buyer-driven chains are coming to the fore due to the increasing concentration of retailing in developed countries (Dolan and Humphrey, 2000)
According to other scientists, the idea of a value chain is very simply focused upon the activities needed to turn raw materials into finished products and sell them, as well as on the value added at each link (Gereffi, 1999; Kaplinsky and Readman, 2001; UNIDO, 2002). It embraces the socioeconomic system of interdependent actors performing a sequence of value-adding activities required to bring a product from conception to consumption (Kaplinsky, 2000; Gereffi et al., 2001; Schmitz, 2005; Kula et al., 2006; Altenburg, 2006; GTZ, 2007, Molina, 2010).
The global value chain is a new perspective. It is assumed that individual companies rarely undertake alone the full range of activities to bring a product/service from conception to the market, but it involves a chain of activities divided between distinct enterprises. These enterprises may often be located at different places. When the enterprises involved in a value chain are found in different countries, it is called a global value chain.
Value chains naturally represent the linkages of different producers and marketing companies who work together to pursue one or more end markets. Participants sometimes collaborate to enhance the overall competitiveness of the final product, but may also be completely incognizant of the relationship between their operation and other upstream or downstream participants. Value chains help to pull together all the factors of production (land, labor, capital, etc.), as well as all economic activities (input supply, production, processing, handling, transport, etc.) to create, sell, and deliver a product to a certain destination (John C. K., 2006).19
GTZ supposed that value chain is an economic system composed of operators, operational service providers and their business linkages at the micro level, and support service providers at the meso level (GTZ, 2007).20 All operators that add value to a particular marketable product on its way from raw material to the last consumer are considered part of the value chain. The system boundary of a value chain is defined by the final product, and the value chain itself comprises those producers and enterprises that perform functions necessary to bring the product to market. According to the sequence of functions and operators, value chains consist of a series of chain links (GTZ, 2007).21
As a summarization of the foregoing definition, this study defines:
Value chain as including various actors and stakeholders collaborating vertically and horizontally with each other to bring a product or service through the different phases from input supply to the final product with the aim of increasing the value added for all actors and relevant stakeholders along the chain.
18
Kaplinsky, Raphael and Michael Morris, 2000, p 4 19
John C. K. (2006), p8 20
GTZ (2007), module 1, p2 21
GTZ (2007), p 6
18 Chapter 1. Literature review and theoretical framework
Thus, value chain consists first of vertical direct functions such as: primary production, collection, processing, distribution of products and services done by various actors to bring a raw material to the point of retailing the final product. Second, there are horizontal supporting functions such as input supply, financial services, transport, packaging, advertising, etc. to lead to achieving the goal of maximizing the value added and equality for each actor and relevant stakeholders along the chain.
1.1.1.2 Fresh milk value chain
This paper attempts to take an in-depth look into the fresh milk value chain to discover its nature. In this paper, the fresh milk value chain refers to the various stages through which fresh milk produced on dairy farms passes from the farm to the final consumer. It will be considered as:
• A sequence of related business activities (functions) from the provision of specific inputs required to keep the dairy cattle to milk production, collection (bulking and cooling), pasteurizing and packaging, right up to the final sale of fresh milk to consumers (the functional view of a value chain).
• The set of operators performing these functions, including the dairyman (milk producer), the milk collector, the milk processor (dairy plant), and finally the traders and distributors of fresh milk. These operators are linked by a series of business transactions in which fresh milk is passed on from the initial milk producer to end consumers.22
1.1.1.3 Relevant concepts and different connotations of the value chain concept
Since the 1970s, many economists have studied the relationships between firms. Value chains have become a significant concept in their approach. However, the meaning and connotation of the value chain differ, depending on the researcher’s disciplinary focus. Some style themselves as logisticians (from a management perspective), while others refer to themselves depending on their impact on specific locations, and again, others focus on technological aspects. Although there are many different ways of looking at the value chain concept, it can be seen as comprising five main categories.
+ The management science perspective
Strategic management focuses upon the differences between core and non-core competencies and explains the choices of firms: the make-or-buy decision. Firms need to consider the costs and benefits of in-house production versus outsourcing in a dynamic perspective (Quinn, Hilmer, 1994; Mahoney, 1992; Altenburg, 2007). If they choose to buy inputs from outside, they have to consider future situations such as risks, cost arisings, etc. The forward linkage was introduced to reduce risk and cost for firms.
Boundaries of firms appear when firms enhance the trade of products and services across boundaries. New forms of nonmarketable coordination between core firms and associated producers appear to make standards and procedures compatible and reduce transaction costs.
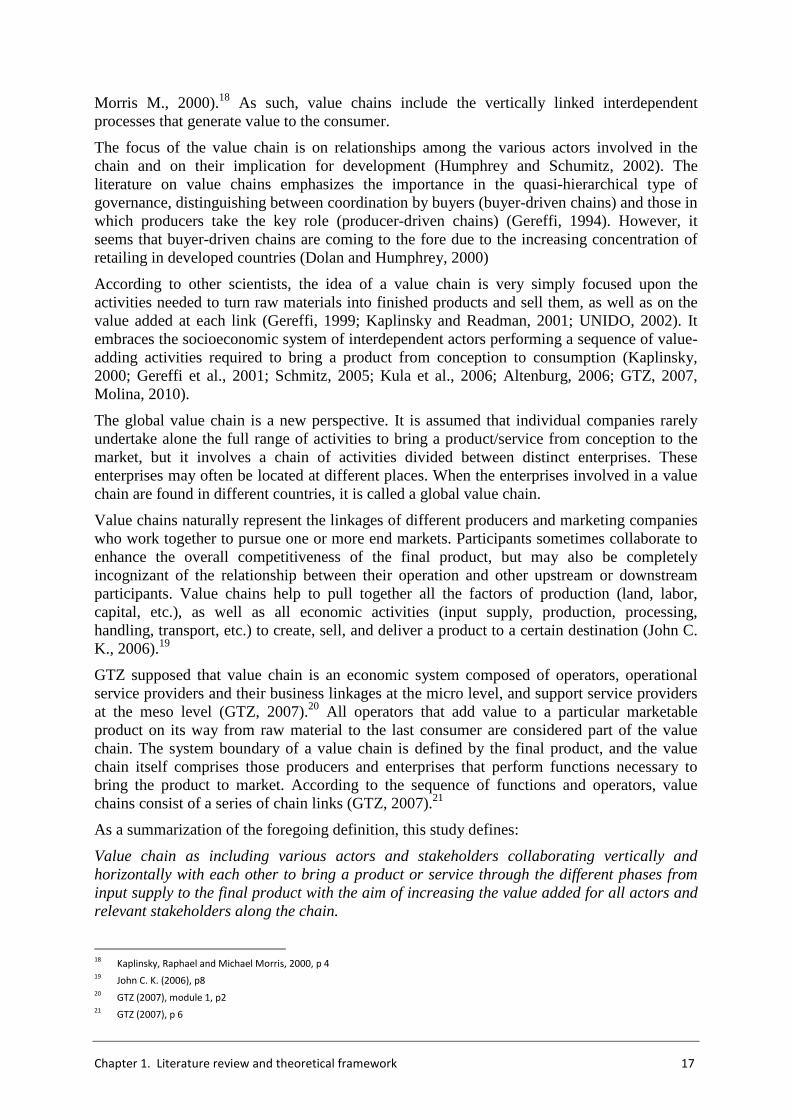
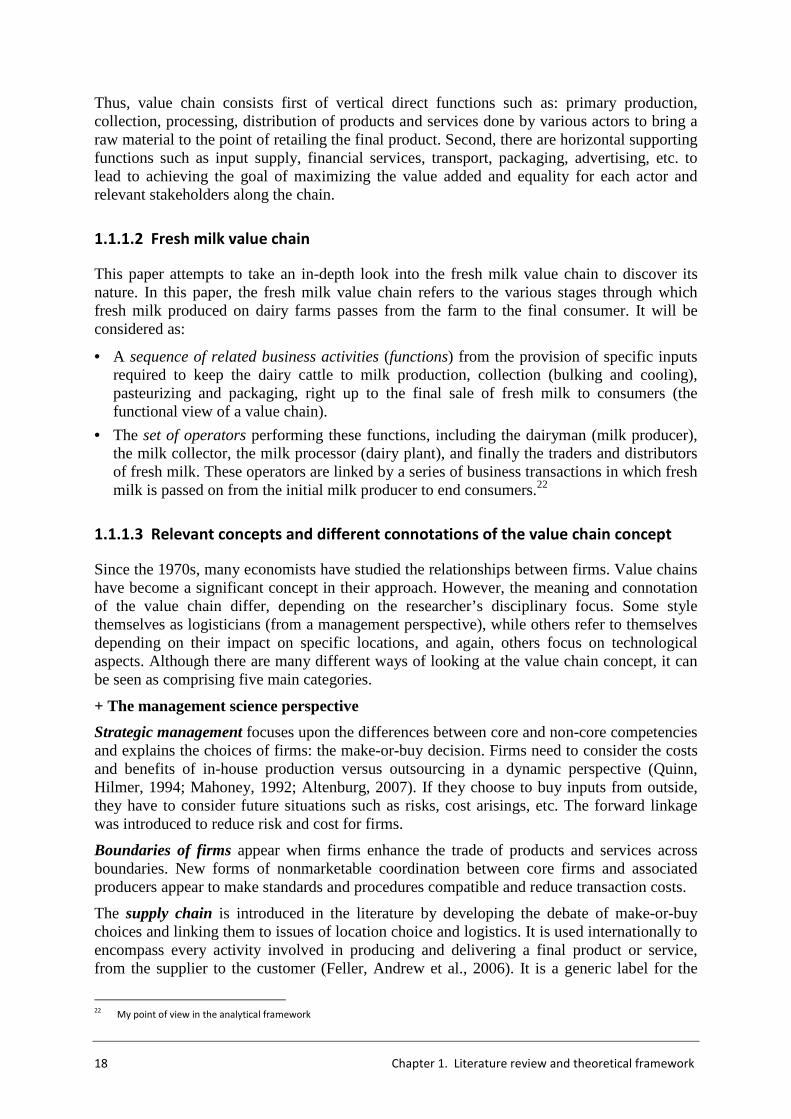
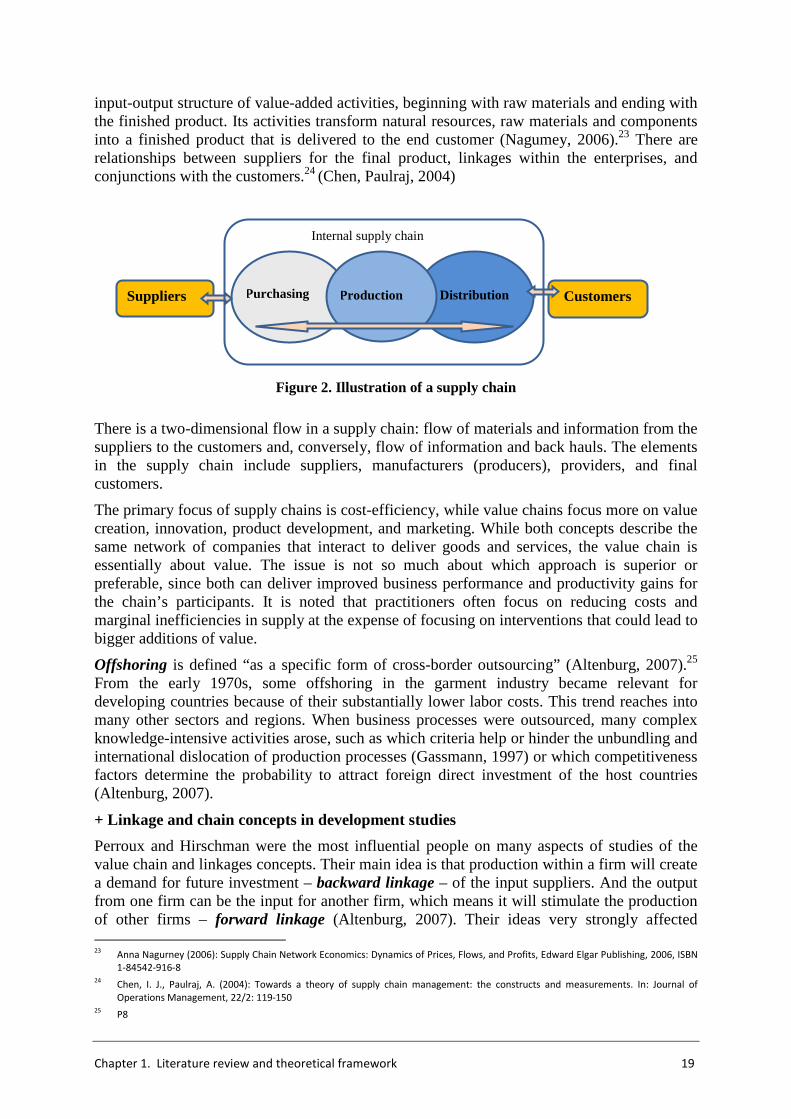
The supply chain is introduced in the literature by developing the debate of make-or-buy choices and linking them to issues of location choice and logistics. It is used internationally to encompass every activity involved in producing and delivering a final product or service, from the supplier to the customer (Feller, Andrew et al., 2006). It is a generic label for the
22
My point of view in the analytical framework
Chapter 1. Literature review and theoretical framework 19
input-output structure of value-added activities, beginning with raw materials and ending with the finished product. Its activities transform natural resources, raw materials and components into a finished product that is delivered to the end customer (Nagumey, 2006).23 There are relationships between suppliers for the final product, linkages within the enterprises, and conjunctions with the customers.24 (Chen, Paulraj, 2004)
Figure 2. Illustration of a supply chain
There is a two-dimensional flow in a supply chain: flow of materials and information from the suppliers to the customers and, conversely, flow of information and back hauls. The elements in the supply chain include suppliers, manufacturers (producers), providers, and final customers.
The primary focus of supply chains is cost-efficiency, while value chains focus more on value creation, innovation, product development, and marketing. While both concepts describe the same network of companies that interact to deliver goods and services, the value chain is essentially about value. The issue is not so much about which approach is superior or preferable, since both can deliver improved business performance and productivity gains for the chain’s participants. It is noted that practitioners often focus on reducing costs and marginal inefficiencies in supply at the expense of focusing on interventions that could lead to bigger additions of value.
Offshoring is defined “as a specific form of cross-border outsourcing” (Altenburg, 2007).25 From the early 1970s, some offshoring in the garment industry became relevant for developing countries because of their substantially lower labor costs. This trend reaches into many other sectors and regions. When business processes were outsourced, many complex knowledge-intensive activities arose, such as which criteria help or hinder the unbundling and international dislocation of production processes (Gassmann, 1997) or which competitiveness factors determine the probability to attract foreign direct investment of the host countries (Altenburg, 2007).
+ Linkage and chain concepts in development studies
Perroux and Hirschman were the most influential people on many aspects of studies of the value chain and linkages concepts. Their main idea is that production within a firm will create a demand for future investment – backward linkage – of the input suppliers. And the output from one firm can be the input for another firm, which means it will stimulate the production of other firms – forward linkage (Altenburg, 2007). Their ideas very strongly affected 23
Anna Nagurney (2006): Supply Chain Network Economics: Dynamics of Prices, Flows, and Profits, Edward Elgar Publishing, 2006, ISBN
1-84542-916-8 24
Chen, I. J., Paulraj, A. (2004): Towards a theory of supply chain management: the constructs and measurements. In: Journal of
Operations Management, 22/2: 119-150 25
P8
Suppliers Customers Purchasing
Distribution
Production
Internal supply chain
20 Chapter 1. Literature review and theoretical framework
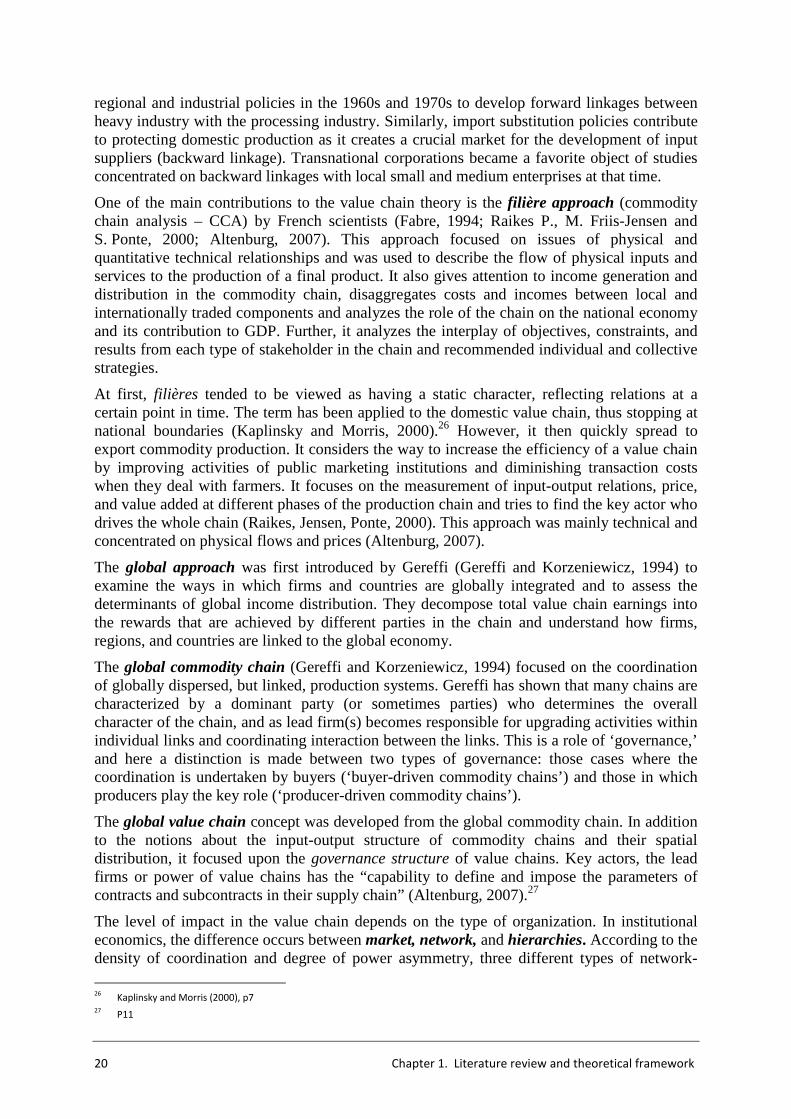
regional and industrial policies in the 1960s and 1970s to develop forward linkages between heavy industry with the processing industry. Similarly, import substitution policies contribute to protecting domestic production as it creates a crucial market for the development of input suppliers (backward linkage). Transnational corporations became a favorite object of studies concentrated on backward linkages with local small and medium enterprises at that time.
One of the main contributions to the value chain theory is the filière approach (commodity chain analysis – CCA) by French scientists (Fabre, 1994; Raikes P., M. Friis-Jensen and S. Ponte, 2000; Altenburg, 2007). This approach focused on issues of physical and quantitative technical relationships and was used to describe the flow of physical inputs and services to the production of a final product. It also gives attention to income generation and distribution in the commodity chain, disaggregates costs and incomes between local and internationally traded components and analyzes the role of the chain on the national economy and its contribution to GDP. Further, it analyzes the interplay of objectives, constraints, and results from each type of stakeholder in the chain and recommended individual and collective strategies.
At first, filières tended to be viewed as having a static character, reflecting relations at a certain point in time. The term has been applied to the domestic value chain, thus stopping at national boundaries (Kaplinsky and Morris, 2000).26 However, it then quickly spread to export commodity production. It considers the way to increase the efficiency of a value chain by improving activities of public marketing institutions and diminishing transaction costs when they deal with farmers. It focuses on the measurement of input-output relations, price, and value added at different phases of the production chain and tries to find the key actor who drives the whole chain (Raikes, Jensen, Ponte, 2000). This approach was mainly technical and concentrated on physical flows and prices (Altenburg, 2007).
The global approach was first introduced by Gereffi (Gereffi and Korzeniewicz, 1994) to examine the ways in which firms and countries are globally integrated and to assess the determinants of global income distribution. They decompose total value chain earnings into the rewards that are achieved by different parties in the chain and understand how firms, regions, and countries are linked to the global economy.
The global commodity chain (Gereffi and Korzeniewicz, 1994) focused on the coordination of globally dispersed, but linked, production systems. Gereffi has shown that many chains are characterized by a dominant party (or sometimes parties) who determines the overall character of the chain, and as lead firm(s) becomes responsible for upgrading activities within individual links and coordinating interaction between the links. This is a role of ‘governance,’ and here a distinction is made between two types of governance: those cases where the coordination is undertaken by buyers (‘buyer-driven commodity chains’) and those in which producers play the key role (‘producer-driven commodity chains’).
The global value chain concept was developed from the global commodity chain. In addition to the notions about the input-output structure of commodity chains and their spatial distribution, it focused upon the governance structure of value chains. Key actors, the lead firms or power of value chains has the “capability to define and impose the parameters of contracts and subcontracts in their supply chain” (Altenburg, 2007).27
The level of impact in the value chain depends on the type of organization. In institutional economics, the difference occurs between market, network, and hierarchies. According to the density of coordination and degree of power asymmetry, three different types of network-
26
Kaplinsky and Morris (2000), p7 27
P11
Chapter 1. Literature review and theoretical framework 21
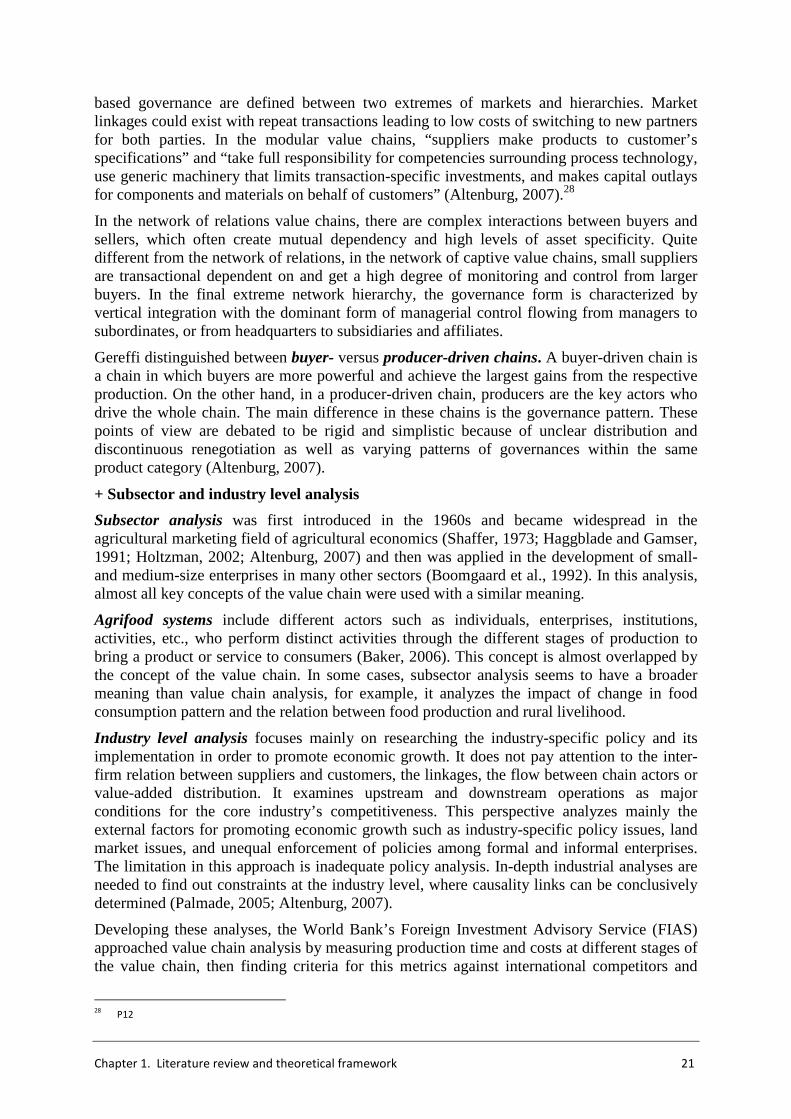
based governance are defined between two extremes of markets and hierarchies. Market linkages could exist with repeat transactions leading to low costs of switching to new partners for both parties. In the modular value chains, “suppliers make products to customer’s specifications” and “take full responsibility for competencies surrounding process technology, use generic machinery that limits transaction-specific investments, and makes capital outlays for components and materials on behalf of customers” (Altenburg, 2007).28
In the network of relations value chains, there are complex interactions between buyers and sellers, which often create mutual dependency and high levels of asset specificity. Quite different from the network of relations, in the network of captive value chains, small suppliers are transactional dependent on and get a high degree of monitoring and control from larger buyers. In the final extreme network hierarchy, the governance form is characterized by vertical integration with the dominant form of managerial control flowing from managers to subordinates, or from headquarters to subsidiaries and affiliates.
Gereffi distinguished between buyer- versus producer-driven chains. A buyer-driven chain is a chain in which buyers are more powerful and achieve the largest gains from the respective production. On the other hand, in a producer-driven chain, producers are the key actors who drive the whole chain. The main difference in these chains is the governance pattern. These points of view are debated to be rigid and simplistic because of unclear distribution and discontinuous renegotiation as well as varying patterns of governances within the same product category (Altenburg, 2007).
+ Subsector and industry level analysis
Subsector analysis was first introduced in the 1960s and became widespread in the agricultural marketing field of agricultural economics (Shaffer, 1973; Haggblade and Gamser, 1991; Holtzman, 2002; Altenburg, 2007) and then was applied in the development of small- and medium-size enterprises in many other sectors (Boomgaard et al., 1992). In this analysis, almost all key concepts of the value chain were used with a similar meaning.
Agrifood systems include different actors such as individuals, enterprises, institutions, activities, etc., who perform distinct activities through the different stages of production to bring a product or service to consumers (Baker, 2006). This concept is almost overlapped by the concept of the value chain. In some cases, subsector analysis seems to have a broader meaning than value chain analysis, for example, it analyzes the impact of change in food consumption pattern and the relation between food production and rural livelihood.
Industry level analysis focuses mainly on researching the industry-specific policy and its implementation in order to promote economic growth. It does not pay attention to the inter-firm relation between suppliers and customers, the linkages, the flow between chain actors or value-added distribution. It examines upstream and downstream operations as major conditions for the core industry’s competitiveness. This perspective analyzes mainly the external factors for promoting economic growth such as industry-specific policy issues, land market issues, and unequal enforcement of policies among formal and informal enterprises. The limitation in this approach is inadequate policy analysis. In-depth industrial analyses are needed to find out constraints at the industry level, where causality links can be conclusively determined (Palmade, 2005; Altenburg, 2007).
Developing these analyses, the World Bank’s Foreign Investment Advisory Service (FIAS) approached value chain analysis by measuring production time and costs at different stages of the value chain, then finding criteria for this metrics against international competitors and
28
P12
22 Chapter 1. Literature review and theoretical framework
prioritizing policy interventions accordingly. It is “to detect policy and market failures rather than pro-active strengthening of individual firms or groups of firms” (Altenburg, 2007).
+ Network concepts
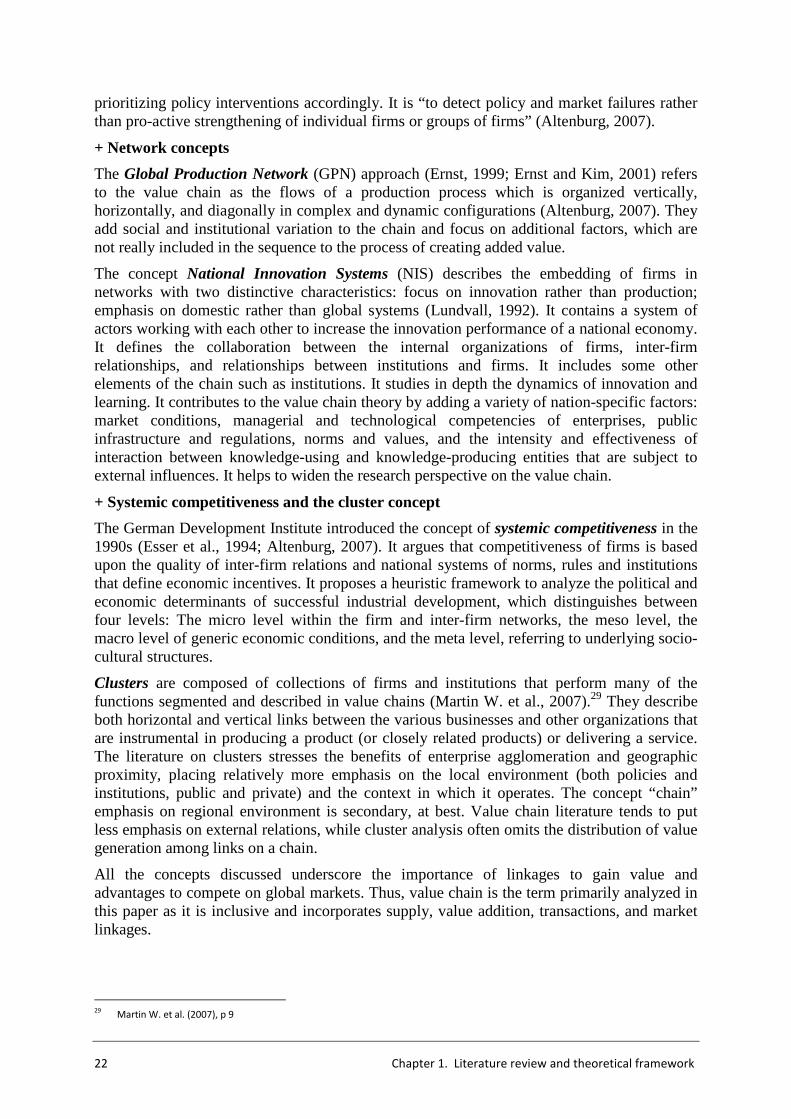
The Global Production Network (GPN) approach (Ernst, 1999; Ernst and Kim, 2001) refers to the value chain as the flows of a production process which is organized vertically, horizontally, and diagonally in complex and dynamic configurations (Altenburg, 2007). They add social and institutional variation to the chain and focus on additional factors, which are not really included in the sequence to the process of creating added value.
The concept National Innovation Systems (NIS) describes the embedding of firms in networks with two distinctive characteristics: focus on innovation rather than production; emphasis on domestic rather than global systems (Lundvall, 1992). It contains a system of actors working with each other to increase the innovation performance of a national economy. It defines the collaboration between the internal organizations of firms, inter-firm relationships, and relationships between institutions and firms. It includes some other elements of the chain such as institutions. It studies in depth the dynamics of innovation and learning. It contributes to the value chain theory by adding a variety of nation-specific factors: market conditions, managerial and technological competencies of enterprises, public infrastructure and regulations, norms and values, and the intensity and effectiveness of interaction between knowledge-using and knowledge-producing entities that are subject to external influences. It helps to widen the research perspective on the value chain.
+ Systemic competitiveness and the cluster concept
The German Development Institute introduced the concept of systemic competitiveness in the 1990s (Esser et al., 1994; Altenburg, 2007). It argues that competitiveness of firms is based upon the quality of inter-firm relations and national systems of norms, rules and institutions that define economic incentives. It proposes a heuristic framework to analyze the political and economic determinants of successful industrial development, which distinguishes between four levels: The micro level within the firm and inter-firm networks, the meso level, the macro level of generic economic conditions, and the meta level, referring to underlying socio-cultural structures.
Clusters are composed of collections of firms and institutions that perform many of the functions segmented and described in value chains (Martin W. et al., 2007).29 They describe both horizontal and vertical links between the various businesses and other organizations that are instrumental in producing a product (or closely related products) or delivering a service. The literature on clusters stresses the benefits of enterprise agglomeration and geographic proximity, placing relatively more emphasis on the local environment (both policies and institutions, public and private) and the context in which it operates. The concept “chain” emphasis on regional environment is secondary, at best. Value chain literature tends to put less emphasis on external relations, while cluster analysis often omits the distribution of value generation among links on a chain.
All the concepts discussed underscore the importance of linkages to gain value and advantages to compete on global markets. Thus, value chain is the term primarily analyzed in this paper as it is inclusive and incorporates supply, value addition, transactions, and market linkages.
29
Martin W. et al. (2007), p 9
Chapter 1. Literature review and theoretical framework 23
1.1.2 Roles of the value chain approach
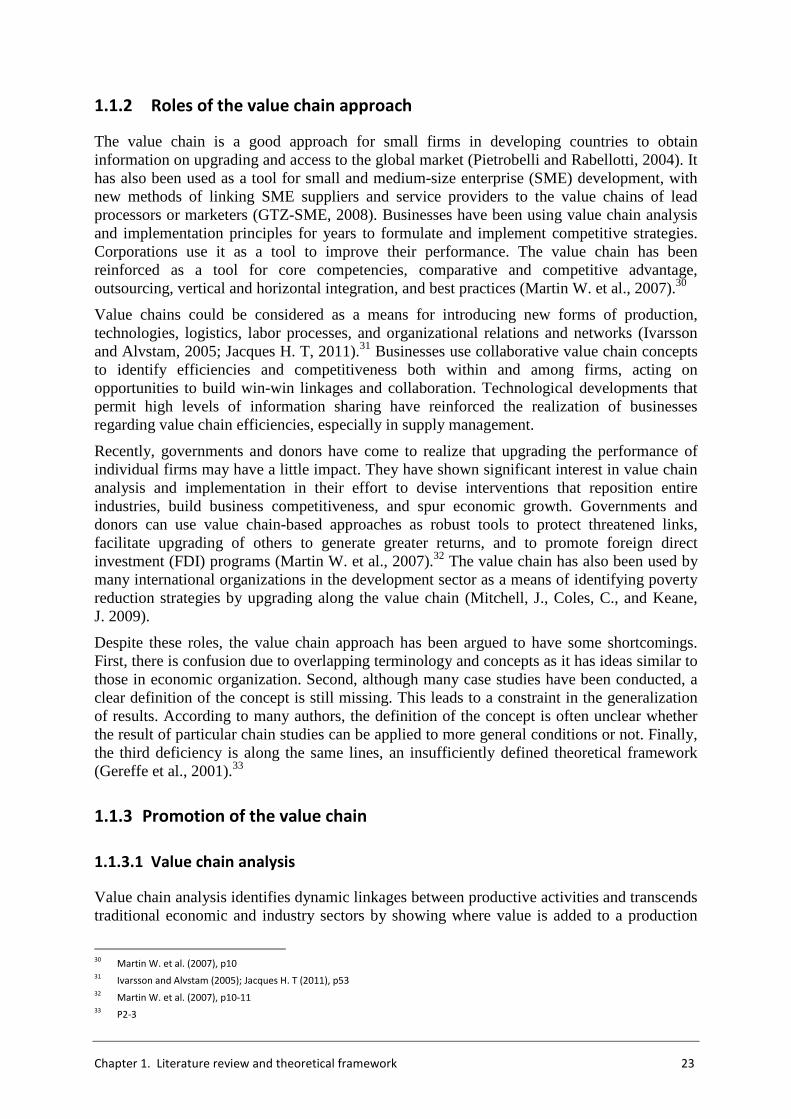
The value chain is a good approach for small firms in developing countries to obtain information on upgrading and access to the global market (Pietrobelli and Rabellotti, 2004). It has also been used as a tool for small and medium-size enterprise (SME) development, with new methods of linking SME suppliers and service providers to the value chains of lead processors or marketers (GTZ-SME, 2008). Businesses have been using value chain analysis and implementation principles for years to formulate and implement competitive strategies. Corporations use it as a tool to improve their performance. The value chain has been reinforced as a tool for core competencies, comparative and competitive advantage, outsourcing, vertical and horizontal integration, and best practices (Martin W. et al., 2007).30
Value chains could be considered as a means for introducing new forms of production, technologies, logistics, labor processes, and organizational relations and networks (Ivarsson and Alvstam, 2005; Jacques H. T, 2011).31 Businesses use collaborative value chain concepts to identify efficiencies and competitiveness both within and among firms, acting on opportunities to build win-win linkages and collaboration. Technological developments that permit high levels of information sharing have reinforced the realization of businesses regarding value chain efficiencies, especially in supply management.
Recently, governments and donors have come to realize that upgrading the performance of individual firms may have a little impact. They have shown significant interest in value chain analysis and implementation in their effort to devise interventions that reposition entire industries, build business competitiveness, and spur economic growth. Governments and donors can use value chain-based approaches as robust tools to protect threatened links, facilitate upgrading of others to generate greater returns, and to promote foreign direct investment (FDI) programs (Martin W. et al., 2007).32 The value chain has also been used by many international organizations in the development sector as a means of identifying poverty reduction strategies by upgrading along the value chain (Mitchell, J., Coles, C., and Keane, J. 2009).
Despite these roles, the value chain approach has been argued to have some shortcomings. First, there is confusion due to overlapping terminology and concepts as it has ideas similar to those in economic organization. Second, although many case studies have been conducted, a clear definition of the concept is still missing. This leads to a constraint in the generalization of results. According to many authors, the definition of the concept is often unclear whether the result of particular chain studies can be applied to more general conditions or not. Finally, the third deficiency is along the same lines, an insufficiently defined theoretical framework (Gereffe et al., 2001).33
1.1.3 Promotion of the value chain
1.1.3.1 Value chain analysis
Value chain analysis identifies dynamic linkages between productive activities and transcends traditional economic and industry sectors by showing where value is added to a production
30
Martin W. et al. (2007), p10 31
Ivarsson and Alvstam (2005); Jacques H. T (2011), p53 32
Martin W. et al. (2007), p10-11 33
P2-3
24 Chapter 1. Literature review and theoretical framework
process. It also examines information flows between actors in the value chain (Kaplinsky and Morris, 2000; Martin W. et al., 2007).34
The main ideas of value chain analysis are: the economic costs along the value chain; the most value-added section of the value chain; the most important actors within the value chain; the institutional framework of the value chain; bottlenecks in the value chain; a place for market potential growth; the size of the sector/chain; the potential for upgrading; possible synergies (SNV, 2004). Value chain analysis is very useful for new producers – including poor producers and poor countries – who are trying to enter global markets in a manner that would provide for sustainable income growth (Kaplinsky and Morris, 2000).35
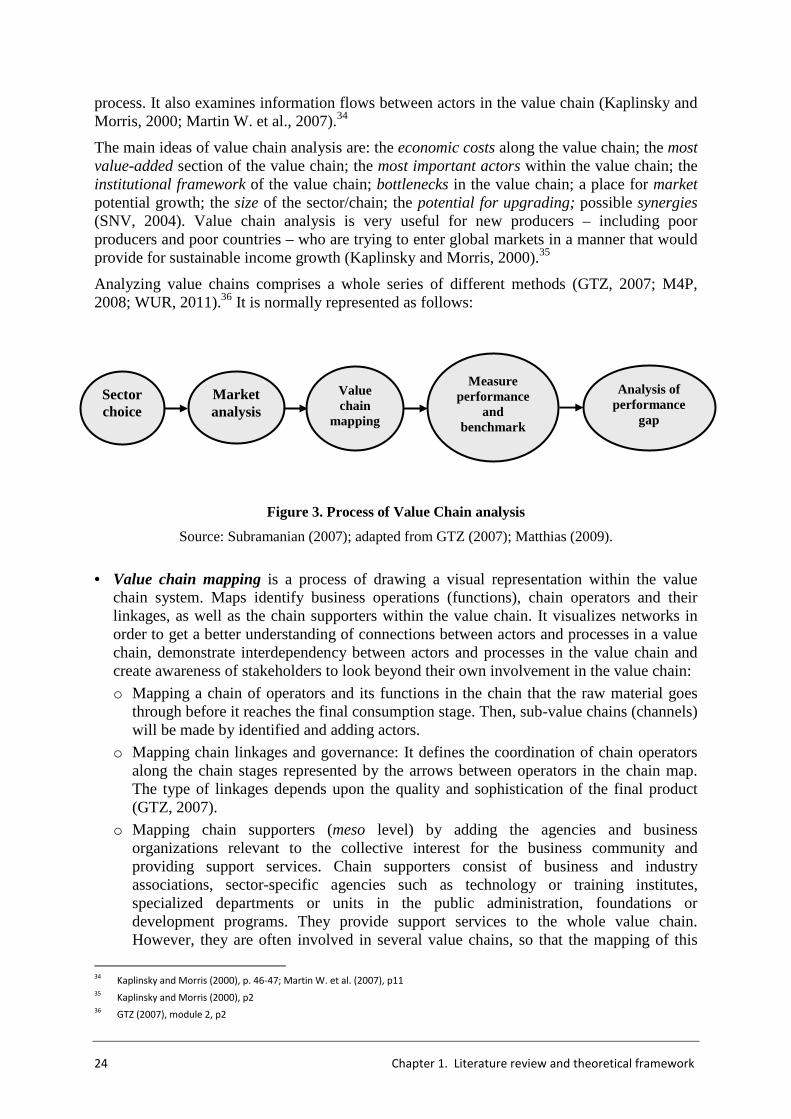
Analyzing value chains comprises a whole series of different methods (GTZ, 2007; M4P, 2008; WUR, 2011).36 It is normally represented as follows:
Figure 3. Process of Value Chain analysis
Source: Subramanian (2007); adapted from GTZ (2007); Matthias (2009).
• Value chain mapping is a process of drawing a visual representation within the value chain system. Maps identify business operations (functions), chain operators and their linkages, as well as the chain supporters within the value chain. It visualizes networks in order to get a better understanding of connections between actors and processes in a value chain, demonstrate interdependency between actors and processes in the value chain and create awareness of stakeholders to look beyond their own involvement in the value chain:
o Mapping a chain of operators and its functions in the chain that the raw material goes through before it reaches the final consumption stage. Then, sub-value chains (channels) will be made by identified and adding actors.
o Mapping chain linkages and governance: It defines the coordination of chain operators along the chain stages represented by the arrows between operators in the chain map. The type of linkages depends upon the quality and sophistication of the final product (GTZ, 2007).
o Mapping chain supporters (meso level) by adding the agencies and business organizations relevant to the collective interest for the business community and providing support services. Chain supporters consist of business and industry associations, sector-specific agencies such as technology or training institutes, specialized departments or units in the public administration, foundations or development programs. They provide support services to the whole value chain. However, they are often involved in several value chains, so that the mapping of this
34
Kaplinsky and Morris (2000), p. 46-47; Martin W. et al. (2007), p11 35
Kaplinsky and Morris (2000), p2 36
GTZ (2007), module 2, p2
Sector choice
Market analysis
Value chain
mapping
Measure performance
and benchmark
Analysis of performance
gap
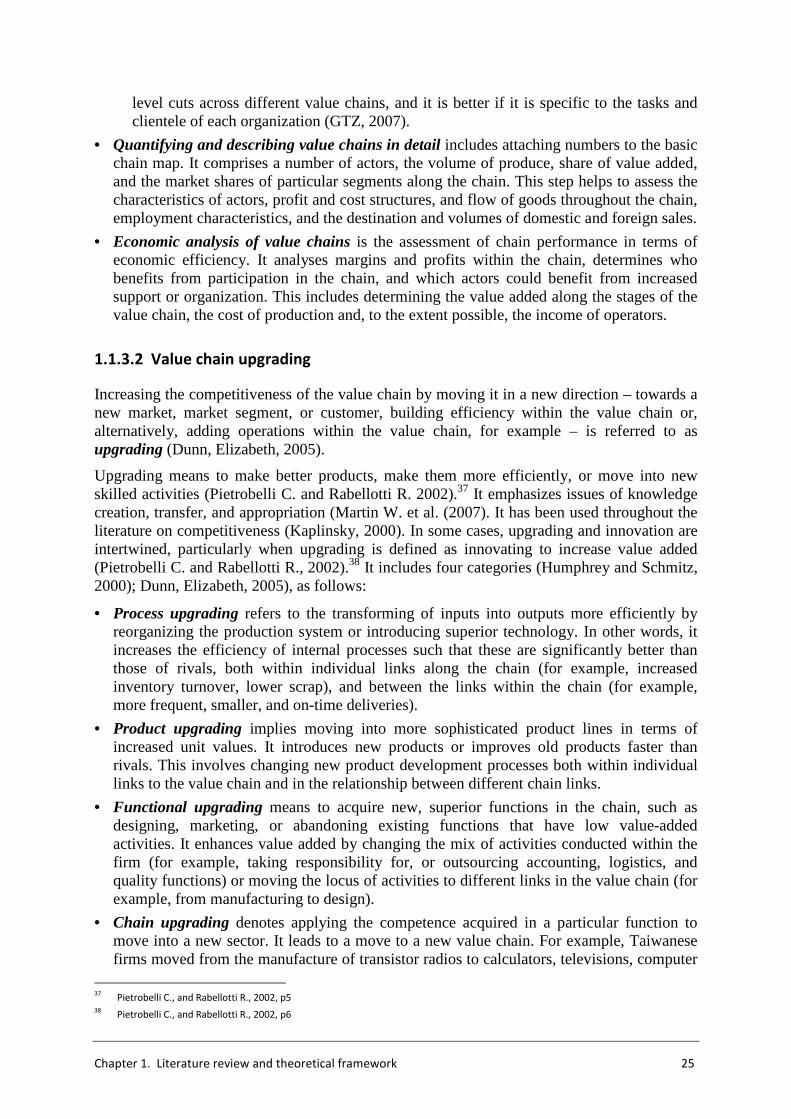
Chapter 1. Literature review and theoretical framework 25
level cuts across different value chains, and it is better if it is specific to the tasks and clientele of each organization (GTZ, 2007).
• Quantifying and describing value chains in detail includes attaching numbers to the basic chain map. It comprises a number of actors, the volume of produce, share of value added, and the market shares of particular segments along the chain. This step helps to assess the characteristics of actors, profit and cost structures, and flow of goods throughout the chain, employment characteristics, and the destination and volumes of domestic and foreign sales.
• Economic analysis of value chains is the assessment of chain performance in terms of economic efficiency. It analyses margins and profits within the chain, determines who benefits from participation in the chain, and which actors could benefit from increased support or organization. This includes determining the value added along the stages of the value chain, the cost of production and, to the extent possible, the income of operators.
1.1.3.2 Value chain upgrading
Increasing the competitiveness of the value chain by moving it in a new direction – towards a new market, market segment, or customer, building efficiency within the value chain or, alternatively, adding operations within the value chain, for example – is referred to as upgrading (Dunn, Elizabeth, 2005).
Upgrading means to make better products, make them more efficiently, or move into new skilled activities (Pietrobelli C. and Rabellotti R. 2002).37 It emphasizes issues of knowledge creation, transfer, and appropriation (Martin W. et al. (2007). It has been used throughout the literature on competitiveness (Kaplinsky, 2000). In some cases, upgrading and innovation are intertwined, particularly when upgrading is defined as innovating to increase value added (Pietrobelli C. and Rabellotti R., 2002).38 It includes four categories (Humphrey and Schmitz, 2000); Dunn, Elizabeth, 2005), as follows:
• Process upgrading refers to the transforming of inputs into outputs more efficiently by reorganizing the production system or introducing superior technology. In other words, it increases the efficiency of internal processes such that these are significantly better than those of rivals, both within individual links along the chain (for example, increased inventory turnover, lower scrap), and between the links within the chain (for example, more frequent, smaller, and on-time deliveries).
• Product upgrading implies moving into more sophisticated product lines in terms of increased unit values. It introduces new products or improves old products faster than rivals. This involves changing new product development processes both within individual links to the value chain and in the relationship between different chain links.
• Functional upgrading means to acquire new, superior functions in the chain, such as designing, marketing, or abandoning existing functions that have low value-added activities. It enhances value added by changing the mix of activities conducted within the firm (for example, taking responsibility for, or outsourcing accounting, logistics, and quality functions) or moving the locus of activities to different links in the value chain (for example, from manufacturing to design).
• Chain upgrading denotes applying the competence acquired in a particular function to move into a new sector. It leads to a move to a new value chain. For example, Taiwanese firms moved from the manufacture of transistor radios to calculators, televisions, computer
37
Pietrobelli C., and Rabellotti R., 2002, p5 38
Pietrobelli C., and Rabellotti R., 2002, p6

26 Chapter 1. Literature review and theoretical framework
monitors, laptops and now WAP phones (Kaplinsky, Raphael and Michael Morris, 2000).39 This category includes intra-sectoral upgrading, which involves operating in a new market channel within the same value chain; and inter-sectoral upgrading also can mean producing an entirely different product in a completely distinct value chain.
An upgrading strategy is an agreement between chain actors on joint action to upgrade. It concerns what the actors in a value chain must do to become more competitive and to generate greater value added in the future (GTZ, 2007).40 Upgrading a value chain comprises a sequence of steps. After analysis the chain, two main steps will be analyzed: (i) review value chain constraints as well as opportunities and select upgrading actors and operators, and define the upgrading program; (ii) set operational objectives, identify a methodology, and prepare upgrading action.
Figure 4. Value chains upgrading strategy
Source: Adapted from GTZ (2007)
39
Kaplinsky, Raphael and Michael Morris (2000), p39 40
GTZ (2007), module 3, p2
Upgrading strategy
Strategy revision and continuous upgrading
Selecting a value chain
Identifying of constraints & opportunities
Analyzing of chosen chain
Determining an upgrading
strategy
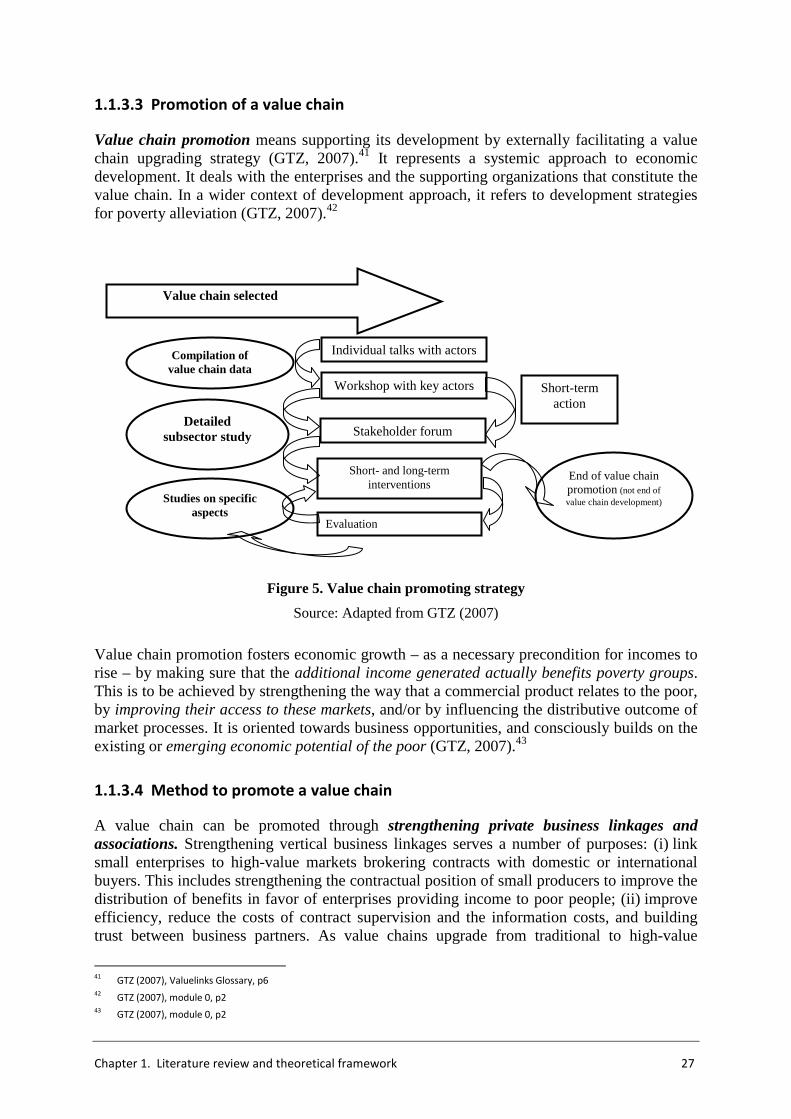
Chapter 1. Literature review and theoretical framework 27
1.1.3.3 Promotion of a value chain
Value chain promotion means supporting its development by externally facilitating a value chain upgrading strategy (GTZ, 2007).41 It represents a systemic approach to economic development. It deals with the enterprises and the supporting organizations that constitute the value chain. In a wider context of development approach, it refers to development strategies for poverty alleviation (GTZ, 2007).42
Figure 5. Value chain promoting strategy
Source: Adapted from GTZ (2007)
Value chain promotion fosters economic growth – as a necessary precondition for incomes to rise – by making sure that the additional income generated actually benefits poverty groups. This is to be achieved by strengthening the way that a commercial product relates to the poor, by improving their access to these markets, and/or by influencing the distributive outcome of market processes. It is oriented towards business opportunities, and consciously builds on the existing or emerging economic potential of the poor (GTZ, 2007).43
1.1.3.4 Method to promote a value chain
A value chain can be promoted through strengthening private business linkages and associations. Strengthening vertical business linkages serves a number of purposes: (i) link small enterprises to high-value markets brokering contracts with domestic or international buyers. This includes strengthening the contractual position of small producers to improve the distribution of benefits in favor of enterprises providing income to poor people; (ii) improve efficiency, reduce the costs of contract supervision and the information costs, and building trust between business partners. As value chains upgrade from traditional to high-value
41
GTZ (2007), Valuelinks Glossary, p6 42
GTZ (2007), module 0, p2 43
GTZ (2007), module 0, p2
Compilation of value chain data
Detailed subsector study
Studies on specific aspects
Value chain selected
Individual talks with actors
Short-term action
Evaluation
Workshop with key actors
Stakeholder forum
Short- and long-term interventions
End of value chain promotion (not end of value chain development)
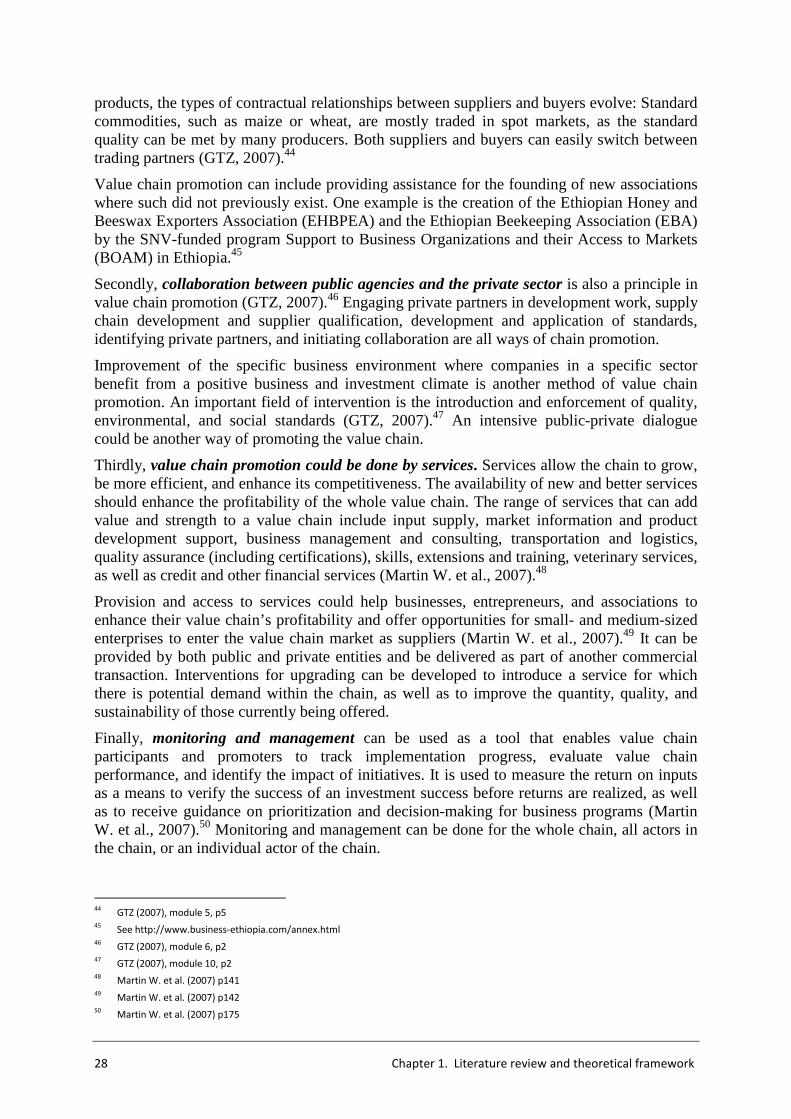
28 Chapter 1. Literature review and theoretical framework
products, the types of contractual relationships between suppliers and buyers evolve: Standard commodities, such as maize or wheat, are mostly traded in spot markets, as the standard quality can be met by many producers. Both suppliers and buyers can easily switch between trading partners (GTZ, 2007).44
Value chain promotion can include providing assistance for the founding of new associations where such did not previously exist. One example is the creation of the Ethiopian Honey and Beeswax Exporters Association (EHBPEA) and the Ethiopian Beekeeping Association (EBA) by the SNV-funded program Support to Business Organizations and their Access to Markets (BOAM) in Ethiopia.45
Secondly, collaboration between public agencies and the private sector is also a principle in value chain promotion (GTZ, 2007).46 Engaging private partners in development work, supply chain development and supplier qualification, development and application of standards, identifying private partners, and initiating collaboration are all ways of chain promotion.
Improvement of the specific business environment where companies in a specific sector benefit from a positive business and investment climate is another method of value chain promotion. An important field of intervention is the introduction and enforcement of quality, environmental, and social standards (GTZ, 2007).47 An intensive public-private dialogue could be another way of promoting the value chain.
Thirdly, value chain promotion could be done by services. Services allow the chain to grow, be more efficient, and enhance its competitiveness. The availability of new and better services should enhance the profitability of the whole value chain. The range of services that can add value and strength to a value chain include input supply, market information and product development support, business management and consulting, transportation and logistics, quality assurance (including certifications), skills, extensions and training, veterinary services, as well as credit and other financial services (Martin W. et al., 2007).48
Provision and access to services could help businesses, entrepreneurs, and associations to enhance their value chain’s profitability and offer opportunities for small- and medium-sized enterprises to enter the value chain market as suppliers (Martin W. et al., 2007).49 It can be provided by both public and private entities and be delivered as part of another commercial transaction. Interventions for upgrading can be developed to introduce a service for which there is potential demand within the chain, as well as to improve the quantity, quality, and sustainability of those currently being offered.
Finally, monitoring and management can be used as a tool that enables value chain participants and promoters to track implementation progress, evaluate value chain performance, and identify the impact of initiatives. It is used to measure the return on inputs as a means to verify the success of an investment success before returns are realized, as well as to receive guidance on prioritization and decision-making for business programs (Martin W. et al., 2007).50 Monitoring and management can be done for the whole chain, all actors in the chain, or an individual actor of the chain.
44
GTZ (2007), module 5, p5 45
See http://www.business-ethiopia.com/annex.html 46
GTZ (2007), module 6, p2 47
GTZ (2007), module 10, p2 48
Martin W. et al. (2007) p141 49
Martin W. et al. (2007) p142 50
Martin W. et al. (2007) p175
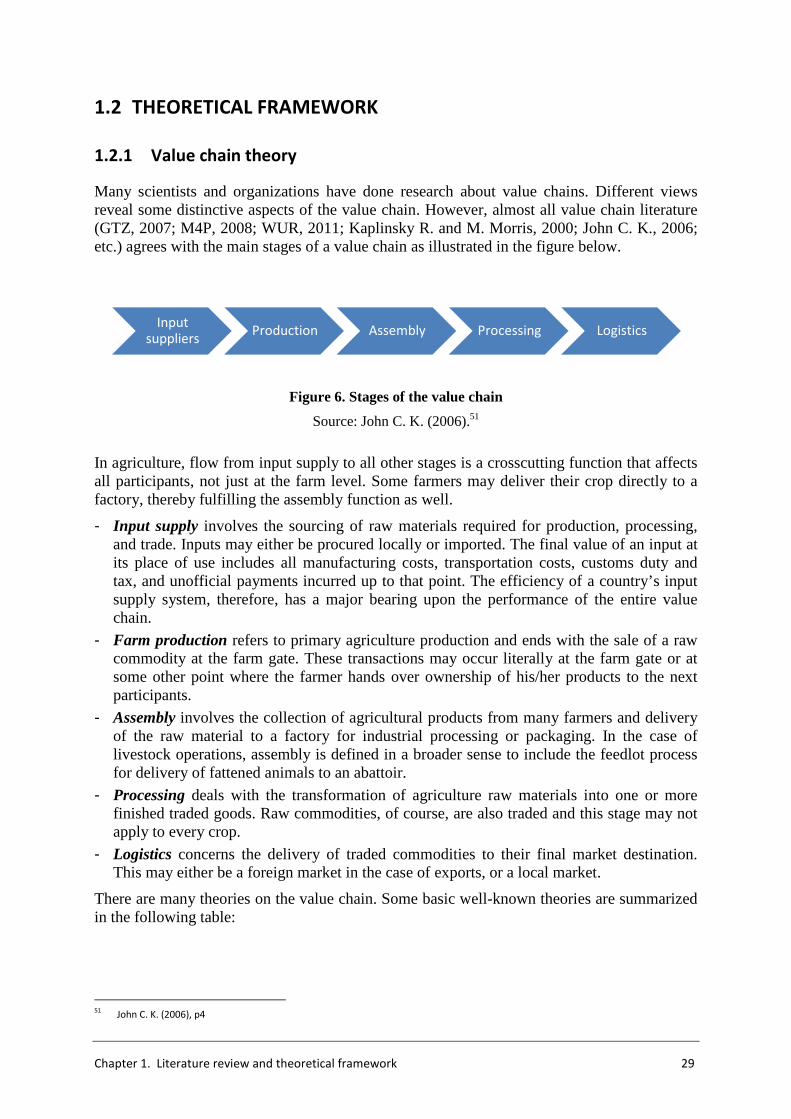
Chapter 1. Literature review and theoretical framework 29
1.2 THEORETICAL FRAMEWORK
1.2.1 Value chain theory
Many scientists and organizations have done research about value chains. Different views reveal some distinctive aspects of the value chain. However, almost all value chain literature (GTZ, 2007; M4P, 2008; WUR, 2011; Kaplinsky R. and M. Morris, 2000; John C. K., 2006; etc.) agrees with the main stages of a value chain as illustrated in the figure below.
Figure 6. Stages of the value chain
Source: John C. K. (2006).51
In agriculture, flow from input supply to all other stages is a crosscutting function that affects all participants, not just at the farm level. Some farmers may deliver their crop directly to a factory, thereby fulfilling the assembly function as well.
- Input supply involves the sourcing of raw materials required for production, processing, and trade. Inputs may either be procured locally or imported. The final value of an input at its place of use includes all manufacturing costs, transportation costs, customs duty and tax, and unofficial payments incurred up to that point. The efficiency of a country’s input supply system, therefore, has a major bearing upon the performance of the entire value chain.
- Farm production refers to primary agriculture production and ends with the sale of a raw commodity at the farm gate. These transactions may occur literally at the farm gate or at some other point where the farmer hands over ownership of his/her products to the next participants.
- Assembly involves the collection of agricultural products from many farmers and delivery of the raw material to a factory for industrial processing or packaging. In the case of livestock operations, assembly is defined in a broader sense to include the feedlot process for delivery of fattened animals to an abattoir.
- Processing deals with the transformation of agriculture raw materials into one or more finished traded goods. Raw commodities, of course, are also traded and this stage may not apply to every crop.
- Logistics concerns the delivery of traded commodities to their final market destination. This may either be a foreign market in the case of exports, or a local market.
There are many theories on the value chain. Some basic well-known theories are summarized in the following table:
51
John C. K. (2006), p4
Input suppliers
Production Assembly Processing Logistics
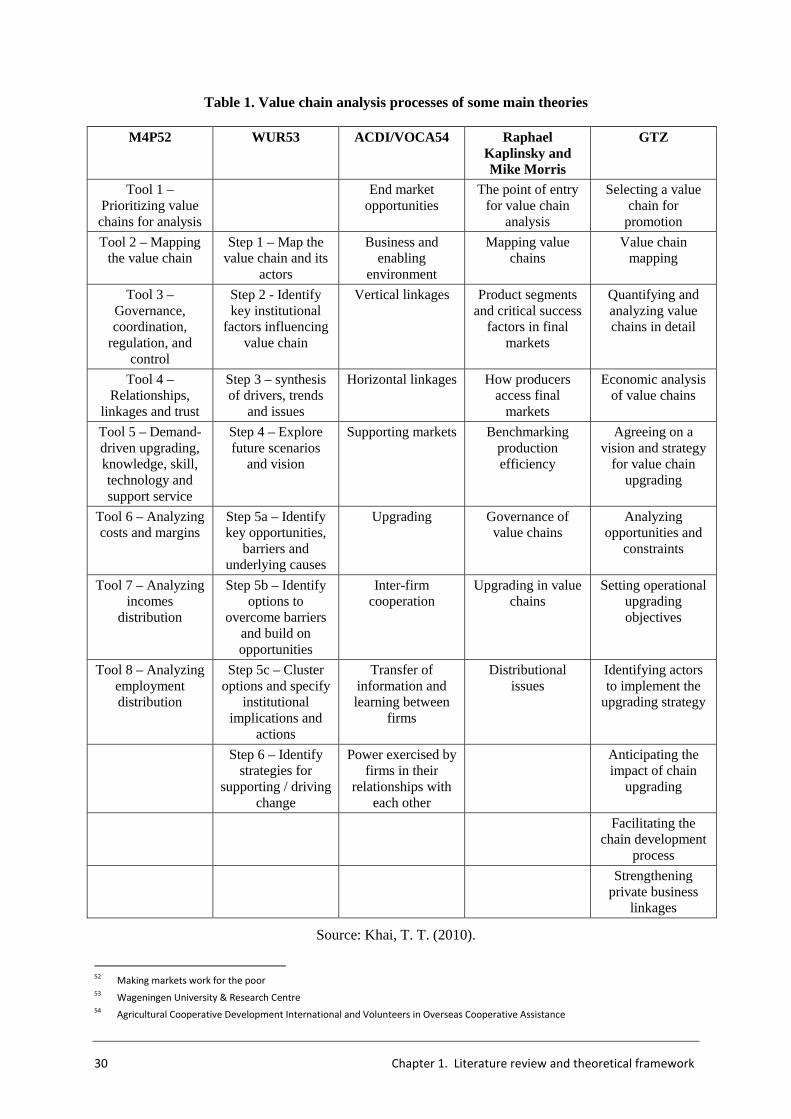
30 Chapter 1. Literature review and theoretical framework
Table 1. Value chain analysis processes of some main theories
M4P52 WUR53 ACDI/VOCA54 Raphael Kaplinsky and Mike Morris
GTZ
Tool 1 – Prioritizing value chains for analysis
End market opportunities
The point of entry for value chain
analysis
Selecting a value chain for
promotion
Tool 2 – Mapping the value chain
Step 1 – Map the value chain and its
actors
Business and enabling
environment
Mapping value chains
Value chain mapping
Tool 3 – Governance, coordination,
regulation, and control
Step 2 - Identify key institutional
factors influencing value chain
Vertical linkages Product segments and critical success
factors in final markets
Quantifying and analyzing value chains in detail
Tool 4 – Relationships,
linkages and trust
Step 3 – synthesis of drivers, trends
and issues
Horizontal linkages How producers access final
markets
Economic analysis of value chains
Tool 5 – Demand-driven upgrading, knowledge, skill, technology and support service
Step 4 – Explore future scenarios
and vision
Supporting markets Benchmarking production efficiency
Agreeing on a vision and strategy
for value chain upgrading
Tool 6 – Analyzing costs and margins
Step 5a – Identify key opportunities,
barriers and underlying causes
Upgrading Governance of value chains
Analyzing opportunities and
constraints
Tool 7 – Analyzing incomes
distribution
Step 5b – Identify options to
overcome barriers and build on opportunities
Inter-firm cooperation
Upgrading in value chains
Setting operational upgrading objectives
Tool 8 – Analyzing employment distribution
Step 5c – Cluster options and specify
institutional implications and
actions
Transfer of information and learning between
firms
Distributional issues
Identifying actors to implement the
upgrading strategy
Step 6 – Identify strategies for
supporting / driving change
Power exercised by firms in their
relationships with each other
Anticipating the impact of chain
upgrading
Facilitating the chain development
process
Strengthening private business
linkages
Source: Khai, T. T. (2010).
52
Making markets work for the poor 53
Wageningen University & Research Centre 54
Agricultural Cooperative Development International and Volunteers in Overseas Cooperative Assistance
Chapter 1. Literature review and theoretical framework 31
Each theory approaches the value chain in its own way. They could divide the value chain into different steps and follow different processes for analyzing the chain. Each of them has its own strengths that it wants to emphasize. For example, M4P concentrates more on welfare among the poor so that they concentrate more on improving employment and benefits for the poor, while GTZ pays more attention to the promotion of the whole value chain.
However, all theories agree on the major stages of a value chain, including: (i) selecting a chain to analyze; (ii) mapping the value chain; (iii) defining the vertical and horizontal linkages of the actors and stakeholders along the chain; (iv) quantifying and economic analysis of value chains in detail; (v) defining the benchmarking; (vi) upgrading and promoting the value chain. This study tries to exploit the advantages of these tools for analyzing the value chain.
1.2.2 Economy of scale
The economy of scale concept was introduced by the neo-classical economists. It characterizes a production process in which an increase of the number of units produced or managed generates a decrease in the average cost per unit (Martin W. et al., 2007).55 In other words, economy of scale appears when the unit cost of production decreases as the quantity of the production increases.
When the scale of production is small, it allows for little specialization – the entrepreneur making a small number of chairs employs no one and undertakes all the different tasks required in making the final product. The small scale prevents him/her from accessing inputs at an optimum price, reducing the uneconomical unit costs of extension services, enjoying enhanced market power stemming from increased volumes of production and non-fragmented marketing (Martin W. et al., 2007).56
If production expands, it becomes profitable to employ workers and to allow each of them to specialize. Workers do not waste time picking up and putting down their work-in-progress but concentrate on developing their specific skills. Moreover, it also opens the way for the introduction of mechanization as simple repetitive tasks are much easier to mechanize than complex ones (Kaplinsky, R. and Morris M., 2000).57
55
Martin W. et al. (2007) p107 56
Martin W. et al. (2007) p105 57
Kaplinsky, Raphael and Michael Morris (2000), p10
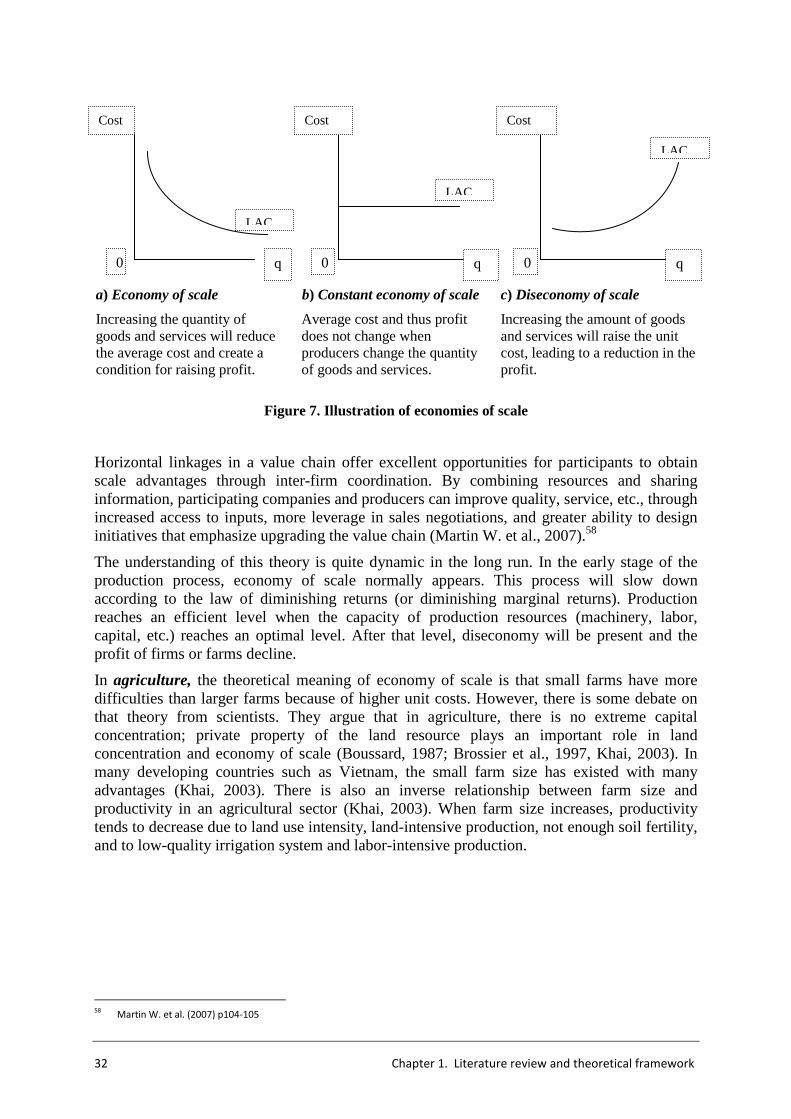
32 Chapter 1. Literature review and theoretical framework
a) Economy of scale
Increasing the quantity of goods and services will reduce the average cost and create a condition for raising profit.
b) Constant economy of scale
Average cost and thus profit does not change when producers change the quantity of goods and services.
c) Diseconomy of scale
Increasing the amount of goods and services will raise the unit cost, leading to a reduction in the profit.
Figure 7. Illustration of economies of scale
Horizontal linkages in a value chain offer excellent opportunities for participants to obtain scale advantages through inter-firm coordination. By combining resources and sharing information, participating companies and producers can improve quality, service, etc., through increased access to inputs, more leverage in sales negotiations, and greater ability to design initiatives that emphasize upgrading the value chain (Martin W. et al., 2007).58
The understanding of this theory is quite dynamic in the long run. In the early stage of the production process, economy of scale normally appears. This process will slow down according to the law of diminishing returns (or diminishing marginal returns). Production reaches an efficient level when the capacity of production resources (machinery, labor, capital, etc.) reaches an optimal level. After that level, diseconomy will be present and the profit of firms or farms decline.
In agriculture, the theoretical meaning of economy of scale is that small farms have more difficulties than larger farms because of higher unit costs. However, there is some debate on that theory from scientists. They argue that in agriculture, there is no extreme capital concentration; private property of the land resource plays an important role in land concentration and economy of scale (Boussard, 1987; Brossier et al., 1997, Khai, 2003). In many developing countries such as Vietnam, the small farm size has existed with many advantages (Khai, 2003). There is also an inverse relationship between farm size and productivity in an agricultural sector (Khai, 2003). When farm size increases, productivity tends to decrease due to land use intensity, land-intensive production, not enough soil fertility, and to low-quality irrigation system and labor-intensive production.
58
Martin W. et al. (2007) p104-105
q
Cost
0 q
Cost
0 q
Cost
0
LAC
LAC
LAC
Chapter 1. Literature review and theoretical framework 33
1.1.1 Basic factors of farm production
Land
There is a much closer linkage between agricultural production and land area, except for some highly intensive animal husbandry enterprises (Khai, 2003). Normally, land is one of the most important assets of farmers. An increase in land holding allows them easier access to credit. It creates a condition for them to enhance production, exploit the return to scale, raise their income, and promote their living standard. Moreover, land is one of the indicators of the social status of the family within village or community (Ellis, 1993; Khai, 2003).
Capital
Capital, in agriculture, refers to (i) any manufactured asset that is applied in production, such as machinery, buildings, or vehicles; (ii) factors of production such as stocks of fertilizers, feeds; (iii) live animals, like livestock; or (iv) money used to buy what the farmers need to make their products or provide their services.
Similar to land, capital plays a significant role in agricultural production. It is often considered to be a scarce factor for small households in developing countries. It is difficult for people in such countries to access credit, especially formal credit (Khai, 2003).
Labor
The typical characteristic of agricultural production is its strong reliance upon family labor. This situation prevails not only for small households but also for large-sized farms, not only in developing countries but also in developed countries with merchandize production (Khai, 2003). This situation has an impact on the workings of the labor market in peasant communities due to its effects on the supply and demand sides for paid labor.

CHAPTER 2
METHODOLOGY OF THE STUDY AND SITUATION OF
DAIRY PRODUCTION IN VIETNAM
Chapter 2 starts by presenting the methodology for the study including selection of the study sites, method for collecting data and analysis, and the analytical framework. The second part of the chapter presents the situation of dairy production in Vietnam, in which the basic socioeconomic characteristics of Vietnam and a brief history of dairy development will be introduced. Then, herd holding pattern, dairy production, milk marketing, prospects for dairy production, flow of services, and institutions involved in the dairy industry in Vietnam will be analyzed.
2.1 METHODOLOGY OF THE STUDY
2.1.1 Selection of study sites and survey samples
Selection of province and district
The choice of study sites was based on the real condition of dairy production in Vietnam. Vietnam has a tropical monsoon climate with an average relative humidity of 84–100%. Vietnam also suffers from many natural disasters such as storms, flooding, drought, etc., often following an annual cyclical pattern. Natural conditions do not weigh in favor of the dairy industry. Regarding favorable geographic areas for dairy farming, Vietnam has only two main places: Son La in the north and Lam Dong in the south. Dairy cattle have been raised in these two provinces for years. Son La province ranked third highest in the size of cattle herds in Vietnam.59 (See more details in Annex 1.) Thus, this study chose Son La as a study site.
In Son La, most of the dairy cattle were kept in Moc Chau district, which accounts for about 80% of the total number of cattle and over 90% of the quantity of milk produced. It is well known for dairy husbandry and milk production in Vietnam. It also has a trademark: Moc Chau milk.
59
The first rank belongs to HCMC, the second to Long An. Son La ranks third, followed by Tuyen Quang, Ha Tay (now included in Hanoi),
Binh Duong, Binh Dinh, Lam Dong and Thanh Hoa
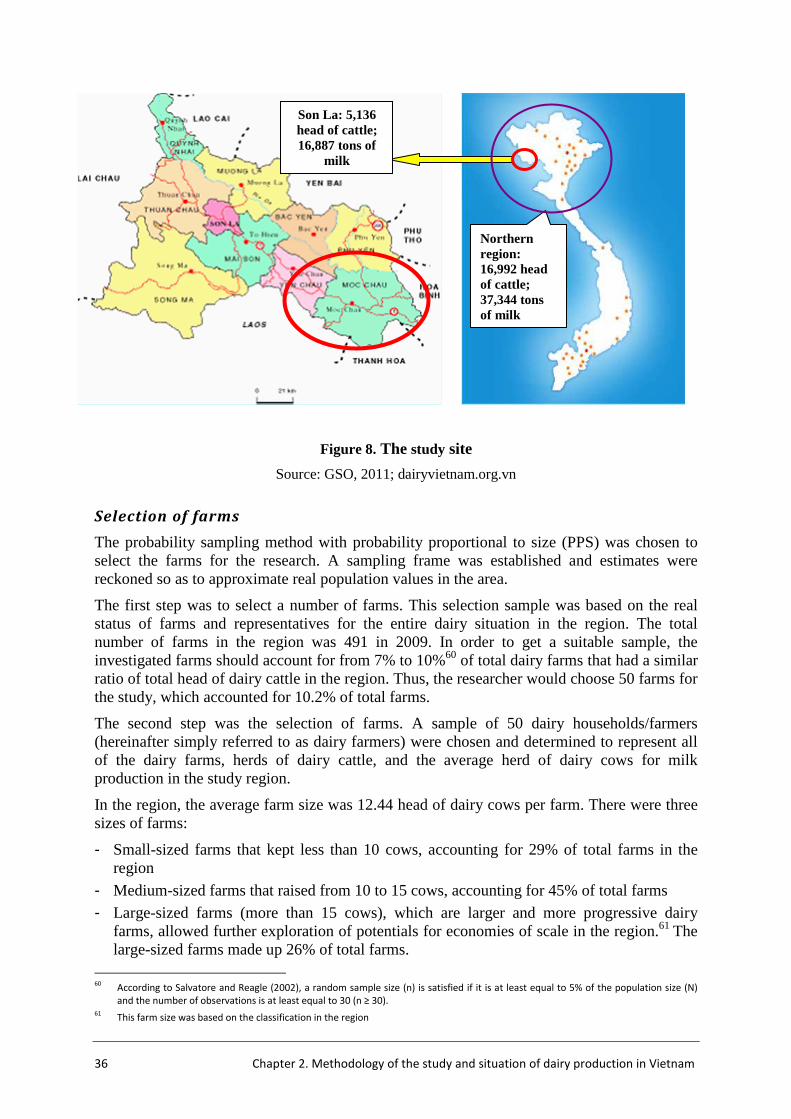
36 Chapter 2. Methodology of the study and situation of dairy production in Vietnam
Figure 8. The study site
Source: GSO, 2011; dairyvietnam.org.vn
Selection of farms
The probability sampling method with probability proportional to size (PPS) was chosen to select the farms for the research. A sampling frame was established and estimates were reckoned so as to approximate real population values in the area.
The first step was to select a number of farms. This selection sample was based on the real status of farms and representatives for the entire dairy situation in the region. The total number of farms in the region was 491 in 2009. In order to get a suitable sample, the investigated farms should account for from 7% to 10%60 of total dairy farms that had a similar ratio of total head of dairy cattle in the region. Thus, the researcher would choose 50 farms for the study, which accounted for 10.2% of total farms.
The second step was the selection of farms. A sample of 50 dairy households/farmers (hereinafter simply referred to as dairy farmers) were chosen and determined to represent all of the dairy farms, herds of dairy cattle, and the average herd of dairy cows for milk production in the study region.
In the region, the average farm size was 12.44 head of dairy cows per farm. There were three sizes of farms:
- Small-sized farms that kept less than 10 cows, accounting for 29% of total farms in the region
- Medium-sized farms that raised from 10 to 15 cows, accounting for 45% of total farms
- Large-sized farms (more than 15 cows), which are larger and more progressive dairy farms, allowed further exploration of potentials for economies of scale in the region.61 The large-sized farms made up 26% of total farms.
60
According to Salvatore and Reagle (2002), a random sample size (n) is satisfied if it is at least equal to 5% of the population size (N)
and the number of observations is at least equal to 30 (n ≥ 30). 61
This farm size was based on the classification in the region
Northern region: 16,992 head of cattle; 37,344 tons of milk
Son La: 5,136 head of cattle; 16,887 tons of
milk
Chapter 2. Methodology of the study and situation of dairy production in Vietnam 37
Thus, the farms selected should have been approximately these numbers. After a period of researching in consultation with the dairy plant extension officer, the researcher selected 50 farms with the following characteristic:
- The average size of the investigated farms was 13 head of cattle.
- Small-sized farms: 15 farms accounted for 30% of total farms in the region
- Medium-sized farms: 21 farms accounted for 42% of total farms
- Large-sized farm: 14 farms made up 28% of total farms.
- Investigated farms kept 10.2% total head cow in the region.
The study also investigated three of eight milk collecting centers (37.5% of the total population value) and four middlemen, three distributors in the region (10%) by using the a method similar to that of choosing the farms; and one of one dairy plant (100%).
2.1.2 Method for collecting data
The study is concerned with the qualitative features of the value chain for the selected households, and quantitative information about chosen value chains, in particular, technical and economic data of the dairyman’s milk production. The methodology was designed to collect these data at critical stages in the value chain, beginning with input supply, through to farm production, collection, processing, and distribution.
2.1.2.1 Structured interview
The structured interview is the first method to collect primary data. Three structured questionnaire sets were designed to interview three sets of actors in the chain – farmers, milk collectors, and milk distributors – to collect qualitative and quantitative information about the dairy industry (Annex 3). The interview was carried out at two different times and with two different approaches:
• The first one was the semi-structured interview. Its main objectives are to collect qualitative data and information in order to define and describe the milk chain in its actual stages: fresh milk production, collection, processing, and distribution. Besides, it would help to describe the characteristics of the chain actors, flow of information, flow of products, and supporting system. This step would also help to analyze the overall value chain.
The survey started with the dairymen and finished at the retailers. Firstly, the specific study areas had to be designed (Which communes? Which villages? etc.). Then a sample of dairy households had to be chosen. In this step, some main questions for chain actors, then detailed questions, would be used to discuss with individuals and groups. And an orientation interview would be used to collect data and information.
The main results of this step were intended to:
o Comprehend the general situation of the study sites. Understand the geography, the habits, the working hours, methods of transportation used on the study sites, the difficulties and challenges before us before the survey was actually carried out.
o Define the overall characteristic of chain actors.
o Test the questionnaire: A pre-test of the questionnaire was conducted before starting the household interviews and was used to develop the formal version of the questionnaire.
38 Chapter 2. Methodology of the study and situation of dairy production in Vietnam
Three farmers were selected for the pre-test of the questionnaire that is fleshed out in the formal interviews.
o Establish the official questionnaire: After the survey, certain corrections or modifications had to be made to finalize the questionnaire for the survey.
o Collect data and information about the dairy plant.
Data on the dairy plant would be collected in two ways. First, the quantitative information and data about the historical development, management structure, the situation of labor and capital, business results of recent years had to be collected at the departments of the company. Afterwards, information and data on milk cost production, including labor cost, material expenses, and data on revenue of milk production would be collected from the accounting department then re-adjusted and re-calculated in keeping with our objective. Then an orientated interview was conducted of the leaders of the company to collect qualitative information on the company’s development orientation, strategy of development, linkages, strengths, weaknesses, opportunities, and threats faced by it.
• The second approach was the structured interview with a standard questionnaire. Its main objective was to collect qualitative and quantitative data for technical, economic, and financial analysis.
Data in farms, milk collectors, and distributors would be collected mainly through the standard questionnaire. In addition, observation was used to add the information.
The questionnaire was broken down into three parts, as follows:
- Information about the socio-economic status and characteristics of the dairy farmer.
- Information on milk production, including herd size, characteristics of cow’s milk preservation; inputs and outputs from cow milk production, expenses, feed resources.
- Market and linkages for the milk produced, and socioeconomic issues related to improved milk production.
About two thirds of the questions were closed-ended, meaning that the responses were classified into pre-determined codes. The other questions were open-ended, allowing the respondent to answer in any form. The responses were recorded either in notebooks or by filling in the questionnaire blanks.
2.1.2.2 Informal, conversational interviews
The second method to collect data was through informal conversational interviews. This method is very flexible and appropriate for exploring a broad field related to dairy farming. This interview method is used to gain insight problems in the target study villages. The conversations focused on such things as milk production and preservation methods and problems of production (e.g. diseases, biological safety).
In-depth interviews provide qualitative and quantitative information on the value chain and are particularly useful for different participants in the value chain to understand their complementary relationships. This method is used for finding information useful for the upgrading and promoting strategy.
Key informant interviews are used with some successful dairy farmers and dairy cattle specialists to find out the method they use to promote the milk value chain.
The focused group interview is used to explore and gather the expectations of dairymen on upgrading the milk value chain.
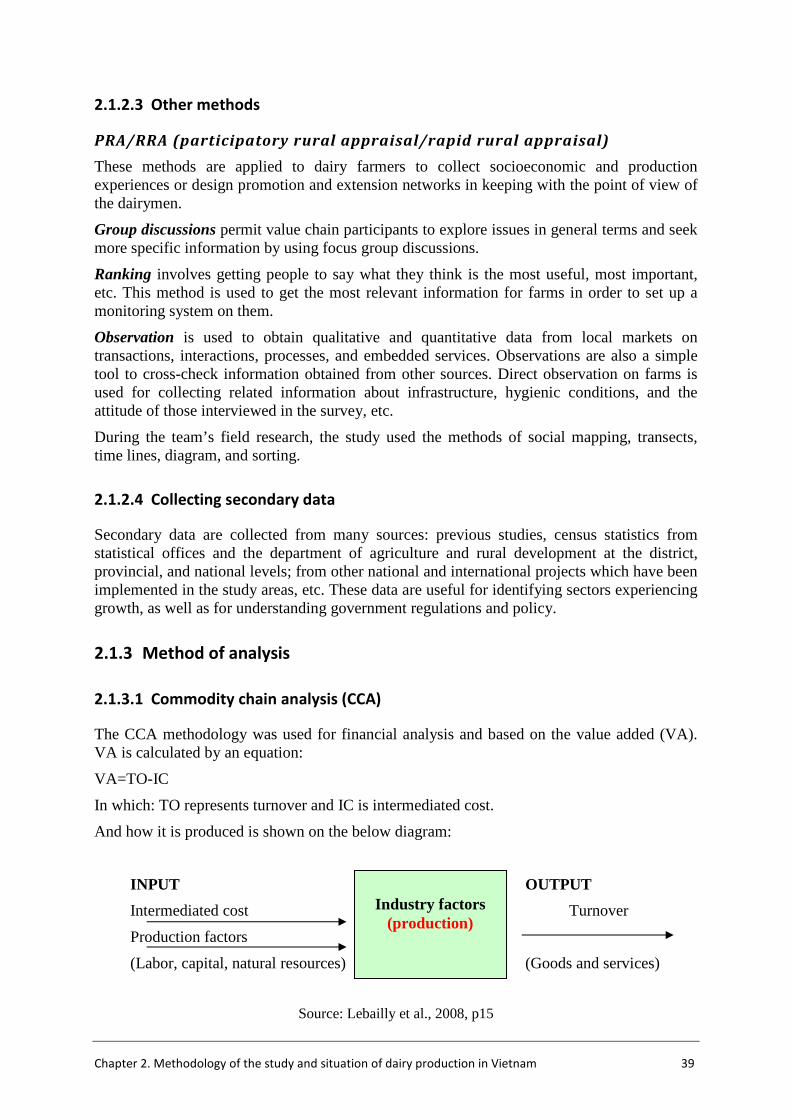
Chapter 2. Methodology of the study and situation of dairy production in Vietnam 39
2.1.2.3 Other methods
PRA/RRA (participatory rural appraisal/rapid rural appraisal)
These methods are applied to dairy farmers to collect socioeconomic and production experiences or design promotion and extension networks in keeping with the point of view of the dairymen.
Group discussions permit value chain participants to explore issues in general terms and seek more specific information by using focus group discussions.
Ranking involves getting people to say what they think is the most useful, most important, etc. This method is used to get the most relevant information for farms in order to set up a monitoring system on them.
Observation is used to obtain qualitative and quantitative data from local markets on transactions, interactions, processes, and embedded services. Observations are also a simple tool to cross-check information obtained from other sources. Direct observation on farms is used for collecting related information about infrastructure, hygienic conditions, and the attitude of those interviewed in the survey, etc.
During the team’s field research, the study used the methods of social mapping, transects, time lines, diagram, and sorting.
2.1.2.4 Collecting secondary data
Secondary data are collected from many sources: previous studies, census statistics from statistical offices and the department of agriculture and rural development at the district, provincial, and national levels; from other national and international projects which have been implemented in the study areas, etc. These data are useful for identifying sectors experiencing growth, as well as for understanding government regulations and policy.
2.1.3 Method of analysis
2.1.3.1 Commodity chain analysis (CCA)
The CCA methodology was used for financial analysis and based on the value added (VA). VA is calculated by an equation:
VA=TO-IC
In which: TO represents turnover and IC is intermediated cost.
And how it is produced is shown on the below diagram:
INPUT OUTPUT
Intermediated cost Turnover
Production factors
(Labor, capital, natural resources) (Goods and services)
Source: Lebailly et al., 2008, p15
Industry factors
(production)
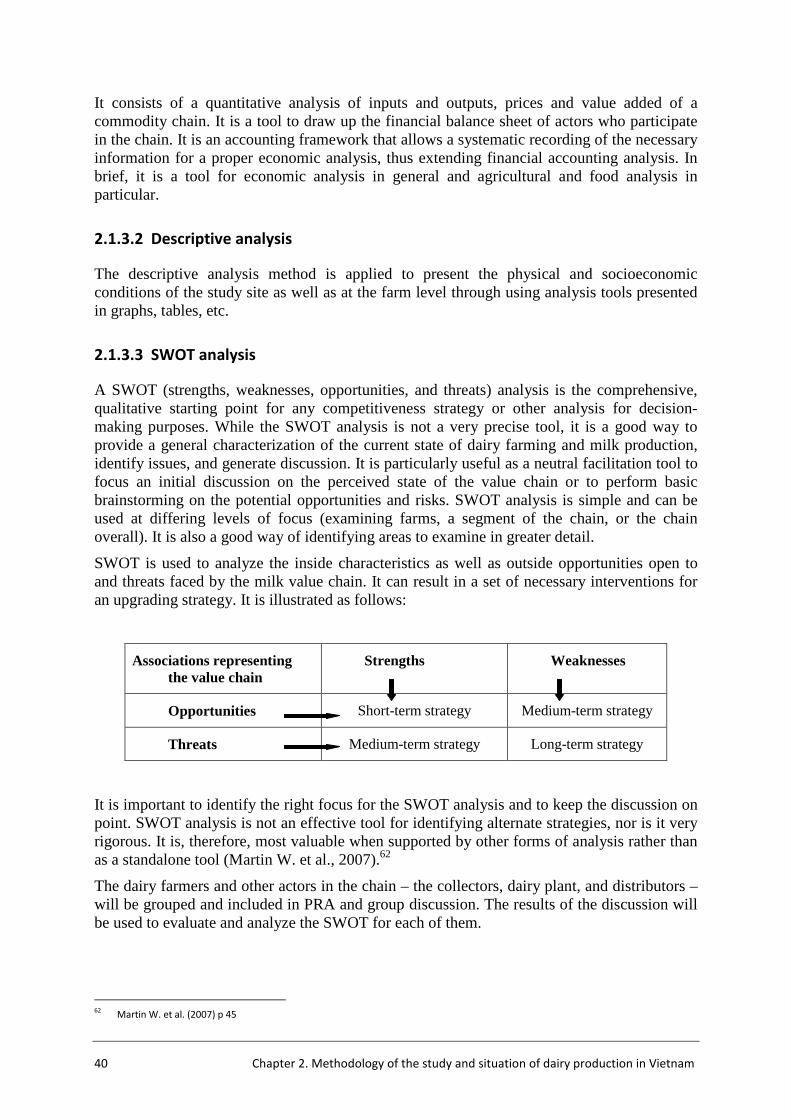
40 Chapter 2. Methodology of the study and situation of dairy production in Vietnam
It consists of a quantitative analysis of inputs and outputs, prices and value added of a commodity chain. It is a tool to draw up the financial balance sheet of actors who participate in the chain. It is an accounting framework that allows a systematic recording of the necessary information for a proper economic analysis, thus extending financial accounting analysis. In brief, it is a tool for economic analysis in general and agricultural and food analysis in particular.
2.1.3.2 Descriptive analysis
The descriptive analysis method is applied to present the physical and socioeconomic conditions of the study site as well as at the farm level through using analysis tools presented in graphs, tables, etc.
2.1.3.3 SWOT analysis
A SWOT (strengths, weaknesses, opportunities, and threats) analysis is the comprehensive, qualitative starting point for any competitiveness strategy or other analysis for decision-making purposes. While the SWOT analysis is not a very precise tool, it is a good way to provide a general characterization of the current state of dairy farming and milk production, identify issues, and generate discussion. It is particularly useful as a neutral facilitation tool to focus an initial discussion on the perceived state of the value chain or to perform basic brainstorming on the potential opportunities and risks. SWOT analysis is simple and can be used at differing levels of focus (examining farms, a segment of the chain, or the chain overall). It is also a good way of identifying areas to examine in greater detail.
SWOT is used to analyze the inside characteristics as well as outside opportunities open to and threats faced by the milk value chain. It can result in a set of necessary interventions for an upgrading strategy. It is illustrated as follows:
Associations representing the value chain
Strengths Weaknesses
Opportunities Short-term strategy Medium-term strategy
Threats Medium-term strategy Long-term strategy
It is important to identify the right focus for the SWOT analysis and to keep the discussion on point. SWOT analysis is not an effective tool for identifying alternate strategies, nor is it very rigorous. It is, therefore, most valuable when supported by other forms of analysis rather than as a standalone tool (Martin W. et al., 2007).62
The dairy farmers and other actors in the chain – the collectors, dairy plant, and distributors – will be grouped and included in PRA and group discussion. The results of the discussion will be used to evaluate and analyze the SWOT for each of them.
62
Martin W. et al. (2007) p 45
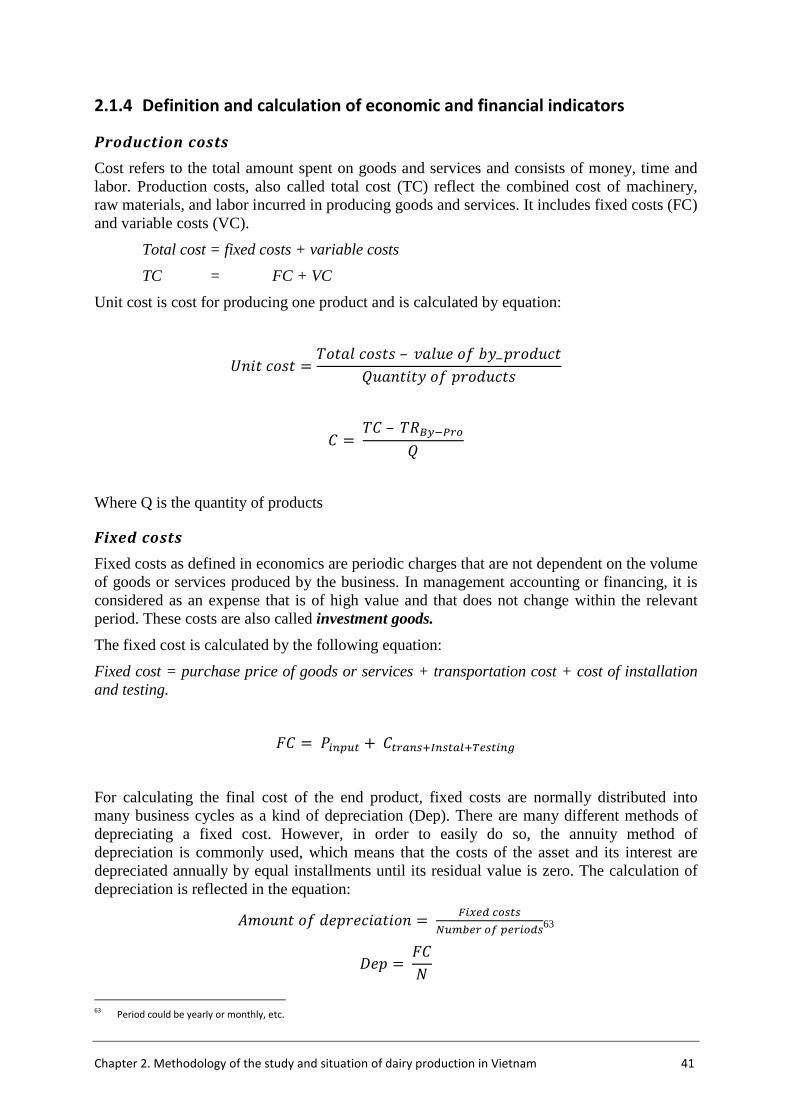
Chapter 2. Methodology of the study and situation of dairy production in Vietnam 41
2.1.4 Definition and calculation of economic and financial indicators
Production costs
Cost refers to the total amount spent on goods and services and consists of money, time and labor. Production costs, also called total cost (TC) reflect the combined cost of machinery, raw materials, and labor incurred in producing goods and services. It includes fixed costs (FC) and variable costs (VC).
Total cost = fixed costs + variable costs
TC = FC + VC
Unit cost is cost for producing one product and is calculated by equation:
�������� ���������– �����������������
������������������
� �–�������
�
Where Q is the quantity of products
Fixed costs
Fixed costs as defined in economics are periodic charges that are not dependent on the volume of goods or services produced by the business. In management accounting or financing, it is considered as an expense that is of high value and that does not change within the relevant period. These costs are also called investment goods.
The fixed cost is calculated by the following equation:
Fixed cost = purchase price of goods or services + transportation cost + cost of installation and testing.
� !"#$%& '�&�(#)*+#)&(,*-.)&"#/
For calculating the final cost of the end product, fixed costs are normally distributed into many business cycles as a kind of depreciation (Dep). There are many different methods of depreciating a fixed cost. However, in order to easily do so, the annuity method of depreciation is commonly used, which means that the costs of the asset and its interest are depreciated annually by equal installments until its residual value is zero. The calculation of depreciation is reflected in the equation:
01������������������ 2"3.45�)&)
6%78.��9$.�"�4)63
:�� �
;
63
Period could be yearly or monthly, etc.
42 Chapter 2. Methodology of the study and situation of dairy production in Vietnam
Where n is the number of depreciating periods.
On a dairy farm, fixed costs include:
• Purchasing heifers
• Construction of cowshed and its annual maintenance cost
• Milk storage tanks
• Milking system
• Other:
o Carts
o Pump station
o Generator
o Vehicle: tractors, mowers, etc.
Overhead cost
“A cost or expense (such as for administration, insurance, rent, and utility charges) that (1) relates to an operation or the company as a whole, (2) does not become an integral part of a good or service (unlike a raw material or direct labor), and (3) cannot be applied or traced to any specific unit of output. Overheads are indirect costs.”64
These costs are not directly related to the output of an activity as they are expenses incurred through the general operating of a farm, and do not vary directly as output varies. They include cash overhead such as permanent labor, rates, insurances, administration for which a cash payment must be made. Non-cash overheads include costs that are not actual cash expenditures such as depreciation on a piece of equipment.
Variable costs
Variable cost is cost that varies directly with volume of product produced. This cost changes in proportion to the activity of a business. It is the sum of marginal costs over all outputs and usually calculated by the equation:
Total variable costs = Variable cost per unit of product * Total quantity of products
VC = AVC * Q
Where: AVC is the variable cost per unit of output.
It is necessary to distinguish between variable costs and intermediate inputs or intermediate goods. Variable costs are expenses that vary in the same direction with the quantity of goods and services produced. Intermediate goods, also called producer goods, are goods that are used as inputs in the production of other goods, such as partly finished goods. Intermediate inputs are goods and services, other than a fixed cost, which are totally transformed or consumed in the production process during a period of time. In farms, intermediate inputs do not consist of labor cost, capital cost, or land cost.
64
http://www.businessdictionary.com/definition/overhead.html, consulted on 22/4/2013
Chapter 2. Methodology of the study and situation of dairy production in Vietnam 43
Variable costs in the dairy farms in the study context consist of:
Feeding cost
The feeding cost accounts for a large share of the cost in milk production. It is calculated by multiplying the market price by the quantity of feed consumed. Feeding cost on a dairy farm includes two main kinds: concentrates and forages.
Feeding cost = Market price * Quantity of feed = P feed * Q feed
= Concentrate cost + forage cost + other feed cost
It is quite difficult to determine the real feeding cost because of by-products. The farmers typically use agricultural by-products to feed their cows such as straw, sugarcane tops, cassava peel, soybean residues, etc., and industry by-products such as brewery residues, molasses, etc. If they have to buy these by-products, the cost is calculated by factoring in the expense for purchasing them. If they produce inside their farms, they usually do not count them in the total cost of milk production.
Cost of grass production
Total cost of grass
production a year
(on a farm)
= cost of grass turf or seed/seeding per year
+ hired labor cost for growing, caring for and cutting grass per
year65
+ fertilizer cost per year, including urea, NPK, kali, phosphate, and
bought manure (if any)
+ land fee cost (if any)
+ cost of irrigation (if any)
+ cost of mower and other tools per year.
+ other costs (if any)
Cost of grass /1 ha/year = total cost of grass production a year/total land area of grass growing
Cost of grass/cow/year = total cost of grass production/number of cow in the farm
Cost of grass/dairy cow/year = total cost of grass production/number of dairy cows on the farm
(Number of dairy cow = number of milking cows + number of dry cows)
Cost of a kg of grass = total cost of grass production/quantity of grass production
Cost of grass/kg of milk = cost of 1 kg of grass * quantity of grass consumed by a milking cow a day/milk yield of a cow/day
65
In order to calculate VA of grass growing, labor cost will be excluded
44 Chapter 2. Methodology of the study and situation of dairy production in Vietnam
Cost of maize silage
Total cost of
maize silage a
year (on a farm)
= cost of maize seed per year
+ hired labor cost for growing, caring for, cutting maize, trench
digging, silage for a year66
+ fertilizer cost per year including urea, NPK, kali, phosphate, and
bought manure (if any)
+ land fee cost (if any)
+ cost of irrigation (if any)
+ cost of mower and other tools per year.
+ cost of substance67
and cover (if any)
+ other cost (if any)
Cost of silage /ha/year = total cost of maize silage a year/total land area of maize growing68
Cost of silage/cow/year = total cost of silage production/number of cows on the farm
Cost of silage/dairy cow/year = total cost of silage production/number of dairy cows on the farm
(Number of dairy cows = number of milking cows + number of dry cows)
Cost of a kg of silage = total cost of silage production/quantity of silage produced
Cost of silage/kg of milk = cost of a kg of silage * quantity of silage consumed by a milking cow/day/ milk yield of a cow/day
Cost of concentrate69
Cost of concentrate/1 kg of milk = cost of a kg of bought concentrate * quantity of concentrate consumed by a milking cow a day/milk yield of a cow a day
Labor cost
This cost refers to the part of the cost of goods and services attributable to wages, especially for direct labor. It is calculated by period – hourly, daily, weekly, monthly, or yearly – in addition to payroll and related taxes or benefits.
- Hired labor is labor that the farm hires to perform work on the farm. Cost of hired labor = wage/salary paid + other relevant costs70
- Family labor (opportunity cost): are members of the family who work as laborers in their farms. This kind of labor cost is quite difficult to calculate because it is hard to separate their house work from their production work. However, this cost can be counted relatively by the equation: Unpaid family cost = average market wage in the region * production working time
66
In order to calculate VA of grass growing, labor cost will be excluded 67
Molasses fodder, and salt are added: 8–10 kg/1 ton maize 68
At the time of study, only maize was grown for silage 69
Concentrate has not been produced but is bought from outside 70
Normally, these include bonus, transport cost, clothing, and others
Chapter 2. Methodology of the study and situation of dairy production in Vietnam 45
Land
Normally, land is considered as a fixed cost (Khai, 2003). However, in Vietnam, land is owned and managed by the government, not private persons. The farmers have the right to use the land but not the right to own it as property (NA, 2003).71 They have to pay a rental fee or land tax yearly to the government.72 The area (number of hectares) is the surface of land that is used for raising animals and/or crops and vegetables by a farmer.
o Land (opportunity cost) is the land use rights that belong to the farm holder: Land cost = land fees or taxes * area (ha)
In Vietnam, the farmers can have land use rights by paying a small land fee or taxes.
o Hired/rented land.
If a farmer does not have enough land, he must rent land from other people or organizations.
Hired/rented land = expense/payment for land using * area (ha)
Other costs
o Veterinary medicine is the cost or payment for artificial insemination, vaccination, medicine, and other medical services for dairy cows.
o Electricity/fuel costs are costs for operating (other than labor costs) machinery for milk production such as milking machines, handling the milk, pump, etc.
o Cost for water: washing the cattle, irrigation, etc.
o Cost of hygiene maintenance (cleaning of shed, removal of waste, disposal of waste, application of chemicals). Attention must be paid to calculating these costs separately from other costs such as labor costs or electricity costs, etc., in order to avoid overlapping.
o Fertilizer cost is an expense of the farm for growing the grass and maize used as dairy cattle feed.
o Other overhead costs.
These costs usually are calculated based on the invoices received by the farmer.
Outputs, revenue, and value added
Outputs (products) of a farm
On a farm, outputs or products are considered as goods or a service that result from a production process. They are produced to meet the demand of customers or to serve a need. They can be tangible things or intangible attributes. Products consist of main products and by-products.
Total products = Main products + by-products
= Products sold + auto or own consumption products
Main product
Main products or principal products are major products that are produced in great quantity and generate a large share of value or turnover for the producers. Main products usually 71
Article 1, p 1 72
Between the years 2003 and 2013, the government exempted farmers from land tax
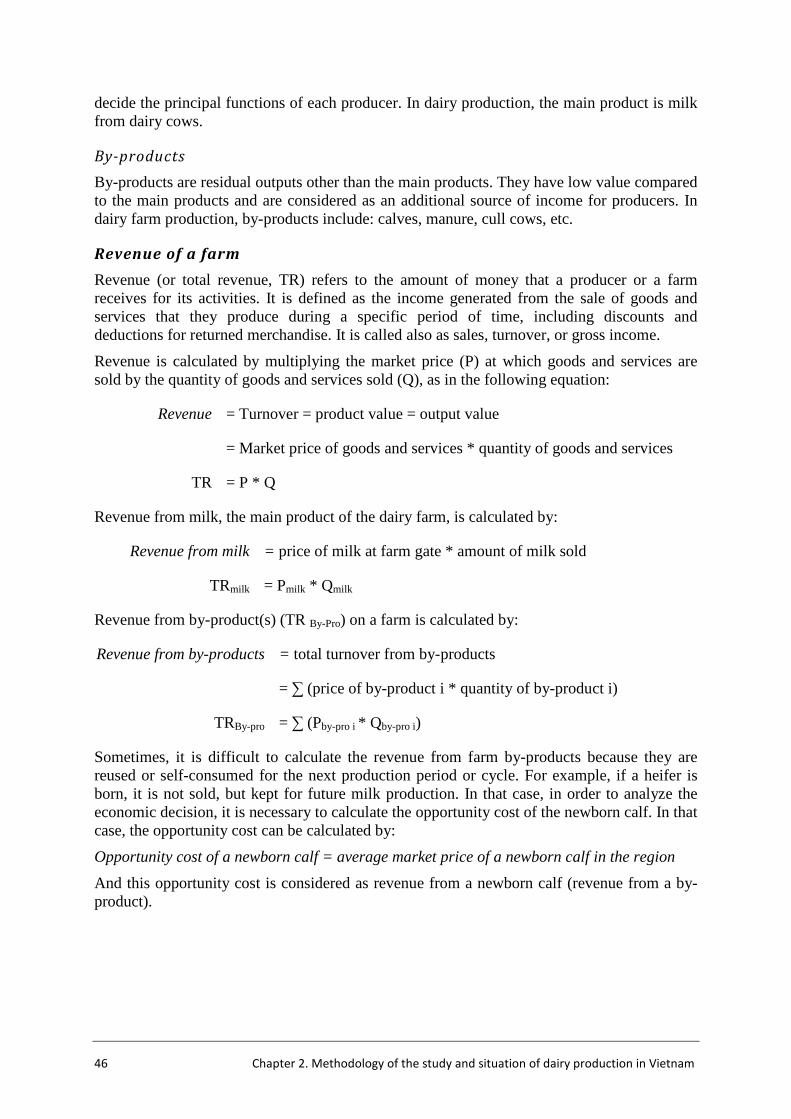
46 Chapter 2. Methodology of the study and situation of dairy production in Vietnam
decide the principal functions of each producer. In dairy production, the main product is milk from dairy cows.
By-products
By-products are residual outputs other than the main products. They have low value compared to the main products and are considered as an additional source of income for producers. In dairy farm production, by-products include: calves, manure, cull cows, etc.
Revenue of a farm
Revenue (or total revenue, TR) refers to the amount of money that a producer or a farm receives for its activities. It is defined as the income generated from the sale of goods and services that they produce during a specific period of time, including discounts and deductions for returned merchandise. It is called also as sales, turnover, or gross income.
Revenue is calculated by multiplying the market price (P) at which goods and services are sold by the quantity of goods and services sold (Q), as in the following equation:
Revenue = Turnover = product value = output value
= Market price of goods and services * quantity of goods and services
TR = P * Q
Revenue from milk, the main product of the dairy farm, is calculated by:
Revenue from milk = price of milk at farm gate * amount of milk sold
TRmilk = Pmilk * Qmilk
Revenue from by-product(s) (TR By-Pro) on a farm is calculated by:
Revenue from by-products = total turnover from by-products
= ∑ (price of by-product i * quantity of by-product i)
TRBy-pro = ∑ (Pby-pro i * Qby-pro i)
Sometimes, it is difficult to calculate the revenue from farm by-products because they are reused or self-consumed for the next production period or cycle. For example, if a heifer is born, it is not sold, but kept for future milk production. In that case, in order to analyze the economic decision, it is necessary to calculate the opportunity cost of the newborn calf. In that case, the opportunity cost can be calculated by:
Opportunity cost of a newborn calf = average market price of a newborn calf in the region
And this opportunity cost is considered as revenue from a newborn calf (revenue from a by-product).
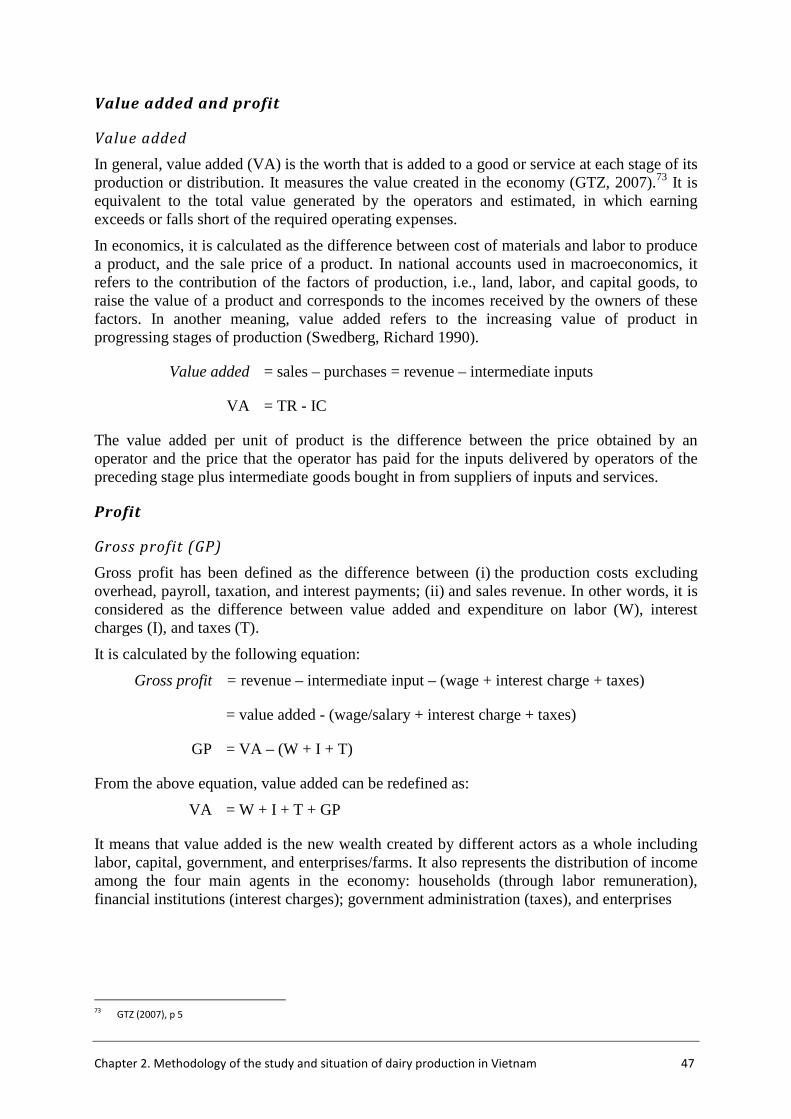
Chapter 2. Methodology of the study and situation of dairy production in Vietnam 47
Value added and profit
Value added
In general, value added (VA) is the worth that is added to a good or service at each stage of its production or distribution. It measures the value created in the economy (GTZ, 2007).73 It is equivalent to the total value generated by the operators and estimated, in which earning exceeds or falls short of the required operating expenses.
In economics, it is calculated as the difference between cost of materials and labor to produce a product, and the sale price of a product. In national accounts used in macroeconomics, it refers to the contribution of the factors of production, i.e., land, labor, and capital goods, to raise the value of a product and corresponds to the incomes received by the owners of these factors. In another meaning, value added refers to the increasing value of product in progressing stages of production (Swedberg, Richard 1990).
Value added = sales – purchases = revenue – intermediate inputs
VA = TR - IC
The value added per unit of product is the difference between the price obtained by an operator and the price that the operator has paid for the inputs delivered by operators of the preceding stage plus intermediate goods bought in from suppliers of inputs and services.
Profit
Gross profit (GP)
Gross profit has been defined as the difference between (i) the production costs excluding overhead, payroll, taxation, and interest payments; (ii) and sales revenue. In other words, it is considered as the difference between value added and expenditure on labor (W), interest charges (I), and taxes (T).
It is calculated by the following equation:
Gross profit = revenue – intermediate input – (wage + interest charge + taxes)
= value added - (wage/salary + interest charge + taxes)
GP = VA – (W + I + T)
From the above equation, value added can be redefined as:
VA = W + I + T + GP
It means that value added is the new wealth created by different actors as a whole including labor, capital, government, and enterprises/farms. It also represents the distribution of income among the four main agents in the economy: households (through labor remuneration), financial institutions (interest charges); government administration (taxes), and enterprises
73
GTZ (2007), p 5
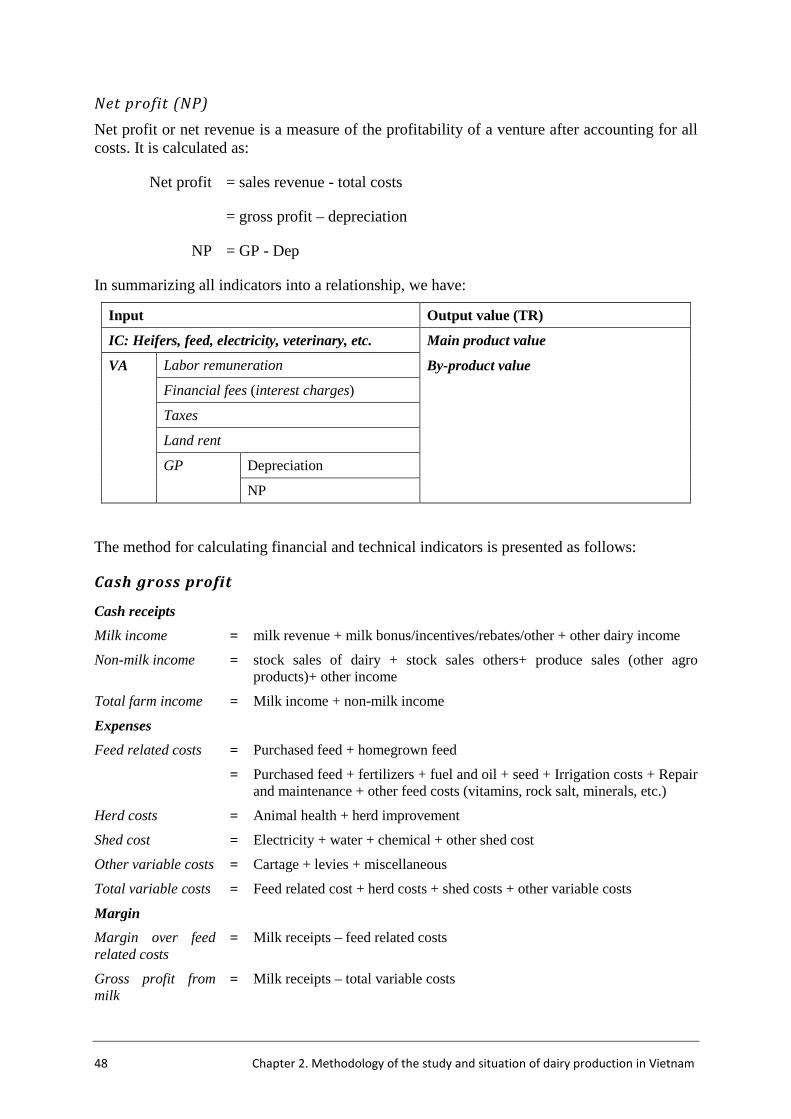
48 Chapter 2. Methodology of the study and situation of dairy production in Vietnam
Net profit (NP)
Net profit or net revenue is a measure of the profitability of a venture after accounting for all costs. It is calculated as:
Net profit = sales revenue - total costs
= gross profit – depreciation
NP = GP - Dep
In summarizing all indicators into a relationship, we have:
Input Output value (TR)
IC: Heifers, feed, electricity, veterinary, etc. Main product value
VA Labor remuneration By-product value
Financial fees (interest charges)
Taxes
Land rent
GP Depreciation
NP
The method for calculating financial and technical indicators is presented as follows:
Cash gross profit
Cash receipts
Milk income = milk revenue + milk bonus/incentives/rebates/other + other dairy income
Non-milk income = stock sales of dairy + stock sales others+ produce sales (other agro products)+ other income
Total farm income = Milk income + non-milk income
Expenses
Feed related costs = Purchased feed + homegrown feed
= Purchased feed + fertilizers + fuel and oil + seed + Irrigation costs + Repair and maintenance + other feed costs (vitamins, rock salt, minerals, etc.)
Herd costs = Animal health + herd improvement
Shed cost = Electricity + water + chemical + other shed cost
Other variable costs = Cartage + levies + miscellaneous
Total variable costs = Feed related cost + herd costs + shed costs + other variable costs
Margin
Margin over feed related costs
= Milk receipts – feed related costs
Gross profit from milk
= Milk receipts – total variable costs
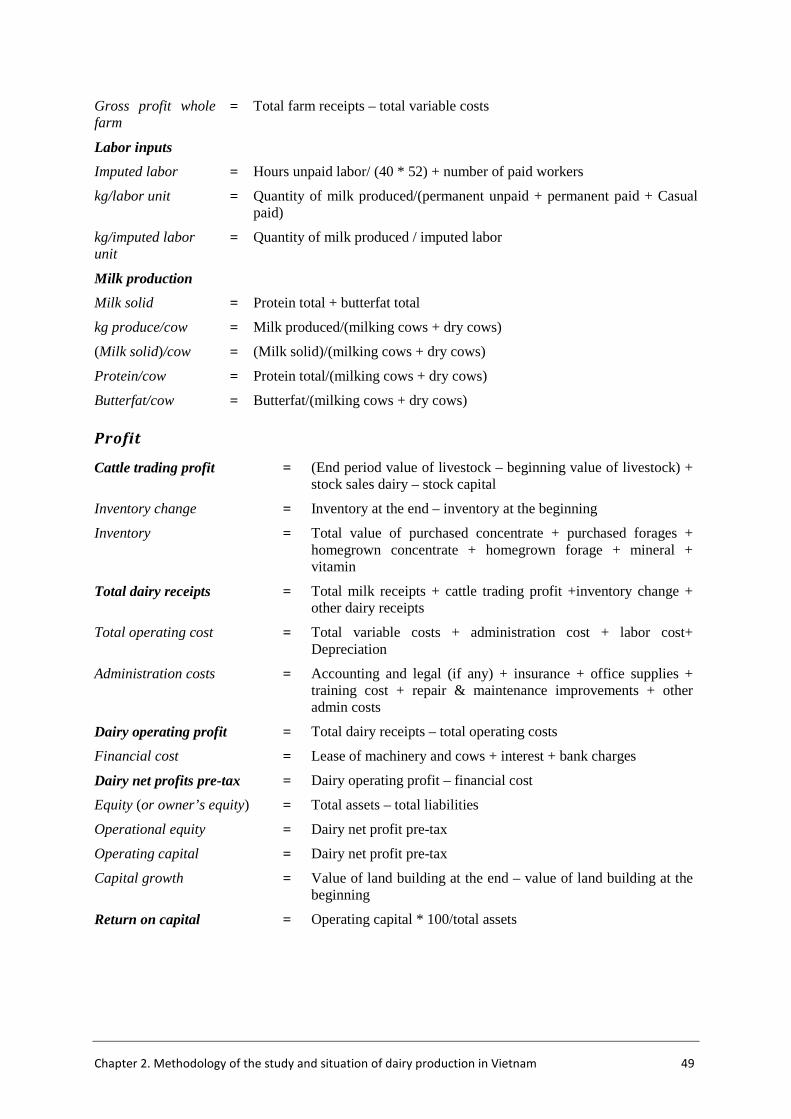
Chapter 2. Methodology of the study and situation of dairy production in Vietnam 49
Gross profit whole farm
= Total farm receipts – total variable costs
Labor inputs
Imputed labor = Hours unpaid labor/ (40 * 52) + number of paid workers
kg/labor unit = Quantity of milk produced/(permanent unpaid + permanent paid + Casual paid)
kg/imputed labor unit
= Quantity of milk produced / imputed labor
Milk production
Milk solid = Protein total + butterfat total
kg produce/cow = Milk produced/(milking cows + dry cows)
(Milk solid)/cow = (Milk solid)/(milking cows + dry cows)
Protein/cow = Protein total/(milking cows + dry cows)
Butterfat/cow = Butterfat/(milking cows + dry cows)
Profit
Cattle trading profit = (End period value of livestock – beginning value of livestock) + stock sales dairy – stock capital
Inventory change = Inventory at the end – inventory at the beginning
Inventory = Total value of purchased concentrate + purchased forages + homegrown concentrate + homegrown forage + mineral + vitamin
Total dairy receipts = Total milk receipts + cattle trading profit +inventory change + other dairy receipts
Total operating cost = Total variable costs + administration cost + labor cost+ Depreciation
Administration costs = Accounting and legal (if any) + insurance + office supplies + training cost + repair & maintenance improvements + other admin costs
Dairy operating profit = Total dairy receipts – total operating costs
Financial cost = Lease of machinery and cows + interest + bank charges
Dairy net profits pre-tax = Dairy operating profit – financial cost
Equity (or owner’s equity) = Total assets – total liabilities
Operational equity = Dairy net profit pre-tax
Operating capital = Dairy net profit pre-tax
Capital growth = Value of land building at the end – value of land building at the beginning
Return on capital = Operating capital * 100/total assets
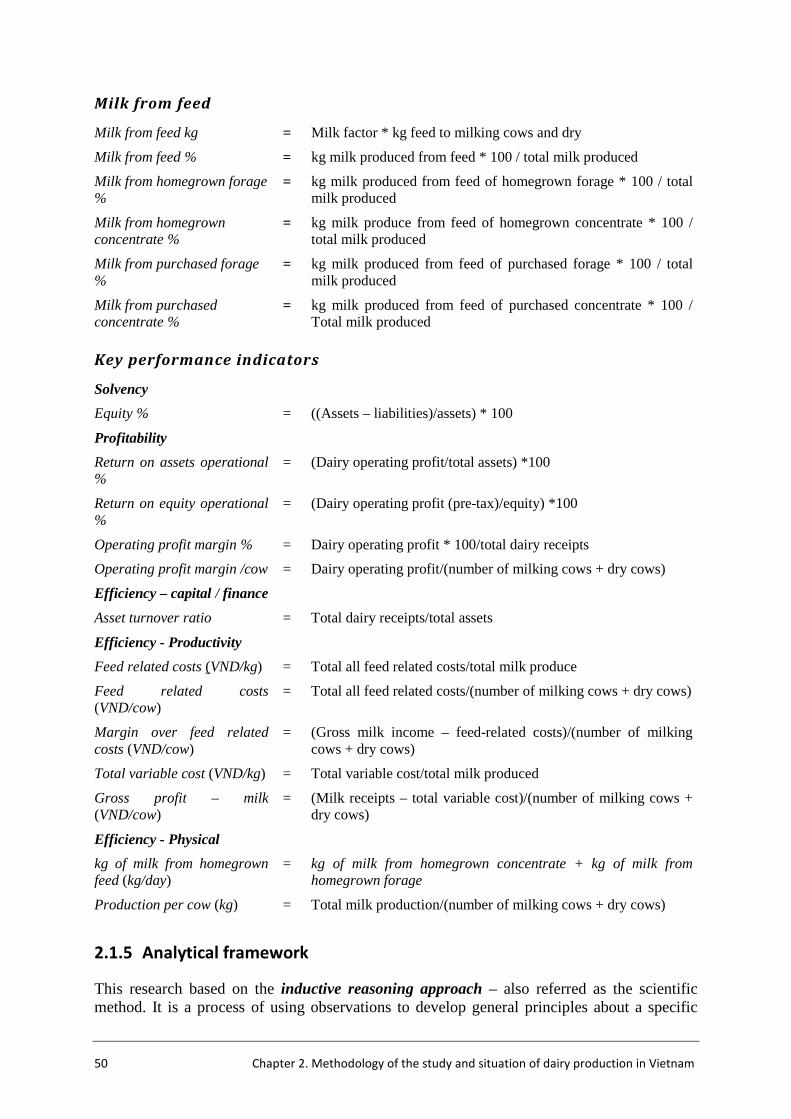
50 Chapter 2. Methodology of the study and situation of dairy production in Vietnam
Milk from feed
Milk from feed kg = Milk factor * kg feed to milking cows and dry
Milk from feed % = kg milk produced from feed * 100 / total milk produced
Milk from homegrown forage %
= kg milk produced from feed of homegrown forage * 100 / total milk produced
Milk from homegrown concentrate %
= kg milk produce from feed of homegrown concentrate * 100 / total milk produced
Milk from purchased forage %
= kg milk produced from feed of purchased forage * 100 / total milk produced
Milk from purchased concentrate %
= kg milk produced from feed of purchased concentrate * 100 / Total milk produced
Key performance indicators
Solvency
Equity % = ((Assets – liabilities)/assets) * 100
Profitability
Return on assets operational %
= (Dairy operating profit/total assets) *100
Return on equity operational %
= (Dairy operating profit (pre-tax)/equity) *100
Operating profit margin % = Dairy operating profit * 100/total dairy receipts
Operating profit margin /cow = Dairy operating profit/(number of milking cows + dry cows)
Efficiency – capital / finance
Asset turnover ratio = Total dairy receipts/total assets
Efficiency - Productivity
Feed related costs (VND/kg) = Total all feed related costs/total milk produce
Feed related costs (VND/cow)
= Total all feed related costs/(number of milking cows + dry cows)
Margin over feed related costs (VND/cow)
= (Gross milk income – feed-related costs)/(number of milking cows + dry cows)
Total variable cost (VND/kg) = Total variable cost/total milk produced
Gross profit – milk (VND/cow)
= (Milk receipts – total variable cost)/(number of milking cows + dry cows)
Efficiency - Physical
kg of milk from homegrown feed (kg/day)
= kg of milk from homegrown concentrate + kg of milk from homegrown forage
Production per cow (kg) = Total milk production/(number of milking cows + dry cows)
2.1.5 Analytical framework
This research based on the inductive reasoning approach – also referred as the scientific method. It is a process of using observations to develop general principles about a specific
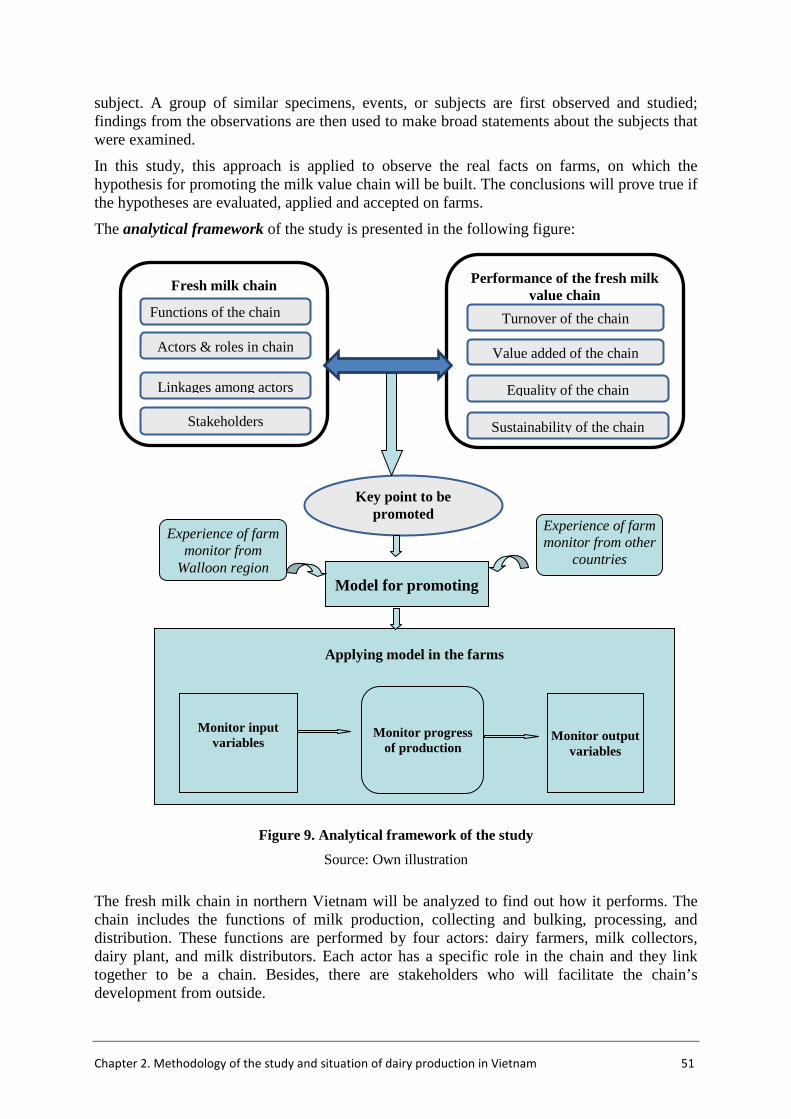
Chapter 2. Methodology of the study and situation of dairy production in Vietnam 51
subject. A group of similar specimens, events, or subjects are first observed and studied; findings from the observations are then used to make broad statements about the subjects that were examined.
In this study, this approach is applied to observe the real facts on farms, on which the hypothesis for promoting the milk value chain will be built. The conclusions will prove true if the hypotheses are evaluated, applied and accepted on farms.
The analytical framework of the study is presented in the following figure:
Figure 9. Analytical framework of the study
Source: Own illustration
The fresh milk chain in northern Vietnam will be analyzed to find out how it performs. The chain includes the functions of milk production, collecting and bulking, processing, and distribution. These functions are performed by four actors: dairy farmers, milk collectors, dairy plant, and milk distributors. Each actor has a specific role in the chain and they link together to be a chain. Besides, there are stakeholders who will facilitate the chain’s development from outside.
Applying model in the farms
Monitor input variables
Monitor output variables
Monitor progress of production
Performance of the fresh milk value chain
Key point to be promoted
Fresh milk chain
Functions of the chain
Actors & roles in chain
Linkages among actors
Stakeholders Sustainability of the chain
Equality of the chain
Value added of the chain
Turnover of the chain
Model for promoting
Experience of farm monitor from
Walloon region
Experience of farm monitor from other
countries

52 Chapter 2. Methodology of the study and situation of dairy production in Vietnam
Performance of the chain will then be analyzed including turnover and added value created by the actors of the chain. The equality and sustainability of the chain will be studied. After that, the SWOT and PRA tools will be exploited to determine where the weakest point in the chain is, who the most vulnerable actor is, and which key is the most important to make the chain perform better. Then, a model will be established to promote the chain based on the real situation of farms with reference to the experience of a farm monitor from Walloon region and farm monitors from other countries. The model will be applied in farms to monitor the variables of inputs, as well as process the activities and output of the production. The study will apply an on-farm experiment. The details of the technical method include the main steps as follows:
Figure 10. Technical method for on-farm experiment
Source: Own compilation
• Firstly, it is necessary to gather available information on dairy-related activities in Vietnam. Then, interacting with stakeholders in the dairy sector will be done to collect the primary data on the fresh milk chain in northern Vietnam. The main data collection on farms will be technical data such as the milk yield, lactation length, the quality of milk, along with economic data for the instant monitoring system, constraints and weaknesses. After that, the study will concentrate on processing and analyzing the primary data collection, establishing details regarding the value chain, and focus on economic and technical factors at the household level.
• The next step will be the findings of the cluster for promoting the chain. A visit to and study of successful dairy farms will be carried out to see how they organize the operational chart and review documents from typical cases. After that, a model will be defined for dairy farmers in Vietnam and will be extended and applied to some typical households/farms.
Survey
PRA
1st phase
2nd phase
Apply and monitor
Recommend
3rd phase
PRA
PRA
Problem
Discuss
Households
Establish a model for promoting
Experience from Walloon region
Select farms and variables
Farm
Farm
Farm
Prepare to apply Group discussions
Analysis
Chapter 2. Methodology of the study and situation of dairy production in Vietnam 53
• The model will be applied on dairy farms. Then, observations and analysis of the differences before and after, recommendations to be put into practice, difficulties in applying them in order to promote value added for dairy farmers will be presented. From the clustered findings, the research will formulate recommendations for promoting the fresh milk chain in order to improve the welfare of dairymen as well as improve equality in the chain.
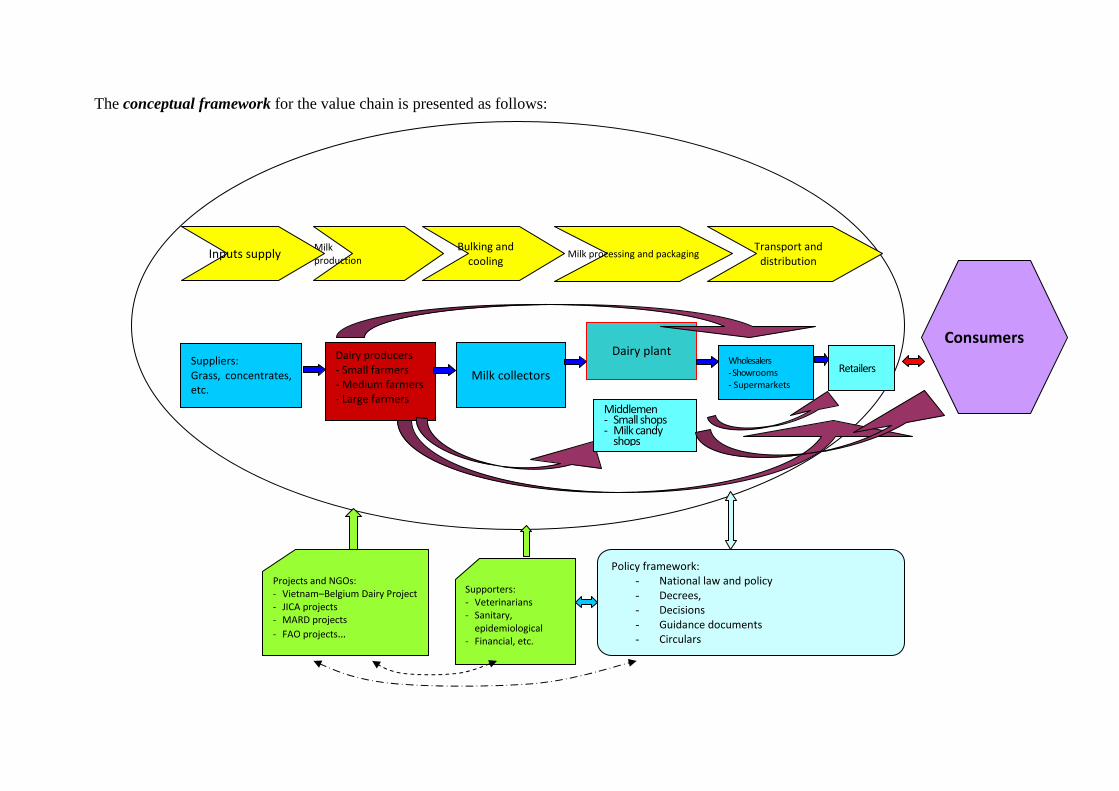
The conceptual framework for the value chain is presented as follows:
Supporters:
- Veterinarians
- Sanitary,
epidemiological
- Financial, etc.
Milk
production Inputs supply
Bulking and
cooling Milk processing and packaging
Transport and
distribution
Suppliers:
Grass, concentrates,
etc.
Dairy producers
- Small farmers
- Medium farmers
- Large farmers
Milk collectors
Wholesalers
- Showrooms
- Supermarkets
Dairy plant
Projects and NGOs:
- Vietnam–Belgium Dairy Project
- JICA projects
- MARD projects
- FAO projects…
Policy framework:
- National law and policy
- Decrees,
- Decisions
- Guidance documents
- Circulars
Consumers
Middlemen - Small shops - Milk candy
shops
Retailers
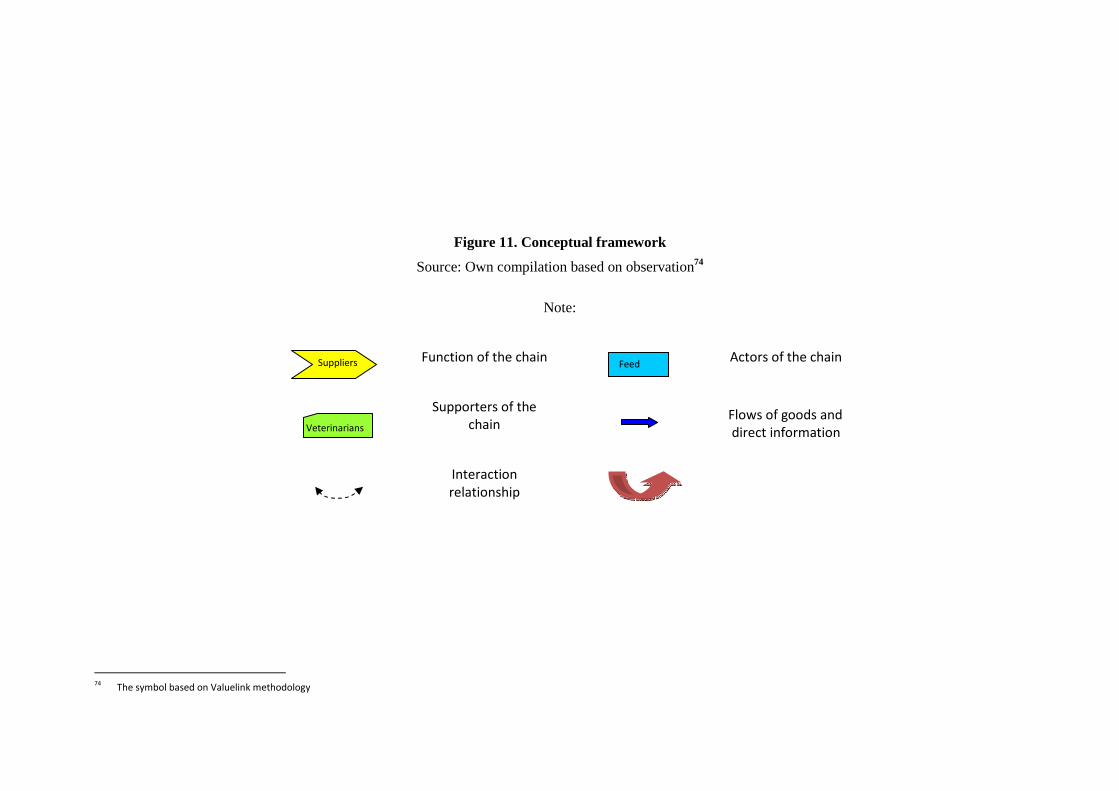
Figure 11. Conceptual framework
Source: Own compilation based on observation74
Note:
Function of the chain Actors of the chain
Supporters of the
chain Flows of goods and
direct information
Interaction
relationship
74
The symbol based on Valuelink methodology
Veterinarians
Suppliers Feed

Chapter 2. Methodology of the study and situation of dairy production in Vietnam 57
Suppliers are those who provide the inputs for milk production such as: forage and concentrated feed, heifers, machinery for milk producers, etc. Dairy producers refer to persons who keep cows for milk. In this study, they are dairy farmers or dairy householders. They are classified into three groups based on the herd size: small-, medium- and large-sized. They are also considered to be the main actors in the chain that the research will focus on. Milk collectors are actors who collect milk from dairy farmers, bulk and cool it, then deliver it to dairy processors, dairy distributors, or customers. The dairy plant is a factory that receives milk from milk collectors and goes on to process and package it. Distributors can be wholesalers, retailers, and middlemen who provide milk to the end customers. Because Vietnam does not export milk and is considered to be an importer of milk and milk products, this chain stops at the borders and does not concern itself with the export market.
Besides the main actors in the chain, some stakeholders will be viewed as supporters in the chain (providers of financial services, research and extension services, credit services, sanitary workers, veterinarians, etc.), alongside policy framework and project designers, and NGOs that normally work with the chain.
There are linkages among the chain actors. Strong and positive linkages will enhance the development of the entire chain and increase the value added of each actor in the chain. In contrast, loose and negative linkages lead to decreased benefits for the actors and the chain as a whole.
2.2 SITUATION OF DAIRY PRODUCTION IN VIETNAM
2.2.1 Basic socioeconomic and agro-ecological characteristics of Vietnam
2.2.1.1 Socioeconomic characteristics of Vietnam
Economic development
The economy of Vietnam has grown gradually over time since the Doi Moi75 (renovation) reforms were instituted. Since 2005, Vietnam has become the second country in Asia whose fast economic growth rate exceeded 8 percent per annum (GSO, 2011; Nancy, 2008). Thanks to the government’s commitment to market liberalization and further reforms of the legal, financial, and institutional systems, Vietnam’s development has been put on the world center stage. In 2011, the gross domestic product (GDP) of Vietnam at current prices was 2,535 thousand billion Vietnam dong (VND), an increase of 5.74 times (it was 584.1 thousand billion VND at constant prices,76 increasing 2.13 times) compared to that of the year 2000 (GSO, 2011).77 GDP per capita per year rose from 5.7 million VND (402 USD) in 2000 to 28.9 million VND (1,375 USD) in 2011. As the result of the economic growth, almost all the macroeconomic indicators increased.
75
In 1986 76
At constant price 1994 77
At: http://www.gso.gov.vn/default.aspx?tabid=388&idmid=3&ItemID=9897, consulted on 29/08/2011
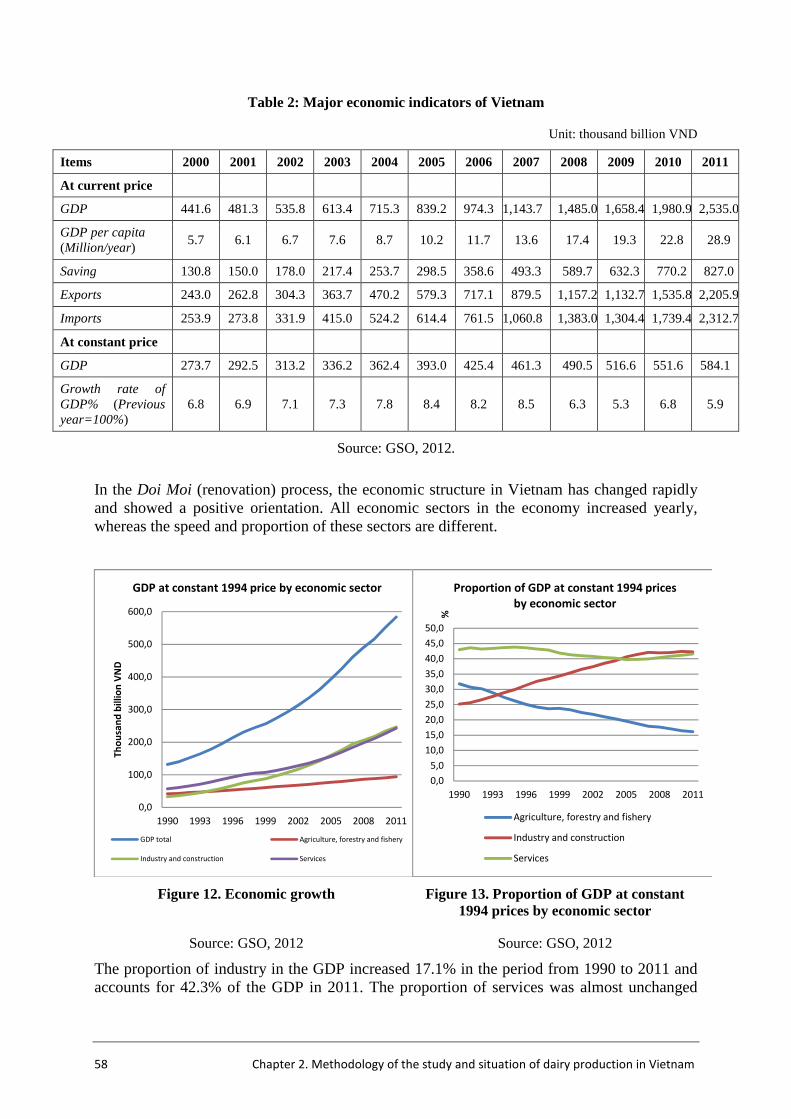
58 Chapter 2. Methodology of the study and situation of dairy production in Vietnam
Table 2: Major economic indicators of Vietnam
Unit: thousand billion VND
Items 2000 2001 2002 2003 2004 2005 2006 2007 2008 2009 2010 2011
At current price
GDP 441.6 481.3 535.8 613.4 715.3 839.2 974.3 1,143.7 1,485.0 1,658.4 1,980.9 2,535.0
GDP per capita (Million/year)
5.7 6.1 6.7 7.6 8.7 10.2 11.7 13.6 17.4 19.3 22.8 28.9
Saving 130.8 150.0 178.0 217.4 253.7 298.5 358.6 493.3 589.7 632.3 770.2 827.0
Exports 243.0 262.8 304.3 363.7 470.2 579.3 717.1 879.5 1,157.2 1,132.7 1,535.8 2,205.9
Imports 253.9 273.8 331.9 415.0 524.2 614.4 761.5 1,060.8 1,383.0 1,304.4 1,739.4 2,312.7
At constant price
GDP 273.7 292.5 313.2 336.2 362.4 393.0 425.4 461.3 490.5 516.6 551.6 584.1
Growth rate of GDP% (Previous year=100%)
6.8 6.9 7.1 7.3 7.8 8.4 8.2 8.5 6.3 5.3 6.8 5.9
Source: GSO, 2012.
In the Doi Moi (renovation) process, the economic structure in Vietnam has changed rapidly and showed a positive orientation. All economic sectors in the economy increased yearly, whereas the speed and proportion of these sectors are different.
Figure 12. Economic growth Figure 13. Proportion of GDP at constant 1994 prices by economic sector
Source: GSO, 2012 Source: GSO, 2012
The proportion of industry in the GDP increased 17.1% in the period from 1990 to 2011 and accounts for 42.3% of the GDP in 2011. The proportion of services was almost unchanged
0,0
100,0
200,0
300,0
400,0
500,0
600,0
1990 1993 1996 1999 2002 2005 2008 2011
Th
ou
san
d b
illi
on
VN
D
GDP at constant 1994 price by economic sector
GDP total Agriculture, forestry and fishery
Industry and construction Services
0,0
5,0
10,0
15,0
20,0
25,0
30,0
35,0
40,0
45,0
50,0
1990 1993 1996 1999 2002 2005 2008 2011
%
Proportion of GDP at constant 1994 prices
by economic sector
Agriculture, forestry and fishery
Industry and construction
Services
Chapter 2. Methodology of the study and situation of dairy production in Vietnam 59
and achieved a high level of more than 40%. The proportion of agriculture decreased by 15.7%. However, in absolute values, all indicators have gone up yearly.
Social issues
Vietnam has a population of 88.87 million in 2012 (GSO, 2013), of which 59.97 million persons were residing in rural areas, accounting for 67.48% of the total; 44.86 million were women (GSO, 2013). As a result of the change in the economic structure, there is an increase in quantity of labor in the industry and service sectors with a higher skills level accompanied by a decrease in the fields of agriculture and unskilled laborers. Thus, there is a transformation and a transfer of rural labor to urban areas.
Even though the proportion of unskilled laborers diminished 18.2% from 1979 to 2005, it is still too high at 75.21% (GSO 1983, GSO 1992, GSO 2000, GSO 2005). This labor was not trained and given any technical skills for working. This shows that labor qualifications in Vietnam are very low. This is a constraint to the development of the country.
The ratio of urban laborers has increased, while that of rural laborers has decreased. However, the speed of structure change is very slow. In 2009, urban laborers accounted for 26.4%, while rural laborers still dominated with 73.6% (GSO, 2011). The ratio is too great in view of the country’s move toward industrialization and modernization. The structure seems to be intensive as far as rural labor is concerned. In urban areas, the unemployment rate was 4.6% in 2010 while in rural areas, the working time is only 81.79% (GSO, 2009.1). This is really a problem needing to be solved to develop the economy.
In rural and mountainous areas, agricultural production plays a more significant role and becomes the main activity. There are 70.06% of rural residents working and living on this sector. Service jobs account for 14.92% and those of industry are 10.18% (Source: GSO 2007.2).
The household structure by main income sources reflects the trend of livelihood diversification in rural areas. Various occupations are being developed and eliminate purely agriculture-based rural livelihoods. The production efficiency of non-agricultural, forestry, and fishery activities is a major reason leading to the difference in the household structure by jobs and by major income sources. There are 67.8% households who responded that a major source of income comes from agricultural activities (GSO, 2007.2). It is also mainly in the form of self-consumed production (Maltsoglou and Rapsomanikis, 2005).
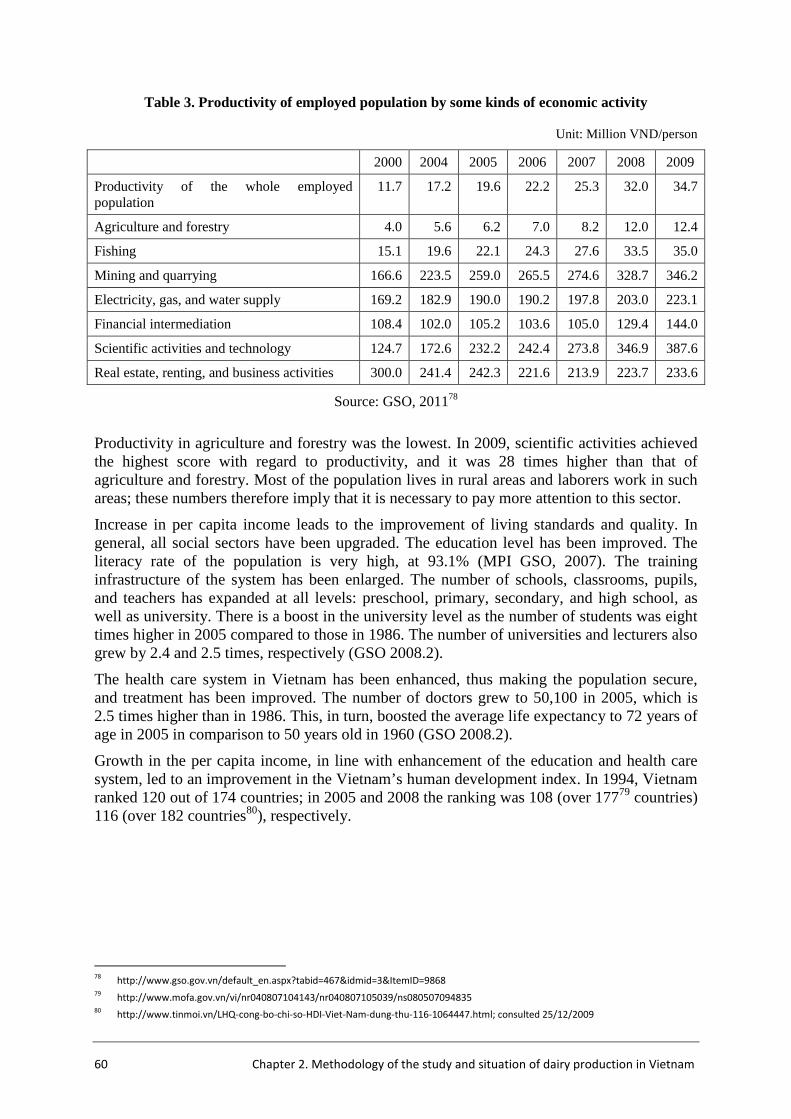
60 Chapter 2. Methodology of the study and situation of dairy production in Vietnam
Table 3. Productivity of employed population by some kinds of economic activity
Unit: Million VND/person
2000 2004 2005 2006 2007 2008 2009
Productivity of the whole employed population
11.7 17.2 19.6 22.2 25.3 32.0 34.7
Agriculture and forestry 4.0 5.6 6.2 7.0 8.2 12.0 12.4
Fishing 15.1 19.6 22.1 24.3 27.6 33.5 35.0
Mining and quarrying 166.6 223.5 259.0 265.5 274.6 328.7 346.2
Electricity, gas, and water supply 169.2 182.9 190.0 190.2 197.8 203.0 223.1
Financial intermediation 108.4 102.0 105.2 103.6 105.0 129.4 144.0
Scientific activities and technology 124.7 172.6 232.2 242.4 273.8 346.9 387.6
Real estate, renting, and business activities 300.0 241.4 242.3 221.6 213.9 223.7 233.6
Source: GSO, 201178
Productivity in agriculture and forestry was the lowest. In 2009, scientific activities achieved the highest score with regard to productivity, and it was 28 times higher than that of agriculture and forestry. Most of the population lives in rural areas and laborers work in such areas; these numbers therefore imply that it is necessary to pay more attention to this sector.
Increase in per capita income leads to the improvement of living standards and quality. In general, all social sectors have been upgraded. The education level has been improved. The literacy rate of the population is very high, at 93.1% (MPI GSO, 2007). The training infrastructure of the system has been enlarged. The number of schools, classrooms, pupils, and teachers has expanded at all levels: preschool, primary, secondary, and high school, as well as university. There is a boost in the university level as the number of students was eight times higher in 2005 compared to those in 1986. The number of universities and lecturers also grew by 2.4 and 2.5 times, respectively (GSO 2008.2).
The health care system in Vietnam has been enhanced, thus making the population secure, and treatment has been improved. The number of doctors grew to 50,100 in 2005, which is 2.5 times higher than in 1986. This, in turn, boosted the average life expectancy to 72 years of age in 2005 in comparison to 50 years old in 1960 (GSO 2008.2).
Growth in the per capita income, in line with enhancement of the education and health care system, led to an improvement in the Vietnam’s human development index. In 1994, Vietnam ranked 120 out of 174 countries; in 2005 and 2008 the ranking was 108 (over 17779 countries) 116 (over 182 countries80), respectively.
78
http://www.gso.gov.vn/default_en.aspx?tabid=467&idmid=3&ItemID=9868 79
http://www.mofa.gov.vn/vi/nr040807104143/nr040807105039/ns080507094835 80
http://www.tinmoi.vn/LHQ-cong-bo-chi-so-HDI-Viet-Nam-dung-thu-116-1064447.html; consulted 25/12/2009
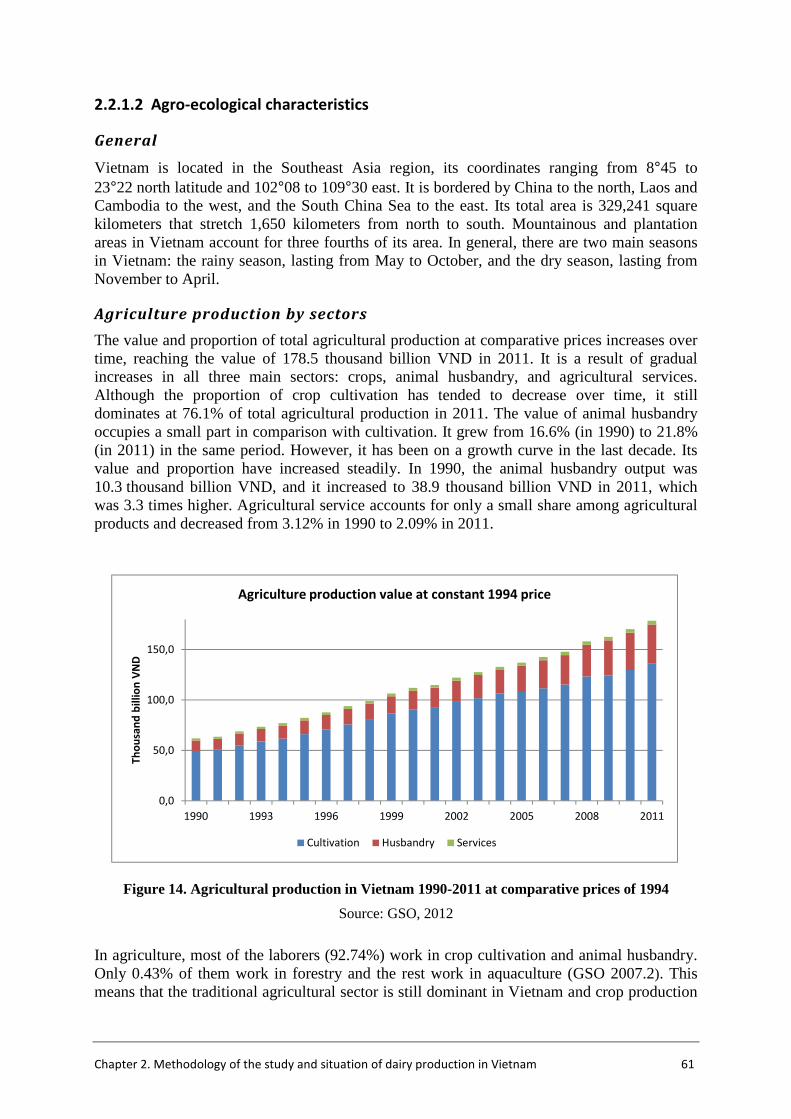
Chapter 2. Methodology of the study and situation of dairy production in Vietnam 61
2.2.1.2 Agro-ecological characteristics
General
Vietnam is located in the Southeast Asia region, its coordinates ranging from 8°45 to 23°22 north latitude and 102°08 to 109°30 east. It is bordered by China to the north, Laos and Cambodia to the west, and the South China Sea to the east. Its total area is 329,241 square kilometers that stretch 1,650 kilometers from north to south. Mountainous and plantation areas in Vietnam account for three fourths of its area. In general, there are two main seasons in Vietnam: the rainy season, lasting from May to October, and the dry season, lasting from November to April.
Agriculture production by sectors
The value and proportion of total agricultural production at comparative prices increases over time, reaching the value of 178.5 thousand billion VND in 2011. It is a result of gradual increases in all three main sectors: crops, animal husbandry, and agricultural services. Although the proportion of crop cultivation has tended to decrease over time, it still dominates at 76.1% of total agricultural production in 2011. The value of animal husbandry occupies a small part in comparison with cultivation. It grew from 16.6% (in 1990) to 21.8% (in 2011) in the same period. However, it has been on a growth curve in the last decade. Its value and proportion have increased steadily. In 1990, the animal husbandry output was 10.3 thousand billion VND, and it increased to 38.9 thousand billion VND in 2011, which was 3.3 times higher. Agricultural service accounts for only a small share among agricultural products and decreased from 3.12% in 1990 to 2.09% in 2011.
Figure 14. Agricultural production in Vietnam 1990-2011 at comparative prices of 1994
Source: GSO, 2012
In agriculture, most of the laborers (92.74%) work in crop cultivation and animal husbandry. Only 0.43% of them work in forestry and the rest work in aquaculture (GSO 2007.2). This means that the traditional agricultural sector is still dominant in Vietnam and crop production
0,0
50,0
100,0
150,0
1990 1993 1996 1999 2002 2005 2008 2011
Th
ou
san
d b
illi
on
VN
D
Agriculture production value at constant 1994 price
Cultivation Husbandry Services
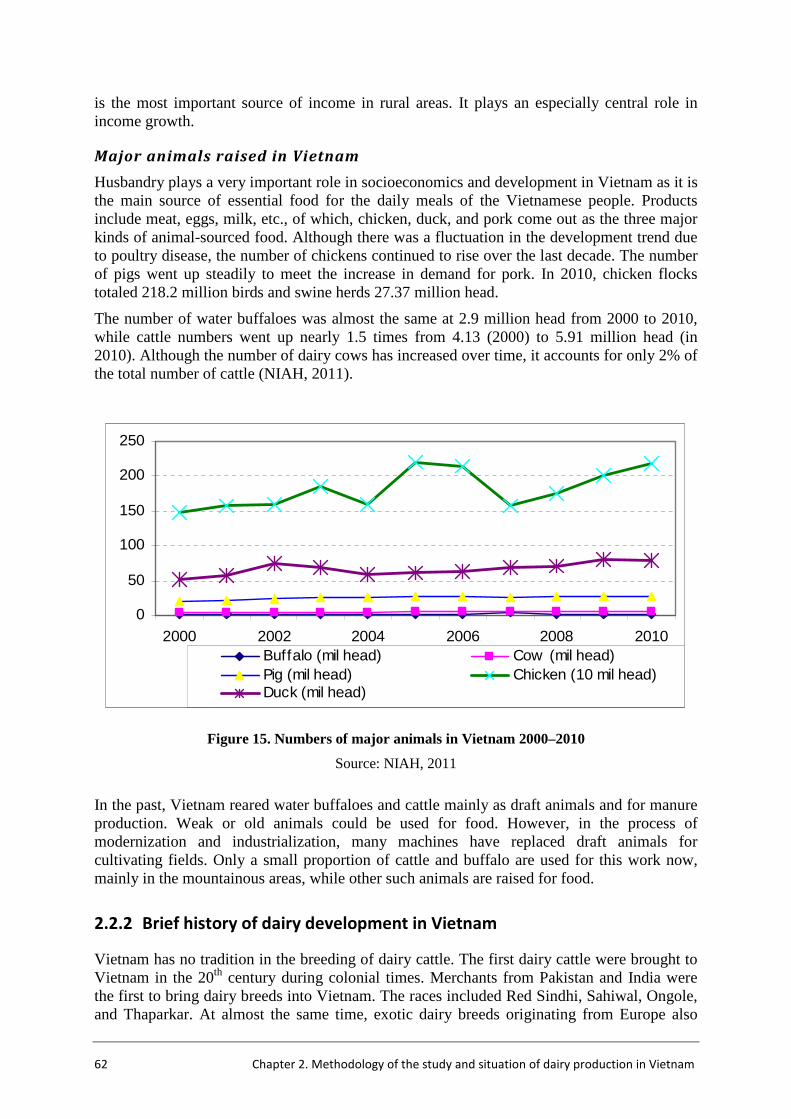
62 Chapter 2. Methodology of the study and situation of dairy production in Vietnam
is the most important source of income in rural areas. It plays an especially central role in income growth.
Major animals raised in Vietnam
Husbandry plays a very important role in socioeconomics and development in Vietnam as it is the main source of essential food for the daily meals of the Vietnamese people. Products include meat, eggs, milk, etc., of which, chicken, duck, and pork come out as the three major kinds of animal-sourced food. Although there was a fluctuation in the development trend due to poultry disease, the number of chickens continued to rise over the last decade. The number of pigs went up steadily to meet the increase in demand for pork. In 2010, chicken flocks totaled 218.2 million birds and swine herds 27.37 million head.
The number of water buffaloes was almost the same at 2.9 million head from 2000 to 2010, while cattle numbers went up nearly 1.5 times from 4.13 (2000) to 5.91 million head (in 2010). Although the number of dairy cows has increased over time, it accounts for only 2% of the total number of cattle (NIAH, 2011).
Figure 15. Numbers of major animals in Vietnam 2000–2010
Source: NIAH, 2011
In the past, Vietnam reared water buffaloes and cattle mainly as draft animals and for manure production. Weak or old animals could be used for food. However, in the process of modernization and industrialization, many machines have replaced draft animals for cultivating fields. Only a small proportion of cattle and buffalo are used for this work now, mainly in the mountainous areas, while other such animals are raised for food.
2.2.2 Brief history of dairy development in Vietnam
Vietnam has no tradition in the breeding of dairy cattle. The first dairy cattle were brought to Vietnam in the 20th century during colonial times. Merchants from Pakistan and India were the first to bring dairy breeds into Vietnam. The races included Red Sindhi, Sahiwal, Ongole, and Thaparkar. At almost the same time, exotic dairy breeds originating from Europe also
0
50
100
150
200
250
2000 2002 2004 2006 2008 2010Buffalo (mil head) Cow (mil head)Pig (mil head) Chicken (10 mil head)Duck (mil head)
Chapter 2. Methodology of the study and situation of dairy production in Vietnam 63
appeared in Vietnam. Dairy cattle began to be kept to provide milk for French residents, and the main consumers lived in Hanoi, Dalat, and Saigon (Ho Chi Minh City). Then a new Laisind crossbreed was generated by mating the Vietnamese yellow cow with Indian Red Sindhi bulls.
During the 1920s and 1930s, some farms were founded in the south, producing around 400 tons milk (Nancy et al., 2006). From the 1950s, State-owned farms in the north and some large private farms in the south were established to keep dairy cattle imported from Australia, the Netherlands, and China (Beijing). At first, dairy cattle were kept in the most favorable conditions for milk production, such as in Moc Chau (Son La), Ba Vi (Hanoi), Dong Giao (Ninh Binh), and Sapa (Lao Cai). In the 1970s, with the support and generosity of Cuba, 883 Holstein Friesian cows originating from Canada were put on farms in Moc Chau and the Moncada artificial Insemination Center was set up in Ba Vi.
Dairy cattle were raised mostly on large State-owned farms until the 1980s. After that, a State-owned dairy processing company was set up to start processing fresh milk into milk products, mainly sweetened condensed milk. Since Doi Moi (renovation), dairy farms were expanded to many other regions. Many milk processing companies, including foreign companies such as Dutch Lady and Nestlé, also appeared in the milk market at that time.
In 2000, there was a breakthrough in dairy development in Vietnam with the issuance of Resolution No. 09/2000/NQ-CP81 and Governmental Decision No. 167. The Resolution created a new policy to expand the herd of dairy cattle up to 100,000 head of dairy cows to produce 300,000 tons of fresh milk. The decision built a strategy for dairy cattle production and development for the 2002–201082 period. This decision stimulated and promoted dairy herd development in Vietnam. However, at first, this decision led to massive development in almost all provinces and resulted in inefficient milk production due to the low level of technology, lack of experience, and unfavorable conditions. Nowadays, dairy herds are concentrated in provinces of the north and south where there are favorable natural conditions.
2.2.3 Herd holding pattern
Dairy farmers in Vietnam are considered to be small holders as even large farms throughout the country have only a relatively small herd size. Around 76% of small dairy farms have only 1 to 5 head of dairy cattle and their holdings accounted for 37% of entire dairy herd throughout the country (Nancy et al., 2006). The northern provinces had a higher proportion of small-scale farms (88%) in comparison to the south (69%). Farms that had from 6 to 20 head of dairy cows accounted for the next 22%, making up 39% of total herd number. Larger farms that had more than 20 head of cows accounted for only 2%, nevertheless holding 24% of total number of dairy cows. Some of these farms have a large number of cows, such as in Moc Chau, Tuyen Quang, Thanh Hoa, and the outskirts of Ho Chi Minh City.83
In 2008, Tuyen (2008) reported that the average size of dairy farms in Vietnam was 5.3 head overall. The mean scale of the south was 6.3 head, higher than that of the north (3.7 head). This number suggested that it could be more difficult to expand the scale of dairy cow husbandry in the north than in the south.
81
Promulgated on June 15, 2000 82
This strategy defined the targeted areas for raising dairy cattle, including 10 provinces in the north, 5 provinces in the central coastal
region, 4 provinces in the Central Highlands and 7 provinces in the south. See annex 1 83
In Tuyen Quang, one of the 7 units of Yen Son district under provincial management, with 1,797 head; followed by LASUCO farm in
Thanh Hoa with 1,100 head and the HCMC Dairy Company farm with 1,072 head
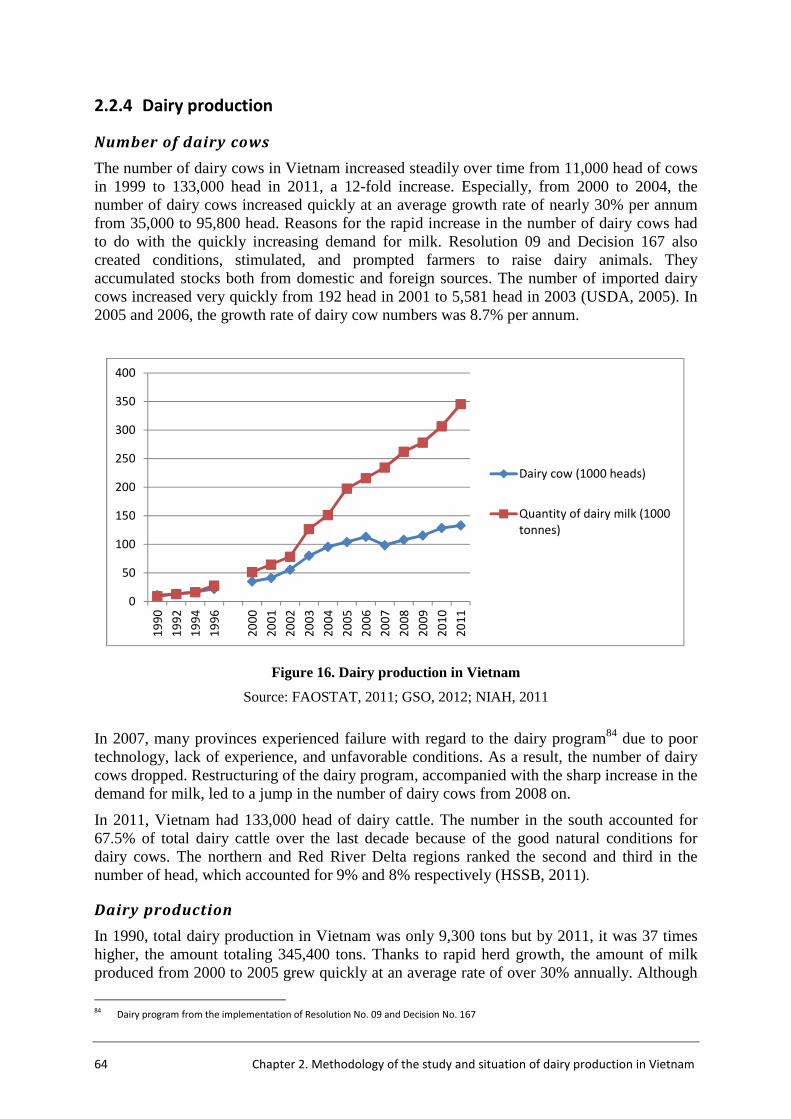
64 Chapter 2. Methodology of the study and situation of dairy production in Vietnam
2.2.4 Dairy production
Number of dairy cows
The number of dairy cows in Vietnam increased steadily over time from 11,000 head of cows in 1999 to 133,000 head in 2011, a 12-fold increase. Especially, from 2000 to 2004, the number of dairy cows increased quickly at an average growth rate of nearly 30% per annum from 35,000 to 95,800 head. Reasons for the rapid increase in the number of dairy cows had to do with the quickly increasing demand for milk. Resolution 09 and Decision 167 also created conditions, stimulated, and prompted farmers to raise dairy animals. They accumulated stocks both from domestic and foreign sources. The number of imported dairy cows increased very quickly from 192 head in 2001 to 5,581 head in 2003 (USDA, 2005). In 2005 and 2006, the growth rate of dairy cow numbers was 8.7% per annum.
Figure 16. Dairy production in Vietnam
Source: FAOSTAT, 2011; GSO, 2012; NIAH, 2011
In 2007, many provinces experienced failure with regard to the dairy program84 due to poor technology, lack of experience, and unfavorable conditions. As a result, the number of dairy cows dropped. Restructuring of the dairy program, accompanied with the sharp increase in the demand for milk, led to a jump in the number of dairy cows from 2008 on.
In 2011, Vietnam had 133,000 head of dairy cattle. The number in the south accounted for 67.5% of total dairy cattle over the last decade because of the good natural conditions for dairy cows. The northern and Red River Delta regions ranked the second and third in the number of head, which accounted for 9% and 8% respectively (HSSB, 2011).
Dairy production
In 1990, total dairy production in Vietnam was only 9,300 tons but by 2011, it was 37 times higher, the amount totaling 345,400 tons. Thanks to rapid herd growth, the amount of milk produced from 2000 to 2005 grew quickly at an average rate of over 30% annually. Although
84
Dairy program from the implementation of Resolution No. 09 and Decision No. 167
0
50
100
150
200
250
300
350
400
19
90
19
92
19
94
19
96
20
00
20
01
20
02
20
03
20
04
20
05
20
06
20
07
20
08
20
09
20
10
20
11
Dairy cow (1000 heads)
Quantity of dairy milk (1000
tonnes)
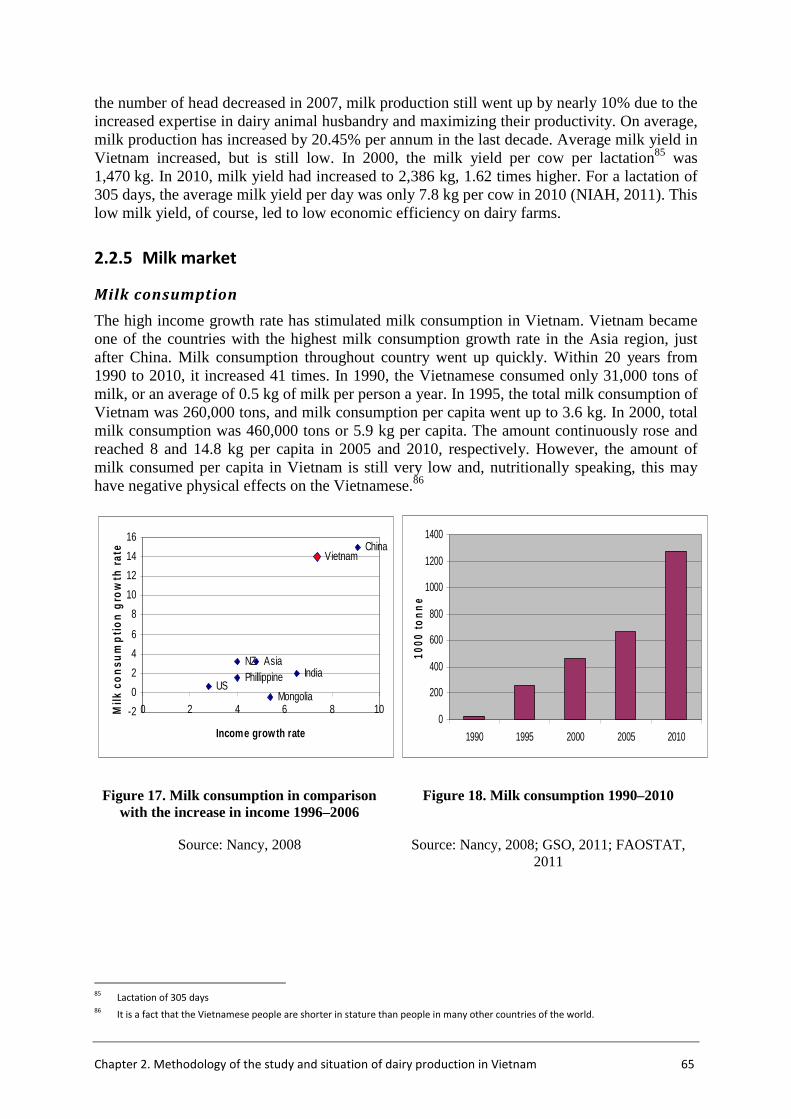
Chapter 2. Methodology of the study and situation of dairy production in Vietnam 65
the number of head decreased in 2007, milk production still went up by nearly 10% due to the increased expertise in dairy animal husbandry and maximizing their productivity. On average, milk production has increased by 20.45% per annum in the last decade. Average milk yield in Vietnam increased, but is still low. In 2000, the milk yield per cow per lactation85 was 1,470 kg. In 2010, milk yield had increased to 2,386 kg, 1.62 times higher. For a lactation of 305 days, the average milk yield per day was only 7.8 kg per cow in 2010 (NIAH, 2011). This low milk yield, of course, led to low economic efficiency on dairy farms.
2.2.5 Milk market
Milk consumption
The high income growth rate has stimulated milk consumption in Vietnam. Vietnam became one of the countries with the highest milk consumption growth rate in the Asia region, just after China. Milk consumption throughout country went up quickly. Within 20 years from 1990 to 2010, it increased 41 times. In 1990, the Vietnamese consumed only 31,000 tons of milk, or an average of 0.5 kg of milk per person a year. In 1995, the total milk consumption of Vietnam was 260,000 tons, and milk consumption per capita went up to 3.6 kg. In 2000, total milk consumption was 460,000 tons or 5.9 kg per capita. The amount continuously rose and reached 8 and 14.8 kg per capita in 2005 and 2010, respectively. However, the amount of milk consumed per capita in Vietnam is still very low and, nutritionally speaking, this may have negative physical effects on the Vietnamese.86
Figure 17. Milk consumption in comparison with the increase in income 1996–2006
Figure 18. Milk consumption 1990–2010
Source: Nancy, 2008 Source: Nancy, 2008; GSO, 2011; FAOSTAT, 2011
85
Lactation of 305 days 86
It is a fact that the Vietnamese people are shorter in stature than people in many other countries of the world.
VietnamChina
NZ AsiaPhillippine
USIndia
Mongolia-2
0
2
4
6
8
10
12
14
16
0 2 4 6 8 10
Income growth rate
Milk
co
nsu
mp
tio
n g
row
th r
ate
0
200
400
600
800
1000
1200
1400
1990 1995 2000 2005 2010
1000
to
nn
e
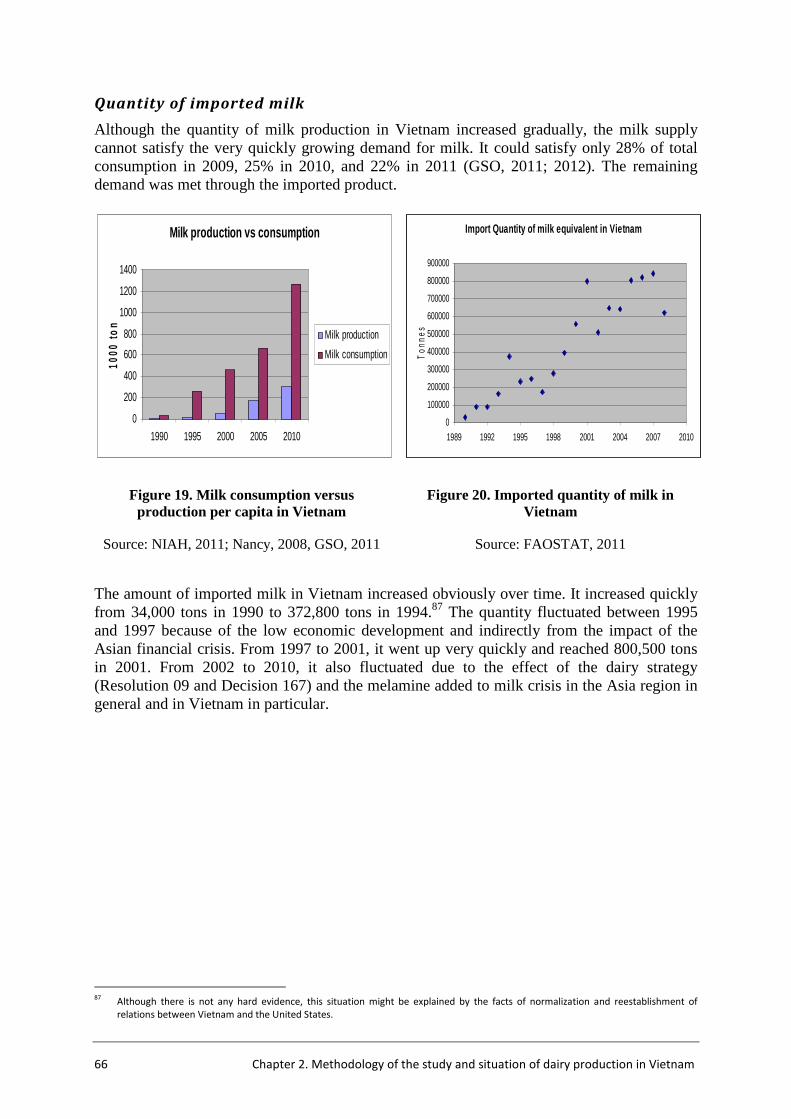
66 Chapter 2. Methodology of the study and situation of dairy production in Vietnam
Quantity of imported milk
Although the quantity of milk production in Vietnam increased gradually, the milk supply cannot satisfy the very quickly growing demand for milk. It could satisfy only 28% of total consumption in 2009, 25% in 2010, and 22% in 2011 (GSO, 2011; 2012). The remaining demand was met through the imported product.
Figure 19. Milk consumption versus production per capita in Vietnam
Figure 20. Imported quantity of milk in Vietnam
Source: NIAH, 2011; Nancy, 2008, GSO, 2011 Source: FAOSTAT, 2011
The amount of imported milk in Vietnam increased obviously over time. It increased quickly from 34,000 tons in 1990 to 372,800 tons in 1994.87 The quantity fluctuated between 1995 and 1997 because of the low economic development and indirectly from the impact of the Asian financial crisis. From 1997 to 2001, it went up very quickly and reached 800,500 tons in 2001. From 2002 to 2010, it also fluctuated due to the effect of the dairy strategy (Resolution 09 and Decision 167) and the melamine added to milk crisis in the Asia region in general and in Vietnam in particular.
87
Although there is not any hard evidence, this situation might be explained by the facts of normalization and reestablishment of
relations between Vietnam and the United States.
Milk production vs consumption
0
200
400
600
800
1000
1200
1400
1990 1995 2000 2005 2010
1000
to
n
Milk production
Milk consumption
Import Quantity of milk equivalent in Vietnam
0
100000
200000
300000
400000
500000
600000
700000
800000
900000
1989 1992 1995 1998 2001 2004 2007 2010
Ton
nes
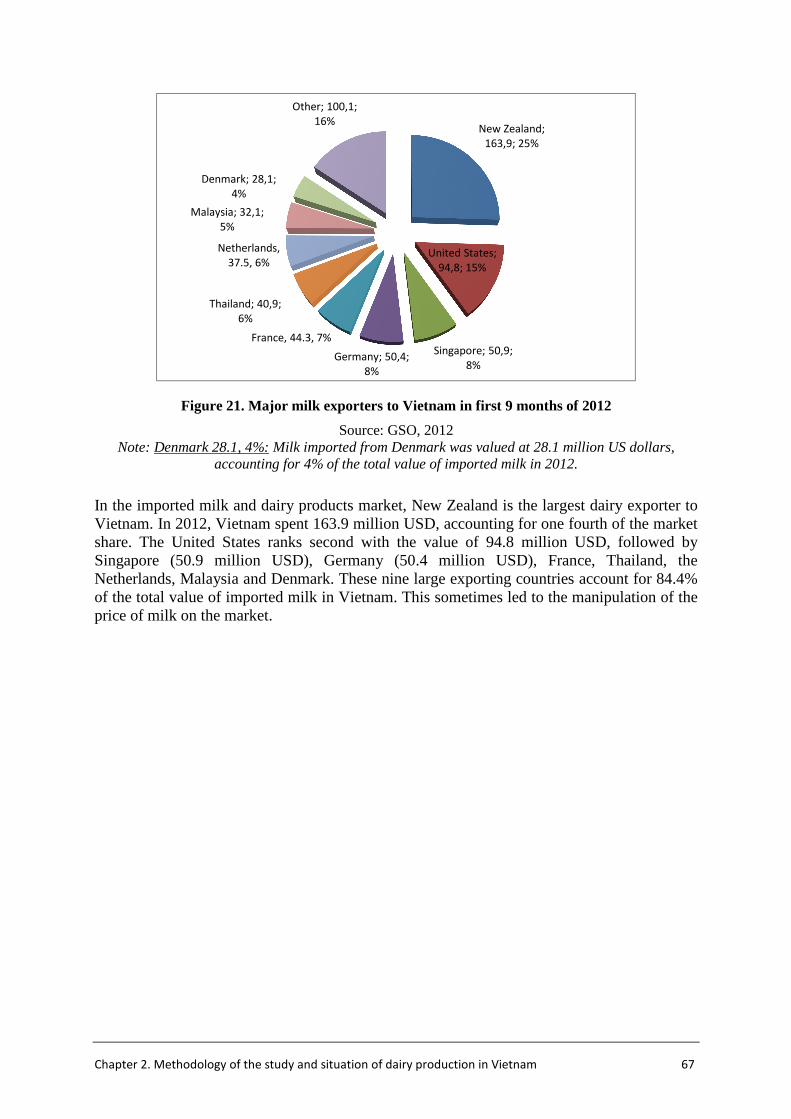
Chapter 2. Methodology of the study and situation of dairy production in Vietnam 67
Figure 21. Major milk exporters to Vietnam in first 9 months of 2012
Source: GSO, 2012 Note: Denmark 28.1, 4%: Milk imported from Denmark was valued at 28.1 million US dollars,
accounting for 4% of the total value of imported milk in 2012.
In the imported milk and dairy products market, New Zealand is the largest dairy exporter to Vietnam. In 2012, Vietnam spent 163.9 million USD, accounting for one fourth of the market share. The United States ranks second with the value of 94.8 million USD, followed by Singapore (50.9 million USD), Germany (50.4 million USD), France, Thailand, the Netherlands, Malaysia and Denmark. These nine large exporting countries account for 84.4% of the total value of imported milk in Vietnam. This sometimes led to the manipulation of the price of milk on the market.
New Zealand;
163,9; 25%
United States;
94,8; 15%
Singapore; 50,9;
8%Germany; 50,4;
8%
France, 44.3, 7%
Thailand; 40,9;
6%
Netherlands,
37.5, 6%
Malaysia; 32,1;
5%
Denmark; 28,1;
4%
Other; 100,1;
16%
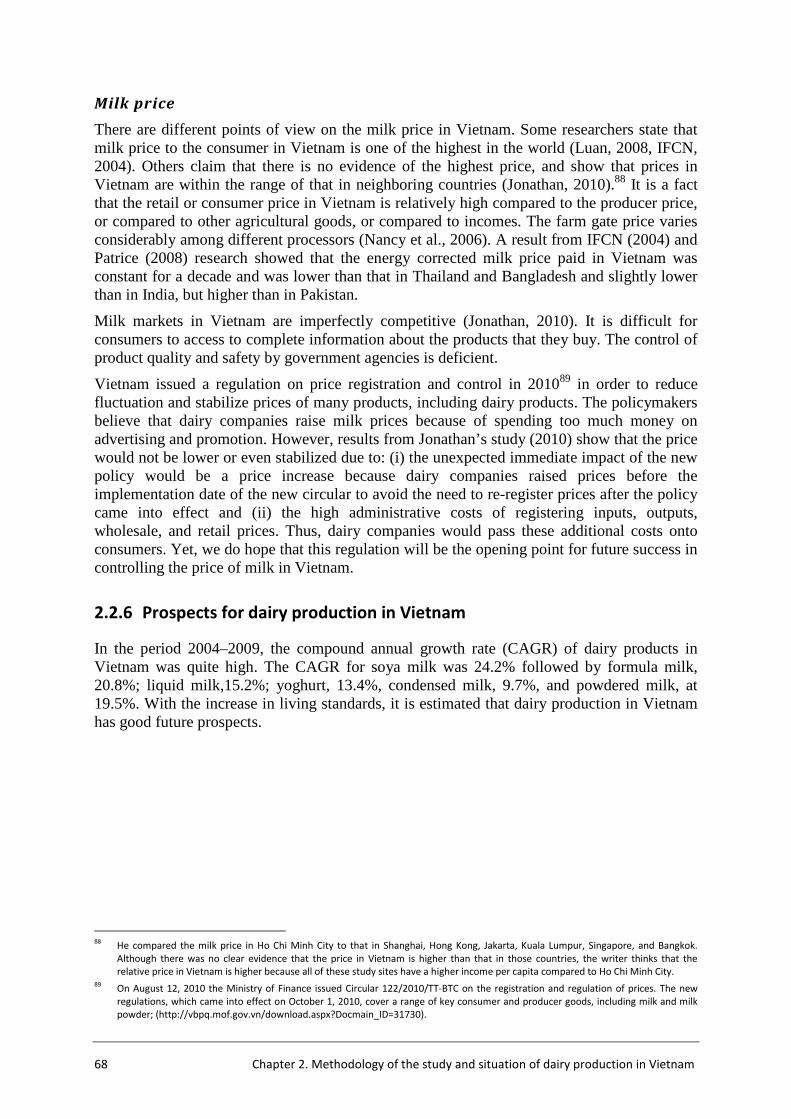
68 Chapter 2. Methodology of the study and situation of dairy production in Vietnam
Milk price
There are different points of view on the milk price in Vietnam. Some researchers state that milk price to the consumer in Vietnam is one of the highest in the world (Luan, 2008, IFCN, 2004). Others claim that there is no evidence of the highest price, and show that prices in Vietnam are within the range of that in neighboring countries (Jonathan, 2010).88 It is a fact that the retail or consumer price in Vietnam is relatively high compared to the producer price, or compared to other agricultural goods, or compared to incomes. The farm gate price varies considerably among different processors (Nancy et al., 2006). A result from IFCN (2004) and Patrice (2008) research showed that the energy corrected milk price paid in Vietnam was constant for a decade and was lower than that in Thailand and Bangladesh and slightly lower than in India, but higher than in Pakistan.
Milk markets in Vietnam are imperfectly competitive (Jonathan, 2010). It is difficult for consumers to access to complete information about the products that they buy. The control of product quality and safety by government agencies is deficient.
Vietnam issued a regulation on price registration and control in 201089 in order to reduce fluctuation and stabilize prices of many products, including dairy products. The policymakers believe that dairy companies raise milk prices because of spending too much money on advertising and promotion. However, results from Jonathan’s study (2010) show that the price would not be lower or even stabilized due to: (i) the unexpected immediate impact of the new policy would be a price increase because dairy companies raised prices before the implementation date of the new circular to avoid the need to re-register prices after the policy came into effect and (ii) the high administrative costs of registering inputs, outputs, wholesale, and retail prices. Thus, dairy companies would pass these additional costs onto consumers. Yet, we do hope that this regulation will be the opening point for future success in controlling the price of milk in Vietnam.
2.2.6 Prospects for dairy production in Vietnam
In the period 2004–2009, the compound annual growth rate (CAGR) of dairy products in Vietnam was quite high. The CAGR for soya milk was 24.2% followed by formula milk, 20.8%; liquid milk,15.2%; yoghurt, 13.4%, condensed milk, 9.7%, and powdered milk, at 19.5%. With the increase in living standards, it is estimated that dairy production in Vietnam has good future prospects.
88
He compared the milk price in Ho Chi Minh City to that in Shanghai, Hong Kong, Jakarta, Kuala Lumpur, Singapore, and Bangkok.
Although there was no clear evidence that the price in Vietnam is higher than that in those countries, the writer thinks that the
relative price in Vietnam is higher because all of these study sites have a higher income per capita compared to Ho Chi Minh City. 89
On August 12, 2010 the Ministry of Finance issued Circular 122/2010/TT-BTC on the registration and regulation of prices. The new
regulations, which came into effect on October 1, 2010, cover a range of key consumer and producer goods, including milk and milk
powder; (http://vbpq.mof.gov.vn/download.aspx?Docmain_ID=31730).
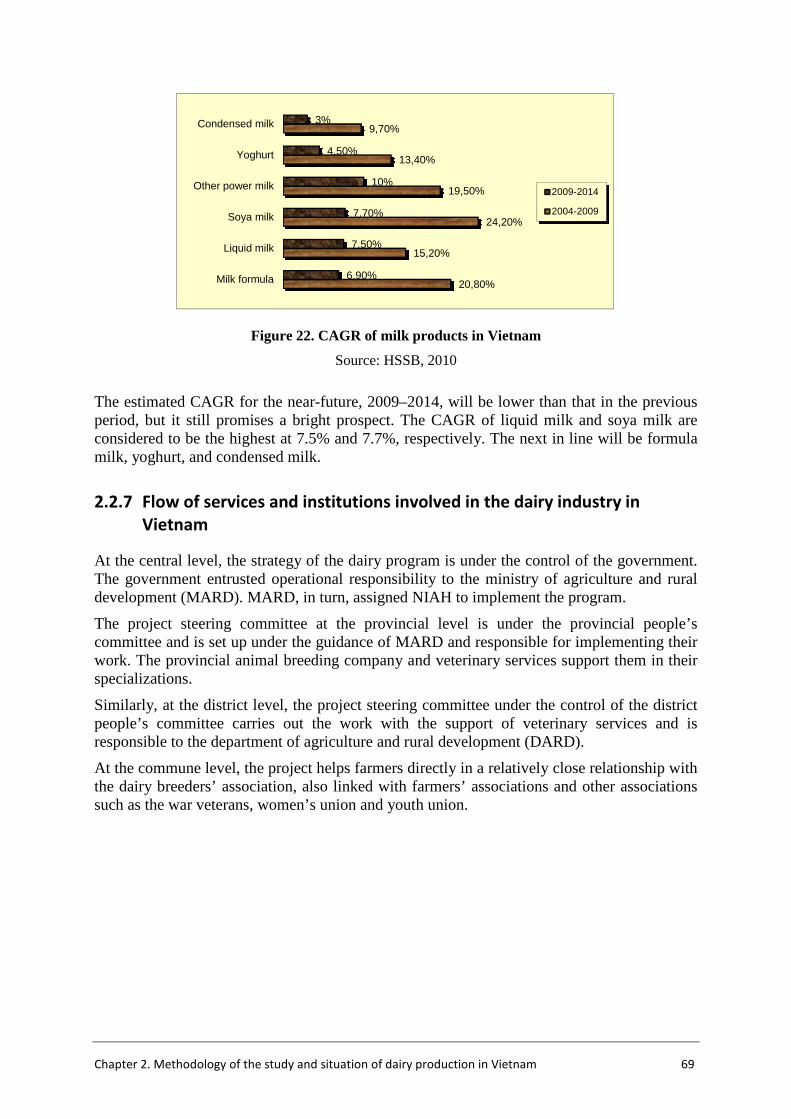
Chapter 2. Methodology of the study and situation of dairy production in Vietnam 69
Figure 22. CAGR of milk products in Vietnam
Source: HSSB, 2010
The estimated CAGR for the near-future, 2009–2014, will be lower than that in the previous period, but it still promises a bright prospect. The CAGR of liquid milk and soya milk are considered to be the highest at 7.5% and 7.7%, respectively. The next in line will be formula milk, yoghurt, and condensed milk.
2.2.7 Flow of services and institutions involved in the dairy industry in
Vietnam
At the central level, the strategy of the dairy program is under the control of the government. The government entrusted operational responsibility to the ministry of agriculture and rural development (MARD). MARD, in turn, assigned NIAH to implement the program.
The project steering committee at the provincial level is under the provincial people’s committee and is set up under the guidance of MARD and responsible for implementing their work. The provincial animal breeding company and veterinary services support them in their specializations.
Similarly, at the district level, the project steering committee under the control of the district people’s committee carries out the work with the support of veterinary services and is responsible to the department of agriculture and rural development (DARD).
At the commune level, the project helps farmers directly in a relatively close relationship with the dairy breeders’ association, also linked with farmers’ associations and other associations such as the war veterans, women’s union and youth union.
20,80%
15,20%
24,20%
19,50%
13,40%
9,70%
6,90%
7,50%
7,70%
10%
4,50%
3%
Milk formula
Liquid milk
Soya milk
Other power milk
Yoghurt
Condensed milk
2009-2014
2004-2009
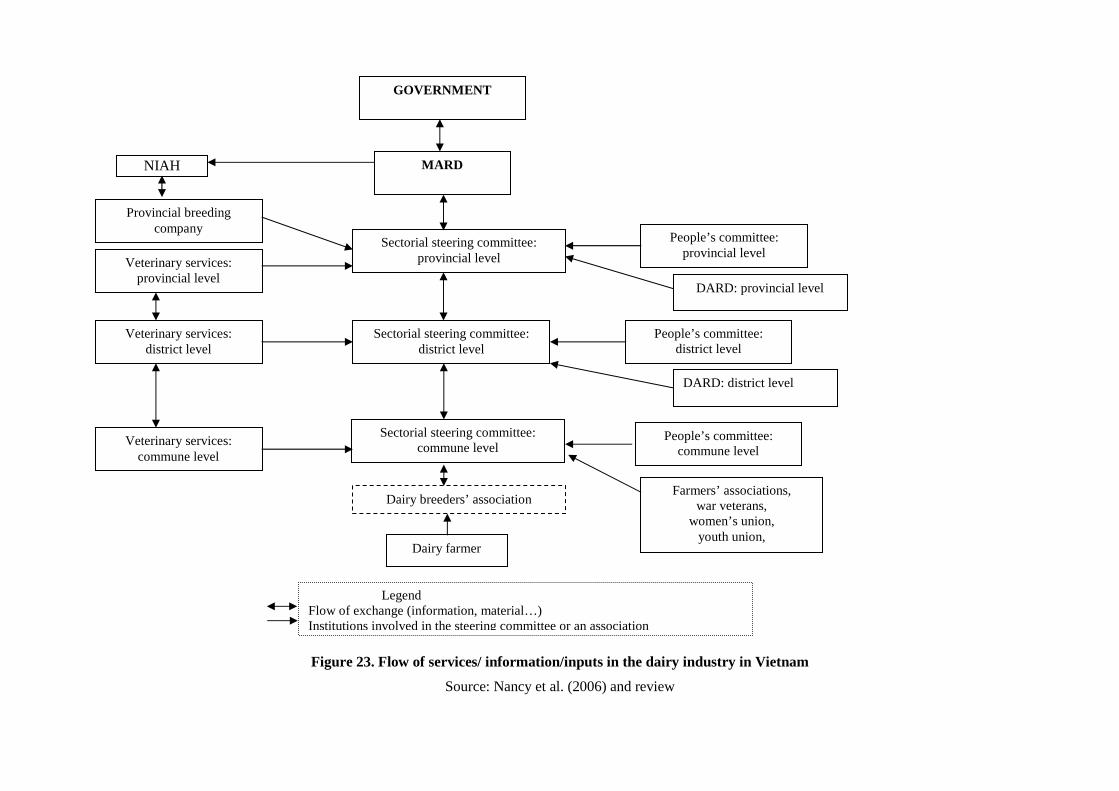
Figure 23. Flow of services/ information/inputs in the dairy industry in Vietnam
Source: Nancy et al. (2006) and review
NIAH
Provincial breeding company
Veterinary services: provincial level
Veterinary services: district level
Veterinary services: commune level
Dairy farmer
Dairy breeders’ association
Sectorial steering committee: commune level
Sectorial steering committee: district level
Sectorial steering committee: provincial level
Farmers’ associations, war veterans,
women’s union, youth union,
People’s committee: commune level
DARD: district level
People’s committee: district level
DARD: provincial level
People’s committee: provincial level
Legend Flow of exchange (information, material…) Institutions involved in the steering committee or an association
MARD
GOVERNMENT
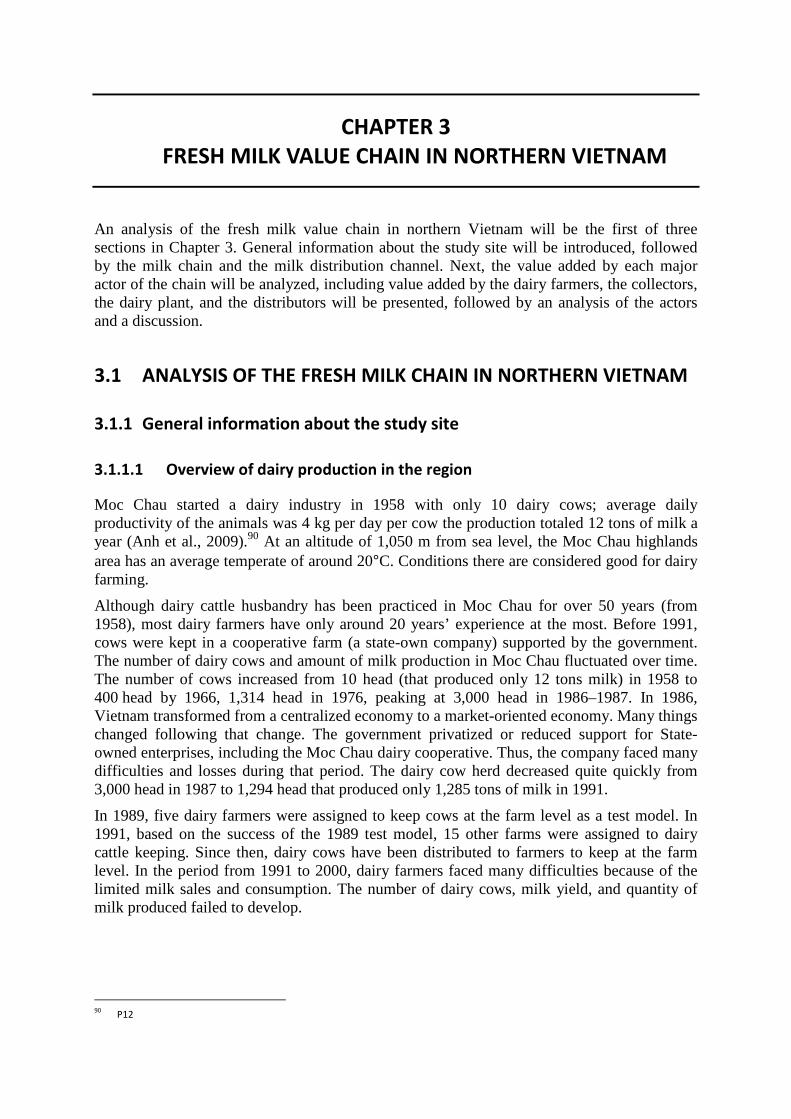
CHAPTER 3
FRESH MILK VALUE CHAIN IN NORTHERN VIETNAM
An analysis of the fresh milk value chain in northern Vietnam will be the first of three sections in Chapter 3. General information about the study site will be introduced, followed by the milk chain and the milk distribution channel. Next, the value added by each major actor of the chain will be analyzed, including value added by the dairy farmers, the collectors, the dairy plant, and the distributors will be presented, followed by an analysis of the actors and a discussion.
3.1 ANALYSIS OF THE FRESH MILK CHAIN IN NORTHERN VIETNAM
3.1.1 General information about the study site
3.1.1.1 Overview of dairy production in the region
Moc Chau started a dairy industry in 1958 with only 10 dairy cows; average daily productivity of the animals was 4 kg per day per cow the production totaled 12 tons of milk a year (Anh et al., 2009).90 At an altitude of 1,050 m from sea level, the Moc Chau highlands area has an average temperate of around 20°C. Conditions there are considered good for dairy farming.
Although dairy cattle husbandry has been practiced in Moc Chau for over 50 years (from 1958), most dairy farmers have only around 20 years’ experience at the most. Before 1991, cows were kept in a cooperative farm (a state-own company) supported by the government. The number of dairy cows and amount of milk production in Moc Chau fluctuated over time. The number of cows increased from 10 head (that produced only 12 tons milk) in 1958 to 400 head by 1966, 1,314 head in 1976, peaking at 3,000 head in 1986–1987. In 1986, Vietnam transformed from a centralized economy to a market-oriented economy. Many things changed following that change. The government privatized or reduced support for State-owned enterprises, including the Moc Chau dairy cooperative. Thus, the company faced many difficulties and losses during that period. The dairy cow herd decreased quite quickly from 3,000 head in 1987 to 1,294 head that produced only 1,285 tons of milk in 1991.
In 1989, five dairy farmers were assigned to keep cows at the farm level as a test model. In 1991, based on the success of the 1989 test model, 15 other farms were assigned to dairy cattle keeping. Since then, dairy cows have been distributed to farmers to keep at the farm level. In the period from 1991 to 2000, dairy farmers faced many difficulties because of the limited milk sales and consumption. The number of dairy cows, milk yield, and quantity of milk produced failed to develop.
90
P12
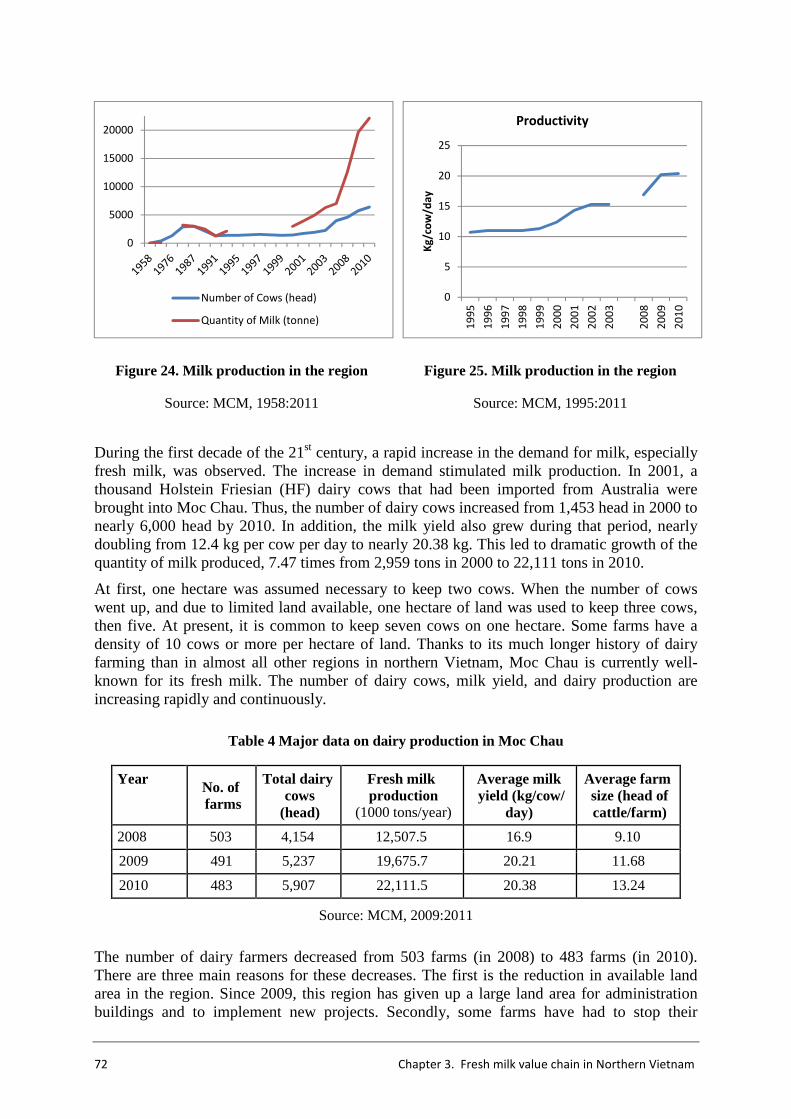
72 Chapter 3. Fresh milk value chain in Northern Vietnam
Figure 24. Milk production in the region Figure 25. Milk production in the region
Source: MCM, 1958:2011 Source: MCM, 1995:2011
During the first decade of the 21st century, a rapid increase in the demand for milk, especially fresh milk, was observed. The increase in demand stimulated milk production. In 2001, a thousand Holstein Friesian (HF) dairy cows that had been imported from Australia were brought into Moc Chau. Thus, the number of dairy cows increased from 1,453 head in 2000 to nearly 6,000 head by 2010. In addition, the milk yield also grew during that period, nearly doubling from 12.4 kg per cow per day to nearly 20.38 kg. This led to dramatic growth of the quantity of milk produced, 7.47 times from 2,959 tons in 2000 to 22,111 tons in 2010.
At first, one hectare was assumed necessary to keep two cows. When the number of cows went up, and due to limited land available, one hectare of land was used to keep three cows, then five. At present, it is common to keep seven cows on one hectare. Some farms have a density of 10 cows or more per hectare of land. Thanks to its much longer history of dairy farming than in almost all other regions in northern Vietnam, Moc Chau is currently well-known for its fresh milk. The number of dairy cows, milk yield, and dairy production are increasing rapidly and continuously.
Table 4 Major data on dairy production in Moc Chau
Year No. of farms
Total dairy cows
(head)
Fresh milk production
(1000 tons/year)
Average milk yield (kg/cow/
day)
Average farm size (head of cattle/farm)
2008 503 4,154 12,507.5 16.9 9.10
2009 491 5,237 19,675.7 20.21 11.68
2010 483 5,907 22,111.5 20.38 13.24
Source: MCM, 2009:2011
The number of dairy farmers decreased from 503 farms (in 2008) to 483 farms (in 2010). There are three main reasons for these decreases. The first is the reduction in available land area in the region. Since 2009, this region has given up a large land area for administration buildings and to implement new projects. Secondly, some farms have had to stop their
0
5000
10000
15000
20000
Number of Cows (head)
Quantity of Milk (tonne)
0
5
10
15
20
25
19
95
19
96
19
97
19
98
19
99
20
00
20
01
20
02
20
03
20
08
20
09
20
10
Kg
/co
w/d
ay
Productivity
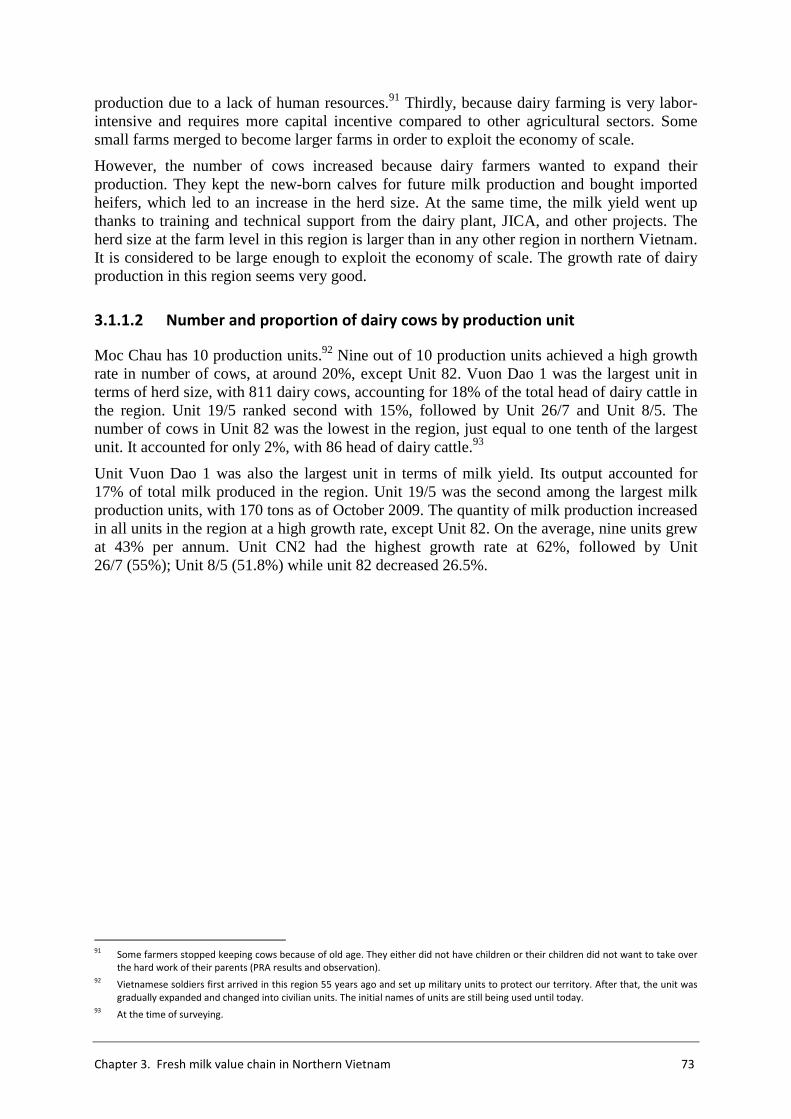
Chapter 3. Fresh milk value chain in Northern Vietnam 73
production due to a lack of human resources.91 Thirdly, because dairy farming is very labor-intensive and requires more capital incentive compared to other agricultural sectors. Some small farms merged to become larger farms in order to exploit the economy of scale.
However, the number of cows increased because dairy farmers wanted to expand their production. They kept the new-born calves for future milk production and bought imported heifers, which led to an increase in the herd size. At the same time, the milk yield went up thanks to training and technical support from the dairy plant, JICA, and other projects. The herd size at the farm level in this region is larger than in any other region in northern Vietnam. It is considered to be large enough to exploit the economy of scale. The growth rate of dairy production in this region seems very good.
3.1.1.2 Number and proportion of dairy cows by production unit
Moc Chau has 10 production units.92 Nine out of 10 production units achieved a high growth rate in number of cows, at around 20%, except Unit 82. Vuon Dao 1 was the largest unit in terms of herd size, with 811 dairy cows, accounting for 18% of the total head of dairy cattle in the region. Unit 19/5 ranked second with 15%, followed by Unit 26/7 and Unit 8/5. The number of cows in Unit 82 was the lowest in the region, just equal to one tenth of the largest unit. It accounted for only 2%, with 86 head of dairy cattle.93
Unit Vuon Dao 1 was also the largest unit in terms of milk yield. Its output accounted for 17% of total milk produced in the region. Unit 19/5 was the second among the largest milk production units, with 170 tons as of October 2009. The quantity of milk production increased in all units in the region at a high growth rate, except Unit 82. On the average, nine units grew at 43% per annum. Unit CN2 had the highest growth rate at 62%, followed by Unit 26/7 (55%); Unit 8/5 (51.8%) while unit 82 decreased 26.5%.
91
Some farmers stopped keeping cows because of old age. They either did not have children or their children did not want to take over
the hard work of their parents (PRA results and observation). 92
Vietnamese soldiers first arrived in this region 55 years ago and set up military units to protect our territory. After that, the unit was
gradually expanded and changed into civilian units. The initial names of units are still being used until today. 93
At the time of surveying.
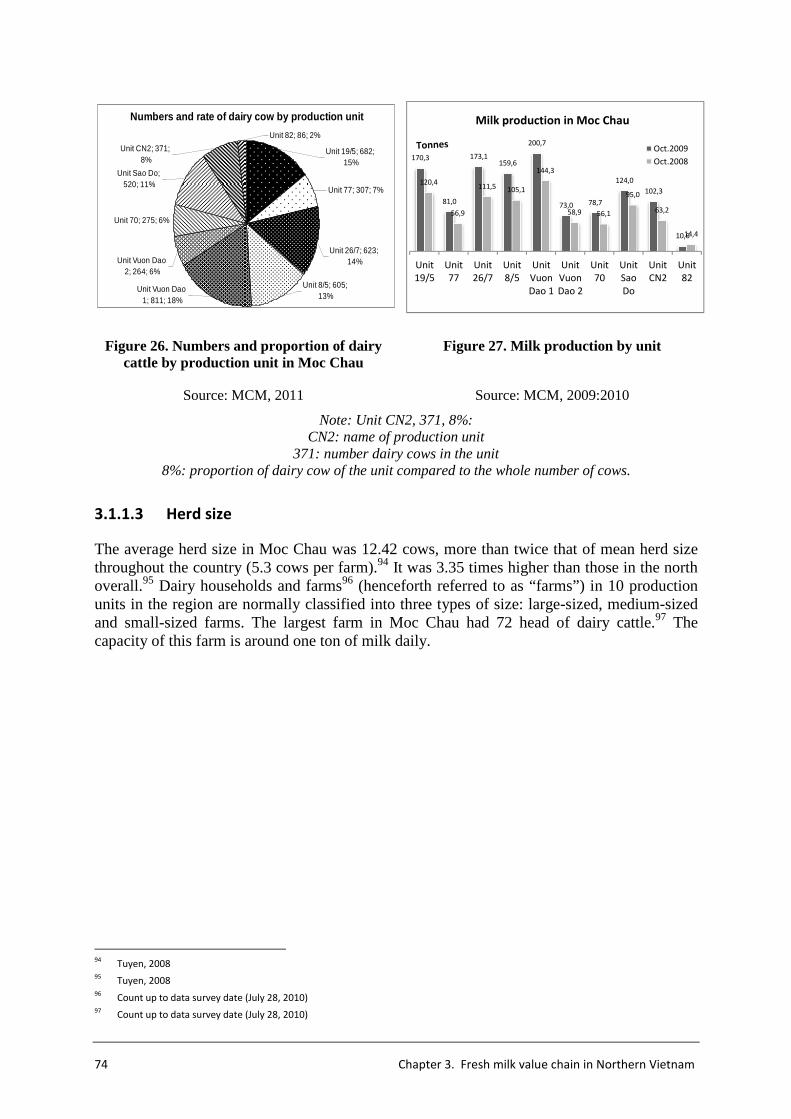
74 Chapter 3. Fresh milk value chain in Northern Vietnam
Figure 26. Numbers and proportion of dairy cattle by production unit in Moc Chau
Figure 27. Milk production by unit
Source: MCM, 2011 Source: MCM, 2009:2010
Note: Unit CN2, 371, 8%: CN2: name of production unit
371: number dairy cows in the unit 8%: proportion of dairy cow of the unit compared to the whole number of cows.
3.1.1.3 Herd size
The average herd size in Moc Chau was 12.42 cows, more than twice that of mean herd size throughout the country (5.3 cows per farm).94 It was 3.35 times higher than those in the north overall.95 Dairy households and farms96 (henceforth referred to as “farms”) in 10 production units in the region are normally classified into three types of size: large-sized, medium-sized and small-sized farms. The largest farm in Moc Chau had 72 head of dairy cattle.97 The capacity of this farm is around one ton of milk daily.
94
Tuyen, 2008 95
Tuyen, 2008 96
Count up to data survey date (July 28, 2010) 97
Count up to data survey date (July 28, 2010)
Numbers and rate of dairy cow by production unit
Unit 70; 275; 6%
Unit 8/5; 605; 13%
Unit 26/7; 623; 14%
Unit 77; 307; 7%
Unit 19/5; 682; 15%
Unit 82; 86; 2%
Unit Sao Do; 520; 11%
Unit CN2; 371; 8%
Unit Vuon Dao 2; 264; 6%
Unit Vuon Dao 1; 811; 18%
170,3
81,0
173,1159,6
200,7
73,0 78,7
124,0
102,3
10,6
120,4
56,9
111,5 105,1
144,3
58,9 56,1
95,0
63,2
14,4
Unit
19/5
Unit
77
Unit
26/7
Unit
8/5
Unit
Vuon
Dao 1
Unit
Vuon
Dao 2
Unit
70
Unit
Sao
Do
Unit
CN2
Unit
82
Milk production in Moc Chau
Oct.2009
Oct.2008
Chapter 3. Fresh milk value chain in Northern Vietnam 75
Figure 28. Proportions of the herd by age
Source: MCM, 2009–2011; Thien, 2010;
Most dairy cows in Moc Chau are Holstein Friesian (HF) but came from many sources: imported from Australia, Cuba, the United States, etc. Some others are Jersey or crossbreeds (F1, F2, and F3). Nowadays, pure HF cows occupy the largest share making up more than 95% of total head of dairy cattle in the region. By age, milking cows account for the highest proportion, at 52%. Heifers over 12 months occupy 16%, and the rest, 32%, are younger heifers.
< 6 months14% 6-12 months
18%
Heifer >12 months
16%
Dairy cow52%
Proportion of herd size by age
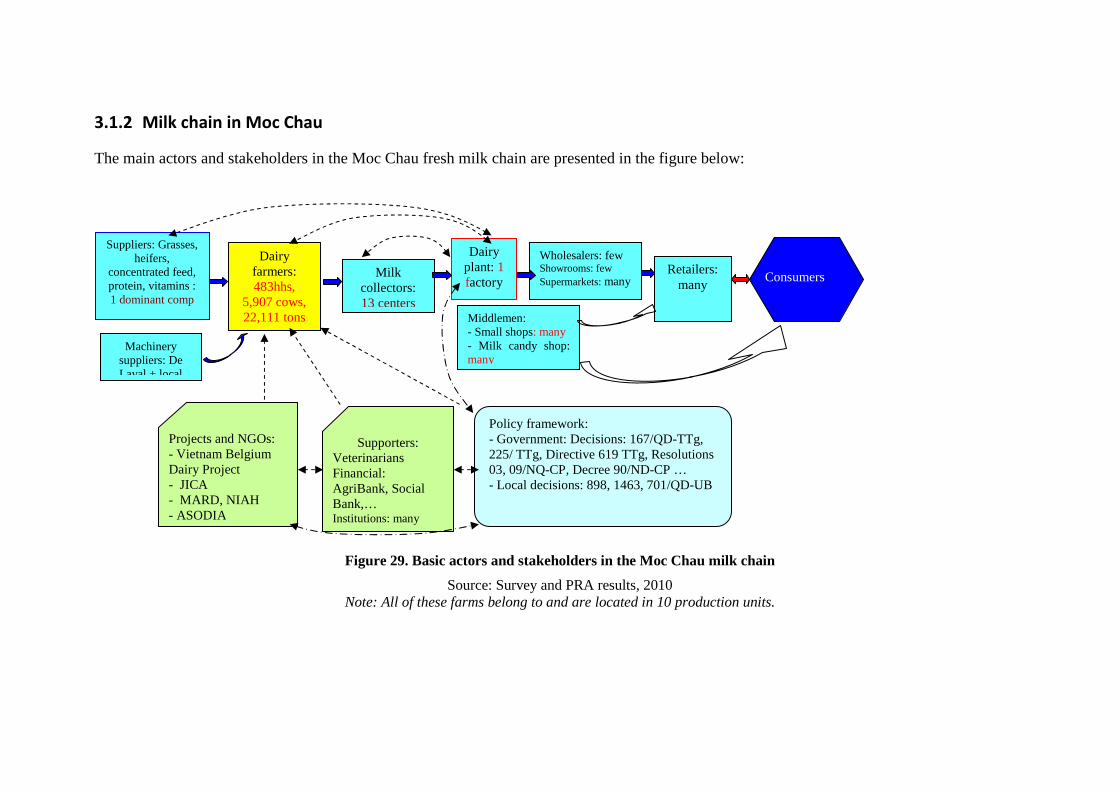
3.1.2 Milk chain in Moc Chau
The main actors and stakeholders in the Moc Chau fresh milk chain are presented in the figure below:
Figure 29. Basic actors and stakeholders in the Moc Chau milk chain
Source: Survey and PRA results, 2010 Note: All of these farms belong to and are located in 10 production units.
Suppliers: Grasses, heifers,
concentrated feed, protein, vitamins : 1 dominant comp
Dairy farmers: 483hhs,
5,907 cows, 22,111 tons
Milk collectors: 13 centers
Wholesalers: few Showrooms: few Supermarkets: many
Dairy plant: 1 factory
Projects and NGOs: - Vietnam Belgium Dairy Project - JICA - MARD, NIAH - ASODIA
Policy framework: - Government: Decisions: 167/QD-TTg, 225/ TTg, Directive 619 TTg, Resolutions 03, 09/NQ-CP, Decree 90/ND-CP … - Local decisions: 898, 1463, 701/QD-UB
Supporters: Veterinarians Financial: AgriBank, Social Bank,… Institutions: many
Consumers
Middlemen: - Small shops: many - Milk candy shop: many
Retailers:many
Machinery suppliers: De Laval + local
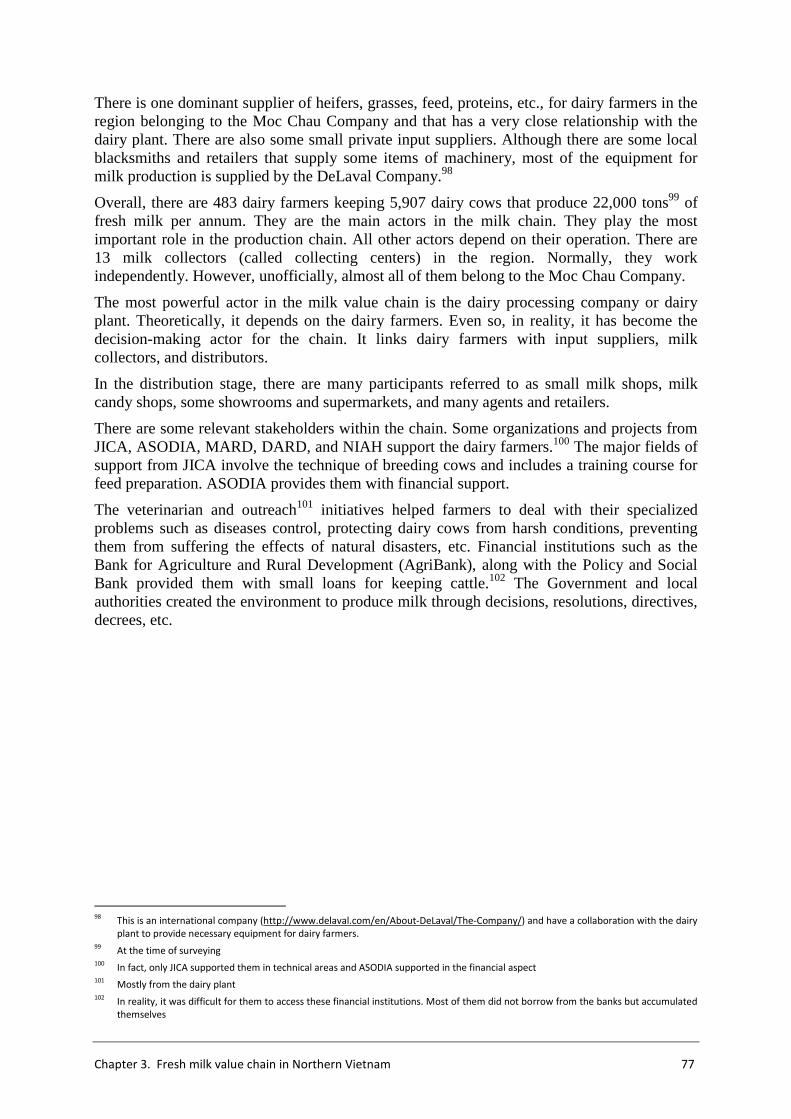
Chapter 3. Fresh milk value chain in Northern Vietnam 77
There is one dominant supplier of heifers, grasses, feed, proteins, etc., for dairy farmers in the region belonging to the Moc Chau Company and that has a very close relationship with the dairy plant. There are also some small private input suppliers. Although there are some local blacksmiths and retailers that supply some items of machinery, most of the equipment for milk production is supplied by the DeLaval Company.98
Overall, there are 483 dairy farmers keeping 5,907 dairy cows that produce 22,000 tons99 of fresh milk per annum. They are the main actors in the milk chain. They play the most important role in the production chain. All other actors depend on their operation. There are 13 milk collectors (called collecting centers) in the region. Normally, they work independently. However, unofficially, almost all of them belong to the Moc Chau Company.
The most powerful actor in the milk value chain is the dairy processing company or dairy plant. Theoretically, it depends on the dairy farmers. Even so, in reality, it has become the decision-making actor for the chain. It links dairy farmers with input suppliers, milk collectors, and distributors.
In the distribution stage, there are many participants referred to as small milk shops, milk candy shops, some showrooms and supermarkets, and many agents and retailers.
There are some relevant stakeholders within the chain. Some organizations and projects from JICA, ASODIA, MARD, DARD, and NIAH support the dairy farmers.100 The major fields of support from JICA involve the technique of breeding cows and includes a training course for feed preparation. ASODIA provides them with financial support.
The veterinarian and outreach101 initiatives helped farmers to deal with their specialized problems such as diseases control, protecting dairy cows from harsh conditions, preventing them from suffering the effects of natural disasters, etc. Financial institutions such as the Bank for Agriculture and Rural Development (AgriBank), along with the Policy and Social Bank provided them with small loans for keeping cattle.102 The Government and local authorities created the environment to produce milk through decisions, resolutions, directives, decrees, etc.
98
This is an international company (http://www.delaval.com/en/About-DeLaval/The-Company/) and have a collaboration with the dairy
plant to provide necessary equipment for dairy farmers. 99
At the time of surveying 100
In fact, only JICA supported them in technical areas and ASODIA supported in the financial aspect 101
Mostly from the dairy plant 102
In reality, it was difficult for them to access these financial institutions. Most of them did not borrow from the banks but accumulated
themselves
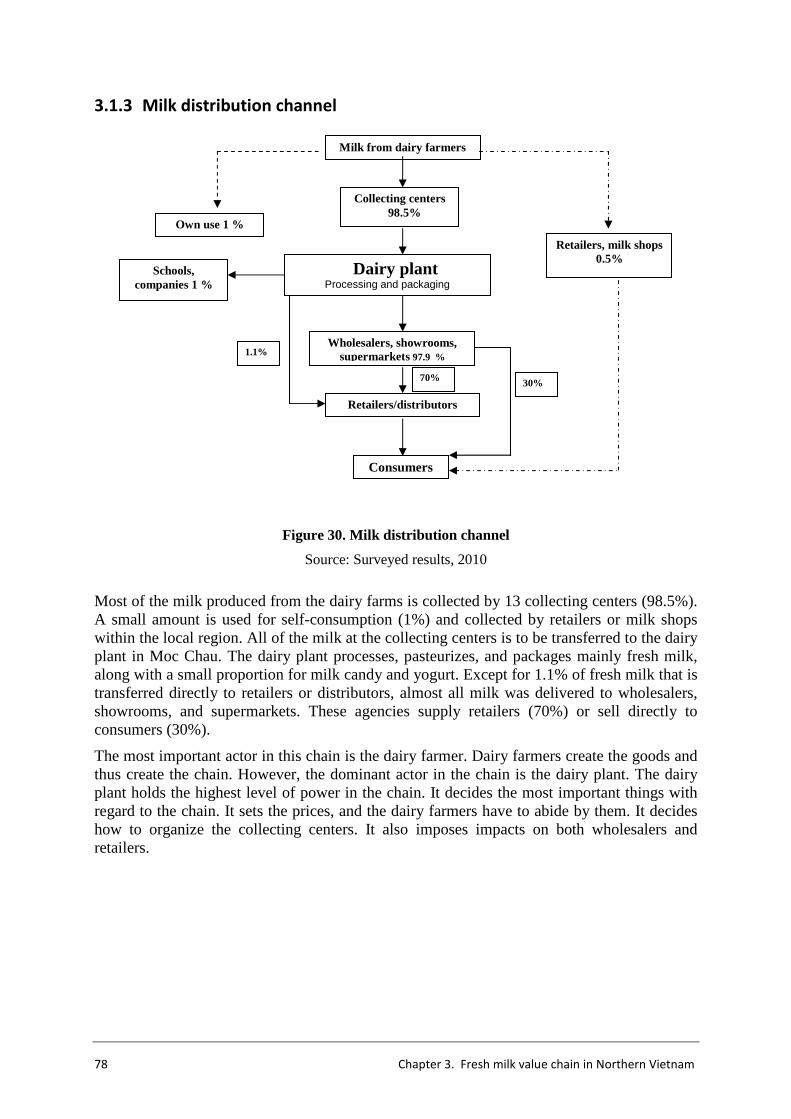
78 Chapter 3. Fresh milk value chain in Northern Vietnam
3.1.3 Milk distribution channel
Figure 30. Milk distribution channel
Source: Surveyed results, 2010
Most of the milk produced from the dairy farms is collected by 13 collecting centers (98.5%). A small amount is used for self-consumption (1%) and collected by retailers or milk shops within the local region. All of the milk at the collecting centers is to be transferred to the dairy plant in Moc Chau. The dairy plant processes, pasteurizes, and packages mainly fresh milk, along with a small proportion for milk candy and yogurt. Except for 1.1% of fresh milk that is transferred directly to retailers or distributors, almost all milk was delivered to wholesalers, showrooms, and supermarkets. These agencies supply retailers (70%) or sell directly to consumers (30%).
The most important actor in this chain is the dairy farmer. Dairy farmers create the goods and thus create the chain. However, the dominant actor in the chain is the dairy plant. The dairy plant holds the highest level of power in the chain. It decides the most important things with regard to the chain. It sets the prices, and the dairy farmers have to abide by them. It decides how to organize the collecting centers. It also imposes impacts on both wholesalers and retailers.
Milk from dairy farmers
Consumers
Retailers/distributors
Dairy plant Processing and packaging
Collecting centers 98.5%
Retailers, milk shops 0.5%
Own use 1 %
Wholesalers, showrooms, supermarkets 97.9 % 1.1%
Schools, companies 1 %
30% 70%
Chapter 3. Fresh milk value chain in Northern Vietnam 79
3.1.4 Value added by dairy farmers
3.1.4.1 Basic technical and economic data of the surveyed farms
The total of investigated farms103 was 50, on which 651 head of dairy cattle are being kept. This number accounts for 11% of total farms and 10.2 % of the number of dairy cattle in the region. The average farm size is 13 cows per farm. The farms were classified into three sizes based on the number of cows.
Table 5. Surveyed farm size
Unit: head
Total (50) Large-sized farms (14) Medium-sized farms (21) Small-sized farms (15)
Heifers
Milking cows
Heifers Milking cows
Heifers Milking cows
Heifers Milking cows
Average head/farm(a) 6.37(±0.4) 6.6(±0.6) 9.7(±0.67) 11.6(±1.37) 6.3(±0.18) 5.7(±0.3) 3.4(±0.35) 3.3(±0.26)
% of herd 48.95 51.05 46 54 52 48 50.7 49.34
Average farm size(b)
13.02 (±0.9) 21.29(±1.3) 12(±0.3) 6.73(±0.5)
Max. 35 35 15 9
Min. 2 16 10 2
Source: Survey results, 2010 (a) Number in brackets is Standard Error, confident level at 95%, F test=29.81, p=5.01E(-18). (b) Number in brackets is Standard Error, confident level at 95%, F test=82.45, p=4.26E(-16).
Large-sized farms included 14 farms, accounting for 28%. The average number of dairy cows in this group was 21.29 head. Medium-sized consists of 21 farms, or 42% of total surveyed farms. The average head of dairy cattle in this group was 12. There were 15 small-sized farms, occupying 30% of total farms. On the average, each farm in this group has 6.73 head of dairy cattle.
On the average, milking cows accounted for 51.05%; the remaining numbers were heifers. This high ratio of heifers seemed not good for the profitability of dairy farms because of the required time and cost of raising them (purchase expense, feeding cost, veterinary cost, etc.) without any revenue until they become milking cows. This situation can be explained by the fact that the rapid increase in the demand for milk in the previous period (after the melamine added to milk issues in Asia and in Vietnam in 2008) encouraged dairy farmers to expand their production. They not only kept all of their newborn heifers but also bought imported heifers (through the dairy plant) to enlarge their herd. All dairy farmers tried to increase their number of cows. Therefore, the proportion of heifers in this region in particular and in Vietnam in general was quite high in comparison to the normal ratio of the world.
The proportion of milking cows was higher in the large-sized group. Nevertheless, in the medium- and small-sized groups, the proportion of heifers was higher. This situation occurred because the small- and medium-sized groups were trying to expand their herd size as much as
103
This investigated farms sited within 10 production units in the region
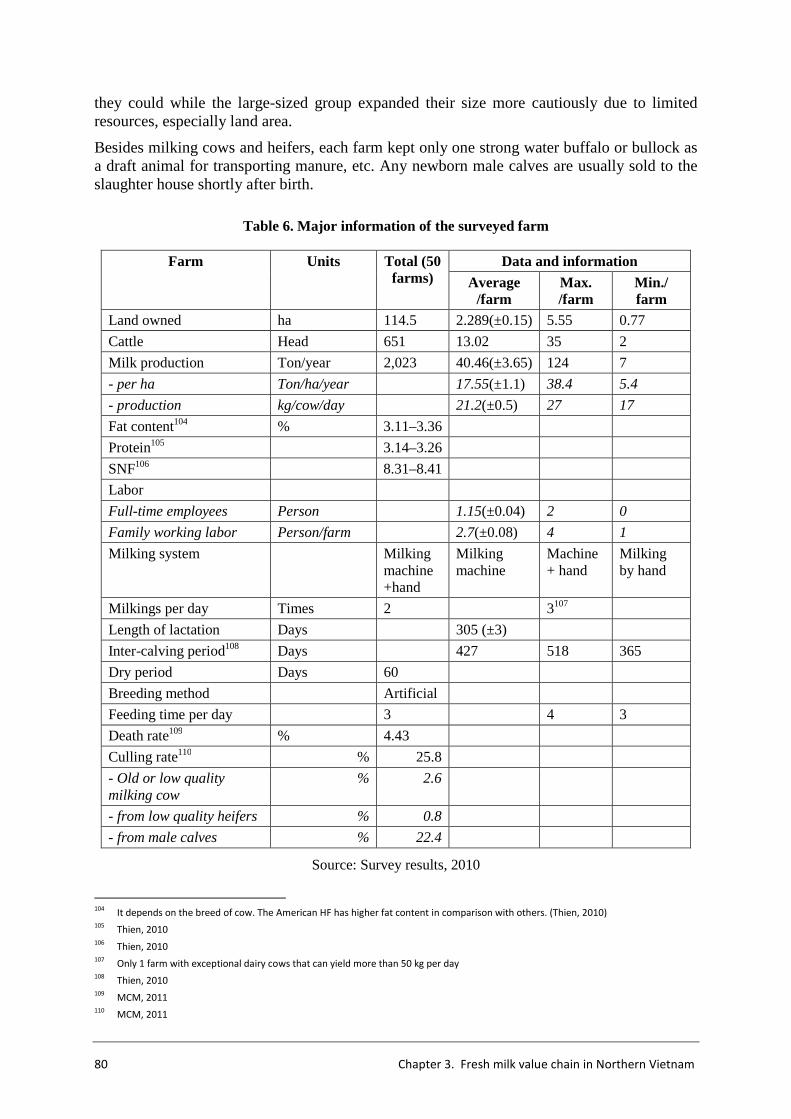
80 Chapter 3. Fresh milk value chain in Northern Vietnam
they could while the large-sized group expanded their size more cautiously due to limited resources, especially land area.
Besides milking cows and heifers, each farm kept only one strong water buffalo or bullock as a draft animal for transporting manure, etc. Any newborn male calves are usually sold to the slaughter house shortly after birth.
Table 6. Major information of the surveyed farm
Farm Units Total (50 farms)
Data and information
Average /farm
Max. /farm
Min./ farm
Land owned ha 114.5 2.289(±0.15) 5.55 0.77
Cattle Head 651 13.02 35 2
Milk production Ton/year 2,023 40.46(±3.65) 124 7
- per ha Ton/ha/year 17.55(±1.1) 38.4 5.4
- production kg/cow/day 21.2(±0.5) 27 17
Fat content104 % 3.11–3.36
Protein105 3.14–3.26
SNF106 8.31–8.41
Labor
Full-time employees Person 1.15(±0.04) 2 0
Family working labor Person/farm 2.7(±0.08) 4 1
Milking system Milking machine +hand
Milking machine
Machine + hand
Milking by hand
Milkings per day Times 2 3107
Length of lactation Days 305 (±3)
Inter-calving period108 Days 427 518 365
Dry period Days 60
Breeding method Artificial
Feeding time per day 3 4 3
Death rate109 % 4.43
Culling rate110 % 25.8
- Old or low quality milking cow
% 2.6
- from low quality heifers % 0.8
- from male calves % 22.4
Source: Survey results, 2010
104
It depends on the breed of cow. The American HF has higher fat content in comparison with others. (Thien, 2010) 105
Thien, 2010 106
Thien, 2010 107
Only 1 farm with exceptional dairy cows that can yield more than 50 kg per day 108
Thien, 2010 109
MCM, 2011 110
MCM, 2011
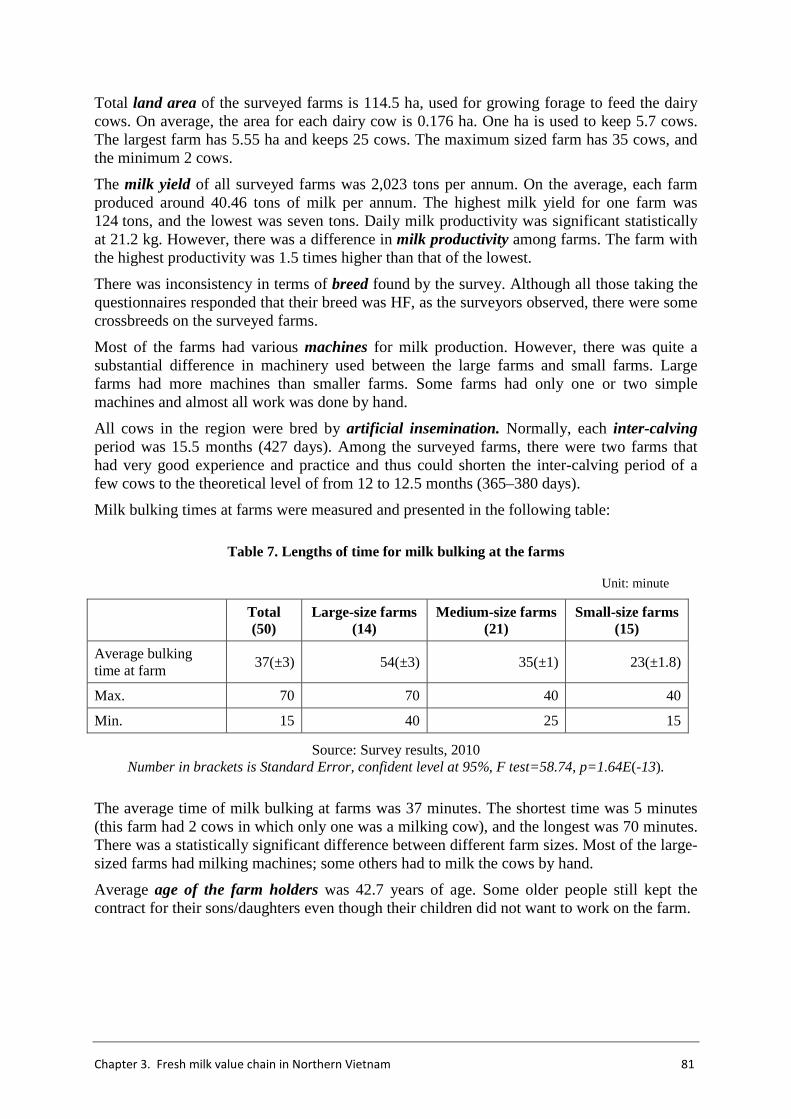
Chapter 3. Fresh milk value chain in Northern Vietnam 81
Total land area of the surveyed farms is 114.5 ha, used for growing forage to feed the dairy cows. On average, the area for each dairy cow is 0.176 ha. One ha is used to keep 5.7 cows. The largest farm has 5.55 ha and keeps 25 cows. The maximum sized farm has 35 cows, and the minimum 2 cows.
The milk yield of all surveyed farms was 2,023 tons per annum. On the average, each farm produced around 40.46 tons of milk per annum. The highest milk yield for one farm was 124 tons, and the lowest was seven tons. Daily milk productivity was significant statistically at 21.2 kg. However, there was a difference in milk productivity among farms. The farm with the highest productivity was 1.5 times higher than that of the lowest.
There was inconsistency in terms of breed found by the survey. Although all those taking the questionnaires responded that their breed was HF, as the surveyors observed, there were some crossbreeds on the surveyed farms.
Most of the farms had various machines for milk production. However, there was quite a substantial difference in machinery used between the large farms and small farms. Large farms had more machines than smaller farms. Some farms had only one or two simple machines and almost all work was done by hand.
All cows in the region were bred by artificial insemination. Normally, each inter-calving period was 15.5 months (427 days). Among the surveyed farms, there were two farms that had very good experience and practice and thus could shorten the inter-calving period of a few cows to the theoretical level of from 12 to 12.5 months (365–380 days).
Milk bulking times at farms were measured and presented in the following table:
Table 7. Lengths of time for milk bulking at the farms
Unit: minute
Total (50)
Large-size farms (14)
Medium-size farms (21)
Small-size farms (15)
Average bulking time at farm 37(±3) 54(±3) 35(±1) 23(±1.8)
Max. 70 70 40 40
Min. 15 40 25 15
Source: Survey results, 2010 Number in brackets is Standard Error, confident level at 95%, F test=58.74, p=1.64E(-13).
The average time of milk bulking at farms was 37 minutes. The shortest time was 5 minutes (this farm had 2 cows in which only one was a milking cow), and the longest was 70 minutes. There was a statistically significant difference between different farm sizes. Most of the large-sized farms had milking machines; some others had to milk the cows by hand.
Average age of the farm holders was 42.7 years of age. Some older people still kept the contract for their sons/daughters even though their children did not want to work on the farm.
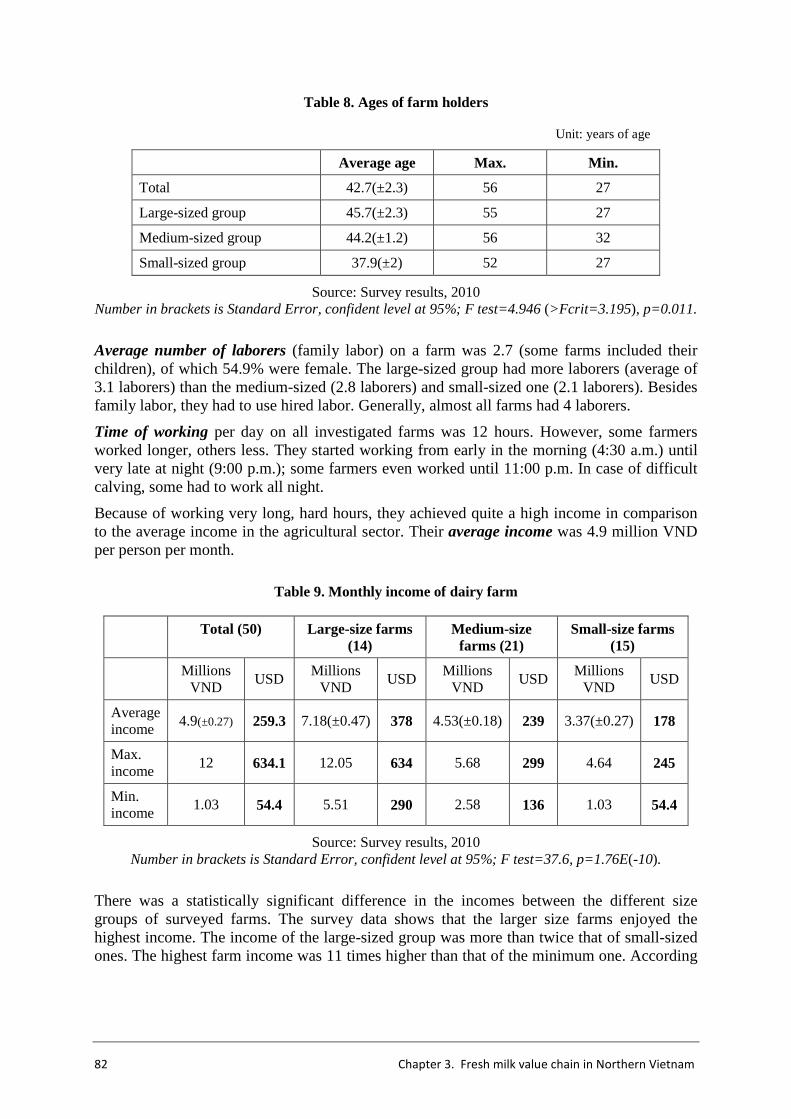
82 Chapter 3. Fresh milk value chain in Northern Vietnam
Table 8. Ages of farm holders
Unit: years of age
Average age Max. Min.
Total 42.7(±2.3) 56 27
Large-sized group 45.7(±2.3) 55 27
Medium-sized group 44.2(±1.2) 56 32
Small-sized group 37.9(±2) 52 27
Source: Survey results, 2010 Number in brackets is Standard Error, confident level at 95%; F test=4.946 (>Fcrit=3.195), p=0.011.
Average number of laborers (family labor) on a farm was 2.7 (some farms included their children), of which 54.9% were female. The large-sized group had more laborers (average of 3.1 laborers) than the medium-sized (2.8 laborers) and small-sized one (2.1 laborers). Besides family labor, they had to use hired labor. Generally, almost all farms had 4 laborers.
Time of working per day on all investigated farms was 12 hours. However, some farmers worked longer, others less. They started working from early in the morning (4:30 a.m.) until very late at night (9:00 p.m.); some farmers even worked until 11:00 p.m. In case of difficult calving, some had to work all night.
Because of working very long, hard hours, they achieved quite a high income in comparison to the average income in the agricultural sector. Their average income was 4.9 million VND per person per month.
Table 9. Monthly income of dairy farm
Total (50) Large-size farms (14)
Medium-size farms (21)
Small-size farms (15)
Millions VND
USD Millions
VND USD
Millions VND
USD Millions
VND USD
Average income
4.9(±0.27) 259.3 7.18(±0.47) 378 4.53(±0.18) 239 3.37(±0.27) 178
Max. income
12 634.1 12.05 634 5.68 299 4.64 245
Min. income
1.03 54.4 5.51 290 2.58 136 1.03 54.4
Source: Survey results, 2010 Number in brackets is Standard Error, confident level at 95%; F test=37.6, p=1.76E(-10).
There was a statistically significant difference in the incomes between the different size groups of surveyed farms. The survey data shows that the larger size farms enjoyed the highest income. The income of the large-sized group was more than twice that of small-sized ones. The highest farm income was 11 times higher than that of the minimum one. According
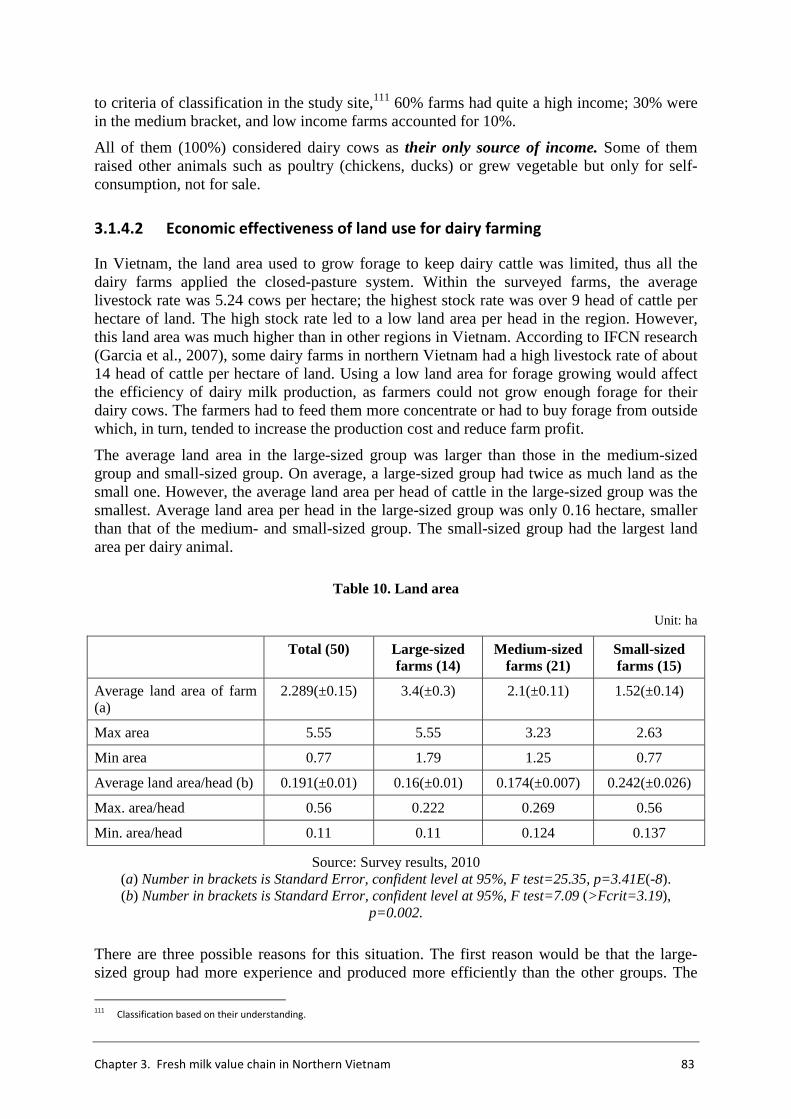
Chapter 3. Fresh milk value chain in Northern Vietnam 83
to criteria of classification in the study site,111 60% farms had quite a high income; 30% were in the medium bracket, and low income farms accounted for 10%.
All of them (100%) considered dairy cows as their only source of income. Some of them raised other animals such as poultry (chickens, ducks) or grew vegetable but only for self-consumption, not for sale.
3.1.4.2 Economic effectiveness of land use for dairy farming
In Vietnam, the land area used to grow forage to keep dairy cattle was limited, thus all the dairy farms applied the closed-pasture system. Within the surveyed farms, the average livestock rate was 5.24 cows per hectare; the highest stock rate was over 9 head of cattle per hectare of land. The high stock rate led to a low land area per head in the region. However, this land area was much higher than in other regions in Vietnam. According to IFCN research (Garcia et al., 2007), some dairy farms in northern Vietnam had a high livestock rate of about 14 head of cattle per hectare of land. Using a low land area for forage growing would affect the efficiency of dairy milk production, as farmers could not grow enough forage for their dairy cows. The farmers had to feed them more concentrate or had to buy forage from outside which, in turn, tended to increase the production cost and reduce farm profit.
The average land area in the large-sized group was larger than those in the medium-sized group and small-sized group. On average, a large-sized group had twice as much land as the small one. However, the average land area per head of cattle in the large-sized group was the smallest. Average land area per head in the large-sized group was only 0.16 hectare, smaller than that of the medium- and small-sized group. The small-sized group had the largest land area per dairy animal.
Table 10. Land area
Unit: ha
Total (50) Large-sized farms (14)
Medium-sized farms (21)
Small-sized farms (15)
Average land area of farm (a)
2.289(±0.15) 3.4(±0.3) 2.1(±0.11) 1.52(±0.14)
Max area 5.55 5.55 3.23 2.63
Min area 0.77 1.79 1.25 0.77
Average land area/head (b) 0.191(±0.01) 0.16(±0.01) 0.174(±0.007) 0.242(±0.026)
Max. area/head 0.56 0.222 0.269 0.56
Min. area/head 0.11 0.11 0.124 0.137
Source: Survey results, 2010 (a) Number in brackets is Standard Error, confident level at 95%, F test=25.35, p=3.41E(-8). (b) Number in brackets is Standard Error, confident level at 95%, F test=7.09 (>Fcrit=3.19),
p=0.002.
There are three possible reasons for this situation. The first reason would be that the large-sized group had more experience and produced more efficiently than the other groups. The
111
Classification based on their understanding.
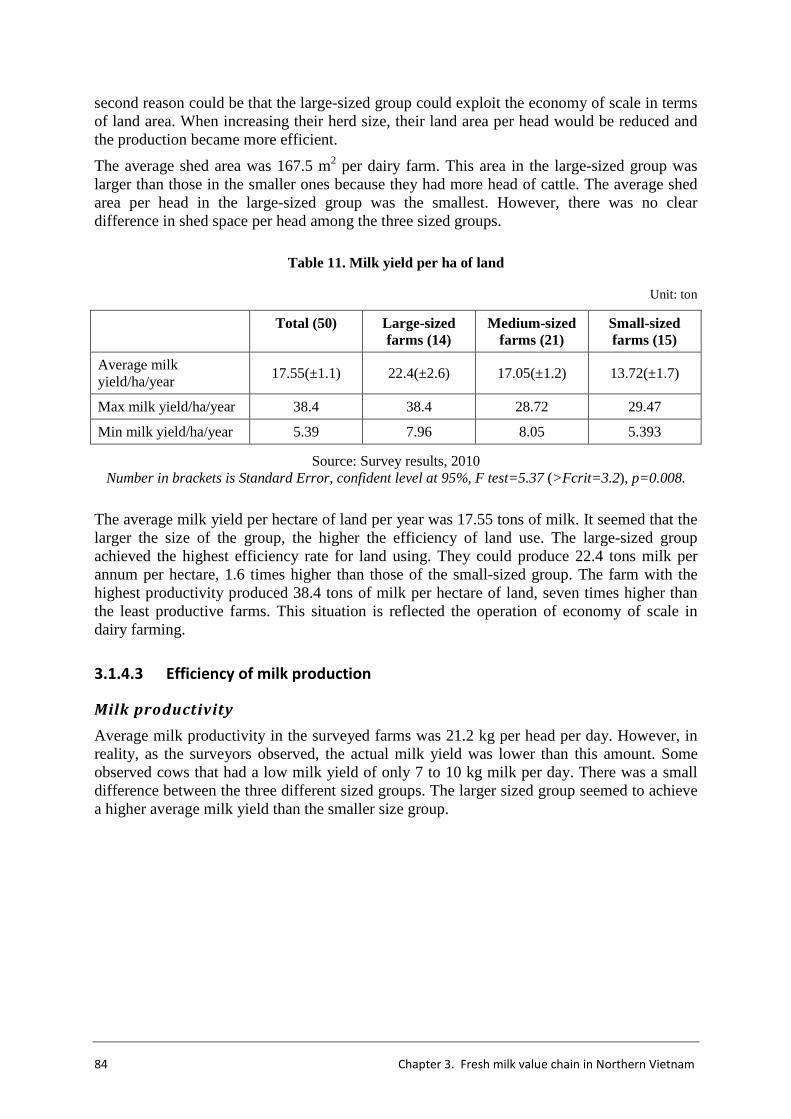
84 Chapter 3. Fresh milk value chain in Northern Vietnam
second reason could be that the large-sized group could exploit the economy of scale in terms of land area. When increasing their herd size, their land area per head would be reduced and the production became more efficient.
The average shed area was 167.5 m2 per dairy farm. This area in the large-sized group was larger than those in the smaller ones because they had more head of cattle. The average shed area per head in the large-sized group was the smallest. However, there was no clear difference in shed space per head among the three sized groups.
Table 11. Milk yield per ha of land
Unit: ton
Total (50) Large-sized farms (14)
Medium-sized farms (21)
Small-sized farms (15)
Average milk yield/ha/year 17.55(±1.1) 22.4(±2.6) 17.05(±1.2) 13.72(±1.7)
Max milk yield/ha/year 38.4 38.4 28.72 29.47
Min milk yield/ha/year 5.39 7.96 8.05 5.393
Source: Survey results, 2010 Number in brackets is Standard Error, confident level at 95%, F test=5.37 (>Fcrit=3.2), p=0.008.
The average milk yield per hectare of land per year was 17.55 tons of milk. It seemed that the larger the size of the group, the higher the efficiency of land use. The large-sized group achieved the highest efficiency rate for land using. They could produce 22.4 tons milk per annum per hectare, 1.6 times higher than those of the small-sized group. The farm with the highest productivity produced 38.4 tons of milk per hectare of land, seven times higher than the least productive farms. This situation is reflected the operation of economy of scale in dairy farming.
3.1.4.3 Efficiency of milk production
Milk productivity
Average milk productivity in the surveyed farms was 21.2 kg per head per day. However, in reality, as the surveyors observed, the actual milk yield was lower than this amount. Some observed cows that had a low milk yield of only 7 to 10 kg milk per day. There was a small difference between the three different sized groups. The larger sized group seemed to achieve a higher average milk yield than the smaller size group.
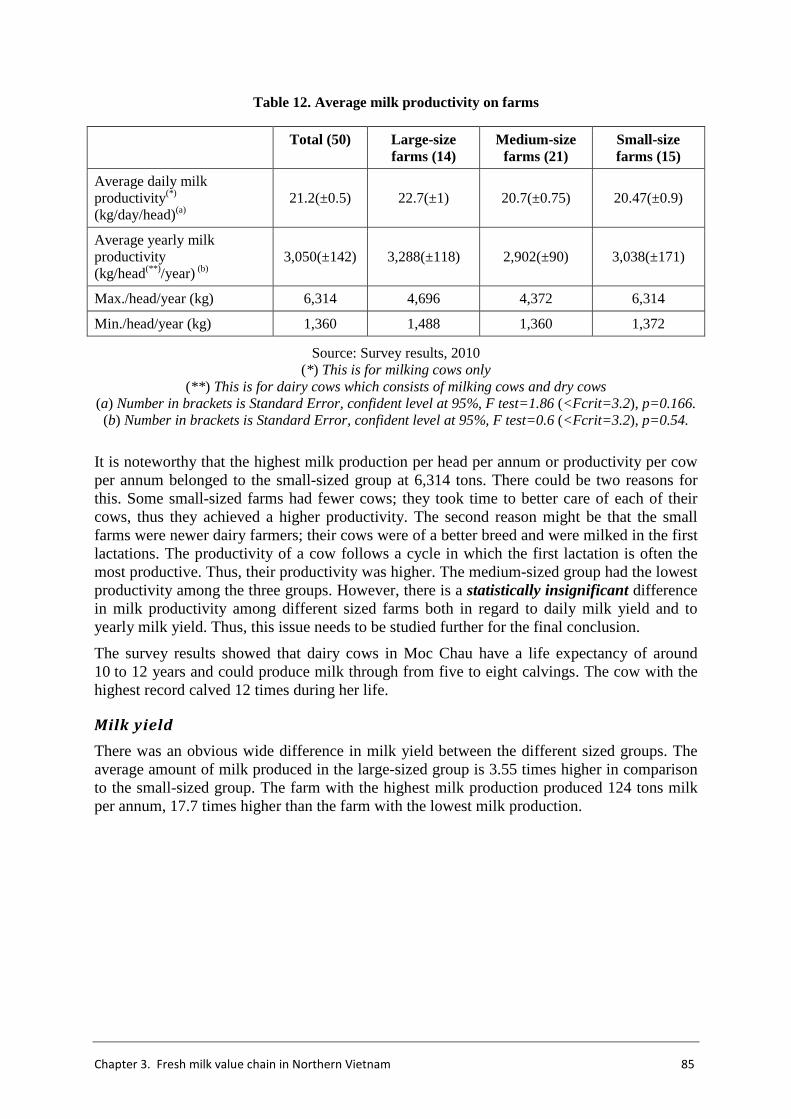
Chapter 3. Fresh milk value chain in Northern Vietnam 85
Table 12. Average milk productivity on farms
Total (50) Large-size farms (14)
Medium-size farms (21)
Small-size farms (15)
Average daily milk productivity(*)
(kg/day/head)(a) 21.2(±0.5) 22.7(±1) 20.7(±0.75) 20.47(±0.9)
Average yearly milk productivity (kg/head(**) /year) (b)
3,050(±142) 3,288(±118) 2,902(±90) 3,038(±171)
Max./head/year (kg) 6,314 4,696 4,372 6,314
Min./head/year (kg) 1,360 1,488 1,360 1,372
Source: Survey results, 2010 (* ) This is for milking cows only
(** ) This is for dairy cows which consists of milking cows and dry cows (a) Number in brackets is Standard Error, confident level at 95%, F test=1.86 (<Fcrit=3.2), p=0.166. (b) Number in brackets is Standard Error, confident level at 95%, F test=0.6 (<Fcrit=3.2), p=0.54.
It is noteworthy that the highest milk production per head per annum or productivity per cow per annum belonged to the small-sized group at 6,314 tons. There could be two reasons for this. Some small-sized farms had fewer cows; they took time to better care of each of their cows, thus they achieved a higher productivity. The second reason might be that the small farms were newer dairy farmers; their cows were of a better breed and were milked in the first lactations. The productivity of a cow follows a cycle in which the first lactation is often the most productive. Thus, their productivity was higher. The medium-sized group had the lowest productivity among the three groups. However, there is a statistically insignificant difference in milk productivity among different sized farms both in regard to daily milk yield and to yearly milk yield. Thus, this issue needs to be studied further for the final conclusion.
The survey results showed that dairy cows in Moc Chau have a life expectancy of around 10 to 12 years and could produce milk through from five to eight calvings. The cow with the highest record calved 12 times during her life.
Milk yield
There was an obvious wide difference in milk yield between the different sized groups. The average amount of milk produced in the large-sized group is 3.55 times higher in comparison to the small-sized group. The farm with the highest milk production produced 124 tons milk per annum, 17.7 times higher than the farm with the lowest milk production.
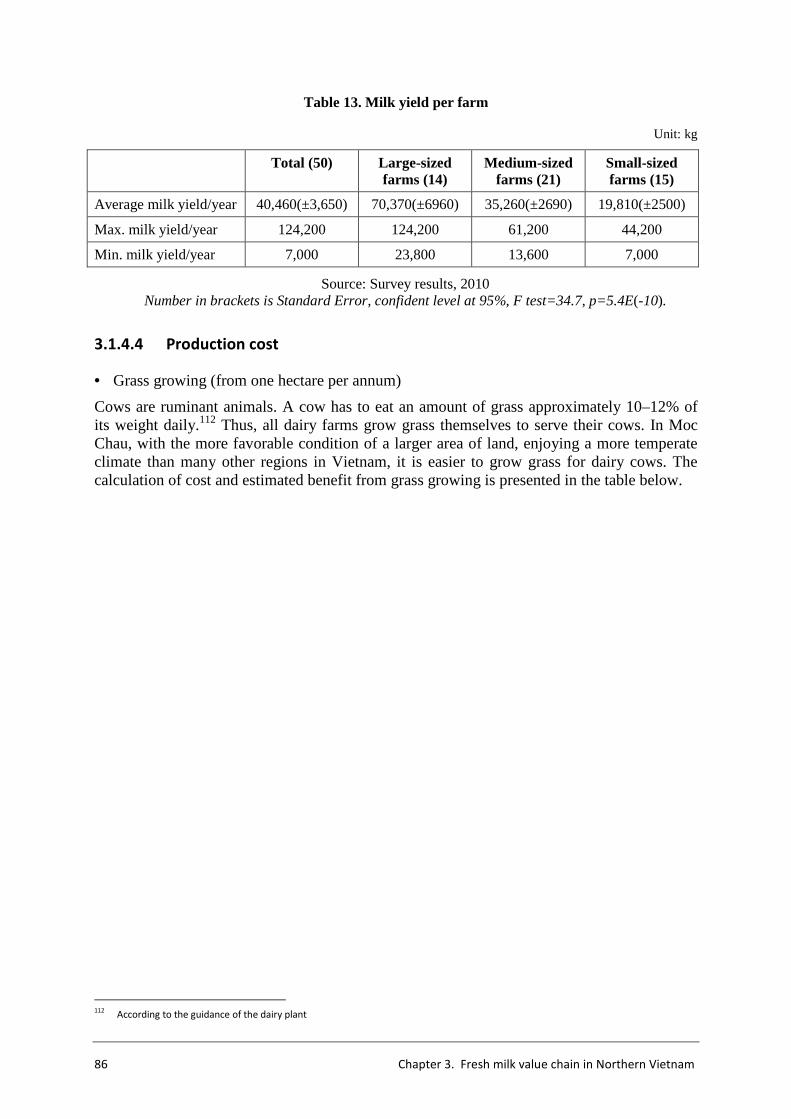
86 Chapter 3. Fresh milk value chain in Northern Vietnam
Table 13. Milk yield per farm
Unit: kg
Total (50) Large-sized farms (14)
Medium-sized farms (21)
Small-sized farms (15)
Average milk yield/year 40,460(±3,650) 70,370(±6960) 35,260(±2690) 19,810(±2500)
Max. milk yield/year 124,200 124,200 61,200 44,200
Min. milk yield/year 7,000 23,800 13,600 7,000
Source: Survey results, 2010 Number in brackets is Standard Error, confident level at 95%, F test=34.7, p=5.4E(-10).
3.1.4.4 Production cost
• Grass growing (from one hectare per annum)
Cows are ruminant animals. A cow has to eat an amount of grass approximately 10–12% of its weight daily.112 Thus, all dairy farms grow grass themselves to serve their cows. In Moc Chau, with the more favorable condition of a larger area of land, enjoying a more temperate climate than many other regions in Vietnam, it is easier to grow grass for dairy cows. The calculation of cost and estimated benefit from grass growing is presented in the table below.
112
According to the guidance of the dairy plant
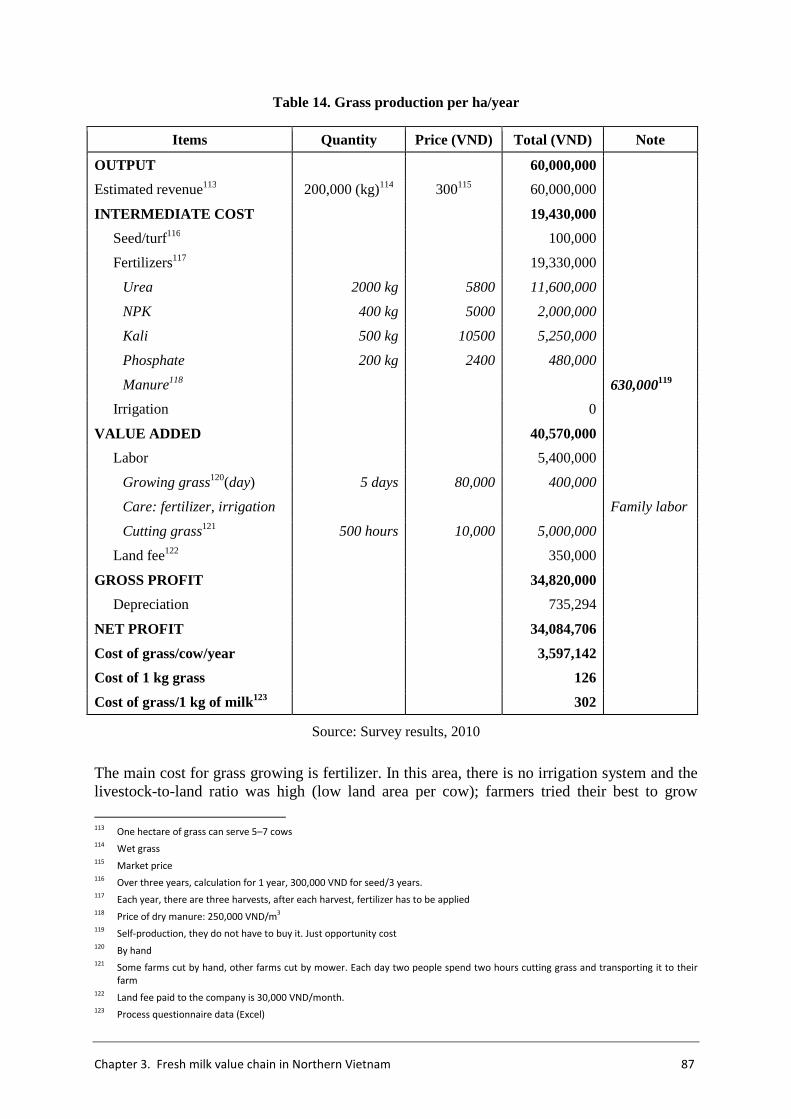
Chapter 3. Fresh milk value chain in Northern Vietnam 87
Table 14. Grass production per ha/year
Items Quantity Price (VND) Total (VND) Note
OUTPUT 60,000,000
Estimated revenue113 200,000 (kg)114 300115 60,000,000
INTERMEDIATE COST 19,430,000
Seed/turf116 100,000
Fertilizers117 19,330,000
Urea 2000 kg 5800 11,600,000
NPK 400 kg 5000 2,000,000
Kali 500 kg 10500 5,250,000
Phosphate 200 kg 2400 480,000
Manure118 630,000119
Irrigation 0
VALUE ADDED 40,570,000
Labor 5,400,000
Growing grass120(day) 5 days 80,000 400,000
Care: fertilizer, irrigation Family labor
Cutting grass121 500 hours 10,000 5,000,000
Land fee122 350,000
GROSS PROFIT 34,820,000
Depreciation 735,294
NET PROFIT 34,084,706
Cost of grass/cow/year 3,597,142
Cost of 1 kg grass 126
Cost of grass/1 kg of milk123 302
Source: Survey results, 2010
The main cost for grass growing is fertilizer. In this area, there is no irrigation system and the livestock-to-land ratio was high (low land area per cow); farmers tried their best to grow
113
One hectare of grass can serve 5–7 cows 114
Wet grass 115
Market price 116
Over three years, calculation for 1 year, 300,000 VND for seed/3 years. 117
Each year, there are three harvests, after each harvest, fertilizer has to be applied 118
Price of dry manure: 250,000 VND/m3
119 Self-production, they do not have to buy it. Just opportunity cost
120 By hand
121 Some farms cut by hand, other farms cut by mower. Each day two people spend two hours cutting grass and transporting it to their
farm 122
Land fee paid to the company is 30,000 VND/month. 123
Process questionnaire data (Excel)
88 Chapter 3. Fresh milk value chain in Northern Vietnam
forage in their fields by using many different fertilizers, especially urea. They found that urea stimulates the growth of grass. As grass grew faster, it could be harvested sooner and the numbers of cuttings per annum would increase. Thus, the amount of urea used is quite high.
Due to quite a harsh climate in northern Vietnam, normally grass cannot be grown during the period from November (sometimes October) to April, as the weather is too cold and dry. Temperatures can sometimes approach the freezing point. Even in summer, grass may not grow if affected by excessive rains or flooding. In that situation, the farmers have to replant it, which takes time and costs money. In addition, little attention has been given to the varieties of grass in Vietnam. Thus, the yield of grass growing in Vietnam is still low. This explains the low amount of grass grown per cow. The farmers had to buy hay from outside (imported hay from America through the dairy plant). This, in turn, increases the feeding cost in particular, and production cost in general.
Under normal weather conditions, farmers plant grass once and harvest it for three years. Each year, they harvest three times. After each cutting, they fertilize the mowed grass fields for future cutting. Fertilizers dominate the total costs of grass production at 76.77%. Hired laborers are commonly used to cut grass and their wages account for 92.6% of labor costs.
• Maize silage
Besides grass, from 2007–2008 to now, the dairy farmers were trained to grow maize for silage feed. Nowadays, growing maize for silage is another necessary activity on farms.
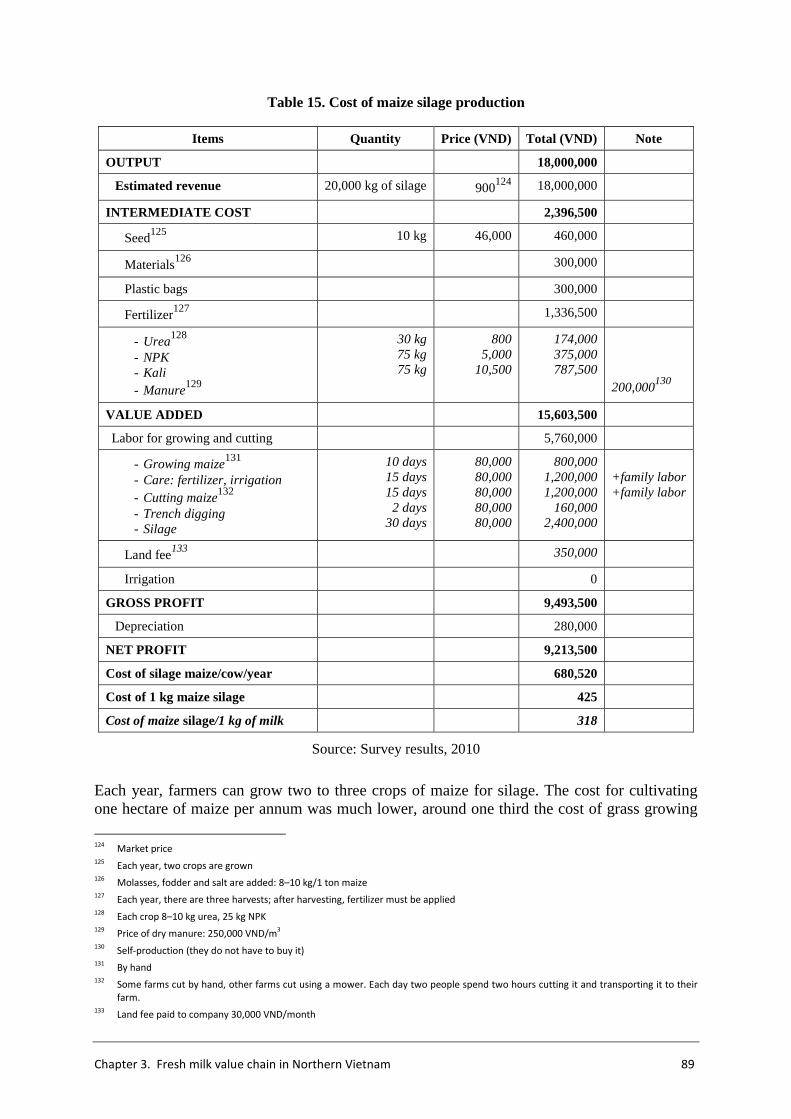
Chapter 3. Fresh milk value chain in Northern Vietnam 89
Table 15. Cost of maize silage production
Items Quantity Price (VND) Total (VND) Note
OUTPUT 18,000,000
Estimated revenue 20,000 kg of silage 900124 18,000,000
INTERMEDIATE COST 2,396,500
Seed125 10 kg 46,000 460,000
Materials126 300,000
Plastic bags 300,000
Fertilizer127 1,336,500
- Urea128
- NPK - Kali - Manure
129
30 kg 75 kg 75 kg
800 5,000
10,500
174,000 375,000 787,500
200,000
130
VALUE ADDED 15,603,500
Labor for growing and cutting 5,760,000
- Growing maize131
- Care: fertilizer, irrigation - Cutting maize
132
- Trench digging - Silage
10 days 15 days 15 days 2 days
30 days
80,000 80,000 80,000 80,000 80,000
800,000 1,200,000 1,200,000
160,000 2,400,000
+family labor +family labor
Land fee133 350,000
Irrigation 0
GROSS PROFIT 9,493,500
Depreciation 280,000
NET PROFIT 9,213,500
Cost of silage maize/cow/year 680,520
Cost of 1 kg maize silage 425
Cost of maize silage/1 kg of milk 318
Source: Survey results, 2010
Each year, farmers can grow two to three crops of maize for silage. The cost for cultivating one hectare of maize per annum was much lower, around one third the cost of grass growing
124
Market price 125
Each year, two crops are grown 126
Molasses, fodder and salt are added: 8–10 kg/1 ton maize 127
Each year, there are three harvests; after harvesting, fertilizer must be applied 128
Each crop 8–10 kg urea, 25 kg NPK 129
Price of dry manure: 250,000 VND/m3
130 Self-production (they do not have to buy it)
131 By hand
132 Some farms cut by hand, other farms cut using a mower. Each day two people spend two hours cutting it and transporting it to their
farm. 133
Land fee paid to company 30,000 VND/month
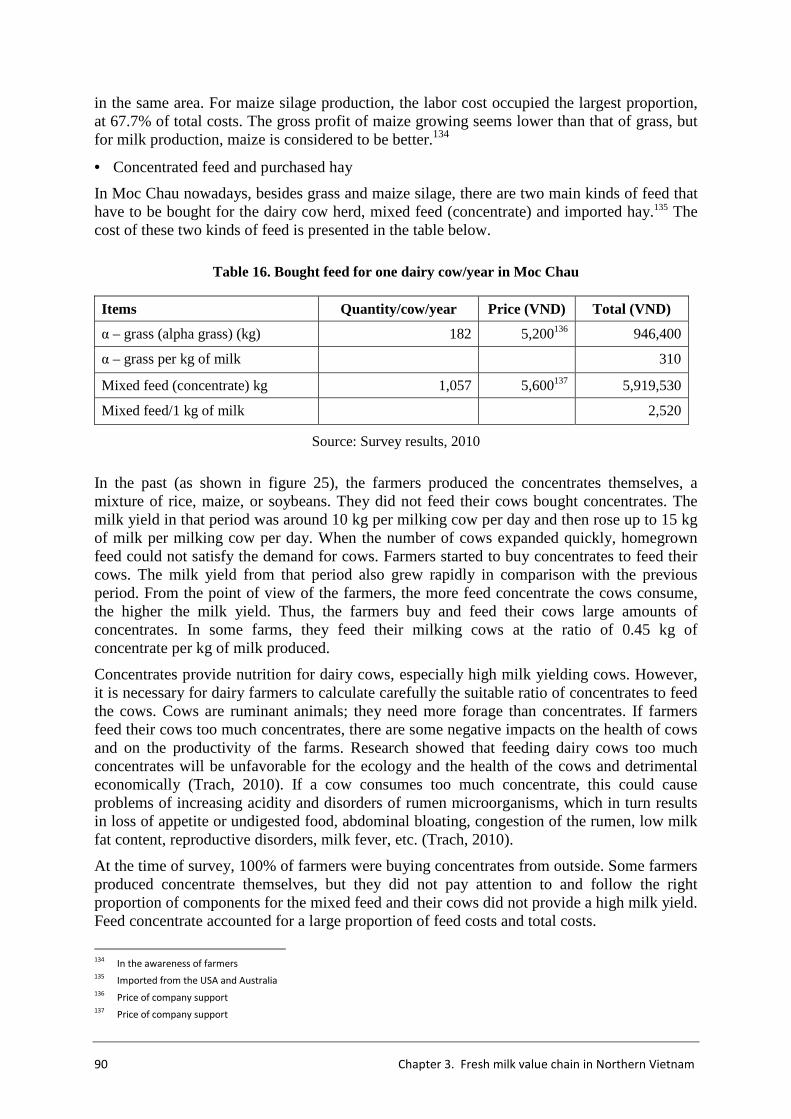
90 Chapter 3. Fresh milk value chain in Northern Vietnam
in the same area. For maize silage production, the labor cost occupied the largest proportion, at 67.7% of total costs. The gross profit of maize growing seems lower than that of grass, but for milk production, maize is considered to be better.134
• Concentrated feed and purchased hay
In Moc Chau nowadays, besides grass and maize silage, there are two main kinds of feed that have to be bought for the dairy cow herd, mixed feed (concentrate) and imported hay.135 The cost of these two kinds of feed is presented in the table below.
Table 16. Bought feed for one dairy cow/year in Moc Chau
Items Quantity/cow/year Price (VND) Total (VND)
α – grass (alpha grass) (kg) 182 5,200136 946,400
α – grass per kg of milk 310
Mixed feed (concentrate) kg 1,057 5,600137 5,919,530
Mixed feed/1 kg of milk 2,520
Source: Survey results, 2010
In the past (as shown in figure 25), the farmers produced the concentrates themselves, a mixture of rice, maize, or soybeans. They did not feed their cows bought concentrates. The milk yield in that period was around 10 kg per milking cow per day and then rose up to 15 kg of milk per milking cow per day. When the number of cows expanded quickly, homegrown feed could not satisfy the demand for cows. Farmers started to buy concentrates to feed their cows. The milk yield from that period also grew rapidly in comparison with the previous period. From the point of view of the farmers, the more feed concentrate the cows consume, the higher the milk yield. Thus, the farmers buy and feed their cows large amounts of concentrates. In some farms, they feed their milking cows at the ratio of 0.45 kg of concentrate per kg of milk produced.
Concentrates provide nutrition for dairy cows, especially high milk yielding cows. However, it is necessary for dairy farmers to calculate carefully the suitable ratio of concentrates to feed the cows. Cows are ruminant animals; they need more forage than concentrates. If farmers feed their cows too much concentrates, there are some negative impacts on the health of cows and on the productivity of the farms. Research showed that feeding dairy cows too much concentrates will be unfavorable for the ecology and the health of the cows and detrimental economically (Trach, 2010). If a cow consumes too much concentrate, this could cause problems of increasing acidity and disorders of rumen microorganisms, which in turn results in loss of appetite or undigested food, abdominal bloating, congestion of the rumen, low milk fat content, reproductive disorders, milk fever, etc. (Trach, 2010).
At the time of survey, 100% of farmers were buying concentrates from outside. Some farmers produced concentrate themselves, but they did not pay attention to and follow the right proportion of components for the mixed feed and their cows did not provide a high milk yield. Feed concentrate accounted for a large proportion of feed costs and total costs.
134
In the awareness of farmers 135
Imported from the USA and Australia 136
Price of company support 137
Price of company support
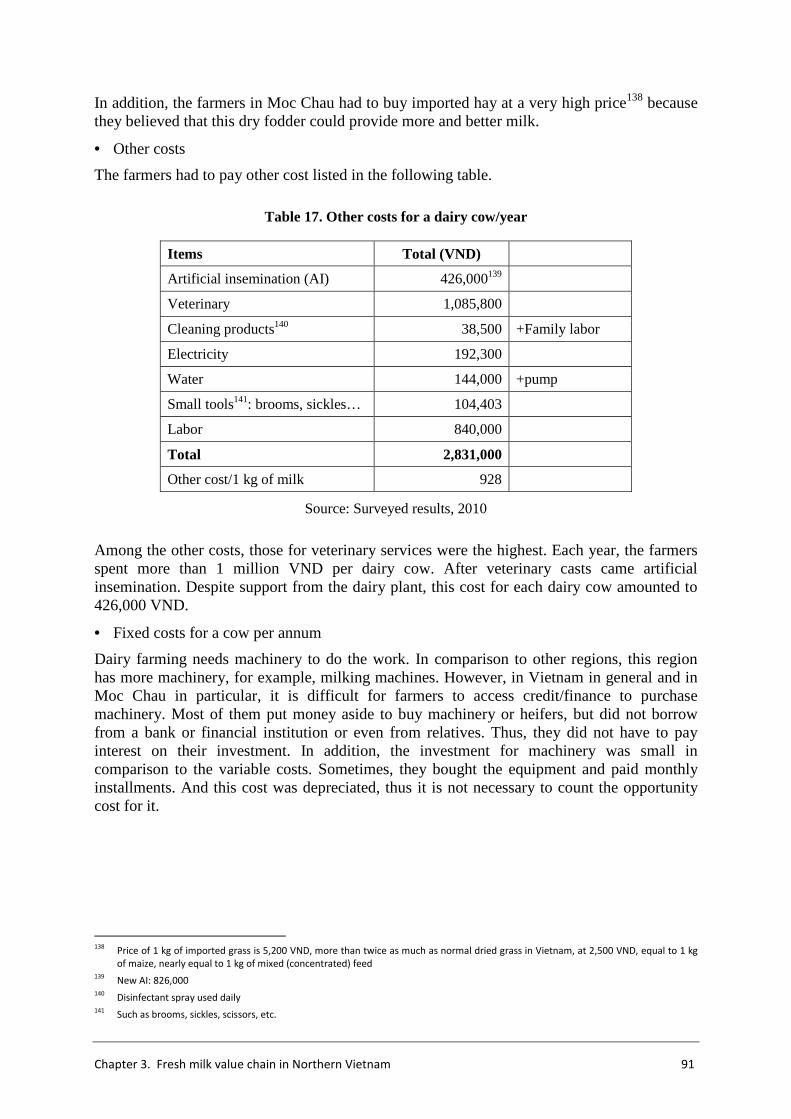
Chapter 3. Fresh milk value chain in Northern Vietnam 91
In addition, the farmers in Moc Chau had to buy imported hay at a very high price138 because they believed that this dry fodder could provide more and better milk.
• Other costs
The farmers had to pay other cost listed in the following table.
Table 17. Other costs for a dairy cow/year
Items Total (VND)
Artificial insemination (AI) 426,000139
Veterinary 1,085,800
Cleaning products140 38,500 +Family labor
Electricity 192,300
Water 144,000 +pump
Small tools141: brooms, sickles… 104,403
Labor 840,000
Total 2,831,000
Other cost/1 kg of milk 928
Source: Surveyed results, 2010
Among the other costs, those for veterinary services were the highest. Each year, the farmers spent more than 1 million VND per dairy cow. After veterinary casts came artificial insemination. Despite support from the dairy plant, this cost for each dairy cow amounted to 426,000 VND.
• Fixed costs for a cow per annum
Dairy farming needs machinery to do the work. In comparison to other regions, this region has more machinery, for example, milking machines. However, in Vietnam in general and in Moc Chau in particular, it is difficult for farmers to access credit/finance to purchase machinery. Most of them put money aside to buy machinery or heifers, but did not borrow from a bank or financial institution or even from relatives. Thus, they did not have to pay interest on their investment. In addition, the investment for machinery was small in comparison to the variable costs. Sometimes, they bought the equipment and paid monthly installments. And this cost was depreciated, thus it is not necessary to count the opportunity cost for it.
138
Price of 1 kg of imported grass is 5,200 VND, more than twice as much as normal dried grass in Vietnam, at 2,500 VND, equal to 1 kg
of maize, nearly equal to 1 kg of mixed (concentrated) feed 139
New AI: 826,000 140
Disinfectant spray used daily 141
Such as brooms, sickles, scissors, etc.
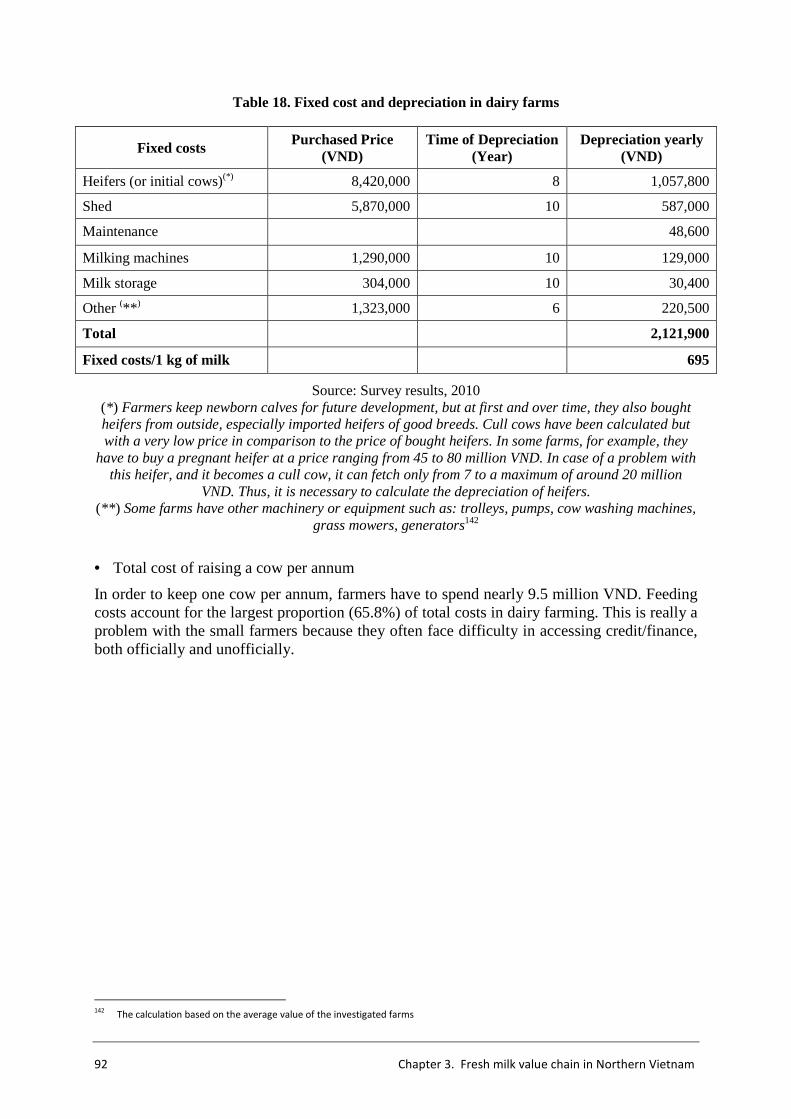
92 Chapter 3. Fresh milk value chain in Northern Vietnam
Table 18. Fixed cost and depreciation in dairy farms
Fixed costs Purchased Price (VND)
Time of Depreciation (Year)
Depreciation yearly (VND)
Heifers (or initial cows)(*) 8,420,000 8 1,057,800
Shed 5,870,000 10 587,000
Maintenance 48,600
Milking machines 1,290,000 10 129,000
Milk storage 304,000 10 30,400
Other (** ) 1,323,000 6 220,500
Total 2,121,900
Fixed costs/1 kg of milk 695
Source: Survey results, 2010 (* ) Farmers keep newborn calves for future development, but at first and over time, they also bought heifers from outside, especially imported heifers of good breeds. Cull cows have been calculated but with a very low price in comparison to the price of bought heifers. In some farms, for example, they
have to buy a pregnant heifer at a price ranging from 45 to 80 million VND. In case of a problem with this heifer, and it becomes a cull cow, it can fetch only from 7 to a maximum of around 20 million
VND. Thus, it is necessary to calculate the depreciation of heifers. (** ) Some farms have other machinery or equipment such as: trolleys, pumps, cow washing machines,
grass mowers, generators142
• Total cost of raising a cow per annum
In order to keep one cow per annum, farmers have to spend nearly 9.5 million VND. Feeding costs account for the largest proportion (65.8%) of total costs in dairy farming. This is really a problem with the small farmers because they often face difficulty in accessing credit/finance, both officially and unofficially.
142
The calculation based on the average value of the investigated farms
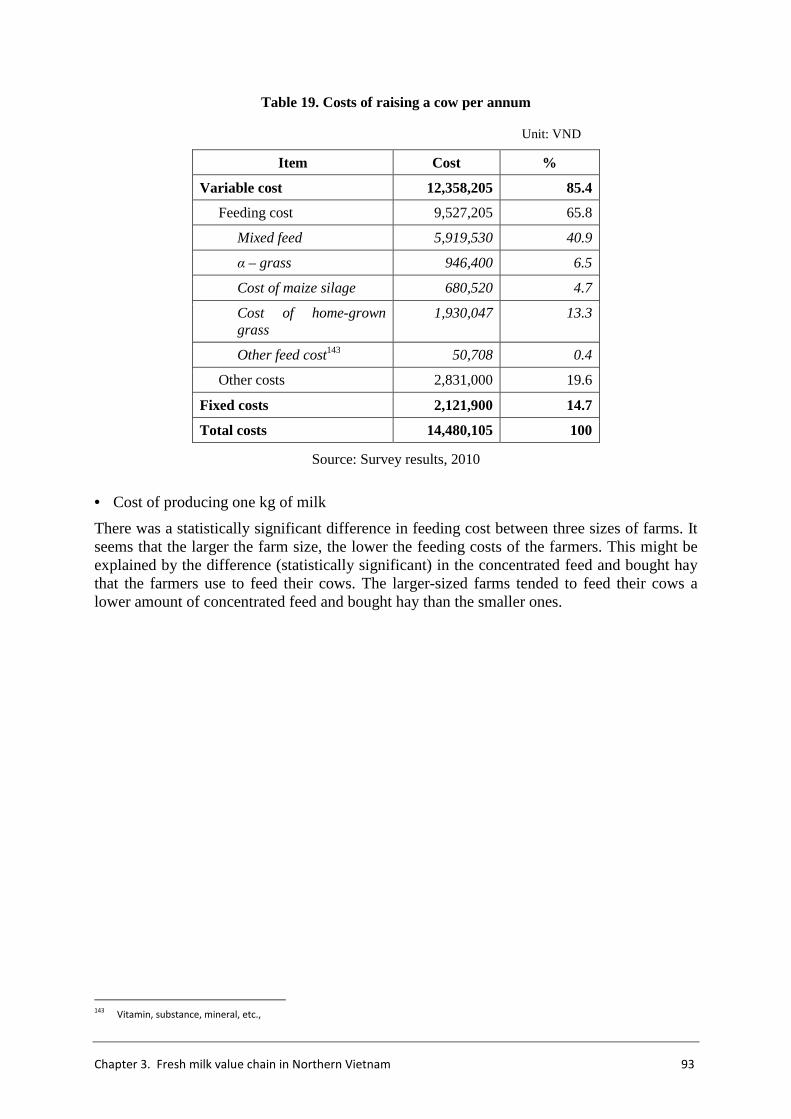
Chapter 3. Fresh milk value chain in Northern Vietnam 93
Table 19. Costs of raising a cow per annum
Unit: VND
Item Cost %
Variable cost 12,358,205 85.4
Feeding cost 9,527,205 65.8
Mixed feed 5,919,530 40.9
α – grass 946,400 6.5
Cost of maize silage 680,520 4.7
Cost of home-grown grass
1,930,047 13.3
Other feed cost143 50,708 0.4
Other costs 2,831,000 19.6
Fixed costs 2,121,900 14.7
Total costs 14,480,105 100
Source: Survey results, 2010
• Cost of producing one kg of milk
There was a statistically significant difference in feeding cost between three sizes of farms. It seems that the larger the farm size, the lower the feeding costs of the farmers. This might be explained by the difference (statistically significant) in the concentrated feed and bought hay that the farmers use to feed their cows. The larger-sized farms tended to feed their cows a lower amount of concentrated feed and bought hay than the smaller ones.
143
Vitamin, substance, mineral, etc.,
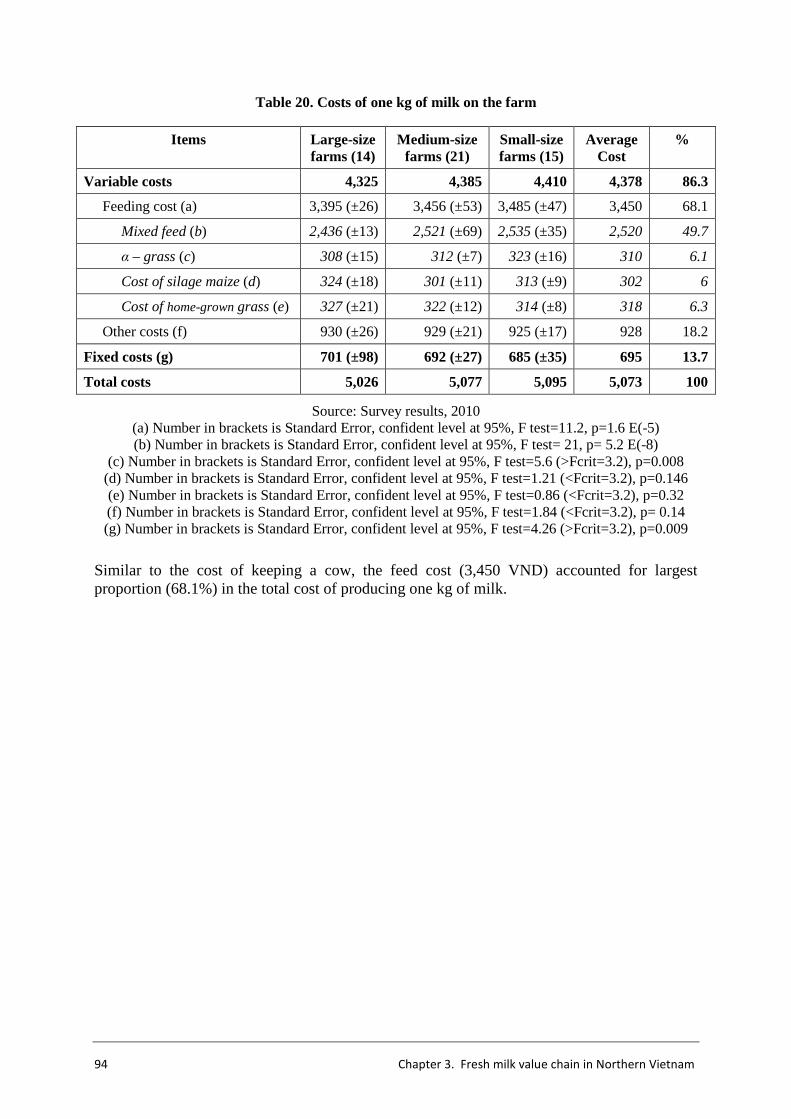
94 Chapter 3. Fresh milk value chain in Northern Vietnam
Table 20. Costs of one kg of milk on the farm
Items Large-size farms (14)
Medium-size farms (21)
Small-size farms (15)
AverageCost
%
Variable costs 4,325 4,385 4,410 4,378 86.3
Feeding cost (a) 3,395 (±26) 3,456 (±53) 3,485 (±47) 3,450 68.1
Mixed feed (b) 2,436 (±13) 2,521 (±69) 2,535 (±35) 2,520 49.7
α – grass (c) 308 (±15) 312 (±7) 323 (±16) 310 6.1
Cost of silage maize (d) 324 (±18) 301 (±11) 313 (±9) 302 6
Cost of home-grown grass (e) 327 (±21) 322 (±12) 314 (±8) 318 6.3
Other costs (f) 930 (±26) 929 (±21) 925 (±17) 928 18.2
Fixed costs (g) 701 (±98) 692 (±27) 685 (±35) 695 13.7
Total costs 5,026 5,077 5,095 5,073 100
Source: Survey results, 2010 (a) Number in brackets is Standard Error, confident level at 95%, F test=11.2, p=1.6 E(-5) (b) Number in brackets is Standard Error, confident level at 95%, F test= 21, p= 5.2 E(-8)
(c) Number in brackets is Standard Error, confident level at 95%, F test=5.6 (>Fcrit=3.2), p=0.008 (d) Number in brackets is Standard Error, confident level at 95%, F test=1.21 (<Fcrit=3.2), p=0.146 (e) Number in brackets is Standard Error, confident level at 95%, F test=0.86 (<Fcrit=3.2), p=0.32 (f) Number in brackets is Standard Error, confident level at 95%, F test=1.84 (<Fcrit=3.2), p= 0.14 (g) Number in brackets is Standard Error, confident level at 95%, F test=4.26 (>Fcrit=3.2), p=0.009
Similar to the cost of keeping a cow, the feed cost (3,450 VND) accounted for largest proportion (68.1%) in the total cost of producing one kg of milk.
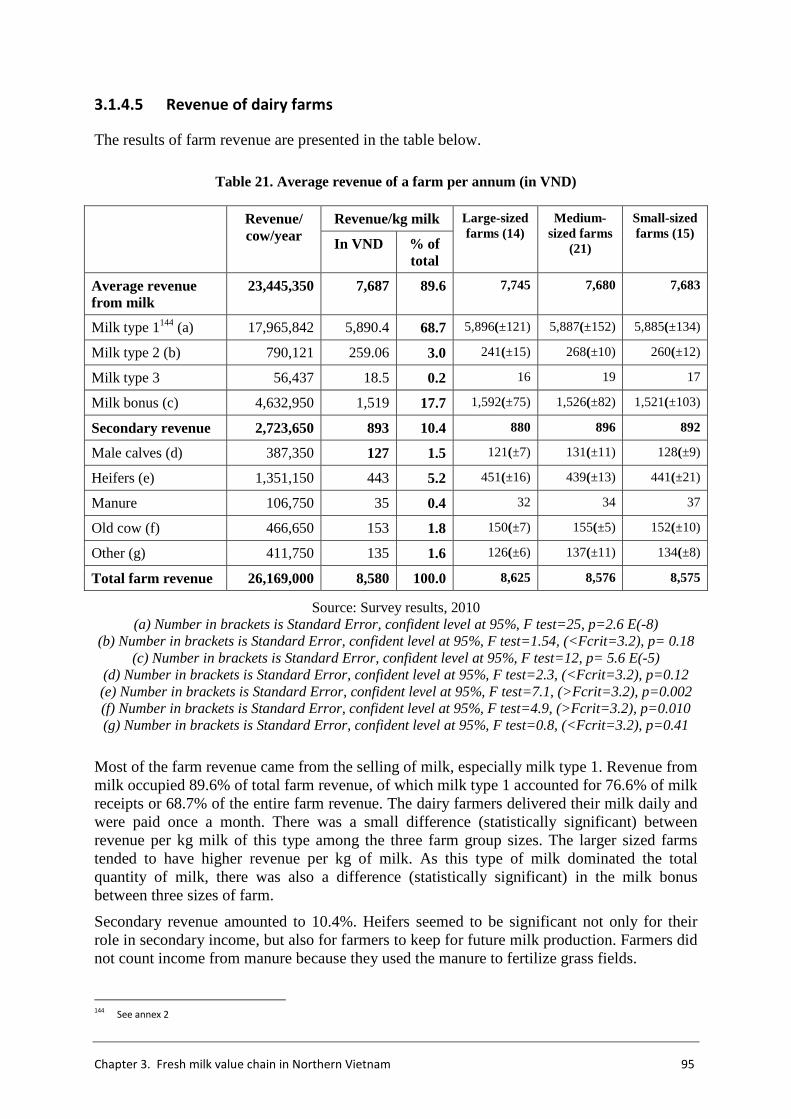
Chapter 3. Fresh milk value chain in Northern Vietnam 95
3.1.4.5 Revenue of dairy farms
The results of farm revenue are presented in the table below.
Table 21. Average revenue of a farm per annum (in VND)
Revenue/ cow/year
Revenue/kg milk Large-sized farms (14)
Medium-sized farms
(21)
Small-sized farms (15)
In VND % of total
Average revenue from milk
23,445,350 7,687 89.6 7,745 7,680 7,683
Milk type 1144 (a) 17,965,842 5,890.4 68.7 5,896(±121) 5,887(±152) 5,885(±134)
Milk type 2 (b) 790,121 259.06 3.0 241(±15) 268(±10) 260(±12)
Milk type 3 56,437 18.5 0.2 16 19 17
Milk bonus (c) 4,632,950 1,519 17.7 1,592(±75) 1,526(±82) 1,521(±103)
Secondary revenue 2,723,650 893 10.4 880 896 892
Male calves (d) 387,350 127 1.5 121(±7) 131(±11) 128(±9)
Heifers (e) 1,351,150 443 5.2 451(±16) 439(±13) 441(±21)
Manure 106,750 35 0.4 32 34 37
Old cow (f) 466,650 153 1.8 150(±7) 155(±5) 152(±10)
Other (g) 411,750 135 1.6 126(±6) 137(±11) 134(±8)
Total farm revenue 26,169,000 8,580 100.0 8,625 8,576 8,575
Source: Survey results, 2010 (a) Number in brackets is Standard Error, confident level at 95%, F test=25, p=2.6 E(-8)
(b) Number in brackets is Standard Error, confident level at 95%, F test=1.54, (<Fcrit=3.2), p= 0.18 (c) Number in brackets is Standard Error, confident level at 95%, F test=12, p= 5.6 E(-5)
(d) Number in brackets is Standard Error, confident level at 95%, F test=2.3, (<Fcrit=3.2), p=0.12 (e) Number in brackets is Standard Error, confident level at 95%, F test=7.1, (>Fcrit=3.2), p=0.002 (f) Number in brackets is Standard Error, confident level at 95%, F test=4.9, (>Fcrit=3.2), p=0.010 (g) Number in brackets is Standard Error, confident level at 95%, F test=0.8, (<Fcrit=3.2), p=0.41
Most of the farm revenue came from the selling of milk, especially milk type 1. Revenue from milk occupied 89.6% of total farm revenue, of which milk type 1 accounted for 76.6% of milk receipts or 68.7% of the entire farm revenue. The dairy farmers delivered their milk daily and were paid once a month. There was a small difference (statistically significant) between revenue per kg milk of this type among the three farm group sizes. The larger sized farms tended to have higher revenue per kg of milk. As this type of milk dominated the total quantity of milk, there was also a difference (statistically significant) in the milk bonus between three sizes of farm.
Secondary revenue amounted to 10.4%. Heifers seemed to be significant not only for their role in secondary income, but also for farmers to keep for future milk production. Farmers did not count income from manure because they used the manure to fertilize grass fields.
144
See annex 2
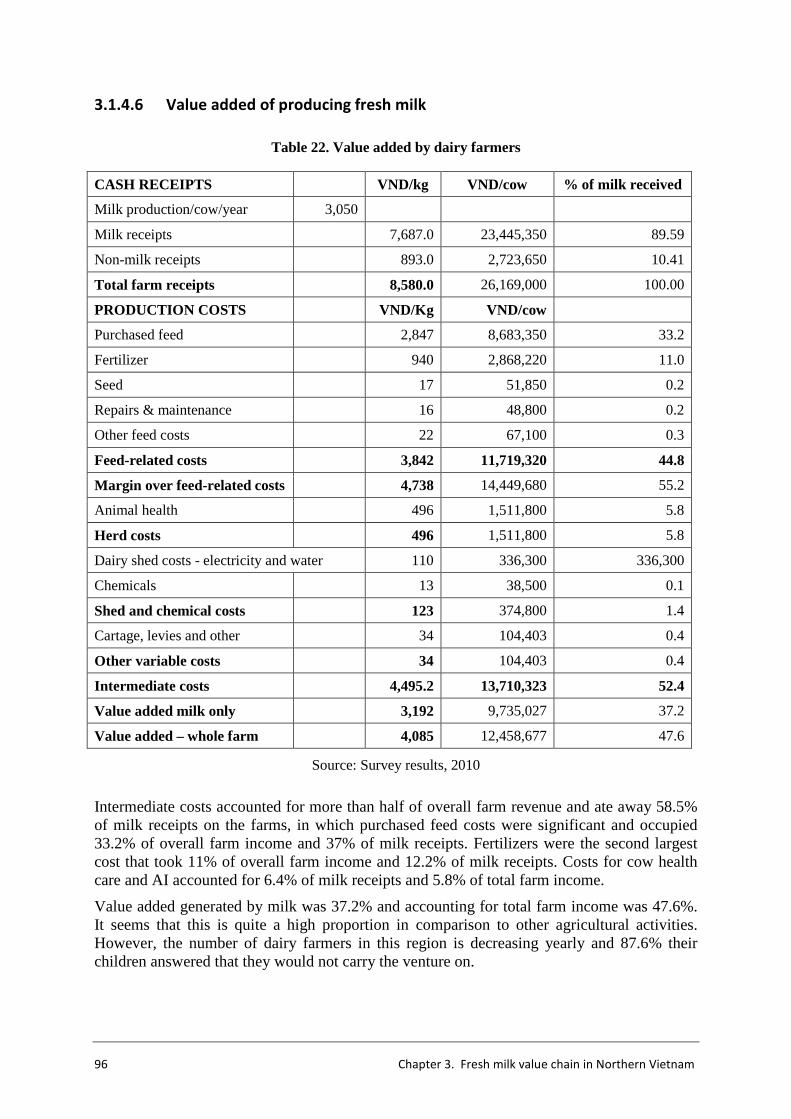
96 Chapter 3. Fresh milk value chain in Northern Vietnam
3.1.4.6 Value added of producing fresh milk
Table 22. Value added by dairy farmers
CASH RECEIPTS VND/kg VND/cow % of milk received
Milk production/cow/year 3,050
Milk receipts 7,687.0 23,445,350 89.59
Non-milk receipts 893.0 2,723,650 10.41
Total farm receipts 8,580.0 26,169,000 100.00
PRODUCTION COSTS VND/Kg VND/cow
Purchased feed 2,847 8,683,350 33.2
Fertilizer 940 2,868,220 11.0
Seed 17 51,850 0.2
Repairs & maintenance 16 48,800 0.2
Other feed costs 22 67,100 0.3
Feed-related costs 3,842 11,719,320 44.8
Margin over feed-related costs 4,738 14,449,680 55.2
Animal health 496 1,511,800 5.8
Herd costs 496 1,511,800 5.8
Dairy shed costs - electricity and water 110 336,300 336,300
Chemicals 13 38,500 0.1
Shed and chemical costs 123 374,800 1.4
Cartage, levies and other 34 104,403 0.4
Other variable costs 34 104,403 0.4
Intermediate costs 4,495.2 13,710,323 52.4
Value added milk only 3,192 9,735,027 37.2
Value added – whole farm 4,085 12,458,677 47.6
Source: Survey results, 2010
Intermediate costs accounted for more than half of overall farm revenue and ate away 58.5% of milk receipts on the farms, in which purchased feed costs were significant and occupied 33.2% of overall farm income and 37% of milk receipts. Fertilizers were the second largest cost that took 11% of overall farm income and 12.2% of milk receipts. Costs for cow health care and AI accounted for 6.4% of milk receipts and 5.8% of total farm income.
Value added generated by milk was 37.2% and accounting for total farm income was 47.6%. It seems that this is quite a high proportion in comparison to other agricultural activities. However, the number of dairy farmers in this region is decreasing yearly and 87.6% their children answered that they would not carry the venture on.
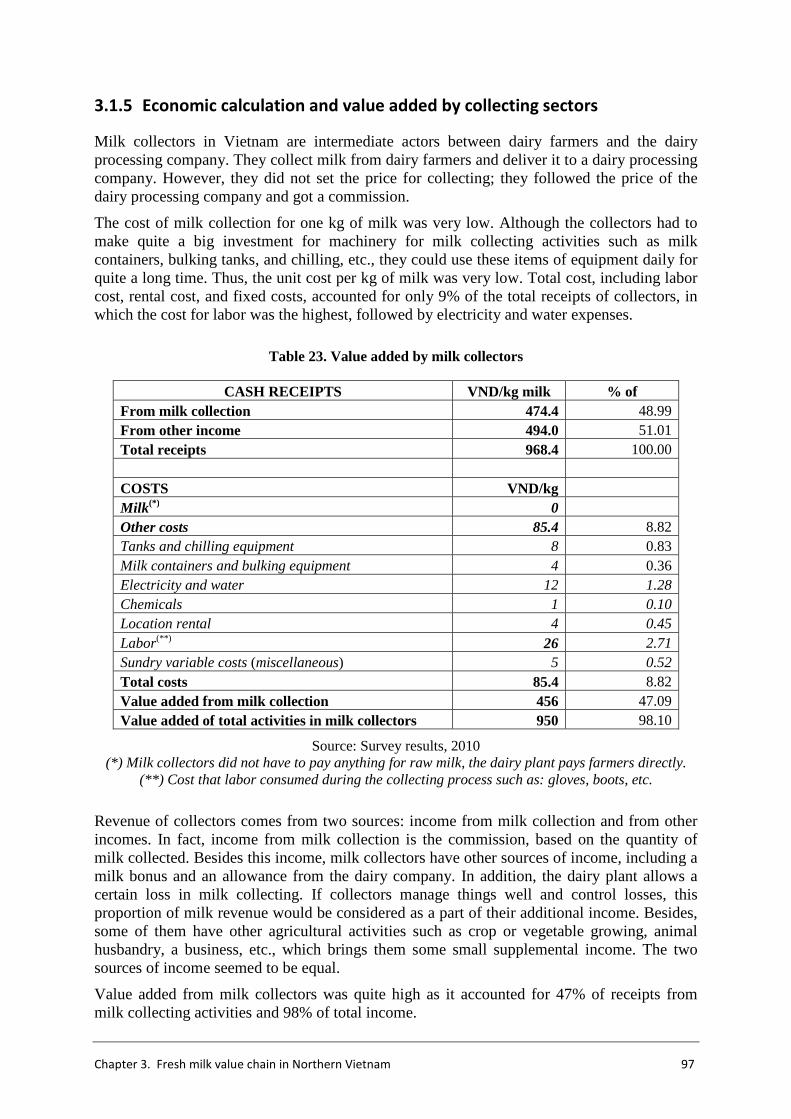
Chapter 3. Fresh milk value chain in Northern Vietnam 97
3.1.5 Economic calculation and value added by collecting sectors
Milk collectors in Vietnam are intermediate actors between dairy farmers and the dairy processing company. They collect milk from dairy farmers and deliver it to a dairy processing company. However, they did not set the price for collecting; they followed the price of the dairy processing company and got a commission.
The cost of milk collection for one kg of milk was very low. Although the collectors had to make quite a big investment for machinery for milk collecting activities such as milk containers, bulking tanks, and chilling, etc., they could use these items of equipment daily for quite a long time. Thus, the unit cost per kg of milk was very low. Total cost, including labor cost, rental cost, and fixed costs, accounted for only 9% of the total receipts of collectors, in which the cost for labor was the highest, followed by electricity and water expenses.
Table 23. Value added by milk collectors
CASH RECEIPTS VND/kg milk % of From milk collection 474.4 48.99 From other income 494.0 51.01 Total receipts 968.4 100.00 COSTS VND/kg Milk (*) 0 Other costs 85.4 8.82 Tanks and chilling equipment 8 0.83 Milk containers and bulking equipment 4 0.36 Electricity and water 12 1.28 Chemicals 1 0.10 Location rental 4 0.45 Labor(**) 26 2.71 Sundry variable costs (miscellaneous) 5 0.52 Total costs 85.4 8.82 Value added from milk collection 456 47.09 Value added of total activities in milk collectors 950 98.10
Source: Survey results, 2010 (*) Milk collectors did not have to pay anything for raw milk, the dairy plant pays farmers directly.
(**) Cost that labor consumed during the collecting process such as: gloves, boots, etc.
Revenue of collectors comes from two sources: income from milk collection and from other incomes. In fact, income from milk collection is the commission, based on the quantity of milk collected. Besides this income, milk collectors have other sources of income, including a milk bonus and an allowance from the dairy company. In addition, the dairy plant allows a certain loss in milk collecting. If collectors manage things well and control losses, this proportion of milk revenue would be considered as a part of their additional income. Besides, some of them have other agricultural activities such as crop or vegetable growing, animal husbandry, a business, etc., which brings them some small supplemental income. The two sources of income seemed to be equal.
Value added from milk collectors was quite high as it accounted for 47% of receipts from milk collecting activities and 98% of total income.
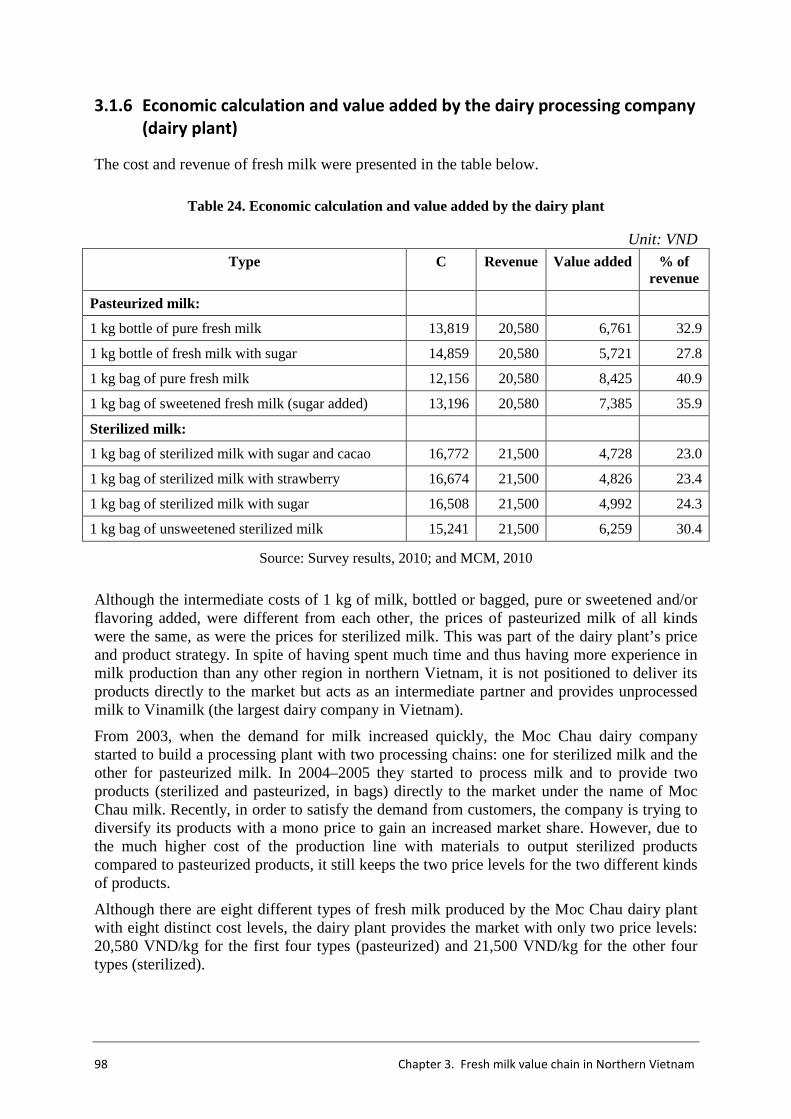
98 Chapter 3. Fresh milk value chain in Northern Vietnam
3.1.6 Economic calculation and value added by the dairy processing company
(dairy plant)
The cost and revenue of fresh milk were presented in the table below.
Table 24. Economic calculation and value added by the dairy plant
Unit: VND
Type C Revenue Value added % of revenue
Pasteurized milk:
1 kg bottle of pure fresh milk 13,819 20,580 6,761 32.9
1 kg bottle of fresh milk with sugar 14,859 20,580 5,721 27.8
1 kg bag of pure fresh milk 12,156 20,580 8,425 40.9
1 kg bag of sweetened fresh milk (sugar added) 13,196 20,580 7,385 35.9
Sterilized milk:
1 kg bag of sterilized milk with sugar and cacao 16,772 21,500 4,728 23.0
1 kg bag of sterilized milk with strawberry 16,674 21,500 4,826 23.4
1 kg bag of sterilized milk with sugar 16,508 21,500 4,992 24.3
1 kg bag of unsweetened sterilized milk 15,241 21,500 6,259 30.4
Source: Survey results, 2010; and MCM, 2010
Although the intermediate costs of 1 kg of milk, bottled or bagged, pure or sweetened and/or flavoring added, were different from each other, the prices of pasteurized milk of all kinds were the same, as were the prices for sterilized milk. This was part of the dairy plant’s price and product strategy. In spite of having spent much time and thus having more experience in milk production than any other region in northern Vietnam, it is not positioned to deliver its products directly to the market but acts as an intermediate partner and provides unprocessed milk to Vinamilk (the largest dairy company in Vietnam).
From 2003, when the demand for milk increased quickly, the Moc Chau dairy company started to build a processing plant with two processing chains: one for sterilized milk and the other for pasteurized milk. In 2004–2005 they started to process milk and to provide two products (sterilized and pasteurized, in bags) directly to the market under the name of Moc Chau milk. Recently, in order to satisfy the demand from customers, the company is trying to diversify its products with a mono price to gain an increased market share. However, due to the much higher cost of the production line with materials to output sterilized products compared to pasteurized products, it still keeps the two price levels for the two different kinds of products.
Although there are eight different types of fresh milk produced by the Moc Chau dairy plant with eight distinct cost levels, the dairy plant provides the market with only two price levels: 20,580 VND/kg for the first four types (pasteurized) and 21,500 VND/kg for the other four types (sterilized).
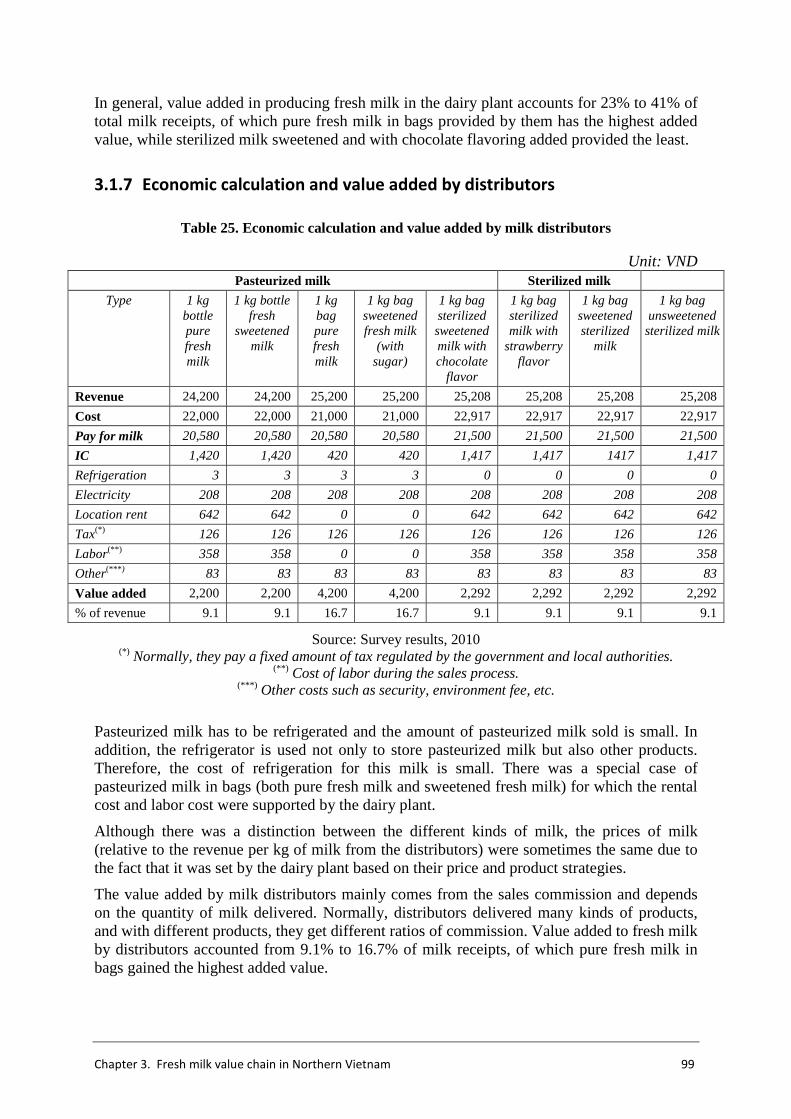
Chapter 3. Fresh milk value chain in Northern Vietnam 99
In general, value added in producing fresh milk in the dairy plant accounts for 23% to 41% of total milk receipts, of which pure fresh milk in bags provided by them has the highest added value, while sterilized milk sweetened and with chocolate flavoring added provided the least.
3.1.7 Economic calculation and value added by distributors
Table 25. Economic calculation and value added by milk distributors
Unit: VND Pasteurized milk Sterilized milk
Type 1 kg bottle pure fresh milk
1 kg bottle fresh
sweetened milk
1 kg bag pure fresh milk
1 kg bag sweetened fresh milk
(with sugar)
1 kg bag sterilized sweetened milk with chocolate
flavor
1 kg bag sterilized milk with
strawberry flavor
1 kg bag sweetened sterilized
milk
1 kg bag unsweetened sterilized milk
Revenue 24,200 24,200 25,200 25,200 25,208 25,208 25,208 25,208
Cost 22,000 22,000 21,000 21,000 22,917 22,917 22,917 22,917
Pay for milk 20,580 20,580 20,580 20,580 21,500 21,500 21,500 21,500
IC 1,420 1,420 420 420 1,417 1,417 1417 1,417
Refrigeration 3 3 3 3 0 0 0 0
Electricity 208 208 208 208 208 208 208 208
Location rent 642 642 0 0 642 642 642 642
Tax(*) 126 126 126 126 126 126 126 126
Labor(**) 358 358 0 0 358 358 358 358
Other(*** ) 83 83 83 83 83 83 83 83
Value added 2,200 2,200 4,200 4,200 2,292 2,292 2,292 2,292
% of revenue 9.1 9.1 16.7 16.7 9.1 9.1 9.1 9.1
Source: Survey results, 2010 (*) Normally, they pay a fixed amount of tax regulated by the government and local authorities.
(**) Cost of labor during the sales process. (***) Other costs such as security, environment fee, etc.
Pasteurized milk has to be refrigerated and the amount of pasteurized milk sold is small. In addition, the refrigerator is used not only to store pasteurized milk but also other products. Therefore, the cost of refrigeration for this milk is small. There was a special case of pasteurized milk in bags (both pure fresh milk and sweetened fresh milk) for which the rental cost and labor cost were supported by the dairy plant.
Although there was a distinction between the different kinds of milk, the prices of milk (relative to the revenue per kg of milk from the distributors) were sometimes the same due to the fact that it was set by the dairy plant based on their price and product strategies.
The value added by milk distributors mainly comes from the sales commission and depends on the quantity of milk delivered. Normally, distributors delivered many kinds of products, and with different products, they get different ratios of commission. Value added to fresh milk by distributors accounted from 9.1% to 16.7% of milk receipts, of which pure fresh milk in bags gained the highest added value.
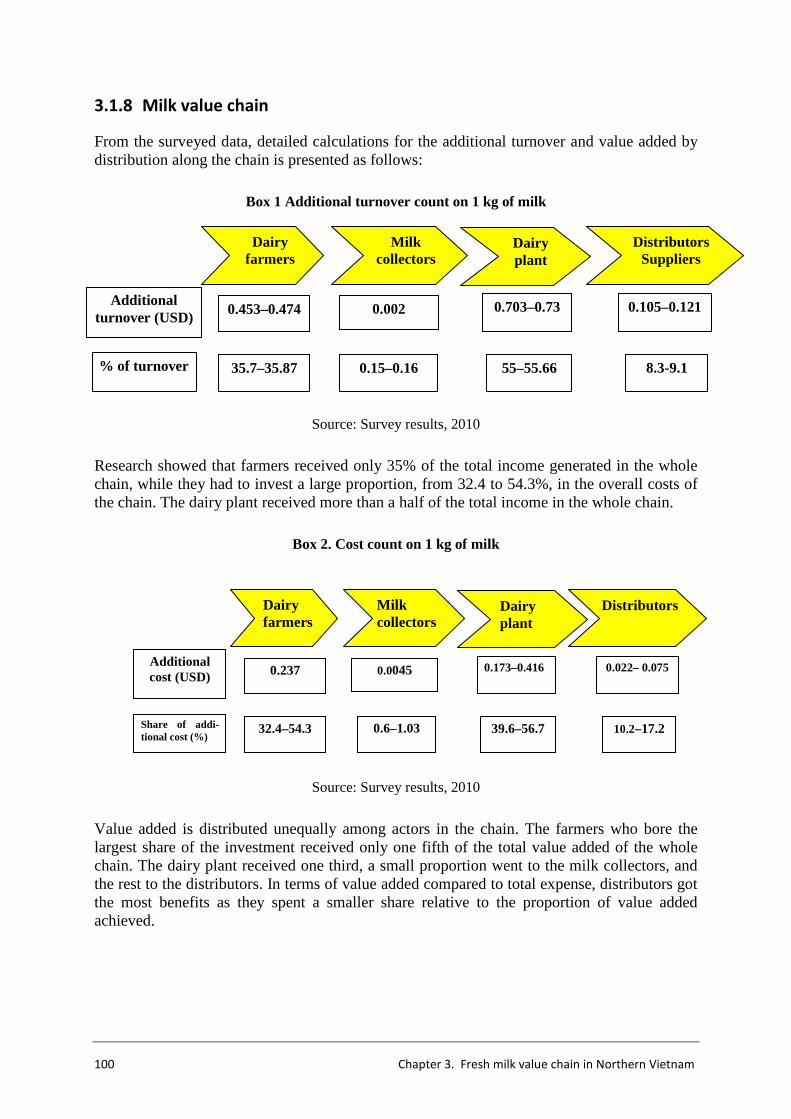
100 Chapter 3. Fresh milk value chain in Northern Vietnam
3.1.8 Milk value chain
From the surveyed data, detailed calculations for the additional turnover and value added by distribution along the chain is presented as follows:
Box 1 Additional turnover count on 1 kg of milk
Source: Survey results, 2010
Research showed that farmers received only 35% of the total income generated in the whole chain, while they had to invest a large proportion, from 32.4 to 54.3%, in the overall costs of the chain. The dairy plant received more than a half of the total income in the whole chain.
Box 2. Cost count on 1 kg of milk
Source: Survey results, 2010
Value added is distributed unequally among actors in the chain. The farmers who bore the largest share of the investment received only one fifth of the total value added of the whole chain. The dairy plant received one third, a small proportion went to the milk collectors, and the rest to the distributors. In terms of value added compared to total expense, distributors got the most benefits as they spent a smaller share relative to the proportion of value added achieved.
Dairy farmers
Milk collectors
Dairy plant
Distributors Suppliers
Additional turnover (USD) 0.453–0.474 0.105–0.121 0.002 0.703–0.73
8.3-9.1 0.15–0.16 55–55.66 35.7–35.87 % of turnover
Dairy farmers
Milk collectors
Dairy plant
Distributors
Additional cost (USD) 0.237 0.022– 0.075 0.0045 0.173–0.416
10.2–17.2 0.6–1.03 39.6–56.7 32.4–54.3 Share of addi-tional cost (%)
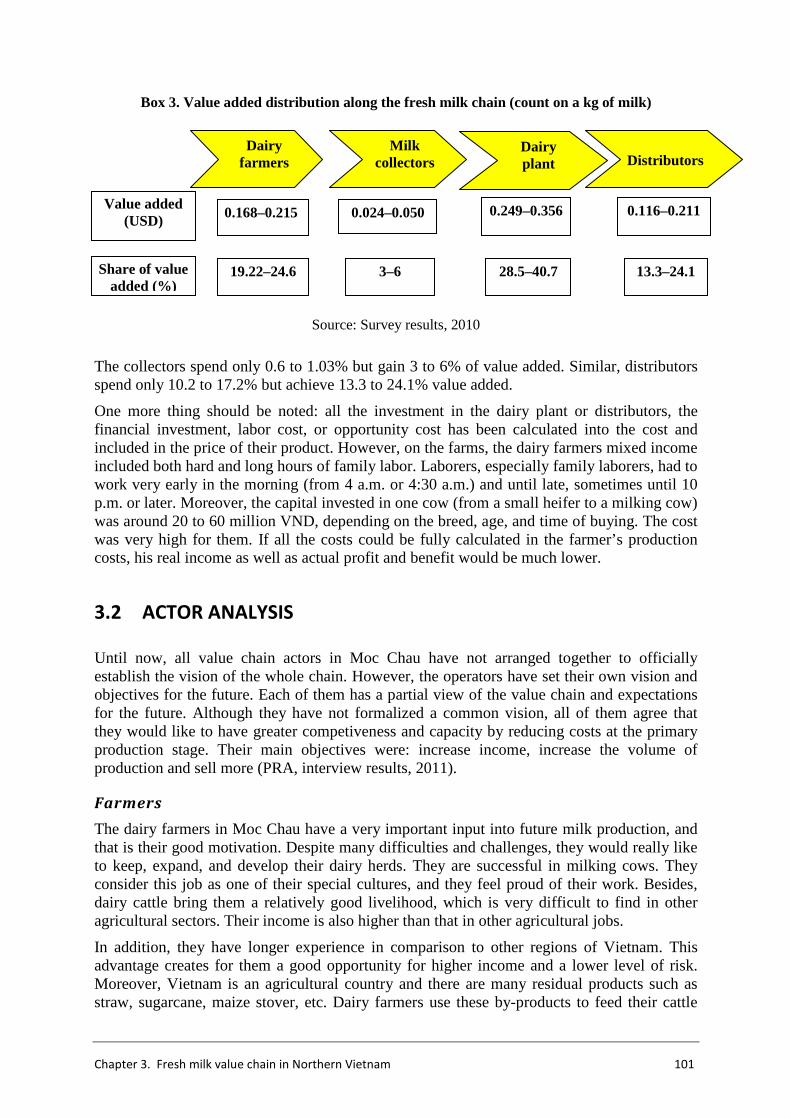
Chapter 3. Fresh milk value chain in Northern Vietnam 101
Box 3. Value added distribution along the fresh milk chain (count on a kg of milk)
Source: Survey results, 2010
The collectors spend only 0.6 to 1.03% but gain 3 to 6% of value added. Similar, distributors spend only 10.2 to 17.2% but achieve 13.3 to 24.1% value added.
One more thing should be noted: all the investment in the dairy plant or distributors, the financial investment, labor cost, or opportunity cost has been calculated into the cost and included in the price of their product. However, on the farms, the dairy farmers mixed income included both hard and long hours of family labor. Laborers, especially family laborers, had to work very early in the morning (from 4 a.m. or 4:30 a.m.) and until late, sometimes until 10 p.m. or later. Moreover, the capital invested in one cow (from a small heifer to a milking cow) was around 20 to 60 million VND, depending on the breed, age, and time of buying. The cost was very high for them. If all the costs could be fully calculated in the farmer’s production costs, his real income as well as actual profit and benefit would be much lower.
3.2 ACTOR ANALYSIS
Until now, all value chain actors in Moc Chau have not arranged together to officially establish the vision of the whole chain. However, the operators have set their own vision and objectives for the future. Each of them has a partial view of the value chain and expectations for the future. Although they have not formalized a common vision, all of them agree that they would like to have greater competiveness and capacity by reducing costs at the primary production stage. Their main objectives were: increase income, increase the volume of production and sell more (PRA, interview results, 2011).
Farmers
The dairy farmers in Moc Chau have a very important input into future milk production, and that is their good motivation. Despite many difficulties and challenges, they would really like to keep, expand, and develop their dairy herds. They are successful in milking cows. They consider this job as one of their special cultures, and they feel proud of their work. Besides, dairy cattle bring them a relatively good livelihood, which is very difficult to find in other agricultural sectors. Their income is also higher than that in other agricultural jobs.
In addition, they have longer experience in comparison to other regions of Vietnam. This advantage creates for them a good opportunity for higher income and a lower level of risk. Moreover, Vietnam is an agricultural country and there are many residual products such as straw, sugarcane, maize stover, etc. Dairy farmers use these by-products to feed their cattle
Dairy farmers
Milk collectors
Dairy plant
Distributors
Value added (USD) 0.168–0.215 0.116–0.211 0.024–0.050 0.249–0.356
13.3–24.1 3–6 28.5–40.7 19.22–24.6 Share of value added (%)
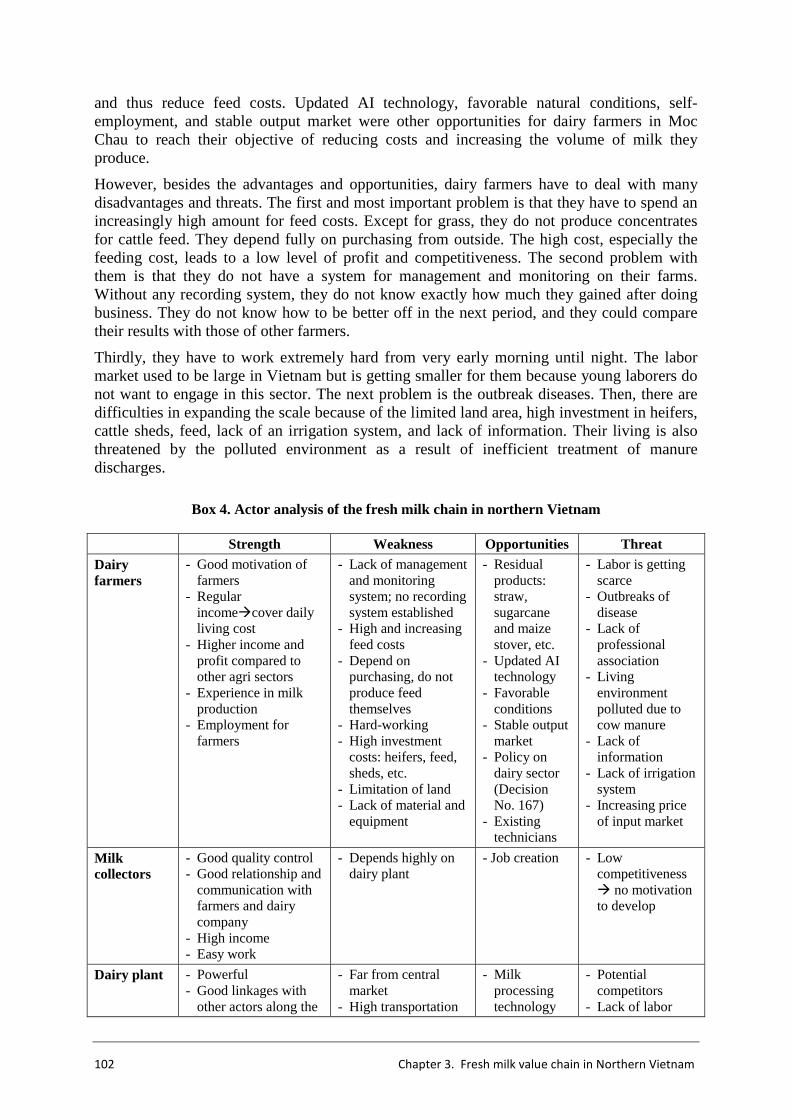
102 Chapter 3. Fresh milk value chain in Northern Vietnam
and thus reduce feed costs. Updated AI technology, favorable natural conditions, self-employment, and stable output market were other opportunities for dairy farmers in Moc Chau to reach their objective of reducing costs and increasing the volume of milk they produce.
However, besides the advantages and opportunities, dairy farmers have to deal with many disadvantages and threats. The first and most important problem is that they have to spend an increasingly high amount for feed costs. Except for grass, they do not produce concentrates for cattle feed. They depend fully on purchasing from outside. The high cost, especially the feeding cost, leads to a low level of profit and competitiveness. The second problem with them is that they do not have a system for management and monitoring on their farms. Without any recording system, they do not know exactly how much they gained after doing business. They do not know how to be better off in the next period, and they could compare their results with those of other farmers.
Thirdly, they have to work extremely hard from very early morning until night. The labor market used to be large in Vietnam but is getting smaller for them because young laborers do not want to engage in this sector. The next problem is the outbreak diseases. Then, there are difficulties in expanding the scale because of the limited land area, high investment in heifers, cattle sheds, feed, lack of an irrigation system, and lack of information. Their living is also threatened by the polluted environment as a result of inefficient treatment of manure discharges.
Box 4. Actor analysis of the fresh milk chain in northern Vietnam
Strength Weakness Opportunities Threat
Dairy farmers
- Good motivation of farmers
- Regular income�cover daily living cost
- Higher income and profit compared to other agri sectors
- Experience in milk production
- Employment for farmers
- Lack of management and monitoring system; no recording system established
- High and increasing feed costs
- Depend on purchasing, do not produce feed themselves
- Hard-working - High investment
costs: heifers, feed, sheds, etc.
- Limitation of land - Lack of material and
equipment
- Residual products: straw, sugarcane and maize stover, etc.
- Updated AI technology
- Favorable conditions
- Stable output market
- Policy on dairy sector (Decision No. 167)
- Existing technicians
- Labor is getting scarce
- Outbreaks of disease
- Lack of professional association
- Living environment polluted due to cow manure
- Lack of information
- Lack of irrigation system
- Increasing price of input market
Milk collectors
- Good quality control - Good relationship and
communication with farmers and dairy company
- High income - Easy work
- Depends highly on dairy plant
- Job creation - Low competitiveness� no motivation to develop
Dairy plant - Powerful - Good linkages with
other actors along the
- Far from central market
- High transportation
- Milk processing technology
- Potential competitors
- Lack of labor
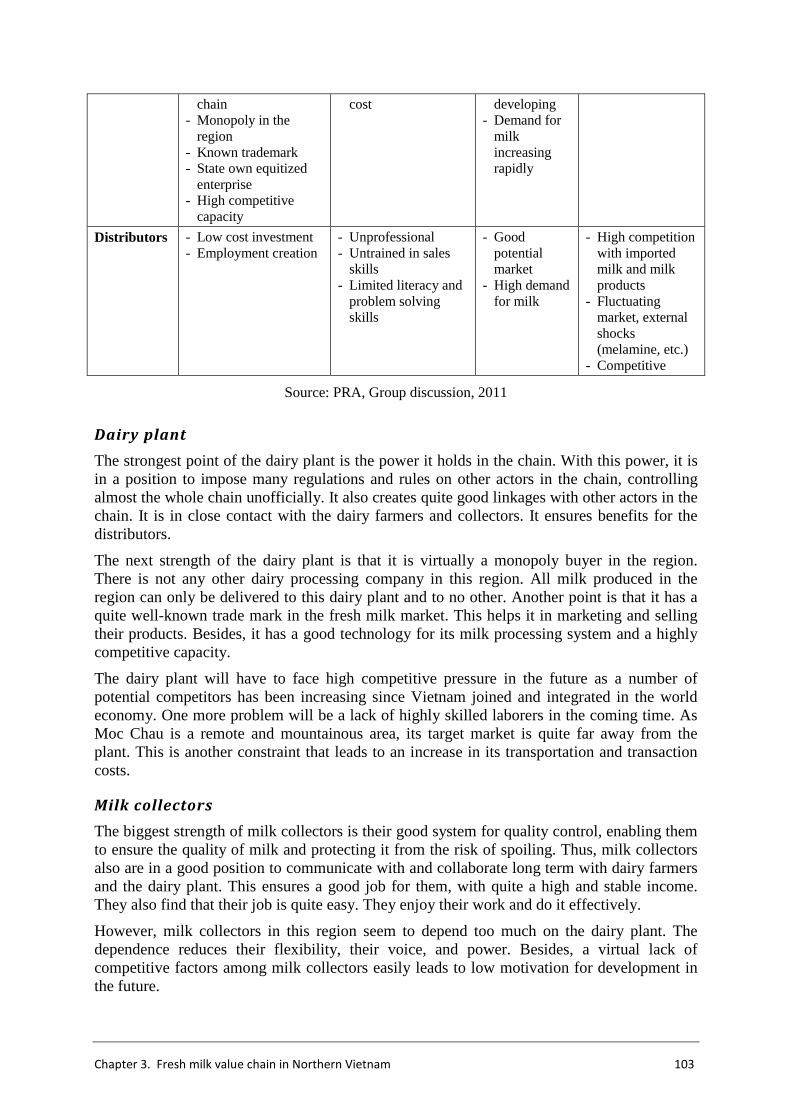
Chapter 3. Fresh milk value chain in Northern Vietnam 103
chain - Monopoly in the
region - Known trademark - State own equitized
enterprise - High competitive
capacity
cost developing - Demand for
milk increasing rapidly
Distributors - Low cost investment - Employment creation
- Unprofessional - Untrained in sales
skills - Limited literacy and
problem solving skills
- Good potential market
- High demand for milk
- High competition with imported milk and milk products
- Fluctuating market, external shocks (melamine, etc.)
- Competitive
Source: PRA, Group discussion, 2011
Dairy plant
The strongest point of the dairy plant is the power it holds in the chain. With this power, it is in a position to impose many regulations and rules on other actors in the chain, controlling almost the whole chain unofficially. It also creates quite good linkages with other actors in the chain. It is in close contact with the dairy farmers and collectors. It ensures benefits for the distributors.
The next strength of the dairy plant is that it is virtually a monopoly buyer in the region. There is not any other dairy processing company in this region. All milk produced in the region can only be delivered to this dairy plant and to no other. Another point is that it has a quite well-known trade mark in the fresh milk market. This helps it in marketing and selling their products. Besides, it has a good technology for its milk processing system and a highly competitive capacity.
The dairy plant will have to face high competitive pressure in the future as a number of potential competitors has been increasing since Vietnam joined and integrated in the world economy. One more problem will be a lack of highly skilled laborers in the coming time. As Moc Chau is a remote and mountainous area, its target market is quite far away from the plant. This is another constraint that leads to an increase in its transportation and transaction costs.
Milk collectors
The biggest strength of milk collectors is their good system for quality control, enabling them to ensure the quality of milk and protecting it from the risk of spoiling. Thus, milk collectors also are in a good position to communicate with and collaborate long term with dairy farmers and the dairy plant. This ensures a good job for them, with quite a high and stable income. They also find that their job is quite easy. They enjoy their work and do it effectively.
However, milk collectors in this region seem to depend too much on the dairy plant. The dependence reduces their flexibility, their voice, and power. Besides, a virtual lack of competitive factors among milk collectors easily leads to low motivation for development in the future.
104 Chapter 3. Fresh milk value chain in Northern Vietnam
Milk distributors
Milk distributors had a large and expanding potential market, as many new markets are coming on the scene. In the past, fresh milk could only be consumed in the city, or town. However, nowadays, markets have expanded considerably: delta and mountainous region, highlands and lowlands, urban and rural areas. Customers have emerged in remote areas where there had not previously been a habit of drinking milk. In parallel with the higher living standard, the demand for fresh milk is increasing in Vietnam nowadays. Thus, it is getting easier for distributors to succeed in the market. Another advantage for milk distributors is that their cost for distributing milk is very low. They do not have to invest much, but still earn a good income.
The biggest challenge to the development of fresh milk distributors is the high competitive pressure in the market. They have to compete with their current competitors and future competitors. Their products (bearing the Moc Chau milk label) have to compete with other milk products, other milk substitute products, and imported milk products. In addition, the milk market in Vietnam is subject to high fluctuation and is vulnerable to external shocks such as occurred with the melamine scandal.
3.3 DISCUSSION
From the analysis of the situation in the study area, it is recognized that:
- The key feature in the chain is the dairy farmers. They are the starting point of the whole chain. They are the condition for the existence of other actors in the chain. Because they exist, the other actors exist. If their production was stagnant, the whole chain would be stagnant. Thus, the promotion strategy should pay attention to the dairy farmers.
- The dairy farmers are the most vulnerable actors of the chain as well as being subject to the greatest difficulties. They face higher risks than other actors in the chain. Therefore, it is necessary to improve their benefits and welfare.
- The biggest weakness of the dairy farmers that needs attention is their high and growing costs, especially for feed. Reducing production costs at the farm level is very significant to improve the income and value added for the farmers and for the whole chain. If their costs are high, the cost of the entire chain is high, and competitiveness suffers. Reducing their costs would generate higher profit and improve the efficiency for the whole chain.
- There were many methods to help dairy farmers improve their performance such as: improve the linkages among actors in the chain, improve the facilitation of NGOs, get more support from the Vietnamese government, and improve on-farm management and monitoring.
- The most suitable method to promote value added for dairy farmers is to help them to monitor and manage their farms better. If they monitor and manage their farms better, they would use their budget better, their resources would be used efficiently, costs would be reduced and profit would be higher. Moreover, if they knew how to manage their farms better, they would know how, where, and when to make the best investment of their money.
Thus, in order to promote the fresh milk chain, the most suitable area to intervene is at the primary milk production level or the dairy farmers. The main action would be to focus on monitoring and managing on the dairy farms. Therefore, this research looks mainly at facilitating and improving the capacity of monitoring and management for dairy farmers.
PART 2
METHODOLOGY FOR THE APPLICATION OF A COST-MONITORING
SYSTEM AND MANAGEMENT OF DAIRY FARMS IN VIETNAM

CHAPTER 4
MONITORING SYSTEM AND MANAGEMENT OF DAIRY
FARMS AROUND THE WORLD, FOCUSING
ON THE WALLOON REGION OF BELGIUM
This chapter consists of two main parts: (i) theories of monitoring system in farms introducing monitoring and farm management, i.e. management of dairy farms and monitoring dairy farms; (ii) and experience of monitoring and management around the world, especially in the Walloon region and experience for Vietnamese dairy farmers.
4.1 MONITORING SYSTEM AND MANAGEMENT OF DAIRY FARMS
4.1.1 Management and farm management
Management
This concept is considered as the act of gathering people to attain desired goals and objectives by using available resources efficiently and effectively. In other words, it embraces the attempts to achieve the group’s purposes with the least expenditure of material or human resources (Koontz 1969).145 It is the efficient integration and coordination of resources to achieve desired objectives (Hitt et al., 1989).146 It ensures that the organization serves its mission in a productive way, and also that it serves the needs of those who control or otherwise have power over the organization (Mintzberg 1983).147 It is the art of getting things done through other people (Hellriegel and Slocum 1986).148
Successful management is considered as entailing both efficiency in resource use and effectiveness in the achievement of goals. It is seen as a universal process that includes four main functions: planning, organizing, leading (or directing), and controlling an organization. It plays an important role in the existence and development of every organization. Relative to its stakeholders, the management has three sets of duties (Mintzberg 1983)149: (i) direct supervision and running of the organization; (ii) management of the organization’s boundary conditions; and (iii) developing the organization’s strategy. Good management needs technical, interpersonal, conceptual, and diagnostic skills (Hellriegel and Slocum 1986).150
There are four major approaches to management: The traditional approach emphasizing order, stability, and routine procedures; the behavioral approach concentrating on knowledge about how people behave and why they act as they do; the systems approach referring to interrelatedness within the organization; and the contingency approach recognizing that there
145
P145 146
P13 147
P13 148
P8 149
P13 150
P22–25
108 Chapter 4. Monitoring system and management of dairy farms
around the world, focusing on the Walloon region of Belgium
is no best way of managing for all situations (Hellriegel and Slocum 1986151; Kast and Rosenzweig 1974; Koontz 1976).
Farm management
Basing on the general management background, farm management refers to the way of organizing the production factors on the farm – land, labor, and capital – to yield the largest net return (Butterfield 1910).152 It is considered as a subdivision of economics and helps householders to decide how to allocate efficiently their limited resources (Heady and Jensen 1954).153 It concentrates on the decision-making process of farmers to evaluate and choose between alternative strategies. It focusses more on adjustments of suitability and profitability, and explores new situations and opportunities for maximization of income to satisfy other goals of a farmer.
There are two major theories of farm management (Kast and Rosenzweig 1974). The first one, the farm system theory, conceptualizes the farm as a purposeful system and concentrates on ways of generating income for farmers through agricultural production. According to this theory, the farm has many boundaries or interfaces that need to be supervised: the boundary of land management or farm-system interfaces with input suppliers, credit agencies, the local community, government agencies, etc. A farm system is also considered to involve subsystems (Kast and Rosenzweig 1974),154 as follows:
- The technical subsystem whereby resources, technology, knowledge, and opportunity are used to produce agricultural products;
- The organizational structural subsystem which corresponds to the formal structure of authority, communication, job descriptions, responsibilities, and task allocation within the farm system;
- The informal structural subsystem which exists in any farm system involving two or more persons;
- The goals and values subsystem relates to those goals and values held by the farm system as a purposeful organization;
- The managerial subsystem which relates to the entire farm system through the farm manager’s activity of setting goals, developing long- and short-term plans.
The second theory refers to management by objectives, which involves the managerial functions of planning, organizing, and controlling the operation within the farm system over time through the use of economic and other principles and administrative procedures (Nix, 1979).
The applicability of management by objectives to various levels for the farm system’s goal hierarchy necessarily implies its applicability across different time spans, e.g. to short-, medium- and long-term objectives. The longer the term is, however, the greater the uncertainty, and the greater the need for management by objectives and the more difficult its successful application.
This theory aims at maximizing financial profit within the relevant constraints as present in the traditional theoretical approach to commercial farm management. The farmer needs to adjust his farm organization from year to year to keep tract of changes in methods, price
151
P25–29 152
P3 153
P6 154
P111–113
Chapter 4. Monitoring system and management of dairy farms
around the world, focusing on the Walloon region of Belgium 109
variability, and resources. Thus, farm management is the science dealing with the analysis of the farming resources, alternatives, choices, and opportunities within the framework of resource restrictions, the social and personal constraints of the farming business. This complex information is integrated and synthesized to increase the profitability of the farming business, the ultimate aim being to raise the standard of living of the farming people. It concerns the goals and objectives of the individual farmer, other than income maximization.
Farm management is a decision-making science. It helps to determine the fundamental course of action of the farming business. The basic decisions about the farming business are:
1) What goods to produce or what combination of different enterprises to follow?
2) How much to produce and what is the most profitable level of production?
3) What should be the size of an individual enterprise, which, in turn, will determine the best overall size of the farm business?
4) What methods of production (production practices or what type of quality of inputs and their combination) should be used?
5) What and where to market?
4.1.2 Management of dairy farms
Dairy farm management is economics within the context of the fundamental definition of economics in dairy farms, which involves three elements: the scarcity of resources, their alternative uses, and the objective of profit maximization. It focuses mainly on decision-making on the farm. It is deals with making rational, profitable and economic recommendations to farmers. It also pays attention to the growth and stability aspects of economics. Good farm management helps to increase productivity and effectiveness of farm resources and can avail itself of the technological revolution now going on in our agriculture.
The management of dairy farms is a process of supervising and handling the day-to-day routine of a farm. It refers to the distribution of farm resources such as labor and irrigation water for daily operations. It not only concerns itself with yield, but also deals with the increase of farm income. As a business, farming requires the application of business methods and effective management. To be a skillful manager, one must keep oneself abreast of developments in modern technology, new practices, price trends, and economic outlook.
As farming becomes more complex with considerations such as price volatility and consumer perception affecting the farm businesses, there are more factors involved in making the right decision. How does the farmer manage his business to increase productivity? Successful management is a crucial part of dairy farming.
Dairy management keeps track of how the farm is progressing in terms of expenditure, resource use, and implementation of activities, delivery of results, and management of risks. This is achieved through monitoring. Monitoring is an internal management responsibility.
4.1.3 Monitoring system of dairy farms
The objectives of monitoring on dairy farms are to provide updated information on the status and results of various operations, processes, and transactions. It is used to make decisions, find out problems, and reposition organizations to take full advantage of emerging opportunities.
110 Chapter 4. Monitoring system and management of dairy farms
around the world, focusing on the Walloon region of Belgium
Monitoring of dairy farms comprises the systematic and continuous collection, analysis, and use of management information to support effective decision-making. It provides information on quantities of feed bought, the price of feed, the amount of reserve, veterinary costs, types and cost of AI, etc., from which problems in its operation can be identified and corrected.
Monitoring also involves the analysis of data both from within and outside the farm to ensure that the farmer’s objectives are achieved, opportunities taken advantage of, and problems speedily corrected. The monitoring information can be useful for improving his production processes. The degree of monitoring depends on what information the farmer wants to evaluate and analyze and how he wants it to be monitored, in real-time, near real-time, or ad hoc. The main questions that monitoring should have to answer are:
- What information needs to be collected? For example, the information can normally be cash, stock and sales, budget items, expenditures, and the like.
- Is it important? Why? Maybe it is important as it provides the key performance indicators for the farmer to invest more or not, or to manage risk and profitability within the farm.
- How often is it required? Is it frequent, daily or weekly, or is it intermittent monthly, planning over three to six months or annually, crisis information (when boundary conditions are breached and the contingency plan is initiated), and information required during random inspection? Random inspection information focusing on likely failure points in the farms is also required.
- Who is responsible for collection of data and quality control? Is the information timely, accurate, comprehensive, and coherent?
- Who uses it? Many stakeholders would like to use the data, for example, the farmers, milk collectors, milk processors, etc., and consumers as well.
The monitoring system may generate action and implementation decisions. As it is both inward and outward looking, incorporating benchmarks for all key performance indicators and the overall farm balanced scorecard, it may be used by many actors to make decisions. When the farmer wants to invest more in his farm, it is important that the monitoring system goes ahead. Its effectiveness is to provide accurate information at the precise time to help the farmer to predict what will happen and how to take advantage of the market opportunities. A monitoring system will be established through timescale, group review, and data analysis to help farms measure and redirect resources.
4.2 EXPERIENCE OF MONITORING AND MANAGEMENT OF DAIRY
FARMS AROUND THE WORLD, FOCUSING ON THE WALLOON
REGION
4.2.1 Experience of monitoring dairy farms in European countries
The Farm Accountancy Data Network (FADN155) is a European system that aims to monitor the income and business activities of agricultural holdings and to evaluate the impacts of the Common Agricultural Policy (CAP). It takes surveys each year and collects structural and accountancy data relating to sample farms. The samples are only those farms exceeding a minimum economic size, cover the most relevant part of the agricultural activity of each EU
155
The FADN is the only harmonized source of microeconomic data, which means that the accounting principles are the same in all EU
Member States. See more at http://ec.europa.eu/agriculture/rica/index.cfm
Chapter 4. Monitoring system and management of dairy farms
around the world, focusing on the Walloon region of Belgium 111
Member State, i.e. at least 90% of the Standard Gross Margin156 and 90% of Utilized Agricultural Area covered in the Farm Structure Survey (FSS, Eurostat), along with representative data in three dimensions: region, economic size, and type of farming. For 2007, it covered approximately 78,000 holdings in the EU-27, which represent 5.4 million farms (39 %) out of a total of some 14 million farms included in the FSS (EU, FADN, 2012).
The FADN database comprises mainly information about output and subsidies per product. They also collect costs in farms as a whole because it is difficult for the accountant or the farmer to assess the proportion of overhead costs on the farm, especially for mixed farms. The EU FADN unit has built several models to estimate costs and margins for the different products: arable crops, milk and beef, and permanent crops. These models allocate farm costs to a particular product using different ratios.
Allocation of costs
• Operating costs: o Specific costs consist of: purchased concentrates, purchased coarse fodder, farm use of
non-fodder crops, specific forage costs, milk herd renewal costs, the milk levy, and other specific livestock costs (veterinary, etc.).
o Non-specific costs: upkeep of machinery and buildings, power (fuel and electricity), contract work, taxes and other dues (excluding the milk levy), taxes on land and buildings, insurance for farm buildings and other direct costs (including water as regards the model for milk).
• Depreciation;
• External factors: i.e. wages, rent, and interest;
• Imputed family factors, which cover: family labor cost and own capital cost (own land cost + estimated cost for own capital except land – interest paid).
Ratios are used to allocate a share of the farm costs to milk production:
• The dairy livestock unit157 as a proportion of grazing livestock units is used to allocate grazing livestock feed costs;
• The dairy livestock unit as a proportion of total livestock units is used to allocate other livestock specific costs;
• Milk output and subsidies as a proportion of total output158 plus linked subsidies is used to allocate non-specific inputs and fixed costs. Subsidies are taken into account to enable the results to be compared over time since, from 2004 onwards; a part of the milk support that was previously included within the price has been allocated via a direct payment. Moreover, this makes it possible to distinguish and to take better account of the co-existence of beef production on farms where costs of milk production are estimated (increasing the importance of direct aid support compared to market price support in beef production). The total output is also adjusted by deducting the value of home grown fodder recorded in FADN and adding the purchase costs for milk herd renewal.
156
The Standard Gross Margin (SGM) is the difference between the standardized monetary value of gross production and the
standardized monetary value of certain special costs. This difference is calculated for the various crop and animal characteristics (per
hectare or per animal), at the level of the survey district for each Member State and given in euros. By multiplying the areas or the
number of animals by the corresponding SGM and then adding the products together, the total SGM of the holding is obtained. By
adding the total SGM of all holdings of a Member State, the total Member State SGM is obtained. The concept of SGM is used for 5
Farm Structure Survey (FSS, EUROSTAT). 157
Dairy livestock units are defined as dairy cows and a share of total breeding heifers and young females. This share is equal to dairy
cows as a proportion of the total number of cows (dairy cows, cull dairy cows, and other cows). (EU, FADN, 2012) 158
Output after deduction of forage crops farm use, (EU, FADN, 2012)
112 Chapter 4. Monitoring system and management of dairy farms
around the world, focusing on the Walloon region of Belgium
The milk levy is fully allocated to the costs of milk production because it is directly linked to the milk production. Because it is difficult to estimate production and the value of forage, fodder production used at the farm is treated as follows for the model:
• The value from the farm use of non-fodder plants (e.g. barley, rye, etc.) is reckoned as crops used for feed, but the farm use value of all crops used as forage (fodder roots, other fodder plants such as silage of cereals, temporary grass, meadows and pastures and rough grazing) is excluded.
• The value of fodder plants produced at the farm is estimated upon the basis of the specific costs of the crops (e.g. seeds, fertilizers, crop protection). Specific costs are allocated to fodder production according to a ratio (fodder on total area), although some forage crops do not benefit from all inputs (e.g. there is no crop protection for temporary grass).
• The home grown fodder value is deducted from total output because it is included in the farm total output.
The milk herd renewal purchases cost was introduced in 2008 to take directly into account the cost of purchases of young female bovines to be used for milk production. This cost is calculated by multiplying the farm purchases of female cattle from 12 to 24 months and of breeding heifers by the ratio of dairy cows over the total dairy cows plus suckle cows.159 However, the value of sales of cull dairy cows cannot be deducted because of the scarcity of information; it is considered as a meat by-product. The value of calves is not taken into account in revenues. A correction is made for total output to avoid double counting of these costs. The total output already deducts all purchases of animals, so the calculated milk herd renewal costs is added back into the total output used for the allocation ratio milk output over total output ration.
Depreciation of the milk quota is entered into the FADN table.160 The cost of buying or renting a milk quota is covered (where it is not self-financed) by interest and rent paid.
The following FADN cost items have been included in the 2008 revision to the model:
- Taxes and other dues (excluding the milk levy) (part of farming overheads, nonspecific costs);
- Insurance on farm buildings (part of farming overheads, non-specific costs); - Taxes on land and buildings (part of farming overheads, non-specific costs).
The estimation of imputed unpaid family factors has also been included in the margin and income calculation.
Revenues from milk consist of:
• The value of sales of milk and milk products;
• EU dairy payments;161
• Any national dairy payments.
This means that the value of calves and of sales of cull dairy cows is not taken into account, because no satisfactory method has been found to estimate this value upon the basis of the current data.
159
This makes it possible to allocate 17 codes referring to product or cost codes in the farm return (Commission Regulations Nos.
2237/77 and 868/2008), (EU, FADN, 2012) 160
Document RI/CC 1256: Depreciation of quota should not be entered in Table G (Land and buildings, deadstock, circulating capital), but
may be entered in Table L 161
11.81 EURO/ton of quota in 2004, 23.65 EURO/ton in 2005, 35.50 EURO/ton in 2006 before decoupling; the actual implementation
date of the payments depends on the Member State and Article 69 payments for dairy (used in Spain) (EU, FADN, 2012)
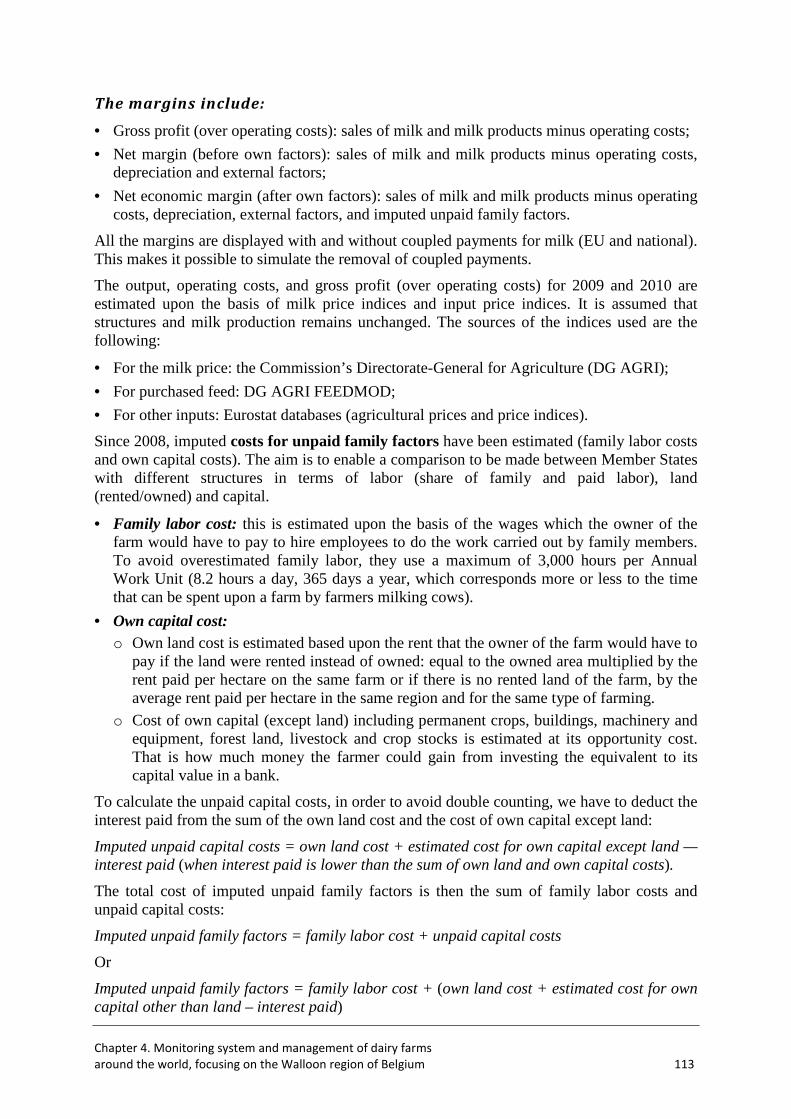
Chapter 4. Monitoring system and management of dairy farms
around the world, focusing on the Walloon region of Belgium 113
The margins include:
• Gross profit (over operating costs): sales of milk and milk products minus operating costs;
• Net margin (before own factors): sales of milk and milk products minus operating costs, depreciation and external factors;
• Net economic margin (after own factors): sales of milk and milk products minus operating costs, depreciation, external factors, and imputed unpaid family factors.
All the margins are displayed with and without coupled payments for milk (EU and national). This makes it possible to simulate the removal of coupled payments.
The output, operating costs, and gross profit (over operating costs) for 2009 and 2010 are estimated upon the basis of milk price indices and input price indices. It is assumed that structures and milk production remains unchanged. The sources of the indices used are the following:
• For the milk price: the Commission’s Directorate-General for Agriculture (DG AGRI);
• For purchased feed: DG AGRI FEEDMOD;
• For other inputs: Eurostat databases (agricultural prices and price indices).
Since 2008, imputed costs for unpaid family factors have been estimated (family labor costs and own capital costs). The aim is to enable a comparison to be made between Member States with different structures in terms of labor (share of family and paid labor), land (rented/owned) and capital.
• Family labor cost: this is estimated upon the basis of the wages which the owner of the farm would have to pay to hire employees to do the work carried out by family members. To avoid overestimated family labor, they use a maximum of 3,000 hours per Annual Work Unit (8.2 hours a day, 365 days a year, which corresponds more or less to the time that can be spent upon a farm by farmers milking cows).
• Own capital cost: o Own land cost is estimated based upon the rent that the owner of the farm would have to
pay if the land were rented instead of owned: equal to the owned area multiplied by the rent paid per hectare on the same farm or if there is no rented land of the farm, by the average rent paid per hectare in the same region and for the same type of farming.
o Cost of own capital (except land) including permanent crops, buildings, machinery and equipment, forest land, livestock and crop stocks is estimated at its opportunity cost. That is how much money the farmer could gain from investing the equivalent to its capital value in a bank.
To calculate the unpaid capital costs, in order to avoid double counting, we have to deduct the interest paid from the sum of the own land cost and the cost of own capital except land:
Imputed unpaid capital costs = own land cost + estimated cost for own capital except land — interest paid (when interest paid is lower than the sum of own land and own capital costs).
The total cost of imputed unpaid family factors is then the sum of family labor costs and unpaid capital costs:
Imputed unpaid family factors = family labor cost + unpaid capital costs
Or
Imputed unpaid family factors = family labor cost + (own land cost + estimated cost for own capital other than land – interest paid)
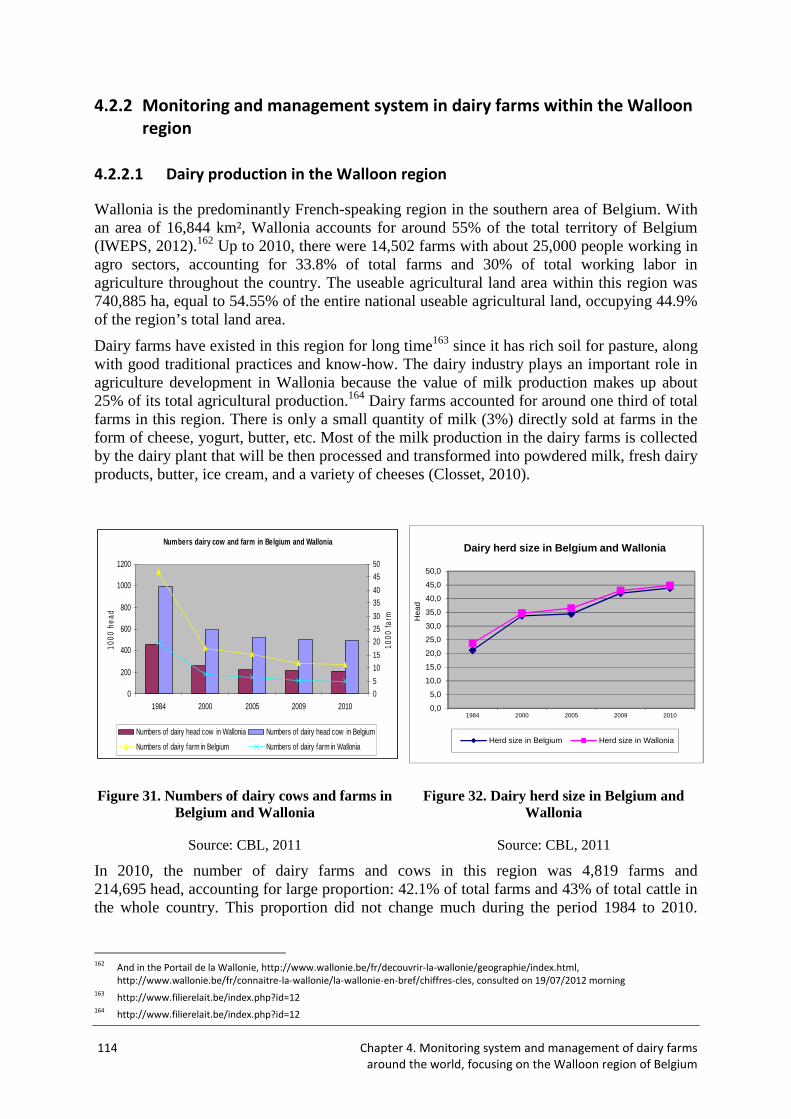
114 Chapter 4. Monitoring system and management of dairy farms
around the world, focusing on the Walloon region of Belgium
4.2.2 Monitoring and management system in dairy farms within the Walloon
region
4.2.2.1 Dairy production in the Walloon region
Wallonia is the predominantly French-speaking region in the southern area of Belgium. With an area of 16,844 km², Wallonia accounts for around 55% of the total territory of Belgium (IWEPS, 2012).162 Up to 2010, there were 14,502 farms with about 25,000 people working in agro sectors, accounting for 33.8% of total farms and 30% of total working labor in agriculture throughout the country. The useable agricultural land area within this region was 740,885 ha, equal to 54.55% of the entire national useable agricultural land, occupying 44.9% of the region’s total land area.
Dairy farms have existed in this region for long time163 since it has rich soil for pasture, along with good traditional practices and know-how. The dairy industry plays an important role in agriculture development in Wallonia because the value of milk production makes up about 25% of its total agricultural production.164 Dairy farms accounted for around one third of total farms in this region. There is only a small quantity of milk (3%) directly sold at farms in the form of cheese, yogurt, butter, etc. Most of the milk production in the dairy farms is collected by the dairy plant that will be then processed and transformed into powdered milk, fresh dairy products, butter, ice cream, and a variety of cheeses (Closset, 2010).
Figure 31. Numbers of dairy cows and farms in Belgium and Wallonia
Figure 32. Dairy herd size in Belgium and Wallonia
Source: CBL, 2011 Source: CBL, 2011
In 2010, the number of dairy farms and cows in this region was 4,819 farms and 214,695 head, accounting for large proportion: 42.1% of total farms and 43% of total cattle in the whole country. This proportion did not change much during the period 1984 to 2010.
162
And in the Portail de la Wallonie, http://www.wallonie.be/fr/decouvrir-la-wallonie/geographie/index.html,
http://www.wallonie.be/fr/connaitre-la-wallonie/la-wallonie-en-bref/chiffres-cles, consulted on 19/07/2012 morning 163
http://www.filierelait.be/index.php?id=12 164
http://www.filierelait.be/index.php?id=12
Numbers dairy cow and farm in Belgium and Wallonia
0
200
400
600
800
1000
1200
1984 2000 2005 2009 2010
1000
hea
d
0
5
10
15
20
25
30
35
40
45
50
1000
farm
Numbers of dairy head cow in Wallonia Numbers of dairy head cow in Belgium
Numbers of dairy farm in Belgium Numbers of dairy farm in Wallonia
0,0
5,0
10,0
15,0
20,0
25,0
30,0
35,0
40,0
45,0
50,0
1984 2000 2005 2009 2010
Hea
d
Dairy herd size in Belgium and Wallonia
Herd size in Belgium Herd size in Wallonia
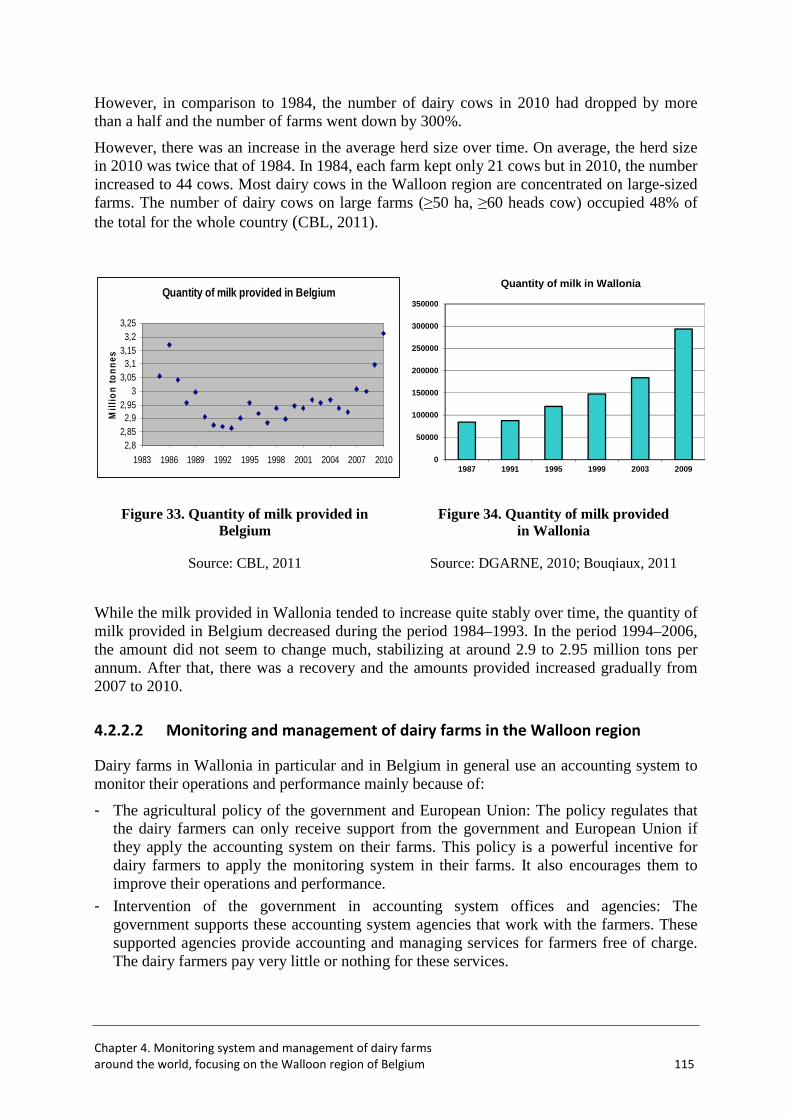
Chapter 4. Monitoring system and management of dairy farms
around the world, focusing on the Walloon region of Belgium 115
However, in comparison to 1984, the number of dairy cows in 2010 had dropped by more than a half and the number of farms went down by 300%.
However, there was an increase in the average herd size over time. On average, the herd size in 2010 was twice that of 1984. In 1984, each farm kept only 21 cows but in 2010, the number increased to 44 cows. Most dairy cows in the Walloon region are concentrated on large-sized farms. The number of dairy cows on large farms (≥50 ha, ≥60 heads cow) occupied 48% of the total for the whole country (CBL, 2011).
Figure 33. Quantity of milk provided in Belgium
Figure 34. Quantity of milk provided in Wallonia
Source: CBL, 2011 Source: DGARNE, 2010; Bouqiaux, 2011
While the milk provided in Wallonia tended to increase quite stably over time, the quantity of milk provided in Belgium decreased during the period 1984–1993. In the period 1994–2006, the amount did not seem to change much, stabilizing at around 2.9 to 2.95 million tons per annum. After that, there was a recovery and the amounts provided increased gradually from 2007 to 2010.
4.2.2.2 Monitoring and management of dairy farms in the Walloon region
Dairy farms in Wallonia in particular and in Belgium in general use an accounting system to monitor their operations and performance mainly because of:
- The agricultural policy of the government and European Union: The policy regulates that the dairy farmers can only receive support from the government and European Union if they apply the accounting system on their farms. This policy is a powerful incentive for dairy farmers to apply the monitoring system in their farms. It also encourages them to improve their operations and performance.
- Intervention of the government in accounting system offices and agencies: The government supports these accounting system agencies that work with the farmers. These supported agencies provide accounting and managing services for farmers free of charge. The dairy farmers pay very little or nothing for these services.
Quantity of milk provided in Belgium
2,82,852,9
2,953
3,053,1
3,153,2
3,25
1983 1986 1989 1992 1995 1998 2001 2004 2007 2010
Mil
lio
n t
on
nes
0
50000
100000
150000
200000
250000
300000
350000
1987 1991 1995 1999 2003 2009
Quantity of milk in Wallonia
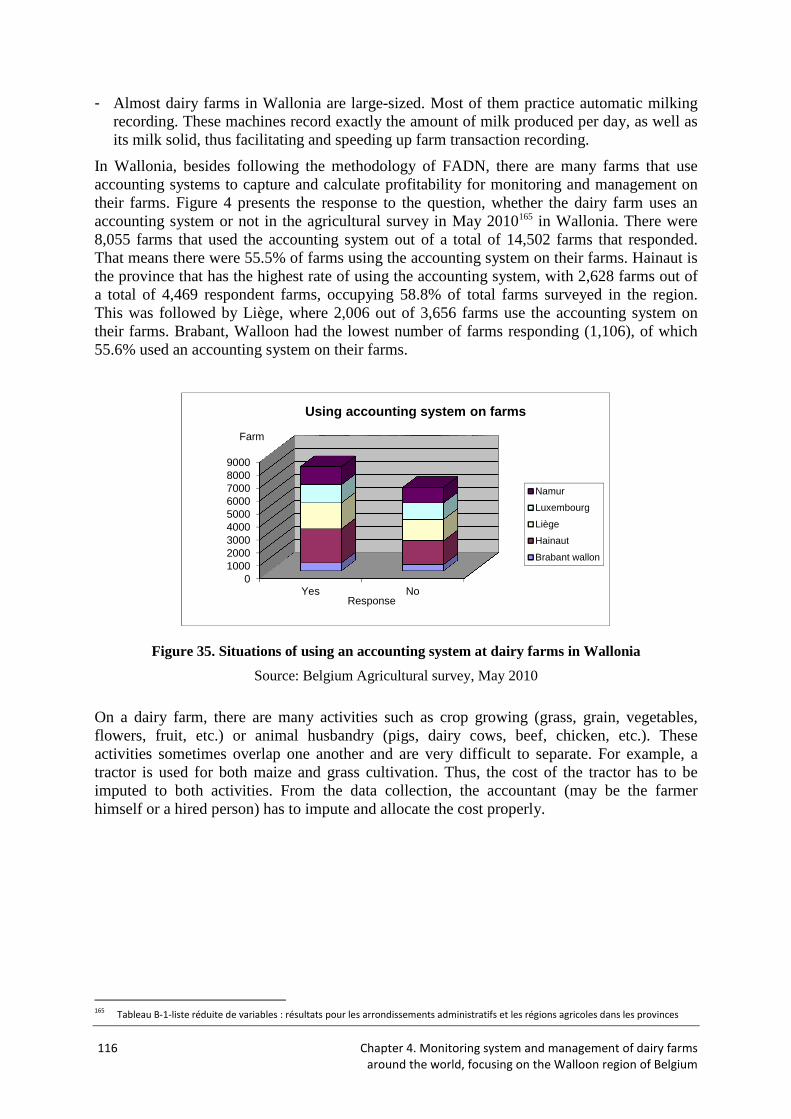
116 Chapter 4. Monitoring system and management of dairy farms
around the world, focusing on the Walloon region of Belgium
- Almost dairy farms in Wallonia are large-sized. Most of them practice automatic milking recording. These machines record exactly the amount of milk produced per day, as well as its milk solid, thus facilitating and speeding up farm transaction recording.
In Wallonia, besides following the methodology of FADN, there are many farms that use accounting systems to capture and calculate profitability for monitoring and management on their farms. Figure 4 presents the response to the question, whether the dairy farm uses an accounting system or not in the agricultural survey in May 2010165 in Wallonia. There were 8,055 farms that used the accounting system out of a total of 14,502 farms that responded. That means there were 55.5% of farms using the accounting system on their farms. Hainaut is the province that has the highest rate of using the accounting system, with 2,628 farms out of a total of 4,469 respondent farms, occupying 58.8% of total farms surveyed in the region. This was followed by Liège, where 2,006 out of 3,656 farms use the accounting system on their farms. Brabant, Walloon had the lowest number of farms responding (1,106), of which 55.6% used an accounting system on their farms.
Figure 35. Situations of using an accounting system at dairy farms in Wallonia
Source: Belgium Agricultural survey, May 2010
On a dairy farm, there are many activities such as crop growing (grass, grain, vegetables, flowers, fruit, etc.) or animal husbandry (pigs, dairy cows, beef, chicken, etc.). These activities sometimes overlap one another and are very difficult to separate. For example, a tractor is used for both maize and grass cultivation. Thus, the cost of the tractor has to be imputed to both activities. From the data collection, the accountant (may be the farmer himself or a hired person) has to impute and allocate the cost properly.
165
Tableau B-1-liste réduite de variables : résultats pour les arrondissements administratifs et les régions agricoles dans les provinces
0100020003000400050006000700080009000
Yes No
Farm
Response
Using accounting system on farms
Namur
Luxembourg
Liège
Hainaut
Brabant wallon
Chapter 4. Monitoring system and management of dairy farms
around the world, focusing on the Walloon region of Belgium 117
Example of supporting agents for monitoring and managing dairy farms
in Walloon
Monitoring and management activities in dairy farmers belonging to the Association of Walloon Husbandry (AWE)
In 2011, the AWE had 5,255 members who subscribed for management. In their accounting work, they also processed more than 100,000 invoices for 1,000 clients (AWE, 2012).166
Their technical and economics service provides supervision for management of farms. Their major activities include:
• Management accounting
• Administrative supervision
• Technical framework
The monitoring system is based upon the performance data measured from farms, especially on the management accounting of 704 farms. This includes financial income for detailed operations, together with specialist counseling. Production costs and revenues of each farm are analyzed in detail to find potential areas for improvement. Then advice is provided to farmers to help them improve the profitability of their farms.
Main activities for monitoring and managing dairy farms are:
• Farm visiting for monitoring and managing: o Keeping detailed inventory of cattle;
o Gathering necessary data for farm management accounting.
• Farm management accounting: o Calculation of gross profits of different crops;
o Calculation of technical indices which is useful to find the methods for obtaining productions achieved.
• Reporting the results: o Detailed results from the dairy farm practice;
o Changes in operating results during the last three years;
o Comparison of results obtained by technical and financial speculation with the average and group analysis.
• A visit of a management consultant for the interpretation of results and to increase the profitability of their output, identify improvements in the techniques of production in:
o Cattle breeding
o Livestock feeding
o Farms forage area
o Cultivation techniques
Cost accounting management:
• Inventory of the farm
• Compile different periodic expenses
• Annual report and advice on management of operations
• Study the economic recovery of farms 166
P10
118 Chapter 4. Monitoring system and management of dairy farms
around the world, focusing on the Walloon region of Belgium
• Aid administration
• Constitution of records for obtaining European grants
• Surveying fragmented results using specialized software
Technical guidance:
• Study of land improvement and drainage
• Return on investment and recovery of operations
Walloon Federation of Agriculture (FWA): The FWA provides farmers with a strong team of advisors who analyze the political context in which the industry operates. The management center in this federation helps the farmers to:
o Analyze the income of farmers
o Monitor profitability and cash flow and give advice tailored to their operation
o Analyze the debt and over-indebtedness
o Closely monitor farms in precarious situations
The management accounting of this center provides farmers with services to gather technical and economic data, which they can use to make a comparison with averages from other farms (depending on region, type of speculation, etc.). This will generate an opportunity for increased profitability of operations for farmers. This also helps the farmers to make appropriate decisions and correct operations on their farms.
The management consultants provide farmers with advice and reliable figures. They discuss with the farmers how to take the most suitable approach, focus on some specific points in their building or improvement plans, which will generate better operating profitability, how to make the best decision regarding any new investment (building, land, equipment, etc.), new generations, the purchase of production quotas, the farm’s recovery, agriculture installations, the analysis of financial difficulties, the choice of tax and VAT system.
4.2.3 Monitoring and management system in dairy farms in the Netherlands
4.2.3.1 Dairy farming in the Netherlands
Milk production in the Netherlands is an age-old practice, as its cheese has been well-known since the Middle Ages.167 Since the 13th and 16th centuries, there was a massive growth in specialized milk production in this region. Thanks to favorable natural conditions and with the long experience of milk production, good selection of the best breeding varieties, the Netherlands is famous for its extremely productive dairy cow, the Holstein.168 This breed was the original cattle of the Batavians and the Frisians more than 2,000 years ago and it continues to be bred in the Netherlands. This breed is now the world’s most highly productive cow, producing an average of over 26,000 liters of milk in its lifetime (STATLINE, 2012).
Farmers in the Netherlands are very well-motivated, foreword thinking, and realistic. They operate their farms very well and efficiently, keeping their cows healthy (Audrey et al., 2011).169 In 2011, the Netherlands had 19,029 dairy farms that had a total of 1,469,000 milking cows. The total milk that this country produced in that year was
167
http://www.kaasmarkt.nl/content/content.asp?lang=0&menu=4&submenu=33, consulted on 15/08/2012 168
http://www.civ-viande.org/uk/ebn.ebn?pid=57&rubrik=1&item=1&page=1, consulted on 15/08/2012 169
P1
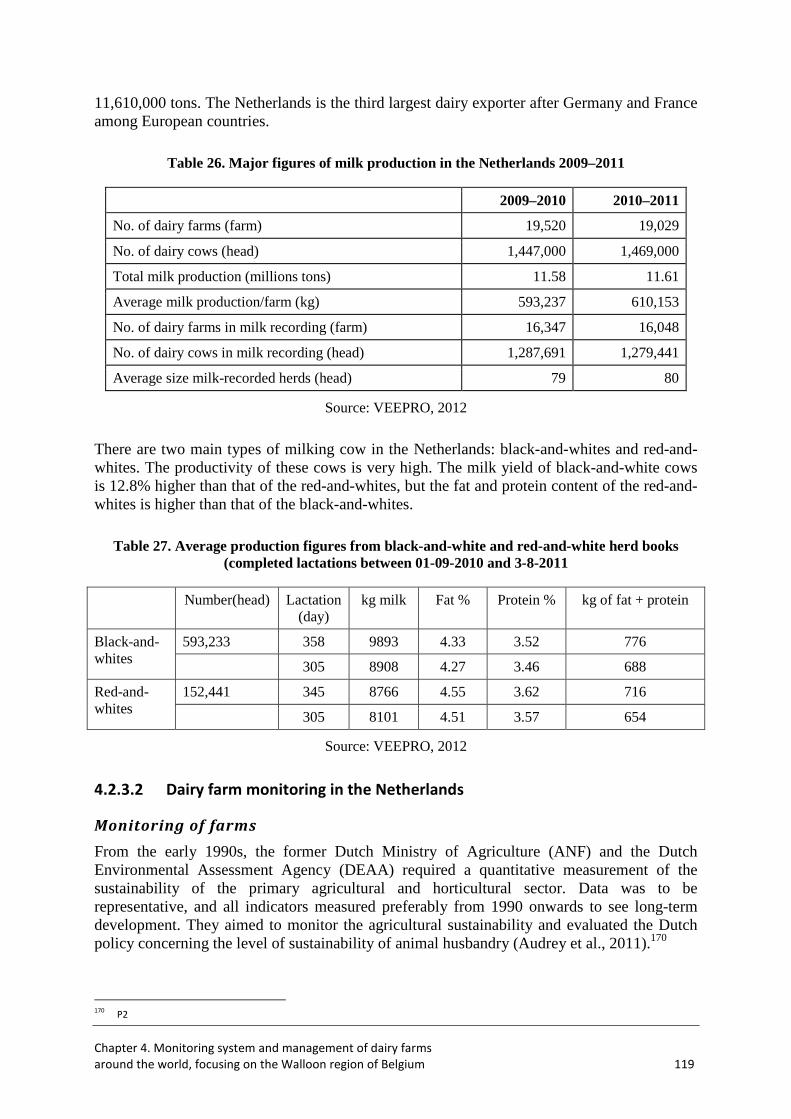
Chapter 4. Monitoring system and management of dairy farms
around the world, focusing on the Walloon region of Belgium 119
11,610,000 tons. The Netherlands is the third largest dairy exporter after Germany and France among European countries.
Table 26. Major figures of milk production in the Netherlands 2009–2011
2009–2010 2010–2011
No. of dairy farms (farm) 19,520 19,029
No. of dairy cows (head) 1,447,000 1,469,000
Total milk production (millions tons) 11.58 11.61
Average milk production/farm (kg) 593,237 610,153
No. of dairy farms in milk recording (farm) 16,347 16,048
No. of dairy cows in milk recording (head) 1,287,691 1,279,441
Average size milk-recorded herds (head) 79 80
Source: VEEPRO, 2012
There are two main types of milking cow in the Netherlands: black-and-whites and red-and-whites. The productivity of these cows is very high. The milk yield of black-and-white cows is 12.8% higher than that of the red-and-whites, but the fat and protein content of the red-and-whites is higher than that of the black-and-whites.
Table 27. Average production figures from black-and-white and red-and-white herd books (completed lactations between 01-09-2010 and 3-8-2011
Number(head) Lactation (day)
kg milk Fat % Protein % kg of fat + protein
Black-and-whites
593,233 358 9893 4.33 3.52 776
305 8908 4.27 3.46 688
Red-and-whites
152,441 345 8766 4.55 3.62 716
305 8101 4.51 3.57 654
Source: VEEPRO, 2012
4.2.3.2 Dairy farm monitoring in the Netherlands
Monitoring of farms
From the early 1990s, the former Dutch Ministry of Agriculture (ANF) and the Dutch Environmental Assessment Agency (DEAA) required a quantitative measurement of the sustainability of the primary agricultural and horticultural sector. Data was to be representative, and all indicators measured preferably from 1990 onwards to see long-term development. They aimed to monitor the agricultural sustainability and evaluated the Dutch policy concerning the level of sustainability of animal husbandry (Audrey et al., 2011).170
170
P2
120 Chapter 4. Monitoring system and management of dairy farms
around the world, focusing on the Walloon region of Belgium
A model for developing performance measurement systems was applied to the process of monitoring. Within this model, eight choices have to be made (Koen and Mark, 2011), including:
• Goals and functions
• Scale level
• Specification of preconditions and functional and user demands
• Themes
• Indicators, targets, and measurement methods
• Weighting and aggregation methods
• Presentation format
• Data source
Data on sustainability indicators of agricultural production focused on the agricultural and horticultural sectors. Three options were identified: regional presentation, presentation per sustainability theme, and presentation by farm type.
The following criteria have been taken into account in the selection of the themes:
• Materiality
• Inclusiveness (viewpoints of all stakeholders included)
• Completeness
• Sustainability context (the context that is needed to understand the impact of the themes on sustainability should be described)
• Balance between themes
• Lack of overlap and interaction between themes
• Consistency of the list of themes
Based on this process, it was decided to split the themes up into the most often used grouping of sustainability themes: profit, planet, and people.
The selected sustainability themes consisted of:
• Context: Geographical distribution, structure (number of farms, area, animals), organic agriculture, multi functionality
• People: Spatial quality, image/reputation, labor, succession, animal welfare and health, food quality
• Planet: Energy use, climate change, nutrients, water use, crop protection, biodiversity, animal feed, soil quality, plant health, fine particulate matter
• Profit: Income, financial position, investment, innovation, competitiveness
After the identification of relevant farm types and themes, key indicators were identified. Criteria to select indicators:
o Completeness
o Structural availability
o Representativity
o Quantitativeness
o Stakeholder support
o Simplicity
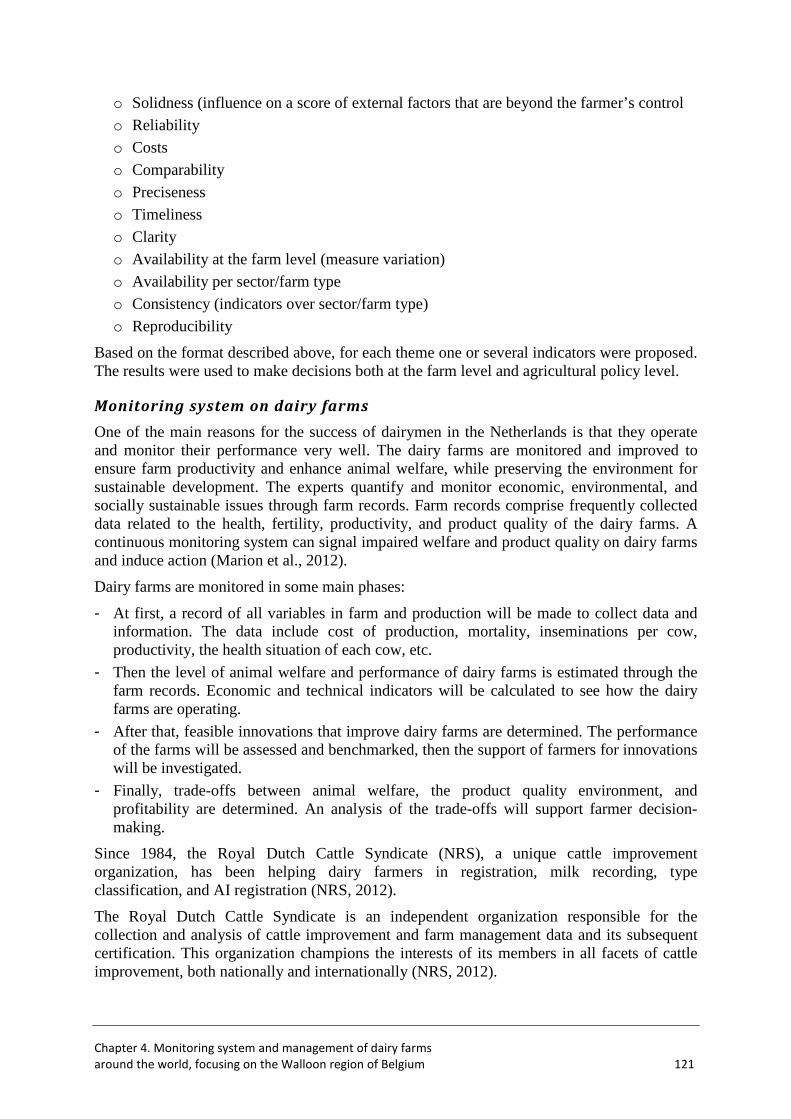
Chapter 4. Monitoring system and management of dairy farms
around the world, focusing on the Walloon region of Belgium 121
o Solidness (influence on a score of external factors that are beyond the farmer’s control
o Reliability
o Costs
o Comparability
o Preciseness
o Timeliness
o Clarity
o Availability at the farm level (measure variation)
o Availability per sector/farm type
o Consistency (indicators over sector/farm type)
o Reproducibility
Based on the format described above, for each theme one or several indicators were proposed. The results were used to make decisions both at the farm level and agricultural policy level.
Monitoring system on dairy farms
One of the main reasons for the success of dairymen in the Netherlands is that they operate and monitor their performance very well. The dairy farms are monitored and improved to ensure farm productivity and enhance animal welfare, while preserving the environment for sustainable development. The experts quantify and monitor economic, environmental, and socially sustainable issues through farm records. Farm records comprise frequently collected data related to the health, fertility, productivity, and product quality of the dairy farms. A continuous monitoring system can signal impaired welfare and product quality on dairy farms and induce action (Marion et al., 2012).
Dairy farms are monitored in some main phases:
- At first, a record of all variables in farm and production will be made to collect data and information. The data include cost of production, mortality, inseminations per cow, productivity, the health situation of each cow, etc.
- Then the level of animal welfare and performance of dairy farms is estimated through the farm records. Economic and technical indicators will be calculated to see how the dairy farms are operating.
- After that, feasible innovations that improve dairy farms are determined. The performance of the farms will be assessed and benchmarked, then the support of farmers for innovations will be investigated.
- Finally, trade-offs between animal welfare, the product quality environment, and profitability are determined. An analysis of the trade-offs will support farmer decision-making.
Since 1984, the Royal Dutch Cattle Syndicate (NRS), a unique cattle improvement organization, has been helping dairy farmers in registration, milk recording, type classification, and AI registration (NRS, 2012).
The Royal Dutch Cattle Syndicate is an independent organization responsible for the collection and analysis of cattle improvement and farm management data and its subsequent certification. This organization champions the interests of its members in all facets of cattle improvement, both nationally and internationally (NRS, 2012).
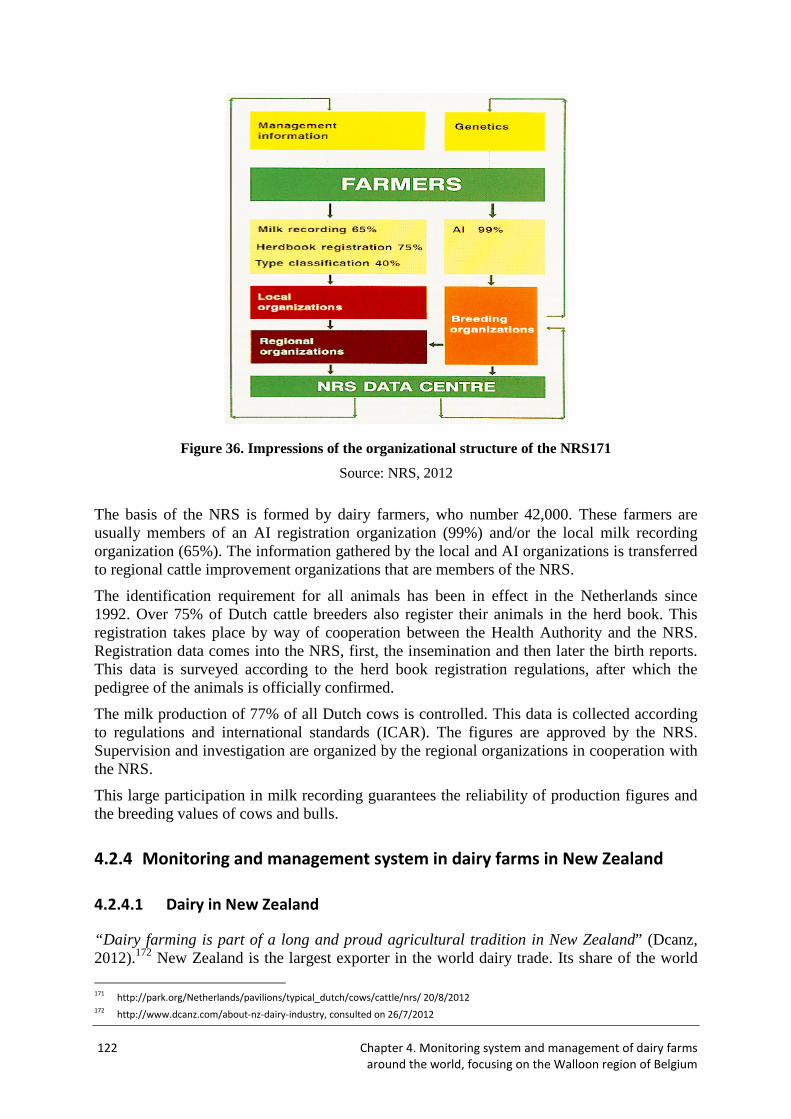
122 Chapter 4. Monitoring system and management of dairy farms
around the world, focusing on the Walloon region of Belgium
Figure 36. Impressions of the organizational structure of the NRS171
Source: NRS, 2012
The basis of the NRS is formed by dairy farmers, who number 42,000. These farmers are usually members of an AI registration organization (99%) and/or the local milk recording organization (65%). The information gathered by the local and AI organizations is transferred to regional cattle improvement organizations that are members of the NRS.
The identification requirement for all animals has been in effect in the Netherlands since 1992. Over 75% of Dutch cattle breeders also register their animals in the herd book. This registration takes place by way of cooperation between the Health Authority and the NRS. Registration data comes into the NRS, first, the insemination and then later the birth reports. This data is surveyed according to the herd book registration regulations, after which the pedigree of the animals is officially confirmed.
The milk production of 77% of all Dutch cows is controlled. This data is collected according to regulations and international standards (ICAR). The figures are approved by the NRS. Supervision and investigation are organized by the regional organizations in cooperation with the NRS.
This large participation in milk recording guarantees the reliability of production figures and the breeding values of cows and bulls.
4.2.4 Monitoring and management system in dairy farms in New Zealand
4.2.4.1 Dairy in New Zealand
“Dairy farming is part of a long and proud agricultural tradition in New Zealand” (Dcanz, 2012).172 New Zealand is the largest exporter in the world dairy trade. Its share of the world
171
http://park.org/Netherlands/pavilions/typical_dutch/cows/cattle/nrs/ 20/8/2012 172
http://www.dcanz.com/about-nz-dairy-industry, consulted on 26/7/2012
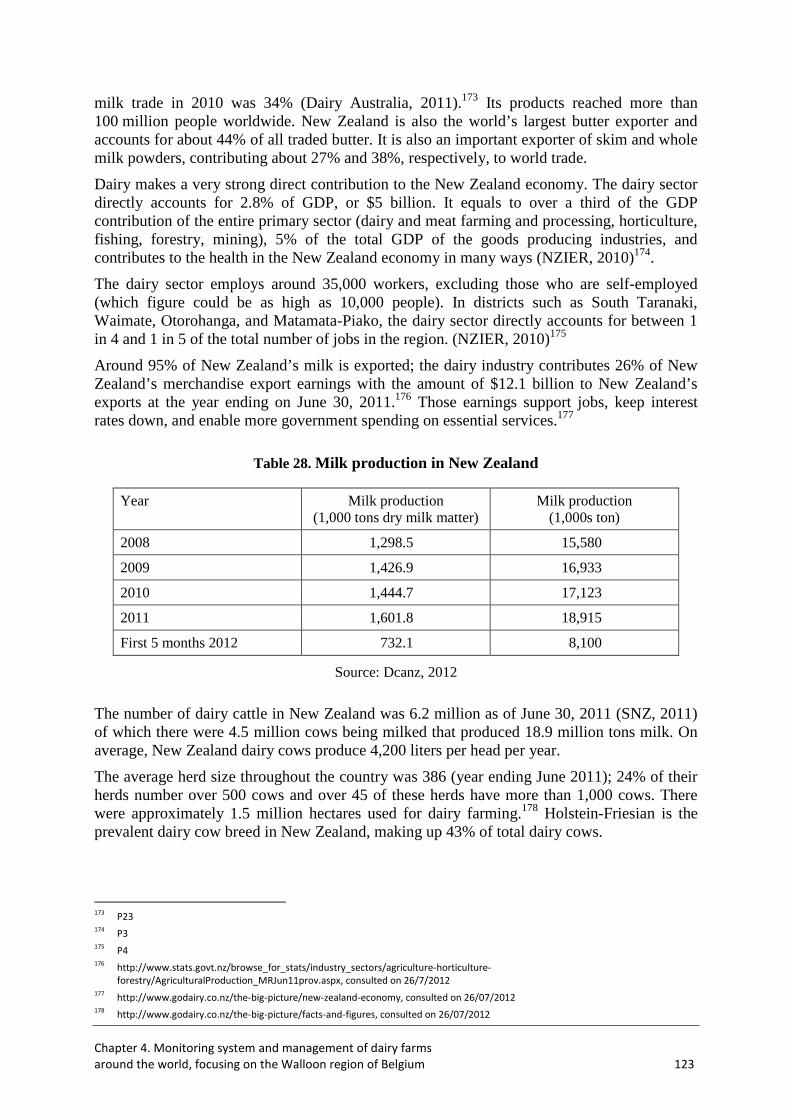
Chapter 4. Monitoring system and management of dairy farms
around the world, focusing on the Walloon region of Belgium 123
milk trade in 2010 was 34% (Dairy Australia, 2011).173 Its products reached more than 100 million people worldwide. New Zealand is also the world’s largest butter exporter and accounts for about 44% of all traded butter. It is also an important exporter of skim and whole milk powders, contributing about 27% and 38%, respectively, to world trade.
Dairy makes a very strong direct contribution to the New Zealand economy. The dairy sector directly accounts for 2.8% of GDP, or $5 billion. It equals to over a third of the GDP contribution of the entire primary sector (dairy and meat farming and processing, horticulture, fishing, forestry, mining), 5% of the total GDP of the goods producing industries, and contributes to the health in the New Zealand economy in many ways (NZIER, 2010)174.
The dairy sector employs around 35,000 workers, excluding those who are self-employed (which figure could be as high as 10,000 people). In districts such as South Taranaki, Waimate, Otorohanga, and Matamata-Piako, the dairy sector directly accounts for between 1 in 4 and 1 in 5 of the total number of jobs in the region. (NZIER, 2010)175
Around 95% of New Zealand’s milk is exported; the dairy industry contributes 26% of New Zealand’s merchandise export earnings with the amount of $12.1 billion to New Zealand’s exports at the year ending on June 30, 2011.176 Those earnings support jobs, keep interest rates down, and enable more government spending on essential services.177
Table 28. Milk production in New Zealand
Year Milk production (1,000 tons dry milk matter)
Milk production (1,000s ton)
2008 1,298.5 15,580
2009 1,426.9 16,933
2010 1,444.7 17,123
2011 1,601.8 18,915
First 5 months 2012 732.1 8,100
Source: Dcanz, 2012
The number of dairy cattle in New Zealand was 6.2 million as of June 30, 2011 (SNZ, 2011) of which there were 4.5 million cows being milked that produced 18.9 million tons milk. On average, New Zealand dairy cows produce 4,200 liters per head per year.
The average herd size throughout the country was 386 (year ending June 2011); 24% of their herds number over 500 cows and over 45 of these herds have more than 1,000 cows. There were approximately 1.5 million hectares used for dairy farming.178 Holstein-Friesian is the prevalent dairy cow breed in New Zealand, making up 43% of total dairy cows.
173
P23 174
P3 175
P4 176
http://www.stats.govt.nz/browse_for_stats/industry_sectors/agriculture-horticulture-
forestry/AgriculturalProduction_MRJun11prov.aspx, consulted on 26/7/2012 177
http://www.godairy.co.nz/the-big-picture/new-zealand-economy, consulted on 26/07/2012 178
http://www.godairy.co.nz/the-big-picture/facts-and-figures, consulted on 26/07/2012
124 Chapter 4. Monitoring system and management of dairy farms
around the world, focusing on the Walloon region of Belgium
Characterized by quality and innovation, the key strengths of New Zealand’s world-class dairy industry are the country’s efficient all-grass farming systems combined with large-scale processing, high level of research and development spending, and creative marketing.179
The temperate climate in New Zealand is ideal for dairy farming and 95% of milk production is from grass. No cattle are wintered indoors. The only crops given are green feed brassica (turnips). Maize is fed as silage or green fodder for cows. New Zealand is a recognized world leader in low-cost farm production systems.180
The main dairying areas are Canterbury, Southland, Taranaki, and Waikato, but most areas have at least some dairy farming. Seventy-six percent of dairy herds are on the North Island, with one third of all New Zealand dairy farms located in the Waikato/South Auckland region. Taranaki is the second most heavily populated region at 17%. South Island dairy farms account for 15% of the national total (SNZ, 2011)181.
4.2.4.2 Dairy farm monitor in New Zealand
The Farm Monitoring Program in New Zealand provides a short-term view of the financial and production status of a range of farm types throughout New Zealand. It examines revenue and expenditure for the past season and outlines what farmers are budgeting for the year ahead. It provides information on trends and issues facing the sectors.
The program collects data from a range of farm types throughout New Zealand and is supplemented with farmer and industry expectations. One use of this data is to produce model budgets. Each model budget is representative of a farm type in a given region and is modeled on how a real farm would operate, contrary to using an average of results from the monitored farms. Each model budget is then augmented with feedback gathered from regional industry meetings and other information sources to represent the current situation and expectations in each region.
Dairy farm monitoring projects have been running in South Taranaki, New Zealand, since 1988–1989. The monitoring aimed at finding constraints to profitable production. The program of monitoring is presented as follows:
179
http://www.dcanz.com/about-nz-dairy-industry/dairying-today, consulted on 26/7/2012 180
http://www.innovationwaikato.co.nz/dairy-solutioNZ--NZ--Ltd 181
See more on: www.marketnewzealand.com/MNZ/aboutNZ/sectors/14413/13784.aspx;
www.stats.govt.nz/store/2006/12/agricultural-production-statistics-provisional-jun06-mr.htm ;
www.investmentnz.govt.nz/common/files/Dairy_Feb06.pdf; Consulted on 26/07/2012.
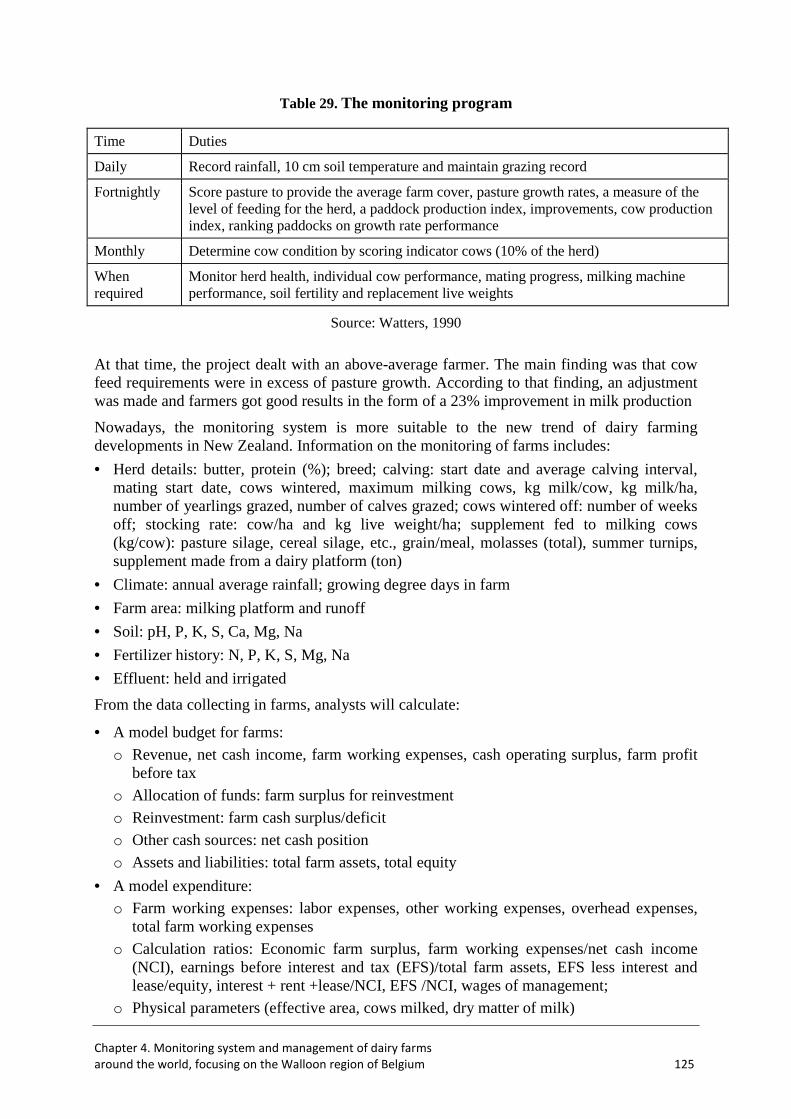
Chapter 4. Monitoring system and management of dairy farms
around the world, focusing on the Walloon region of Belgium 125
Table 29. The monitoring program
Time Duties
Daily Record rainfall, 10 cm soil temperature and maintain grazing record
Fortnightly Score pasture to provide the average farm cover, pasture growth rates, a measure of the level of feeding for the herd, a paddock production index, improvements, cow production index, ranking paddocks on growth rate performance
Monthly Determine cow condition by scoring indicator cows (10% of the herd)
When required
Monitor herd health, individual cow performance, mating progress, milking machine performance, soil fertility and replacement live weights
Source: Watters, 1990
At that time, the project dealt with an above-average farmer. The main finding was that cow feed requirements were in excess of pasture growth. According to that finding, an adjustment was made and farmers got good results in the form of a 23% improvement in milk production
Nowadays, the monitoring system is more suitable to the new trend of dairy farming developments in New Zealand. Information on the monitoring of farms includes:
• Herd details: butter, protein (%); breed; calving: start date and average calving interval, mating start date, cows wintered, maximum milking cows, kg milk/cow, kg milk/ha, number of yearlings grazed, number of calves grazed; cows wintered off: number of weeks off; stocking rate: cow/ha and kg live weight/ha; supplement fed to milking cows (kg/cow): pasture silage, cereal silage, etc., grain/meal, molasses (total), summer turnips, supplement made from a dairy platform (ton)
• Climate: annual average rainfall; growing degree days in farm
• Farm area: milking platform and runoff
• Soil: pH, P, K, S, Ca, Mg, Na
• Fertilizer history: N, P, K, S, Mg, Na
• Effluent: held and irrigated
From the data collecting in farms, analysts will calculate:
• A model budget for farms:
o Revenue, net cash income, farm working expenses, cash operating surplus, farm profit before tax
o Allocation of funds: farm surplus for reinvestment
o Reinvestment: farm cash surplus/deficit
o Other cash sources: net cash position
o Assets and liabilities: total farm assets, total equity
• A model expenditure: o Farm working expenses: labor expenses, other working expenses, overhead expenses,
total farm working expenses
o Calculation ratios: Economic farm surplus, farm working expenses/net cash income (NCI), earnings before interest and tax (EFS)/total farm assets, EFS less interest and lease/equity, interest + rent +lease/NCI, EFS /NCI, wages of management;
o Physical parameters (effective area, cows milked, dry matter of milk)

126 Chapter 4. Monitoring system and management of dairy farms
around the world, focusing on the Walloon region of Belgium
o Key parameters, financial results and budget: total dry matter of milk revenue per cow, per ha, per cow milked, cattle income, other farm incomes, etc.
o Breakeven analysis
o Percentile analysis
The project helps sample dairy farmers to monitor their farms. Competition and follow-up field trips were organized to encourage discussion between farmers on best management practices for persistent pastures. Other farmers visited the sample monitor farms. Farmers can learn what other farmers are doing. This will help farmers fine-tune current systems to improve performance. They can identify where they need to consider major changes in their winter management and will have access to comprehensive, independent information about the options available.
4.2.5 Monitoring and management system of dairy farms in Australia
4.2.5.1 Dairy in Australia
The dairy industry is one of the three most important rural industries in Australia. Its farm gate value was approximately 4 billion US dollars in 2010/2011. In 2011, Australia had nearly 7,000 farms with the total dairy herd numbering 1.6 million cows and producing 9,101 million liters milk. On average, each farm raised 230 cows and annual milk production per cow was 5,700 liters. Value of dairy exports ranks the fourth in agricultural exports with 2.75 billion US dollars, accounting for 8% of the entire world dairy trade. It is estimated that approximately 40,000 people are directly employed on dairy farms and dairy processing plants. Dairy is also one of Australia’s leading rural industries in terms of adding value through further downstream processing.
Table 30. Australian dairy 2010/2011
National dairy herd 1.6 million cows
Average herd size 230 cows
Milk production 9,101 million liters
Average annual milk production per cow 5,700 liters
Dairy – Australia’s 3rd largest rural industry $3.9 billion value at farm gate
Dairy – Major export industry $2.75 billion - 8% of world dairy trade
Percentage of Australia milk production exported 43%
Dairy industry workforce Direct employment of approximately 40,000
Source: Dairy Australia, 2011182
182
P2
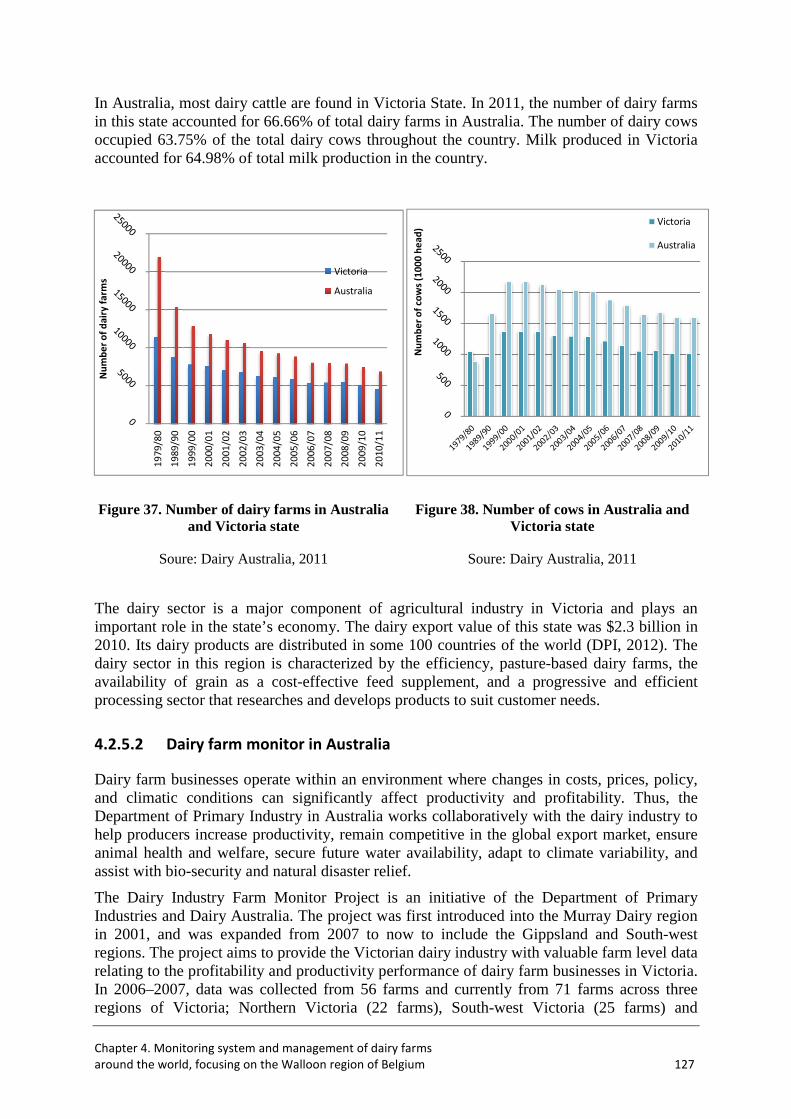
Chapter 4. Monitoring system and management of dairy farms
around the world, focusing on the Walloon region of Belgium 127
In Australia, most dairy cattle are found in Victoria State. In 2011, the number of dairy farms in this state accounted for 66.66% of total dairy farms in Australia. The number of dairy cows occupied 63.75% of the total dairy cows throughout the country. Milk produced in Victoria accounted for 64.98% of total milk production in the country.
Figure 37. Number of dairy farms in Australia and Victoria state
Figure 38. Number of cows in Australia and Victoria state
Soure: Dairy Australia, 2011 Soure: Dairy Australia, 2011
The dairy sector is a major component of agricultural industry in Victoria and plays an important role in the state’s economy. The dairy export value of this state was $2.3 billion in 2010. Its dairy products are distributed in some 100 countries of the world (DPI, 2012). The dairy sector in this region is characterized by the efficiency, pasture-based dairy farms, the availability of grain as a cost-effective feed supplement, and a progressive and efficient processing sector that researches and develops products to suit customer needs.
4.2.5.2 Dairy farm monitor in Australia
Dairy farm businesses operate within an environment where changes in costs, prices, policy, and climatic conditions can significantly affect productivity and profitability. Thus, the Department of Primary Industry in Australia works collaboratively with the dairy industry to help producers increase productivity, remain competitive in the global export market, ensure animal health and welfare, secure future water availability, adapt to climate variability, and assist with bio-security and natural disaster relief.
The Dairy Industry Farm Monitor Project is an initiative of the Department of Primary Industries and Dairy Australia. The project was first introduced into the Murray Dairy region in 2001, and was expanded from 2007 to now to include the Gippsland and South-west regions. The project aims to provide the Victorian dairy industry with valuable farm level data relating to the profitability and productivity performance of dairy farm businesses in Victoria. In 2006–2007, data was collected from 56 farms and currently from 71 farms across three regions of Victoria; Northern Victoria (22 farms), South-west Victoria (25 farms) and
19
79
/80
19
89
/90
19
99
/00
20
00
/01
20
01
/02
20
02
/03
20
03
/04
20
04
/05
20
05
/06
20
06
/07
20
07
/08
20
08
/09
20
09
/10
20
10
/11
Nu
mb
er
of
da
iry
fa
rms
Victoria
Australia
Nu
mb
er
of
cow
s (1
00
0 h
ea
d)
Victoria
Australia
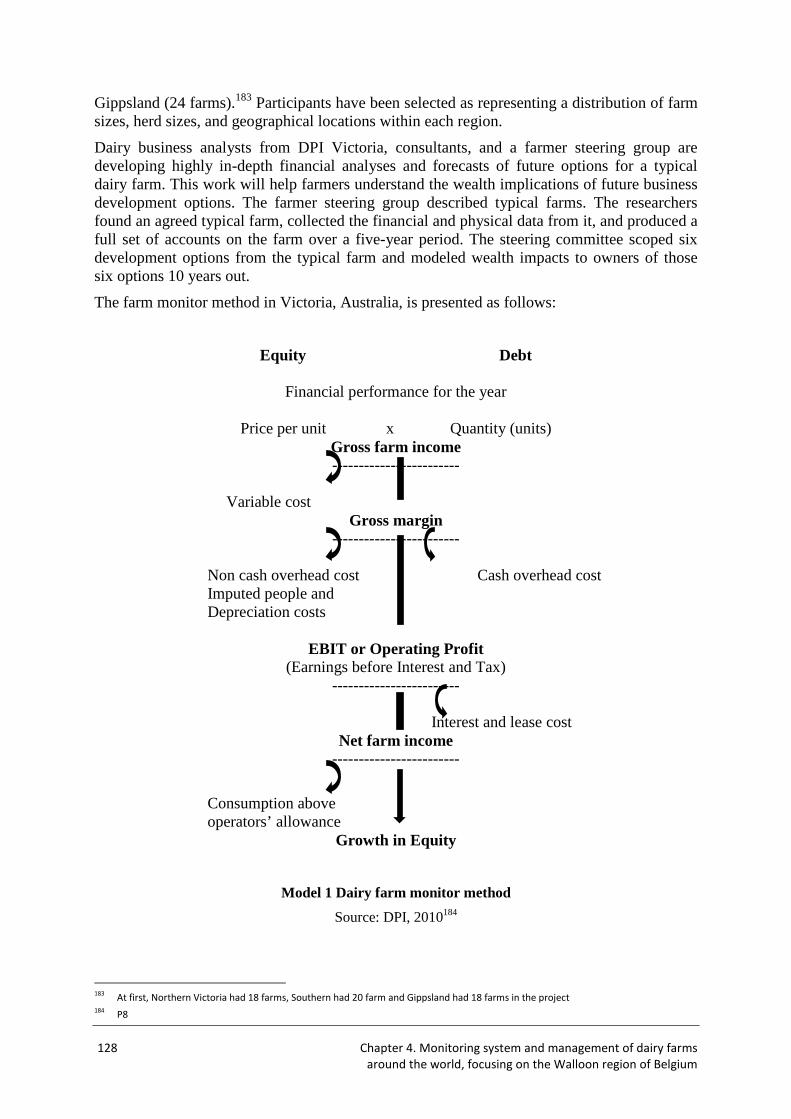
128 Chapter 4. Monitoring system and management of dairy farms
around the world, focusing on the Walloon region of Belgium
Gippsland (24 farms).183 Participants have been selected as representing a distribution of farm sizes, herd sizes, and geographical locations within each region.
Dairy business analysts from DPI Victoria, consultants, and a farmer steering group are developing highly in-depth financial analyses and forecasts of future options for a typical dairy farm. This work will help farmers understand the wealth implications of future business development options. The farmer steering group described typical farms. The researchers found an agreed typical farm, collected the financial and physical data from it, and produced a full set of accounts on the farm over a five-year period. The steering committee scoped six development options from the typical farm and modeled wealth impacts to owners of those six options 10 years out.
The farm monitor method in Victoria, Australia, is presented as follows:
Equity Debt
Financial performance for the year
Price per unit x Quantity (units) Gross farm income ------------------------
Variable cost
Gross margin ------------------------
Non cash overhead cost Cash overhead cost Imputed people and Depreciation costs
EBIT or Operating Profit
(Earnings before Interest and Tax) ------------------------
Interest and lease cost
Net farm income ------------------------
Consumption above operators’ allowance
Growth in Equity
Model 1 Dairy farm monitor method
Source: DPI, 2010184
183
At first, Northern Victoria had 18 farms, Southern had 20 farm and Gippsland had 18 farms in the project 184
P8
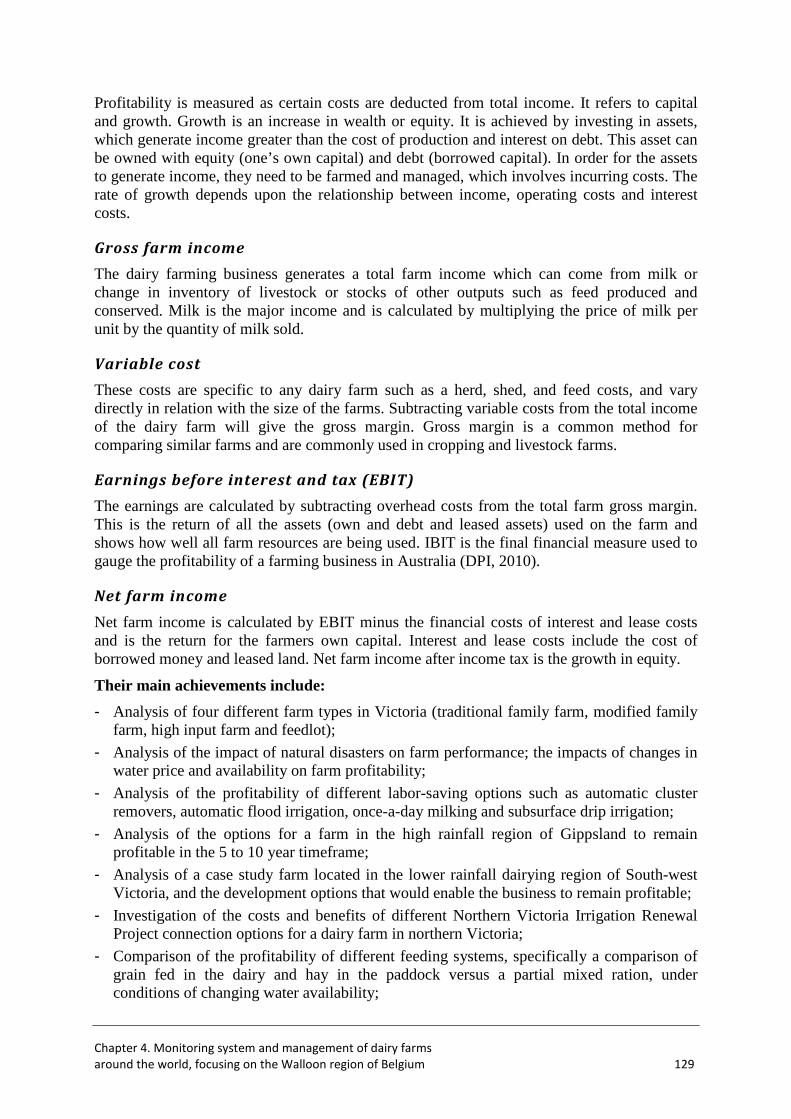
Chapter 4. Monitoring system and management of dairy farms
around the world, focusing on the Walloon region of Belgium 129
Profitability is measured as certain costs are deducted from total income. It refers to capital and growth. Growth is an increase in wealth or equity. It is achieved by investing in assets, which generate income greater than the cost of production and interest on debt. This asset can be owned with equity (one’s own capital) and debt (borrowed capital). In order for the assets to generate income, they need to be farmed and managed, which involves incurring costs. The rate of growth depends upon the relationship between income, operating costs and interest costs.
Gross farm income
The dairy farming business generates a total farm income which can come from milk or change in inventory of livestock or stocks of other outputs such as feed produced and conserved. Milk is the major income and is calculated by multiplying the price of milk per unit by the quantity of milk sold.
Variable cost
These costs are specific to any dairy farm such as a herd, shed, and feed costs, and vary directly in relation with the size of the farms. Subtracting variable costs from the total income of the dairy farm will give the gross margin. Gross margin is a common method for comparing similar farms and are commonly used in cropping and livestock farms.
Earnings before interest and tax (EBIT)
The earnings are calculated by subtracting overhead costs from the total farm gross margin. This is the return of all the assets (own and debt and leased assets) used on the farm and shows how well all farm resources are being used. IBIT is the final financial measure used to gauge the profitability of a farming business in Australia (DPI, 2010).
Net farm income
Net farm income is calculated by EBIT minus the financial costs of interest and lease costs and is the return for the farmers own capital. Interest and lease costs include the cost of borrowed money and leased land. Net farm income after income tax is the growth in equity.
Their main achievements include:
- Analysis of four different farm types in Victoria (traditional family farm, modified family farm, high input farm and feedlot);
- Analysis of the impact of natural disasters on farm performance; the impacts of changes in water price and availability on farm profitability;
- Analysis of the profitability of different labor-saving options such as automatic cluster removers, automatic flood irrigation, once-a-day milking and subsurface drip irrigation;
- Analysis of the options for a farm in the high rainfall region of Gippsland to remain profitable in the 5 to 10 year timeframe;
- Analysis of a case study farm located in the lower rainfall dairying region of South-west Victoria, and the development options that would enable the business to remain profitable;
- Investigation of the costs and benefits of different Northern Victoria Irrigation Renewal Project connection options for a dairy farm in northern Victoria;
- Comparison of the profitability of different feeding systems, specifically a comparison of grain fed in the dairy and hay in the paddock versus a partial mixed ration, under conditions of changing water availability;
130 Chapter 4. Monitoring system and management of dairy farms
around the world, focusing on the Walloon region of Belgium
The Department of Primary Industry publishes their monitor results yearly. The reports provide detailed information on:
• Whole farm analysis, including: o Farm characteristics: number of farms, herd size, annual rainfall, water used, total
useable area, stocking rate, milk sold per cow and per hectare, price received, labor efficiency.
o Gross farm income
o Variable costs
o Overhead costs
o Operating profit
o Return on assets and on equity
• Physical measures: o Feed consumption
o Fertilizer application
o Milk production
o Calving pattern
Besides, they survey the confidence among the dairy farmers throughout the region to know their expectations, issues, owner, operator time, and holidays. They also examine the greenhouse effect of the dairy industry.
4.3 LESSON LEARNED FOR VIETNAMESE DAIRY FARMERS
The monitoring system and management play an important role in milk production. Farm monitoring will help reduce the error of judgment in farms (Ridler & Hurley, 1984) by providing them: (i) an appreciation of the input/output; (ii) relationship operating on farms; (iii) an emphasis on forward planning; (iv) increased confidence in decision making; (v) and better control over the farming system through changing climatic conditions.
The monitoring system also facilitates the process of farmer decision making. It provides the information and builds confidence to make an effective change in the farming system (Watters, 1990).
Dairy farmers in many countries around the world monitor their milk production as: volume of milk, milk yield, lactation period, inter-calving period, storage temperatures, monitoring wash-out and handling the logistics of tanker collection, etc. The monitoring system enables them to know their current situation of milk production.
The monitoring system and management is a good way to evaluate the profitability of dairy farm operations. It helps farmers to choose suitable herd size and provides them information regarding their development trend. Through this information and data, dairy farmers can analyze and predict the return of their future investment. It will create a condition for them to receive higher revenue and improve profitability. Moreover, it helps them to use their land more efficiently, improve their pasture quality through calculation of the cost, the efficiency of fodder, the time of feed shortage, and solutions for it.
It is essential to have access to more reliable data for decision making. Farmers should keep records regarding animal performance, such as milk production, breeding, and the health of all their animals. If these records are kept properly, they can help dairy farmers in making the
Chapter 4. Monitoring system and management of dairy farms
around the world, focusing on the Walloon region of Belgium 131
right decision at the right time. Complete milk production records provide the basis required for developing and maintaining a high-producing herd. Milk production records also provide dairymen with information about items affecting breeding efficiency, such as when to dry-off, calving date, calving interval, when to breed, number of inseminations per pregnancy, and so on.
Dairy farmers in Vietnam are almost all smallholders. They are economic units, so it is important for them to monitor their farms more thoroughly. However, they do not have the habit and do not recognize the importance of monitoring their farm through recording transactions and analyzing data. Most of them usually think that monitoring farms is just for and by the local authorities, or for calculating tax, or for scientific research.
It is necessary for dairy farmers in Vietnam to monitor their farms more closely. Through monitoring their farms, they can calculate profit themselves, cover all of their expenses, and make better decisions in doing business and in their lives. They can balance the revenue and expense, and maybe have a part for efficient saving. They also can calculate the real benefit to their business. This will motivate them to do business better in the future.
Proper comparison of the farm’s performance with previous months and years, as well as with other farms of a similar type, can be extremely valuable. They can compare income and expenses, especially detailed expenditures for feed, labor, maintenance, and so on, which will assist them in evaluating their farm’s performance. Milk production records are a must for dairyman to make optimal dairy farm management decisions. Thus, setting up and developing the habit of applying the monitoring technique and management in their farms is important.
Thus, it is necessary to find a suitable model of applying a cost-monitoring system on dairy farms in Vietnam.
• The model of the European (FADN) has advantages that have created a network of data, enabling a comprehensive assessment of the economic activity on the farm; and at the same time it could evaluate the impact of the Common Agricultural Policy of the European on agricultural sectors. However, this model has a limit that is very difficult to apply in the conditions of Vietnam: First, the need for support both to policy and financial aspects. It is quite large and must be synchronized between the government and local authorities. The current conditions of Vietnam hardly make this feasible. Second, this model needs to be applied on a large scale and demands a method and agencies for monitoring that are highly professional and able to perform complex calculations, along with the support of information technology equipment. This is not really suitable in the current limited conditions of Vietnam.
• The model of monitoring system in Belgium, especially the model in Walloon region is very flexible. The greatest advantage of this model is based on the farmers. Monitoring agencies will guide and support farmers to record their data in farms and then calculate the technical and economic indicators for them. In Belgium, this model is successful due to three basic factors: The support of the European Common Agricultural Policy, the intervention and support of the Belgian government, and farms in Belgium are large-scale and almost all of them apply the electronic system for the recording of parameters related to milk production. However, this model can be adjusted and applied to Vietnam’s conditions.
• The model of the Netherlands is very specific, detailed, and complete. It is a good basis for innovation and improvement of farm activities. However, similar to the FADN model, it requires intervention and support both in terms of policy and funding and must be synchronized between the government and local authorities. In addition, because the dairy
132 Chapter 4. Monitoring system and management of dairy farms
around the world, focusing on the Walloon region of Belgium
industry has a long history in the Netherlands, farmers and the supported agencies have accumulated professional skills for farm monitoring and management. The situation is quite different from Vietnam. Thus, this model can hardly be effective when applied to the context of Vietnam.
• The New Zealand model has created good conditions for farmers to exchange, learn, and improve their management skills and manage their farms better. But this model selected only above-average farmers who normally manage their farms quite well. In addition, milk is one of the main products in the New Zealand development strategy; the government has many policies, strategies and development assistance. At the same time, they also have favorable natural conditions. Therefore, Vietnam can learn from the self-learning experience of New Zealand farmers, but it would be difficult to fully apply this model in Vietnam.
• Models from Australia have outstanding advantages. The monitor method is very clear, easy to understand, and easy to apply. However, in order for this model to be used successfully, much intervention and support from the government, as well as local authorities, is necessary. The Australia government and authorities directly carry out monitoring projects annually.
From the above analysis, it is found that a number of factors leading to success and improved efficiency in the cost-monitoring system as well as value-added for farms require that:
1) There be intervention and support from the government and local authorities in terms of both policy and financial aspects.
2) Farms are large-scale and apply the mechanized system to record and manage the parameters related to farm operations and milk production.
3) The farmers have professional skills in milk production.
4) There is support from the agency in farm monitoring or management
Through the experience of other countries, the author found that the most appropriate model that can apply in Vietnam is the model of the Walloon region of Belgium with some adjustment in keeping with real conditions in Vietnam. Besides, to be successful, the following three conditions must be met:
1) Have the support and intervention of the government and local authorities in terms of policy and funding.
2) Have support from international finance organizations.
3) Set up operative monitoring and management agencies.
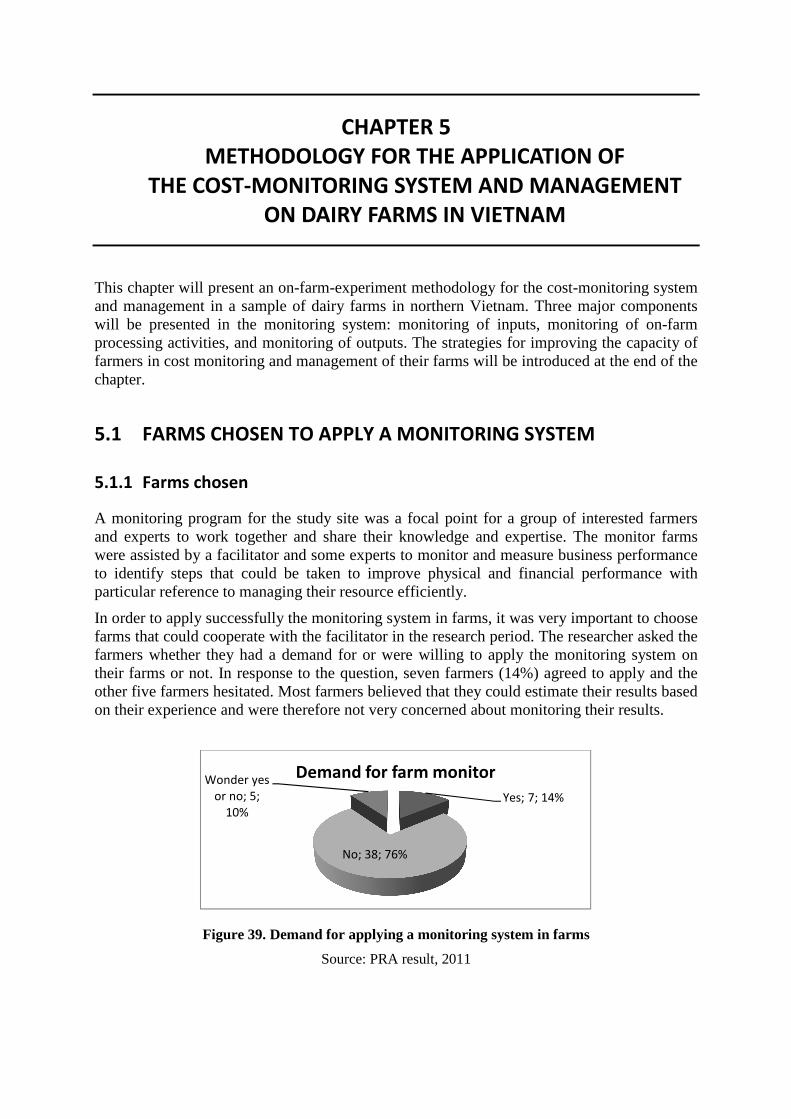
CHAPTER 5
METHODOLOGY FOR THE APPLICATION OF
THE COST-MONITORING SYSTEM AND MANAGEMENT
ON DAIRY FARMS IN VIETNAM
This chapter will present an on-farm-experiment methodology for the cost-monitoring system and management in a sample of dairy farms in northern Vietnam. Three major components will be presented in the monitoring system: monitoring of inputs, monitoring of on-farm processing activities, and monitoring of outputs. The strategies for improving the capacity of farmers in cost monitoring and management of their farms will be introduced at the end of the chapter.
5.1 FARMS CHOSEN TO APPLY A MONITORING SYSTEM
5.1.1 Farms chosen
A monitoring program for the study site was a focal point for a group of interested farmers and experts to work together and share their knowledge and expertise. The monitor farms were assisted by a facilitator and some experts to monitor and measure business performance to identify steps that could be taken to improve physical and financial performance with particular reference to managing their resource efficiently.
In order to apply successfully the monitoring system in farms, it was very important to choose farms that could cooperate with the facilitator in the research period. The researcher asked the farmers whether they had a demand for or were willing to apply the monitoring system on their farms or not. In response to the question, seven farmers (14%) agreed to apply and the other five farmers hesitated. Most farmers believed that they could estimate their results based on their experience and were therefore not very concerned about monitoring their results.
Figure 39. Demand for applying a monitoring system in farms
Source: PRA result, 2011
Yes; 7; 14%
No; 38; 76%
Wonder yes
or no; 5;
10%
Demand for farm monitor
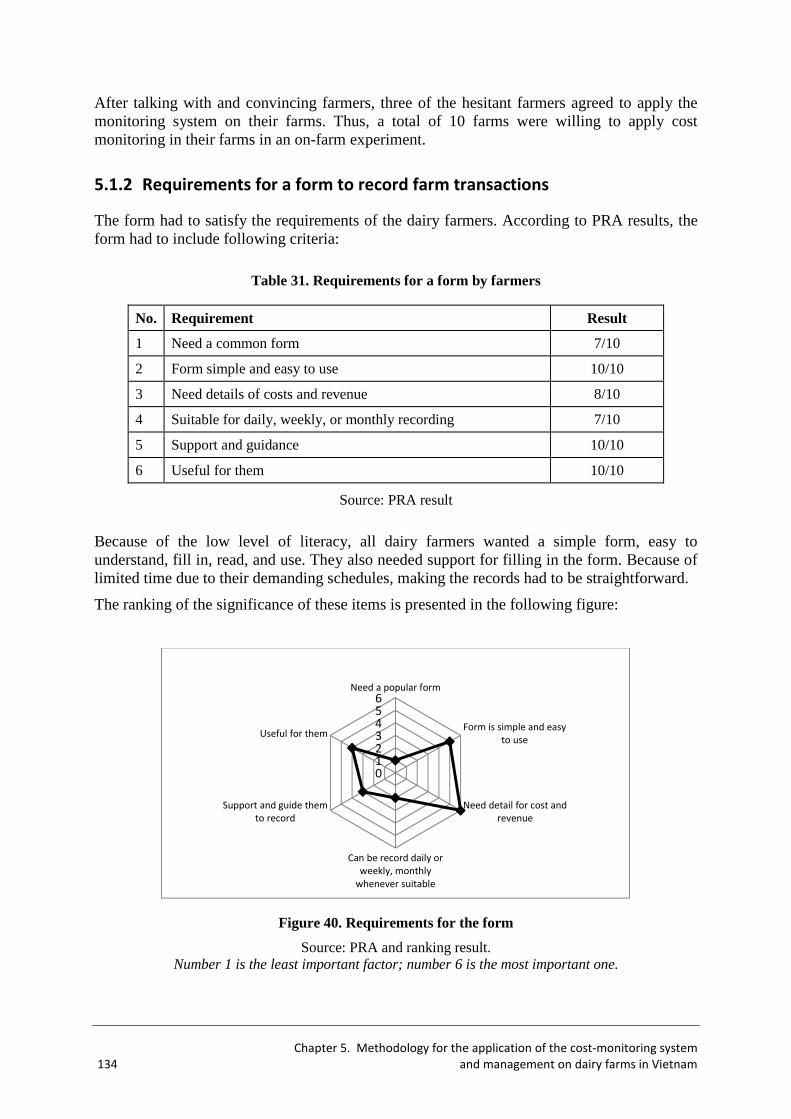
Chapter 5. Methodology for the application of the cost-monitoring system
134 and management on dairy farms in Vietnam
After talking with and convincing farmers, three of the hesitant farmers agreed to apply the monitoring system on their farms. Thus, a total of 10 farms were willing to apply cost monitoring in their farms in an on-farm experiment.
5.1.2 Requirements for a form to record farm transactions
The form had to satisfy the requirements of the dairy farmers. According to PRA results, the form had to include following criteria:
Table 31. Requirements for a form by farmers
No. Requirement Result
1 Need a common form 7/10
2 Form simple and easy to use 10/10
3 Need details of costs and revenue 8/10
4 Suitable for daily, weekly, or monthly recording 7/10
5 Support and guidance 10/10
6 Useful for them 10/10
Source: PRA result
Because of the low level of literacy, all dairy farmers wanted a simple form, easy to understand, fill in, read, and use. They also needed support for filling in the form. Because of limited time due to their demanding schedules, making the records had to be straightforward.
The ranking of the significance of these items is presented in the following figure:
Figure 40. Requirements for the form
Source: PRA and ranking result. Number 1 is the least important factor; number 6 is the most important one.
0123456
Need a popular form
Form is simple and easy
to use
Need detail for cost and
revenue
Can be record daily or
weekly, monthly
whenever suitable
Support and guide them
to record
Useful for them
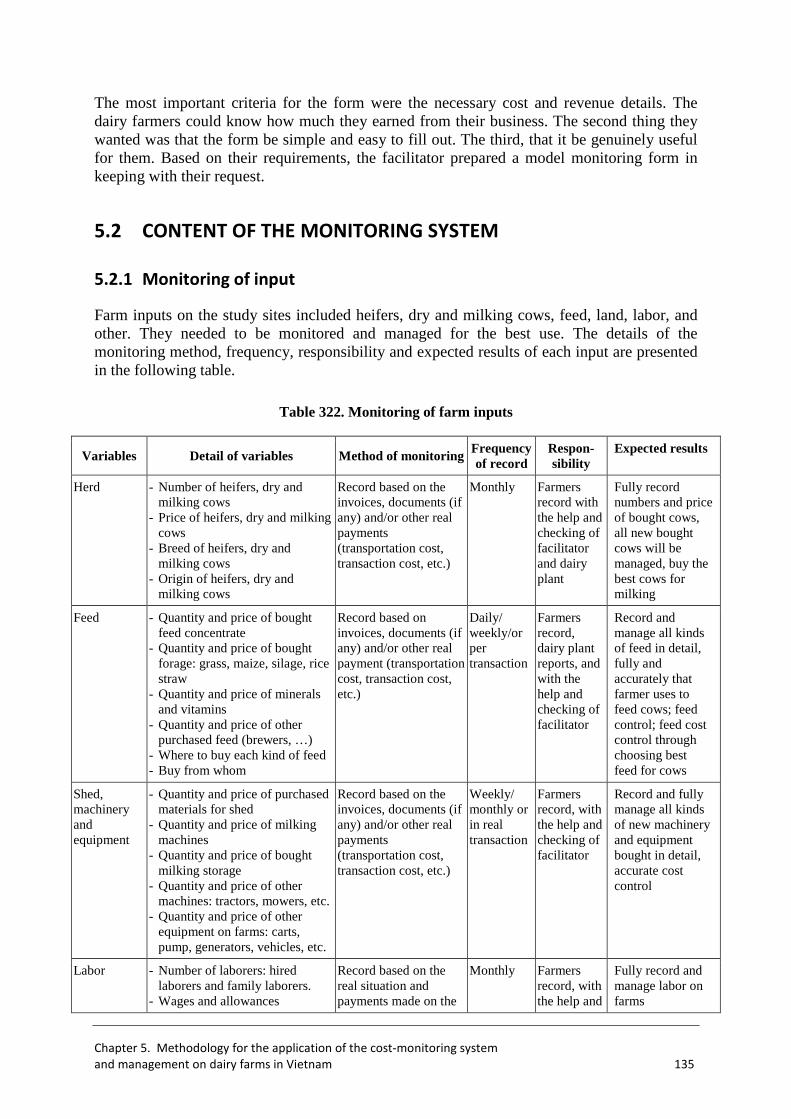
Chapter 5. Methodology for the application of the cost-monitoring system
and management on dairy farms in Vietnam 135
The most important criteria for the form were the necessary cost and revenue details. The dairy farmers could know how much they earned from their business. The second thing they wanted was that the form be simple and easy to fill out. The third, that it be genuinely useful for them. Based on their requirements, the facilitator prepared a model monitoring form in keeping with their request.
5.2 CONTENT OF THE MONITORING SYSTEM
5.2.1 Monitoring of input
Farm inputs on the study sites included heifers, dry and milking cows, feed, land, labor, and other. They needed to be monitored and managed for the best use. The details of the monitoring method, frequency, responsibility and expected results of each input are presented in the following table.
Table 322. Monitoring of farm inputs
Variables Detail of variables Method of monitoring Frequency of record
Respon-sibility
Expected results
Herd - Number of heifers, dry and milking cows
- Price of heifers, dry and milking cows
- Breed of heifers, dry and milking cows
- Origin of heifers, dry and milking cows
Record based on the invoices, documents (if any) and/or other real payments (transportation cost, transaction cost, etc.)
Monthly Farmers record with the help and checking of facilitator and dairy plant
Fully record numbers and price of bought cows, all new bought cows will be managed, buy the best cows for milking
Feed - Quantity and price of bought feed concentrate
- Quantity and price of bought forage: grass, maize, silage, rice straw
- Quantity and price of minerals and vitamins
- Quantity and price of other purchased feed (brewers, …)
- Where to buy each kind of feed - Buy from whom
Record based on invoices, documents (if any) and/or other real payment (transportation cost, transaction cost, etc.)
Daily/ weekly/or per transaction
Farmers record, dairy plant reports, and with the help and checking of facilitator
Record and manage all kinds of feed in detail, fully and accurately that farmer uses to feed cows; feed control; feed cost control through choosing best feed for cows
Shed, machinery and equipment
- Quantity and price of purchased materials for shed
- Quantity and price of milking machines
- Quantity and price of bought milking storage
- Quantity and price of other machines: tractors, mowers, etc.
- Quantity and price of other equipment on farms: carts, pump, generators, vehicles, etc.
Record based on the invoices, documents (if any) and/or other real payments (transportation cost, transaction cost, etc.)
Weekly/ monthly or in real transaction
Farmers record, with the help and checking of facilitator
Record and fully manage all kinds of new machinery and equipment bought in detail, accurate cost control
Labor - Number of laborers: hired laborers and family laborers.
- Wages and allowances
Record based on the real situation and payments made on the
Monthly Farmers record, with the help and
Fully record and manage labor on farms
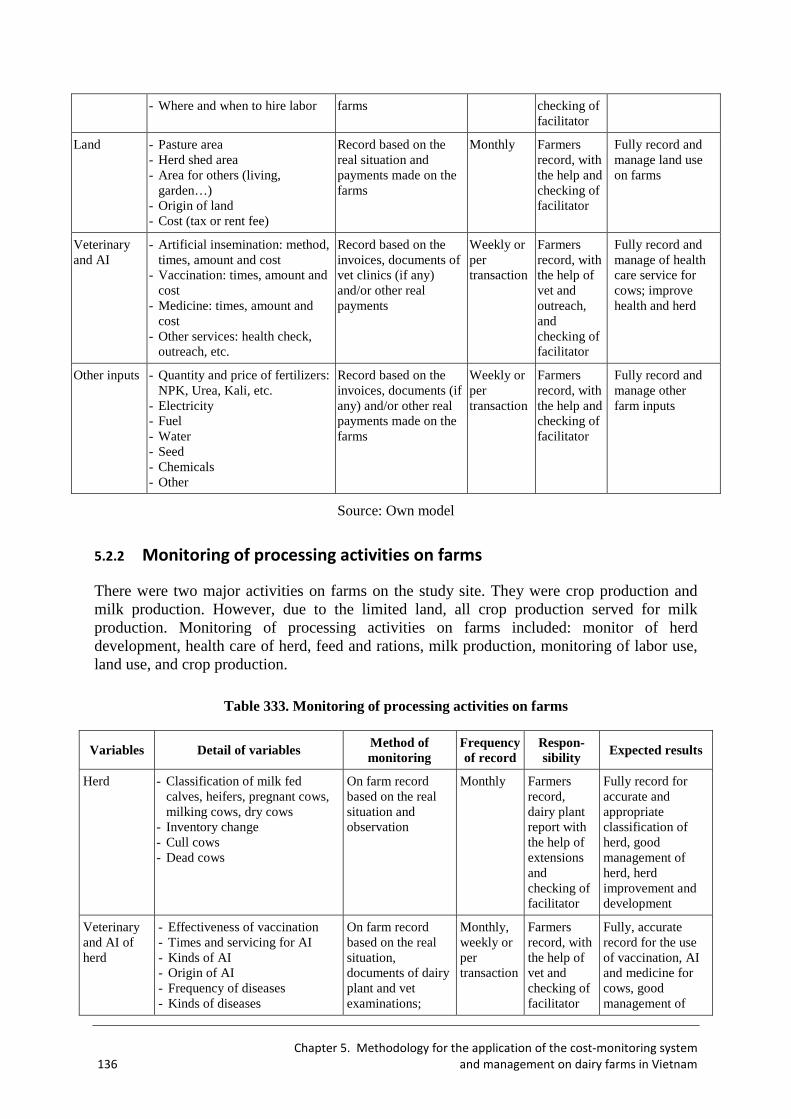
Chapter 5. Methodology for the application of the cost-monitoring system
136 and management on dairy farms in Vietnam
- Where and when to hire labor farms checking of facilitator
Land - Pasture area - Herd shed area - Area for others (living,
garden…) - Origin of land - Cost (tax or rent fee)
Record based on the real situation and payments made on the farms
Monthly Farmers record, with the help and checking of facilitator
Fully record and manage land use on farms
Veterinary and AI
- Artificial insemination: method, times, amount and cost
- Vaccination: times, amount and cost
- Medicine: times, amount and cost
- Other services: health check, outreach, etc.
Record based on the invoices, documents of vet clinics (if any) and/or other real payments
Weekly or per transaction
Farmers record, with the help of vet and outreach, and checking of facilitator
Fully record and manage of health care service for cows; improve health and herd
Other inputs - Quantity and price of fertilizers: NPK, Urea, Kali, etc.
- Electricity - Fuel - Water - Seed - Chemicals - Other
Record based on the invoices, documents (if any) and/or other real payments made on the farms
Weekly or per transaction
Farmers record, with the help and checking of facilitator
Fully record and manage other farm inputs
Source: Own model
5.2.2 Monitoring of processing activities on farms
There were two major activities on farms on the study site. They were crop production and milk production. However, due to the limited land, all crop production served for milk production. Monitoring of processing activities on farms included: monitor of herd development, health care of herd, feed and rations, milk production, monitoring of labor use, land use, and crop production.
Table 333. Monitoring of processing activities on farms
Variables Detail of variables Method of monitoring
Frequency of record
Respon-sibility
Expected results
Herd - Classification of milk fed calves, heifers, pregnant cows, milking cows, dry cows
- Inventory change - Cull cows - Dead cows
On farm record based on the real situation and observation
Monthly Farmers record, dairy plant report with the help of extensions and checking of facilitator
Fully record for accurate and appropriate classification of herd, good management of herd, herd improvement and development
Veterinary and AI of herd
- Effectiveness of vaccination - Times and servicing for AI - Kinds of AI - Origin of AI - Frequency of diseases - Kinds of diseases
On farm record based on the real situation, documents of dairy plant and vet examinations;
Monthly, weekly or per transaction
Farmers record, with the help of vet and checking of facilitator
Fully, accurate record for the use of vaccination, AI and medicine for cows, good management of
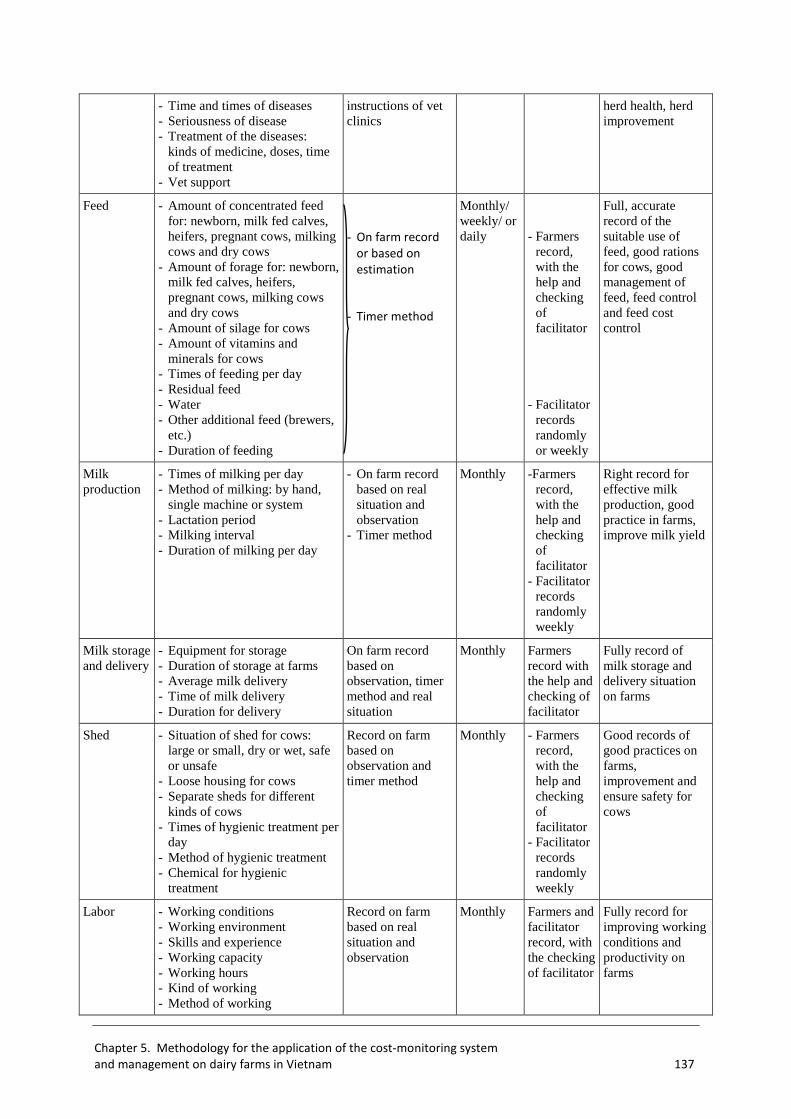
Chapter 5. Methodology for the application of the cost-monitoring system
and management on dairy farms in Vietnam 137
- Time and times of diseases - Seriousness of disease - Treatment of the diseases:
kinds of medicine, doses, time of treatment
- Vet support
instructions of vet clinics
herd health, herd improvement
Feed - Amount of concentrated feed for: newborn, milk fed calves, heifers, pregnant cows, milking cows and dry cows
- Amount of forage for: newborn, milk fed calves, heifers, pregnant cows, milking cows and dry cows
- Amount of silage for cows - Amount of vitamins and
minerals for cows - Times of feeding per day - Residual feed - Water - Other additional feed (brewers,
etc.) - Duration of feeding
- On farm record
or based on
estimation
- Timer method
Monthly/weekly/ or daily
- Farmers
record, with the help and checking of facilitator
- Facilitator
records randomly or weekly
Full, accurate record of the suitable use of feed, good rations for cows, good management of feed, feed control and feed cost control
Milk production
- Times of milking per day - Method of milking: by hand,
single machine or system - Lactation period - Milking interval - Duration of milking per day
- On farm record based on real situation and observation
- Timer method
Monthly -Farmers record, with the help and checking of facilitator
- Facilitator records randomly weekly
Right record for effective milk production, good practice in farms, improve milk yield
Milk storage and delivery
- Equipment for storage - Duration of storage at farms - Average milk delivery - Time of milk delivery - Duration for delivery
On farm record based on observation, timer method and real situation
Monthly Farmers record with the help and checking of facilitator
Fully record of milk storage and delivery situation on farms
Shed - Situation of shed for cows: large or small, dry or wet, safe or unsafe
- Loose housing for cows - Separate sheds for different
kinds of cows - Times of hygienic treatment per
day - Method of hygienic treatment - Chemical for hygienic
treatment
Record on farm based on observation and timer method
Monthly - Farmers record, with the help and checking of facilitator
- Facilitator records randomly weekly
Good records of good practices on farms, improvement and ensure safety for cows
Labor - Working conditions - Working environment - Skills and experience - Working capacity - Working hours - Kind of working - Method of working
Record on farm based on real situation and observation
Monthly Farmers and facilitator record, with the checking of facilitator
Fully record for improving working conditions and productivity on farms
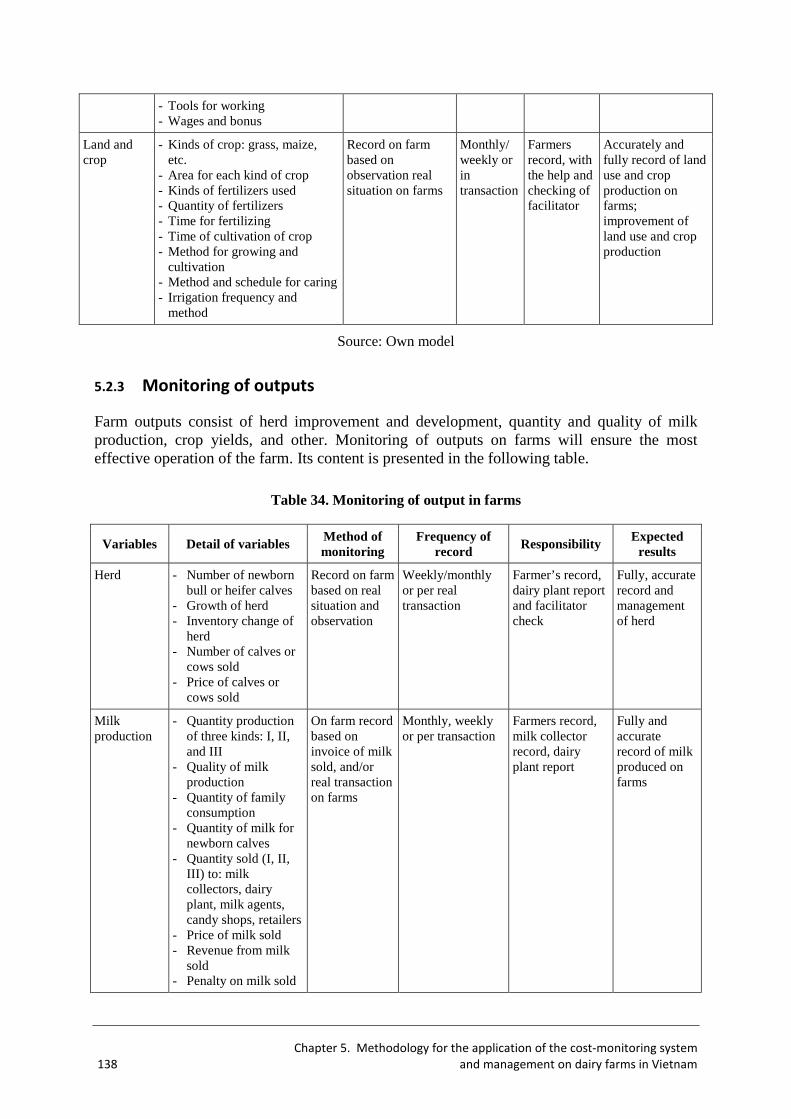
Chapter 5. Methodology for the application of the cost-monitoring system
138 and management on dairy farms in Vietnam
- Tools for working - Wages and bonus
Land and crop
- Kinds of crop: grass, maize, etc.
- Area for each kind of crop - Kinds of fertilizers used - Quantity of fertilizers - Time for fertilizing - Time of cultivation of crop - Method for growing and
cultivation - Method and schedule for caring - Irrigation frequency and
method
Record on farm based on observation real situation on farms
Monthly/weekly or in transaction
Farmers record, with the help and checking of facilitator
Accurately and fully record of land use and crop production on farms; improvement of land use and crop production
Source: Own model
5.2.3 Monitoring of outputs
Farm outputs consist of herd improvement and development, quantity and quality of milk production, crop yields, and other. Monitoring of outputs on farms will ensure the most effective operation of the farm. Its content is presented in the following table.
Table 34. Monitoring of output in farms
Variables Detail of variables Method of monitoring
Frequency of record
Responsibility Expected results
Herd - Number of newborn bull or heifer calves
- Growth of herd - Inventory change of
herd - Number of calves or
cows sold - Price of calves or
cows sold
Record on farm based on real situation and observation
Weekly/monthly or per real transaction
Farmer’s record, dairy plant report and facilitator check
Fully, accurate record and management of herd
Milk production
- Quantity production of three kinds: I, II, and III
- Quality of milk production
- Quantity of family consumption
- Quantity of milk for newborn calves
- Quantity sold (I, II, III) to: milk collectors, dairy plant, milk agents, candy shops, retailers
- Price of milk sold - Revenue from milk
sold - Penalty on milk sold
On farm record based on invoice of milk sold, and/or real transaction on farms
Monthly, weekly or per transaction
Farmers record, milk collector record, dairy plant report
Fully and accurate record of milk produced on farms
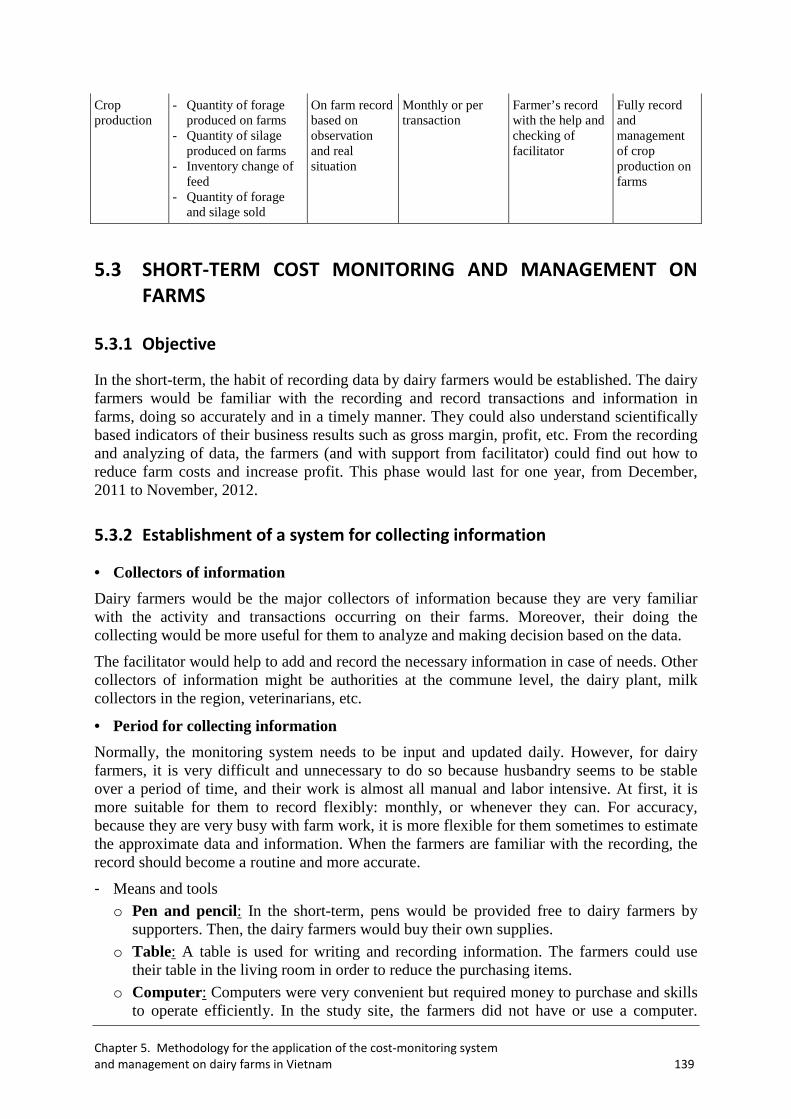
Chapter 5. Methodology for the application of the cost-monitoring system
and management on dairy farms in Vietnam 139
Crop production
- Quantity of forage produced on farms
- Quantity of silage produced on farms
- Inventory change of feed
- Quantity of forage and silage sold
On farm record based on observation and real situation
Monthly or per transaction
Farmer’s record with the help and checking of facilitator
Fully record and management of crop production on farms
5.3 SHORT-TERM COST MONITORING AND MANAGEMENT ON
FARMS
5.3.1 Objective
In the short-term, the habit of recording data by dairy farmers would be established. The dairy farmers would be familiar with the recording and record transactions and information in farms, doing so accurately and in a timely manner. They could also understand scientifically based indicators of their business results such as gross margin, profit, etc. From the recording and analyzing of data, the farmers (and with support from facilitator) could find out how to reduce farm costs and increase profit. This phase would last for one year, from December, 2011 to November, 2012.
5.3.2 Establishment of a system for collecting information
• Collectors of information
Dairy farmers would be the major collectors of information because they are very familiar with the activity and transactions occurring on their farms. Moreover, their doing the collecting would be more useful for them to analyze and making decision based on the data.
The facilitator would help to add and record the necessary information in case of needs. Other collectors of information might be authorities at the commune level, the dairy plant, milk collectors in the region, veterinarians, etc.
• Period for collecting information
Normally, the monitoring system needs to be input and updated daily. However, for dairy farmers, it is very difficult and unnecessary to do so because husbandry seems to be stable over a period of time, and their work is almost all manual and labor intensive. At first, it is more suitable for them to record flexibly: monthly, or whenever they can. For accuracy, because they are very busy with farm work, it is more flexible for them sometimes to estimate the approximate data and information. When the farmers are familiar with the recording, the record should become a routine and more accurate.
- Means and tools o Pen and pencil: In the short-term, pens would be provided free to dairy farmers by
supporters. Then, the dairy farmers would buy their own supplies.
o Table: A table is used for writing and recording information. The farmers could use their table in the living room in order to reduce the purchasing items.
o Computer: Computers were very convenient but required money to purchase and skills to operate efficiently. In the study site, the farmers did not have or use a computer.
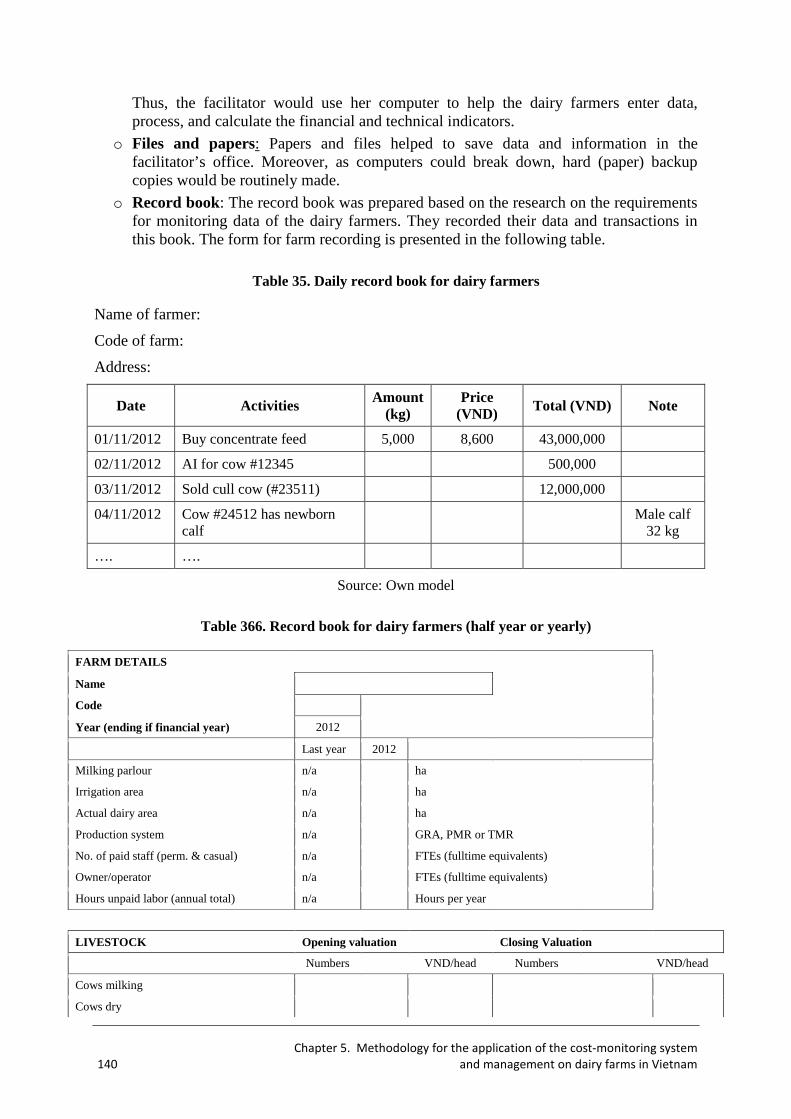
Chapter 5. Methodology for the application of the cost-monitoring system
140 and management on dairy farms in Vietnam
Thus, the facilitator would use her computer to help the dairy farmers enter data, process, and calculate the financial and technical indicators.
o Files and papers: Papers and files helped to save data and information in the facilitator’s office. Moreover, as computers could break down, hard (paper) backup copies would be routinely made.
o Record book: The record book was prepared based on the research on the requirements for monitoring data of the dairy farmers. They recorded their data and transactions in this book. The form for farm recording is presented in the following table.
Table 35. Daily record book for dairy farmers
Name of farmer:
Code of farm:
Address:
Date Activities Amount (kg)
Price (VND) Total (VND) Note
01/11/2012 Buy concentrate feed 5,000 8,600 43,000,000
02/11/2012 AI for cow #12345 500,000
03/11/2012 Sold cull cow (#23511) 12,000,000
04/11/2012 Cow #24512 has newborn calf
Male calf
32 kg
…. ….
Source: Own model
Table 366. Record book for dairy farmers (half year or yearly)
FARM DETAILS
Name
Code
Year (ending if financial year) 2012
Last year 2012
Milking parlour n/a ha
Irrigation area n/a ha
Actual dairy area n/a ha
Production system n/a GRA, PMR or TMR
No. of paid staff (perm. & casual) n/a FTEs (fulltime equivalents)
Owner/operator n/a FTEs (fulltime equivalents)
Hours unpaid labor (annual total) n/a Hours per year
LIVESTOCK Opening valuation Closing Valuation
Numbers VND/head Numbers VND/head
Cows milking
Cows dry
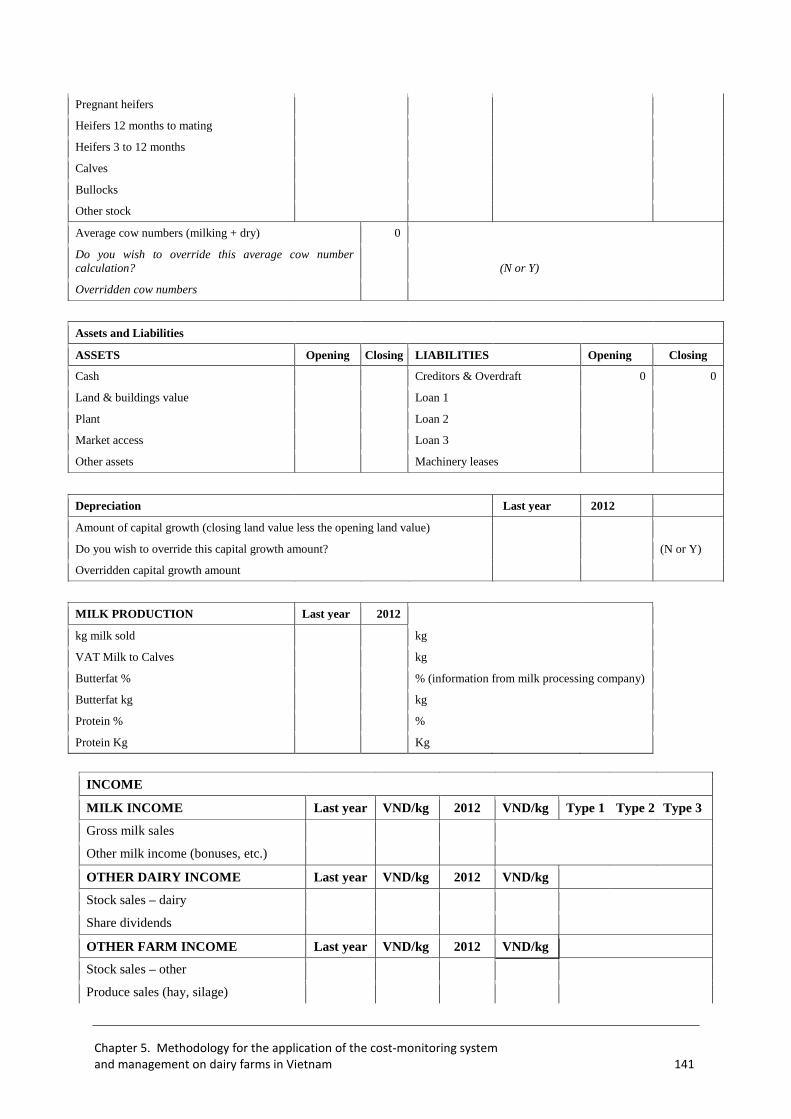
Chapter 5. Methodology for the application of the cost-monitoring system
and management on dairy farms in Vietnam 141
Pregnant heifers
Heifers 12 months to mating
Heifers 3 to 12 months
Calves
Bullocks
Other stock
Average cow numbers (milking + dry) 0
Do you wish to override this average cow number calculation? (N or Y)
Overridden cow numbers
Assets and Liabilities
ASSETS Opening Closing LIABILITIES Opening Closing
Cash Creditors & Overdraft 0 0
Land & buildings value Loan 1
Plant Loan 2
Market access Loan 3
Other assets Machinery leases
Depreciation Last year 2012
Amount of capital growth (closing land value less the opening land value)
Do you wish to override this capital growth amount? (N or Y)
Overridden capital growth amount
MILK PRODUCTION Last year 2012
kg milk sold kg
VAT Milk to Calves kg
Butterfat % % (information from milk processing company)
Butterfat kg kg
Protein % %
Protein Kg Kg
INCOME
MILK INCOME Last year VND/kg 2012 VND/kg Type 1 Type 2 Type 3
Gross milk sales
Other milk income (bonuses, etc.)
OTHER DAIRY INCOME Last year VND/kg 2012 VND/kg
Stock sales – dairy
Share dividends
OTHER FARM INCOME Last year VND/kg 2012 VND/kg
Stock sales – other
Produce sales (hay, silage)
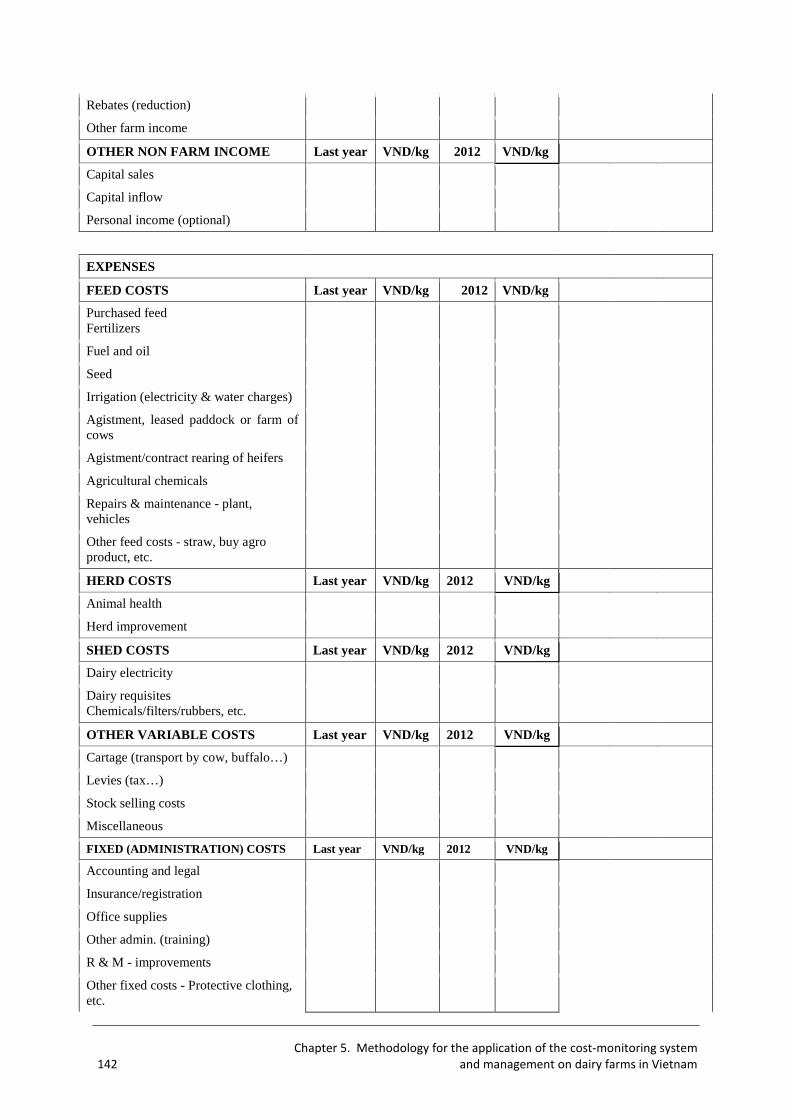
Chapter 5. Methodology for the application of the cost-monitoring system
142 and management on dairy farms in Vietnam
Rebates (reduction)
Other farm income
OTHER NON FARM INCOME Last year VND/kg 2012 VND/kg
Capital sales
Capital inflow
Personal income (optional)
EXPENSES
FEED COSTS Last year VND/kg 2012 VND/kg
Purchased feed Fertilizers
Fuel and oil
Seed
Irrigation (electricity & water charges)
Agistment, leased paddock or farm of cows
Agistment/contract rearing of heifers
Agricultural chemicals
Repairs & maintenance - plant, vehicles
Other feed costs - straw, buy agro product, etc.
HERD COSTS Last year VND/kg 2012 VND/kg
Animal health
Herd improvement
SHED COSTS Last year VND/kg 2012 VND/kg
Dairy electricity
Dairy requisites Chemicals/filters/rubbers, etc.
OTHER VARIABLE COSTS Last year VND/kg 2012 VND/kg
Cartage (transport by cow, buffalo…)
Levies (tax…)
Stock selling costs
Miscellaneous
FIXED (ADMINISTRATION) COSTS Last year VND/kg 2012 VND/kg
Accounting and legal
Insurance/registration
Office supplies
Other admin. (training)
R & M - improvements
Other fixed costs - Protective clothing, etc.
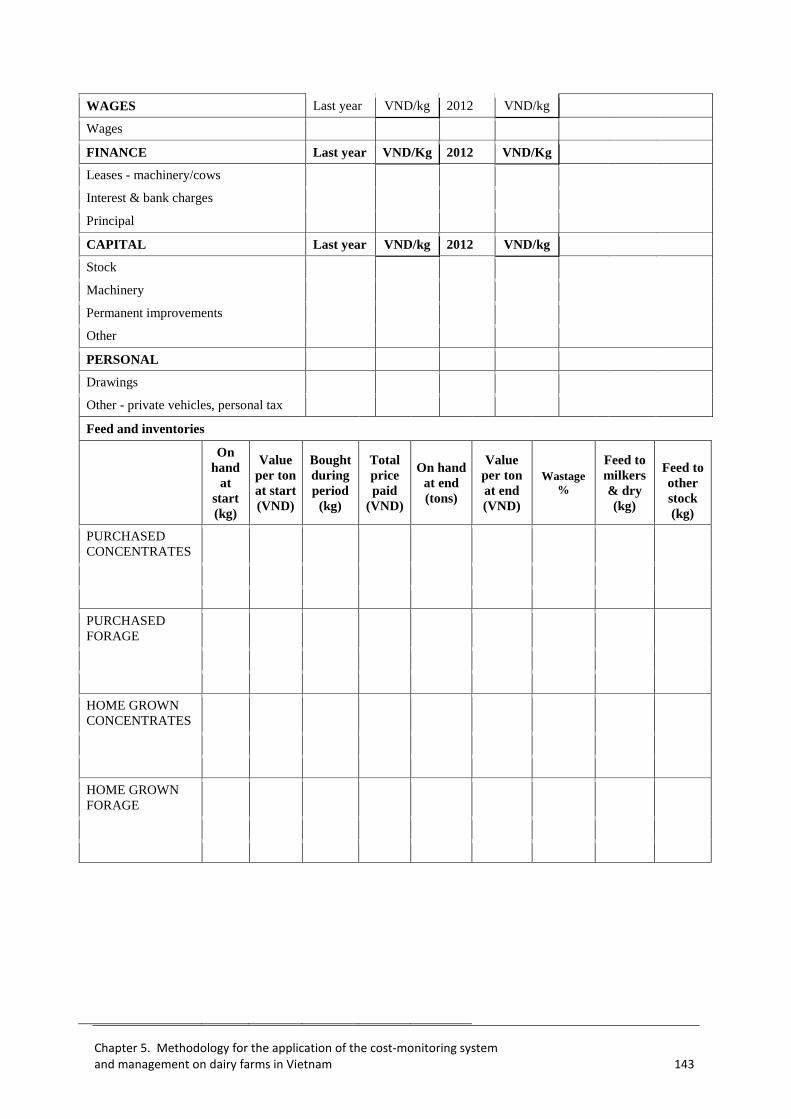
Chapter 5. Methodology for the application of the cost-monitoring system
and management on dairy farms in Vietnam 143
WAGES Last year VND/kg 2012 VND/kg
Wages
FINANCE Last year VND/Kg 2012 VND/Kg
Leases - machinery/cows
Interest & bank charges
Principal
CAPITAL Last year VND/kg 2012 VND/kg
Stock
Machinery
Permanent improvements
Other
PERSONAL
Drawings
Other - private vehicles, personal tax
Feed and inventories
On hand
at start (kg)
Value per ton at start (VND)
Bought during period (kg)
Total price paid
(VND)
On hand at end (tons)
Value per ton at end (VND)
Wastage %
Feed to milkers & dry (kg)
Feed to other stock (kg)
PURCHASED CONCENTRATES
PURCHASED FORAGE
HOME GROWN CONCENTRATES
HOME GROWN FORAGE
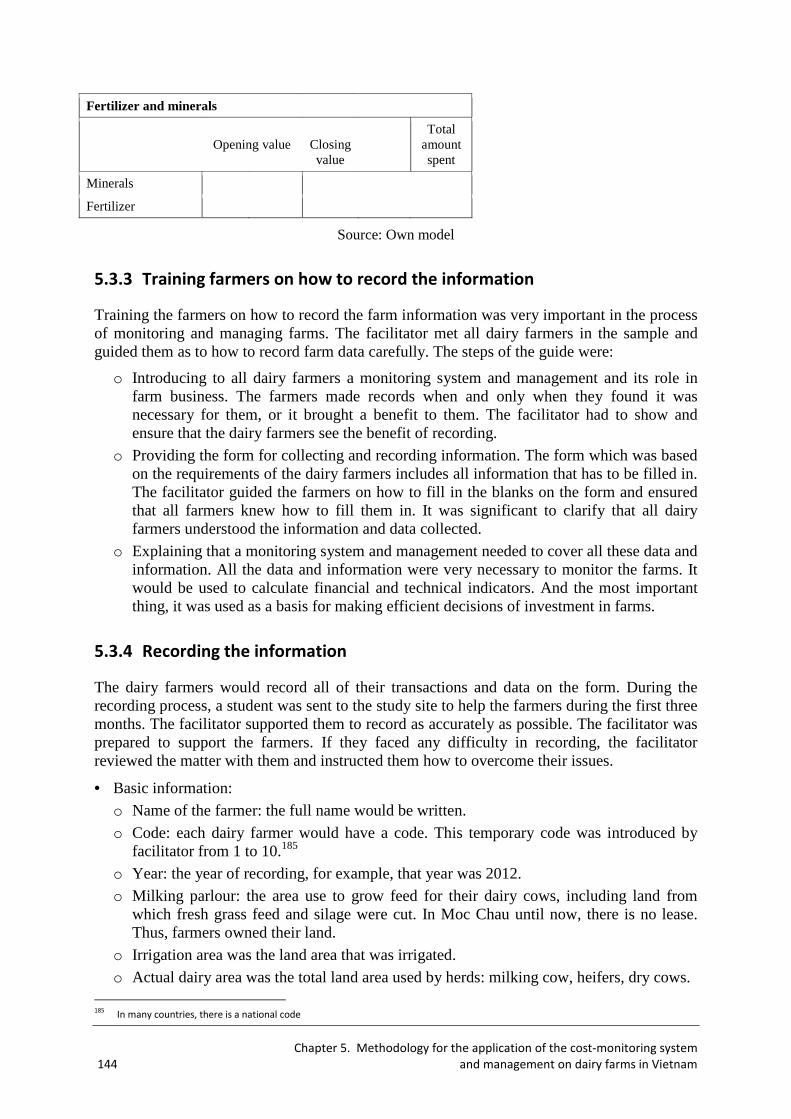
Chapter 5. Methodology for the application of the cost-monitoring system
144 and management on dairy farms in Vietnam
Fertilizer and minerals
Opening value
Closing value
Total amount spent
Minerals
Fertilizer
Source: Own model
5.3.3 Training farmers on how to record the information
Training the farmers on how to record the farm information was very important in the process of monitoring and managing farms. The facilitator met all dairy farmers in the sample and guided them as to how to record farm data carefully. The steps of the guide were:
o Introducing to all dairy farmers a monitoring system and management and its role in farm business. The farmers made records when and only when they found it was necessary for them, or it brought a benefit to them. The facilitator had to show and ensure that the dairy farmers see the benefit of recording.
o Providing the form for collecting and recording information. The form which was based on the requirements of the dairy farmers includes all information that has to be filled in. The facilitator guided the farmers on how to fill in the blanks on the form and ensured that all farmers knew how to fill them in. It was significant to clarify that all dairy farmers understood the information and data collected.
o Explaining that a monitoring system and management needed to cover all these data and information. All the data and information were very necessary to monitor the farms. It would be used to calculate financial and technical indicators. And the most important thing, it was used as a basis for making efficient decisions of investment in farms.
5.3.4 Recording the information
The dairy farmers would record all of their transactions and data on the form. During the recording process, a student was sent to the study site to help the farmers during the first three months. The facilitator supported them to record as accurately as possible. The facilitator was prepared to support the farmers. If they faced any difficulty in recording, the facilitator reviewed the matter with them and instructed them how to overcome their issues.
• Basic information:
o Name of the farmer: the full name would be written.
o Code: each dairy farmer would have a code. This temporary code was introduced by facilitator from 1 to 10.185
o Year: the year of recording, for example, that year was 2012.
o Milking parlour: the area use to grow feed for their dairy cows, including land from which fresh grass feed and silage were cut. In Moc Chau until now, there is no lease. Thus, farmers owned their land.
o Irrigation area was the land area that was irrigated.
o Actual dairy area was the total land area used by herds: milking cow, heifers, dry cows. 185
In many countries, there is a national code
Chapter 5. Methodology for the application of the cost-monitoring system
and management on dairy farms in Vietnam 145
o Production system: type of production: grazing, pasture, mix rations or total mix rations.
o Number of paid staff (permanent and casual): number of fulltime equivalents hired laborers on farms, permanent and casual.
o Owner/operator: number of full time equivalent owners or operators working on farms.
o Hour of unpaid labor: number of hours per annum of family unpaid labor.
• Livestock o Opening valuation: number of head, the estimated market price per head, and value at
the beginning of the recording period.
o Closing valuation: number of head and the estimated market price per head and value at the end of the recording period.
o Cows milking: number of milking cows.
o Cows dry: number of dry cows.
o Pregnant heifers: number of heifers that had been mated and will be milking in the near future.
o Heifers 12 months to mating: number of heifers from 12 months to insemination date.
o Heifers 3 to 12 months: number of heifers from 3 to 12 months.
o Calves: number of calves less than 3 months.
o Bullocks: number of bullocks on farm (normally older than 12 months, used as draft animals).
o Other stock: other kinds of stock in farms.
• Assets and liabilities: o Assets: all that was used to generate income, either owned or purchased on credit. This
was a combination of physical and monetary values, with the physical quantity multiplied by a unit price to obtain its monetary value. It included:
- Cash: amount of money held by the farm at the beginning and at the end of the recording period.
- Land building value: value of land building of the farms.
- Plant: value of plants on farms (if applicable).
- Market access: value of an asset that is in the market.
- Other assets: value of other assets in farms.
- Livestock: value of total livestock in farms (from the above calculation).
- Inventories: total value of inventories in farms. o Liabilities: what farmers still had on credit
- Creditors and overdraft: total money owed by the farmers in the short term and an extension of credit that they could withdraw.
- Loan: amount of money that farmers borrowed from others.
- Machinery leases: value that machinery brought in as it was leased by other people. o Depreciation: allocation of the cost of assets to periods in which the assets were used.
• Milk production: o kg milk sold: quantity in kg of milk that farms sold
o VAT milk to calves: quantity of milk used for raising newborn calves
o Butterfat: butter in kg and in percentage of milk
o Protein: protein in kg and in percentage of milk
Chapter 5. Methodology for the application of the cost-monitoring system
146 and management on dairy farms in Vietnam
• Income: o Milk income:
o Gross milk income: revenue from the sale of milk
o Other milk income: other income from the sale of milk such as a bonus.
o Other dairy income: other income from dairy such as stock sale of dairy or share dividends.
o Other farm income: other non-dairy income of farm activities such as stock sale of chickens, ducks, vegetables, silage, etc., or rebate and the like.
o Other non-farm income: other non-farm income such as capital sales, capital inflow, personal income of a family member.
5.3.5 Processing and analyzing the information
At the first phase, the facilitator would process and analyze the data and information. After a period of six months of farm data recording, the facilitator would check the data. Yearly, the facilitator would process it by computer and calculate the major indicators. Then she/he would analyze the performance of the farms at the individual level and at the general level. After that, the farmers would be provided with the major financial indicators of their own operation and of the average level.
5.4 LONG-TERM MONITORING IN FARMS
5.4.1 Objectives
The main objective of the long-term monitoring on farms is that dairy farmers can make suitable decisions based on analysis of the data. The ideal result is that they can invest efficiently as smart investors. The farmers can make suitable decisions of investment in quantity, such as how many cows they should keep; how much grass they should grow, etc. They can make decisions of higher quality. They will decide what, when, how much, etc., they should invest to bring them the best profits and benefits.
The skills of the farmers in processing and analyzing data will be built. The farmers will know how to calculate scientifically financial and technical indicators for the whole year and whole production cycle. They can identify problems and reposition the organization of their farms to take full advantage of emerging opportunities. They can act as a farm managerial accountant and manager of their business farms. This phase is estimated to take up to five years.
At first, the facilitator will calculate all economic indicators for dairy farmers. The facilitator also analyzes, points out some weaknesses of the farm operation, and suggests some solutions to the problems. This will help dairy farmers improve their economic performance.
Step by step, the dairy farmers will be trained to be able to calculate and analyze the indicators themselves. In order to transfer the technique to the farmers, the facilitator has to instruct them on how to calculate the economic variables.
When the farmers understand thoroughly and can calculate the economic variables, they will be trained to be able to calculate financial and technical indicators.
Chapter 5. Methodology for the application of the cost-monitoring system
and management on dairy farms in Vietnam 147
5.4.2 Decision making based on monitoring system and management on
farms
• Dry matter of milk
The price of milk sales is normally based on the dry matter of milk. Improving the dry matter of milk will increase milk income for farmers. Calculating dry matter of milk will help farmers to make suitable decisions, whether they should expand the scales of production or improve the milk quality.
• Milk production per cow
This indicator shows the quantity of milk that a cow produces in a period of time. The more milk a cow can produce, the higher the profitability of the cow. An increase in the number of cows will scale up the farm, but it will not be sure of getting greater profitability if milk production per cow is low. This indicator will help farmers to choose which cows and how many cows to keep on their farms to get optimal productivity.
• Milk from home-grown feed
This indicator shows the quantity of milk produced from the forage and concentrate that dairy farmers produce themselves. The higher the number, the better. A high value of this indicator means that the farmers will reduce purchased feed, so they do not depend on the market. If the value is low, the farmers will depend on the feed market and this will make them vulnerable when the market fluctuates. This indicator helps the farmers to choose whether they should produce the feed themselves or purchase.
• Return on assets (and return on equity)
This measures the value of dairy profit created by one unit of asset (equity). The higher this indicator, the better the operation of farm. Even if the total profit of a farm is high, it does not mean that the farm is operating well if its costs are high. This indicator helps farmers to choose an amount of investment that will bring highest profitability.
• Operating profit margin
This financial indicator measures levels and rates of profitability. It gives the farmers much valuable information about the farm’s profitability, particularly with regard to cost control. It shows how much cash is thrown off after most of the expenses are met. A high operating profit margin means that the farm has good cost control and/or that sales are increasing faster than costs, which is the optimal situation for the farms. Operating profit will be a lot lower than the gross profit since selling, administrative, and other expenses are included along with cost of goods sold.
• Asset turnover ratio
This is the amount of sales generated for each unit of asset. It measures a farm’s efficiency in using its assets to generate sales or revenue. The higher the number, the better. Farms with low profit margins tend to have a high asset turnover ratio, while those with high profit margins have a low asset turnover.
Chapter 5. Methodology for the application of the cost-monitoring system
148 and management on dairy farms in Vietnam
• Feed-related costs ratio (kg)
This measures the productivity of a farm in producing milk. It shows the amount that the farmer has to pay for feed in order to produce 1 kg of milk. The lower the number, the better. If the number is too high, the profit level will tend to fall and the probability for farmers to succeed will likewise fall. In this case, the farmers have to reconsider how the farm is operated.
CHAPTER 6
RESULTS OF THE APPLICATION OF COST MONITORING
ON NORTHERN VIETNAM DAIRY FARMS
Chapter 6 begins with the research findings regarding the interest of dairy farmers in testing the project of applying cost monitoring on their farms. Then difficulties in the process of applying the project will be analyzed, followed by the recommended solution. The chapter concludes with a model for the future application of cost monitoring on farms, which refers to the necessary model chosen, the cost calculation for applying the model, and sharing of cost among stakeholders.
6.1 INTEREST OF DAIRY FARMERS DURING PERIOD OF
APPLICATION OF COST-MONITORING SYSTEM
6.1.1 Methodology to get results
In order to know whether the farmers were interested in applying the monitoring system on farms or not, and to what extent they wanted to apply it, the researcher made a field trip to the study site, met individually with each farmer, then held a group discussion with them.
In the individual meetings, the researcher went to the dairy farmer’s house to meet, introduce the project, and discuss with each of the dairy farmers individually about his/her results after the period of monitoring. The results included the economic results, financial results, and technical results. For each variable or indicator, the researcher showed his/her results in parallel with the average results of the farms and the result of the best farm among them. Thus, each farmer could compare his/her results with those of the others. From that, he/she would see whether his/her results were high or low, good or bad. Here are examples of the results on farm 8 and farm 10.
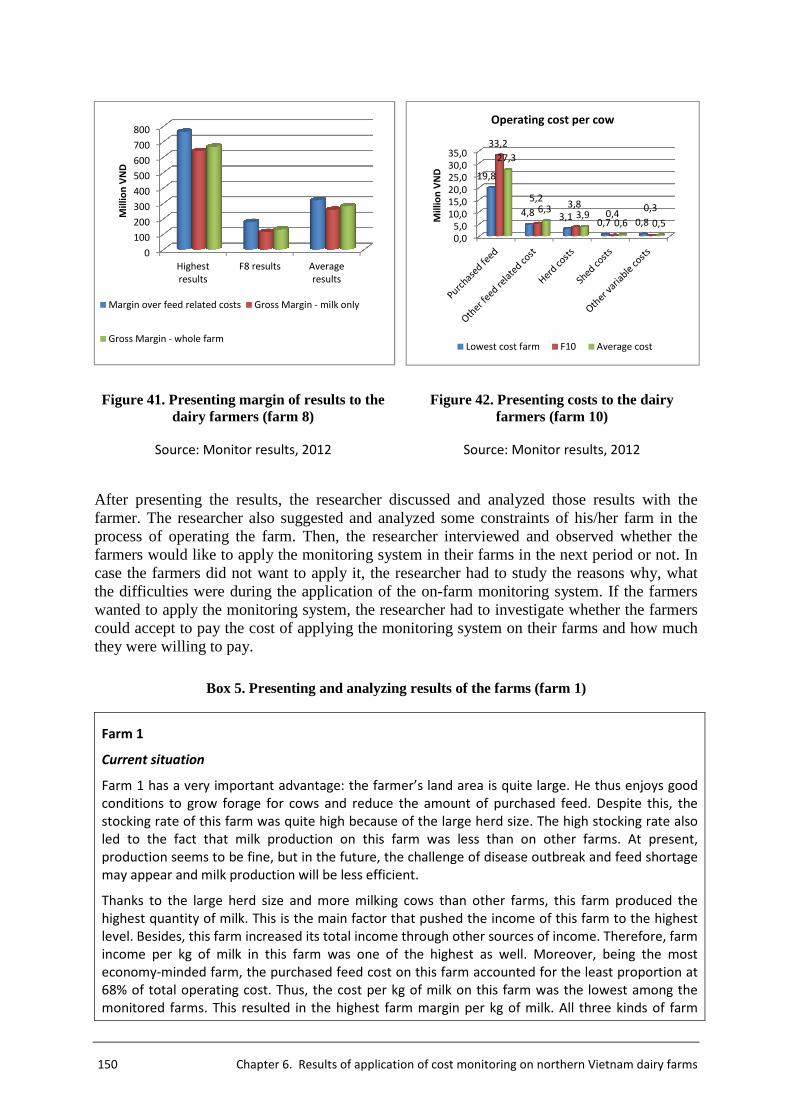
150 Chapter 6. Results of application of cost monitoring on northern Vietnam dairy farms
Figure 41. Presenting margin of results to the dairy farmers (farm 8)
Figure 42. Presenting costs to the dairy farmers (farm 10)
Source: Monitor results, 2012 Source: Monitor results, 2012
After presenting the results, the researcher discussed and analyzed those results with the farmer. The researcher also suggested and analyzed some constraints of his/her farm in the process of operating the farm. Then, the researcher interviewed and observed whether the farmers would like to apply the monitoring system in their farms in the next period or not. In case the farmers did not want to apply it, the researcher had to study the reasons why, what the difficulties were during the application of the on-farm monitoring system. If the farmers wanted to apply the monitoring system, the researcher had to investigate whether the farmers could accept to pay the cost of applying the monitoring system on their farms and how much they were willing to pay.
Box 5. Presenting and analyzing results of the farms (farm 1)
Farm 1
Current situation
Farm 1 has a very important advantage: the farmer’s land area is quite large. He thus enjoys good
conditions to grow forage for cows and reduce the amount of purchased feed. Despite this, the
stocking rate of this farm was quite high because of the large herd size. The high stocking rate also
led to the fact that milk production on this farm was less than on other farms. At present,
production seems to be fine, but in the future, the challenge of disease outbreak and feed shortage
may appear and milk production will be less efficient.
Thanks to the large herd size and more milking cows than other farms, this farm produced the
highest quantity of milk. This is the main factor that pushed the income of this farm to the highest
level. Besides, this farm increased its total income through other sources of income. Therefore, farm
income per kg of milk in this farm was one of the highest as well. Moreover, being the most
economy-minded farm, the purchased feed cost on this farm accounted for the least proportion at
68% of total operating cost. Thus, the cost per kg of milk on this farm was the lowest among the
monitored farms. This resulted in the highest farm margin per kg of milk. All three kinds of farm
0
100
200
300
400
500
600
700
800
Highest
results
F8 results Average
results
Mil
lio
n V
ND
Margin over feed related costs Gross Margin - milk only
Gross Margin - whole farm
0,0
5,0
10,0
15,0
20,0
25,0
30,0
35,0
19,8
4,8 3,10,7 0,8
33,2
5,23,8
0,40,3
27,3
6,33,9
0,6 0,5Mil
lio
n V
ND
Operating cost per cow
Lowest cost farm F10 Average cost
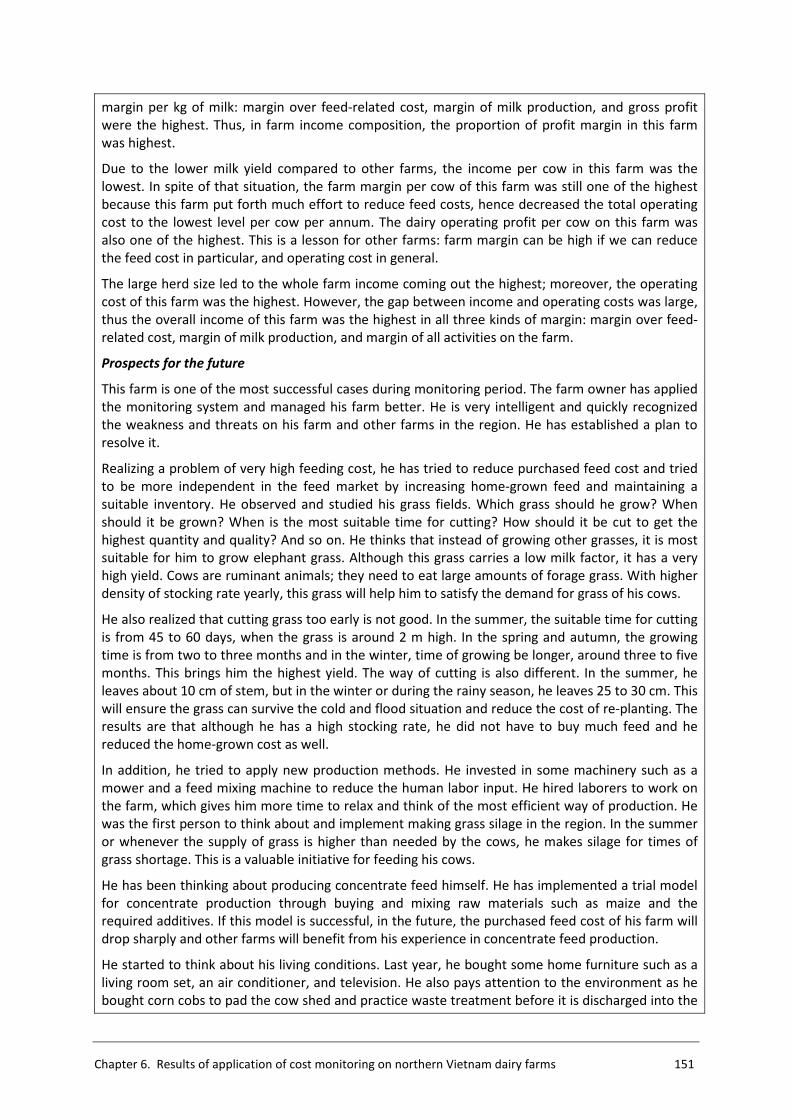
Chapter 6. Results of application of cost monitoring on northern Vietnam dairy farms 151
margin per kg of milk: margin over feed-related cost, margin of milk production, and gross profit
were the highest. Thus, in farm income composition, the proportion of profit margin in this farm
was highest.
Due to the lower milk yield compared to other farms, the income per cow in this farm was the
lowest. In spite of that situation, the farm margin per cow of this farm was still one of the highest
because this farm put forth much effort to reduce feed costs, hence decreased the total operating
cost to the lowest level per cow per annum. The dairy operating profit per cow on this farm was
also one of the highest. This is a lesson for other farms: farm margin can be high if we can reduce
the feed cost in particular, and operating cost in general.
The large herd size led to the whole farm income coming out the highest; moreover, the operating
cost of this farm was the highest. However, the gap between income and operating costs was large,
thus the overall income of this farm was the highest in all three kinds of margin: margin over feed-
related cost, margin of milk production, and margin of all activities on the farm.
Prospects for the future
This farm is one of the most successful cases during monitoring period. The farm owner has applied
the monitoring system and managed his farm better. He is very intelligent and quickly recognized
the weakness and threats on his farm and other farms in the region. He has established a plan to
resolve it.
Realizing a problem of very high feeding cost, he has tried to reduce purchased feed cost and tried
to be more independent in the feed market by increasing home-grown feed and maintaining a
suitable inventory. He observed and studied his grass fields. Which grass should he grow? When
should it be grown? When is the most suitable time for cutting? How should it be cut to get the
highest quantity and quality? And so on. He thinks that instead of growing other grasses, it is most
suitable for him to grow elephant grass. Although this grass carries a low milk factor, it has a very
high yield. Cows are ruminant animals; they need to eat large amounts of forage grass. With higher
density of stocking rate yearly, this grass will help him to satisfy the demand for grass of his cows.
He also realized that cutting grass too early is not good. In the summer, the suitable time for cutting
is from 45 to 60 days, when the grass is around 2 m high. In the spring and autumn, the growing
time is from two to three months and in the winter, time of growing be longer, around three to five
months. This brings him the highest yield. The way of cutting is also different. In the summer, he
leaves about 10 cm of stem, but in the winter or during the rainy season, he leaves 25 to 30 cm. This
will ensure the grass can survive the cold and flood situation and reduce the cost of re-planting. The
results are that although he has a high stocking rate, he did not have to buy much feed and he
reduced the home-grown cost as well.
In addition, he tried to apply new production methods. He invested in some machinery such as a
mower and a feed mixing machine to reduce the human labor input. He hired laborers to work on
the farm, which gives him more time to relax and think of the most efficient way of production. He
was the first person to think about and implement making grass silage in the region. In the summer
or whenever the supply of grass is higher than needed by the cows, he makes silage for times of
grass shortage. This is a valuable initiative for feeding his cows.
He has been thinking about producing concentrate feed himself. He has implemented a trial model
for concentrate production through buying and mixing raw materials such as maize and the
required additives. If this model is successful, in the future, the purchased feed cost of his farm will
drop sharply and other farms will benefit from his experience in concentrate feed production.
He started to think about his living conditions. Last year, he bought some home furniture such as a
living room set, an air conditioner, and television. He also pays attention to the environment as he
bought corn cobs to pad the cow shed and practice waste treatment before it is discharged into the
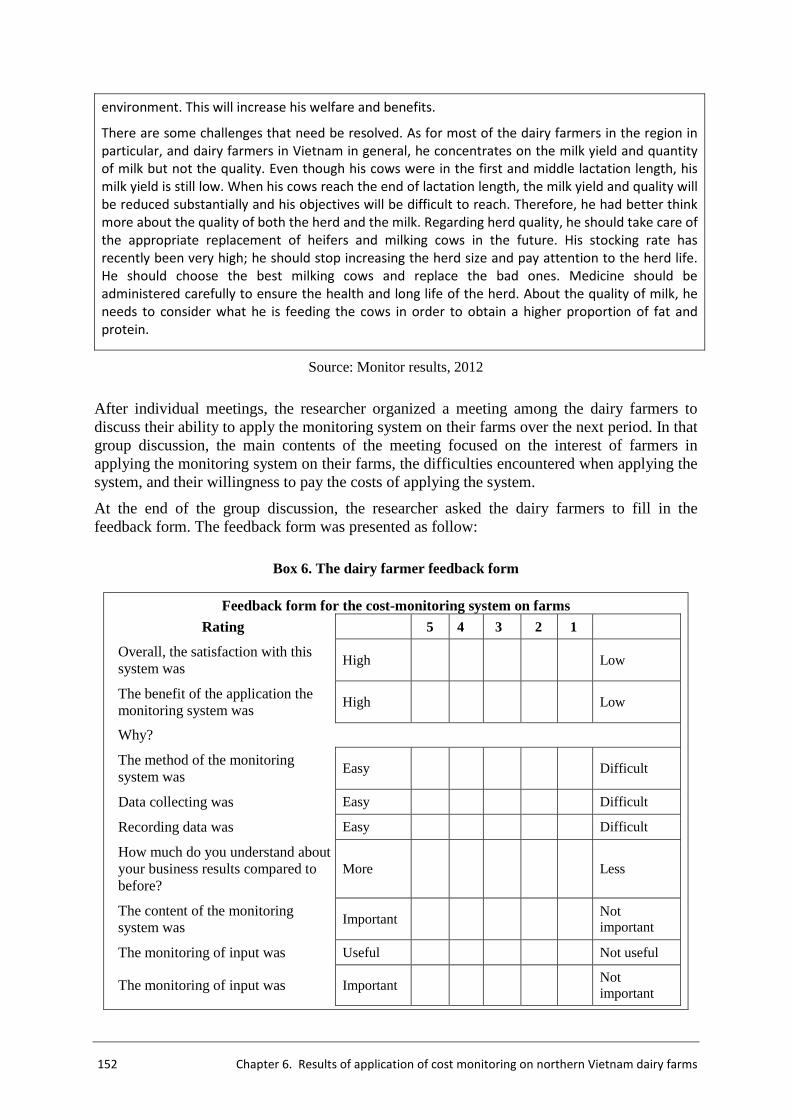
152 Chapter 6. Results of application of cost monitoring on northern Vietnam dairy farms
environment. This will increase his welfare and benefits.
There are some challenges that need be resolved. As for most of the dairy farmers in the region in
particular, and dairy farmers in Vietnam in general, he concentrates on the milk yield and quantity
of milk but not the quality. Even though his cows were in the first and middle lactation length, his
milk yield is still low. When his cows reach the end of lactation length, the milk yield and quality will
be reduced substantially and his objectives will be difficult to reach. Therefore, he had better think
more about the quality of both the herd and the milk. Regarding herd quality, he should take care of
the appropriate replacement of heifers and milking cows in the future. His stocking rate has
recently been very high; he should stop increasing the herd size and pay attention to the herd life.
He should choose the best milking cows and replace the bad ones. Medicine should be
administered carefully to ensure the health and long life of the herd. About the quality of milk, he
needs to consider what he is feeding the cows in order to obtain a higher proportion of fat and
protein.
Source: Monitor results, 2012
After individual meetings, the researcher organized a meeting among the dairy farmers to discuss their ability to apply the monitoring system on their farms over the next period. In that group discussion, the main contents of the meeting focused on the interest of farmers in applying the monitoring system on their farms, the difficulties encountered when applying the system, and their willingness to pay the costs of applying the system.
At the end of the group discussion, the researcher asked the dairy farmers to fill in the feedback form. The feedback form was presented as follow:
Box 6. The dairy farmer feedback form
Feedback form for the cost-monitoring system on farms
Rating 5 4 3 2 1
Overall, the satisfaction with this system was High Low
The benefit of the application the monitoring system was High Low
Why?
The method of the monitoring system was Easy Difficult
Data collecting was Easy Difficult
Recording data was Easy Difficult
How much do you understand about your business results compared to before?
More Less
The content of the monitoring system was Important
Not important
The monitoring of input was Useful Not useful
The monitoring of input was Important Not important
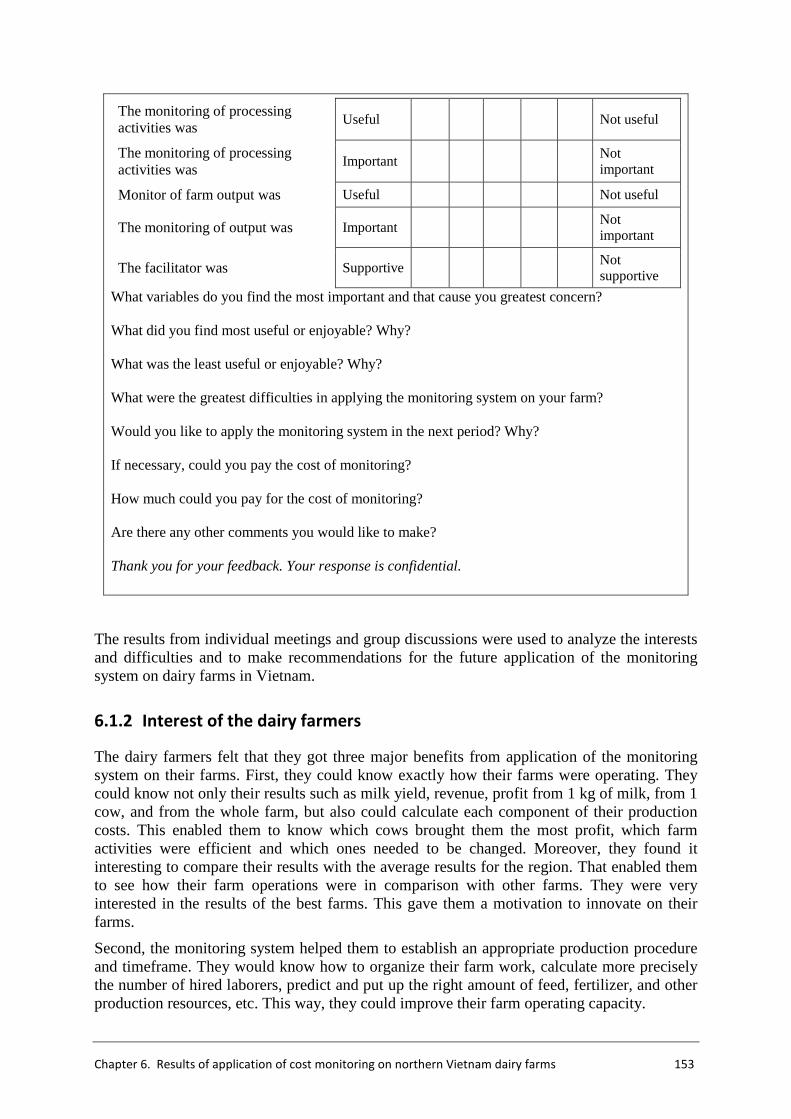
Chapter 6. Results of application of cost monitoring on northern Vietnam dairy farms 153
The monitoring of processing activities was Useful Not useful
The monitoring of processing activities was Important
Not important
Monitor of farm output was Useful Not useful
The monitoring of output was Important Not important
The facilitator was Supportive Not supportive
What variables do you find the most important and that cause you greatest concern? What did you find most useful or enjoyable? Why? What was the least useful or enjoyable? Why? What were the greatest difficulties in applying the monitoring system on your farm? Would you like to apply the monitoring system in the next period? Why? If necessary, could you pay the cost of monitoring? How much could you pay for the cost of monitoring? Are there any other comments you would like to make? Thank you for your feedback. Your response is confidential.
The results from individual meetings and group discussions were used to analyze the interests and difficulties and to make recommendations for the future application of the monitoring system on dairy farms in Vietnam.
6.1.2 Interest of the dairy farmers
The dairy farmers felt that they got three major benefits from application of the monitoring system on their farms. First, they could know exactly how their farms were operating. They could know not only their results such as milk yield, revenue, profit from 1 kg of milk, from 1 cow, and from the whole farm, but also could calculate each component of their production costs. This enabled them to know which cows brought them the most profit, which farm activities were efficient and which ones needed to be changed. Moreover, they found it interesting to compare their results with the average results for the region. That enabled them to see how their farm operations were in comparison with other farms. They were very interested in the results of the best farms. This gave them a motivation to innovate on their farms.
Second, the monitoring system helped them to establish an appropriate production procedure and timeframe. They would know how to organize their farm work, calculate more precisely the number of hired laborers, predict and put up the right amount of feed, fertilizer, and other production resources, etc. This way, they could improve their farm operating capacity.
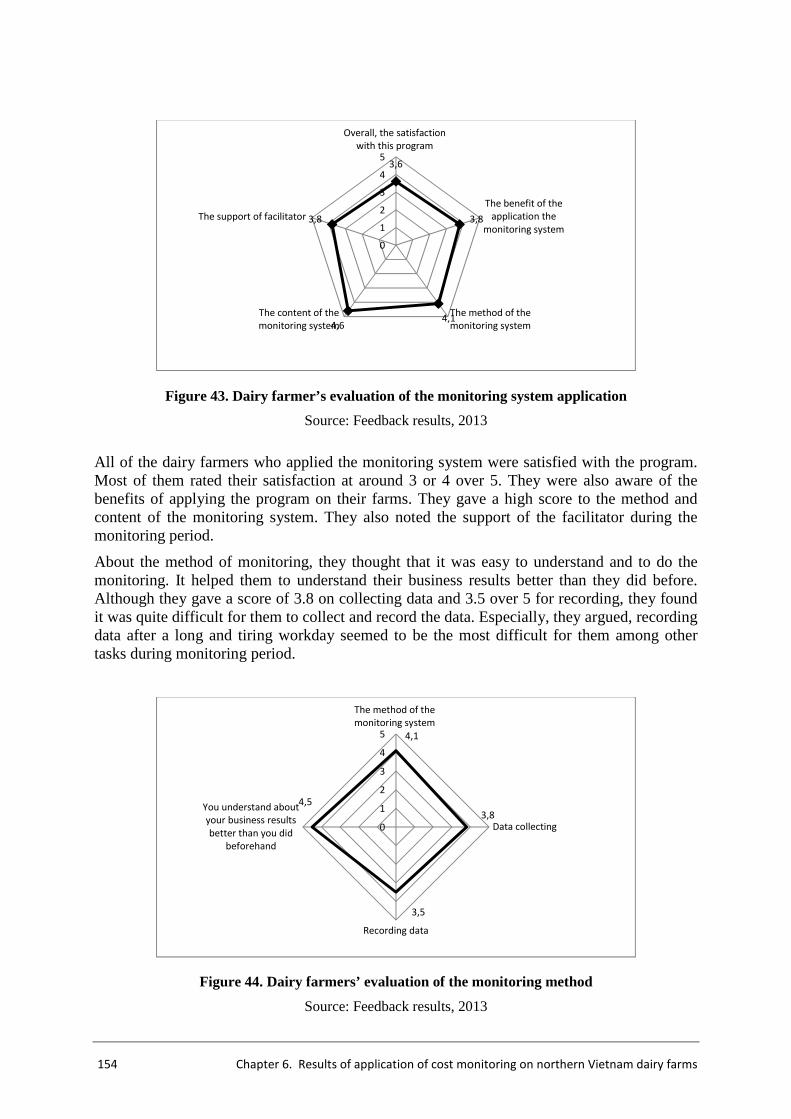
154 Chapter 6. Results of application of cost monitoring on northern Vietnam dairy farms
Figure 43. Dairy farmer’s evaluation of the monitoring system application
Source: Feedback results, 2013
All of the dairy farmers who applied the monitoring system were satisfied with the program. Most of them rated their satisfaction at around 3 or 4 over 5. They were also aware of the benefits of applying the program on their farms. They gave a high score to the method and content of the monitoring system. They also noted the support of the facilitator during the monitoring period.
About the method of monitoring, they thought that it was easy to understand and to do the monitoring. It helped them to understand their business results better than they did before. Although they gave a score of 3.8 on collecting data and 3.5 over 5 for recording, they found it was quite difficult for them to collect and record the data. Especially, they argued, recording data after a long and tiring workday seemed to be the most difficult for them among other tasks during monitoring period.
Figure 44. Dairy farmers’ evaluation of the monitoring method
Source: Feedback results, 2013
3,6
3,8
4,14,6
3,8
0
1
2
3
4
5
Overall, the satisfaction
with this program
The benefit of the
application the
monitoring system
The method of the
monitoring system
The content of the
monitoring system
The support of facilitator
4,1
3,8
3,5
4,5
0
1
2
3
4
5
The method of the
monitoring system
Data collecting
Recording data
You understand about
your business results
better than you did
beforehand
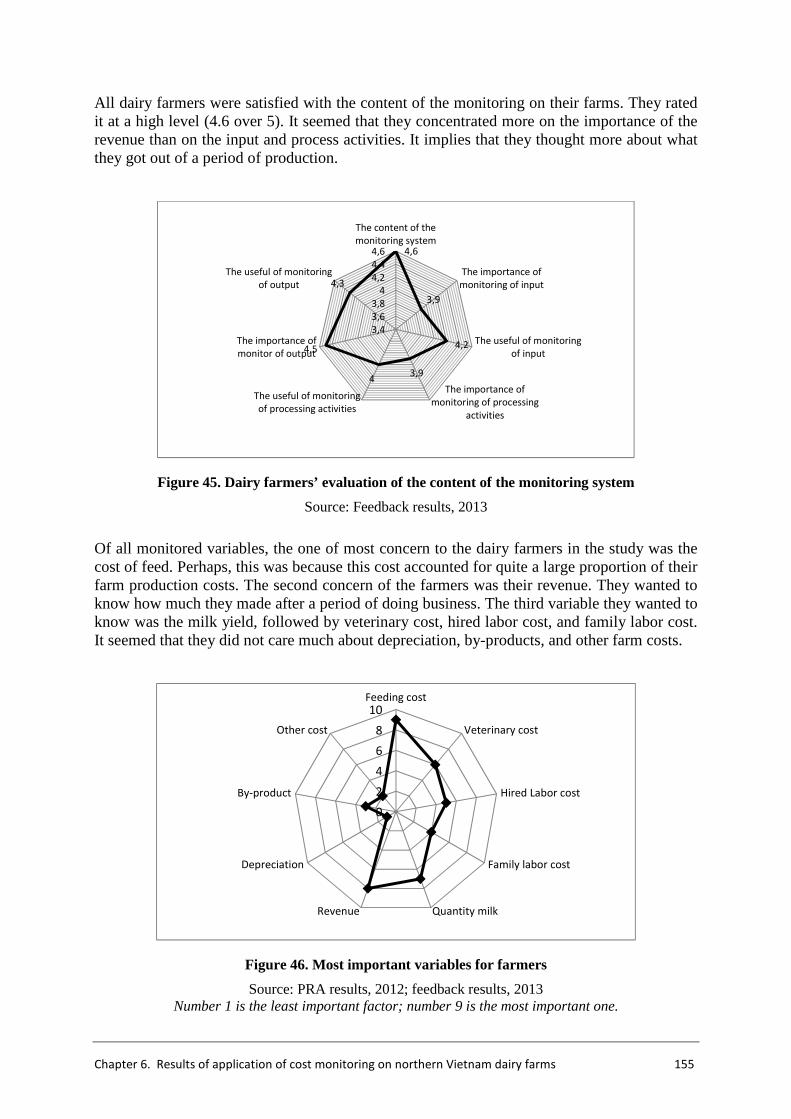
Chapter 6. Results of application of cost monitoring on northern Vietnam dairy farms 155
All dairy farmers were satisfied with the content of the monitoring on their farms. They rated it at a high level (4.6 over 5). It seemed that they concentrated more on the importance of the revenue than on the input and process activities. It implies that they thought more about what they got out of a period of production.
Figure 45. Dairy farmers’ evaluation of the content of the monitoring system
Source: Feedback results, 2013
Of all monitored variables, the one of most concern to the dairy farmers in the study was the cost of feed. Perhaps, this was because this cost accounted for quite a large proportion of their farm production costs. The second concern of the farmers was their revenue. They wanted to know how much they made after a period of doing business. The third variable they wanted to know was the milk yield, followed by veterinary cost, hired labor cost, and family labor cost. It seemed that they did not care much about depreciation, by-products, and other farm costs.
Figure 46. Most important variables for farmers
Source: PRA results, 2012; feedback results, 2013 Number 1 is the least important factor; number 9 is the most important one.
4,6
3,9
4,2
3,94
4,5
4,3
3,4
3,6
3,8
4
4,2
4,4
4,6
The content of the
monitoring system
The importance of
monitoring of input
The useful of monitoring
of input
The importance of
monitoring of processing
activities
The useful of monitoring
of processing activities
The importance of
monitor of output
The useful of monitoring
of output
0
2
4
6
8
10Feeding cost
Veterinary cost
Hired Labor cost
Family labor cost
Quantity milkRevenue
Depreciation
By-product
Other cost
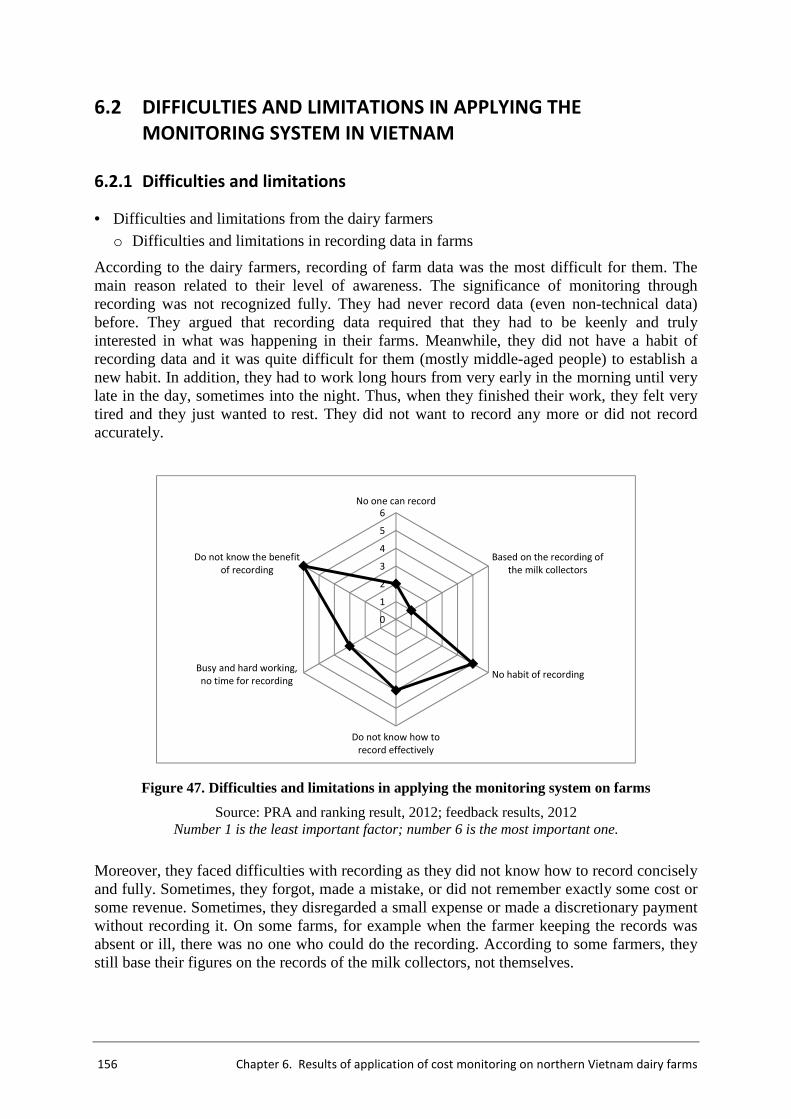
156 Chapter 6. Results of application of cost monitoring on northern Vietnam dairy farms
6.2 DIFFICULTIES AND LIMITATIONS IN APPLYING THE
MONITORING SYSTEM IN VIETNAM
6.2.1 Difficulties and limitations
• Difficulties and limitations from the dairy farmers o Difficulties and limitations in recording data in farms
According to the dairy farmers, recording of farm data was the most difficult for them. The main reason related to their level of awareness. The significance of monitoring through recording was not recognized fully. They had never record data (even non-technical data) before. They argued that recording data required that they had to be keenly and truly interested in what was happening in their farms. Meanwhile, they did not have a habit of recording data and it was quite difficult for them (mostly middle-aged people) to establish a new habit. In addition, they had to work long hours from very early in the morning until very late in the day, sometimes into the night. Thus, when they finished their work, they felt very tired and they just wanted to rest. They did not want to record any more or did not record accurately.
Figure 47. Difficulties and limitations in applying the monitoring system on farms
Source: PRA and ranking result, 2012; feedback results, 2012 Number 1 is the least important factor; number 6 is the most important one.
Moreover, they faced difficulties with recording as they did not know how to record concisely and fully. Sometimes, they forgot, made a mistake, or did not remember exactly some cost or some revenue. Sometimes, they disregarded a small expense or made a discretionary payment without recording it. On some farms, for example when the farmer keeping the records was absent or ill, there was no one who could do the recording. According to some farmers, they still base their figures on the records of the milk collectors, not themselves.
0
1
2
3
4
5
6
No one can record
Based on the recording of
the milk collectors
No habit of recording
Do not know how to
record effectively
Busy and hard working,
no time for recording
Do not know the benefit
of recording
Chapter 6. Results of application of cost monitoring on northern Vietnam dairy farms 157
o Difficulties in knowledge level and capacity
Most of the dairy farmers were in their middle age. The average age in the sample was 41. At that age, they were not too old, but it was difficult for them to innovate their working habits and take in new knowledge. The general level of education of the farmers in the sample was grade 7 (out of 12 grades in Vietnam). They hesitated to do anything relevant to literacy, such as writing and analyzing. Some of them had technical certificates in farming. They could read the information and understand the invoice. However, their ability in the area of information analysis was not very good. They did not and could not understand basic accounting. Thus, they could not analyze the accounting information.
As for the financial aspect, they were interested only in profit, but they did not know how to finalize the profit and did not calculate it accurately. In their understanding, profit was calculated by subtracting intermediate costs from revenue (similar to value added). They did not understand and could not assess the viability, stability, and profitability of their dairy business. In brief, they analyze information based on their understanding and experience but not following a scientific method.
Most of the decisions on farms were made based on the farmer’s experience. Men were the decision makers on most of the sample farms.186 Normally, the farmers made a decision whenever they felt it was necessary. However, they were not very concerned about making decisions. Most of them considered their budget because it was the condition to be able to implement the decision. They also estimated their expected performance results but did not do detailed calculations.
The farmers were not very concerned with and did not estimate the level of risk when making investment decisions. They are influenced by the business of neighboring farms. Seven out of ten farmers based their decision on what neighboring farms did. Only one farm estimated risks, but the farmer did not have a plan for minimizing risk.
When they made a decision, all ten farmers did not study the alternatives. In normal conditions, they estimated the basic profit and decided what and how much to produce. If they faced an unexpected condition or unfavorable factors, they would change their decision to suit these new conditions. Eight out of ten farmers did not calculate the probability of success. Only two of them took this element into account. In particular, one farmer calculated the expected level of success. This farmer seemed more successful than the other farms and, in fact, was the most successful farmer in the area.
Farmers rarely considered the reasonableness of the expense on their farms. Only one farmer paid attention to the appropriateness of expenses; the remaining nine farmers were not concerned whether the costs were suitable or not. Before making a decision to invest or purchase something, they considered the expense. After buying, they did not consider whether the investment was of much or little benefit, whether it was worth the outlay or not. They did not pay much attention to the reasonableness of costs in the farm. According to survey results, all farmers responded that their costs were still high. However, they had not found a solution to reduce costs. After the monitoring period, four farmers are trying to cut costs.
Resources on farms included financial resources, inventory, human resources, production resources, and information technology. Farmers knew how to use these resources, but they did
186
The only woman decision-maker on a farm is Ms. Hao because she is a single. Although there is discussion and agreement on the part
of the other members of the family, in the final analysis, decisions are up to the men, normally the husband in the family. On some
farms, before making a big decision with a long-term or big effect on their lives, all the members or the older members of the family
sit together to discuss and finalize the solution. However, most of the decisions are made by the men (focus discussion and
observation).
158 Chapter 6. Results of application of cost monitoring on northern Vietnam dairy farms
not how to exploit their full potential. With regard to human resources, they knew the point and number of hired laborers, but they did not manage their labor very well. They responded that they were not interested in organizing labor. They did not pay attention to motivating and encouraging their employees either.
Although the farmers got income monthly, they did not invest in or purchase equipment effectively to support their operations. They did not depreciate their assets. Some resources were used wastefully as by-products. Nine farmers concluded that they had not used their resources in an effective way.
The main source of income in farms is milk. There are sources of secondary income, such as from the sale of bull calves and heifers. However, they did not pay much attention to these revenues. Most of the income was used to cover the expense of keeping the cattle and the family’s living costs. Anything left was saved. However, they did not accumulate much in the form of investment, but usually deposited the money in the bank. For them, money in the bank gives them a sense of security, which is more important than the interest rate.
• Difficulties and limitations from the other stakeholders and conditions o Difficulties and limitations from the dairy plant
The dairy plant had facilitated and created a mechanism for farmers to do business themselves. However, in reality, it still manages farmers under military command, mainly based on punishment. It wields considerable power over the farmers and its impacts on farms are high. The company’s multifaceted policy affects the operation and effectiveness of the farmers, but the company had no policy related to the application of the monitoring system on farms. Without the permission of the dairy plant, the application of the monitoring system on farms still faces many difficulties, as farmers are very worried about punishment from the dairy plant and they were unwilling to apply it fully.
o Difficulties and limitations from the extension
Although the extension system in Vietnam nowadays is quite well organized with a full channel from the national level to the commune level, the role of extension in the application of the monitoring system in dairy farms is not working. The extension staff at the provincial, district, and commune levels is still bureaucratic. During the study, no extension staff visited or provided any extension services to the dairy farmers (such as investigating results). The role of extension on the activities of the farm operation in general and on farm monitoring in particular was unclear. In addition, the outreach of the company and of some organizations (such as JICA) just referred to technical aspects such as advising people on how to keep cattle, the diet ration for cows, etc., but did not pay attention to the application of the cost-monitoring system on the farms.
o Difficulties and limitations from the education institutes
Because Moc Chau is far away from the city center and training facilities, the people in this area did not seem to benefit from training services. Training facilities, including the Hanoi University of Agriculture, a specialized training institute in the field of agriculture and rural development, did not have a provision for training and educating people in this region regarding the basic skills and techniques of applying the monitoring system on the farms.
o Other difficulties and limitations
The application of the monitoring system in Moc Chau faced some other difficulties and limitations. The government agencies and authorities at all levels, from the national to the commune level, have not facilitated things for the application of on-farm monitoring systems. They have not approved any policies, regulations, and mechanisms relating to the application
Chapter 6. Results of application of cost monitoring on northern Vietnam dairy farms 159
of the monitoring system on the farm. Besides, some NGOs that came to Moc Chau focus only on the implementation of projects related to technical aspects, but are not implementing any project related to this aspect.
Another difficulty came from the geographical location. Moc Chau is a mountainous district; travel to and from it is difficult and time-consuming, so support from organizations and agencies in this region is also limited. The difficulty of travelling conditions also means that there is a limited number of enterprises in the region, thus the services provided to the people, including services of accountancy and application of the cost-monitoring system, are limited. Currently, there is no professional unit or enterprise to help the dairy farmers in applying the monitoring system on their farms or to support them in analyzing farm data or information.
The shortage of experts was another difficulty for application of the cost-monitoring system in the region. Normally, experts work in larger cities and towns in Vietnam. It was quite difficult and costly to invite experts to a remote and mountainous area like Moc Chau to help farmers implement application of the monitoring system.
6.2.2 Recommendations
• For the dairy farmers
Promote the recording of data
- It is necessary for the dairy farmers to believe that data recording brings them benefits. Thus, the facilitator must present to the farmers arguments to convince them that if they record data and information frequently, they will know in depth the status and results of their operations. They can look the data up and see whether their expenses are reasonable or not, if their revenue is up or down, etc. This helps them to minimize costs through such things as finding out the appropriate grass to grow or using efficiently their machinery, implement suitable maintenance, etc.
After a period of recording information, they will have available basic financial indicators to show the efficiency of their farms. They can also compare their revenue, profit, cost, etc., with other farmers to see whether their farms are efficient or not. They will recognize the reasons for their high or low profit compared to that of other farmers, for example, whether they are feeding their livestock too little or too much feed, whether the forage they are using is good or unsuitable, how their milk yield compares, whether their stock is of good or bad genetics, and the like. The indicators provided through the monitoring system and management, such as inter-calving periods, calving time per cow per annum, etc., can help them to improve their herd. Thus, they can find ways to promote their future development.
When the farmers recognize the benefits of monitoring on their farms, they will be willing to spend time to record effectively.
- The habit of recording should be implemented fully and gradually, over a long enough period to hone their skills. In addition, it is necessary to get the younger generation into the habit of recording. This means involving their children who will manage the farms in the future. Training courses or workshops for recording data on farms need to be organized to support the farmers and remind them to record regularly. Experience exchange workshops or group discussions on good recording practices need to be carried out so that farmers can learn from each other.
160 Chapter 6. Results of application of cost monitoring on northern Vietnam dairy farms
Improve the capacity to manage their farms
- Normally, the farmers are interested in expanding their herd and production, purchasing the necessary equipment and tools for production, and having a target of how much they could earn at the end of the year. However, in some cases, expanding production does not bring them higher profit, and their investment is inefficient. Even if they have a cow with a very high milk yield, that does not ensure that they have the highest or optimal profitability if that cow consumes a large amount of feed or the charge for keeping that cow is very high.
Thus, it is more important to help them to focus on the margin and profitability of their investment. It means that for every VND they invest, they must know how much they will gain. From analysis of farm data, farmers can be in a position to determine at what size they will gain the highest profit, concentrate their efforts on that, and find solutions to optimize production. They will make the best decisions regarding their investment. When resources are limited, farmers have to choose how to invest effectively and profitability.
- The farmers should be trained to be able to count all their transactions and see how many they make each year or after a whole production cycle. If they can be given appropriate training, they can impute their costs. They will know how to calculate data and transform it into speaking indicators. They will understand what lies behind the indicators. If they can do it themselves, their economic and financial knowledge will be improved and they will become more skilled. Therefore, they will be more confident in their farming operation. They will believe more in knowledge and technology and readily apply new methods on their farms. This is a condition that will ensure the future success of their farm business.
If they do well in applying the monitoring system, they can see their weaknesses in financial management and identify solutions for reducing costs, increasing their productivity, and improving their economic performance.
• For the other stakeholders and conditions
o With regard to the dairy plant
In order to help the dairy farmers to be ready and willing to apply the monitoring system on their farms, the dairy plant must provide them with a suitable mechanism with a large enough and clear enough space so that they can apply and follow through on the decisions that they think are right or appropriate to the circumstances of their farms. The plant not only gives them a basis to perform, but also can support, enable, and encourage them to apply the monitoring system because it would be better for both the dairy farmers and the plant. By applying this monitoring system, the farmers will better manage their resources and see to quality, including milk quality. The dairy plant can support them by funding or providing technical assistance or monitoring implementation. The company can also organize a specialized professional organization or bring in experts to help them do this.
o With the extension system
With a large and high density system, officials from the central to local level facilitate the government’s support. The extension effort should assist in applying the monitoring system on dairy farms in particular, and for the Vietnamese farmers in general. The extension staff can be trained to guide and help farmers in monitoring the performance of their farms and the implementation of monitoring services on the farm.
o With the education institutes
To help the dairy farmers in applying the monitoring system on farms, institutes and training institutions should provide training and coaching services in keeping records and calculating
Chapter 6. Results of application of cost monitoring on northern Vietnam dairy farms 161
the economic, financial, and technical indicators. The training institutes must provide regular support to help farmers update their knowledge and techniques, as well as apply science and technology for farm monitoring.
o Other
Government agencies and authorities at all levels, from the national to the commune, should facilitate things for applying the monitoring system on dairy farms in particular and on all farms in general. The government could approve and implement some mechanisms and policies relating to application of the monitoring system on farms. In addition, financial or technical support from NGOs for the practical implementation of projects related to this issue would be greatly appreciated.
6.3 FUTURE APPLICATION OF THE COST-MONITORING SYSTEM
6.3.1 Model for future application of cost monitoring on farms
To ensure that the monitoring system is applied on dairy farms sustainably, it is necessary to choose and establish a model of organization for the future. With the specific conditions of Vietnam, three models can be envisioned.
In the first model, monitoring services are organized as a part or a department in the dairy plant. This model has three advantages. The first advantage, because it is a part of the dairy company, the company can easily accept the model because it will sense that it is in control of the activities of this department (this service). The second advantage, as part of an existing company, the cost for set up and operation of the monitoring system will be reduced. This, in turn, will reduce the cost per unit of supervision (cost per cow or per 1 kg of milk), and the farmers will easily accept the service and participate in it. Third, the application will be easier because it comes from the company and the farmers have to accept it.
However, this method also has disadvantages. Its biggest constraint is that the service will be led by the company, making it mandatory, so people will just be following orders, not doing so voluntarily, and they will not cooperate. The results may be insignificant because the farmers will report the parameters and data just to please the company, not because they are getting benefits from it. In addition, this will make people feel more dependent on the company and the real benefits, the real voice, and their role can also be weakened. Thus, the application of the monitoring system on the farms will not bring them real, tangible benefits.
For the second model, the farm monitoring service will be organized as a part of Vietnam’s agricultural extension system. This model has two advantages. The first is the saving of the cost of setting up and operating the system. Second, it has a chance of being supported by the State and local authorities because it is an extension or outreach system program. However, this model may not be very acceptable to the dairy company. As a State enterprise, although it is equitized, interference from the State and outside in the elements and operation of the company is unlikely to be feasible. In addition, the current extension system operation is not effective. It is cumbersome, not very flexible, and sometimes bureaucratic. To be able to apply the monitoring system through the extension system, a lot of time will be required to get approval for the program by the national and local authorities in Vietnam. Besides, extension staff at all levels has not gained the trust of the farmers, so perhaps they will not voluntarily cooperate and implement the program. Therefore, the real effectiveness of applying the monitoring system in the farm will be negligible.
162 Chapter 6. Results of application of cost monitoring on northern Vietnam dairy farms
The third model is that the monitoring system service will be organized as an independent organizational unit, as a kind of a company or agency activity such as the AWE or CRA-W model in the Walloon region, but adapted to suit the conditions of Vietnam. Although this model has an expensive cost structure and organization, it has tremendous advantages in terms of high efficiency and feasibility. As an independent organization, bringing many social benefits, it would be easily accepted by the dairy company for testing. Besides, this model can be considered as an independent organization so that dairy farmers will be willing and able to cooperate with it. In fact, the poll results showed that people want to have third-party, independent stakeholders in this area. They will feel no pressure from the company. When they are aware of the benefits of applying the monitoring system on their farms, they will be more willing to implement this project.
From the analysis of the advantages and disadvantages of the three models in the study area, and based on the survey of dairy farmer aspirations and willingness, the third model is feasible and would be the most efficient. Over time, this model will be modified to better suit to the local practical conditions.
6.3.2 Future application of the monitoring system on dairy farms in Vietnam
General framework for future application of the monitoring system
Learning the experience from the AWE and CRA-W model in Walloon, the agency will provide dairy farmers with monitoring services as follows:
• Recording system for the monitoring process
Because most of the dairy farms in the region do not have computers, the on-farm monitoring system will be implemented based on the bookkeeping system. After that, when the farmers have been able to get computers, it will be necessary to encourage them to use the computer system for recording data in farms.
For the staff of the management and monitoring agency, after receiving the records from the farmers, the staff of the agency will do a computer entry of the data and process the data to calculate financial, economic, and technical indicators for the farms. Whenever the farmers get equipped with computers for the recording, the data and information will be copied from their computers to the computers of the agency. Then, the agency staff will check the data, process it, and compute the indicators. When the system is further developed, an internal network will be set up; the information from the dairy farms can be transferred directly to the agency’s network under the supervision and guidance of the information and technology staff.
• Provide forms and train the dairy farmers to record data and information in farms
In order to help the dairy farmers record accurately the necessary data from their farms for the management and monitoring process, the agency will organize training courses for them on how to record effectively. Training sessions will be held monthly during the first three months to help the farmers get familiar with data recording and solve any difficulties encountered in the recording process. When the farmers become familiar with the recording, then training and experience exchange sessions can be held quarterly.
Each training session will be organized with two trainers (or extension staff) of the agency and is expected to attract around 40 to 50 farmers. Other stakeholders may be invited to participate in the course, such as the staff from the dairy companies, local government officials, etc. Each training course will last about four hours.
Chapter 6. Results of application of cost monitoring on northern Vietnam dairy farms 163
At the same time, in order to facilitate computer entry of the data and processing it, it is necessary to unify the recording notebooks. Thus, at the beginning of project implementation, the agency provides each dairy farmer with a printed, uniform record book.
• Visit, supervise, and guide farmers to keep records and monitor their farms
Initially, once a week, extension staff or technicians will visit the farms, supervise and guide them with regard to the record keeping. They will also check the recording done by the farmers. Besides, they will record or copy the farm information into their own notebooks. The frequency will decrease as the farmers get used to making the records. The duration for the agency staff to make the first visit in one farm will be around two hours. Subsequent visits will last about one hour.
• Calculation of the farm’s economic, financial, and technical indicators
After a certain period (3, 6 or 12 months), the economic experts will calculate the farm’s economic, financial, and technical indicators, such as farm income, gross profit, farm operating costs, profitability, labor and land productivity, etc.
• Report the results to farmers
The experts will print the report of each farm’s performance after the monitoring period and provide it to the dairy farmer. The report will present the farm’s results over the previous first, second or third years from the second year onwards. Besides the individual farm results, the report also provides the results of the best farm and the average results for the whole group of monitored farms.
• Analysis and explanation of the results and improvement to farmers
The experts will provide an analysis and an explanation to farmers about the operation of their farm, improvements made compared to the previous period, the activities, the possibility or need for improvement in the future.
In brief, the working framework is summarized as follow:
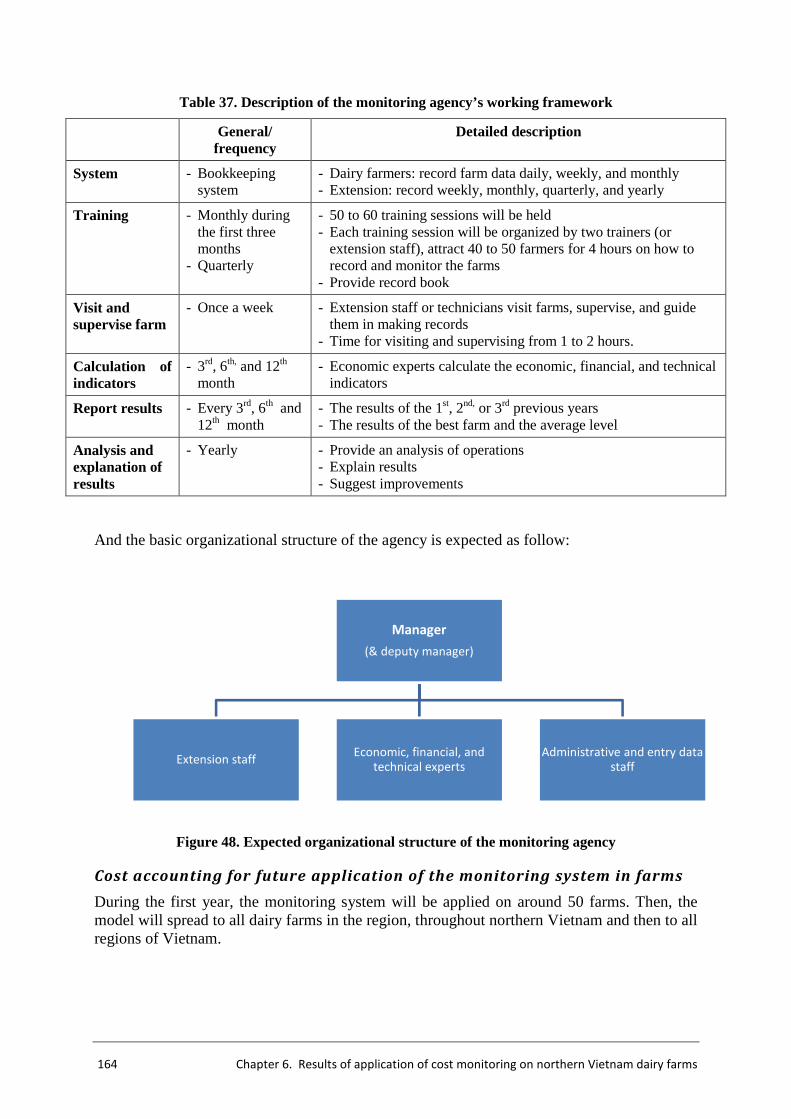
164 Chapter 6. Results of application of cost monitoring on northern Vietnam dairy farms
Table 37. Description of the monitoring agency’s working framework
General/ frequency
Detailed description
System - Bookkeeping system
- Dairy farmers: record farm data daily, weekly, and monthly - Extension: record weekly, monthly, quarterly, and yearly
Training - Monthly during the first three months
- Quarterly
- 50 to 60 training sessions will be held - Each training session will be organized by two trainers (or
extension staff), attract 40 to 50 farmers for 4 hours on how to record and monitor the farms
- Provide record book
Visit and supervise farm
- Once a week - Extension staff or technicians visit farms, supervise, and guide them in making records
- Time for visiting and supervising from 1 to 2 hours.
Calculation of indicators
- 3rd, 6th, and 12th month
- Economic experts calculate the economic, financial, and technical indicators
Report results - Every 3rd, 6th and 12th month
- The results of the 1st, 2nd, or 3rd previous years - The results of the best farm and the average level
Analysis and explanation of results
- Yearly - Provide an analysis of operations - Explain results - Suggest improvements
And the basic organizational structure of the agency is expected as follow:
Figure 48. Expected organizational structure of the monitoring agency
Cost accounting for future application of the monitoring system in farms
During the first year, the monitoring system will be applied on around 50 farms. Then, the model will spread to all dairy farms in the region, throughout northern Vietnam and then to all regions of Vietnam.
Manager
(& deputy manager)
Extension staffEconomic, financial, and
technical expertsAdministrative and entry data
staff
Chapter 6. Results of application of cost monitoring on northern Vietnam dairy farms 165
• Cost of training
In the first year of the project, there will be about six training sessions conducted.187 The cost of training includes allowance for trainers, equipment and tools, and miscellaneous.188 The estimated cost of conducting the training sessions will be around 18 million189 VND for the whole year (about 865.4 USD).190
Besides, the estimated cost for printing and providing the form for dairy farmers is estimated at about 1.25 million VND (60 USD).
• Cost for extension staff to visit and supervise farms
The time for the staff to make the first visit to one farm will be around two hours and the following visits will be about one hour. Thus, excluding travel time, each extension staff can visit and monitor about 5 to 6 farms a day. With this frequency, an extension staff member can monitor 25 to 30 farms yearly. The number of extension staff needed to do these jobs will be two people.
The charge for salaries, insurance, fuel allowance, and equipment for each staff will be around 9.17 million VND per month.191 Therefore, the total cost per year for extension staff involved in monitoring farms will be about 220.08 million (about 10,580.77 USD).
• Cost of calculation, reports, analysis and explanation of the results
In order to implement this duty, it is necessary to have staff to carry out specific tasks as follows:
Staff to computer enter data from the record books if the farmers
Each staff member can enter data for about 7 to 10 farms a day. Thus, one person will be required to computer enter data for all farms in the region. This person will be responsible for administrative duties daily as well. Expenses for this staff include salary, insurance, allowances, working equipment (each person needs a computer). The estimated cost for data entry for the first year will be about 86.86 million192 (4,175.9 USD).
The financial and economic experts who calculate the financial, economic and technical indicators
To make the calculation, analysis, and report on the financial, economic, and technical indicators, the agency should have one expert with skills in the area of financial, economic, and information technology with three good computers and dedicated software for data calculation. The costs of these experts consist of salaries, insurance, allowances, and working equipment, estimated at about 166.72 million193 (8,015.4 USD).
187
It is estimated that each farmer will participate in three training courses in the first three months and three more over the next
months of the year. 188
Estimated cost will be 1 million VND for two trainers, 2.5 million VND for equipment and tools and miscellaneous, totaling around 3
million VND per training course 189
Equal to 50 to 60 courses, multiplied by 3 million per course 190
Current exchange rate 20,800 VND = 1 USD 191
Includes 7 million in salary, 21% in insurance according to Vietnamese law, 10% for various allowances 192
Consists of salary (5 million/person), insurance (21%), allowance (10%), computer (7 million/one) 193
Includes salary (10 million/person), insurance (21%), allowance (10%), computer (7 million/one)
166 Chapter 6. Results of application of cost monitoring on northern Vietnam dairy farms
• Cost for management
It is important to have one manager to manage and operate the agency. The salary, insurance, allowances, and working equipment for the manager is estimated at 246.58 million194 (11,854.8 USD).
• Other costs for operating the agency
Besides, to implement this operational model, it is necessary to count other costs: The cost of setting up the agency consists of transaction costs and establishment cost for the agency;195 the cost to rent and outfit an office which will be the working place for the agency’s staff;196 cost of office equipment such as desks, tables and chairs, cabinet for storing materials, files and paper, printer, scanner and fax,197 cost of opening the agency,198 cost for advertising, marketing, and promotion activities of the agency;199 and miscellaneous costs.200 These costs will come to a total of around 99.5 million (4,783.6 USD) for one year.
Total cost
Total cost for the first year operation of the agency (2013 if is possible) will be around 839 million VND (40,336 USD).
Cost per monitored unit
According to the poll results on the study site with the existing conditions of Moc Chau milk farms, persuading people to pay a fixed fee to participate in the monitoring system service is not feasible. People said that they do not accept to pay a fixed fee. However, the cost per monitored unit could be acceptable according to the sample of pilot farms, i.e. the 10 farms studied during the on-farm experiment period. Therefore, the costs will allocated to each monitored unit in farms including cost per farm, cost per cow and per kg of milk.
The above services, with an estimated 50 farms of around 1,250 dairy cows that produce in 2013, with the assumption that the fixed cost will be depreciated in five years, the estimated average cost of monitoring for each farm should be from 15.2 million VND (730 USD) per year or estimated cost should be from 607,510 VND per cow (29.2 USD) or 167 VND per kg of milk (0.008 USD)
- Share of cost among stakeholders
Based on the poll results on farmer willingness to pay for the monitoring service in the study area, at first, they do not want to pay any cost above the cost of production, including the monitoring cost. However, if they recognize the benefits of the monitoring system on farms as illustrated in the sample of monitored farms in the pilot project, they do accept to pay for it.
Thus, in the first period of around twp years, it is necessary to support fully the cost of applying the monitoring system on farms. Support for the cost may be obtained from organizations such as: (i) international projects and NGO projects; (ii) Vietnamese
194
Includes salary (15 million/person), insurance (21%), allowance (10%), computer 7 million/one) 195
The normal cost to get a permit to establish an agency in Vietnam is now commonly 3 million VND 196
The current market price for this space which is enough for these staff in this area is about 5 million VND monthly 197
Tables: 1 large table and chairs for meeting and receiving dairy farmers, estimated at 7 million VND. Desks: initially there will be 1 staff
member, 1 expert with 1 manager working in the office of the agency. Thus, they need 3 working desks, at a cost of 7.5 million VND.
Cabinets for storing the material, files and papers, etc. cost approximately 6 million VND for 2 units, printer and fax: 1 unit worth 5
million VND, office supplies: files, paper, ink, books, pens, etc, at a cost of 5 million 198
Estimated cost will be around 5 million VND 199
Establishment of the website: 2 million, private business cards: 0.5 million, design brochure: 0.5 million 200
Electricity, telephone, water, sanitation: estimated at 1 million per month
Chapter 6. Results of application of cost monitoring on northern Vietnam dairy farms 167
government extension projects and/or agricultural and rural development projects; and (iii) the dairy plant.
Some international projects and NGO projects that can be called upon for support for application of the monitoring system on farms could be GTZ, BMGF.201 The monitoring system could also be combined with Vietnam Good Animal Husbandry Practices (VietGAHP). By combining the monitoring system with VietGAHP, the dairy farmers not only would receive support from the Vietnamese government202 but also benefit from practices to help them farm better. Therefore, their production would improve and their health would be protected. Moreover, benefits to consumers also increase due to having a more delicious, nutritious, safe and cleaner product available. Thus, they will buy more dairy products which, in turn, will stimulate dairy industry development.
If this support is available, dairy farmers will apply the monitoring system in their farms. After a period of time, they will recognize the benefits of the system and will find that it is necessary to apply a monitoring system in their farms for better operation and management. Therefore, they will easily accept to pay for what they find makes their farms better. Dairy farmers will indeed get benefits from the monitoring system. It will provide them with basic financial indicators to show the efficiency of their farms. They will have in-depth insight on the status and results of their operations. They can look up their results and see whether their expenses are reasonable or not, if their revenue is high or low. This will help them to minimize cost through such things as finding out what is the appropriate grass to grow or how to use efficiently their machinery and how to implement suitable maintenance.
In the third year, the cost of monitoring will be shared among farmers and other stakeholders. The farmers will pay for half, while the remainder will be supported by other stakeholders. During this period, besides the above benefits, dairy farmers can compare their revenue, profit, cost, etc., with other farms to see whether their farms are effective or not and they will recognize the reasons for their high or low profit compared to other farmers, for example, supplying too much or too little feed, good or unsuitable forage, high or low milk yield, good or bad genetics, etc.
201
Bill and Melinda Gates Foundation 202
According to Decision No. 01/2012/QD-TTg dated January 9, 2012 of the Vietnamese Prime Minister on some policies supporting to
the application of the method of good agricultural practices to agriculture, silviculture, and aquaculture; Article 5 Some supporting
policies:
1. Budget will invest 100% in baseline surveys, topographical surveys, soil analysis, water samples, air samples to determine the
concentration of the production that implement projects on agriculture, forestry and aquaculture applying VietGAP approval by the
competent authority.
2. Budget will support
a) No more than 50% of the total investment in the construction and renovation of roads, irrigation systems, pumping stations, low
voltage, waste treatment systems, water supply systems of the centralized production to fit the technical requirements of VietGAP.
Funding to support the implementation of the Regulation on management of investment and construction;
b) Training managers, technical staff, extension staff at all levels and vocational training for rural laborers who apply VietGAP in safely
producing, processing products; compiling, printing documents and forms for training courses;
c) Support once for hiring certified organization to assess and provide certificates for safety product;
d) Application of new advanced techniques in the use of pest-resistant varieties, plant protection drugs, biological plant protection
substances of biological origin, applying integrated pest management (IPM), integrated crop management (ICM);
e) Support for trade promotion activities as stipulated in Decision No. 72/2010/QD-TTg dated November 15, 2010 of the Prime
Minister promulgating the regulations on construction, management and implementation trade promotion program countries.
3. The organizations and individuals who have investment project in producing and processing products applied VietGAP not only
enjoying the policies specified in Clause 1, Clause 2 of this Article but also be entitled to support policies and other incentives of the
current regulations.
According to Article 2, Circular No. 53/2012/TT-BNNPTNT dated October 26, 2012 of the Ministry of Agriculture and Rural
Development on the list of supported agricultural and aquacultural products according to the Prime Minister’s Decision No.
01/2012/QD-TTg dated January 09, 2012 regulated that fields will be supported when applied VietGAHP: vegetables, fruits, tea,
coffee, pepper, rice; swine, poultry, dairy cows, bees; pangasius, giant tiger prawns, whiteleg shrimps, tilapias.
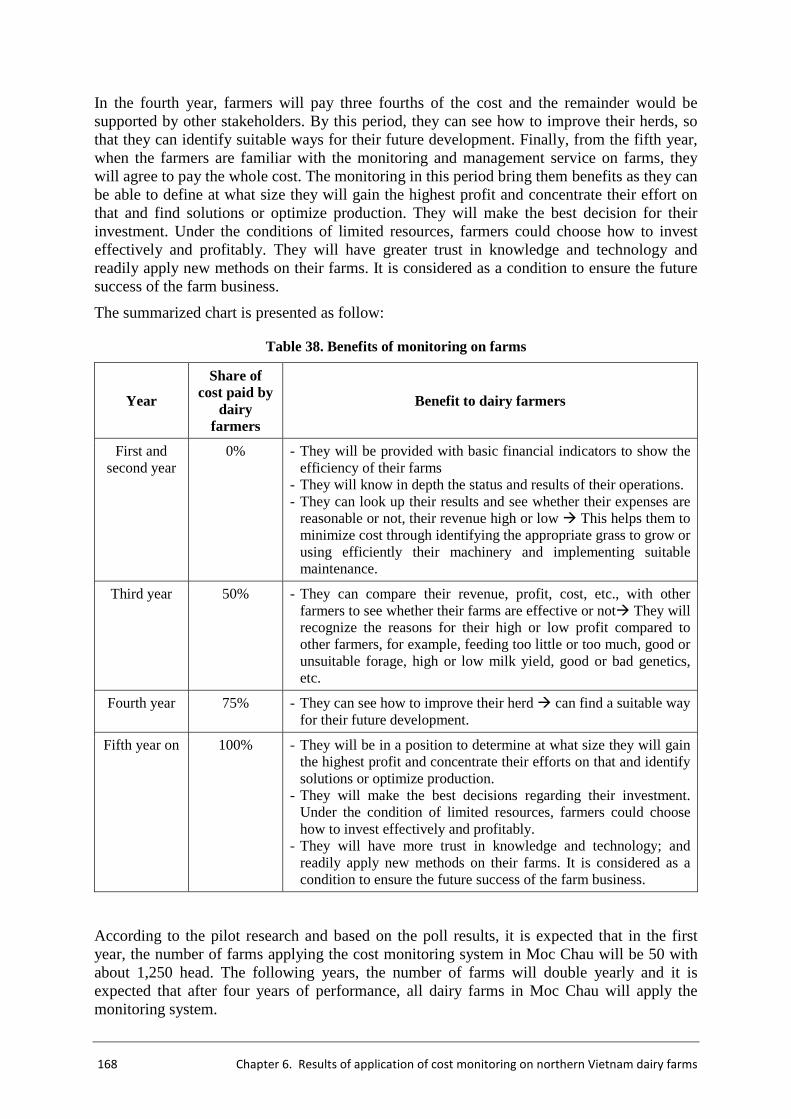
168 Chapter 6. Results of application of cost monitoring on northern Vietnam dairy farms
In the fourth year, farmers will pay three fourths of the cost and the remainder would be supported by other stakeholders. By this period, they can see how to improve their herds, so that they can identify suitable ways for their future development. Finally, from the fifth year, when the farmers are familiar with the monitoring and management service on farms, they will agree to pay the whole cost. The monitoring in this period bring them benefits as they can be able to define at what size they will gain the highest profit and concentrate their effort on that and find solutions or optimize production. They will make the best decision for their investment. Under the conditions of limited resources, farmers could choose how to invest effectively and profitably. They will have greater trust in knowledge and technology and readily apply new methods on their farms. It is considered as a condition to ensure the future success of the farm business.
The summarized chart is presented as follow:
Table 38. Benefits of monitoring on farms
Year
Share of cost paid by
dairy farmers
Benefit to dairy farmers
First and second year
0% - They will be provided with basic financial indicators to show the efficiency of their farms
- They will know in depth the status and results of their operations. - They can look up their results and see whether their expenses are
reasonable or not, their revenue high or low � This helps them to minimize cost through identifying the appropriate grass to grow or using efficiently their machinery and implementing suitable maintenance.
Third year 50% - They can compare their revenue, profit, cost, etc., with other farmers to see whether their farms are effective or not� They will recognize the reasons for their high or low profit compared to other farmers, for example, feeding too little or too much, good or unsuitable forage, high or low milk yield, good or bad genetics, etc.
Fourth year 75% - They can see how to improve their herd � can find a suitable way for their future development.
Fifth year on 100% - They will be in a position to determine at what size they will gain the highest profit and concentrate their efforts on that and identify solutions or optimize production.
- They will make the best decisions regarding their investment. Under the condition of limited resources, farmers could choose how to invest effectively and profitably.
- They will have more trust in knowledge and technology; and readily apply new methods on their farms. It is considered as a condition to ensure the future success of the farm business.
According to the pilot research and based on the poll results, it is expected that in the first year, the number of farms applying the cost monitoring system in Moc Chau will be 50 with about 1,250 head. The following years, the number of farms will double yearly and it is expected that after four years of performance, all dairy farms in Moc Chau will apply the monitoring system.
Chapter 6. Results of application of cost monitoring on northern Vietnam dairy farms 169
Yearly, the cost-monitoring model will be adjusted as to the method of implementation, technical implementation, financing levels, or other requirements in accordance with actual conditions in the region. After four years of applying the cost-monitoring system on farms, the model will be summarized, modified, and improved for extension to other areas of the country. From the fifth year, the model will be transferred to dairy farms in other northern mountainous areas such as Lai Chau, Tuyen Quang, Thai Nguyen, etc. After that, the model will be applied in the Red River Delta region, including Hanoi, Bac Ninh, Hung Yen, etc. Along with the dairy development strategy, it is expected that by 2020–2025, the model will become more popular and widely used in the majority of dairy farms, and contribute to the development of the dairy industry in Vietnam.
As the number of monitored farms and dairy cows increase, the number of staff in the agency will increase to satisfy the demand for monitoring and management. Moreover, when the farmers get familiar with the service of monitoring and management on their farms, they may request other services such as additional visits to their farms, further explanations and suggestions for future development, etc., and the agency can develop and supply new services. Therefore, the service of farm monitoring and management can develop sustainably.

CONCLUSIONS AND RECOMMENDATION
CONCLUSIONS
This research found that the fresh milk value chain in northern Vietnam is characterized by a typical and formal chain in which 98.5% of milk produced by dairy farmers is delivered to milk collectors and then to a dairy processing company (dairy plant). The dairy plant pasteurizes and sterilizes the milk and provides it to distributors. The distributors, in turn, deliver it to customers, mainly in northern Vietnam. All the milk produced in Moc Chau goes to the domestic customers in the form of fresh milk.
Although dairy farmers played the most important role in the chain, the dairy plant proved to be the most powerful actor, positioned to impose many impacts on the other actors of the chain. There were quite tight linkages among the actors, but not very tight linkages between the actors and stakeholders. Value added is distributed unequally among actors in the chain due to the bias orientation toward non-milk production (non-farmers). In term of absolute value, the dairy plant seems to achieve a higher benefit but in terms of comparative value. Distributors were the actors deriving the most benefit as they spent the smaller share and gained the high proportion of value added.
The farmers were the most vulnerable and disadvantaged actors who bore a large share of the cost (from 32.4 to 54.3% of total costs) but received only one fifth of the total value added in the whole chain. They are also key features in the chain. The weakest point for the dairy farmers is high, fluctuating costs, especially for feed, in which concentrates is a chief concern. The major reasons were that they feed their cows too much concentrate and depend too much on bought feed. Their home-grown forage was limited due to shortage of land, low efficiency, poor management, and their lack of familiarity with the ruminant animal. Thus, facilitating and improving cost monitoring and management for dairy farmers is a major cluster to promote farmer earnings and equality throughout the chain.
The method of applying a cost-monitoring system in farms in Vietnam includes six main steps: choose farms that agree to apply the cost-monitoring system; establish a method and major variables as well as responsibility to monitor; determine a system of data collection (collectors, period of collecting, means and tools for collecting, etc.); train the farmers on how to record farm data and information; have farmers record farm data with the support and supervision of facilitators; process and analyze the data. An on-farm experiment was conducted on the study site with ten farms to test the model.
The results of the on-farm experiment showed that none of the monitored farms applied a cost-monitoring system before. They had never been trained to use and analyze their previous information as a basis for future decisions. Most farm decisions are made based on the farmer’s experience. Men are the decision makers on most of the farms. The benefits of the farm monitoring system captured the interest of the dairy farmers as it helped them to know how they operate their farms. Although they found it was difficult, they understood the how to monitor their farm. They are furthermore interested in the output variables, but less in the input, in spite of the fact that the most variable of greatest concern was feeding costs. They found that the most difficult thing to apply in the farm monitoring system was the recording of farm data. Limitations in capacity and knowledge also constrained them during the
172 Conclusions and recommendation
experiment. In addition, some limitations and difficulties from outside such as from the dairy plant and from the geographical location also restrict application of the monitoring system.
RECOMMENDATIONS
In order to increase the value added and benefits, dairy farmers should concentrate on both milk yield and quality. They need to take care of the optimal stocking rate, invest more in herd quality. The replacement of heifers demands attention in order to upgrade the quality of herds in the future. Farmers also should increase forage feeding and decrease concentrate in the feed rations for better animal health and reduction of feeding costs. Home-grown feed should be enhanced to replace the costly bought feed. Especially, forage growing should be improved by promoting the appropriate varieties of grass, cultivating efficiently, and cutting grass at the right time. Furthermore, they should spend time to exchange experiences with other farmers in the region, especially successful farmers. They need to develop their knowledge of milk production. They should reconsider how they operate their farm. They could compare their results with those of other farmers in the region to know what is done differently and why. In the long term, they should learn how to make better decisions regarding their farms.
In order to improve and enhance the application of the monitoring system on farms, it is necessary to promote the recording of data for dairy farmers and improve their capacity to manage their farms. Besides, support from other stakeholders is very important to encourage application of the model. The most suitable model for future application of the farm monitoring system is to organize an independent agency. The estimated average cost of monitoring for each farm in the first year would be from 15.2 million VND per year; or 607,510 VND per cow; or 167 VND per kg of milk. The survey showed that, at the time of the study, the farmers did not want to pay the cost of monitoring services but they would accept to pay it if they recognized the benefits of monitoring. Thus, in the first period of around two years, it is necessary to support them fully. Support may be sought from an international project and NGO projects, Vietnamese government extension projects and/or agricultural and rural development projects, and the dairy plant. Then, in the third and the fourth year, the cost will be shared among farmers and other stakeholders. The farmers would pay the whole cost from the fifth year.
It is expected that from the fifth year, the monitoring service will extend throughout Son La province and other provinces in the northern mountainous region of Vietnam. After that, the model will be disseminated and applied in most dairy farms in the Red River Delta of Vietnam. By 2020–2025, most of the dairy farms in Vietnam will be able to access the monitoring service. The farm monitoring and management service can combine with VietGAHP and will develop more sustainably if the Vietnamese government devises and implements a suitable policy for dairy promotion. If the government has a policy to implement or support the monitoring system on farms, it will create the opportunity and provide to the motivation for dairy farmers to apply the monitoring system on their farms. It will also encourage them to implement better their operation and performance. The government can also support agencies that do the monitoring or provide accounting services for farms. Once these agencies receive support, they would provide accounting and management services free of charge for farmers; and farm monitoring will be developed.
REFERENCES
1. Altenburg T. (2007), Donor approaches to supporting pro-poor value chains, Report prepared for The Donor Committee for Enterprise Development, Working group on Linkages and value chains, Bonn, Germany : German Development Institute.
2. AWE (2011), Comptabilité de gestion, Ciney, Belgique : Association Wallonne de l’Elevage, Centre de Gestion des Exploitations.
3. AWE (2012), Rapport d’activités 2011, Ciney, Belgique : Association Wallonne de l’Elevage, http://www.awenet.be/nouv_awe/UserFiles/file/News/RA%202011/AWE_RapportAct2011-36P-BsDef.pdf, and http://www.awenet.be/nouv_awe/commun/accueil/accueil.php, (2/8/2012).
4. Baker D. (2006), Modern agrifood systems. Understanding agriculture in a global economy, Rome, Italy.
5. Bolnick B., Camoens A. & Zislin J. (2005), Tanzania economic performance assessment, Country Analytical Support Report, Washington, USA : USAID.
6. Boomgard J.J. et al. (1992), A subsector approach to small enterprise promotion and research, World Development, 20(2), 199-212.
7. Boone K. & Dolman M. (2011), Monitoring sustainability of Dutch Agriculture, Wageningen , The The Netherlands : University of Wageningen.
8. Bouquiaux J.M (2011), Evolution de la production de lait en Wallonie. Facteurs de production et situation économique, Namur, Belgique : Direction générale de l’Agriculture, Direction de l’Analyse Economique Agricole.
9. Bouquiaux J.M et al. (2010), Performances et rentabilité des productions bovines en Région wallonne, Namur, Belgique : Direction opérationnelle de l’Agriculture, des Ressources naturelles et de l’Environnement.
10. Bouquiaux J.-M. et al. (2009), Performances et rentabilité en agriculture wallonne, Namur, Belgique : Direction opérationnelle de l’Agriculture, des Ressources naturelles et de l’Environnement, (Les livrets de l’agriculture ; n°18).
11. Bourgeois Luthi N. et al. (2006), Review, analysis and dissemination of experiences in dairy production in Vietnam, AVSF/ACI/FAO final report, Rome, Italy : FAO.
12. Brossier J. et al. (2006), Gestion de l’exploitation agricole familiale. Eléments théoriques et méthodologique, Dijon, France : Educagri éditions.
13. Bublot G. (1965), L’exploitation agricole. Economie-Gestion-Analyse, Louvain, Belgique : Editions Nauwelaerts.
14. Burny P. (2011), Atouts, faiblesses et défis futurs de la filière lait et produits laitiers en Belgique, In : CRA-W & GxABT, Seizième Carrefour des Productions animales « La filière laitière bovine européenne est-elle durable ? », Gembloux, Belgique, 2 mars 2011, Gembloux, Belgique : CRA-W, 8-14.
15. Butterfield, K.L. (1910), Analysis of the Rural Problem, In : American Farm Management Association, Report of the First Annual Meeting, Baltimore, USA : American Farm Management Association.
16. C.S.W.A.A.A (2004), Analyse de l’évolution de la rentabilité des exploitations agricoles à partir de RWCA sur une moyenne période, Rapport final provisoire, Liège, Belgique : C.S.W.A.A.A.
174 References
17. Cai D. V (2009), Research and develop of dairy production in Vietnam. Ho Chi Minh City, Vietnam : Southern Institutes of Science in Agriculture.
18. Can Tho University (2007), Research of the fish farming chain. Processing plant gained, http://www.baovietnam.vn/kinh-te/65262/23/Nghien-cuu-chuoi-gia-tri-ca-tra,- Doanh-nghiep-che-bien-huong-loi, (22/12/2009).
19. CBL (2011). Rapport annuel 2011. Année activité 2010, Leuven, Belgique : Confédération belge de l'industrie laitière, http://www.bcz-cbl.be/www/, (22/09/2011).
20. Chen, I. J. & Paulraj, A. (2004), Towards a theory of supply chain management. The constructs and measurements. Journal of Operations Management, 22(2), 119-150.
21. Closset M. F. (2010), Perpectives du secteur laitier en Wallonie, Namur : Direction générale de l’Agriculture, Division de la Politique agricole.
22. Commission européenne (2011). Milk Market Situation. Bruxelles, Belgique : Commission européenne.
23. Conseil de Filière Lait et Produits Laitiers Wallonne (2010). La filière laitière en Région wallonne. Gembloux, Belgique : FLPLW.
24. Dairy Australia (2011), Australian dairy industry in focus 2011, Victoria, Australia : Dairy Australia Ltd, http://www.dairyaustralia.com.au/Industry-overview/About-Dairy-Australia/~/media/Documents/Statistics-and-markets/Australian%20Dairy%20Industry%20in%20Focus/2011/DA_Infocus_2011_www.ashx, http://www.dairyaustralia.com.au/Industry-overview/About-Dairy-Australia/Publications-2.aspx, (20/07/2012).
25. Dang T. M. (2007), Evaluation of the development situation of imported milking cow in Vietnam from 2001-2007, Master thesis in Husbandry : Hanoi University of Agriculture (Vietnam).
26. Dao T.M. (2007), Vietnam retail food sector report 2007, Gain Report No VM7086, Washington, USA : USDA.
27. Dcanz (2012), New Zealand milk production data report, Wellington, New Zealand : Dairy companies association of New Zealand, http://www.dcanz.com/files/New%20Zealand%20Milk%20Production%2023Jul2012.pdf, (26/07/2012).
28. De Vries M. et al. (2012), Monitoring animal welfare and product quality of Dutch dairy farms, Wageningen University, The Netherlands : Wageningen Institute of Animal Sciences.
29. DGA-DPA (2007), Etude du secteur laitier Wallon. Synthèse et annexes, Namur, Belgique : Direction générale de l’Agriculture, Division de la Politique agricole.
30. Dgarne D. (2009), Harmonisation des concepts dans les comptabilités analytiques agricoles en Wallonie, Version 3.0, Belgique.
31. Dolan C. & Humphrey J. (2000), Governance and trade in fresh vegetables. The impacts of supermarkets on the African horticulture industry, Journal of Development Studies, 37(2), 147-176.
32. DPI (2010), Dairy industry monitor project. Annual report 2009/10, Victoria, Australia : Dairy Australia, Department of Primary Industries of Australia.
33. DPI (2012), Dairy, Victoria, Australia : Department of Primary Industries of Australia, http://www.dpi.vic.gov.au/agriculture/dairy, (20/07/2012).
34. Dunn, E. (2005), AMAP BDS knowledge and practice task order lexicon. MicroNOTE No. 6, Washington, USA : USAID.
References 175
35. EC (EU FADN) (2010), EU dairy farm report 2010, based on FADN data, Brussels, Belgium : European Commission, Agriculture and Rural Development.
36. EC (EU FADN) (2011), EU dairy farm report 2011, based on FADN data, Brussels, Belgium : European Commission, Agriculture and Rural Development.
37. EC (European Commission) (2004), Project cycle management guidelines, Volume 1, Brussels, Belgium : EuropeAid Cooperation Office.
38. Ellis, F. (1993), Peasant economics. Farm households and agrarian development, 2nd ed., Cambridge, UK : Cambridge University Press, (WYE studies in agricultural and rural development).
39. Ernst D. & Kim L. (2001), Global production networks, knowledge diffusion, and local capability formation: a conceptual framework, Working Papers No 19, Honolulu, Hawaï : East-West Center,
40. Ernst D., (1999), Globalization and the changing geography of innovation systems. A policy perspective on global production networks, In : International Workshop « The political economy of technology in developing countries », Brighton, UK, October 8-9, 1999.
41. Fabre P. (1994), Note de méthodologie générale sur l'analyse de filière. Utilisation de l'analyse de filière pour l'analyse économique des politiques, Rome : FAO.
42. FAOSTAT (2009), Data of Vietnam, Rome, Italy : FAO Statistics Divisions.
43. Feller, A. et al. (2006), Value chains versus supply chains, BPTrends, (March 2006), 1-7.
44. Garcia O. et al. (2007), The economics of milk production in Hanoi, Vietnam, with particular emphasis on small-scale producers, PPLPI Working paper No.33, Kiel, Germany : IFCN.
45. Gautier P. (2008), Smallholder dairy in Vietnam, study and presentation on behalf of FAO within the project “Improved Market Access and Smallholder dairy farmer Participation for Sustainable Dairy Development”, Rome : FAO, (CFC/FIGMDP/16FT).
46. Gereffi G. & Korzeniewicz M. (1994), Commodity chains and global capitalism, Westport, Ireland : Praeger.
47. Gereffi G. (1994), The organization of buyer-driven global commodity chains. How US retailers shape overseas production networks, In : Gereffi G. & Korzeniewivz M., (eds.), Commodity chains and global capitalism, Westport, Ireland : Praeger, 95-122.
48. Gereffi G. (1999), International trade and industrial upgrading in the apparel commodity chain, Journal of International Economics, 48(1), 37-70.
49. Gereffi, G. et al. (2001), Introduction. Globalisation, value chains and development. IDS Bulletin, 32(3), 1-8.
50. Giuliani, E. et al. (2005), Upgrading in global value chains. Lessons from Latin American Clusters. World Development, 33(4/April 2005), 549-573.
51. GSO (1983), Population and Housing census Preliminary 1-10-1979, Hanoi, Vietnam : Statistic Publisher.
52. GSO (1992), Population and Housing census Preliminary 1-4-1989, Hanoi, Vietnam : Statistic Publisher.
53. GSO (2000), Population and Housing census Preliminary 1-4-1999, Hanoi, Vietnam : Statistic Publisher.
54. GSO (2005), Population and Housing census Preliminary 1-4-2005, Hanoi, Vietnam : Statistic Publisher.
55. GSO (2007a), Annual Statistic Year Book 2006, Hanoi, Vietnam : Statistic Publisher.
176 References
56. GSO (2007b), Rural, Agricultural, and Fishing census Preliminary 2006, Episode 1, Hanoi, Vietnam : Statistic Publisher.
57. GSO (2008), Annual Statistic Year Book 2007, Hanoi, Vietnam : Statistic Publisher.
58. GSO (2008b), Vietnam : 20 years of renovation and development 1986-2005, http://www.gso.gov.VN/default.aspx?tabid=418&ItemID=4326, (20/12/2008).
59. GSO (2009a), Conference of Releasing the 2009 Population & Housing Census Preliminary Results, Hanoi, Vietnam, August 13, 2009.
60. GSO (2009b), Labor structure working at seventh annual distribution by economic sectors and distribution by economic sectors, http://www.gso.gov.vn/default.aspx?tabid=387&idmid=3&ItemID=8628, (21/10/2009).
61. GSO (2009c), Annual Statistic Year Book 2008, Hanoi, Vietnam : Statistic Publisher.
62. GSO (2009d), Press release. Socio-economics statistical data first nine months of 2009, http://www.gso.gov.VN/default.aspx?tabid=388&idmid=3&ItemID=7363, (24/12/2009).
63. GSO (2011a), Unemployment rate of labour forve of working age in urban area by region, http://www.gso.gov.vn/default.aspx?tabid=387&idmid=3&ItemID=9850, (12/08/2011).
64. GSO (2011b), Summary results of the Vietnam household living standard survey 2011, http://www.gso.gov.vn/default_en.aspx?tabid=483&idmid=4&ItemID=11148, (12/08/2011).
65. GSO (2012), Press release. Socio-economics statistical data in 2012, http://www.gso.gov.VN/default.aspx?tabid=388&idmid=3&ItemID=10221, (24/3/2012).
66. GSO (2013), Press release: Socio-economics statistical data nine first months of 2009, http://www.gso.gov.vn/default.aspx?tabid=507&ItemID=13490, (29/03/2013).
67. GTZ (2007), ValueLinks manual. The methodology of value chain promotion. First edition, Eschborn, Germany : GTZ.
68. GTZ-SME (2008), Report of Value Chain Exchange Seminar, Dalat, Vietnam, November 2008.
69. Haggblade, S.J. & Gamser M.S. (1991), A field manual for subsector practitioners, Washington, USA : Development Alternatives, Incorporated.
70. HBBS (2010), Vietnam dairy industry report, 1st Quarter, 2010, http://www.ors.com.vn/reports/2/Report_Industry.aspx?CateID=-1&ParentIn=202&Key=dairy, (02/08/2011).
71. Heady E.O. & Jensen H.R. (1954), Farm Management Economics, Upper Saddle River, USA : Prentice-Hall.
72. Hellriegel D. & Slocum J.W. (1986), Management, 4th ed., Indianapolis, USA : Addison-Wesley.
73. Herr M. L. & Muzira T. J. (2009), Value chain development for decent work. A guide for development practitioners, government and private sector initiatives, Geneva, Switzeland : International Labour Office.
74. Hitt M.A., Middlemist R.D. & Mathis R.L. (1989), Management. Concepts and effective practice, 3rd ed., Saint Paul, USA : West Publishing Co.
75. Hoang Thi Huong T. (2007), Assessing failure and prespective development of crossbreeding cattle in the Northern mountainous region of Vietnam. A study in Bac Kan province, DEA master : Gembloux Faculté Universitaire des Sciences Agronomiques (Belgique).
76. Hoffler/Ogana (2006), Experience on Milk Value chain analysis in Kenya, Kenya.
References 177
77. Holtzman J.S. (2002), Using subsector analysis to assess the impact of policy reform on commodity subsectors, Cairo, Egypt : Abt Associates Inc.
78. Humphrey J. & Schmitz H. (2000), Governance upgrading. Linking industrial cluster and global value chain research, IDS Working paper No 120, Brighton, UK : University of Sussex, Institute of Development Studies.
79. Humphrey J. (2005), Establish value chain for the development. Global value chains in agricultural business, GTZ Eschborn, Germany : GTZ.
80. Humphrey J. (2006), Global value chain in agrifood sector, Sussex, UK : University of Sussex, Institute of Development Studies.
81. IFCN (2006), The economics of milk production in Hanoi, Vietnam, with particular Emphasis on Small scale Producers, PPLPI working paper No. 33, http://www.ifcnnetwork.org/media/pdf/DR10-Extract-lowres.pdf, (20/09/2009).
82. Ipsard (2007), Report on Tea value chain, Hanoi, Vietnam : Ipsard, http://www.ipsard.gov.vn/News/mispa/Taphuan/Nganhhanghe.pdf, (20/11/2009).
83. Ipsard (2008), Effectiveness of dairy farmers in Vietnam, commodity chain approaches, In : Workshop on Development strategy for dairy of Vietnam, Hanoi, Vietnam, October 2008.
84. Ivarsson I. & Alvstam C.G. (2005), Technology transfer from TNCs to local suppliers in developing countries : a study of AB Volvo's truck and bus plants in Brazil, China, India, and Mexico. World Development, 33(8), 1325-1344.
85. IWEPS (2012), Les chiffres-clés de la Wallonie, n°12/février 2012, Namur, Belgique : Iweps. 86. Kaplinsky R. & Morris M. (2000), A handbook for value chain research, Ottawa, Canada :
IDRC.
87. Kaplinsky R. (2000), Globalization and unequalization. What can be learned from value chain analysis, Journal of Development Studies, 37(2), 117-146.
88. Kast R.E. & Rosenzweig J.E. (1974), Organization and management. A systems approach, 2nd ed., Tokyo, Japan : McGraw-Hill Kogakusha.
89. Keyser J. C. (2006), Description of methodology and presentation of templates for value chain analysis, In : Competitive Commercial Agriculture in Sub–Saharan Africa, Washington ; Rome : World Bank ; FAO.
90. Kirzner I.M. (1963), Market theory and the price system, New York, USA : D. Van Nostrand company.
91. Koontz H. (1969), A model for analyzing the universality and transferability of management, Academy of Management Journal, 12(4), 415-429.
92. Le Van Cao L. (2008), Fresh Grass to Fress milk, Ho Chi Minh City, Vietnam : JACCAR Equity Research, http://reports.jaccarequityresearch.com/reports/report/369-Fresh-Grass-To-Fresh-Milk.html, (25/03/2013).
93. Lebailly P. et al. (2008), Commodity chain research methodology, Journal of Science and Development, 6(3), 15-31.
94. Lundvall B. A., (1992), National systems of innovation. Towards a theory of innovation and interactive learning. London, UK : Pinter Publishers.
95. M4P (2008), Making value chains work better for the poor. A tool book for practitioners of value chain analysis. 3rd version. Making markets work better for the poor (M4P) Project. Phnom Penh, Cambodia : UK Department for International Development (DFID), Agricultural Development International.
178 References
96. Mahoney J.T. (1992), The Choice of Organizational Form. Vertical Financial Ownership versus Other Methods of Vertical Integration, Strategic Management Journal, 13(8), 559-584.
97. Maltsoglou I. & Rapsomanikis G. (2005), The contribution of livestock to household income in Vietnam. A household typology based analysis, Pro-poor Livestock Initiative. PPLPI Working Paper No 21, Rome, Italy : FAO.
98. MARD (2013), Report on the situation of milk production and market in September 2012, http://vietnamdairy.org.vn/vi/news.php?mnu=7&nid=1298, (25/3/2013).
99. Martin W. et al. (2007), Using value chain approaches in agribusiness and agriculture in Sub- Saharan Africa. A methodological guider, Tool as that make value chains work : Discussion and cases, Washington, USA : The World Bank.
100. MCM (2009), Report on the situation of dairy production 2008, Son La, Vietnam. 101. MCM (2010), Report on the situation of dairy production 2009, Son La, Vietnam. 102. MCM (2011), Report on the situation of dairy production 2010, Son La, Vietnam. 103. MCMA/CEA (2002), “Livre de l’exploitation”, Belgique.
104. Mintzberg H. (1983), Structure in fives : designing effective organizations, Upper Saddle River , USA : Prentice-Hall.
105. Mitchell J., Coles C. & Keane J. (2009), Upgrading along value chains. Strategies for poverty reduction in Latin America, Briefing paper December 2009, London, UK : Overseas Development Institute (ODI).
106. Molina N., (2010), Value chain analysis of Asian vegetables produced in Honduras, Doctoral Thesis : Humboldt Universität zu Berlin, Department of Agricultural Economics, Division of Horticultural Economics (Germany).
107. MOPI GSO (2007), Report on the summary result of household living standard investigation 2006, Hanoi, Vietnam : General Statistics Office.
108. Morgan N. (2008), FAO vision for the Dairy Development in Asia, In : Conference on Dairy Strategy in Vietnam, Hanoi, Vietnam, 30-31/10/2008.
109. MRW (2002), Transmission d’information relatives au revenue agricole dans le cadre du rapport annuel du Conseil Supérieur Wallon de l’Agriculture, de l’Agroalimentaire et de l’Alimentation (C.S.W.A.A.A) : Constitution d’une banque de données comptables agricoles à partir d’informations collectées auprès de deux centres de gestion, Rapport final provisoire, Namur, Belgique : Ministère de la Région wallonne.
110. MRW (2003), Transmission d’information relatives au revenue agricole dans le cadre du rapport annuel du Conseil Supérieur Wallon de l’Agriculture, de l’Agroalimentaire et de l’Alimentation (C.S.W.A.A.A) : Constitution d’une banque de données comptables agricoles à partir d’informations collectées auprès de deux centres de gestion, Rapport final provisoire, Namur, Belgique : Ministère de la Région wallonne.
111. MRW (2004), Transmission d’information relatives au revenue agricole dans le cadre du rapport annuel du Conseil Supérieur Wallon de l’Agriculture, de l’Agroalimentaire et de l’Alimentation (C.S.W.A.A.A) : Constitution d’une banque de données comptables agricoles a partir d’informations collectées auprès de deux centres de gestion, Rapport final provisoire, Namur, Belgique : Ministère de la Région wallonne.
112. Nagurney A. (2006), Supply chain network economics. Dynamics of prices, flows, and profits, Camberley, UK : Edward Elgar Publishing.
113. National Assembly (NA) (2003), Law on land, Hanoi, Vietnam.
References 179
114. Nguyen A. P. (2007), Improved market access and smallholder dairy farmer participation for sustainable dairy development (CFC/FIGMDP/16FT). Lessons learned studies case of Vietnam. Hanoi, Vietnam : Institute of Policy and Strategy for Agriculture and Rural Development , Commodity Analysis Division.
115. Nguyen Tai Anh et al. (2009), Moc Chau Sonla Plantation. 50 years foundation and growth, Sonla, Vietnam.
116. NIAH (2011), Vietnam Animal husbandry, Hanoi, Vietnam : Scientific and Technological Publishing house.
117. Nix, J. (1979). Farm management. The state of the an (or science), Journal of Agricultural Economics, 30(3), 277-292.
118. Nzier (2010), Dairy’s role in sustaining New Zealand-The sector’s contribution to the economy. Report to Fonterra and Dairy New Zealand, December 2010, Wellington, New Zealand : New Zealand Institute of Economic Research Inc.
119. Palmade V., (2005), Industry level analysis. The way to identify the binding constraints to economic growth, Washington, USA : World Bank, (World Bank Policy Research Working Paper ; n° 3551).
120. Philippot, A. et al. (2011), Competitiveness analysis of the Netherlands and the Dutch dairy cluster, Den Haag, The Netherlands : Microeconomics of Competitiveness.
121. Pietrobelli C. & Rabellotti R., (2002), Upgrading in Clusters and value chain in Latin America. The role of Policies, Washington, USA : Inter-American Development Bank.
122. Pincus J. (2010), Milk price registration and regulations in Vietnam. Will it lower milk prices ? Ho Chi Minh City, Vietnam : Fulbright Economic Teaching Program.
123. Porter, M. E. (1985), Competitive advantage, New York, USA : The Free Press.
124. Porter, M. E. (1996), What is strategy ? Harvard Business Review, (November–December 1996), 61-78.
125. Quinn, J.B. & Hilmer F.G. (1994), Strategic Outsourcing, In : Sloan Management Review, (Summer 1994), 43-55
126. Raikes P., Jensen M. F. & Ponte S. (2000), Global commodity chain analysis and the french « filière » approach. Comparison and critique, CDR Working paper No 00.3/February 2000, Copenhagen, Danmark : Centre for Development Research.
127. Raikes P., Jensen M. F. & Ponte S. (2000), Global commodity chain analysis and the french “filière” approach, Economy and Society, 29(3), 390-417.
128. Richards M. et al. (2003), Options for rural poverty reduction in central America, ODI briefing Paper, January 2003, London, UK : ODI.
129. Ridler B. J. & Hurley E. M. (1984), The management policy for Massey University’s large herd. In : Proceedings of the Ruakuara Farmers Conference 36, 15-19.
130. Salvatore D. & Reagle D. (2002), Statistics and econometrics. 2nd edition., New York, USA : McGraw-Hill.
131. Schmitz H. (2005), Value chain analysis for policy-makers and practitioners, Geneva, Switzerland : International Labor Office.
132. Schmitz H. (1995), Collective efficiency. Growth path for small-scale industry, Journal of Development Studies, 31(4), 529-566.
133. Shaffer J. D. (1973), On the concept of subsector studies, American Journal of Agricultural Economics, (55), 333-335.
180 References
134. SNV (2004), Synthesis of the 1st cycle of CVRD debate.
135. SNZ (2011), Agricultural Production Statistics: June 2011 (Provisional), Wellington, New Zealand : Statistic office of New Zealand, http://www.stats.govt.nz/browse_for_stats/industry_sectors/agriculture-horticulture-forestry/AgriculturalProduction_MRJun11prov.aspx, (26/07/2012).
136. Springer-Heinze A. (2008), Value Chain Exchange Seminar, Dalat, Vietnam, November 2008.
137. SPW (2009), Evaluation de l’économie agricole et horticole de la Région wallonne 2008-2009, Namur, Belgique : Service Public de Wallonie.
138. STATLINE (2012), Milk supply and dairy production by dairy factories, Den Haag, The Netherlands : Statistics Netherlands, http://statline.cbs.nl/StatWeb/publication/?DM=SLEN&PA=7425ENG&D1=0,3-9&D2=155,168,181,194,207&LA=EN&HDR=T&STB=G1&VW=T, (20/8/2012).
139. Subramanian U & Matthijs M., (2007), Can Sub-Saharan Africa Leap into Global Network Trade ? World Bank Policy Research Working Paper No 4112/January 2007, Washington, USA : World Bank, http://papers.ssrn.com/sol3/papers.cfm?abstract_id =956492, (20/10/2012).
140. Swedberg R. (1990), economics and sociology. Redefining their boundaries. Conversations with economists and sociologists, Princeton, USA : Princeton University Press.
141. Thien H. V. (2010), Evaluation milk yield and quality of HF dairy cow in Moc Chau Dairy cow Joint stock Company, Master of Art in Agriculture, Hanoi, Vietnam.
142. Trach N. X (2010), Concentrates to dairy cows, Hanoi, Vietnam : Hanoi University of Agriculture, http://www.hua.edu.vn/khoa/cnts/index2.php?option=com_docman&task=doc_view&gid=271, (30/04/2013).
143. Tran T. K. (2010), Value chain and commodity chain analysis. Basic concept, Course for IMARES program, Hanoi Agriculture University, Vietnam.
144. Tran T. K., (2003), Methodology for analysis of rice production costs evoluation. Application to Mekong region (Vietnam), Doctoral thesis : Faculté Universitaire des Sciences agronomiques de Gembloux (Belgique).
145. Trienekens J.H. (2011), Agricultural Value Chains in developing countries. A framework for analysis, International Food and Agribusiness Management Review,14(2), 51-82.
146. Tuyen D. K. (2001), Study of suitable techniques to use the improved local cattle form milk production in smallholders. Hanoi, Vietnam : Department of Agricultural extension, Ministry of Agriculture and Rural Development.
147. Tuyen D. K. (2008), Dairy strategry for Vietnam to 2020, In : Workshop on Development strategy for dairy of Vietnam, October 2008, Hanoi, Vietnam.
148. USDA-Foreign Agricultural Service (2005), Vietnam Livestock and Products, Update 2004. Wahington, USA : USDA-Foreign Agricultural Service.
149. VEEPRO (2012), Dairy data 2010/2011, Ah Zoetermeer, The Netherlands : Information Centre for Dutch Dairy Cattle, http://www.veepro.nl/cms/dairy-info/H218, (20/08/2012).
150. VOV News/VNA (2008), A development strategy for dairy industry under discussion, http://english.vovnews.vn/Home/A-development-strategy-for-dairy-industry-under-discussion/200810/12063.vov, (10/11/2008).
151. Watters A. F. (1990), Farm monitoring as an initiator of improved farm management practices, In : Processings of the New Zealand Grassland Association, Ashburton, New Zealand, 1990, 52, 17-19.
References 181
152. World Bank/GDS (2007), Toward a development strategy for private sector in Campuchia, (1), 19.
153. WUR (2011), Value chain, social inclusion and economic development. Contrasting theories and realities, Sietze Vellema, The Netherlands : A.H.J. Helmsing.
154. Zuurbier P. J. P. (2003), Global food supply chains and the role of smallholders. Getting access tomarkets, Wageningen, The Netherlands : Wageningen University.

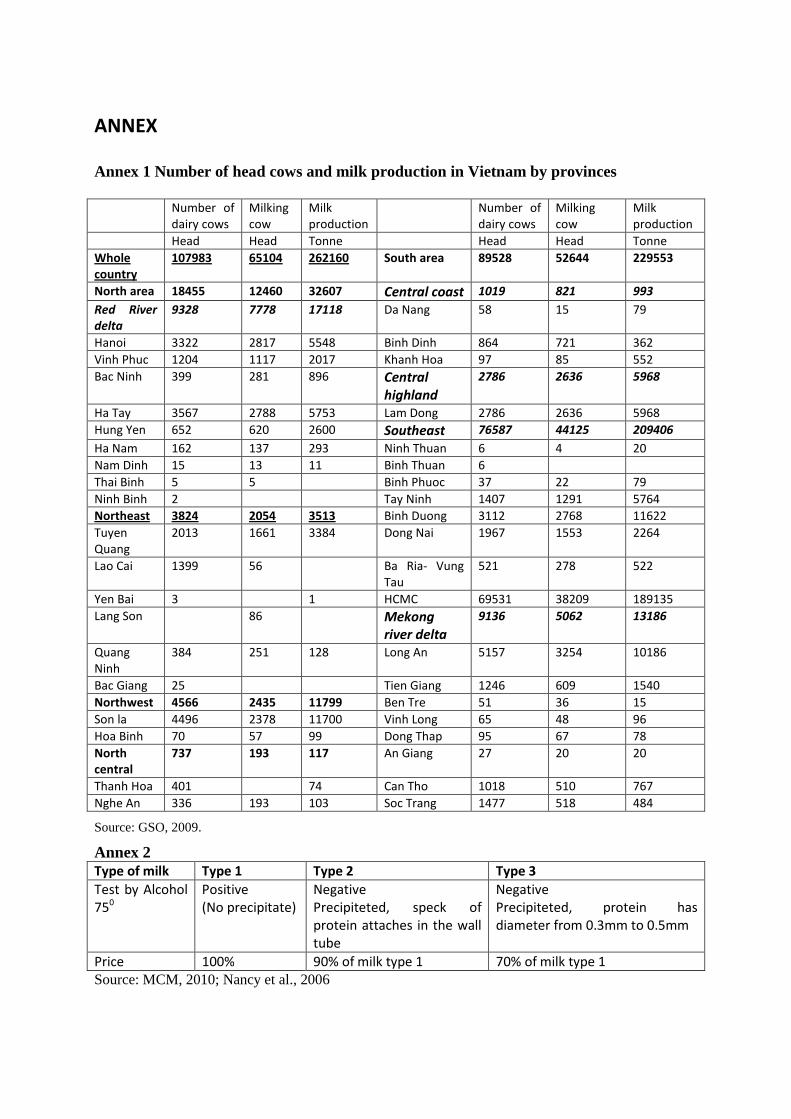
ANNEX
Annex 1 Number of head cows and milk production in Vietnam by provinces Number of
dairy cows
Milking
cow
Milk
production
Number of
dairy cows
Milking
cow
Milk
production
Head Head Tonne Head Head Tonne
Whole
country
107983 65104 262160 South area 89528 52644 229553
North area 18455 12460 32607 Central coast 1019 821 993
Red River
delta
9328 7778 17118 Da Nang 58 15 79
Hanoi 3322 2817 5548 Binh Dinh 864 721 362
Vinh Phuc 1204 1117 2017 Khanh Hoa 97 85 552
Bac Ninh 399 281 896 Central
highland
2786 2636 5968
Ha Tay 3567 2788 5753 Lam Dong 2786 2636 5968
Hung Yen 652 620 2600 Southeast 76587 44125 209406
Ha Nam 162 137 293 Ninh Thuan 6 4 20
Nam Dinh 15 13 11 Binh Thuan 6
Thai Binh 5 5 Binh Phuoc 37 22 79
Ninh Binh 2 Tay Ninh 1407 1291 5764
Northeast 3824 2054 3513 Binh Duong 3112 2768 11622
Tuyen
Quang
2013 1661 3384 Dong Nai 1967 1553 2264
Lao Cai 1399 56 Ba Ria- Vung
Tau
521 278 522
Yen Bai 3 1 HCMC 69531 38209 189135
Lang Son 86 Mekong
river delta
9136 5062 13186
Quang
Ninh
384 251 128 Long An 5157 3254 10186
Bac Giang 25 Tien Giang 1246 609 1540
Northwest 4566 2435 11799 Ben Tre 51 36 15
Son la 4496 2378 11700 Vinh Long 65 48 96
Hoa Binh 70 57 99 Dong Thap 95 67 78
North
central
737 193 117 An Giang 27 20 20
Thanh Hoa 401 74 Can Tho 1018 510 767
Nghe An 336 193 103 Soc Trang 1477 518 484
Source: GSO, 2009.
Annex 2 Type of milk Type 1 Type 2 Type 3
Test by Alcohol
750
Positive
(No precipitate)
Negative
Precipiteted, speck of
protein attaches in the wall
tube
Negative
Precipiteted, protein has
diameter from 0.3mm to 0.5mm
Price 100% 90% of milk type 1 70% of milk type 1
Source: MCM, 2010; Nancy et al., 2006
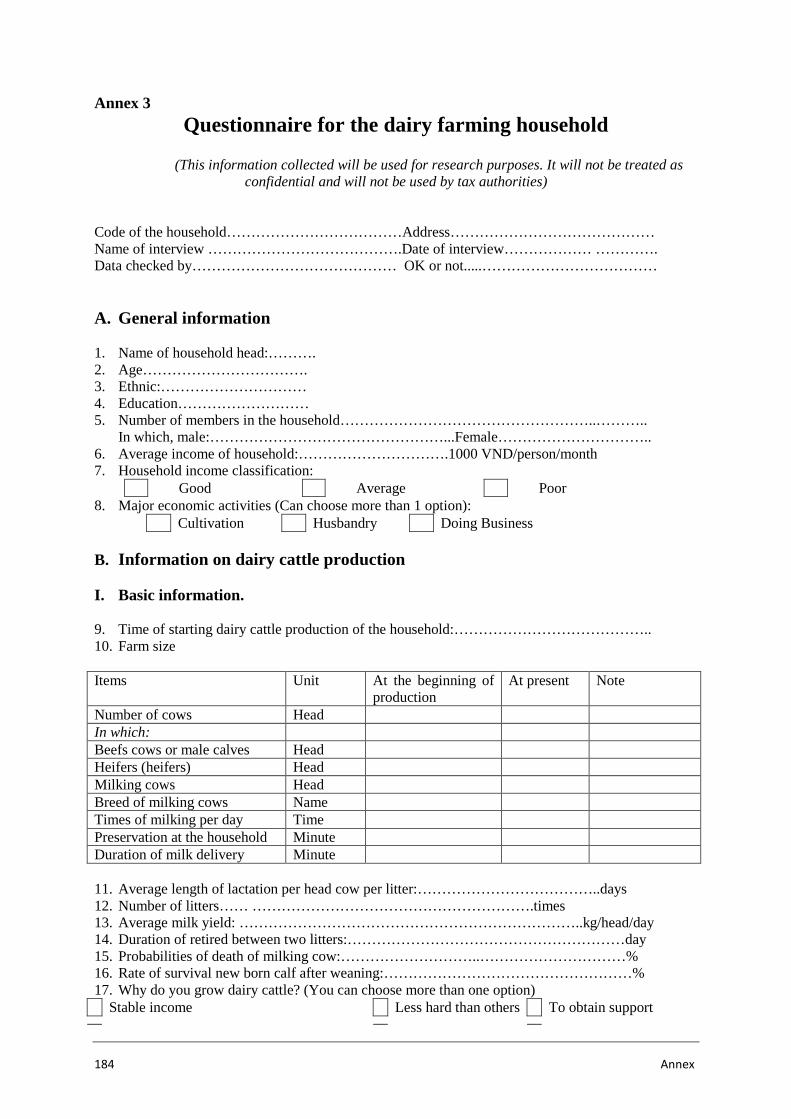
184 Annex
Annex 3
Questionnaire for the dairy farming household
(This information collected will be used for research purposes. It will not be treated as confidential and will not be used by tax authorities)
Code of the household………………………………Address…………………………………… Name of interview ………………………………….Date of interview……………… …………. Data checked by…………………………………… OK or not.....……………………………… A. General information 1. Name of household head:………. 2. Age……………………………. 3. Ethnic:………………………… 4. Education……………………… 5. Number of members in the household……………………………………………..……….. In which, male:…………………………………………...Female………………………….. 6. Average income of household:………………………….1000 VND/person/month 7. Household income classification:
Good Average Poor 8. Major economic activities (Can choose more than 1 option):
Cultivation Husbandry Doing Business B. Information on dairy cattle production I. Basic information. 9. Time of starting dairy cattle production of the household:………………………………….. 10. Farm size Items Unit At the beginning of
production At present Note
Number of cows Head In which: Beefs cows or male calves Head Heifers (heifers) Head Milking cows Head Breed of milking cows Name Times of milking per day Time Preservation at the household Minute Duration of milk delivery Minute 11. Average length of lactation per head cow per litter:………………………………..days 12. Number of litters…… ………………………………………………….times 13. Average milk yield: ……………………………………………………………..kg/head/day 14. Duration of retired between two litters:…………………………………………………day 15. Probabilities of death of milking cow:………………………..…………………………% 16. Rate of survival new born calf after weaning:……………………………………………% 17. Why do you grow dairy cattle? (You can choose more than one option) Stable income Less hard than others To obtain support
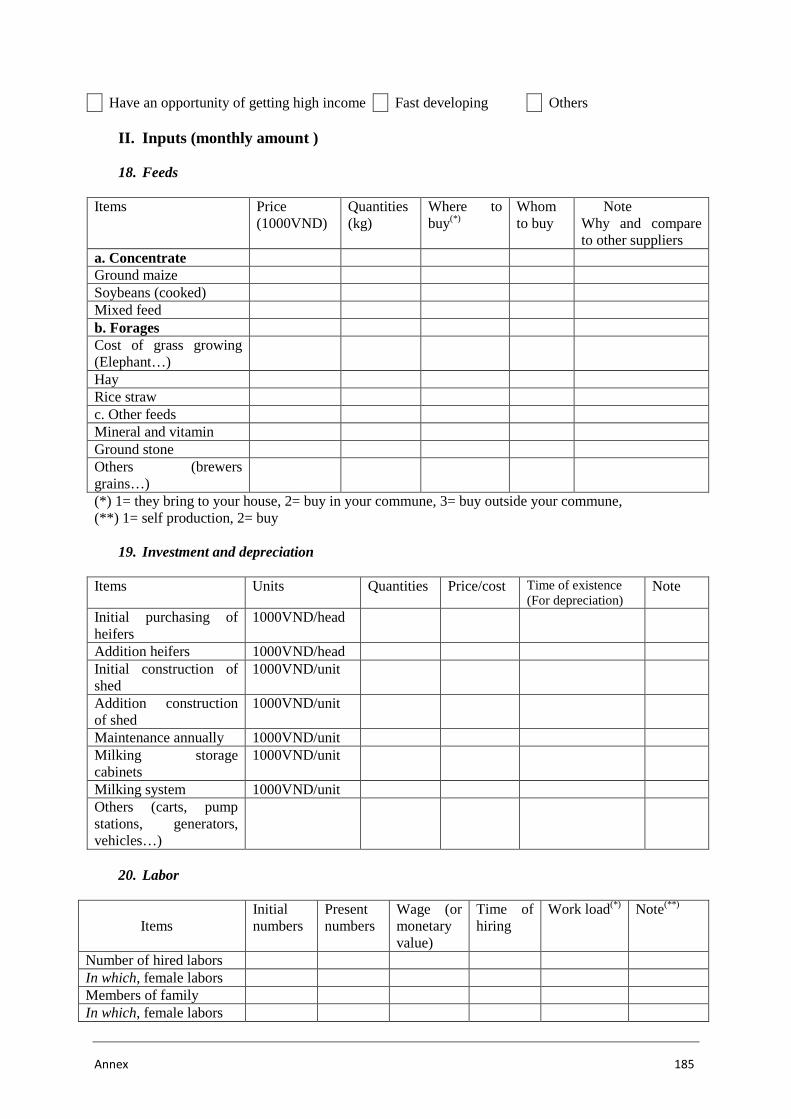
Annex 185
Have an opportunity of getting high income Fast developing Others
II. Inputs (monthly amount )
18. Feeds Items Price
(1000VND) Quantities (kg)
Where to buy(*)
Whom to buy
Note Why and compare to other suppliers
a. Concentrate Ground maize Soybeans (cooked) Mixed feed b. Forages Cost of grass growing (Elephant…)
Hay Rice straw c. Other feeds Mineral and vitamin Ground stone Others (brewers grains…)
(*) 1= they bring to your house, 2= buy in your commune, 3= buy outside your commune, (**) 1= self production, 2= buy
19. Investment and depreciation Items Units Quantities Price/cost Time of existence
(For depreciation) Note
Initial purchasing of heifers
1000VND/head
Addition heifers 1000VND/head Initial construction of shed
1000VND/unit
Addition construction of shed
1000VND/unit
Maintenance annually 1000VND/unit Milking storage cabinets
1000VND/unit
Milking system 1000VND/unit Others (carts, pump stations, generators, vehicles…)
20. Labor
Items
Initial numbers
Present numbers
Wage (or monetary value)
Time of hiring
Work load(*) Note(**)
Number of hired labors In which, female labors Members of family In which, female labors
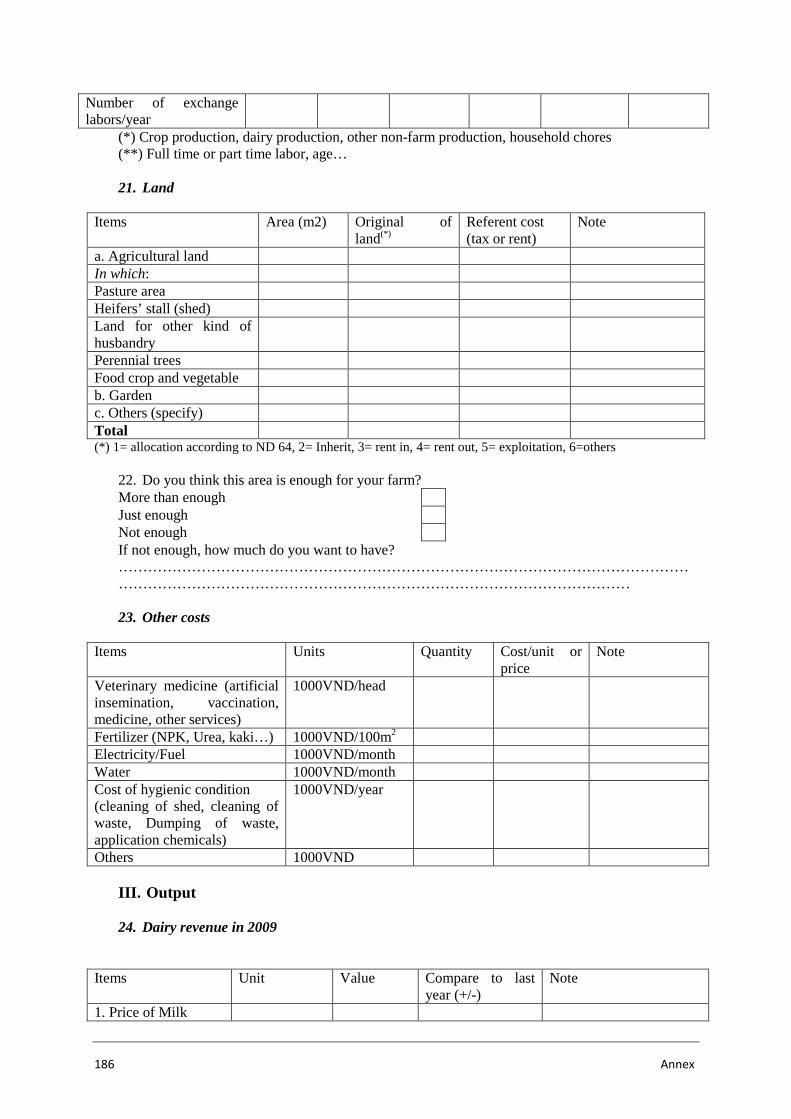
186 Annex
Number of exchange labors/year
(*) Crop production, dairy production, other non-farm production, household chores (**) Full time or part time labor, age… 21. Land
Items Area (m2) Original of
land(*) Referent cost (tax or rent)
Note
a. Agricultural land In which: Pasture area Heifers’ stall (shed) Land for other kind of husbandry
Perennial trees Food crop and vegetable b. Garden c. Others (specify) Total (*) 1= allocation according to ND 64, 2= Inherit, 3= rent in, 4= rent out, 5= exploitation, 6=others
22. Do you think this area is enough for your farm? More than enough Just enough Not enough If not enough, how much do you want to have? …………………………………………………………………………………………………………………………………………………………………………………………………… 23. Other costs
Items Units Quantity Cost/unit or price
Note
Veterinary medicine (artificial insemination, vaccination, medicine, other services)
1000VND/head
Fertilizer (NPK, Urea, kaki…) 1000VND/100m2 Electricity/Fuel 1000VND/month Water 1000VND/month Cost of hygienic condition (cleaning of shed, cleaning of waste, Dumping of waste, application chemicals)
1000VND/year
Others 1000VND
III. Output
24. Dairy revenue in 2009 Items Unit Value Compare to last
year (+/-) Note
1. Price of Milk
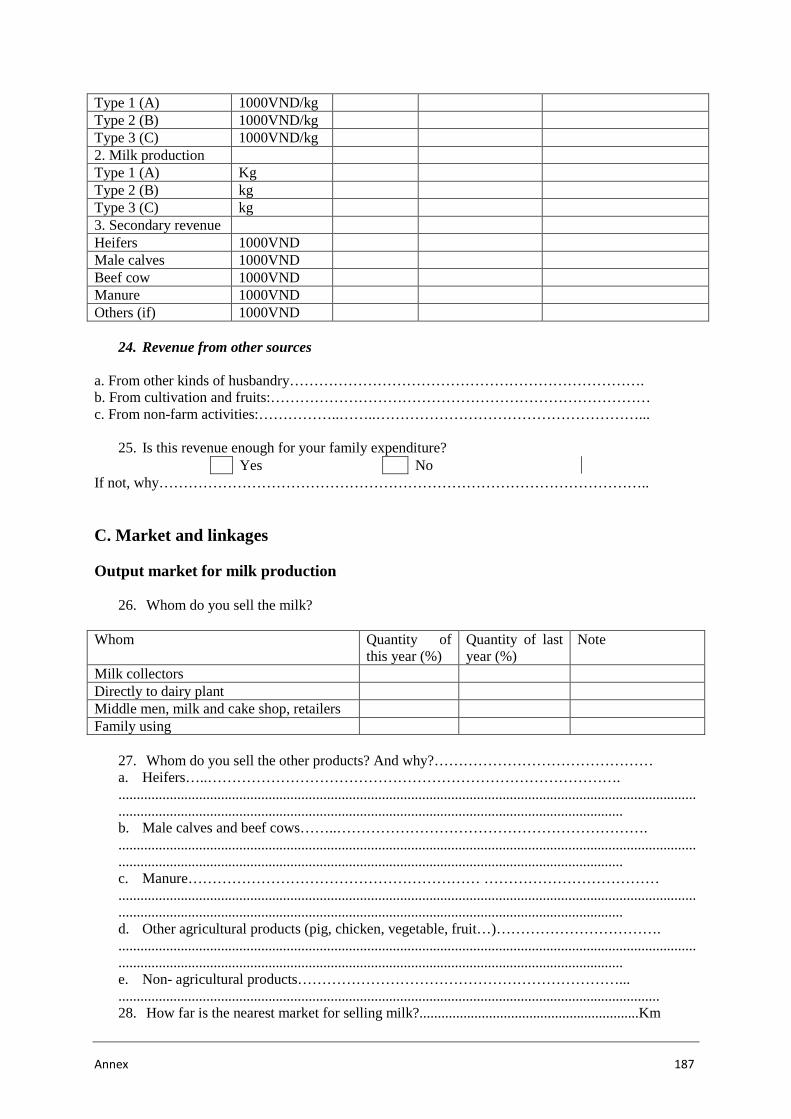
Annex 187
Type 1 (A) 1000VND/kg Type 2 (B) 1000VND/kg Type 3 (C) 1000VND/kg 2. Milk production Type 1 (A) Kg Type 2 (B) kg Type 3 (C) kg 3. Secondary revenue Heifers 1000VND Male calves 1000VND Beef cow 1000VND Manure 1000VND Others (if) 1000VND
24. Revenue from other sources a. From other kinds of husbandry………………………………………………………………. b. From cultivation and fruits:…………………………………………………………………… c. From non-farm activities:……………..……..………………………………………………...
25. Is this revenue enough for your family expenditure?
Yes No If not, why……………………………………………………………………………………….. C. Market and linkages Output market for milk production
26. Whom do you sell the milk?
Whom Quantity of this year (%)
Quantity of last year (%)
Note
Milk collectors Directly to dairy plant Middle men, milk and cake shop, retailers Family using
27. Whom do you sell the other products? And why?……………………………………… a. Heifers…..…………………………………………………………………………. ........................................................................................................................................................................................................................................................................................................ b. Male calves and beef cows……..………………………………………………………. ........................................................................................................................................................................................................................................................................................................ c. Manure…………………………………………………… ……………………………… ........................................................................................................................................................................................................................................................................................................ d. Other agricultural products (pig, chicken, vegetable, fruit…)……………………………. ........................................................................................................................................................................................................................................................................................................ e. Non- agricultural products…………………………………………………………... .................................................................................................................................................... 28. How far is the nearest market for selling milk?............................................................Km
188 Annex
29. What is the available means of transportation?..................................................................
30. Did you face any difficulty in distributing your products? Yes No
If yes, what are they?…………………………………………………………………… ……………………………………………………………………………………... Why?................................................................................................................................................................................................................................................................................................................................................................................................................................................. 31. According to your point of views, is the price of your products in the market high or low?
High OK Low Why?……………………………………………………………………………………….. ........................................................................................................................................................................................................................................................................................................ 32. Could you please give some ideas for improving the efficiency of dairy cattle production? ................................................................................................................................................................................................................................................................................................................................................................................................................................................................................................................................................................................................................
The input market for milk production
33. How many suppliers for milk production are there in the local market? Suppliers of Name of suppliers Note a. Heifers b. Feeds c. Fertilizers d. Machineries and equipments
e. Others .................................................................................................................................................... .................................................................................................................................................... 34. In your opinion, are these numbers few or too many?...................................................... 35. Is it difficult to buy the input?............................................................................................. .................................................................................................................................................... Why? ……………………………………………………………………………………. .................................................................................................................................................... ....................................................................................................................................................................................................................................................................................................... 36. How do you think about the price of input?.......………………………………………… .................................................................................................................................................... .................................................................................................................................................... 37. When do input become scarcity?........................................................................................ ................................................................................................................................................... How can you overcome?............................................................................................................ .................................................................................................................................................... 38. Do you have any idea for improving the input market?………………………………. ………………………………………………………………………………………………… …………………………………………………………………………………………………
Annex 189
Linkages with the dairy plant (company)
39. Did you sign contracts with the dairy plant or Milk Company? Yes No
If yes: a. Which dairy plant/company?................................................................................................ b. Why did you sign contract with them?................................................................................ ………………………………………………………………………………………………… c. Kind of contract: Supplying input Consume output Supplying input – Consume output Other (specify) d. Time/terms of contract:…………………………………………………………………. …………………………………………………………………………………………….. …………………………………………………………………………………………….. e. Do the articles in the contract clear?
Yes No f. Do you have any idea on the signing and implementing the contract?……………… ……………………………………………………………………………………………..
…………………………………………………………………………………………….. . ……………………………………………………………………………………………..
40. Do you receive any support from the dairy plant? a. Loan
Yes No If yes: Amount of loan…………………..1000 VND; Interest rate:……………%. Time/terms:…………………….………. b. Technique:
Yes No If yes, specify?…………………………………………………………………….………
…………………………………………………………………………………………….. . ……………………………………………………………………………………………..
c. Training Yes No
If yes, specify?…………………………………………………………………….. …………………………………………………………………………………………….. . …………………………………………………………………………………………….. Time of training……………………………………………………………..
d. Other supports……………………………………………………………………………. ……………………………………………………………………………………………..
e. Do you want the dairy plant to support any thing else or to change their supports?……... ……………………………………………………………………………………………………………………………………………………………………………………………………………………………………………………………………………………………………..
Linkages with milk collectors
41. Do you sign contract with milk collectors? Yes No
If yes: a. Kind of contract:
190 Annex
b. Time/term:…………………………………………………………………………………………………………………………………………………………………………………………………………………………………………………………………………………………………………………………………………
c. Are the article in the contract clearly? Yes No
42. Could you please suggest some ideas to improve the process of milk collection?……… ……………………………………………………………………………………………..
…………………………………………………………………………………………….. . …………………………………………………………………………………………….. Linkages with suppliers
43. Do you sign contract with suppliers? Yes No
If yes, suppliers of: a. Heifers b. Fertilizers c. Machineries and equipments d. Others 44. Do you receive any support from the suppliers?
Yes No If yes, the supports on:
Amount Condition Note a. Loan b. Heifers c. Fertilizers d. Technique e. Others 45. How do you think about the suppliers?.....................……………………………………. ………………………………………………………………………………………………. ………………………………………………………………………………………………. ……………………………………………………………………………………………….
Linkage with organizations and institutions
46. What do you think about the government and local policies for the development of dairy cattle production in Vietnam?
………………………………………………………………………………………………. ………………………………………………………………………………………………. ………………………………………………………………………………………………. 47. What kinds of supports did you receive from the State and local government? Supports State
government Local government Note
Priority loan/funds for Dairy cattle rising Free tax for Dairy products Price support Subsidy (feeds) Others (specify)
48. Do you have any linkage with or receive any loan from organizations, institutions?
Annex 191
Yes No If yes, which organization Amount
(1000ñ) Interest rate (%)
Time (term) Note
Bank for agriculture and Rural development
Bank for Social Policy Women Union Other loan organization 49. For what purpose did you use the loan? Buy new cows Buy feed Buy equipments for cow husbandry Construct new shed, repair facilities Others 50. Do you have any recommendation regarding the loan support provided by organizations,
institutions? Increase amount of loan Longer duration for loan repayment Lower interest rate Prioritize loan support program for milk production Others 51. Do you get any support on training from organizations, institutions?
Yes No If yes, specify Training program Year
conducted Your assessment on the usefulness and efficiency(*)
Note
Feed ratio combination (formulation) Nutrition value of feeds and supplements used for cow
Improvement of quality of milk and milk hygiene
Vaccination program for cow Some common diseases of milking cow Breeding Management (*) 1=very useful, 2= useful, 3= not useful,
Other (specify) ……………………………………………………………………………………………………. …………………………………………………………………………………………………….. ……………………………………………………………………………………………………. ……………………………………………………………………………………………………..
52. Do you receive any support from other domestic and international NGOs, Programs and Projects?
Yes No If yes, specify
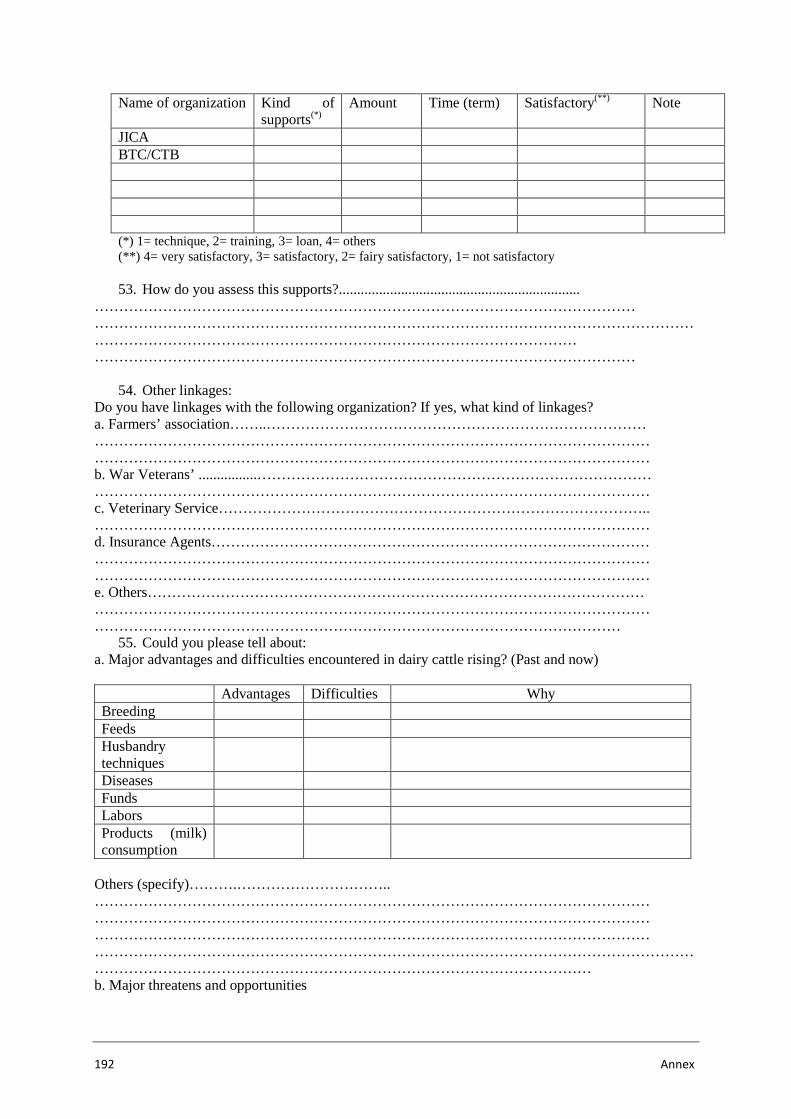
192 Annex
Name of organization Kind of supports(*)
Amount Time (term) Satisfactory(**) Note
JICA BTC/CTB (*) 1= technique, 2= training, 3= loan, 4= others (**) 4= very satisfactory, 3= satisfactory, 2= fairy satisfactory, 1= not satisfactory 53. How do you assess this supports?..................................................................
………………………………………………………………………………………………… …………………………………………………………………………………………………………………………………………………………………………………………………… …………………………………………………………………………………………………
54. Other linkages: Do you have linkages with the following organization? If yes, what kind of linkages? a. Farmers’ association……..…………………………………………………………………… …………………………………………………………………………………………………… …………………………………………………………………………………………………… b. War Veterans’ ................……………………………………………………………………… …………………………………………………………………………………………………… c. Veterinary Service…………………………………………………………………………….. …………………………………………………………………………………………………… d. Insurance Agents……………………………………………………………………………… …………………………………………………………………………………………………… …………………………………………………………………………………………………… e. Others………………………………………………………………………………………… …………………………………………………………………………………………………… ………………………………………………………………………………………………
55. Could you please tell about: a. Major advantages and difficulties encountered in dairy cattle rising? (Past and now) Advantages Difficulties Why Breeding Feeds Husbandry techniques
Diseases Funds Labors Products (milk) consumption
Others (specify)……….………………………….. …………………………………………………………………………………………………… …………………………………………………………………………………………………… …………………………………………………………………………………………………… ……………………………………………………………………………………………………………………………………………………………………………………………………… b. Major threatens and opportunities
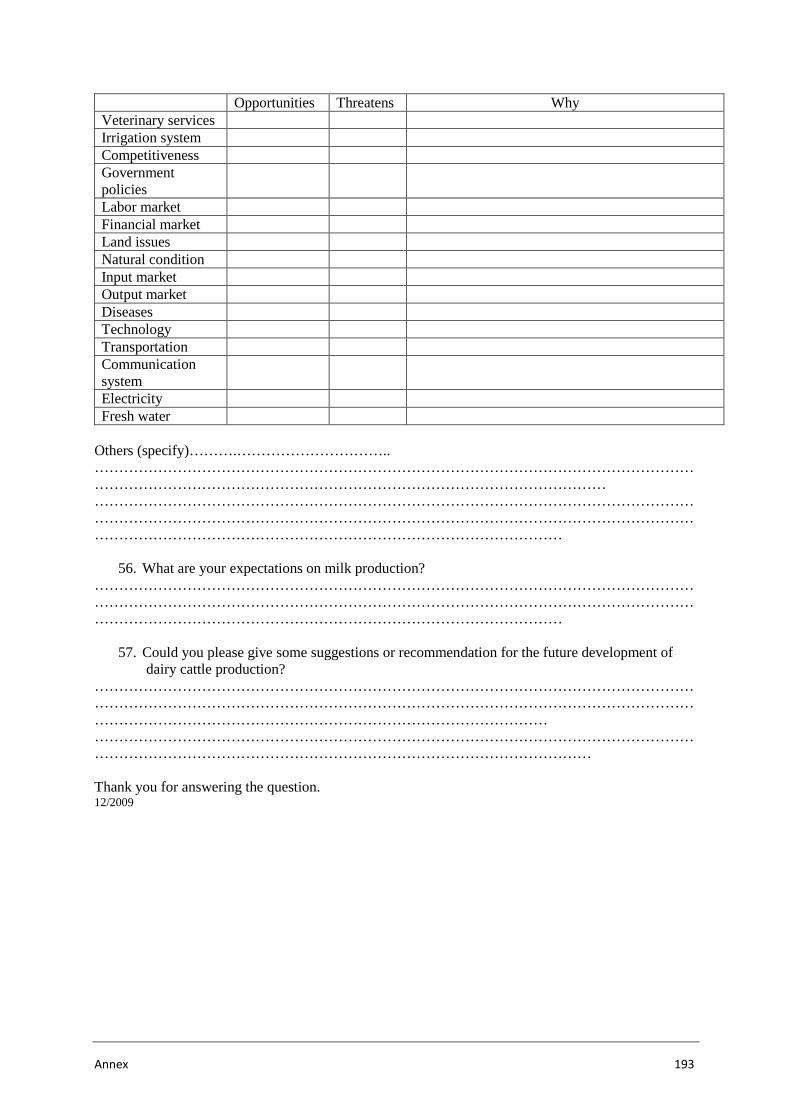
Annex 193
Opportunities Threatens Why Veterinary services Irrigation system Competitiveness Government policies
Labor market Financial market Land issues Natural condition Input market Output market Diseases Technology Transportation Communication system
Electricity Fresh water
Others (specify)……….………………………….. ………………………………………………………………………………………………………………………………………………………………………………………………………… ………………………………………………………………………………………………………………………………………………………………………………………………………………………………………………………………………………………………………………
56. What are your expectations on milk production? ………………………………………………………………………………………………………………………………………………………………………………………………………………………………………………………………………………………………………………
57. Could you please give some suggestions or recommendation for the future development of
dairy cattle production? …………………………………………………………………………………………………………………………………………………………………………………………………………………………………………………………………………………………………………… ……………………………………………………………………………………………………………………………………………………………………………………………………… Thank you for answering the question. 12/2009
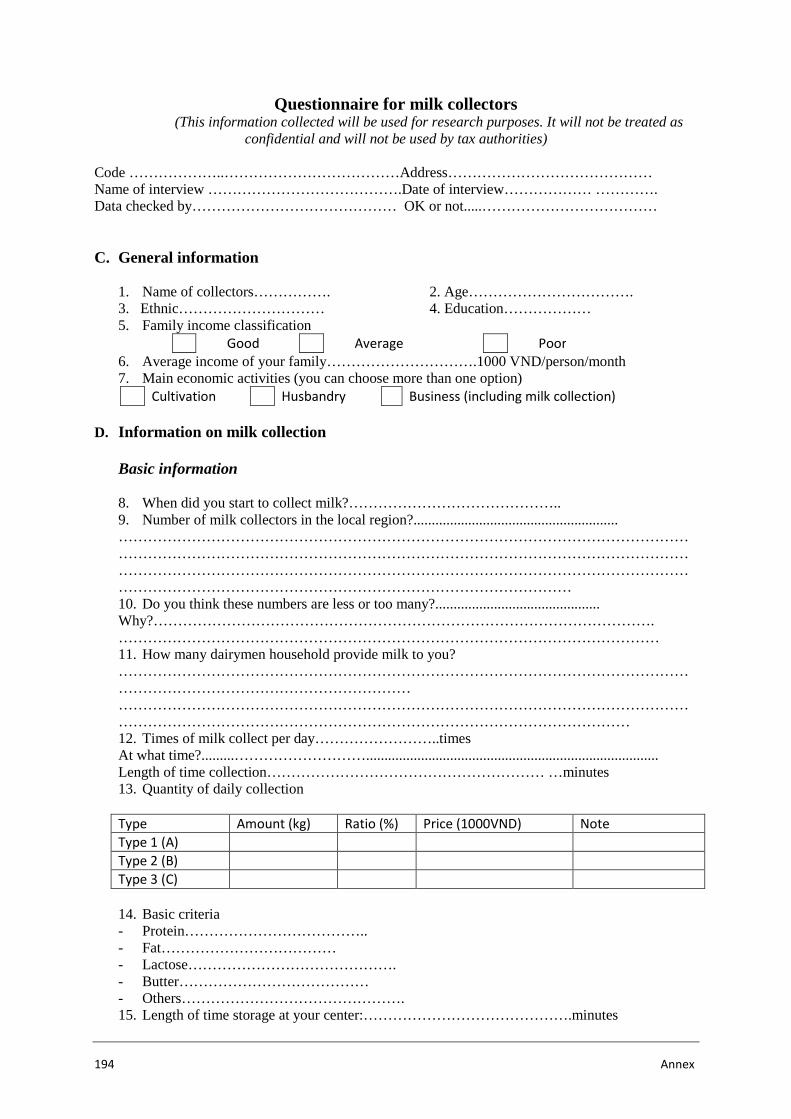
194 Annex
Questionnaire for milk collectors (This information collected will be used for research purposes. It will not be treated as
confidential and will not be used by tax authorities) Code ………………..………………………………Address…………………………………… Name of interview ………………………………….Date of interview……………… …………. Data checked by…………………………………… OK or not.....……………………………… C. General information
1. Name of collectors……………. 2. Age……………………………. 3. Ethnic………………………… 4. Education……………… 5. Family income classification
Good Average Poor
6. Average income of your family………………………….1000 VND/person/month 7. Main economic activities (you can choose more than one option)
Cultivation Husbandry Business (including milk collection)
D. Information on milk collection Basic information
8. When did you start to collect milk?…………………………………….. 9. Number of milk collectors in the local region?........................................................ ………………………………………………………………………………………………………………………………………………………………………………………………………………………………………………………………………………………………………………………………………………………………………………………………………… 10. Do you think these numbers are less or too many?............................................. Why?…………………………………………………………………………………………. ………………………………………………………………………………………………… 11. How many dairymen household provide milk to you? …………………………………………………………………………………………………………………………………………………………… …………………………………………………………………………………………………………………………………………………………………………………………………… 12. Times of milk collect per day……………………..times At what time?.........………………………................................................................................ Length of time collection………………………………………………… …minutes 13. Quantity of daily collection Type Amount (kg) Ratio (%) Price (1000VND) Note
Type 1 (A)
Type 2 (B)
Type 3 (C)
14. Basic criteria - Protein……………………………….. - Fat……………………………… - Lactose……………………………………. - Butter………………………………… - Others………………………………………. 15. Length of time storage at your center:…………………………………….minutes
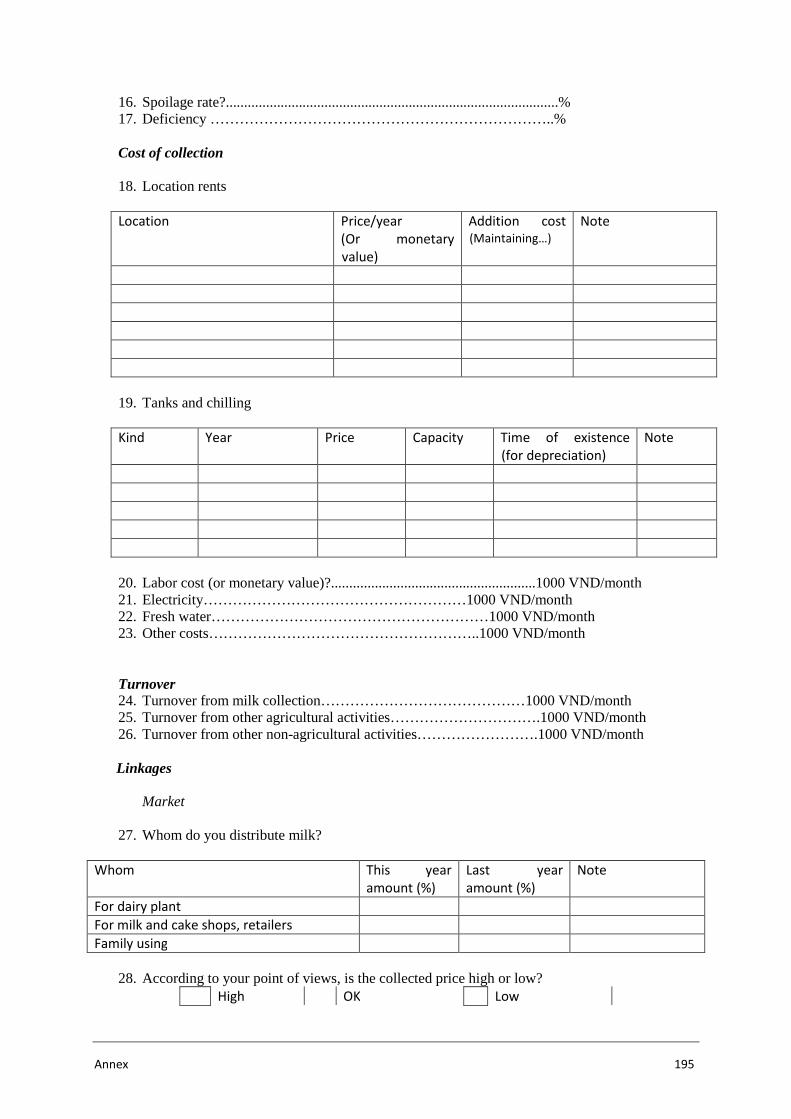
Annex 195
16. Spoilage rate?...........................................................................................% 17. Deficiency ……………………………………………………………..% Cost of collection 18. Location rents
Location Price/year
(Or monetary
value)
Addition cost
(Maintaining…)
Note
19. Tanks and chilling Kind Year Price Capacity Time of existence
(for depreciation)
Note
20. Labor cost (or monetary value)?........................................................1000 VND/month 21. Electricity………………………………………………1000 VND/month 22. Fresh water…………………………………………………1000 VND/month 23. Other costs………………………………………………..1000 VND/month Turnover 24. Turnover from milk collection……………………………………1000 VND/month 25. Turnover from other agricultural activities………………………….1000 VND/month 26. Turnover from other non-agricultural activities…………………….1000 VND/month
Linkages Market
27. Whom do you distribute milk? Whom This year
amount (%)
Last year
amount (%)
Note
For dairy plant
For milk and cake shops, retailers
Family using
28. According to your point of views, is the collected price high or low?
High OK Low
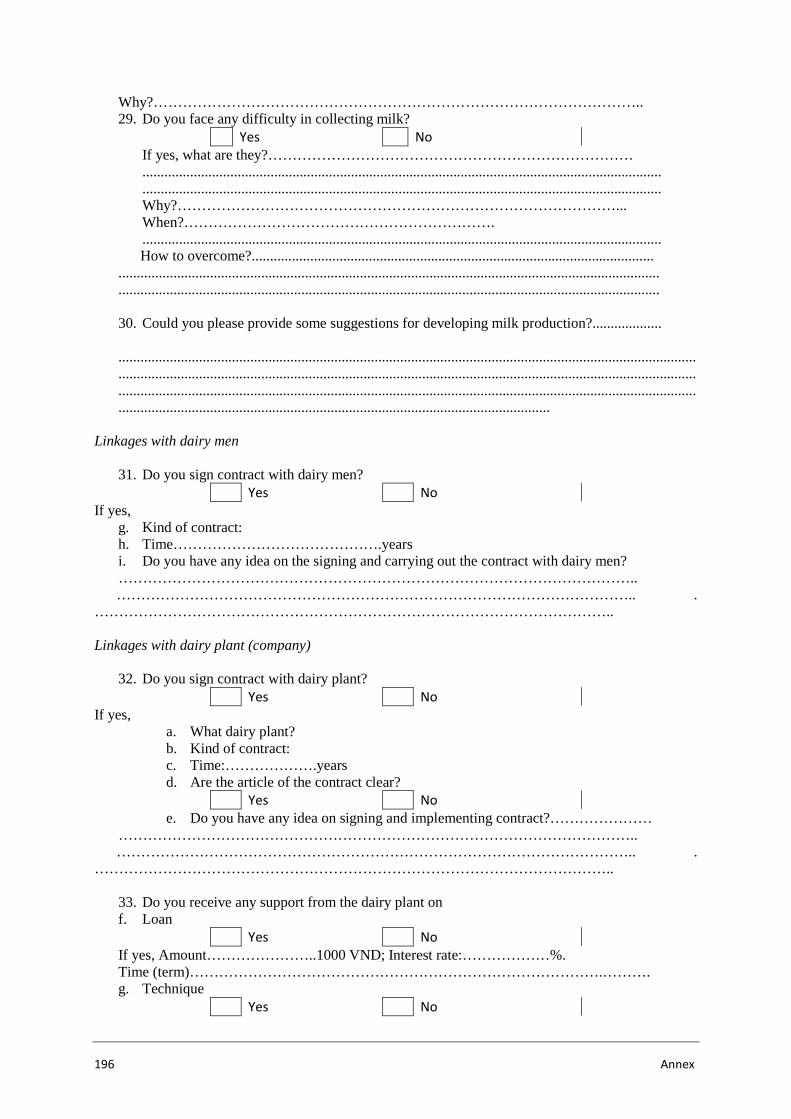
196 Annex
Why?……………………………………………………………………………………….. 29. Do you face any difficulty in collecting milk?
Yes No
If yes, what are they?………………………………………………………………… .............................................................................................................................................. .............................................................................................................................................. Why?………………………………………………………………………………... When?………………………………………………………. ..............................................................................................................................................
How to overcome?.............................................................................................................. .................................................................................................................................................... .................................................................................................................................................... 30. Could you please provide some suggestions for developing milk production?................... ................................................................................................................................................................................................................................................................................................................................................................................................................................................................................................................................................................................................................
Linkages with dairy men
31. Do you sign contract with dairy men? Yes No
If yes, g. Kind of contract: h. Time…………………………………….years i. Do you have any idea on the signing and carrying out the contract with dairy men? ……………………………………………………………………………………………..
…………………………………………………………………………………………….. . ……………………………………………………………………………………………..
Linkages with dairy plant (company)
32. Do you sign contract with dairy plant? Yes No
If yes, a. What dairy plant? b. Kind of contract: c. Time:……………….years d. Are the article of the contract clear?
Yes No
e. Do you have any idea on signing and implementing contract?………………… ……………………………………………………………………………………………..
…………………………………………………………………………………………….. . ……………………………………………………………………………………………..
33. Do you receive any support from the dairy plant on f. Loan
Yes No
If yes, Amount…………………..1000 VND; Interest rate:………………%. Time (term)………………………………………………………………………….………. g. Technique
Yes No
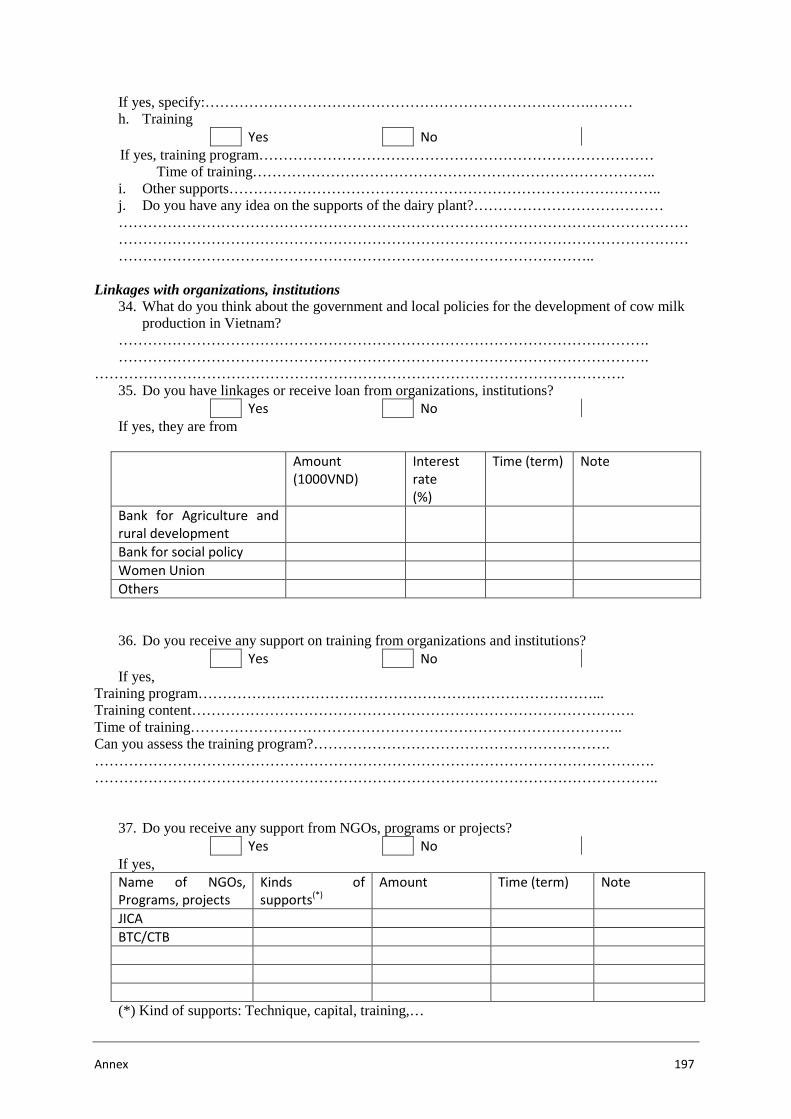
Annex 197
If yes, specify:…………………………………………………………………….……… h. Training
Yes No
If yes, training program……………………………………………………………………… Time of training………………………………………………………………………..
i. Other supports…………………………………………………………………………….. j. Do you have any idea on the supports of the dairy plant?………………………………… ……………………………………………………………………………………………………………………………………………………………………………………………………………………………………………………………………………………………………..
Linkages with organizations, institutions
34. What do you think about the government and local policies for the development of cow milk production in Vietnam?
………………………………………………………………………………………………. ……………………………………………………………………………………………….
………………………………………………………………………………………………. 35. Do you have linkages or receive loan from organizations, institutions?
Yes No
If yes, they are from Amount
(1000VND)
Interest
rate
(%)
Time (term) Note
Bank for Agriculture and
rural development
Bank for social policy
Women Union
Others
36. Do you receive any support on training from organizations and institutions? Yes No
If yes, Training program………………………………………………………………………... Training content………………………………………………………………………………. Time of training…………………………………………………………………………….. Can you assess the training program?……………………………………………………. ……………………………………………………………………………………………………. ……………………………………………………………………………………………………..
37. Do you receive any support from NGOs, programs or projects? Yes No
If yes, Name of NGOs,
Programs, projects
Kinds of
supports(*)
Amount Time (term) Note
JICA
BTC/CTB
(*) Kind of supports: Technique, capital, training,…
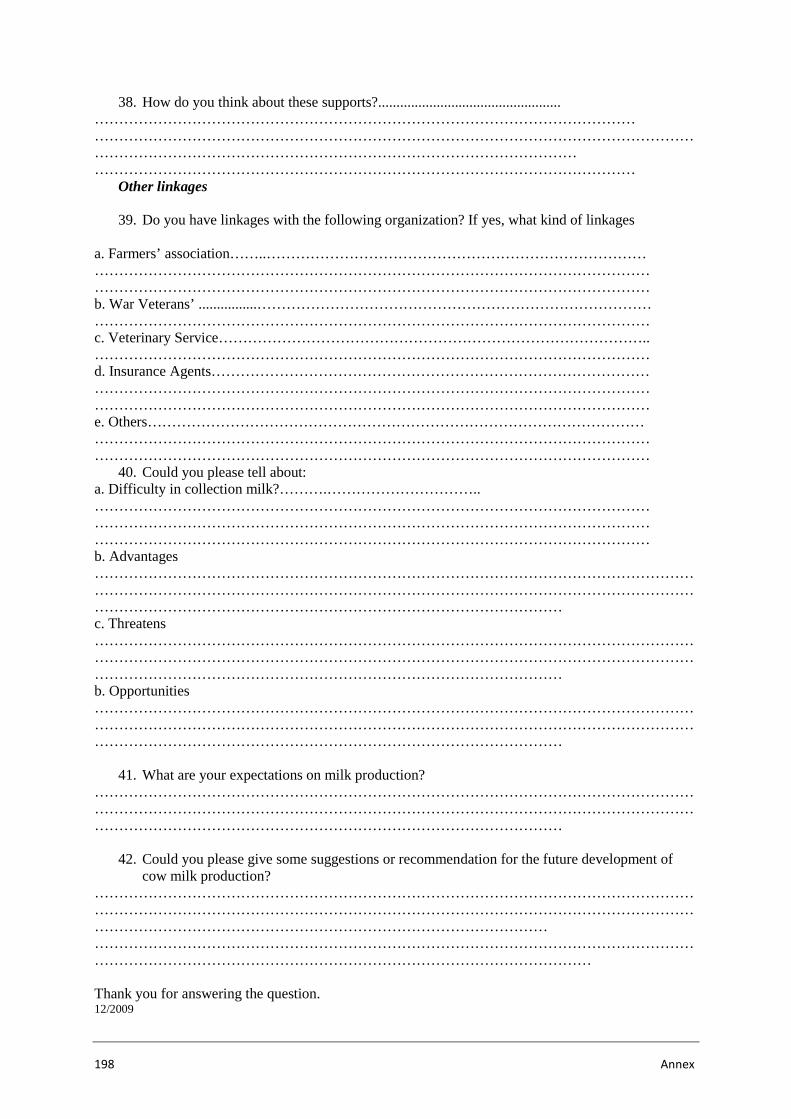
198 Annex
38. How do you think about these supports?.................................................. ………………………………………………………………………………………………… …………………………………………………………………………………………………………………………………………………………………………………………………… …………………………………………………………………………………………………
Other linkages 39. Do you have linkages with the following organization? If yes, what kind of linkages
a. Farmers’ association……..…………………………………………………………………… …………………………………………………………………………………………………… …………………………………………………………………………………………………… b. War Veterans’ ................……………………………………………………………………… …………………………………………………………………………………………………… c. Veterinary Service…………………………………………………………………………….. …………………………………………………………………………………………………… d. Insurance Agents……………………………………………………………………………… …………………………………………………………………………………………………… …………………………………………………………………………………………………… e. Others………………………………………………………………………………………… …………………………………………………………………………………………………… ……………………………………………………………………………………………………
40. Could you please tell about: a. Difficulty in collection milk?……….………………………….. …………………………………………………………………………………………………… …………………………………………………………………………………………………… …………………………………………………………………………………………………… b. Advantages ……………………………………………………………………………………………………………………………………………………………………………………………………………………………………………………………………………………………………………… c. Threatens ……………………………………………………………………………………………………………………………………………………………………………………………………………………………………………………………………………………………………………… b. Opportunities ………………………………………………………………………………………………………………………………………………………………………………………………………………………………………………………………………………………………………………
41. What are your expectations on milk production? ………………………………………………………………………………………………………………………………………………………………………………………………………………………………………………………………………………………………………………
42. Could you please give some suggestions or recommendation for the future development of
cow milk production? …………………………………………………………………………………………………………………………………………………………………………………………………………………………………………………………………………………………………………… ……………………………………………………………………………………………………………………………………………………………………………………………………… Thank you for answering the question. 12/2009
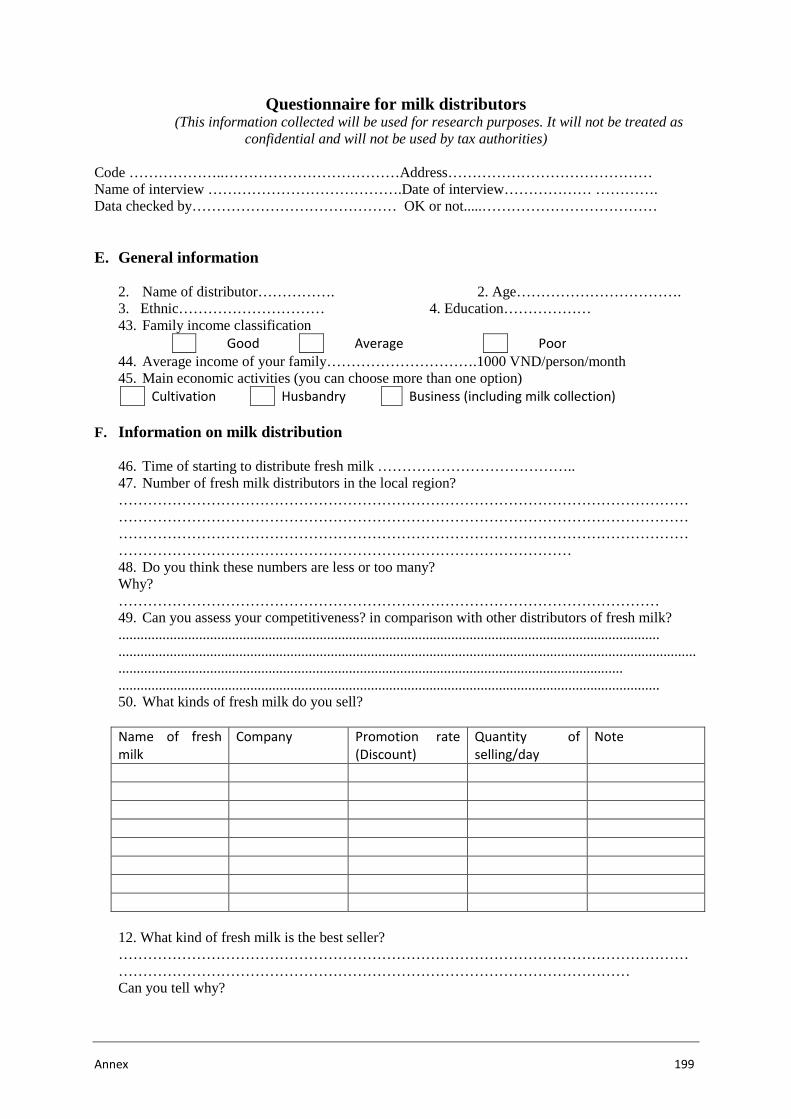
Annex 199
Questionnaire for milk distributors (This information collected will be used for research purposes. It will not be treated as
confidential and will not be used by tax authorities) Code ………………..………………………………Address…………………………………… Name of interview ………………………………….Date of interview……………… …………. Data checked by…………………………………… OK or not.....……………………………… E. General information
2. Name of distributor……………. 2. Age……………………………. 3. Ethnic………………………… 4. Education……………… 43. Family income classification
Good Average Poor
44. Average income of your family………………………….1000 VND/person/month 45. Main economic activities (you can choose more than one option)
Cultivation Husbandry Business (including milk collection)
F. Information on milk distribution
46. Time of starting to distribute fresh milk ………………………………….. 47. Number of fresh milk distributors in the local region? ………………………………………………………………………………………………………………………………………………………………………………………………………………………………………………………………………………………………………………………………………………………………………………………………………… 48. Do you think these numbers are less or too many? Why? ………………………………………………………………………………………………… 49. Can you assess your competitiveness? in comparison with other distributors of fresh milk? .................................................................................................................................................... ........................................................................................................................................................................................................................................................................................................ .................................................................................................................................................... 50. What kinds of fresh milk do you sell? Name of fresh
milk
Company Promotion rate
(Discount)
Quantity of
selling/day
Note
12. What kind of fresh milk is the best seller? …………………………………………………………………………………………………………………………………………………………………………………………………… Can you tell why?
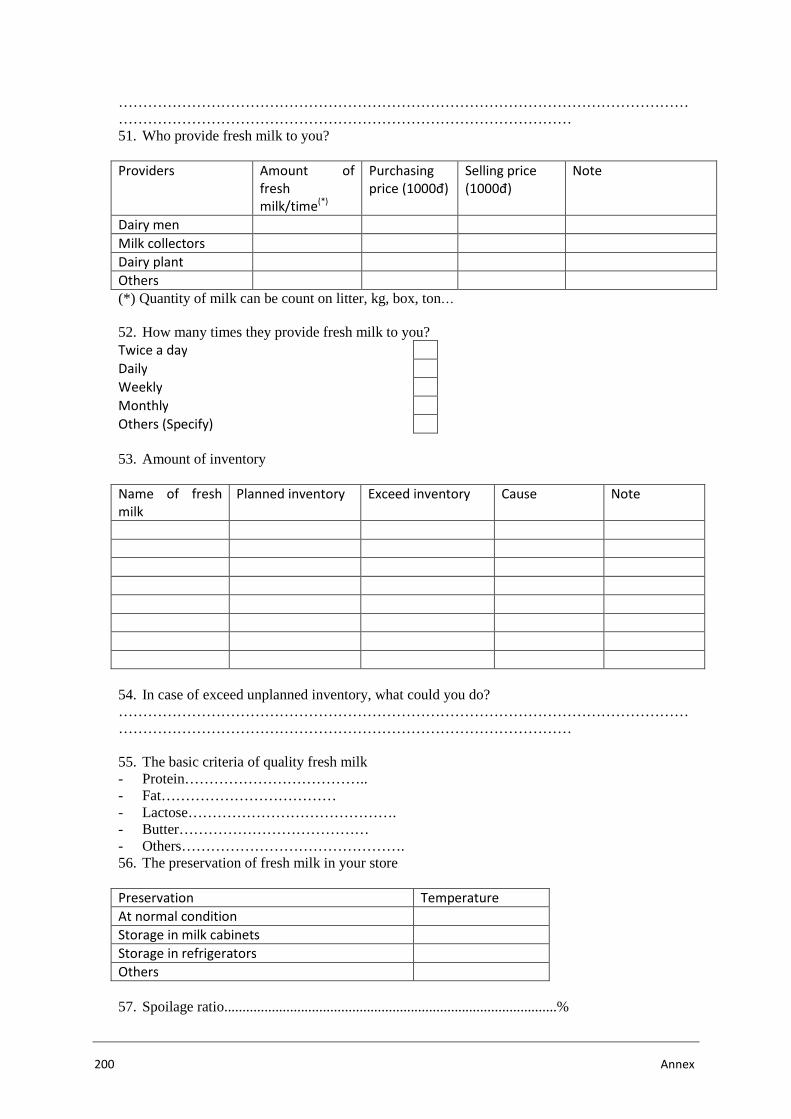
200 Annex
………………………………………………………………………………………………………………………………………………………………………………………… 51. Who provide fresh milk to you? Providers Amount of
fresh
milk/time(*)
Purchasing
price (1000đ)
Selling price
(1000đ)
Note
Dairy men
Milk collectors
Dairy plant
Others
(*) Quantity of milk can be count on litter, kg, box, ton… 52. How many times they provide fresh milk to you? Twice a day
Daily
Weekly
Monthly
Others (Specify)
53. Amount of inventory Name of fresh
milk
Planned inventory Exceed inventory Cause Note
54. In case of exceed unplanned inventory, what could you do? ………………………………………………………………………………………………………………………………………………………………………………………… 55. The basic criteria of quality fresh milk - Protein……………………………….. - Fat……………………………… - Lactose……………………………………. - Butter………………………………… - Others………………………………………. 56. The preservation of fresh milk in your store Preservation Temperature
At normal condition
Storage in milk cabinets
Storage in refrigerators
Others
57. Spoilage ratio...........................................................................................%
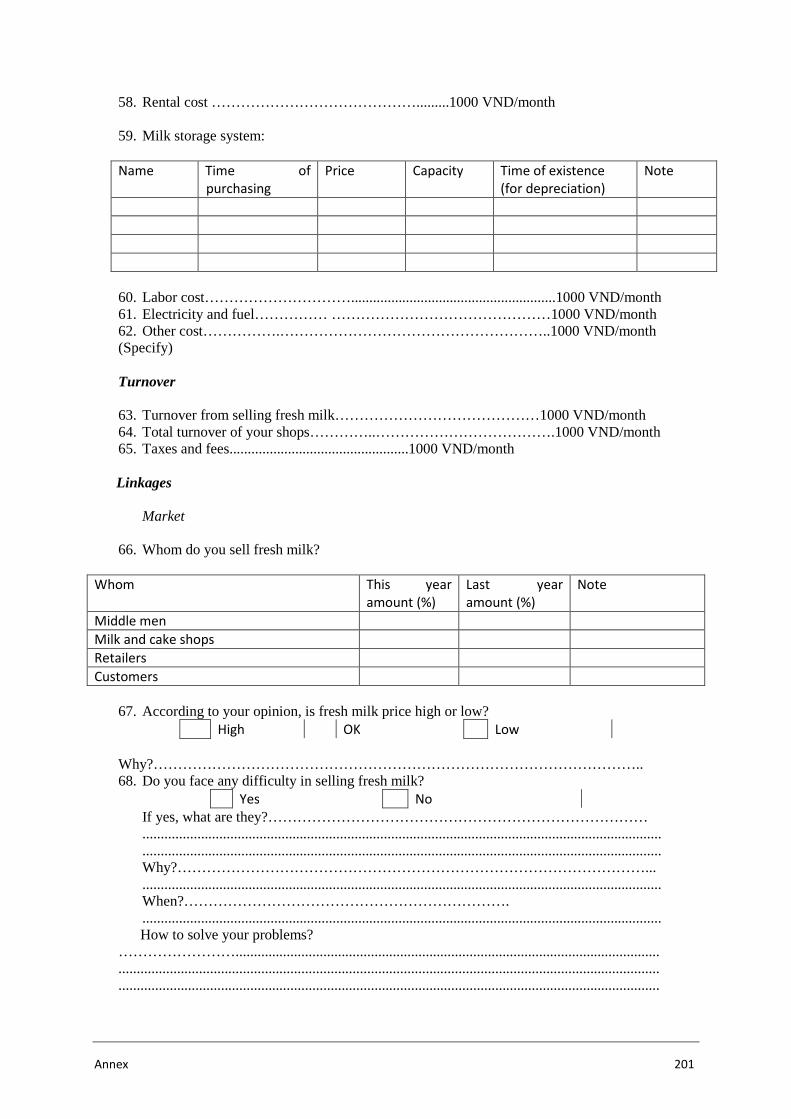
Annex 201
58. Rental cost …………………………………….........1000 VND/month
59. Milk storage system: Name Time of
purchasing
Price Capacity Time of existence
(for depreciation)
Note
60. Labor cost…………………………........................................................1000 VND/month 61. Electricity and fuel…………… ………………………………………1000 VND/month 62. Other cost…………….………………………………………………..1000 VND/month (Specify) Turnover 63. Turnover from selling fresh milk……………………………………1000 VND/month 64. Total turnover of your shops…………..……………………………….1000 VND/month 65. Taxes and fees.................................................1000 VND/month
Linkages Market
66. Whom do you sell fresh milk? Whom This year
amount (%)
Last year
amount (%)
Note
Middle men
Milk and cake shops
Retailers
Customers
67. According to your opinion, is fresh milk price high or low?
High OK Low
Why?……………………………………………………………………………………….. 68. Do you face any difficulty in selling fresh milk?
Yes No
If yes, what are they?…………………………………………………………………… .............................................................................................................................................. .............................................................................................................................................. Why?……………………………………………………………………………………... .............................................................................................................................................. When?…………………………………………………………. ..............................................................................................................................................
How to solve your problems? …………………….................................................................................................................... .................................................................................................................................................... ....................................................................................................................................................
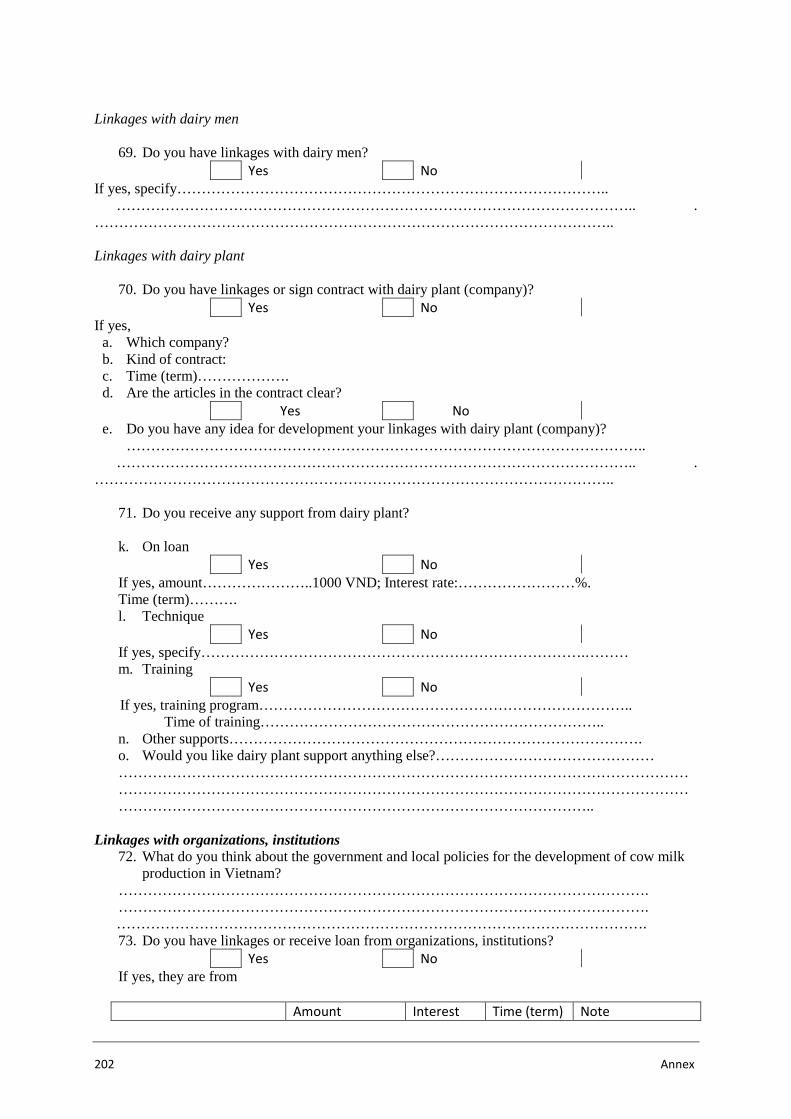
202 Annex
Linkages with dairy men
69. Do you have linkages with dairy men? Yes No
If yes, specify…………………………………………………………………………….. …………………………………………………………………………………………….. . ……………………………………………………………………………………………..
Linkages with dairy plant
70. Do you have linkages or sign contract with dairy plant (company)? Yes No
If yes, a. Which company? b. Kind of contract: c. Time (term)………………. d. Are the articles in the contract clear?
Yes No
e. Do you have any idea for development your linkages with dairy plant (company)? ……………………………………………………………………………………………..
…………………………………………………………………………………………….. . ……………………………………………………………………………………………..
71. Do you receive any support from dairy plant? k. On loan
Yes No
If yes, amount…………………..1000 VND; Interest rate:……………………%. Time (term)………. l. Technique
Yes No
If yes, specify…………………………………………………………………….……… m. Training
Yes No
If yes, training program………………………………………………………………….. Time of training……………………………………………………………..
n. Other supports…………………………………………………………………………. o. Would you like dairy plant support anything else?……………………………………… ……………………………………………………………………………………………………………………………………………………………………………………………………………………………………………………………………………………………………..
Linkages with organizations, institutions
72. What do you think about the government and local policies for the development of cow milk production in Vietnam?
………………………………………………………………………………………………. ……………………………………………………………………………………………….
………………………………………………………………………………………………. 73. Do you have linkages or receive loan from organizations, institutions?
Yes No
If yes, they are from Amount Interest Time (term) Note
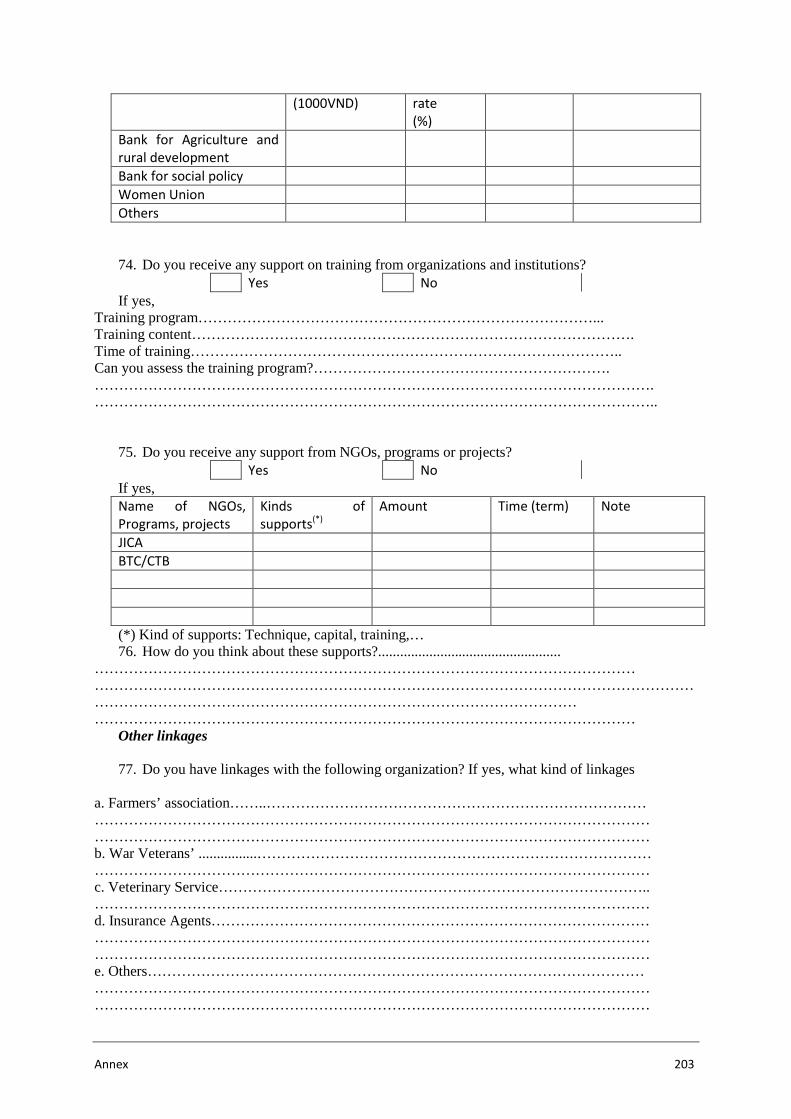
Annex 203
(1000VND) rate
(%)
Bank for Agriculture and
rural development
Bank for social policy
Women Union
Others
74. Do you receive any support on training from organizations and institutions? Yes No
If yes, Training program………………………………………………………………………... Training content………………………………………………………………………………. Time of training…………………………………………………………………………….. Can you assess the training program?……………………………………………………. ……………………………………………………………………………………………………. ……………………………………………………………………………………………………..
75. Do you receive any support from NGOs, programs or projects? Yes No
If yes, Name of NGOs,
Programs, projects
Kinds of
supports(*)
Amount Time (term) Note
JICA
BTC/CTB
(*) Kind of supports: Technique, capital, training,… 76. How do you think about these supports?..................................................
………………………………………………………………………………………………… …………………………………………………………………………………………………………………………………………………………………………………………………… …………………………………………………………………………………………………
Other linkages 77. Do you have linkages with the following organization? If yes, what kind of linkages
a. Farmers’ association……..…………………………………………………………………… …………………………………………………………………………………………………… …………………………………………………………………………………………………… b. War Veterans’ ................……………………………………………………………………… …………………………………………………………………………………………………… c. Veterinary Service…………………………………………………………………………….. …………………………………………………………………………………………………… d. Insurance Agents……………………………………………………………………………… …………………………………………………………………………………………………… …………………………………………………………………………………………………… e. Others………………………………………………………………………………………… …………………………………………………………………………………………………… ……………………………………………………………………………………………………
204 Annex
78. Could you please tell about: a. Difficulty in collection milk?……….………………………….. …………………………………………………………………………………………………… …………………………………………………………………………………………………… …………………………………………………………………………………………………… b. Advantages ……………………………………………………………………………………………………………………………………………………………………………………………………………………………………………………………………………………………………………… c. Threatens ……………………………………………………………………………………………………………………………………………………………………………………………………………………………………………………………………………………………………………… b. Opportunities ………………………………………………………………………………………………………………………………………………………………………………………………………………………………………………………………………………………………………………
79. What are your expectations on milk production? ………………………………………………………………………………………………………………………………………………………………………………………………………………………………………………………………………………………………………………
80. Could you please give some suggestions or recommendation for the future development of
cow milk production? …………………………………………………………………………………………………………………………………………………………………………………………………………………………………………………………………………………………………………… ……………………………………………………………………………………………………………… Thank you for answering the question. 12/2009