COST ESTIMATION AND DESIGN RITERIA - JICAopen_jicareport.jica.go.jp/pdf/11580578_01.pdfTruck Mounted...
33
Republic of the Philippines DOTC*MMDA*DPWH*NEDA*PNP-NCR*HUDCC*UP-NCTS*EMB Japan International Cooperation Agency (JICA) METRO MANILA URBAN TRANSPORTATION INTEGRATION STUDY TECHNICAL REPORT NO. 11 C COST E ESTIMATION AND D DESIGN C CRITERIA March 1999 MMUTIS STUDY TEAM m m m m u u t t i i s s No. SSF JR 99-036 (14/16) .
Transcript of COST ESTIMATION AND DESIGN RITERIA - JICAopen_jicareport.jica.go.jp/pdf/11580578_01.pdfTruck Mounted...
Republic of the Philippines DOTC*MMDA*DPWH*NEDA*PNP-NCR*HUDCC*UP-NCTS*EMB Japan International Cooperation Agency (JICA)
MMEETTRROO MMAANNIILLAA
UURRBBAANN TTRRAANNSSPPOORRTTAATTIIOONN
IINNTTEEGGRRAATTIIOONN SSTTUUDDYY TTEECCHHNNIICCAALL RREEPPOORRTT NNOO.. 1111
CCOOSSTT EESSTTIIMMAATTIIOONN AANNDD DDEESSIIGGNN CCRRIITTEERRIIAA
MMaarrcchh 11999999
MMMMUUTTIISS SSTTUUDDYY TTEEAAMM mmmm
uu ttii ss
No.
SSF
JR
99-036 (14/16)
.
METRO MANILA URBAN TRANSPORTATION INTEGRATION STUDY
TECHNICAL REPORT NO. 11: COST ESTIMATION AND DESIGN CRITERIA
TABLE OF CONTENTS
Page No.
1. INTRODUCTION.........................................................................................................1-1
1.1 Direct Cost Component........................................................................................1-1
1.1.1 Labor Cost ................................................................................................1-11.1.2 Material Cost ............................................................................................1-11.1.3 Equipment Cost ........................................................................................1-2
1.2 Indirect Cost .........................................................................................................1-41.3 Currency Component ...........................................................................................1-41.4 Land Acquisition Costs ........................................................................................1-61.5 Construction Cost Estimates ................................................................................1-6
2. COST ANALYSIS ........................................................................................................2-1
3. TYPHICAL CROSS SECTION....................................................................................3-1
STRUCTURAL DESIGN CODES AND STANDARD............................................. 3-11
3.1 General ............................................................................................................... 3-113.2 Loading Specifications....................................................................................... 3-11
3.2.1 Dead Loads............................................................................................. 3-113.2.2 Standard Truck and Lane Loads.............................................................3-123.2.3 Impact Load............................................................................................3-133.2.4 Longitudinal Forces................................................................................3-133.2.5 Centrifugal Forces ..................................................................................3-133.2.6 Wind Load..............................................................................................3-133.2.7 Collision Load ........................................................................................3-143.2.8 Train Load ..............................................................................................3-143.2.9 Seismic Load .......................................................................................... 3.14
3.3 Material ..............................................................................................................3-163.4 Quantity Calculation ..........................................................................................3-17
3.4.1 ALT-1 PC Box Girder + Single Concrete Pier.......................................3-173.4.2 ALT-2 PC Box Girder + Single Rigid Portal Frame Pier.......................3-193.4.3 ALT-3 EDSA Interchange Flyover ........................................................3-203.4.4 Railway Viaduct Simply Support Concrete Box Girder ........................3-203.4.5 Standard Span Bridge L=30m................................................................3-223.4.6 Standard Span Bridge L=35+40+35 = 110m .........................................3-223.4.7 At Grade Section for Primary Arterial Expressway...............................3-24
METRO MANILA URBAN TRANSPORTATION INTEGRATION STUDY
TECHNICAL REPORT NO. 11: COST ESTIMATION AND DESIGN CRITERIA
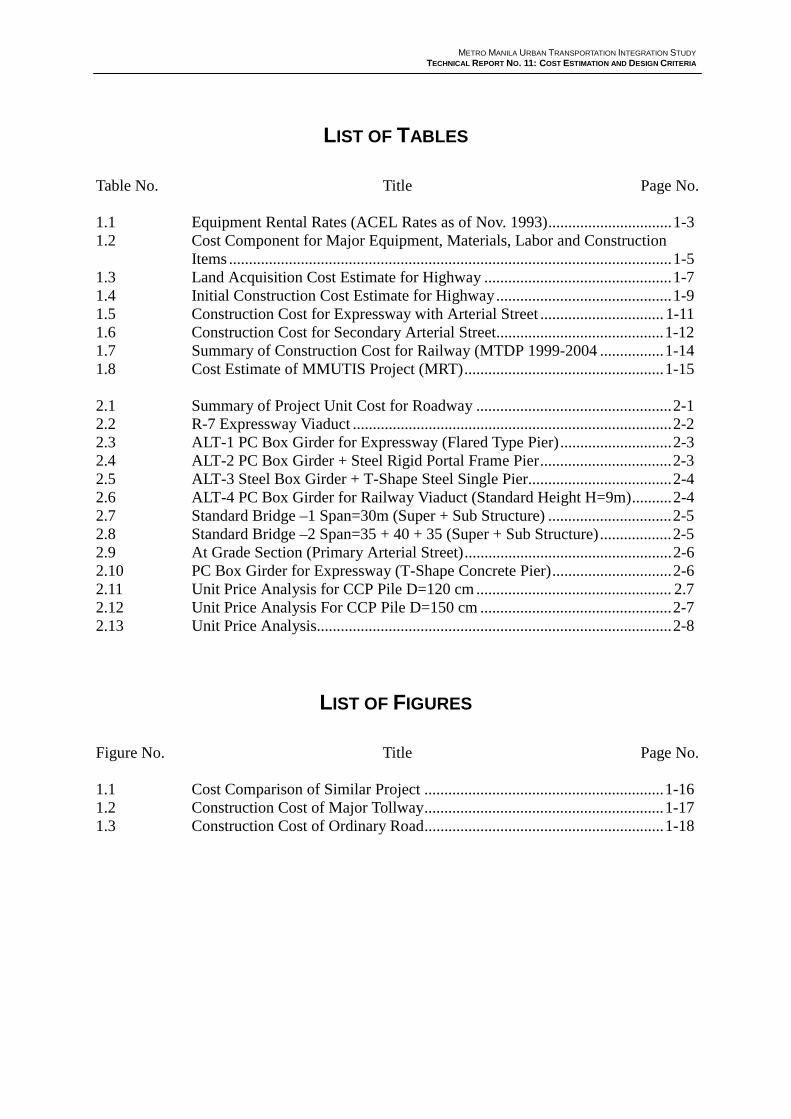
LIST OF TABLES
Table No. Title Page No.
1.1 Equipment Rental Rates (ACEL Rates as of Nov. 1993)...............................1-31.2 Cost Component for Major Equipment, Materials, Labor and Construction
Items ...............................................................................................................1-51.3 Land Acquisition Cost Estimate for Highway ...............................................1-71.4 Initial Construction Cost Estimate for Highway............................................1-91.5 Construction Cost for Expressway with Arterial Street ............................... 1-111.6 Construction Cost for Secondary Arterial Street..........................................1-121.7 Summary of Construction Cost for Railway (MTDP 1999-2004 ................1-141.8 Cost Estimate of MMUTIS Project (MRT)..................................................1-15
2.1 Summary of Project Unit Cost for Roadway .................................................2-12.2 R-7 Expressway Viaduct ................................................................................2-22.3 ALT-1 PC Box Girder for Expressway (Flared Type Pier)............................2-32.4 ALT-2 PC Box Girder + Steel Rigid Portal Frame Pier.................................2-32.5 ALT-3 Steel Box Girder + T-Shape Steel Single Pier....................................2-42.6 ALT-4 PC Box Girder for Railway Viaduct (Standard Height H=9m)..........2-42.7 Standard Bridge –1 Span=30m (Super + Sub Structure) ...............................2-52.8 Standard Bridge –2 Span=35 + 40 + 35 (Super + Sub Structure)..................2-52.9 At Grade Section (Primary Arterial Street)....................................................2-62.10 PC Box Girder for Expressway (T-Shape Concrete Pier)..............................2-62.11 Unit Price Analysis for CCP Pile D=120 cm ................................................. 2.72.12 Unit Price Analysis For CCP Pile D=150 cm ................................................2-72.13 Unit Price Analysis.........................................................................................2-8
LIST OF FIGURES
Figure No. Title Page No.
1.1 Cost Comparison of Similar Project ............................................................1-161.2 Construction Cost of Major Tollway............................................................1-171.3 Construction Cost of Ordinary Road............................................................1-18
METRO MANILA URBAN TRANSPORTATION INTEGRATION STUDY
TECHNICAL REPORT NO. 11 COST ESTIMATION AND DESIGN CRITERIA
1-1
1. INTRODUCTION
An investigation and analysis of equipment, materials and labor prices are pre-requisite for estimation of unit costs of major civil works. The construction costs ofsimilar projects in the Philippines and Southeast Asia also are investigated.
1.1 Direct Cost Component
The direct construction costs basically consists of the followings
a) Labor Costsb) Material Costsc) Equipment Costs
Data collected in the preliminary investigation are as follows
1.1.1 Labor cost
The prescribed minimum wage in the National Capital Region is P 198 perday effective from February 1998 .
Department of Labor and Employment and labor indexes for other categoriesare in compliance with the indexes of Department of Public Works andHighways as of December 1993.
Labor Index Wage daily(Pesos)
a) Foreman 2.14 423b) Assistant Foreman 1.98 392c) Heavy Equipment Operator 1.90 376d) Light Equipment Operator 1.65 327e) Driver 1.45 287f) Skilled Labor 1.74 344g) Unskilled Labor 1.00 198
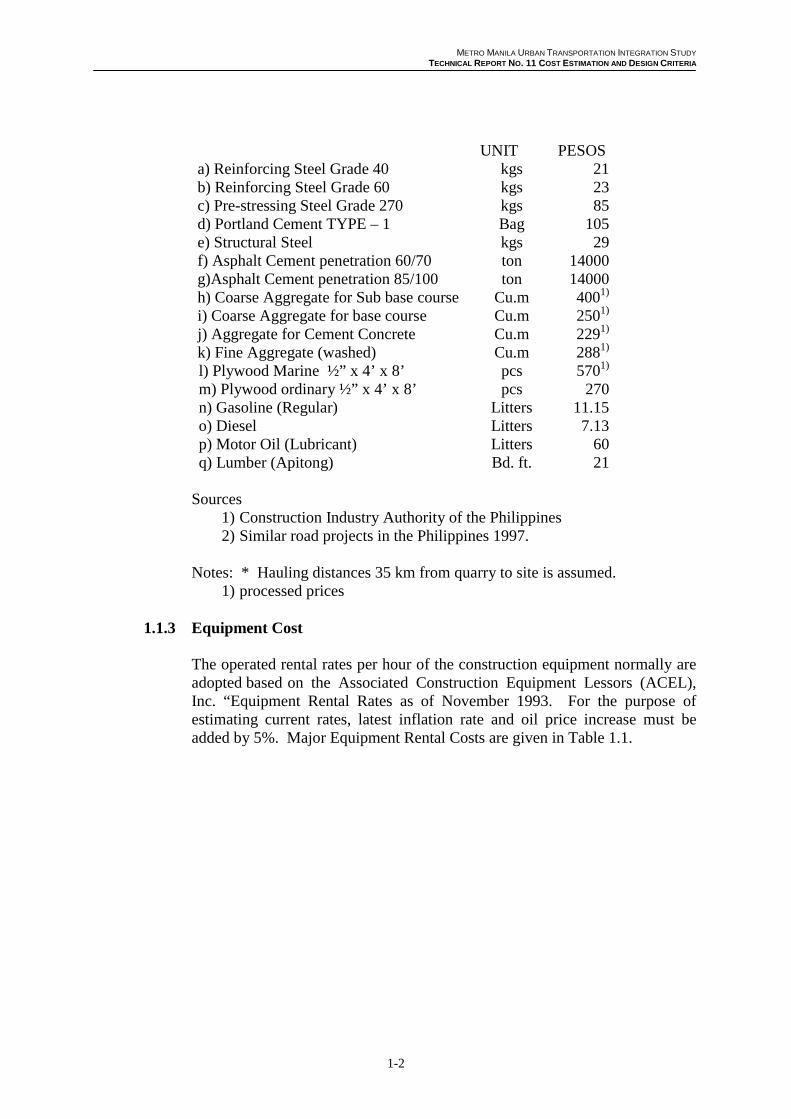
1.1.2 Material Cost
The current market prices of construction materials are collected by Canvass,Market price survey and similar projects. Materials applied to the project aredivided into commercial materials and processed materials by contractors.The result of investigation for major materials are listed as follows.
METRO MANILA URBAN TRANSPORTATION INTEGRATION STUDY
TECHNICAL REPORT NO. 11 COST ESTIMATION AND DESIGN CRITERIA
1-2
UNIT PESOSa) Reinforcing Steel Grade 40 kgs 21b) Reinforcing Steel Grade 60 kgs 23c) Pre-stressing Steel Grade 270 kgs 85d) Portland Cement TYPE – 1 Bag 105e) Structural Steel kgs 29f) Asphalt Cement penetration 60/70 ton 14000g)Asphalt Cement penetration 85/100 ton 14000h) Coarse Aggregate for Sub base course Cu.m 4001)
i) Coarse Aggregate for base course Cu.m 2501)
j) Aggregate for Cement Concrete Cu.m 2291)
k) Fine Aggregate (washed) Cu.m 2881)
l) Plywood Marine ½” x 4’ x 8’ pcs 5701)
m) Plywood ordinary ½” x 4’ x 8’ pcs 270n) Gasoline (Regular) Litters 11.15o) Diesel Litters 7.13p) Motor Oil (Lubricant) Litters 60q) Lumber (Apitong) Bd. ft. 21
Sources1) Construction Industry Authority of the Philippines2) Similar road projects in the Philippines 1997.
Notes: * Hauling distances 35 km from quarry to site is assumed.1) processed prices
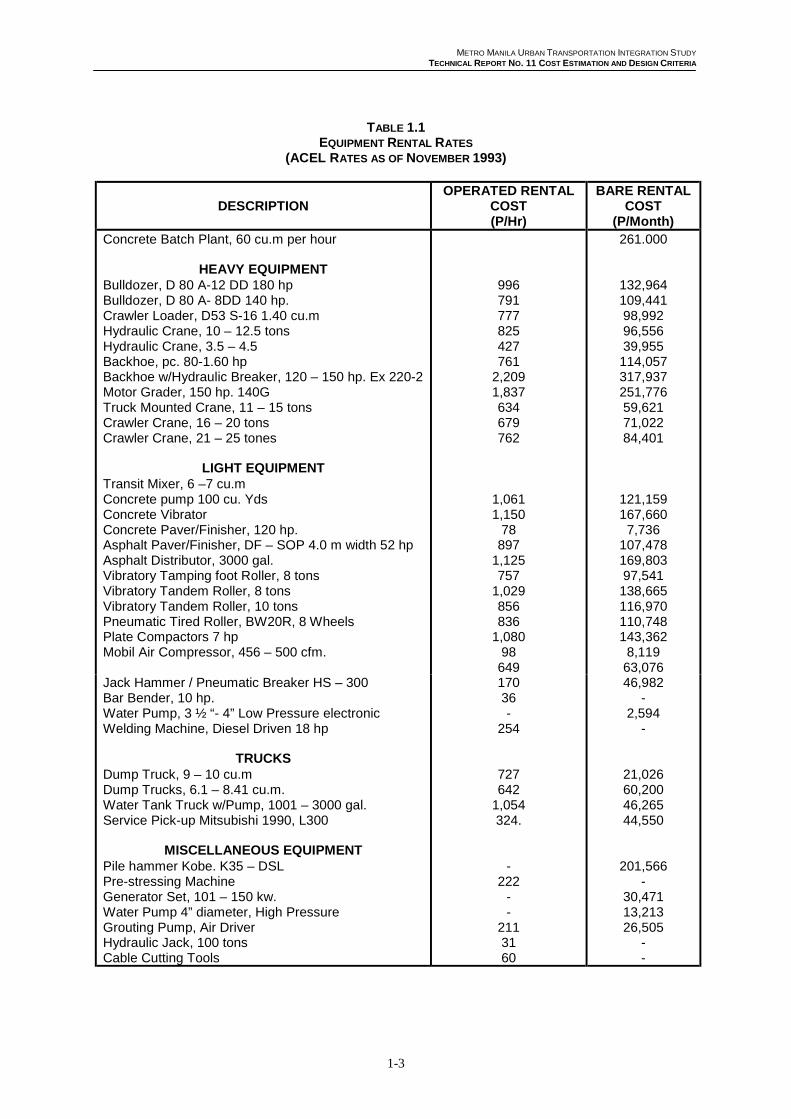
1.1.3 Equipment Cost
The operated rental rates per hour of the construction equipment normally areadopted based on the Associated Construction Equipment Lessors (ACEL),Inc. “Equipment Rental Rates as of November 1993. For the purpose ofestimating current rates, latest inflation rate and oil price increase must beadded by 5%. Major Equipment Rental Costs are given in Table 1.1.
METRO MANILA URBAN TRANSPORTATION INTEGRATION STUDY
TECHNICAL REPORT NO. 11 COST ESTIMATION AND DESIGN CRITERIA
1-3
TABLE 1.1EQUIPMENT RENTAL RATES
(ACEL RATES AS OF NOVEMBER 1993)
DESCRIPTIONOPERATED RENTAL
COST(P/Hr)
BARE RENTALCOST
(P/Month)Concrete Batch Plant, 60 cu.m per hour
HEAVY EQUIPMENTBulldozer, D 80 A-12 DD 180 hpBulldozer, D 80 A- 8DD 140 hp.Crawler Loader, D53 S-16 1.40 cu.mHydraulic Crane, 10 – 12.5 tonsHydraulic Crane, 3.5 – 4.5Backhoe, pc. 80-1.60 hpBackhoe w/Hydraulic Breaker, 120 – 150 hp. Ex 220-2Motor Grader, 150 hp. 140GTruck Mounted Crane, 11 – 15 tonsCrawler Crane, 16 – 20 tonsCrawler Crane, 21 – 25 tones
LIGHT EQUIPMENTTransit Mixer, 6 –7 cu.mConcrete pump 100 cu. YdsConcrete VibratorConcrete Paver/Finisher, 120 hp.Asphalt Paver/Finisher, DF – SOP 4.0 m width 52 hpAsphalt Distributor, 3000 gal.Vibratory Tamping foot Roller, 8 tonsVibratory Tandem Roller, 8 tonsVibratory Tandem Roller, 10 tonsPneumatic Tired Roller, BW20R, 8 WheelsPlate Compactors 7 hpMobil Air Compressor, 456 – 500 cfm.
996791777825427761
2,2091,837634679762
1,0611,150
78897
1,125757
1,029856836
1,08098649
261.000
132,964109,44198,99296,55639,955114,057317,937251,77659,62171,02284,401
121,159167,6607,736
107,478169,80397,541138,665116,970110,748143,3628,11963,076
Jack Hammer / Pneumatic Breaker HS – 300Bar Bender, 10 hp.Water Pump, 3 ½ “- 4” Low Pressure electronicWelding Machine, Diesel Driven 18 hp
TRUCKSDump Truck, 9 – 10 cu.mDump Trucks, 6.1 – 8.41 cu.m.Water Tank Truck w/Pump, 1001 – 3000 gal.Service Pick-up Mitsubishi 1990, L300
MISCELLANEOUS EQUIPMENTPile hammer Kobe. K35 – DSLPre-stressing MachineGenerator Set, 101 – 150 kw.Water Pump 4” diameter, High PressureGrouting Pump, Air DriverHydraulic Jack, 100 tonsCable Cutting Tools
17036-
254
727642
1,054324.
-222
--
2113160
46,982-
2,594-
21,02660,20046,26544,550
201,566-
30,47113,21326,505
--
METRO MANILA URBAN TRANSPORTATION INTEGRATION STUDY
TECHNICAL REPORT NO. 11 COST ESTIMATION AND DESIGN CRITERIA
1-4
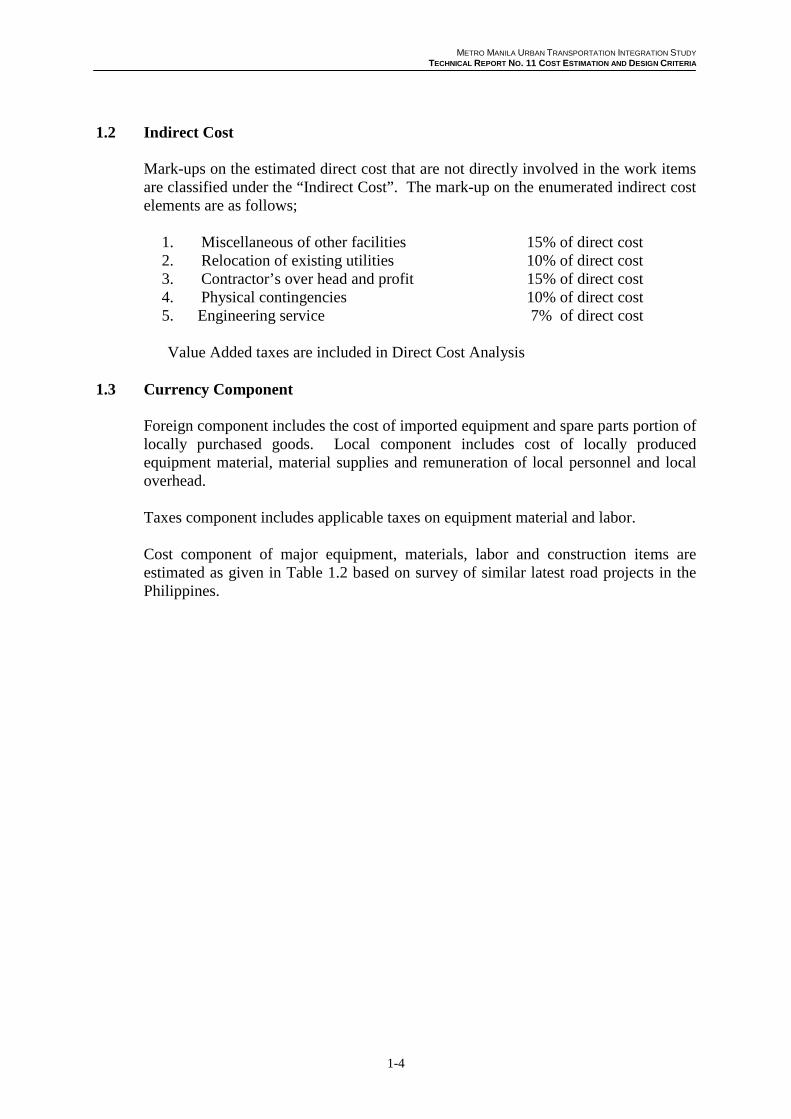
1.2 Indirect Cost
Mark-ups on the estimated direct cost that are not directly involved in the work itemsare classified under the “Indirect Cost”. The mark-up on the enumerated indirect costelements are as follows;
1. Miscellaneous of other facilities 15% of direct cost2. Relocation of existing utilities 10% of direct cost3. Contractor’s over head and profit 15% of direct cost4. Physical contingencies 10% of direct cost5. Engineering service 7% of direct cost
Value Added taxes are included in Direct Cost Analysis
1.3 Currency Component
Foreign component includes the cost of imported equipment and spare parts portion oflocally purchased goods. Local component includes cost of locally producedequipment material, material supplies and remuneration of local personnel and localoverhead.
Taxes component includes applicable taxes on equipment material and labor.
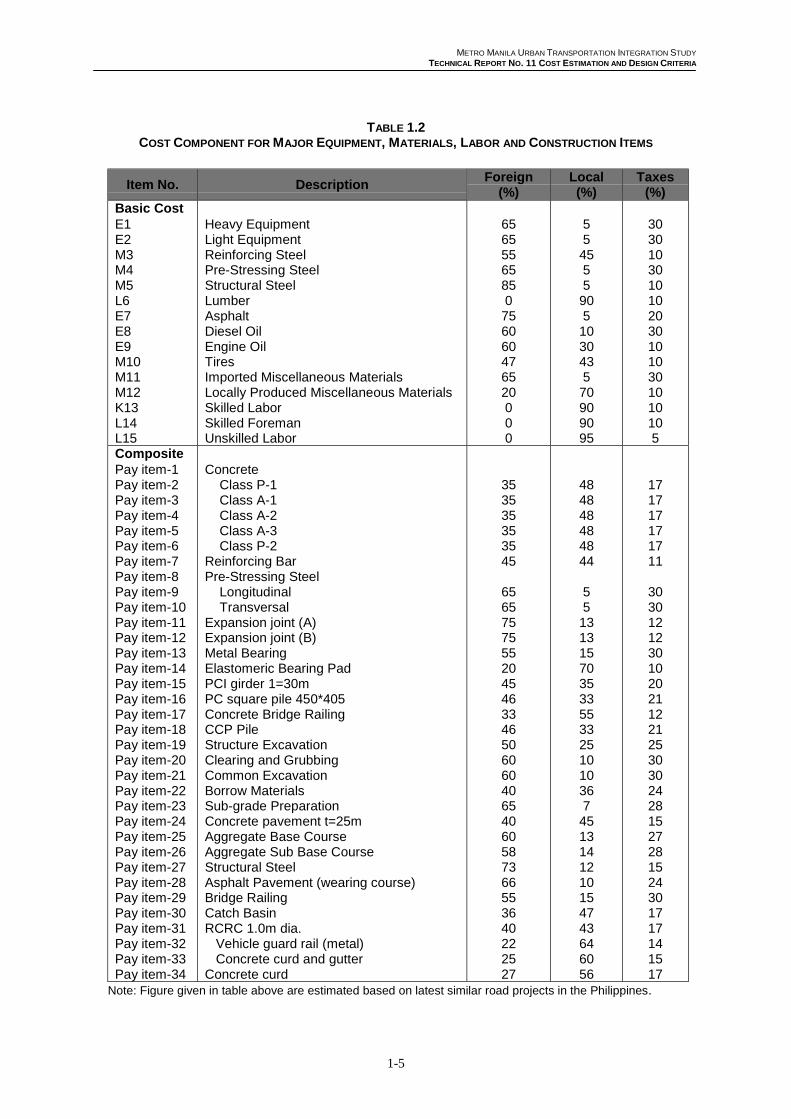
Cost component of major equipment, materials, labor and construction items areestimated as given in Table 1.2 based on survey of similar latest road projects in thePhilippines.
METRO MANILA URBAN TRANSPORTATION INTEGRATION STUDY
TECHNICAL REPORT NO. 11 COST ESTIMATION AND DESIGN CRITERIA
1-5
TABLE 1.2COST COMPONENT FOR MAJOR EQUIPMENT, MATERIALS, LABOR AND CONSTRUCTION ITEMS
Item No. DescriptionForeign
(%)Local(%)
Taxes(%)
Basic CostE1E2M3M4M5L6E7E8E9M10M11M12K13L14L15
Heavy EquipmentLight EquipmentReinforcing SteelPre-Stressing SteelStructural SteelLumberAsphaltDiesel OilEngine OilTiresImported Miscellaneous MaterialsLocally Produced Miscellaneous MaterialsSkilled LaborSkilled ForemanUnskilled Labor
65655565850756060476520000
554555905103043570909095
30301030101020301010301010105
CompositePay item-1Pay item-2Pay item-3Pay item-4Pay item-5Pay item-6Pay item-7Pay item-8Pay item-9Pay item-10Pay item-11Pay item-12Pay item-13Pay item-14Pay item-15Pay item-16Pay item-17Pay item-18Pay item-19Pay item-20Pay item-21Pay item-22Pay item-23Pay item-24Pay item-25Pay item-26Pay item-27Pay item-28Pay item-29Pay item-30Pay item-31Pay item-32Pay item-33Pay item-34
Concrete Class P-1 Class A-1 Class A-2 Class A-3 Class P-2Reinforcing BarPre-Stressing Steel Longitudinal TransversalExpansion joint (A)Expansion joint (B)Metal BearingElastomeric Bearing PadPCI girder 1=30mPC square pile 450*405Concrete Bridge RailingCCP PileStructure ExcavationClearing and GrubbingCommon ExcavationBorrow MaterialsSub-grade PreparationConcrete pavement t=25mAggregate Base CourseAggregate Sub Base CourseStructural SteelAsphalt Pavement (wearing course)Bridge RailingCatch BasinRCRC 1.0m dia. Vehicle guard rail (metal) Concrete curd and gutterConcrete curd
353535353545
6565757555204546334650606040654060587366553640222527
484848484844
5513131570353355332510103674513141210154743646056
171717171711
3030121230102021122125303024281527281524301717141517
Note: Figure given in table above are estimated based on latest similar road projects in the Philippines.
METRO MANILA URBAN TRANSPORTATION INTEGRATION STUDY
TECHNICAL REPORT NO. 11 COST ESTIMATION AND DESIGN CRITERIA
1-6
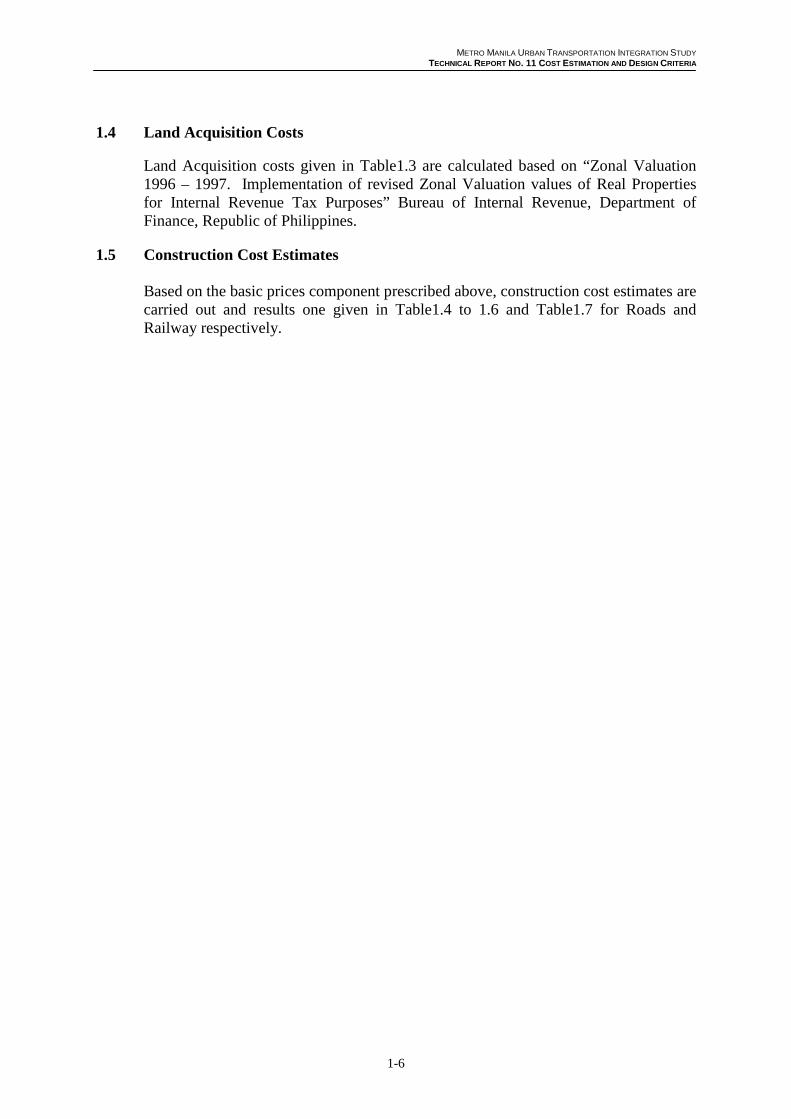
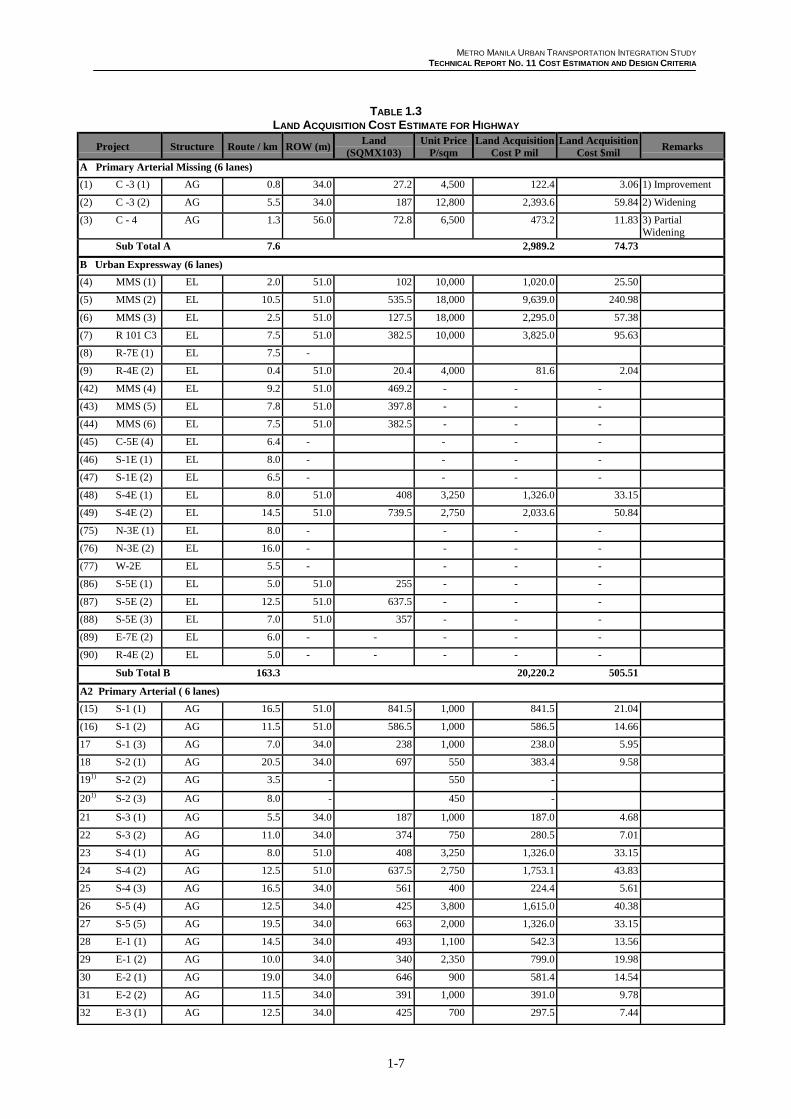
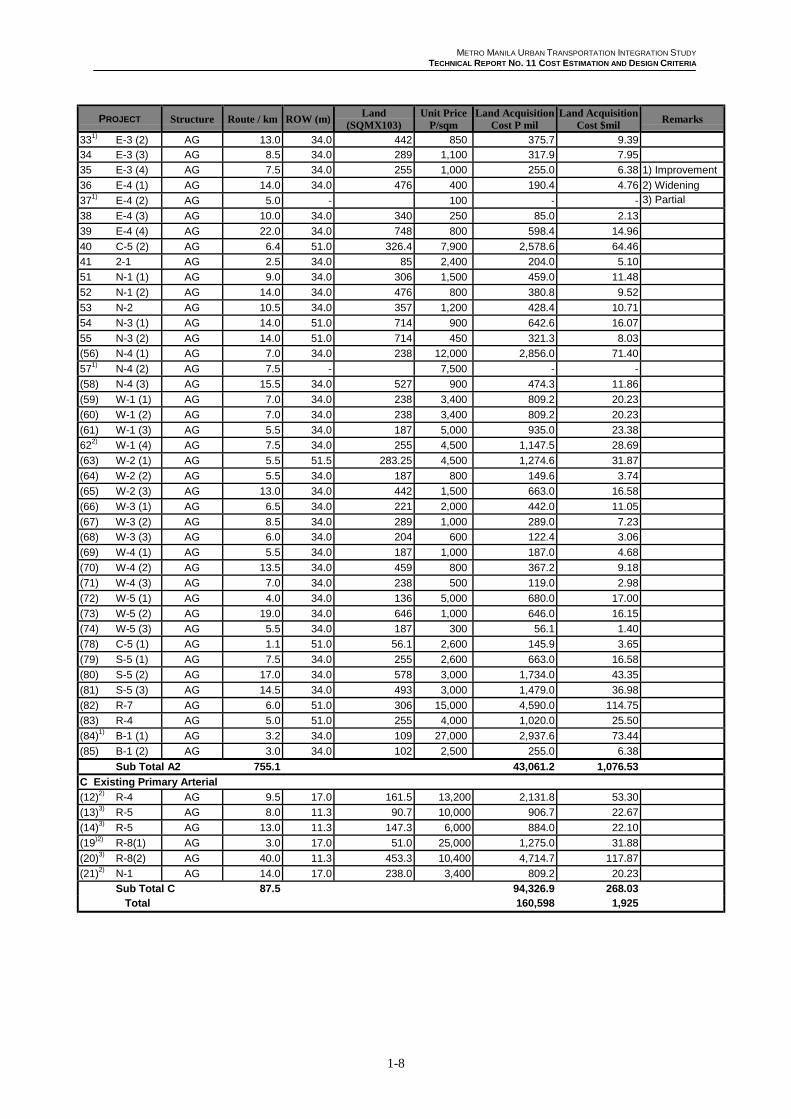
1.4 Land Acquisition Costs
Land Acquisition costs given in Table1.3 are calculated based on “Zonal Valuation1996 – 1997. Implementation of revised Zonal Valuation values of Real Propertiesfor Internal Revenue Tax Purposes” Bureau of Internal Revenue, Department ofFinance, Republic of Philippines.
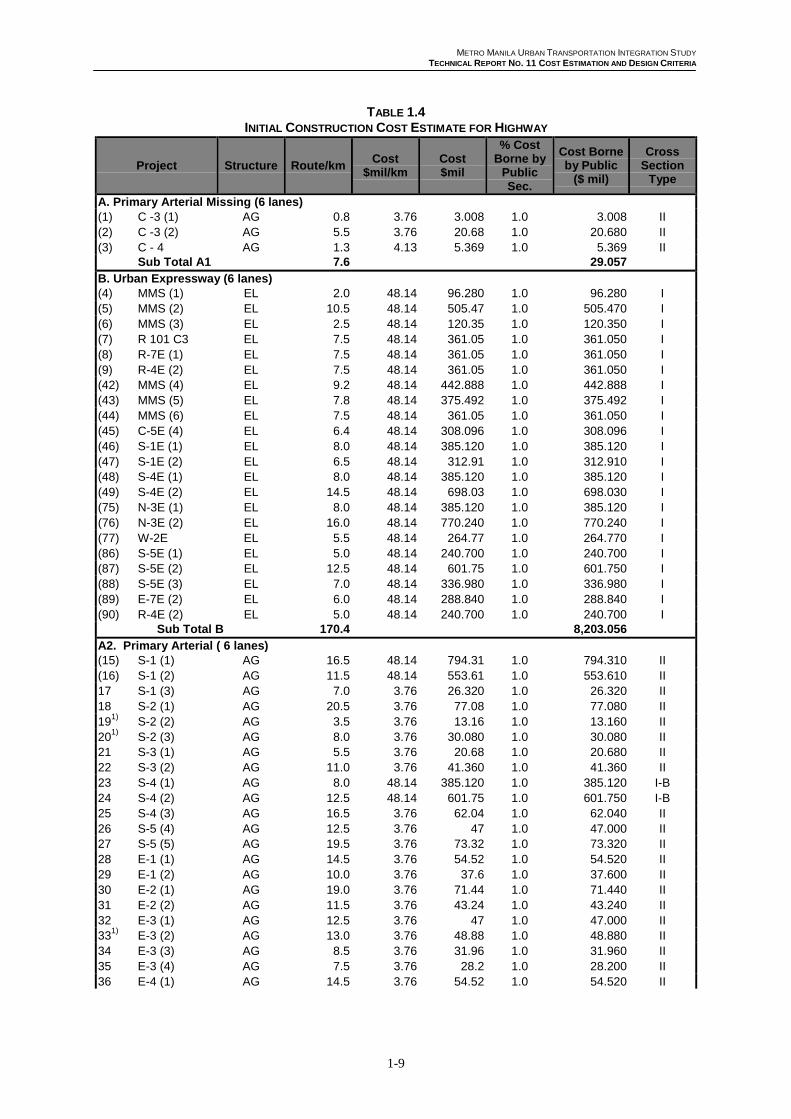
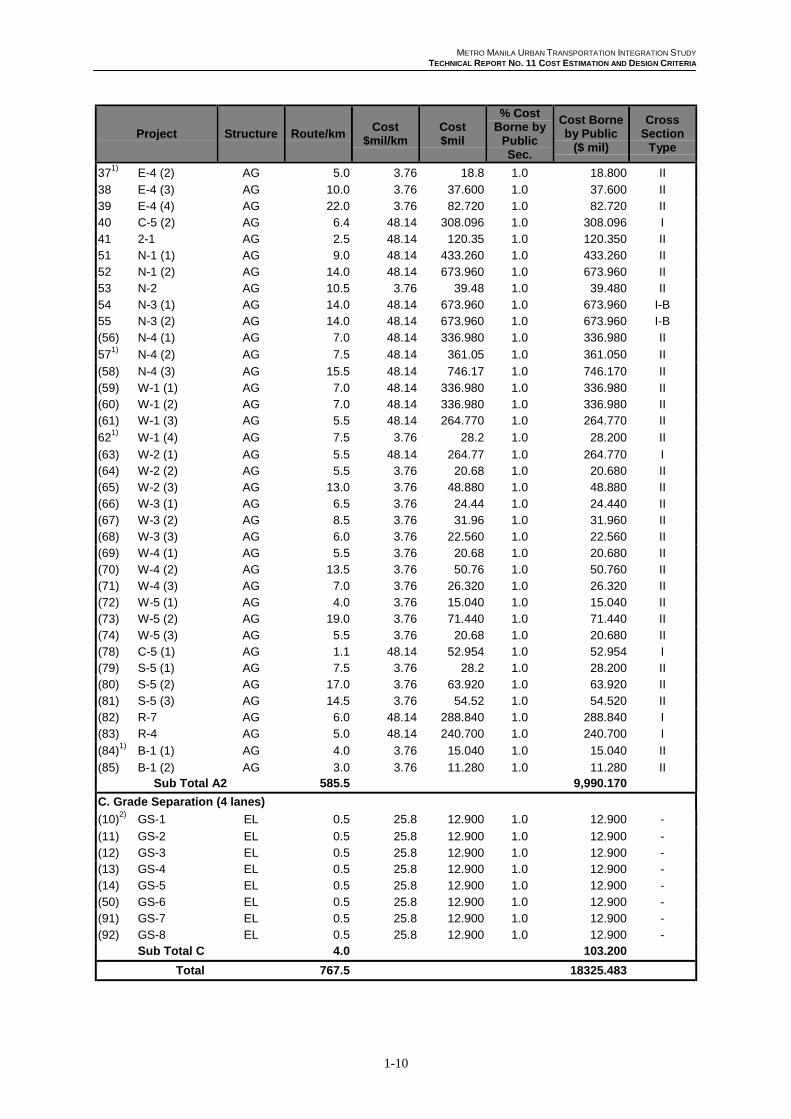
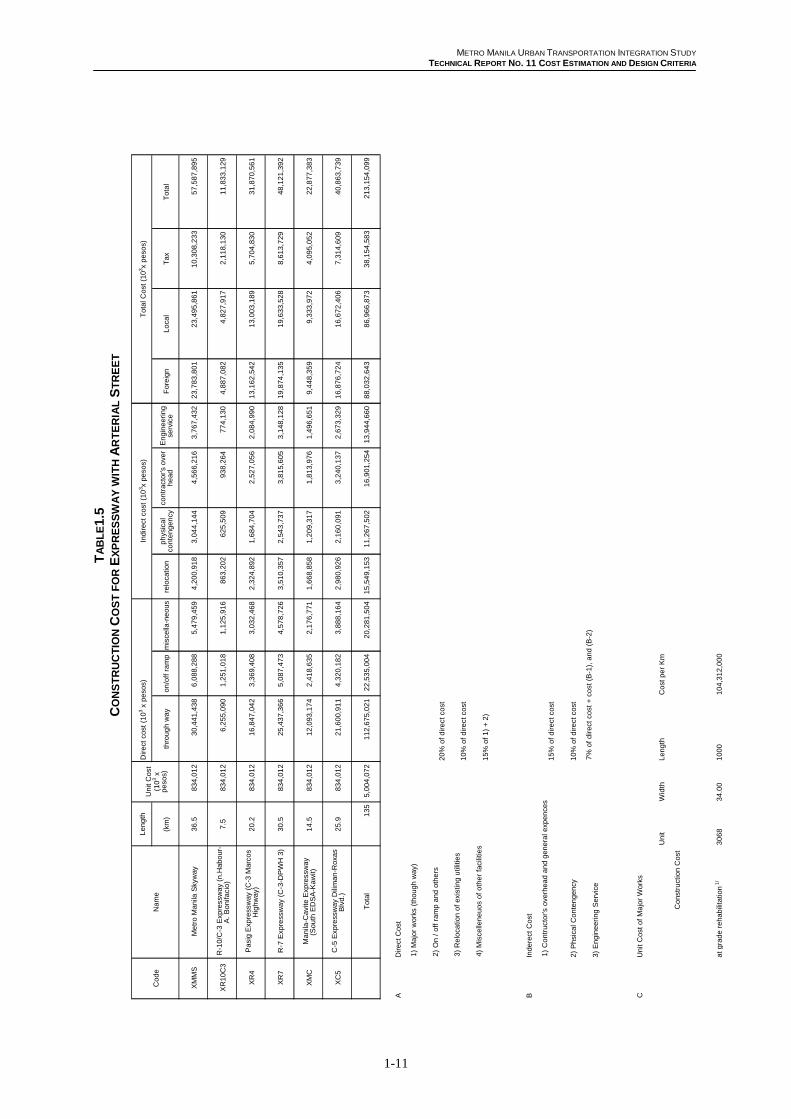
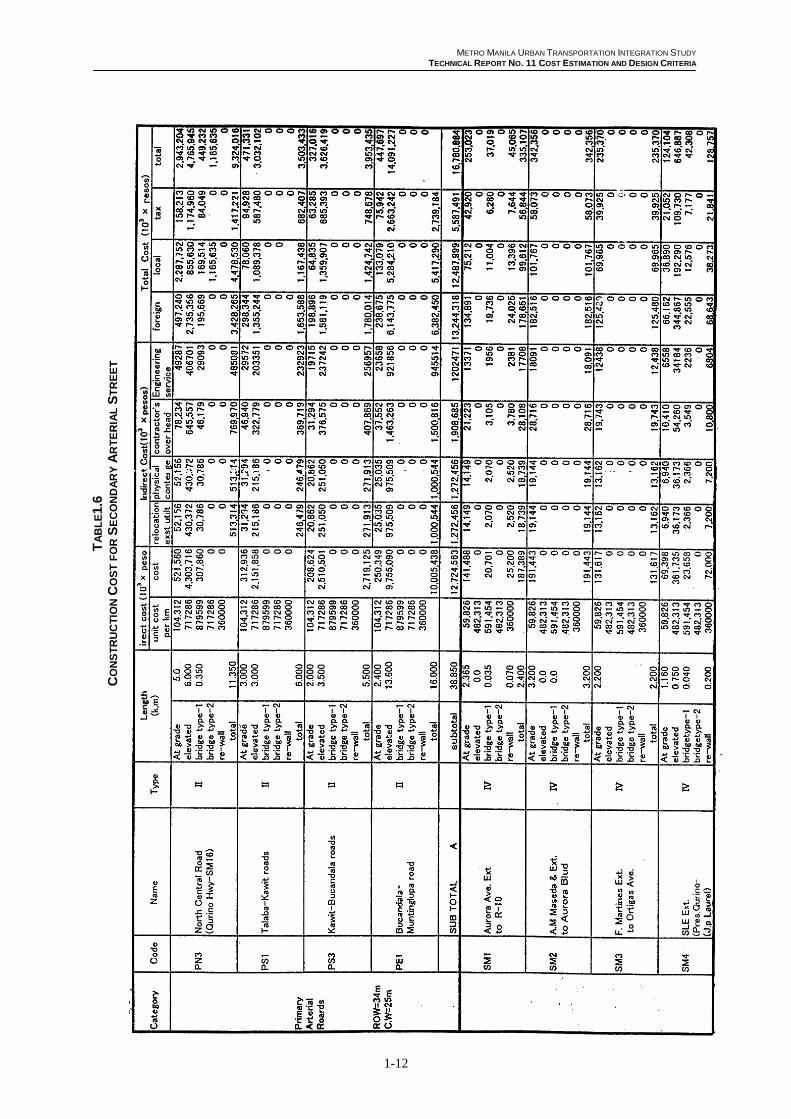
1.5 Construction Cost Estimates
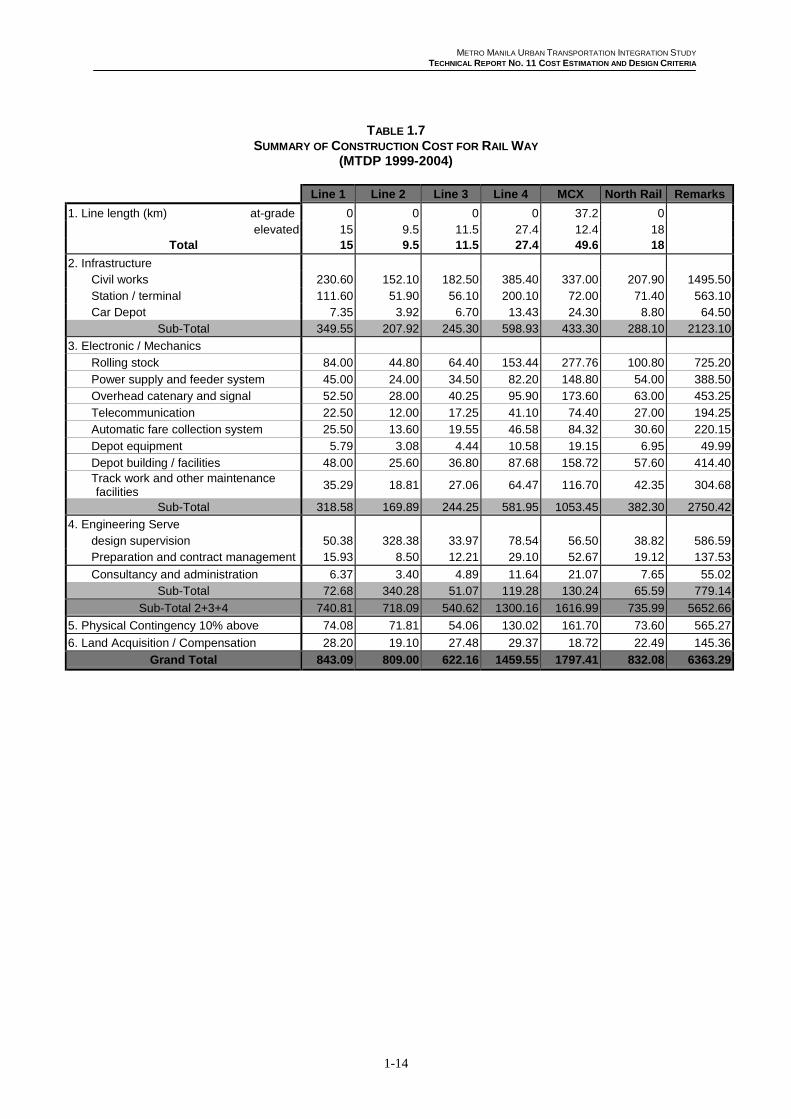
Based on the basic prices component prescribed above, construction cost estimates arecarried out and results one given in Table1.4 to 1.6 and Table1.7 for Roads andRailway respectively.
METRO MANILA URBAN TRANSPORTATION INTEGRATION STUDY
TECHNICAL REPORT NO. 11 COST ESTIMATION AND DESIGN CRITERIA
1-7
TABLE 1.3LAND ACQUISITION COST ESTIMATE FOR HIGHWAY
Project Structure Route / km ROW (m)Land
(SQMX103)Unit Price
P/sqmLand Acquisition
Cost P milLand Acquisition
Cost $milRemarks
A Primary Arterial Missing (6 lanes)
(1) C -3 (1) AG 0.8 34.0 27.2 4,500 122.4 3.06 1) Improvement
(2) C -3 (2) AG 5.5 34.0 187 12,800 2,393.6 59.84 2) Widening
(3) C - 4 AG 1.3 56.0 72.8 6,500 473.2 11.83 3) PartialWidening
Sub Total A 7.6 2,989.2 74.73
B Urban Expressway (6 lanes)
(4) MMS (1) EL 2.0 51.0 102 10,000 1,020.0 25.50
(5) MMS (2) EL 10.5 51.0 535.5 18,000 9,639.0 240.98
(6) MMS (3) EL 2.5 51.0 127.5 18,000 2,295.0 57.38
(7) R 101 C3 EL 7.5 51.0 382.5 10,000 3,825.0 95.63
(8) R-7E (1) EL 7.5 -
(9) R-4E (2) EL 0.4 51.0 20.4 4,000 81.6 2.04
(42) MMS (4) EL 9.2 51.0 469.2 - - -
(43) MMS (5) EL 7.8 51.0 397.8 - - -
(44) MMS (6) EL 7.5 51.0 382.5 - - -
(45) C-5E (4) EL 6.4 - - - -
(46) S-1E (1) EL 8.0 - - - -
(47) S-1E (2) EL 6.5 - - - -
(48) S-4E (1) EL 8.0 51.0 408 3,250 1,326.0 33.15
(49) S-4E (2) EL 14.5 51.0 739.5 2,750 2,033.6 50.84
(75) N-3E (1) EL 8.0 - - - -
(76) N-3E (2) EL 16.0 - - - -
(77) W-2E EL 5.5 - - - -
(86) S-5E (1) EL 5.0 51.0 255 - - -
(87) S-5E (2) EL 12.5 51.0 637.5 - - -
(88) S-5E (3) EL 7.0 51.0 357 - - -
(89) E-7E (2) EL 6.0 - - - - -
(90) R-4E (2) EL 5.0 - - - - -
Sub Total B 163.3 20,220.2 505.51
A2 Primary Arterial ( 6 lanes)
(15) S-1 (1) AG 16.5 51.0 841.5 1,000 841.5 21.04
(16) S-1 (2) AG 11.5 51.0 586.5 1,000 586.5 14.66
17 S-1 (3) AG 7.0 34.0 238 1,000 238.0 5.95
18 S-2 (1) AG 20.5 34.0 697 550 383.4 9.58
191) S-2 (2) AG 3.5 - 550 -
201) S-2 (3) AG 8.0 - 450 -
21 S-3 (1) AG 5.5 34.0 187 1,000 187.0 4.68
22 S-3 (2) AG 11.0 34.0 374 750 280.5 7.01
23 S-4 (1) AG 8.0 51.0 408 3,250 1,326.0 33.15
24 S-4 (2) AG 12.5 51.0 637.5 2,750 1,753.1 43.83
25 S-4 (3) AG 16.5 34.0 561 400 224.4 5.61
26 S-5 (4) AG 12.5 34.0 425 3,800 1,615.0 40.38
27 S-5 (5) AG 19.5 34.0 663 2,000 1,326.0 33.15
28 E-1 (1) AG 14.5 34.0 493 1,100 542.3 13.56
29 E-1 (2) AG 10.0 34.0 340 2,350 799.0 19.98
30 E-2 (1) AG 19.0 34.0 646 900 581.4 14.54
31 E-2 (2) AG 11.5 34.0 391 1,000 391.0 9.78
32 E-3 (1) AG 12.5 34.0 425 700 297.5 7.44
METRO MANILA URBAN TRANSPORTATION INTEGRATION STUDY
TECHNICAL REPORT NO. 11 COST ESTIMATION AND DESIGN CRITERIA
1-8
PROJECT Structure Route / km ROW (m)Land
(SQMX103)Unit Price
P/sqmLand Acquisition
Cost P milLand Acquisition
Cost $milRemarks
331) E-3 (2) AG 13.0 34.0 442 850 375.7 9.39
34 E-3 (3) AG 8.5 34.0 289 1,100 317.9 7.95
35 E-3 (4) AG 7.5 34.0 255 1,000 255.0 6.38 1) Improvement
36 E-4 (1) AG 14.0 34.0 476 400 190.4 4.76 2) Widening
371) E-4 (2) AG 5.0 - 100 - - 3) Partial
38 E-4 (3) AG 10.0 34.0 340 250 85.0 2.13
39 E-4 (4) AG 22.0 34.0 748 800 598.4 14.96
40 C-5 (2) AG 6.4 51.0 326.4 7,900 2,578.6 64.46
41 2-1 AG 2.5 34.0 85 2,400 204.0 5.10
51 N-1 (1) AG 9.0 34.0 306 1,500 459.0 11.48
52 N-1 (2) AG 14.0 34.0 476 800 380.8 9.52
53 N-2 AG 10.5 34.0 357 1,200 428.4 10.71
54 N-3 (1) AG 14.0 51.0 714 900 642.6 16.07
55 N-3 (2) AG 14.0 51.0 714 450 321.3 8.03
(56) N-4 (1) AG 7.0 34.0 238 12,000 2,856.0 71.40
571) N-4 (2) AG 7.5 - 7,500 - -
(58) N-4 (3) AG 15.5 34.0 527 900 474.3 11.86
(59) W-1 (1) AG 7.0 34.0 238 3,400 809.2 20.23
(60) W-1 (2) AG 7.0 34.0 238 3,400 809.2 20.23
(61) W-1 (3) AG 5.5 34.0 187 5,000 935.0 23.38
622) W-1 (4) AG 7.5 34.0 255 4,500 1,147.5 28.69
(63) W-2 (1) AG 5.5 51.5 283.25 4,500 1,274.6 31.87
(64) W-2 (2) AG 5.5 34.0 187 800 149.6 3.74
(65) W-2 (3) AG 13.0 34.0 442 1,500 663.0 16.58
(66) W-3 (1) AG 6.5 34.0 221 2,000 442.0 11.05
(67) W-3 (2) AG 8.5 34.0 289 1,000 289.0 7.23
(68) W-3 (3) AG 6.0 34.0 204 600 122.4 3.06
(69) W-4 (1) AG 5.5 34.0 187 1,000 187.0 4.68
(70) W-4 (2) AG 13.5 34.0 459 800 367.2 9.18
(71) W-4 (3) AG 7.0 34.0 238 500 119.0 2.98
(72) W-5 (1) AG 4.0 34.0 136 5,000 680.0 17.00
(73) W-5 (2) AG 19.0 34.0 646 1,000 646.0 16.15
(74) W-5 (3) AG 5.5 34.0 187 300 56.1 1.40
(78) C-5 (1) AG 1.1 51.0 56.1 2,600 145.9 3.65
(79) S-5 (1) AG 7.5 34.0 255 2,600 663.0 16.58
(80) S-5 (2) AG 17.0 34.0 578 3,000 1,734.0 43.35
(81) S-5 (3) AG 14.5 34.0 493 3,000 1,479.0 36.98
(82) R-7 AG 6.0 51.0 306 15,000 4,590.0 114.75
(83) R-4 AG 5.0 51.0 255 4,000 1,020.0 25.50
(84)1) B-1 (1) AG 3.2 34.0 109 27,000 2,937.6 73.44
(85) B-1 (2) AG 3.0 34.0 102 2,500 255.0 6.38
Sub Total A2 755.1 43,061.2 1,076.53
C Existing Primary Arterial
(12)2) R-4 AG 9.5 17.0 161.5 13,200 2,131.8 53.30
(13)3) R-5 AG 8.0 11.3 90.7 10,000 906.7 22.67
(14)3) R-5 AG 13.0 11.3 147.3 6,000 884.0 22.10
(19)2) R-8(1) AG 3.0 17.0 51.0 25,000 1,275.0 31.88
(20)3) R-8(2) AG 40.0 11.3 453.3 10,400 4,714.7 117.87
(21)2) N-1 AG 14.0 17.0 238.0 3,400 809.2 20.23
Sub Total C 87.5 94,326.9 268.03Total 160,598 1,925
METRO MANILA URBAN TRANSPORTATION INTEGRATION STUDY
TECHNICAL REPORT NO. 11 COST ESTIMATION AND DESIGN CRITERIA
1-9
TABLE 1.4INITIAL CONSTRUCTION COST ESTIMATE FOR HIGHWAY
Project Structure Route/kmCost
$mil/kmCost$mil
% CostBorne by
PublicSec.
Cost Borneby Public
($ mil)
CrossSection
Type
A. Primary Arterial Missing (6 lanes)(1) C -3 (1) AG 0.8 3.76 3.008 1.0 3.008 II(2) C -3 (2) AG 5.5 3.76 20.68 1.0 20.680 II(3) C - 4 AG 1.3 4.13 5.369 1.0 5.369 II
Sub Total A1 7.6 29.057B. Urban Expressway (6 lanes)(4) MMS (1) EL 2.0 48.14 96.280 1.0 96.280 I(5) MMS (2) EL 10.5 48.14 505.47 1.0 505.470 I(6) MMS (3) EL 2.5 48.14 120.35 1.0 120.350 I(7) R 101 C3 EL 7.5 48.14 361.05 1.0 361.050 I(8) R-7E (1) EL 7.5 48.14 361.05 1.0 361.050 I(9) R-4E (2) EL 7.5 48.14 361.05 1.0 361.050 I(42) MMS (4) EL 9.2 48.14 442.888 1.0 442.888 I(43) MMS (5) EL 7.8 48.14 375.492 1.0 375.492 I(44) MMS (6) EL 7.5 48.14 361.05 1.0 361.050 I(45) C-5E (4) EL 6.4 48.14 308.096 1.0 308.096 I(46) S-1E (1) EL 8.0 48.14 385.120 1.0 385.120 I(47) S-1E (2) EL 6.5 48.14 312.91 1.0 312.910 I(48) S-4E (1) EL 8.0 48.14 385.120 1.0 385.120 I(49) S-4E (2) EL 14.5 48.14 698.03 1.0 698.030 I(75) N-3E (1) EL 8.0 48.14 385.120 1.0 385.120 I(76) N-3E (2) EL 16.0 48.14 770.240 1.0 770.240 I(77) W-2E EL 5.5 48.14 264.77 1.0 264.770 I(86) S-5E (1) EL 5.0 48.14 240.700 1.0 240.700 I(87) S-5E (2) EL 12.5 48.14 601.75 1.0 601.750 I(88) S-5E (3) EL 7.0 48.14 336.980 1.0 336.980 I(89) E-7E (2) EL 6.0 48.14 288.840 1.0 288.840 I(90) R-4E (2) EL 5.0 48.14 240.700 1.0 240.700 I
Sub Total B 170.4 8,203.056A2. Primary Arterial ( 6 lanes)(15) S-1 (1) AG 16.5 48.14 794.31 1.0 794.310 II(16) S-1 (2) AG 11.5 48.14 553.61 1.0 553.610 II17 S-1 (3) AG 7.0 3.76 26.320 1.0 26.320 II18 S-2 (1) AG 20.5 3.76 77.08 1.0 77.080 II191) S-2 (2) AG 3.5 3.76 13.16 1.0 13.160 II201) S-2 (3) AG 8.0 3.76 30.080 1.0 30.080 II21 S-3 (1) AG 5.5 3.76 20.68 1.0 20.680 II22 S-3 (2) AG 11.0 3.76 41.360 1.0 41.360 II23 S-4 (1) AG 8.0 48.14 385.120 1.0 385.120 I-B24 S-4 (2) AG 12.5 48.14 601.75 1.0 601.750 I-B25 S-4 (3) AG 16.5 3.76 62.04 1.0 62.040 II26 S-5 (4) AG 12.5 3.76 47 1.0 47.000 II27 S-5 (5) AG 19.5 3.76 73.32 1.0 73.320 II28 E-1 (1) AG 14.5 3.76 54.52 1.0 54.520 II29 E-1 (2) AG 10.0 3.76 37.6 1.0 37.600 II30 E-2 (1) AG 19.0 3.76 71.44 1.0 71.440 II31 E-2 (2) AG 11.5 3.76 43.24 1.0 43.240 II32 E-3 (1) AG 12.5 3.76 47 1.0 47.000 II331) E-3 (2) AG 13.0 3.76 48.88 1.0 48.880 II34 E-3 (3) AG 8.5 3.76 31.96 1.0 31.960 II35 E-3 (4) AG 7.5 3.76 28.2 1.0 28.200 II36 E-4 (1) AG 14.5 3.76 54.52 1.0 54.520 II
METRO MANILA URBAN TRANSPORTATION INTEGRATION STUDY
TECHNICAL REPORT NO. 11 COST ESTIMATION AND DESIGN CRITERIA
1-10
Project Structure Route/kmCost
$mil/kmCost$mil
% CostBorne by
PublicSec.
Cost Borneby Public
($ mil)
CrossSection
Type
371) E-4 (2) AG 5.0 3.76 18.8 1.0 18.800 II
38 E-4 (3) AG 10.0 3.76 37.600 1.0 37.600 II39 E-4 (4) AG 22.0 3.76 82.720 1.0 82.720 II40 C-5 (2) AG 6.4 48.14 308.096 1.0 308.096 I41 2-1 AG 2.5 48.14 120.35 1.0 120.350 II51 N-1 (1) AG 9.0 48.14 433.260 1.0 433.260 II52 N-1 (2) AG 14.0 48.14 673.960 1.0 673.960 II53 N-2 AG 10.5 3.76 39.48 1.0 39.480 II54 N-3 (1) AG 14.0 48.14 673.960 1.0 673.960 I-B55 N-3 (2) AG 14.0 48.14 673.960 1.0 673.960 I-B(56) N-4 (1) AG 7.0 48.14 336.980 1.0 336.980 II
571) N-4 (2) AG 7.5 48.14 361.05 1.0 361.050 II
(58) N-4 (3) AG 15.5 48.14 746.17 1.0 746.170 II(59) W-1 (1) AG 7.0 48.14 336.980 1.0 336.980 II(60) W-1 (2) AG 7.0 48.14 336.980 1.0 336.980 II(61) W-1 (3) AG 5.5 48.14 264.770 1.0 264.770 II
621) W-1 (4) AG 7.5 3.76 28.2 1.0 28.200 II
(63) W-2 (1) AG 5.5 48.14 264.77 1.0 264.770 I(64) W-2 (2) AG 5.5 3.76 20.68 1.0 20.680 II(65) W-2 (3) AG 13.0 3.76 48.880 1.0 48.880 II(66) W-3 (1) AG 6.5 3.76 24.44 1.0 24.440 II(67) W-3 (2) AG 8.5 3.76 31.96 1.0 31.960 II(68) W-3 (3) AG 6.0 3.76 22.560 1.0 22.560 II(69) W-4 (1) AG 5.5 3.76 20.68 1.0 20.680 II(70) W-4 (2) AG 13.5 3.76 50.76 1.0 50.760 II(71) W-4 (3) AG 7.0 3.76 26.320 1.0 26.320 II(72) W-5 (1) AG 4.0 3.76 15.040 1.0 15.040 II(73) W-5 (2) AG 19.0 3.76 71.440 1.0 71.440 II(74) W-5 (3) AG 5.5 3.76 20.68 1.0 20.680 II(78) C-5 (1) AG 1.1 48.14 52.954 1.0 52.954 I(79) S-5 (1) AG 7.5 3.76 28.2 1.0 28.200 II(80) S-5 (2) AG 17.0 3.76 63.920 1.0 63.920 II(81) S-5 (3) AG 14.5 3.76 54.52 1.0 54.520 II(82) R-7 AG 6.0 48.14 288.840 1.0 288.840 I(83) R-4 AG 5.0 48.14 240.700 1.0 240.700 I
(84)1) B-1 (1) AG 4.0 3.76 15.040 1.0 15.040 II
(85) B-1 (2) AG 3.0 3.76 11.280 1.0 11.280 IISub Total A2 585.5 9,990.170
C. Grade Separation (4 lanes)
(10)2) GS-1 EL 0.5 25.8 12.900 1.0 12.900 -
(11) GS-2 EL 0.5 25.8 12.900 1.0 12.900 -(12) GS-3 EL 0.5 25.8 12.900 1.0 12.900 -(13) GS-4 EL 0.5 25.8 12.900 1.0 12.900 -(14) GS-5 EL 0.5 25.8 12.900 1.0 12.900 -(50) GS-6 EL 0.5 25.8 12.900 1.0 12.900 -(91) GS-7 EL 0.5 25.8 12.900 1.0 12.900 -(92) GS-8 EL 0.5 25.8 12.900 1.0 12.900 -
Sub Total C 4.0 103.200
Total 767.5 18325.483
METRO MANILA URBAN TRANSPORTATION INTEGRATION STUDY
TECHNICAL REPORT NO. 11 COST ESTIMATION AND DESIGN CRITERIA
1-11
TA
BL
E1.
5C
ON
ST
RU
CT
ION
CO
ST
FO
R E
XP
RE
SS
WA
Y W
ITH
AR
TE
RIA
L S
TR
EE
T
To
tal
5
7,5
87
,89
5
1
1,8
33
,12
9
3
1,8
70
,56
1
4
8,1
21
,39
2
2
2,8
77
,38
3
4
0,8
63
,73
9
21
3,1
54
,09
9
Ta
x
10
,30
8,2
33
2
,11
8,1
30
5
,70
4,8
30
8
,61
3,7
29
4
,09
5,0
52
7
,31
4,6
09
38
,15
4,5
83
Lo
cal
2
3,4
95
,86
1
4,8
27
,91
7
1
3,0
03
,18
9
1
9,6
33
,52
8
9,3
33
,97
2
1
6,6
72
,40
6
8
6,9
66
,87
3
Fo
reig
n
23
,78
3,8
01
4
,88
7,0
82
13
,16
2,5
42
19
,87
4,1
35
9
,44
8,3
59
16
,87
6,7
24
88
,03
2,6
43
En
gin
ee
rin
g
serv
ice
3
,76
7,4
32
7
74
,13
0
2
,08
4,9
90
3
,14
8,1
28
1
,49
6,6
51
2
,67
3,3
29
13
,94
4,6
60
con
tra
cto
r's o
ver
he
ad
4
,56
6,2
16
93
8,2
64
2
,52
7,0
56
3
,81
5,6
05
1
,81
3,9
76
3
,24
0,1
37
16
,90
1,2
54
ph
ysic
al
con
ten
ge
ncy
3,0
44
,14
4
6
25
,50
9
1,6
84
,70
4
2,5
43
,73
7
1,2
09
,31
7
2,1
60
,09
1
1
1,2
67
,50
2
relo
catio
n
4
,20
0,9
18
8
63
,20
2
2
,32
4,8
92
3
,51
0,3
57
1
,66
8,8
58
2
,98
0,9
26
15
,54
9,1
53
mis
cella
-ne
ou
s
5
,47
9,4
59
1
,12
5,9
16
3
,03
2,4
68
4
,57
8,7
26
2
,17
6,7
71
3
,88
8,1
64
20
,28
1,5
04
on
/off
ra
mp
6
,08
8,2
88
1
,25
1,0
18
3
,36
9,4
08
5
,08
7,4
73
2
,41
8,6
35
4
,32
0,1
82
22
,53
5,0
04
Co
st p
er
Km
10
4,3
12
,00
0
thro
ug
h w
ay
3
0,4
41
,43
8
6,2
55
,09
0
1
6,8
47
,04
2
2
5,4
37
,36
6
1
2,0
93
,17
4
2
1,6
00
,91
1
11
2,6
75
,02
1
20
% o
f d
ire
ct c
ost
10
% o
f d
ire
ct c
ost
15
% o
f 1
) +
2)
15
% o
f d
ire
ct c
ost
10
% o
f d
ire
ct c
ost
Le
ng
th
10
00
83
4,0
12
83
4,0
12
83
4,0
12
83
4,0
12
83
4,0
12
83
4,0
12
5,0
04
,07
2
Wid
th
34
.00
Le
ng
th
(km
)
36
.5
7.5
20
.2
30
.5
14
.5
25
.9
13
5
Un
it
30
68
Me
tro
Ma
nila
Sky
wa
y
R-1
0/C
-3 E
xpre
ssw
ay
(n.H
ab
ou
r-A
. B
on
ifaci
o)
Pa
sig
Exp
ress
wa
y (C
-3 M
arc
os
Hig
hw
ay)
R-7
Exp
ress
wa
y (C
-3-D
PW
H 3
)
Ma
nila
-Ca
vite
Exp
ress
wa
y (S
ou
th E
DS
A-K
aw
it)
C-5
Exp
ress
wa
y D
ilim
an
-Ro
xas
Blv
d.)
To
tal
Dire
ct C
ost
Ind
ere
ct C
ost
2)
Ph
sica
l Co
nte
ng
en
cy
3)
En
gin
ee
rin
g S
erv
ice
Un
it C
ost
of
Ma
jor
Wo
rks
at
gra
de
re
ha
bili
tatio
n 1
/
XM
MS
XR
10
C3
XR
4
XR
7
XM
C
XC
5
A B C
4)
Mis
celle
ne
uo
s o
f o
the
r fa
cilit
ies
3)
Re
loca
tion
of
exi
stin
g u
tiliti
es
2)
On
/ o
ff r
am
p a
nd
oth
ers
1)
Co
ntr
uct
or's
ove
rhe
ad
an
d g
en
era
l exp
en
ces
Co
nst
ruct
ion
Co
st
7%
of
dir
ect
co
st +
co
st (
B-1
), a
nd
(B
-2)
1)
Ma
jor
wo
rks
(th
ou
gh
wa
y)
Nam
eC
od
e
To
tal C
ost
(1
03 x p
eso
s)In
dir
ect
co
st (
10
3 x p
eso
s)D
ire
ct c
ost
(1
03 x
pe
sos)
Un
it C
ost
(1
03 x
p
eso
s)
METRO MANILA URBAN TRANSPORTATION INTEGRATION STUDY
TECHNICAL REPORT NO. 11 COST ESTIMATION AND DESIGN CRITERIA
1-12
TA
BL
E1.
6C
ON
ST
RU
CT
ION
CO
ST
FO
R S
EC
ON
DA
RY
AR
TE
RIA
L S
TR
EE
T
METRO MANILA URBAN TRANSPORTATION INTEGRATION STUDY
TECHNICAL REPORT NO. 11 COST ESTIMATION AND DESIGN CRITERIA
1-13
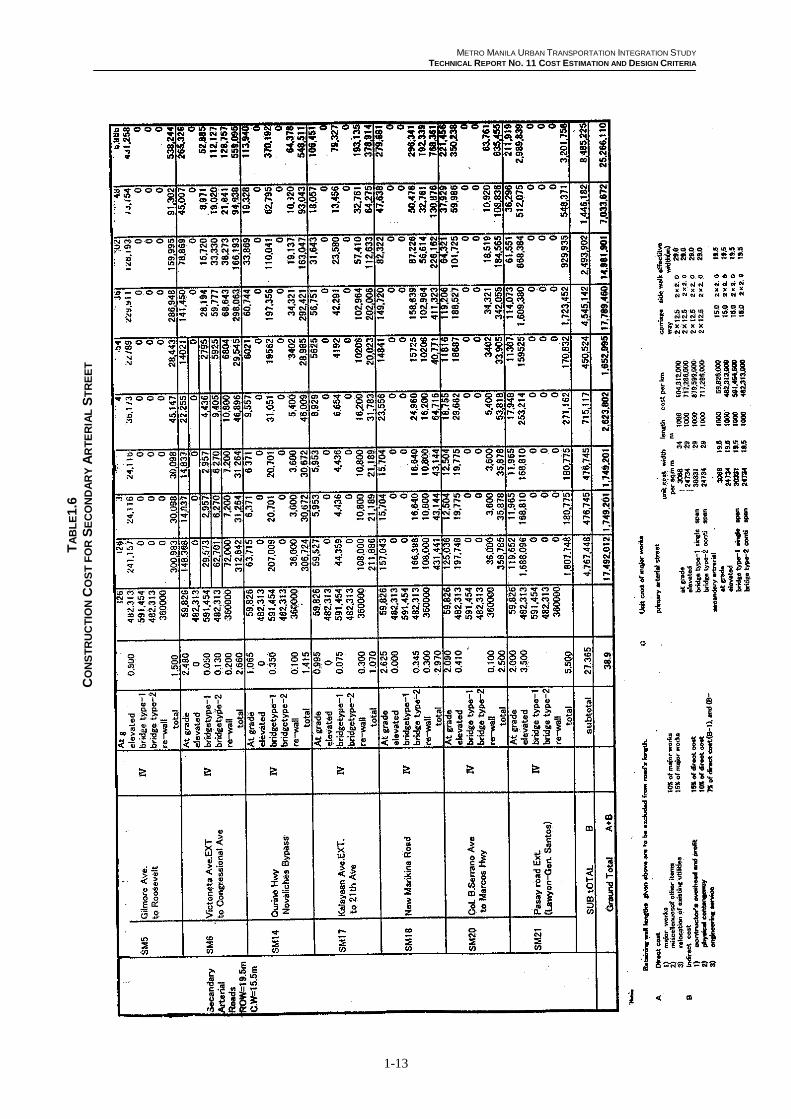
TA
BL
E1.
6C
ON
ST
RU
CT
ION
CO
ST
FO
R S
EC
ON
DA
RY
AR
TE
RIA
L S
TR
EE
T
METRO MANILA URBAN TRANSPORTATION INTEGRATION STUDY
TECHNICAL REPORT NO. 11 COST ESTIMATION AND DESIGN CRITERIA
1-14
TABLE 1.7SUMMARY OF CONSTRUCTION COST FOR RAIL WAY
(MTDP 1999-2004)
Line 1 Line 2 Line 3 Line 4 MCX North Rail Remarks
1. Line length (km) at-grade 0 0 0 0 37.2 0elevated 15 9.5 11.5 27.4 12.4 18
Total 15 9.5 11.5 27.4 49.6 18
2. Infrastructure Civil works 230.60 152.10 182.50 385.40 337.00 207.90 1495.50 Station / terminal 111.60 51.90 56.10 200.10 72.00 71.40 563.10 Car Depot 7.35 3.92 6.70 13.43 24.30 8.80 64.50
Sub-Total 349.55 207.92 245.30 598.93 433.30 288.10 2123.10
3. Electronic / Mechanics
Rolling stock 84.00 44.80 64.40 153.44 277.76 100.80 725.20
Power supply and feeder system 45.00 24.00 34.50 82.20 148.80 54.00 388.50
Overhead catenary and signal 52.50 28.00 40.25 95.90 173.60 63.00 453.25
Telecommunication 22.50 12.00 17.25 41.10 74.40 27.00 194.25
Automatic fare collection system 25.50 13.60 19.55 46.58 84.32 30.60 220.15
Depot equipment 5.79 3.08 4.44 10.58 19.15 6.95 49.99
Depot building / facilities 48.00 25.60 36.80 87.68 158.72 57.60 414.40 Track work and other maintenance
facilities35.29 18.81 27.06 64.47 116.70 42.35 304.68
Sub-Total 318.58 169.89 244.25 581.95 1053.45 382.30 2750.42
4. Engineering Serve design supervision 50.38 328.38 33.97 78.54 56.50 38.82 586.59 Preparation and contract management 15.93 8.50 12.21 29.10 52.67 19.12 137.53
Consultancy and administration 6.37 3.40 4.89 11.64 21.07 7.65 55.02Sub-Total 72.68 340.28 51.07 119.28 130.24 65.59 779.14
Sub-Total 2+3+4 740.81 718.09 540.62 1300.16 1616.99 735.99 5652.66
5. Physical Contingency 10% above 74.08 71.81 54.06 130.02 161.70 73.60 565.27
6. Land Acquisition / Compensation 28.20 19.10 27.48 29.37 18.72 22.49 145.36
Grand Total 843.09 809.00 622.16 1459.55 1797.41 832.08 6363.29
METRO MANILA URBAN TRANSPORTATION INTEGRATION STUDY
TECHNICAL REPORT NO. 11 COST ESTIMATION AND DESIGN CRITERIA
1-15
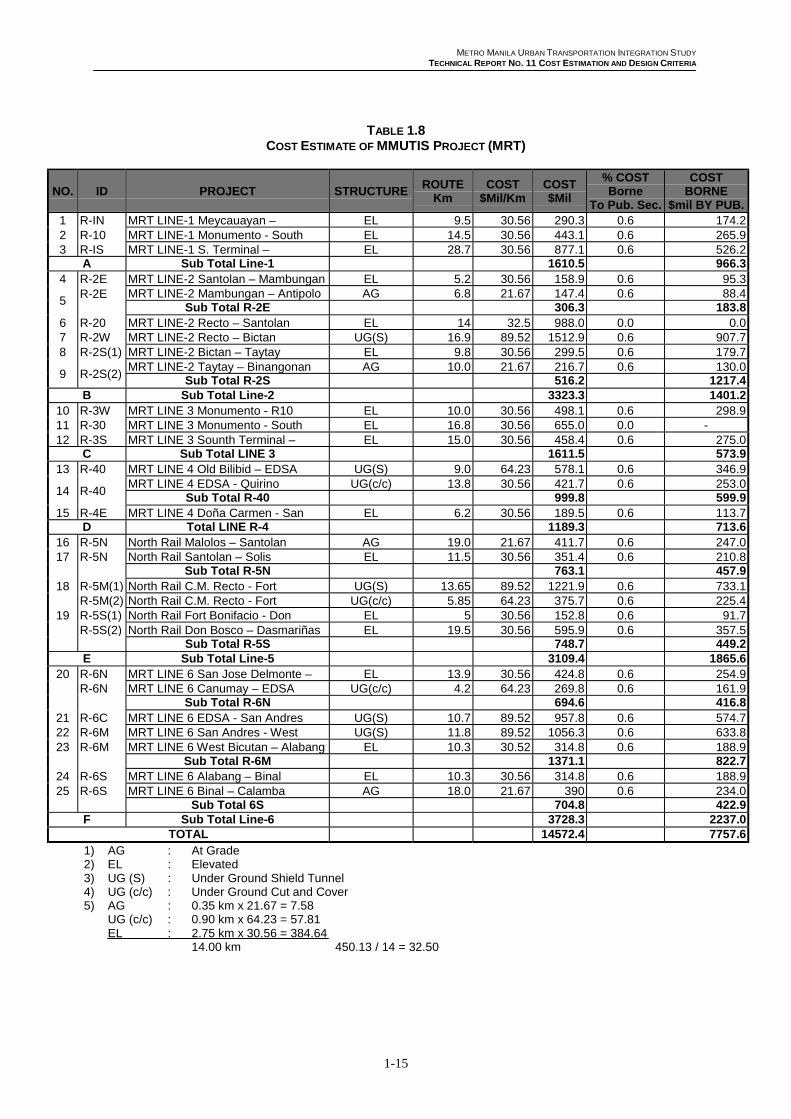
TABLE 1.8COST ESTIMATE OF MMUTIS PROJECT (MRT)
NO. ID PROJECT STRUCTUREROUTE
KmCOST
$Mil/KmCOST$Mil
% COSTBorne
To Pub. Sec.
COSTBORNE
$mil BY PUB.1 R-IN MRT LINE-1 Meycauayan – EL 9.5 30.56 290.3 0.6 174.22 R-10 MRT LINE-1 Monumento - South EL 14.5 30.56 443.1 0.6 265.93 R-IS MRT LINE-1 S. Terminal – EL 28.7 30.56 877.1 0.6 526.2
A Sub Total Line-1 1610.5 966.34 R-2E MRT LINE-2 Santolan – Mambungan EL 5.2 30.56 158.9 0.6 95.3
MRT LINE-2 Mambungan – Antipolo AG 6.8 21.67 147.4 0.6 88.45
R-2ESub Total R-2E 306.3 183.8
6 R-20 MRT LINE-2 Recto – Santolan EL 14 32.5 988.0 0.0 0.07 R-2W MRT LINE-2 Recto – Bictan UG(S) 16.9 89.52 1512.9 0.6 907.78 R-2S(1) MRT LINE-2 Bictan – Taytay EL 9.8 30.56 299.5 0.6 179.7
MRT LINE-2 Taytay – Binangonan AG 10.0 21.67 216.7 0.6 130.09 R-2S(2) Sub Total R-2S 516.2 1217.4
B Sub Total Line-2 3323.3 1401.210 R-3W MRT LINE 3 Monumento - R10 EL 10.0 30.56 498.1 0.6 298.911 R-30 MRT LINE 3 Monumento - South EL 16.8 30.56 655.0 0.0 -12 R-3S MRT LINE 3 Sounth Terminal – EL 15.0 30.56 458.4 0.6 275.0
C Sub Total LINE 3 1611.5 573.913 R-40 MRT LINE 4 Old Bilibid – EDSA UG(S) 9.0 64.23 578.1 0.6 346.9
MRT LINE 4 EDSA - Quirino UG(c/c) 13.8 30.56 421.7 0.6 253.014 R-40
Sub Total R-40 999.8 599.915 R-4E MRT LINE 4 Doña Carmen - San EL 6.2 30.56 189.5 0.6 113.7
D Total LINE R-4 1189.3 713.616 R-5N North Rail Malolos – Santolan AG 19.0 21.67 411.7 0.6 247.017 R-5N North Rail Santolan – Solis EL 11.5 30.56 351.4 0.6 210.8
Sub Total R-5N 763.1 457.918 R-5M(1) North Rail C.M. Recto - Fort UG(S) 13.65 89.52 1221.9 0.6 733.1
R-5M(2) North Rail C.M. Recto - Fort UG(c/c) 5.85 64.23 375.7 0.6 225.419 R-5S(1) North Rail Fort Bonifacio - Don EL 5 30.56 152.8 0.6 91.7
R-5S(2) North Rail Don Bosco – Dasmariñas EL 19.5 30.56 595.9 0.6 357.5Sub Total R-5S 748.7 449.2
E Sub Total Line-5 3109.4 1865.620 R-6N MRT LINE 6 San Jose Delmonte – EL 13.9 30.56 424.8 0.6 254.9
R-6N MRT LINE 6 Canumay – EDSA UG(c/c) 4.2 64.23 269.8 0.6 161.9Sub Total R-6N 694.6 416.8
21 R-6C MRT LINE 6 EDSA - San Andres UG(S) 10.7 89.52 957.8 0.6 574.722 R-6M MRT LINE 6 San Andres - West UG(S) 11.8 89.52 1056.3 0.6 633.823 R-6M MRT LINE 6 West Bicutan – Alabang EL 10.3 30.52 314.8 0.6 188.9
Sub Total R-6M 1371.1 822.724 R-6S MRT LINE 6 Alabang – Binal EL 10.3 30.56 314.8 0.6 188.925 R-6S MRT LINE 6 Binal – Calamba AG 18.0 21.67 390 0.6 234.0
Sub Total 6S 704.8 422.9F Sub Total Line-6 3728.3 2237.0
TOTAL 14572.4 7757.61) AG : At Grade2) EL : Elevated3) UG (S) : Under Ground Shield Tunnel4) UG (c/c) : Under Ground Cut and Cover5) AG : 0.35 km x 21.67 = 7.58
UG (c/c) : 0.90 km x 64.23 = 57.81EL : 2.75 km x 30.56 = 384.64
14.00 km 450.13 / 14 = 32.50
METRO MANILA URBAN TRANSPORTATION INTEGRATION STUDY
TECHNICAL REPORT NO. 11 COST ESTIMATION AND DESIGN CRITERIA
1-16
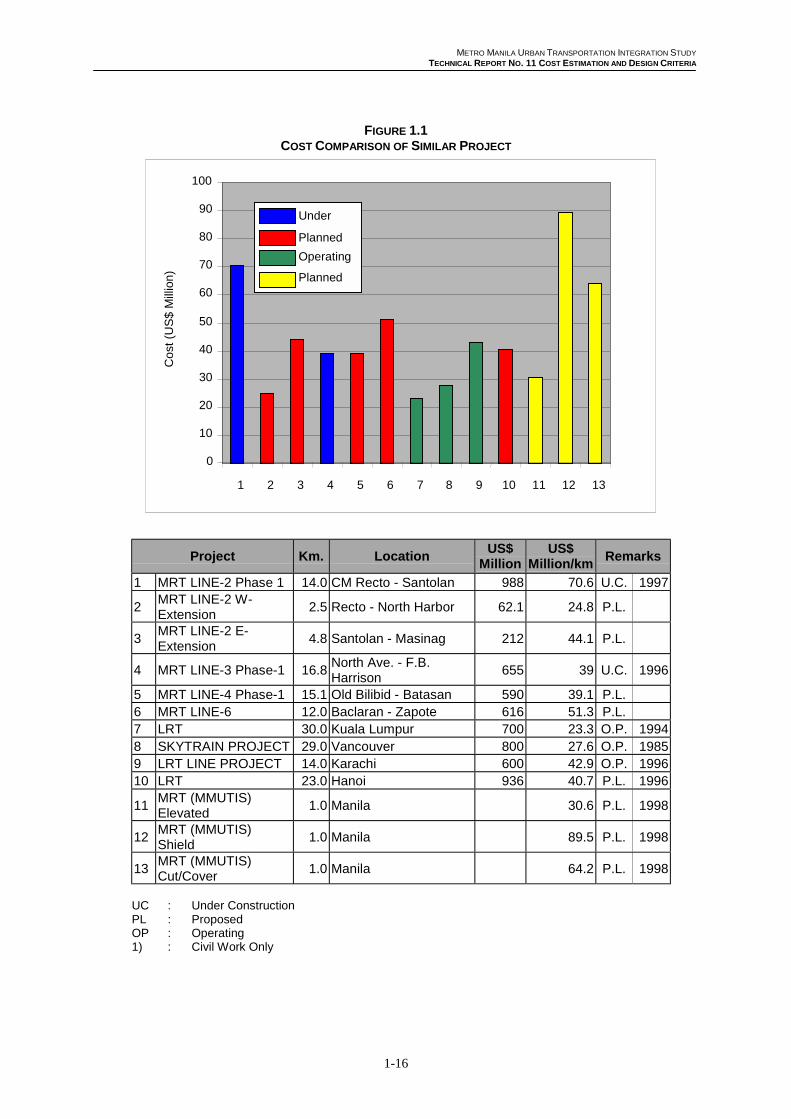
FIGURE 1.1COST COMPARISON OF SIMILAR PROJECT
Project Km. LocationUS$
MillionUS$
Million/kmRemarks
1 MRT LINE-2 Phase 1 14.0 CM Recto - Santolan 988 70.6 U.C. 1997
2MRT LINE-2 W-Extension
2.5 Recto - North Harbor 62.1 24.8 P.L.
3MRT LINE-2 E-Extension
4.8 Santolan - Masinag 212 44.1 P.L.
4 MRT LINE-3 Phase-1 16.8North Ave. - F.B.Harrison
655 39 U.C. 1996
5 MRT LINE-4 Phase-1 15.1 Old Bilibid - Batasan 590 39.1 P.L.6 MRT LINE-6 12.0 Baclaran - Zapote 616 51.3 P.L.7 LRT 30.0 Kuala Lumpur 700 23.3 O.P. 19948 SKYTRAIN PROJECT 29.0 Vancouver 800 27.6 O.P. 19859 LRT LINE PROJECT 14.0 Karachi 600 42.9 O.P. 199610 LRT 23.0 Hanoi 936 40.7 P.L. 1996
11MRT (MMUTIS)Elevated
1.0 Manila 30.6 P.L. 1998
12MRT (MMUTIS)Shield
1.0 Manila 89.5 P.L. 1998
13MRT (MMUTIS)Cut/Cover
1.0 Manila 64.2 P.L. 1998
UC : Under ConstructionPL : ProposedOP : Operating1) : Civil Work Only
0
10
20
30
40
50
60
70
80
90
100
1 2 3 4 5 6 7 8 9 10 11 12 13
Co
st (
US
$ M
illio
n)
Under
Planned
Operating
Planned
METRO MANILA URBAN TRANSPORTATION INTEGRATION STUDY
TECHNICAL REPORT NO. 11 COST ESTIMATION AND DESIGN CRITERIA
1-17
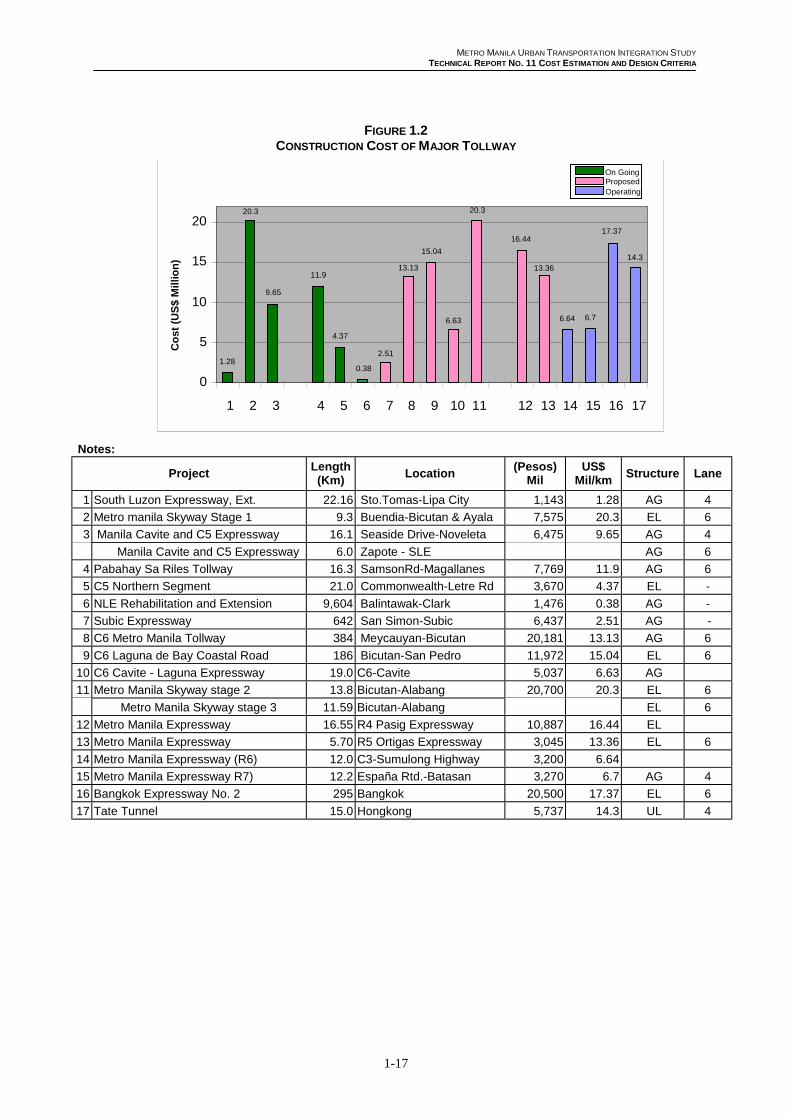
FIGURE 1.2CONSTRUCTION COST OF MAJOR TOLLWAY
Notes:
ProjectLength(Km)
Location(Pesos)
MilUS$
Mil/kmStructure Lane
1 South Luzon Expressway, Ext. 22.16 Sto.Tomas-Lipa City 1,143 1.28 AG 4
2 Metro manila Skyway Stage 1 9.3 Buendia-Bicutan & Ayala 7,575 20.3 EL 6
3 Manila Cavite and C5 Expressway 16.1 Seaside Drive-Noveleta 6,475 9.65 AG 4
Manila Cavite and C5 Expressway 6.0 Zapote - SLE AG 6
4 Pabahay Sa Riles Tollway 16.3 SamsonRd-Magallanes 7,769 11.9 AG 6
5 C5 Northern Segment 21.0 Commonwealth-Letre Rd 3,670 4.37 EL -
6 NLE Rehabilitation and Extension 9,604 Balintawak-Clark 1,476 0.38 AG -
7 Subic Expressway 642 San Simon-Subic 6,437 2.51 AG -
8 C6 Metro Manila Tollway 384 Meycauyan-Bicutan 20,181 13.13 AG 6
9 C6 Laguna de Bay Coastal Road 186 Bicutan-San Pedro 11,972 15.04 EL 6
10 C6 Cavite - Laguna Expressway 19.0 C6-Cavite 5,037 6.63 AG
11 Metro Manila Skyway stage 2 13.8 Bicutan-Alabang 20,700 20.3 EL 6
Metro Manila Skyway stage 3 11.59 Bicutan-Alabang EL 6
12 Metro Manila Expressway 16.55 R4 Pasig Expressway 10,887 16.44 EL
13 Metro Manila Expressway 5.70 R5 Ortigas Expressway 3,045 13.36 EL 6
14 Metro Manila Expressway (R6) 12.0 C3-Sumulong Highway 3,200 6.64
15 Metro Manila Expressway R7) 12.2 España Rtd.-Batasan 3,270 6.7 AG 4
16 Bangkok Expressway No. 2 295 Bangkok 20,500 17.37 EL 6
17 Tate Tunnel 15.0 Hongkong 5,737 14.3 UL 4
Co
st (
US
$ M
illio
n)
1.28
20.3
9.65
11.9
4.37
0.38
2.51
13.13
15.04
6.63
20.3
16.44
13.36
6.64 6.7
17.37
14.3
0
5
10
15
20
1 2 3 4 5 6 7 8 9 10 11 12 13 14 15 16 17
On GoingProposedOperating
METRO MANILA URBAN TRANSPORTATION INTEGRATION STUDY
TECHNICAL REPORT NO. 11 COST ESTIMATION AND DESIGN CRITERIA
1-18
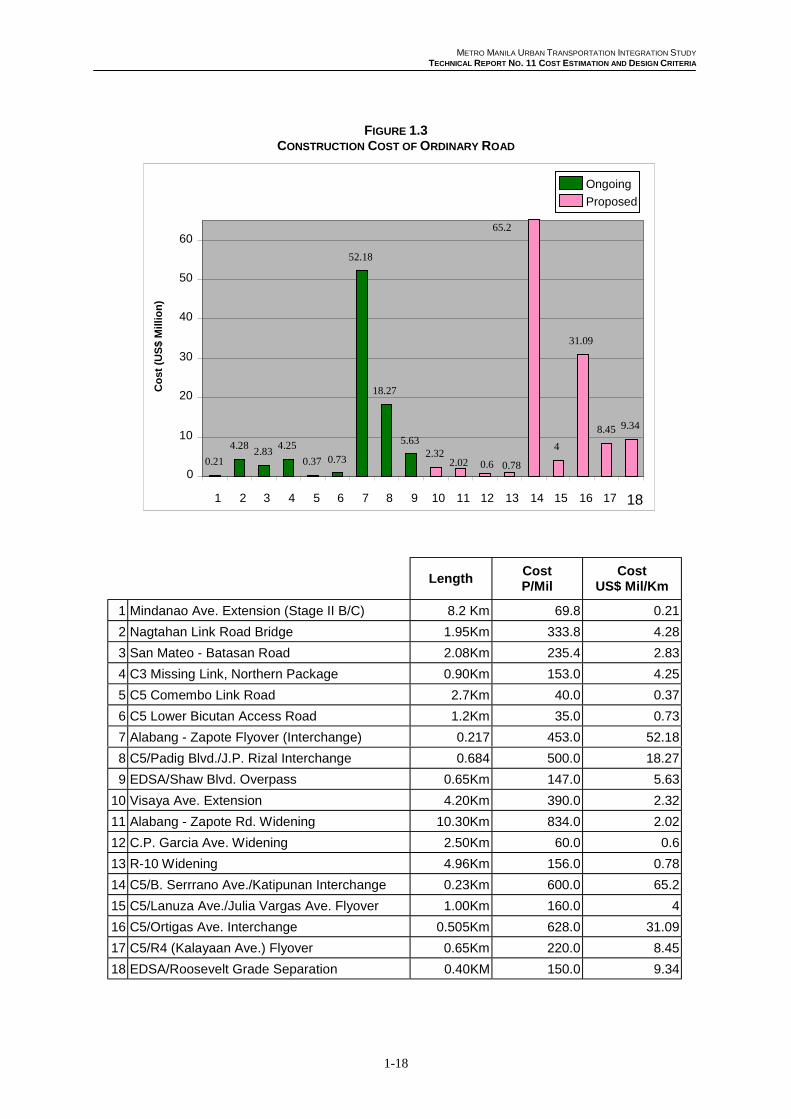
FIGURE 1.3CONSTRUCTION COST OF ORDINARY ROAD
LengthCostP/Mil
CostUS$ Mil/Km
1 Mindanao Ave. Extension (Stage II B/C) 8.2 Km 69.8 0.21
2 Nagtahan Link Road Bridge 1.95Km 333.8 4.28
3 San Mateo - Batasan Road 2.08Km 235.4 2.83
4 C3 Missing Link, Northern Package 0.90Km 153.0 4.25
5 C5 Comembo Link Road 2.7Km 40.0 0.37
6 C5 Lower Bicutan Access Road 1.2Km 35.0 0.73
7 Alabang - Zapote Flyover (Interchange) 0.217 453.0 52.18
8 C5/Padig Blvd./J.P. Rizal Interchange 0.684 500.0 18.27
9 EDSA/Shaw Blvd. Overpass 0.65Km 147.0 5.63
10 Visaya Ave. Extension 4.20Km 390.0 2.32
11 Alabang - Zapote Rd. Widening 10.30Km 834.0 2.02
12 C.P. Garcia Ave. Widening 2.50Km 60.0 0.6
13 R-10 Widening 4.96Km 156.0 0.78
14 C5/B. Serrrano Ave./Katipunan Interchange 0.23Km 600.0 65.2
15 C5/Lanuza Ave./Julia Vargas Ave. Flyover 1.00Km 160.0 4
16 C5/Ortigas Ave. Interchange 0.505Km 628.0 31.09
17 C5/R4 (Kalayaan Ave.) Flyover 0.65Km 220.0 8.45
18 EDSA/Roosevelt Grade Separation 0.40KM 150.0 9.34
0.21
4.282.83
4.25
0.37 0.73
52.18
18.27
5.632.32
4
31.09
8.45 9.34
0.782.02 0.60
10
20
30
40
50
60
1 2 3 4 5 6 7 8 9 10 11 12 13 14 15 16 17 18
Co
st (
US
$ M
illio
n)
Ongoing
Proposed
65.2
METRO MANILA URBAN TRANSPORTATION INTEGRATION STUDY
TECHNICAL REPORT NO. 11 COST ESTIMATION AND DESIGN CRITERIA
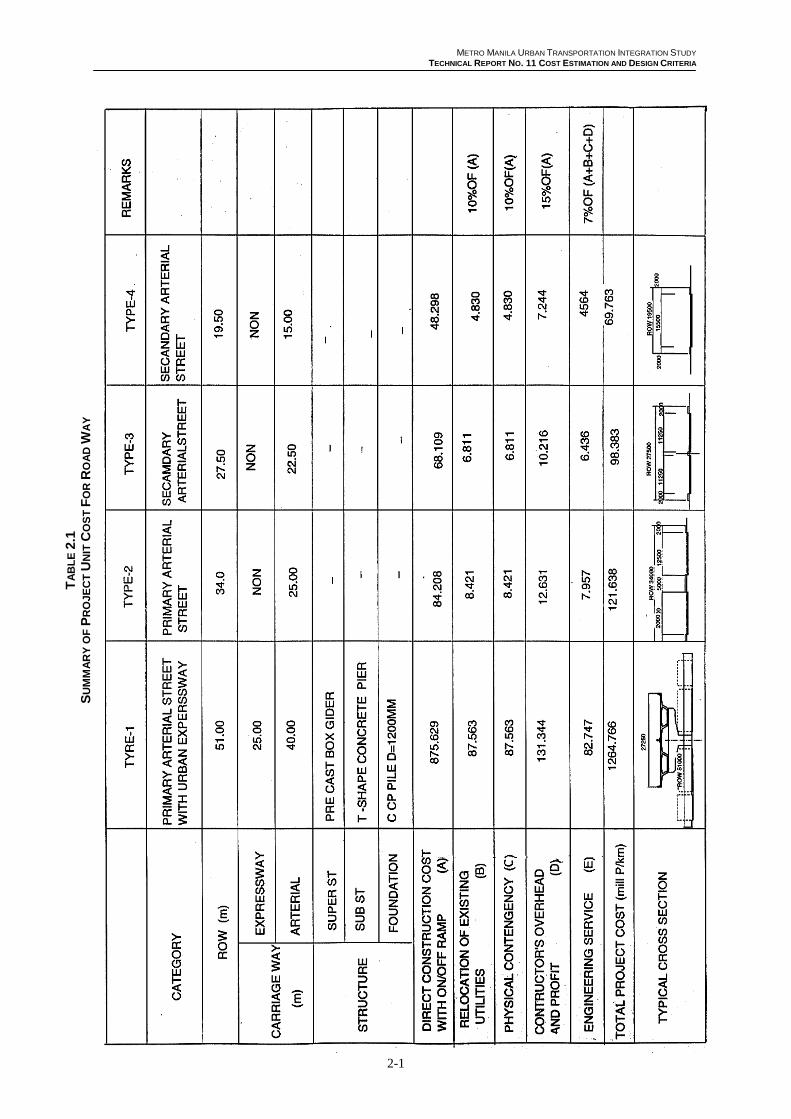
2-1
TA
BL
E 2
.1S
UM
MA
RY
OF
PR
OJE
CT
UN
IT C
OS
T F
OR
RO
AD
WA
Y
METRO MANILA URBAN TRANSPORTATION INTEGRATION STUDY
TECHNICAL REPORT NO. 11 COST ESTIMATION AND DESIGN CRITERIA
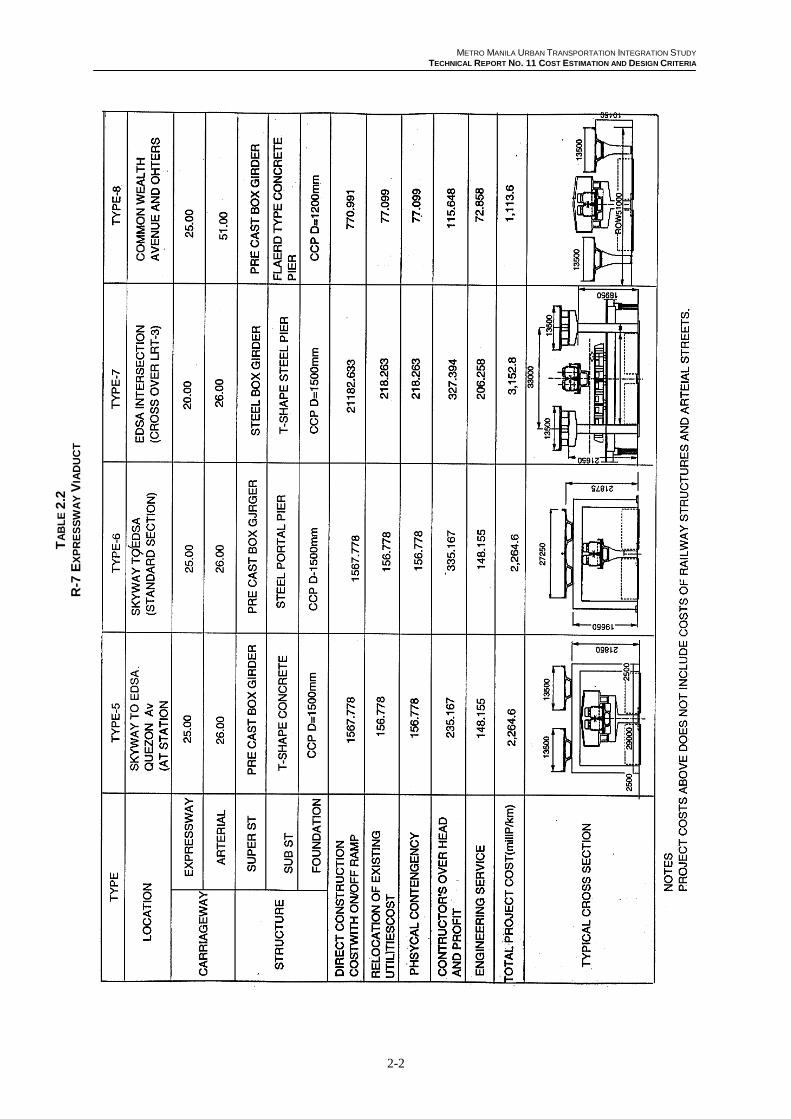
2-2
TA
BL
E 2
.2R
-7 E
XP
RE
SS
WA
Y V
IAD
UC
T
METRO MANILA URBAN TRANSPORTATION INTEGRATION STUDY
TECHNICAL REPORT NO. 11 COST ESTIMATION AND DESIGN CRITERIA
2-3
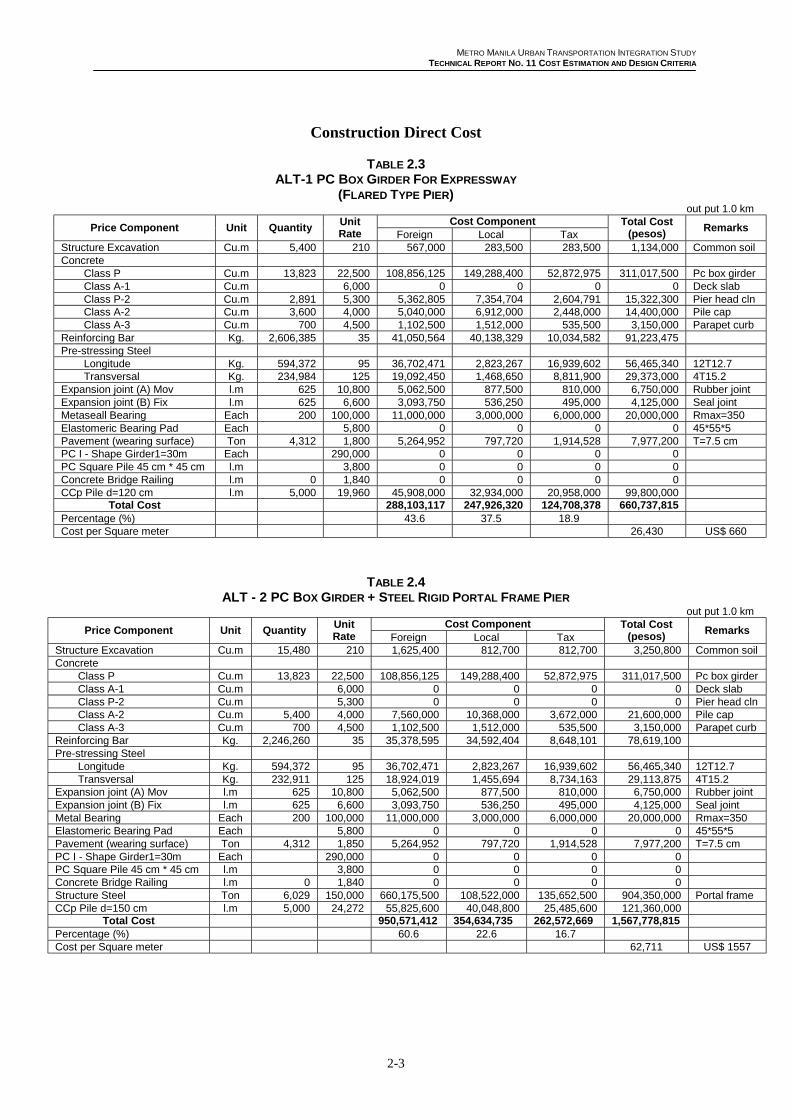
Construction Direct Cost
TABLE 2.3ALT-1 PC BOX GIRDER FOR EXPRESSWAY
(FLARED TYPE PIER)out put 1.0 km
Cost ComponentPrice Component Unit Quantity
UnitRate Foreign Local Tax
Total Cost(pesos)
Remarks
Structure Excavation Cu.m 5,400 210 567,000 283,500 283,500 1,134,000 Common soilConcrete
Class P Cu.m 13,823 22,500 108,856,125 149,288,400 52,872,975 311,017,500 Pc box girderClass A-1 Cu.m 6,000 0 0 0 0 Deck slabClass P-2 Cu.m 2,891 5,300 5,362,805 7,354,704 2,604,791 15,322,300 Pier head clnClass A-2 Cu.m 3,600 4,000 5,040,000 6,912,000 2,448,000 14,400,000 Pile capClass A-3 Cu.m 700 4,500 1,102,500 1,512,000 535,500 3,150,000 Parapet curb
Reinforcing Bar Kg. 2,606,385 35 41,050,564 40,138,329 10,034,582 91,223,475Pre-stressing Steel
Longitude Kg. 594,372 95 36,702,471 2,823,267 16,939,602 56,465,340 12T12.7Transversal Kg. 234,984 125 19,092,450 1,468,650 8,811,900 29,373,000 4T15.2
Expansion joint (A) Mov l.m 625 10,800 5,062,500 877,500 810,000 6,750,000 Rubber jointExpansion joint (B) Fix l.m 625 6,600 3,093,750 536,250 495,000 4,125,000 Seal jointMetaseall Bearing Each 200 100,000 11,000,000 3,000,000 6,000,000 20,000,000 Rmax=350Elastomeric Bearing Pad Each 5,800 0 0 0 0 45*55*5Pavement (wearing surface) Ton 4,312 1,800 5,264,952 797,720 1,914,528 7,977,200 T=7.5 cmPC I - Shape Girder1=30m Each 290,000 0 0 0 0PC Square Pile 45 cm * 45 cm l.m 3,800 0 0 0 0Concrete Bridge Railing l.m 0 1,840 0 0 0 0CCp Pile d=120 cm l.m 5,000 19,960 45,908,000 32,934,000 20,958,000 99,800,000
Total Cost 288,103,117 247,926,320 124,708,378 660,737,815Percentage (%) 43.6 37.5 18.9Cost per Square meter 26,430 US$ 660
TABLE 2.4ALT - 2 PC BOX GIRDER + STEEL RIGID PORTAL FRAME PIER
out put 1.0 kmCost Component
Price Component Unit QuantityUnitRate Foreign Local Tax
Total Cost(pesos)
Remarks
Structure Excavation Cu.m 15,480 210 1,625,400 812,700 812,700 3,250,800 Common soilConcrete 0 0 0 0
Class P Cu.m 13,823 22,500 108,856,125 149,288,400 52,872,975 311,017,500 Pc box girderClass A-1 Cu.m 6,000 0 0 0 0 Deck slabClass P-2 Cu.m 5,300 0 0 0 0 Pier head clnClass A-2 Cu.m 5,400 4,000 7,560,000 10,368,000 3,672,000 21,600,000 Pile capClass A-3 Cu.m 700 4,500 1,102,500 1,512,000 535,500 3,150,000 Parapet curb
Reinforcing Bar Kg. 2,246,260 35 35,378,595 34,592,404 8,648,101 78,619,100Pre-stressing Steel 0 0 0 0
Longitude Kg. 594,372 95 36,702,471 2,823,267 16,939,602 56,465,340 12T12.7Transversal Kg. 232,911 125 18,924,019 1,455,694 8,734,163 29,113,875 4T15.2
Expansion joint (A) Mov l.m 625 10,800 5,062,500 877,500 810,000 6,750,000 Rubber jointExpansion joint (B) Fix l.m 625 6,600 3,093,750 536,250 495,000 4,125,000 Seal jointMetal Bearing Each 200 100,000 11,000,000 3,000,000 6,000,000 20,000,000 Rmax=350Elastomeric Bearing Pad Each 5,800 0 0 0 0 45*55*5Pavement (wearing surface) Ton 4,312 1,850 5,264,952 797,720 1,914,528 7,977,200 T=7.5 cmPC I - Shape Girder1=30m Each 290,000 0 0 0 0PC Square Pile 45 cm * 45 cm l.m 3,800 0 0 0 0Concrete Bridge Railing l.m 0 1,840 0 0 0 0Structure Steel Ton 6,029 150,000 660,175,500 108,522,000 135,652,500 904,350,000 Portal frameCCp Pile d=150 cm l.m 5,000 24,272 55,825,600 40,048,800 25,485,600 121,360,000
Total Cost 950,571,412 354,634,735 262,572,669 1,567,778,815Percentage (%) 60.6 22.6 16.7Cost per Square meter 62,711 US$ 1557
METRO MANILA URBAN TRANSPORTATION INTEGRATION STUDY
TECHNICAL REPORT NO. 11 COST ESTIMATION AND DESIGN CRITERIA
2-4
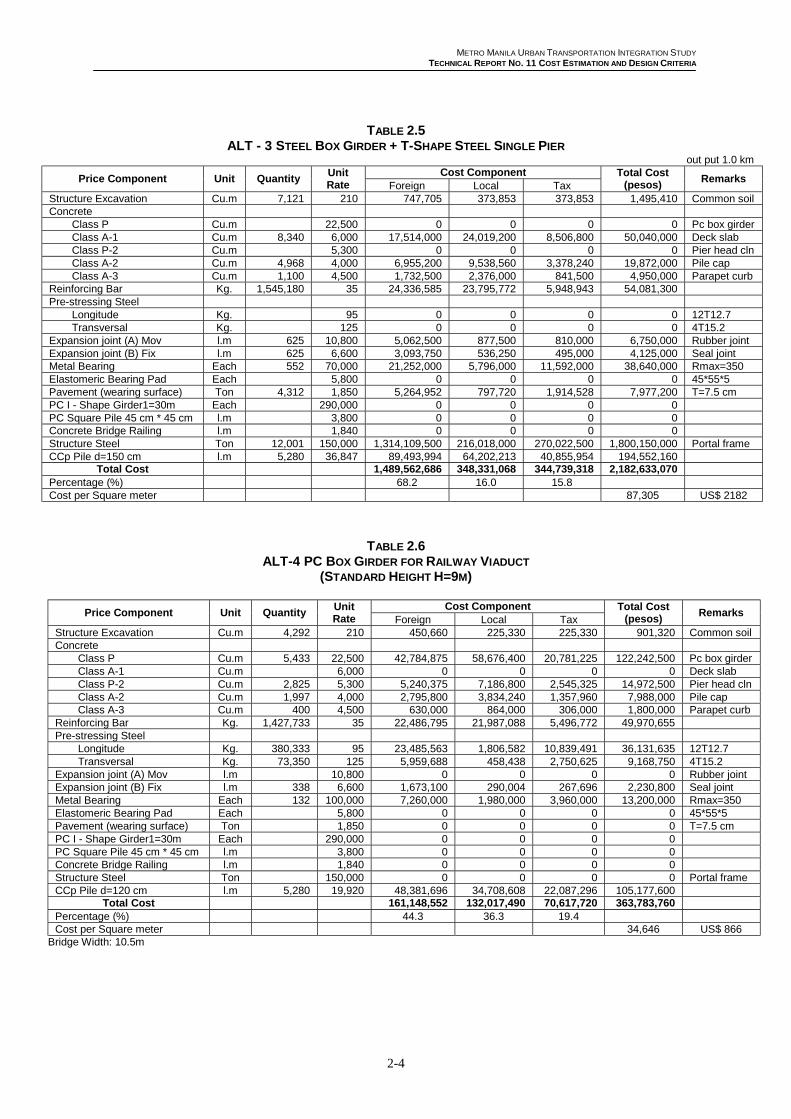
TABLE 2.5ALT - 3 STEEL BOX GIRDER + T-SHAPE STEEL SINGLE PIER
out put 1.0 kmCost Component
Price Component Unit QuantityUnitRate Foreign Local Tax
Total Cost(pesos)
Remarks
Structure Excavation Cu.m 7,121 210 747,705 373,853 373,853 1,495,410 Common soilConcrete 0 0 0 0
Class P Cu.m 22,500 0 0 0 0 Pc box girderClass A-1 Cu.m 8,340 6,000 17,514,000 24,019,200 8,506,800 50,040,000 Deck slabClass P-2 Cu.m 5,300 0 0 0 0 Pier head clnClass A-2 Cu.m 4,968 4,000 6,955,200 9,538,560 3,378,240 19,872,000 Pile capClass A-3 Cu.m 1,100 4,500 1,732,500 2,376,000 841,500 4,950,000 Parapet curb
Reinforcing Bar Kg. 1,545,180 35 24,336,585 23,795,772 5,948,943 54,081,300Pre-stressing Steel 0 0 0 0
Longitude Kg. 95 0 0 0 0 12T12.7Transversal Kg. 125 0 0 0 0 4T15.2
Expansion joint (A) Mov l.m 625 10,800 5,062,500 877,500 810,000 6,750,000 Rubber jointExpansion joint (B) Fix l.m 625 6,600 3,093,750 536,250 495,000 4,125,000 Seal jointMetal Bearing Each 552 70,000 21,252,000 5,796,000 11,592,000 38,640,000 Rmax=350Elastomeric Bearing Pad Each 5,800 0 0 0 0 45*55*5Pavement (wearing surface) Ton 4,312 1,850 5,264,952 797,720 1,914,528 7,977,200 T=7.5 cmPC I - Shape Girder1=30m Each 290,000 0 0 0 0PC Square Pile 45 cm * 45 cm l.m 3,800 0 0 0 0Concrete Bridge Railing l.m 1,840 0 0 0 0Structure Steel Ton 12,001 150,000 1,314,109,500 216,018,000 270,022,500 1,800,150,000 Portal frameCCp Pile d=150 cm l.m 5,280 36,847 89,493,994 64,202,213 40,855,954 194,552,160
Total Cost 1,489,562,686 348,331,068 344,739,318 2,182,633,070Percentage (%) 68.2 16.0 15.8Cost per Square meter 87,305 US$ 2182
TABLE 2.6ALT-4 PC BOX GIRDER FOR RAILWAY VIADUCT
(STANDARD HEIGHT H=9M)
Cost ComponentPrice Component Unit Quantity
UnitRate Foreign Local Tax
Total Cost(pesos)
Remarks
Structure Excavation Cu.m 4,292 210 450,660 225,330 225,330 901,320 Common soilConcrete 0 0 0 0
Class P Cu.m 5,433 22,500 42,784,875 58,676,400 20,781,225 122,242,500 Pc box girderClass A-1 Cu.m 6,000 0 0 0 0 Deck slabClass P-2 Cu.m 2,825 5,300 5,240,375 7,186,800 2,545,325 14,972,500 Pier head clnClass A-2 Cu.m 1,997 4,000 2,795,800 3,834,240 1,357,960 7,988,000 Pile capClass A-3 Cu.m 400 4,500 630,000 864,000 306,000 1,800,000 Parapet curb
Reinforcing Bar Kg. 1,427,733 35 22,486,795 21,987,088 5,496,772 49,970,655Pre-stressing Steel 0 0 0 0
Longitude Kg. 380,333 95 23,485,563 1,806,582 10,839,491 36,131,635 12T12.7Transversal Kg. 73,350 125 5,959,688 458,438 2,750,625 9,168,750 4T15.2
Expansion joint (A) Mov l.m 10,800 0 0 0 0 Rubber jointExpansion joint (B) Fix l.m 338 6,600 1,673,100 290,004 267,696 2,230,800 Seal jointMetal Bearing Each 132 100,000 7,260,000 1,980,000 3,960,000 13,200,000 Rmax=350Elastomeric Bearing Pad Each 5,800 0 0 0 0 45*55*5Pavement (wearing surface) Ton 1,850 0 0 0 0 T=7.5 cmPC I - Shape Girder1=30m Each 290,000 0 0 0 0PC Square Pile 45 cm * 45 cm l.m 3,800 0 0 0 0Concrete Bridge Railing l.m 1,840 0 0 0 0Structure Steel Ton 150,000 0 0 0 0 Portal frameCCp Pile d=120 cm l.m 5,280 19,920 48,381,696 34,708,608 22,087,296 105,177,600
Total Cost 161,148,552 132,017,490 70,617,720 363,783,760Percentage (%) 44.3 36.3 19.4Cost per Square meter 34,646 US$ 866
Bridge Width: 10.5m
METRO MANILA URBAN TRANSPORTATION INTEGRATION STUDY
TECHNICAL REPORT NO. 11 COST ESTIMATION AND DESIGN CRITERIA
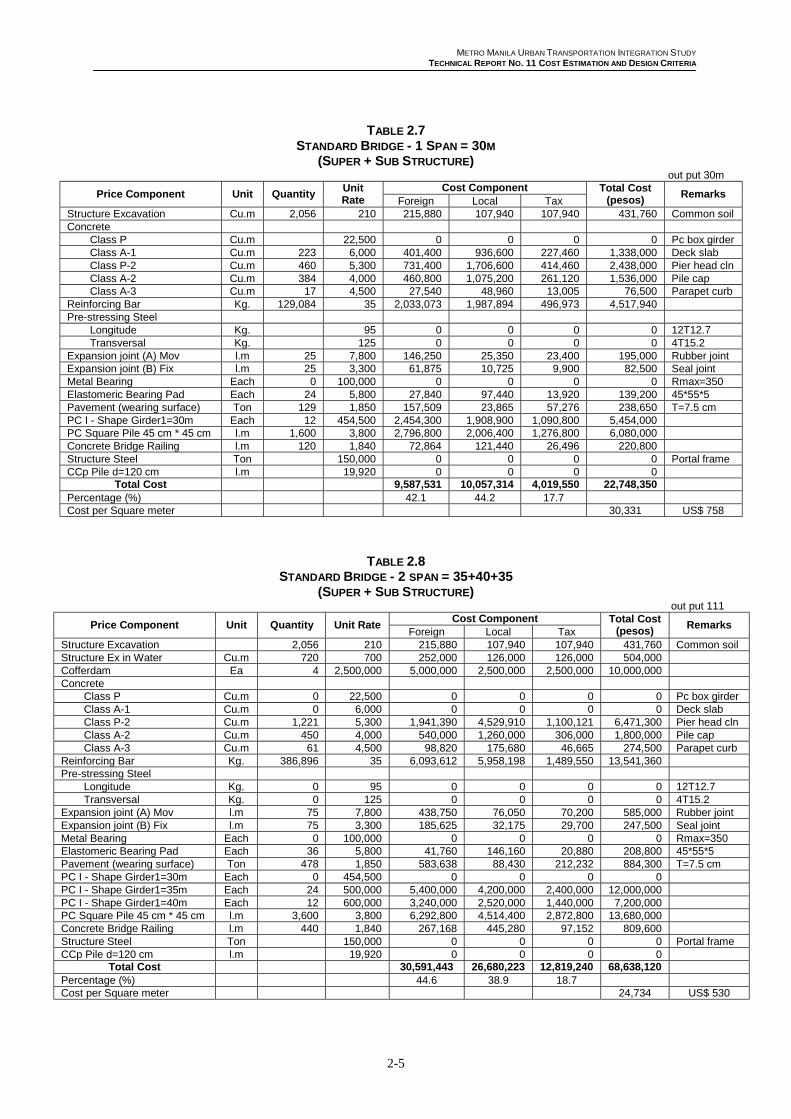
2-5
TABLE 2.7STANDARD BRIDGE - 1 SPAN = 30M
(SUPER + SUB STRUCTURE)out put 30m
Cost ComponentPrice Component Unit Quantity
UnitRate Foreign Local Tax
Total Cost(pesos)
Remarks
Structure Excavation Cu.m 2,056 210 215,880 107,940 107,940 431,760 Common soilConcrete 0 0 0 0
Class P Cu.m 22,500 0 0 0 0 Pc box girderClass A-1 Cu.m 223 6,000 401,400 936,600 227,460 1,338,000 Deck slabClass P-2 Cu.m 460 5,300 731,400 1,706,600 414,460 2,438,000 Pier head clnClass A-2 Cu.m 384 4,000 460,800 1,075,200 261,120 1,536,000 Pile capClass A-3 Cu.m 17 4,500 27,540 48,960 13,005 76,500 Parapet curb
Reinforcing Bar Kg. 129,084 35 2,033,073 1,987,894 496,973 4,517,940Pre-stressing Steel 0 0 0 0
Longitude Kg. 95 0 0 0 0 12T12.7Transversal Kg. 125 0 0 0 0 4T15.2
Expansion joint (A) Mov l.m 25 7,800 146,250 25,350 23,400 195,000 Rubber jointExpansion joint (B) Fix l.m 25 3,300 61,875 10,725 9,900 82,500 Seal jointMetal Bearing Each 0 100,000 0 0 0 0 Rmax=350Elastomeric Bearing Pad Each 24 5,800 27,840 97,440 13,920 139,200 45*55*5Pavement (wearing surface) Ton 129 1,850 157,509 23,865 57,276 238,650 T=7.5 cmPC I - Shape Girder1=30m Each 12 454,500 2,454,300 1,908,900 1,090,800 5,454,000PC Square Pile 45 cm * 45 cm l.m 1,600 3,800 2,796,800 2,006,400 1,276,800 6,080,000Concrete Bridge Railing l.m 120 1,840 72,864 121,440 26,496 220,800Structure Steel Ton 150,000 0 0 0 0 Portal frameCCp Pile d=120 cm l.m 19,920 0 0 0 0
Total Cost 9,587,531 10,057,314 4,019,550 22,748,350Percentage (%) 42.1 44.2 17.7Cost per Square meter 30,331 US$ 758
TABLE 2.8STANDARD BRIDGE - 2 SPAN = 35+40+35
(SUPER + SUB STRUCTURE)out put 111
Cost ComponentPrice Component Unit Quantity Unit Rate
Foreign Local TaxTotal Cost
(pesos)Remarks
Structure Excavation 2,056 210 215,880 107,940 107,940 431,760 Common soilStructure Ex in Water Cu.m 720 700 252,000 126,000 126,000 504,000Cofferdam Ea 4 2,500,000 5,000,000 2,500,000 2,500,000 10,000,000Concrete 0 0 0 0
Class P Cu.m 0 22,500 0 0 0 0 Pc box girderClass A-1 Cu.m 0 6,000 0 0 0 0 Deck slabClass P-2 Cu.m 1,221 5,300 1,941,390 4,529,910 1,100,121 6,471,300 Pier head clnClass A-2 Cu.m 450 4,000 540,000 1,260,000 306,000 1,800,000 Pile capClass A-3 Cu.m 61 4,500 98,820 175,680 46,665 274,500 Parapet curb
Reinforcing Bar Kg. 386,896 35 6,093,612 5,958,198 1,489,550 13,541,360Pre-stressing Steel 0 0 0 0
Longitude Kg. 0 95 0 0 0 0 12T12.7Transversal Kg. 0 125 0 0 0 0 4T15.2
Expansion joint (A) Mov l.m 75 7,800 438,750 76,050 70,200 585,000 Rubber jointExpansion joint (B) Fix l.m 75 3,300 185,625 32,175 29,700 247,500 Seal jointMetal Bearing Each 0 100,000 0 0 0 0 Rmax=350Elastomeric Bearing Pad Each 36 5,800 41,760 146,160 20,880 208,800 45*55*5Pavement (wearing surface) Ton 478 1,850 583,638 88,430 212,232 884,300 T=7.5 cmPC I - Shape Girder1=30m Each 0 454,500 0 0 0 0PC I - Shape Girder1=35m Each 24 500,000 5,400,000 4,200,000 2,400,000 12,000,000PC I - Shape Girder1=40m Each 12 600,000 3,240,000 2,520,000 1,440,000 7,200,000PC Square Pile 45 cm * 45 cm l.m 3,600 3,800 6,292,800 4,514,400 2,872,800 13,680,000Concrete Bridge Railing l.m 440 1,840 267,168 445,280 97,152 809,600Structure Steel Ton 150,000 0 0 0 0 Portal frameCCp Pile d=120 cm l.m 19,920 0 0 0 0
Total Cost 30,591,443 26,680,223 12,819,240 68,638,120Percentage (%) 44.6 38.9 18.7Cost per Square meter 24,734 US$ 530
METRO MANILA URBAN TRANSPORTATION INTEGRATION STUDY
TECHNICAL REPORT NO. 11 COST ESTIMATION AND DESIGN CRITERIA
2-6
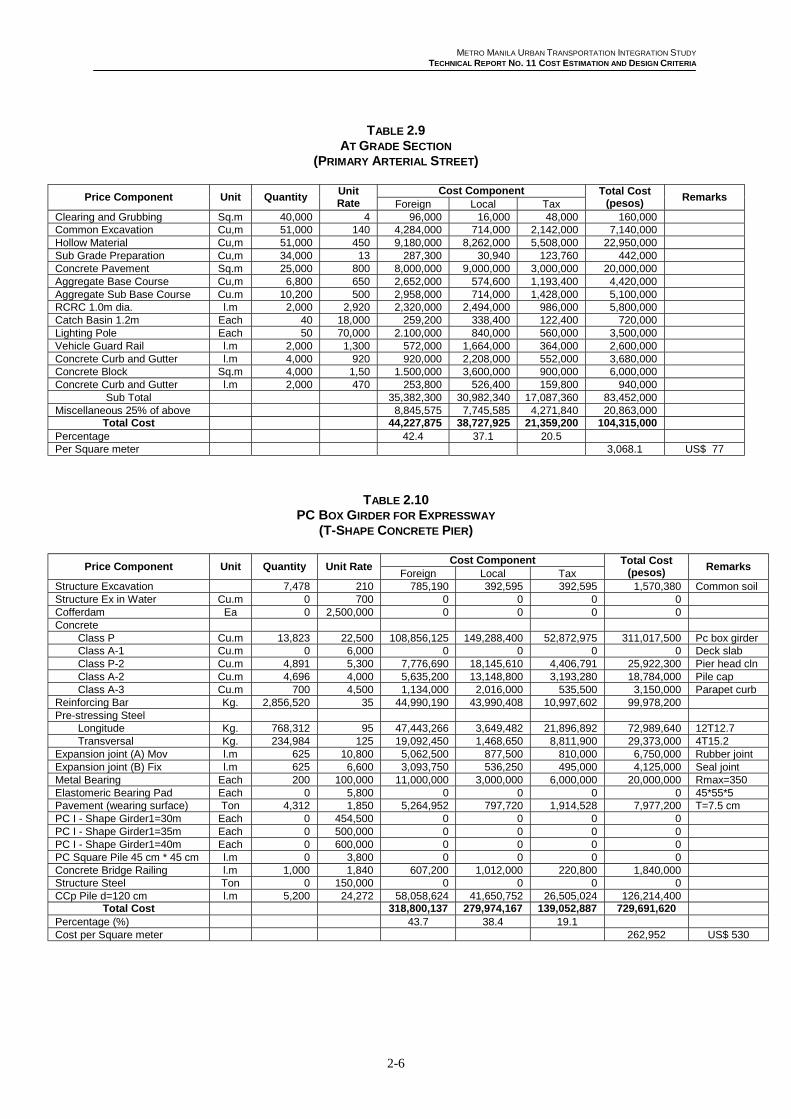
TABLE 2.9AT GRADE SECTION
(PRIMARY ARTERIAL STREET)
Cost ComponentPrice Component Unit Quantity
UnitRate Foreign Local Tax
Total Cost(pesos)
Remarks
Clearing and Grubbing Sq.m 40,000 4 96,000 16,000 48,000 160,000Common Excavation Cu,m 51,000 140 4,284,000 714,000 2,142,000 7,140,000Hollow Material Cu,m 51,000 450 9,180,000 8,262,000 5,508,000 22,950,000Sub Grade Preparation Cu,m 34,000 13 287,300 30,940 123,760 442,000Concrete Pavement Sq.m 25,000 800 8,000,000 9,000,000 3,000,000 20,000,000Aggregate Base Course Cu,m 6,800 650 2,652,000 574,600 1,193,400 4,420,000Aggregate Sub Base Course Cu.m 10,200 500 2,958,000 714,000 1,428,000 5,100,000RCRC 1.0m dia. l.m 2,000 2,920 2,320,000 2,494,000 986,000 5,800,000Catch Basin 1.2m Each 40 18,000 259,200 338,400 122,400 720,000Lighting Pole Each 50 70,000 2.100,000 840,000 560,000 3,500,000Vehicle Guard Rail l.m 2,000 1,300 572,000 1,664,000 364,000 2,600,000Concrete Curb and Gutter l.m 4,000 920 920,000 2,208,000 552,000 3,680,000Concrete Block Sq.m 4,000 1,50 1.500,000 3,600,000 900,000 6,000,000Concrete Curb and Gutter l.m 2,000 470 253,800 526,400 159,800 940,000
Sub Total 35,382,300 30,982,340 17,087,360 83,452,000Miscellaneous 25% of above 8,845,575 7,745,585 4,271,840 20,863,000
Total Cost 44,227,875 38,727,925 21,359,200 104,315,000Percentage 42.4 37.1 20.5Per Square meter 3,068.1 US$ 77
TABLE 2.10PC BOX GIRDER FOR EXPRESSWAY
(T-SHAPE CONCRETE PIER)
Cost ComponentPrice Component Unit Quantity Unit Rate
Foreign Local TaxTotal Cost
(pesos)Remarks
Structure Excavation 7,478 210 785,190 392,595 392,595 1,570,380 Common soilStructure Ex in Water Cu.m 0 700 0 0 0 0Cofferdam Ea 0 2,500,000 0 0 0 0Concrete 0 0 0 0
Class P Cu.m 13,823 22,500 108,856,125 149,288,400 52,872,975 311,017,500 Pc box girderClass A-1 Cu.m 0 6,000 0 0 0 0 Deck slabClass P-2 Cu.m 4,891 5,300 7,776,690 18,145,610 4,406,791 25,922,300 Pier head clnClass A-2 Cu.m 4,696 4,000 5,635,200 13,148,800 3,193,280 18,784,000 Pile capClass A-3 Cu.m 700 4,500 1,134,000 2,016,000 535,500 3,150,000 Parapet curb
Reinforcing Bar Kg. 2,856,520 35 44,990,190 43,990,408 10,997,602 99,978,200Pre-stressing Steel 0 0 0 0
Longitude Kg. 768,312 95 47,443,266 3,649,482 21,896,892 72,989,640 12T12.7Transversal Kg. 234,984 125 19,092,450 1,468,650 8,811,900 29,373,000 4T15.2
Expansion joint (A) Mov l.m 625 10,800 5,062,500 877,500 810,000 6,750,000 Rubber jointExpansion joint (B) Fix l.m 625 6,600 3,093,750 536,250 495,000 4,125,000 Seal jointMetal Bearing Each 200 100,000 11,000,000 3,000,000 6,000,000 20,000,000 Rmax=350Elastomeric Bearing Pad Each 0 5,800 0 0 0 0 45*55*5Pavement (wearing surface) Ton 4,312 1,850 5,264,952 797,720 1,914,528 7,977,200 T=7.5 cmPC I - Shape Girder1=30m Each 0 454,500 0 0 0 0PC I - Shape Girder1=35m Each 0 500,000 0 0 0 0PC I - Shape Girder1=40m Each 0 600,000 0 0 0 0PC Square Pile 45 cm * 45 cm l.m 0 3,800 0 0 0 0Concrete Bridge Railing l.m 1,000 1,840 607,200 1,012,000 220,800 1,840,000Structure Steel Ton 0 150,000 0 0 0 0CCp Pile d=120 cm l.m 5,200 24,272 58,058,624 41,650,752 26,505,024 126,214,400
Total Cost 318,800,137 279,974,167 139,052,887 729,691,620Percentage (%) 43.7 38.4 19.1Cost per Square meter 262,952 US$ 530
METRO MANILA URBAN TRANSPORTATION INTEGRATION STUDY
TECHNICAL REPORT NO. 11 COST ESTIMATION AND DESIGN CRITERIA
2-7
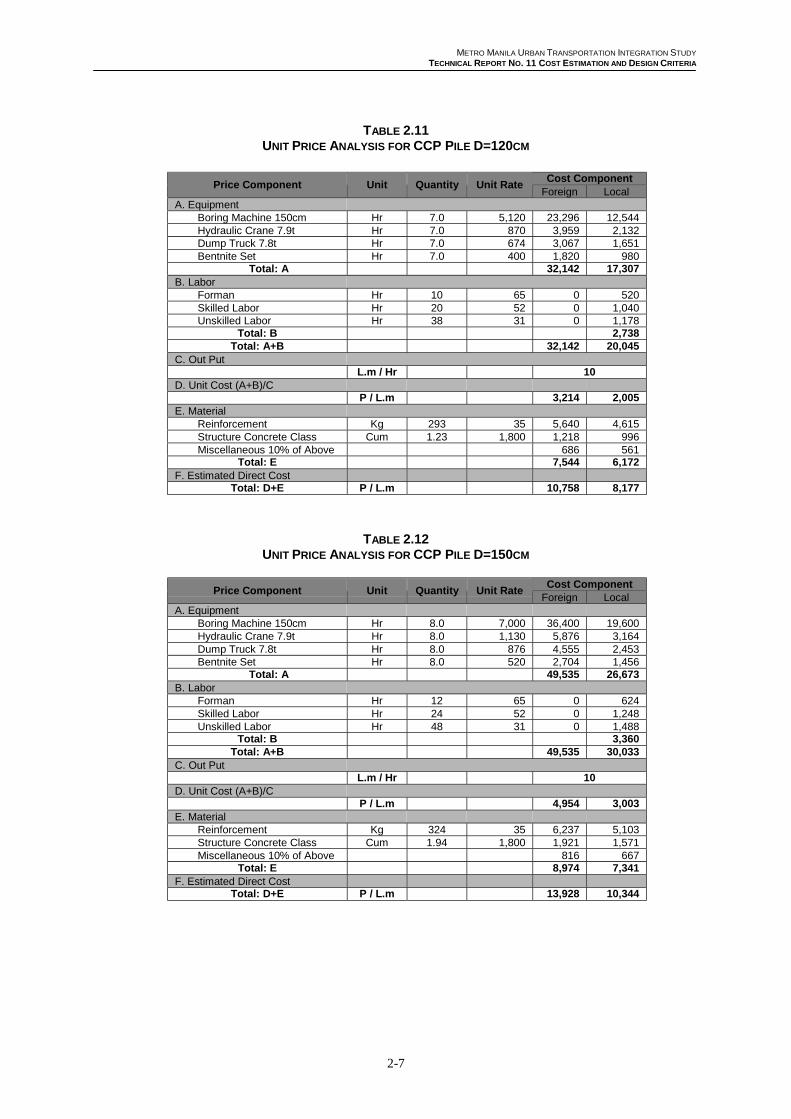
TABLE 2.11UNIT PRICE ANALYSIS FOR CCP PILE D=120CM
Cost ComponentPrice Component Unit Quantity Unit Rate
Foreign LocalA. Equipment
Boring Machine 150cm Hr 7.0 5,120 23,296 12,544Hydraulic Crane 7.9t Hr 7.0 870 3,959 2,132Dump Truck 7.8t Hr 7.0 674 3,067 1,651Bentnite Set Hr 7.0 400 1,820 980
Total: A 32,142 17,307B. Labor
Forman Hr 10 65 0 520Skilled Labor Hr 20 52 0 1,040Unskilled Labor Hr 38 31 0 1,178
Total: B 2,738Total: A+B 32,142 20,045
C. Out PutL.m / Hr 10
D. Unit Cost (A+B)/CP / L.m 3,214 2,005
E. MaterialReinforcement Kg 293 35 5,640 4,615Structure Concrete Class Cum 1.23 1,800 1,218 996Miscellaneous 10% of Above 686 561
Total: E 7,544 6,172F. Estimated Direct Cost
Total: D+E P / L.m 10,758 8,177
TABLE 2.12UNIT PRICE ANALYSIS FOR CCP PILE D=150CM
Cost ComponentPrice Component Unit Quantity Unit Rate
Foreign LocalA. Equipment
Boring Machine 150cm Hr 8.0 7,000 36,400 19,600Hydraulic Crane 7.9t Hr 8.0 1,130 5,876 3,164Dump Truck 7.8t Hr 8.0 876 4,555 2,453Bentnite Set Hr 8.0 520 2,704 1,456
Total: A 49,535 26,673B. Labor
Forman Hr 12 65 0 624Skilled Labor Hr 24 52 0 1,248Unskilled Labor Hr 48 31 0 1,488
Total: B 3,360Total: A+B 49,535 30,033
C. Out PutL.m / Hr 10
D. Unit Cost (A+B)/CP / L.m 4,954 3,003
E. MaterialReinforcement Kg 324 35 6,237 5,103Structure Concrete Class Cum 1.94 1,800 1,921 1,571Miscellaneous 10% of Above 816 667
Total: E 8,974 7,341F. Estimated Direct Cost
Total: D+E P / L.m 13,928 10,344
METRO MANILA URBAN TRANSPORTATION INTEGRATION STUDY
TECHNICAL REPORT NO. 11 COST ESTIMATION AND DESIGN CRITERIA
2-8
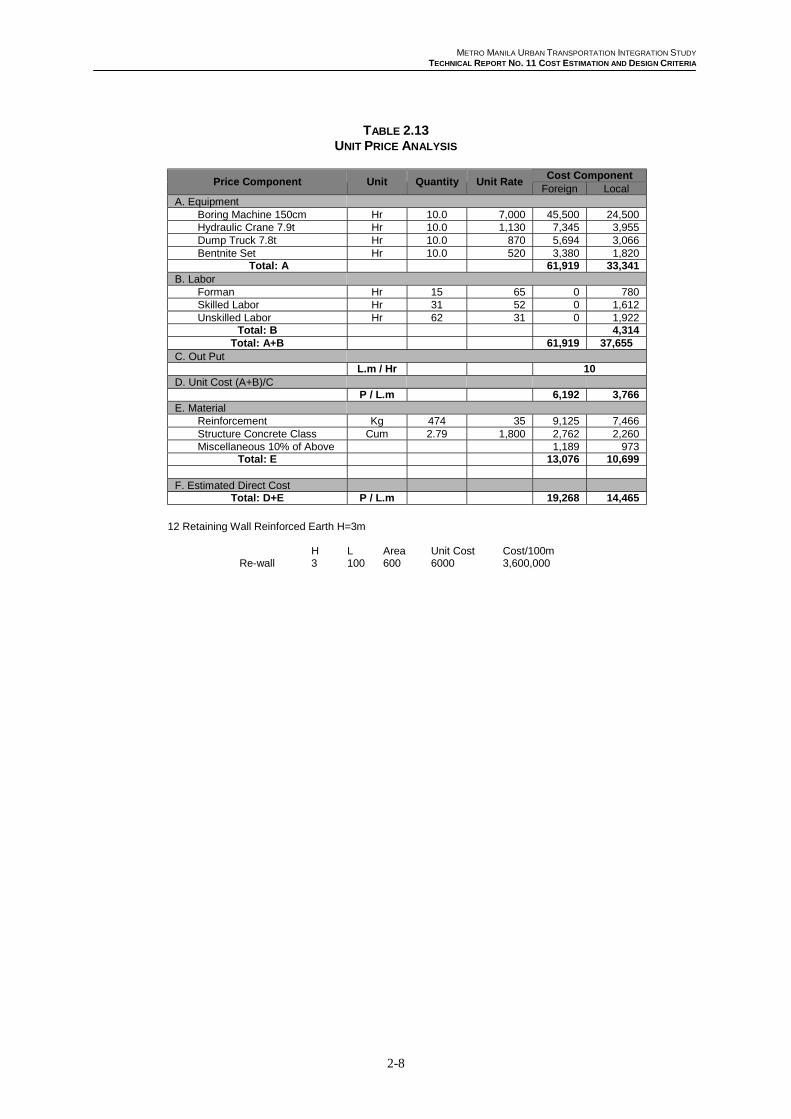
TABLE 2.13UNIT PRICE ANALYSIS
Cost ComponentPrice Component Unit Quantity Unit Rate
Foreign LocalA. Equipment
Boring Machine 150cm Hr 10.0 7,000 45,500 24,500Hydraulic Crane 7.9t Hr 10.0 1,130 7,345 3,955Dump Truck 7.8t Hr 10.0 870 5,694 3,066Bentnite Set Hr 10.0 520 3,380 1,820
Total: A 61,919 33,341B. Labor
Forman Hr 15 65 0 780Skilled Labor Hr 31 52 0 1,612Unskilled Labor Hr 62 31 0 1,922
Total: B 4,314Total: A+B 61,919 37,655
C. Out PutL.m / Hr 10
D. Unit Cost (A+B)/CP / L.m 6,192 3,766
E. MaterialReinforcement Kg 474 35 9,125 7,466Structure Concrete Class Cum 2.79 1,800 2,762 2,260Miscellaneous 10% of Above 1,189 973
Total: E 13,076 10,699
F. Estimated Direct CostTotal: D+E P / L.m 19,268 14,465
12 Retaining Wall Reinforced Earth H=3m
H L Area Unit Cost Cost/100mRe-wall 3 100 600 6000 3,600,000
METRO MANILA URBAN TRANSPORTATION INTEGRATION STUDY
TECHNICAL REPORT NO. 11 COST ESTIMATION AND DESIGN CRITERIA
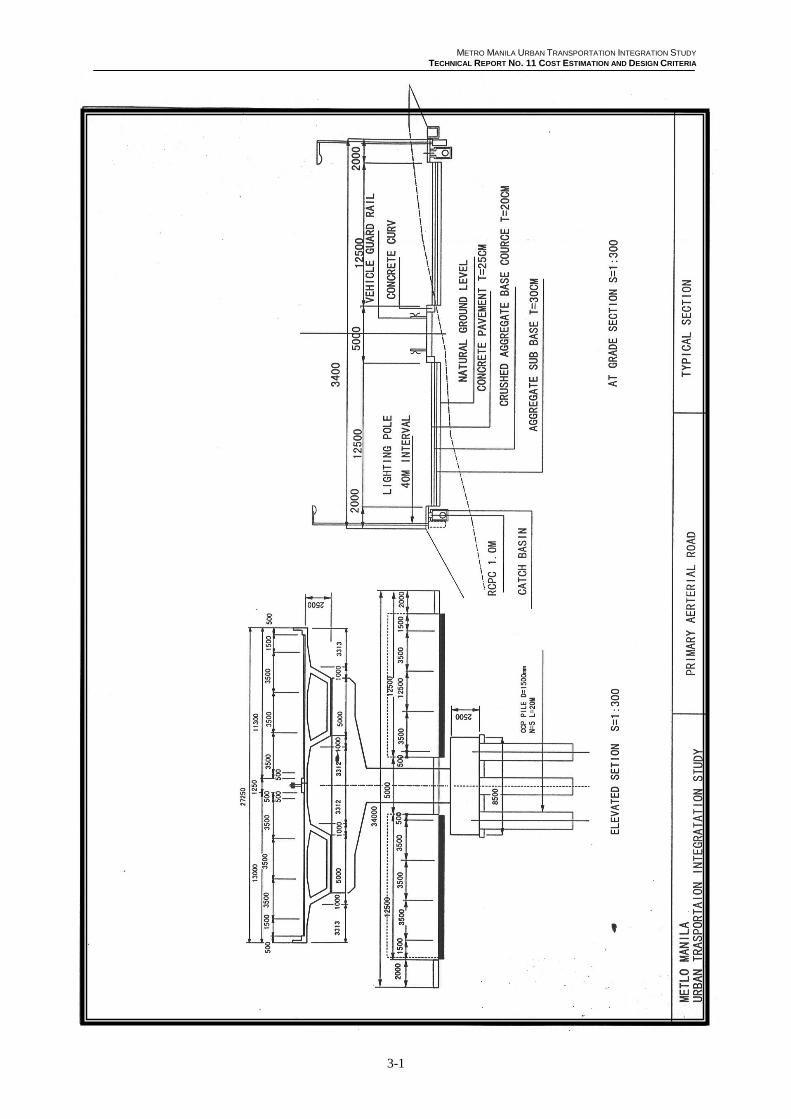
3-1
-
METRO MANILA URBAN TRANSPORTATION INTEGRATION STUDY
TECHNICAL REPORT NO. 11 COST ESTIMATION AND DESIGN CRITERIA
3-2
METRO MANILA URBAN TRANSPORTATION INTEGRATION STUDY
TECHNICAL REPORT NO. 11 COST ESTIMATION AND DESIGN CRITERIA
3-3
METRO MANILA URBAN TRANSPORTATION INTEGRATION STUDY
TECHNICAL REPORT NO. 11 COST ESTIMATION AND DESIGN CRITERIA
3-4