Correction of Conductance Measurements in Non-Space-Clamped
21
3508 Biophysical Journal Volume 84 June 2003 3508–3528 Correction of Conductance Measurements in Non-Space-Clamped Structures: 1. Voltage-Gated K 1 Channels Andreas T. Schaefer,* Moritz Helmstaedter,* Bert Sakmann,* and Alon Korngreen* y *Abteilung Zellphysiologie, Max-Planck-Institut fu ¨ r medizinische Forschung, D-69120 Heidelberg, Germany; and y Faculty of Life Sciences, Bar-Ilan University, Ramat-Gan 52900, Israel ABSTRACT To understand functions of a single neuron, such as propagation and generation of synaptic or action potentials, a detailed description of the kinetics and distribution of the underlying ionic conductances is essential. In voltage-clamp experiments, incomplete space clamp distorts the recorded currents, rendering accurate analysis impossible. Here, we present a simple numerical algorithm that corrects such distortions. The method performs a stepwise approximation of the conductance density at the site of a local voltage clamp. This is achieved by estimating membrane conductances in a simulation that yields simulated clamp currents, which are then fitted to the distorted recordings from the non-space-clamped structure, relying on accurately reconstructed cell morphology and experimentally determined passive properties. The method enabled accurate retrieval of the local densities, kinetics, and density gradients of somatic and dendritic channels. Neither the addition of noise nor variation of passive parameters significantly reduced the performance of the correction algorithm. The correction method was applied to two-electrode voltage-clamp recordings of K 1 currents from the apical dendrite of layer 5 neocortical pyramidal neurons. The generality and robustness of the algorithm make it a useful tool for voltage-clamp analysis of voltage-gated currents in structures of any morphology that is amenable to the voltage-clamp technique. INTRODUCTION Understanding the function of a single neuron requires quantitative description of the ionic channels it expresses. Such a description is usually achieved using the voltage- clamp technique (Hodgkin and Huxley, 1952). However, voltage-clamp recordings can only be properly analyzed in isopotential structures. Problems that occur upon incomplete space clamp have been addressed extensively (Armstrong and Gilly, 1992; Augustine et al., 1985; Johnston et al., 1996; Koch, 1999; Larsson et al., 1997; Major, 1993; Major et al., 1993; Mu ¨ ller and Lux, 1993; Rall et al., 1992; Rall and Segev, 1985; Spruston et al., 1993; White et al., 1995). Typically, voltage-clamp recordings from neurons are severely dis- torted, which makes it impossible to directly determine properties of ionic conductances, even for small neurons. So far, only a few theoretical and experimental techniques enable true voltage-clamp recordings from specific branched struc- tures either by analytical transformations (Cole and Curtis, 1941), or by recording conditions (Adrian et al., 1970; Augustine et al., 1985). Currently available reduced models only partially correct for space-clamp errors in somatic recordings of simple structures (Nadeau and Lester, 2000). Recently, there have been advancements in the visualiza- tion and recording from dendrites (Johnston et al., 1996; Stuart et al., 1997). So far, information on dendritic channels has mainly been obtained from excised or cell-attached patch-clamp recordings (Bekkers, 2000; Bischofberger and Jonas, 1997; Hoffman et al., 1997; Korngreen and Sakmann, 2000; Magee, 1999; Magee and Johnston, 1995; Stuart and Sakmann, 1994) and from dendrosomes (Benardo et al., 1982; Kavalali et al., 1997; Takigawa and Alzheimer, 1999). However, cell-attached and outside-out recordings are lab- orious, and due to small currents and high variability in patch area, a large number of recordings is necessary to obtain an accurate description of dendritic channel density in such systems. Here we present analytical, numerical, and experimental evidence, demonstrating that in general membrane conduc- tances can be calculated from clamp-current recordings of nonregenerative conductances in a nonisopotential structure. We developed a numerical algorithm that performs this calculation and tested it on simplified potassium-channel models with systematically varied model parameters, and on a variety of potassium-channel models taken from the literature. Distortions due to the lack of space clamp were clearly seen and corrected in simulations carried out with an unbranched cylindrical cable, as well as in the soma and apical dendrite of a computer-reconstructed, layer 5 (L5) neocortical pyramidal neuron. This required i), the knowl- edge of morphology and passive parameters, and ii), an ionic current with hyperpolarized reversal potential. To explore the locality of the method, the cylinder was equipped with channel-density steps and gradients of various slopes were inserted into the apical dendrite of a L5 pyramidal neuron. Limitations of the correction algorithm were assessed by testing its sensitivity to incomplete knowledge of passive parameters, incorrect morphological reconstruction, and ex- perimental noise. For voltage regions accessible to the activation voltage-clamp protocol, all channel parameters could be extracted faithfully under realistic conditions. In addition, the method was shown to be applicable to two- Submitted October 10, 2002, and accepted for publication December 23, 2002. Address reprint requests to Dr. Alon Korngreen, Faculty of Life Sciences, Bar-Ilan University, Ramat-Gan 52900, Israel. Tel.: 1972-3-5318224; Fax: 1972-3-5351824; E-mail: [email protected]. Ó 2003 by the Biophysical Society 0006-3495/03/06/3508/21 $2.00
Transcript of Correction of Conductance Measurements in Non-Space-Clamped

3508 Biophysical Journal Volume 84 June 2003 3508–3528
Correction of Conductance Measurements in Non-Space-ClampedStructures: 1. Voltage-Gated K1 Channels
Andreas T. Schaefer,* Moritz Helmstaedter,* Bert Sakmann,* and Alon Korngreen*y
*Abteilung Zellphysiologie, Max-Planck-Institut fur medizinische Forschung, D-69120 Heidelberg, Germany; andyFaculty of Life Sciences, Bar-Ilan University, Ramat-Gan 52900, Israel
ABSTRACT To understand functions of a single neuron, such as propagation and generation of synaptic or action potentials,a detailed description of the kinetics and distribution of the underlying ionic conductances is essential. In voltage-clampexperiments, incomplete space clamp distorts the recorded currents, rendering accurate analysis impossible. Here, we presenta simple numerical algorithm that corrects such distortions. The method performs a stepwise approximation of the conductancedensity at the site of a local voltage clamp. This is achieved by estimating membrane conductances in a simulation that yieldssimulated clamp currents, which are then fitted to the distorted recordings from the non-space-clamped structure, relying onaccurately reconstructed cell morphology and experimentally determined passive properties. The method enabled accurateretrieval of the local densities, kinetics, and density gradients of somatic and dendritic channels. Neither the addition of noisenor variation of passive parameters significantly reduced the performance of the correction algorithm. The correction methodwas applied to two-electrode voltage-clamp recordings of K1 currents from the apical dendrite of layer 5 neocortical pyramidalneurons. The generality and robustness of the algorithm make it a useful tool for voltage-clamp analysis of voltage-gatedcurrents in structures of any morphology that is amenable to the voltage-clamp technique.
INTRODUCTION
Understanding the function of a single neuron requires
quantitative description of the ionic channels it expresses.
Such a description is usually achieved using the voltage-
clamp technique (Hodgkin and Huxley, 1952). However,
voltage-clamp recordings can only be properly analyzed in
isopotential structures. Problems that occur upon incomplete
space clamp have been addressed extensively (Armstrong and
Gilly, 1992; Augustine et al., 1985; Johnston et al., 1996;
Koch, 1999; Larsson et al., 1997; Major, 1993; Major et al.,
1993; Muller and Lux, 1993; Rall et al., 1992; Rall and Segev,
1985; Spruston et al., 1993; White et al., 1995). Typically,
voltage-clamp recordings from neurons are severely dis-
torted, which makes it impossible to directly determine
properties of ionic conductances, even for small neurons. So
far, only a few theoretical and experimental techniques enable
true voltage-clamp recordings from specific branched struc-
tures either by analytical transformations (Cole and Curtis,
1941), or by recording conditions (Adrian et al., 1970;
Augustine et al., 1985). Currently available reduced models
only partially correct for space-clamp errors in somatic
recordings of simple structures (Nadeau and Lester, 2000).
Recently, there have been advancements in the visualiza-
tion and recording from dendrites (Johnston et al., 1996;
Stuart et al., 1997). So far, information on dendritic channels
has mainly been obtained from excised or cell-attached
patch-clamp recordings (Bekkers, 2000; Bischofberger and
Jonas, 1997; Hoffman et al., 1997; Korngreen and Sakmann,
2000; Magee, 1999; Magee and Johnston, 1995; Stuart and
Sakmann, 1994) and from dendrosomes (Benardo et al.,
1982; Kavalali et al., 1997; Takigawa and Alzheimer, 1999).
However, cell-attached and outside-out recordings are lab-
orious, and due to small currents and high variability in
patch area, a large number of recordings is necessary to
obtain an accurate description of dendritic channel density in
such systems.
Here we present analytical, numerical, and experimental
evidence, demonstrating that in general membrane conduc-
tances can be calculated from clamp-current recordings of
nonregenerative conductances in a nonisopotential structure.
We developed a numerical algorithm that performs this
calculation and tested it on simplified potassium-channel
models with systematically varied model parameters, and
on a variety of potassium-channel models taken from the
literature. Distortions due to the lack of space clamp were
clearly seen and corrected in simulations carried out with an
unbranched cylindrical cable, as well as in the soma and
apical dendrite of a computer-reconstructed, layer 5 (L5)
neocortical pyramidal neuron. This required i), the knowl-
edge of morphology and passive parameters, and ii), an ionic
current with hyperpolarized reversal potential. To explore
the locality of the method, the cylinder was equipped with
channel-density steps and gradients of various slopes were
inserted into the apical dendrite of a L5 pyramidal neuron.
Limitations of the correction algorithm were assessed by
testing its sensitivity to incomplete knowledge of passive
parameters, incorrect morphological reconstruction, and ex-
perimental noise. For voltage regions accessible to the
activation voltage-clamp protocol, all channel parameters
could be extracted faithfully under realistic conditions. In
addition, the method was shown to be applicable to two-
Submitted October 10, 2002, and accepted for publication December 23,2002.
Address reprint requests to Dr. Alon Korngreen, Faculty of Life Sciences,
Bar-Ilan University, Ramat-Gan 52900, Israel. Tel.: 1972-3-5318224; Fax:
1972-3-5351824; E-mail: [email protected].
� 2003 by the Biophysical Society
0006-3495/03/06/3508/21 $2.00
electrode voltage-clamp recordings from the apical dendrite
of L5 neocortical pyramidal neurons.
METHODS
Simulations
All simulations were carried out using NEURON 4.1.1, 4.3.2, and 5.0.0
(Hines and Carnevale, 1997) on a Silicon Graphics Origin 2000 or on
a Pentium III, 650 MHz. The integration time step used was 25 ms; changing
the time step did not alter the algorithm performance provided it stayed
smaller than the channel activation time constants. Potassium-channel
models were taken from the literature (for a full description see Appendix):
delayed rectifier Kv, (Mainen et al., 1995), muscarinic potassium channel
Km, (Mainen et al., 1995), A-type potassium channel Ka (Hoffman et al.,
1997), and two types of K1 channels (Kslow and Kfast), which we recently
described in neocortical pyramidal neurons (Korngreen and Sakmann,
2000). Simulation data were evaluated on a Macintosh Power PC G4 using
custom-written routines in IgorPro 4 (Wavemetrics; Lake Oswego, OR). The
unbranched cable (cylinder) had a diameter (d) of 3 mm and a length (l) of
2000 mm (Figs. 1, 4, 5 C and D, 6, 7, and 8). When comparison with
analytical calculations in an infinite cylinder was attempted during
simulations, a much longer cylinder was used to approximate this situation
(d¼ 2 mm and l¼ 50,000 mm, Figs. 2, 5 A and B, and 11). For determination
of morphological parameters, a L5 neocortical pyramidal neuron of a 48-
day-old Wistar rat was biocytin-filled, computer-reconstructed (except for
parts of the axonal arborization), and converted to the format of NEURON as
previously described (Stuart and Spruston, 1998). The passive parameters
were Ri ¼ 250 Vcm; Rm ¼ 20,000 Vcm2, and Cm ¼ 0.75 mF cm�2 with
a passive reversal potential of Eleak ¼ �65 mV and a potassium reversal
potential of Ek ¼ �80 mV, unless otherwise noted. All voltage-clamp
simulations used the built-in MOD file SEClmp.mod. Dendritic two-
electrode voltage-clamp configuration was simulated using the linear circuit
builder in NEURON 5.0.0. Simulated voltage protocols consisted of an 8–15
s prepulse of –110 mV to relieve channels from inactivation, followed by
a voltage step to the test potential. Series resistance was set to 10�5 V to
simulate an ideal voltage clamp. The total time necessary for correcting
a 100-ms voltage-clamp experiment in a full model of a layer 5 pyramidal
neuron sampled at 10 kHz was 6 h on a single processor of the SGI Origin
2000 and 8 h on the Pentium III PC.
Direct contributions of the passive membrane properties were accounted
for by simulating voltage-clamp experiments in morphologies that lack
active conductances. Subtraction of these latter traces from those simulated
in the presence of active conductances is referred to as leak subtraction.
Similar results have been obtained by scaling and subtraction of currents
from voltage steps to hyperpolarized potentials as performed experimentally
(Augustine et al., 1985). The code of the correction algorithm can be
downloaded from http://sun0.mpimf-heidelberg.mpg.de/~alon.
Slice preparation
Slices (sagittal, 300 mm thick) were prepared from the somatosensory cortex
of 40–45 days old Wistar rats using previously described techniques (Stuart
et al., 1993). Slices were perfused throughout the experiment with an
oxygenated artificial cerebrospinal solution containing: (mM) 125 NaCl, 15
NaCO3, 2.5 KCl, 1.25 NaH2PO4, 1 MgCl2, 2 CaCl2, 25 Glucose (pH 7.4
with 5% CO2, 310 mosmol kg�1) at room temperature (20–228C). Pyramidal
neurons from L5 in the somatosensory cortex were visually identified using
infrared differential interference contrast videomicroscopy (Stuart et al.,
1993).
Solutions and drugs
The standard pipette solution contained (mM): 125 K-gluconate, 20 KCl, 10
HEPES, 4 MgATP, 10 Na-phosphocreatin, 0.5 EGTA, 0.3 GTP, and 0.2%
biocytin (pH 7.2 with KOH, 312 mosmol kg�1). The bath solution for two-
electrode voltage-clamp experiments contained (mM) 125 NaCl, 15 NaCO3,
2.5 KCl, 1 MgCl2, 2 CoCl2, 25 Glucose, 0.03 ZD2788, 0.001 tetrodotoxin
(TTX pH 7.4 with 5% CO2, 308 mosmol kg�1). TTX (Tocris, Bristol, UK)
was stored at �208C as stock solutions in doubly distilled water and added
directly to the bath solution. ZD2788 (Tocris) was stored at 48C as stock
solutions in doubly distilled water and added directly to the bath solution.
Two-electrode voltage clamp
Dendritic two-electrode voltage-clamp recordings were made with an
Axoclamp-2B amplifier (Axon Instruments, Foster City, CA). Two HS-
2Ax0.1M headstages were used. Whole-cell recordings were performed
with two patch pipettes at a distance of 30–40 mm apart. Simulations have
shown that the accuracy and stability of the correction algorithm were not
affected by an interelectrode distance that was smaller than 50 mm (data not
shown). No series resistance compensation was used. Capacitive coupling
between the electrodes was minimized by placing a grounded shield that
extended almost to the bath fluid level between the electrodes. To increase
clamp gain, the feedback current injected via the current injecting electrode
was low pass filtered by a built-in filter of the Axoclamp-2B (phase-lag
control) with a time constant of 1–5 ms. Voltage and current were filtered at
10 kHz and sampled at 50 or 20 kHz using the program ‘‘Pulse’’ (Version
8.1, Heka Electronic, Lambrecht, Germany), digitized by an ITC-16
interface (Instrutech, Greatneck, NY, USA), and stored on the hard disk
of a Macintosh computer. Capacitive and leak currents were subtracted off-
line by scaling of pulses taken at hyperpolarized potentials. Patch pipettes
FIGURE 1 The space-clamp problem for a basic voltage-clamp protocol.
A voltage protocol of 8.4 s to �110 mV (truncated to facilitate presentation),
followed by a 25-ms pulse to voltages between �80 mV and 180 mV at 20
mV increments is shown in C. (A) The kinetics of the Kfast channel as it
would be recorded in an isopotential structure (short cylinder with length ¼50 mm and diameter ¼ 50 mm, left; density of Kfast was 30 pS/mm2). The
kinetics were distorted when recorded in an unbranched cable ((B) long
cylinder, length ¼ 2000 mm, diameter ¼ 3 mm; density of Kfast was 30 pS/
mm2). Conductance densities were estimated by assuming that the entire
membrane area contributed to the measured current (i.e., g ¼ Iclamp/((total
membrane area)�(Vclamp � E)). Note different scales.
Correcting Space Clamp in Dendrites 3509
Biophysical Journal 84(6) 3508–3528
(5–10 MV) were pulled from thick-walled borosilicate glass capillaries (2.0
mm outer diameter, 0.5 mm wall thickness, Hilgenberg, Malsfeld, Germany)
and were coated with Sylgard before the experiment. The distance of the
dendritic recording from the soma and the interelectrode distance was
measured from video pictures taken by a frame grabber.
Histology and morphology
At the end of the experiments, the slices were fixed in cold 100 mM
phosphate buffer (PBS, pH ¼ 7.4) containing 4% paraformaldehyde. After
fixation, the slices were incubated for 2 h in avidin-biotinilated horseradish
peroxidase (ABC Elite, Vector Laboratories, Peterborough, UK) and the
stain was developed using 0.015% diaminobenzidine. The slices were
mounted in Mowiol (Hoechst, Frankfurt, Germany) and stored at 48C. The
stained neurons were digitally traced using Neurolucida (MicroBrightField,
Colchester, VT, USA).
Passive membrane parameters
The passive membrane parameters (Rm, Ri, and Cm) were determined as
previously described (Roth and Hausser, 2001; Stuart and Spruston, 1998).
Briefly, before engaging the two-electrode voltage clamp, both electrodes
were in bridge mode of the Axoclamp-2B. In this configuration, a 0.5 ms
pulse of 0.5 nA of current was injected via one of the electrodes and the
voltage deflection was monitored by both electrodes. The passive membrane
properties were determined simultaneously by direct fitting of the average of
30 voltage traces measured in the same cell (Clements and Redman, 1989;
Roth and Hausser, 2001; Stuart and Spruston, 1998). The fitting was carried
out using NEURON by routines kindly provided by A. Roth (for details see
Roth and Hausser, 2001).
RESULTS
The voltage-clamp protocol routinely applied to measure
channel activation consists of a long prepulse to a hyper-
polarized voltage V0, which relieves voltage-gated channels
from inactivation, followed by steps to various voltages V1 at
which the channels activate (Fig. 1 C). In isopotential
structures, this yields current recordings that, upon process-
ing (i.e., leak subtraction, followed by division by the driving
force and membrane area), provide changes of conductance
density with time (Fig. 1 A). The resulting conductance
densities can then be fitted to a model (Hodgkin-Huxley or
other) that describes the kinetics of that channel. In
nonisopotential structures this procedure results in distorted
kinetics (Fig. 1 B) and also yields a poor prediction of
channel density (note different scales in Fig. 1, A and B) since
the contributing membrane area varies for different channel
types in an a priori unpredictable manner. Therefore in the
following, with the exception of Fig. 1, distorted currents
were not converted to conductance densities, but only dis-
played as conductance values with different scale bars.
The reverse problem in cable theory
Cable theory enables calculation of membrane currents in
an arbitrary voltage-clamp experiment when the geometry,
conductance-density distribution, and conductance kinetics
are known (Rall, 1959). However, when obtaining clamp
currents from voltage-clamp recordings, we are faced with
the reverse problem, namely to determine the conduc-
tance kinetics, distribution, and density from the recorded
currents. With a space-clamped structure, all the missing
kinetic parameters can usually be extracted directly from
the recorded currents, thus automatically solving the re-
verse problem, resulting in a full description of channel
kinetics.
However, with nonisopotential structures, solution of the
reverse problem is far from obvious. Our line of argument for
the solution of this problem is presented in Figs. 2–4 for time-
independent conductances of increasingly complex voltage
dependence. In general, the reverse problem is equivalent to
extracting multiple parameters (i.e., several gn(Vn) sufficient
to accurately describe the conductance g(V)) from multiple
measurements (i.e., the clamp currents In measured in various
voltage-clamp experiments). As shown below, this multipa-
rameter problem can be split into successive one-parameter
problems such that only one conductance gn at a time has to be
extracted from an appropriately chosen clamp-current re-
cording. As argued above, with the conductance gn known,
the clamp current I(gn) can be calculated by cable theory. If
this function is unique, it can be inverted, yielding gn(In), and
thus solving the reverse problem. In the one-parameter case,
monotonicity of the clamp current-conductance relation is
sufficient for the function I(gn) to be invertible.
Solving the reverse problem forsimple conductances
A conductance with a hyperpolarized reversal potential, such
as potassium, was distributed homogenously into a cylinder.
A voltage clamp was applied (Fig. 2, A and D) and the steady-
state situation was examined. First, a voltage-independent
conductance was studied (Fig. 2, A and B). The relation
between the measured clamp current Iclamp and the underlying
ohmic conductance g can be determined analytically by cable
theory as IclampðgÞ ¼ 2 � ðV � EKÞffiffiffiffiffiffiffiffiffig=Ri
pðpd3=2=2Þ (diam-
eter d, intracellular resistivityRi, and reversal potentialEk (see
Koch, 1999, chapter 2, adapted from Eq. 2.17)), which is
indeed monotonic for a given clamp voltage V (Fig. 2 C).
A slightly more complex conductance was examined in
Fig. 2 E: the conductance had a step dependence on voltage,
i.e., being constant up to a voltage V0 and constant again for
voltages larger than V0. Voltage clamping to voltages smaller
than V0 yields the same situation as in Fig. 2, A–C: The entire
cable was exposed to voltages more negative than V0 (Fig. 2
D), due to the assumption of a reversal potential at
hyperpolarized voltages. Since g(V) is constant throughout
the entire voltage range V \ V0, g is therefore in this
experiment constant throughout the entire cable (cf. Fig. 2 E).
Thus, g0 ¼ g(V, V # V0) can be uniquely determined from
a voltage-clamp experiment with a voltage step to V0 as
described above for a nonvoltage-dependent conductance. In
3510 Schaefer et al.
Biophysical Journal 84(6) 3508–3528

a second step, g1 ¼ g(V, V [ V0) can be extracted from
a voltage-clamp experiment to V1: Since g(V, V # V0) is
known from the first step, again only one parameter, g1,
remains to be determined. The relation between the clamp
current and the conductance g1 is again monotonic as shown
in the Appendix (Eqs. 1, 3, and 4, Fig. 2F). Therefore, also for
a one-step voltage-dependent conductance as in Fig. 2E, g(V)
can be calculated from the recorded clamp currents, solving
the reverse problem.
This argument can be extended to an arbitrary conduc-
tance g(V) as follows: First, consider a g(V) that is a multistep
function (‘‘staircase’’) with identical voltage stepwidth DV
FIGURE 2 The reverse problem in steady state. (A) A voltage-clamp experiment was simulated in a long cable (l ¼ 50,000 mm, d ¼ 2 mm). The voltage
attenuation in steady state is shown for a simulated voltage clamp to �20 mV in the middle of the cable with an ohmic membrane conductance of 30 pS/mm2
(B). (C) Increasing the ohmic membrane conductance increased the required clamp current. The solid line depicts the clamp current required in simulation. For
comparison, the analytical solution for an infinite cylinder with the same membrane properties is given in gray (see Appendix and Fig. 11). Comparison of the
calculated clamp current with a target clamp current (Iexp, dashed line) resulted in a unique estimate of the underlying membrane conductance (gest, dotted line).
D–F same as A–C except a voltage-dependent conductance was inserted. The membrane conductance was voltage-independent, g0 ¼ 5 pS/mm2 for voltages
V\�30 mV, and g1 ¼ 40 pS/mm2 for voltages V $ �30 mV. (F) Increasing g1, the membrane conductance for voltages V $ �30 mV, again increased
the required clamp current. The analytical solution for an infinite cylinder with the same membrane properties is given in gray (see Appendix and Fig. 11).
Correcting Space Clamp in Dendrites 3511
Biophysical Journal 84(6) 3508–3528

with N points (e.g., black line in the lower panel of Fig. 3 A).
Then we can argue the following regarding the correction of
one of the conductance steps (k).
At the first stage of the correction (k ¼ 1), assuming, that
g(V) is negligible for V\ V0, (e.g., as in Fig. 3 A for V0 \�80 mV) a voltage-clamp experiment with a voltage step to
V1 ¼ V0 1 DV will be faced with the same situation as in Fig.
2, D–F: Only one parameter has to be determined (that is the
conductance g1 ¼ g(V, V0 \ V # V1), as no voltages above
V1 occur and the conductance for voltages less than V0 is
known (i.e., assumed to be negligible). Since, as in Fig. 2,
D–F, the relationship between clamp current and g1 is
monotonic (see also Appendix), g1 can be determined
unambiguously, thus yielding g(V, V\ V1).
At the second stage of the correction (k ¼ 2), perform-
ing a voltage-clamp experiment to V2 ¼ V1 1 DV results
in a similar situation again: Only one parameter has to be
determined as V is more negative than V2 in the entire
structure (due to the assumption of a hyperpolarized
reversal potential) and g(V) is known for V \ V1. This
missing parameter is g2 ¼ g(V, V1 \ V # V2). Since the
clamp current-g2 relationship I(g2) is again monotonic (as
FIGURE 3 Proceeding of the correction algorithm. (A) Sketch of the proceeding for the correction of a Boltzmann activation curve in steady state. In the first
step, the conductance between �80 mV and �70 mV was varied (black arrow in the upper panel) to fit the ‘‘corrected clamp current’’ to the ‘‘experimentally
determined current’’ for a voltage-clamp experiment to �70 mV. This was repeated with successively higher voltage steps, until the estimated conductances
(black) reflected the actual activation curve (gray) across the entire voltage range of interest. (B) Flow chart of the proceeding of the correction algorithm. The
adjusting of g(V) occurs either in a ‘‘stepwise constant’’ (as in A) or stepwise linear approximation. In the former, g(V) ¼ ga for V0 � DV# V\V0; in the latter
g(V) ¼ gc 1 (V � V0 1 DV)/DV�(ga � gc) for V0 � DV# V\V0. In both cases, only ga is varied to fit the ‘‘corrected’’ to the ‘‘experimental’’ clamp current.
The flow chart describes the function of the entire algorithm including the correction over time. The rationale of the correction over time is described in Fig. 6.
Examples and NEURON code can be downloaded from http://sun0.mpimf-heidelberg.mpg.de/~alon.
3512 Schaefer et al.
Biophysical Journal 84(6) 3508–3528

in Fig. 2, cf. Appendix), g2 can be determined from the
clamp current, resulting in the knowledge of g(V) for all
voltages up to V2: g ¼ 0 for V # V0, g ¼ g1 for V0 \ V #
V1; g ¼ g2 for V1 \ V # V2. At this step, g is still
unknown for voltages above V2.
At the rest of the correction stages (2 \ k \ N),
continuing this procedure in steps of DV results in
a stepwise calculation of g(V) for all voltages of interest.
The conductance g(V, Vn�1 \ V # Vn) can be calculated
from a voltage step to a voltage Vn ¼ Vn�1 1 DV, relying
on the knowledge of g(V, V # Vn�1) from previous
calculation steps (see Fig. 3). Essentially every smooth
function g(V) can be approximated by a multistep
‘‘staircase’’ function with sufficiently small stepwidth
FIGURE 4 Correction of a K1 channel with a Boltzmann activation curve in steady state. (A and B) A voltage-clamp experiment was simulated in a cable (l¼ 2000 mm, d ¼ 3 mm). The clamp was inserted in the middle of the cable, and voltage steps from �110 mV to �80 mV, �70 mV . . .160 mV were applied.
The voltage-dependent membrane conductance was time-independent, and consisted of a single Boltzmann activation curve gðVÞ ¼ gmax=ð11 e�ðV�V1=2Þ=kÞ;V1/2 ¼�20 mV, gmax ¼ 30 pS/mm2, inverse slope k¼ 8 mV (dashed line). The solid line indicates the direct estimate of the activation curve from the distorted
clamp currents (clamp currents divided by the driving force). Note the shallow slope, lack of saturation at higher voltages, and different scales (nS versus pS/
mm2) since normalization to the membrane area was not possible. The parameter estimates were gmax ¼ 48 6 1 nS, V1/2 ¼ �14 6 0.8 mV, and inverse slope k
¼ 15.8 6 0.8 mV. The corrected conductance densities are depicted as triangles (gmax ¼ 30.3 6 0.1 pS/mm2, V1/2 ¼ �19.1 6 0.1 mV, inverse slope ¼ 8.2 6
0.1 mV). The voltage-clamp experiment was simulated for different slopes (C) and different V1/2 (D) of the Boltzmann activation curve. The three conductance
parameters that fully describe the conductance were calculated from a Boltzmann fit to the corrected conductance-voltage relation (triangles in B). Error bars
indicate the goodness of the Boltzmann fit depicted as standard deviation in fit parameters estimated from the residuals. The actual parameters of the underlying
conductances are shown as dashed lines.
Correcting Space Clamp in Dendrites 3513
Biophysical Journal 84(6) 3508–3528
DV. Thus, in approximation, the reverse problem in
a cylinder can be solved for any voltage-dependent
conductance (with little activation at hyperpolarized
potentials and a hyperpolarized reversal potential) by
applying successive voltage-clamp experiments and using
the data obtained from previous experiments to process
current recordings for higher voltages.
The correction algorithm
To implement the approximation technique described above,
we relied on i), accurate knowledge of passive properties
and morphology (discussed in detail below); ii), the ionic cur-
rent being nonregenerative (i.e., the reversal potential be-
ing below the region of activation for this channel—for
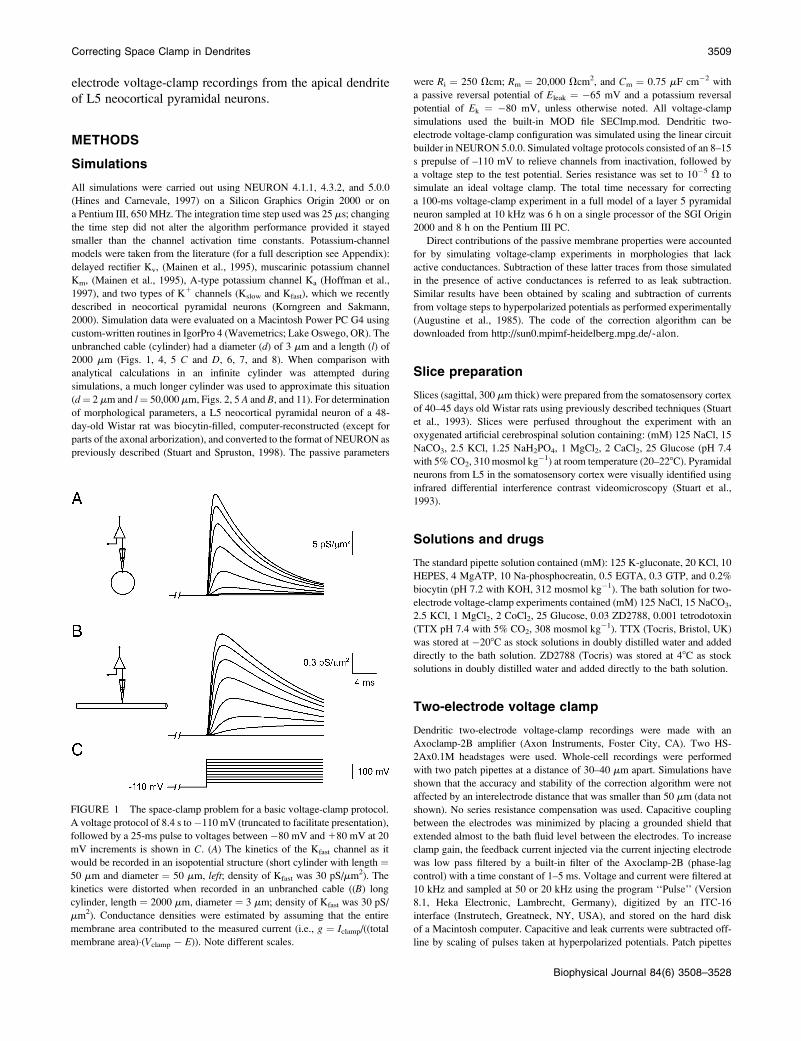
FIGURE 5 Spatial resolution. (A) A voltage-clamp experiment was simulated in a long cable as in Fig. 2. Distances were measured from the position of the
clamp. The cable was equipped with an ohmic conductance of gD ¼ 10 pS/mm2 for distances greater than l and gM ¼ 20 pS/mm2 around the clamp electrode.
(B) gD was decreased by 50%, and the ensuing change in the steady-state clamp current was calculated both analytically (gray line) and by simulation (black
dots) for various gD (see Appendix). This was repeated for three different distances l. Rside is the input resistance of the white cylinders, and R‘,middle the input
resistance of a semi-infinite cylinder with the properties of the middle, gray cylinder. Therefore, Rside=R‘;middle ¼ffiffiffiffiffiffiffiffiffiffiffiffiffiffigM=gD
p; lmiddle indicates the space constant
of the middle cylinder lmiddle ¼ffiffiffiffiffiffiffiffiffiffiffiffiffiffiffiffiffiffiffiffiffiffiffiffiffiffiffiffiffiffiffiffiffiffi1=ðRa � gMÞ � d=4
p. (C) A voltage-clamp experiment was simulated in a cable equipped with a Boltzmann-like conductance
as in Fig. 4. The conductance density, gmax(x), was g0 for x\1000 mm and g1 for x$ 1000 mm. For each position, the simulated clamp currents were corrected
assuming a homogenous conductance distribution. The corrected g(V) obtained was analyzed as in Fig. 4. Therefore, for each electrode position, three
parameters could be obtained, that attempt to fully describe the underlying voltage-dependent conductance. Error bars indicate the goodness of the Boltzmann
fit to the corrected conductance densities depicted as standard deviation in fit parameters. The estimate of the corrected conductance density (dots) deviates
from the actual step function (dashed line) and was fitted with a sigmoid (thin line). (D) Voltage-clamp experiment and correction were repeated for various
combinations of g0, g1, Ra, and Rm. The spatial resolution of the correction was calculated as the inverse slope parameter of the sigmoid. For every parameter
combination, the space constant lactive was determined as lactive ¼ffiffiffiffiffiffiffiffiffiffiffiffiffiffiffiffiffiffiffiffiffiffiffiffiffiffiffiffiffiffiffiffiffiffiffiffiffiffiffiffiffiffiffiffiffi1=ðRa � gMembraneÞ � d=4
p, with the membrane conductance gMembrane ¼
ð1=RmÞ=21 ðg0 1 g1Þ. Error bars indicate the goodness of the sigmoidal fit depicted as standard deviation in fit parameters.
3514 Schaefer et al.
Biophysical Journal 84(6) 3508–3528
simplicity, a potassium current with a hyperpolarized re-
versal potential was assumed); and iii), the conductance
being negligible at resting membrane conditions, so that g(V,
V\�80 mV) ¼ 0 could be assumed as a starting condition.
In the first step of the correction algorithm, the conductance
between �80 mV and �70 mV (that was assumed to be
constant throughout this voltage range) was determined from
the clamp current I1 obtained from a voltage-clamp protocol
stepping from �110 mV to �70 mV (see Fig. 1 C). This was
achieved by simulating the voltage-clamp experiment in the
given morphology with a time-independent potassium
conductance that was different from 0 (but constant g1) only
for voltages above �80 mV. The magnitude g1 of the po-
tassium conductance was varied systematically to minimize
the squared difference (Iclamp,simulated � Iexp,1)2 (using the
golden section algorithm (Press et al., 1992)).
In the next step, the conductance was now known between
�80 mV and �70 mV from the first correction step and
assumed constant again but yet unknown for the next voltage
region from �70 mV to �60 mV, in analogy to Fig. 2, D–F.
The conductance for this more depolarized voltage region
could again be obtained from the voltage-clamp data, this time
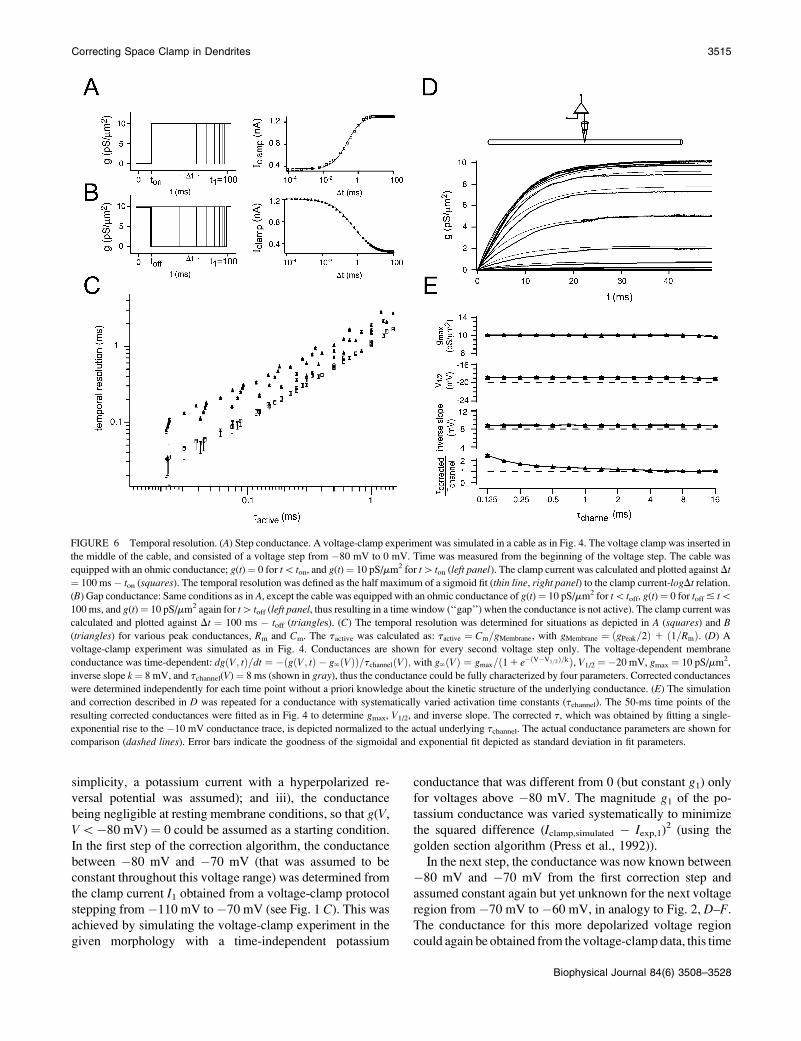
FIGURE 6 Temporal resolution. (A) Step conductance. A voltage-clamp experiment was simulated in a cable as in Fig. 4. The voltage clamp was inserted in
the middle of the cable, and consisted of a voltage step from �80 mV to 0 mV. Time was measured from the beginning of the voltage step. The cable was
equipped with an ohmic conductance; g(t) ¼ 0 for t\ ton, and g(t) ¼ 10 pS/mm2 for t[ ton (left panel). The clamp current was calculated and plotted against Dt
¼ 100 ms � ton (squares). The temporal resolution was defined as the half maximum of a sigmoid fit (thin line, right panel) to the clamp current-logDt relation.
(B) Gap conductance: Same conditions as in A, except the cable was equipped with an ohmic conductance of g(t) ¼ 10 pS/mm2 for t\ toff, g(t) ¼ 0 for toff # t\100 ms, and g(t) ¼ 10 pS/mm2 again for t[ toff (left panel, thus resulting in a time window (‘‘gap’’) when the conductance is not active). The clamp current was
calculated and plotted against Dt ¼ 100 ms � toff (triangles). (C) The temporal resolution was determined for situations as depicted in A (squares) and B
(triangles) for various peak conductances, Rm and Cm. The tactive was calculated as: tactive ¼ Cm=gMembrane, with gMembrane ¼ ðgPeak=2Þ 1 ð1=RmÞ. (D) A
voltage-clamp experiment was simulated as in Fig. 4. Conductances are shown for every second voltage step only. The voltage-dependent membrane
conductance was time-dependent: dgðV; tÞ=dt ¼ �ðgðV; tÞ � g‘ðVÞÞ=tchannelðVÞ; with g‘ðVÞ ¼ gmax=ð11 e�ðV�V1=2Þ=kÞ, V1/2 ¼ �20 mV, gmax ¼ 10 pS/mm2,
inverse slope k¼ 8 mV, and tchannel(V) ¼ 8 ms (shown in gray), thus the conductance could be fully characterized by four parameters. Corrected conductances
were determined independently for each time point without a priori knowledge about the kinetic structure of the underlying conductance. (E) The simulation
and correction described in D was repeated for a conductance with systematically varied activation time constants (tchannel). The 50-ms time points of the
resulting corrected conductances were fitted as in Fig. 4 to determine gmax, V1/2, and inverse slope. The corrected t, which was obtained by fitting a single-
exponential rise to the �10 mV conductance trace, is depicted normalized to the actual underlying tchannel. The actual conductance parameters are shown for
comparison (dashed lines). Error bars indicate the goodness of the sigmoidal and exponential fit depicted as standard deviation in fit parameters.
Correcting Space Clamp in Dendrites 3515
Biophysical Journal 84(6) 3508–3528

using the recorded clamp current I2 for a voltage step from
�110 mV to �60 mV. Again, simulations of the voltage-
clamp experiment were performed in the given morphology
with the potassium conductance g¼ 0 (for V#�80 mV); g¼g1 (for �80 mV\V#�70 mV), and g¼ variable (for �70
mV\V#�60 mV; higher voltages did not occur due to the
assumption of a hyperpolarized reversal potential). To obtain
g2¼ g(V,�70 mV\V#�60 mV), it was varied to minimize
the difference (Iclamp,simulated � Iexp,2)2.
This process was continued in 10 mV steps until the entire
activation curve g(V) of the conductance was retrieved by this
approximation technique (Fig. 3 A). In the following, the
accuracy was increased by replacing the stepwise constant
approximation with a stepwise linear approximation of the
conductance (see also legend to Fig. 3B and Appendix). As the
voltage profile narrowed with increasing voltage, the step size
was increased to 20 mV for (V�Ek)[80 mV, i.e.,V[0 mV.
In general, rather than correcting distorted clamp currents,
then converting the corrected current to a conductance and
finally to a conductance density, the algorithm is used to
directly estimate the conductance density to fit the resulting
clamp currents to the ‘‘experimentally recorded’’ ones.
FIGURE 7 Effects of noise and incomplete knowledge of passive parameters on performance of the correction algorithm. (A) A cylinder was prepared as in
Fig. 6 D; conductance parameters were V1/2 ¼ �20 mV, gmax ¼ 10 pS/mm2, inverse slope ¼ 8 mV, and tchannel ¼ 7 ms. A voltage-clamp experiment was
simulated, and random Gaussian noise added (10 pA rms) to the simulated currents. The corrected conductance estimate was plotted (thin lines) and compared
to the true conductance (thick lines). (B) Noise of increasing magnitude was added to the recordings. The resulting corrected conductances were analyzed as
described for Fig. 6 D and compared to the actual conductance parameters (dashed lines). (C–F) During the correction, passive parameters were changed in
comparison to the simulated experiment, as indicated by the ‘‘% error’’, to emulate inaccurate knowledge of the underlying parameters. Conductance
parameters were calculated from the corrected conductances as described for Fig. 6 D and compared to the actual conductance parameters (dashed line). Note
the different scales for the channel parameter errors in C compared to D–F.
3516 Schaefer et al.
Biophysical Journal 84(6) 3508–3528

FIGURE 8 Space-clamp distortions
and corrections for realistic potassium
conductances in a cable. The uncor-
rected currents were simulated as in
Fig. 4, with 30 pS/mm2 of Kfast, 10 pS/
mm2 of Km, 30 pS/mm2 of Kslow, 100
pS/mm2 of Kv, and 100 pS/mm2 of Ka.
The prepulse (for 8.4 s to –110 mV)
was truncated to facilitate presentation.
The current was corrected for the
passive leak, and converted to a con-
ductance by dividing by the driving
force (A, black lines). The conductance-
density estimates obtained with the
correction algorithm are displayed as
blue lines. For comparison, the true
kinetics are shown as red lines in all
panels. Scale bars apply to the (un-
corrected) conductance in the left panel
(conductance in nS), and to the true
kinetics and corrected traces (conduc-
tance density in pS/mm2). (B) Cables as
in A were prepared with different
conductance densities (Kfast: 3, 10,
and 30 pS/mm2; Km: 1, 3, and 10 pS/
mm2; Kslow: 3, 10, and 30 pS/mm2; Kv:
10, 30, and 100 pS/mm2; and Ka: 10,
30, and 100 pS/mm2). Peak conductan-
ces were calculated from the corrected
kinetics, normalized to the value at 160
mV, and shown as blue markers in B for
the three conductance densities (low
(open squares), medium (open trian-
gles), and high (solid diamonds)). The
uncorrected conductances are shown in
black symbols similar to those used to
describe the corrected conductance.
The red lines were calculated directly
from the original kinetics (Kfast: 5 pS/
mm2; Km: 10 pS/mm2; Kslow: 5 pS/mm2;
Kv: 100 pS/mm2; and Ka: 100 pS/mm2).
The pseudo-steady-state approach was
modified for these simulations by
replacing the constant, time-indepen-
dent conductance model with a mono-
exponential one. The necessary time
constants (t) were roughly estimated as
the rise time of the distorted clamp-
current recordings (half the time in
which 86% of the peak current was
reached). Changing t up to 10-fold did
not significantly alter the correction
result.
Correcting Space Clamp in Dendrites 3517
Biophysical Journal 84(6) 3508–3528
Testing the algorithm
To test the algorithm, we used known conductances to obtain
simulated voltage-clamp currents, distorted by a lack of space
clamp. Here, the term ‘‘simulated currents/conductances’’
refers to these currents, and the term ‘‘corrected currents/
conductances’’ describes currents/conductances generated
by the correction algorithm. It has to be emphasized that the
simulated currents were analyzed by the correction algorithm
without any prior knowledge of the kinetics or distribution of
the conductance that had been used to generate them.
First, a simple time-independent potassium conductance
was implemented in an unbranched cable (Fig. 4 A). Its
Boltzmann activation curve is depicted in Fig. 4 B (dashedline; gmax ¼ 30 pS/mm2, V1/2 ¼ �20 mV, inverse slope ¼ 8
mV). Direct estimation of the activation parameters from
the distorted clamp-current recording (solid line in Fig. 4 B)
yielded a shallow slope and no saturation at high voltages.
However, the correction algorithm accurately retrieved the
activation parameters: gmax ¼ 30.3 6 0.1 pS/mm2, V1/2 ¼�19.1 6 0.1 mV, inverse slope ¼ 8.2 6 0.1 mV. The range
of parameters that can be accurately retrieved was assessed
systematically by varying the slope and V1/2 of the
activation curve (Fig. 4, C and D, respectively). Steep
activation curves yielded increasingly worse fits for inverse
slopes smaller than 2 mV (i.e., 25–75% activation within 4
mV). For shallow activation curves with inverse slopes[32
mV, a decrease of the accuracy of the fit was observed as
a result of significant activation at the starting potential (V¼ –80 mV). When V1/2 was varied (Fig. 4 D), accurate
values for all Boltzmann parameters were retrieved for V1/2
[ �40 mV. For smaller values of V1/2, once again
significant activation at –80 mV resulted in deviations
from the original Boltzmann activation curve. Similar
results were obtained with a nonmonotonic conduct-
ance-voltage relation gðVÞ ¼ 10 ps=mm2=ð11 expððV1
10 mVÞ=20 mVÞ2Þ (data not shown).
These findings indicate that our correction algorithm is
capable of extracting steady-state activation parameters in a
non-space-clamped situation for all but extremely steeply
activating channels or those with a substantial activation at
rest. Thus, the algorithm can in principle solve the reverse
problem.
Spatial resolution of the algorithm
In realistic situations, the membrane properties are neither
known completely nor necessarily homogenous. Thus, we
investigated whether i), distal regions of unknown structure
affect the precision of the algorithm, and whether ii), the
obtained activation curve reflects local membrane properties
or rather some average across parts of the structure.
These concerns were assessed by first studying the influ-
ence of changes in distal membrane properties on clamp-
current recordings (see Fig. 5, A and B, and Appendix). A
cylinder was divided into a middle region and two distal ones
(Fig. 5 A). For simplicity, these cylindrical regions were
modeled with constant membrane conductances gM and gD,
respectively. Then, gD was varied and the relative change in
Iclamp was noted for different gM/gD (or Rside/R‘,middle, cf.
Appendix) ratios. Even when the distal region was as close as
ð1=2Þlmiddleðlmiddle ¼ffiffiffiffiffiffiffiffiffiffiffiffiffiffiffiffiffiffiffiffiffiffiffiffiffiffiffiffiffiffiffiffiffiffiffiffiffið1=Ri � gMÞ � ðd=4Þ
pÞ, 50% changes
of the distal membrane conductance gD did not alter Iclamp by
more than 12% (Fig. 5 B, middle trace). The alteration of
Iclamp was most prominent for situations where gD approx-
imately equaled gM (Fig. 5 B).
In addition, a spatial conductance step was implemented in
a cylinder. The simulated clamp currents at various positions
(Fig. 5 C) were corrected without any a priori assumptions
about the channel distribution. Since channel distributions
are in general not known in an experimental situation,
a homogenous channel distribution was assumed for cor-
rection of the individual recordings at different positions.
The corrected conductance parameters for a conductance
step from 3 to 30 pS/mm2 at various positions are depicted in
Fig. 5 C: Both V1/2 and the inverse slope of the activation
curve were retrieved accurately throughout the cylinder.
Deviations from the actual values (dashes) were small and
occurred primarily close to the conductance step. The con-
ductance density was retrieved as a sigmoid, whose inverse
slope indicated the spatial resolution of the correction
algorithm. Repetition of this simulation and correction
procedure for various conductance densities and passive
parameters showed the dependence of the resolution on the
‘‘active space constant’’, lactive. This term refers to the
apparent space constant when voltage-gated channels are
open, lactive ¼ffiffiffiffiffiffiffiffiffiffiffiffiffiffiffiffigpas=gact
p� lpas. For Rm ¼ 30,000 Vcm2
(gpas ¼ 0.33 pS/mm2) and gact ¼ 30 pS/mm2, lactive �ffiffiffiffiffiffiffiffiffi0:01
p� lpas; which is only 10% of the passive space
constant. Thus, information obtained was averaged over
a small region that extended only on the order of lactive
around the recording electrode (Fig. 5 D).
Temporal resolution of the algorithm
The applicability of the algorithm to non-steady-state sit-
uations was tested by studying the sensitivity of clamp-
current recordings to temporal changes in channel activation,
and in addition by correcting clamp-current recordings from
potassium channels with various activation times. For the
non-steady-state case, we have to assume a kinetic model for
the time course of g(V,t), this model being as simple as
possible. Therefore, clamp currents recorded during activa-
tion of voltage-gated channels were corrected independently
for every time point t1: For each t1, we assumed a simple
kinetic ‘‘model’’ g ¼ const for all times less than t1 and
approximated the voltage-dependent conductance g(V) to
fit the corrected clamp current at time t1 to the simulated
current, thus obtaining the activation curve at time t1: g(V,t1).
3518 Schaefer et al.
Biophysical Journal 84(6) 3508–3528

This was repeated independently for each time point to yield
the complete activation kinetics g(V,t) as outlined in Fig. 3.
To assess the errors made by this ‘‘pseudo-steady-state’’
approach, the dependence of the clamp current on the recent
history of the membrane conductance was examined. A
voltage clamp with a voltage step from �80 mV to 0 mV at
t ¼ 0 was performed, and the clamp current was measured at
t1 ¼ 100 ms. Then a constant membrane conductance was
implemented in the cylinder and switched on at varying
times ton, 0\ ton\ t1 (Fig. 6 A). This conductance made the
clamp current change as a function of Dt ¼ t1 � ton. The half
maximum of a log-sigmoid fit to Iclamp(Dt) yielded a measure
of the temporal resolution (‘‘memory’’) of the clamp-current
recording. The same procedure was applied to a conductance
that was initially on, switched off at varying times toff, and on
again at t1 ¼ 100 ms (Fig. 6 B), and to a conductance that
increased linearly from 0 at time ton to a maximum value at t1¼ 100 ms (data not shown). The dependence of the temporal
resolution of the system on the apparent membrane time
constant upon activation of all conductances (active mem-
brane time constant: tactive, cf. legend to Fig. 6) is shown in
Fig. 6 C.
Active time constants are usually small (tactive � 300 ms
for a conductance with a density of 30 pS/mm2), which
encouraged us to take the approach described above, i.e.,
not to assume a special kinetic model for the underly-
ing conductances, but rather to fit every time point indepen-
dently with a time-independent conductance. The fitted
conductance is expected to reflect the time course of the
actual underlying conductance with an accuracy of about
tactive.
The validity of this ‘‘pseudo-steady-state’’ approach was
further assessed by implementing a simplified potassium-
channel model in a cable (Fig. 6 D). This channel model
consisted of one activation particle with a voltage-inde-
pendent activation time (tchannel ¼ 8 ms) and a first-order
steady-state activation model as in Fig. 4 (gmax ¼ 10 pS/
mm2, V1/2 ¼ �20 mV, inverse slope ¼ 8 mV). Channel
kinetics directly estimated from the simulated distorted
clamp currents deviated from the actual values (V1/2 ¼�12.8 6 0.8 mV, inverse slope ¼ 15.6 6 0.7 mV, tchannel
¼ 10.4 6 0.1 ms; tchannel was determined for the voltage
step to �10 mV). In contrast, by using the correction
algorithm, the channel parameters could be retrieved
accurately (gmax ¼ 10.10 6 0.04 pS/mm2, V1/2 ¼ –18.7
6 0.2 mV; inverse slope ¼ 8.9 6 0.2 mV and tchannel ¼8.8 6 0.4 ms). Variation of tchannel indicated that, for all
activation time constants, the steady-state parameters were
determined correctly (Fig. 6 E). However, estimation of the
channel activation time was less precise for fast channels
(tchannel \ 300 ms), which confirmed the prediction based
on Fig. 6 C. Higher or lower channel densities (from 1 to
1000 pS/mm2) or membrane resistances (from 2000 to
128,000 Vcm2) did not influence algorithm performance
(not shown).
Sensitivity and numerical stability
The algorithm, due to its structure, cannot be tested an-
alytically for numerical stability. Therefore, stability was
tested by adding various white noise levels to a simulated
current recording from a cylinder with a simple underlying
conductance (Fig. 7 A; gmax ¼ 10 pS/mm2, V1/2 ¼ �20 mV,
inverse slope ¼ 8 mV, tchannel ¼ 7 ms). The corrected
conductance density for a noise level with root mean square
(rms) of 10 pA (;1% of steady-state current at 0 mV) is
depicted in Fig. 7 A. The original kinetics were easily
retrieved. The activation curve was markedly distorted only
for noise levels above 100 pA rms. (Fig. 7 B). Thus, for
experimentally observed noise levels numerical stability of
the algorithm can be obtained.
The sensitivity of the correction algorithm to morpholog-
ical and electrical parameters was also examined. Recordings
from a cylinder, equipped with the same conductance as
in Fig. 7 A, were made with the same passive parameters
as described above. However, for the correction algorithm,
passive parameters were modified, thus simulating an in-
correct estimate of the true passive parameters. Global in-
creases or decreases in the diameter of the cylinder were used
to simulate incorrect morphological reconstruction. Changes
in the corrected conductance parameters occurred mainly
with incomplete knowledge of the morphology (Fig. 7 C,
compare to 7, D–F). Overall, neither noise nor variations in
passive parameters or morphology to an extent expected
from experimental accuracy resulted in significant deviations
of the correction results from the actual underlying channel
parameters.
Full channel models
The correction algorithm was tested on more complex
channel kinetics by implementing several published models
of potassium channels in a 2-mm long cable. Simulations of
voltage-clamp experiments produced clamp currents with
distortions due to lack of space clamp (black in Fig. 8 A). As
expected, apparent activation and inactivation time constants
increased and the voltage dependence of the steady-state
conductance flattened. The correction algorithm yielded
estimates for the conductance kinetics (blue trace in Fig. 8
A) that accurately reflected the underlying channel properties
(red trace in Fig. 8 A). The kinetics of fast inactivating
channels (Kfast and Ka) and channels with a steep conduc-
tance-voltage relation (Kv) were not corrected as properly as
slower channels (Km and Kslow). This deviation corresponded
to the predictions depicted in Figs. 4 and 6. The contributing
membrane areas varied significantly, thus no a priori pre-
diction could be made for the conductance densities.
Therefore, the distorted currents are displayed as conductan-
ces rather than conductance densities and with different scales
to facilitate comparison. The results of applying the algorithm
to several conductance densities of each of the five realistic
Correcting Space Clamp in Dendrites 3519
Biophysical Journal 84(6) 3508–3528

conductances (Kfast: 3, 10, and 30 pS/mm2; Km: 1, 3, and 10
pS/mm2; Kslow: 3, 10, and 30 pS/mm2; Kv: 10, 30, and 100 pS/
mm2; and Ka: 10, 30, and 100 pS/mm2) are shown in Fig. 8 B.
The maximal conductance obtained at each voltage was
normalized to the conductance at the maximal voltage (V¼ 60
mV). The results obtained by applying the algorithm to these
realistic channels demonstrated that correcting every time
point independently is sufficient to accurately obtain the
kinetics of a wide range of potassium channels.
Correcting in neuronal morphologies
The major goal in designing the correction algorithm was to
devise a method that could overcome space-clamp problems
in elongated and branched structures, such as large cortical
neurons. Therefore, the algorithm was tested on a fully re-
constructed L5 neocortical pyramidal neuron (Fig. 9 A), into
which was inserted the fast inactivating potassium channel
Kfast (Korngreen and Sakmann, 2000). This type of neuron
was selected for the simulations because it provided a worst
case of problems that arise from improper space clamp. As
expected, in somatic recordings the uncorrected conductance
calculated from currents that were obtained from a simulated
somatic voltage clamp did not properly reflect the underlying
kinetics (Fig. 9 A, bottom panel, black versus red traces). In
this morphology, as with the cylinder, application of the
correction algorithm considerably reduced the error (Fig. 9 A,
bottom panel, blue traces). The same was true for simulated
currents from the apical dendrite (Fig. 9 A, upper panels).Note that the uncorrected dendritic currents obtained at the
indicated positions not only display distorted kinetics, but
also incorrect values of the relative channel densities (Fig. 9
A, black traces).In both hippocampal (Hoffman et al., 1997) and neo-
cortical (Korngreen and Sakmann, 2000) pyramidal neurons,
potassium-channel densities change along the apical den-
drite. Therefore, we tested whether the correction algorithm
could retrieve correct local conductance densities without
a priori knowledge of a conductance density gradient. The
same reconstructed pyramidal neuron was used with a Kfast
conductance density that was constant across soma, axon,
and basal dendrites, but increased linearly along the api-
cal dendrite. Again, uncorrected conductances from several
recording sites as in Fig. 9 A displayed distorted channel
kinetics (not shown). For the correction algorithm, a homog-
enous density of potassium channels was assumed, since
a priori knowledge about the existence of an inhomogene-
ous distribution is usually not available. Nevertheless, the
correction resulted in a correct estimate of the local channel
density (Fig. 9 B) and retrieval of the correct kinetics as
predicted by the spatial (Fig. 5) and temporal (Fig. 6)
resolutions of the algorithm. The correction was successful
for all tested locations; the conductance density slope along
the apical dendrite was accurately retrieved (Fig. 9 B,
inverted triangles). Results of this and of the correction of
both a steeper (solid circles) and shallower (triangles)upwards gradients are summarized in Fig. 9 B. A decreasing
gradient was also accurately extracted (Fig. 9 C).
Dendritic recordings
All our simulations were performed under the assumption
of a negligible series resistance. However, experimentally
reached series resistances are at least several MV, especially
for dendritic recordings that can easily be above 20 MV
(Stuart and Spruston, 1995; Stuart and Sakmann, 1994). The
current injected by the voltage-clamp amplifier results in
a voltage drop across the series resistance generated in the
whole-cell configuration. Therefore, the voltage reported by
most single-electrode voltage-clamp amplifiers is not correct
(Armstrong and Gilly, 1992). The bigger the current injected
by the amplifier, the bigger will be the error due to the series
resistance. Conventional series resistance compensation,
a part of any modern patch-clamp amplifier, can reasonably
compensate resistances of up to 20 MV if the series re-
sistance is measured accurately. When recording from neu-
rons, the large currents and the high series resistance will
greatly increase the error, thus rendering the use of patch-
clamp amplifiers impossible. In principle, series resistance
problems could be overcome by discontinuous voltage-
clamp amplifiers. In these amplifiers, the current is injected
for short durations followed by periods during which the
voltage is recorded. Since the voltage is recorded during
a time in which there is no current flowing across the series
resistance, it is a true recording of the membrane potential.
When this cycle is repeated at a high enough frequency, it is
possible to voltage-clamp a cell even in the presence of
a relatively high series resistance. However, application of
such amplifiers to dendrites is not trivial because of the many
membrane time constants inherent to neurons (Major, 1993;
Wilson and Park, 1989). Furthermore, the existing discon-
tinuous voltage-clamp amplifiers cannot cycle fast enough
to accurately follow fast and large conductance changes.
Therefore, the current method of choice for implementing
our correction algorithm is the two-electrode voltage clamp.
In this method, one electrode injects current while the other
records the voltage. Both electrodes have series resistance
due to the whole-cell configuration. However, since no cur-
rent is injected via the voltage-sensing electrode, it is re-
porting the correct membrane potential. Furthermore, this
technique can be tuned to follow very fast and large changes
in membrane current.
To comply with the assumptions made while developing
the correction algorithm, the morphology of the neuron and
the passive parameters were determined as detailed in the
methods. To isolate only K1 currents, we blocked voltage-
gated Na1 channels with 1 mM TTX, voltage-gated Ca21
channels by complete substitution of the Ca21 in the bath
with Co21, and Ih with 30 mM of ZD2788. Two simultaneous
whole-cell dendritic recordings were established at an in-
3520 Schaefer et al.
Biophysical Journal 84(6) 3508–3528

FIGURE 9 Space-clamp errors and correction of dendritic and somatic recordings of potassium channels. (A) The Kfast channel with a homogenous density
of 30 pS/mm2 was inserted into a partially reconstructed morphology of a layer 5 neocortical pyramidal neuron (left panel). Voltage-clamp experiments were
simulated at 0 mm, 250 mm, 500 mm, and 750 mm from the middle of the soma. The leak-subtracted and converted current recordings (black lines) and the
corrected conductances (blue lines) are shown in the right panel. For comparison, the red lines indicate the true conductance kinetics and densities for the given
positions. Scale bars apply to the uncorrected conductance (conductance in nS) and to the corrected and original kinetics (conductance density in pS/mm2). (B)
The reconstructed layer 5 pyramidal cell from A was equipped with a homogenous density of Kfast (gmax ¼ 10 pS/mm2) throughout the soma, the partially
Correcting Space Clamp in Dendrites 3521
Biophysical Journal 84(6) 3508–3528

terelectrode distance of 30–40 mm. Under these conditions it
was possible to record K1 currents from the dendrites of L5
neocortical pyramidal neurons. Fig. 10 A displays the
schematic representation of the two-electrode voltage-clamp
circuit with the current-injecting electrode at 220 mm and the
voltage-sensing electrode at 180 mm measured from the
center of the soma. The distorted currents, recorded voltage,
and corrected conductance density are shown alongside the
neuron (Fig. 10 B). Due to the initial overshoot of the
potential (Fig. 10 B), the activation time course of the current
was distorted and therefore not analyzed. The decay of the
corrected conductance density was faster than the distorted
currents as expected from our simulations. The correction
clearly revealed a biexponential decay of the conductance
density that was obscured in the distorted currents. This
biexponential decay is probably the manifestation of the fast
inactivating and slow inactivating K1 conductances that are
known to be present in the dendrites of layer 5 neocortical
pyramidal neurons (Bekkers, 2000; Korngreen and Sakmann,
2000). The steady-state activation curve of the distorted
conductances, calculated by dividing the distorted currents
by the driving force, could be fitted to a Boltzmann function
to obtain a V1/2 ¼ 27 mV and k ¼ 22 mV (average of 21 6 3
mV and 17 6 2 mV, n ¼ 3). After correction, these
parameters had values of V1/2 ¼ 18 mV and k ¼ 16 mV
(average of 17 6 2 mV and 14 6 1 mV, n¼ 3). The corrected
slope factor was not different (P[ 0.1, ANOVA) from that
obtained using somatic nucleated patches (12 6 1 mV, n¼ 6)
(Korngreen and Sakmann, 2000). The V1/2, after correction
for a liquid junction potential of 12 mV, was significantly
different (P\0.05, ANOVA) from the published value (�1
6 2 mV, n ¼ 6) (Korngreen and Sakmann, 2000).
DISCUSSION
Space-clamp errors render proper analysis of ionic currents
impossible in any branched or elongated structure. Here we
present an algorithm (Fig. 3) that accurately extracts channel
properties from distorted recordings (Figs. 4–9). Counterin-
tuitively, the lack of space clamp offers the opportunity to
obtain very local information about potassium-channel
kinetics and densities (Fig. 5 and 9). The correction al-
gorithm was not sensitive to added noise or to errors in
passive membrane parameters (Fig. 7). Up until now, while
performing voltage clamp in neurons, extreme measures
were taken to increase the voltage control over a membrane
area (Augustine et al., 1985). Such measures essentially
flatten the voltage attenuation from the point of the clamp,
thus reducing the error in the voltage. However, this only
applies to structures with relatively short dendritic trees.
Here we demonstrate that our algorithm performs best in the
almost complete absence of space clamp. Since voltage
attenuation upon channel activation is much narrower than in
the well-studied passive case, the region that significantly
influences the clamp current is limited to a narrow region
around the electrode (‘‘poor space clamp’’). Thus, any
method for estimation of membrane conductances will re-
trieve an averaged conductance only over this region,
enabling high spatial resolution for poorly space-clamped
structures (a small active l; Fig. 5). The same principle
applies to the temporal domain as follows. Many channel
kinetics are slow compared to the membrane time constant
for activated conductances (that is again much smaller than
the well-known passive membrane time constant), therefore
facilitating adaptation of our correction algorithm for the
study of channel kinetics (Fig. 6).
With simplified channel models, which are described by
only four parameters (three parameters for the activation
curve in steady state and one voltage-invariant activation
time constant), the correction algorithm accurately retrieved
the entire channel model. Limitations of the algorithm were
addressed by varying the four parameters (Figs. 4 and 6).
Channels with a steep steady-state activation curve (inverse
slope of the Boltzmann curve, k # 4 mV) could not be fully
corrected due to the finite step size of the linear interpolation.
Similarly, with very fast channel activation times (tchannel �tactive) a poorer correction was achieved, since essentially no
kinetic model was assumed. Although these two difficulties
are not a major concern in realistic channel models, they
could be accounted for by including a priori assumptions
about the activation curve or underlying channel kinetics.
However, such assumptions substantially reduce the gener-
ality of the correction approach. Other problems, such as
decreases in correction accuracy with decreasing V1/2 of the
Boltzmann activation curve, can be overcome by minor
modifications of the algorithm, such as omission of the
assumption of no channel activation at rest.
Correct implementation of the algorithm requires de-
termination of both the morphology and passive parameters
of the structure being studied. Given enough reconstructions,
implementation might be simplified by building a canonical
view of the specific neuron to obtain at least a first-order
correction at a much reduced computation time, especially
since the correction is sensitive primarily to local morpho-
reconstructed axon, and basal dendrites, and with a linearly increasing gradient along the apical dendrite (up to 50 pS/mm2 at 1000 mm away from the soma).
Correction was performed without any a priori knowledge of the gradient. The local recording was corrected with the underlying assumption of a homogenous
distribution of a potassium conductance (inverted triangles). This procedure was repeated on a cell prepared with gradients of different steepness and sign: 20
pS/mm2 (soma) to 40 pS/mm2 (1000 mm distance), triangles; 7 pS/mm2 to 70 pS/mm2, solid circles; and (C) 70 pS/mm2 down to 7 pS/mm2, solid diamonds.
Peak conductance densities were calculated and fitted with a Boltzmann function: g=gmax ¼ ð1=ð11 e�ðV�V1=2Þ=kÞÞn; where g/gmax is the conductance
normalized to its maximal value, V is membrane potential, V1/2 is the voltage at which half of the ‘‘gates’’ of all channels are in the open configuration, and k is
the slope factor. gmax was normalized to the true somatic value for display purposes.
3522 Schaefer et al.
Biophysical Journal 84(6) 3508–3528

logical features (Fig. 5). The effects of changes in distal
morphology are in general minor (as partially discussed in
the Appendix). Simplifying distant parts of the dendritic tree
could thus substantially both ease and speed up the
reconstruction process and enhance computational efficacy.
This becomes important not mainly for the demonstration of
the basic principles (that are assessed in a cylinder model)
but for the application to various complex dendritic trees. We
observed significant errors in the correction only if the
reconstruction became poor in regions closer than ;200 mm
to the recording site on the dendrite (data not shown). For
experimental implementability it could therefore be useful to
extract the local dendritic morphology during the experiment
(e.g., by imaging methods) and combine it with a simple
generic cell morphological model to result in a quick semi-
online correction. In a post hoc analysis, a slightly more
detailed morphological measurement might already be
sufficient. This can always be tested by further simplifying
the morphology and testing whether any significant changes
in the corrected conductance values occur. If this is not
the case, it is safe to assume that the morphological
reconstruction is sufficient.
Of concern also is the accuracy of the passive membrane
parameters (Rm, Ri, and Cm). A 10–20% error in the passive
parameters did not significantly affect the final outcome (Fig.
7). The passive parameters of a given neuron can be
estimated with reasonable accuracy once its morphology is
known (Clements and Redman, 1989; Major et al., 1994;
Roth and Hausser 2001; Stuart and Spruston, 1998). This
requires an additional pulse protocol in current-clamp mode,
before the voltage-clamp experiment, and a full reconstruc-
tion of the neuron afterward (Clements and Redman, 1989;
Major et al., 1994; Roth and Hausser 2001; Stuart and
Spruston, 1998). As the neuron usually is to be reconstructed
for use in the correction algorithm, only additional pulse
protocols in current clamp need to be performed. Previously,
many recorded sweeps were claimed to be needed to obtain
a sufficiently accurate estimate of the passive parameters
(Major et al., 1994). However, using two electrodes to record
such sweeps (Roth and Hausser, 2001; Stuart and Spruston,
1998) greatly reduces the number of sweeps required. Thus,
obtaining the passive parameters for each neuron before
starting the voltage-clamp experiment does not require more
than an additional 5–10 min. Another advantage of the two-
electrode voltage clamp is that the series resistance of the two
electrodes can be considerably higher than the one required
FIGURE 10 Dendritic two-electrode voltage-clamp recording of K1 currents. (A) The schematic representation of a two-electrode voltage-clamp circuit is
shown at the recording site on the dendrite of the reconstructed neuron. (B) The distorted currents, membrane voltage, and corrected conductance density are
shown from top to bottom. The data was sampled at 10 kHz and filtered at 5 kHz. Both the current-injecting and the voltage-sensing electrodes had series
resistances of 25 MV. The passive parameters determined as detailed in Methods were Ri ¼ 90 Vcm, Rm ¼ 51,000 Vcm2, and Cm ¼ 1.1 mF cm�2.
Correcting Space Clamp in Dendrites 3523
Biophysical Journal 84(6) 3508–3528

for the accurate application of a single-electrode voltage
clamp. We were able to voltage-clamp dendrites even when
both electrodes had series resistance of 25–30 MV. Although
more recordings are required to establish the full kinetic and
density profile of the K1 conductances along the apical
dendrite of L5 pyramidal neurons, it is clear that the
correction algorithm was able to correct currents recorded in
the absence of space clamp.
Here, we present an algorithm that extracts only activation
curves of single or mixtures of potassium channels. Much
more information can be obtained from the voltage-clamp
technique with carefully planned voltage protocols. Using
the correction of the activation curve as a cornerstone,
inactivation properties and activation kinetics can also be
corrected (M.H., A.T.S., B.S., and A.K., in preparation). We
applied the algorithm to a variety of potassium channels. As
outlined in the text, the algorithm works best for non-
regenerative currents. Thus, under physiological conditions,
the algorithm can be applied to potassium channels, as
shown in Fig. 10, and chloride channels, as well as, in the
opposite direction, to Ih and inward rectifier channels.
Sodium and calcium channels, the two other important
classes of voltage-gated ion channels in neurons would, due
to the lack of space clamp, generate regenerative events,
which will be observed as ‘‘voltage escapes’’ to the
recording electrode. Such events do not comply with the
basic assumption of the correction algorithm that the mem-
brane potential does not exceed the clamp voltage anywhere
in the entire structure. This problem might be overcome by
designing an experiment in which the probability of regen-
erative events is low.
The principle we developed for the correction of currents
from voltage-gated channels could in general be applied
to estimate the conductance density of ligand-gated chan-
nels and that of synaptic currents as well. However, several
problems need to be addressed first. It is possible to design
an experiment in which a puff of a neurotransmitter will be
applied to the dendrite at the location of a voltage-clamp
electrode. This experiment will suffer from the lack of
knowledge of the membrane area onto which the neuro-
transmitter was applied because of the dense structure of
the brain slice and the speed of the perfusion system. It is
important to stress that the neurotransmitter must be applied
to the location of the voltage clamp. Application to a site on
the dendrite farther away from the electrode introduces more
free parameters to be estimated by the algorithm: knowledge
of the site of application and the distance to the recording,
active contributions to the signal propagation by voltage-
gated channels, and nonuniformity of the passive parameters
between the application site and the recording electrode.
Above all, at a site of a remote application, there is virtually
no control of the membrane potential by the voltage-clamp
electrode. Thus, we cannot use the same iterative approach as
detailed in this paper. This problem is worse for the
correction of synaptic currents. The release of neurotrans-
mitter is variable and dependent on the properties of the
presynaptic terminal. Thus, we have very little control over
the amount of neurotransmitter released and over the voltage
at both pre- and postsynaptic terminals. To allow the
correcting of space-clamp distortions of synaptic currents,
it may be possible to combine our approach with new ways
of influencing the membrane potential at the synapse or
measuring the membrane potential at multiple positions to
facilitate estimates regarding the signal propagation.
Many voltage-clamp recordings are limited by the absence
of proper space clamp. Even neurons with relatively short
dendrites will produce erroneous current recordings due to
voltage drop in the dendrites. Here we present an algorithm
to correct for such distortions with the aid of computer-
simulated experiments, and described its application to L5
pyramidal neurons. Since the functionality of this correction
algorithm does not depend on specific properties of the
studied structure, it can be used to analyze voltage-clamp
recordings in any type of nonisopotential cell or fiber.
APPENDIX
The reverse problem: monotonicity of the clampcurrent-conductance relation
With complete knowledge of conductance kinetics and distributions, cable
theory allows calculation of clamp currents from the conductance properties.
As outlined in the Results section, in voltage-clamp experiments one is faced
with the far more difficult reverse problem: to determine the conductance
distribution and kinetics from the clamp-current recording. The algorithm
described above breaks down this multiparameter problem into several one-
parameter problems, each linking one current recording (e.g., the clamp
current I in the steady state of a voltage-clamp experiment to �40 mV) to
a single yet unknown conductance value (the steady-state conductance g for
voltages �50 mV\V#�40 mV). The reverse problem is thus to invert the
relation I(g) to determine the conductance g0 that matches the experimen-
tally measured clamp current Iexp ¼ I(g0). A sufficient and in most cases
essential prerequisite for solving the reverse problem is therefore mono-
tonicity of this clamp current-conductance relation. However, an increase in
the membrane conductance results in a narrowing of the voltage profile.
Therefore only a smaller region contributes substantially to the clamp
current. Whether the increase in the membrane conductance is not usually
overcompensated by the decrease in the activated region due to the
narrowing voltage profile must hence be examined.
In the following, we analytically examine the clamp current-conductance
relation in several scenarios. In the general case of an arbitrary voltage-
dependent conductance g(V) a complete analytic solution is impossible to
obtain. In a simplified situation with a very simple voltage dependence g(V)
¼ g0 (for V\V0) and g(V) ¼ g1 (for V$ V0), a complete analytical solution
can be derived as outlined in the first paragraph. For more complex voltage
dependencies, this is not possible any more. Thus, we describe approx-
imations of the clamp current-conductance relation that allow to qualitatively
predict its overall shape (and thus its monotonicity). These solutions are then
compared to the exact analytical solution and numerical calculations.
Let us consider the steady-state situation in an infinite cylinder
(equipped with a voltage-dependent conductance density g measured per
membrane area) that is voltage-clamped to Vclamp at position x ¼ 0 (Fig.
11 A). The voltage dependence of g to be g(V) ¼ g0 (for V \ V0) and
g(V) ¼ g1 (for V $ V0; higher voltages do not occur in the clamp
experiment: V # Vclamp throughout the cylinder as reversal potentials are
assumed to be hyperpolarized (as described in the Results section)), as
3524 Schaefer et al.
Biophysical Journal 84(6) 3508–3528

shown in Fig. 11 B. The cylinder can be divided into three parts: one
finite cylinder with length 2lDec around the voltage clamp (gray in Fig.
11 A) and two semi-infinite cylinders (white). lDec indicates the length
over which the voltage attenuates from the clamp voltage Vclamp to the
voltage V0. Therefore, in the gray cylinder, the membrane voltage is
larger than V0 at each position. With the voltage-dependent conductance
defined as above, i.e., constant for V $ V0, this results in an ohmic
membrane conductance g ¼ g1 for the gray cylinder. For the white
cylinders, V \ V0, therefore g ¼ g0. All the properties of the white
cylinders are independent of g1, since changes in g1 only influence lDec, not
the length nor membrane properties of the white cylinders (at this point the
assumption of an infinite cylinder substantially simplifies the calculation).
The analytical solution
For a finite cylinder with an ohmic membrane conductance and a terminating
resistance RL (Fig. 11, RL being the known input resistance of the semi-
infinite cylinder (white) with membrane conductance g0), the input
resistance is Ginp ¼ 2G‘ðR‘ 1RL tanhðLÞÞ=ðRL 1R‘ tanhðLÞÞ (for deriva-
tion see e.g., Koch, 1999, chapter 2.2, page 37), with L ¼ lDec=lgray ¼2lDec
ffiffiffiffiffiffiffiffiffiffiffiffiffiffiRig1=d
pand G‘ ¼ 1=R‘ ¼
ffiffiffiffiffiffiffiffiffiffiffig1=Ri
ppd3=2=2 being the input conduc-
tance of a semi-infinite cylinder with the membrane properties of the gray
cylinder. Ri is the morphology-independent, specific axial resistance of the
cylinder; d its diameter. The clamp current can then be calculated as
Iclamp ¼ ðV � EkÞ � Ginp ¼ 2ðV � EkÞG‘
R‘ 1RL tanhðLÞRL 1R‘ tanhðLÞ ;
(1)
which is depicted in Fig. 11 D as a dotted line. No free parameters needed to
be fitted.
FIGURE 11 Monotonicity of the clamp current-conductance relation. (A) A voltage-clamp experiment was simulated in a long unbranched cable as for Fig. 2.
Outer regions of the cylinder are clipped for displaying purposes. The voltage attenuation in steady state is shown for a simulated voltage clamp to�20 mV in the
middle of the cable. lDec, the decreasing length, is the length for which the voltage drops from �20 to �30 mV. (B) The voltage-dependent membrane
conductance was time-independent, g0 ¼ 5 pS/mm2 for voltagesV\�30 mV, and g1 ¼ 40 pS/mm2 for voltagesV$�30 mV. (C) Dependence of the decreasing
length lDec on the membrane conductance g1. (D) Dependence of the clamp current on the membrane conductance g1. The calculations underlying the analytical
(gray and dotted lines) and approximate (dashed line) traces in C and D are detailed in the Appendix. Simulation results in C and D are indicated by black lines.
Correcting Space Clamp in Dendrites 3525
Biophysical Journal 84(6) 3508–3528

Approximate solutions
The clamp current required can—in very general terms—be written as
Iclamp ¼ Iwhite 1 Igray; (2)
Iwhite being the contribution of the white cylinders (independent of g1) and
Igray being the contribution of the gray cylinder that is dependent on g1. This
holds true for both the situation described above (g ¼ const in the white
cylinder) and for an arbitrary voltage dependence g(V \ V0). For a first
approximation, a rough estimate of the g1-dependence of Igray can be
calculated from the membrane conductance and the membrane area as Igray
� c 2lDecg1. The constant c could be derived from the driving force and the
cylinder diameter. What is important for the estimate is, however, that c is
almost independent of g1. With increasing g1, the voltage profile narrows,
thus resulting in a smaller lDec. To assess the question, whether the current-
conductance relation is monotonic, in this first estimate it remains to be
shown that the decrease in lDec does not overcompensate the increase in g1.
With the intrinsic length scale of the gray cylinder being lgray, a first estimate
for lDec is ldec } lgray } 1=ffiffiffiffiffig1
pand therefore Igray � c � ð1= ffiffiffiffiffi
g1p Þ � g1 ¼
cffiffiffiffiffig1
p. Substitution of this approximation into Eq. 2 yields a first
approximation for the clamp current
Iclamp ¼ Iwhite 1 cffiffiffiffiffig1
p: (3)
Since Iwhite and c are (almost) g1-independent fit parameters, it becomes
evident, that Iclamp is indeed monotonic, and a first approximation (dashed
line in Fig. 11 D) of the actual (calculated in simulation, black line) clamp
current-conductance relation can be obtained.
As outlined above, for a more general conductance (g(V) is arbitrary for V
\ V0 and g(V) ¼ g1 for Vclamp $ V $ V0), the only difference to the step
conductance is in the contribution of the white cylinders. Therefore, the
above argument still holds for arbitrary voltage dependence for voltages V\V0, with the only change being in the parameters Iwhite and c.
To more accurately assess the validity of the g1-dependence of lDec, it was
calculated analytically for the step-conductance as follows (depicted in Fig.
11 C): From the general voltage distribution VðX\ LÞ ¼a coshðL� XÞ1b sinhðL� XÞ, the boundary condition for the gray
cylinder Vo=RL ¼ �ð1=ralÞðdV=dXÞjX¼L (ra indicates the axial resistance
per unit length, see also Koch, 1999, pages 33–37), and the boundary
condition V(L) ¼ V0, one obtains Vo=RL ¼ ð1=ralÞðVclamp�Vo coshðLÞÞ=sinhðLÞ. Since L ¼ lDec=l � 1, a Taylor expansion for the
hyperbolic functions yields a square equation for lDec, and
finally lDec ¼ �k1=g1 1ffiffiffiffiffiffiffiffiffiffiffiffiffiffiffiffiffiffiffiffiffiffiffiffiffiffiffiffiffiffiffiffiffiffiffiffiðk2
1=g21Þ1 ðk2=g1Þ
p; with k1 ¼ 1=2
ffiffiffiffiffiffiffiffiffiffiffiffiffiffig0d=Ri
pand k2 ¼ ððVclamp=V0Þ � 1Þðd=2RiÞ.
The clamp current can then be approximated by:
Iclamp ¼ 2 ðV0 � EkÞ1
RL
1V0 1Vclamp
2pdlDecg1
� �(4)
as shown in gray in Fig. 11 D.
Effects of distal membrane properties onclamp-current recordings
The sensitivity of conductance estimates from the correction algorithm to
changes in distal membrane properties (which reflects incomplete
knowledge about the spatial distribution of e.g., passive properties)
was assessed by studying the dependence of the clamp-current record-
ings on the membrane conductances in regions distal to the recording
electrodes (Fig. 5). For this purpose, an infinite cylinder was divided into
three regions: a middle region around the voltage-clamp electrode with
a length of 2l and an ohmic membrane conductance gM (Fig. 5 A, gray),and two semi-infinite cylinders with ohmic membrane conductances
gD (Fig. 5 A, white). The clamp current was calculated according to
Eq. 1
Iclamp;gD ;gM¼ 2ðV � EkÞG‘
R‘;middle 1Rside tanhðl=lmiddleÞRside 1R‘;middle tanhðl=lmiddleÞ
;
lmiddle, R‘,middle, G‘, and Rside being the space constant of the middle
cylinder, the input resistance, input conductance of a semi-infinite cylinder
with the membrane conductance gM, and the input resistance of the white
semi-infinite cylinder, respectively. The relative change in the clamp current
ðIclampð0:5gD; gMÞ � IclampðgD; gMÞÞ=IclampðgD; gMÞwas calculated as a func-
tion of the relative input resistances Rside=R‘;middle ¼ffiffiffiffiffiffiffiffiffiffiffiffiffiffigM=gD
pof the
cylinders indicating the sensitivity of the clamp-current recording to changes
in distal membrane properties.
Piecewise linear conductance models
To increase the accuracy of the conductance calculations, the staircase
conductance approach was changed to a piecewise linear conductance
model. Again, in the first step of the correction algorithm, the conductance g1
¼ g(�70 mV) was estimated. To achieve this, the voltage-clamp experiment
stepping to �70 mV was simulated as described above with the only
difference that the conductance model was g(V) ¼ 0 (V \ �80 mV) and
gðVÞ ¼ ðV1 80 mVÞ=10 mV � g1 (�80 mV \ V # �70 mV, higher
voltages do not occur). This resulted in a conductance-voltage relation that is
continuous and piecewise linear. The conductance g1 (and thus the slope of
the conductance voltage relation for �80 mV\V#�70 mV) was varied to
minimize the clamp current difference. Similarly, at higher voltages Vn, the
conductance for Vn � 10 mV\V# Vn was assumed to be linear across this
voltage region. From the last correction step, gn � 1 ¼ g(Vn � 10 mV) was
known. Thus the conductance for the voltage region of interest can be
written as gðVÞ ¼ gn�1 1 ðV� ðVn � 10 mVÞÞ=10 mV � ðgn � gn�1Þ. Dur-
ing the fitting procedure, gn (and thus the slope of the conductance-voltage
relation for voltages V with Vn � 10 mV \ V # Vn) is varied to match the
clamp currents.
Potassium-channel models
For all realistic channel models used, potassium currents were calculated as
IK ¼ gmaxaxb(v � E), where gmax is the local conductance density; a and
b indicate the activation particle with an x-order kinetic and the inactivation
particle, respectively; v is the local membrane voltage; and E the potassium
reversal potential. Activation and inactivation variables are expressed in
terms of a steady-state value a‘(v) and a time constant ta(v). For Kv, Km,
Kfast, and the activation of Kslow, steady-state value and time constant were
determined as a‘ ¼ a=ða1bÞ and ta ¼ 1=ða1bÞ. The rate functions a
and b were as follows (v in mV, t in ms, and a and b in ms�1):
Delayed rectifier K1 channel Kv (Mainen et al., 1995):
ðno inactivation; x ¼ 1Þ; a ¼ 0:02ðv� 25Þ
1 � e�ðv�25Þ=9
;
b ¼ �0:002ðv� 25Þ
1 � eðv�25Þ=9
:
Muscarinic K1 channel Km (Mainen et al., 1995):
ðno inactivation; x ¼ 1Þ; a ¼ 0:001ðv1 30Þ
1 � e�ðv130Þ=9
;
b ¼ �0:001ðv1 30Þ
1 � eðv130Þ=9
:
3526 Schaefer et al.
Biophysical Journal 84(6) 3508–3528

Fast inactivating K1 channel from neocortical neurons Kfast (Korngreen
and Sakmann, 2000):
Activation ðx ¼ 4Þa ¼ 3:4
11 e�ðv�10Þ=30
;
b ¼ 0:7 ev�6=180 � 0:45:
Inactivationa ¼ 0:0001 eð�0:06vÞ;
b ¼ 0:12
11 eð�ðv1 50Þ=8Þ 1 0:002:
Slow inactivating K1 channel from neocortical neurons Kslow (Korn-
green and Sakmann, 2000):
Activation ðx ¼ 2Þa ¼ 0:0052v� 11:1
1 � e�ðv�11:1Þ=13:1 ;
b ¼ 0:01938 e�ðv11:27Þ=71 � 0:0053:
Inactivation was described as bðt; vÞ ¼ c1ðvÞb1ðt; vÞ1 c2ðvÞb2ðt; vÞ with
first order rate equations for b1 and b2.
b1‘ ¼ b2‘ ¼ 1
11 eðv158Þ=11
;
tb1 ¼ 3601 ð10101 23:7ðv1 54ÞÞe�ððv1 75Þ=48Þ2;
tb2 ¼ 3330 � 4v;
c2 ¼1 v [ � 10
0 v # � 10; c1 ¼ 1 � 0:55c2:
�
Fast inactivating K1 channel from hippocampal neurons Ka (Hoffman
et al., 1997):
Activation ðx ¼ 1Þ:
a‘ ¼ 1=ð11 e�0:001ð1:5�ð39ðv�11Þ=ð11 e
ðv1 40Þ=5ÞÞÞÞ;
ta ¼ e�0:0015�ð21:5ðv�11Þ=ð11 e
ðv140Þ=5ÞÞ � a‘ðvÞ:
Inactivation : b‘ ¼ 1
11 e0:117ðv156Þ ; tb ¼ 0:26ðv1 50Þ:
We thank Dr. Sebastian Bergling for help with the construction of the Kslow
and Kfast MOD files; Drs. Nathan Urban, Dirk Feldmeyer, Troy Margrie,
Fritjof Helmchen, and in particular Arnd Roth for helpful discussions and
critical reading of the manuscript; and Klaus Bauer and Klaus Rohm for
maintaining the computer environment that enabled performance of the
required calculations.
REFERENCES
Adrian, R. H., W. K. Chandler, and A. L. Hodgkin. 1970. Voltage clampexperiments in striated muscle fibers. J. Physiol. 208:607–644.
Armstrong, C. M., and W. F. Gilly. 1992. Access resistance and spaceclamp problems associated with whole-cell patch clamping. MethodsEnzymol. 207:100–122.
Augustine, G. J., M. P. Charlton, and S. J. Smith. 1985. Calcium entryand transmitter release at voltage-clamped nerve terminals of squid.J. Physiol. 367:163–181.
Bekkers, J. M. 2000. Distribution and activation of voltage-gated potassiumchannels in cell-attached and outside-out patches from large layer 5cortical pyramidal neurons of the rat. J. Physiol. 525:611–620.
Benardo, L. S., L. M. Masukawa, and D. A. Prince. 1982. Electrophys-iology of isolated hippocampal pyramidal dendrites. J. Neurosci.2:1614–1622.
Bischofberger, J., and P. Jonas. 1997. Action potential propagation into thepresynaptic dendrites of rat mitral cells. J. Physiol. 504:359–365.
Clements, J. D., and S. J. Redman. 1989. Cable properties of cat spinalmotoneurones measured by combining voltage clamp, current clamp andintracellular staining. J. Physiol. 409:63–87.
Cole, K. S., and H. J. Curtis. 1941. Membrane potential of the squid giantaxon during current flow. J. Gen. Physiol. 24:551–563.
Hines, M. L., and N. T. Carnevale. 1997. The NEURON simulationenvironment. Neural Comput. 9:1179–1209.
Hodgkin, A. L., and A. F. Huxley. 1952. A quantitative description ofmembrane current and its application to conduction and excitation innerve. J. Physiol. 117:500–544.
Hoffman, D. A., J. C. Magee, C. M. Colbert, and D. Johnston. 1997. K1
channel regulation of signal propagation in dendrites of hippocampalpyramidal neurons. Nature. 387:869–875.
Johnston, D., J. C. Magee, C. M. Colbert, and B. R. Cristie. 1996. Activeproperties of neuronal dendrites. Annu. Rev. Neurosci. 19:165–186.
Kavalali, E. T., M. Zhuo, H. Bito, and R. W. Tsien. 1997. Dendritic Ca21
channels characterized by recordings from isolated hippocampaldendritic segments. Neuron. 18:651–663.
Koch, C. 1999. Biophysics of Computation. Oxford University Press,Oxford.
Korngreen, A., and B. Sakmann. 2000. Voltage-gated K1 channels in layer5 neocortical pyramidal neurones from young rats: subtypes andgradients. J. Physiol. 525:621–639.
Larsson, H. P., S. J. Kleene, and H. Lecar. 1997. Noise analysis of ionchannels in non-space-clamped cables: estimates of channel parametersin olfactory cilia. Biophys. J. 72:1193–1203.
Magee, J. C. 1999. Dendritic Ih normalizes temporal summation inhippocampal CA1 neurons. Nat. Neurosci. 2:508–514.
Magee, J. C., and D. Johnston. 1995. Characterization of single voltage-gated Na1 and Ca21 channels in apical dendrites of rat CA1 pyramidalneurons. J. Physiol. 487:67–90.
Mainen, Z. F., J. Joerges, J. R. Huguenard, and T. J. Sejnowski. 1995. Amodel of spike initiation in neocortical pyramidal neurons. Neuron.15:1427–1439.
Major, G. 1993. Solutions for transients in arbitrarily branching cables: III.Voltage clamp problems. Biophys. J. 65:469–491.
Major, G., J. D. Evans, and J. J. Jack. 1993. Solutions for transients inarbitrarily branching cables: II. Voltage clamp theory. Biophys. J. 65:450–468.
Major, G., A. U. Larkman, P. Jonas, B. Sakmann, and J. J. Jack. 1994.Detailed passive cable models of whole-cell recorded CA3 pyramidalneurons in rat hippocampal slices. J. Neurosci. 14:4613–4638.
Muller, W., and H. D. Lux. 1993. Analysis of voltage-dependent membranecurrents in spatially extended neurons from point-clamp data. J. Neu-rophysiol. 69:241–247.
Nadeau, H., and H. A. Lester. 2000. Two-compartment model for whole-cell data analysis and transient compensation. J. Neurosci. Meth. 99:25–35.
Press, W. H., S. A. Teukolsky, W. T. Vetterling, and B. P. Flannery. 1992.Numerical Recipes in C, the Art of Scientific Computing, 2nd ed.Cambridge University Press, Cambridge.
Rall, W. 1959. Branching dendritic trees and motorneuron membraneresistivity. Experimental Neurobiology. 1:491–527.
Rall, W., R. E. Burke, W. R. Holmes, J. J. Jack, S. J. Redman, and I. Segev.1992. Matching dendritic neuron models to experimental data. Physiol.Rev. 72 (4 Suppl):S159–S186.
Correcting Space Clamp in Dendrites 3527
Biophysical Journal 84(6) 3508–3528
Rall, W., and I. Segev. 1985. Space clamp problems when voltage clampingbranched neuron with intracellular microelectrodes. In Voltage and PatchClamping with Microelectrodes. T. G. Smith, H. Lecar, S. J. Redman,and P. W. Gage, editors. 191–215.
Roth, A., and M. Hausser. 2001. Compartmental models of rat cerebellarPurkinje cells based on simultaneous somatic and dendritic patch-clamprecordings. J. Physiol. 535:445–472.
Spruston, N., D. B. Jaffe, S. H. Williams, and D. Johnston. 1993. Voltage-and space-clamp errors associated with the measurement of electroton-ically remote synaptic events. J. Neurophysiol. 70:781–802.
Stuart, G., and N. Spruston. 1995. Probing dendritic function with patchpipettes. Curr. Opin. Neurobiol. 5:389–394.
Stuart, G., and N. Spruston. 1998. Determinants of voltage attenuation inneocortical pyramidal neuron dendrites. J. Neurosci. 18:3501–3510.
Stuart, G., N. Spruston, B. Sakmann, and M. Hausser. 1997. Actionpotential initiation and backpropagation in neurons of the mammalianCNS. Trends Neurosci. 20:125–131.
Stuart, G. J., H.-U. Dodt, and B. Sakmann. 1993. Patch-clamp recordingsfrom the soma and dendrites of neurons in brain slices using infraredvideo microscopy. Pflugers Arch. 423:511–518.
Stuart, G. J., and B. Sakmann. 1994. Active propagation of somatic actionpotentials into neocortical pyramidal cell dendrites. Nature. 367:69–72.
Takigawa, T., and C. Alzheimer. 1999. G protein-activated inwardlyrectifying K1 (GIRK) currents in dendrites of rat neocortical pyramidalcells. J. Physiol. 517:385–390.
White, J. A., N. S. Sekar, and A. R. Kay. 1995. Errors in persistent inwardcurrents generated by space-clamp errors: a modeling study. J. Neuro-physiol. 73:2369–2377.
Wilson, C. J., and M. R. Park. 1989. Capacitance compensation and bridgebalance adjustment in intracellular recording from dendritic neurons.J. Neurosci. Meth. 27:51–75.
3528 Schaefer et al.
Biophysical Journal 84(6) 3508–3528
![INDIAN SPACE RESEARCH ORGANISATION (ISRO) · 2017. 7. 11. · Indian Space Research Organisation [ISRO] of the Department of Space [DOS] is looking for young, dynamic and dedicated](https://static.fdocuments.fr/doc/165x107/5fe6ccc886c71843dc28e72b/indian-space-research-organisation-isro-2017-7-11-indian-space-research-organisation.jpg)