COMPARATIVE ANALYSIS OF FINANCIAL EFFICIENCIES WITH …
26
Gönderim Tarihi: 02.10.2017 Kabul Tarihi: 03.12.2018 COMPARATIVE ANALYSIS OF FINANCIAL EFFICIENCIES WITH DATA ENVELOPMENT ANALYSIS (DEA) AND MULTI-ATTRIBUTE UTULITY THEORY (MAUT) METHODS Mehmet APAN İhsan ALP Ahmet ÖZTEL VERİ ZARFLAMA ANALİZİ (VZA) VE ÇOK NİTELİKLİ FAYDA TEORİSİ (MAUT) YÖNTEMLERİ İLE FİNANSAL ETKİNLİKLERİN KARŞILAŞTIRMALI ANALİZİ Abstract The main purpose of this study is to perform financial analysis of textile companies with Multi Criteria Decision Making (MCDM) methods. "Which MCDM method is most suitable for a given problem?" is an important question in the literature. The study was carried out with different MCDM methods and the results were compared and it was aimed to make a small contribution to the question in the literature. In addition, providing a perspective to the stakeholders and investors of textile sector is another aim of the study. In this study, were attempt to determine the financial activities and performances of 22 firms in the textile sector, which were traded in BIST (Borsa Istanbul) during 2008–2015. The efficiency analysis was done by DEA method using the financial indicators of the firms. Furthermore, the MAUT method was applied to determine financial performance. In this study, the efficiency and performance orders obtained with the DEA (BCC), DEA (CCR), and MAUT methods were examined together and then compared. Accordingly, it was seen that BISAS was the most successful company during the whole period for the three methods. The following companies were found to be ESEMS, SNPAM, ATEKS, and KORDS. Keywords: Efficiency, Performance, Textile Sector, DEA, MAUT, Entropy. Dr. Öğr. Üyesi, Karabük Üniversitesi, İşletme Fakültesi, İşletme Bölümü, e - posta: [email protected]. Prof. Dr., Gazi Üniversitesi, Fen Fakültesi, İstatistik Bölümü, e -posta: [email protected]. Öğr. Gör., Bartın Üniversitesi, İİBF, İşletme Bölümü, e -posta: [email protected].
Transcript of COMPARATIVE ANALYSIS OF FINANCIAL EFFICIENCIES WITH …
Gönderim Tarihi: 02.10.2017 Kabul Tarihi: 03.12.2018
COMPARATIVE ANALYSIS OF FINANCIAL
EFFICIENCIES WITH DATA ENVELOPMENT ANALYSIS
(DEA) AND MULTI-ATTRIBUTE UTULITY THEORY
(MAUT) METHODS
Mehmet APAN
İhsan ALP
Ahmet ÖZTEL
VERİ ZARFLAMA ANALİZİ (VZA) VE ÇOK NİTELİKLİ
FAYDA TEORİSİ (MAUT) YÖNTEMLERİ İLE FİNANSAL
ETKİNLİKLERİN KARŞILAŞTIRMALI ANALİZİ
Abstract
The main purpose of this study is to perform financial analysis of textile
companies with Multi Criteria Decision Making (MCDM) methods. "Which
MCDM method is most suitable for a given problem?" is an important question
in the literature. The study was carried out with different MCDM methods and
the results were compared and it was aimed to make a small contribution to the
question in the literature. In addition, providing a perspective to the
stakeholders and investors of textile sector is another aim of the study. In this
study, were attempt to determine the financial activities and performances of 22
firms in the textile sector, which were traded in BIST (Borsa Istanbul) during
2008–2015. The efficiency analysis was done by DEA method using the
financial indicators of the firms. Furthermore, the MAUT method was applied
to determine financial performance. In this study, the efficiency and
performance orders obtained with the DEA (BCC), DEA (CCR), and MAUT
methods were examined together and then compared. Accordingly, it was seen
that BISAS was the most successful company during the whole period for the
three methods. The following companies were found to be ESEMS, SNPAM,
ATEKS, and KORDS.
Keywords: Efficiency, Performance, Textile Sector, DEA, MAUT, Entropy.
Dr. Öğr. Üyesi, Karabük Üniversitesi, İşletme Fakültesi, İşletme Bölümü, e-
posta: [email protected].
Prof. Dr., Gazi Üniversitesi, Fen Fakültesi, İstatistik Bölümü, e-posta:
Öğr. Gör., Bartın Üniversitesi, İİBF, İşletme Bölümü, e-posta:
AİBÜ Sosyal Bilimler Enstitüsü Dergisi, 2018, Cilt:18, Yıl:18, Sayı: 4, 18: 115-140
116
Öz
Bu çalışmanın temel amacı, Çok Kriterli Karar Verme (ÇKKV) yöntemleri ile
tekstil firmalarının finansal analizinin yapılmasıdır. "Verilen bir problem için
hangi ÇKKV yöntemi en uygundur?", literatürde yer alan önemli bir sorudur.
Çalışmada farklı ÇKKV yöntemleri ile analiz yapılmış ve sonuçlar
karşılaştırarak, literatürdeki soruya küçük de olsa bir katkı yapmak
amaçlanmıştır. Ayrıca, tekstil sektörü paydaşlarına ve yatırımcılarına bir
perspektif sunulması, çalışmanın diğer bir amacıdır. Bu çalışmada, 2008-2015
yılları arasında BIST'de (Borsa İstanbul) işlem gören tekstil sektöründeki 22
firmanın finansal faaliyet ve performanslarını belirlemeye çalışılmıştır. Etkinlik
analizi, firmaların finansal göstergeleri kullanılarak VZA yöntemi ile yapılmıştır.
Ayrıca, finansal performansı belirlemek için MAUT yöntemi uygulanmıştır. Bu
çalışmada VZA (BCC), VZA (CCR) ve MAUT yöntemleri ile elde edilen
etkinlik ve performanslar birlikte incelenmiş ve karşılaştırılmıştır. Buna göre üç
yöntem için BİSAS’ın tüm dönem boyunca en başarılı şirket olduğu
görülmüştür. Bunu ise ESEMS, SNPAM, ATEKS ve KORDS firmaları takip
etmiştir.
Anahtar Kelimeler: Etkinlik, Performans, Tekstil Sektörü, VZA, MAUT,
Entropi.
1. Introduction
A firm’s investment in foreign markets, the rise of the boundaries
between the markets, and increasing competition in communication and
technological developments have made it necessary to manage resources
effectively and efficiently. This is directly related to efficiency and
productivity that firms with the potential for development in the entry of
foreign investors into the countries catch the opportunities arising from
the competition and manage the development process. Therefore,
efficiency and productivity measures help companies measure their level
of achieving their goals. Thus, companies can take steps to determine
what level they have reached in regards to their targets and what
measures should be taken to address the factors that cause a departure
from the efficiency. This study aims to determine efficiency based on the
financial performance of firms with the help of financial ratios.
The aim of the study is to measure and compare the financial activities of
selected textile sector firms traded in the Borsa Istanbul; the second part
is given in the literature on the subject after the Introduction. In the third
part, Data, DEA and MAUT are explained. In the fourth chapter, the
results of the analysis of the firms’ financial efficiency over the years are
explained as a comparative. In the fifth section, the conclusions and
suggestions reached are mentioned.
AİBÜ Sosyal Bilimler Enstitüsü Dergisi, 2018, Cilt:18, Yıl:18, Sayı: 4, 18: 115-140
117
2. Literature Review
Many studies in the literature measure the efficiency level of firms with
the DEA method. In this regard, detailed information can be sought by
Atıcı et al. (2016) on the study of the application of the DEA method in
many sectors in Turkey. On the other hand, a limited number of studies
that determine performance by the MAUT method are included in the
literature. In this context, studies are given in the literature search on the
textiles sector with DEA and studies on textile sectors or other sectors for
the MAUT method. In 1994, Chandra et al. (1998) determined the
performances of firms by DEA method using the data of 29 Canadian
textile companies. As a result of analysis, a balanced mathematical model
had been developed, which increased efficiency via the balance of the
input effect that reduce efficiency. Jahanshahloo and Khodabakhshi
(2004) claimed that the Chinese textile sector has tried to determine the
efficiency of the sector with the number of employees and the amount of
capital as input and the data of 1981-1997 period using the production
amount as the single output with the DEA method.
Kayalıdere and Kargın (2004) revealed that the financial activities of the
27 textile and 15 cement companies traded on the IMKB (İstanbul
Menkul Kıymetler Borsası) were determined by the DEA method with
the 2002 year data. Çetin (2006) determined the financial performance
and financial efficiencies of the 22 companies in the textile sector in the
IMKB for the year 2004 by DEA. As a result of empirical analysis, it has
been determined that four textile companies are efficient. According to
Kayalı (2009), the efficiencies of 29 textile firms among the biggest
companies operating in the textile products sector, determined by Fortune
Turkey’s “500 largest companies in Turkey” study, were measured by
DEA method. It has been determined that the average technical efficiency
of the sector is 57% in terms of profitability.
In the study of Yenilmez and Girginer (2012), the export efficiencies of
five companies operating in Eskisehir Organized Industrial Zone were
determined by DEA with 2008–2009 period data. As a result of the
analysis, it was determined that the Sarar Company proved efficient every
two years, but the Buzlu Konfeksiyon Company was only efficient in
2009. According to Yayar and Çoban (2012), using the 2008 and 2010
data of 25 companies operating in the ISO (Istanbul Chamber of Industry)
500 textile and apparel goods industry, their financial efficiencies were
determined by the DEA method. In this study, the CCR (Charnes,
Cooper, Rhodes) model with constant returns to scale and BCC (Banker,
Charnes, Cooper) and the model with variable return to scale according to
the input oriented scale were used. According to the results of empirical
AİBÜ Sosyal Bilimler Enstitüsü Dergisi, 2018, Cilt:18, Yıl:18, Sayı: 4, 18: 115-140
118
analysis, four companies in the textile industry and two firms in the
clothing industry were found efficient in 2010, according to the CCR
model. On the other hand, according to the BCC model, 11 companies in
the textile industry, and four firms in the apparel industry were found
efficient in 2010. Kahveci (2012) evaluated the export performances of
firms on the basis of CBRT (Central Bank of the Republic of Turkey)
sector accountants’ 2002-2008 financial data of textile enterprises via a
resource-based strategy using the DEA method. Öztürk and Girginer
(2015) used DEA and AHP (analytical hierarchy process) methods to
measure and evaluate the export efficiencies of 30 firms from textile and
apparel companies, which are included in the list of ISO (Istanbul
Chamber of Industry) 500. As a result of the analysis, according to the
export efficiencies of 2012, four textile companies are efficient.
In order to manage the intense workload of the US Emergency
Management Authority, Ashour and Kremer (2013) analyzed the data by
using the fuzzy analytical hierarchy process / MAUT method and
examined the possibility of simulating them according to emergency
situations. Thus, the performance of the emergency management
departments will be measured on a departmental basis. Alp et al. (2015)
examined the corporate sustainability performance of the Linde Company
using its 2009–2012 period data via the MAUT method. According to the
analysis results, economic and social sustainability performances have an
increasing tendency, but environmental sustainability performance has
been found to be unstable. According to Ömürbek et al. (2016), the
criteria of capital, stock price, market value, sales revenue, number of
employees, net profit margin, current ratio, net profit / capital, net profit /
sales, and net sales / number of employees six automotive companies
whose shares are traded in the IMKB are using only 2014 year data to
determine their financial performance. This study compares financial
performances separately determined by the entropy-based weighting
MAUT and SAW (Simple Additive Weighting) methods. In both
methods, the performance of the same firms was found to be in the first
three ranks.
3. Data and Methodology
Twenty-two private equity companies publicly traded on BIST for which
the financial statements are available for eight annuals from 2008 to 2015
were identified in order to assess textile firms’ financial performance.
The financial performance of Akın Textile (ATEKS), Arsan Textile
(ARSAN), Bilici Investment (BLCYT), Birko Textile Goods (BRKO),
Birlik Textile Goods (BRMEN), Bisaş Textile (BISAS), Bossa (BOSSA),
AİBÜ Sosyal Bilimler Enstitüsü Dergisi, 2018, Cilt:18, Yıl:18, Sayı: 4, 18: 115-140
119
Dagi Clothing (DAGI), Derimod Leather (DERIM), Desa Leather
(DESA), Esem Sport Clothing (ESEMS), Hatay Textile (HATEK), İDAŞ
(IDAS), Karsu Textile (KRTEK), Kordsa Global (KORDS), Lüks Kadife
(LUKSK), Menderes Textile (MNDRS), Mensa Textile
Goods(MEMSA), Söktaş (SKTAS), Sönmez Cotton (SNPAM), Yataş
(YATAS), and Yünsa (YUNSA) will be analyzed in this study. The data
for the study were obtained from the financial statements on the public
disclosure platform website.
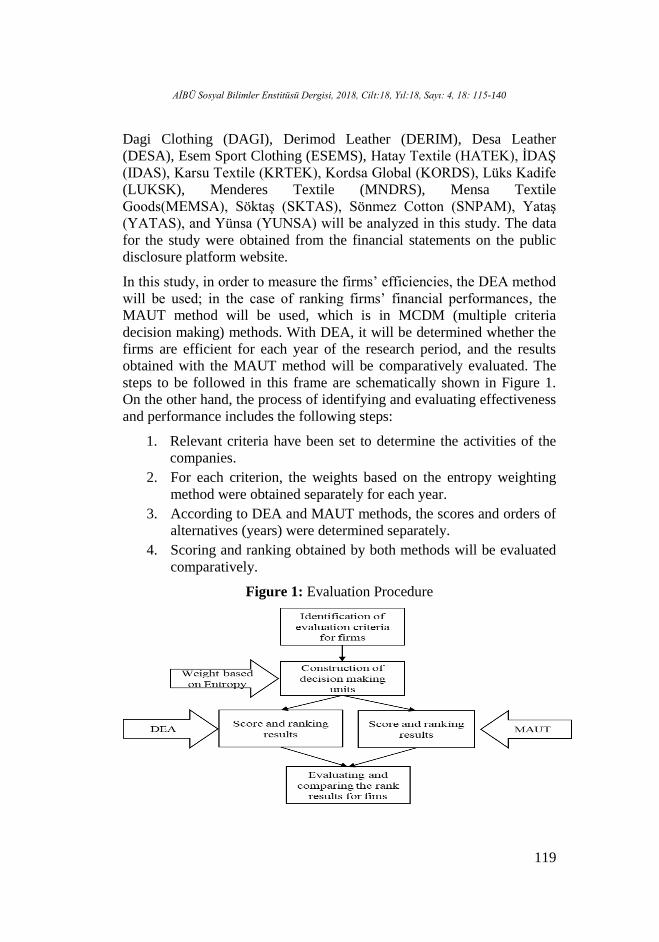
In this study, in order to measure the firms’ efficiencies, the DEA method
will be used; in the case of ranking firms’ financial performances, the
MAUT method will be used, which is in MCDM (multiple criteria
decision making) methods. With DEA, it will be determined whether the
firms are efficient for each year of the research period, and the results
obtained with the MAUT method will be comparatively evaluated. The
steps to be followed in this frame are schematically shown in Figure 1.
On the other hand, the process of identifying and evaluating effectiveness
and performance includes the following steps:
1. Relevant criteria have been set to determine the activities of the
companies.
2. For each criterion, the weights based on the entropy weighting
method were obtained separately for each year.
3. According to DEA and MAUT methods, the scores and orders of
alternatives (years) were determined separately.
4. Scoring and ranking obtained by both methods will be evaluated
comparatively.
Figure 1: Evaluation Procedure

AİBÜ Sosyal Bilimler Enstitüsü Dergisi, 2018, Cilt:18, Yıl:18, Sayı: 4, 18: 115-140
120
The performance criteria and content used to analyze the financial
performance are presented in Table 1 (Kula and Özdemir 2007: 63-64;
Kula et al. 2009: 195; Başkaya and Öztürk 2012: 184; Erdoğan and
Yıldız 2015: 136; Ömürbek et al. 2016: 242; Çetin 2006: 266).
Table 1: Criteria of Inputs and Outputs
INPUTS OUTPUTS
Current Ratio Current Assets / Short Term
Liabilities
Net Profit
Margin
Net Income /
Sales
Acid Test Ratio (Current Assets – Inventories ) /
Short Term Liabilities
Return on
Assets
Net Income /
Total Assets
Financial
Leverage Ratio Liabilities / Total Assets
Return on
Equity
Net Income /
Equity
Receivable
turnover in days
Average Recievables * Days in
the year / Sales
Inventory
turnover in days
Average Inventory * Days in the
year / Cost of goods sold
In this section, information about DEA and MAUT methods is given, and
the steps of the analysis are explained with mathematical notation.
3.1. Data Envelopment Analysis
It is complex to measure the efficiency of any organization using multiple
inputs and generating multiple outputs. CCR described a nonparametric
approach to measure efficiency in such situations (Charnes et al. 1978:
429-444). This technique is known as DEA. DEA is a linear
programming technique that is used to estimate the relevant technology
over the production possibility set on the basis of what is observed. The
production possibility set is defined as the set of input–output
combinations. The boundary of this set, reflecting the greatest amount of
output that can be produced from a given amount of input, defines the
relevant technology or production function. Based on this, it is then
possible to compute the efficiency score of a given decision-making unit
(DMU, here Textile firms), a measure of its relative distance to the
efficient frontier. DEA is a relatively new way of calculating efficiency
of comparable homogeneous organizations; for an extensive description
of this technique, the reader is referred to existing papers and textbooks
on the subject (Emrouznejad et al. 2008: 151-157; Ray 2004; Cook and
Seiford 2009: 1-17; Charnes et al. 1998).
There are some most striking advantages of DEA over other efficiency
measurement methods. First, DEA allows measurement of efficiency
without having to specify in advance either the form of production
AİBÜ Sosyal Bilimler Enstitüsü Dergisi, 2018, Cilt:18, Yıl:18, Sayı: 4, 18: 115-140
121
function or the weights for inputs and outputs used. Second, it obtains no
measurement error or statistical noise, which contributes to accuracy of
the result. Third, it simultaneously considers multiple inputs and outputs.
That is, DEA is a generalization of total factor productivity (TFP)
methods. Thus, DEA is a flexible and important tool to measure
efficiency of firms. DEA comes from its property to envelop all points on
or below a production frontier line. It is a measure of multifactor
productivity growth.
DEA models can be classified by two criteria: type of scale effects and
model orientation. The first criterion determines the assumptions
concerning the scale effects accepted in the model constant returns to
scale (CRS) or variable returns to scale (VRS). The CRS surface is
represented by a straight line that starts at the origin and passes through
the first DMU that it meets as it approaches the observed population. The
models with CRS envelopment surface assume that an increase in inputs
will result in a proportional increase in outputs. The CCR model of DEA
is based on the CRS assumption. The VRS surface envelops the
population by connecting the outermost DMUs. The VRS model allows
an increase in input values to result in a non-proportional increase of
output levels. The BCC model of DEA is based on the VRS assumption
(Charnes et al. 1978: 429-444; Ray 2004; Banker et al. 1984: 1078-1092).
The model orientation approach indicates whether the objective is the
minimization of input(s), such as the cost of production, so called the
input-oriented model, or the maximization of outputs, so called the
output-oriented model.
One point to be noted here is that the term “relatively efficient” means
that the DMUs are efficient in relation to other DMUs in the sample. The
CCR model allows the respective DMU to adjust its own weights
accordingly so that it becomes relatively efficient. Thus, the efficiency
score is the ratio of the weighted set of inputs to the weighted set of
outputs.
Efficiency = (weighted sum of outputs) / (weighted sum of inputs).
In the CCR model, we assume that there are n DMU to be evaluated.
Each DMU consumes varying amounts of m different inputs to produce s
different outputs.
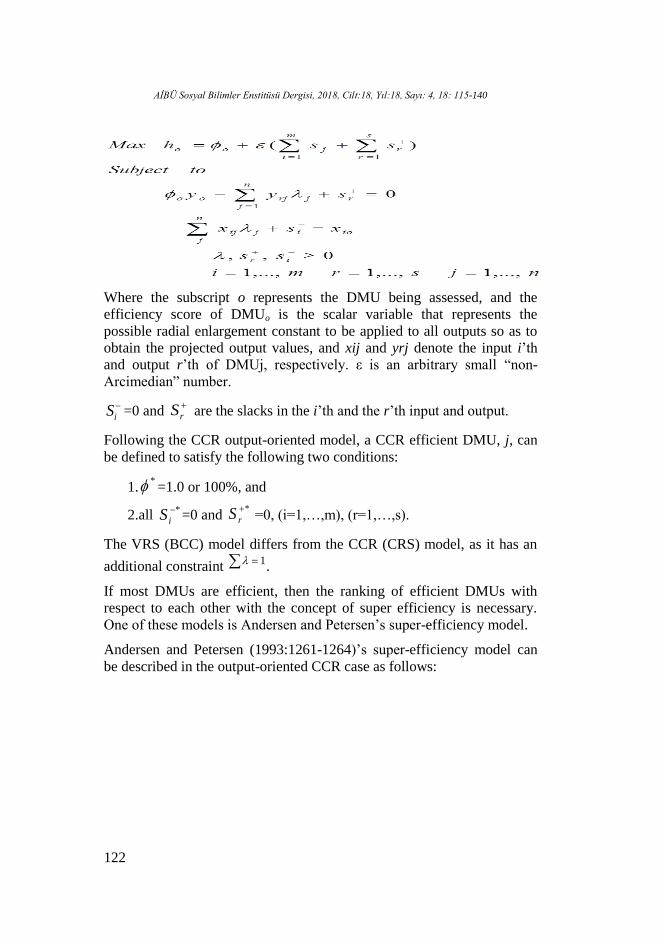
In DEA, different mathematical models are used (Charnes, et al., 1998:
36-39). The output oriented model CCR which will be used in this study
is defined as below. Behind the efficiency scores, the model provides the
lacks and shortages in outputs and excesses in inputs.
AİBÜ Sosyal Bilimler Enstitüsü Dergisi, 2018, Cilt:18, Yıl:18, Sayı: 4, 18: 115-140
122
Where the subscript o represents the DMU being assessed, and the
efficiency score of DMUo is the scalar variable that represents the
possible radial enlargement constant to be applied to all outputs so as to
obtain the projected output values, and xij and yrj denote the input i’th
and output r’th of DMUj, respectively. ε is an arbitrary small “non-
Arcimedian” number.
iS =0 and
rS are the slacks in the i’th and the r’th input and output.
Following the CCR output-oriented model, a CCR efficient DMU, j, can
be defined to satisfy the following two conditions:
1.* =1.0 or 100%, and
2.all *
iS =0 and *
rS =0, (i=1,…,m), (r=1,…,s).
The VRS (BCC) model differs from the CCR (CRS) model, as it has an
additional constraint 1.
If most DMUs are efficient, then the ranking of efficient DMUs with
respect to each other with the concept of super efficiency is necessary.
One of these models is Andersen and Petersen’s super-efficiency model.
Andersen and Petersen (1993:1261-1264)’s super-efficiency model can
be described in the output-oriented CCR case as follows:

AİBÜ Sosyal Bilimler Enstitüsü Dergisi, 2018, Cilt:18, Yıl:18, Sayı: 4, 18: 115-140
123
srminj
SS
Syy
Sxx
toSubject
h
rij
rrj
n
j
jro
iij
n
oj
jio
o
,...,1,,...,1,,...,1
0,
max
,
1
,1
where
iS and
rS represent input and output slacks, respectively. For an
efficient DMU, is not less than 1.0 ( or 100) and slacks are zero. The
only difference between Andersen and Petersen’s super-efficiency model
and CCR|BCC model is just the omission of DMU, which is being
evaluated in the constraints. All of the CCR|BCC inefficient DMUs have
the same results on weights and efficiency score by the Andersen and
Petersen’s süper-efficiency model as those by the CCR|BCC model.
3.2. Multi-Attribute Utility Theory
3.2.1.Weighting
Most of the MCDM methods use criteria weights for determining the
importance degree of the criteria. Because the distribution of the weights
have a wide influence on the solution, the weighting process is important
for MCDM problems. In this process, the decision-maker should be
accurate and simple but not contradict the essential theoretical
consistency (Choo et al. 1999: 527-541). Conceptually, weighting
methods can be studied in two main categories: objective weighting
methods and subjective weighting methods. The objective methods obtain
criteria weights via applying mathematical techniques without any
external influence (Zardari et al. 2014). This is an important advantage
for the decision-maker in order to employ a neutral evaluation.
3.2.2.Entropy Method
Entropy is a handy concept in information theory, where it is relevant to
measuring the amount of the expected information content of a certain
message (H wang and Yoon 1981). It indicates that a large deviation
represents more uncertainty than does a sharply peaked one (Deng et al.
2000: 963-973). To calculate the weights by entropy method, first the
information matrix is normalized, then the following equations are used.

AİBÜ Sosyal Bilimler Enstitüsü Dergisi, 2018, Cilt:18, Yıl:18, Sayı: 4, 18: 115-140
124
The entropy method consists of the following steps (Hwang and Yoon
1981; Islamoglu et al. 2015: 124-138):
Equation (1) shows the decision matrix D of a multi-criteria problem with
m alternatives and n criteria,
𝑋1 𝑋2 ⋯ 𝑋𝑛
𝐷 =
𝐴1
𝐴2
⋮𝐴𝑚
[
𝑥11 𝑥12 … 𝑥1𝑛
𝑥21 𝑥22 … 𝑥2𝑛
⋮ ⋮ ⋮ ⋮𝑥𝑚1 𝑥𝑚2 … 𝑥𝑚𝑛
] (1)
where 𝑥𝑖𝑗 is the achievement value of the ith alternative for the jth
criterion.
Step 1: 𝑅 = [𝑟𝑖𝑗]𝑚×𝑛
normalized decision matrix calculated by the
following formula:
𝑟𝑖𝑗 =𝑥𝑖𝑗
∑ 𝑥𝑝𝑗𝑚𝑝=1
, 𝑖 = 1,2, … , 𝑚 , 𝑗 = 1,2, … , 𝑛 (2)
The aim of the normalization is to obtain same scale for all criteria and so
to make comparison between them.
Step 2: 𝑒𝑗 = −𝐾 ∑ 𝑟𝑖𝑗 ln 𝑟𝑖𝑗𝑚𝑖=1 , 𝑗 = 1,2, … , 𝑛 . (3)
The entropy value 𝑒𝑗 for the jth criterion is obtained via the above
formula, where K is a constant number: 𝐾 =1
ln 𝑚, which assurances that
0 ≤ 𝑒𝑗 ≤ 1.
Step 3: The degree of diversification 𝑑𝑗 of the average information
contained by the outcomes of criterion j can be obtained as
𝑑𝑗 = 1 − 𝑒𝑗 , 𝑗 = 1,2, … , 𝑛 (4)
Step 4: Finally, the weight of jth criterion can be defined as
𝑊𝑗 =1−𝑒𝑗
∑ (1−𝑒𝑝)𝑛𝑝=1
, 𝑗 = 1,2, … , 𝑛 . (5)
as addition ∑ 𝑊𝑗𝑛𝑗=1 = 1 is clear.
3.2.3. MAUT Method
The main hypothesis of the MAUT method is that there is a real valued
utility function U so that the decision-maker’s desire is maximized
(deliberately or not) (Olson 1995). This function aggregates all criteria.
The task of the decision-maker is to accurately define or select the
function. The selection process can be seen in (De Montis et al. 2005: 1-
12; Keeney 1977: 267-310; Keeney and Raiffa 1993). As in most studies
in this paper, we have used the additive utility function.
AİBÜ Sosyal Bilimler Enstitüsü Dergisi, 2018, Cilt:18, Yıl:18, Sayı: 4, 18: 115-140
125
Each alternative gives an output that has values in different dimensions.
The MAUT method searches to measure these values, one dimension at a
time, via a weighting procedure (Zietsman et al. 2006).
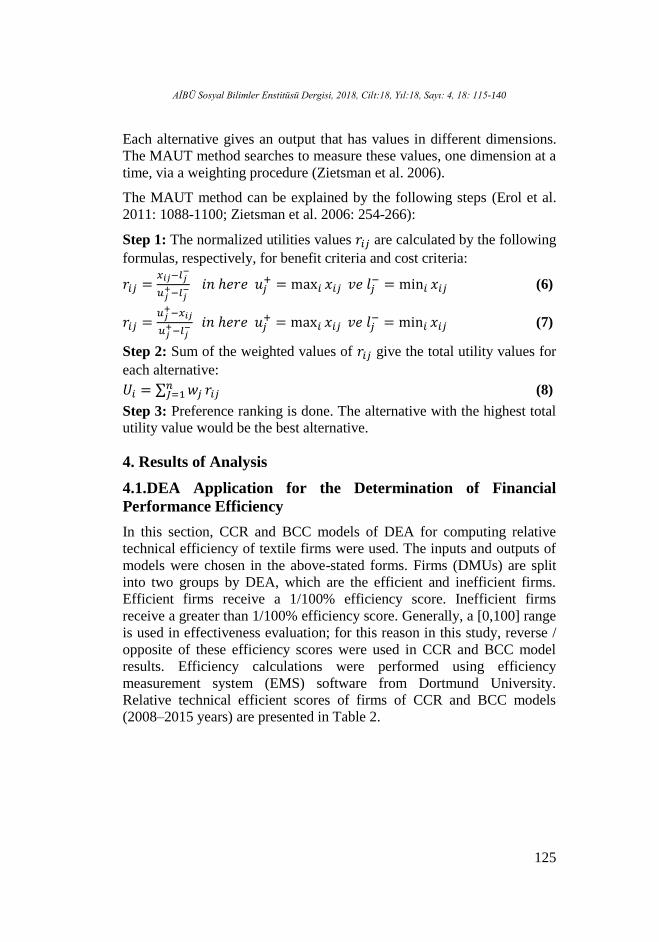
The MAUT method can be explained by the following steps (Erol et al.
2011: 1088-1100; Zietsman et al. 2006: 254-266):
Step 1: The normalized utilities values 𝑟𝑖𝑗 are calculated by the following
formulas, respectively, for benefit criteria and cost criteria:
𝑟𝑖𝑗 =𝑥𝑖𝑗−𝑙𝑗
−
𝑢𝑗+−𝑙𝑗
− 𝑖𝑛 ℎ𝑒𝑟𝑒 𝑢𝑗+ = max𝑖 𝑥𝑖𝑗 𝑣𝑒 𝑙𝑗
− = min𝑖 𝑥𝑖𝑗 (6)
𝑟𝑖𝑗 =𝑢𝑗
+−𝑥𝑖𝑗
𝑢𝑗+−𝑙𝑗
− 𝑖𝑛 ℎ𝑒𝑟𝑒 𝑢𝑗+ = max𝑖 𝑥𝑖𝑗 𝑣𝑒 𝑙𝑗
− = min𝑖 𝑥𝑖𝑗 (7)
Step 2: Sum of the weighted values of 𝑟𝑖𝑗 give the total utility values for
each alternative:
𝑈𝑖 = ∑ 𝑤𝑗𝑛𝐽=1 𝑟𝑖𝑗 (8)
Step 3: Preference ranking is done. The alternative with the highest total
utility value would be the best alternative.
4. Results of Analysis
4.1.DEA Application for the Determination of Financial
Performance Efficiency
In this section, CCR and BCC models of DEA for computing relative
technical efficiency of textile firms were used. The inputs and outputs of
models were chosen in the above-stated forms. Firms (DMUs) are split
into two groups by DEA, which are the efficient and inefficient firms.
Efficient firms receive a 1/100% efficiency score. Inefficient firms
receive a greater than 1/100% efficiency score. Generally, a [0,100] range
is used in effectiveness evaluation; for this reason in this study, reverse /
opposite of these efficiency scores were used in CCR and BCC model
results. Efficiency calculations were performed using efficiency
measurement system (EMS) software from Dortmund University.
Relative technical efficient scores of firms of CCR and BCC models
(2008–2015 years) are presented in Table 2.
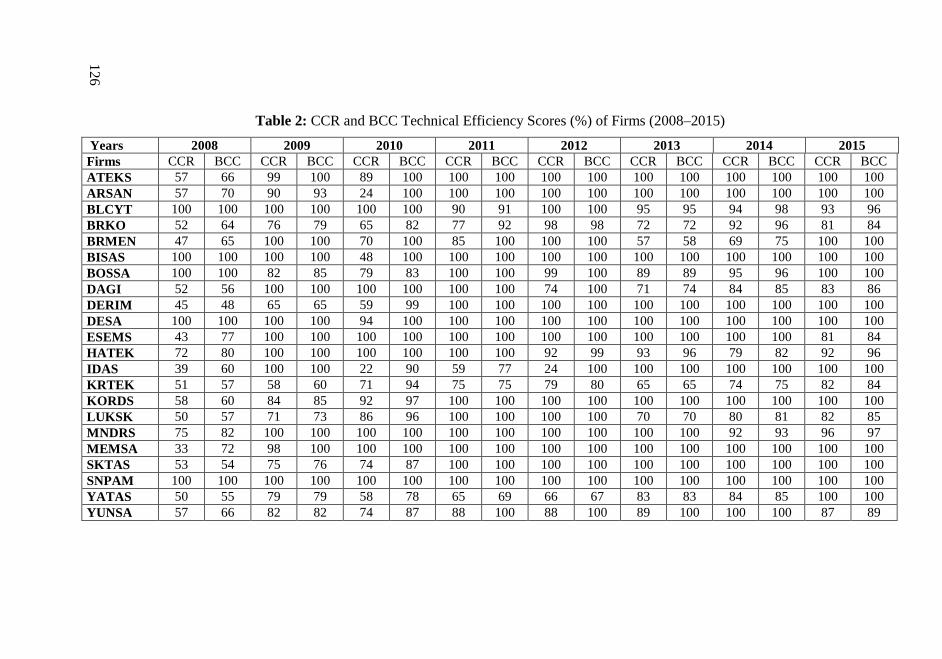
126
Table 2: CCR and BCC Technical Efficiency Scores (%) of Firms (2008–2015)
Years 2008 2009 2010 2011 2012 2013 2014 2015
Firms CCR BCC CCR BCC CCR BCC CCR BCC CCR BCC CCR BCC CCR BCC CCR BCC
ATEKS 57 66 99 100 89 100 100 100 100 100 100 100 100 100 100 100
ARSAN 57 70 90 93 24 100 100 100 100 100 100 100 100 100 100 100
BLCYT 100 100 100 100 100 100 90 91 100 100 95 95 94 98 93 96
BRKO 52 64 76 79 65 82 77 92 98 98 72 72 92 96 81 84
BRMEN 47 65 100 100 70 100 85 100 100 100 57 58 69 75 100 100
BISAS 100 100 100 100 48 100 100 100 100 100 100 100 100 100 100 100
BOSSA 100 100 82 85 79 83 100 100 99 100 89 89 95 96 100 100
DAGI 52 56 100 100 100 100 100 100 74 100 71 74 84 85 83 86
DERIM 45 48 65 65 59 99 100 100 100 100 100 100 100 100 100 100
DESA 100 100 100 100 94 100 100 100 100 100 100 100 100 100 100 100
ESEMS 43 77 100 100 100 100 100 100 100 100 100 100 100 100 81 84
HATEK 72 80 100 100 100 100 100 100 92 99 93 96 79 82 92 96
IDAS 39 60 100 100 22 90 59 77 24 100 100 100 100 100 100 100
KRTEK 51 57 58 60 71 94 75 75 79 80 65 65 74 75 82 84
KORDS 58 60 84 85 92 97 100 100 100 100 100 100 100 100 100 100
LUKSK 50 57 71 73 86 96 100 100 100 100 70 70 80 81 82 85
MNDRS 75 82 100 100 100 100 100 100 100 100 100 100 92 93 96 97
MEMSA 33 72 98 100 100 100 100 100 100 100 100 100 100 100 100 100
SKTAS 53 54 75 76 74 87 100 100 100 100 100 100 100 100 100 100
SNPAM 100 100 100 100 100 100 100 100 100 100 100 100 100 100 100 100
YATAS 50 55 79 79 58 78 65 69 66 67 83 83 84 85 100 100
YUNSA 57 66 82 82 74 87 88 100 88 100 89 100 100 100 87 89

AİBÜ Sosyal Bilimler Enstitüsü Dergisi, 2018, Cilt:18, Yıl:18, Sayı: 4, 18: 115-140
127
In these tables, firms with 100% efficiency scores are efficient firms.
Firms that have less than 100% efficiency scores are considered
inefficient firms. An inefficient firmbecome an efficient firm when output
expands with a 100% efficiency score. Thirteen firms in 2015, according
to Table 2, are efficient and others are inefficient. Efficiency scores
perthe CCR model are less than or equal to those of the BCC model. The
CCR model computes global (overall) efficiency values, whereas the
BCC model gives local (weak, pure) efficient values.
Box plots are available for comparison with other interpretations of
variability of performance scores of firms (CCR and BCC models)
between the years 2008–2015. A box plot contains information about the
distribution of a variable. For example, quartiles, approximate mean,
range, skewness of distribution variable, homogeneity, or heterogeneity.
Also in regards to outliers and extremum (represented by circles and stars
in charts, respectively), the box plot of relative technical efficient scores
of firms of CCR and BCC models (2008–2015 years ) are shown in
Figures 2 and 3, respectively.
Figure 2: Box plot of CCR technical efficiency scores of firms (2008–
2015)
AİBÜ Sosyal Bilimler Enstitüsü Dergisi, 2018, Cilt:18, Yıl:18, Sayı: 4, 18: 115-140
128
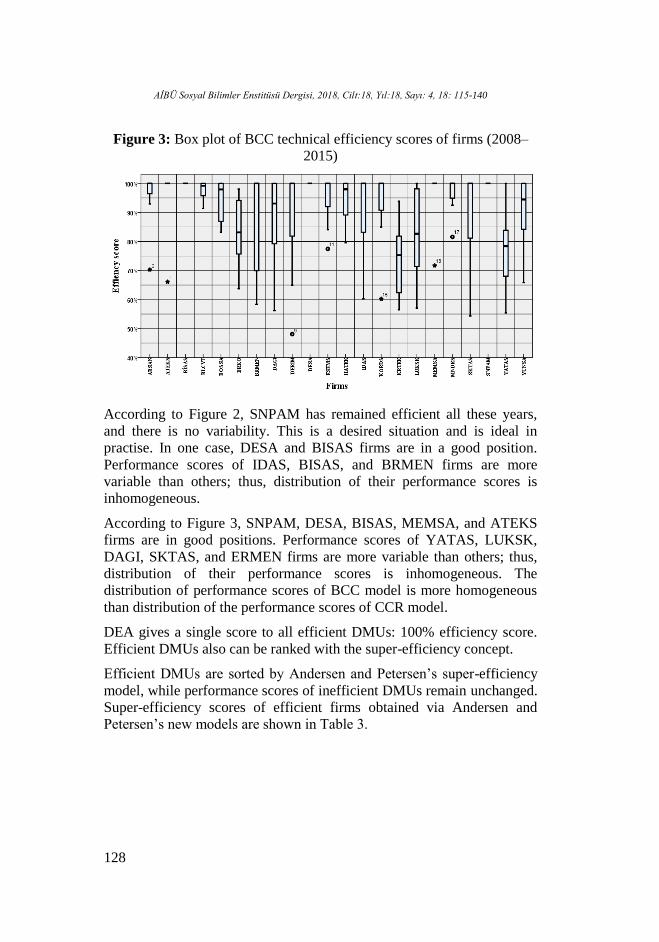
Figure 3: Box plot of BCC technical efficiency scores of firms (2008–
2015)
According to Figure 2, SNPAM has remained efficient all these years,
and there is no variability. This is a desired situation and is ideal in
practise. In one case, DESA and BISAS firms are in a good position.
Performance scores of IDAS, BISAS, and BRMEN firms are more
variable than others; thus, distribution of their performance scores is
inhomogeneous.
According to Figure 3, SNPAM, DESA, BISAS, MEMSA, and ATEKS
firms are in good positions. Performance scores of YATAS, LUKSK,
DAGI, SKTAS, and ERMEN firms are more variable than others; thus,
distribution of their performance scores is inhomogeneous. The
distribution of performance scores of BCC model is more homogeneous
than distribution of the performance scores of CCR model.
DEA gives a single score to all efficient DMUs: 100% efficiency score.
Efficient DMUs also can be ranked with the super-efficiency concept.
Efficient DMUs are sorted by Andersen and Petersen’s super-efficiency
model, while performance scores of inefficient DMUs remain unchanged.
Super-efficiency scores of efficient firms obtained via Andersen and
Petersen’s new models are shown in Table 3.
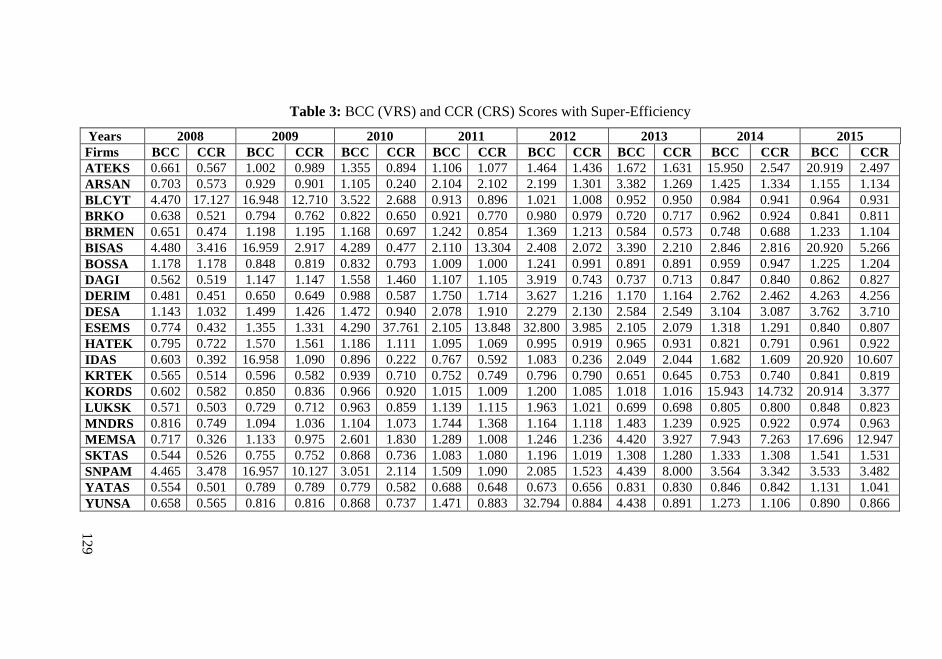
129
Table 3: BCC (VRS) and CCR (CRS) Scores with Super-Efficiency
Years 2008 2009 2010 2011 2012 2013 2014 2015
Firms BCC CCR BCC CCR BCC CCR BCC CCR BCC CCR BCC CCR BCC CCR BCC CCR
ATEKS 0.661 0.567 1.002 0.989 1.355 0.894 1.106 1.077 1.464 1.436 1.672 1.631 15.950 2.547 20.919 2.497
ARSAN 0.703 0.573 0.929 0.901 1.105 0.240 2.104 2.102 2.199 1.301 3.382 1.269 1.425 1.334 1.155 1.134
BLCYT 4.470 17.127 16.948 12.710 3.522 2.688 0.913 0.896 1.021 1.008 0.952 0.950 0.984 0.941 0.964 0.931
BRKO 0.638 0.521 0.794 0.762 0.822 0.650 0.921 0.770 0.980 0.979 0.720 0.717 0.962 0.924 0.841 0.811
BRMEN 0.651 0.474 1.198 1.195 1.168 0.697 1.242 0.854 1.369 1.213 0.584 0.573 0.748 0.688 1.233 1.104
BISAS 4.480 3.416 16.959 2.917 4.289 0.477 2.110 13.304 2.408 2.072 3.390 2.210 2.846 2.816 20.920 5.266
BOSSA 1.178 1.178 0.848 0.819 0.832 0.793 1.009 1.000 1.241 0.991 0.891 0.891 0.959 0.947 1.225 1.204
DAGI 0.562 0.519 1.147 1.147 1.558 1.460 1.107 1.105 3.919 0.743 0.737 0.713 0.847 0.840 0.862 0.827
DERIM 0.481 0.451 0.650 0.649 0.988 0.587 1.750 1.714 3.627 1.216 1.170 1.164 2.762 2.462 4.263 4.256
DESA 1.143 1.032 1.499 1.426 1.472 0.940 2.078 1.910 2.279 2.130 2.584 2.549 3.104 3.087 3.762 3.710
ESEMS 0.774 0.432 1.355 1.331 4.290 37.761 2.105 13.848 32.800 3.985 2.105 2.079 1.318 1.291 0.840 0.807
HATEK 0.795 0.722 1.570 1.561 1.186 1.111 1.095 1.069 0.995 0.919 0.965 0.931 0.821 0.791 0.961 0.922
IDAS 0.603 0.392 16.958 1.090 0.896 0.222 0.767 0.592 1.083 0.236 2.049 2.044 1.682 1.609 20.920 10.607
KRTEK 0.565 0.514 0.596 0.582 0.939 0.710 0.752 0.749 0.796 0.790 0.651 0.645 0.753 0.740 0.841 0.819
KORDS 0.602 0.582 0.850 0.836 0.966 0.920 1.015 1.009 1.200 1.085 1.018 1.016 15.943 14.732 20.914 3.377
LUKSK 0.571 0.503 0.729 0.712 0.963 0.859 1.139 1.115 1.963 1.021 0.699 0.698 0.805 0.800 0.848 0.823
MNDRS 0.816 0.749 1.094 1.036 1.104 1.073 1.744 1.368 1.164 1.118 1.483 1.239 0.925 0.922 0.974 0.963
MEMSA 0.717 0.326 1.133 0.975 2.601 1.830 1.289 1.008 1.246 1.236 4.420 3.927 7.943 7.263 17.696 12.947
SKTAS 0.544 0.526 0.755 0.752 0.868 0.736 1.083 1.080 1.196 1.019 1.308 1.280 1.333 1.308 1.541 1.531
SNPAM 4.465 3.478 16.957 10.127 3.051 2.114 1.509 1.090 2.085 1.523 4.439 8.000 3.564 3.342 3.533 3.482
YATAS 0.554 0.501 0.789 0.789 0.779 0.582 0.688 0.648 0.673 0.656 0.831 0.830 0.846 0.842 1.131 1.041
YUNSA 0.658 0.565 0.816 0.816 0.868 0.737 1.471 0.883 32.794 0.884 4.438 0.891 1.273 1.106 0.890 0.866

AİBÜ Sosyal Bilimler Enstitüsü Dergisi, 2018, Cilt:18, Yıl:18, Sayı: 4, 18: 115-140
130
4.2.MAUT Application and Ranking
4.2.1.Entropy Weighting
When we analyze the weights according to the years calculated by the
entropy method given in the Table 4, it is observed that they generally
value at similar levels. Criteria 3 and 5 appear to have the lowest weights
in all periods. In this criteria, the alternatives have relatively close values
to each other and the weight values are kept at lower levels. In Criteria 8,
6, and 2, the entropy method assigns high values to these criteria because
variability is high among alternatives. Differences in data relative to years
also have led to differences in weights. This gives sensitivity to the
evaluation of alternatives. According to the changes in the financial
environment, it is expected that the criteria will change between the
levels of importance. For example, the fifth criterion is the lowest
weighted criterion in 2011, and the highest weighted criterion in 2013.
Table 4: Weights Calculated by Entropy Method (2008–2015)
Cri
teria
Cu
rren
t
Ra
tio
Aci
d-T
est
Ra
tio
Fin
an
cia
l
Lev
era
ge
Ra
tio
Rec
eiv
ab
le
turn
ov
er
in
da
ys
Inv
ento
ry
turn
ov
er
in
da
ys
Net
P
rofi
t
Ma
rgin
Ret
urn
o
n
Ass
ets
Ret
urn
o
n
Eq
uit
y
Years (1) (2) (3) (4) (5) (6) (7) (8)
2008 0.199 0.212 0.043 0.079 0.079 0.148 0.086 0.154
2009 0.183 0.201 0.036 0.081 0.078 0.168 0.113 0.141
2010 0.062 0.087 0.024 0.186 0.027 0.116 0.104 0.394
2011 0.141 0.193 0.038 0.045 0.033 0.195 0.196 0.161
2012 0.195 0.256 0.026 0.065 0.041 0.145 0.119 0.153
2013 0.086 0.125 0.018 0.217 0.241 0.161 0.073 0.078
2014 0.071 0.109 0.022 0.173 0.043 0.262 0.126 0.195
2015 0.088 0.129 0.028 0.309 0.033 0.176 0.110 0.126

AİBÜ Sosyal Bilimler Enstitüsü Dergisi, 2018, Cilt:18, Yıl:18, Sayı: 4, 18: 115-140
131
Table 5: MAUT Multi-Utility Function Values
Years
Firms 2008 2009 2010 2011 2012 2013 2014 2015
ATEKS 0.638 0.820 0.936 0.783 0.784 0.974 0.892 0.958
ARSAN 0.669 0.766 0.925 0.701 0.727 0.963 0.815 0.928
BLCYT 0.967 0.968 0.950 0.574 0.719 0.963 0.830 0.940
BRKO 0.782 0.777 0.900 0.694 0.726 0.944 0.837 0.909
BRMEN 0.529 0.770 0.906 0.765 0.717 0.946 0.776 0.884
BISAS 0.909 0.881 0.960 0.830 0.901 0.983 0.948 0.983
BOSSA 0.615 0.774 0.918 0.640 0.769 0.957 0.865 0.953
DAGI 0.771 0.890 0.946 0.640 0.618 0.912 0.855 0.948
DERIM 0.561 0.789 0.921 0.689 0.771 0.957 0.833 0.934
DESA 0.382 0.494 0.868 0.532 0.595 0.926 0.766 0.902
ESEMS 0.847 0.904 0.979 0.944 0.986 0.993 0.942 0.953
HATEK 0.824 0.893 0.912 0.771 0.777 0.968 0.873 0.952
IDAS 0.419 0.782 0.850 0.433 0.658 0.943 0.633 0.908
KRTEK 0.540 0.820 0.924 0.657 0.776 0.949 0.839 0.948
KORDS 0.710 0.842 0.941 0.752 0.799 0.968 0.913 0.968
LUKSK 0.484 0.764 0.900 0.649 0.704 0.949 0.823 0.924
MNDRS 0.693 0.853 0.945 0.735 0.794 0.965 0.880 0.954
MEMSA 0.275 0.019 0.046 0.365 0.316 0.000 0.189 0.014
SKTAS 0.637 0.801 0.931 0.723 0.767 0.963 0.879 0.954
SNPAM 0.754 0.665 0.927 0.671 0.738 0.961 0.894 0.949
YATAS 0.435 0.753 0.887 0.508 0.528 0.933 0.796 0.928
YUNSA 0.530 0.753 0.904 0.617 0.724 0.948 0.827 0.918
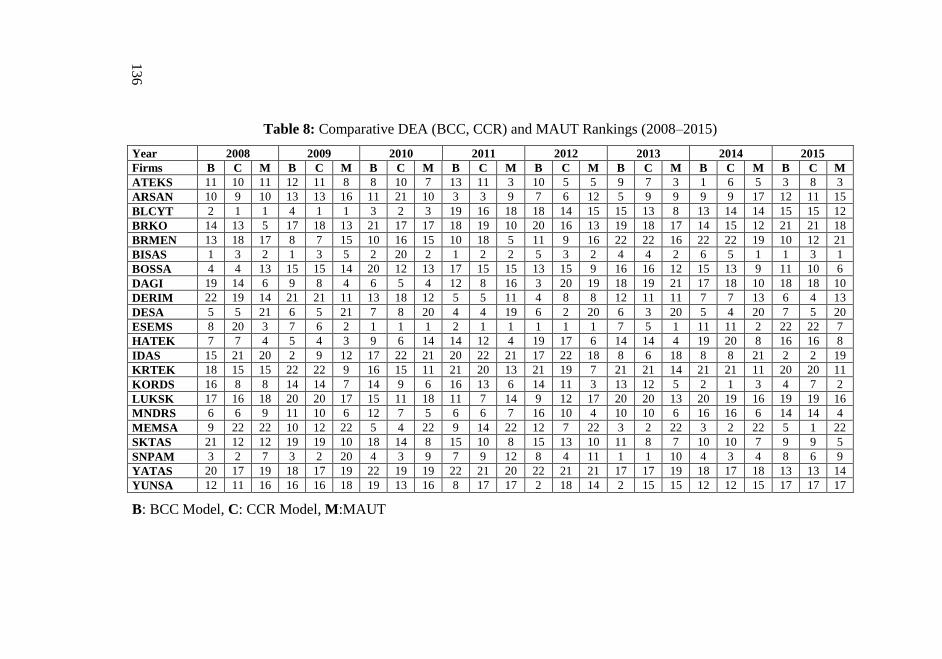
Table 5 lists the MAUT multi-utility function values of firms. Table 8
also lists the financial performance analysis rankings of companies
according to the MAUT method in 2008–2015. It is seen that BISAS and
ESEMS firms have received the first two orders with close performance.
KORDS and ATEKS firms steadily increased their financial
performances and obtained third and fourth orders. YATAS, IDAS,
DESA, and MEMSA were in the last place with poor performances in all
periods. MNDRS, HATEK, and SKTAS companies achieved a
moderately stable performance. BLCYT and DAGI have attracted
attention with their falling performances. The performances of other
firms followed a low level of performance.
4.2.2.The Correlation Results of MAUT Method and CRR and
BCC Models of DEA
Correlation is one of the easiest ways to compare models. High
correlation reveals the similarity of the results obtained by the models.
For this purpose, correlations of model rankings were calculated first.
AİBÜ Sosyal Bilimler Enstitüsü Dergisi, 2018, Cilt:18, Yıl:18, Sayı: 4, 18: 115-140
132
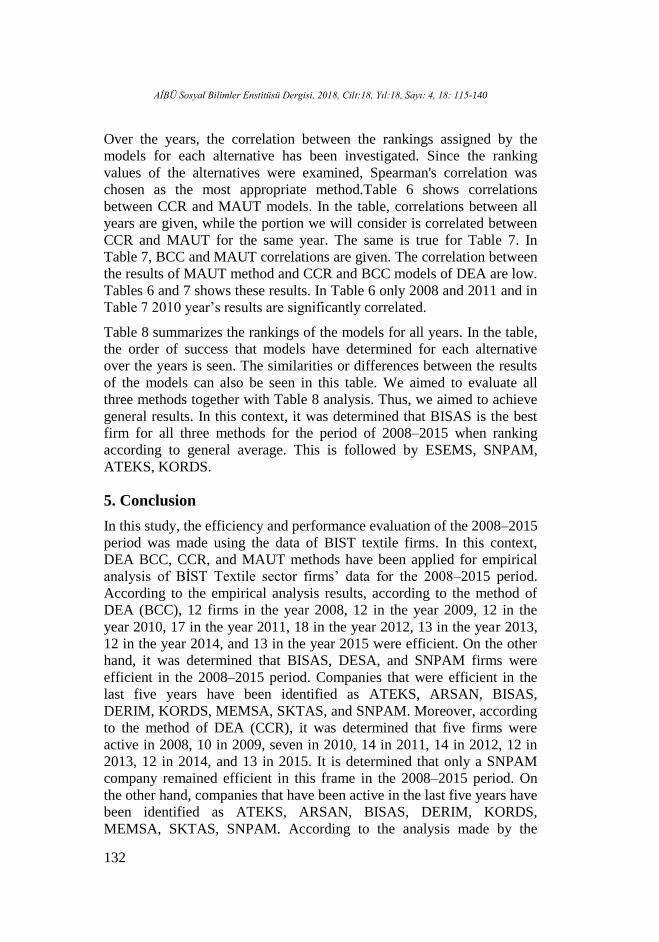
Over the years, the correlation between the rankings assigned by the
models for each alternative has been investigated. Since the ranking
values of the alternatives were examined, Spearman's correlation was
chosen as the most appropriate method.Table 6 shows correlations
between CCR and MAUT models. In the table, correlations between all
years are given, while the portion we will consider is correlated between
CCR and MAUT for the same year. The same is true for Table 7. In
Table 7, BCC and MAUT correlations are given. The correlation between
the results of MAUT method and CCR and BCC models of DEA are low.
Tables 6 and 7 shows these results. In Table 6 only 2008 and 2011 and in
Table 7 2010 year’s results are significantly correlated.
Table 8 summarizes the rankings of the models for all years. In the table,
the order of success that models have determined for each alternative
over the years is seen. The similarities or differences between the results
of the models can also be seen in this table. We aimed to evaluate all
three methods together with Table 8 analysis. Thus, we aimed to achieve
general results. In this context, it was determined that BISAS is the best
firm for all three methods for the period of 2008–2015 when ranking
according to general average. This is followed by ESEMS, SNPAM,
ATEKS, KORDS.
5. Conclusion
In this study, the efficiency and performance evaluation of the 2008–2015
period was made using the data of BIST textile firms. In this context,
DEA BCC, CCR, and MAUT methods have been applied for empirical
analysis of BİST Textile sector firms’ data for the 2008–2015 period.
According to the empirical analysis results, according to the method of
DEA (BCC), 12 firms in the year 2008, 12 in the year 2009, 12 in the
year 2010, 17 in the year 2011, 18 in the year 2012, 13 in the year 2013,
12 in the year 2014, and 13 in the year 2015 were efficient. On the other
hand, it was determined that BISAS, DESA, and SNPAM firms were
efficient in the 2008–2015 period. Companies that were efficient in the
last five years have been identified as ATEKS, ARSAN, BISAS,
DERIM, KORDS, MEMSA, SKTAS, and SNPAM. Moreover, according
to the method of DEA (CCR), it was determined that five firms were
active in 2008, 10 in 2009, seven in 2010, 14 in 2011, 14 in 2012, 12 in
2013, 12 in 2014, and 13 in 2015. It is determined that only a SNPAM
company remained efficient in this frame in the 2008–2015 period. On
the other hand, companies that have been active in the last five years have
been identified as ATEKS, ARSAN, BISAS, DERIM, KORDS,
MEMSA, SKTAS, SNPAM. According to the analysis made by the
AİBÜ Sosyal Bilimler Enstitüsü Dergisi, 2018, Cilt:18, Yıl:18, Sayı: 4, 18: 115-140
133
MAUT method, ESEMS firm showed the highest performance in the
whole period; further, it was determined that it followed BISAS,
HATEK, BLCYT, and KORDS firms.
In this study, the efficiency and performance orders obtained with the
DEA (BCC), DEA (CCR), and MAUT methods were examined together
and then compared. Accordingly, it was seen that BISAS was the most
successful company during the whole period for the three methods. The
following companies were found to be ESEMS, SNPAM, ATEKS, and
KORDS.
In line with the purpose of the study, the financial outlook of firms in the
textile sector has been tried to be demonstrated by different MCDM
methods. In this way, sectoral stakeholders and investors have been
provided with tools to evaluate. The preference rankings obtained by
different MCDM methods are compared and the differences of the results
reached are illustrated. The determination of the most appropriate method
is beyond the scope of this study.
In subsequent studies, the findings will vary widely, as the input and
output variables differ. For this reason, the studies to be done with
different input and output variables can be evaluated by comparing with
this study.
In this study, the efficiency and performance measurement methods were
compared with each other and evaluated. In the efficiency and
performance measurement studies, an evaluation can be made by
comparing the results obtained in this study, using different sectors and
criteria. For this reason, it is expected that the results obtained in this
study will provide guidance for new efficiency and performance analysis.
In this framework, different activities can be done that can be used
together with other efficiency or performance measurement methods.

134
Table 6: Correlation of CCR Ranks and MAUT Ranks with Sperman Tests
2008
CCR
2009
CCR
2010
CCR
2011
CCR
2012
CCR
2013
CCR
2014
CCR
2015
CCR
2008
M
2009
M
2010
M
2011
M
2012
M
2013
M
2014
M
2015
M
2008
CCR
1 0.456* 0.246 0.243 0.213 0.182 0.170 0.072 0.514* 0.195 0.422 0.184 0.319 0.420 0.448* 0.493*
. 0.033 0.271 0.275 0.342 0.417 0.450 0.751 0.014 0.385 0.051 0.414 0.148 0.052 0.037 0.020
2009
CCR
0.456* 1 0.470* 0.264 0.371 0.455* 0.189 0.193 0.441* 0.285 0.335 0.160 0.055 0.241 0.190 0.124
0.033 . 0.027 0.236 0.089 0.034 0.399 0.391 0.040 0.198 0.128 0.477 0.809 0.280 0.396 0.584
2010
CCR
0.246 0.470* 1 0.254 0.269 0.223 0.075 -0.214 0.324 0.246 0.330 0.024 0.077 0.170 0.296 0.191
0.271 0.027 . 0.255 0.225 0.318 0.740 0.339 0.142 0.271 0.133 0.915 0.732 0.450 0.180 0.393
2011
CCR
0.243 0.264 0.254 1 0.745** 0.471* 0.331 0.104 0.335 0.194 0.491* 0.452* 0.389 0.469* 0.414 0.364
0.275 0.236 0.255 . 0.000 0.027 0.132 0.644 0.128 0.388 0.020 0.035 0.074 0.028 0.056 0.096
2012
CCR
0.213 0.371 0.269 0.745** 1 0.642** 0.561** 0.340 0.161 -0.074 0.310 0.460* 0.344 0.426* 0.295 0.177
0.342 0.089 0.225 0.000 . 0.001 0.007 0.121 0.474 0.744 0.160 0.031 0.117 0.048 0.182 0.431
2013
CCR
0.182 0.455* 0.223 0.471* 0.642** 1 0.836** 0.657** 0.049 -0.107 0.123 0.049 0.155 0.266 0.187 0.162
0.417 0.034 0.318 0.027 0.001 . 0.000 0.001 0.828 0.636 0.587 0.828 0.490 0.232 0.405 0.471
2014
CCR
0.170 0.189 0.075 0.331 0.561** 0.836** 1 0.755** -0.045 -0.229 0.055 -0.037 0.118 0.151 0.154 0.147
0.450 0.399 0.740 0.132 0.007 0.000 . 0.000 0.844 0.306 0.809 0.871 0.601 0.503 0.493 0.513
2015
CCR
0.072 0.193 -0.214 0.104 0.340 0.657** 0.755** 1 -0.336 -0.326 -0.199 -0.174 -0.107 -0.062 -0.143 -0.011
0.751 0.391 0.339 0.644 0.121 0.001 0.000 . 0.126 0.139 0.374 0.437 0.636 0.786 0.526 0.962
2008
M
0.514* 0.441* 0.324 0.335 0.161 0.049 -0.045 -0.336 1 0.759** 0.809** 0.596** 0.617** 0.671** 0.746** 0.630**
0.014 0.040 0.142 0.128 0.474 0.828 0.844 0.126 . 0.000 0.000 0.003 0.002 0.001 0.000 0.002
2009
M
0.195 0.285 0.246 0.194 -0.074 -0.107 -0.229 -0.326 0.759** 1 0.770** 0.543** 0.626** 0.636** 0.616** 0.642**
0.385 0.198 0.271 0.388 0.744 0.636 0.306 0.139 0.000 . 0.000 0.009 0.002 0.001 0.002 0.001
2010
M
0.422 0.335 0.330 0.491* 0.310 0.123 0.055 -0.199 0.809** 0.770** 1 0.618** 0.694** 0.728** 0.804** 0.787**
0.051 0.128 0.133 0.020 0.160 0.587 0.809 0.374 0.000 0.000 . 0.002 0.000 0.000 0.000 0.000
2011
M
0.184 0.160 0.024 0.452* 0.460* 0.049 -0.037 -0.174 0.596** 0.543** 0.618** 1 0.832** 0.815** 0.735** 0.628**
0.414 0.477 0.915 0.035 0.031 0.828 0.871 0.437 0.003 0.009 0.002 . 0.000 0.000 0.000 0.002
2012
M
0.319 0.055 0.077 0.389 0.344 0.155 0.118 -0.107 0.617** 0.626** 0.694** 0.832** 1 0.892** 0.861** 0.811**
0.148 0.809 0.732 0.074 0.117 0.490 0.601 0.636 0.002 0.002 0.000 0.000 . 0.000 0.000 0.000
2013
M
0.420 0.241 0.170 0.469* 0.426* 0.266 0.151 -0.062 0.671** 0.636** 0.728** 0.815** 0.892** 1 0.798** 0.798**
0.052 0.280 0.450 0.028 0.048 0.232 0.503 0.786 0.001 0.001 0.000 0.000 0.000 . 0.000 0.000
2014
M
0.448* 0.190 0.296 0.414 0.295 0.187 0.154 -0.143 0.746** 0.616** 0.804** 0.735** 0.861** 0.798** 1 0.919**
0.037 0.396 0.180 0.056 0.182 0.405 0.493 0.526 0.000 0.002 0.000 0.000 0.000 0.000 . 0.000
2015
M
0.493* 0.124 0.191 0.364 0.177 0.162 0.147 -0.011 0.630** 0.642** 0.787** 0.628** 0.811** 0.798** 0.919** 1
0.020 0.584 0.393 0.096 0.431 0.471 0.513 0.962 0.002 0.001 0.000 0.002 0.000 0.000 0.000 .
*Correlation is significant at the 0.05 level (2-tailed), **Correlation is significant at the 0.01 level (2-tailed), M:MAUT, CCR: Charnes Cooper
Rhodes Model

13
5
Table 7: Correlation of BCC Ranks and MAUT Ranks with Sperman Tests
2008
M
2009
M
2010
M
2011
M
2012
M
2013
M
2014
M
2015
M
2008
BCC
2009
BCC
2010
BCC
2011
BCC
2012
BCC
2013
BCC
2014
BCC
2015
BCC
2008
M
1.000 0.759** 0.809** 0.596** 0.617** 0.671** 0.746** 0.630** 0.382 0.336 0.430* 0.137 0.064 0.008 0.014 -0.248
0.000 0.000 0.003 0.002 0.001 0.000 0.002 0.079 0.126 0.046 0.543 0.778 0.970 0.950 0.266
2009
M
0.759** 1.000 0.770** 0.543** 0.626** 0.636** 0.616** 0.642** 0.092 0.229 0.330 -0.073 -0.066 -0.231 -0.141 -0.189
0.000
0.000 0.009 0.002 0.001 0.002 0.001 0.684 0.306 0.133 0.747 0.770 0.301 0.533 0.399
2010
M
0.809** 0.770** 1.000 0.618** 0.694** 0.728** 0.804** 0.787** 0.244 0.212 0.500* 0.266 0.266 0.069 0.110 -0.080
0.000 0.000
0.002 0.000 0.000 0.000 0.000 0.273 0.344 0.018 0.232 0.232 0.759 0.626 0.725
2011
M
0.596** 0.543** 0.618** 1.000 0.832** 0.815** 0.735** 0.628** 0.141 0.088 0.281 0.372 0.177 -0.015 0.033 -0.006
0.003 0.009 0.002
0.000 0.000 0.000 0.002 0.533 0.699 0.206 0.088 0.431 0.946 0.883 0.978
2012
M
0.617** 0.626** 0.694** 0.832** 1.000 0.892** 0.861** 0.811** 0.222 0.011 0.184 0.254 0.097 0.116 0.159 0.025
0.002 0.002 0.000 0.000
0.000 0.000 0.000 0.321 0.962 0.414 0.255 0.669 0.608 0.481 0.911
2013
M
0.671** 0.636** 0.728** 0.815** 0.892** 1.000 0.798** 0.798** 0.335 0.165 0.328 0.282 0.106 0.203 0.207 0.080
0.001 0.001 0.000 0.000 0.000
0.000 0.000 0.128 0.462 0.136 0.204 0.640 0.366 0.355 0.725
2014
M
0.746** 0.616** 0.804** 0.735** 0.861** 0.798** 1.000 0.919** 0.237 0.110 0.278 0.194 0.153 0.121 0.191 -0.014
0.000 0.002 0.000 0.000 0.000 0.000
0.000 0.289 0.626 0.210 0.388 0.497 0.590 0.393 0.950
2015
M
0.630** 0.642** 0.787** 0.628** 0.811** 0.798** 0.919** 1.000 0.181 0.050 0.176 0.060 0.022 0.073 0.185 0.134
0.002 0.001 0.000 0.002 0.000 0.000 0.000
0.420 0.824 0.434 0.789 0.923 0.747 0.411 0.553
2008
BCC
0.382 0.092 0.244 0.141 0.222 0.335 0.237 0.181 1.000 0.704** 0.569** 0.378 0.135 0.464* 0.234 0.138
0.079 0.684 0.273 0.533 0.321 0.128 0.289 0.420
0.000 0.006 0.083 0.549 0.030 0.294 0.539
2009
BCC
0.336 0.229 0.212 0.088 0.011 0.165 0.110 0.050 0.704** 1.000 0.700** 0.290 0.176 0.435* 0.281 0.333
0.126 0.306 0.344 0.699 0.962 0.462 0.626 0.824 0.000
0.000 0.191 0.434 0.043 0.206 0.130
2010
BCC
0.430* 0.330 0.500* 0.281 0.184 0.328 0.278 0.176 0.569** 0.700** 1.000 0.580** 0.471* 0.397 0.338 0.165
0.046 0.133 0.018 0.206 0.414 0.136 0.210 0.434 0.006 0.000
0.005 0.027 0.067 0.124 0.462
2011
BCC
0.137 -0.073 0.266 0.372 0.254 0.282 0.194 0.060 0.378 0.290 0.580** 1.000 0.809** 0.602** 0.343 0.151
0.543 0.747 0.232 0.088 0.255 0.204 0.388 0.789 0.083 0.191 0.005
0.000 0.003 0.118 0.503
2012
BCC
0.064 -0.066 0.266 0.177 0.097 0.106 0.153 0.022 0.135 0.176 0.471* 0.809** 1.000 0.488* 0.344 0.093
0.778 0.770 0.232 0.431 0.669 0.640 0.497 0.923 0.549 0.434 0.027 0.000
0.021 0.117 0.680
2013
BCC
0.008 -0.231 0.069 -0.015 0.116 0.203 0.121 0.073 0.464* 0.435* 0.397 0.602** 0.488* 1.000 0.746** 0.455*
0.970 0.301 0.759 0.946 0.608 0.366 0.590 0.747 0.030 0.043 0.067 0.003 0.021
0.000 0.034
2014
BCC
0.014 -0.141 0.110 0.033 0.159 0.207 0.191 0.185 0.234 0.281 0.338 0.343 0.344 0.746** 1.000 0.715**
0.950 0.533 0.626 0.883 0.481 0.355 0.393 0.411 0.294 0.206 0.124 0.118 0.117 0.000
0.000
2015
BCC
-0.248 -0.189 -0.080 -0.006 0.025 0.080 -0.014 0.134 0.138 0.333 0.165 0.151 0.093 0.455* 0.715** 1.000
0.266 0.399 0.725 0.978 0.911 0.725 0.950 0.553 0.539 0.130 0.462 0.503 0.680 0.034 0.000
*Correlation is significant at the 0.05 level (2-tailed), **Correlation is significant at the 0.01 level (2-tailed), BCC: Banker Charnes Cooper Model
136
Table 8: Comparative DEA (BCC, CCR) and MAUT Rankings (2008–2015)
Year 2008 2009 2010 2011 2012 2013 2014 2015
Firms B C M B C M B C M B C M B C M B C M B C M B C M
ATEKS 11 10 11 12 11 8 8 10 7 13 11 3 10 5 5 9 7 3 1 6 5 3 8 3
ARSAN 10 9 10 13 13 16 11 21 10 3 3 9 7 6 12 5 9 9 9 9 17 12 11 15
BLCYT 2 1 1 4 1 1 3 2 3 19 16 18 18 14 15 15 13 8 13 14 14 15 15 12
BRKO 14 13 5 17 18 13 21 17 17 18 19 10 20 16 13 19 18 17 14 15 12 21 21 18
BRMEN 13 18 17 8 7 15 10 16 15 10 18 5 11 9 16 22 22 16 22 22 19 10 12 21
BISAS 1 3 2 1 3 5 2 20 2 1 2 2 5 3 2 4 4 2 6 5 1 1 3 1
BOSSA 4 4 13 15 15 14 20 12 13 17 15 15 13 15 9 16 16 12 15 13 9 11 10 6
DAGI 19 14 6 9 8 4 6 5 4 12 8 16 3 20 19 18 19 21 17 18 10 18 18 10
DERIM 22 19 14 21 21 11 13 18 12 5 5 11 4 8 8 12 11 11 7 7 13 6 4 13
DESA 5 5 21 6 5 21 7 8 20 4 4 19 6 2 20 6 3 20 5 4 20 7 5 20
ESEMS 8 20 3 7 6 2 1 1 1 2 1 1 1 1 1 7 5 1 11 11 2 22 22 7
HATEK 7 7 4 5 4 3 9 6 14 14 12 4 19 17 6 14 14 4 19 20 8 16 16 8
IDAS 15 21 20 2 9 12 17 22 21 20 22 21 17 22 18 8 6 18 8 8 21 2 2 19
KRTEK 18 15 15 22 22 9 16 15 11 21 20 13 21 19 7 21 21 14 21 21 11 20 20 11
KORDS 16 8 8 14 14 7 14 9 6 16 13 6 14 11 3 13 12 5 2 1 3 4 7 2
LUKSK 17 16 18 20 20 17 15 11 18 11 7 14 9 12 17 20 20 13 20 19 16 19 19 16
MNDRS 6 6 9 11 10 6 12 7 5 6 6 7 16 10 4 10 10 6 16 16 6 14 14 4
MEMSA 9 22 22 10 12 22 5 4 22 9 14 22 12 7 22 3 2 22 3 2 22 5 1 22
SKTAS 21 12 12 19 19 10 18 14 8 15 10 8 15 13 10 11 8 7 10 10 7 9 9 5
SNPAM 3 2 7 3 2 20 4 3 9 7 9 12 8 4 11 1 1 10 4 3 4 8 6 9
YATAS 20 17 19 18 17 19 22 19 19 22 21 20 22 21 21 17 17 19 18 17 18 13 13 14
YUNSA 12 11 16 16 16 18 19 13 16 8 17 17 2 18 14 2 15 15 12 12 15 17 17 17
B: BCC Model, C: CCR Model, M:MAUT
AİBÜ Sosyal Bilimler Enstitüsü Dergisi, 2018, Cilt:18, Yıl:18, Sayı: 4, 18: 115-140
137
References
Alp, İhsan, Öztel, Ahmet ve Köse, Mehmet Said (2015). “Entropi Tabanlı
MAUT Yöntemi ile Kurumsal Sürdürülebilirlik Performansı
Ölçümü: Bir Vaka Çalışması”. Ekonomik ve Sosyal Araştırmalar
Dergisi 11(2): 65-81.
Andersen Per and Petersen, Niels Christian (1993). “A procedure for
ranking efficient units in data envelopment analysis”.
Management Science 39(10): 1261-1264.
Ashour, Omar M. and Kremer, Gül E. Okudan (2013). “A Simulation
Analysis of the Impact of FAHP-MAUT Triage Algorithm on the
Emergency Depermant Performance Measures”. Expert Systems
with Application (40): 177-187.
Atıcı, Kazım Barış, Şimşek, Ahmet Bahadır, Ulucan, Aydın ve Tosun,
Mustafa Umur (2016). “Veri Zarflama Analizi ile Uygulama
Alanı Türkiye Olan Performans Ölçümü Çalışmaları: Literatür
Araştırması ve Değerlendirmeler”. Verimlilik Dergisi (1): 7-47.
Banker, R.D., Charnes, A., and Cooper, W.W. (1984). “Some models for
estimating technical and scale inefficiencies in data envelopment
analysis”. Management Science 30(9): 1078–1092.
Başkaya, Zehra, and Öztürk, Burcu Avcı (2012). “Measuring Financial
Efficiency of Cement Firms Listed in Istanbul Stock Exchange
via Fuzzy Data Envelopment Analy sis”. Muhasebe ve
Finansman Dergisi (54): 175-188.
Chandra, Pankaj, Cooper, William W., Li, Shangling, and Rahman,
Atiqur (1998). “Using DEA To evaluate 29 Canadian textile
companies-Considering returns to scale”. International Journal of
Production Economics (54): 129-141.
Charnes, Abraham, Cooper William W., and Rhodes E. (1978).
“Measuring the efficiency of decision making units”. European
Journal of Operational Research 2(6): 429-444.
Charnes, Abraham, Cooper, William W., Lewin, Arie Y., and Sieford,
Lawrence M. (1998). "Data envelopment analysis: theory
methodology and applications”, Massachusetts, USA.
Choo, Eng U., Schoner, Bertram, and Wedley, William C. (1999).
“Interpretation of criteria weights in multicriteria decision
making”. Computers & Industrial Engineering 37(3): 527-541.
AİBÜ Sosyal Bilimler Enstitüsü Dergisi, 2018, Cilt:18, Yıl:18, Sayı: 4, 18: 115-140
138
Cook Wade D. and Seiford Larry M., (2009). “Data envelopment analysis
(DEA) – Thirty years on”. European Journal of Operational
Research (192): 1-17.
Çetin, Ali Cüneyt (2006). “Türk Tekstil Sektörü ve Türk Tekstil
Firmalarının Etkinlik Düzeylerinin Belirlenmesi”. Afyon
Kocatepe Üniversitesi İ.İ.B.F. Dergisi 8(2): 255-278.
De Montis, Andrea, Barthélemy, Marc, Chessa, Alessandro, and
Vespignani, Alessandro (2005). “The structure of inter-urban
traffic: A weighted network analysis” 1-12.
(https://arxiv.org/pdf/physics/0507106.pdf, 17 Ağustos 2016’da
erişildi).
Deng, Hepu, Yeh, Chung-Hsing, and Willis, Robert J. (2000). “Inter-
company comparison using modified TOPSIS with objective
weights”. Computers & Operations Research (27): 963-973. (doi:
http://dx.doi.org/10.1016/S0305-0548(99)00069-6).
Emrouznejad, Ali, Parker Barnett R., and Tavares Gabriel (2008).
“Evaluation of research in efficiency and productivity: A survey
and analysis of the first 30 years of scholarly literature in DEA”.
Socio-Economic Planning Sciences 42(3): 151-157.
Erdoğan, Muammer, ve Yıldız, Bülent (2015). “Sağlık İşletmelerinde
Finansal Oranlar Aracılığıyla Performans Ölçümü: Hastanelerde
Bir Uygulama”. Kafkas Üniversitesi İktisadi ve İdari Bilimler
Fakültesi Dergisi 6(9): 129-148.
Erol, Ismail, Sencer, Safiye, and Sari, Ramazan (2011). “A new fuzzy
multi-criteria framework for measuring sustainability
performance of a supply chain”. Ecological Economics (70):
1088-1100. (doi:
http://dx.doi.org/10.1016/j.ecolecon.2011.01.001).
Hwang, C.-L. and Yoon, K. (1981). “Lecture Notes in Economics and
Mathematical Systems: Multiple Attribute Decision Making:
Methods and Appllication”: Springer Verlag.
Islamoglu, Mehmet, Apan, Mehmet, and Oztel, Ahmet (2015). “An
Evaluation of the Financial Performance of REITs in Borsa
Istanbul: A Case Study Using the Entropy-Based TOPSIS
Method”. International Journal of Financial Research 6(2): 124-
138.
Jahanshahloo, G. R. and Khodabakhshi, M. (2004). “Suitable
combination of inputs for improving outputs in DEA with
AİBÜ Sosyal Bilimler Enstitüsü Dergisi, 2018, Cilt:18, Yıl:18, Sayı: 4, 18: 115-140
139
determining input congestion Considering textile industry of
China”. Applied Mathematics and Computation (151): 263-273.
Kahveci, Eyüp (2012). “Kaynak Temelli Strateji ve İhracat Performansı:
Tekstil İşletmeleri Üzerinde Veri Zarflama Analizi ile Bir
Uygulama”. Ankara Üniversitesi SBF Dergisi 67(2): 29-67.
Kayalı, Cevdet Alptekin (2009). “2007 Yılı Tekstil İşletmelerinin
Finansal Karlılık Açısından Etkinliklerinin Değerlendirilmesi”.
Tekstil ve Konfeksiyon 19(1): 3-8.
Kayalıdere, Koray ve Kargın, Sibel (2004). “Çimento ve Tekstil
Sektörlerinde Etkinlik Çalışması ve Veri Zarflama Analizi”.
Dokuz Eylül Üniversitesi Sosyal Bilimler Enstitüsü Dergisi 6(1):
196-219.
Keeney, Ralph L. (1977). “The art of assessing multiattribute utility
functions”. Organizational Behavior and Human Performance
19(2): 267-310.
Keeney, Ralph L. and Raiffa, Howard (1993). “Decisions with multiple
objectives: preferences and value trade-offs”: Cambridge
University Press.
Kula, Veysel ve Özdemir, Letife (2007). “Çimento Sektöründe Göreceli
Etkinsizlik Alanlarının Veri Zarflama Analizi Yöntemi ile
Tespiti”. Afyon Kocatepe Üniversitesi İktisadi ve İdari Bilimler
Fakültesi Dergisi 9(1): 55-70.
Kula, Veysel, Kandemir, Tuğrul ve Özdemir, Letife (2009). “VZA
Malmquist Toplam Faktör Verimlilik Ölçüsü: İMKB’ye Koteli
Çimento Şirketleri Üzerine Bir Araştırma”. Sosyal Ekonomik
Araştırmalar Dergisi 9(17): 187-202.
Olson, David L. (1995). “Decision aids for selection problems”: Springer
Science & Business Media.
Ömürbek, Nuri, Karaatlı, Meltem ve Balcı, Halil Furkan (2016). “Entropi
Tabanlı MAUT ve SAW Yöntemleri ile Otomotiv Firmalarının
Performans Değerlemesi”. Dokuz Eylül Üniversitesi, İktisadi ve
İdari Bilimler Fakültesi Dergisi 31(1): 227-255.
Öztürk, Oğuzhan and Girginer, Nuray (2015). “The Export Efficiency of
Turkish Textile and Appreal Firms: An Investigation Employing
Data Envolepment Analysis (DEA) and Analytic Hierarchy
Process(AHP) Methods”. Tekstil ve Konfeksiyon 25(1): 10-23.
AİBÜ Sosyal Bilimler Enstitüsü Dergisi, 2018, Cilt:18, Yıl:18, Sayı: 4, 18: 115-140
140
Ray, Subhash C. (2004). “Data Envelopment Analysis: Theory and
Techniques for Economics and Operations Research”, Cambridge
University Pres.
Yayar, Rüştü ve Çoban, Mustafa Necati (2012). “İSO 500 Firmalarının
Etkinliklerinin Ölçülmesinde Veri Zarflama Analizi Yaklaşımı:
Dokuma ve Giyim Eşya Sanayi”. Niğde Üniversitesi İİBF Dergisi
5(2): 165-180.
Yenilmez, Füsun and Girginer, Nuray (2012). “Assessing Export
Performance of Textile Companies in Eskişehir Organized
Industrial Zone by Use of Data Envelopment Analysis (DEA)”.
Tekstil ve Konfeksiyon 22(1): 12-17.
Zardari, Noorul Hassan, Ahmed, Kamal, Shirazi, Sharif Moniruzzaman,
and Yusop, Zulkifli Bin (2014). “Weighting Methods and Their
Effects on Multi-Criteria Decision Making Model Outcomes in
Water Resources Management”: Springer.
Zietsman, Josias, Rilett, Laurence R., and Kim, Seung-Jun (2006).
“Transportation corridor decision-making with multi-attribute
utility theory”. International Journal of Management and
Decision Making 7(2-3): 254-266