CEN/TC 264/WG 17 N 147 - VDI Verein Deutscher Ingenieure ... · CRT – Centre de Recherche de...
20
1, avenue Albert Einstein BP 120 - F-78193 Trappes cedex Tél.: +33 (0)1 30 66 27 27 Fax : +33 (0)1 30 66 28 76 Fax labo. : +33 (0)1 30 66 27 28 www.crt-trappes.fr Société par Actions Simplifiée au capital de 1 410 015 Euros - Siret 301 608 634 00012 - APE 731 Z - RCS Versailles 301 608 634 b N° d'identification TVA : FR 20 301 608 634 48.03.154 / CD Trappes, le 10 mars 2009 C. DESNOYERS STANDARDISATION OF FUGITIVE AND DIFFUSE DUST EMISSION RATE ESTIMATES BY REVERSE DISPERSION MODELLING ROUND ROBIN TEST AT CORUS PLANT (NL) EVALUATION OF RESULTS FOLLOWING ISO 5725° DISTRIBUTION : CEN/TC264/WG17 ERAMET CRT-Trappes F. HENKS C. TISSOT-COLLE M-F. MESCHI-DANIEL J. WOLF C. PLAZANET DOCUMENTATION KEYWORDS : FUGITIVE DUST – EMISSION RATE – REVERSE DISPERSION MODELLING – STANDARDISATION – ROUND ROBIN TEST - EVALUATION CEN/TC 264/WG 17 N 147
Transcript of CEN/TC 264/WG 17 N 147 - VDI Verein Deutscher Ingenieure ... · CRT – Centre de Recherche de...
1, avenue Albert Einstein BP 120 - F-78193 Trappes cedex Tél.: +33 (0)1 30 66 27 27 Fax : +33 (0)1 30 66 28 76 Fax labo. : +33 (0)1 30 66 27 28 www.crt-trappes.fr
Société par Actions Simplifiée au capital de 1 410 015 Euros - Siret 301 608 634 00012 - APE 731 Z - RCS Versailles 301 608 634 b N° d'identification TVA : FR 20 301 608 634
48.03.154 / CD Trappes, le 10 mars 2009 C. DESNOYERS
STANDARDISATION OF FUGITIVE AND DIFFUSE DUST EMISSION RATE ESTIMATES
BY REVERSE DISPERSION MODELLING
ROUND ROBIN TEST AT CORUS PLANT (NL)
EVALUATION OF RESULTS FOLLOWING ISO 5725°
DISTRIBUTION : CEN/TC264/WG17 ERAMET CRT-Trappes F. HENKS C. TISSOT-COLLE M-F. MESCHI-DANIEL J. WOLF C. PLAZANET DOCUMENTATION
KEYWORDS : FUGITIVE DUST – EMISSION RATE – REVERSE DISPERSION MODELLING – STANDARDISATION – ROUND ROBIN TEST - EVALUATION
CEN/TC 264/WG 17 N 147

CRT – Centre de Recherche de Trappes- 2/20 - CARACTERISATION-ANALYSE C. DESNOYERS 48.05.154/CD.
1. Introduction The working group CEN/TC264/WG17 has prepared a draft standard which describes a method to estimate Fugitive Dust Emission Rates by Reverse Dispersion Modelling (RDM). This document (WG17 N140) contains the general description of the method RDM (calculation procedure) and the requirements for dust samplers (fine and coarse dust) and dispersion models. A Round Robin Test was carried out at CORUS steel plant (Ijmuiden, NL) from 15 February till 15 April 2005, to implement the method by several laboratories and to proceed to evaluation of the results (ISO 5725) to determine the repeatability and the Reproducibility of the RDM method in order to finalise the draft standard. A map of the experimental setup at CORUS plant is given in Annexe 2 ; it displays : - areas of the two fugitive dust sources (S1 and S2) of the plant under investigation ; - areas of the background dust sources (S3 to S9) outside the plant ; - the available sampling locations to install dust samplers. Six laboratories participate in this RRT. - Fine dust sampling Five laboratories have carried out hourly measurements of fine dust concentrations, each one using a set of 3 appropriate samplers, and have performed the calculation of emission rate estimates of sources by using the dispersion model “Fugitive Dust Model” (FDM) built by EPA (1993), following the procedure indicate in the draft standard. Sampler type Sampling locations Lab 1 (France) Osiris L (0,6 l/min) 1, 3, 4 Lab 2 (Germany) TEOM (2 l/min) 1, 2, 3 Lab 3 (Germany) E-BAM (b) 2, 3 Osiris (0,6 l/min) 5
Lab 4 (Belgium) Grimm L (1,2 l/min) 1, 2, 4
Lab 5 (The Netherlands) TEOM (2 l/min) 2, 4, 5
-Coarse dust sampling The coarse dust hourly measurements have been carried out by another laboratory (BLAW, The Netherlands) with 4 available coarse dust samplers installed in sampling locations 1 ,2, 3 and 4. Different combinations of data set have been provide to the 5 five laboratories to perform the calculation of emission rate estimates of sources by using the same FDM model. Coarse dust data set Lab 1 (France) 1 – 3 – 4 Lab 2 (Germany) 1 – 2 – 3 Lab 3 (Germany) 1 – 2 – 3 Lab 4 (Belgium) 1 – 2 – 4 Lab 5 (The Netherlands) 1 – 2 - 4
CRT – Centre de Recherche de Trappes- 3/20 - CARACTERISATION-ANALYSE C. DESNOYERS 48.05.154/CD.
With this RRT protocol, the repeatability and Reproducibility provided by the results evaluation take into account the variability resulting from the different experimental setup (set of sampling locations) for each laboratory.
2. Results from laboratories The task of each laboratory was to determine the regular emission rate estimate of the plant dust sources S1 and S2, taking into account the outside background sources which contribute to dust at the sampling locations , by using their hourly dust measurements data, general and hourly meteorological data through mathematical treatment which comprises the following steps (specified in the draft standard) : - Determination of correlation coefficient R2c between dust concentrations of sets of 2 samplers (different sampling locations) : R2c value near 1 indicates that dust concentrations of two samplers are dominated by background dust ; - Determination of the dispersion factor a of the different sources using the FDM and data set (characteristics of sources, meteorological data of the measurement period, environment ), and calculation of correlation coefficient R2α between α of the sources : R2α value > 0,5 indicates a correlation between 2 sources which can not be distinguished ; they can be associated in one source by averaging the 2 dispersion factors ; - The first emission rates (E1, g/s) for the remaining sources are calculated by multiple stepwise regression ; - F-test is applied to this regression calculation to determine if the calculated rate is significant (significance risk < 5%), the source with non significant E1 has to be eliminated ; - Determination – analysis of the residues : residues are the difference between measured dust concentrations at the sampling locations and the expected dust concentrations calculated using the emission rate E1 ; the probability plot of normally distributed residues is a straight line : deviations of the straight line indicate that the mean emission (regular) rate values are influence by some extreme dust concentrations (punctual events with short high emission, or very low emission related to weather…), in this case these extreme concentration values are removed from the regular values and listed ; - Second emission rate values E2, mean or regular emission rate, of sources are then calculated with remained concentrations ; -Finally , for each significant source, partial coefficient of multiple determination (R2d, %) is calculated : it represent the contribution of the source to the variations in the measured concentrations, and the sum of these coefficients is the percentage of the measured concentrations which is explained by the mean emission rates of the dust sources. The RRT reports of the participant laboratories do not display all the results corresponding to the calculation steps (one excepted), only 2 laboratories provide R2d values (%) : the most penalizing facts for the evaluation of the results (E2) are : - calculated emission rates E1 displaying negative values (no physical emission) have been kept till regular E2 calculation ; -absence of F-test to eliminate non significant results (E1-source); - F-test was applied but the non significant results (E1-source) have been kept for subsequent calculation (residues, E2). When non significant E1 results has been correctly removed by the laboratory, it is indicated in the tables of Annexe 2, by “ns” instead of the value, or by “omitted” for the source.
CRT – Centre de Recherche de Trappes- 4/20 - CARACTERISATION-ANALYSE C. DESNOYERS 48.05.154/CD.
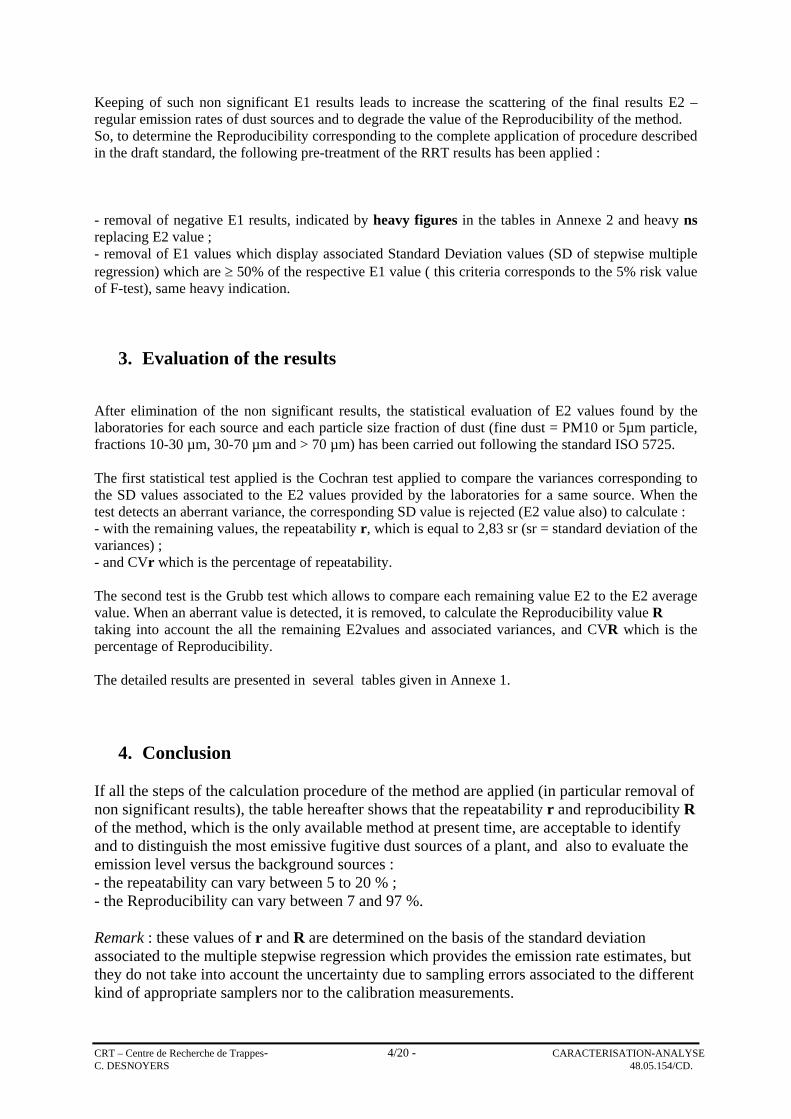
Keeping of such non significant E1 results leads to increase the scattering of the final results E2 – regular emission rates of dust sources and to degrade the value of the Reproducibility of the method. So, to determine the Reproducibility corresponding to the complete application of procedure described in the draft standard, the following pre-treatment of the RRT results has been applied : - removal of negative E1 results, indicated by heavy figures in the tables in Annexe 2 and heavy ns replacing E2 value ; - removal of E1 values which display associated Standard Deviation values (SD of stepwise multiple regression) which are ≥ 50% of the respective E1 value ( this criteria corresponds to the 5% risk value of F-test), same heavy indication.
3. Evaluation of the results After elimination of the non significant results, the statistical evaluation of E2 values found by the laboratories for each source and each particle size fraction of dust (fine dust = PM10 or 5µm particle, fractions 10-30 µm, 30-70 µm and > 70 µm) has been carried out following the standard ISO 5725. The first statistical test applied is the Cochran test applied to compare the variances corresponding to the SD values associated to the E2 values provided by the laboratories for a same source. When the test detects an aberrant variance, the corresponding SD value is rejected (E2 value also) to calculate : - with the remaining values, the repeatability r, which is equal to 2,83 sr (sr = standard deviation of the variances) ; - and CVr which is the percentage of repeatability. The second test is the Grubb test which allows to compare each remaining value E2 to the E2 average value. When an aberrant value is detected, it is removed, to calculate the Reproducibility value R taking into account the all the remaining E2values and associated variances, and CVR which is the percentage of Reproducibility. The detailed results are presented in several tables given in Annexe 1.
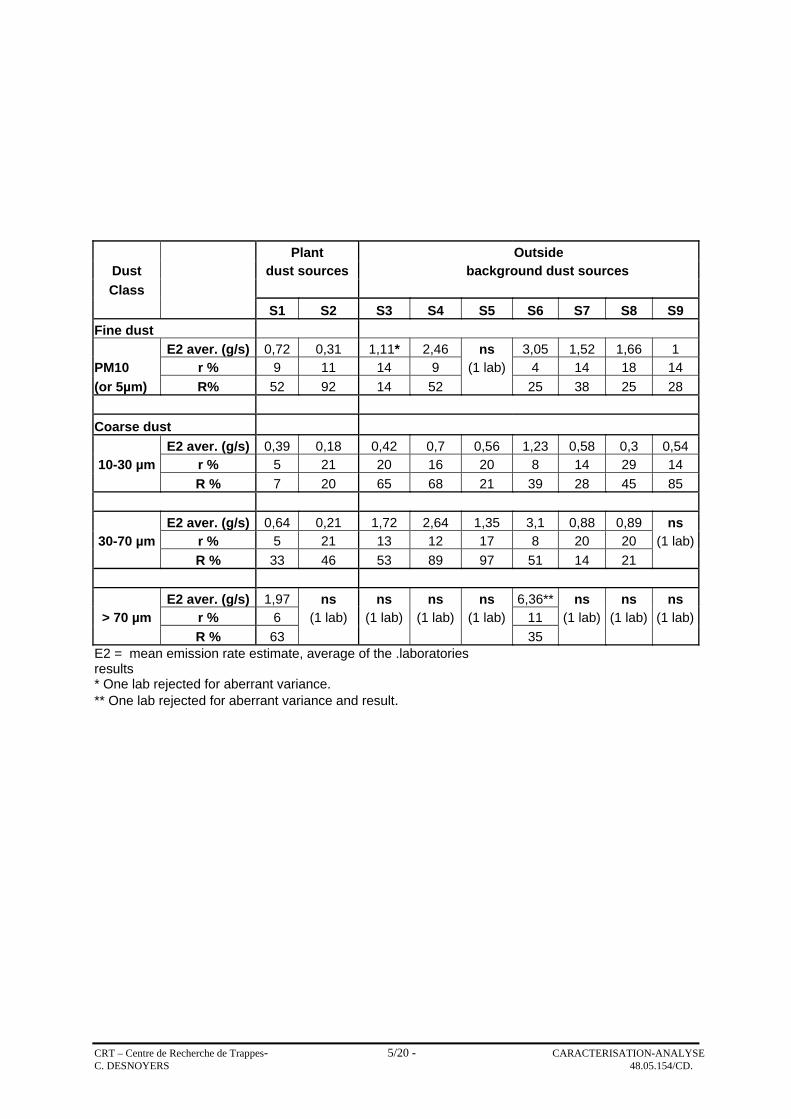
4. Conclusion If all the steps of the calculation procedure of the method are applied (in particular removal of non significant results), the table hereafter shows that the repeatability r and reproducibility R of the method, which is the only available method at present time, are acceptable to identify and to distinguish the most emissive fugitive dust sources of a plant, and also to evaluate the emission level versus the background sources : - the repeatability can vary between 5 to 20 % ; - the Reproducibility can vary between 7 and 97 %. Remark : these values of r and R are determined on the basis of the standard deviation associated to the multiple stepwise regression which provides the emission rate estimates, but they do not take into account the uncertainty due to sampling errors associated to the different kind of appropriate samplers nor to the calibration measurements.
CRT – Centre de Recherche de Trappes- 5/20 - CARACTERISATION-ANALYSE C. DESNOYERS 48.05.154/CD.
Plant Outside
Dust dust sources background dust sources Class
S1 S2 S3 S4 S5 S6 S7 S8 S9 Fine dust E2 aver. (g/s) 0,72 0,31 1,11* 2,46 ns 3,05 1,52 1,66 1 PM10 r % 9 11 14 9 (1 lab) 4 14 18 14 (or 5µm) R% 52 92 14 52 25 38 25 28 Coarse dust E2 aver. (g/s) 0,39 0,18 0,42 0,7 0,56 1,23 0,58 0,3 0,54 10-30 µm r % 5 21 20 16 20 8 14 29 14
R % 7 20 65 68 21 39 28 45 85 E2 aver. (g/s) 0,64 0,21 1,72 2,64 1,35 3,1 0,88 0,89 ns
30-70 µm r % 5 21 13 12 17 8 20 20 (1 lab) R % 33 46 53 89 97 51 14 21 E2 aver. (g/s) 1,97 ns ns ns ns 6,36** ns ns ns
> 70 µm r % 6 (1 lab) (1 lab) (1 lab) (1 lab) 11 (1 lab) (1 lab) (1 lab) R % 63 35 E2 = mean emission rate estimate, average of the .laboratories results * One lab rejected for aberrant variance. ** One lab rejected for aberrant variance and result.
CRT – Centre de Recherche de Trappes- 6/20 - CARACTERISATION-ANALYSE C. DESNOYERS 48.05.154/CD.
ANNEXE 1 Tables of results the RDM Round Robin Test at Corus plant (NL), with removal of non significant results, and values of repeatability and Reproducibility (evaluation following ISO 5725) for the dust sources S1 and S2 of the steel plant, and for outside background sources S3 to S9, for each particle size fraction :
- Fine dust (PM10, or 5µm particles)
- Coarse dust :
o 10 – 30 µm fraction ; o 30 – 70 µm fraction ; o > 70 µm fraction.
CRT – Centre de Recherche de Trappes - 7/20 - CARACTERISATION-ANALYSE C. DESNOYERS 48.05.154/CD.
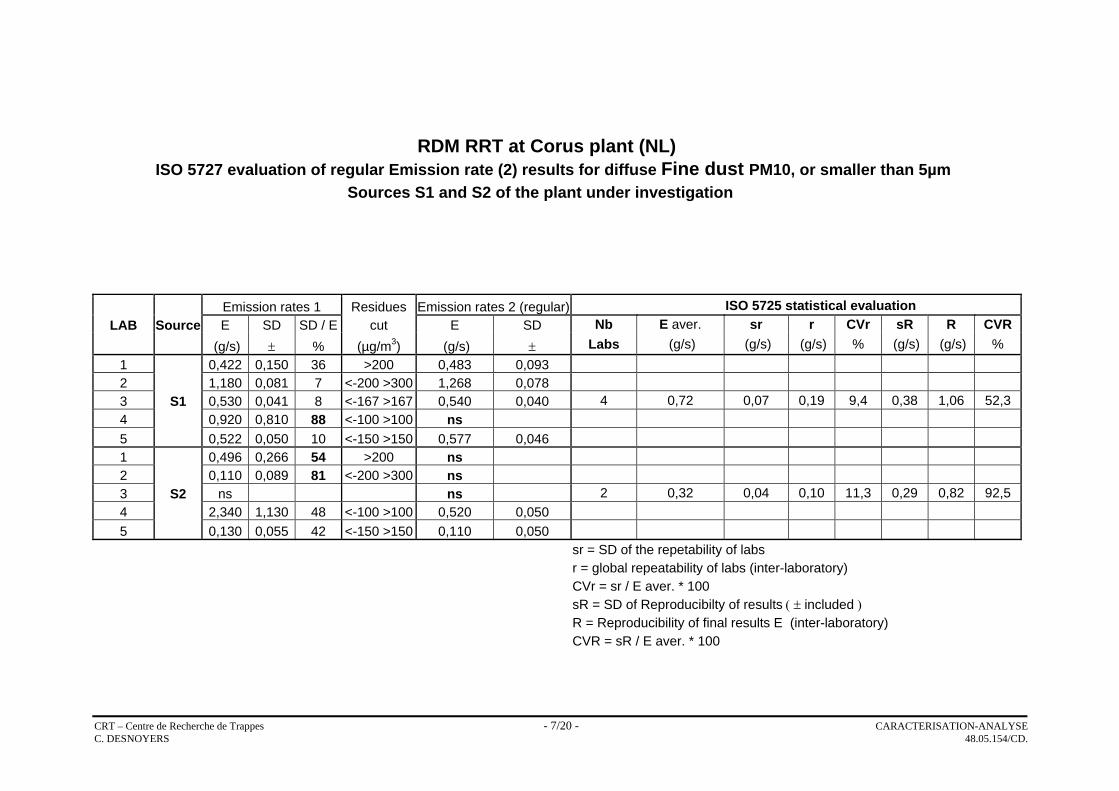
RDM RRT at Corus plant (NL)
ISO 5727 evaluation of regular Emission rate (2) results for diffuse Fine dust PM10, or smaller than 5µm Sources S1 and S2 of the plant under investigation Emission rates 1 Residues Emission rates 2 (regular) ISO 5725 statistical evaluation
LAB Source E SD SD / E cut E SD Nb E aver. sr r CVr sR R CVR (g/s) ± % (µg/m3) (g/s) ± Labs (g/s) (g/s) (g/s) % (g/s) (g/s) %
1 0,422 0,150 36 >200 0,483 0,093 2 1,180 0,081 7 <-200 >300 1,268 0,078 3 S1 0,530 0,041 8 <-167 >167 0,540 0,040 4 0,72 0,07 0,19 9,4 0,38 1,06 52,3 4 0,920 0,810 88 <-100 >100 ns 5 0,522 0,050 10 <-150 >150 0,577 0,046 1 0,496 0,266 54 >200 ns 2 0,110 0,089 81 <-200 >300 ns 3 S2 ns ns 2 0,32 0,04 0,10 11,3 0,29 0,82 92,5 4 2,340 1,130 48 <-100 >100 0,520 0,050 5 0,130 0,055 42 <-150 >150 0,110 0,050
sr = SD of the repetability of labs r = global repeatability of labs (inter-laboratory) CVr = sr / E aver. * 100 sR = SD of Reproducibilty of results ( ± included ) R = Reproducibility of final results E (inter-laboratory) CVR = sR / E aver. * 100

CRT – Centre de Recherche de Trappes - 8/20 - CARACTERISATION-ANALYSE C. DESNOYERS 48.05.154/CD.
RDM RRT at Corus plant (NL)
ISO 5727 evaluation of regular Emission rate (2) results for diffuse Fine dust PM10, or smaller than 5µm Background sources S3 to S6 outside the plant under investigation
Emission rates 1 ResiduesEmission rates 2
(regular) ISO 5725 statistical evaluation
LAB Source E SD SD / E cut E SD Nb E aver. sr r CVr sR R CVR (g/s) ± % (µg/m3) (g/s) ± Labs (g/s) (g/s) (g/s) % (g/s) (g/s) %
1 3,504 0,568 16 >200 3,370 0,354 2 1,159 0,197 17 <-200 >300 1,152 0,187 4 1,675 0,219 0,621 13,1 1,147 3,246 68,5 3 S3 1,170 0,130 11 <-167 >167 1,180 0,120 4 1,890 2,240 119 <-100 >100 ns 3 1,110 0,153 0,432 13,7 0,158 0,449 14,3 5 1,072 0,159 15 <-150 >150 0,998 0,143 1 3,922 0,688 18 >200 3,631 0,429 2 1,751 0,173 10 <-200 >300 1;749 0,164 3 S4 1,710 0,090 5 <-167 >167 1,690 0,090 5 2,458 0,220 0,622 8,9 1,291 3,654 52,5 4 9,070 2,970 33 <-100 >100 4,030 0,110 5 1,196 0,109 9 <-150 >150 1,192 0,098 1 ? ? ? 2 0,323 0,228 71 <-200 >300 ns 3 S5 0,530 0,130 25 <-167 >167 0,510 0,120 1 0,510 4 -12,82 7,810 -61 <-100 >100 ns 5 excluded, correlated to S4 1 3,481 0,348 10 >200 3,020 0,217 2 4,097 0,206 5 <-200 >300 4,362 0,200 3 S6 2,710 0,110 4 <-167 >167 2,650 0,100 4 3,054 0,121 0,341 3,9 0,767 2,171 25,1 4 0,340 3,040 894 <-100 >100 ns 5 2,438 0,143 6 <-150 >150 2,660 0,132
sr = SD of the repetability of labs r = global repeatability of labs (inter-laboratory) CVr = sr / E aver. * 100 sR = SD of Reproducibilty of results ( ± included ) R = Reproducibility of final results E (inter-laboratory) CVR = sR / E aver. * 100
CRT – Centre de Recherche de Trappes - 9/20 - CARACTERISATION-ANALYSE C. DESNOYERS 48.05.154/CD.
RDM RRT at Corus plant (NL)
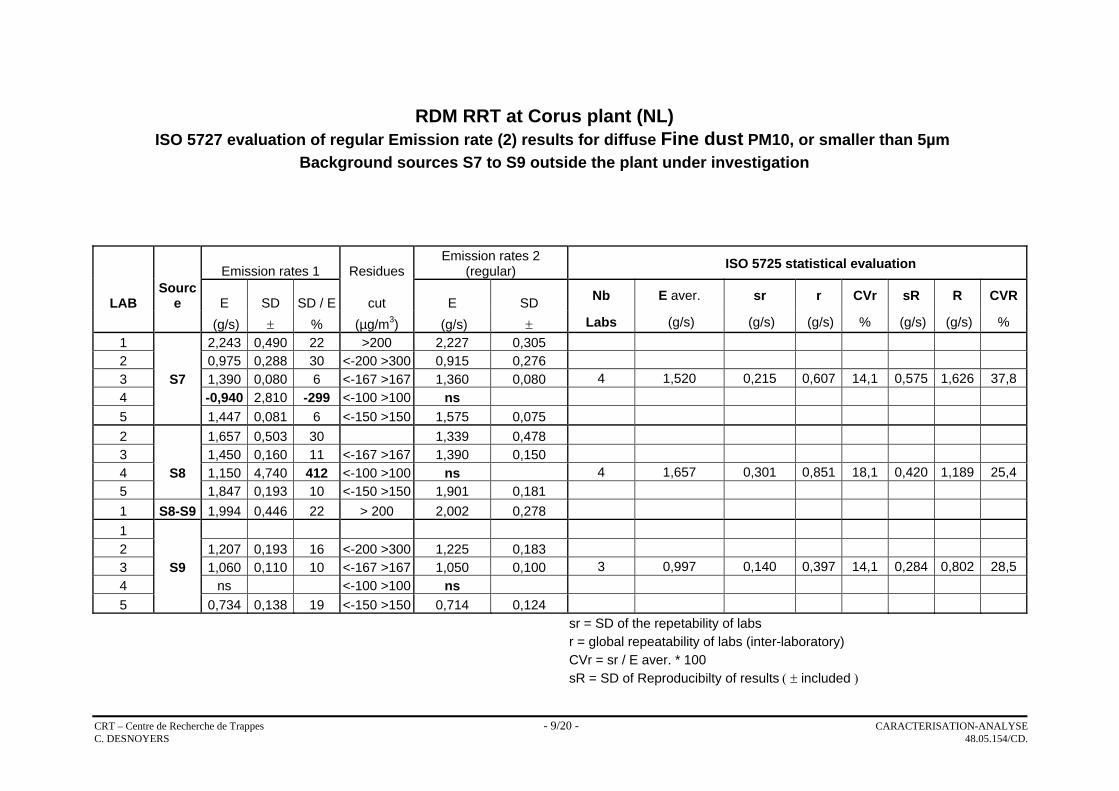
ISO 5727 evaluation of regular Emission rate (2) results for diffuse Fine dust PM10, or smaller than 5µm Background sources S7 to S9 outside the plant under investigation
Emission rates 1 Residues Emission rates 2
(regular) ISO 5725 statistical evaluation
LAB Sourc
e E SD SD / E cut E SD Nb E aver. sr r CVr sR R CVR
(g/s) ± % (µg/m3) (g/s) ± Labs (g/s) (g/s) (g/s) % (g/s) (g/s) % 1 2,243 0,490 22 >200 2,227 0,305 2 0,975 0,288 30 <-200 >300 0,915 0,276 3 S7 1,390 0,080 6 <-167 >167 1,360 0,080 4 1,520 0,215 0,607 14,1 0,575 1,626 37,8 4 -0,940 2,810 -299 <-100 >100 ns 5 1,447 0,081 6 <-150 >150 1,575 0,075 2 1,657 0,503 30 1,339 0,478 3 1,450 0,160 11 <-167 >167 1,390 0,150 4 S8 1,150 4,740 412 <-100 >100 ns 4 1,657 0,301 0,851 18,1 0,420 1,189 25,4 5 1,847 0,193 10 <-150 >150 1,901 0,181 1 S8-S9 1,994 0,446 22 > 200 2,002 0,278 1 2 1,207 0,193 16 <-200 >300 1,225 0,183 3 S9 1,060 0,110 10 <-167 >167 1,050 0,100 3 0,997 0,140 0,397 14,1 0,284 0,802 28,5 4 ns <-100 >100 ns 5 0,734 0,138 19 <-150 >150 0,714 0,124
sr = SD of the repetability of labs r = global repeatability of labs (inter-laboratory) CVr = sr / E aver. * 100 sR = SD of Reproducibilty of results ( ± included )
CRT – Centre de Recherche de Trappes - 10/20 - CARACTERISATION-ANALYSE C. DESNOYERS 48.05.154/CD.
R = Reproducibility of final results E (inter-laboratory) CVR = sR / E aver. * 100 RDM RRT at Corus plant (NL)
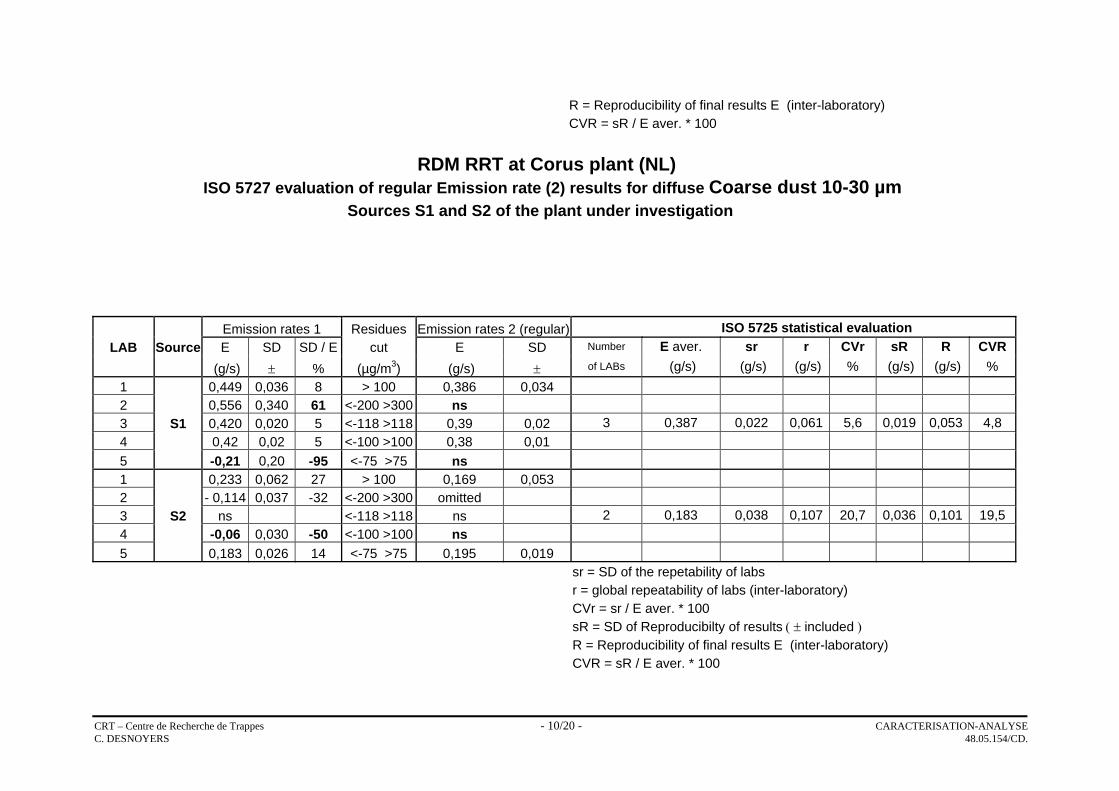
ISO 5727 evaluation of regular Emission rate (2) results for diffuse Coarse dust 10-30 µm
Sources S1 and S2 of the plant under investigation
Emission rates 1 Residues Emission rates 2 (regular) ISO 5725 statistical evaluation
LAB Source E SD SD / E cut E SD Number E aver. sr r CVr sR R CVR (g/s) ± % (µg/m3) (g/s) ± of LABs (g/s) (g/s) (g/s) % (g/s) (g/s) %
1 0,449 0,036 8 > 100 0,386 0,034 2 0,556 0,340 61 <-200 >300 ns 3 S1 0,420 0,020 5 <-118 >118 0,39 0,02 3 0,387 0,022 0,061 5,6 0,019 0,053 4,8 4 0,42 0,02 5 <-100 >100 0,38 0,01 5 -0,21 0,20 -95 <-75 >75 ns 1 0,233 0,062 27 > 100 0,169 0,053 2 - 0,114 0,037 -32 <-200 >300 omitted 3 S2 ns <-118 >118 ns 2 0,183 0,038 0,107 20,7 0,036 0,101 19,5 4 -0,06 0,030 -50 <-100 >100 ns 5 0,183 0,026 14 <-75 >75 0,195 0,019
sr = SD of the repetability of labs r = global repeatability of labs (inter-laboratory) CVr = sr / E aver. * 100 sR = SD of Reproducibilty of results ( ± included ) R = Reproducibility of final results E (inter-laboratory) CVR = sR / E aver. * 100
CRT – Centre de Recherche de Trappes - 11/20 - CARACTERISATION-ANALYSE C. DESNOYERS 48.05.154/CD.

CRT – Centre de Recherche de Trappes - 12/20 - CARACTERISATION-ANALYSE C. DESNOYERS 48.05.154/CD.
RDM RRT at Corus plant (NL)
ISO 5727 evaluation of regular Emission rate (2) results for diffuse Coarse dust 10-30 µm
Background sources S3 to S6 outside the plant under investigation Emission rates 1 Residues Emission rates 2 (regular) ISO 5725 statistical evaluation
LAB Source E SD SD / E cut E SD Number E aver. sr r CVr sR R CVR (g/s) ± % (µg/m3) (g/s) ± of LABs (g/s) (g/s) (g/s) % (g/s) (g/s) %
1 0,875 0,158 18 > 100 0,891 0,135 2 0,312 0,096 31 <-200 >300 0,306 0,096 3 S3 0,240 0,090 38 <-118 >118 0,24 0,07 5 0,422 0,084 0,237 19,9 0,275 0,779 65,31 4 0,38 0,07 18 <-100 >100 0,29 0,04 5 0,334 0,066 20 <-75 >75 0,382 0,049 1 0,834 0,214 26 > 100 0,860 0,183 2 0,358 0,093 26 <-200 >300 0,337 0,093 3 S4 9,4 0,4 4 <-118 >118 0,320 0,080 4 0,705 0,114 0,332 16,1 0,481 1,361 68,2 4 0,18 0,10 56 <-100 >100 ns 5 1,656 0,088 5 <-75 >75 1,305 0,065 1 0,723 0,146 20 > 100 0,609 0,125 2 0,514 0,102 20 <-200 >300 0,521 0,102 3 S5 0,51 0,1 20 <-118 >118 0,490 0,090 4 0,564 0,114 0,324 20,3 0,117 0,330 20,7 4 1,14 0,22 19 <-100 >100 0,64 0,13 5 Correlated to 4, excluded 1 1,496 0,103 7 > 100 1,534 0,089 2 1,816 0,093 5 <-200 >300 1,732 0,089 3 S6 1,56 0,08 5 <-118 >118 1,530 0,070 5 1,250 0,095 0,268 7,6 0,490 1,386 39,2 4 0,75 0,09 12 <-100 >100 0,78 0,06 5 1,122 0,193 17 <-75 >75 0,679 0,142
sr = SD of the repetability of labs r = global repeatability of labs (inter-laboratory) CVr = sr / E aver. * 100 sR = SD of Reproducibilty of results ( ± included ) R = Reproducibility of final results E (inter-laboratory) CVR = sR / E aver. * 100
CRT – Centre de Recherche de Trappes - 13/20 - CARACTERISATION-ANALYSE C. DESNOYERS 48.05.154/CD.
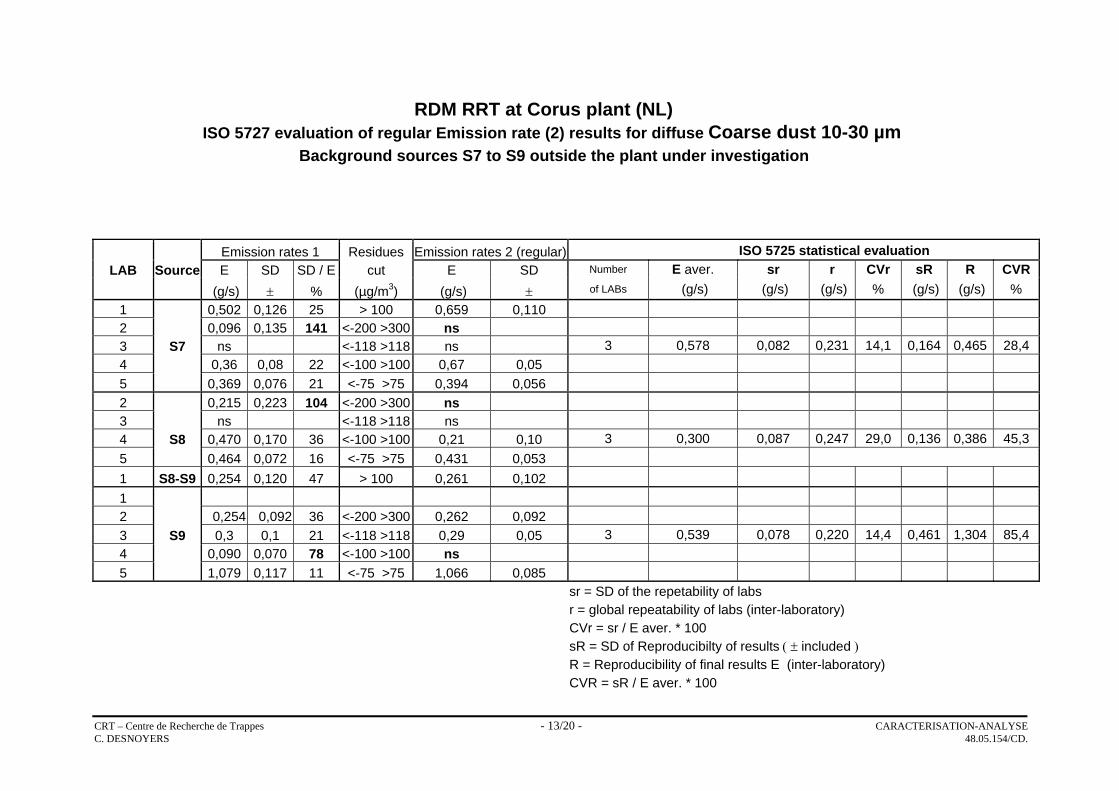
RDM RRT at Corus plant (NL)
ISO 5727 evaluation of regular Emission rate (2) results for diffuse Coarse dust 10-30 µm
Background sources S7 to S9 outside the plant under investigation Emission rates 1 Residues Emission rates 2 (regular) ISO 5725 statistical evaluation
LAB Source E SD SD / E cut E SD Number E aver. sr r CVr sR R CVR (g/s) ± % (µg/m3) (g/s) ± of LABs (g/s) (g/s) (g/s) % (g/s) (g/s) %
1 0,502 0,126 25 > 100 0,659 0,110 2 0,096 0,135 141 <-200 >300 ns 3 S7 ns <-118 >118 ns 3 0,578 0,082 0,231 14,1 0,164 0,465 28,4 4 0,36 0,08 22 <-100 >100 0,67 0,05 5 0,369 0,076 21 <-75 >75 0,394 0,056 2 0,215 0,223 104 <-200 >300 ns 3 ns <-118 >118 ns 4 S8 0,470 0,170 36 <-100 >100 0,21 0,10 3 0,300 0,087 0,247 29,0 0,136 0,386 45,3 5 0,464 0,072 16 <-75 >75 0,431 0,053 1 S8-S9 0,254 0,120 47 > 100 0,261 0,102 1 2 0,254 0,092 36 <-200 >300 0,262 0,092 3 S9 0,3 0,1 21 <-118 >118 0,29 0,05 3 0,539 0,078 0,220 14,4 0,461 1,304 85,4 4 0,090 0,070 78 <-100 >100 ns 5 1,079 0,117 11 <-75 >75 1,066 0,085
sr = SD of the repetability of labs r = global repeatability of labs (inter-laboratory) CVr = sr / E aver. * 100 sR = SD of Reproducibilty of results ( ± included ) R = Reproducibility of final results E (inter-laboratory) CVR = sR / E aver. * 100

CRT – Centre de Recherche de Trappes - 14/20 - CARACTERISATION-ANALYSE C. DESNOYERS 48.05.154/CD.
RDM RRT at Corus plant (NL)
ISO 5727 evaluation of regular Emission rate (2) results for diffuse Coarse dust 30-70 µm
Sources S1 and S2 of the plant under investigation Emission rates 1 Residues Emission rates 2 (regular) ISO 5725 statistical evaluation
LAB Source E SD SD / E cut E SD Number E aver. sr r CVr sR R CVR (g/s) ± % (µg/m3) (g/s) ± of LABs (g/s) (g/s) (g/s) % (g/s) (g/s) %
1 0,834 0,050 6 > 60 0,524 0,034 2 1,089 0,048 4 <-200 >300 0,937 0,041 3 S1 0,72 0,03 4 <-100 >100 0,66 0,03 4 0,644 0,031 0,088 4,8 0,214 0,605 33,2 4 0,69 0,03 4 <-50 >50 0,46 0,02 5 -0,14 0,026 -19 <-80 >80 ns 1 0,203 0,089 44 > 60 0,175 0,054 2 0,066 0,063 95 <-200 >300 ns 3 S2 ns ns 3 0,211 0,044 0,124 20,8 0,098 0,277 46,3 4 0,13 0,06 46 <-50 >50 0,14 0,04 5 0,297 0,049 16 <-80 >80 0,314 0,041
sr = SD of the repetability of labs r = global repeatability of labs (inter-laboratory) CVr = sr / E aver. * 100 sR = SD of Reproducibilty of results ( ± included ) R = Reproducibility of final results E (inter-laboratory) CVR = sR / E aver. * 100
CRT – Centre de Recherche de Trappes - 15/20 - CARACTERISATION-ANALYSE C. DESNOYERS 48.05.154/CD.
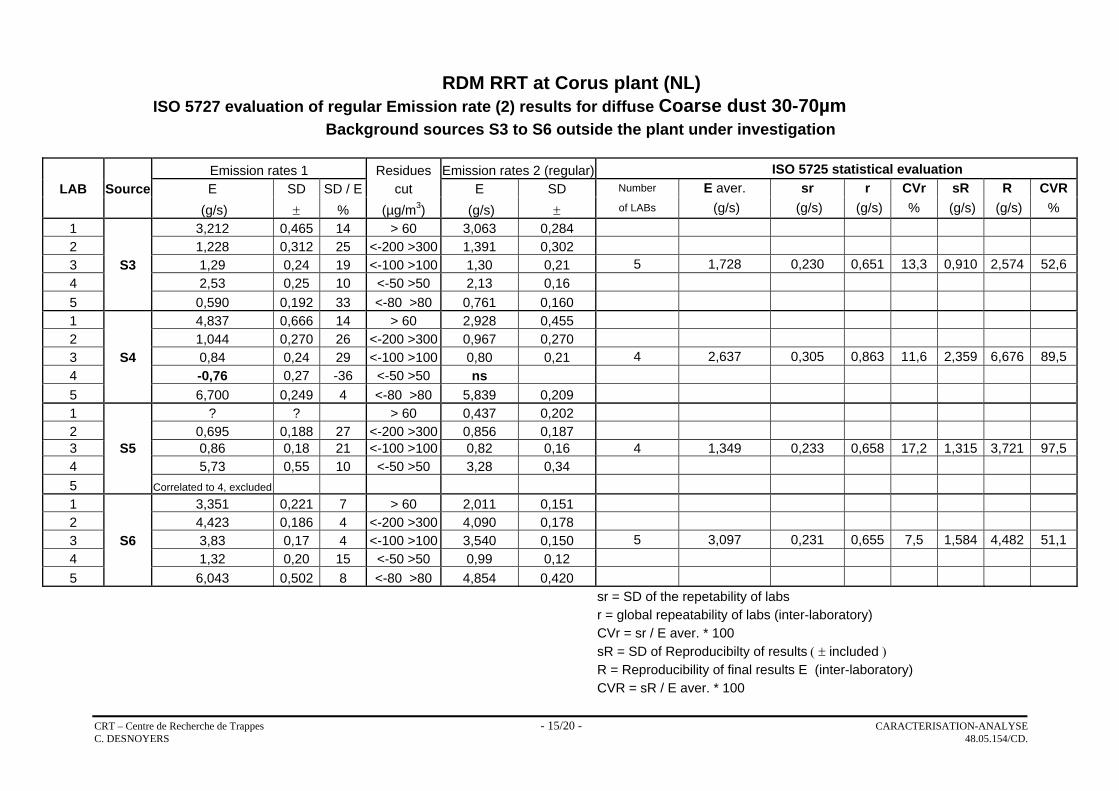
RDM RRT at Corus plant (NL)
ISO 5727 evaluation of regular Emission rate (2) results for diffuse Coarse dust 30-70µm
Background sources S3 to S6 outside the plant under investigation Emission rates 1 Residues Emission rates 2 (regular) ISO 5725 statistical evaluation
LAB Source E SD SD / E cut E SD Number E aver. sr r CVr sR R CVR (g/s) ± % (µg/m3) (g/s) ± of LABs (g/s) (g/s) (g/s) % (g/s) (g/s) %
1 3,212 0,465 14 > 60 3,063 0,284 2 1,228 0,312 25 <-200 >300 1,391 0,302 3 S3 1,29 0,24 19 <-100 >100 1,30 0,21 5 1,728 0,230 0,651 13,3 0,910 2,574 52,6 4 2,53 0,25 10 <-50 >50 2,13 0,16 5 0,590 0,192 33 <-80 >80 0,761 0,160 1 4,837 0,666 14 > 60 2,928 0,455 2 1,044 0,270 26 <-200 >300 0,967 0,270 3 S4 0,84 0,24 29 <-100 >100 0,80 0,21 4 2,637 0,305 0,863 11,6 2,359 6,676 89,5 4 -0,76 0,27 -36 <-50 >50 ns 5 6,700 0,249 4 <-80 >80 5,839 0,209 1 ? ? > 60 0,437 0,202 2 0,695 0,188 27 <-200 >300 0,856 0,187 3 S5 0,86 0,18 21 <-100 >100 0,82 0,16 4 1,349 0,233 0,658 17,2 1,315 3,721 97,5 4 5,73 0,55 10 <-50 >50 3,28 0,34 5 Correlated to 4, excluded 1 3,351 0,221 7 > 60 2,011 0,151 2 4,423 0,186 4 <-200 >300 4,090 0,178 3 S6 3,83 0,17 4 <-100 >100 3,540 0,150 5 3,097 0,231 0,655 7,5 1,584 4,482 51,1 4 1,32 0,20 15 <-50 >50 0,99 0,12 5 6,043 0,502 8 <-80 >80 4,854 0,420
sr = SD of the repetability of labs r = global repeatability of labs (inter-laboratory) CVr = sr / E aver. * 100 sR = SD of Reproducibilty of results ( ± included ) R = Reproducibility of final results E (inter-laboratory) CVR = sR / E aver. * 100
CRT – Centre de Recherche de Trappes - 16/20 - CARACTERISATION-ANALYSE C. DESNOYERS 48.05.154/CD.
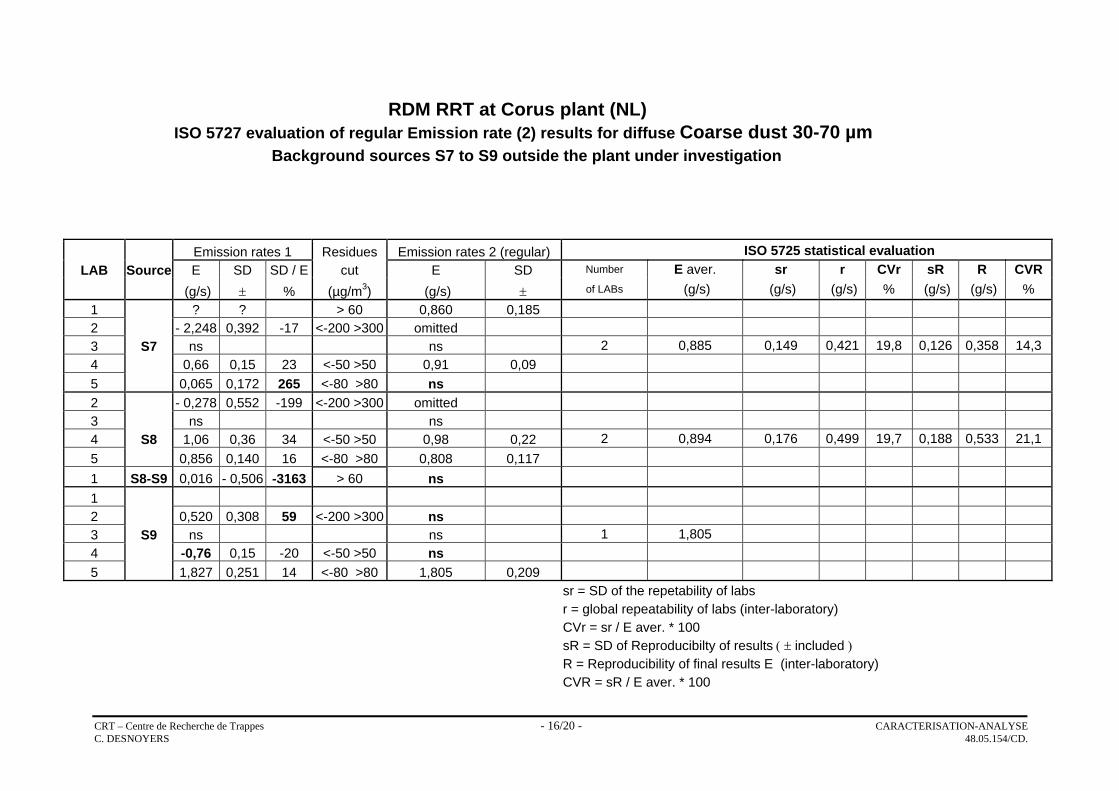
RDM RRT at Corus plant (NL)
ISO 5727 evaluation of regular Emission rate (2) results for diffuse Coarse dust 30-70 µm
Background sources S7 to S9 outside the plant under investigation Emission rates 1 Residues Emission rates 2 (regular) ISO 5725 statistical evaluation
LAB Source E SD SD / E cut E SD Number E aver. sr r CVr sR R CVR (g/s) ± % (µg/m3) (g/s) ± of LABs (g/s) (g/s) (g/s) % (g/s) (g/s) %
1 ? ? > 60 0,860 0,185 2 - 2,248 0,392 -17 <-200 >300 omitted 3 S7 ns ns 2 0,885 0,149 0,421 19,8 0,126 0,358 14,3 4 0,66 0,15 23 <-50 >50 0,91 0,09 5 0,065 0,172 265 <-80 >80 ns 2 - 0,278 0,552 -199 <-200 >300 omitted 3 ns ns 4 S8 1,06 0,36 34 <-50 >50 0,98 0,22 2 0,894 0,176 0,499 19,7 0,188 0,533 21,1 5 0,856 0,140 16 <-80 >80 0,808 0,117 1 S8-S9 0,016 - 0,506 -3163 > 60 ns 1 2 0,520 0,308 59 <-200 >300 ns 3 S9 ns ns 1 1,805 4 -0,76 0,15 -20 <-50 >50 ns 5 1,827 0,251 14 <-80 >80 1,805 0,209
sr = SD of the repetability of labs r = global repeatability of labs (inter-laboratory) CVr = sr / E aver. * 100 sR = SD of Reproducibilty of results ( ± included ) R = Reproducibility of final results E (inter-laboratory) CVR = sR / E aver. * 100
CRT – Centre de Recherche de Trappes - 17/20 - CARACTERISATION-ANALYSE C. DESNOYERS 48.05.154/CD.
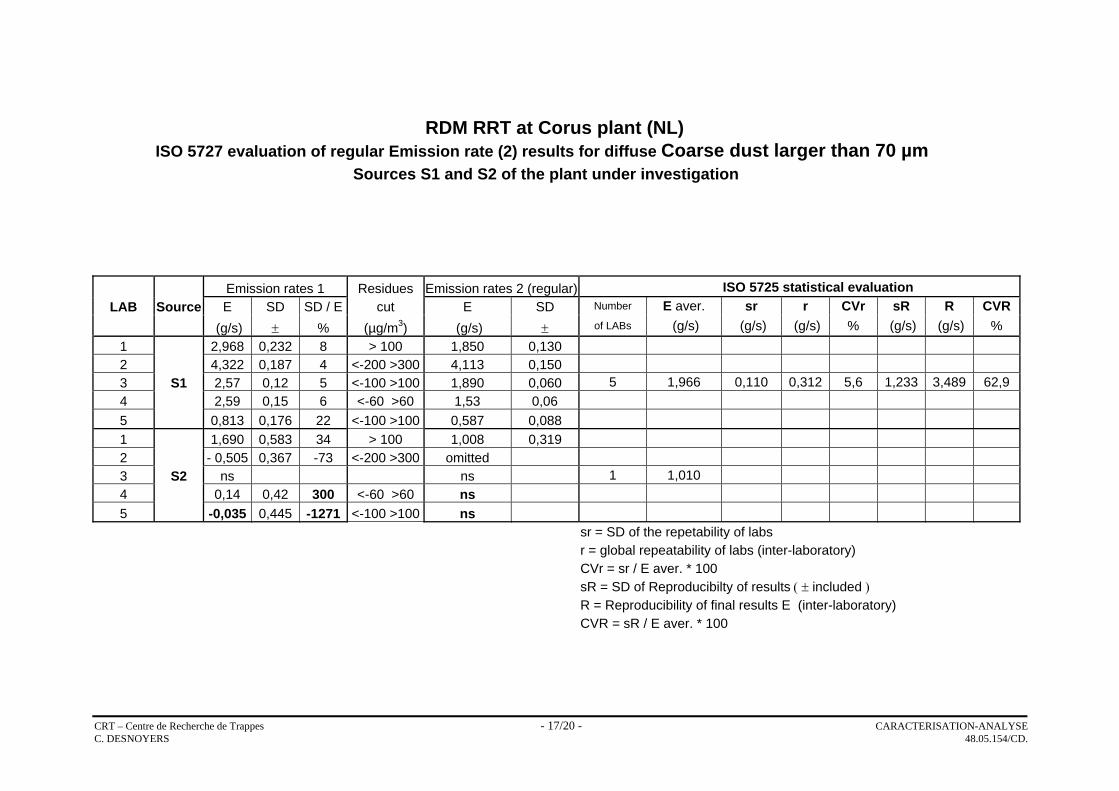
RDM RRT at Corus plant (NL)
ISO 5727 evaluation of regular Emission rate (2) results for diffuse Coarse dust larger than 70 µm
Sources S1 and S2 of the plant under investigation Emission rates 1 Residues Emission rates 2 (regular) ISO 5725 statistical evaluation
LAB Source E SD SD / E cut E SD Number E aver. sr r CVr sR R CVR (g/s) ± % (µg/m3) (g/s) ± of LABs (g/s) (g/s) (g/s) % (g/s) (g/s) %
1 2,968 0,232 8 > 100 1,850 0,130 2 4,322 0,187 4 <-200 >300 4,113 0,150 3 S1 2,57 0,12 5 <-100 >100 1,890 0,060 5 1,966 0,110 0,312 5,6 1,233 3,489 62,9 4 2,59 0,15 6 <-60 >60 1,53 0,06 5 0,813 0,176 22 <-100 >100 0,587 0,088 1 1,690 0,583 34 > 100 1,008 0,319 2 - 0,505 0,367 -73 <-200 >300 omitted 3 S2 ns ns 1 1,010 4 0,14 0,42 300 <-60 >60 ns 5 -0,035 0,445 -1271 <-100 >100 ns
sr = SD of the repetability of labs r = global repeatability of labs (inter-laboratory) CVr = sr / E aver. * 100 sR = SD of Reproducibilty of results ( ± included ) R = Reproducibility of final results E (inter-laboratory) CVR = sR / E aver. * 100
CRT – Centre de Recherche de Trappes - 18/20 - CARACTERISATION-ANALYSE C. DESNOYERS 48.05.154/CD.
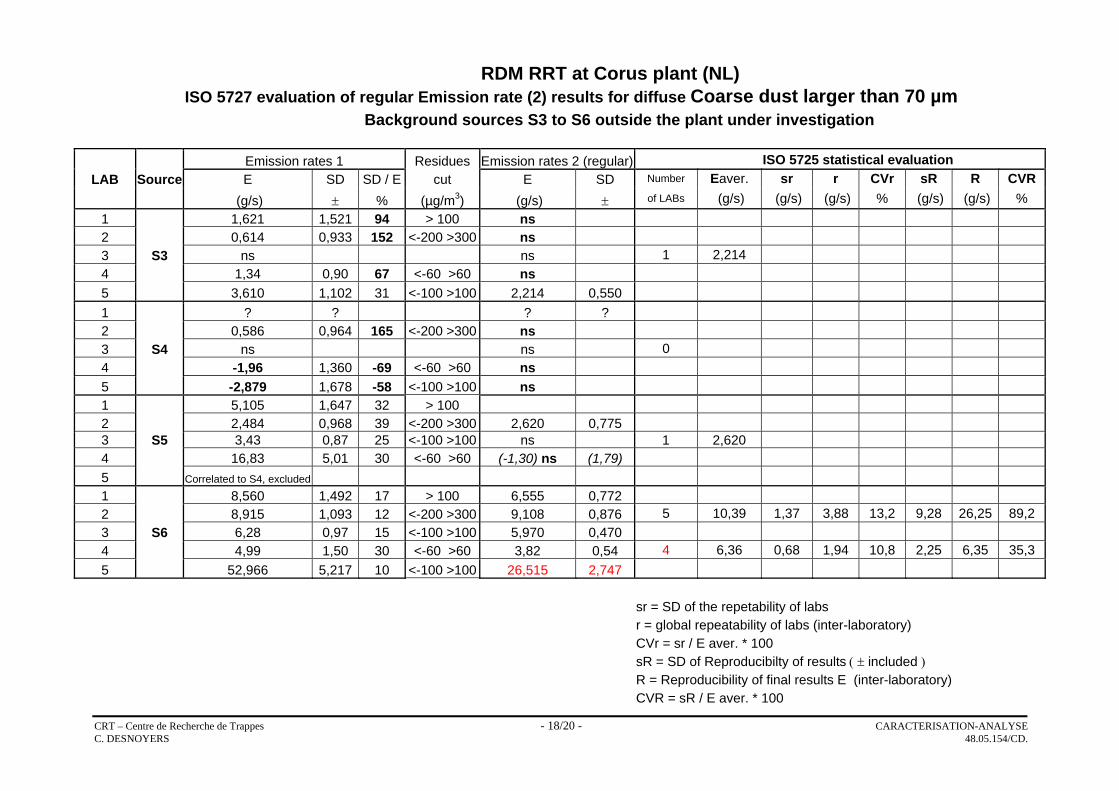
RDM RRT at Corus plant (NL)
ISO 5727 evaluation of regular Emission rate (2) results for diffuse Coarse dust larger than 70 µm Background sources S3 to S6 outside the plant under investigation Emission rates 1 Residues Emission rates 2 (regular) ISO 5725 statistical evaluation
LAB Source E SD SD / E cut E SD Number Eaver. sr r CVr sR R CVR (g/s) ± % (µg/m3) (g/s) ± of LABs (g/s) (g/s) (g/s) % (g/s) (g/s) %
1 1,621 1,521 94 > 100 ns 2 0,614 0,933 152 <-200 >300 ns 3 S3 ns ns 1 2,214 4 1,34 0,90 67 <-60 >60 ns 5 3,610 1,102 31 <-100 >100 2,214 0,550 1 ? ? ? ? 2 0,586 0,964 165 <-200 >300 ns 3 S4 ns ns 0 4 -1,96 1,360 -69 <-60 >60 ns 5 -2,879 1,678 -58 <-100 >100 ns 1 5,105 1,647 32 > 100 2 2,484 0,968 39 <-200 >300 2,620 0,775 3 S5 3,43 0,87 25 <-100 >100 ns 1 2,620 4 16,83 5,01 30 <-60 >60 (-1,30) ns (1,79) 5 Correlated to S4, excluded 1 8,560 1,492 17 > 100 6,555 0,772 2 8,915 1,093 12 <-200 >300 9,108 0,876 5 10,39 1,37 3,88 13,2 9,28 26,25 89,2 3 S6 6,28 0,97 15 <-100 >100 5,970 0,470 4 4,99 1,50 30 <-60 >60 3,82 0,54 4 6,36 0,68 1,94 10,8 2,25 6,35 35,3 5 52,966 5,217 10 <-100 >100 26,515 2,747
sr = SD of the repetability of labs r = global repeatability of labs (inter-laboratory) CVr = sr / E aver. * 100 sR = SD of Reproducibilty of results ( ± included ) R = Reproducibility of final results E (inter-laboratory) CVR = sR / E aver. * 100
CRT – Centre de Recherche de Trappes - 19/20 - CARACTERISATION-ANALYSE C. DESNOYERS 48.05.154/CD.
RDM RRT at Corus plant (NL)
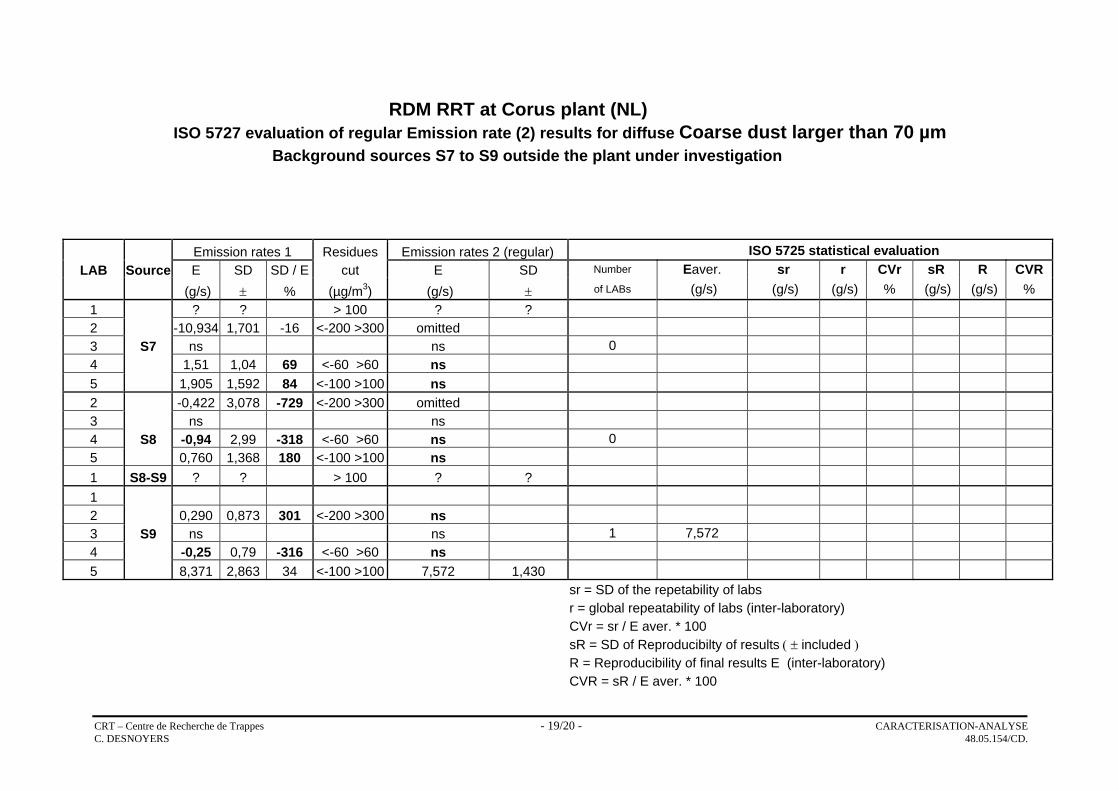
ISO 5727 evaluation of regular Emission rate (2) results for diffuse Coarse dust larger than 70 µm Background sources S7 to S9 outside the plant under investigation Emission rates 1 Residues Emission rates 2 (regular) ISO 5725 statistical evaluation
LAB Source E SD SD / E cut E SD Number Eaver. sr r CVr sR R CVR (g/s) ± % (µg/m3) (g/s) ± of LABs (g/s) (g/s) (g/s) % (g/s) (g/s) %
1 ? ? > 100 ? ? 2 -10,934 1,701 -16 <-200 >300 omitted 3 S7 ns ns 0 4 1,51 1,04 69 <-60 >60 ns 5 1,905 1,592 84 <-100 >100 ns 2 -0,422 3,078 -729 <-200 >300 omitted 3 ns ns 4 S8 -0,94 2,99 -318 <-60 >60 ns 0 5 0,760 1,368 180 <-100 >100 ns 1 S8-S9 ? ? > 100 ? ? 1 2 0,290 0,873 301 <-200 >300 ns 3 S9 ns ns 1 7,572 4 -0,25 0,79 -316 <-60 >60 ns 5 8,371 2,863 34 <-100 >100 7,572 1,430
sr = SD of the repetability of labs r = global repeatability of labs (inter-laboratory) CVr = sr / E aver. * 100 sR = SD of Reproducibilty of results ( ± included ) R = Reproducibility of final results E (inter-laboratory) CVR = sR / E aver. * 100
CRT – Centre de Recherche de Trappes - 20/20 - CARACTERISATION-ANALYSE C. DESNOYERS 48.05.154/CD.
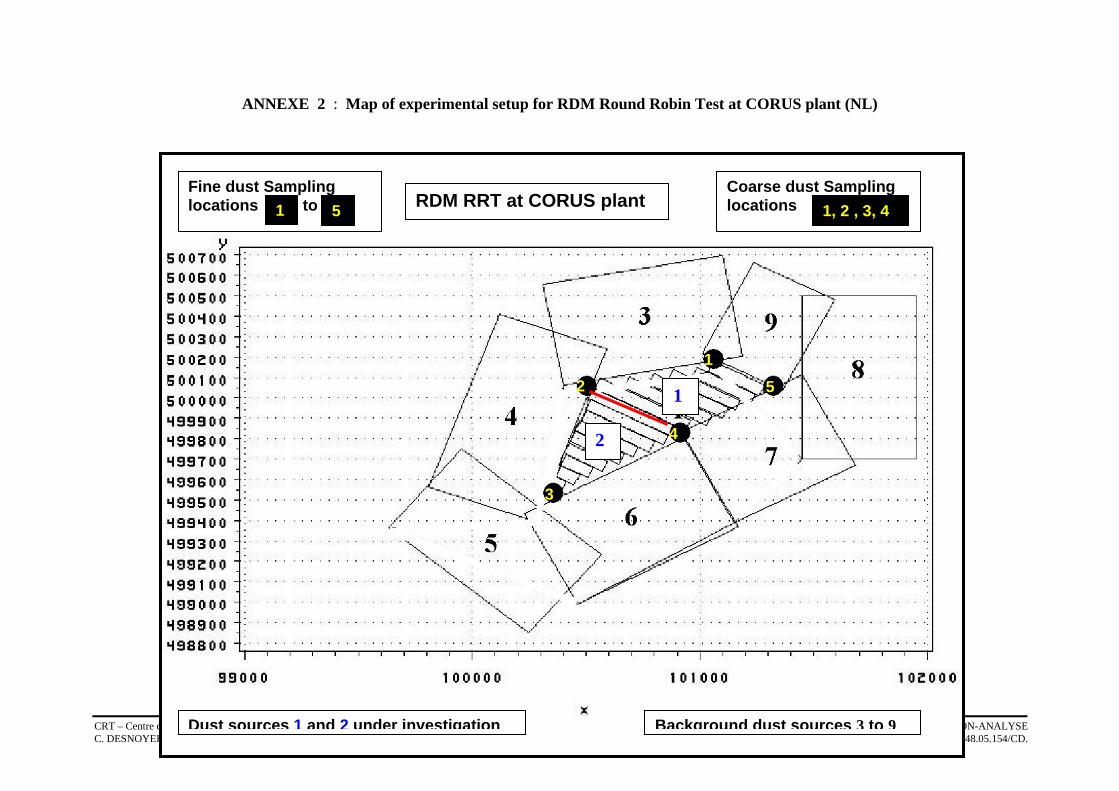
ANNEXE 2 : Map of experimental setup for RDM Round Robin Test at CORUS plant (NL)
1
2
1 2
3
4
5
Dust sources 1 and 2 under investigation
RDM RRT at CORUS plant
Background dust sources 3 to 9
Fine dust Sampling locations to 1 5
Coarse dust Sampling locations 1, 2 , 3, 4