Associations among growth, scrotal circumference, and ... · Associations among growth, scrotal...
8
Associations among growth, scrotal circumference, and visual score of beef cattle in performance tests on pasture or in feedlots Fernanda Santos Silva Raidan 1 , Juan Salvador Andrade Tineo 1 , Mariana Mamedes de Moraes 1 , Thiago Campos Escarce 1 , Andresa Eva Melo de Araújo 1 , Muller Marques de Carvalho Gomes 1 , Henrique Torres Ventura 2 , Fabio Luiz Buranelo Toral 1* 1 Universidade Federal de Minas Gerais, Escola de Veterinária, Departamento de Zootecnia, Belo Horizonte, MG, Brazil. 2 Associação Brasileira dos Criadores de Zebu, Uberaba, MG, Brazil. ABSTRACT - This study aimed to evaluate associations among final weight (FW), average daily gain (ADG), scrotal circumference (SC), and visual score (VS) of beef cattle in performance tests on pasture or in feedlots. Genetic parameters for FW, ADG, SC, and VS of young Nellore bulls performance-tested on pasture or in feedlots were evaluated by mixed model. The performance test and final age were considered as fixed effects and additive genetic and residual effects were considered as random effects. Additive genetic and residual variances for final weight and average daily gain were smaller on pasture than in feedlots. There was no difference between genetic and residual variances and heritability for scrotal circumference on pasture or in feedlots. Genetic variance and heritability for visual score on pasture were smaller than those in feedlots. The posterior means (and highest posterior density intervals with 90% of samples (HPD90) in parentheses) for heritability were 0.46 (0.42; 0.50) and 0.49 (0.41; 0.55) for FW, 0.25 (0.22; 0.29) and 0.25 (0.19; 0.30) for ADG, 0.56 (0.51; 0.61) and 0.60 (0.51; 0.68) for SC, and 0.31 (0.27; 0.34) and 0.42 (0.36; 0.48) for VS on pasture or in feedlots, respectively. The genetic correlations (posterior means with HPD90 in parentheses) were 0.74 (0.69; 0.79) and 0.67 (0.58; 0.77) between FW and ADG; 0.49 (0.43; 0.55) and 0.60 (0.53; 0.68) for FW and SC; 0.79 (0.75; 0.83) and 0.85 (0.80; 0.90) for FW and VS; 0.37 (0.29; 0.46) and 0.34 (0.19; 0.50) for ADG and SC; 0.65 (0.59; 0.71) and 0.74 (0.64; 0.84) for ADG and VS; and 0.46 (0.39; 0.52) and 0.53 (0.44; 0.62) for SC and VS, obtained on pasture or in feedlots, respectively. The genetic and residual (co)variances of growth, scrotal circumference, and visual score of beef cattle vary across environments; however, genetic and residual correlation and efficiency of correlated response among these traits remain constant on pasture or in feedlots. Key Words: Bos indicus, genetic correlation, heritability, phenotypic selection Revista Brasileira de Zootecnia Brazilian Journal of Animal Science © 2017 Sociedade Brasileira de Zootecnia ISSN 1806-9290 www.sbz.org.br R. Bras. Zootec., 46(4):309-316, 2017 Introduction Performance test is an important tool in beef cattle breeding programs worldwide. The evaluations can be conducted on pasture (Lopes et al., 2013) or in feedlots (Cernicchiaro et al., 2014). The occurrence of genotype × environment interactions in beef cattle has been well documented in the literature (Burrow, 2012; Guidolin et al., 2012; Raidan et al., 2015; Santana Junior et al., 2015). Differences in response to selection of the same trait in different environments may occur, especially for traits with low heritability (Raidan et al., 2015). Nevertheless, there is a lack of knowledge regarding the genetic and residual associations between different traits according to the environment. Genetic correlation indicates the magnitude and direction of correlated responses to selection. Gene linkage and pleiotropy partially explain the joint variation of two traits (Wisser et al., 2011). In turn, residual correlation includes associations arising from environmental effects that are not considered in the statistical model and non-additive genetic effects (Kruuk et al., 2000). The knowledge of the associations between growth, scrotal circumference, and visual score are important in beef cattle breeding programs because they help choose the most efficient methods of selection and selection criteria for each environment. Still, it is possible to reduce the measurement costs and increase profitability in breeding programs by means of the correct choice of selection methods and criteria. Variances and heritability of the same trait are not constant in different environments (Guidolin et al., 2012; Santana Junior et al., 2015) and covariance may also change because it is variance-dependent. Correlations Received: August 26, 2015 Accepted: October 24, 2016 *Corresponding author: fl[email protected] http://dx.doi.org/10.1590/S1806-92902017000400006 How to cite: Raidan, F. S. S.; Tineo, J. S. A.; Moraes, M. M.; Escarce, T. C.; Araújo, A. E. M.; Gomes, M. M. C.; Ventura, H. T. and Toral, F. L. B. 2017. Associations among growth, scrotal circumference, and visual score of beef cattle in performance tests on pasture or in feedlots. Revista Brasileira de Zootecnia 46(4):309-316. Copyright © 2017 Sociedade Brasileira de Zootecnia. This is an Open Access article distributed under the terms of the Creative Commons Attribution License (http://creativecommons.org/licenses/by/4.0/), which permits unrestricted use, distribution, and reproduction in any medium, provided the original work is properly cited.
Transcript of Associations among growth, scrotal circumference, and ... · Associations among growth, scrotal...

Associations among growth, scrotal circumference, and visual score of beef cattle in performance tests on pasture or in feedlots
Fernanda Santos Silva Raidan1, Juan Salvador Andrade Tineo1, Mariana Mamedes de Moraes1, Thiago Campos Escarce1, Andresa Eva Melo de Araújo1, Muller Marques de Carvalho Gomes1,
Henrique Torres Ventura2, Fabio Luiz Buranelo Toral1*
1 Universidade Federal de Minas Gerais, Escola de Veterinária, Departamento de Zootecnia, Belo Horizonte, MG, Brazil.2 Associação Brasileira dos Criadores de Zebu, Uberaba, MG, Brazil.
ABSTRACT - This study aimed to evaluate associations among final weight (FW), average daily gain (ADG), scrotalcircumference (SC), and visual score (VS) of beef cattle in performance tests on pasture or in feedlots. Genetic parameters for FW, ADG, SC, and VS of young Nellore bulls performance-tested on pasture or in feedlots were evaluated by mixed model. The performance test and final age were considered as fixed effects and additive genetic and residual effects were consideredas random effects. Additive genetic and residual variances for final weight and average daily gain were smaller on pasturethan in feedlots. There was no difference between genetic and residual variances and heritability for scrotal circumference on pasture or in feedlots. Genetic variance and heritability for visual score on pasture were smaller than those in feedlots. The posterior means (and highest posterior density intervals with 90% of samples (HPD90) in parentheses) for heritability were 0.46 (0.42; 0.50) and 0.49 (0.41; 0.55) for FW, 0.25 (0.22; 0.29) and 0.25 (0.19; 0.30) for ADG, 0.56 (0.51; 0.61) and 0.60 (0.51; 0.68) for SC, and 0.31 (0.27; 0.34) and 0.42 (0.36; 0.48) for VS on pasture or in feedlots, respectively. The genetic correlations (posterior means with HPD90 in parentheses) were 0.74 (0.69; 0.79) and 0.67 (0.58; 0.77) between FW and ADG; 0.49 (0.43; 0.55) and 0.60 (0.53; 0.68) for FW and SC; 0.79 (0.75; 0.83) and 0.85 (0.80; 0.90) for FW and VS; 0.37 (0.29; 0.46) and 0.34 (0.19; 0.50) for ADG and SC; 0.65 (0.59; 0.71) and 0.74 (0.64; 0.84) for ADG and VS; and 0.46 (0.39; 0.52) and 0.53 (0.44; 0.62) for SC and VS, obtained on pasture or in feedlots, respectively. The genetic and residual (co)variances of growth, scrotal circumference, and visual score of beef cattle vary across environments; however, genetic and residual correlation and efficiency of correlated response among these traits remain constant on pasture or in feedlots.
Key Words: Bos indicus, genetic correlation, heritability, phenotypic selection
Revista Brasileira de ZootecniaBrazilian Journal of Animal Science© 2017 Sociedade Brasileira de ZootecniaISSN 1806-9290 www.sbz.org.br
R. Bras. Zootec., 46(4):309-316, 2017
Introduction
Performance test is an important tool in beef cattle breeding programs worldwide. The evaluations can be conducted on pasture (Lopes et al., 2013) or in feedlots (Cernicchiaro et al., 2014). The occurrence of genotype × environment interactions in beef cattle has been well documented in the literature (Burrow, 2012; Guidolin et al., 2012; Raidan et al., 2015; Santana Junior et al., 2015). Differences in response to selection of the same trait in different environments may occur, especially for traits with
low heritability (Raidan et al., 2015). Nevertheless, there is a lack of knowledge regarding the genetic and residual associations between different traits according to the environment.
Genetic correlation indicates the magnitude and direction of correlated responses to selection. Gene linkage and pleiotropy partially explain the joint variation of two traits (Wisser et al., 2011). In turn, residual correlation includes associations arising from environmental effects that are not considered in the statistical model and non-additive genetic effects (Kruuk et al., 2000). The knowledge of the associations between growth, scrotal circumference, and visual score are important in beef cattle breeding programs because they help choose the most efficient methods ofselection and selection criteria for each environment. Still, it is possible to reduce the measurement costs and increase profitability in breeding programs by means of the correctchoice of selection methods and criteria.
Variances and heritability of the same trait are not constant in different environments (Guidolin et al., 2012; Santana Junior et al., 2015) and covariance may also change because it is variance-dependent. Correlations
Received: August 26, 2015 Accepted: October 24, 2016*Corresponding author: [email protected]
http://dx.doi.org/10.1590/S1806-92902017000400006
How to cite: Raidan, F. S. S.; Tineo, J. S. A.; Moraes, M. M.; Escarce, T. C.; Araújo, A. E. M.; Gomes, M. M. C.; Ventura, H. T. and Toral, F. L. B. 2017. Associations among growth, scrotal circumference, and visual score of beef cattle in performance tests on pasture or in feedlots. Revista Brasileira de Zootecnia 46(4):309-316.
Copyright © 2017 Sociedade Brasileira de Zootecnia. This is an Open Access article distributed under the terms of the Creative Commons Attribution License (http://creativecommons.org/licenses/by/4.0/), which permits unrestricted use, distribution, and reproduction in any medium, provided the original work is properly cited.
310 Raidan et al.
R. Bras. Zootec., 46(4):309-316, 2017
reflect relationships between covariance and variancesand if the last two parameters change, the first one mayalso change. Therefore, associations between traits might change according to the environment. This study aimed to evaluate the associations and efficiency of the indirectselection for growth, scrotal circumference, and visual score of beef cattle in performance tests on pasture or in feedlots.
Material and Methods
The present study was based on data corresponding to 33,013 young Nellore bulls that were subjected to 751 official performance tests by the Associação Brasileirados Criadores de Zebu (Table 1). These performance tests were conducted between 2003 and 2012 in the northern states (Acre, Rondônia, Pará, and Tocantins), northeastern states (Bahia and Maranhão), midwestern states (Goiás, Mato Grosso, and Mato Grosso do Sul), southeastern states (Espírito Santo, Minas Gerais, and São Paulo), and southern states (Paraná and Rio Grande do Sul) of Brazil. A total of 24,910 animals participated in 538 tests conducted on pasture in the aforementioned states, except Rio Grande do Sul, and 8,103 animals were evaluated in 213 tests conducted in feedlots in the aforementioned states, except Acre, Roraima, Tocantins, Maranhão, and Bahia.
The tests conducted on pasture lasted 294 days (70 days for adaptation and 224 days for testing). The tests conducted with the animals in feedlots lasted 168 days (56 days for adaptation and 112 days for testing). The animals were weighed at the beginning and end of the adaptation period and at the end of the testing period. The assessed
traits included final weight (FW), average daily gain (ADG),scrotal circumference (SC), and visual score (VS). The VS value for each animal was obtained by adding the scores of body structure (E), precocity (P), muscling (M), navel (U), breed (R), posture (A), and sexual characteristics (S). The visual scores of E, P, M, and U were evaluated by visual appraisal on a scale from 1 to 6, and the R, A, and S traits were evaluated on a scale from 1 to 4. To obtain the VS, the animals that received scores of 5 or 6 for U had their scores converted to 2 and 1, respectively, to reflect the fact thatvalues of 3 and 4 are more desirable. The FW was adjusted to 550 days of age in the performance tests on pasture and to 426 days of age in feedlot tests according to the duration of each type of test. Individual records of each trait that exceeded the intervals given by the performance test means ± 3.5 standard deviations were excluded and all animals from performance tests on pasture or in feedlots with less than 20 and 8 animals, respectively, were also excluded.
The numerator relationship matrix was constructed from pedigree data that consisted of the pedigree of an animal and pedigree of some of its ancestors. The ancestors retained in the pedigree were those that were parents of the animals with data or that were connected to other animals in the pedigree (Toral and Alencar, 2010). The relationship matrix included records of 140,498 animals. The 33,013 animals assessed were offspring of 2,356 sires and 24,118 dams. A total of 2,356 sires with progeny records of FW and ADG were identified, corresponding to 2,047 sires withprogeny on pasture, 688 sires with progeny in feedlots, and 379 sires with progenies in both types of performance tests. The correspondent numbers of sires were 1,816; 1,347; 469; and 249 for SC and 2,281; 1,962; 688; and 369 for VS.
Trait Environment n Mean SD CV
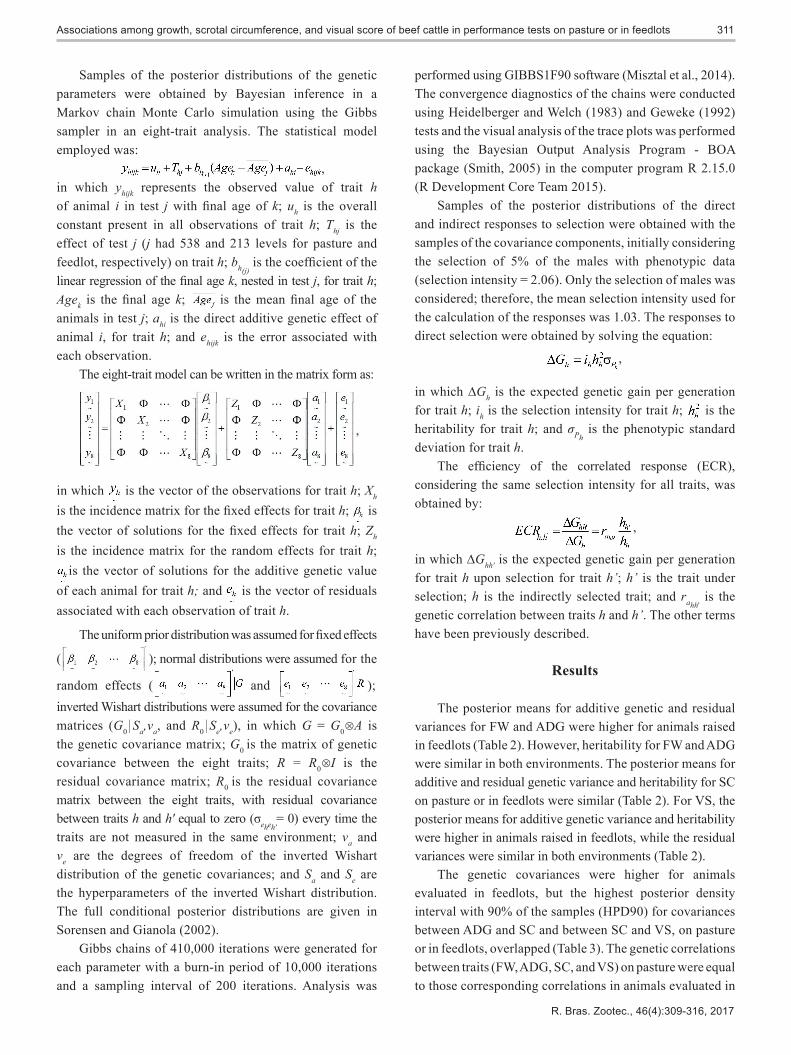
Final age (days)1 Pasture 24,910 553.05 24.39 4.41 Feedlot 8,103 423.59 26.41 6.23Final age (days)2 Pasture 14,888 552.72 25.24 4.57 Feedlot 4,676 420.73 28.01 6.66Final age (days)3 Pasture 23,509 574.73 24.41 4.25 Feedlot 8,046 423.66 26.43 6.24Final weight (kg) Pasture 24,910 350.35 53.09 15.15 Feedlot 8,103 371.65 57.13 15.37Average daily gain (kg/day) Pasture 24,910 0.54 0.16 29.63 Feedlot 8,103 0.83 0.27 32.53Scrotal circumference (cm) Pasture 14,888 26.61 3.38 12.70 Feedlot 4,676 25.41 3.31 13.03Visual score (units) Pasture 23,509 24.62 4.00 16.25 Feedlot 8,046 25.17 4.09 16.92
Table 1 - Descriptive statistics for final weight, average daily gain, scrotal circumference, and visual score of young Nellore bulls tested inperformance tests on pasture or in feedlots
1 Only for animals with final weight and average daily gain data.2 Only for animals with scrotal circumference data.3 Only for animals with visual score data.SD - standard deviation; CV - coefficient of variation.
311Associations among growth, scrotal circumference, and visual score of beef cattle in performance tests on pasture or in feedlots
R. Bras. Zootec., 46(4):309-316, 2017
Samples of the posterior distributions of the genetic parameters were obtained by Bayesian inference in a Markov chain Monte Carlo simulation using the Gibbs sampler in an eight-trait analysis. The statistical model employed was:
,in which yhijk represents the observed value of trait h of animal i in test j with final age of k; uh is the overall constant present in all observations of trait h; Thj is the effect of test j (j had 538 and 213 levels for pasture and feedlot, respectively) on trait h; bh(j)
is the coefficient of thelinear regression of the final age k, nested in test j, for trait h; Agek is the final age k; is the mean final age of theanimals in test j; ahi is the direct additive genetic effect of animal i, for trait h; and ehijk is the error associated with each observation.
The eight-trait model can be written in the matrix form as:
,
in which is the vector of the observations for trait h; Xh is the incidence matrix for the fixed effects for trait h; is the vector of solutions for the fixed effects for trait h; Zh is the incidence matrix for the random effects for trait h;
is the vector of solutions for the additive genetic value of each animal for trait h; and is the vector of residuals associated with each observation of trait h.
The uniform prior distribution was assumed for fixed effects
( ); normal distributions were assumed for the
random effects ( and ); inverted Wishart distributions were assumed for the covariance matrices (G0Sa,va, and R0Se,ve), in which G = G0A is the genetic covariance matrix; G0 is the matrix of genetic covariance between the eight traits; R = R0I is the residual covariance matrix; R0 is the residual covariance matrix between the eight traits, with residual covariance between traits h and h' equal to zero (σeheh'
= 0) every time the traits are not measured in the same environment; va and ve are the degrees of freedom of the inverted Wishart distribution of the genetic covariances; and Sa and Se are the hyperparameters of the inverted Wishart distribution. The full conditional posterior distributions are given in Sorensen and Gianola (2002).
Gibbs chains of 410,000 iterations were generated for each parameter with a burn-in period of 10,000 iterations and a sampling interval of 200 iterations. Analysis was
performed using GIBBS1F90 software (Misztal et al., 2014). The convergence diagnostics of the chains were conducted using Heidelberger and Welch (1983) and Geweke (1992) tests and the visual analysis of the trace plots was performed using the Bayesian Output Analysis Program - BOA package (Smith, 2005) in the computer program R 2.15.0 (R Development Core Team 2015).
Samples of the posterior distributions of the direct and indirect responses to selection were obtained with the samples of the covariance components, initially considering the selection of 5% of the males with phenotypic data (selection intensity = 2.06). Only the selection of males was considered; therefore, the mean selection intensity used for the calculation of the responses was 1.03. The responses to direct selection were obtained by solving the equation:
,
in which ∆Gh is the expected genetic gain per generation for trait h; ih is the selection intensity for trait h; is the heritability for trait h; and σPh
is the phenotypic standard deviation for trait h.
The efficiency of the correlated response (ECR),considering the same selection intensity for all traits, was obtained by:
,
in which ∆Ghh' is the expected genetic gain per generation for trait h upon selection for trait h’; h’ is the trait under selection; h is the indirectly selected trait; and rahh'
is the genetic correlation between traits h and h’. The other terms have been previously described.
Results
The posterior means for additive genetic and residual variances for FW and ADG were higher for animals raised in feedlots (Table 2). However, heritability for FW and ADG were similar in both environments. The posterior means for additive and residual genetic variance and heritability for SC on pasture or in feedlots were similar (Table 2). For VS, the posterior means for additive genetic variance and heritability were higher in animals raised in feedlots, while the residual variances were similar in both environments (Table 2).
The genetic covariances were higher for animals evaluated in feedlots, but the highest posterior density interval with 90% of the samples (HPD90) for covariances between ADG and SC and between SC and VS, on pasture or in feedlots, overlapped (Table 3). The genetic correlations between traits (FW, ADG, SC, and VS) on pasture were equal to those corresponding correlations in animals evaluated in

312 Raidan et al.
R. Bras. Zootec., 46(4):309-316, 2017
feedlots (Figure 1). The change in environment, i.e., pasture or feedlot, did not result in changes of posterior means for covariances or residual correlations between the traits, except for the residual covariances and correlations of FW with ADG and of ADG with VS (Table 3 and Figure 1).
The genetic correlations between FW, ADG, SC, and VS on pasture with the same traits in feedlots were positive (Table 4). The genetic correlations between FW, ADG, and SC measured on pasture and FW, ADG, and SC, measured in feedlots, were previously presented and explained by Raidan et al. (2015). The posterior means (and HPD90) for genetic correlation between FW and ADG were 0.74 (0.69; 0.79) on pasture and 0.67 (0.58; 0.77) in feedlots (Figure 1). These values were higher than the genetic correlation between FW measured on pasture and ADG measured in feedlots (mean of 0.42, with HPD90 from 0.26 to 0.54) and higher than the genetic correlation between FW in feedlots and ADG on pasture (mean of 0.46, with HPD90 from 0.34 to 0.60) (Table 4).
The posterior means (HPD90) for direct response to selection were 14.54 (13.18; 15.90) kg/generation
and 18.96 (15.87; 21.83) kg/generation for FW; 0.0022 (0.0019; 0.0025) kg.day–1/generation and 0.0039 (0.0030; 0.0049) kg.day–1/generation for ADG; 1.47 (1.32; 1.61) cm/generation and 1.59 (1.35; 1.83) cm/generation for SC; and 1.04 (0.92; 1.15) points/generation and 1.55 (1.32; 1.80) points/generation for VS in animals raised on pasture and in feedlots, respectively. Considering the same selection intensity, direct responses for FW, ADG, and VS were greater in animals raised in feedlots.
The HPD90 values of the efficiency of correlatedresponses on pasture and in feedlots overlapped (Figure 2). Therefore, the correlated responses obtained for different traits on pasture and in feedlots were similar. The efficienciesof correlated response for each pair of trait were less than one (Figure 2). These results indicate the superiority of direct selection over indirect selection, except for the indirect response for ADG and VS through selection for FW (Figure 2). In these cases, the HPD90 included the value one, indicating that the correlated responses for ADG or VS through selection for FW were similar to direct responses.
Trait σ 2 a σ 2
e h2
PastureFinal weight 432.18 (387.80; 475.00) 504.23 (470.80; 533.40) 0.46 (0.42; 0.50)Average daily gain 0.0018 (0.0015; 0.0020) 0.0053 (0.0051; 0.0056) 0.25 (0.22; 0.29)Scrotal circumference 3.60 (3.24; 4.02) 2.87 (2.59; 3.16) 0.56 (0.51; 0.61)Visual score 3.32 (2.95; 3.73) 7.53 (7.23; 7.85) 0.31 (0.27; 0.34)
FeedlotFinal weight 694.64 (568.00; 804.20) 727.16 (643.70; 810.20) 0.49 (0.41; 0.55)Average daily gain 0.0061 (0.0044; 0.0074) 0.0018 (0.0017; 0.0020) 0.25 (0.19; 0.30)Scrotal circumference 4.00 (3.32; 4.68) 2.66 (2.21; 3.18) 0.60 (0.51; 0.68)Visual score 5.38 (4.54; 6.33) 7.36 (6.73; 8.04) 0.42 (0.36; 0.48)
Table 2 - Posterior means (with highest posterior density intervals with 90% of samples in parentheses) of the genetic parameters for finalweight, average daily gain, scrotal circumference, and visual score of young Nellore bulls tested in performance tests on pasture or in feedlots
σ 2 a - additive genetic variance; σ 2
e - residual variance; h2 - heritability.
Figure 1 - Posterior means and highest posterior density intervals (with 90% of samples - error bars) for genetic and residual correlations among final weight (FW), average daily gain (ADG), scrotal circumference (SC), and visual score (VS) of young Nellore bullstested in performance tests on pasture or in feedlots.

313Associations among growth, scrotal circumference, and visual score of beef cattle in performance tests on pasture or in feedlots
R. Bras. Zootec., 46(4):309-316, 2017
TraitGenetic covariance Residual covariance
Pasture Feedlot Pasture Feedlot
FW × ADG 65.46 (56.79; 74.24) 137.74 (104.40; 170.70) 96.82 (89.70; 103.40) 164.63 (140.30; 188.70)FW × SC 19.28 (16.10; 22.84) 31.90 (23.94; 38.62) 18.17 (15.81; 20.81) 17.40 (12.53; 22.88)FW × VS 29.93 (26.19; 33.36) 51.97 (42.33; 61.50) 34.31 (31.69; 37.03) 42.45 (35.53; 49.16)ADG × SC 3.00 (2.24; 3.71) 5.21 (2.60; 7.79) 2.39 (1.78; 2.92) 2.63 (0.71; 4.48)ADG × VS 5.09 (4.33; 5.86) 13.31 (10.16; 16.30) 7.48 (6.82; 8.03) 10.61 (8.25; 12.88)SC × VS 1.59 (1.28; 1.90) 2.45 (1.82; 3.08) 1.72 (1.49; 1.97) 1.31 (0.84; 1.80)
Table 3 - Posterior means (with highest posterior density intervals with 90% of samples in parentheses) for genetic and residual covariances among final weight (FW), average daily gain (ADG), scrotal circumference (SC), and visual score (VS) of young Nellore bullstested in performance tests on pasture or in feedlots
Table 4 - Posterior means (with highest posterior density intervals with 90% of samples in parentheses) for genetic correlations between final weight, average daily gain, scrotal circumference, and visual score of young Nellore bulls tested in performance tests onpasture with the same traits of animals tested in feedlots
FeedlotPasture
Final weight Average daily gain Scrotal circumference Visual score
Final weight 0.74 (0.63; 0.85) 0.46 (0.34; 0.60) 0.33 (0.22; 0.46) 0.57 (0.43; 0.72)Average daily gain 0.42 (0.26; 0.54) 0.44 (0.29; 0.60) 0.19 (0.04; 0.36) 0.42 (0.26; 0.59)Scrotal circumference 0.44 (0.33; 0.57) 0.33 (0.21; 0.46) 0.84 (0.74; 0.93) 0.35 (0.23; 0.48)Visual score 0.56 (0.44; 0.68) 0.41 (0.25; 0.55) 0.28 (0.16; 0.39) 0.71 (0.59; 0.83)
Figure 2 - Posterior means and highest posterior density intervals (with 90% of samples - error bars) for efficiency of the correlated response(ECR) for final weight (FW), average daily gain (ADG), scrotal circumference (SC), and visual score (VS) of young Nellore bullstested in performance tests on pasture or in feedlots, when selection is applied for FW, ADG, SC, and VS.
314 Raidan et al.
R. Bras. Zootec., 46(4):309-316, 2017
Discussion
The nutritional plan on pasture may limit the expression of genetic differences for the traits evaluated in this work (Hammond, 1947). The posterior means of heritability for FW (0.46) and ADG (0.25) were lower than the values of 0.73 and 0.31 estimated by Fragomeni et al. (2013) for young Nellore bulls on pasture performance tests and lower than the values of 0.69 and 0.32 estimated by Neves et al. (2014) for young Nellore bulls in feedlot tests. The posterior means of heritability for SC were higher than the values of 0.42, 0.43, and 0.37 estimated by Boligon et al. (2010), Yokoo et al. (2010), and Neves et al. (2014), respectively. Estimates of heritability for visual scores of E (0.26), P (0.34), M (0.28), U (0.43), R (0.18), A (0.06), and S (0.18) were low to high (Lima et al., 2013).
Genetic differences across populations (from differences in genetic bases and/or differences in selection objectives) and differences in the means and standard deviations of each trait explain part of the differences in the genetic parameters across studies. Nevertheless, heritability for FW, ADG, SC, and VS were moderate to high and indicate that those traits may be used as selection criteria and that phenotypic selection in individual performance tests may result in genetic progress over generations.
The magnitude of the variances affects covariance between traits. Thus, differences in covariances between traits on pasture or in feedlots represent differences in their variances on these environments, suggesting that correlation might be more useful than covariance for evaluation of associations between traits. Genetic (FW, ADG, and VS) and residual variances (FW and ADG) and heritabilities (FW, ADG, and VS) for some traits vary according to the environment, but genetic and residual correlations between traits remained constant. The Nellore population used in this study is under constant evolution and there are no specificlines for pasture or feedlot systems. Thus, we expected gene frequencies in animals on pasture or in feedlots to be very similar. Moreover, the segregation of genes with pleiotropic effects at the same frequencies might explain the constant genetic correlations among FW, ADG, SC, and VS across pasture and feedlots (Sheridan and Barker, 1974; Roach, 1986).
The genetic correlation between FW and ADG obtained in this study (Figure 1) was similar to that of 0.74 reported by Fragomeni et al. (2013) and greater than 0.25 estimated by Lima et al. (2013) for Nellore young bulls on pasture performance tests. The FW is dependent on initial body weight, ADG, and days on test. Days on test were constant
either on each pasture or in each feedlots tests and the adaptation period reduced the differences in weight at the beginning of the test. Thus, it is expected that FW and ADG become highly correlated traits.
The genetic correlations between growth traits (FW and ADG) and SC (Figure 1) were higher than the values of 0.19 (Santana Junior et al., 2012) and 0.38 (Boligon et al., 2011) obtained using field records. Data recordingin performance tests is more precise than data recording in field conditions and this difference in precision mightexplain the higher correlations obtained in our study. The genetic correlation between growth traits and SC indicates that the selection for FW or ADG can be an alternative for improving fertility and sexual precocity in Nellore cattle.
The genetic correlations between growth (FW and ADG) and VS obtained in this study (Figure 1) were high. Lima et al., (2013) reported genetic correlations of 0.41 (0.61), 0.83 (0.90), 0.91 (0.66), 0.32 (0.44), 0.17 (0.70), 0.54 (0.18), and 0.87 (0.97) between FW (ADG) and visual scores of E, P, M, U, R, A, and S, respectively, which are components of the VS. Thus, the direct selection for VS implies genetic progress for growth and the selection for growth also implies genetic gain for VS.
The genetic correlations between SC and VS were moderate (Figure 1). The genetic correlations between body condition score (BCS) and SC have been reported as positive (Boligon and Albuquerque, 2010). Moreover, VS values of E, P, M, U, R, A, and S are highly correlated (Lima et al., 2013). Thus, a positive and moderate genetic correlation between VS and SC is expected and changes in VS and SC can be achieved by direct and indirect selection.
Differences in the genetic bases, means and standard deviations, pleiotropy, and gene linkage can explain differences between the estimates of genetic correlation between traits across populations. The genetic correlation between traits across herds or generations remain constant when pleiotropy is the primary cause (Sheridan and Barker, 1974; Carey, 1988). However, genetic correlations between traits across herds or generations tend towards change when gene linkage is the most important cause of genetic correlation (Sheridan and Barker, 1974; Carey, 1988). Gene linkage depends on selection intensity, gene effects, gene frequency, and strength of linkage (Sheridan and Barker, 1974), factors that might vary across herds or generations.
In general, the genetic correlations, from moderate to high magnitude, indicate that there are favorable associations between the evaluated traits and that the selection for any of the traits provides genetic gains in the same direction for the other traits despite the environment.
315Associations among growth, scrotal circumference, and visual score of beef cattle in performance tests on pasture or in feedlots
R. Bras. Zootec., 46(4):309-316, 2017
The residual correlations were also positive, indicating that the environment acts in a similar way on the various evaluated traits. The posterior means for the residual correlations between FW and ADG and between ADG and VS were higher in animals raised on pasture (Figure 1), probably because the pasture tests are longer than the feedlot tests.
Genetic variance and heritability for VS were higher for animals raised in feedlots than for animals raised on pastures (Table 2) and the posterior mean (and HPD90) for the genetic correlation between VS on pastures and VS in feedlots was lower than the thresholds of 1.0 and 0.8 presented by Falconer (1952) and Robertson (1959), respectively. This result indicates the presence of a genotype × environment interaction for VS and the breeding values and correlated response for this trait measured on pasture or in feedlot could be different. In fact, the posterior mean (and HPD90) for efficiency for acorrelated response for VS on pasture through selection for VS in feedlots was 0.60 (0.50; 0.74), and that for a correlated response for VS in feedlots through selection for VS on pasture was 0.83 (0.68; 0.99). These results confirmthat, for the same selection intensity in two environments, the specific environment selection promotes greater geneticgain for this trait.
The positive and favorable trend in genetic correlation between one trait on pasture and another trait in feedlots was observed for all pairs of traits. Thus, the selection to improve one trait on pasture could increase the means of other traits in feedlots (Table 4). We did not find studiesin the literature that assessed genetic correlations between FW, ADG, SC, and VS in different environments. These associations indicate that it is possible to achieve direct and indirect genetic progress on pasture and in feedlots through selection.
The selection is more efficient in an environment that allows the maximum expression of genetic differences (Hammond, 1947 and Kearney et al., 2004). However, it is important to highlight that selection intensity also plays an important role in indirect response to selection because the assumption of constant selection intensity across environments is conservative (Raidan et al., 2015). At times, the selection intensity on pasture may be higher than the selection intensity in feedlots and indirect selection (on pasture) might be as efficient as direct selection (infeedlots).
The results obtained in this study indicate that the same strategy applied for ranking young bulls on pasture might be used for ranking young bulls in feedlots. The moderate to high correlations between FW, ADG, SC, and VS on
pasture with FW, ADG, SC, and VS in feedlots (Table 4) contribute to explain these results.
The genetic correlation between FW and initial test weight was greater than the genetic correlation between initial test weight and ADG (0.67 vs 0.33, according to Lima et al., (2013)). Thus, the indirect response for initial test weight might be higher than the indirect response for ADG, as stated by Fragomeni et al. (2013). The increase in initial test weight reflects the efficiency of cow-calf operationand the increase of ADG in performance tests reflects theefficiency of the backgrounding operation. The increaseof cow-calf and backgrounding efficiencies will increasethe beef chain efficiency. However, the performance testis designed to evaluate the performance of animals after weaning and young bulls should be ranked by selection indices with higher relative emphasis for post-weaning traits.
The genetic correlations between average daily gain from birth to yearling (550 days of age) with age at firstcalving, weight at first calving, and mature body weight werebetter (–0.38, 0.52 and 0.53) than the genetic correlations between body weight at yearling with age at first calving(–0.24), weight at first calving (0.66), and mature bodyweight (0.62) (Castro-Pereira et al., 2007a,b). Moreover, the genetic correlations between scrotal circumference with age at first calving (–0.47 to –0.37), weight at firstcalving (0.04 to 0.09), and mature body weight (–0.24 to –0.17) (Silva et al., 2000; Castro-Pereira et al., 2007b) are also favorable and indicate that increasing SC by genetic selection will reduce age at first calving, keep weight at firstcalving unaltered, and reduce mature body weight. Thus, the relative weights of ADG and SC in selection indexes for the ranking of young bulls in performance tests should be higher than the relative weight of FW.
Conclusions
The genetic and residual covariances vary according to the environment, but genetic and residual correlations and the efficiency of the correlated responses for growth,scrotal circumference, and visual scores of beef cattle remain constant on pasture and in feedlots.
Acknowledgments
The authors thank Conselho Nacional de Desenvolvimento Científico e Tecnológico, Coordenaçãode Aperfeiçoamento de Pessoal de Nível Superior and Fundação de Amparo à Pesquisa do Estado de Minas Gerais for the financial support.
316 Raidan et al.
R. Bras. Zootec., 46(4):309-316, 2017
References
Boligon, A. A. and Albuquerque, L. G. 2010. Correlações genéticas entre escores visuais e características reprodutivas em bovinos Nelore usando inferência bayesiana. Pesquisa Agropecuária Brasileira 45:1412-1418.
Boligon, A. A; Silva, J. A. V; Sesana, R. C.; Sesana, J. C.; Junqueira, J. B. and Albuquerque, L. G. 2010. Estimation of genetic parameters for body weights, scrotal circumference, and testicular volume measured at different ages in Nellore cattle. Journal of Animal Science 88:1215-1219.
Boligon, A. A.; Baldi, F. and Albuquerque, L. G. 2011. Genetic parameters and relationships between growth traits and scrotal circumference measured at different ages in Nellore cattle. Genetic and Molecular Biology 34:225-230.
Burrow, H. M. 2012. Importance of adaptation and genotype-environment interaction in tropical beef breeding systems. Animal 6:729-740.
Carey, G. 1988. Inference about genetic correlations. Behavior Genetics 18:329-338.
Castro-Pereira, V. M.; Alencar, M. M. and Barbosa, P. F. 2007a. Estimativas de parâmetros genéticos e de ganhos direto e indireto à seleção para características de crescimento de machos e fêmeas da raça Canchim. Revista Brasileira de Zootecnia 36:1037-1044.
Castro-Pereira, V. M.; Alencar, M. M. and Barbosa, R. T. 2007b. Estimativas de parâmetros genéticos e de ganhos direto e indireto à seleção para características reprodutivas e de crescimento em um rebanho da raça Canchim. Revista Brasileira de Zootecnia 36:1029-1036.
Cernicchiaro, D. G. R.; Xiang, S.; White, B. J. and Bello, N. M. 2014. Hierarchical Bayesian modeling of heterogeneous variances in average daily weight gain of commercial feedlot cattle. Journal of Animal Science 91:2910-2919.
Falconer, D. S. 1952. The problem of environment and selection. The American Naturalist 86:293-298.
Fragomeni, B. O.; Scalez, D. C. B.; Toral, F. L. B.; Bergmann, J. A. G.; Pereira, I. G. and Costa, P. S. T. 2013. Genetic parameters and alternatives for evaluation and ranking of Nellore young bulls in pasture performance tests. Revista Brasileira de Zootecnia 42:559-564.
Geweke, J. 1992. Evaluating the accuracy of sampling-based approaches to calculating posterior moments. p.169-193. In: Bayesian statistics. 4th ed. Bernardo, J. M.; Berger, J. O.; Dawid, A. P. and Smith, A. F. M. Oxford University Press, Oxford.
Guidolin, D. G. F.; Buzanskas, M. E.; Ramos, S. B.; Venturini, G. C.; Lôbo, R. B.; Paz, C. C. P.; Munari, D. P. and Oliveira, J. A. 2012. Genotype-environment interaction for post-weaning traits in Nellore beef cattle. Animal Production Science 52:975-980.
Hammond, J. 1947. Animal breeding in relation nutrition and environmental conditions. Biology Reviews 22:195-213.
Heidelberger, P. and Welch, P. D. 1983. Simulation run length control in the presence of an initial transient. Operations Research 31:1109-1144.
Kearney, J. F.; Schutz, M. M.; Boettcher, P. J. and Weigel, K. A. 2004. Genotype x environment interaction for grazing versus confinement. I. Production traits. Journal of Dairy Science87:501-509.
Kruuk, L. E. B.; Clutton-Brock, T. H.; Slate, J.; Pemberton, J. M.; Brotherstone, S. and Guinness, F. E. 2000. Heritability of fitness ina wild mammal population. Proceedings of the National Academy of Science 97:698-703.
Lima, P. R. M.; Paiva, S. R.; Cobuci, J. A.; Braccini Neto, J.; Machado, C. H. C. and McManus, C. 2013. Genetic parameters
for type classification of Nelore cattle on central performancetests at pasture in Brazil. Tropical Animal Health and Production 45:1627-2634.
Lopes, F. B.; Magnabosco, C. U.; Paulini, F.; Silva, M. C.; Miyagi, E. S. and Lôbo, R. B. 2013. Genetic analysis of growth traits in Polled Nellore cattle raised on pasture in tropical region using Bayesian approaches. PloS One 8:e75423.
Misztal, I.; Tsuruta, S.; Lourenço, D.; Aguilar, I.; Legara, A. and Vitezica, Z. 2014. Manual for BLUPF90 family of programs. Georgia, Athens.
Neves, H. H. R.; Reis, F. P.; Paterno, F. M.; Guarini, A. R.; Carvalheiro, R.; Silva, L. R.; Oliveira, J. A. and Queiroz, S. A. 2014. Herd-of-origin effect on the post-weaning performance of centrally tested Nellore beef cattle. Tropical Animal Health and Produciton 46:1235-1241.
R Development Core Team 2015. R: A language and environment for statistical computing. R Foundation for Statistical Computing. Vienna, Austria.
Raidan, F. S. S.; Passafaro, T. L.; Fragomeni, B. O.; Josahkian, L. A.; Pereira, I. G. and Toral, F. L. B. 2015. Genotype x environment interaction in individual performance and progeny tests in beef cattle. Journal of Animal Science 93:920-933.
Roach, D. A. 1986. Life history variation in Geranium carolinianum. 1. Covariation between characters at different stages of the life cycle. The American Naturalist 128:47-57.
Robertson, A. 1959. The sampling variance of the genetic correlation coefficient. Biometrics 15:469-485.
Santana Junior, M. L.; Eler, J. P.; Ferraz, J. B. S. and Mattos, E. C. 2012. Genetic relationship between growth and reproductive traits in Nellore cattle. Animal 6:565-570.
Santana Junior, M. L.; Eler, J. P.; Bignardi, A. B.; Menéndez-Buxadera, A.; Cardoso, F. F. and Ferraz, J. B. S. 2015. Multi-trait linear reaction norm model to describe the pattern of phenotypic expression of some economic traits in beef cattle across a range of environments. Journal of Applied and Genetics 56:219-229.
Sheridan, A. K. and Barker, J. S. F. 1974. Two-trait selection and genetic correlation II. Changes in the genetic correlation during two-trait selection. Australian Journal of Biology and Science 27:89-101.
Silva, A. M.; Alencar, M. M.; Freitas, A. R.; Barbosa, R. T.; Barbosa, P. F.; Oliveira, M. C. S.; Corrêa, L. A.; Novaes, A. P. and Tullio, R. R. 2000. Herdabilidades e correlações genéticas para peso e perímetro escrotal de machos e características reprodutivas e de crescimento de fêmeas na raça Canchim. Revista Brasileira de Zootecnia 29:2223-2230.
Smith, B. J. 2005. Bayesian Output Analysis program (BOA) version 1.1 user’s manual. Available at: <http://www.public-health.uiowa.edu/boa/BOA.pdf>. Accessed on: Sept. 29, 2014.
Sorensen, D. and Gianola, D. 2002. Likelihood, Bayesian and MCMC methods in quantitative genetics. New York, New York.
Toral, F. L. B. and Alencar, M. M. 2010. Alternatives for analysis of performance data and ranking of Charolais x Nellore crossbred bulls in performance tests. Revista Brasileira de Zootecnia 39:1483-1490.
Wisser, R. J.; Kolkman, J. M.; Patzoldt, M. E.; Holland, J. B.; Yud, J.; Krakowsky, M.; Nelson, R. J. and Balint-Kurti, P. J. 2011. Multivariate analysis of maize disease resistances suggests a pleiotropic genetic basis and implicates a GST gene. Proceeding of the National Academy of Science USA 108:7339-7344.
Yokoo, M. J. I.; Lôbo, R. B.; Araujo, F. R.; Bezerra, L. A. F.; Sainz, R. D. and Albuquerque, L. G. 2010. Genetic associations between carcass traits measured by real-time ultrasound and scrotal circumference and growth traits in Nellore cattle. Journal of Animal Science 88:52-58.